Attached files
| file | filename |
|---|---|
| EX-99.2 - EXHIBIT 99.2 - Tri-Tech Holding, Inc. | dex992.htm |
| EX-32.1 - EXHIBIT 32.1 - Tri-Tech Holding, Inc. | dex321.htm |
| EX-31.2 - EXHIBIT 31.2 - Tri-Tech Holding, Inc. | dex312.htm |
| EX-31.1 - EXHIBIT 31.1 - Tri-Tech Holding, Inc. | dex311.htm |
| EX-32.2 - EXHIBIT 32.2 - Tri-Tech Holding, Inc. | dex322.htm |
Table of Contents
U.S. SECURITIES AND EXCHANGE COMMISSION
WASHINGTON, DC 20549
FORM 10-K
| x | Annual report pursuant to Section 13 or 15(d) of the Securities Exchange Act of 1934 |
For the fiscal year ended December 31, 2009
| ¨ | Transition report pursuant to Section 13 or 15(d) of the Securities Exchange Act of 1934 |
For the transition period from to .
Commission File Number 001-34427
TRI-TECH HOLDING INC.
(Exact name of registrant as specified in its charter)
| Cayman Islands | Not Applicable | |
| (State or other jurisdiction of incorporation or organization) |
(I.R.S. employer identification number) |
5D, Tower A, 2 Building
Business Center Jinyuan Shidai
No. 2 East Road Landianchang, Haidian District
Beijing, People’s Republic of China 100097
(Address of principal executive offices and zip code)
(+86-10) 8887 3946
(Registrant’s telephone number, including area code)
Securities registered under Section 12(b) of the Exchange Act:
| Title of each class |
Name of each exchange on which registered | |
| Ordinary Shares, $0.001 par value per share | NASDAQ Capital Market |
Securities registered under Section 12(g) of the Exchange Act:
None.
Indicate by check mark if the registrant is a well-known seasoned issuer, as defined in Rule 405 of the Securities Act. Yes ¨ No x
Indicate by check mark if the registrant is not required to file reports pursuant to Section 13 or Section 15(d) of the Act. Yes ¨ No x
Indicate by check mark whether the issuer (1) has filed all reports required to be filed by Section 13 or 15(d) of the Securities Exchange Act of 1934 during the preceding 12 months (or for such shorter period that the issuer was required to file such reports), and (2) has been subject to such filing requirements for the past 90 days. (1) Yes x No ¨ (2) Yes x No ¨
Indicate by check mark whether the registrant has submitted electronically and posted on its corporate web site, if any, every Interactive Data File required to be submitted and posted pursuant to Rule 405 of Regulation S-T (§232.45 of this chapter) during the preceding 12 months (or for such shorter period that the registrant was required to submit and post such files). Yes ¨ No ¨
Indicate by check mark if disclosure of delinquent filers pursuant to Item 405 of Regulation S-K (§229.405 of this chapter) is not contained herein, and will not be contained, to the best of registrant’s knowledge, in definitive proxy or information statements incorporated by reference in Part III of this Form 10-K or any amendment to this Form 10-K. ¨
Indicate by check mark whether the registrant is a large accelerated filer, an accelerated filer, a non-accelerated filer, or a smaller reporting company. See the definitions of “large accelerated filer,” “accelerated filer” and “smaller reporting company” in Rule 12b-2 of the Exchange Act.
| Large accelerated filer | ¨ | Accelerated filer | ¨ | |||
| Non-accelerated filer | ¨ (Do not check if a smaller reporting company) | Smaller reporting company | x | |||
Indicate by check mark whether the registrant is a shell company (as defined in Rule 12b-2 of the Exchange Act). Yes ¨ No x
The aggregate market value of the ordinary shares, $0.001 par value per share (“Shares”), of the registrant held by non-affiliates on June 30, 2009 was $0, as there were no Shares held by non-affiliates on such date, and the registrant’s Shares were not then publicly traded.
The Company is authorized to issue 30,000,000 Shares. As of the date of this report, the Company has issued and outstanding 5,255,000 Shares.
DOCUMENTS INCORPORATED BY REFERENCE
This Form 10-K incorporates the registration statement filed with the Commission on April 3, 2009, as amended (file no. 333-158393) (the “Registration Statement”) and prospectus filed pursuant to Rule 424(b)(3) of the Securities Act of 1933 (the “Securities Act”) on September 2, 2009 (the “IPO Prospectus”). The Registration Statement and IPO Prospectus are incorporated by reference into Parts II and III of this Form 10-K.
Table of Contents
FORM 10-K
INDEX
i
Table of Contents
SPECIAL NOTE REGARDING FORWARD-LOOKING STATEMENTS
We have made statements in this annual report that constitute forward-looking statements. Forward-looking statements involve risks and uncertainties, such as statements about our plans, objectives, expectations, assumptions or future events. In some cases, you can identify forward-looking statements by terminology such as “anticipate,” “estimate,” “plan,” “project,” “continuing,” “ongoing,” “expect,” “we believe,” “we intend,” “may,” “should,” “could” and similar expressions. These statements involve estimates, assumptions, known and unknown risks, uncertainties and other factors that could cause actual results to differ materially from any future results, performances or achievements expressed or implied by the forward-looking statements.
Examples of forward-looking statements include:
| • | projections of revenue, earnings, capital structure and other financial items; |
| • | statements of our plans and objectives; |
| • | statements regarding the capabilities and capacities of our business operations; |
| • | statements of expected future economic performance; and |
| • | assumptions underlying statements regarding us or our business. |
The ultimate correctness of these forward-looking statements depends upon a number of known and unknown risks and events. Many factors could cause our actual results to differ materially from those expressed or implied in our forward-looking statements. Consequently, you should not place undue reliance on these forward-looking statements.
The forward-looking statements speak only as of the date on which they are made, and, except as required by law, we undertake no obligation to update any forward-looking statement to reflect events or circumstances after the date on which the statement is made or to reflect the occurrence of unanticipated events.
In addition, we cannot assess the impact of each factor on our business or the extent to which any factor, or combination of factors, may cause actual results to differ materially from those contained in any forward-looking statements.
Readers are cautioned not to place undue reliance on these forward-looking statements, which speak only as of the date hereof. The Company undertakes no obligation to update this forward-looking information. Nonetheless, the Company reserves the right to make such updates from time to time by press release, periodic report or other method of public disclosure without the need for specific reference to this Report. No such update shall be deemed to indicate that other statements not addressed by such update remain correct or create an obligation to provide any other updates.
1
Table of Contents
| Item 1. | Business |
Overview
We are a leading provider of integrated solutions for China’s water environmental protection industry, including the water pollution remediation, software and engineering industries. We combine software and hardware to monitor and manage China’s natural and municipal water resources. We provide two lines of service: (i) Wastewater and Tail Gas Treatment and (ii) Water Resource Management. Our customers are mostly local and regional government bodies in China and since we began providing these services in 2002, we have implemented more than 250 projects in provinces, municipalities, autonomous regions and special administrative regions throughout China:
Through our Wastewater and Tail Gas Treatment segment, we design sewage treatment and odor control systems for municipal supplies. These systems, which coordinate technological solutions (software, management information systems, enterprise resource planning and local and wide area networking) with hardware (sensors, distributed control systems, programmable logic controllers, supervisory control and data acquisition systems and mechatronics), allow our clients to monitor and control numerous variables in the sewage treatment and odor control processes. Our goal in this regard is to be a total solution provider for our clients, allowing them to engage us to design processes and systems that work seamlessly to manage the process from the initial intake of raw sewage through the return of water to consumers for reuse.
Through our Water Resource Management segment, we assist the government in monitoring natural waterways. We provide systems that combine technological solutions (software, geological information systems, management information systems, enterprise resource planning and local, wireless and wide area networking) with
2
Table of Contents
hardware (sensors, supervisory control and data acquisition systems and mechatronics) to track water levels for drought and flood control, monitor groundwater quality and assist the government in planning its water resource use and management.
Our Industry
Water Resource and Pollution Control in China
China’s environmental infrastructure in general, and its water infrastructure in particular, are under great stress. China has a smaller water supply than the United States but approximately five times as many people. China faces water scarcity, frequent floods in the south and east and droughts in the north and west, serious water pollution and heavy strains on the environment. Water usage in China has quintupled since 1949. In short, China struggles to procure, clean and provide enough potable water for a growing population.
As a result of the high population density in China, the poor ratio of available water supply to demand, and the further regional imbalances in available water resources, China faces serious challenges in managing its supply of usable water.
To address these challenges, the Chinese government has enacted stricter environmental standards and invested significantly in water treatment projects to promote sustainable economic growth to provide the population with affordable, purified water. We believe the following factors, among others, may present an opportunity for companies that assist the Chinese government in its goals to increase access to usable water, reduce the effects of droughts and alleviate flooding:
| • | China possesses approximately 7% of the earth’s total fresh water supply, similar to Canada. China, however, has approximately 40 times more people than Canada. |
| • | Approximately 300 million Chinese citizens have no access to clean water. |
| • | Over 70 million Chinese citizens drink water that does not meet current World Health Organization standards. |
| • | Chinese citizens have access to approximately one-quarter the per-person supply of water available on average around the world. China has one of the 15 lowest per capita water supplies in the world. |
| • | Per capita water availability in north China is only 757 cubic meters per year, less than one-fourth of per capita availability in south China, one-eleventh of the world average. The Food and Agriculture Organization of the United Nations regards a per capita water level of less than 1,000 cubic meters per year as a severe constraint on socio-economic development and environmental protection. |
| • | Almost 90% of underground water in Chinese cities is affected by pollution. |
| • | Approximately 80% of China’s rivers fail to meet standards for fishing. |
| • | According to China’s Ministry of Environmental Protection (“MEP”), over 70% of China’s lakes and 5 out of 7 major river systems are so polluted that they are not suitable for human contact. |
| • | Almost all of China’s rivers are considered polluted to some degree. |
| • | Southern China has access to over 80% of China’s water supply. |
| • | Approximately 400 of China’s 660 cities are affected by water shortages. Of those, over 100—including large cities like Beijing and Tianjin—are facing serious water shortages. |
| • | Southwest China is reported to be experiencing its worst drought in a hundred years. Additionally, the North China Plain has seen seven consecutive years of drought, and its water table is falling at approximately five feet per year. |
| • | China’s industrial water use is comparatively inefficient: to generate RMB10,000 in gross domestic product, China uses three times more water than the world average and seven times more than the United States. |
| • | China recycles or reuses only 60% to 65% of water used by industry, compared with 80% to 85% in most developed countries. |
3
Table of Contents
| • | In 2006, China treated in some form only 56 percent of 53.7 billion tons of waste water; the rest was discharged without any treatment. |
| • | In November 2000, the State Council notified all cities with a population greater than 100,000 to build one or more wastewater treatment facilities by 2005. |
| • | The World Bank estimates that China’s water crisis currently costs China approximately 2.3% of its gross domestic product, of which 1.3% is attributable to water scarcity and 1% is a direct result of water pollution. |
As a result of this increased demand for resources, the Chinese government has increased its financial investment in environmental protection legislation and increased environmental standards. Between 1995 and 2000, China invested approximately $47.4 billion in environmental protection. From 2000 through 2005, the investment grew to approximately $92.1 billion. From 2005 through 2010, China’s environmental investment is expected to be approximately $184.2 billion. This growth represents a cumulative annual growth rate of approximately 14.5%. Of the estimated $184.2 billion to be spent on environmental protection, approximately $39.5 billion is expected to be used for water resource management, urban water management, wastewater treatment, sewage reuse and water treatment.
China’s economy has historically been a planned economy, and its environmental protection policies have also been planned, in a series of five-year plans. According to The National Eleventh Five-Year Plan for Environmental Protection (2006-2010) (the “11th Plan”), China’s current environmental priorities are (i) to shift focus from economic growth without regard to environmental protection to placing equal emphasis on economic growth and environmental protection; (ii) to synchronize environmental protection and economic development, rather than allowing environmental protections to lag behind economic development and (iii) to shift from primarily administrative methods to protect the environment to implementing a more comprehensive legal, economic, technical and administrative framework to address environmental issues.
China failed to meet many of the environmental protection targets set in the National Tenth Five-Year Plan for Environmental Protection (2001-2005) (the “10th Plan”), despite devoting more than 1% of China’s gross domestic product in environmental protections for the first time. For example, the 10th Plan set a target of 10% reduction in sulphur dioxide, but China actually experienced an increase of 27.8%. Similarly, key water resources met only 60% of the targets set for pollution during the 10th Plan.
To this end, the 11th Plan provides that China will need to dedicate an estimated 1.35% of its gross domestic product, or approximately RMB1.4 trillion (approximately $205 billion), to environmental protection. China’s MEP projects growth of 15% per year in the environmental industry. While the 11th Plan does not prescribe amounts to be spent for particular projects or in individual sectors, it does state that the water pollution control will be the top priority for China’s environmental investment.
In order to reduce total chemical oxygen demand (“COD”) by 10% during the period, the 11th Plan estimates that engineering measures must be taken to reduce COD by 4 million tons. The 11th Plan anticipates that COD may be reduced by 3 million tons by increasing urban waste water treatment capacity by 45 million tons per day and by 1 million tons through industrial waste water treatment. These treatment plans anticipate that, by 2010, all cities in China will have sewage treatment facilities to allow at least 70% of urban sewage to be treated, with total urban sewage treatment capacity to reach 100 million tons per day. Such capacity increases will require China to construct new sewage treatment facilities and to strengthen the monitoring and supervision of existing and new facilities. The 11th Plan states that such plants will install real time on-line monitoring devices. Monitoring stations for water environmental quality will be expected to meet scientific standards. China plans, in particular, to focus on the enhancement of real time monitoring the pollution of trans-province and trans-boundary waters or estuaries; early warning systems for pollution accidents; and routine monitoring of surface water, drinking water sources and coastal sea waters. By 2010, the 11th Plan anticipates that, of such monitoring stations, 90% will meet government standards in east China, 80% in central China and 60% in west China.
According to the 2009 Chinese Government Annual Report announced by Primer Wen Jiabao, the Chinese government will continue to focus its efforts on environmental protection in 2010. To improve its environmental management, and municipal sewage and solid waste treatment in key areas, China will increase its daily sewage treatment capacity by 15 million cubic meters and its daily solid waste treatment capacity by 0.06 million tons in 2010. Based on an average construction unit cost of RMB 1300 per cubic meter of treatment capacity, we believe that total spending on sewage treatment will reach RMB 19.5 billion.
4
Table of Contents
The Ministry of Environmental Protection of China stated that the Chinese government will invest RMB 3.1 trillion in the environmental protection sector during the 12th 5-year plan (2011-2015), including RMB 1 trillion in construction of treatment facilities. Governmental spending will be twice as much as that during the 11th 5-year plan (2006-2010). The total volume of investment in the environmental protection sector is expected to exceed RMB 1.1 trillion in 2010. Given the favorable policies, we believe that the environmental protection industry in China will maintain an annual growth rate between 15% and 20% for the next 5 years.
China’s Economic Development
China’s population of approximately 1.3 billion people is expected to grow by almost 9 million people per year. The country’s gross national product has grown at a rate of approximately 9% for more than 25 years, making it the fastest growth rate for a major economy in recorded history and securing China’s place as the world’s third largest economy. In the same 25 year period, China has moved more than 300 million people out of poverty and quadrupled the average Chinese person’s income. The potential of this market is noted by the fact that 400 of the world’s largest 500 companies have invested in China.
The financial crisis started in the second half of 2008 and soon became a global economic crisis as financial markets around the world deteriorated. The crisis eventually spread to other sectors such as manufacturing.
In 2010, the Chinese government is posed with the difficult task of maintaining China’s economy in the midst of the global economic financial crisis. China’s economy experienced overall growth of only 8.7% in 2009, its lowest growth rate in eight years, down from growth rates of 9.6% in 2008 and 13% in 2007. The global financial crisis has significantly decreased demand for Chinese exports, resulting in factory closures and significant unemployment. This 8.7% growth rate is well above the 7.2% rate predicted by the World Bank and also exceeds the 8% rate the Chinese government had predicted and said would be necessary to avoid significant further unemployment. While China’s growth rate has fallen, China’s growth rate remains well above the World Bank’s forecast for decline of 1.5% for the world economy in 2009.
According to China’s National Bureau of Statistics, China’s GDP for 2009 reached RMB 33.54 trillion (or $4.92 trillion), an increase of 8.7% over the same period in 2008. The growth rates for the first, second, third and fourth quarters of 2009 were 6.2%, 7.9%, 9.1% and 10.7% respectively, over the same periods in 2008. The overall fixed asset investment (“FAI”) in 2009 rose by 30.1%. In the same period, fixed asset investment in water resources, environment and public works management increased by 45.1%.
According to the 2009 Chinese Government Annual Report announced by Primer Wen Jiabao, China’s expected GDP growth of approximately 8% for 2010 and the government intends to apply active fiscal policies and appropriate expansionary monetary policies by increasing the government deficit by about RMB 1.05 trillion in incurring an additional RMB 7.5 trillion in bank loans.
Based on the data shown above, we believe that our company is likely to continue to grow in 2010 because our business is poised to directly benefit from China’s investment in its water and environmental protection infrastructure.
China’s Technology Industry
The Chinese government began to focus upon technology and science shortly after the formation of the PRC. From 1949 to 1977, the Chinese government directly controlled all research, development and engineering activities through its State Development Planning Commission and State Science and Technology Commission. In the 1980s, China began to implement market-oriented economic reforms designed to improve the Chinese science and technology industry, among other priorities. During this period, China further reduced the central government’s control over the operation of research oriented businesses. In the 1990s, Chinese policymakers again attempted to
5
Table of Contents
enhance the development of high technology businesses by experimenting with additional reduction of governmental control while also providing new forms of ownership for these businesses. In addition, in 1992, the Chinese government liberalized market access by adopting policies that favored foreign investment in high technology businesses. By the end of the 1990s, the Chinese government had abandoned most of its control over many high technology businesses and adopted a progressive tax structure designed to further encourage the financial development of these businesses. These policies positively impacted the development of Chinese software and engineering businesses.
New Opportunities in Water Resources and Wastewater Treatment
We are currently pursuing smaller river basin flood monitoring and forecasting systems and groundwater monitoring systems across the country. In 2009, we received the award of 5 projects for smaller river basin flood and forecasting systems.
Through local distributors and partnerships, we also promote our proprietary products targeting the water monitoring and dispatching systems of the Northward Rerouting of Southern River engineering construction, which we believe has a project budget and expense estimates of approximately $43.5 million. We are still pursuing these projects, but there can be no guarantee that we will be successful in all or any of these endeavors.
In 2009, the Chinese government launched the 103-Pilot-County Mountain Torrent Forecast Plan proposed by the Ministry of Water Resources and the Ministry of Environmental Protection. Accordingly, the Chinese government allocated RMB 200 million (approximately $29 million) to fund these projects, which are frequently devastated by mountain torrents. In 2009, we won the bids for 14 of these pilot projects. The development is in line with our earlier indications of our goals.
Our wastewater treatment business segment focuses on Tianjin City and Hebei Province. In 2009, we entered into 26 contracts from this targeted municipal water and wastewater treatment market, including pump stations, treatment plants, odor control systems, controls and instruments, etc.
We are actively pursuing opportunities in the industrial wastewater and process tail gas treatment market in the petrochemical industry (such as the SINOPEC and PetroChina), the power generation industry, and the oil and gas industry.
Currently almost all newly designed sewage treatment plants have odorous gas containment and control requirements. As such, we expect an increase in sales of our proprietary biofiltration odor control systems.
To take advantage of these new market opportunities, we continue to increase our workforce to meet the anticipated increase in workload. In order to pursue several major new water projects and increase our interaction with our clients, we recently registered branch offices in Tianjin Dongli Economic Development Zone and Tianjin Baodi Economic Development Zone, and set up a branch office in Hebei Province.
Our Lines of Service
We currently provide services in two segments. We group these segments based on the types of services we provide and the types of clients that use these services. Our two reportable operating segments are (i) water and wastewater treatment process control systems, and process tail gas purification (“Wastewater and Tail Gas Treatment”) and (ii) water resources protection and allocation, flood control and forecasting, irrigation systems and municipal water supply and distribution systems (“Water Resource Management”). Within these segments, we have developed technology and products to assist our customers (i) process and treat wastewater and tail gases and (ii) monitor water supplies. In addition to these two segments, we have begun to provide industrial sector services; however, we did not receive revenues from such services in 2008 or 2009.
6
Table of Contents
The following table identifies the percentage of revenues derived from each business segment for the 2009 fiscal year:
| Year Ended December 31, 2009 | ||||||||||||||||||
| Segment 1 Wastewater and Tail Gas Treatment |
% | Segment 2 Water Resource Management |
% | Total | % | |||||||||||||
| System integration |
$ | 7,745,944 | 86.4 | % | $ | 4,277,742 | 54.6 | % | $ | 12,023,686 | 72 | % | ||||||
| Hardware products |
464,886 | 5.2 | % | 2,047,077 | 26.1 | % | 2,511,963 | 15 | % | |||||||||
| Software products |
750,000 | 8.4 | % | 1,514,246 | 19.3 | % | 2,264,246 | 13 | % | |||||||||
| Total revenues |
$ | 8,960,830 | 100.0 | % | $ | 7,839,065 | 100 | % | $ | 16,799,895 | 100 | % | ||||||
Wastewater and Tail Gas Treatment Segment
We have developed the following technology and products to assist our customers in this segment to process and treat wastewater and gases:
Sewage Treatment and Water Recycling/Sewage Water Pipeline Network
| • | Electric Automation and Dispatching Management System for Cities. These systems are able to track a number of variables in a sewage treatment facility and allow the city to control the system electronically to react to chemical and other changes and to ensure safe and efficient treatment of sewage. We engineer, procure and install these systems, including high- and low-voltage electrical equipment, controls, instruments and management information systems required by the projects. |
Sewage Water Plant/Recycling
| • | Electric Instruments Automation Water Management System. We provide systems to allow municipalities to reuse and recycle both grey water (the non-industrial waste water generated from domestic processes such as dish washing, laundry and bathing) and industrial waste water. We also provide pump station electrical and mechanical equipment and municipal water supply plant and distribution pipelines for our clients. We engineer, procure and install these systems, including high- and low-voltage electrical equipment, controls, instruments and management information systems required by the projects. |
Recycling
| • | Tranhold Series Biofiltration Odor Control Systems (Patented). We provide our patented biofiltration odor control systems to municipal wastewater treatment plants and pump stations to eliminate offensive odors emitted at the sources. We engineer, manufacture, procure, install, integrate and commission the entire system for our clients. |
| • | Tranhold Chemical Scrubbing Odor Control Systems. We provide chemical scrubbing odor control systems to eliminate offensive odors with higher concentrations, usually emitted from industrial wastewater treatment plants and processes. Some of our customers commission us to combine our chemical scrubbing units and biofiltration odor control systems to further enhance odor elimination. |
| • | Process Control and Monitoring System Software (Certified). We provide process control and monitoring system software to integrate entire water/wastewater treatment plants, and to combine individual unit operations into complete systems. We program and customize the software to match our clients’ specific needs. |
| • | Sewage Treatment Operation Management System. We provide sewage treatment plant operation and maintenance management services for some of our clients after we build the treatment plants for them. |
7
Table of Contents
Water Resource Management Segment
We have developed the following technology and products to assist our customers in this segment to monitor municipal and natural water resources:
Drought/Flood Control
| • | YY-RTU-2000 Remote Terminal (Patented Product). The Remote Terminal is a specialized data acquisition and transition unit used for communications in remote areas where we install our control systems. |
| • | Rainfall Monitoring and Data Processing WEB System Software (Certified software). We use our WEB System Software to monitor remote rain gauges and to process and report rainfall data. |
| • | YY-RTU-2000 Rainfall Measurement Software (Certified software). The Rainfall Measurement Software is a specialized software package used for rainfall measurement in conjunction with the Remote Terminal and WEB System Software. |
| • | Small Watershed Flood Hazard Early Warning System. Our Early Warning System is an integrated system that contains both software and hardware units that are used for small watershed forecasting. |
Water Quality Monitoring
| • | Groundwater Monitoring and Data Processing WEB System Software (Certified software). We use our WEB System Software to monitor groundwater levels and to process groundwater data. |
| • | YY-RTU-2000 Remote Terminal (Patented Product). The Remote Terminal is a specialized data acquisition and transition unit used for communications in remote areas where we install our control systems. |
Water Resource Utilization and Management
| • | Irrigation and Agriculture Water Conservation System. Our Irrigation and Agriculture Water Conservation System helps farms and rural governments manage their water resources to ensure that often limited water supplies are used as efficiently and effectively as possible. |
| • | National Flood Control System. Our Flood Control System uses remotely placed rain gauges and computer modeling to monitor water flow rates. This allows governments to recognize the early signs of flooding. |
| • | Water Resource Equipment Monitoring System. Our Water Resource Equipment Monitoring System is an automatic system that allows customers to react quickly to changes in monitored flow rates and failures in equipment. |
Municipal Water Supply
| • | Municipal Water Supplying Dispatch System. Our Municipal Water Supplying Dispatch System is an automatic pipeline network system that monitors municipal water flow rates and can be used to balance pressures and ensure municipal water supplies remain in service and run smoothly. |
8
Table of Contents
Principal Suppliers
We use the following principal suppliers; however, our suppliers generally vary on a project by project basis, as each project is tailored to the needs and requests of the client. We believe the materials provided by our suppliers are widely available and do not anticipate that we will be unable to obtain these materials from other suppliers in the event our principal suppliers are unable or unwilling to supply us. Indeed, we honor our customers’ requests for materials from their preferred suppliers.
| Items |
Suppliers/Manufacturers | |||
| Electromagnetic Flowmeters | - | Endress + Hauser (Shanghai) Co, Ltd. | ||
| COD Meters | - | Beijing Eastern-Dataphy Instruments Co., Ltd. | ||
| Fans | - | WINFAN (Suzhou) Technology Co., Ltd. | ||
| PLC-Modules | - | Siemens (Nanjing) Co., Ltd. | ||
| Gas-Oil Separators | - | Ping Yuan Flow Control Technology Co., Ltd | ||
| Screens | - | B-Tohin Machine (Jiangsu) Co, Ltd. | ||
| Components & Connectors | - | Beijing Hangfeng Weidian Technology Co., Ltd. | ||
| Electrical Control Boxes | - | Cangzhou Jinhe Plastic Products Co., Ltd. | ||
| Fluviograph & Rain Gauge (Pluviometer) | - | Nanjing Automation Institute of Water Conservation and Hydrology of Ministry of Water Resources (NAIWCH) | ||
| PV Solar Panels | - | Ningbo Solar Electric Power Co., Ltd. | ||
| Nissei Data Transition Stations | - | Rainbow Electronics Co., Ltd. | ||
| Data Switchboard | - | Siemens (China), Co. Ltd. | ||
| Digital Trunked Base Stations | - | European Aeronautic Defense and Space Company (EADS N.V.) | ||
| PLC control Systems | - | Huazhang Group | ||
| Regenerative Thermal Oxidizers | - | Air Clear LLC | ||
| Remote Terminal Units | - | Motorola | ||
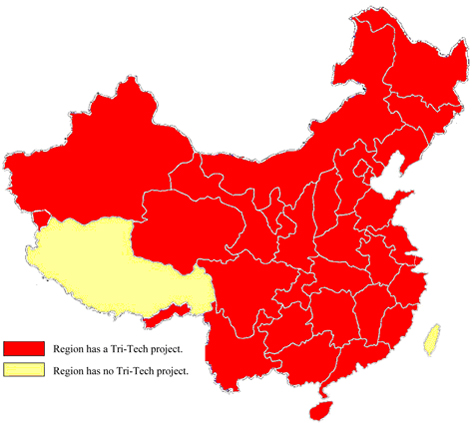
Representative Projects
We have provided service to customers throughout China. Our largest clients are regional and local government entities. We have also provided solutions to companies in the chemical, and particularly petrochemical, industry. The following map of China shows those political regions of China in which we have undertaken projects. The subsequent list, by operating segment, is a partial list of projects we have undertaken for customers throughout China.

9
Table of Contents
Representative Projects - Wastewater and Tail Gas Treatment Segment
Sewage Treatment and Odor Control
| Project Name |
After Taxes Revenues to Date ($) |
Project Status | ||
| SINOPEC YanShan Petrochemical Plant – Process tail gas VOC removal |
1,438,490 | Completed in December 2008 | ||
| Beijing Huamei Polymer Co. Ltd. – Process Tail Gas Control to EVA Renovation Project |
996,108 | Completed in October 2009 | ||
| Tianjin Drainage Management Office – Pumping Station Odor Control |
527,462 | Completed in September 2009 | ||
| Tianjin Free Trade Zone – Pumping Stations automatic control system upgrade |
424,197 | Completed in September 2009 | ||
| Tianjin Baodi Economic Development Zone – Baodi Wastewater Treatment Plant Phase 1 |
327,865 | Completed in December 2009 | ||
| Northeast China Pharmaceutical Group – Wastewater treatment plant odor control system |
283,383 | Completed in October 2007 | ||
| Hebei Quzhou Sewage Treatment Plant – Electrical engineering, control and instruments |
201,027 | Completed in August 2009 | ||
| Ningxia Shizuishan Sewage Treatment Plant – Procurement and installation |
197,010 | Finished installation | ||
| Tianjin Free Trade Zone – Wastewater Treatment Plant electrical engineering, control and instruments |
148,501 | Completed in December 2008 | ||
| Hebei Zaoqiang Sewage Treatment Plant – Procurement and installation |
133,111 | Completed in December 2008 |
Representative Projects - Water Resource Management Segment
Hydrology Monitoring and Control Dispatch
| Project Name |
After Taxes Revenues to Date ($) |
Project Status | ||
| Heilongjiang Songhua River Flood Control Non-Structural Measures – Flood Dispatching System and Flood Information Transmission System |
184,957 | Completed in October 2009 | ||
| ZheJiang CangNan TianTai Real Time Flood Monitoring System |
134,069 | Completed in December 2007 | ||
| 7 Drought Relief Branch Centers Construction Phase 2 – Equipment procurement |
110,398 | Completed in June 2009 | ||
| Hainan Sanya Hydrology Data Collecting and Report System Upgrade |
73,832 | Completed in April 2009 | ||
| Zhujiang River Monitoring and Hydrologic Data Collecting System |
64,562 | Completed in September 2009 |
Water Quality Monitoring & Control
| Project Name |
After Taxes Revenues to Date ($) |
Projects Status | ||
| TianJin DongLi District Under Groundwater Monitoring System |
48,900 | Completed in September 2005 |
10
Table of Contents
Water Resource Dispatching and Utilization
| Project Name |
After Taxes Revenues to Date ($) |
Project Status | ||
| Hebei Province Reservoir Hydrology Measurement and Report System |
611,095 | Completed in December 2007 | ||
| Guangxi Reservoirs Software Upgrade |
145,119 | Completed in May 2009 |
Municipal Water Supply
| Project Name |
After Taxes Revenues to Date ($) |
Project Status | ||
| Chengdu Water Supply Company – Municipal water supply dispatching system |
713,143 | Completed in June 2005 | ||
| SINOPEC Shengli Oil Field - Water Sourcing Monitoring System |
21,280 | Completed in February 2008 |
Research and Development
We focus our research and development efforts on improving our development efficiency and the quality of our products and services. As of March 24, 2010, our research and development team consisted of 15 experienced researchers, engineers, developers and programmers. In addition, some of our support employees regularly participate in our research and development programs. In cooperation with Nankai University, we are currently jointly pursuing government funds for odor control technology research.
In the fiscal years ended December 31, 2009 and 2008, we spent $178,864 and $66,295, respectively, on research and development activities.
Competition
We operate in a highly competitive industry characterized by rapid technological development and evolving industry standards. Given the $585 billion stimulus initiative in China, we expect this competition to intensify, as more companies enter the market. We compete primarily on the basis of customer recognition and industry reputation, research and development strength, comprehensive product offerings, and a competitive cost structure. We believe we can continue to compete successfully with international competitors because of our competitive cost structure and with local competitors because of our superior technology. Our established nationwide distribution and customer service network and knowledge of local markets provide us with an advantage over international competitors who typically appoint only one distributor in the Chinese market who is responsible for selling and servicing their products. In addition, we provide a more comprehensive set of products than most of our international or local competitors. In order to maintain and enhance our competitive advantage, we must continue to focus on competitive pricing and technological innovation by being at the forefront of market trends and improving our proprietary manufacturing processes.
We compete with both major international conglomerates and local companies in each of our product categories as follows:
| • | Wastewater and Tail Gas Treatment Segment: Our wastewater treatment competes primarily with products and services from five other local and international companies: Beijing Sound Group (China), HollySys (China), Nanjing Automation Institute of Water Conservation and Hydrology of Ministry of Water Resources (China), Veolia Water (France) and Degremont, S.A. (France). Our tail gas treatment competes primarily with products and services from Biorem, Inc. (Canada), Durr Environmental GmbH (Germany), Kewei Environmental Protection Co., Ltd. (China), and Kai-Hong (Taiwan). |
| • | Water Resource Management Segment. Our water resources management segment competes primarily with products and services from Motorola (USA), HollySys (China) and Nanjing Automation Institute of Water Conservation and Hydrology of Ministry of Water Resources (China). |
11
Table of Contents
Although we believe that our competitive strengths provide us with advantages over many of our competitors, many of our international competitors have stronger brand names, longer operating histories, longer or more established relationships with their customers, stronger research and development capabilities and greater marketing and other resources than we do. All of the international competitors listed above are substantially larger and have greater access to capital than we have. Some of our domestic competitors have stronger customer bases, better access to government authorities and stronger industry-based background than us. For example, we believe Beijing Sound Group has an especially strong reputation in the north of China, Kai-Hong and Kewei in the south of China, Nanjing Automation Institute with government authorities and HollySys in the power and transportation industries. If we fail to maintain or improve our market position or fail to respond successfully to changes in the competitive landscape, our business, financial condition and results of operations may suffer.
Customers
We operate on a project-by-project basis and as such do not have ongoing relationships with most customers. Our five biggest customers collectively represented approximately 38.9% and 29.6% of the Company’s sales for the years ended December 31, 2008 and December 31, 2009, respectively. We are dependent on our large clients, but these customers routinely change from year to year, as our revenues are largely project-based, rather than ongoing in nature. As a result, a customer may account for our largest revenues in one year and none in the next year upon completion of a project.
Proprietary Rights
Our success and competitive position is dependent in part upon our ability to develop and maintain the proprietary aspect of our technology. The reverse engineering, unauthorized copying, or other misappropriation of our technology could enable third parties to benefit from our technology without paying for it. We rely on a combination of patents, copyright and trade secrets law and contractual restrictions to protect the proprietary aspects of our technology. We seek to protect the source code to our software, documentation and other written materials under trade secret, patent and copyright laws. While we actively take steps to protect our proprietary rights, such steps may not be adequate to prevent the infringement or misappropriation of our intellectual property. This is particularly the case in China where the laws may not protect our proprietary rights as fully as in the United States.
In 1998, China established the State Intellectual Property Office (“SIPO”) to coordinate China’s intellectual property enforcement efforts. SIPO is responsible for granting and enforcing patents, as well as coordinating intellectual property rights related to copyrights and trademarks. Protection of intellectual property in China follows a two-track system. The first track is administrative in nature, whereby a holder of intellectual property rights files a complaint at a local administrative office. Determining which intellectual property agency can be confusing, as jurisdiction of intellectual property matters is diffused throughout a number of government agencies and offices, which each are typically responsible for the protection afforded by one statute or one specific area of intellectual property-related law. The second track is a judicial track, whereby complaints are filed through the Chinese court system. Since 1993, China has maintained various intellectual property tribunals. The total volume of intellectual property related litigation, however, remains small.
Although there are differences in intellectual property rights between the United States and China, of most significance to our company is the inexperience of China in connection with the development and protection of intellectual property rights. Similar to the United States, China has chosen to protect software under copyright law rather than trade secrets, patent or contract law. As such, we will attempt to protect our intellectual property assets pursuant to Chinese laws that have only recently been adopted. Unlike the United States, which has lengthy case law related to the interpretation and applicability of intellectual property law, China is currently in the process of developing such interpretations.
We have obtained software copyrights on seven of our software products and patents on two of our other products in China. The duration of our patents is as follows:
| • | Tranhold Patent – Biofiltration Odor Control System (Invention), August 25, 2004 – August 24, 2024. |
12
Table of Contents
| • | Yanyu Patent – Automatic Monitoring Control for Real-Time Hydrology Information and Disaster Pre-Alert/Alarm System (Utility Model), August 24, 2006 – August 23, 2016. |
According to the Copyright Law of the PRC, the term of protection for copyrights lasts for the life of the author plus an additional 50 years and for works of corporate authorship, the protection lasts for 50 years beyond publication.
We seek to avoid disclosure of our intellectual property by requiring employees and independent consultants to execute confidentiality agreements with us and by restricting access to our source codes.
Employees
As of March 24, 2010, we had 120 full-time employees, all but two of whom were based in China. Of the total, 15 were in management, 67 were in technical support, 15 were in research and development, 15 were engaged in sales and marketing, and 8 were in financial affairs and administration. We believe that our relations with our employees are good. We have never had a work stoppage, and our employees are not subject to a collective bargaining agreement.
Backlog
As of December 31, 2009, we had a total backlog of $11.5 million to be collected in 2010, including $9.8 million in municipal water and wastewater services, $1.0 million in water resources services, and $0.7 million in industrial sector services. Our backlog represents the amounts of contract work remaining to be completed, or in other words, revenue from existing contracts and work in progress expected to be recorded in 2010, based on the assumptions that these projects will be accepted to our customers in 2010.
2010 Guidance
For 2010, we anticipate that our revenues will range between $40.6 million and $50.5 million. We anticipate our net income will likely reach between $7.0 million and $9.2 million. We expect that we will be able to reach these revenue and net income projections without receiving further financing.
| Item 1A. | Risk Factors. |
The Company is not required to provide the information required by this Item because the Company is a smaller reporting company.
| Item 1B. | Unresolved Staff Comments. |
The Company is not required to provide the information required by this Item because the Company is a smaller reporting company.
13
Table of Contents
| Item 2. | Properties. |
We currently operate in four rented facilities throughout China. Our headquarters are located in Beijing.
| Office |
Address |
Rental Term | Space | Expiration Date | ||||
| Beijing (headquarters) | 5D, Tower A, 2 Building Business Center Jinyuan Shidai, No. 2 East Road Landianchang, Haidian District, Beijing, PRC 100097 |
1 year | 3,907 square feet | April 1, 2010 | ||||
| Yanyu | 180 Guanganmen Wai Street, Suite 707 Xuanwu District, Beijing, PRC |
2 years | 6,157 square feet | May 1, 2011 | ||||
| Tranhold | Yangliuqing, Xiqing District, Tianjin, PRC |
4 years | 8,611 square feet | December 26, 2010 | ||||
| Tranhold Tianjin | 4th Floor, Tower A, No. 7 Rongyuan Road, Huayuan Industrial Area, Tianjin New Industrial District, PRC |
5 years | 18,300 square feet |
December 2, 2014 | ||||
| Item 3. | Legal Proceedings. |
There are no material legal proceedings, regulatory inquiries or investigations pending or threatened against us.
| Item 5. | Market for Registrant’s Common Equity, Related Stockholder Matters and Issuer Purchases of Equity Securities. |
(a) Market for Our Common Stock
Our ordinary shares are traded on the NASDAQ Capital Market under the symbol “TRIT”. On March 24, 2010, there were approximately ten holders of record of our ordinary shares. This number excludes our ordinary shares owned by shareholders holding ordinary shares under nominee security position listings.
The high and low ordinary share sales prices per share were as follows:
| Quarter Ended |
March 31 | June 30 | September 30 | December 31 | Year | ||||||||||
| Fiscal year 2009 |
|||||||||||||||
| Ordinary shares price per share: |
|||||||||||||||
| High |
$ | N/A | $ | N/A | $ | 17.20 | $ | 25.50 | $ | 25.50 | |||||
| Low |
$ | N/A | $ | N/A | $ | 7.80 | $ | 12.00 | $ | 7.80 | |||||
| Fiscal year 2008 |
|||||||||||||||
| Ordinary shares price per share: |
|||||||||||||||
| High |
$ | N/A | $ | N/A | $ | N/A | $ | N/A | $ | N/A | |||||
| Low |
$ | N/A | $ | N/A | $ | N/A | $ | N/A | $ | N/A | |||||
Dividend Policy
We have never declared or paid any cash dividends on our ordinary shares. We anticipate that we will retain any earnings to support operations and to finance the growth and development of our business. Therefore, we do not expect to pay cash dividends in the foreseeable future. Any future determination relating to our dividend policy will
14
Table of Contents
be made at the discretion of our Board of Directors and will depend on a number of factors, including future earnings, capital requirements, financial conditions and future prospects and other factors the Board of Directors may deem relevant. Payments of dividends by TTB to our company are subject to restrictions including primarily the restriction that foreign invested enterprises may only buy, sell and/or remit foreign currencies at those banks authorized to conduct foreign exchange business after providing valid commercial documents.
(b) The section entitled “Use of Proceeds” from the Registration Statement is incorporated herein by reference. The Registration Statement registers the offering of up to 1,700,000 ordinary shares (subject to amendment in accordance with the Securities Act of 1933 and the rules and regulations promulgated thereunder) (the “IPO”). As of the date of this report, the Company has used offering proceeds from completion of the IPO for the following purposes:
| Description of Use |
Proposed Expenditure Amount |
Actual Expenditures through December 31, 2009 | ||||
| Working Capital |
$ | 5,015,000 | $ | 4,300,000 | ||
| New Product Development |
2,006,000 | 1,400,000 | ||||
| Application Expansion |
1,504,500 | 1,050,000 | ||||
| Sales and Marketing |
1,504,500 | 250,000 | ||||
| Total |
$ | 10,030,000 | $ | 7,000,000 | ||
(c) None.
| Item 6. | Selected Financial Data. |
The Company is not required to provide the information required by this Item because the Company is a smaller reporting company.
| Item 7. | Management’s Discussion and Analysis of Financial Condition and Results of Operations. |
The following discussion contains, in addition to historical information, forward-looking statements that involve risks and uncertainties. Our actual results could differ materially from those described herein.
Overview
We are a leading provider or integrated solutions in China for its water and environmental problems. We are headquartered in Beijing with a current headcount of 120 employees. Our clients are a combination of government agencies, municipalities, and industrial companies and are located throughout China. Since our interception in 2002, we have successfully implemented more than 250 projects in 29 provinces, municipalities and autonomous regions in China.
Through contractual arrangements with each of Beijing Yanyu Water Tech Co., Ltd. and Tranhold Environmental (Beijing) Co., Ltd., our two variable interest entities (“VIEs”) in China, we provide self-manufactured, proprietary or third-party products, system integration and other services in the fields of environmental protection, and water resource monitoring, development, utilization and protection. We design customized sewage treatment and odor control systems for China’s municipalities and larger cities. These systems combine process equipment, software, controls and instruments, information management systems, resource planning and local and distant networking hardware that includes sensors, control systems, programmable logic controllers, supervisory control and data acquisition systems (SCADA). We also design systems that track natural waterway levels for drought control, monitor groundwater quality and assist governmental agencies in managing water resources.
For the year ended December 31, 2009 and 2008, our total revenues amounted to approximately $16.8 million and $8.4 million, respectively, a 98.8% year-over-year increase. Our revenues are subject to VAT, business tax, urban maintenance and construction tax and additional education fees. We deduct these amounts from our gross revenues to arrive at our total revenues. Our net income for the years ended December 31, 2009 and 2008 were $3.8 million and $1.7 million, respectively, a year-over-year increase of 127%.
15
Table of Contents
The Company experienced a rapid growth on the sales of system integration, hardware and software products in 2009. Depending on the demand of customers and market conditions, we played different roles in the market, such as prime contractor, subcontractor, and hardware, software and service provider. However, with the further development of this market, we expect our sales price and profitability will change due to the intense competition in the sales of hardware and software products. In order to maintain the competition advantages, we will aggregate all our resources to expand our market share of prime contract and subcontract projects.
We generate revenues from services we provide in our two operating segments: (i) wastewater and tail gas treatment and (ii) water resource management. Total sales and costs are divided between the two segments.
Wastewater and Tail Gas Treatment (“Segment 1”)
Revenues for this segment were $8.9 million in 2009, an increase of 80.4% over revenues of $4.9 million in this segment in 2008. Cost of revenue (exclusive of depreciation and amortization) was $5.5 million, an increase of 77.5% over cost of revenue (exclusive of depreciation and amortization) of $3.1 million in 2008. Operating expenses were $1.5 million in 2009, an increase of 117% over operating expenses of $0.7 million in 2008. Net income was $1.9 million in 2009, an increase of 72.4% over net income of $1.1 million in 2008.
Water Resource Management (“Segment 2”)
Revenues for this segment were $7.8 million in 2009, an increase of 125.2% over revenues of $3.4 million in this segment in 2008. Cost of revenue (exclusive of depreciation and amortization) was $4.6 million, an increase of 110.5% over cost of revenue (exclusive of depreciation and amortization) of $2.2 million in 2008. Operating expenses were $1.1 million in 2009, an increase of 67.8% over operating expenses of $0.6 million in 2008. Net income was $1.9 million in 2009, an increase of 231.3% over net income of $0.6 million in 2008.
Factors Affecting Our Results of Operations – Generally
We believe the most significant factors that directly or indirectly affect our sales revenues and net incomes are:
| • | The changes in China’s macro-economic environment, government strategies and policies, industrial development and planning; |
| • | The amount of the Chinese central and provincial governmental spending in water resources management, including surface and groundwater monitoring, flood control and mitigation, flood forecasting, water quality monitoring and assessment and water resources management decision maker systems; |
| • | The amount of Chinese central and local governmental investment in municipal wastewater management, including sewer pipelines and sewage treatment, water reuse and odor control; |
| • | Our comprehensive capabilities and competencies, including the evolving technologies and applications, industrial experience and customer basis, core competitive advantages, market shares and revenues; and |
| • | The availability and required terms of funding for our working capital. |
Historically, our business growth has primarily been driven by an increase in the number of our customers and projects. The complexity and scale of our projects have grown from single pieces of equipment, to comprehensive systems, to general contracting for complete solutions. For example, we now undertake projects to design and build entire treatment plants and complicated flood monitoring and forecasting systems for river basins. Due to the increasing urbanization process and growing Chinese economy, we expect that we will continue to earn a substantial majority of our revenues from our existing product and service lines. As a result, we plan to continue to focus most of our resources on expanding our business to the larger areas in the PRC and increasing our market share in the regions we serve. In addition, we will allocate our resources to innovate our technology, to develop applications, to improve our larger project execution capabilities and profitability, and to market our brand to customers. Through a successful initial public offering on September 10, 2009, we received net proceeds of approximately $10.03 million and used a portion of the net proceeds for working capital, product research and development, application expansion and sales and marketing and expect to use the remaining portion for the same general purposes.
16
Table of Contents
Macro-Economic Factors and Business Trends
The financial crisis started in the second half of 2008 and soon became a global economic crisis as financial markets around the world deteriorated. The crisis eventually spread to other sectors such as manufacturing.
China’s economy has improved markedly from the worst part of the financial crisis. According to China’s National Bureau of Statistics, China’s GDP for 2009 reached RMB 33.54 trillion (or $4.92 trillion), an increase of 8.7% over the same period in 2008. The growth rates for the first, second, third and fourth quarters of 2009 were 6.2%, 7.9%, 9.1% and 10.7% respectively, over the same periods in 2008. The overall fixed asset investment (“FAI”) in 2009 rose by 30.1%. In the same period, fixed asset investment in water resources, environment and public works management increased 45.1%.
According to the 2009 Chinese Government Annual Report announced by Primer Wen Jiabao, China’s expected GDP growth for 2010 is approximately 8% and the government intends to apply actively fiscal policies and appropriate expansionary monetary policies through a RMB1.05 trillion increase in the government deficit and an RMB7.5 trillion increase in bank loans. In addition, the Chinese government will continue to focus its efforts on environmental protection in 2010. To improve its environmental management, and municipal sewage and solid waste treatment in key areas, China will increase its daily sewage treatment capacity by 15 million cubic meters and its daily solid waste treatment capacity by 0.06 million tons. Based on an average construction unit cost of RMB1300 per cubic meter of treatment capacity, we believe that total spending on sewage treatment will reach RMB19.5 billion.
The Ministry of Environmental Protection of China stated that the Chinese government will invest RMB 3.1 trillion in the environmental protection sector during the 12th 5-year plan (2011-2015), including RMB 1 trillion in construction of treatment facilities. Governmental spending will be twice as much as that during 11th 5-year plan (2006-2010). Total volume of environmental protection sector investment is expected to exceed RMB 1.1 trillion in 2010. Given the favorable policies, we believe that the environmental protection industry in China will keep an annual growth rate between 15% and 20% for the next 5 years.
Based on the data shown above, we believe that our company is likely to continue to grow in 2010 because our business is poised to directly benefit from China’s investment in its water and environmental protection infrastructure.
New Opportunities in Water Resources and Wastewater Treatment
We are currently pursuing smaller river basin flood monitoring and forecasting systems, and groundwater monitoring systems in counties across the country. In 2009, we received the award of 5 projects for smaller river basin flood and forecasting systems.
Through local distributors and partnerships, we also promote our proprietary products targeting the water monitoring and dispatching systems of the Northward Rerouting of Southern River engineering construction, which we believe has a projected budget and expense estimate of approximately $43.5 million. We are still pursuing these projects, but there can be no guarantee that we will be successful in all or any of these endeavors.
In 2009, the Chinese government launched the 103-Pilot-County Mountain Torrent Forecast Plan proposed by the Ministry of Water Resources and the Ministry of Environmental Protection. Accordingly, the Chinese government allocated RMB 200 million (approximately $29 million) to fund these projects in 103 pilot counties, which are frequently devastated by mountain torrents. In 2009, our bids were chosen for 14 of the pilot projects that were suitable for our business focus. The development is in line with our earlier indications of our goals.
Our wastewater treatment business segment focuses on Tianjin City and Hebei Province. In 2009, we won 26 contracts from this targeted municipal water and wastewater treatment market, including pump stations, treatment plants, odor control systems, and controls and instruments.
17
Table of Contents
We are actively pursuing opportunities in the industrial wastewater and process tail gas treatment market in the petrochemical industry (such as the SINOPEC and PetroChina), the power generation industry, and the oil and gas industry.
Currently almost all newly designed sewage treatment plants have odorous gas containment and control requirements. As such, we expect an increase in sales of our proprietary biofiltration odor control systems.
To take advantage of these new market opportunities, we continue to increase our workforce to meet the anticipated increase in workload. In order to pursue several major new water projects and increase our interaction with our clients, we recently registered branch offices in Tianjin Dongli Economic Development Zone and Tianjin Baodi Economic Development Zone, and set up a branch office in Hebei Province.
Strategies for Growth
Municipal Wastewater Treatment
In our municipal wastewater business, we plan to expand outside of our current base of operations. In our current business footprint, the local governments are building 80 new wastewater treatment plants. This growth represents development activities in only 2 provinces. We believe significant opportunities exist in the other 32 provinces, municipalities and autonomous regions in China.
We plan to continue to expand our company’s capabilities from sub-contracting to prime contracting services. Since our inception, we have gown our company from a provider of system controls to a company capable of managing the installation of municipal water and wastewater facilities. As we continue to grow, we intend to focus our business on the more complex installation projects.
Water Resources Management
In a similar manner, we are going to further develop our water resource management services from partial management solutions to full management of large scale river basin projects. We believe that the Chinese government’s decision to initiate new programs and allocate significant investment for their implementation will offer our company significant business opportunities.
Industrial Pollution Control
We intend to strengthen our company’s industrial pollution services by penetrating adjacent industry verticals such as the power generation, oil and petrochemical industries. While we have previously implemented air pollution control systems for the petrochemical industry, we believe that there is significant opportunity to further develop this portion of our business.
Potential Acquisitions of Complementary Businesses
In addition to organic growth, we intend target selected acquisitions to further enhance our growth. In general, our markets are highly fragmented with small competitors. We will consider acquiring companies that we believe will add significant value to our business. These potential targets may have strong customer relationships but limited market access. Similarly, these targets may possess specialized skills, but the businesses have not scaled to the point where they can fully implement such skills. When evaluating targets we use a disciplined, conservative approach to ensure the acquisitions are strategic and creative.
18
Table of Contents
Results of Operations
| 2009 ($) | % of sales |
2008 ($) | % of sales |
Change ($) | Change (%) |
|||||||||||||
| Revenue |
$ | 16,799,895 | 100 | % | $ | 8,449,958 | 100 | % | $ | 8,349,937 | 98.8 | % | ||||||
| Cost of Revenue (exclusive of depreciation and amortization) |
10,175,925 | 60.6 | % | 5,322,240 | 63.0 | % | 4,853,685 | 91.2 | % | |||||||||
| Selling Expenses |
600,305 | 3.6 | % | 239,285 | 2.8 | % | 361,020 | 150.9 | % | |||||||||
| Depreciation and Amortization |
119,173 | 0.7 | % | 88,731 | 1.1 | % | 30,442 | 34.3 | % | |||||||||
| Other General and Administrative Expenses |
1,848,416 | 11.0 | % | 1,003,130 | 11.9 | % | 845,286 | 84.3 | % | |||||||||
| Operating Expenses |
2,567,894 | 15.3 | % | 1,331,146 | 15.8 | % | 1,236,748 | 92.9 | % | |||||||||
| Other Income (Expenses) |
120,961 | 0.7 | % | 110,512 | 1.3 | % | 10,449 | 9.5 | % | |||||||||
| Income before provision for income taxes and non-controlling interests |
4,177,037 | 24.9 | % | 1,907,084 | 22.6 | % | 2,269,953 | 119.0 | % | |||||||||
| Income Taxes |
308,085 | 1.8 | % | 202,247 | 2.4 | % | 105,838 | 52.3 | % | |||||||||
| Non-controlling Interests |
18,182 | 0.1 | % | 8,685 | 0.1 | % | 9,497 | 109.3 | % | |||||||||
| Net Income Attributable to TRIT |
3,850,770 | 22.9 | % | 1,696,152 | 20.1 | % | 2,154,618 | 127.0 | % | |||||||||
Revenue
Our revenue was $16,799,895 in 2009, an increase of $8,349,937, or 98.8%, compared to revenue of $8,449,958 in 2008. The increased revenue was primarily driven by an increase in the number and size of our contractual engagements during 2009. For example, in 2009, we obtained several contracts with sales amount exceeding $1.5 million (equal to RMB 10 million). Additionally, the increase of revenue attributable to Segment 1 and Segment 2 were $3,992,342, or 80.4%, and $4,357,595, or 125.2%, respectively.
Our revenue primarily consists of system integration sales, hardware sales, and software sales. In 2009, system integration sales were $12,023,686, an increase of $5,904,420, or 96.5%, compared to system integration sales of $6,119,266 in 2008. Hardware sales were $2,511,962, an increase of $1,396,151, or 125.1%, compared to hardware sales of $1,115,811 in 2008. Software sales were $2,264,246, an increase of $1,049,365, or 86.4%, compared to software sales of $1,214,881 in 2008. Accordingly, in 2009, of total revenue, system integration sales, hardware sales and software sales were 71.6%, 15.0% and 13.5% respectively, compared to that of 72.4%, 13.2% and 14.4% respectively in 2008.
In response to the global financial crisis, China increased the government spending on the environmental protection sector, leading to the increase in the company’s projects in the wastewater treatment and water resource management and its related sales in system integration, hardware and software products. As a result, the government fiscal policies will have an effect on our business in one way or the other. In addition, we have been benefiting from the country’s urbanization progress.
Cost of Revenue (exclusive of depreciation and amortization)
Our cost of revenue (exclusive of depreciation and amortization) was $10,175,925, an increase of $4,853,685, or 91.2%, compared to cost of revenue (exclusive of depreciation and amortization) of $5,322,240 in 2008. The increase in our cost of revenue (exclusive of depreciation and amortization) resulted directly from the increased number of projects during the period. The increase in 2009 cost of revenue (exclusive of depreciation and amortization) was less than the 2009 increase in overall revenue because, during the period: (i) we conducted more projects with higher gross margins; and (ii) we sourced more locally-made equipment at a lower cost in connection with our projects.
Of total revenue, cost of revenue (exclusive of depreciation and amortization) was 60.6% in 2009 and 63.0% in 2008. Although we did not experience a significant change in cost of revenue as a percentage of revenues, the large amount of Chinese government spending, urgent construction schedule, and strong market demand resulted in high prices for construction projects. As such, we experienced a business climate that permitted us to enjoy
19
Table of Contents
significant growth in revenue while limiting the cost of that revenue. We believe that this market situation will change if the Chinese government reduces the spending on the environmental sector or competition within this industry dramatically increases.
Operating Expenses
In 2009, our selling expenses were $600,305, an increase of $361,020, or 150.9%, compared to selling expenses of $239,285 in 2008. Salaries, travelling costs and entertainment expenses increased 317.1%, 206.1% and 164.8%, respectively. The increase in selling expenses attributable to Segment 1 and Segment 2 were $178,603, or 159.8% and $182,418, or 143% respectively. The increased selling expenses primarily resulted from the: (i) increased number of our sales personnel, and (ii) more frequent and longer business travelling needed to acquire an increased number of contracts.
Our general and administrative expenses were $1,967,588, an increase of $ 875,727, or 80.2%, compared to general and administrative expense of $1,091,861 in 2008. The increase reflected: (i) a $141,173 increase in salaries, (ii) a $73,267 increase in accounting and attorney services fee, (iii) a $23,971 increase in office rental expenses, (iv) a $27,727 increase in depreciation, (v) a $2,715 increase in amortization, (vi) a $112,568 increase in R&D, (vii) a $114,858 increase in the costs associated with stock options, and (viii) a $379,448 increase in travelling, registration, printing and other expenses. The increased general and administrative expenses primarily resulted from the increase in: (i) the square footage of rental office, (ii) printing expenses, (iii) travelling, and (iv) professional services fee as a publicly traded company.
The Company’s operating expenses were $2,567,894 in 2009, an increase of $1,236,748, or 92.9%, compared to operating expenses of $1,331,146 in 2008, slightly lower than an increase of 98.8% in revenue. It mainly resulted from the rapid growth rate of selling expenses.
Other Income (Expenses)
The Company’s other income was $120,961 in 2009, an increase of $10,449, or 9.5%, compared to other income of $110,512 in 2008. The increased other income in 2009 was mainly driven by additional interest income and a tax rebate.
Net Income
In 2009, our income before income taxes and non-controlling interest was $4,177,037, an increase of $2,269,953, or 119.0%, compared to income before income taxes and non-controlling interest of $1,907,084 in 2008. The increase resulted from both our increased revenue and gross margin improvement.
Our income taxes were $308,085 in 2009, an increase of $105,838, or 52.3%, compared to income taxes of $202,247 in 2008. The increased income taxes in 2009 were primarily driven by an increase in net income in 2009. The increase in income taxes was partially offset by our Chinese subsidiary’s receipt of governmental approval to be taxed at preferential tax rates for high-tech companies in China. Our subsidiary, Tri-Tech Beijing (“TTB”) received a preferential income tax rate of 7.5% from 2009 to 2011.
Our non-controlling interest income was $18,182 in 2009, an increase of $9,497, or 109.3%, compared to non-controlling interest income of $8,685 in 2008.
In 2009, net income attributable to the shareholders of TRIT was $3,850,770, an increase of $2,154,618, or 127.0%, compared to net income attributable to the shareholders of TRIT of $1,696,152 in 2008.
Liquidity and Capital Resources
As highlighted in the consolidated statements of cash flows, the Company’s liquidity and available capital resources are impacted by four key components: (i) cash and cash equivalents, (ii) operating activities, (iii) financing activities, and (iv) investing activities.
20
Table of Contents
Statement of Consolidated Cash Flows ended Dec. 31, 2009 and Dec. 31, 2008
| For the year Ended December 31, 2009 ($) |
For the year Ended December 31, 2008 ($) |
Change ($) |
|||||||
| Operating activities |
(2,925,845 | ) | (393,034 | ) | (2,532,811 | ) | |||
| Financing activities |
9,826,663 | 673,735 | 9,152,928 | ||||||
| Investing activities |
(197,087 | ) | (91,351 | ) | (105,736 | ) | |||
| Effects of exchange rate |
(264,685 | ) | 175,355 | (440,040 | ) | ||||
| Cash, beginning of period |
732,418 | 367,713 | 364,705 | ||||||
| Increase (decrease) in cash |
6,439,046 | 364,705 | 6,074,341 | ||||||
| Cash, end of period |
7,171,464 | 732,418 | 6,439,046 |
Cash and cash equivalents
As of December 31, 2009, our cash and cash equivalents were $7,171,464, including a U.S dollar deposit of $3,316,247 and an equivalent RMB deposit of $3,855,217.
Operating activities
Net cash used for operating activities was $2,925,845 in 2009, compared to $393,034 used in 2008. A $2,532,811 decrease in cash from operating activities in 2009 was due to: (i) a $2,164,114 increase in net income, (ii) an increase in accounts receivable of $298,571 and a decrease in unbilled revenue of $3,883,701, (iii) a $1,151,964 decrease in prepayment of suppliers, and (iv) a $1,616,865 increase in accounts payable,(iiv) a $1,500,534 decrease in restricted cash. As the billing cycle for our construction projects was relatively long, our accounts receivable used a great deal of our cash as a result of the rapid growth of our company. In addition, as we cannot issue invoices before the construction completion under our percentage-of-completion income recognition method, unbilled revenue utilized another part of our cash.
Financing activities
The cash provided by financing activities was $9,826,663 in 2009, compared to $673,735 provided in 2008. A $9,152,928 increase in cash from financing activities in 2009 was due to $10,105,170 of cash received from the initial public offering of our ordinary shares, which was partially offset by $278,507 of cash used for the repayment of debt.
Investing activities
Net cash used for investing activities was $197,087 in 2009, compared to $91,351 used in 2008. A $105,736 decrease in cash from investing activities in 2009 was due to the new equipment and vehicle purchases.
Effect of change in exchange rate
Net cash loss due to currency exchange was $264,685 in 2009, compared to a gain of $175,355 in 2008.
Working Capital and Cash Flow Management
As of December 31, 2009, our working capital was $17,027,286, including cash and cash equivalents of $7,171,464.
Due to the increase in purchase orders, our company has experienced some pressure from a shortage in working capital. We received net proceeds from our initial public offering of approximately $10.03 million, which we intend to use for working capital, product research and development, application expansion and sales and marketing.
21
Table of Contents
However, we may require additional capital to undertake new and larger projects or complete strategic acquisitions in the future. In the event that our current capital is insufficient to fund these or other business purposes, we may take the following actions to meet such working capital needs:
| • | We can improve our collection of accounts receivable. Most of our clients are central, provincial and local governments. Due to the current situation with the Central government stimulus plan and increases in bank liquidity, we believe our clients are in good financial positions. Therefore, we expect to collect more cash from our relatively high accounts receivable, and use the cash collected in our business expansion; |
| • | We may raise additional capital from the market through an offering of equity or debt; or |
| • | We may incur short-and/or long-term debt through commercial loans. As of December 31, 2009, our company had long-term debt of $58,171 and short-term debt of $0. Therefore, we believe we are in a strong position to utilize debt, if appropriate. |
Contractual Obligations and Commercial Commitments
Operating Leases
As of December 31, 2009, we had commitments under certain operating leases, requiring annual minimum rentals as follows:
| 2010 |
$ | 238,319 | |
| 2011 |
134,087 | ||
| 2012 |
116,842 | ||
| 2013 |
116,842 | ||
| 2014 |
107,106 | ||
| Total |
$ | 713,196 |
Our leased properties are principally located in the PRC and are used for administration and research and development purposes. The terms of these operating leases vary from one to three years. Pursuant to the lease terms, when the contracts expire, we have the right to extend them with new negotiated prices. The leases are renewable subject to negotiation. Rental expenses were $184,312 and $160,341 for the years ended December 31, 2009 and December 31, 2008, respectively.
Product Warranties
Our warranty policy generally is to replace parts if they become defective within one year after deployment at no additional charge. Historically, failure of product parts due to materials or workmanship has not been significant. We have not incurred any material unexpected costs associated with servicing its warranties. We continuously evaluate and estimate our potential warranty obligations, and record the related warranty obligation when the estimated amount becomes material at the time revenue is recorded.
Capital Expenditures
In the past, our capital expenditures were used to purchase computers and other office equipment for our business. Our capital expenditures may increase in the near term as our business continues to grow and as we expand and improve our financial and accounting systems and infrastructure. We spent $255,235 and $91,351 on such capital expenditures during the years ended December 31, 2009 and 2008, respectively. As of December 31, 2009, we do not have any capital expenditure commitments.
22
Table of Contents
Seasonality
Our sales are not significantly affected by seasonality.
Off-Balance Sheet Arrangements
We do not have any off-balance sheet arrangements.
Taxation
Under the current law of the Cayman Islands, we are not subject to tax on income or capital gain. However, our revenues are primarily derived from payments made by Tranhold and Yanyu to our Chinese subsidiary, TTB. Prior to January 1, 2008, under PRC laws and regulations, a company established in China was typically subject to a state enterprise income tax rate of 30% and a local enterprise tax rate of 3% on its taxable income. PRC laws and regulations also provide foreign-invested enterprises established in certain areas in the PRC with preferential tax treatment. Since January 1, 2008, China has mandated a unified enterprise income tax rate of 25%, with a preferential tax rate of 15% for high-tech companies.
Pursuant to the New EIT Law and the supplementary regulations, only high-tech companies that have been re-certified as such under the new criteria are granted the preferential enterprise income tax rate of 15%. According to an approval from the Beijing State Tax Bureau of Xicheng District, TTB received a preferential income tax rate of 7.5% from January 1, 2009 to December 31, 2011.
Sales tax varies from 3% to 17% depending on the nature of the revenue. For revenues generated from those parts of our software solutions which are recognized by and registered with government authorities and meet government authorities’ requirements to be treated as software products, we are entitled to receive a refund of 14% on the total VAT paid at rate of 17%. Revenues from software products other than the above are subject to full VAT at 17%. In addition, we are currently exempted from sales tax for revenues generated from development and transfer of tailor-made software solutions for clients; further, revenues from our consulting services are subject to a 5% sales tax. As a company that qualifies to issue VAT invoices, we need to maintain a certain amount of revenue that is taxable by VAT. As such, we may have to refuse some of the tax exemption benefit in our tailor-made software development business and pay VAT for those parts of the revenue in order to maintain minimum VAT revenue thresholds. This practice may cease to apply if more of our software products are matured, recognized and registered as software products in the PRC.
Segment Information
We have two reportable operating segments. The segments are grouped with references to the types of services provided and the types of clients that use those services. Total sales and costs are divided between the two segments. We assess each segment’s performance based on net revenues and gross profit on contribution margin. The two reportable operating segments are Segment 1: Water and wastewater treatment process control systems, process tail gas purification and Segment 2: Water resources protection and allocation, flood control and forecasting, irrigation systems, and municipal water supply and distribution systems.
23
Table of Contents
Segment 1: Wastewater and Tail Gas Treatment
| 2009 | 2008 | Change ($) | Change (%) | |||||||||||
| Revenue |
$ | 8,960,830 | $ | 4,968,488 | $ | 3,992,342 | 80.4 | % | ||||||
| Cost of revenue(exclusive of depreciation and amortization) |
5,522,167 | 3,111,659 | 2,410,508 | 77.5 | % | |||||||||
| Selling Expenses |
290,354 | 111,751 | 178,603 | 159.8 | % | |||||||||
| Depreciation and Amortization |
67,081 | 34,399 | 32,682 | 95.0 | % | |||||||||
| Other general and administrative Expenses |
1,120,509 | 535,336 | 585,173 | 109.3 | % | |||||||||
| Operating Expenses |
1,477,944 | 681,486 | 796,458 | 116.9 | % | |||||||||
| Other Income |
(4,978 | ) | 40 | (5,018 | ) | (12,545 | )% | |||||||
| Income before provision for income taxes and non-controlling interest |
1,955,741 | 1,175,383 | 780,358 | 66.4 | % | |||||||||
| Income Taxes |
36,125 | 62,102 | (25,977 | ) | (41.8 | )% | ||||||||
| Non-controlling interest |
— | — | — | |||||||||||
| Net Income attributable to TRIT |
$ | 1,919,616 | 1,113,281 | 806,335 | 72.4 | % | ||||||||
In Segment 1, revenue was $8,960,830 in 2009, an increase of $3,992,342, or 80.4%, compared to revenue of $4,968,488 in 2008. The primary contributors to this increase were: (i) our recently executed prime contractor contracts with Dongli in Tianjin ($2.5 million) and with Xinle in Hebei ($2.0 million), and (ii) our recently executed contracts for some individual projects with large transactional value through our customer base expansion and product line extension, such as a project contract in Kuancheng ($1.65 million), a project contract in Zhouliangzhuang ($1.02 million) and a project contract in Hangu ($1.76 million). Recently, the Ministry of Environmental Protection of PRC with two other governmental agencies issued the First National Census of Pollution Source. This report acknowledged the severe environmental pollution in the PRC and unveiled the fact that Ministry of Environmental Protection, together with Ministry of Finance and State Administration of Taxation were discussing the environmental tax issue, which implied that the government will likely increase its environmental protection investment. We believe that such increased investment is likely to greatly benefit the Chinese environmental businesses, including our company.
Cost of revenue (exclusive of depreciation and amortization) for Segment 1 was $5,522,167 in 2009, an increase of $2,410,508, or 77.5%, compared to cost of revenue (exclusive of depreciation and amortization) of $3,111,659 in 2008. This increase was slightly less than our increase in Segment 1 revenue because: (i) we conducted more projects with higher gross margins; and (ii) we sourced more locally made equipment at a lower cost in connection with our projects.
In 2009, selling expenses were $290,354, an increase of $178,603, or 159.8%, compared to selling expenses of $111,751 in 2008. The increased selling expenses were mainly driven by the increased number of our sales personnel, as well as more frequent and longer business travelling necessary to compete for larger contracts. However, in the future, we expect to increase our marketing to existing customers and our selling expenses may decrease as a result.
Depreciation and amortization was $67,081 in 2009, an increase of $32,682, or 95.0%, compared to depreciation and amortization of $34,399 in 2008. The increase in depreciation and amortization resulted from the new equipment and vehicle purchases in 2009.
Other general and administrative expenses were $1,120,509, an increase of $585,173, or 109.3%, compared to other general and administrative expenses of $535,336 in 2008. Material causes for this increase included: (i) a $29,912 increase in office rental expenses, (ii) a $ 36,959 increase in R&D, and (iii) a $518,302 increase in the costs associated with being a publicly traded company, printing expenses, salary and depreciation and amortization expenses.
In 2009, total general and administrative expenses were $1,187,590, an increase of $617,855, or 108.4%, compared to general and administrative expenses of $569,735 in 2008. This increase exceeded the 80.4% increase
24
Table of Contents
in Segment 1 revenue. The increase in total general and administrative expenses was primarily due to: (i) an increase in R&D expenses, (ii) an increase in expenses associated with being a publicly traded company, and (iii) increased deprecation and amortization expenses. We will continuously monitor our general and administrative expenses in an effort to maximize our profitability.
Operating expenses in 2009 were $1,477,944, an increase of $796,458, or 116.9%, compared to operating expenses of $681,486 in 2008. The primary reasons were: (i) an increase in R&D expenses, (ii) an increase in expenses associated with being a publicly traded company, (iii) increased deprecation and amortization expenses, and (iv) an increase in selling expenses.
Other incomes (expenses) were $(4,978) in 2009, a $5,018 decrease compared to other income of $40 in 2008. The decrease was mainly due to the increased service charge of financial institutions.
Income before provision for income taxes and non-controlling interest was $1,955,741 in 2009, an increase of $780,358, or 66.4%, compared to income before provision for income taxes and non-controlling interest of $1,175,383 in 2008.
Income taxes were $36,125 in 2009, a $25,977 decrease compared to income taxes of $62,102 in 2008.
Net income attributable to the shareholders of TRIT was $1,919,616 in 2009, an increase of $806,335, or 72.4%, compared to net income attributable to the shareholders of TRIT of $1,113,281 in 2008. The increased net income attributable to the shareholders of TRIT was mainly driven by the increase in revenue. In the future, we intend to continue to improve our profitability by expanding our exiting market base and reducing project costs by utilizing locally-made equipment and parts.
Segment 2: Water Resource Management
| 2009 | 2008 | Change ($) | Change (%) | ||||||||||
| Revenue |
$ | 7,839,065 | $ | 3,481,470 | $ | 4,357,595 | 125.2 | % | |||||
| Cost of Revenue |
4,653,758 | 2,210,581 | 2,443,177 | 110.5 | % | ||||||||
| Selling Expenses |
309,951 | 127,533 | 182,418 | 143.0 | % | ||||||||
| Depreciation and Amortization |
52,092 | 54,332 | (2,240 | ) | (4.1 | )% | |||||||
| Other general and administrative Expenses |
727,906 | 467,795 | 260,111 | 55.6 | % | ||||||||
| Operating Expenses |
1,089,949 | 649,660 | 440,289 | 67.8 | % | ||||||||
| Other Income |
125,938 | 110,472 | 15,466 | 14.0 | % | ||||||||
| Income before provision for income taxes and non-controlling interest |
2,221,296 | 731,701 | 1,489,595 | 203.6 | % | ||||||||
| Income Taxes |
271,960 | 140,145 | 131,815 | 94.1 | % | ||||||||
| Non-controlling interest |
18,182 | 8,685 | 9,497 | 109.3 | % | ||||||||
| TRIT Net Income attributable to TIRT |
$ | 1,931,154 | $ | 582,871 | 1,348,283 | 231.3 | % | ||||||
In Segment 2, revenue was $7,839,065 in 2009, an increase of $4,357,595 or 125.2%, compared to revenue of $3,481,470 in 2008. This increase was driven by our recently executed contracts for several projects with large transactional value through our customer base expansion and product line extension. The primary contributors to this increase were our recently executed subcontractor contracts with Zhongyou in Beijing ($1.7 million) and the increase in the numbers of water resource management projects and the size of each project, resulting from the increase in government spending on water conservancy facilities.
Cost of revenue (exclusive of depreciation and amortization) in Segment 2 was $4,653,758 in 2009, an increase of $2,443,177, or 110.5%, compared to cost of revenue (exclusive of depreciation and amortization) of $2,210,581 in 2008. This increase was less than our increase in revenue because: (i) we conducted more projects with higher gross margins; and (ii) we lowered our equipment cost by acquiring more locally-made equipment and parts. For example, of total revenue, system integration sales were 54.6% in 2009, an increase of 12.6% compared
25
Table of Contents
to system integration sales of 42% in 2008. Similarly, of total revenue, hardware sales were 26.1% in 2009, a decrease of 5.9% compared to hardware sales of 32% in 2008. In 2009, the gross margin regarding to system integration and hardware sales were 34.0% and 13.4% respectively. As system integration requires high technology capability, it enjoys higher profitability, and we intend to focus our development on the higher margin areas of our business.
Selling expenses were $309,951 in 2009, an increase of $182,418 or 143.0%, compared to selling expenses of $127,533 in 2008. The growth rate of selling expenses was close to the growth rate of revenue. The increased selling expenses in 2009 included: (i) a $57,832 increase in travelling cost, and (ii) a $80,051 increase in salaries. We expect to secure additional contracts and projects through the increase in our selling expenses, such as rewarding outstanding sales representatives, increasing the number of sales personnel as well as the frequency and time of business travel.
Depreciation and amortization in Segment 2 was $52,092 in 2009, compared to depreciation and amortization of $54,332 in 2008. A $2,240 decrease in depreciation and amortization resulted from our completion of the depreciation of some equipment. In addition, changes in exchange rates reduced the depreciation results.
Other general and administrative expenses were $727,906, an increase of $260,111, or 55.6%, compared to other general and administrative expenses of $467,795 in 2008. This increase reflected: (i) a $75,610 increase in R&D expenses, (ii) a $117,945 increase in salaries.
Operating expenses in 2009 were $1,089,949, an increase of $440,289, or 67.8%, compared to operating expenses of $649,660 in 2008. This increase directly resulted from our increased revenues. However, the increased productivity of our personnel kept this increase below the increase in overall revenue in 2009. To the extent our company continues to increase the number of its projects, we will add administrative personnel as needed.
Other income was $125,938 in 2009, an increase of $15,466, or 14.0%, compared to other income of $110,472 in 2008. The increase was primarily due to the increased tax rebate in software sales.
Income before provision for income taxes and non-controlling interest was $2,221,296 in 2009, an increase of $1,489,595, or 203.6%, compared to income before provision for income taxes and non-controlling interest of $731,701 in 2008. The increase was driven by the rapid growth of our revenue.
Income taxes were $271,960 in 2009, an increase of $131,815, or 94.1%, compared to income taxes of $140,145 in 2008. This increase is in conformity with our increased revenues.
Non-controlling interest was $18,182 in 2009, an increase of $9,497, or 109.3%, compared to non-controlling interest of $8,685 in 2008.
Net income attributable to the shareholders of TRIT was $1,931,154 in 2009, an increase of $1,348,283, or 231.3%, compared to net income attributable to the shareholders of TRIT of $582,871 in 2008. The increased net income attributable to the shareholders of TRIT was mainly driven by the increase in revenue..
Significant Accounting Policies
Critical Accounting Policies
The accompanying consolidated financial statements have been prepared in accordance with generally accepted accounting principles in the United States of America (“US GAAP”). The accompanying consolidated financial statements include the accounts of our company, subsidiaries and VIEs. All material inter-company transactions and balances have been eliminated in the consolidation.
Our company adopted the provisions of FIN 46(R) (ASC No. 810). Pursuant to FIN 46(R), Tranhold and Yanyu are VIEs of our company, and we are the primary beneficiary of the VIEs. Accordingly, the VIEs have been consolidated in our financial statements.
26
Table of Contents
We compile our daily accounts in accordance with generally accepted accounting principles in the PRC (“PRC GAAP”) and convert our financial statements to make them comply with U.S. GAAP when reporting.
Estimates and Assumptions
The preparation of financial statements in conformity with U.S. GAAP requires management to make estimates and assumptions that affect the amounts reported in the combined financial statements and accompanying notes. Management believes that the estimates utilized in preparing its financial statements are reasonable and prudent. Actual results could differ from these estimates.
Certain of our accounting policies require higher degrees of judgment than others in their application. These include the recognition of revenue and earnings from system integration under the percentage of completion method and the allowance for doubtful accounts. Management evaluates all of its estimates and judgments on an on-going basis.
Revenue Recognition
Revenues consist primarily of product sales, software sales, and products and services solutions. Our company recognizes revenue when it is probable that the economic benefits will flow to the Company.
Specifically we provide products and service solutions under short and long-term fixed-price contracts. The contract periods range from two months to approximately three years in length. Our company recognizes income for these contracts following the percentage-of-completion method, measured by contract milestones in accordance with the AICPA’s Statement of Position 81-1, “Accounting for Performance of Construction-Type and Certain Production-Type Contracts” (“SOP 81-1”) (ASC No. 605). Cost of revenue (exclusive of depreciation and amortization) is based on total actual costs incurred plus estimated costs to completion applied to percentage of completion as measured by contract milestone. Cost of revenues (exclusive of depreciation and amortization) includes direct labor, materials and the applicable share of overhead expense directly related to the execution of services and delivery of projects.
If unapproved change orders and claims occur in the future, in accounting for contracts, we will follow Paragraphs 62 and 65 of SOP 81-1 (ASC No. 605). We will recognize as revenues costs associated with unapproved change orders (Paragraph 62 of SOP 81-1) and claims (Paragraph 65 of SOP 81-1) to the extent it is probable that such claims and change orders will result in additional contract revenue, and the amount of such additional revenue can be reliably estimated. Contract losses are provided for in their entirety in the period that they become known, without regard to the percentage-of-completion. However, we have not experienced significant unapproved change orders to date.
Our company recognizes sales of its products upon delivery of goods and passage of title in accordance with Securities and Exchange Commission (“SEC”) Staff Accounting Bulletin (“SAB”) No. 101, “Revenue Recognition in Financial Statements”, as amended by SAB No. 104, “Revenue Recognition”.
We recognize revenue from the sales of software, support contracts and services in accordance with SOP No. 97-2 (ASC No. 985), “Software Revenue Recognition” and SOP 81-1 (ASC No. 605). For software sales with no significant post-shipment obligations and no uncertainty about customer acceptance, our company recognizes revenue on delivery of software to the customer. Our company recognizes revenues for software sales with significant post-shipment obligations, including the production, modification, or customization of software, by the percentage-of-completion method, with progress to completion measured on the basis of milestone completion, labor costs incurred currently versus the total estimated labor cost of performing the contract over its term, or other factors appropriate to the individual contract of sale.
We present all sales revenue net of VAT or a sales tax. Our company’s products that are sold in the PRC are generally subject to a Chinese VAT at a rate of 17% or sales tax of 5% of the gross sales price, except for certain proprietary software sales, which will only be subject to an effective tax rate of 3%. The VAT may be offset by VAT paid by our company on purchased raw materials and other materials included in the cost of projects or producing the finished product.
27
Table of Contents
Our company records revenue in excess of billings as “unbilled receivables”. We record billings in excess of revenues as “billings in excess of revenue”.
We obtained several contracts with billing cycles of over three years in 2009. The discounted revenue is recorded as long-term unbilled revenue and the discount rate is the 3-year nominal interest rate of 5.4%, set by the PRC central bank.
Consolidation of Variable Interest Entities
The accounts of Yanyu and Tranhold are consolidated in the accompanying financial statements pursuant to FIN 46(R). As VIEs, Yanyu’s and Tranhold’s sales are included in our company’s total sales, their income from operations is consolidated with our company’s, and our net income from continuing operations before non-controlling interest in income includes all of Yanyu’s and Tranhold’s net income. Our non-controlling interest in their income is then subtracted in calculating the net income attributable to our company. Because of the contractual arrangements, we have a pecuniary interest in each of Yanyu and Tranhold that requires consolidation of our company’s, Yanyu’s and Tranhold’s financial statements.
Accounts Receivable
We recognize accounts receivable initially at fair value less an allowance for doubtful accounts. We make an allowance for doubtful accounts based on aging of accounts receivable and on any specifically identified accounts receivable that may become uncollectible. We maintain allowances for doubtful accounts for estimated losses resulting from the failure of customers to make required payments in the relevant time period. We review the accounts receivable on a periodic basis and make general and specific allowances when there is doubt as to the collectability of individual balances. In evaluating the collectability of individual receivable balances, we consider many factors, including the age of the balance, the customer’s historical payment history and current credit-worthiness and current economic trends. The amount of the provision, if any, is recognized in the consolidated statement of operations within “General and administrative expenses”.
Cost of Revenues (exclusive of depreciation and amortization)
Cost of revenues (exclusive of depreciation and amortization) include: material and equipment costs, transportation costs, labor costs, processing costs, packaging costs, quality inspection cost, quality control costs, and sales tax. Cost of revenues (exclusive of depreciation and amortization) also includes inbound freight charges, purchasing and receiving costs and inspection costs, where those types of cost occur.
Operating expenses
Operating expenses include: salaries, bonus, and social insurance of management, administrative and sales personal, traveling cost, entertainment expenses, depreciation of equipment, amortization of intangible asset, office rental expenses, professional service fee, office supply, R&D expenses, bad debt provision, etc.
Plant and Equipment
We state plant and equipment at historical cost less accumulated depreciation and amortization. Historical cost consists of purchase price and any directly attributable costs of bringing the assets to working condition and location for intended use. We provide for depreciation and amortization in amounts sufficient to expense the related cost of depreciable assets for operations over their estimated useful lives. We compute depreciation using the straight-line method over the estimated useful lives of the assets with 5% residual value.
28
Table of Contents
Estimated useful lives of the Company’s assets are as follows:
| Useful Life | ||
| Buildings and improvements |
40 years | |
| Transportation equipment |
5-8 years | |
| Machinery |
10 years | |
| Office equipment |
5 years | |
| Furniture |
5 years |
We eliminate the cost and related accumulated depreciation of assets sold or otherwise retired from the accounts and includes any gain or loss in the statement of income. We charge maintenance, repairs and minor renewals directly to expenses as incurred, and it capitalizes major additions and betterment to buildings and equipment.
The depreciation expense for the years ended December 31, 2009 and 2008 amounted to $58,619 and $30,892, respectively, and the net value of plant and equipment as of December 31, 2009 and 2008 amounted to $374,009 and $174,128, respectively.
Intangible Assets
We amortize other acquired intangible assets with definite lives on a straight-line basis over their expected useful economic lives. We do not amortize intangible assets with an indefinite useful life, and we subject such assets to an impairment test annually or more frequently if events or changes in circumstances indicate that the assets might be impaired. We periodically evaluate the recoverability of all intangible assets and take into account events or circumstances that warrant revised estimates of useful lives or that indicate that impairment exists.
| Useful Life | ||
| Proprietary technology relating to sewage, municipal solid waste treatment and tail gas purification |
20 years | |
| Proprietary technology relating to low energy consumption data transmission system |
20 years |
The amortization expense for the years ended December 31, 2009 and December 31, 2008 amounted to $60,554 and $57,839, respectively. The net value of intangible assets as of December 31, 2009 and 2008 amounted to $797,854 and $857,475, respectively.
Inventories
We value inventory at the lower of cost or net realizable value and determine inventory by using the average cost method. Inventory consists of raw materials, finished goods, and work-in-progress, which includes the cost of direct labor, materials and overhead costs related to projects.
Inventories consisted of the following:
| December 31, 2009 | December 31, 2008 | |||||
| Raw materials |
$ | 140,048 | $ | 112,638 | ||
| Finished goods |
360,152 | 226,172 | ||||
| Project work-in-progress |
1,073,124 | 1,127,658 | ||||
| Totals |
$ | 1,573,324 | $ | 1,466,468 | ||
We review our inventory periodically for possible obsolete goods and to determine if any reserves are necessary for potential obsolescence. As of December 31, 2009 and 2008, we determined that no more reserves were necessary.
29
Table of Contents
Research and development
Research and development expenses include salaries, consultant fees, supplies and materials, as well as costs related to other overhead such as depreciation, facilities, utilities and other departmental expenses. Our company expenses costs for the development of new software products and substantial enhancements to existing software products as incurred until technological feasibility has been established, at which time we capitalize any additional costs. Our management is responsible for assessing the establishment of technological feasibility in accordance with FAS 86 (ASC No. 985), “Accounting for the Costs of Computer Software to Be Sold, Leased, or Otherwise Marketed.”
Research and development costs recorded in selling and general and administrative expenses were $178,864 and $66,296 during the years ended December 31, 2009 and 2008, respectively. No research and development expenses were capitalized in 2009 and 2008. The increase in research and development costs is in line with our strategy to increase research and development spending to develop new products in the future. We did not capitalize research and development expenses in the years ended December 31, 2009 and 2008.
Translation of Foreign Currency
We use the United States dollar as our reporting and functional currency. We translate monetary assets and liabilities denominated in currencies other than United States dollars into United States dollars at the rates of exchange ruling at the balance sheet date. We convert transactions in currencies other than United States dollars during the year into United States dollars at the rates of exchange ruling at the transaction dates.
We maintain financial records of our PRC subsidiary and the VIEs in RMB, their functional currency and the currency of the PRC. We translate their balance sheets assets and liabilities into United States dollars based on the rates of exchange existing on the balance sheet date and translate their statements of operations using a weighted average rate for the period. We reflect translation adjustments as accumulated other comprehensive income (loss) in stockholders’ equity.
Transaction gains and losses that arise from exchange rate fluctuations on transactions denominated in a currency other than the functional currency are included in the results of operations as incurred.
Translation adjustments amounted to $377,096 and $361,328 as of December 31, 2009 and December 31, 2008, respectively. We translated balance sheet amounts with the exception of equity at December 31, 2009 at RMB 6.8282 to $1.00 as compared to RMB 6.8346 to $1.00 at December 31, 2008. We stated equity accounts at their historical rate. The average translation rates applied to income statement accounts for the year ended December 31, 2009 and the year ended December 31, 2008 were RMB 6.8309 and RMB 6.9451, respectively.
Earnings per share
Basic EPS excludes dilution and is computed by dividing net income (loss) attributable to common stockholders by the weighted average number of ordinary shares outstanding for the period. Diluted EPS reflects the potential dilution that could occur if securities or other contracts to issue common stock (convertible preferred stock, forward contract, warrants to purchase common stock, contingently issuable shares, common stock options and warrants and their equivalents using the treasury stock method) were exercised or converted into common stock. We exclude potential ordinary shares in the diluted EPS computation in periods of losses from continuing operations, as their effect would be anti-dilutive.
We have granted 525,500 options to our key employees and 177,500 warrants, to purchase ordinary shares, both of which are included when calculating the diluted earnings per share.
PRC Enterprise Income Tax
Our company provides for deferred income taxes using the asset and liability method. Under this method, we recognize deferred income taxes for tax credits and net operating losses available for carry-forwards and significant
30
Table of Contents
temporary differences. We classify deferred tax assets and liabilities as current or non-current based upon the classification of the related asset or liability in the financial statements or the expected timing of their reversal if they do not relate to a specific asset or liability. We provide a valuation allowance to reduce the amount of deferred tax assets if it is considered more likely than not that some portion of, or all of, the deferred tax assets will not be realized.
We adopted FASB Interpretation 48 (ASC No. 605), “Accounting for Uncertainty in Income Taxes” (“FIN 48”), as of January 1, 2007. We recognize a tax position as a benefit only if it is “more likely than not” that the tax position would be sustained in a tax examination, with a tax examination being presumed to occur. The amount recognized is the largest amount of tax benefit that is over 50% likely to be realized on examination. For tax positions not meeting the “more likely than not” test, we do not record a tax benefit. FIN 48 also provides guidance on de-recognition, classification, interest and penalties, accounting in interim periods, disclosures, and transition. The adoption had no effect on our financial statements. We did not have any significant unrecognized uncertain tax positions.
Our operations are subject to income and transaction taxes mainly in the PRC. Significant estimates and judgments are required in determining our provision for income taxes. Some of these estimates are based on interpretations of existing tax laws or regulations. The ultimate amount of tax liability may be uncertain as a result. We do not anticipate any events that are likely to change these uncertainties.
PRC Value-added Tax
Our Company’s products that are sold in the PRC are generally subject to a Chinese VAT at a rate of 17% except for certain proprietary software sales, which will only be subject to a tax at an effective rate of 3%. The VAT may be offset by VAT we pay on raw materials and other materials included in the cost of producing their finished product. Accrued VAT payables from Yanyu and Tranhold are subject to a 10% surtax, which includes urban maintenance and construction tax and additional education fees.
PRC Business Tax
Revenues from services provided by TTB, Yanyu and Tranhold are subject to a PRC business tax of 5% and surtax of 0.5%. We pay business tax on gross revenues generated from our shipping agency services minus the costs of services, which are paid on behalf of our customers.
Recent Accounting Pronouncements
In April 2009, the Securities and Exchange Commission issued Staff Accounting Bulletin (“SAB”) No. 111 (“SAB 111”). SAB 111 amends Topic 5.M. in the SAB series entitled “Other Than Temporary Impairment of Certain Investments Debt and Equity Securities”. On April 9, 2009, the FASB issued FASB Staff Position (“FSP”) No. FAS 115-2 and FAS 124-2, “Recognition and Presentation of Other-Than-Temporary Impairments”. SAB 111 maintains the previous views related to equity securities and amends Topic 5.M. to exclude debt securities from its scope. SAB 111 was effective for the Company as of March 31, 2009. There was no material impact on our consolidated financial position or results of operations upon adoption.
In April 2009, the FASB issued FSP No. FAS 107-1 and APB 28-1, “Interim Disclosures about Fair Value of Financial Instruments”. This FASB staff position amends FASB Statement No. 107 to require disclosures about fair values of financial instruments for interim reporting periods as well as in annual financial statements. The staff position also amends APB Opinion No. 28 to require those disclosures in summarized financial information at interim reporting periods. This FASB staff position becomes effective for interim reporting periods ending after June 15, 2009, with early adoption permitted for periods ending after March 15, 2009. We do not believe there will be material impact on our consolidated financial position or results of operations upon adoption on April 1, 2009.
In April 2009, the FASB issued FSP No. FAS 115-2 and FAS 124-2, “Recognition and Presentation of Other-Than-Temporary Impairments”. This FSP amends the other-than-temporary impairment guidance in GAAP for debt securities. If an entity determines that it has an other-than-temporary impairment on a security, it must recognize the credit loss on the security in the income statement. The credit loss is defined as the difference between the present
31
Table of Contents
value of the cash flows expected to be collected and the amortized cost basis. The staff position expands disclosures about other-than-temporary impairment and requires that the annual disclosures in FASB Statement No. 115 and FSP FAS 115-1 and FAS 124-1 be made for interim reporting periods. This FSP becomes effective for interim reporting periods ending after June 15, 2009, with early adoption permitted for periods ending after March 15, 2009. The Company believes that the adoption of this standard will not materially impact its financial statements.
In April 2009, the Financial Accounting Standards Board (“FASB”) issued three Staff Positions (“FSPs”) that are intended to provide additional application guidance and enhance disclosures about fair value measurements and impairments of securities. FSP FAS 157-4 clarifies the objective and method of fair value measurement even when there has been a significant decrease in market activity for the asset being measured. FSP FAS 115-2 and FAS 124-2 establish a new model for measuring other-than-temporary impairments for debt securities, including establishing criteria for when to recognize a write-down through earnings versus other comprehensive income. FSP FAS 107-1 and APB 28-1 expand the fair value disclosures required for all financial instruments within the scope of SFAS No. 107, “Disclosures about Fair Value of Financial Instruments”, to interim periods. All of these FSPs are effective for us beginning April 1, 2009. The Company believes that the adoption of this standard will not materially impact its financial statements.
In May 2009, the FASB issued SFAS No. 165 (ASC No. 855), “Subsequent Events.” This Statement sets forth: (1) the period after the balance sheet date during which management of a reporting entity should evaluate events or transactions that may occur for potential recognition or disclosure in the financial statements; (2) the circumstances under which an entity should recognize events or transactions occurring after the balance sheet date in its financial statements; and (3) the disclosures that an entity should make about events or transactions that occurred after the balance sheet date. This Statement is effective for interim and annual periods ending after June 15, 2009. The company adopted this Statement in the quarter ended June 30, 2009. This Statement did not impact the consolidated financial results.
In June 2009, the FASB issued SFAS No. 167 (ASC No. 810), “Amendments to FASB Interpretation No. 46(R),” and SFAS No. 166 (ASC No. 860), “Accounting for Transfers of Financial Assets—an amendment of FASB Statement No. 140 (ASC No. 860).” SFAS No. 167 amends FASB Interpretation 46(R) to eliminate the quantitative approach previously required for determining the primary beneficiary of a variable interest entity and requires ongoing qualitative reassessments of whether an enterprise is the primary beneficiary of a variable interest entity. SFAS No. 166 amends SFAS No. 140 by removing the exemption from consolidation for Qualifying Special Purpose Entities (QSPEs). This Statement also limits the circumstances in which a financial asset, or portion of a financial asset, should be derecognized when the transferor has not transferred the entire original financial asset to an entity that is not consolidated with the transferor in the financial statements being presented and/or when the transferor has continuing involvement with the transferred financial asset. The company will adopt these Statements for interim and annual reporting periods beginning on January 1, 2010. The company does not expect the adoption of these standards to have any material impact on the Consolidated Financial Statements.
In June 2009, the Financial Accounting Standards Board (FASB) issued Statement of Financial Accounting Standards (SFAS) No. 168 (ASC No. 105), “The FASB Accounting Standards Codification TM and the Hierarchy of Generally Accepted Accounting Principles, a replacement of FASB Statement No. 162” (the Codification). The Codification, which was launched on July 1, 2009, became the single source of authoritative nongovernmental U.S. GAAP, superseding existing FASB, American Institute of Certified Public Accountants (AICPA), Emerging Issues Task Force (EITF) and related literature. The Codification eliminates the GAAP hierarchy contained in SFAS No. 162 and establishes one level of authoritative GAAP. All other literature is considered non-authoritative. This Statement is effective for financial statements issued for interim and annual periods ending after September 15, 2009. The company adopted this Statement for its quarter ended September 30, 2009. There was no change to the company’s Consolidated Financial Statements due to the implementation of this Statement.
In June 2009, the Financial Accounting Standards Board (FASB) issued Accounting Standard Update No. 2009-02. “Amendments to Various Topics for Technical corrections.” ASU No. 2009-2 is an omnibus update that is effective for financial statements issued for interim and annual periods ending after July 1, 2009. This Statement did not impact the company’s consolidated financial results.
32
Table of Contents
In August 2009, the FASB issued guidance on the measurement of liabilities at fair value (ASU No. 2009-5). The guidance provides clarification that in circumstances in which a quoted market price in an active market for an identical liability is not available, an entity is required to measure fair value using a valuation technique that uses the quoted price of an identical liability when traded as an asset or, if unavailable, quoted prices for similar liabilities or similar assets when traded as assets. If none of this information is available, an entity should use a valuation technique in accordance with existing fair valuation principles. The company adopted this guidance in the quarter ended September 30, 2009 and there was no material impact on the Consolidated Financial Statements.
In September 2009, the FASB issued amended guidance concerning fair value measurements of investments in certain entities that calculate net asset value per share (or its equivalent) (ASU No. 2009-12). If fair value is not readily determinable, the amended guidance permits, as a practical expedient, a reporting entity to measure the fair value of an investment using the net asset value per share (or its equivalent) provided by the investee without further adjustment. The amendments are effective for interim and annual periods ending after December 15, 2009. The company does not expect a material impact on the Consolidated Financial Statements due to the adoption of this amended guidance.
In October 2009, the FASB issued guidance that amends the scope of existing software revenue recognition accounting (ASU No. 2009-14). Tangible products containing software components and non-software components that function together to deliver the product’s essential functionality would be scoped out of the accounting guidance on software and accounted for based on other appropriate revenue recognition guidance. For the company, this guidance is effective for all new or materially modified arrangements entered into on or after January 1, 2011 with earlier application permitted as of the beginning of a fiscal year. Full retrospective application of the new guidance is optional. This guidance must be adopted in the same period that the company adopts the amended accounting for arrangements with multiple deliverables described in the preceding paragraph. The company is currently assessing its implementation of this new guidance, but does not expect a material impact on the Consolidated Financial Statements.
In October 2009, the Financial Accounting Standards Board (FASB) issued amended revenue recognition guidance for arrangements with multiple deliverables (ASU No. 2009-13). The new guidance eliminates the residual method of revenue recognition and allows the use of management’s best estimate of selling price for individual elements of an arrangement when vendor specific objective evidence (VSOE), vendor objective evidence (VOE) or third-party evidence (TPE) is unavailable. For the company, this guidance is effective for all new or materially modified arrangements entered into on or after January 1, 2011 with earlier application permitted as of the beginning of a fiscal year. Full retrospective application of the new guidance is optional. The company is currently assessing its implementation of this new guidance, but does not expect a material impact on the Consolidated Financial Statements.
In October 2009, the FASB issued amended accounting guidance for own-share lending arrangements in contemplation of convertible debt issuance or other financing (ASU No.2009-15). A share-lending arrangement is an agreement of prohibitive share borrowing between a company and an investment banking firm to facilitate third-party investors to exercise the conversion option in the company’s convertible debt. This amendment requires a disclosure of various items in terms of share-lending arrangements and is effective for fiscal years beginning on or after December 15, 2009, and interim periods within those fiscal years for arrangements outstanding as of the beginning of those fiscal years. Early adoption is not permitted. The Company currently does not issue any convertible debt and believes the appliance with this guidance will not have a material impact on the Consolidated Financial Statements.
In December 2009, the FASB issued amended accounting guidance for transfers of financial assets (ASU No. 2009-16). The amendment redefines the types of transfers and the term of sales of financial assets, and points out the obligations for each party involved in the transfer service. The amendment is effective as of the beginning of the first annual reporting period that begins after November 15, 2009, for interim periods within that first annual reporting period, and for interim and annual reporting periods thereafter. Earlier adoption is prohibited. The company is currently assessing its implementation of this new guidance, but does not expect a material impact on the Consolidated Financial Statements.
33
Table of Contents
In December 2009, the FASB issued amended accounting guidance for improvements to financial reporting by enterprises involved with variable interest entities (ASU No. 2009-17). The guidance clarifies the definition of VIEs as well as the obligations of each party and requires the primary beneficiary of a VIE to disclose, the assumptions of the VIEs consolidation, the change in its most recent financials through the consolidation and its involvement with VIEs regarding to both quantities and qualitative information. The amendment is effective as of the beginning of the first annual reporting period that begins after November 15, 2009, for interim periods within that first annual reporting period, and for interim and annual reporting periods thereafter. Earlier adoption is prohibited. The Company is currently assessing its implementation of this new guidance, but does not expect a material impact on the Consolidated Financial Statements.
Management does not believe that other recent accounting pronouncements issued by the FASB (including its Emerging Issues Task Force), the American Institute of Certified Public Accountants, and the SEC have or will have a material impact on our company’s present or future consolidated financial statements.
| Item 7A. | Quantitative and Qualitative Disclosures about Market Risk. |
The Company is not required to provide the information required by this Item because the Company is a smaller reporting company.
| Item 8. | Financial Statements and Supplementary Data. |
The Company’s financial statements and the related notes, together with the report of Mao & Company, CPAs, Inc. are set forth following the signature pages of this report.
| Item 9. | Changes in and Disagreements with Accountants on Accounting and Financial Disclosure. |
None.
Item 9A/9A(T). Controls and Procedures
Disclosure Controls and Procedures
As of December 31, 2009, our company carried out an evaluation, under the supervision of and with the participation of management, including our company’s chief executive officer and chief financial officer, of the effectiveness of the design and operation of our company’s disclosure controls and procedures. Based on the foregoing, the chief executive officer and chief financial officer concluded that our company’s disclosure controls and procedures (as defined in Rules 13a-15(e) and 15d-15(e) under the Securities Exchange Act of 1934) were effective.
Changes in Internal Control over Financial Reporting
There were no changes in our company’s internal control over financial reporting (as defined in Rule 13a-15(f) of the Securities Exchange Act of 1934) during the quarter and year ended December 31, 2009 that have materially affected, or are reasonably likely to materially affect, our company’s internal control over financial reporting.
This annual report does not include a report of management’s assessment regarding internal control over financial reporting or an attestation report of the company’s registered public accounting firm due to a transition period established by rules of the Securities and Exchange Commission for newly public companies.
| Item 9B. | Other Information. |
None.
34
Table of Contents
| Item 10. | Directors, Executive Officers and Corporate Governance. |
Regulation S-K Item 401:
Executive Officers and Directors
The following table sets forth our executive officers and directors, their ages and the positions held by them:
| Name |
Age |
Position | ||
| Warren Zhao(1)(7) | 44 | Chairman of the Board & Chief Executive Officer of TRIT, President of TTB and Tranhold | ||
| Phil Fan(1) |
44 | President and founder of TRIT | ||
| Peter Dong(1) |
41 | Chief Financial Officer of TRIT | ||
| Simon Zhuang(1) |
57 | President of Yanyu | ||
| David Hu(1)(7) |
44 | Director | ||
| Peiyao Zhang(1)(2)(3)(4)(6) |
65 | Director | ||
| Xiaoping Zhou(1)(2)(3)(4)(6) |
46 | Director | ||
| Robert W. Kraft(1)(2)(3)(4)(5) | 58 | Director |
| (1) | The individual’s business address is c/o Tri-Tech Holding Inc., 5D, Tower A, 2 Building Business Center Jinyuan Shidai, No. 2 East Road Landianchang, Haidian District, Beijing, PRC 100097. |
| (2) | Member of audit committee. |
| (3) | Member of compensation committee. |
| (4) | Member of nominating committee. |
| (5) | Class I director whose term expires in 2010. |
| (6) | Class II director whose term expires in 2011. |
| (7) | Class III director whose term expires in 2012. |
Warren Zhao. Mr. Zhao is our Chairman and Chief Executive Officer. He is also the president of our subsidiary, TTB, and one of our VIEs, Tranhold. Mr. Zhao was one of the founders of our company in 2002. Prior to founding our company, Mr. Zhao established Beijing Tranhold Automatic Control Systems and served as its general manager in 1994. From 1988 through 1993, Mr. Zhao was the manager of the research and development department at Beijing Test Control Technology Institute of Aeronautics Ministry. Mr. Zhao earned his bachelor’s and master’s degrees in engineering from Northwest China Polytechnic University. Mr. Zhao has been chosen as a director because he is one of the founders and the leader of our company and we because we believe we can benefit from his guidance in the industry.
Phil Fan. Mr. Fan is our President. Mr. Fan was one of the founders of our company in 2003. Prior to founding our company, Mr. Fan provided technical, engineering and management services in several U.S. engineering firms, including Black and Veatch, Parsons Brinckerhoff, Inc., and Chastain-Skillman, Inc. From 2003 through 2005, Mr. Fan was the Asia Regional Sales Manager for Met-Pro Corporation. Mr. Fan earned his bachelor’s and master’s degrees in environmental engineering from Hunan University and a master’s degree in civil engineering from Louisiana State University. Mr. Fan has been a registered professional engineer in the United States since 2001.
Peter Dong. Mr. Dong is our Chief Financial Officer. Mr. Dong has been our CFO since 2006. From 2001 through 2005, Mr. Dong was the Customer Service Manager of South West Securities Company and Wan Lian Securities Company. Mr. Dong has over 15 years of management experience in the technology and securities industries in China. Mr. Dong earned his bachelor’s degree in computer science from Nanjing University of Aeronautics and Astronautics and his master’s degree in economics from Renmin University of China.
35
Table of Contents
Simon Zhuang. Mr. Zhuang is the president of one of our VIEs, Yanyu. Mr. Zhuang has served Yanyu as its vice president and president since 2002. From 1991 through 2001, Mr. Zhuang was a manager of the Department of Technology of the Aeronautics Industry Science and Technology Corp.
David Hu. Mr. Hu is a director. Mr. Hu has been our director since 2007. From 2004 through 2006, Mr. Hu was a technical adviser of Beijing Aderco New Science and Technology Co., Ltd., a Chinese company that provides engineering services in the petrochemical industry. From 1996 through 2003, Mr. Hu engaged in research in petrochemical technology, earning four scientific research awards from the Anqing government Mr. Hu received his bachelor’s degree in chemical engineering from Dalian Polytechnic University. Mr. Hu was chosen as a director because of his engineering background and experience.
Dr. Peiyao Zhang. Dr. Zhang has been a Director of our Company since 2009. Dr. Zhang is the Chairman of the nominating committee of the board of directors. Dr. Zhang served as the Deputy Director of the SINOPEC Petrochemical Science and Engineering Research Institute from 1999-2005, where he was responsible for technical license management. Prior to his work with SINOPEC, from 1994-1998, Dr. Zhang served as the Deputy Director and Chief Engineer of the SINOPEC Department of Developing and Planning, where he directed over forty joint venture projects. Prior to SINOPEC, from 1992-1993, Dr. Zhang served as the Deputy Bureau Chief of Foreign Affairs for SINOPEC, as well as the Deputy Director of Research and Development for SINOPEC from 1990-1992. Dr. Zhang has also served as a Director and Senior Engineer for the Yanshan Petrochemical Research Institute, specializing in catalyst research and development, from 1985-1990. Prior to Yanshan, Dr. Zhang was an engineer at the Beijing Yanshan Petrochemical Co. from 1974-1983 and a technician at the Jinxi Chemical Plant from 1968-1973. Dr. Zhang received a bachelor’s degree from Tsinghua University in 1967 and a Ph.D in chemical engineering from the Sweden Royal Institute of Technology in 1988. Dr. Zhang is a visiting scholar at the Sweden Royal Institute of Technology and was awarded the 1994 National Outstanding Scholar Award by the Chinese Government. Dr. Zhang has been chosen as a director because we believe we can benefit from his engineering and leadership experience.
Dr. Xiaoping Zhou. Dr. Zhou has been a Director of our Company since 2009. Dr. Zhou is the Chairman of the compensation committee of the board of directors. Dr. Zhou currently serves as the Senior Hydrologist for the resources, groundwater resources, surface water resources, and environmental resources departments at the Southern Nevada Water Authority. He is responsible for conducting hydrologic and hydrogeologic studies and surface and groundwater quality monitoring. He is also currently an adjunct professor in the Department of Geosciences at the University of Nevada, Las Vegas. Prior to the SNWA, from 1998-2001, Dr. Zhou served as a Research Hydrogeologist at the UNLV Harry Reid Center for Environmental Studies. Prior to the Harry Reid Center, in 1998, Dr. Zhou was a Project Geologist with Group Alpha, Inc. Prior to Group Alpha, from 1996-1998, Dr. Zhou was an Engineering Geologist and Laboratory Manager for Construction Testing and Engineering, Inc., where he conducted geotechnical investigations and environmental site assessments. Dr. Zhou received a bachelor’s degree and a M.S. in Geology from Nanjing University. He also received a M.S. in Geosciences and a Ph.D. in Hydrogeology from UNLV. Dr. Zhou has been chosen because we believe his experience as a hydrologist will benefit our company.
Robert W. Kraft. Mr. Kraft has been a Director of our Company since 2009. Mr. Kraft is the Chairman and financial expert of the audit committee of the board of directors. Mr. Kraft is the Chairman, Chief Executive Officer and a founding partner of First Pathway Partners, LLC, an investment fund manager that qualifies foreign citizens for United States citizenship under the U.S. Homeland Security EB5 Immigration Program. Mr. Kraft also currently serves as the Chairman, President and CEO of PSA, North America, LLC, a consultancy focused on China. Mr. Kraft was the founder, President and CEO of Openfirst, a national provider of direct mail, statement processing, electronic messaging, and database management services for Fortune 1000 companies that was sold in 2006. Mr. Kraft also serves on the Boards of RBP Chemical, First Edge Solutions, Pacific Strategies & Assessments-Asia, United Community Center, University of Wisconsin-Madison’s China Leadership Board, and the Metropolitan Milwaukee Association of Commerce, where he is Co-Chair of the China Business Council. Mr. Kraft has a bachelor’s degree in Business Administration from John Carroll University in Cleveland, Ohio. Mr. Kraft was chosen as a director because of his leadership experience and financial background and experience.
36
Table of Contents
Employment Agreements
Under Chinese law, we may only terminate employment agreements without cause and without penalty by providing notice of non-renewal one month prior to the date on which the employment agreement is scheduled to expire. If we fail to provide this notice or if we wish to terminate an employment agreement in the absence of cause, then we are obligated to pay the employee one month’s salary for each year we have employed the employee. We are, however, permitted to terminate an employee for cause without penalty to our company, where the employee has committed a crime or the employee’s actions or inactions have resulted in a material adverse effect to us.
Our employment agreements with our executive officers generally provide for a term of five years and a salary to be paid monthly. The agreements also provide that executive officers are to work an average of forty hours per week and are entitled to all legal holidays as well as other paid leave in accordance with PRC laws and regulations and our internal work policies. Under such agreements, our executive officers can be terminated for cause without further compensation. The employment agreements also provide that we will pay for all mandatory social security programs for our executive officers in accordance with PRC regulations. During the agreement and for two (2) years afterward, our executive officers are subject to keep trade secrets confidential.
Stock Option Pool
Our 2009 Stock Incentive Plan authorizes the issuance of up to 525,500 ordinary shares. Pursuant to this plan, we may issue options to purchase our ordinary shares to our employees and directors. The Compensation Committee of the Board of Directors will administer the plan. The options will have exercise prices equal to the fair market value of our ordinary shares on the date of grant. In addition, the options will vest over five years (20% per year) and have terms of ten years. As of the date of this Prospectus, we have issued all the options available under the 2009 Stock Incentive Plan.
Board of Directors and Board Committees
Our board of directors currently consists of 5 directors. There are no family relationships between any of our executive officers and directors.
The directors will be divided into three classes, as nearly equal in number as the then total number of directors permits. Class I directors shall face re-election at our annual general meeting of shareholders in 2010 and every three years thereafter. Class II directors shall face re-election at our annual general meeting of shareholders in 2011 and every three years thereafter. Class III directors shall face re-election at our annual general meeting of shareholders in 2012 and every three years thereafter.
If the number of directors changes, any increase or decrease will be apportioned among the classes so as to maintain the number of directors in each class as nearly as possible. Any additional directors of a class elected to fill a vacancy resulting from an increase in such class will hold office for a term that coincides with the remaining term of that class. Decreases in the number of directors will not shorten the term of any incumbent director. These board provisions could make it more difficult for third parties to gain control of our company by making it difficult to replace members of the Board of Directors.
A director may vote in respect of any contract or transaction in which he is interested, provided, however that the nature of the interest of any director in any such contract or transaction shall be disclosed by him at or prior to its consideration and any vote on that matter. A general notice or disclosure to the directors or otherwise contained in the minutes of a meeting or a written resolution of the directors or any committee thereof of the nature of a director’s interest shall be sufficient disclosure and after such general notice it shall not be necessary to give special notice relating to any particular transaction. A director may be counted for a quorum upon a motion in respect of any contract or arrangement which he shall make with our company, or in which he is so interested and may vote on such motion.
There are no membership qualifications for directors. Further, there are no share ownership qualifications for directors unless so fixed by us in a general meeting.
37
Table of Contents
Mr. Warren Zhao currently holds both the positions of Chief Executive Officer and Chairman of the Board. These two positions have not been consolidated into one position; Mr. Zhao simply holds both positions at this time. We do not have a lead independent director because of the foregoing reason and also because we believe our independent directors are encouraged to freely voice their opinions on a relatively small company board. We believe this leadership structure is appropriate because we are a smaller reporting company that recently became listed on a public exchange; as such we deem it appropriate to be able to benefit from the guidance of Mr. Zhao as both our principal executive officer and Chairman of the Board.
Our Board of Directors plays a significant role in our risk oversight. The Board of Directors makes all relevant Company decisions. As such, it is important for us to have our Chief Executive Officer serve on the Board as he plays a key role in the risk oversight of the Company. As a smaller reporting company with a small board of directors, we believe it is appropriate to have the involvement and input of all of our directors in risk oversight matters.
Currently, three committees have been established under the board: the audit committee, the compensation committee and the nominating committee. All members of each committee are independent directors. The audit committee is responsible for overseeing the accounting and financial reporting processes of our company and audits of the financial statements of our company, including the appointment, compensation and oversight of the work of our independent auditors. The compensation committee of the board of directors reviews and makes recommendations to the board regarding our compensation policies for our officers and all forms of compensation, and also administers our incentive compensation plans and equity-based plans (but our board retains the authority to interpret those plans). The nominating committee of the board of directors is responsible for the assessment of the performance of the board, considering and making recommendations to the board with respect to the nominations or elections of directors and other governance issues. The nominating committee considers diversity of opinion and experience when nominating directors.
There are no other arrangements or understandings pursuant to which our directors are selected or nominated.
Duties of Directors
Under Cayman Islands law, our directors have a fiduciary duty to the company to act in good faith in their dealings with or on behalf of our company and exercise their powers and fulfill the duties of their office honestly. This duty has four essential elements:
| • | a duty to act in good faith in the best interests of the company; |
| • | a duty not to personally profit from opportunities that arise from the office of director; |
| • | a duty to avoid conflicts of interest; and |
| • | a duty to exercise powers for the purpose for which such powers were intended. |
In general, Cayman Islands Law imposes various duties on directors of a company with respect to certain matters of management and administration of the company. In addition to the remedies available under general law, the Companies Law imposes fines on directors who fail to satisfy some of these requirements. However, in many circumstances, an individual is only liable if he is knowingly guilty of the default or knowingly and willfully authorizes or permits the default. In comparison, under Delaware law, the business and affairs of a corporation are managed by or under the direction of its board of directors. In exercising their powers, directors are charged with a fiduciary duty of care to protect the interests of the corporation and a fiduciary duty of loyalty to act in the best interests of its shareholders. In addition, under Delaware law, a party challenging the propriety of a decision of the directors bears the burden of rebutting the applicability of the presumptions afforded to directors by the “business judgment rule.” If the presumption is not rebutted, the business judgment rule protects the directors and their decisions, and their business judgments will not be second guessed. If the presumption is rebutted, the directors bear the burden of demonstrating the entire fairness of the relevant transaction. Notwithstanding the foregoing, Delaware courts subject directors’ conduct to enhanced scrutiny in respect of defensive actions taken in response to a threat to corporate control and approval of a transaction resulting in a sale of control of the corporation.
38
Table of Contents
Limitation of Director and Officer Liability
Pursuant to our Memorandum and Articles of Association, every director or officer and the personal representatives of the same shall be indemnified and secured harmless out of our assets and funds against all actions, proceedings, costs, charges, expenses, losses, damages or liabilities incurred or sustained by him or her in or about the conduct of our business or affairs or in the execution or discharge of his or her duties, powers, authorities or discretions, including without prejudice to the generality of the foregoing, any costs, expenses, losses or liabilities incurred by him in defending (whether successfully or otherwise) any civil proceedings concerning us or our affairs in any court whether in the Cayman Islands or elsewhere. No such director or officer will be liable for: (a) the acts, receipts, neglects, defaults or omissions of any other such Director or officer or agent; or (b) any loss on account of defect of title to any of our property; or (c) account of the insufficiency of any security in or upon which any of our money shall be invested; or (d) any loss incurred through any bank, broker or other similar person; or (e) any loss occasioned by any negligence, default, breach of duty, breach of trust, error of judgment or oversight on his or her part; or (f) any loss, damage or misfortune whatsoever which may happen in or arise from the execution or discharge of the duties, powers authorities, or discretions of his or her office or in relation thereto, unless the same shall happen through his or her own dishonesty, gross negligence or willful default.
Involvement in Certain Legal Proceedings
To the best of our knowledge, none of our directors or executive officers has been convicted in a criminal proceeding, excluding traffic violations or similar misdemeanors, or has been a party to any judicial or administrative proceeding during the past ten years that resulted in a judgment, decree or final order enjoining the person from future violations of, or prohibiting activities subject to, federal or state securities laws, or a finding of any violation of federal or state securities laws, except for matters that were dismissed without sanction or settlement. Except as set forth in our discussion below in “Related Party Transactions,” none of our directors, director nominees or executive officers has been involved in any transactions with us or any of our directors, executive officers, affiliates or associates which are required to be disclosed pursuant to the rules and regulations of the SEC.
Regulation S-K Item 405:
Based solely upon a review of Forms 3 and 4 and amendments thereto furnished to the Company under 17 CFR 240.16a-3(e) during its most recent fiscal year and Form 5 and amendments thereto furnished to the Company with respect to its most recent fiscal year, and any written representation referred to in paragraph (b)(1) of this section, the Company is not aware of any director, officer, beneficial owner of more than ten percent of any class of equity securities of the Company registered pursuant to Section 12 that failed to file on a timely basis, as disclosed in the above Forms, reports required by Section 16(a) during the most recent fiscal year or prior years.
Regulation S-K Item 406:
The Company has adopted a Code of Ethics and has filed a copy of the Code of Ethics with the Commission.
Regulation S-K Item 407(c)(3):
None.
Regulation S-K Item 407(d)(4) and (5):
The Board of Directors maintains a majority of independent directors who are deemed to be independent under the definition of independence provided by NASDAQ Stock Market Rule 4200(a)(15). The Company has an audit committee, consisting solely of independent directors of the Company, Mr. Robert W. Kraft, Dr. Peiyao Zhang, and Dr. Xiaoping Zhou. Mr. Kraft qualifies as the audit committee financial expert. The Company’s audit committee charter has been filed as Exhibit 99.2 to this report and will be promptly made available on the Company’s website (www.tri-tech.cn).
39
Table of Contents
| Item 11. | Executive Compensation. |
The following table shows the annual compensation paid by us for the years ended December 31, 2008 and 2009 to Warren Zhao, our principal executive officer, Peter Dong, our Chief Financial Officer, and Phil Fan, our President. No other officer had a salary during either of the previous two years of more than $100,000.
Summary Compensation Table
| Name and principal position |
Year | Salary | Bonus | Option Awards(1) |
All Other Compensation |
Total | ||||||||||||
| Warren Zhao, |
2009 | $ | 19,355 | $ | 29,800 | $ | 556,505 | (1) | $ | — | $ | 605,660 | ||||||
| Principal Executive Officer |
2008 | $ | 12,958 | $ | 25,917 | $ | — | $ | — | $ | 38,875 | |||||||
| Peter Dong, |
2009 | $ | 14,076 | $ | 31,615 | $ | 278,252 | (2) | $ | — | $ | 323,943 | ||||||
| Chief Financial Officer |
2008 | $ | 14,076 | $ | 0 | $ | — | $ | — | $ | 14,076 | |||||||
| Phil Fan, |
2009 | $ | 48,000 | $ | 0 | $ | 185,502 | (3) | $ | — | $ | 233,502 | ||||||
| President |
2008 | $ | 48,000 | $ | 0 | $ | — | $ | — | $ | 48,000 | |||||||
| (1) | On September 9, 2009, 157,650 stock options were awarded to Warren Zhao, which options have not yet begun to vest and no dollar amounts have as yet been recognized in connection with such option grant. One fifth of these options will begin to vest on the first anniversary of the grant date. |
| (2) | On September 9, 2009, 78,825 stock options were awarded to Peter Dong, which options have not yet begun to vest and no dollar amounts have as yet been recognized in connection with such option grant. One fifth of these options will begin to vest on the first anniversary of the grant date. |
| (3) | On September 9, 2009, 52,550 stock options were awarded to Phil Fan, which options have not yet begun to vest and no dollar amounts have as yet been recognized in connection with such option grant. One fifth of these options will begin to vest on the first anniversary of the grant date. |
| (4) | Did not qualify as named executive officers in 2008, and would not qualify as named executive officers in 2009, but for option awards which have a grant date value in excess of $100,000. |
The following chart shows the current salary of our principal executive officer, Mr. Zhao, our principal financial officer, Mr. Dong, and our President, Mr. Fan. Mr. Zhao’s employment agreement commenced on February 10, 2006 and is scheduled to expire on February 9, 2011, subject to extension with mutual agreement of Mr. Zhao and our company. Mr. Dong’s employment agreement commenced on February 10, 2006 and is scheduled to expire on February 9, 2011, subject to extension with mutual agreement of Mr. Dong and our company. Mr. Fan’s employment agreement commenced on February 10, 2006 and is scheduled to expire on_ February 9, 2011, subject to extension with mutual agreement of Mr. Fan and our company. No other officer has a salary of more than $100,000.
| Officer |
Title |
Annual Compensation | |||
| Warren Zhao |
Chairman & Chief Executive Officer (Principal Executive Officer) | $ | 50,000 | ||
| Peter Dong |
Chief Financial Officer (Principal Financial Officer) | $ | 45,700 | ||
| Phil Fan |
President | $ | 48,000 | ||
40
Table of Contents
The following table shows outstanding equity awards to our principal executive officer, Mr. Zhao, our principal financial officer, Mr. Dong, and our President Phil Fan as of the end of Fiscal Year 2009.
Outstanding Equity Awards at Fiscal Year End
| Name |
Number of Securities Underlying Unexercised options (#) |
Option Exercise Price ($) |
Option Expiration Date ($) |
Equity Incentive Plan Awards: Number of Unearned Shares, Units or Other Rights that have not Vested (#) |
Equity Incentive Plan Awards: Market or Payout Value of Unearned Shares, Units or other Rights that have not Vested ($) |
||||||||||
| Warren Zhao, |
157,650 | (1) | $ | 6.75 | September 9, 2019 | 157,650 | (1) | $ | 3,216,060 | (2) | |||||
| Peter Dong, |
78,825 | (1) | $ | 6.75 | September 9, 2019 | 78,825 | (1) | $ | 1,608,030 | (3) | |||||
| Phil Fan, |
52,550 | (1) | $ | 6.75 | September 9, 2019 | 52,550 | (1) | $ | 1,072,020 | (4) | |||||
| (1) | The options granted to Mr. Zhao, Mr. Dong and Mr. Fan under an equity incentive plan, do not begin to vest until September 9, 2010, when they begin to vest at a rate of 20 percent (20%) per year. |
| (2) | $3,216,060 = 157,650 x $20.40 (closing price on December 31, 2009). |
| (3) | $1,608,030 = 78,825 x $20.40 (closing price on December 31, 2009). |
| (4) | $1,072,020 = 52,550 x $20.40 (closing price on December 31, 2009). |
Director Compensation
All directors hold office until the next annual meeting of shareholders at which their respective class of directors is re-elected and until their successors have been duly elected and qualified. There are no family relationships among our directors or executive officers. Officers are elected by and serve at the discretion of the Board of Directors. Employee directors do not receive any compensation for their services. Non-employee directors are entitled to receive $10,000/RMB 48,000 per year for serving as directors and may receive option grants from our company. In addition, non-employee directors are entitled to receive compensation for their actual travel expenses for each Board of Directors meeting attended, up to a maximum of $6,000 per meeting or $12,000 per year.
Summary Director Compensation Table FY 2009
| Name |
Director Fees earned or paid in cash |
Option Awards(1) |
Total(2) | ||||||
| Warren Zhao(3) |
$ | 0 | $ | 556,504 | $ | 556,504 | |||
| Robert Kraft(4) |
$ | 0 | $ | 21,280 | $ | 21,280 | |||
| Peiyao Zhang(5) |
$ | 0 | $ | 10,590 | $ | 10,590 | |||
| Xiaoping Zhou(4) |
$ | 0 | $ | 10,590 | $ | 10,590 | |||
| David Hu |
$ | 0 | $ | 421,394 | $ | 421,394 | |||
| (1) | On September 9, 2009, stock options were awarded to directors as follows: 157,650 stock options to Warren Zhao, 119,375 options were awarded to David Hu, 3,000 options were awarded to Xiaoping Zhou, 3,000 options were awarded to Peiyao Zhang, and 6,000 options were awarded to Robert Kraft. Such options have a grant date fair value of $3.53 per option. |
| (2) | None of the directors received any ordinary share awards, nonqualified deferred compensation earnings or non-equity incentive plan compensation in fiscal year 2009. |
41
Table of Contents
| (3) | Mr. Zhao received payment in his capacity as an officer of our company and/or subsidiaries/affiliates but did not receive any compensation for serving as a director of our company. |
| (4) | Messers. Kraft and Zhou did not become directors until 2009 and did not receive any payment in 2009. |
| (5) | Mr. Zhang did not become a director until 2009 and did not receive any payment for director fees in 2009. Mr. Zhang previously received compensation as a consultant to our board which is not reflected in the above amounts. Such consulting compensation amounted to $1,728 in 2008. |
| Item 12. | Security Ownership of Certain Beneficial Owners and Management and Related Stockholder Matters. |
| Plan category |
Number of securities to be issued upon exercise of outstanding options, warrants and rights (a) |
Weighted-average exercise price of outstanding options, warrants and rights (b) |
Number of securities remaining available for future issuance under equity compensation plans (excluding securities reflected in column (a)) (c) | ||||
| Equity compensation plans approved by security holders |
525,500 | $ | 6.75 | 0 | |||
Principal Shareholders
The following table sets forth information with respect to beneficial ownership of our ordinary shares as of March 24, 2010 by:
| • | Each person who is known by us to beneficially own more than 5% of our outstanding ordinary shares; |
| • | Each of our directors and named executive officers; and |
| • | All directors and named executive officers as a group. |
The number and percentage of ordinary shares beneficially owned are based on 5,255,000 ordinary shares outstanding as of March 24, 2010. Information with respect to beneficial ownership has been furnished by each director, officer or beneficial owner of more than 5% of our ordinary shares. Beneficial ownership is determined in accordance with the rules of the SEC and generally requires that such person have voting or investment power with respect to securities. In computing the number of ordinary shares beneficially owned by a person listed below and the percentage ownership of such person, ordinary shares underlying options, warrants or convertible securities held by each such person that are exercisable or convertible within 60 days of March 24, 2010 are deemed outstanding, but are not deemed outstanding for computing the percentage ownership of any other person. Except as otherwise indicated in the footnotes to this table, or as required by applicable community property laws, all persons listed have sole voting and investment power for all ordinary shares shown as beneficially owned by them. Unless otherwise indicated in the footnotes, the address for each principal shareholder is in the care of Tri-Tech Holding Inc., 5D, Tower A, 2 Building Business Center Jinyuan Shidai, No. 2 East Road Landianchang, Haidian District, Beijing, PRC 100097. As of the date of this annual report, we had 10 shareholders of record.
| Named Executive Officers and Directors |
Amount of Beneficial Ownership(1) |
Percentage Ownership(2) |
|||
| Warren Zhao, Principal Executive Officer and Director(3) |
1,155,375 | 22.0 | % | ||
| Peter Dong, Principal Financial and Accounting Officer(4) |
1,548,558 | 29.5 | % | ||
| David Hu, Director(5) |
1,299,708 | 24.7 | % | ||
| Peiyao Zhang, Director |
0 | * | % | ||
| Xiaoping Zhou, Director |
0 | * | % | ||
| Robert W. Kraft, Director |
0 | * | % | ||
| All Directors and Executive Officers as a Group (8 people)(6) |
2,952,783 | 56.2 | % | ||
| Tranhold Investment Inc. |
1,155,375 | 22 | % | ||
| Yanyu Investment Inc. |
1,299,708 | 24.7 | % |
| * | Less than 1%. |
42
Table of Contents
| (1) | Beneficial ownership is determined in accordance with the rules of the SEC and includes voting or investment power with respect to the ordinary shares. |
| (2) | The number of our ordinary shares outstanding used in calculating the percentage for each listed person excludes the ordinary shares underlying options held by such person. |
| (3) | Mr. Zhao has the sole power to direct the voting of the 1,155,375 shares held by Tranhold Investment Inc. |
| (4) | Mr. Dong has (i) the sole power to direct the voting of the 248,850 shares held by FLYY Investment Inc. and (ii) shared power to direct the voting of the 1,299,708 ordinary shares held by Yanyu Investment Inc. |
| (5) | Mr. Hu has the shared power to direct the voting of the 1,299,708 shares held by Yanyu Investment Inc. Mr. Hu shares this voting power with 17 other individual owners of the equity of Yanyu’s shareholders, WTECH Holding Inc. and STECH Holding Inc. |
| (6) | One or more of our directors and executive officers have (i) the sole power to direct the voting of the (a) 248,850 shares held by FLYY Investment Inc., (b) the 1,155,375 shares held by Tranhold Investment Inc. and (c) the 248,850 shares held by Allied Investment Consultation Inc. and (ii) shared power to direct the voting of the 1,299,708 shares held by Yanyu Investment Inc. |
| Item 13. | Certain Relationships and Related Transactions, and Director Independence. |
Prior Related Party Transactions
On July 20, 2007, the original shareholders of Yanyu completed a sales and purchase agreement with Beijing Satellite Technology Co., Ltd. (“Satellite”) which owned 58.88% of Yanyu. As a result of the transaction, the Yanyu original shareholders acquired 100% of the equity interests of Yanyu owned by Satellite for RMB 8.751 million (approximately $1.2 million). As a result, Satellite is no longer a shareholder of Yanyu and ceased to be a related party of our company as of July 20, 2007.
On December 31, 2007, TTII and TTB completed a sales and purchase agreement with the Yanyu original shareholders. Pursuant to this agreement, TTII issued 50,000 ordinary shares to the Yanyu original shareholders and acquired 92.86% of the shares of Yanyu. The purchase of Yanyu was based on the fair market value of Yanyu as of December 31, 2007. The assets and liabilities transferred have been accounted for at fair value. After the acquisition, the only shareholders of Yanyu are TTB and the SOE Shareholder.
To finance the growth of the business, Tranhold borrowed RMB 750,000 (equivalent to $102,675) from a shareholder at the time of Tranhold on April 28, 2006, without interest and without specific terms. Tranhold repaid RMB 650,000 (equivalent to $88,044) to the shareholder in 2008. Outstanding payable balances for this loan were at $14,631 as of December 31, 2008. Tranhold repaid RMB 100,000 (equivalent to $14,631) to the shareholder in March, 2009.
TTB has entered into control agreements with all of the owners of Tranhold and 92.86% of the owners of Yanyu, which agreements allow TTB to control Tranhold and Yanyu.
Founders’ Shares Subject to Redemption
Our company was valued on a forward-looking basis for purposes of our initial public offering. Valuing a company on a forward-looking basis is subject to a number of risks, including the possibility that the company will not achieve the projected income levels and that world markets may not maintain the same valuation for companies in general in the future. In order to mitigate some of this risk, each of the founders of our company placed, on a pro rated basis, an aggregate of 340,000 ordinary shares into escrow. Such escrowed shares are referred to as the “Founders’ Shares”. The Founders’ Shares will remain in escrow with SunTrust Bank pending the filing of this Form 10-K for the year ending December 31, 2009. Our audited after-tax earnings per share for the year ending December 31, 2009 exceeded $0.7205 per share. Because our earnings per share exceeded this number, we will release the Founder’s Shares from escrow upon the filing of this Form 10-K.
43
Table of Contents
Future Related Party Transactions
In the future, the audit committee of our Board of Directors must approve all related party transactions. All material related party transactions will be made or entered into on terms that are no less favorable to use than can be obtained from unaffiliated third parties. Related party transactions that we have previously entered into were not approved by independent directors, as we had no independent directors at that time.
Promoters and Certain Control Persons
We did not have any promoters at any time during the past five fiscal years. Except as set forth in our discussion above, none of our directors or officers has been involved in any transactions with us or any of our directors, executive officers, affiliates or associates which are required to be disclosed pursuant to the rules and regulations of the SEC.
| Item 14. | Principal Accountant Fees and Services. |
Mao & Company, CPAs, Inc. was appointed by the Company to serve as its independent registered public accounting firm for fiscal 2009. Audit services provided by Mao & Company, CPAs, Inc. for fiscal 2009 included the examination of the consolidated financial statements of the Company; and services related to periodic filings made with the SEC.
Fees Paid To Independent Registered Public Accounting Firm
Audit Fees
During fiscal 2009 and 2008, Mao & Company, CPAs, Inc.’s fees for the annual audit of our financial statements and the quarterly reviews of the financial statements were $87,848 and $65,904 respectively.
Audit Related Fees
During fiscal 2009 and 2008, the Company paid Mao & Company, CPAs, Inc. $120,786 and $0, respectively, for audit-related services. These services consisted of assurance and related services that were reasonably related to the performance of the audit and reviews of our financial statements and are not included in “Audit Fees” above. The services provided by our accountants within this category consisted of advice relating to SEC matters and the filing of our registration statement and amendments thereto.
Tax Fees
The Company has not paid Mao & Company, CPAs, Inc. for tax services in fiscal 2009 and 2008.
All Other Fees
The Company has not paid Mao & Company, CPAs, Inc. for any other services in fiscal 2009 and 2008.
Audit Committee Pre-Approval Policies
Before Mao & Company, CPAs, Inc. was engaged by the Company to render audit or non-audit services, the engagement was approved by the Company’s audit committee. All services rendered by Mao & Company, CPAs, Inc. have been so approved.
44
Table of Contents
| Item 15. | Exhibits, Financial Statement Schedules. |
The following documents are filed herewith:
| Exhibit Number |
Document | |
| 3(i).1 | Articles of Association of the Registrant (1) | |
| 3(i).2 | Amended and Restated Articles of Association of the Registrant (1) | |
| 3(ii).1 | Memorandum of Association of the Registrant (1) | |
| 3(ii).2 | Amended and Restated Memorandum of Association of the Registrant (1) | |
| 4.1 | Specimen Share Certificate (1) | |
| 10.1 | Translation of Form of Employment Agreement between Registrant and Executive Officer of the Registrant (1) | |
| 10.2 | Translation of Exclusive Technical and Consulting Service Agreement for Tranhold (1) | |
| 10.3 | Translation of Management Fee Payment Agreement for Tranhold (1) | |
| 10.4 | Translation of Proxy Agreement for Tranhold (1) | |
| 10.5 | Translation of Equity Interest Pledge Agreement for Tranhold (1) | |
| 10.6 | Translation of Exclusive Equity Interest Purchase Agreement for Tranhold (1) | |
| 10.7 | Translation of Exclusive Technical and Consulting Service Agreement for Yanyu (1) | |
| 10.8 | Translation of Management Fee Payment Agreement for Yanyu (1) | |
| 10.9 | Translation of Proxy Agreement for Yanyu (1) | |
| 10.10 | Translation of Equity Interest Pledge Agreement for Yanyu (1) | |
| 10.11 | Translation of Exclusive Equity Interest Purchase Agreement for Yanyu (1) | |
| 10.14 | Translation of Operating Agreement for Yanyu (1) | |
| 10.15 | Translation of Operating Agreement for Tranhold (1) | |
| 10.16 | Stock Option Plan (1) | |
| 21.1 | Subsidiaries of the Registrant (1) | |
| 31.1 | Certifications pursuant to Rule 13a-14(a) or 15(d)-14(a) under the Securities Exchange Act of 1934, as amended, as adopted pursuant to Section 302 of the Sarbanes-Oxley Act of 2002 (2) | |
| 31.2 | Certifications pursuant to Rule 13a-14(a) or 15(d)-14(a) under the Securities Exchange Act of 1934, as amended, as adopted pursuant to Section 302 of the Sarbanes-Oxley Act of 2002 (2) | |
| 32.1 | Certifications pursuant to 18 U.S.C. Section 1350, as adopted pursuant to Section 906 of the Sarbanes-Oxley Act of 2002 (2) | |
| 32.2 | Certifications pursuant to 18 U.S.C. Section 1350, as adopted pursuant to Section 906 of the Sarbanes-Oxley Act of 2002 (2) | |
| 99.1 | Code of Business Conduct and Ethics (1) | |
| 99.2 | Audit Committee Charter (2) | |
| (1) | Incorporated by reference to the registrant’s registration statement on Form S-1, File no. 333-158393, filed on April 3, 2009, as amended. |
| (2) | Filed herewith. |
45
Table of Contents
SIGNATURES
Pursuant to the requirements of Section 13 or 15(d) of the Securities Exchange Act of 1934, the Registrant has duly caused this report to be signed on its behalf by the undersigned; thereunto duly authorized, in Beijing, China, on March 24, 2010.
| TRI-TECH HOLDING INC. | ||||
| March 24, 2010 |
By: | /S/ WARREN ZHAO | ||
| Warren Zhao | ||||
| Chief Executive Officer | ||||
| (Principal Executive Officer) | ||||
Pursuant to the requirements of the Securities Exchange Act of 1934, this report has been signed below by the following persons on behalf of Registrant and in the capacities indicated on March 24, 2010.
| Signature |
Title | |
| /S/ WARREN ZHAO Warren Zhao |
Chief Executive Officer and Director (Principal Executive Officer) | |
| /S/ PETER DONG Peter Dong |
Chief Financial Officer (Principal Accounting and Financial Officer) | |
| /S/ PHIL FAN Phil Fan |
President (Authorized Representative in the United States) | |
| /S/ DAVID HU David Hu |
Director | |
| /S/ PEIYAO ZHANG Peiyao Zhang |
Director | |
| /S/ XIAOPING ZHOU Xiaoping Zhou |
Director | |
| /S/ ROBERT W. KRAFT Robert W. Kraft |
Director | |
46
Table of Contents
TRI-TECH HOLDING INC.
Financial Statements
For the years ended December 31, 2009 and 2008
(Prepared under accounting standards generally accepted in the United States of America)
Table of Contents
TRI-TECH HOLDING INC.
TABLE OF CONTENTS
| Page | ||
| F-i | ||
| F-1 | ||
| CONSOLIDATED STATEMENTS OF INCOME AND OTHER COMPREHENSIVE INCOME |
F-2 | |
| F-4 | ||
| F-5 | ||
| F-6 | ||
Table of Contents
REPORT OF INDEPENDENT REGISTERED PUBLIC ACCOUNTING FIRM
To the Board of Directors and Stockholders of
Tri-Tech Holding Inc.:
We have audited the accompanying consolidated balance sheets of Tri-Tech Holding Inc. and its subsidiaries (the “Company”) as of December 31, 2009 and 2008, and the related consolidated statements of income and comprehensive income, shareholders’ equity, and cash flows for each of the years in the two-year period ended December 31, 2009. The Company’s management is responsible for these financial statements. Our responsibility is to express an opinion on these financial statements based on our audits.
We conducted our audits in accordance with the standards of the Public Company Accounting Oversight Board (United States). Those standards require that we plan and perform the audit to obtain reasonable assurance about whether the financial statements are free of material misstatement. The Company is not required to have, nor were we engaged to perform, an audit of its internal control over financial reporting. Our audit included consideration of internal control over financial reporting as a basis for designing audit procedures that are appropriate in the circumstances, but not for the purpose of expressing an opinion on the effectiveness of the Company’s internal control over financial reporting. Accordingly, we express no such opinion. An audit also includes examining, on a test basis, evidence supporting the amounts and disclosures in the financial statements, assessing the accounting principles used and significant estimates made by management, as well as evaluating the overall financial statement presentation. We believe that our audits provide a reasonable basis for our opinion.
In our opinion, the consolidated financial statements referred to above present fairly, in all material respects, the financial position of the Company as of December 31, 2009 and 2008, and the results of its operations and its cash flows for each of the years in the two-year period ended December 31, 2009 in conformity with accounting principles generally accepted in the United States of America.
The consolidated balance sheet as of December 31, 2008 and consolidated statements of income and comprehensive income, shareholders’ equity and cash flows for the year ended December 31, 2008 were restated to reflect a correction of 2008 income tax rate as determined by tax regulators in May 2009.
/s/ Mao & Company, CPAs, Inc.
Los Angeles, California
March 22, 2010
F-i
Table of Contents
CONSOLIDATED BALANCE SHEETS
| December 31, 2009 |
December 31, 2008 Restated | |||||
| ASSETS | ||||||
| Current Assets |
||||||
| Cash |
$ | 7,171,464 | $ | 732,418 | ||
| Restricted cash |
1,501,128 | — | ||||
| Accounts receivable, net of allowance for doubtful accounts of $56,491 and $62,286 as of December 31, 2009 and December 31, 2008, respectively |
4,338,239 | 3,105,859 | ||||
| Unbilled revenue |
3,952,763 | 1,429,846 | ||||
| Notes receivable |
— | 7,316 | ||||
| Other receivables |
273,602 | 166,395 | ||||
| Inventories |
1,573,324 | 1,466,468 | ||||
| Deposits on projects |
585,153 | 266,973 | ||||
| Prepayments to suppliers and subcontractors |
1,898,900 | 567,346 | ||||
| Total current assets |
21,294,573 | 7,742,621 | ||||
| Long-term unbilled revenue |
1,723,852 | — | ||||
| Plant and equipment, net |
374,009 | 174,128 | ||||
| Proprietary technology, net |
797,854 | 857,475 | ||||
| Total assets |
$ | 24,190,288 | $ | 8,774,224 | ||
| LIABILITIES AND SHAREHOLDERS’ EQUITY | ||||||
| Current liabilities |
||||||
| Accounts payable and cost accrual on projects |
$ | 3,367,056 | $ | 1,589,103 | ||
| Commercial paper and other short-term notes payable: |
||||||
| Non-related parties |
— | 271,041 | ||||
| Related party |
— | 14,631 | ||||
| Customer deposits |
494,047 | 436,372 | ||||
| Billings in excess of revenue |
8,650 | 30,639 | ||||
| Other payables |
8,633 | 81,721 | ||||
| Accrued liabilities |
103,190 | 84,660 | ||||
| Deferred income taxes |
141,478 | 83,643 | ||||
| Income taxes payable |
144,232 | 141,818 | ||||
| Other taxes payable |
— | 90,908 | ||||
| Total current liabilities |
4,267,286 | 2,824,536 | ||||
| Long-term liabilities |
58,171 | — | ||||
| Total liabilities |
4,325,457 | 2,824,536 | ||||
| Shareholders’ equity |
||||||
| Tri-Tech Holding Inc. shareholders’ equity Common stock (30,000,000 shares authorized and $0.001 par value, 5,255,000 and 3,555,000 issued as of December 31, 2009 and 2008, respectively; on December 31, 2009, 340,000 shares issued were held in escrow. See note 12 for more discussion.) |
5,255 | 3,555 | ||||
| Additional paid-in-capital |
12,942,650 | 2,914,058 | ||||
| Statutory reserves |
50,655 | 50,655 | ||||
| Retained earnings |
6,333,343 | 2,482,573 | ||||
| Accumulated other comprehensive income |
377,097 | 361,328 | ||||
| Total Tri-Tech Holding Inc. shareholders’ equity |
19,709,000 | 5,812,169 | ||||
| Noncontrolling Interests |
155,831 | 137,519 | ||||
| Total shareholders’ equity |
19,864,831 | 5,949,688 | ||||
| Total liabilities and shareholders’ equity |
$ | 24,190,288 | $ | 8,774,224 | ||
F-1
Table of Contents
CONSOLIDATED STATEMENTS OF INCOME AND OTHER COMPREHENSIVE INCOME
| For The Years Ended December 31, |
||||||||
| 2009 | 2008 (Restated) |
|||||||
| Revenues: |
||||||||
| System integration |
$ | 12,023,686 | $ | 6,119,266 | ||||
| Hardware products |
2,511,962 | 1,115,811 | ||||||
| Software products |
2,264,247 | 1,214,881 | ||||||
| Total revenues |
16,799,895 | 8,449,958 | ||||||
| Cost of revenues: (exclusive of depreciation and amortization shown separately below) |
||||||||
| System integration |
8,003,667 | 4,219,892 | ||||||
| Hardware products |
2,115,052 | 1,036,401 | ||||||
| Software products |
57,206 | 65,947 | ||||||
| Total cost of revenues (exclusive of depreciation and amortization shown separately below) |
10,175,925 | 5,322,240 | ||||||
| Operating expenses: |
||||||||
| Depreciation and amortization expenses |
119,173 | 88,731 | ||||||
| Other operating expenses |
2,448,721 | 1,242,414 | ||||||
| Total operating expenses |
2,567,894 | 1,331,145 | ||||||
| Income from operations |
4,056,076 | 1,796,572 | ||||||
| Other income (expenses): |
||||||||
| Other expense |
(7,591 | ) | (1,774 | ) | ||||
| Interest income |
26,855 | 17,475 | ||||||
| Interest expense |
(5,683 | ) | (7,833 | ) | ||||
| Tax rebates |
107,380 | 102,644 | ||||||
| Total other income (expenses), net |
120,961 | 110,512 | ||||||
| Income before provision for income taxes and noncontrolling interests income |
4,177,037 | 1,907,085 | ||||||
| Provision for income taxes |
(308,085 | ) | (202,247 | ) | ||||
| Net income |
3,868,952 | 1,704,838 | ||||||
| Noncontrolling Interests Income |
18,182 | 8,685 | ||||||
| Net income attributable to Tri-Tech Holding Inc. |
3,850,770 | 1,696,153 | ||||||
| Other comprehensive income |
||||||||
| Foreign currency translation adjustment |
15,899 | 259,708 | ||||||
| Comprehensive income |
3,884,851 | 1,964,546 | ||||||
| Comprehensive income attributable to noncontrolling interests |
18,312 | 17,211 | ||||||
| Comprehensive income attributable to Tri-Tech Holding Inc. |
$ | 3,866,539 | $ | 1,947,335 | ||||
| Net income attributable to Tri-Tech Holding Inc. per share: |
||||||||
| Basic |
0.94 | 0.48 | ||||||
| Diluted |
$ | 0.92 | $ | 0.48 | ||||
| Shares used in computation: |
||||||||
| Basic |
4,081,301 | 3,555,000 | ||||||
| Diluted |
4,170,879 | 3,555,000 | ||||||
F-2
Table of Contents
TRI-TECH HOLDING INC.
CONSOLIDATED STATEMENTS OF SHAREHOLDERS’ EQUITY
2009
| Tri-Tech Holding Inc. shareholders | |||||||||||||||||||||||
| Common Stock | Additional | Retained earnings | Accumulated other Comprehensive |
Noncontrolling | Total stockholders’ | ||||||||||||||||||
| Shares | Amount | paid-in-capital | Statutory reserves | Unrestricted | Income | interests | equity | ||||||||||||||||
| BALANCE, January 1, 2009 |
3,555,000 | $ | 3,555 | $ | 2,914,058 | $ | 50,655 | $ | 2,482,573 | $ | 361,328 | $ | 137,519 | $ | 5,949,688 | ||||||||
| Common stock |
1,700,000 | 1,700 | 9,497,003 | — | — | — | — | 9,498703 | |||||||||||||||
| Warrants to Anderson & Strudwick Inc. |
— | — | 402,900 | — | — | — | — | 402,900 | |||||||||||||||
| Warrants to Hawk Associates Inc. |
— | — | 13,831 | — | — | — | — | 13,831 | |||||||||||||||
| Options to employees |
— | 114,858 | — | — | — | — | 114,858 | ||||||||||||||||
| Net income |
— | — | — | — | 3,850,770 | — | 18,182 | 3,868,952 | |||||||||||||||
| Foreign currency translation adjustment |
— | — | — | — | — | 15,769 | 130 | 15899 | |||||||||||||||
| BALANCE, December 31, 2009 |
5,255,000 | $ | 5,255 | $ | 12,942,650 | $ | 50,655 | $ | 6,333,343 | $ | 377,097 | $ | 155,831 | $ | 19,864,831 | ||||||||
F-3
Table of Contents
CONSOLIDATED STATEMENTS OF SHAREHOLDERS’ EQUITY
2008 ( Restated )
| Tri-Tech Holding Inc. shareholders | |||||||||||||||||||||||
| Common stock | Additional | Retained earnings | Accumulated other comprehensive |
Noncontrolling | Total Stockholders’ | ||||||||||||||||||
| Shares | Amount | paid-in-capital | Statutory reserves | Unrestricted | income | interest | equity | ||||||||||||||||
| BALANCE, January 1, 2008 |
3,555,000 | 3,555 | 2,914,058 | 50,655 | 786,420 | 110,147 | 120,308 | 3,985,143 | |||||||||||||||
| Net income |
— | — | — | — | 1,696,153 | — | 8,685 | 1,704,838 | |||||||||||||||
| Foreign currency translation adjustment |
— | — | — | — | — | 251,181 | 8,526 | 259,707 | |||||||||||||||
| BALANCE, December 31, 2008 |
3,555,000 | $ | 3,555 | $ | 2,914,058 | $ | 50,655 | $ | 2,482,573 | $ | 361,328 | $ | 137,519 | $ | 5,949,688 | ||||||||
F-4
Table of Contents
CONSOLIDATED STATEMENTS OF CASH FLOWS
| For The Years Ended December 31, |
||||||||
| 2009 | 2008 (Restated) |
|||||||
| Cash flows from operating activities: |
||||||||
| Net income |
$ | 3,868,952 | $ | 1,704,838 | ||||
| Adjustments to reconcile net income to cash: |
||||||||
| Depreciation |
59,244 | 30,892 | ||||||
| Amortization |
60,588 | 57,839 | ||||||
| Allowance for doubtful accounts |
1,322 | 22,935 | ||||||
| Deferred income taxes |
66,061 | 74,429 | ||||||
| Changes in operating assets and liabilities: |
||||||||
| Restricted cash |
(1,500,534 | ) | — | |||||
| Accounts receivable |
(1,230,305 | ) | (1,528,876 | ) | ||||
| Unbilled revenue |
(4,243,749 | ) | (360,048 | ) | ||||
| Other receivables |
(424,813 | ) | (104,235 | ) | ||||
| Inventories |
(161,817 | ) | (330,918 | ) | ||||
| Prepayments and deferred expenses |
(1,315,244 | ) | (163,280 | ) | ||||
| Accounts payable |
1,761,867 | 145,002 | ||||||
| Customer deposits |
57,244 | (5,286 | ) | |||||
| Billings in excess of revenue |
(22,009 | ) | — | |||||
| Other payables |
218,941 | 112,280 | ||||||
| Accrued liabilities |
18,443 | — | ||||||
| Taxes payable |
(140,036 | ) | (48,606 | ) | ||||
| Net cash provided by operating activities |
(2,925,845 | ) | (393,034 | ) | ||||
| Cash flows from investing activities: |
||||||||
| Additions to equipment |
(197,087 | ) | (91,351 | ) | ||||
| Cash flows from financing activities: |
||||||||
| Common stock |
10,105,170 | — | ||||||
| (Repayments to) advances from third parties |
(278,507 | ) | 678,485 | |||||
| Repayment from a related party of an advance |
— | (4,750 | ) | |||||
| Net cash provided by (used in) financing activities |
9,826,663 | 673,735 | ||||||
| Effect of exchange rate changes on cash and cash equivalents |
(264,685 | ) | 175,355 | |||||
| Net increase in cash |
6,439,046 | 364,705 | ||||||
| Cash, beginning of year |
732,418 | 367,713 | ||||||
| Cash, end of period |
$ | 7,171,464 | $ | 732,418 | ||||
| Supplemental Data: |
||||||||
| Income taxes paid |
$ | 239,743 | $ | — | ||||
| Interest paid on debt |
$ | 4,538 | $ | 7,832 | ||||
| Borrow money from third party, using in purchase transportation equipment on April 2009. |
$ | 87,221 | — | |||||
F-5
Table of Contents
Notes To Consolidated Financial Statements
December 31, 2009 and 2008
1. Background
Tri-Tech Holding Inc. (“TRIT”) was incorporated in the Cayman Islands on January 7, 2009 as a limited liability company and is authorized to issue 30,000,000 ordinary shares, with a par value of $0.001. TRIT issued 50,000 ordinary shares (or 3,555,000 ordinary shares after 71.1-for-1 stock split which was completed on May 22, 2009) to shareholders of Tri-Tech International Investment, Inc. (“TTII”) for their respective interests in TTII. TTII was incorporated in the British Virgin Islands on November 24, 2005 as a limited liability company. TTII has subsidiaries and variable interest entities (“VIEs”) in the People’s Republic of China (the “PRC”) as discussed below. TRIT and its subsidiaries and variable interest entities together are referred to as the “Company”. Through its subsidiaries and VIEs in PRC, the Company provides self-manufactured, proprietary or third-party products, system integration and other services in the fields of environmental protection, and water resource monitoring, development, utilization and protection.
On September 9, 2009, the Company completed its initial public offering (“IPO”) of 1,700,000 ordinary shares at $6.75 per share.
Tri-Tech (Beijing) Co., Ltd. (“TTB”) was incorporated in the PRC on February 6, 2006. It is wholly-owned by TTII. It is a wholly foreign-owned high-tech enterprise, primarily engaged in water resource protection including the utilization and development of technology and product sales, and the development of new industries and applications.
Tranhold Environmental (Beijing) Tech Co., Ltd. (“Tranhold”) was established on June 6, 2003. It was a wholly-owned subsidiary of TTII until it was converted into a VIE controlled by TTII on November 28, 2008. (refer to the section “Reorganization and Acquisition”). Tranhold specializes in environmental technology research and development, environmental engineering design and building for major industrial sectors such as the petrochemical, pharmaceutical and municipal industries. It also provides water and wastewater treatment process control systems, process tail gas purification and other air pollution control systems and related integration solutions. Tranhold participated in the compilation of “The Technical Guidelines of Municipal Sewage Treatment Plant Operation, Management and Safety” for the Ministry of Construction of the People’s Republic of China.
Beijing Yanyu Water Tech Co., Ltd. (“Yanyu”) was established on March 29, 2002. It was a wholly-owned subsidiary of TTII until it was converted into a VIE controlled by TTII on November 28, 2008. (refer to the section “Reorganization and Acquisition”). Yanyu specializes in research and development, production, system integration, and consulting services in the fields of water resource protection and allocation, flood control and forecasting, irrigation systems, and municipal water supply and distribution systems. Yanyu participated in the compilation of “Technical Standards of Automatic Hydrologic Measuring and Report Systems (SL61-2003)” and “Technical Guidelines of Automatic Hydrologic Measuring and Reporting Systems – General Devices (GB/T)” for the Ministry of Water Resources of the PRC.
We recently formed Tri-Tech Infrastructure LLC. (“TIS”), our wholly-owned subsidiary in the U.S. to develop opportunities in the United States. As of December 31, 2009, we have not conducted any business through TIS.
F-6
Table of Contents
Tri-Tech Holding Inc.
Notes To Consolidated Financial Statements—(Continued)
December 31, 2009 and 2008
Reorganization and Acquisition
On October 24, 2007, TTII and its wholly owned subsidiary TTB entered a sales and purchase agreement with the existing shareholders of Tranhold (the “Tranhold Original Shareholders”). Pursuant to the agreement, TTII issued 50,000 shares (equivalent to 1,777,500 ordinary shares of TRIT after stock split as discussed in note 17) of its stock to the Tranhold Original Shareholders for 100% equity ownership of Tranhold. The total number of shares outstanding was 50,000 shares (equivalent to 1,777,500 ordinary shares of TRIT after stock split as discussed in note 11). As a result of this transaction, the Tranhold Original Shareholders were able to exercise control of TTII. The purchase of Tranhold and the issuance of TTII’s common stock were accounted for as a reverse acquisition and as a recapitalization under common control. The assets and liabilities transferred were accounted for at historical cost. The consolidated financial statements have been presented as if the reorganization occurred at the beginning of 2007.
On December 31, 2007, TTII and its wholly owned subsidiary TTB completed a sales and purchase agreement with certain existing shareholders of Yanyu (the “Yanyu Original Shareholders”). Pursuant to the agreement, TTII issued 50,000 shares (equivalent to 1,777,500 ordinary shares of TRIT after stock split as discussed in note 11) of its common stock to the Yanyu Original Shareholders for 92.86% equity ownership of Yanyu. Based on Statement of Financial Accounting Standards No. 141, “Business Combinations”, TTII is determined to be the acquirer. The allocation of the purchase price of Yanyu was based on the fair value of Yanyu as of December 31, 2007.
| December 31, 2007 |
||||
| Current Assets |
$ | 1,836,705 | ||
| Plant and equipment, net |
44,298 | |||
| Intangible assets |
587,058 | |||
| Liabilities assumed |
(902,018 | ) | ||
| Total purchase price |
$ | 1,566,043 | ||
The fair value of assets and liabilities of Yanyu approximated to the book value as of December 31, 2007.
As a result of these transactions, Tranhold and Yanyu became the subsidiaries of TTII.
The Company’s principal geographic market is mainly in the People’s Republic of China (“PRC”). As PRC laws and regulations prohibit or restrict other than PRC companies to engage in certain government-related businesses, the Company provides its services in the PRC through Tranhold and Yanyu, Chinese legal entities, which hold the qualifications and permits necessary to conduct government-related services in the PRC. In order to avoid any restrictions that Tranhold or Yanyu might encounter during future business development, the Company concluded that TTII and Tranhold or Yanyu should not have a parent-subsidiary relationship.
By November 28, 2008, the Company had completed two steps of reorganization. The Company first returned its shares to the original shareholders of Tranhold and Yanyu. These shareholders are major shareholders, directors, corporate level executives and key employees of the Company. Legally, Tranhold and Yanyu returned to their legal status prior to the acquisitions in 2007. Concurrently, on November 28, 2008,
F-7
Table of Contents
Tri-Tech Holding Inc.
Notes To Consolidated Financial Statements—(Continued)
December 31, 2009 and 2008
the Company signed and executed with Tranhold and Yanyu a series of contractual agreements with a 25-year, renewable term. These contractual agreements require the pledge of the original shareholders’ equity interests and stock certificates of the VIEs. At any time during the agreement period, the Company has absolute rights to acquire any portion of the equity interests of those VIEs under no-cost conditions. In addition, the Company has absolute rights to appoint directors and officers of those VIEs and to obtain the profits from those VIEs. These agreements consist of the following agreements (Operating Agreements subsequently entered):
Exclusive Technical and Consulting Service Agreement. Each of Yanyu and Tranhold has entered into an Exclusive Technical and Consulting Service Agreement with TTB, which agreement provides that TTB will be the exclusive provider of technical and consulting services to Yanyu and Tranhold, as appropriate, and that each of them will in turn pay 90% of its profits (other than net profits allocable to the SOE Shareholder of Yanyu) to TTB for such services. In addition to such payment, Yanyu and Tranhold agree to reimburse TTB for TTB’s expenses (other than TTB’s income taxes) incurred in connection with its provision of services under the agreement. Payments will be made on a quarterly basis, with any overpayment or underpayment to be reconciled once each of Tranhold’s and Yanyu’s annual net profits, as applicable, are determined at its fiscal year end. Any payment from TTB to TTII would need to comply with applicable Chinese laws affecting payments from Chinese companies to non-Chinese companies. Although based on this agreement TTB is only entitled to 90% of net profits (other than net profits allocable to the SOE Shareholder of Yanyu), TTB also entitled the remaining share of the net profits of the VIEs through dividends per the Proxy Agreement as discussed below. The Company relies on dividends paid by TTB for its cash needs, and TTB relies on payments from Yanyu and Tranhold to be able to pay such dividends to the Company.
Management Fee Payment Agreement. Each of the shareholders of Yanyu and Tranhold (other than Beijing YanYu Communications Telemetry United New Technology Development Department, a Chinese State Owned Entity (the “SOE Shareholder”) of Yanyu) has entered into a Management Fee Payment Agreement, which provides that, in the event TTB exercises its rights to purchase the equity interests of the Yanyu or Tranhold shareholders (other than those owned by the SOE Shareholder of Yanyu) under the Equity Interest Purchase Agreements, such shareholders shall pay a Management Fee to TTB in an amount equal to the amount of the Transfer Fee received by the such shareholders under the Equity Interest Purchase Agreement.
Proxy Agreement. Each of the shareholders of Yanyu and Tranhold (other than the SOE Shareholder of Yanyu) has executed a Proxy Agreement authorizing TTB to exercise any and all shareholder rights associated with his ownership in Yanyu or Tranhold, as appropriate, including the right to attend shareholders’ meetings, the right to execute shareholders’ resolutions, the right to sell, assign, transfer or pledge any or all of the equity interest in Yanyu or Tranhold, as appropriate, and the right to vote such equity interest for any and all matters.
Equity Interest Pledge Agreement. TTB and the shareholders of each of Tranhold and Yanyu (other than the SOE Shareholder of Yanyu) have entered in Equity Interest Pledge Agreements, pursuant to which each such shareholder pledges all of his shares of Tranhold or Yanyu, as appropriate, to TTB. If Tranhold or Yanyu or any of its respective shareholders (other than the SOE Shareholder of Yanyu) breaches its respective contractual obligations, TTB, as pledgee, will be entitled to certain rights, including the right to foreclose on
F-8
Table of Contents
Tri-Tech Holding Inc.
Notes To Consolidated Financial Statements—(Continued)
December 31, 2009 and 2008
the pledged equity interests. Such Tranhold and Yanyu shareholders have agreed not to dispose of the pledged equity interests or take any actions that would prejudice TTB’s interest. According to this agreement, TTB has absolute rights to obtain any and full dividends related to the equity interest pledged during the term of the pledge.
Exclusive Equity Interest Purchase Agreement. Each of the shareholders of Tranhold and Yanyu (other than the SOE Shareholder of Yanyu) has entered into an Exclusive Equity Interest Purchase Agreement, which provides that TTB will be entitled to acquire such shares from the current shareholders upon certain terms and conditions, if such a purchase is or becomes allowable under PRC laws and regulations. The Exclusive Equity Interest Purchase Agreement also prohibits the current shareholders of each of Tranhold and Yanyu (other than the SOE Shareholder of Yanyu) from transferring any portion of their equity interests to anyone other than TTB. TTB has not yet taken any corporate action to exercise this right of purchase, and there is no guarantee that it will do so or will be permitted to do so by applicable law at such time as it may wish to do so.
Operating Agreements. TTB, Tranhold, Yanyu and each of their respective shareholders (other than the SOE Shareholder of Yanyu) have entered into an Operating Agreement on July 3, 2009, which requires TTB to guarantee the obligations of each of Tranhold and Yanyu in their business arrangements with third parties. Each of Tranhold and Yanyu, in return, agrees to pledge its accounts receivable and all of its assets to TTB. Moreover, each of Tranhold and Yanyu agrees that without the prior consent of TTB, such company will not engage in any transactions that could materially affect its assets, liabilities, rights or operations, including, without limitation, incurrence or assumption of any indebtedness, sale or purchase of any assets or rights, incurrence of any encumbrance on any of its assets or intellectual property rights in favor of a third party or transfer of any agreements relating to its business operation to any third party. Pursuant to these operating agreements, TTB provides guidance and instructions on each of Tranhold’s and Yanyu’s daily operations and financial affairs. The contracting shareholders of each of Tranhold and Yanyu must designate the candidates recommended by TTB as their representatives on their respective boards of directors. TTB has the right to appoint and remove senior executives of each of Tranhold and Yanyu.
The Company provided advances to its VIEs in total of $5,899,410 for the year ended December 31, 2009. The Company’s accumulated outstanding advances to Tranhold and Yanyu, respectively, were $5,395,514 (which included the increasing in it’s registered capital of $5,855,566 invested by TTB) and $503,896 as of December 31, 2009.
Except as disclosed above, there are no arrangements that could require the Company to provide financial support to the VIEs, including events or circumstances that could expose the Company to a loss. As stated in the disclosure of various agreements between the Company and its VIEs in note 1 under Reorganization and Acquisition, the Company has rights to acquire any portion of the equity interests of those VIEs under no-cost conditions. Also the Company may allocate its available funds to its VIEs for business purposes. There are no fixed terms of such arrangement.
Based on these agreements and according to the provisions of Financial Accounting Standards Board Interpretation No. 46R, “Consolidation of Variable Interest Entities” (or “FIN 46R”ASC NO.810), Tranhold and Yanyu are considered two variable interest entities (“VIEs”), and the Company is the primary beneficiary. Accordingly, Tranhold and Yanyu have continued to be consolidated in the Company’s financial statements.
F-9
Table of Contents
Tri-Tech Holding Inc.
Notes To Consolidated Financial Statements—(Continued)
December 31, 2009 and 2008
It is the Company’s general belief that the creditors and the other beneficial interest holder of Tranhold and Yanyu have no recourse to the general credit of the Company.
No change occurred in financial statements before and after the Company entered into agreements with these VIEs.
The following are major categories of the Assets and Liabilities of the VIEs:
| Yanyu | Tranhold | |||||||
| December 31, 2009 |
December 31, 2009 |
|||||||
| Current assets |
$ | 3,010,585 | $ | 11,133,068 | ||||
| Plant and equipment, net |
27,660 | 343,011 | ||||||
| Intangible assets |
544,279 | 253,575 | ||||||
| Long-term unbilled revenue |
— | 1,128,548 | ||||||
| Long-term investment |
— | — | ||||||
| Liabilities assumed |
(1,604,509 | ) | (5,336,339 | ) | ||||
| Total shareholders’ equity |
$ | 1,9780,15 | $ | 7,521,863 | ||||
2. Summary of Significant Accounting Policies
Basis of Presentation
The accompanying consolidated financial statements have been prepared in accordance with generally accepted accounting principles in the United States of America (“US GAAP”). The accompanying consolidated financial statements include the accounts of TRIT and its subsidiaries and VIEs. All material inter-company transactions and balances have been eliminated in the consolidation. Please also refer to Note 1 for the discussion on accounting for the reorganization and acquisition.
The Company adopted the provisions of FIN 46R ASU NO.810. Pursuant to FIN 46R ASC NO.810, Tranhold and Yanyu are VIEs of the Company and the Company is the primary beneficiary of the VIEs. Accordingly, the VIEs have been consolidated in the Company’s financial statements.
Based on various VIE agreements, the Company is able to exercise control over the VIEs; and obtain the financial interests such as obtaining periodic income of the VIEs through technical and consulting service arrangements and obtaining the net assets of VIEs through purchase of their equities at essentially no cost basis. The Company therefore concluded that its equities of both VIEs are not noncontrolling interest and therefore are not classified as so. The noncontrolling interest only relates to the SOE Shareholder’s 7.14% interest in Yanyu. The amount of noncontrolling interest of the original shareholders of Tranhold and Yanyu holding shares of both VIEs for the Company is zero. They excise no controls over the VIEs and no financial interests of ownership are due to them either for periodic income or the net assets.
F-10
Table of Contents
Tri-Tech Holding Inc.
Notes To Consolidated Financial Statements—(Continued)
December 31, 2009 and 2008
The Company compiles its daily accounts in accordance with generally accepted accounting principles in the PRC (“PRC GAAP”) and converts its financial statements to make them comply with U.S. GAAP when reporting.
For presentation of the financial statements, we assume the issuance of 3,555,000 ordinary shares at the beginning of the period. On September 9, 2009, the Company completed its IPO of 1,700,000 ordinary shares at $6.75 per share. On December 31, 2009, the Company had issued and outstanding 177,500 unexercised warrants 525,500 unexercised options.
Use of Estimates
The preparation of financial statements in conformity with U.S. GAAP requires management to make estimates and assumptions that affect the amounts reported in the combined financial statements and accompanying notes. Management believes that the estimates used in preparing its financial statements are reasonable and prudent. Actual results could differ from these estimates.
Certain of the Company’s accounting policies require higher degrees of judgment than others in their application. These include the recognition of revenue and earnings from system integration under the percentage of completion method and the allowance for doubtful accounts. Management evaluates all of its estimates and judgments on an on-going basis.
Cash and cash equivalents
The Company considers all highly liquid investments with an original maturity of three months or less when purchased to be cash equivalents. Cash equivalents are composed primarily of time deposits and investments in money market accounts and are stated at cost which approximates fair value.
Restricted Cash
On December, 2009, the Company made a 3-months time deposit of RMB 10.25 million (or $1,501,128) in a bank as collateral in exchange for the issuance of Letter of Credit facility of RMB 10 million (or $1,464,515), with an expiration in three months. However, the Company didn’t use the facility for any issuance of Letter of Credit within that period. Correspondingly, the bank released the collateral and the restrictions on cash on March 3, 2010.
Allowances for doubtful accounts
The Company makes an allowance for doubtful accounts based on the aging of accounts receivable and on any specifically identified accounts receivable that may become uncollectible.
Inventories
The Company values inventory at the lower of cost or net realizable value and determines inventory by using the average cost method. Inventory consists of raw materials, finished goods, and work-in-progress, which includes the cost of direct labor, materials and overhead costs related to projects.
F-11
Table of Contents
Tri-Tech Holding Inc.
Notes To Consolidated Financial Statements—(Continued)
December 31, 2009 and 2008
Long-term unbilled revenue
The Company obtained several contracts with billing cycles of over three years in 2009. The discounted revenue is recorded as long-term unbilled revenue and the discount rate is the 3-year nominal interest rate of 5.4%, set by the PRC Central Bank. These projects are funded by the Government, so the Company does not ascribe any financial risks to such projects.
Plant and equipment
The Company states plant and equipment at cost less accumulated depreciation. The Company computes depreciation using the straight-line method over the estimated useful lives of the assets with 5% residual value. The depreciation expense for the years ended December 31, 2009 and 2008 amounted to $58,619 and $30,892, respectively.
Estimated useful lives of the Company’s assets are as follows:
| Asset |
Useful Life | |
| Buildings and improvements |
40 years | |
| Transportation equipment |
5-8 years | |
| Machinery |
10 years | |
| Office equipment |
5 years | |
| Furniture |
5 years |
The Company eliminates the cost and related accumulated depreciation of assets sold or otherwise retired from the accounts and includes any gain or loss in the statement of income. The Company charges maintenance, repairs and minor renewals directly to expenses as incurred, and it capitalizes major additions and betterment to buildings and equipment.
The financing cost $2,485 from installation for equipment purchase incurred has been expensed.
Valuation of Long-Lived Assets
The Company reviews the carrying value of its long-lived assets, including plant and equipment, and finite life intangibles whenever events or changes in circumstances indicate that the carrying value may not be recoverable. To the extent the estimated undiscounted future cash inflows attributable to the asset, less estimated undiscounted future cash outflows, are less than the carrying amount, the Company recognizes an impairment loss in an amount equal to the difference between the carrying value of such assets and fair value. The Company reports assets for which there is a committed disposition plan, whether through sale or abandonment, at the lower of carrying value or fair value less costs to sell.
The Company evaluates the periods of depreciation and amortization to determine whether subsequent events and circumstances warrant revised estimates of useful lives.
Intangible Assets
The Company amortizes other acquired intangible assets with definite lives on a straight-line basis over their expected useful economic lives. The Company does not amortize intangible assets with an indefinite
F-12
Table of Contents
Tri-Tech Holding Inc.
Notes To Consolidated Financial Statements—(Continued)
December 31, 2009 and 2008
useful life but subjects them to an impairment test annually or more frequently if events or changes in circumstances indicate that the assets might be impaired. The Company periodically evaluates the recoverability of all intangible assets and takes into account events or circumstances that warrant revised estimates of useful lives or that indicate that impairment exists.
| Useful Life | ||
| Proprietary technology relating to sewage, municipal solid waste treatment and tail gas purification |
20 years | |
| Proprietary technology relating to low energy consumption data transmission system |
20 years |
The amortization expense for the years ended December 31, 2009 and December 31, 2008 amounted to $60,554 and $57,839, respectively.
Balance Sheet Classifications
The Company uses a one-year time period as the basis for classifying all current assets and liabilities.
Revenue Recognition
Revenues consist primarily of product sales, software sales, and products and services solutions. The Company recognizes revenue when it is probable that the economic benefits will flow to the Company.
Specifically the Company generally provides products and services solutions under short and long-term fixed-price contracts. The contract periods range from two months to approximately three years in length. The Company recognizes income for these contracts following the percentage-of-completion method, measured by contract milestones in accordance with the AICPA’s Statement of Position (“SOP”) 81-1 (ASC No. 605), “Accounting for Performance of Construction-Type and Certain Production-Type Contracts”. Cost of revenue (exclusive of depreciation and amortization expenses) is based on total actual costs incurred plus estimated costs to completion applied to percentage of completion as measured by contract milestone. Cost of revenues (exclusive of depreciation and amortization expenses) includes direct labor, materials and the applicable share of overhead expense directly related to the execution of services and delivery of projects.
Provided unapproved change orders or claims occur in the future, in accounting for contracts, the Company follows Paragraphs 62 and 65 of the AICPA’s Statement of Position 81-1 - Accounting for Performance of Construction-Type and Certain Production-Type Contracts (“SOP 81-1”) (ASC No. 605). We will recognize as revenues costs associated with unapproved change orders (Paragraph 62 of SOP 81-1) or claims (Paragraph 65 of SOP 81-1) to the extent it is probable that such claims and change orders will result in additional contract revenue, and the amount of such additional revenue can be reliably estimated. Contract losses are provided for in their entirety in the period that they become known, without regard to the percentage-of-completion. However, we have not experienced significant unapproved change orders in the past.
The Company recognizes sales of its products upon delivery of goods and passage of title in accordance with Securities and Exchange Commission (“SEC”) Staff Accounting Bulletin (“SAB”) No. 101, “Revenue Recognition in Financial Statements”, as amended by SAB No. 104, “Revenue Recognition”.
F-13
Table of Contents
Tri-Tech Holding Inc.
Notes To Consolidated Financial Statements—(Continued)
December 31, 2009 and 2008
The Company recognizes revenue from the sales of software, support contracts and services in accordance with SOP No. 97-2, “Software Revenue Recognition” and SOP 81-1. For software sales with no significant post-shipment obligations and no uncertainty about customer acceptance, the Company recognizes revenue on delivery of software to the customer. The Company recognizes revenues for software sales with significant post-shipment obligations, including the production, modification, or customization of software, by the percentage-of-completion method, with progress to completion measured on the basis of milestone completion, labor costs incurred currently versus the total estimated labor cost of performing the contract over its term, or other factors appropriate to the individual contract of sale.
The Company presents all sales revenue net of a value-added tax (“VAT”) or a sales tax. The Company’s products that are sold in the PRC are generally subject to a Chinese VAT at a rate of 17% or sales tax of 5% of the gross sales price, except for certain proprietary software sales which will only be subject to an effective tax rate of 3%. The VAT may be offset by VAT paid by the Company on purchased raw materials and other materials included in the cost of projects or producing the finished product.
The Company records revenue in excess of billings as “unbilled revenue”. The Company records billings in excess of revenues as “billings in excess of revenue”. The Company expects all billed and unbilled amounts to be collected within one year.
The Company obtained several contracts with the billing cycle over three years in 2009. The discounted revenue is recorded and the discount rate is the 3-year nominal interest rate of 5.4%, set by the PRC Central Bank.
Cost of revenues (exclusive of depreciation and amortization)
Cost of revenues (exclusive of depreciation and amortization) includes material and equipment costs, transportation costs, labor costs, processing costs, packaging costs, quality inspection cost, quality control costs, sales tax. Cost of revenues (exclusive of depreciation and amortization) also includes inbound freight charges, purchasing and receiving costs and inspection costs where those types of costs occur.
Operating expenses
Operating expenses include, among other items, salaries, bonuses, and social insurance of management, administrative and sales personal, traveling costs, entertainment expenses, depreciation of equipment, amortization of intangible assets, office rental expenses, professional service fees, office supplies, R&D expenses and bad debt provision.
Research and Development
Research and development expenses include salaries, consultant fees, supplies and materials, as well as costs related to other overhead such as depreciation, facilities, utilities and other departmental expenses. The Company expenses costs for the development of new software products and substantial enhancements to existing software products as incurred until technological feasibility has been established, at which time any additional costs are capitalized. The management of the Company is responsible for assessing the establishment of technological feasibility in accordance with FAS 86(ASC NO.985), Accounting for the Costs of Computer Software to Be Sold, Leased, or Otherwise Marketed.
F-14
Table of Contents
Tri-Tech Holding Inc.
Notes To Consolidated Financial Statements—(Continued)
December 31, 2009 and 2008
Research and development costs recorded in general and administrative expenses were $178,864 and $66,296 during the years ended December 31, 2009 and 2008. No research and development expenses were capitalized in 2009 and 2008 respectively. We do not pass along research and development expenses directly or indirectly to our customers.
Foreign Currency Translation
The Company uses the United States dollar as its reporting and functional currency. The Company translates monetary assets and liabilities denominated in currencies other than United States dollars into United States dollars at the rates of exchange ruling at the balance sheet date. The Company converts transactions in currencies other than United States dollars during the year into United States dollars at the rates of exchange ruling at the transaction dates.
The Company maintains its financial records of its PRC subsidiaries in Renminbi (“RMB”), their functional currency and the currency of the PRC. The Company translates its balance sheets assets and liabilities into United States dollars at the rates of exchange existing on the balance sheet date and translates its PRC subsidiaries’ and affiliates’ statements of operations using a weighted average exchange rate for the same period. The Company reflects translation adjustments as “accumulated other comprehensive income (loss)” in stockholders’ equity
Transaction gains and losses that arise from exchange rate fluctuations on transactions denominated in a currency other than the functional currency are included in the results of operations as incurred.
Translation adjustments amounted to $377,096 and $361,328 as of December 31, 2009 and December 31, 2008, respectively. The Company translated balance sheet amounts with the exception of equity at December 31, 2009 at RMB 6.8282 to US$1.00 as compared to RMB6.8346 to US$1.00 at December 31, 2008. The Company stated equity accounts at their historical rate. The average translation rates applied to income statement accounts for the year ended December 31, 2009 and December 31, 2008 were RMB 6.8309 and RMB 6.9451, respectively.
Income Taxes
The Company provides for deferred income taxes using the asset and liability method. Under this method, the Company recognizes deferred income taxes for tax credits and net operating losses available for carry-forwards and significant temporary differences. The Company classifies deferred tax assets and liabilities as current or non-current based upon the classification of the related asset or liability in the financial statements or the expected timing of their reversal if they do not relate to a specific asset or liability. The Company provides a valuation allowance to reduce the amount of deferred tax assets if it is considered more likely than not that some portion or all of the deferred tax assets will not be realized.
The Company adopted Financial Accounting Standards Board (“FASB”) Interpretation 48, “Accounting for Uncertainty in Income Taxes” (“FIN 48” (ASC NO.740)), as of January 1, 2007. The Company recognizes a tax position as a benefit only if it is “more likely than not” that the tax position would be sustained in a tax examination, with a tax examination being presumed to occur. The amount recognized is the largest amount of tax benefit that the Company believes is more than 50% likely to be realized on examination. For tax
F-15
Table of Contents
Tri-Tech Holding Inc.
Notes To Consolidated Financial Statements—(Continued)
December 31, 2009 and 2008
positions not meeting the “more likely than not” test, the Company does not record a tax benefit. FIN 48 also provides guidance on de-recognition, classification, interest and penalties, accounting in interim periods, disclosures, and transition. The adoption had no effect on the Company’s financial statements. The Company did not have any significant unrecognized uncertain tax positions.
The Company’s operations are subject to income and transaction taxes mainly in the PRC. Significant estimates and judgments are required in determining the Company’s provision for income taxes. Some of these estimates are based on interpretations of existing tax laws or regulations. The ultimate amount of tax liability may be uncertain as a result. The Company does not anticipate any events which could change these uncertainties.
Stock-based Compensation
The Company adopted the fair value recognition provisions of Statement of Financial Accounting Standards (“SFAS”) No. 123 (revised 2004), “Share-Based Payment” (“SFAS 123(R)” (ASC NOs.505,718)).
Earnings per Share
Basic EPS excludes dilution and is computed by dividing net income (loss) attributable to common stockholders by the weighted average number of common shares outstanding for the period. Diluted EPS reflects the potential dilution that could occur if securities or other contracts to issue common stock (convertible preferred stock, forward contract, warrants to purchase common stock, contingently issuable shares, common stock options and warrants and their equivalents using the treasury stock method) were exercised or converted into common stock. The Company excludes potential common shares in the diluted EPS computation in periods of losses from continuing operations, as their effect would be anti-dilutive.
We have granted 525,500 options to our key employees and 177,500 warrants to the placement agent in our IPO and to our investor relations consultant, all of which are included when calculating the earnings per share diluted.
Comprehensive Income (Loss)
Comprehensive income (loss) includes all changes in equity except those resulting from investments by owners and distributions to owners. The Company has chosen to report comprehensive income (loss) in the statements of operations and comprehensive income.
Financial Instruments
The Company carries the carrying value of financial instruments, which consists of cash and cash equivalents, short-term investments, accounts receivable, trade notes receivable, accounts payable, trade notes payable, and other payables at cost, which approximates fair value due to the short-term nature of these instruments. The Company does not use derivative instruments to manage risks.
F-16
Table of Contents
Tri-Tech Holding Inc.
Notes To Consolidated Financial Statements—(Continued)
December 31, 2009 and 2008
Segments
The Company identifies segments by reference to its internal organization structure and the factors that management uses to make operating decisions and assess performance.
Reclassifications
The Company has reclassified certain prior period amounts to conform to the current period presentation. These reclassifications did not affect net income or cash flows.
Recently Issued Accounting Pronouncements
In December 2009, the FASB issued amended accounting guidance for improvements to financial reporting by enterprises involved with variable interest entities (ASU No. 2009-17). The guidance clarifies the definition of VIEs as well as the obligations of each party and requires a primary beneficiary of VIEs to disclose the assumptions of the VIEs consolidation, the change in its most recent financials through the consolidation and its involvement with VIEs regarding to both quantitative and qualitative information. The amendment is effective as of the beginning of the first annual reporting period that begins after November 15, 2009, for interim periods within that first annual reporting period, and for interim and annual reporting periods thereafter. Earlier adoption is prohibited. The company is currently assessing its implementation of this new guidance, but does not expect a material impact on the Consolidated Financial Statements.
In December 2009, the FASB issued amended accounting guidance for transfers of financial assets (ASU No. 2009-16). The amendment redefines the types of transfers and the term of sales of financial assets and points out the obligations for each party involving in the transfer service. The amendment is effective as of the beginning of the first annual reporting period that begins after November 15, 2009, for interim periods within that first annual reporting period and for interim and annual reporting periods thereafter. Earlier adoption is prohibited. The Company is currently assessing its implementation of this new guidance, but does not expect a material impact on the Consolidated Financial Statements.
In October 2009, the FASB issued amended accounting guidance for own-share lending arrangements in contemplation of convertible debt issuance or other financing (ASU No. 2009-15). A share-lending arrangement is an agreement of prohibitive shares borrowing between a company and an investment banking firm to facilitate third-party investors’ exercise of conversion options in the company’s convertible debt. This amendment requires a disclosure of a various items in terms of share-lending arrangements and is effective for fiscal years beginning on or after December 15, 2009, and interim period within those fiscal years for arrangements outstanding as of the beginning of those fiscal years. Early adoption is not permitted. The Company currently does not issue any convertible debt and believes the application of this guidance will not materially impact the Consolidated Financial Statements.
In October 2009, the FASB issued amended revenue recognition guidance for arrangements with multiple deliverables (ASU No. 2009-13). The new guidance eliminates the residual method of revenue recognition and allows the use of management’s best estimate of selling price for individual elements of an arrangement when vendor specific objective evidence (“VSOE”), vendor objective evidence (“VOE”) or third-party evidence (“TPE”) is unavailable. For the Company, this guidance is effective for all new or materially
F-17
Table of Contents
Tri-Tech Holding Inc.
Notes To Consolidated Financial Statements—(Continued)
December 31, 2009 and 2008
modified arrangements entered into on or after January 1, 2011 with earlier application permitted as of the beginning of a fiscal year. Full retrospective application of the new guidance is optional. The Company is currently assessing its implementation of this new guidance, but does not expect a material impact on the Consolidated Financial Statements.
In October 2009, the FASB issued guidance which amends the scope of existing software revenue recognition accounting (ASU No. 2009-14). Tangible products containing software components and non-software components that function together to deliver the product’s essential functionality would be scoped out of the accounting guidance on software and accounted for based on other appropriate revenue recognition guidance. For the Company, this guidance is effective for all new or materially modified arrangements entered into on or after January 1, 2011 with earlier application permitted as of the beginning of a fiscal year. Full retrospective application of the new guidance is optional. This guidance must be adopted in the same period that the Company adopts the amended accounting for arrangements with multiple deliverables described in the preceding paragraph. The Company is currently assessing its implementation of this new guidance, but does not expect a material impact on the Consolidated Financial Statements.
In September 2009, the FASB issued amended guidance concerning fair value measurements of investments in certain entities that calculate net asset value per share (or its equivalent) (ASU No.2009-12). If fair value is not readily determinable, the amended guidance permits, as a practical expedient, a reporting entity to measure the fair value of an investment using the net asset value per share (or its equivalent) provided by the investee without further adjustment. The Company adopted this guidance in the year ended December 31, 2009, and there was no material impact on the Consolidated Financial Statements.
In August 2009, the FASB issued guidance on the measurement of liabilities at fair value (ASU No. 2009-5). The guidance provides clarification that in circumstances in which a quoted market price in an active market for an identical liability is not available, an entity is required to measure fair value using a valuation technique that uses the quoted price of an identical liability when traded as an asset or, if unavailable, quoted prices for similar liabilities or similar assets when traded as assets. If none of this information is available, an entity should use a valuation technique in accordance with existing fair valuation principles. The Company adopted this guidance in the year ended December 31, 2009 and there was no material impact on the Consolidated Financial Statements.
In June 2009, the FASB issued account Accounting Standard Update No. 2009-02. “Amendments to Various Topics for Technical Corrections”. This is an omnibus update, which is effective for financial statements issued for interim and annual periods ending after July 1, 2009. This Statement did not impact the Company’s consolidated financial results.
In June 2009, the FASB issued SFAS No. 168 (ASC No.105), “The FASB Accounting Standards CodificationTM and the Hierarchy of Generally Accepted Accounting Principles, a replacement of FASB Statement No. 162” (the “Codification”). The Codification, which was launched on July 1, 2009, became the single source of authoritative nongovernmental U.S. GAAP, superseding existing FASB, American Institute of Certified Public Accountants (“AICPA”), Emerging Issues Task Force (“EITF”) and related literature. The Codification eliminates the GAAP hierarchy contained in SFAS No. 162 and establishes one level of authoritative GAAP. All other literature is considered non-authoritative. This Statement is effective for financial statements issued for interim and annual periods ending after September 15, 2009. The Company adopted this Statement for its year ended December 31, 2009. There was no change to the Company’s Consolidated Financial Statements due to the implementation of this Statement.
F-18
Table of Contents
Tri-Tech Holding Inc.
Notes To Consolidated Financial Statements—(Continued)
December 31, 2009 and 2008
In June 2009, the FASB issued SFAS No. 167 (ASC No. 810), “Amendments to FASB Interpretation No. 46(R)” and SFAS No. 166 (ASC No. 860), “Accounting for Transfers of Financial Assets—an amendment of FASB Statement No. 140 (ASC No.860).” SFAS No. 167 amends FASB Interpretation 46(R) to eliminate the quantitative approach previously required for determining the primary beneficiary of a variable interest entity and requires ongoing qualitative reassessments of whether an enterprise is the primary beneficiary of a variable interest entity. SFAS No. 166 amends SFAS No. 140 by removing the exemption from consolidation for Qualifying Special Purpose Entities (“QSPEs”). This Statement also limits the circumstances in which a financial asset, or portion of a financial asset, should be derecognized when the transferor has not transferred the entire original financial asset to an entity that is not consolidated with the transferor in the financial statements being presented and/or when the transferor has continuing involvement with the transferred financial asset. The Company will adopt these Statements for interim and annual reporting periods beginning on January 1, 2010. The Company does not expect the adoption of these standards to have any material impact on the Consolidated Financial Statements.
In May 2009, the FASB issued SFAS No. 165 (ASC No. 855), “Subsequent Events.” This Statement sets forth: (1) the period after the balance sheet date during which management of a reporting entity should evaluate events or transactions that may occur for potential recognition or disclosure in the financial statements; (2) the circumstances under which an entity should recognize events or transactions occurring after the balance sheet date in its financial statements; and (3) the disclosures that an entity should make about events or transactions that occur after the balance sheet date. This Statement is effective for interim and annual periods ending after June 15, 2009. The Company adopted this Statement in the year ended December 31, 2009. This Statement did not impact the consolidated financial results.
In April 2009, the FASB issued FASB Staff Position (FSP) FAS 141(R)-1 (ASC No. 805), “Accounting for Assets Acquired and Liabilities Assumed in a Business Combination That Arise from Contingencies”, which amends the accounting in SFAS 141(R) for assets and liabilities arising from contingencies in a business combination. The FSP is effective January 1, 2009, and requires pre-acquisition contingencies to be recognized at fair value, if fair value can be reasonably determined during the measurement period. If fair value cannot be reasonably determined, the FSP requires measurement based on the recognition and measurement criteria of SFAS 5, “Accounting for Contingencies”. Adoption of FSP FAS 141(R)-1 did not have an impact on the Company’s financial position, results of operations or cash flows.
In April 2009, the FASB issued FSP No. FAS 107-1 (ASC No. 825) and APB 28-1 (ASC No.270), “Interim Disclosures about Fair Value of Financial Instruments”. This FASB staff position amends FASB Statement No. 107 to require disclosures about fair values of financial instruments for interim reporting periods as well as in annual financial statements. The staff position also amends APB Opinion No. 28 to require those disclosures in summarized financial information at interim reporting periods. This FASB staff position becomes effective for interim reporting periods ending after June 15, 2009, with early adoption permitted for periods ending after March 15, 2009. The Company adopted these standards. The adoption of these standards did not materially impact its financial statements.
F-19
Table of Contents
Tri-Tech Holding Inc.
Notes To Consolidated Financial Statements—(Continued)
December 31, 2009 and 2008
In April 2009, the FASB issued FSP No. FAS 115-2 and FAS 124-2 (ASC No. 320), “Recognition and Presentation of Other-Than-Temporary Impairments”. This FSP amends the other-than-temporary impairment guidance in GAAP for debt securities. If an entity determines that it has an other-than-temporary impairment on a security, it must recognize the credit loss on the security in the income statement. The credit loss is defined as the difference between the present value of the cash flows expected to be collected and the amortized cost basis. The staff position expands disclosures about other-than-temporary impairment and requires that the annual disclosures in FASB Statement No. 115 and FSP FAS 115-1 and FAS 124-1 be made for interim reporting periods. This FSP becomes effective for interim reporting periods ending after June 15, 2009, with early adoption permitted for periods ending after March 15, 2009. The Company adopted this standard. The adoption of this standard did not materially impact its financial statements.
In April 2008, the FASB issued Staff Position No. FAS 142-3, “Determination of the Useful Life of Intangible Assets” (“FSP FAS 142-3”) (ASC No. 350). FSP FAS 142-3 amends the factors that should be considered in developing renewal or extension assumptions used to determine the useful life of a recognized intangible asset under SFAS No. 142, “Goodwill and Other Intangible Assets” (“SFAS 142”). The intent of FSP FAS 142-3 is to improve the consistency between the useful life of a recognized intangible asset under SFAS 142 and the period of expected cash flows used to measure the fair value of the asset under SFAS 141(R) and other applicable accounting literature. The Company adopted this Statement on January 1, 2009. There was no impact upon adoption, and its effects on future periods will depend on the nature and significance of business combinations subject to this statement.
In June 2008, the FASB issued FSP EITF 03-6-1(ASC No.260), “Determining Whether Instruments Granted in Share-Based Payment Transactions Are Participating Securities,” which became effective in 2009 via retrospective application. Under the FSP, unvested share-based payment awards that contain non-forfeitable rights to dividends or dividend equivalents are participating securities and, therefore, are included in computing earnings per share (“EPS”) pursuant to the two-class method. The two-class method determines earnings per share for each class of common stock and participating securities according to dividends or dividend equivalents and their respective participation rights in undistributed earnings. Restricted Stock Units (“RSUs”) granted to employees prior to December 31, 2007 are considered participating securities as they receive non-forfeitable dividend equivalents at the same rate as common stock. RSUs granted after December 31, 2007 do not receive dividend equivalents and are not considered participating securities. The Company retrospectively adopted the FSP on January 1, 2009. The adoption of this standard did not materially impact its financial statements.
In November 2008, the FASB ratified EITF Issue 08-7 (ASC No. 350), “Accounting for Defensive Intangible Assets.” A defensive intangible asset is an asset acquired in a business combination or in an asset acquisition that an entity does not intend to actively use. According to the guidance, defensive intangible assets are considered to be a separate unit of account and valued based on their highest and best use from the perspective of an external market participant. The Company adopted EITF 08-7 on January 1, 2009. There was no material impact upon adoption, and its effects on future periods will depend on the nature and significance of the business combinations subject to this statement.
In December 2008, the FASB issued FSP FAS 132(R)-1(ASC No.715), “Employers’ Disclosures about Postretirement Benefit Plan Assets.” This FSP amends SFAS No. 132(R), “Employers’ Disclosures
F-20
Table of Contents
Tri-Tech Holding Inc.
Notes To Consolidated Financial Statements—(Continued)
December 31, 2009 and 2008
about Pensions and Other Postretirement Benefits” to require more detailed disclosures about the fair value measurements of employers’ plan assets including: (a) investment policies and strategies; (b) major categories of plan assets; (c) information about valuation techniques and inputs to those techniques, including the fair value hierarchy classifications (as defined by SFAS No. 157) of the major categories of plan assets; (d) the effects of fair value measurements using significant unobservable inputs (Level 3) on changes in plan assets; and (e) significant concentrations of risk within plan assets. The disclosures required by the FSP will be included in the Company’s year ending 2009 Consolidated Financial Statements. This Statement does not impact the consolidated financial results as it is disclosure-only in nature.
In December 2007, the FASB issued Statement of Financial Accounting Standards No. 160 (“SFAS 160”) (ASC No. 810), “Noncontrolling Interests in Consolidated Financial Statements — An Amendment of ARB No. 51.” SFAS 160 establishes new accounting and reporting standards for the noncontrolling interest in a subsidiary and for the deconsolidation of a subsidiary. Pursuant to the transition provisions of SFAS No. 160, the Company adopted the Statement on January 1, 2009 via retrospective application of the presentation and disclosure requirements. Noncontrolling interests were reclassified from the Liabilities section to the Stockholders’ Equity section in the Consolidated Statement of Financial Position as of January 1, 2009.
3. Accounts Receivable
Based on the Company’s valuation review, management believes the net balance on each balance sheet date herein was collectable.
The following analysis details the changes in the Company’s allowances for doubtful accounts during the years ended December 31, 2009 and December 31, 2008:
| December 31, 2009 |
December 31, 2008 (Restated) | ||||||
| Balance at beginning of the year |
$ | 62,286 | $ | 39,351 | |||
| Increase in allowances during the period |
1,380 | 22,935 | |||||
| Write-offs during the period |
(7,175 | ) | — | ||||
| Balance at the end of the year |
$ | 56,491 | $ | 62,286 | |||
4. Inventories
Inventories consisted of the following:
| December 31, 2009 |
December 31, 2008 (Restated) | |||||
| Raw materials |
$ | 140,048 | $ | 112,638 | ||
| Finished goods |
360,152 | 226,172 | ||||
| Project work-in-progress |
1,073,124 | 1,127,658 | ||||
| Totals |
$ | 1,573,324 | $ | 1,466,468 | ||
F-21
Table of Contents
Tri-Tech Holding Inc.
Notes To Consolidated Financial Statements—(Continued)
December 31, 2009 and 2008
The Company reviews its inventory periodically for possible obsolete goods and to determine if any reserves are necessary for potential obsolescence. As of December 31, 2009 and December 31, 2008, the Company determined that no more reserves were necessary.
5. Plant and Equipment
Plant and equipment consist of the following:
| December 31, 2009 |
December 31, 2008 |
|||||||
| (Restated) | ||||||||
| Transportation equipment |
$ | 308,042 | $ | 123,498 | ||||
| Office equipment |
206,674 | 137,666 | ||||||
| Furniture |
13,986 | 10,140 | ||||||
| Total plant and equipment |
528,702 | 271,304 | ||||||
| Less accumulated depreciation |
(154,693 | ) | (97,176 | ) | ||||
| Plant and equipment, net |
$ | 374,009 | $ | 174,128 | ||||
6. Notes Receivable
Notes receivable represents advances the Company made to third parties without specific terms and sometimes without interest. The interest rates charged range from 6% to 12%. The Company’s management believes that all the notes will be repaid within one year.
7. Prepayments
Prepayments are monies deposited with or advanced to subcontractors to perform services on system contracting projects. Some subcontractors require a certain amount of money to be deposited as a guaranty payment in order for them to start performing the services. Prepayments also include monies deposited or advanced to vendors on future inventory purchases to ensure timely delivery.
8. Commercial Paper and Other Short-term Notes Payable
Commercial paper and other short-term notes payable represent temporary advances obtained from third parties. These advances normally do not carry interest and specific terms.
9. Accounts payable and cost accrual on projects
This account contains the accruals of costs incurred in the projects in accordance with the percentage of completion method. Cost accrual on projects are $2433, 407 and $635,721 as of December 31, 2009 and December 31, 2008, respectively.
F-22
Table of Contents
Tri-Tech Holding Inc.
Notes To Consolidated Financial Statements—(Continued)
December 31, 2009 and 2008
10. Long-term liabilities
Company purchased transport equipment payable on installments, pursuant to the payment agreement, the remaining payments totally $58,171 will be repaid within 16 months at $3,635 per month from December 31, 2009.
11. Income Taxes
Under the Income Tax Laws of the PRC, before 2008, domestic companies in the PRC were generally subject to an income tax at an effective rate of 33% (30% state income taxes plus 3% local income taxes) on income reported in the statutory financial statements after appropriate tax adjustments, unless (a) the enterprise was located in a specially designated region which allowed enterprises a three-year income tax exemption and a 50% income tax reduction for the following three years or (b) the enterprise was a manufacturing related joint venture with a foreign enterprise or a wholly-owned subsidiary of a foreign enterprise, which was allowed a two-year income tax exemption and a 50% income tax reduction for the following three years.
Under the Income Tax Laws of the Beijing State Administration Taxation of PRC, any enterprise with manufacturing operations in the city of Beijing that is a wholly owned subsidiary of a foreign enterprise is subject to an income tax rate of 24%.
According to an approval document (Taxation Notice No. 201 (2008)) from the Beijing State Tax Bureau of Xicheng District, TTB was granted an income tax exemption in 2007 and 2008 and reduced income tax rates of 10%, 11%, and 12% from 2009 to 2011, on the basis of being a high-tech company.
According to an approval document from the Beijing State Tax Bureau of Haidian District, Tranhold was granted an income tax exemption in 2004 and 2005 and a half reduced income tax rate from the normal rate of 15% from 2006 to 2008, on the basis of being a high-tech company. Before being re-identified as High-technology Enterprise in accordance with new legislation, the income tax rates of Tranhold will be 25% in 2009 and beyond.
According to an approval document from the Beijing State Tax Bureau of Haidian District, Yanyu was granted, on the basis of being a high-tech and software company, an income tax exemption in 2003 and 2004 and a half reduced income tax rate from the normal rate of 15% from 2005 to 2007. Before being re-identified as High-technology Enterprise in accordance with new legislation, the income tax rates of Yanyu will be 25% in 2009 and beyond.
Beginning January 1, 2008, the new Enterprise Income Tax (“EIT”) law replaced the existing laws for Domestic Enterprises (“DES”) and Foreign Invested Enterprises (“FIEs”).
The key changes are:
| a. | The new standard EIT rate of 25% will replace the 33% rate currently applicable to both DES and FIEs, except for high-tech companies which have a reduced rate of 15%; |
| b. | Companies established before March 16, 2007 will continue to enjoy tax holiday treatment approved by the local government for a grace period of the next 5 years or until the tax holiday term is completed, whichever is sooner. |
F-23
Table of Contents
Tri-Tech Holding Inc.
Notes To Consolidated Financial Statements—(Continued)
December 31, 2009 and 2008
However, on May 27, 2009, TTB received Taxation Notice No. 9 (2009) from the Beijing State Tax Bureau of Xicheng District, which superseded Taxation Notice No. 201 (2008) mentioned above.
According to Taxation Notice No. 9 (2009), TTB is required to pay income at the rate of 25% for the fiscal year ended December 2008. As a result, the Company was required to pay additional $139,562 for the fiscal year ended December 31, 2008.
Pursuant to the Taxation Notice and supplementary regulations, only the high-tech companies re-certified under the new criteria of high-tech enterprise are granted the preferred tax rates.
According to State Tax Notice No. 203 (2009) issued by State Administration of Taxation on April 22, 2009, neither Tranhold nor Yanyu is qualified for preferred tax benefits for high-tech enterprise until they are re-certified as high-tech enterprises under the newly revised criteria for high-tech enterprises. Both Tranhold and Yanyu are currently subject to 25% income tax rate. As a result, the Company accrued $32,925 deferred income tax liability for the fiscal year ended December 31, 2008.
TTB has already certified as a high-tech enterprise under the new criteria in December 2009.
According to Taxation Notice No. 1 (2010) from the Beijing State Tax Bureau of Xicheng, District, TTB is subject to 7.5% income tax rate, from January 1, 2009 to December 31, 2011.
The Company had paid income taxes $239,743 for the year ended December 31, 2009.
Restated Financial Statements
As a result of the foregoing, the Company has restated its consolidated balance sheets as of December 31, 2008, and the related consolidated statements of income and comprehensive income, changes in stockholders’ equity for the year ended December 31, 2008.
F-24
Table of Contents
Tri-Tech Holding Inc.
Notes To Consolidated Financial Statements—(Continued)
December 31, 2009 and 2008
A summary of the significant effects of the restatement on the Company’s consolidated balance sheet as of December 31, 2008 is as follows:
| As of December 31, 2008 | ||||||||||
| Item |
As Previously Reported |
Adjustments | As Restated | |||||||
| Deferred income taxes |
$ | 50,186 | $ | 33,457 | $ | 83,643 | ||||
| Income taxes payable |
— | 141,818 | 141,818 | |||||||
| Total current liabilities |
2,649,261 | 175,275 | 2,824,536 | |||||||
| Retained earnings |
2,654,475 | (171,902 | ) | 2,482,573 | ||||||
| Accumulated other comprehensive income |
372,642 | (11,314 | ) | 361,328 | ||||||
| Total Tri-Tech Holding Inc. shareholders’ equity |
5,995,385 | (183,216 | ) | 5,812,169 | ||||||
| Non-controlling Interests |
129,578 | 7,941 | 137,519 | |||||||
| Total shareholders’ equity |
$ | 6,124,963 | $ | (175,275 | ) | $ | 5,949,688 | |||
A summary of the significant effects of the restatement on the Company’s consolidated statement of income and comprehensive income for the year ended December 31, 2008 is as follows:
| As of December 31, 2008 | ||||||||||
| Item |
As Previously Reported |
Adjustments | As Restated | |||||||
| Provision for income taxes expenses |
$ | 29,760 | $ | 172,487 | $ | 202,247 | ||||
| Net income |
1,877,324 | (172,487 | ) | 1,704,837 | ||||||
| Noncontrolling Interests Income |
9,270 | (585 | ) | 8,685 | ||||||
| Net income attributable to Tri-Tech Holding Inc. |
1,868,055 | (171,902 | ) | 1,696,153 | ||||||
| Foreign currency translation adjustment |
262,495 | (2,787 | ) | 259,708 | ||||||
| Comprehensive income |
2,139,819 | (175,274 | ) | 1,964,546 | ||||||
| Comprehensive income attributable to noncontrolling interests |
9,270 | 7,951 | 17,221 | |||||||
| Comprehensive income attributable to Tri-Tech Holding Inc. |
$ | 2,130,549 | $ | (183,226 | ) | $ | 1,947,324 | |||
| Net income attributable to Tri-Tech Holding Inc. per share: |
||||||||||
| Basic and diluted |
$ | 0.53 | $ | — | $ | 0.53 | ||||
| Shares used in computation: |
||||||||||
| Basic and diluted |
3,555,000 | — | 3,215,000 | |||||||
The provision for income tax expense (benefit) from continuing operations consists of the following:
| Years Ended December 31, | ||||||
| 2009 | 2008 | |||||
| Current: |
||||||
| PRC |
$ | 166,607 | $ | 139,562 | ||
| Deferred: |
||||||
| PRC |
141,478 | 62,685 | ||||
| Total income tax expense (benefit) |
$ | 308,085 | $ | 202,247 | ||
F-25
Table of Contents
Tri-Tech Holding Inc.
Notes To Consolidated Financial Statements—(Continued)
December 31, 2009 and 2008
Significant components of the Company’s net deferred tax assets/(liabilities) are as follows:
| December 31, 2009 |
December 31, 2008 (Restated) |
|||||||
| Deferred tax assets: |
||||||||
| Net operating loss carry forwards |
140,814 | 107,266 | ||||||
| Deferred tax liabilities: |
||||||||
| Revenue recognition based on percentage of completion |
282,292 | 190,909 | ||||||
| Total net deferred tax assets (liabilities) |
$ | (141,478 | ) | $ | (83,643 | ) | ||
Yanyu had accumulated net operating losses of RMB3,774,490 (approximately $552,780) for income tax purposes as of December 31, 2009. These net operating losses can be carried forward for 5 years to reduce future years’ PRC taxable income. Tranhold had accumulated net operating losses of RMB 498,826 (approximately $73,054) for income tax purposes as of December 31, 2009. These net operating losses can be carried forward for 5 years to reduce future years’ PRC taxable income. These carry forwards will expire, if not utilized, beginning in 2010 and continue through 2015.
The Beijing Tax Bureau generally conducts annual audits of income tax by commissioning an accounting firm or tax auditing firm, although the tax bureau will do it by itself when they feel there is need to do so. No tax bureau audits have been performed on the subsidiary or VIEs in the PRC so far. Tax audits by auditing firms for TTB, Tranhold and Yanyu have been performed through, 2008. All subsidiaries and VIEs of the Company file their tax returns in accordance with the audit reports issued by the auditing firm.
12. Equity
On September 9, 2009, the Company completed its initial public offering (“IPO”) of 1,700,000 ordinary shares at $6.75 per share. In order to mitigate some of the risk of valuing the Company on a forward-looking basis, each of the founders of TRIT placed into escrow, on a pro rated basis, that number of ordinary shares that was equal to 20% of the number of shares sold in the IPO (“Founders’ Shares”) or 340,000 shares. If TRIT’s 2009 EPS equaled or exceeded $0.7205 (calculated before the effects of the expenses related to Warrants, Options and escrow shares, and with the assumption as indicated above), then the Founders’ Shares were to be released to the Founders from escrow. Because the Founders’ Shares were escrowed as a condition of completing the IPO and were to be released to the Founders without regard to the shareholders’ continued employment if TRIT met the foregoing criteria, we have determined that no compensatory arrangement exists. Accordingly, we have accounted for the escrow shares as an element of the overall transaction and will not recognize any compensation expense upon the return of escrow shares to the Founders. If our Company did not meet the criteria for releasing the Founders’ Shares, then we were obligated to redeem the Founders’ Shares without payment, resulting in the reduction of TRIT shares outstanding.
F-26
Table of Contents
Tri-Tech Holding Inc.
Notes To Consolidated Financial Statements—(Continued)
December 31, 2009 and 2008
13. Warrants
On September 9, 2009, the Company issued to Anderson & Strudwick Incorporated 170,000 warrants, as a portion of the placement commission for the IPO. On the same day, the Company issued a total of 7,500 warrants to Hawk Associates Inc., the Company’s investor relations consultancy. The Company issued 177,500 warrants as of December 31, 2009. All warrants can be exercised at a price equal to $8.10 per share, at any time on and after 180 days from the grant date. The expiration date for the warrants is September 9, 2014.
The fair value of each warrants award is estimated on the date of grant using a Black Scholes Model that uses the item noted in the following table.
| Fair value per share (USD/share) |
5.94 | ||
| Exercise price (USD/share) |
8.10 | ||
| Risk free rate |
2.74 | % | |
| Dividend yield |
0.00 | % | |
| Expected term/Contractual Life (No. of Yrs) |
5.0 | ||
| Expected volatility |
53.0 | % |
(1) Fair Value of Underlying Ordinary Shares
With reference to Paragraph 17 of SFAS123R, a restricted stock discount was applied to price of the Company’s ordinary shares to reflect the fact that the warrant holders are restricted from exercising the warrant within 180-days after its vesting date. When determining the restricted stock discount, the Black Scholes option model was used. Under the option-pricing method, the cost of put option, which can hedge the price change before the privately held share can be sold, was considered as a basis to determine the discount for lack of marketability. Based on the analysis, restricted stock discount of 12% was applied on the market price of our common share as of the warrant grant dates.
(2) Exercise price
The exercise price of the warrant was determined by the Company’s board of directors.
(3) Risk-free interest rate
Risk-free interest rate was estimated based on the yield to maturity of China international government bonds with a maturity period close to the term of the warrants.
(4) Dividend yield
Dividend yield of 0% was estimated by management of the Company
(5) Life to Expiration
Life to expiration was based on the contractual term of the warrants.
F-27
Table of Contents
Tri-Tech Holding Inc.
Notes To Consolidated Financial Statements—(Continued)
December 31, 2009 and 2008
(6) Volatility
The volatility of the underlying ordinary shares during the life of the warrants was estimated based on the historical stock price volatility of listed comparable companies over a period comparable to the expected term of the warrants.
The fair value of warrants on the grant date of September 9, 2009 was $2.37 per share. The total fair value of warrants was $420,675.
The warrants expense for the placement agent was $402,900 as an IPO expense. The warrants expense for the investor relations firm recognized as general and administrative expenses for the year ended December 31, 2009 was $13,831, and another $3,944 will recognize as general and administrative expenses in the next 69 days.
14. Options issued to employees
TRIT’s 2009 employee share option plan that was approved by shareholders permits the Company to offer up to 525,500 shares, options and other securities to its employees. On September 9, 2009, TRIT granted employee 525,500 stock options with an exercise price equal to $6.75 to its senior management and employees. The options will vest based on 5 years of continuous service and will have 10-year contractual terms from September 9, 2009. The options will vest over five years at a rate of 20% per year beginning in September 2010. Certain options provide for accelerated vesting upon a change in control (as defined in the employee share option plan). The company had issued 525,500 stock options on December 31, 2009.
The fair value of each option award is estimated on the date of grant using a Black Scholes Model that uses the item noted in the following table.
| Fair value per share (USD/share) |
6.75 | ||
| Exercise price (USD/share) |
6.75 | ||
| Risk free rate |
2.74 | % | |
| Dividend yield |
0.00 | % | |
| Expected term/Contractual Life (No. of Yrs) |
6.5 | ||
| Expected volatility |
50.0 | % |
(1) Fair Value of Underlying Ordinary Shares
This is based on market price of the Company’s ordinary shares as of option grant dates.
(2) Exercise price
The exercise price of the options was determined by the Company’s board of directors.
(3) Risk-free interest rate
Risk-free interest rate was estimated based on the yield to maturity of China international government bonds with a maturity period close to the expected term of the options.
F-28
Table of Contents
Tri-Tech Holding Inc.
Notes To Consolidated Financial Statements—(Continued)
December 31, 2009 and 2008
(4) Dividend yield
Dividend yield of 0% was estimated by management of the Company.
(5) Expected term
As the Company did not have historical share option exercise experience, it estimated the expected term as the average between the vesting term of the options and the original contractual term.
(6) Volatility
The volatility of the underlying ordinary shares during the life of the options was estimated based on the historical stock price volatility of listed comparable companies over a period comparable to the expected term of the options.
The fair value of options on the grant-date of September 9, 2009 was $3.53 per share. The total fair value of options was $1,855,015. None of options is vested under the employee share option plan as of December 31, 2009.
The total option compensation expense recognized for the year ended December 31, 2009 was $114,858, and another $1,740,157 will be recognized as general and administrative expense over the next 1,712 days.
15. Commitments and Contingencies
Operating Leases
As of December 31, 2009, the Company had commitments under certain operating leases, requiring annual minimum rentals as follows:
| 2010 |
$ | 238,319 | |
| 2011 |
134,087 | ||
| 2012 |
116,842 | ||
| 2013 |
116,842 | ||
| 2014 |
107,106 | ||
| Total |
$ | 713,196 | |
The leased properties are principally located in the PRC and are used for administration and research and development purposes. The terms of these operating leases varied from one to three years. Pursuant to contracts, when the contracts are expired, we have the rights to extended them with new negotiated prices. The leases are renewable subject to negotiation. Rental expenses were $184,312 and $160,341 for the years ended December 31, 2009 and December 31, 2008, respectively.
F-29
Table of Contents
Tri-Tech Holding Inc.
Notes To Consolidated Financial Statements—(Continued)
December 31, 2009 and 2008
Product Warranties
The Company’s warranty policy generally is to replace parts if they become defective within one year after deployment at no additional charge. Historically, failure of product parts due to materials or workmanship has not been significant. The Company has not incurred any material unexpected costs associated with servicing its warranties. The Company continuously evaluates and estimates its potential warranty obligations, and records the related warranty obligation when the estimated amount becomes material at the time revenue is recorded.
16. Certain Significant Risks and Uncertainties
Cash includes cash on hand and demand deposits in accounts maintained with state owned banks within the PRC. Total cash in these banks at December 31, 2009 and December 31, 2008, amounted to $8,672,592 and $732,418, respectively, of which no deposits are covered by insurance. The Company has not experienced any losses in such accounts and believes it is not exposed to any risks on its cash in bank accounts.
The Company’s operations are carried out in the PRC. Accordingly, the Company’s business, financial condition and results of operations may be influenced by the political, economic and legal environments in the PRC and by the general state of the PRC’s economy. The Company’s operations in the PRC are subject to specific considerations and significant risks not typically associated with companies in North America and Western Europe. These include risks associated with, among others, the political, economic and legal environments and foreign currency exchange. The Company’s results may be adversely affected by changes in governmental policies with respect to laws and regulations, anti-inflationary measures, currency conversion and remittance abroad, and rates and methods of taxation, among other things.
The Company has five major customers which in total represented approximately 29.6% and 38.9% of the Company’s sales for the years ended December 31, 2009 and December 31, 2008, respectively. Sales to one customer amounted to $1,493,577 and 1,046,092 in the segment of Water Resource Management, or accounted for 8.9% and 12.4% of the Company’s sales for 2009 and 2008, respectively.
17. Related Party Transactions
To finance the growth of the business, Tranhold borrowed RMB750,000 (equivalent to $102,675) from a shareholder at that time of Tranhold on April 28, 2006, without interest and specific terms. Tranhold repaid RMB650,000 (equivalent to $88,044) to the shareholder in 2008. Outstanding payable balances for this loan were at $14,631 for the years ended December 31, 2008. Tranhold repaid RMB 100,000 (equivalent to $14,631) to the shareholder in March 2009.
An administrative officer of the Company leased his personal property to Tranhold as its branch office in Beijing. The monthly rent is $4,758, which approximates an average of market price, from January 1, 2009 to December 31, 2010.
F-30
Table of Contents
Tri-Tech Holding Inc.
Notes To Consolidated Financial Statements—(Continued)
December 31, 2009 and 2008
18. Retirement Plan
The Company and its subsidiaries are required to participate in a central pension scheme operated by the local municipal government. The Company is required to contribute approximately 20% of its payroll costs, subject to certain caps with reference to average municipal salary, to the central pension scheme. The Company charges contributions to its income statement as they become payable in accordance with the rules of the scheme. The aggregate contributions of the Company to retirement benefit schemes amounted to $49,727 and $44,955 for the years ended December 31, 2009 and December 31, 2008 respectively.
19. Statutory Reserves
The laws and regulations of the People’s Republic of China provide that before a Chinese enterprise distributes profits to its shareholders, it must first satisfy all tax liabilities, provide for losses in previous years, and make appropriation, in proportions determined at the discretion of the board of directors, to the statutory reserves. The statutory reserves include the surplus reserve fund and the collective welfare fund. These statutory reserves represent restricted retained earnings.
TTII’s subsidiary and VIEs are required to transfer 10% of its net income, as determined in accordance with the PRC accounting rules and regulations, to a statutory surplus reserve fund until such reserve balance reaches 50% of the Company’s registered capital.
The transfer to this reserve must be made before distribution of any dividend to shareholders. The surplus reserve fund is non-distributable other than during liquidation and can be used to fund previous years’ losses, if any, and may be utilized for business expansion or converted into share capital by issuing new shares to existing shareholders in proportion to their shareholding or by increasing the par value of the shares currently held by them, provided that the remaining reserve balance after such issue is not less than 25% of the registered capital.
As stipulated by the relevant laws and regulations applicable to PRC foreign investment enterprises, the foreign invested PRC subsidiaries are required to make appropriations from net income as determined under PRC GAAP to non-distributable reserves which include a general reserve, an enterprise expansion reserve and an employee welfare and bonus reserve.
Wholly-foreign-owned PRC subsidiaries are not required to make appropriations to the enterprise expansion reserve but appropriations to the general reserve are required to be made at not less than 10% of the profit after tax as determined under PRC GAAP.
The employee welfare and bonus reserve is determined by the Company’s Board of Directors. The general reserve is used to offset future extraordinary losses. The subsidiaries may, upon a resolution passed by the stockholders, convert the general reserve into capital. The employee welfare and bonus reserve is used for the collective welfare of the employees of the subsidiaries. The enterprise expansion reserve is used for the expansion of the subsidiaries’ operations and can be converted to capital subject to approval by the relevant authorities. These reserves represent appropriations of retained earnings determined according to PRC law.
For the years ended December 31, 2009 and December 31, 2008, respectively, the Company made no appropriations to statutory reserves.
F-31
Table of Contents
Tri-Tech Holding Inc.
Notes To Consolidated Financial Statements—(Continued)
December 31, 2009 and 2008
20. Segment and Geographic Information
The Company has two reportable operating segments. The segments are grouped with references to the types of services provided and the types of clients that use those services. As TTB and its subsidiaries conduct services of the two segments, the total sales and costs are accordingly divided into the two segmental portions. The Company assesses each segment’s performance based on net revenues and gross profit on contribution margin. The two reportable operating segments are Segment 1: water and wastewater treatment process control systems, process tail gas purification (“Wastewater and Tail Gas Treatment”) and Segment 2: water resources protection and allocation, flood control and forecasting, irrigation systems, and municipal water supply and distribution systems (“Water Resource Management”). .
| For the year ended December 31, 2009 | ||||||||||
| Segment 1 Wastewater and Tail Gas Treatment |
Segment 2 Water Resource Management |
Total | ||||||||
| Revenues |
$ | 8,960,830 | $ | 7,839,065 | $ | 16,799,895 | ||||
| Cost of revenues (exclusive of depreciation and amortization expenses shown separately below): |
5,522,167 | 4,653,758 | 10,175,925 | |||||||
| Operating expenses: |
||||||||||
| Depreciation and amortization expenses |
67,081 | 52,092 | 119,173 | |||||||
| Other operating expenses |
1,410,864 | 1,037,857 | 2,448,721 | |||||||
| Total operating expenses |
1,477,945 | 1,089,949 | 2,567,894 | |||||||
| Other income, net |
(4,977 | ) | 125,938 | 120,961 | ||||||
| Income before income taxes and noncontrolling interest |
$ | 1,955,741 | $ | 2,221,296 | $ | 4,177,037 | ||||
F-32
Table of Contents
Tri-Tech Holding Inc.
Notes To Consolidated Financial Statements—(Continued)
December 31, 2009 and 2008
| For the year Ended December 31, 2008 (Restated) | |||||||||
| Segment 1 Wastewater and Tail Gas Treatment |
Segment 2 Water Resource Management |
Total | |||||||
| Revenues |
$ | 4,968,488 | $ | 3,481,470 | $ | 8,449,958 | |||
| Cost of revenues (exclusive of depreciation and amortization expenses which are included in the Operating expenses below): |
3,111,659 | 2,210,581 | 5,322,240 | ||||||
| Operating expenses: |
|||||||||
| Depreciation and amortization expenses |
34,399 | 54,332 | 88,731 | ||||||
| Other operating expenses |
647,087 | 595,327 | 1,242,414 | ||||||
| Total operating expenses |
681,486 | 649,659 | 1,331,145 | ||||||
| Other income net |
40 | 110,472 | 110,512 | ||||||
| Income before income taxes and noncontrolling interests |
$ | 1,175,383 | $ | 731,702 | $ | 1,907,085 | |||
Assets by segment
The Company evaluates its assets by segment to generate information needed for internal control, resource allocation and performance assessment. This information also helps management to establish a basis for asset realization, determine insurance coverage, assess risk exposure, and meet requirements for external financial reporting.
Segment assets of the Company are as follows:
| As of December 31, 2009 | |||||||||
| Segment 1 Wastewater and Tail Gas Treatment |
Segment 2 Water Resource Management |
Total | |||||||
| Segment Assets |
$ | 10,952,971 | $ | 13,237,317 | $ | 24,190,288 | |||
| As of December 31, 2008 (Restated) | |||||||||
| Segment 1 Wastewater and Tail Gas Treatment |
Segment 2 Water Resource Management |
Total | |||||||
| Segment Assets |
$ | 3,906,088 | $ | 4,868,136 | $ | 8,774,224 | |||
F-33
Table of Contents
Tri-Tech Holding Inc.
Notes To Consolidated Financial Statements—(Continued)
December 31, 2009 and 2008
21. Subsequent Event
In January, 2010, Yanyu acquired 5 software products, which include BlueSky (large region environmental management system), Skylon MCMS V1.0 (mobile web management system), Skylon DLMS V1.0 (database management system), pollution reduction checking assistant, water pollution control infrastructure, and hired its associated software R&D persons, simultaneously. This purchase involves $293,000. This is attributable to Segment 2 (“Water Resource Management”). Through this purchase, we will strengthen our service and provide better products for our customer, which integrates the acquired software products with our existing products and services. The customers are similar type of our previous customers of central and local government administrations, such as environmental protection department, hydrology department and other public utility. The Company intends to start the promotion and marketing campaign for these products.
F-34