Attached files
| file | filename |
|---|---|
| 8-K - FORM 8-K - TPC Group Inc. | d8k.htm |
| EX-10.1 - AGREEMENT DATED MARCH 24, 2010 - TPC Group Inc. | dex101.htm |
 A
Valuable, Unique & Stable Bridge from Mixed C4 to Purity Products
Charles Shaver President and Chief Executive Officer Ruth Dreessen Executive Vice President and Chief Financial Officer BB&T Capital Markets Commercial & Industrial Conference Investor Presentation March 24, 2010 A Service-Based Intermediary with Strong Infrastructure & Logistics Network Exhibit 99.1 |
 Forward-Looking Statements & Non-GAAP Financial Measures This presentation may contain forward-looking statements, including, in particular,
statements about the plans, strategies and prospects of TPC Group Inc. (“the Company” or “TPC”). These forward-looking statements are based on the Company’s current assumptions, expectations and projections about future events. Although the Company believes that the expectations reflected in these forward-looking statements are reasonable, the Company can give no assurance that these expectations will prove to be
correct or that synergies or other benefits anticipated in the
forward-looking statements will be achieved. Important factors, some of which may be beyond the Company’s control, that could cause results to differ materially from
management’s expectations are set forth in Amendment No. 1 to the
company’s Registration Statement on Form 10 filed with the Securities and Exchange Commission. Estimated projected financial information for the twelve months ended March 31, 2010 is
based on the current belief of TPC based on currently available information as to the outcome and timing of future events and assumptions that TPC believes are reasonable. The assumptions underlying the estimated projected
financial information are inherently uncertain and are subject to
significant business, economic, regulatory and competitive risks and uncertainties that could cause actual results to differ materially from those TPC anticipates. If the
assumptions are not realized, the actual financial results could be
substantially different than that currently expected. When reading this information, you should keep in mind the risk factors and other cautionary statements included in TPC’s filings with the SEC, including its registration statement on Form 10 filed on January 8, 2010. TPC does not undertake any obligation to release
publicly the results of any future revisions TPC may make to the projections
or to update the projections to reflect events or circumstances after the date of this presentation. Therefore, you are cautioned not to place undue reliance on this
information. This presentation may also contain non-GAAP financial
measures. For a presentation of the most directly comparable GAAP measures and a reconciliation of the two as well as additional detail regarding selected items impacting comparability, please refer to Appendix. 2 BB&T Capital Markets Commercial & Industrial Conference – March 24, 2010 |
 Investment Highlights BB&T Capital Markets Commercial & Industrial Conference – March 24, 2010 3 Large Valuation Gap Attractive Market Position in Consolidated Industry Substantial and Strategic Asset Value Significant and Stable Free Cash Flow Differentiated Business Model Positioned for Margin Expansion and Growth |
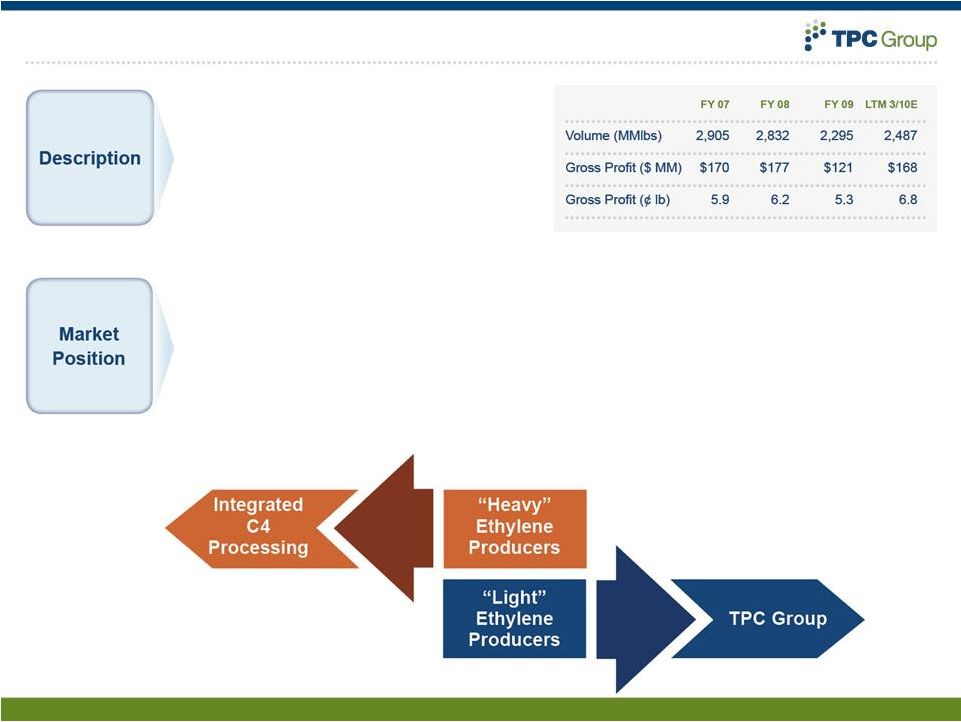
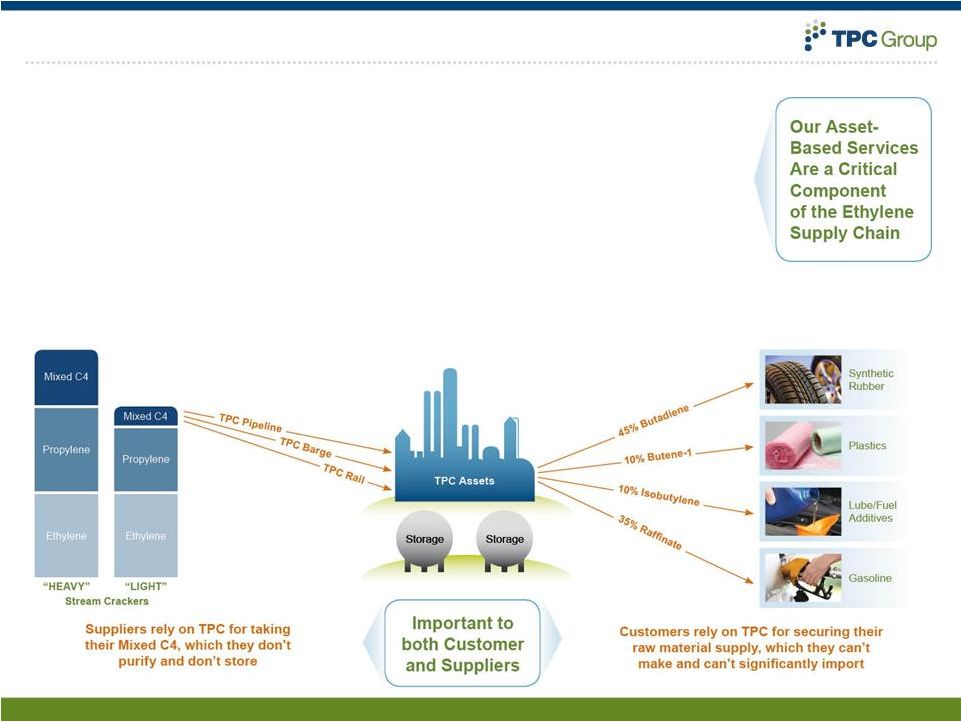 Differentiated Business Model TPC Group: a C4 processor, logistics provider & marketer • C4: four carbon hydrocarbon by-products of ethylene production • Ethylene produced by cracking “heavy” (oil) or “light” (natural gas) – Cracking “heavy” produces significantly more C4 than cracking “light” – “Heavy” crackers: integrated with their own C4 processing – “Light” crackers: non-integrated and therefore outsource to TPC • Long-standing, service-based contracts mitigate exposure to commodity
prices – TPC receives processing fees from its suppliers – TPC receives service fees from its customers • Key drivers of profitability are unit margins, volume & production efficiency
BB&T Capital Markets Commercial & Industrial Conference – March 24, 2010 4 |
 Substantial & Strategic Asset Value BB&T Capital Markets Commercial & Industrial Conference – March 24, 2010 5 |
 Business Segments – C4 Processing & Performance Products BB&T Capital Markets Commercial & Industrial Conference – March 24, 2010 6 |
 C4
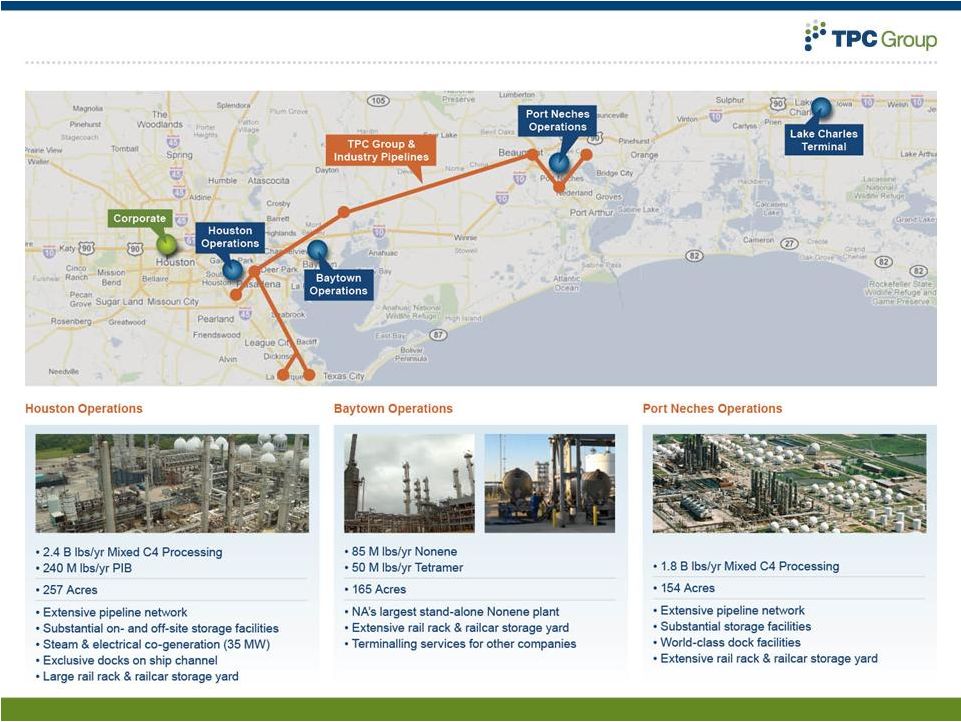
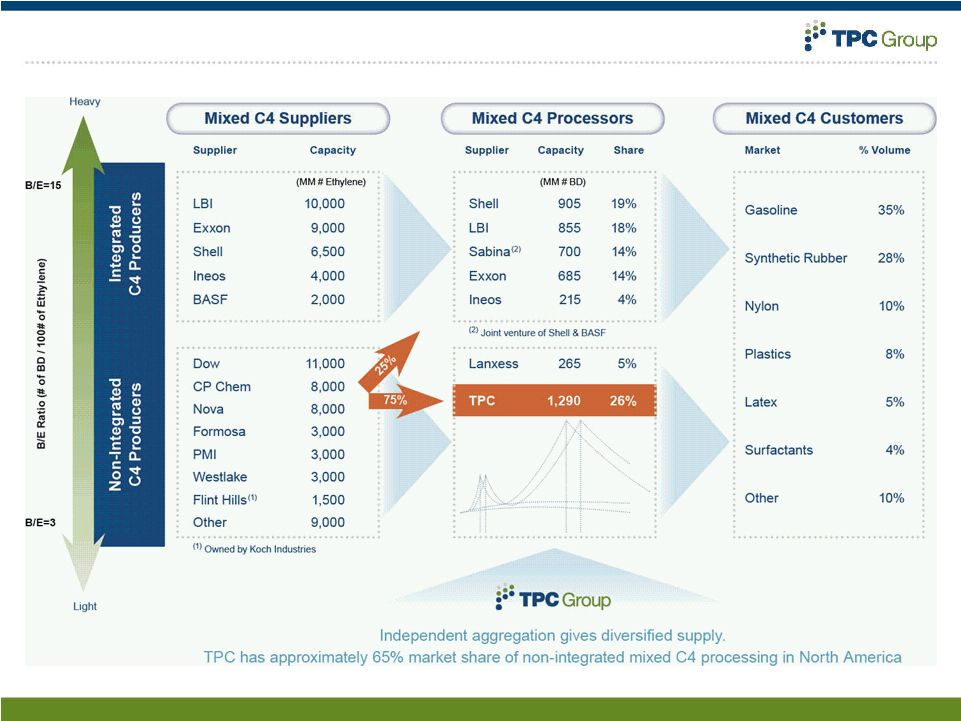
Processing – Logistics, Credibility, Competency BB&T Capital Markets Commercial & Industrial Conference – March 24, 2010 7 • Products: Butadiene, Butene-1, Raffinates • Suppliers: Dow, Formosa, Nova, CP Chem, Others (15 different ethylene plants) • Customers: Goodyear, Firestone, Lanxess, Invista, Dow, Motiva, Valero, Others • Market leader with 35% of overall North American C4 processing capacity • Approximately 65% market share of non-integrated C4 processing • Contractually aligned with cost-advantaged ethylene producers • Profitability model: fixed margin and index-based contracts • Best-in-class logistical system and operational reliability • Bringing diverse C4 supplies together • Integral to ethylene value chain |
 C4
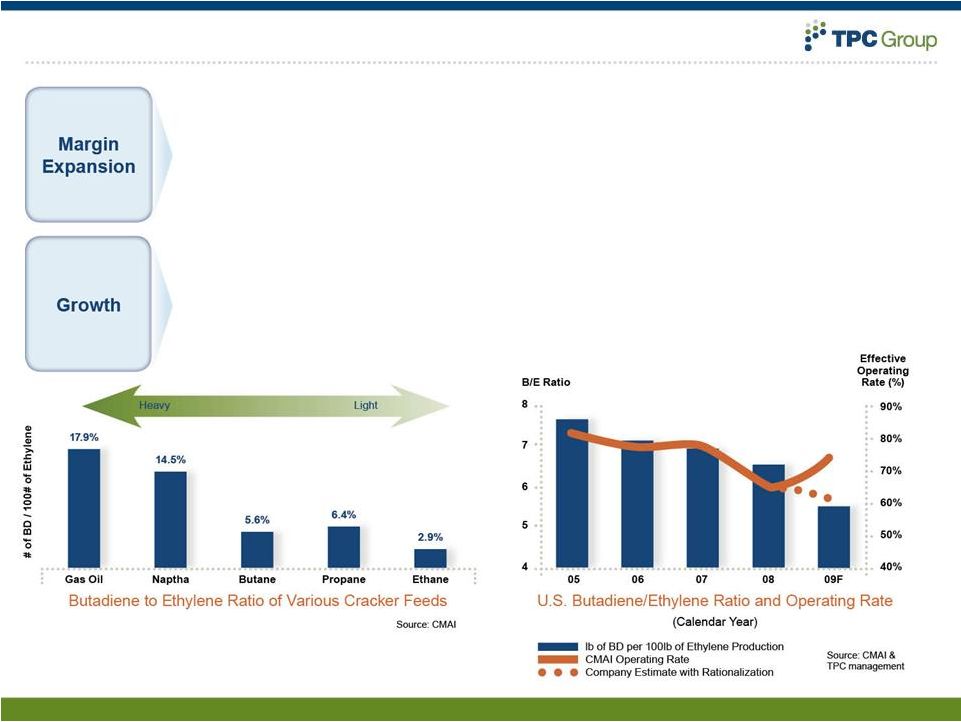
Processing – Logistics, Credibility, Competency BB&T Capital Markets Commercial & Industrial Conference – March 24, 2010 8 • C4 markets remain tight, allowing margin increase opportunities • Raffinates margin is a percentage of gasoline price • Service fees for use of our logistical network • Any industry movement toward heavier feeds increases Mixed C4 volumes • Light cracking may lead integrated producers to outsource C4 handling • Butene-1 demand continues to increase faster than plastic demand
|
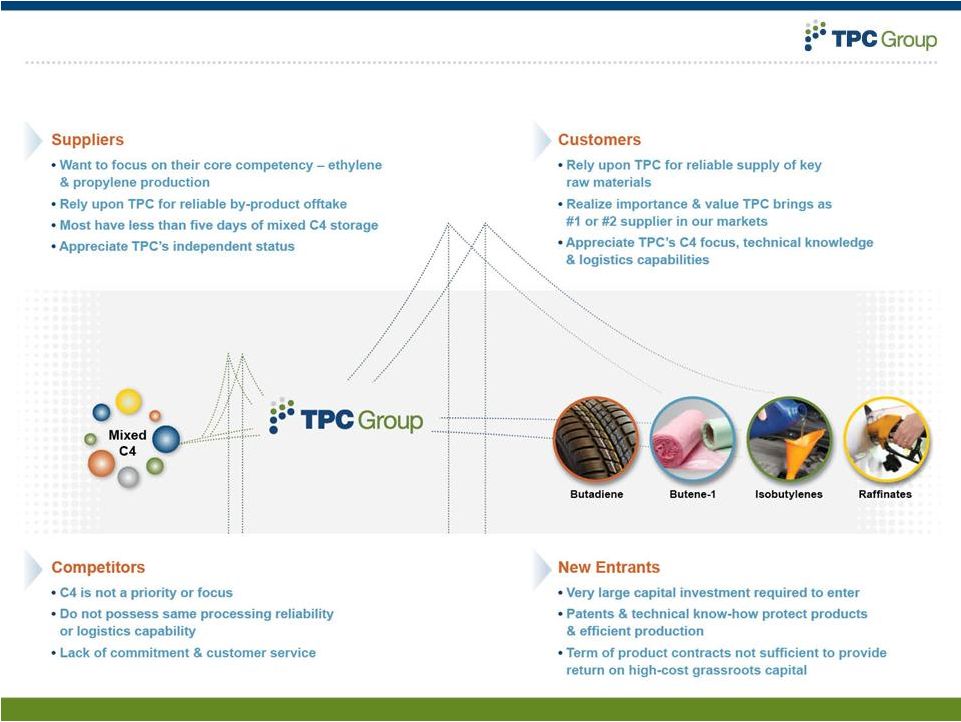
 Attractive Market Position in Consolidated Industry BB&T Capital Markets Commercial & Industrial Conference – March 24, 2010 9 |
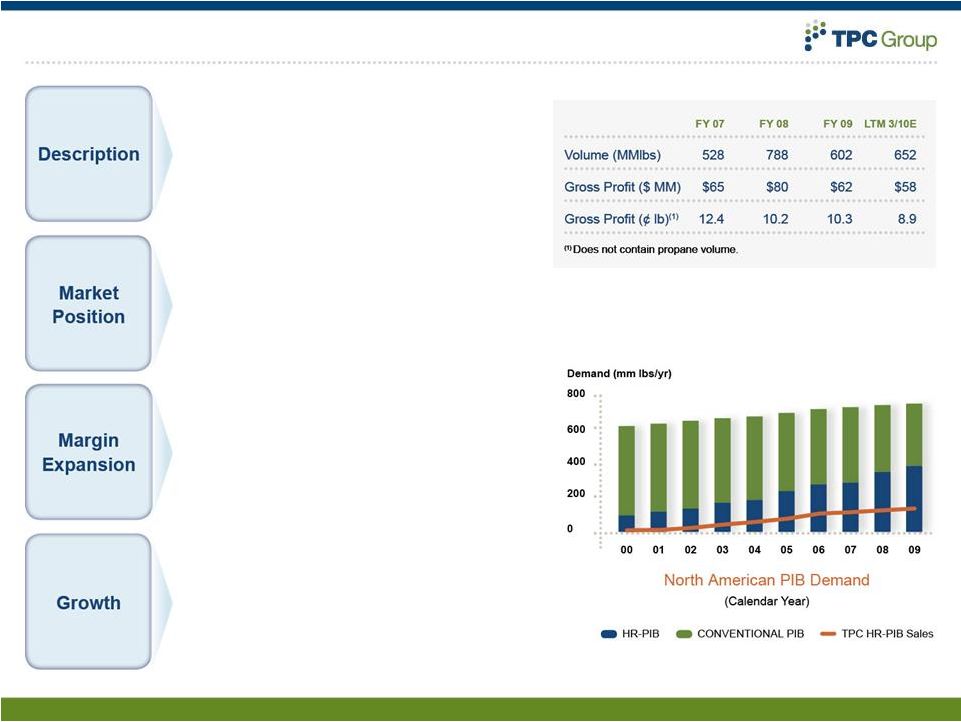 Performance Products – Poised for Growth BB&tal Markets Commercial & Industrial Conference – March 24, 2010 BB&T Capital Markets Commercial & Industrial Conference – March 24, 2010 10 • Products: PIB, HPIB, DIB, Nonene, Tetramer • Suppliers: C4 Processing, LyondellBasell, BP, Others • Customers: Afton, SI Group, Lanxess, Others • Profitability model: index-based contracts • Only merchant producer of HR-PIB in North America • Patent protected technology (PIB) • Second largest merchant HPIB producer, 90+% market share of DIB market • Only dedicated Nonene & Tetramer production plant in North America • Merchant HPIB player exited market • Strong alternative value for Isobutylenes • Operating ramp-up & efficiency gains for Nonene plant • Second HR-PIB plant on-line in early 2009, with market expanding • Increasing HPIB & Nonene sales • Additional product lines from upgrading by-products |
 Financials – Past Performance BB&T Capital Markets Commercial & Industrial Conference – March 24, 2010 11 |
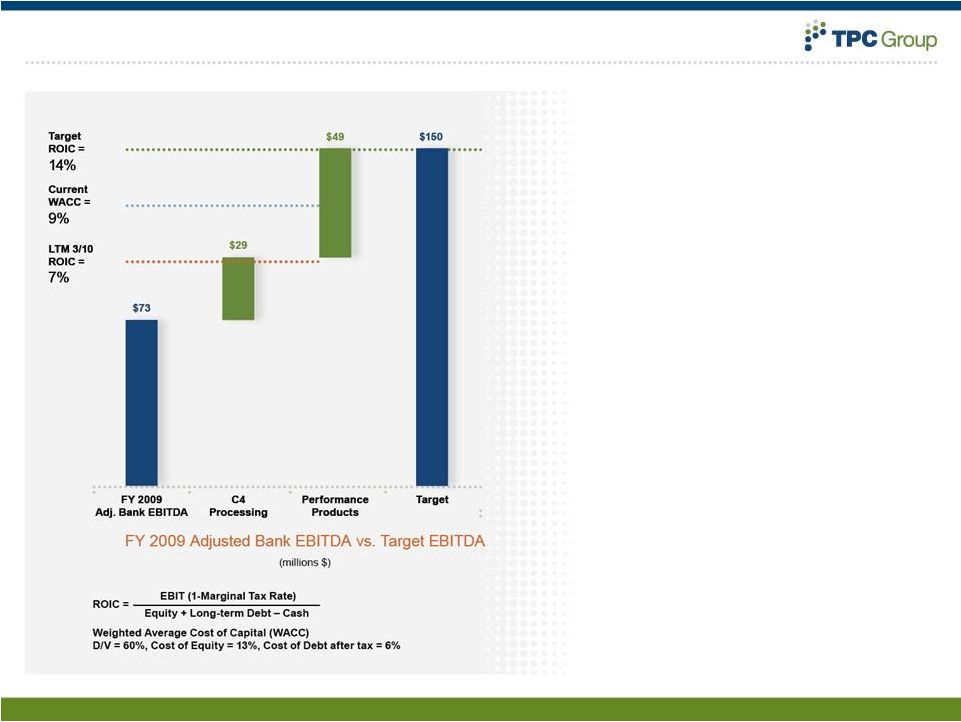 Financials – Target BB&T Capital Markets Commercial & Industrial Conference – March 24, 2010 12 • Target EBITDA levels allow the company to earn in excess of WACC • C4 processing driven by margin expansion from favorable market conditions and reliable supply • Performance products driven by volume and margin expansion – Recent capital investments in Polyisobutylene and Propylene Derivatives |
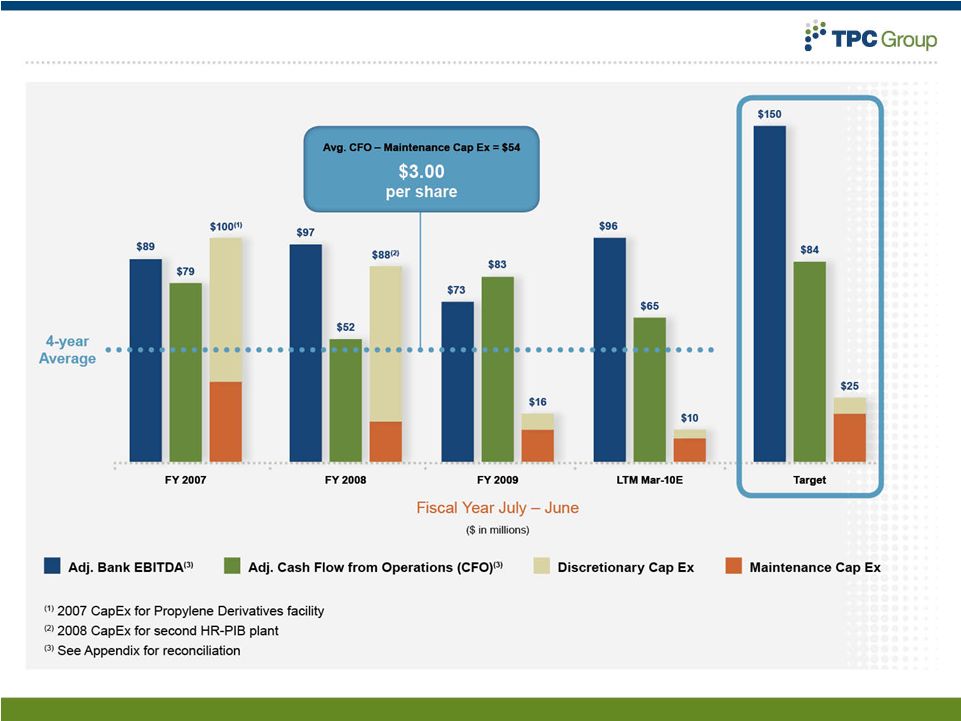
 Significant & Stable Free Cash Flow A Valuable, Unique and Stable Bridge BB&T Capital Markets Commercial & Industrial Conference – March 24, 2010 13 |
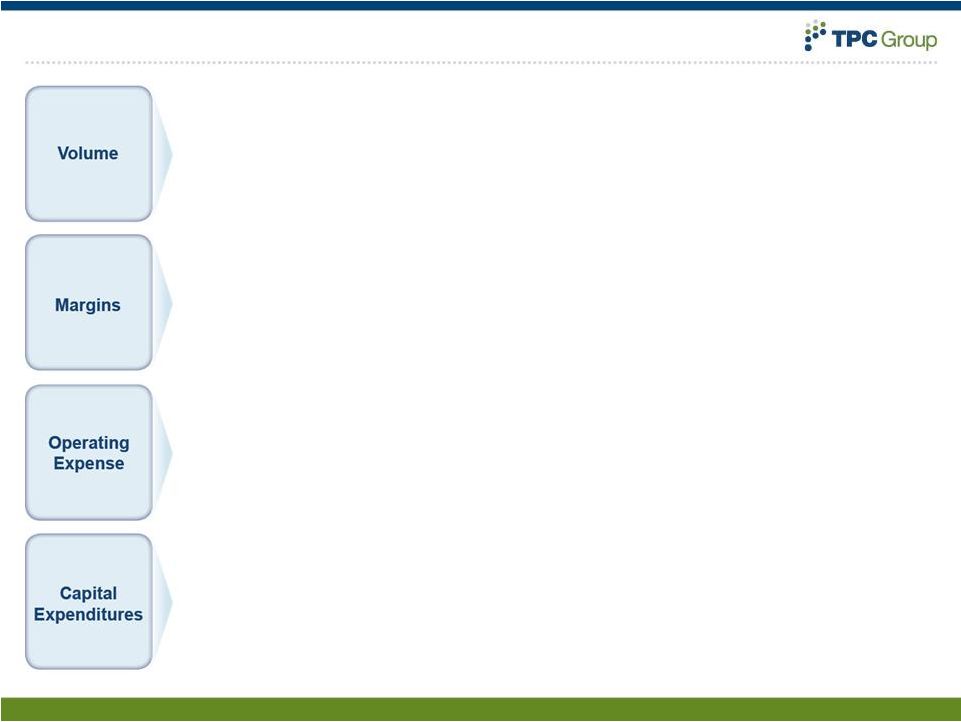 Outlook – Positioned for Margin Expansion & Growth BB&T Capital Markets Commercial & Industrial Conference – March 24, 2010 14 • C4 Processing – Expect long-term volumes to be stable, with opportunistic upside should heavier cracking return • Performance Products – Steady volume growth, particularly with polyisobutylene as we fill out sales of our new plant capacity • Differentiated business model allows for continued growth • Light cracking has tightened Mixed C4 product markets • Increased usage of highly reactive polyisobutylene allows for margin expansion • Strong focus on operational excellence and cost management • Wide production flexibility with minimal impact on operating expense • Expect operating costs to be level, as cost reduction efforts offset inflation
• Maintenance CapEx predictable and within historical range of $20–25 MM/Yr • No material impact expected from potential changes within the regulatory
environment • Many organic, low-risk discretionary projects that should provide high return on
investment over next several years if we choose to execute
|
 Why
TPC Group? Why Now? • Differentiated Business Model – Service-based intermediary with strong infrastructure & logistics network
– Long-standing, service-based contracts limit exposure to commodity prices
• Substantial and Strategic Asset Value – TPC asset-based services are a critical component of the ethylene supply
chain – High replacement value is strong barrier to entry • Attractive Market Position in Consolidated Industry – #1 position in BD, B-1, DIB and HR-PIB – Contractually aligned with cost-advantaged “light” ethylene producers • Positioned for Margin Expansion and Growth – Market dynamics allow for increased margins – Recent capital investment projects now complete • Significant and Stable Free Cash Flow – Minimal maintenance CapEx & cost-efficient capital structure – Strong cash generation throughout cycle (average of $3.00/share over last four
years) • Large Valuation Gap – Business model stabilizes unit margins – TPC Group’s trading position at a low multiple of EBITDA BB&T Capital Markets Commercial & Industrial Conference – March 24, 2010 15 |
 Investor Presentation – March 2010 Appendix |
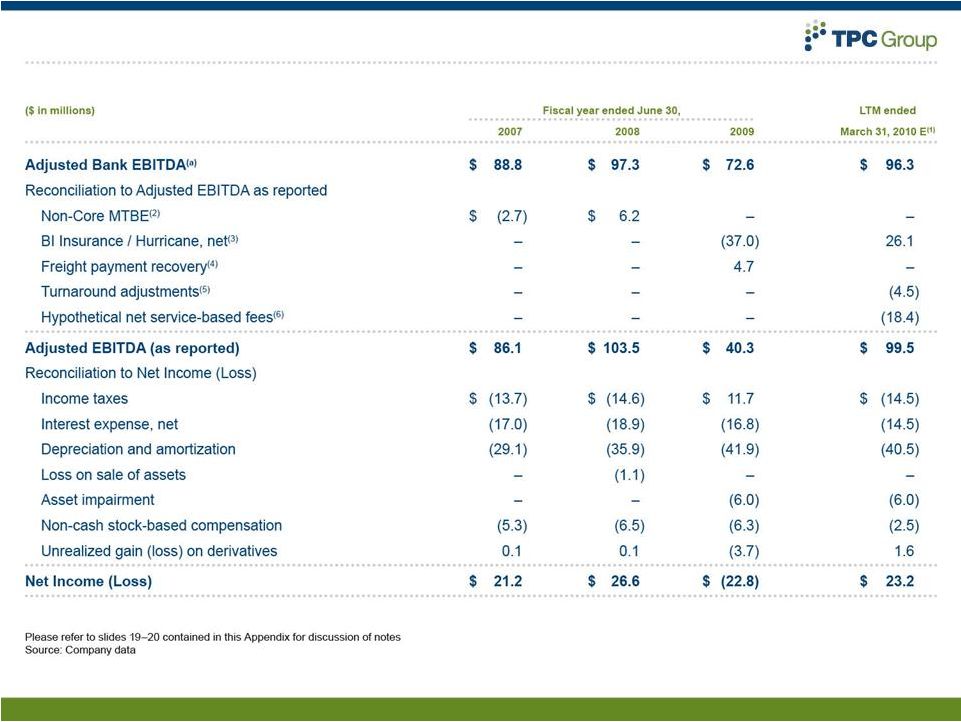 Reconciliation of Adjusted Bank EBITDA to Net Income BB&T Capital Markets Commercial & Industrial Conference – March 24, 2010 17 |
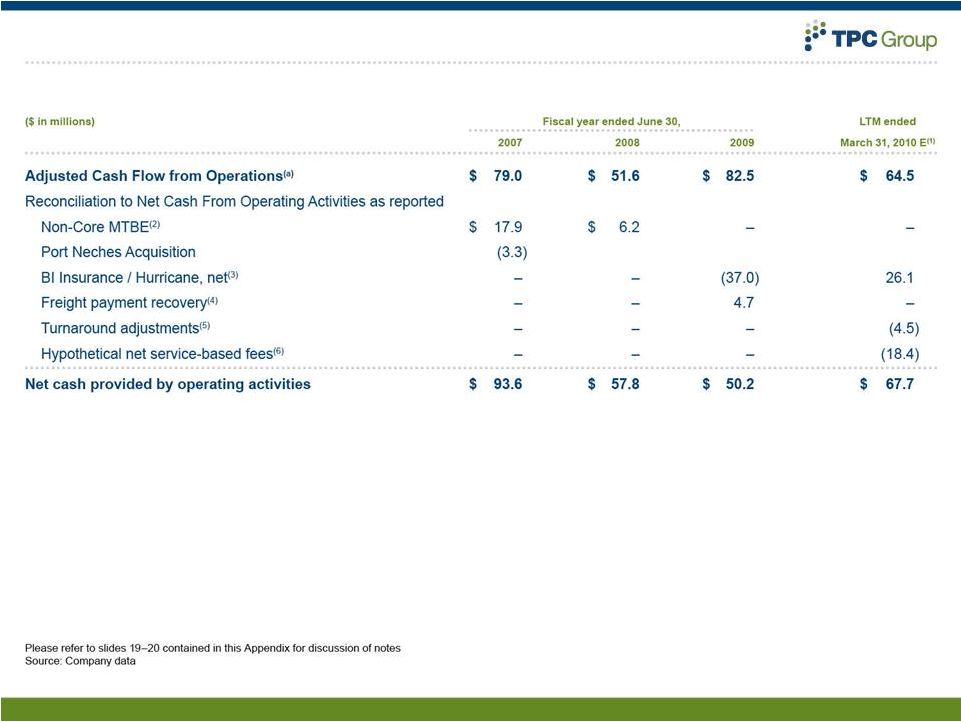 Reconciliation of Cash Flows BB&T Capital Markets Commercial & Industrial Conference – March 24, 2010 18 Adjusted Cash Flow from Operations to Net Cash Provided by Operating Activities
|
 Notes to EBITDA and Cash Flow Reconciliations BB&T Capital Markets Commercial & Industrial Conference – March 24, 2010 19 Adjusted Bank EBITDA is included in this presentation to provide investors with a view of the TPC Group’s financial performance as adjusted to exclude certain items that might affect the
comparability of results, and to hypothetically reflect recent financial
improvements in results for prior periods. Adjusted Bank EBITDA is not
reflective of actual results, and therefore should not be unduly relied upon. Adjusted Bank EBITDA is not a measure computed in accordance with GAAP. Accordingly it does not represent cash flow
from operations, nor is it intended to be presented herein as a substitute
to operating income or net income as indicators of our operating
performance. The reconciliation provided above is to Adjusted EBITDA (as reported), another non- GAAP measure. Adjusted EBITDA is reconciled to net income, the most directly comparable
GAAP financial measure, on slide 17. Adjusted Bank EBITDA is not calculated
in accordance with the definition of “Consolidated EBITDA”
in the credit facilities. 1.Estimated projected financial information for the twelve months ended March 31, 2010
is based on the current belief of TPC based on currently available
information as to the outcome and timing of future events and assumptions
that TPC believes are reasonable. The assumptions underlying the estimated projected financial information are inherently uncertain and are subject to significant business, economic,
regulatory and competitive risks and uncertainties that could cause actual
results to differ materially from those TPC anticipates. If the assumptions
are not realized, the actual financial results could be substantially different than that currently expected. When reading this information, you should keep in mind the risk
factors and other cautionary statements included in TPC’s filings with the SEC, including the Amendment No. 1 to its Registration Statement on
Form 10 filed on January 8, 2010. TPC does not undertake any obligation to
release publicly the results of any future revisions TPC may make to the
projections or to update the projections to reflect events or circumstances after the date of this presentation. Therefore, you are cautioned not to place undue
reliance on this information. 2.Adjustment reflects that TPC has managed its
MTBE business as a non-core business since fiscal 2005. With the
completion of the isobutylene processing unit in the first quarter of fiscal 2008, TPC idled its Houston dehydrogenation units and stopped production of MTBE from those units. Subsequent to the
dehydrogenation units being idled, MTBE has been produced only from TPC’s C4 processing activities at significantly reduced volumes, and is used either as a feedstock to the Performance Products segment or sold
opportunistically into overseas markets. From third quarter of fiscal 2008
forward, MTBE revenues and operating results are included in the C4
Processing segment category for reporting purposes. |
 Notes to EBITDA and Cash Flow Reconciliations (continued)
BB&T Capital Markets Commercial & Industrial Conference – March 24, 2010 20 3. Based on total net business insurance claim of $47.0 million, comprised of (a) $19.5
million deductible, (b) $10.0 million cash recovery received in June 2009
and (c) $17.5 million cash recovery received in December 2010. Adjustment of
$37.0 million in FY2009 period reflects total net business insurance claim of $47.0 million less $10.0 million cash recovery received in June 2009. Negative
adjustment of $26.1 million in LTM period ending 3/31/10 reflects $10.0
million cash recovery received in June 2009 plus $17.1 cash recovery (net of
fees) received in December 2010 less $1.0 million of hurricane-related repairs completed during the period. This adjustment has been made to enhance the comparability of operating results
by excluding items that are nonrecurring or for which the timing and/or
amount cannot reasonably be estimated. 4. Adjustment reflects recovery of $4.7 million from restitution of freight payments. This adjustment has been made to enhance the comparability of operating results by excluding items that are
nonrecurring or for which the timing and/or amount cannot reasonably be
estimated. 5. Adjustment adds back $4.3 million of Adjusted EBITDA (or Adjusted Cash Flow from
Operations) estimated to have resulted from reduced contracted sales volumes
due to a turnaround at our Houston facility in February 2010, plus
additional estimated losses of $0.2 million as a result of tolling fees for processing of feedstock due to the turnaround. This adjustment has been made to illustrate what TPC’s operating performance might have been had the turnaround not been undertaken; note, however, that turnarounds typically occur every three to four years at TPC’s facilities, and their exclusion from this calculation is not intended to suggest that
they will not occur again in future periods. 6. In January and February 2010, TPC’s average monthly net service-based fees increased relative to prior months. This adjustment applies the higher average fees from January and February 2010
to prior months in the LTM period, in order to hypothetically illustrate what TPC’s performance would have been had these higher average fees actually been achieved throughout the period. The adjustment
is calculated as (a) $31.1 million, reflecting the actual January and
February average multiplied by nine (for the nine months from and including
April 2009 to December 2009), less (b) $12.7 million, the actual amount of service-based fees for the April - December 2009 period (which was already included in estimated Adjusted EBITDA). This adjustment has been made to illustrate the effect of TPC’s recently improved service-based fees on Adjusted EBITDA in prior periods, but it is not intended to suggest that these fees were achieved
or could have been achieved in prior periods, or will continue to be
achieved in future periods. The adjustment is for illustrative purposes only
and is not reflective of actual results; accordingly, you are cautioned not to place undue reliance upon it. |