Attached files
| file | filename |
|---|---|
| EX-23.1 - EX-23.1 - TECHWELL INC | a2197105zex-23_1.htm |
| EX-32.1 - EX-32.1 - TECHWELL INC | a2197105zex-32_1.htm |
| EX-21.1 - EX-21.1 - TECHWELL INC | a2197105zex-21_1.htm |
| EX-32.2 - EX-32.2 - TECHWELL INC | a2197105zex-32_2.htm |
| EX-31.2 - EX-31.2 - TECHWELL INC | a2197105zex-31_2.htm |
| EX-31.1 - EX-31.1 - TECHWELL INC | a2197105zex-31_1.htm |
Use these links to rapidly review the document
Table of Contents
ITEM 8. Financial Statements and Supplementary Data
UNITED STATES
SECURITIES AND EXCHANGE COMMISSION
WASHINGTON, D.C. 20549
FORM 10-K
| (Mark one) | ||
ý |
ANNUAL REPORT PURSUANT TO SECTION 13 OR 15(d) OF THE SECURITIES EXCHANGE ACT OF 1934 |
|
For the fiscal year ended December 31, 2009 |
||
OR |
||
o |
TRANSITION REPORT PURSUANT TO SECTION 13 OR 15(d) OF THE SECURITIES EXCHANGE ACT OF 1934 |
|
For the transition period from to |
||
Commission file number 000-52014
TECHWELL, INC.
(Exact name of Registrant as specified in its charter)
| Delaware (State or other jurisdiction of incorporation or organization) |
77-0451738 (I.R.S Employer Identification No.) |
|
408 E. Plumeria Drive San Jose, California (Address of principal executive offices) |
95134 (Zip Code) |
Registrant's telephone number, including area code: (408) 435-3888
Securities registered pursuant to Section 12(b) of the Act:
| Title of each class: | Name of each exchange on which registered | |
|---|---|---|
| Common Stock, par value $0.001 per share | The NASDAQ Stock Market LLC |
Securities registered pursuant to section 12(g) of the Act:
| |
(Title of class) | |
||
|---|---|---|---|---|
| None |
Indicate by check mark if the registrant is a well-known seasoned issuer, as defined in Rule 405 of the Securities Act. o Yes ý No
Indicate by check mark if the registrant is not required to file reports pursuant to Section 13 or Section 15(d) of the Act. o Yes ý No
Indicate by check mark whether the registrant (1) has filed all reports required to be filed by Section 13 or 15(d) of the Securities Exchange Act of 1934 during the preceding 12 months (or for such shorter period that the registrant was required to file such reports), and (2) has been subject to such filing requirements for the past 90 days. ý Yes o No
Indicate by check mark whether the registrant has submitted electronically and posted on its corporate website, if any, every Interactive Data File required to be submitted and posted pursuant to Rule 405 of Regulation S-T (§ 232.405 of this chapter) during the preceding 12 months (or for such shorter period that the registrant was required to submit and post such files) o Yes o No
Indicate by check mark if disclosure of delinquent filers pursuant to Item 405 of Regulation S-K (§229.405 of this chapter) is not contained herein, and will not be contained, to the best of registrant's knowledge, in definitive proxy or information statements incorporated by reference in Part III of this Form 10-K or any amendment to this Form 10-K. ý
Indicate by check mark whether the registrant is a large accelerated filer, an accelerated filer, a non-accelerated filer or a smaller reporting company. See definition of "large accelerated filer", "accelerated filer" and "smaller reporting company" in Rule 12b-2 of the Exchange Act.
| Large Accelerated filer o | Accelerated filer ý | Non-Accelerated filer o (Do not check if a smaller reporting company) |
Smaller Reporting Company o |
Indicate by check mark whether the registrant is a shell company (as defined in Rule 12b-2 of the Act). o Yes ý No
The aggregate market value of the registrant's common stock held by non-affiliates of the registrant, based upon the closing price of a share of the registrant's common stock on June 30, 2009 as reported by the NASDAQ Global Market on that date, was $134,229,739.
Number of shares of the registrant's common stock outstanding as of February 28, 2010: 22,133,012, at $0.001 par value.
DOCUMENTS INCORPORATED BY REFERENCE
Items 10 (as to directors, audit committee financial expert and Section 16(a) Beneficial Ownership Reporting Compliance), 11, 12, 13 and 14 of Part III of this Annual Report on Form 10-K incorporate by reference information from the Registrant's proxy statement to be filed with the Securities and Exchange Commission within 120 days of the fiscal year ended December 31, 2009 in connection with the solicitation of proxies for the Registrant's 2010 Annual Meeting of Stockholders.
2
This Annual Report on Form 10-K contains forward-looking statements that involve risks and uncertainties. These statements relate to future periods, future events or our future operating or financial plans or performance. These statements can often be identified by the use of forward-looking terminology such as "expects," "believes," "intends," "anticipates," "estimates," "plans," "may," or "will," or the negative of these terms, and other similar expressions. These forward-looking statements include statements as to the source of our revenue, our ability to generate revenue, our ability to sustain our growth rate and profitability, expected growth in our target markets and application-specific products, our expectation regarding the increase in certain expenses, our cash needs, our capital requirements, our market risk sensitivity, our business and product strategies, our anticipated tax rate, industry trends and our anticipation that developments in our technologies and new products will increase our target market share.
These forward-looking statements reflect our current views with respect to future events, are based on assumptions and are subject to risks and uncertainties. These risks and uncertainties could cause actual results to differ materially from those projected and include, but are not limited to, fluctuations in our revenue and operating results, our ability to sustain profitability, the demand for our products in our target markets, our ability to compete, our dependence on key and highly skilled personnel, the ability to develop new products and to enhance our existing products, the continued seasonality of our business due to our target markets and location of our customers, our ability to integrate businesses that we may acquire, our ability to estimate and predict customer demand, economic volatility in either domestic or foreign markets, the impact of any change in United States federal income tax laws and the loss of any beneficial tax treatment that we currently enjoy, our reliance on independent foundries and subcontractors for the manufacture, assembly and testing of our products, the length of our sales cycle and reliance on distributors, our ability to protect our intellectual property, the cyclical nature of the semiconductor industry, our ability to raise capital, the potential volatility of our stock, the outcome of future litigation and the other risks set forth under Item 1A. "Risk Factors." Given these risks and uncertainties, you should not place undue reliance on these forward-looking statements. Except as required by federal securities laws, we undertake no obligation to update any forward-looking statements for any reason, even if new information becomes available or other events occur in the future.
In this report all references to "Techwell," "we," "us" or "our" mean Techwell, Inc.
Techwell is our registered trademark. We also refer to trademarks of other corporations and organizations in this Form 10-K.
We are a fabless semiconductor company that designs, markets and sells mixed signal integrated circuits for two primary markets, security surveillance and automotive infotainment. We design application-specific products for these markets that enable the conversion of analog video signals to digital form and perform advanced digital video processing to facilitate the display, storage and transport of video content. We believe this application-specific product strategy allows us to better address varying customer requirements and fully leverage our technology capabilities within our two core markets. Our semiconductors are based on our proprietary architecture and mixed signal technologies that we believe provide high video quality under a wide range of signal conditions, enable high levels of integration and are cost-effective.
3
Growth in Video Applications Based on Digital Technology
Video applications based on digital technology are experiencing rapid growth in the security surveillance and automotive infotainment markets. This growth is largely attributable to significant improvements in the user experience, including enhanced video quality, increased functionality and reduced form factors as well as the lower cost of such systems.
The security surveillance market is comprised of systems that receive video from multiple surveillance cameras. Security surveillance systems are increasingly incorporating digital technologies that provide advanced functionalities such as video motion detection, hard disk drive storage, intelligent video content analysis and remote monitoring over the Internet. In addition, a heightened focus on security and declining system prices are driving increased demand for security surveillance systems.
Applications such as navigation, DVD entertainment, enhanced driver information systems and backup cameras are causing the proliferation of in-car LCD displays in the automotive infotainment market. These displays are capable of displaying video and graphics signals from a variety of sources, including navigation systems, DVDs, game consoles, TV tuners and cameras. In addition to being incorporated into new automobiles by manufacturers, these systems are also increasingly being purchased by consumers in the aftermarket.
The Complexity of Video
To display, store and transport video content, digital video applications receive analog video signals based on multiple standards from a variety of sources. For example, a security surveillance system receives analog video signals from multiple surveillance cameras for storage on a hard disk drive, display on a TV or PC monitor or transport over the Internet. In addition, an in-car LCD display typically receives analog signals from navigation systems, DVDs, game consoles, TV tuners and cameras.
Video sources such as security surveillance cameras, DVD players, and game consoles generate video signals that conform to popular analog video standards such as composite, S-video, component and Syndicate of Radio and Television Manufacturers, or SCART. However, these sources may generate video signals that are off-specification or weak, both of which deteriorate video quality. Off-specification signals are signals that have been generated with slight variations to specifications under a particular standard. Weak signals are signals that conform to specifications but result in high levels of noise. Digital video applications must support these standard analog video signals, even if they are off-specification or weak, without sacrificing video quality.
Opportunity for Mixed Signal Video Semiconductors
Mixed signal video semiconductors are critical components of digital video applications and enable the conversion of standard analog video signals to digital form, even if they are off-specification or weak. In addition, these semiconductors incorporate advanced digital video processing to improve video quality and provide enhanced functionality. Designing these semiconductors requires an extensive knowledge of TV broadcast and popular analog video standards as well as significant digital video processing expertise and advanced analog design capability. We believe that semiconductor companies that possess the combination of these capabilities will benefit most from the growth in digital video applications.
Since our inception, we have internally developed the combination of technologies, expertise and capabilities necessary for the conversion and processing of video signals. We do not depend on third-
4
parties for any material technology, expertise or capability. We believe we have the following technology strengths:
Advanced Analog Design Capability. As a result of our advanced analog design capability, we have developed multiple technologies that enable analog video signals to be processed digitally. One of the key analog technologies we have developed internally is our high performance, cost-effective and low power analog front-end that conditions and converts analog video signals into a digital format. The multiple core functions performed within our analog front-end are anti-aliasing filtering, automatic gain control signal clamping and analog to digital conversion. Other key analog technologies we have developed internally are phase lock loops, high frequency and sigma delta analog to digital converters, video and audio digital to analog converters and low voltage differential signaling.
Advanced Digital Video Processing Technology. We have a proprietary video decoding architecture for decoding analog video. This architecture allows us to cost-effectively implement two dimension, or 2D, and three dimension, or 3D, comb filtering, color demodulating and sync processing, which are the key technologies required for high performance video decoding. Comb filtering enables improved video quality, while sync processing enables support of weak and off-specification signals. In addition, we have developed a number of digital technologies targeted at specific applications in the security surveillance and automotive infotainment markets. For example, we have developed deinterlacing, scaling and image enhancement algorithms, which are important technologies for displaying video signals in in-car LCD display and advanced TV applications. Similarly, we have developed multiplexing, motion detection, multiple picture-in-picture and motion JPEG compression technologies for security surveillance systems.
Expertise in TV Broadcast and Popular Analog Video Standards. Our focus on video has enabled us to develop expertise in analog TV broadcast and popular analog video signals, including off-specification and weak signals that are difficult to support. As a result, we have the extensive knowledge base required to perform the analog, mixed signal and digital processing necessary for the display, storage and transport of video signals. This is particularly important because no standards body exists to determine and qualify products developed to meet analog video standards.
Integrated Analog and Digital Technologies in a Standard CMOS Process. We integrate our advanced digital technologies with our analog technologies on a single semiconductor using a standard complementary metal-oxide semiconductor, or CMOS, process. We believe this provides us with performance, cost and power advantages over other processes such as bipolar.
We believe that the combination of the technology strengths listed above allows us to provide our customers with significant benefits, including:
High Performance. We enable our customers to achieve high video quality by limiting artifacts such as cross-color, crawling or dangling dots and stair-stepping or jagging that are commonly found when processing analog video signals. Our technology also enables our customers' products to support multiple standard signals, even if off-specification or weak, without sacrificing video quality. The result is high video quality under a wide range of signal conditions.
High Levels of Integration. We integrate our analog conversion and digital processing technologies into a single semiconductor. For example, in the security surveillance market, we integrate multiple video decoders and a system controller into a single highly integrated semiconductor, allowing for increased functionality and enabling our customers to reduce system-level costs significantly. Similarly, in the automotive infotainment market, we integrate a video decoder, display processor and a timing controller into a single semiconductor, also enabling our customers to reduce system-level costs.
5
Cost-effectiveness. Our proprietary video decoding architecture and our standard CMOS process design expertise allow us to reduce the number of transistors required to design semiconductors cost-effectively.
Our objective is to be the leading provider of high performance, cost-effective mixed signal semiconductors to the security surveillance and automotive infotainment markets. To achieve this objective, we expect to continue to pursue the following strategies:
Target Multiple High Growth Digital Video Applications. We address a number of digital video applications in the security surveillance and automotive infotainment markets that provide us with multiple high growth opportunities. Our products are incorporated into numerous security surveillance applications, including embedded digital video recorders, or DVRs, networked video recorders, or NVRs, and multiplexers. Our products are also incorporated into numerous automotive infotainment applications such as rear seat entertainment, front console navigation and rear view mirror displays.
Develop Additional Application-Specific Products. We provide our customers with application-specific products designed specifically to address the requirements of the specific market we target. These application-specific products integrate our video decoder with our advanced digital processing technologies and target the security surveillance and automotive infotainment markets. We believe that our application-specific product strategy allows us to better address varying customer requirements and fully leverage our technology capabilities. We plan to maintain and expand upon this product strategy in the future.
Develop New Technologies. We plan to continue to develop additional technologies to address evolving customer requirements. For example, we have expanded our research and development efforts and are developing H.264 encoding and decoding technologies, which are important functions for storing, displaying and networking video. Consistent with our product strategy, we intend to incorporate these H.264 encoding and decoding technologies into our application-specific products in the future.
We have also developed a new technology that will enable full high definition display using the existing coaxial infrastructure that currently enables standard definition display. We are now in the process of productizing the technology for use by customers supplying DVR and camera components to the security surveillance market.
Expand Customer Relationships. Our mixed signal semiconductors are used by over 100 companies in the security surveillance and automotive infotainment markets. We sell our semiconductors through sales and customer support personnel and sales and marketing offices in the United States, Japan, South Korea, Taiwan and China. We intend to continue to expand our sales, marketing and technical support capabilities to pursue additional design wins with our existing customers and to develop relationships with new customers in our target markets.
We design, market and sell mixed signal semiconductor products that enable the conversion of analog video signals to digital form and perform advanced digital video processing to facilitate the display, storage and transport of video content. Historically, we classified our initial products as general purpose products in that they serviced multiple markets. In the process of supplying products to these markets, we developed specific knowledge regarding the requirements for certain markets. We then concentrated our development efforts on video applications within a limited number of target markets. Today, our application-specific products include products specifically designed for security surveillance systems and automotive infotainment displays. We intend to continue to develop new generations of products for each of these application-specific product lines. To a lesser extent, we continue to design,
6
market and sell general purpose video decoders for applications in consumer products. Accordingly, we classify our products in three primary lines: security surveillance, automotive infotainment and consumer.
Security Surveillance. Our security surveillance products integrate important functions required to display, store and transport analog video signals from security surveillance cameras. For example, we integrate multiple video decoders into a single semiconductor. As a result, this semiconductor is able to receive and decode analog video signals from multiple cameras into a standard digital format. In addition, we integrate a multiplexer, a key technology required to combine multiple video signals into a single video signal, and a display processor, a key technology required to display multiple video channels. In December 2008, we introduced a new security surveillance product which includes a 16 channel multiplexer and supports the display of multiple standard definition and high definition video sources. We currently sell our security surveillance products to customers for use in numerous applications including DVRs, PC-based DVRs, NVRs and multiplexers.
Automotive Infotainment. Our automotive infotainment display products integrate important functions required to display popular analog video, high definition video and PC graphics signals on a LCD display. These key functions include a video decoder, deinterlacer and scaler. In addition, our newer generation LCD display products integrate a timing controller to interface directly with certain types of LCD displays and image enhancement functionality to improve overall video quality. In January 2008, we announced the introduction of five new LCD display processors designed for the automotive end market. These new products are designed to offer our customers a comprehensive set of capabilities including advanced image processing, an integrated programmable timing controller and multiple analog and digital video inputs.
Consumer. Our consumer video decoder products are high performance mixed signal semiconductors that decode analog TV broadcast signals, including NTSC, PAL and SECAM, and popular analog video signals, including composite, S-Video, component and SCART, into a standard digital format. Our video decoder products integrate proprietary sync processing, color demodulating and digital 2D and 3D comb filtering, which are the key technologies required for high performance video decoding. We offer a broad range of video decoder products at various price points and with varying features.
7
The following table summarizes the features and diverse applications of our primary product lines:
| Product Line | Key Features | Target Applications | ||
|---|---|---|---|---|
Security Surveillance |
• Integrates four NTSC and PAL video decoders |
Embedded DVR, PC based DVR, NVR and multiplexer | ||
Automotive Infotainment |
• Integrates NTSC, PAL, SECAM video decoder, deinterlacer,
scaler, timing controller and image enhancement |
In-car LCD display, including front console, rear seat and rear view mirror displays | ||
Consumer |
• Supports NTSC, PAL and SECAM analog TV broadcast
formats |
Advanced TV, DVD recorder, multifunction LCD monitor, camcorders and PC peripherals including TV tuner cards and USB TV boxes | ||
Our other products include early generation mixed signal semiconductors for digital video applications and a PCI video decoder product, which is a video decoder that utilizes peripheral component interconnect, or PCI, technology for personal computer applications.
We have several core competencies that enable us to design important analog, mixed signal and digital technologies that can be implemented across our application-specific product lines. Over the last ten years, we have internally developed the combination of technologies, expertise and capabilities necessary for the conversion and processing of video signals. We do not depend on third-parties for any material technology, expertise or capability.
We have developed a proprietary high performance and cost-effective video decoder technology that receives and converts various analog video signals, including TV broadcast, composite video, S-video, component and SCART, into a standard digital format. Our video decoder uses both analog and digital circuitry. Our video decoder uses our high performance, cost-effective and low power analog front-end for signal conditioning and sampling the analog signal into digital format. It uses our advanced digital processing circuitry, including a 2D and 3D comb filter, a color demodulator and a sync processor for deciphering the raw digital stream into the four principal components: luminance,
8
U, V and synchronization. These are important technologies required for high performance video decoding. Comb filtering is a technique for separating TV broadcast and composite video signals into luminance and modulated chrominance. Our advanced comb filter provides separation resulting in high-resolution image with minimal visible artifacts such as cross color and crawling or dangling dots. Our color demodulator converts the modulated chrominance signals based on NTSC, PAL and SECAM standards and sub-standards into baseband U and V components. Our sync processor extracts the vertical and horizontal synchronization information from the video stream, which is required for the display device to reconstruct the original video content. Both our advanced color demodulator and our advanced sync processor are critical to our decoder's ability to support off-specification and weak signals.
We have expertise in analog TV broadcast and popular analog video standards. These standards typically define video signal characteristics such as line period, field rate, signal amplitude, chrominance modulation scheme and frequency, among others. Notwithstanding the existence of standards, terrestrial TV stations and video applications such as TVs, VCRs, DVD players, game consoles, camcorders and security cameras sometimes generate signals that are off-specification due to their mechanical nature or other characteristics. In addition, these video sources sometimes contain noise from interference, additional modulation/de-modulation processing or RF transmission. These variations in signal standards and signal strength create significant challenges for original equipment manufacturers, or OEMs, and, in turn, semiconductor companies. To deal with these challenges, we believe these semiconductor companies require expertise in analog TV broadcast and popular analog video standards to assure manufacturers that their products can support these signals, even if they are off-specification or weak.
We design semiconductors that receive an analog signal, convert the analog signal to a digital signal represented by ones and zeroes and then use digital circuitry to process the signal. Using digital circuitry to process analog video signals allows us to achieve high performance video, integrate more functionality and reduce costs. As a result, we combine analog functionality on the same semiconductor substrate with digital functionality. Digital circuits perform high speed switching between logic states that generate transients known as electromagnetic interference as well as electrical noise on the substrate and on the power bus. By contrast, analog circuits are extremely sensitive to noise. There are significant design and development challenges involved in mixing noisy digital circuits with noise-sensitive analog circuits on the same semiconductor substrate. Our design engineers are skilled at solving these problems to achieve high quality video performance on a mixed signal semiconductor.
We have also developed a technology that will enable full high definition display using the existing coaxial infrastructure that currently enables standard definition display. We are now in the process of productizing the technology for use by customers supplying DVR and camera components to the security surveillance market.
We principally sell our products to distributors who, in turn, sell to OEMs, original design manufacturers, or ODMs, contract manufacturers and design houses. In addition, we sell our products, though to a lesser extent, directly to OEMs and ODMs. ODMs typically design and manufacture electronic products to sell to OEMs. In 2009, 2008 and 2007, our largest customers have been distributors, who typically support multiple OEMs and ODMS. In 2009, 2008 and 2007, our largest customer was Lacewood International Corporation, or Lacewood, our largest distributor in China, who accounted for 35%, 34% and 22% of our revenue, respectively. Our agreements to sell our products through distribution channels generally provide for a non-exclusive right to sell, and to promote and develop a market for our products in a specified geographic area. These agreements generally may be terminated by either party on 30 days notice and do not require price protection. Our direct sales to OEMs and ODMs are accomplished through purchase orders.
9
Substantially all of our sales are to customers in Asia, which sales accounted for approximately 97%, 98% and 98% of our revenue in 2009, 2008 and 2007, respectively. The table below indicates the percentage of total revenue by geographic location for the periods indicated:
| |
Year Ended December 31, |
||||||||||
|---|---|---|---|---|---|---|---|---|---|---|---|
| |
2009 | 2008 | 2007 | ||||||||
China |
54 | % | 37 | % | 26 | % | |||||
South Korea |
21 | 27 | 29 | ||||||||
Taiwan |
16 | 29 | 40 | ||||||||
Japan |
6 | 5 | 3 | ||||||||
Other |
3 | 2 | 2 | ||||||||
Total revenue |
100 | % | 100 | % | 100 | % | |||||
We sell our products worldwide through multiple channels, utilizing our direct sales force and applications engineering staff and our network of domestic and international independent distributors as well as OEMs and ODMs who are supported by our independent sales representatives. Each of these sales channels is supported by our customer service and marketing organizations. We have marketing and customer support personnel in the United States as well as China, Japan, South Korea and Taiwan. We intend to expand our sales and support capabilities and our network of independent distributors and sales representatives in key regions domestically and internationally.
Our sales cycle typically ranges from six to 24 months. We work directly with system designers to create demand for our semiconductors by providing them with application-specific product information for their system design, engineering and procurement groups. We actively engage these groups during their design processes to introduce them to our semiconductors. We endeavor to design our products to meet anticipated, increasingly complex and specific design requirements, but which will also support widespread demand for the products and future enhancements to them. If successful, this process culminates in a system designer deciding to use our products in their system, which we refer to as a design win. Once our product is accepted and designed into an application, the system designer is likely to continue to use the same or enhanced versions of our product across a number of their models, which tends to extend the life cycles of our product. If we fail to achieve an initial design win, we may lose the opportunity for sales to a customer for a number of its products and for a lengthy period of time.
Our sales are made primarily pursuant to standard individual purchase orders. Our backlog consists of orders that we have received from customers that have not yet shipped. Historically, management has not used backlog as an indicator of future business. As our order lead times may vary and as industry practice allows customers to reschedule or cancel orders on relatively short notice, we believe that backlog is not necessarily a good indicator of future sales. In addition, a substantial portion of our quarterly revenue typically depends on orders booked and shipped in that quarter.
Our research and development efforts are focused on the development of new technologies for our application-specific product lines. As of December 31 2009, we had 114 persons engaged in research and development. Our research and development expense was $19.6 million, $17.1 million and $12.3 million in 2009, 2008 and 2007, respectively.
10
We seek to protect our proprietary technology, documentation and other written materials primarily under trade secret and copyright laws. We also typically require employees and consultants with access to our proprietary information to execute confidentiality agreements. The steps taken by us to protect our proprietary information may not be adequate to prevent misappropriation of our technology.
Although we rely primarily on trade secret laws and contractual restrictions to protect the technology in the semiconductors we currently design and market, our success and ability to compete in the future may also depend to a significant degree upon obtaining and enforcing patent protection for our video decoding architecture and other mixed signal technologies. As of December 31, 2009, we had two issued patents and eleven patent applications pending in the United States and seven patent applications pending in foreign jurisdictions. These patents and patent applications cover aspects of the technology in the semiconductors we currently design and market, including a patent for our video decoding architecture. Our issued patents have expiration dates ranging from January 9, 2029 to November 11, 2029. Patents that we currently own do not cover all of the semiconductors that we presently design and market. Our present and future patents may provide only limited protection for our technology and may not be sufficient to provide competitive advantages to us. For example, competitors could be successful in challenging any issued patents or, alternatively, could develop similar or more advantageous technologies on their own or design around our patents.
The laws of other countries in which we market our semiconductors, such as some countries in the Asia/Pacific region, may offer little or no protection for our proprietary technologies. Reverse engineering, unauthorized copying or other misappropriation of our proprietary technologies could enable third-parties to benefit from our technologies without paying us for doing so. Any inability to protect our proprietary rights could harm our ability to compete, generate revenue and grow our business.
We may be required to resort to litigation to enforce our intellectual property rights. We may also be subject to legal proceedings and claims relating to our intellectual property in the ordinary course of our business. Intellectual property litigation is expensive and time-consuming and could divert management's attention away from running our business. This litigation could also require us to pay substantial damages to the party claiming infringement, stop selling products or using technology that contains the allegedly infringing intellectual property, develop non-infringing technology or enter into royalty or license arrangements.
We do not own or operate a semiconductor fabrication, packaging or testing facility. We depend on third-party vendors to manufacture, package and test our products. By outsourcing manufacturing, we are able to avoid the cost associated with owning and operating our own manufacturing facility. This allows us to focus our efforts on the design and marketing of our products.
Semiconductor Fabrication. We currently outsource our semiconductor manufacturing primarily to Taiwan Semiconductor Manufacturing Company, or TSMC. We work closely with TSMC to forecast on a monthly basis our manufacturing capacity requirements. Our semiconductors are currently fabricated in several advanced, sub-micron manufacturing processes. Because finer manufacturing processes lead to enhanced performance, smaller silicon chip size and lower power requirements, we continually evaluate the benefits and feasibility of migrating to smaller geometry process technologies in order to reduce cost and improve performance. Our products are manufactured using CMOS process technology. The processes we select permit us to engage independent silicon foundries to fabricate our integrated circuits. By subcontracting our manufacturing requirements, we can focus our resources on design and test applications where we believe we have greater competitive advantages. This strategy
11
also eliminates the high cost of owning and operating semiconductor wafer fabrication facilities. Nevertheless, because we do not have a formal, long-term pricing agreement with TSMC, our wafer costs and services are subject to sudden price fluctuations based on the cyclical demand for semiconductors. Our engineers work closely with TSMC to increase yields, lower manufacturing costs and improve quality. Our operations and quality engineering teams closely manage the interface between manufacturing and design engineering. As a result, we are responsible for the complete functional and parametric performance testing of our devices, including quality. We employ an operations and quality organization to work very closely with our semiconductor wafer manufacturers. We also arrange with our foundries to have online work-in-process control.
Assembly and Test. Our products are shipped from our semiconductor manufacturers to third-party sort, assembly and test facilities where they are assembled into finished semiconductors and tested. We outsource all packaging and testing of our products to assembly and test subcontractors, primarily to Advanced Semiconductor Engineering, Inc., or ASE, in Taiwan. Our products are designed to use low cost, standard packages and be tested with widely available test equipment. We have also qualified and retained additional vendors to assemble and test our semiconductors.
Quality Assurance. We focus on product reliability from the initial stage of the design cycle through each specific design process, including layout and production test design. We prequalify each assembly and foundry subcontractor. This prequalification process consists of a series of industry standard environmental product stress tests, as well as an audit and analysis of the subcontractor's quality system and manufacturing capability. We also participate in quality and reliability monitoring through each stage of the production cycle by reviewing electrical and parametric data from our wafer foundry and assembly subcontractors. We closely monitor wafer foundry production to ensure consistent overall quality, reliability and yield levels.
All of our principal independent foundries and package assembly facilities are currently ISO 9001 certified.
The market in which we operate is extremely competitive, and is characterized by rapid technological change, continuously evolving customer requirements and declining average selling prices. We may not be able to compete successfully against current or potential competitors. We compete with numerous domestic and international semiconductor manufacturers and designers, including NXP, Inc. (formerly Philips Semiconductors), Texas Instruments Inc., MStar Semiconductor Inc., Conexant Systems Inc. and Nextchip Company Ltd. Most of our current and potential competitors have longer operating histories, significantly greater resources and name recognition and a larger base of customers than we do. This may allow them to respond more quickly than us to new or emerging technologies or changes in customer requirements. Some of our competitors currently offer product features or technologies that we do not currently offer but intend to sell in the future. We must, therefore, compete against competitors that have more experience in developing and selling products and technologies that we do not currently offer but intend to offer in the future. Some of our competitors also use smaller geometry process technologies in their products, which can result in better manufacturing yields and decreased costs. In addition, these competitors may have greater credibility with our existing and potential customers. Many of our current and potential customers have their own internally developed semiconductor solutions, and may choose not to purchase products from third-party suppliers like us. Increased competition could harm our business, by, for example, increasing pressure on our profit margins or causing us to lose customers. In addition, delivery of products with defects or reliability, quality or compatibility problems may damage our reputation and competitive position.
12
Our ability to compete successfully depends on a number of factors, including:
- •
- performance and robustness;
- •
- functionality;
- •
- price and cost-effectiveness;
- •
- rapid time-to-market; and
- •
- customer service and support.
We believe we currently compete favorably with respect to these factors in the aggregate. However, we cannot assure you that our semiconductor products will continue to compete favorably or that we will be successful in the face of increasing competition from new products and enhancements introduced by existing competitors or new companies entering our market.
As of December 31, 2009, we employed 206 full-time employees, including 114 in research and development, 56 in sales, marketing and support, 19 in operations and 17 in general and administration. We have never had a work stoppage and none of our employees is represented by a labor organization or under any collective bargaining arrangements. We consider our employee relations to be good.
We were incorporated in California in 1997 and reincorporated in Delaware in 2006. The mailing address of our headquarters is 408 E. Plumeria Drive, San Jose, California 95134, and our telephone number at that location is (408) 435-3888. Our website is www.techwellinc.com. Through a link on the Investor Relations section of our website, we make available the following filings as soon as reasonably practicable after they are electronically filed with or furnished to the Securities and Exchange Commission, or SEC: our Annual Report on Form 10-K, Quarterly Reports on Form 10-Q, Current Reports on Form 8-K, and any amendments to those reports filed or furnished pursuant to Section 13(a) or 15(d) of the Securities Exchange Act of 1934. All such filings are available free of charge.
Executive Officers and Other Key Employees
The following table shows information about our executive officers and other key employees as of February 28, 2010:
Name
|
Age | Position | ||
|---|---|---|---|---|
| Fumihiro Kozato | 50 | President, Chief Executive Officer and Director | ||
| Mark Voll | 55 | Vice President of Finance and Administration and Chief Financial Officer | ||
| Dr. Feng Kuo | 52 | Senior Vice President and Chief Technical Officer | ||
| Dong Wook (David) Nam | 42 | Vice President of Sales and Marketing | ||
| Joe Kamei | 53 | Vice President of Operations |
Fumihiro Kozato founded Techwell in 1997 and has served as our president and chief executive officer since inception. From 1995 to 1996, Mr. Kozato was president of Sigmax Technologies, Inc., a CD-ROM controller chip development company. From 1991 to 1995, Mr. Kozato was the business control manager for Ricoh Co., Ltd, a global manufacturer of office automation equipment. Mr. Kozato holds a B.S. in mathematics from the University of California, Santa Barbara.
13
Mark Voll has served as our vice president of finance and administration and chief financial officer since November 2005. From December 2004 to July 2005, Mr. Voll served as the interim chief executive officer of Monolithic System Technology, Inc., a semiconductor intellectual property licensing company. From June 2002 to November 2005, Mr. Voll served as chief financial officer at Monolithic System Technology, Inc. From June 2000 to June 2002, Mr. Voll served as the chief financial officer for Axis Systems, Inc., a developer of semiconductor verification tools. Mr. Voll holds a B.S. in accounting from Providence College.
Dr. Feng Kuo has served as our vice president of engineering from 1998 to 2000, our chief technical officer since 2000 and our senior vice president and chief technical officer since 2009. From 1994 to 1996, Dr. Kuo was the vice president of engineering of Sigmax Technologies, Inc., a CD-ROM controller chip development company. From 1991 to 1994, Dr. Kuo was a design manager at S-MOS systems, a Seiko Epson Corporation affiliated company responsible for semiconductor development and silicon foundry service. Dr. Kuo holds a B.S. in electrical engineering from National Taiwan University and an M.S. and Ph.D. from Stony Brook University of New York.
Dong Wook (David) Nam has served as our vice president of sales and marketing since July 2005. From October 2002 to June 2005, Mr. Nam served as our director of sales and from January 2001 to February 2002, he served as our field applications engineer manager. From January 1994 to January 2001, Mr. Nam was a technical applications and marketing engineer at Samsung Electronics Co., Ltd., a large consumer electronics company. Mr. Nam holds a B.S. in electrical engineering from KyungPook National University in South Korea.
Joe Kamei has served as our vice president of operations since July 2007 and our director of operations from May 2000 to June 2006. From 1998 to 2000, Mr. Kamei was a manager at Kanematsu USA Inc., a Japanese general trading company. From 1991 to 1998, Mr. Kamei was an engineering manager at Ricoh Co., Ltd., a global manufacturer of office automation equipment. Mr. Kamei holds a B.S. of precise machinery engineering from Tokyo University.
If any of the following risks actually occur, our business, results of operations and financial condition could suffer significantly.
Risks Related to Our Business
Fluctuations in our revenue and operating results on a quarterly basis could cause the market price of our common stock to decline.
Our revenue and operating results are difficult to predict, have in the past fluctuated, and may in the future fluctuate from quarter to quarter. It is possible that our operating results in some quarters will be below market expectations. This would likely cause the market price of our common stock to decline. Our quarterly operating results are affected by a number of factors, including:
- •
- unpredictable volume and timing of customer orders, which are not fixed by contract and vary on a purchase order basis;
- •
- uncertain demand in our two primary end markets for our products;
- •
- the loss of one or more of our customers, causing a significant reduction or postponement of orders from these customers;
- •
- decreases in the overall average selling prices of our products;
- •
- changes in the relative sales mix of our products;
- •
- changes in our cost of finished goods;
14
- •
- the availability, pricing and timeliness of delivery of other components used in our customers' products;
- •
- our customers' sales outlook, purchasing patterns and inventory adjustments based on demands and general economic
conditions;
- •
- product obsolescence and our ability to manage product transitions;
- •
- our ability to successfully develop, introduce and sell new or enhanced products in a timely manner;
- •
- the timing of new product announcements or introductions by us or by our competitors; and
- •
- fluctuations in our effective tax rate.
We base our planned operating expenses in part on our expectations of future revenue, and a significant portion of our expenses is relatively fixed in the short-term. We have limited historical financial data from which to predict future sales for our products. As a result, it is difficult for us to forecast our future revenue and budget our operating expenses accordingly. If revenue for a particular quarter is lower than we expect, we likely will be unable to proportionately reduce our operating expenses for that quarter, which would harm our operating results for that quarter.
We may not sustain or increase profitability in the future, which may cause the market price of our common stock to decline.
To sustain or increase profitability, we will need to generate and sustain substantially higher revenue while maintaining reasonable cost and expense levels. We currently expect to increase expense levels in each of the next several quarters to support increased research and development efforts. These expenditures may not result in increased revenue or customer growth. Because many of our expenses are fixed in the short-term, or are incurred in advance of anticipated sales, we may not be able to decrease our expenses in a timely manner to offset any shortfall of sales. We also believe our future effective tax rate will be at or near the current statutory tax rate, which is higher than our average historical annual effective tax rate. This will harm our future financial results and negatively impact our profitability. We may not be able to sustain or increase profitability on a quarterly or an annual basis. This may, in turn, cause the price of our common stock to decline.
The demand for our products is affected by general economic conditions, which could impact our business.
The United States and international economies are currently experiencing a period of economic downturn. The timing of sustained economic recovery, if any, is uncertain. In addition, terrorist acts and similar events, turmoil in the Middle East or war in general, could contribute to a slowdown of the market demand for our products. If the economy continues to slow down as a result of the recent economic, political and social turmoil, or if there are further terrorist attacks in the United States or elsewhere, we may experience decreases in the demand for our products, which may harm our operating results. Our business has been adversely affected by the current economic downturn. Demand for our products has suffered as customers delay purchasing decisions or change or reduce their discretionary spending.
Fluctuations in demand for our products may harm our financial results and are difficult to forecast.
Current uncertainty in global economic conditions pose a risk to the overall economy as consumers and businesses may delay or postpone purchases in response to tighter credit and negative financial
15
news, which could negatively affect demand for our products. Consequently, demand could be different from our expectations due to many factors including:
- •
- changes in business and economic conditions, including conditions in the credit market that could affect consumer
confidence;
- •
- customer acceptance of our products;
- •
- changes in customer order patterns including order cancellations; and
- •
- changes in the level of inventory at customers.
If the growth of demand for digital video applications for the security surveillance and automotive infotainment markets does not continue, our ability to increase our revenue could suffer.
Our ability to increase our revenue will depend on increased demand for digital video applications in the security surveillance and automotive infotainment markets. In 2009, 70% of our revenue was derived from the sale of our products designed for the security surveillance market. If our products sold into this market decline or do not increase, or if demand slows in this market generally, our operating results would suffer. In addition, we have increased our focus on the automotive infotainment market and devoted substantial resources to the development of products for digital video applications that address this market. If we are not successful in selling our products into this market, or if the automotive infotainment industry in general continues to experience weak demand, we may not recover the costs associated with our efforts in this area and our operating results could suffer.
The growth of our target markets is uncertain and will depend in particular upon:
- •
- the pace at which new digital video applications are adopted;
- •
- a continued reduction in the costs of products in these markets;
- •
- the availability, at a reasonable price, of components required by such products, such as LCD panels; and
- •
- consumer confidence and the continued increase of consumer spending levels.
Our success depends on our ability to develop and introduce new products, which we may not be able to do in a timely manner, as product development in smaller wafer fabrication geometries becomes more complex and costly.
The development of new products is highly complex, and we have experienced some delays in bringing new products to the market in the past. As our products integrate new, more advanced functions, they become more complex and increasingly difficult to design. In addition, in our effort to decrease cost, we intend to design new products in smaller fabrication geometries, some of which we may have no prior experience of success. In the past, we have experienced some difficulties in shifting to smaller geometry process technologies.
Completing these projects is extremely challenging, time-consuming and expensive, and we can give no assurance that we will succeed or succeed in a timely and cost-effective manner. Product development delays may result from unanticipated engineering complexities, changing market or competitive product requirements or specifications, difficulties in overcoming resource limitations, the inability to license third-party technology or other factors. If we are unable to develop products successfully, in a timely and cost-effective manner, our business, financial condition and results of operations could suffer.
16
The average selling prices of our semiconductor products may be subject to rapid price declines, which could harm our revenue and gross profits.
The semiconductor products we develop and sell may be subject to rapid declines in average selling prices. From time to time, we have had to reduce our prices significantly to meet customer requirements, and we may be required to reduce our prices in the future. This would cause our gross margins to decline which in turn may negatively impact our operating results. Our financial results will suffer if we are unable to offset any reductions in our average selling prices by increasing our sales volumes, reducing our costs or developing new or enhanced products on a timely basis with higher selling prices or gross margins.
We face intense competition and may not be able to compete effectively, which could reduce our market share and decrease our revenue and profitability.
The markets in which we operate are extremely competitive and are characterized by rapid technological change, continuous evolving customer requirements and declining average selling prices. We may not be able to compete successfully against current or potential competitors. If we do not compete successfully, our market share and revenue may decline. We compete with large semiconductor manufacturers and designers, and our current and potential competitors have longer operating histories, significantly greater resources and name recognition and a larger base of customers than we do. This may allow them to respond more quickly than we can to new or emerging technologies or changes in customer requirements. In addition, these competitors may have greater credibility with our existing and potential customers. Many of our current and potential customers have their own internally developed semiconductor solutions and may choose not to purchase products from third-party suppliers like us.
We depend on key and highly skilled personnel to operate our business, and if we are unable to retain our current personnel and hire additional personnel, our ability to develop and market our products could be harmed.
We believe our future success will depend in large part upon our ability to attract and retain highly skilled managerial, engineering and sales and marketing personnel. The loss of any key employees or the inability to attract or retain qualified personnel could delay the development and introduction of, and harm our ability to sell, our products and harm the market's perception of us. We believe that our future success is highly dependent on the contributions of Fumihiro Kozato, our president and chief executive officer, and Dr. Feng Kuo, our senior vice president and chief technical officer. We do not have long-term employment contracts with these or any other key personnel, and their knowledge of our business and industry would be extremely difficult to replace.
If we fail to develop new products and enhance our existing products in order to react to rapid technological change and market demands, our business will suffer.
We must develop new products and enhance our existing products with improved technologies to meet rapidly evolving customer requirements. We need to design products for customers who continually require higher performance and functionality at lower costs. We must, therefore, continue to cost-effectively add features that enhance performance and functionality to our products. The development process for these advancements is lengthy and requires us to accurately anticipate market trends. Our failure to accurately anticipate market trends in a timely manner will harm the market acceptance of our products and the sales of our products.
Developing and enhancing these products is uncertain and can be time-consuming, costly and complex. There is a risk that these developments and enhancements will be late, fail to meet customer or market specifications or not be competitive with products from our competitors that offer
17
comparable or superior performance and functionality. Any new products or product enhancements may not be accepted in new or existing markets. Our business will suffer if we fail to develop and introduce new products or product enhancements on a cost-effective basis.
If we fail to achieve initial design wins for our products, we may lose the opportunity for sales for a significant period of time to customers and be unable to recoup our investments in our products.
We expend considerable resources in order to achieve design wins for our products, especially our new products and product enhancements. Once a customer designs a semiconductor into a product, it is likely to continue to use the same semiconductor or enhanced versions of that semiconductor from the same supplier across a number of similar and successor products for a lengthy period of time due to the significant costs associated with qualifying a new supplier and potentially redesigning the product to incorporate a different semiconductor. If we fail to achieve an initial design win in a customer's qualification process, we may lose the opportunity for significant sales to that customer for a number of its products and for a lengthy period of time. This may cause us to be unable to recoup our investments in our products, which would harm our business.
If we fail to develop, in a timely manner, or at all, technologies that address the demands of a shift from analog video signals to digital video signals, our operating results could suffer.
Our semiconductors are principally designed to decode analog video signals into digital images. On June 12, 2009, transmission of broadcast TV signals were no longer permitted in analog and all broadcast signals must be in a digital format. Current forecasts project that many other electronic products and applications will similarly transition to digital transmission. We are developing mixed signal and digital technologies to decode digital signals. However, transmission of digital video involves a combination of emerging technologies. The complexities of these technologies and the variability in implementations between manufacturers may cause our development of semiconductors to be costly and time-consuming. We may never obtain the benefits of our investment in developing these technologies. The complexities of digital broadcast technologies may also cause some of the semiconductors we are developing to ultimately work incorrectly for reasons that may be either related or unrelated to our products, or not be interoperable with other key products. Delays or difficulties in integrating our semiconductors into digital broadcast products or the failure of products incorporating digital video to achieve broad market acceptance could have an adverse effect on our business.
Our business is subject to seasonality, which is likely to cause our revenue to fluctuate.
Our business is subject to seasonality as a result of the location of our customers. We sell a significant number of our semiconductors to customers located in Asia, primarily to customers located in regions who observe the Lunar New Year holiday, also referred to as Chinese New Year. Typically, our foreign offices and those of our customers are closed for a week or more during the extended holiday period. In 2009, 91% of our revenue was attributable to customers located in regions that observe the Lunar New Year holiday. As a result, we typically experience fluctuations in our first calendar quarter due in part to a slowing of business activity around the period of the Lunar New Year holiday.
We manufacture our products based on our estimates of customer demand, and if our estimates are incorrect our financial results could be negatively impacted.
Our sales are made on the basis of purchase orders rather than long-term purchase commitments. In addition, our customers may cancel purchase orders or defer the shipments of our products. We manufacture our products according to our estimates of customer demand. This process requires us to make multiple demand forecast assumptions, each of which may introduce error into our estimates. If we overestimate customer demand, we may manufacture products that we may not be able to sell. As a result, we would have excess inventory, which would increase our losses. Conversely, if we underestimate customer demand or if sufficient manufacturing capacity were unavailable, we would forego revenue opportunities, lose market share and damage our customer relationships.
18
We do not expect to sustain the growth rate of our recent revenue.
Our revenue increased 109% in 2005 from 2004 and 49% in 2006 from 2005. We do not expect to achieve similar growth rates in future periods. For example, our revenue increased 11% in 2007 from 2006 and 13% in 2008 compared to 2007 and decreased 7% in the 2009 compared to 2008. You should not rely on the results of any prior quarterly or annual periods as an indication of our future operating performance. If we are unable to maintain adequate revenue growth, our stock price may decline and we may not have adequate financial resources to execute our business objectives.
We may pursue acquisitions or investments in complementary technologies and businesses, which could harm our operating results and may disrupt our business.
We have pursued and may continue to pursue acquisitions of, or investments in, complementary technologies and businesses. For example, we acquired substantially all of the assets of a development stage company in October 2009. Acquisitions present a number of potential risks and challenges that could, if not successfully addressed, disrupt our business operations, increase our operating costs and reduce the value to us of the acquired company. Even if we are successful, we may not be able to integrate the acquired businesses, products or technologies into our existing business and products. Furthermore, potential acquisitions and investments, whether or not consummated, may divert management's attention and require considerable cash outlays at the expense of existing operations. In addition, to complete future acquisitions, we may issue equity securities, incur debt, assume contingent liabilities or have amortization expenses and write-downs of acquired assets, which could adversely affect our profitability.
Changes in our tax rates will affect our future results.
Our future effective tax rates will be favorably or unfavorably affected by the absolute amount and future geographic distribution of our pre-tax income, our ability to take advantage of the available tax planning strategies and the availability of tax credits. In addition, we are subject to the examination of our income tax returns by the Internal Revenue Service and other tax authorities. The outcomes of these examinations, when and if they occur, could harm our financial condition.
We may not be able to manage our future growth effectively, and we may need to incur significant expenditures to address the additional operational and control requirements of our growth.
We have experienced a period of significant growth and expansion, which has placed, and any future expansion will continue to place, a significant strain on management, personnel, systems and financial resources. We have hired additional employees to support an increase in research and development as well as increase our sales and marketing efforts, which resulted in increasing our headcount from 96 employees as of December 31, 2006 to 206 employees as of December 31, 2009. To manage our growth successfully, we believe we must effectively:
- •
- train, integrate and manage additional qualified engineers for research and development activities, sales and marketing
personnel and financial and information technology personnel;
- •
- continue to enhance our customer resource management and manufacturing management systems;
- •
- implement additional and improve existing administrative, financial and operations systems, procedures and controls,
including the requirements of the Sarbanes-Oxley Act of 2002;
- •
- expand and upgrade our technological capabilities; and
- •
- manage multiple relationships with our customers, distributors, suppliers and other third-parties.
19
Our efforts may require substantial managerial and financial resources and may increase our operating costs even though these efforts may not be successful. If we are unable to manage our growth effectively, we may not be able to take advantage of market opportunities, develop new products, satisfy customer requirements, execute our business plan or respond to competitive pressures.
We may experience unforeseen delays, expenses or lower than expected product yields for our semiconductors manufactured by our third-party vendors, which could increase our costs and prevent us from recognizing the benefits of new technologies we develop.
We occasionally have experienced delays in completing the development and introduction of new products and product enhancements, and we could experience delays in the future that may render our new or enhanced products, when introduced, obsolete and unmarketable. In addition, it is often difficult for semiconductor foundries to achieve satisfactory product yields. Product yields depend on both our product design and the manufacturing process technology unique to the semiconductor foundry. Since low yields may result from either design or process difficulties, identifying yield problems can only occur well into the production cycle after a product that can be physically analyzed and tested exists. Poor yields from our foundry could cause us to sell our products at lower gross margins and therefore harm our financial results.
Defects in our products could increase our costs, cause customer claims and delay our product shipments.
Although we test our products, they are complex and may contain defects and errors. In the past, we have encountered defects and errors in our products. Delivery of products with defects or reliability, quality or compatibility problems may damage our reputation and our ability to retain existing customers and attract new customers. In addition, product defects and errors could result in additional development costs, diversion of technical resources, delayed product shipments, increased product returns and product liability claims against us, which may not be fully covered by insurance. Any of these could harm our business.
We rely on a limited number of independent subcontractors for the manufacture, assembly and testing of our semiconductors, and the failure of any of these third-party vendors to deliver products or otherwise perform as requested could damage our relationships with our customers, decrease our sales and limit our growth.
We do not have our own manufacturing or assembly facilities and have very limited in-house testing facilities. Therefore, we must rely on third-party vendors to manufacture, assemble and test the products we design. We currently rely on Taiwan Semiconductor Manufacturing Company, or TSMC, to produce the majority of our semiconductors. We rely on Advanced Semiconductor Engineering, Inc., or ASE, to assemble, package and test many of our products. If these vendors do not provide us with high-quality products, services and production and test capacity in a timely manner, or if one or more of these vendors terminates its relationship with us, we may be unable to obtain satisfactory replacements to fulfill customer orders on a timely basis, our relationships with our customers could suffer and our sales could decrease. Other significant risks associated with relying on these third-party vendors include:
- •
- reduced control over product cost, delivery schedules and product quality;
- •
- potential price increases;
- •
- inability to achieve required production or test capacity and achieve acceptable yields on a timely basis;
- •
- longer delivery times;
- •
- increased exposure to potential misappropriation of our intellectual property;
- •
- shortages of materials that foundries use to manufacture products;
20
- •
- labor shortages or labor strikes; and
- •
- quarantines or closures of manufacturing facilities due to the outbreak of viruses, such as SARS, the avian flu or any similar future outbreaks in Asia.
We currently do not have long-term supply contracts with any of our third-party vendors. Therefore, they are not obligated to perform services or supply products to us for any specific period, in any specific quantities or at any specific price, except as may be provided in a particular purchase order. Neither TSMC nor ASE has provided contractual assurances to us that adequate capacity will be available for us to meet future demand for our products. These third-party vendors may allocate capacity to the production of other companies' products while reducing deliveries to us on short notice. In particular, other customers that are larger and better financed than we are or that have long-term agreements with TSMC or ASE may cause either or both of them to reallocate capacity to those customers, decreasing the capacity available to us.
We plan to retain additional foundries to manufacture our semiconductors, which could disrupt our current manufacturing process and negatively impact our sales volumes and revenue.
We are a fabless semiconductor company which relies on third-party manufacturers or foundries to manufacture our semiconductors. We are reliant on these foundries for the manufacture of our products as well as providing services to assist us in getting our products into production. As a result of the complexity in manufacturing our semiconductors, it is difficult to determine if a new foundry will be able to successfully produce our products. We may not be able to enter into a relationship with a new foundry that produces satisfactory yields on a cost-effective basis. If we need another foundry because of increased demand, or the inability to obtain timely and adequate deliveries from our current provider, we might not be able to cost-effectively and quickly retain other vendors to satisfy our requirements. Any failure to successfully integrate a new foundry could negatively impact our sales volumes and revenue.
Our business depends on customers, suppliers and operations in Asia, and as a result we are subject to regulatory, operational, financial and political risks, which could adversely affect our financial results.
The percentage of our revenue attributable to sales to customers in Asia was 97%, 98% and 98% in 2009, 2008 and 2007, respectively. We expect that revenue from customers in Asia will continue to account for substantially all of our revenue. All our sales currently are denominated in U.S. dollars. As a result, an increase in the value of the U.S. dollar relative to foreign currencies could make our products less competitive in international markets.
Currently, we maintain international sales offices in Asia, and we rely on a network of third-party sales representatives to sell our products internationally. We have offices in China, Japan, Taiwan and South Korea, which serve various aspects of our business. Moreover, we have in the past relied on, and expect to continue to rely on, suppliers, manufacturers and subcontractors primarily located in Taiwan. Accordingly, we are subject to several risks and challenges, any of which could harm our business and financial results. These risks and challenges include:
- •
- difficulties and costs of staffing and managing international operations across different geographic areas and cultures;
- •
- compliance with a wide variety of domestic and foreign laws and regulations, including those relating to the import or
export of semiconductor products;
- •
- legal uncertainties regarding taxes, tariffs, quotas, export controls, export licenses and other trade barriers;
- •
- foreign currency exchange fluctuations relating to our international operating activities;
21
- •
- our ability to receive timely payment and collect our accounts receivable;
- •
- political, legal and economic instability, foreign conflicts and the impact of regional and global infectious illnesses,
such as the SARS outbreak or avian flu in the countries in which we and our customers, suppliers, manufacturers and subcontractors are located;
- •
- legal uncertainties regarding protection for intellectual property rights in some countries; and
- •
- fluctuations in freight rates and transportation disruptions.
Our sales cycle can be lengthy, which could result in uncertainty and delays in generating revenue.
Because our products are based on constantly evolving technologies, we have experienced a lengthy sales cycle for some of our semiconductors, particularly those designed for digital video applications in the automotive infotainment market. Our sales cycle typically ranges from six to 24 months. We may experience a delay between the time we increase expenditures for research and development, sales and marketing efforts and inventory to the time we generate revenue, if any, from these expenditures. In addition, because we do not have long-term commitments from our customers, we must repeat our sales process on a continual basis even for current customers looking to purchase a new product. As a result, our business could be harmed if a customer reduces or delays its orders, chooses not to release products incorporating our semiconductors or elects not to purchase a new product or product enhancements from us.
We primarily sell our products through a limited number of distributors, and if our relationships with one or more of those distributors were to terminate, our operating results may be harmed.
We market and distribute our products primarily through a limited number of distributors, most of which are located in Asia. This distribution channel has been characterized by rapid change and consolidations. Distributors have accounted for a significant portion of our revenue in the past. Sales to our distributors represented 72%, 79% and 77% of our revenue in 2009, 2008 and 2007, respectively. In 2009, one of our distributors, Lacewood International Corporation, accounted for 35% of our revenue. We do not have any long-term contractual commitments with our distributors.
Our operating results and financial condition could be significantly disrupted by the loss of one or more of our current distributors and sales representatives, volume pricing discounts, order cancellations, delays in shipment by one of our major distributors or sales representatives or the failure of our distributors or sales representatives to successfully sell our products.
We face risks associated with doing business in China.
We derived 54%, 37% and 26% of our revenue in 2009, 2008 and 2007, respectively, from customers located in China and significantly increased our operations in China in October 2009 by hiring 40 employees in Chengdu, China in connection with our purchase of substantially all of the assets of a development stage company. As a result, the economic, political, legal and social conditions in China could have a material adverse effect on our business, results of operations and financial condition. In recent years, the Chinese economy has experienced periods of rapid expansion and high rates of inflation. These factors have led to the adoption by the Chinese government, from time to time, of various corrective measures designed to restrict the availability of credit or regulate growth and contain inflation. While inflation has been more moderate since 1995, high inflation may in the future cause the Chinese government to impose controls on credit or prices, or to take other action, which could inhibit economic activity in China, and thereby harm the market for our products. In addition, the legal system in China has inherent uncertainties that may limit the legal protections available in the event of any claims or disputes that we have with third parties, including our ability to protect the intellectual property we develop in China or elsewhere. As China's legal system is still evolving, the interpretation of many laws, regulations and rules is not always uniform and enforcement of these laws,
22
regulations and rules involve uncertainties, which may limit the remedies available in the event of any claims or disputes with third parties. In addition, any litigation in China may be protracted and result in substantial costs and diversion of resources and management attention. Some of the other risks related to doing business in China include:
- •
- the Chinese government exerts substantial influence over the manner in which we must conduct our business activities;
- •
- restrictions on currency exchange may limit our ability to receive and use our cash effectively; and
- •
- more restrictive rules on foreign investment could adversely affect our ability to expand our operations in China.
As a result of our growing operations in China, these risks could have a material adverse effect on our business, results of operations and financial condition.
We rely primarily upon copyright and trade secret laws and contractual restrictions to protect our proprietary rights and if these rights are not sufficiently protected, our ability to compete and generate revenue could suffer.
We seek to protect our proprietary design processes, documentation and other written materials primarily under trade secret and copyright laws. We also typically require employees and consultants with access to our proprietary information to execute confidentiality agreements. The steps taken by us to protect our proprietary information may not be adequate to prevent misappropriation of our technology. In addition, our proprietary rights may not be adequately protected because:
- •
- the laws of other countries in which we market our semiconductors, such as some countries in the Asia/Pacific region, may
offer little or no protection for our proprietary technologies;
- •
- people may not be deterred from misappropriating our technologies despite the existence of laws or contracts prohibiting
these actions; and
- •
- policing unauthorized use of our intellectual property may be difficult, expensive and time-consuming, and we may be unable to determine the extent of any unauthorized use.
Reverse engineering, unauthorized copying or other misappropriation of our proprietary technologies could enable third-parties to benefit from our technologies without compensating us for doing so. For example, if the foundry that manufactures our semiconductors loses control of our intellectual property, it would be more difficult for us to take remedial measures since it is located in Taiwan, which does not have the same protection for intellectual property as is provided in the United States. Any inability to adequately protect our proprietary rights could harm our ability to compete, generate revenue and grow our business.
We may not obtain sufficient patent protection on the technology embodied in the semiconductors we currently manufacture and market, which could harm our competitive position and increase our expenses.
Our success and future revenue growth will depend, in part, on our ability to protect our intellectual property. We primarily rely on patent, copyright, trademark and trade secret laws, as well as nondisclosure agreements and other methods, to protect our proprietary technologies and processes. Despite our efforts to protect our proprietary technologies and processes, it is possible that competitors or other unauthorized third parties may obtain, copy, use or disclose our technologies and processes.
Although we rely primarily on trade secret laws and contractual restrictions to protect the technology in the semiconductors we currently manufacture and market, our success and ability to compete in the future may also depend to a significant degree upon obtaining patent protection for our proprietary technology. As of December 31, 2009, we had two issued patents in the United States and
23
eleven patent applications pending in the United States and seven applications pending in foreign jurisdictions. These patents and patent applications do not cover all of the semiconductors that we presently manufacture and market. We cannot assure you that any additional patents will be issued. Even if a new patent is issued, the claims allowed may not be sufficiently broad to protect our technology. In addition, any of our existing or future patents may be challenged, invalidated or circumvented. As such, any rights granted under these patents may not provide us with meaningful protection. We may not be able to obtain foreign patents or file pending applications corresponding to our U.S. patents and patent applications. Even if foreign patents are granted, effective enforcement in foreign countries may not be available. If our patents do not adequately protect our technology, our competitors may be able to offer products similar to ours. Our competitors may also be able to develop similar technology independently or design around our patents. Our present and future patents may provide only limited protection for our technology and may not be sufficient to provide us with competitive advantages.
We generally enter into confidentiality agreements with our employees, consultants and strategic partners. We also try to control access to and distribution of our technologies, documentation and other proprietary information. Despite these efforts, internal or external parties may attempt to copy, disclose, obtain or use our products, services or technology without our authorization. Also, current or former employees may seek employment with our business partners, customers or competitors, and we cannot assure you that the confidential nature of our proprietary information will be maintained in the course of such future employment. Additionally, current, departing or former employees or third parties could attempt to penetrate our computer systems and networks to misappropriate our proprietary information and technology or interrupt our business. Because the techniques used by computer hackers and others to access or sabotage networks change frequently and generally are not recognized until launched against a target, we may be unable to anticipate, counter or ameliorate these techniques. As a result, our technologies and processes may be misappropriated, particularly in countries where laws may not protect our proprietary rights as fully as in the United States.
We cannot assure you that our efforts to prevent the misappropriation or infringement of our intellectual property or the intellectual property of our customers will succeed. Identifying unauthorized use of our products and technologies is difficult and time consuming. We have in the past been engaged in litigation to enforce or defend our intellectual property rights, protect our trade secrets, or determine the validity and scope of the proprietary rights of others, including our customers. It is possible that the advent of or developments in such litigation may adversely affect our relationships and agreements with certain customers that are either involved in such litigation or also have business relationships with the party with whom we are engaged in litigation. Such litigation (and the settlement thereof) is very expensive and time consuming. Additionally, any litigation can divert the attention of management and other key employees from the operation of the business, which could negatively impact our business and results of operations.
Intellectual property litigation, which is common in our industry, could be costly, harm our reputation, limit our ability to sell our products and divert the attention of management and technical personnel.
Our industry is characterized by frequent litigation regarding patent and other intellectual property rights. For example, during 2005 and 2006, we were a party to an administrative proceeding in front of the intellectual property tribunal in South Korea in which another party unsuccessfully sought a determination that our TW2824 and TW2834 products infringed a South Korean patent allegedly held by that party. We have certain indemnification obligations to customers under our contract development projects with respect to any infringement of third-party patents and intellectual property rights by our products. If a lawsuit were to be filed against us in connection with claims of infringement, our business would be harmed.
24
Questions of infringement in the digital video applications market involve highly technical and subjective analyses. Litigation may be necessary in the future to enforce any patents we may receive and other intellectual property rights, to protect our trade secrets, to determine the validity and scope of the proprietary rights of others or to defend against claims of infringement or invalidity, and we may not prevail in any future litigation. Litigation, whether or not determined in our favor or settled, could be costly, could harm our reputation, could cause our customers to use our competitors' products and could divert the efforts and attention of management and technical personnel from normal business operations. In addition, adverse determinations in litigation could result in the loss of our proprietary rights, subject us to significant liabilities, require us to seek licenses from third-parties or prevent us from licensing our technology or selling our products, any of which could seriously harm our business.
Our headquarters are located in the State of California and our third-party manufacturing, assembly and testing vendors have facilities in the State of Washington and in Taiwan, areas subject to significant earthquake risks. Any disruption to our or their operations resulting from earthquakes or other natural disasters could cause significant delays in the production or shipment of our product.
TSMC, which manufactures substantially all of our semiconductors, has facilities in the State of Washington and in Taiwan. Our assembly and testing vendors' facilities are primarily located in Taiwan. In addition, our headquarters are located in Northern California. The risk of an earthquake or extreme weather in the Pacific Rim region or an earthquake in Northern California or Washington State is significant due to the proximity of major earthquake fault lines. In September 1999, a major earthquake in Taiwan affected the facilities of TSMC and ASE, our primary assembly vendor, as well as other providers of foundry, packaging and test services. In March 2002 and June 2003, additional earthquakes occurred in Taiwan. In 2005, several typhoons also disrupted the operations of TSMC and ASE. As a result of these natural disasters, these contractors suffered power outages and disruptions that impaired their production capacity. The occurrence of earthquakes or other natural disasters could result in the disruption of our foundry or assembly and test capacity. We may not be able to obtain alternate capacity on favorable terms, if at all, which could harm our operating results.
Management may apply our cash, cash equivalents and short-term and long-term investments to uses that do not increase our market value or improve our operating results.
We intend to use our cash, cash equivalents and short-term and long-term investments for general corporate purposes, including working capital and capital expenditures. We may also use a portion of our cash, cash equivalents and short-term and long-term investments to acquire or invest in complementary technologies, businesses or other assets. We have not reserved or allocated our cash, cash equivalents and short-term and long-term investments for any specific purpose, and we cannot state with certainty how management will use our cash, cash equivalents and short-term and long-term investments. Accordingly, management has considerable discretion in applying our cash, cash equivalents and short-term and long-term investments and may use our cash, cash equivalents and short-term and long-term investments for purposes that do not result in any increase in our results of operations or market value. Until the cash, cash equivalents and short-term and long-term investments are used, they may be placed in investments that do not produce income or lose value.
Risks Related to Our Industry
Due to the cyclical nature of the semiconductor industry, our operating results may fluctuate significantly, which could adversely affect the market price of our common stock.
The semiconductor industry is highly cyclical and subject to rapid change and evolving industry standards and, from time to time, has experienced significant downturns. These downturns are characterized by decreases in product demand, excess customer inventory and accelerated erosion of prices. These factors have caused and could cause substantial fluctuations in our revenue and in our
25
operating results. Any downturns in the semiconductor industry may be severe and prolonged, and any failure of this industry to fully recover from downturns could harm our business. The semiconductor industry also periodically experiences increased demand and production capacity constraints, which may affect our ability to ship products. Accordingly, our operating results have varied and may vary significantly as a result of the general conditions in the semiconductor industry, which could cause our stock price to decline.
Risks Related to Our Common Stock
Our stock price has been volatile and you may not be able to resell shares of our common stock at or above the price you paid, or at all.
The trading price of our common stock has experienced wide fluctuations due to the factors discussed in this risk factors section and elsewhere in this Annual Report on Form 10-K. For example, in 2009, the closing price of our stock ranged from a low of $5.16 on March 5, 2009 to a high of $13.49 on December 29, 2009. In addition, the stock market in general has, and The NASDAQ Global Market and technology companies in particular have, experienced extreme price and volume fluctuations. These trading prices and valuations may not be sustainable. These broad market and industry factors may decrease the market price of our common stock, regardless of our actual operating performance. In addition, in the past, following periods of volatility in the overall market and the market price of a company's securities, securities class action litigation has often been instituted against companies that experienced such volatility. This litigation, if instituted against us, regardless of its outcome, could result in substantial costs and a diversion of management's attention and resources.
If securities or industry analysts do not publish research or reports about our business, or if they change their recommendations regarding our stock adversely, our stock price and trading volume could decline.
The trading market for our common stock is influenced by the research and reports that industry or securities analysts publish about us or our business. If one or more of the analysts who cover us downgrade our stock, our stock price would likely decline. If one or more of these analysts cease coverage of our company or fail to regularly publish reports on us, we could lose visibility in the financial markets, which in turn could cause our stock price or trading volume to decline.
Our ability to raise capital in the future may be limited and our failure to raise capital when needed could prevent us from executing our growth strategy.
We believe that our existing cash and cash equivalents and short-term and long-term investments will be sufficient to meet our anticipated cash needs for at least the next 12 months. The timing and amount of our working capital and capital expenditure requirements may vary significantly depending on numerous factors, including:
- •
- market acceptance of our products;
- •
- the need to adapt to changing technologies and technical requirements;
- •
- the existence of opportunities for expansion; and
- •
- access to and availability of sufficient management, technical, marketing and financial personnel.
If our capital resources are insufficient to satisfy our liquidity requirements, we may seek to sell additional equity securities or debt securities or obtain debt financing. The sale of additional equity securities or convertible debt securities would result in additional dilution to our stockholders. Additional debt would result in increased expenses and could result in covenants that would restrict our operations. We have not made arrangements to obtain additional financing and there is no assurance that financing, if required, will be available in amounts or on terms acceptable to us, if at all.
26
Substantial future sales of our common stock in the public market could cause our stock price to fall.
Additional sales of our common stock in the public market, or the perception that these sales could occur, could cause the market price of our common stock to decline. As of December 31, 2009, we had 22.0 million shares of common stock outstanding. A substantial portion of these shares of common stock are entitled to rights to cause us to register the sale of those shares under the Securities Act. Registration of these shares under the Securities Act would result in these shares, other than shares purchased by our affiliates, becoming freely tradable without restriction under the Securities Act immediately upon the effectiveness of the registration.
Failure to maintain effective internal controls over financial reporting may cause us to delay filing our periodic reports with the SEC, affect our Nasdaq listing, and adversely affect our stock price.
The SEC, as directed by Section 404 of the Sarbanes-Oxley Act of 2002, adopted rules requiring public companies to include a report of management on internal control over financial reporting in their annual reports on Form 10-K. Our management is responsible for maintaining internal control over financial reporting designed to provide reasonable assurance regarding the reliability of financial reporting and the preparation of consolidated financial statements for external purposes in accordance with GAAP. Our management assessed the effectiveness of our internal control over financial reporting as of December 31, 2009 and identified a material weakness. Please see Item 9A. Controls and Procedures. Although we review our internal control over financial reporting in order to ensure compliance with the Section 404 requirements, our failure to maintain adequate internal controls over financial reporting could result in an adverse reaction in the financial marketplace due to a loss of investor confidence in the reliability of our financial statements, which ultimately could negatively impact our stock price.
Our corporate actions are substantially controlled by officers, directors, principal stockholders and affiliated entities.
Our directors, executive officers and affiliated entities beneficially own a significant percentage of our outstanding common stock. These stockholders, if they acted together, could exert substantial control over matters requiring approval by our stockholders, including electing directors and approving mergers or other business combination transactions. This concentration of ownership may also discourage, delay or prevent a change in control of our company, which could deprive our stockholders of an opportunity to receive a premium for their stock as part of a sale of our company and might reduce our stock price. These actions may be taken even if they are opposed by our other stockholders.
Certain provisions of Delaware law, our corporate charter and bylaws and our shareholder rights plan contain anti-takeover provisions that could delay or discourage takeover attempts that stockholders may consider favorable.
Provisions in our certificate of incorporation, as amended and restated, may have the effect of delaying or preventing a change of control or changes in our management. These provisions include the following:
- •
- the right of the board of directors to elect a director to fill a vacancy created by the expansion of the board of
directors;
- •
- the prohibition of cumulative voting in the election of directors, which would otherwise allow less than a majority of
stockholders to elect director candidates;
- •
- the requirement for advance notice for nominations for election to the board of directors or for proposing matters that
can be acted upon at a stockholders' meeting;
- •
- the ability of the board of directors to alter our bylaws without obtaining stockholder approval;
27
- •
- the ability of the board of directors to issue, without stockholder approval, up to 10,000,000 shares of preferred stock
with terms set by the board of directors, which rights could be senior to those of common stock;
- •
- the required approval of holders of at least two-thirds of the shares entitled to vote at an election of
directors to adopt, amend or repeal our bylaws or amend or repeal the provisions of our certificate of incorporation regarding the indemnification of directors and officers and the ability of
stockholders to take action;
- •
- the required approval of holders of at least a majority of the shares entitled to vote at an election of directors to
remove directors for cause; and
- •
- the elimination of the right of stockholders to call a special meeting of stockholders and to take action by written consent.
In addition, our stockholder rights plan would cause substantial dilution to any person or group who attempts to acquire a significant interest in us without advance approval from our board of directors.
While these provisions and our stockholder rights plan have the effect of encouraging persons seeking to acquire control of our company to negotiate with our board of directors, the provisions could enable the board of directors to hinder or frustrate a transaction that some, or a majority, of the stockholders might believe to be in their best interests and, in that case, may prevent or discourage attempts to remove and replace incumbent directors.
Because we are incorporated in Delaware, we are governed by the provisions of Section 203 of the Delaware General Corporation Law. These provisions may prohibit or restrict large stockholders, in particular those owning 15% or more of our outstanding voting stock, from merging or combining with us.
These provisions in our certificate of incorporation and bylaws, stockholder rights plan and under Delaware law could discourage potential takeover attempts and could reduce the price that investors might be willing to pay for shares of our common stock in the future and result in our market price being lower than it would without these provisions.
ITEM 1B. Unresolved Staff Comments
None.
Our corporate headquarters and primary research and development and operations facilities occupy approximately 27,900 square feet in San Jose, California under leases that expire in December 2011. We also lease properties in Illinois, Japan, Taiwan, South Korea and China. We do not own any manufacturing facilities, and we contract and license to third-parties the production and distribution of our semiconductors. We believe our space is adequate for our current needs and that suitable additional or substitute space will be available to accommodate expansion of our operations, if necessary.
For additional information regarding obligations under operating leases, see our consolidated financial statements and related notes included elsewhere in this report.
We are currently not a party to any material legal proceedings. We may from time to time become involved in litigation relating to claims arising from our ordinary course of business. These claims, even if not meritorious, could result in the expenditure of significant financial and managerial resources.
28
ITEM 5. Market for Registrant's Common Equity, Related Stockholder Matters and Issuer Purchases of Equity Securities
Market Information for Common Stock
The information required by this item regarding equity compensation plans is set forth under the caption Equity Compensation Plan Information in our 2010 Proxy Statement and is incorporated herein by reference.
Our common stock began trading on the NASDAQ Global Market on June 21, 2006 under the symbol "TWLL". The following table sets forth for the periods indicated the high and low closing sale prices of our common stock, as reported by the NASDAQ Global Market.
| |
Low | High | ||||||
|---|---|---|---|---|---|---|---|---|
Year ended December 31, 2008: |
||||||||
First Quarter |
$ | 9.11 | $ | 10.85 | ||||
Second Quarter |
$ | 10.50 | $ | 14.17 | ||||
Third Quarter |
$ | 9.17 | $ | 12.44 | ||||
Fourth Quarter |
$ | 5.01 | $ | 9.86 | ||||
Year ended December 31, 2009: |
||||||||
First Quarter |
$ | 5.16 | $ | 7.18 | ||||
Second Quarter |
$ | 6.05 | $ | 8.89 | ||||
Third Quarter |
$ | 8.03 | $ | 11.09 | ||||
Fourth Quarter |
$ | 9.42 | $ | 13.49 | ||||
Holders of Record
As of December 31, 2009, there were approximately 31 stockholders of record.
Dividend Policy
To date, we have not declared or paid cash dividends on our common stock. We currently intend to retain any future earnings and currently do not expect to pay any dividends in the foreseeable future.
Securities Authorized for Issuance Under Equity Compensation Plans
Information regarding the securities authorized for issuance under our equity compensation plans can be found under Item 12 of Part III of this Report.
Sales of Unregistered Securities and Purchases of Equity Securities
During 2009, we did not sell any equity securities that were not registered under the Securities Act nor did we repurchase any of our equity securities.
Stock Performance Graph
This performance graph shall not be deemed "filed" for purpose of Section 18 of the Securities Exchange Act of 1934, as amended, or incorporated by reference into any filing of Techwell under the Securities Act of 1933, as amended, except as shall be expressly set forth by specific reference in such filing.
The following graph shows a comparison from June 21, 2006 (the date our common stock commenced trading on the NASDAQ Global Market) through December 31, 2009 of the cumulative
29
total return for our common stock, the NASDAQ Composite Index, and the NASDAQ Semiconductor Index. Such returns are based on historical results and are not intended to suggest future performance. Data for the NASDAQ Composite Index and the NASDAQ Semiconductor Index assume reinvestment of dividends. We have never paid dividends on our common stock and have no present plans to do so.
COMPARISON OF 42 MONTH CUMULATIVE TOTAL RETURN*
Among
Techwell, Inc, The NASDAQ Composite Index
And Nasdaq Semiconductor Index
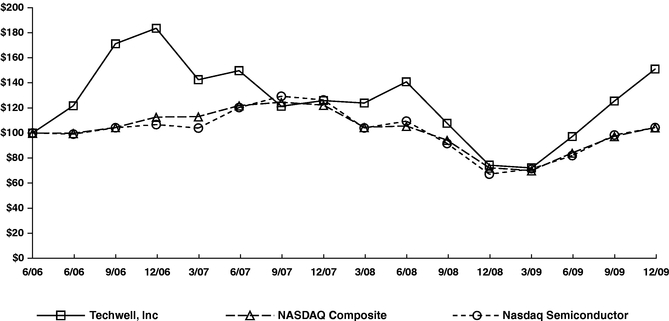
- *
- $100 invested on 6/21/06 in stock & 5/31/06 in index-including reinvestment of dividends. Fiscal year ending December 31.
ITEM 6. Selected Financial Data
The following selected consolidated financial data should be read together with "Management's Discussion and Analysis of Financial Condition and Results of Operations" included in Item 7 and our consolidated financial statements and related notes included elsewhere in this report. The selected consolidated balance sheet data at December 31, 2009 and 2008 and the selected consolidated statements of operations data for each year ended December 31, 2009, 2008 and 2007 have been derived from our audited consolidated financial statements that are included elsewhere in this report. The selected consolidated balance sheet data at December 31, 2007, 2006 and 2005 and the selected consolidated statements of operations data for each year ended December 31, 2006 and 2005 have been
30
derived from our audited consolidated financial statements not included in this report. Historical results are not necessarily indicative of the results to be expected in the future.
| |
Year Ended December 31, | |||||||||||||||||
|---|---|---|---|---|---|---|---|---|---|---|---|---|---|---|---|---|---|---|
| |
2009 | 2008 | 2007 | 2006 | 2005 | |||||||||||||
| |
(in thousands, except per share amounts) |
|||||||||||||||||
Consolidated Statement of Operations |
||||||||||||||||||
Revenue |
$ | 63,174 | $ | 67,636 | $ | 59,887 | $ | 53,712 | $ | 36,051 | ||||||||
Cost of revenue(1) |
24,665 | 25,647 | 24,200 | 22,977 | 17,304 | |||||||||||||
Gross profit |
38,509 | 41,989 | 35,687 | 30,735 | 18,747 | |||||||||||||
Operating expenses: |
||||||||||||||||||
Research and development(1) |
19,603 | 17,104 | 12,277 | 9,183 | 8,684 | |||||||||||||
Selling, general and administrative(1) |
14,916 | 14,656 | 12,287 | 8,702 | 5,730 | |||||||||||||
Total operating expenses |
34,519 | 31,760 | 24,564 | 17,885 | 14,414 | |||||||||||||
Income from operations |
3,990 | 10,229 | 11,123 | 12,850 | 4,333 | |||||||||||||
Interest income |
1,373 | 2,282 | 3,089 | 1,670 | 368 | |||||||||||||
Income before income taxes |
5,363 | 12,511 | 14,212 | 14,520 | 4,701 | |||||||||||||
Income tax provision (benefit) |
1,867 | 4,724 | (518 | ) | 1,298 | 160 | ||||||||||||
Net income |
$ | 3,496 | $ | 7,787 | $ | 14,730 | $ | 13,222 | $ | 4,541 | ||||||||
Net income per share: |
||||||||||||||||||
Basic |
$ | 0.16 | $ | 0.37 | $ | 0.71 | $ | 1.04 | $ | 1.14 | ||||||||
Diluted |
$ | 0.16 | $ | 0.35 | $ | 0.68 | $ | 0.64 | $ | 0.25 | ||||||||
Weighted average shares used in computing net income per share: |
||||||||||||||||||
Basic |
21,545 | 21,112 | 20,772 | 12,772 | 3,993 | |||||||||||||
Diluted |
22,318 | 22,067 | 21,818 | 20,538 | 18,434 | |||||||||||||
- (1)
- Amounts include stock-based compensation as follows:
| |
Year Ended December 31, | ||||||||||||||||
|---|---|---|---|---|---|---|---|---|---|---|---|---|---|---|---|---|---|
| |
2009 | 2008 | 2007 | 2006 | 2005 | ||||||||||||
| |
(in thousands) |
||||||||||||||||
Cost and Expenses: |
|||||||||||||||||
Cost of revenue |
$ | 483 | $ | 492 | $ | 297 | $ | 117 | $ | 31 | |||||||
Research and development |
3,939 | 3,339 | 1,830 | 1,100 | 427 | ||||||||||||
Selling, general and administrative |
3,269 | 3,506 | 2,423 | 1,050 | 442 | ||||||||||||
| |
Year Ended December 31, | |||||||||||||||
|---|---|---|---|---|---|---|---|---|---|---|---|---|---|---|---|---|
| |
2009 | 2008 | 2007 | 2006 | 2005 | |||||||||||
| |
(in thousands) |
|||||||||||||||
Consolidated Balance Sheet Data: |
||||||||||||||||
Cash and cash equivalents |
$ | 6,404 | $ | 44,485 | $ | 27,177 | $ | 13,201 | $ | 15,982 | ||||||
Short and long-term investments |
88,060 | 36,932 | 41,223 | 41,327 | 804 | |||||||||||
Working capital |
59,540 | 67,047 | 65,374 | 51,473 | 21,152 | |||||||||||
Total assets |
115,427 | 97,364 | 83,737 | 63,993 | 25,644 | |||||||||||
Redeemable convertible preferred stock |
— | — | — | — | 40,777 | |||||||||||
Total stockholders' equity (deficit) |
103,817 | 92,904 | 78,065 | 57,146 | (19,210 | ) | ||||||||||
31
ITEM 7. Management's Discussion and Analysis of Financial Condition and Results of Operations
The following discussion of our financial condition and results of operations should be read in conjunction with our consolidated financial statements and the related notes included elsewhere this Annual Report on Form 10-K.
Overview
We are a fabless semiconductor company that designs, markets and sells mixed signal integrated circuits for two primary markets: security surveillance and automotive infotainment. We design application-specific products for our two primary markets that enable the conversion of analog video signals to digital form and perform advanced digital video processing to facilitate the display, storage and transport of video content. We believe this application specific product strategy allows us to better address varying customer requirements, fully leverage our technology capabilities and achieve greater share within our two core markets. To a lesser extent, we market and sell video decoders to the consumer market. Our semiconductors are based on our proprietary architecture and mixed signal technologies that we believe provide high video quality under a wide range of signal conditions, enable high levels of integration and are cost-effective.
Our business has experienced significant growth primarily as a result of our ability to develop new products, obtain design wins and convert these design wins into revenue. We generated revenue from the sale of over 25 different products in 2009.
We have three principal semiconductor product lines: security surveillance products, automotive infotainment products and consumer products. Our security surveillance products integrate important functions required to display, store and transport analog video signals from security surveillance cameras. For example, we integrate multiple video decoders into a single semiconductor. As a result, this semiconductor is able to receive and decode analog video signals from multiple cameras into a standard digital format. In addition, we integrate a multiplexor, a key technology required to combine multiple video signals into a single video signal, and a display processor, a key technology required to display multiple video channels. In 2007, we introduced our first integrated security surveillance product, which integrated four video decoders and a system controller and a multiplexor on a single semiconductor. In December 2008, we introduced a new security surveillance product which includes a 16 channel multiplexer and supports the display of multiple standard definition and high definition video sources. We currently sell our security surveillance products to customers for the following applications: embedded digital video recorders, or DVRs, PC-based DVRs, networked video recorders, or NVRs, and multiplexors.
Our automotive infotainment products integrate important functions required to display popular analog video, high definition video and PC graphics signals on a LCD display. These key functions include a video decoder, deinterlacer and scaler. In addition, our newer generation automotive infotainment products integrate a timing controller to interface directly with certain types of LCD displays and image enhancement functionality to improve overall video quality. In January 2008, we announced the introduction of five new LCD display processors designed for the automotive end market. These new products are designed to provide advanced image processing, an integrated programmable timing controller and multiple analog and digital video inputs.
Our consumer products are high performance mixed signal semiconductors that decode analog broadcast and video signals, including NTSC, PAL and SECAM, and popular analog video signals, including composite, S-Video, component and SCART, into a standard digital format. Our consumer products integrate proprietary sync processing, color demodulating and digital 2D and 3D comb filtering, which are the key technologies required for high performance video decoding. We offer a broad range of consumer products at various price points and with varying features. We have developed our video decoder products for applications within the consumer markets such as advanced TV,
32
multifunction LCD monitor, DVD recorder and camcorders. In the future, however, we intend to focus our development efforts specifically on applications for the security surveillance and automotive infotainment markets and as a result, we anticipate our consumer revenue will decline over the next several quarters.
Our other products include early generation mixed signal semiconductors for digital video applications and PCI video decoder products, which are video decoders that utilize peripheral component interconnect, or PCI, technology for personal computer applications.
We currently expect to increase our expense levels in the future to support increased research and development efforts in order to bring new products to our primary markets. These expenditures may not result in increased revenue or profitability in the future. In addition, our ability to increase our revenue will depend on increased demand for digital video applications in the security surveillance and automotive infotainment markets. Although we believe our two primary markets will experience growth in the next few years, actual growth of these markets is uncertain. In addition, the timing of orders by and shipments to our customers, as well as general trends in our two primary markets, can cause our revenue growth to be inconsistent.
We undertake significant product development efforts well in advance of a product's release, and in advance of receiving purchase orders from our customers. Our product development efforts, which are focused on developing new designs with broad demand and potential for future derivative products, typically take from six to 24 months until production begins, depending on the product's complexity. If we secure a design win, the system designer is likely to continue to use the same or enhanced versions of our product across a number of their models, which tends to extend the life cycles of our products. Conversely, if a competitor secures the design win, it may be difficult for us to sell into the customer's application for an extended period. Our sales cycle typically ranges from six to 24 months. Due to the length of our product development and sales cycle, the majority of our revenue for any period is generally weighted toward products introduced for sale, meaning products for which we commenced placing orders with our manufacturing subcontractors, in the prior one or two years. As a result, our present revenue is not necessarily representative of future sales because our future sales are likely to be comprised of a different mix of products, some of which are now in the development stage.
As a fabless semiconductor company, we outsource all of our manufacturing, assembly and test functions to third-party vendors primarily located in Taiwan. This business model enables us to reduce our capital expenditures and fixed costs, while focusing our engineering and design resources on our core strength, the design of mixed signal semiconductors for digital video applications.
We sell our products to distributors that fulfill third-party orders for our products. We also sell directly, using independent sales representatives, to original equipment manufacturers, or OEMs, and to original design manufacturers, or ODMs. In 2009, we derived 72% of our revenue from products sold to distributors and 28% from products sold to OEMs or ODMs. In 2008, we derived 79% of our revenue from products sold to distributors and 21% from products sold to OEMs or ODMs. In 2007, we derived 77% of our revenue from products sold to distributors and 23% from products sold to OEMs or ODMs. Our gross margins have not historically been significantly different between sales to distributors and sales to OEMs or ODMs through orders procured by independent sales representatives. However, our operating profit on sales through orders procured by independent sales representatives can be less due to the payment of commissions to sales representatives which we record as sales and marketing expense.
We received an aggregate of 69%, 79% and 78% of our revenue from our ten largest customers in 2009, 2008 and 2007, respectively. Lacewood International Corporation, a distributor, accounted for 35%, 34% and 22% of our revenue in 2009, 2008 and 2007 respectively.
33
We derive substantially all of our revenue from sales to foreign customers, particularly in Asia, which sales accounted for 97%, 98% and 98% of our revenue in 2009, 2008 and 2007, respectively. The table below indicates the percentage of total revenue by geographic location for the periods indicated:
| |
Year Ended December 31, |
||||||||||
|---|---|---|---|---|---|---|---|---|---|---|---|
| |
2009 | 2008 | 2007 | ||||||||
China |
54 | % | 37 | % | 26 | % | |||||
South Korea |
21 | 27 | 29 | ||||||||
Taiwan |
16 | 29 | 40 | ||||||||
Japan |
6 | 5 | 3 | ||||||||
Other |
3 | 2 | 2 | ||||||||
Total revenue |
100 | % | 100 | % | 100 | % | |||||
We received 54%, 37% and 26% of our revenue from China in 2009, 2008 and 2007, respectively. The percentage increase between 2009, 2008 and 2007 was primarily due to an increase in revenue from our security surveillance customers in China who are benefitting from the relative strength in the Chinese domestic economy. We received 16%, 29% and 40% of our revenue from Taiwan in 2009, 2008 and 2007, respectively. The decrease was primarily due to a decline in revenue from consumer markets, whose products were primarily sold to customers in Taiwan.
We believe that a substantial majority of our revenue will continue to come from customers located in Asia, where most of the electronic devices that use our semiconductors are manufactured. As a result of this regional customer concentration, we may be subject to environmental, economic, cultural and political events as well as other developments that impact our customers in Asia. All of our sales currently are denominated in U.S. dollars. Therefore, an increase in the value of the U.S. dollar relative to foreign currencies could make our products less competitive in international markets. Substantially all of our cost of revenue and a majority of our operating expenses are also denominated in U.S. dollars. As a result, we believe that our overall exposure to foreign exchange risk is low.
On October 9, 2009, we acquired substantially all of the assets of a development stage company with operations based in China. The purchase price for the acquisition was $3.2 million, less assumed liabilities of approximately $0.7 million. We paid the purchase price in cash and agreed to make restricted stock awards, which will vest over four years, to employees in connection with their new employment with us. The new employees are focused on developing video solutions for the security surveillance market. As part of the purchase agreement, we extended employment offers to approximately 40 employees, substantially all of whom are research and development personnel.
As of December 31, 2009, we had three international subsidiaries, one in Japan and two in China. We also have two international branches, one in South Korea and one in Taiwan. As of December 31, 2009, 102 of our 206 employees were located in our international subsidiaries and branch offices. Our China and Japan subsidiaries are involved in both product development and technical marketing support. Our Taiwan and Korea branches primarily provide technical marketing support.
It is difficult for us to forecast the demand for our products, in part because of the highly complex supply chain between us and the end markets that incorporate our products. Demand for new features changes rapidly. Distributors and ODMs add an additional layer of complexity. We must, therefore, forecast demand not only from our direct customers, but also from other participants in this multi-level distribution channel. Because of our lengthy product development cycle, it is critical for us to anticipate changes in demand for our various product features and the applications they serve, to allow sufficient time for product design. Our failure to accurately forecast demand can lead to product shortages that can impede production by our customers and harm our relationship with these customers. Conversely,
34
our failure to forecast declining demand or shifts in product mix can result in excess or obsolete inventory.
Generally, the average selling price of our products will decline over the life of the product. Our experience to date is that the decline has not had a material effect on our gross margins, as price reductions have been mitigated by lower per unit costs associated with both high unit volume and the transition of our products to smaller process geometries.
We expect our revenue to be lower in the first calendar quarter of each year. The most significant factor for this decline is because most of our semiconductors are sold to customers located in Asia, primarily to customers located in regions who observe the Lunar New Year holiday. Typically, our customers' offices are closed for a week or more during the extended holiday period, which negatively impacts our business during the first calendar quarter of the year. As a result of seasonality associated with our customer concentration in Asia, we expect our revenue to be lower in the first calendar quarter of each year.
Critical Accounting Policies
Our discussion and analysis of our financial condition and results of operations are based upon our consolidated financial statements, which have been prepared in accordance with accounting principles generally accepted in the United States. The preparation of these consolidated financial statements requires us to make estimates and judgments that affect the reported amount of assets, liabilities, revenue and expenses and related disclosure of contingent assets and liabilities. We evaluate our estimates on an on-going basis, including those related to inventory valuations, valuation of investments, income taxes and stock-based compensation. We base our estimates on historical experience and on various other assumptions that we believe to be reasonable under the circumstances, the results of which form the basis for making the judgments we make about the carrying values of assets and liabilities that are not readily apparent from other sources. Because these estimates can vary depending on the situation, actual results may differ from the estimates.
We believe the following critical accounting policies affect our more significant judgments used in the preparation of our consolidated financial statements.
Revenue Recognition. We recognize revenue when all of the following criterias are met: (i) persuasive evidence of an arrangement exists, (ii) delivery has occurred, (iii) the price to the customer is fixed or determinable, and (iv) collection of the resulting receivable is reasonably assured. We do not allow for price protection or stock rotation rights with any of our distributors. If we change our practice and allow stock rotation or price protection in the future, we would have to evaluate the consequences on the timing of our revenue recognition, which could lead to the deferral of the revenue subject to such uncertainties unless reasonable estimates of returns or price reductions can be made at the time of shipment.
Fair Value Measurements. Effective January 1, 2008, we adopted the authoritative guidance for fair value measurements and the fair value option for financial assets and financial liabilities. The guidance defines fair value, establishes a framework for measuring fair value and expands disclosures about fair value measurements required under other accounting guidance. The guidance clarifies that fair value is an exit price, representing the amount that would be received to sell an asset or paid to transfer a liability in an orderly transaction between market participants and also requires that a fair value measurement reflect the assumptions market participants would use in pricing an asset or liability based on the best information available. Assumptions include the risks inherent in a particular valuation technique (such as a pricing model) and/or the risks inherent in the inputs to the model. These assumptions are volatile and subject to change as the underlying sources of these assumptions and market conditions change. Refer to Note 2 to our consolidated financial statements for the fair value hierarchy and inputs to valuation techniques and fair value measurements of financial assets carried at fair value.
35
Inventory Valuation. We write down the carrying value of our inventory to net realizable value for estimated obsolescence or unmarketable inventory in an amount equal to the difference between the cost of inventory and its estimated realizable value based upon assumptions about future demand and market conditions. We evaluate inventory for excess and obsolescence and write-down units that are unlikely to be sold based upon a six month demand forecast. This evaluation may take into account matters including expected demand, anticipated sales price, product obsolescence and other factors. If actual future demand for our products is less than currently forecasted, additional inventory write-downs may be required. Once inventory costs are written down, such revised costs are maintained until the product is sold or scrapped. If a unit that has been written down is subsequently sold, the cost associated with the revenue from this unit is reduced to the extent of the write-down, resulting in an increase in gross profit.
Purchased Intangible Assets. We evaluate intangible assets for impairment when we believe indicators of impairment exist. The value of our intangible assets could be impacted by future adverse changes such as: (i) any future declines in our operating results, (ii) a further significant slowdown in the worldwide economy or the semiconductor industry, (iii) any failure to meet the performance projections included in our forecasts of future operating results or (iv) the abandonment of any of our acquired in-process research and development projects.
Effective January 1, 2009, in-process research and development, or IPR&D, acquired are capitalized. The amounts and useful lives assigned to intangible assets acquired impact the amount and timing of future amortization thereof. IPR&D is considered an indefinite lived asset and will not begin amortization until completed or disposed. Until such events IPR&D is required to be tested annually for impairment by comparing the fair value to the carrying value. Developed technology is amortized using a method that reflects the pattern in which the economic benefit is consumed or otherwise used up or, if that pattern cannot be reliably determined, using a straight-line amortization method. When necessary, reviews of developed technology are performed to determine whether the carrying value of an asset is impaired based on comparisons to undiscounted expected future cash flows. If this comparison indicates that there is impairment, the impaired asset is written down to fair value, which is typically calculated using discounted expected future cash flows utilizing an appropriate discount rate. Impairment is based on the excess of the carrying amount over the fair value of those assets.
Deferred Taxes and Uncertain Tax Positions. We utilize the asset and liability method of accounting for income taxes, under which deferred taxes are determined based on the temporary differences between the financial statement and tax basis of assets and liabilities using tax rates expected to be in effect during the years in which the basis differences reverse. A valuation allowance is recorded when it is more likely than not that some of the deferred tax assets will not be realized.
Income tax positions must meet a more-likely-than-not recognition threshold to be recognized. Income tax positions that previously failed to meet the more-likely-than-not threshold are recognized in the first subsequent financial reporting period in which that threshold is met. Previously recognized tax positions that no longer meet the more-likely-than-not threshold are derecognized in the first subsequent financial reporting period in which that threshold is no longer met. The Company recognizes potential accrued interest and penalties related to unrecognized tax benefits within the consolidated statements of operations as income tax expense.
We assess the recoverability of our deferred tax assets. To assess the likelihood that the deferred tax assets will be recovered from future taxable income, we considered both positive evidence that indicates a valuation allowance is not needed and negative evidence that indicates a valuation allowance is needed. As of December 31, 2009, we believe that our predictable strong earnings provide ample evidence that no valuation allowance is required at this time as it is more likely than not the deferred tax assets will be realized in the future.
36
Management believes it is more likely than not that forecasted income, including income that may be generated as a result of certain tax planning strategies, together with the tax effects of the deferred tax liabilities, will be sufficient to fully recover the remaining deferred tax assets. In the event that we determine all or part of the net deferred tax assets are not realizable in the future, we will make an adjustment to the valuation allowance that would be charged to earnings in the period such determination is made. In addition, the calculation of tax liabilities involves significant judgment in estimating the impact of uncertainties. Resolution of these uncertainties in a manner inconsistent with management's expectations could have a material impact on our financial condition and operating results.
Significant judgment is required in evaluating our uncertain tax positions and determining our provision for income taxes. Although we believe we have adequately reserved for our uncertain tax positions, no assurance can be given that the final tax outcome of these matters will not be different. We adjust these reserves in light of changing facts and circumstances, such as the closing of a tax audit or the refinement of an estimate. To the extent that the final tax outcome of these matters is different than the amounts recorded, such differences will impact the provision for income taxes in the period in which such determination is made. The provision for income taxes includes the impact of reserve provisions and changes to reserves that are considered appropriate, as well as the related net interest.
We file income tax returns in the U.S. federal jurisdiction, various states and foreign jurisdictions. We are currently under examination by the Internal Revenue Service for the tax years 2007 and 2008. Management believes that it has adequately provided for any adjustments that may result from this examination, however, the outcome of tax audits cannot be predicted with certainty. Should any issues addressed in these tax audits be resolved in a manner not consistent with management's expectations, we will be required to adjust our provision for income tax in the period such resolution occurs.
Stock-Based Compensation. All share-based awards, including grants of stock options and restricted stock units, are required to be recognized in our financial statements based upon their respective grant date fair values. The fair value of each employee stock option is estimated on the date of grant using an option pricing model that meets certain requirements. We currently use the Black-Scholes option pricing model to estimate the fair value of our stock options. Although we utilize the Black-Scholes model, which meets established requirements, the fair values generated by the model may not be indicative of the actual fair values of our equity awards as it does not consider certain factors important to those awards to employees, such as continued employment and periodic vesting requirements as well as limited transferability. The determination of the fair value of share-based payment awards utilizing the Black-Scholes model is affected by our stock price and a number of assumptions, including expected volatility, expected life, risk-free interest rate and expected dividends.
In 2009, 2008 and 2007, stock-based compensation expense includes compensation costs related to estimated fair values of stock options and awards granted after January 1, 2006 and compensation costs related to awards outstanding at January 1, 2006, such as unvested stock options, that were recognized based on the intrinsic values.
For options granted after January 1, 2006, we use the straight-line method for expense attribution. For options granted prior to January 1, 2006, we use the multiple grant approach for expense attribution, which results in substantially higher amounts of amortization in earlier years as opposed to the straight-line method, which results in equal amortization over the vesting period of the options.
The fair value of options granted after January 1, 2006 is estimated on the grant date using the Black-Scholes option valuation model. For 2009 and 2008, the expected term assumption calculation was based on historical data as adjusted for any changes in future expectations. For 2007, we used the simplified calculation of expected term. For 2009 and 2008, we relied exclusively on historical volatility for the expected volatility assumption calculation since we do not have any publicly traded options. For 2007, volatility was based on an average of the historical volatilities of the common stock of several
37
entities with characteristics similar to us since our stock had been actively trading for only a short period of time. The risk-free rate is based on the U.S. Treasury yield curve in effect at the time of grant for periods corresponding with the expected term of the option and the estimated forfeiture rate is based on historical pre-vest cancellation experience.
The following assumptions were used to value stock options granted in the periods presented:
| |
Year Ended December 31, | |||||||||
|---|---|---|---|---|---|---|---|---|---|---|
| |
2009 | 2008 | 2007 | |||||||
Expected term (years) |
4.34 | 4.28 | 6.08 | |||||||
Risk-free interest rate |
1.5–2.0% | 1.8–2.9% | 4.6–4.8% | |||||||
Expected volatility |
53.0–54.0% | 51.0–64.0% | 65.1–70.6% | |||||||
Expected dividend |
— | — | — | |||||||
Stock-based compensation expense for restricted stock awards is determined using the fair value of our stock on the date of the grant and is recognized on a straight-line basis over the service period.
Stock-based compensation expense is allocated among cost of revenue, research and development expenses and selling, general and administrative expenses, respectively, based upon the employee's job function. We expect to continue to recognize substantial amounts of stock-based compensation expense relating to our employee stock options and awards in future periods.
We evaluate the assumptions used to value stock awards on a quarterly basis. If factors change and we employ different assumptions, stock-based compensation expense may differ significantly from what we have recorded in the past. If there are any modifications or cancellations of the underlying unvested securities, we may be required to accelerate, increase or cancel any remaining unearned stock-based compensation expense.
Results of Operations
The following table is derived from our selected consolidated financial data and sets forth our historical operating results as a percentage of revenue:
| |
Year Ended December 31, | |||||||||||
|---|---|---|---|---|---|---|---|---|---|---|---|---|
| |
2009 | 2008 | 2007 | |||||||||
Revenue |
100.0 | % | 100.0 | % | 100.0 | % | ||||||
Cost of revenue* |
39.0 | 37.9 | 40.4 | |||||||||
Gross profit |
61.0 | 62.1 | 59.6 | |||||||||
Operating expenses: |
||||||||||||
Research and development* |
31.1 | 25.3 | 20.5 | |||||||||
Selling, general and administrative* |
23.6 | 21.7 | 20.5 | |||||||||
Total operating expenses |
54.7 | 47.0 | 41.0 | |||||||||
Income from operations |
6.3 | 15.1 | 18.6 | |||||||||
Interest income |
2.2 | 3.4 | 5.2 | |||||||||
Income before income taxes |
8.5 | 18.5 | 23.8 | |||||||||
Income tax provision (benefit) |
3.0 | 7.0 | (0.9 | ) | ||||||||
Net income |
5.5 | % | 11.5 | % | 24.7 | % | ||||||
- *
- Percentages include stock-based compensation
38
The following table indicates the percentage of stock-based compensation attributed to each item as a percentage of revenue:
| |
Year Ended December 31, | |||||||||
|---|---|---|---|---|---|---|---|---|---|---|
| |
2009 | 2008 | 2007 | |||||||
Cost of revenue |
0.8 | % | 0.7 | % | 0.5 | % | ||||
Research and development |
6.2 | 4.9 | 3.1 | |||||||
Selling, general and administrative |
5.2 | 5.2 | 4.1 | |||||||
The following table sets forth our revenue by our principal product lines (dollar amounts, in thousands):
| |
Year Ended December 31, | |||||||||||||||||||
|---|---|---|---|---|---|---|---|---|---|---|---|---|---|---|---|---|---|---|---|---|
| |
2009 | 2008 | 2007 | |||||||||||||||||
| |
Amount | % of Revenue |
Amount | % of Revenue |
Amount | % of Revenue |
||||||||||||||
Security surveillance |
$ | 44,512 | 70.4 | % | $ | 52,683 | 77.9 | % | $ | 40,571 | 67.8 | % | ||||||||
Automotive infotainment |
12,431 | 19.7 | 7,059 | 10.4 | 6,015 | 10.0 | ||||||||||||||
Consumer |
6,188 | 9.8 | 7,636 | 11.3 | 12,344 | 20.6 | ||||||||||||||
Other(1) |
43 | 0.1 | 258 | 0.4 | 957 | 1.6 | ||||||||||||||
Total revenue |
$ | 63,174 | 100.0 | % | $ | 67,636 | 100.0 | % | $ | 59,887 | 100.0 | % | ||||||||
- (1)
- Consists of contract development projects, early generation mixed signal semiconductors for digital video applications and PCI video decoder products.
Comparisons of the Year Ended December 31, 2009, 2008 and 2007
Revenue. Our revenue consist of sales of our mixed signal integrated circuits for digital video applications. We have three principal product lines: security surveillance, automotive infotainment and consumer. All of our sales are denominated in U.S. dollars.
Revenue was $63.2 million in 2009 and $67.6 million in 2008, a decrease of 7% due to a general decrease in demand for our security surveillance and consumer products primarily as a result of the global economic downturn, partially offset by an increase in demand for our automotive infotainment products. However, total revenue in the last two quarters of 2009 were $40.8 million, an increase of 16% when compared to the same period a year ago. Revenue from our automotive infotainment products increased $5.4 million, or 76%, in 2009 compared to 2008 due primarily to previously awarded design wins with customers increasingly moving into volume production.
Revenue was $67.6 million in 2008 and $59.9 million in 2007, an increase of 13%. Revenue from our security surveillance products was $52.7 million, an increase of approximately $12.1 million, or 30%, in 2008 compared to 2007, primarily as a result of an increase in sales of our integrated four-in-one security surveillance products. Revenue from our automotive infotainment products was $7.1 million, an increase of $1.0 million, or 17%, in 2008 compared to 2007 primarily due to an increase in demand for vehicles with an in-car LCD displays that utilize our products. Revenue from our consumer products was $7.6 million, a decrease of $4.7 million, or 38%, in 2008 compared to 2007 primarily due to a decrease in demand for our general purpose video decoders. Other revenue decreased to $0.3 million in 2008 compared to $1.0 million in 2007 due primarily to decreased sales of our PCI video decoder products.
Gross Profit and Gross Margin. Gross profit is the difference between revenue and cost of revenue, and gross margin represents gross profit as a percentage of revenue. Costs of revenue, also
39
known as costs of goods sold, consists primarily of the cost of processed silicon wafers, costs associated with assembly, test and shipping of our production semiconductors, cost of personnel and related expenses associated with supporting our outsourced manufacturing activities and write-downs for excess and obsolete inventory.
Gross profit was $38.5 million, $42.0 million and $35.7 million in 2009, 2008 and 2007, respectively.
Gross margin was 61%, 62% and 60% in 2009, 2008 and 2007, respectively. The decrease in gross margin between 2009 and 2008 is due to production variances and changes in product mix. The increase in gross margin between 2008 and 2007 was primarily due to reduced unit materials and production costs partially attributable to increased volume purchases and the increasing transition of our products to lower process geometries.
We incurred stock-based compensation included in cost of revenue associated with outsourced manufacturing support and quality assurance personnel of $0.5 million, $0.5 million and $0.3 million in 2009, 2008 and 2007, respectively.
Research and Development Expenses. Research and development expenses consist primarily of compensation and associated costs of employees engaged in research and development, contractor costs, tape-out costs, development testing and evaluation costs, occupancy costs and depreciation expense. Before releasing new products, we incur charges for mask sets, prototype wafers and mask set revisions, which we refer to as tape-out costs. Tape-out costs cause our research and development expenses to fluctuate because they are not incurred uniformly every quarter. We incurred $2.7 million, $2.5 million and $2.2 million of tape-out expenses in 2009, 2008 and 2007, respectively. We expect our research and development costs to increase in absolute dollars in the future as we increase our investment in developing new products and headcount to support our development efforts.
Research and development expenses were $19.6 million, or 31% of revenue, in 2009, $17.1 million, or 25% of revenue, in 2008 and $12.3 million, or 21% of revenue, in 2007. The increase in research and development expenses from 2008 to 2009 of $2.4 million and from 2007 to 2008 of $4.8 million was primarily attributable to increased compensation-related expenses, reflecting both increases in stock-based compensation and in headcount to support the development of new products and technologies.
We incurred stock-based compensation expense associated with research and development personnel of $3.9 million, $3.3 million and $1.8 million in 2009, 2008 and 2007, respectively. These increases in stock-based compensation expenses were a result of an increase in personnel in research and development.
Selling, General and Administrative Expenses. Selling, general and administrative expenses consist primarily of compensation and associated costs for marketing, selling and administrative personnel, sales commissions to independent sales representatives, public relations, promotional and other marketing expenses, insurance and fees paid for professional services, travel, depreciation expenses and occupancy costs. Costs associated with audit and tax services, corporate governance and compliance and financial reporting are also included in selling, general and administrative expenses. We expect selling, general and administrative expenses to remain relatively constant in absolute dollars for 2010.
Selling, general and administrative expenses were $14.9 million, or 24% of revenue, in 2009, $14.7 million, or 22% of revenue, in 2008 and $12.3 million, or 21% of revenue, in 2007. The increase in selling, general and administrative expenses in 2008 over 2007 was attributable to increases of $1.7 million in compensation-related expenses primarily associated with stock-based compensation and $0.5 million of non-compensation related expenses associated with the expansion of our foreign offices.
We incurred stock-based compensation expense associated with selling, general and administrative personnel of $3.3 million, $3.5 million and $2.4 million in 2009, 2008 and 2007, respectively. The increase in stock-based compensation from 2007 to 2008 was primarily a result of granting restricted
40
stock to employees instead of options. The fair value of the options are typically lower then restricted stock awards because options are valued based on an option pricing model, whereas stock awards are valued based on the stock price on the date of grant.
Interest Income. Interest income was $1.4 million, $2.3 million and $3.1 million in 2009, 2008 2007, respectively. These decreases were primarily due to lower rates of return on our cash equivalents and investments partially offset by higher cash equivalents and investment balances.
Provision for Income Taxes. Our provision for income taxes was $1.9 million and $4.7 million in 2009 and 2008, respectively. A benefit from income taxes of $0.5 million was recorded in 2007. Our effective tax rate was 35%, 38% and (4)% in 2009, 2008 and 2007, respectively. The effective tax rate for 2009 and 2008 differed from the statutory federal income tax rate primarily due to stock-based compensation, research and development credits and state income taxes. The effective tax rate for 2007 differed from the statutory federal income tax rate because we recognized a tax benefit from the release of our valuation allowance on our deferred tax assets of approximately $5.5 million. We expect our effective rate in 2010 to remain consistent with 2009. However, our future effective income tax rate will be subject to many variables, including the absolute amount and future geographic distribution of our pre-tax income and our ability to take advantage of tax planning strategies that may be available to us.
Liquidity and Capital Resources
Since our inception, we have financed our growth primarily with proceeds from the issuance of preferred stock and common stock and cash flow generated by our operations. Our cash and cash equivalents and short-term and long-term investments were $94.5 million as December 31, 2009.
Net cash from operating activities
Net cash provided by operating activities was $16.1 million for 2009. The net cash provided by operating activities was primarily due to our net income of $3.5 million, non-cash charges for stock-based compensation of $7.7 million, an increase in accounts payable of $3.3 million due to timing of purchases and related payments, an increase in accrued liabilities of $3.0 million due to increases in accrued expenses, primarily for income taxes and a decrease in accounts receivable of $1.1 million due to timing of customer collections. These were partially offset by an increase in inventory of $3.2 million due to increased purchases in response to increased customer demand.
Net cash provided by operating activities was $15.3 million for 2008. The cash provided by our operating activities was primarily due to our net income of $7.8 million and non-cash charges for stock-based compensation of $7.3 million.
Net cash provided by operating activities was $14.4 million for 2007. The cash provided by our operating activities was primarily due to our net income of $14.7 million and non-cash charges for stock-based compensation of $4.5 million. These were partially offset by a $5.4 million increase in deferred income taxes, which was a non-cash charge resulting from the release of a valuation allowance.
Net cash from investing activities
Net cash used in investing activities was $53.5 million for 2009 due to the purchases of our investments of $82.7 million and cash used in our acquisition of a development stage company of $2.3 million, partially offset by maturities of our investments of $31.9 million.
Net cash provided by investing activities was $2.7 million for 2008 reflecting maturities of short-term investments of $72.2 million offset by purchases of short and long-term investments of $68.9 million.
41
Net cash used in investing activities was $1.1 million for 2007 reflecting purchases of short and long-term investments of $93.7 million and purchases of capital equipment of $1.3 million offset by maturities of short-term investments of $93.8 million.
Net cash from financing activities
Net cash used in financing activities was $0.8 million for 2009 due to repurchases of common stock upon release of restricted stock awards of $1.2 million offset by proceeds from the exercise of stock options of $0.4 million.
Net cash used in financing activities was $0.7 million for 2008 and primarily consisted of repurchases of common stock upon release of restricted stock awards of $1.2 million offset by proceeds from the exercise of stock options of $0.5 million.
Net cash provided by financing activities was $0.7 million for 2007 reflecting proceeds from the exercise of stock options.
As of December 31, 2009, we held $6.3 million of investments with an auction reset feature, which are referred to as auction rate securities, or ARS, whose underlying assets are generally student loans which are substantially backed by the federal government. In February and March of 2008, auctions failed for our ARS, and there is no assurance that successful auctions of any ARS in our investment portfolio will occur in the future. An auction failure means that the parties wishing to sell securities could not. All of our ARS were rated AAA at the time of purchase, and continue to be rated AAA, the highest rating, by a rating agency.
During the fourth quarter of 2008, we entered into an agreement with one of our investment providers, which currently holds all of our ARS and from whom we had purchased the ARS, to sell, at our discretion, at par value all of the ARS we currently hold back to the investment provider at anytime starting in June 2010. Absent this agreement, our ability to liquidate our ARS investment and fully recover the carrying value of our investment in the near term may be limited or not exist. We have classified these ARS investments as short-term investments because our sale of the ARS back to the investment provider is expected to occur in June 2010. We are continuing to evaluate the credit quality, classification and valuation of our ARS, but based on our expected operating cash flows, and our other sources of cash, we do not anticipate the potential near term lack of liquidity on these investments will affect our ability to execute our current business plan.
We believe our existing cash and cash equivalents and short-term and long-term investments, as well as cash expected to be generated from operating activities will be sufficient to meet our anticipated cash needs for at least the next 12 months. Our long-term future capital requirements will depend on many factors, including our level of revenue, the timing and extent of spending to support our product development efforts, the expansion of sales and marketing activities, the timing of our introductions of new products, the costs to ensure access to adequate manufacturing capacity and the continuing market acceptance of our products. We could be required, or could elect, to seek additional funding through public or private equity or debt financing and additional funds may not be available on terms acceptable to us or at all.
Off-Balance Sheet Arrangements
As of December 31, 2009, we had no off-balance sheet arrangements as defined in Item 303(a)(4) of the Securities and Exchange Commission's Regulation S-K.
42
Contractual Obligations
The following table identifies our commitments to settle contractual obligations as of December 31, 2009 (in thousands):
| |
Payments Due by Period | ||||||||||||
|---|---|---|---|---|---|---|---|---|---|---|---|---|---|
| |
Total | Less than 1 Year |
1–3 Years | 4–5 Years | |||||||||
Operating lease obligations |
$ | 1,551 | $ | 563 | $ | 924 | $ | 64 | |||||
Purchase commitments |
3,013 | 3,013 | — | — | |||||||||
Total commitments |
$ | 4,564 | $ | 3,576 | $ | 924 | $ | 64 | |||||
Recent Accounting Pronouncements
For a description of recent accounting pronouncements, including the expected dates of adoption and estimated effects, if any, on our consolidated financial statements, refer to Note 1 to our consolidated financial statements.
ITEM 7A. Quantitative and Qualitative Disclosures About Market Risk
The primary objectives of our investment activities are to preserve principal, provide liquidity and maximize income without significantly increasing the risk. Some of the securities we invest in are subject to market risk. This means that a change in prevailing interest rates may cause the principal amount of the investment to fluctuate. To minimize this risk, we maintain our portfolio of cash equivalents, short and long-term investments in demand accounts, money market funds, commercial paper, corporate bonds, U.S. government agency securities and ARS which are investment grade securities with a maximum dollar weighted maturity of two years or less. The risk associated with fluctuating interest rates is limited to our investment portfolio, and we believe that a 10% change in interest rates would not have a significant impact on our interest income.
As of December 31, 2009, we held $6.3 million of investments with an auction reset feature (ARS), whose underlying assets are generally student loans which are substantially backed by the federal government. In February and March of 2008, auctions failed for our ARS. An auction failure means that the parties wishing to sell securities could not. All of our ARS were rated AAA at the time of purchase and are still rated AAA as of December 31, 2009, the highest rating, by a rating agency. During the fourth quarter of 2008, we entered into an agreement with one of our investment providers, which currently holds all of our ARS and from whom we had purchased the ARS, to sell, at our discretion, at par value the ARS we currently hold back to the investment provider at anytime starting in June 2010. We have classified our ARS investment as a short-term investment on the consolidated balance sheet because the sale of the ARS back to our investment provider is expected to occur in June 2010. Refer to Note 2 to our consolidated financial statements for additional discussions regarding our ARS and related put option.
To date, our international customer agreements have been denominated solely in U.S. dollars, and accordingly, we have not been exposed to foreign currency exchange rate fluctuations from customer agreements, and do not currently engage in foreign currency hedging transactions. However, the functional currency of our foreign operations is the U.S. dollar and our local accounts are maintained in the local currency, and thus we are subject to foreign currency exchange rate fluctuations associated with remeasurement to U.S. dollars. Such fluctuations have not been significant historically, and we believe that a 10% change in exchange rates would not have a significant impact on our operating expenses.
43
ITEM 8. Financial Statements and Supplementary Data
Index to Consolidated Financial Statements
44
REPORT OF INDEPENDENT REGISTERED PUBLIC ACCOUNTING FIRM
To
the Board of Directors and Stockholders of
Techwell, Inc.
San Jose, California
We have audited the accompanying consolidated balance sheets of Techwell Inc. and subsidiaries (the "Company") as of December 31, 2009 and 2008, and the related consolidated statements of operations, stockholders' equity and comprehensive income, and cash flows for each of the three years in the period ended December 31, 2009. These consolidated financial statements are the responsibility of the Company's management. Our responsibility is to express an opinion on these consolidated financial statements based on our audits.
We conducted our audits in accordance with the standards of the Public Company Accounting Oversight Board (United States). Those standards require that we plan and perform the audit to obtain reasonable assurance about whether the financial statements are free of material misstatement. An audit includes examining, on a test basis, evidence supporting the amounts and disclosures in the financial statements. An audit also includes assessing the accounting principles used and significant estimates made by management, as well as evaluating the overall financial statement presentation. We believe that our audits provide a reasonable basis for our opinion.
In our opinion, such consolidated financial statements present fairly, in all material respects, the financial position of Techwell, Inc. and subsidiaries as of December 31, 2009 and 2008, and the results of their operations and their cash flows for each of the three years in the period ended December 31, 2009, in conformity with accounting principles generally accepted in the United States of America.
We have also audited, in accordance with the standards of the Public Company Accounting Oversight Board (United States), the Company's internal control over financial reporting as of December 31, 2009, based on the criteria established in Internal Control—Integrated Framework issued by the Committee of Sponsoring Organizations of the Treadway Commission and our report dated March 23, 2010 expressed an adverse opinion on the Company's internal control over financial reporting because of a material weakness.
/s/ DELOITTE & TOUCHE LLP
San
Jose, California
March 23, 2010
45
TECHWELL, INC.
CONSOLIDATED BALANCE SHEETS
(in thousands, except par value amount)
| |
December 31, | ||||||||
|---|---|---|---|---|---|---|---|---|---|
| |
2009 | 2008 | |||||||
ASSETS |
|||||||||
Current assets: |
|||||||||
Cash and cash equivalents |
$ | 6,404 | $ | 44,485 | |||||
Short-term investments. |
53,093 | 17,582 | |||||||
Accounts receivable |
926 | 1,985 | |||||||
Inventory |
7,937 | 4,780 | |||||||
Deferred income tax assets |
652 | 1,353 | |||||||
Prepaid expenses and other current assets |
2,066 | 1,200 | |||||||
Total current assets |
71,078 | 71,385 | |||||||
Property and equipment, net |
1,033 | 1,290 | |||||||
Long-term investments. |
34,967 | 19,350 | |||||||
Deferred income tax assets |
4,796 | 4,031 | |||||||
Purchased intangibles, net |
2,996 | — | |||||||
Other assets |
557 | 1,308 | |||||||
TOTAL ASSETS |
$ | 115,427 | $ | 97,364 | |||||
LIABILITIES AND STOCKHOLDERS' EQUITY |
|||||||||
Current liabilities: |
|||||||||
Accounts payable |
$ | 5,529 | $ | 2,221 | |||||
Accrued liabilities |
6,009 | 2,117 | |||||||
Total current liabilities |
11,538 | 4,338 | |||||||
Other non-current liabilities |
72 | 122 | |||||||
Total liabilities |
11,610 | 4,460 | |||||||
Commitments and contingencies (see Note 8) |
|||||||||
Stockholders' equity: |
|||||||||
Preferred stock, $0.001 par value; 10,000 shares authorized and no shares issued and outstanding |
— | — | |||||||
Common stock, $0.001 par value; 250,000 shares authorized; 21,958 shares and 21,347 shares issued and outstanding at December 31, 2009 and 2008, respectively |
22 | 21 | |||||||
Additional paid-in capital |
87,594 | 80,240 | |||||||
Deferred stock-based compensation |
— | (19 | ) | ||||||
Retained earnings |
15,989 | 12,493 | |||||||
Accumulated other comprehensive income |
212 | 169 | |||||||
Total stockholders' equity |
103,817 | 92,904 | |||||||
TOTAL LIABILITIES AND STOCKHOLDERS' EQUITY |
$ | 115,427 | $ | 97,364 | |||||
See accompanying notes.
46
TECHWELL, INC.
CONSOLIDATED STATEMENTS OF OPERATIONS
(in thousands, except per share amounts)
| |
Year Ended December 31, | |||||||||||
|---|---|---|---|---|---|---|---|---|---|---|---|---|
| |
2009 | 2008 | 2007 | |||||||||
Revenue |
$ | 63,174 | $ | 67,636 | $ | 59,887 | ||||||
Cost of revenue |
24,665 | 25,647 | 24,200 | |||||||||
Gross profit |
38,509 | 41,989 | 35,687 | |||||||||
Operating expenses: |
||||||||||||
Research and development |
19,603 | 17,104 | 12,277 | |||||||||
Selling, general and administrative |
14,916 | 14,656 | 12,287 | |||||||||
Total operating expenses |
34,519 | 31,760 | 24,564 | |||||||||
Income from operations |
3,990 | 10,229 | 11,123 | |||||||||
Interest income |
1,373 | 2,282 | 3,089 | |||||||||
Income before income taxes |
5,363 | 12,511 | 14,212 | |||||||||
Income tax provision (benefit) |
1,867 | 4,724 | (518 | ) | ||||||||
Net income |
$ | 3,496 | $ | 7,787 | $ | 14,730 | ||||||
Net income per share: |
||||||||||||
Basic |
$ | 0.16 | $ | 0.37 | $ | 0.71 | ||||||
Diluted |
$ | 0.16 | $ | 0.35 | $ | 0.68 | ||||||
Weighted average shares used in computing net income per share: |
||||||||||||
Basic |
21,545 | 21,112 | 20,772 | |||||||||
Diluted |
22,318 | 22,067 | 21,818 | |||||||||
See accompanying notes.
47
TECHWELL, INC.
CONSOLIDATED STATEMENTS OF STOCKHOLDERS' EQUITY AND COMPREHENSIVE INCOME
(in thousands)
| |
Common Stock | |
|
Retained Earnings (Accumulated Deficit) |
Accumulated Other Comprehensive Income (Loss) |
|
|
||||||||||||||||||
|---|---|---|---|---|---|---|---|---|---|---|---|---|---|---|---|---|---|---|---|---|---|---|---|---|---|
| |
|
Deferred Stock-Based Compensation |
Total Stockholders' Equity |
Comprehensive Income |
|||||||||||||||||||||
| |
Shares | Amount | APIC | ||||||||||||||||||||||
BALANCES—December 31, 2006 |
20,528 | 21 | 67,734 | (546 | ) | (10,024 | ) | (39 | ) | 57,146 | |||||||||||||||
Net income |
— | — | — | — | 14,730 | — | 14,730 | 14,730 | |||||||||||||||||
Unrealized gains on investments |
— | — | — | — | — | 83 | 83 | 83 | |||||||||||||||||
Comprehensive income |
— | — | — | — | — | — | — | $ | 14,813 | ||||||||||||||||
Issuance of common stock upon exercise of stock options and releases of restricted stock awards |
369 | — | 711 | — | — | — | 711 | ||||||||||||||||||
Tax effect from issuance of restricted stock awards |
(5 | ) | — | (53 | ) | — | — | — | (53 | ) | |||||||||||||||
Amortization of deferred stock-based compensation, net of forfeitures |
— | — | (84 | ) | 386 | — | — | 302 | |||||||||||||||||
Shares, net of cancellations, issued to consultant under stock award |
(3 | ) | — | — | — | — | — | — | |||||||||||||||||
Stock-based compensation |
— | — | 4,246 | — | — | — | 4,246 | ||||||||||||||||||
Tax benefits from stock-based compensation |
— | — | 900 | — | — | — | 900 | ||||||||||||||||||
BALANCES—December 31, 2007 |
20,889 | 21 | 73,454 | (160 | ) | 4,706 | 44 | 78,065 | |||||||||||||||||
Net income |
— | — | — | — | 7,787 | — | 7,787 | 7,787 | |||||||||||||||||
Unrealized gains on investments |
— | — | — | — | — | 125 | 125 | 125 | |||||||||||||||||
Comprehensive income |
— | — | — | — | — | — | — | $ | 7,912 | ||||||||||||||||
Issuance of common stock upon exercise of stock options and releases of restricted stock awards |
576 | — | 457 | — | — | — | 457 | ||||||||||||||||||
Tax effect from issuance of restricted stock awards |
(118 | ) | — | (1,184 | ) | — | — | — | (1,184 | ) | |||||||||||||||
Amortization of deferred stock-based compensation, net of forfeitures |
— | — | (110 | ) | 141 | — | — | 31 | |||||||||||||||||
Stock-based compensation |
— | — | 7,306 | — | — | — | 7,306 | ||||||||||||||||||
Tax benefits from stock-based compensation |
— | — | 317 | — | — | — | 317 | ||||||||||||||||||
BALANCES—December 31, 2008 |
21,347 | 21 | 80,240 | (19 | ) | 12,493 | 169 | 92,904 | |||||||||||||||||
Net income |
— | — | — | — | 3,496 | — | 3,496 | $ | 3,496 | ||||||||||||||||
Unrealized gains on investments |
— | — | — | — | — | 43 | 43 | 43 | |||||||||||||||||
Comprehensive income |
— | — | — | — | — | — | — | $ | 3,539 | ||||||||||||||||
Issuance of common stock upon exercise of stock options and releases of restricted stock awards |
751 | 1 | 356 | — | — | — | 357 | ||||||||||||||||||
Tax effect from issuance of restricted stock awards |
(140 | ) | — | (1,164 | ) | — | — | — | (1,164 | ) | |||||||||||||||
Amortization of deferred stock-based compensation, net of forfeitures |
— | — | — | 19 | — | — | 19 | ||||||||||||||||||
Stock-based compensation |
— | — | 7,672 | — | — | — | 7,672 | ||||||||||||||||||
Tax benefits from stock-based compensation |
— | — | 490 | — | — | — | 490 | ||||||||||||||||||
BALANCES—December 31, 2009 |
21,958 | $ | 22 | $ | 87,594 | $ | — | $ | 15,989 | $ | 212 | $ | 103,817 | ||||||||||||
See accompanying notes.
48
TECHWELL, INC.
CONSOLIDATED STATEMENTS OF CASH FLOWS
(in thousands)
| |
Year Ended December 31, | |||||||||||||
|---|---|---|---|---|---|---|---|---|---|---|---|---|---|---|
| |
2009 | 2008 | 2007 | |||||||||||
Cash flows from operating activities: |
||||||||||||||
Net income |
$ | 3,496 | $ | 7,787 | $ | 14,730 | ||||||||
Adjustments to reconcile net income to net cash provided by operating activities: |
||||||||||||||
Depreciation and amortization |
801 | 705 | 495 | |||||||||||
Stock-based compensation |
7,691 | 7,337 | 4,548 | |||||||||||
Write-off of long-lived assets |
— | 250 | — | |||||||||||
Tax benefit from employee equity incentive plan |
490 | 317 | 847 | |||||||||||
Excess tax benefits from stock-based compensation |
(49 | ) | — | (23 | ) | |||||||||
Realized gain on investments |
— | (18 | ) | — | ||||||||||
Put option (gain) loss |
295 | (1,101 | ) | — | ||||||||||
Gain (loss) from trading securities |
(295 | ) | 1,101 | — | ||||||||||
Changes in assets and liabilities, net of effect of acquisition: |
||||||||||||||
Accounts receivable |
1,105 | 110 | 670 | |||||||||||
Inventory |
(3,157 | ) | (27 | ) | (170 | ) | ||||||||
Prepaid expenses and other current assets |
(115 | ) | 6 | (47 | ) | |||||||||
Other assets |
(295 | ) | (80 | ) | (42 | ) | ||||||||
Deferred income tax assets |
(64 | ) | 51 | (5,435 | ) | |||||||||
Accounts payable |
3,305 | (690 | ) | (564 | ) | |||||||||
Accrued liabilities |
2,968 | (416 | ) | (811 | ) | |||||||||
Other non-current liabilities |
(50 | ) | (43 | ) | 165 | |||||||||
Net cash provided by operating activities |
16,126 | 15,289 | 14,363 | |||||||||||
Cash flows from investing activities: |
||||||||||||||
Purchase of property and equipment |
(407 | ) | (587 | ) | (1,308 | ) | ||||||||
Purchase of investments |
(82,716 | ) | (68,879 | ) | (93,660 | ) | ||||||||
Proceeds from maturities of investments |
31,926 | 72,212 | 93,847 | |||||||||||
Acquisition of business, net of cash acquired |
(2,252 | ) | — | — | ||||||||||
Net cash provided by (used in) investing activities |
(53,449 | ) | 2,746 | (1,121 | ) | |||||||||
Cash flows from financing activities: |
||||||||||||||
Proceeds from exercise of stock options |
357 | 457 | 711 | |||||||||||
Excess tax benefits from stock-based compensation |
49 | — | 23 | |||||||||||
Repurchases of common stock upon release of stock awards |
(1,164 | ) | (1,184 | ) | — | |||||||||
Net cash provided by (used in) financing activities |
(758 | ) | (727 | ) | 734 | |||||||||
Net increase (decrease) in cash and cash equivalents |
(38,081 | ) | 17,308 | 13,976 | ||||||||||
Cash and cash equivalents at beginning of period |
44,485 | 27,177 | 13,201 | |||||||||||
Cash and cash equivalents at end of period |
$ | 6,404 | $ | 44,485 | $ | 27,177 | ||||||||
Supplemental cash flow information: income taxes paid |
$ | 243 | $ | 4,335 | $ | 3,578 | ||||||||
Supplemental disclosure of non-cash activity: |
||||||||||||||
Gross issuance of restricted stock awards |
$ | 5,306 | $ | 5,362 | $ | 296 | ||||||||
Reclass of put option from long-term asset to short-term asset |
$ | 751 | $ | — | $ | — | ||||||||
Purchase consideration withheld |
$ | 255 | $ | — | $ | — | ||||||||
Accrued equipment purchase costs |
$ | 13 | $ | 2 | $ | 35 | ||||||||
See accompanying notes.
49
TECHWELL, INC.
NOTES TO CONSOLIDATED FINANCIAL STATEMENTS
1. ORGANIZATION AND SUMMARY OF SIGNIFICANT ACCOUNTING POLICIES
Organization. Techwell, Inc. ("Techwell" or the "Company") was incorporated in California on 1997 and reincorporated in Delaware on 2006. The Company is a fabless semiconductor company that designs, markets and sells mixed signal integrated circuits for two primary markets: security surveillance and automotive infotainment.
The Company's headquarters is located in San Jose, California. The Company's international offices include branch offices in South Korea and Taiwan and subsidiaries in China and Japan. These offices provide marketing support to customers. The China and Japan offices are also involved in product development.
Basis of Presentation. The consolidated financial statements include the accounts of the Company and its subsidiaries. The Company and its subsidiaries use the U.S. dollar as its functional currency. Most of the expenses at the subsidiaries are incurred in local currency. Foreign currency transaction gains and losses are included in selling, general and administrative expenses as they occur. All significant intercompany transactions and balances have been eliminated in consolidation. The Company reports its financial results on a calendar fiscal year.
In June 2009 the Financial Accounting Standards Board ("FASB"), established the Accounting Standards Codification ("Codification"), as the source of authoritative GAAP recognized by the FASB. The Codification is effective in the first interim and annual periods ending after September 15, 2009 and had no effect on the Company's consolidated financial statements.
Use of Estimates. The preparation of consolidated financial statements in accordance with accounting principles generally accepted in the United States of America requires management to make estimates and assumptions that affect the reported amounts of assets and liabilities, the disclosure of contingent assets and liabilities at the date of the consolidated financial statements and the reported amounts of revenue and expenses during the reporting period. Actual results could differ from these estimates.
Cash and Cash Equivalents. The Company considers all highly liquid investments purchased with a maturity of three months or less from the date of purchase to be cash equivalents.
Investments. The Company considers all investments purchased with a maturity of one year or more as of December 31, 2009 to be long-term investments. The Company determines the fair value of its investments using quoted market prices. Investments, with the exception of auction rate securities ("ARS") which were classified as trading starting in the fourth quarter of 2008, are considered available-for-sale and are carried at fair market value based on market quotes. Unrealized gains and losses are reported as a separate component of stockholders' equity, except for unrealized losses determined to be other-than-temporary, which are recorded as interest income. Realized gains and losses are recorded based on the specific identification method.
Fair Value of Financial Instruments. The Company's financial instruments consist principally of cash equivalents, short-term and long-term marketable securities. Authoritative guidance clarifies that fair value is an exit price, representing the amount that would be received to sell an asset or paid to transfer a liability in an orderly transaction between market participants, and also requires that a fair value measurement reflect the assumptions market participants would use in pricing an asset or liability based on the best information available. Assumptions include the risks inherent in a particular valuation technique (such as a pricing model) and/or the risks inherent in the inputs to the model.
50
TECHWELL, INC.
NOTES TO CONSOLIDATED FINANCIAL STATEMENTS (Continued)
1. ORGANIZATION AND SUMMARY OF SIGNIFICANT ACCOUNTING POLICIES (Continued)
Concentration of Credit Risk. Financial instruments that potentially subject the Company to concentrations of credit risk consist principally of cash and cash equivalents, investments and trade receivables. Risks associated with cash and cash equivalents are mitigated by banking with creditworthy institutions and the Company's investments have investment grade ratings when purchased. Additionally, the Company limits the amount invested by maturity, type of security and issuer. The Company's accounts receivable are substantially derived from customers located in Asia. The Company generally requires letters of credit or advance payments from customers. The Company also performs credit evaluations of its customers and provides credit to certain customers in the normal course of business. The Company has not incurred bad debt write-offs during any of the periods presented.
The revenue and accounts receivable from customers representing 10% or more of total revenue and accounts receivable are as follows:
| |
Accounts Receivable at |
Revenue | ||||||||||||||
|---|---|---|---|---|---|---|---|---|---|---|---|---|---|---|---|---|
| |
Year Ended December 31, |
|||||||||||||||
| |
December 31, | |||||||||||||||
Customer
|
2009 | 2008 | 2009 | 2008 | 2007 | |||||||||||
A |
* | % | 21 | % | 35 | % | 34 | % | 22 | % | ||||||
B |
28 | * | * | * | * | |||||||||||
C |
17 | * | * | * | * | |||||||||||
D |
12 | * | * | * | * | |||||||||||
E |
11 | * | * | * | * | |||||||||||
F |
10 | * | * | * | * | |||||||||||
G |
* | 20 | * | * | * | |||||||||||
H |
* | 11 | * | * | * | |||||||||||
- *
- less than 10%
Concentration of Supplier Risk. The Company is a fabless producer of semiconductors and is dependent on two subcontractors for substantially all of its production requirements. The failure of either subcontractor to fulfill the production requirements of the Company on a timely basis would adversely impact future results. Although there are other subcontractors that are capable of providing similar services, an unexpected change in either subcontractor would cause delays in the Company's products and potential significant loss of revenue.
Inventory. Inventory is valued at the lower of cost or market, computed on a first-in, first-out basis. Inventory consists of work in process (principally processed wafers and products at third-party assembly and test subcontractors) and finished goods. The Company's products are subject to rapid technological obsolescence and severe price competition. Should the Company experience a substantial unanticipated decline in the selling price of, or demand for, its products, a significant charge to operations could result. The Company evaluates inventory for excess and obsolescence and writes off units which are not expected to be sold based upon demand forecasts. If actual future demand for the Company's products is less than amounts forecasted, additional inventory write-downs may be required. Once inventory costs are written down, such revised costs are maintained until the product is sold or scrapped.
51
TECHWELL, INC.
NOTES TO CONSOLIDATED FINANCIAL STATEMENTS (Continued)
1. ORGANIZATION AND SUMMARY OF SIGNIFICANT ACCOUNTING POLICIES (Continued)
Property and Equipment. Property and equipment, including leasehold improvements, are recorded at historical cost, less accumulated depreciation. Depreciation is computed using the straight-line method over the estimated useful lives of the assets, generally ranging from three to five years, or in the case of leasehold improvements, over the shorter of the lease period or the estimated useful life.
Other Long-Lived Assets. Other long-lived assets primarily represent rights acquired under developed technology and IPR&D. We currently amortize our intangible assets with definitive lives over a period of five years using a method that reflects the pattern in which the economic benefits of the intangible asset are consumed or otherwise used up or, if that pattern cannot be reliably determined, using a straight-line amortization method. We capitalize IPR&D projects acquired in business combinations and consider them to be indefinite lived until completion of the project or abandonment of the asset. On completion of each project, IPR&D assets will be amortized over their estimated useful lives. If any of the projects are abandoned, the Company would be required to impair the related IPR&D asset.
Impairment of Long-Lived Assets. The Company tests for the impairment of long-lived assets, including other purchased intangible assets, when indicators of impairment, such as reductions in demand, or significant economic slowdowns in the semiconductor industry, are present. Reviews are performed to determine whether the carrying value of an asset is impaired, based on comparisons to undiscounted expected future cash flows. If this comparison indicates that there is impairment, the impaired asset is written down to fair value, which is typically calculated using discounted expected future cash flows utilizing an appropriate discount rate. Impairment is based on the excess of the carrying amount over the fair value of those assets. Until completion or abandonment, IPR&D assets are required to be tested annually for impairment by comparing the fair value to the carrying value.
In 2008, the Company recorded an impairment charge of $0.3 million for equipment that was deemed impaired. This charge was included within research and development expense. The Company did not incur impairment losses in 2009 or 2007.
Other Assets. Other assets consist primarily of long-term lease deposits.
Revenue Recognition. The Company recognizes product revenue when all of the following criteria are met: (i) persuasive evidence of an arrangement exists, (ii) delivery has occurred, (iii) the price to the customer is fixed or determinable, and (iv) collection of the resulting receivable is reasonably assured. These criteria are usually met at the time of product shipment. The Company does not allow for price protection or stock rotation rights with any of its customers.
Customers have no rights of return except pursuant to the Company's product warranty. The Company has no other post-shipment obligations and sales are not subject to customer acceptance provisions.
Product Warranty. The Company offers an 18 month product replacement warranty. The Company accrues for estimated returns of defective products based on historical activity at the time revenue is recognized. The determination of these accruals requires the Company to make estimates of the frequency and extent of warranty activity and estimated future costs to replace the products under warranty. If the actual warranty activity and/or repair and replacement costs differ significantly from these estimates, adjustments to recognize additional cost of sales may be required in future periods.
52
TECHWELL, INC.
NOTES TO CONSOLIDATED FINANCIAL STATEMENTS (Continued)
1. ORGANIZATION AND SUMMARY OF SIGNIFICANT ACCOUNTING POLICIES (Continued)
However, returns of defective products have been infrequent and the quantities have not been significant. Accordingly, historical warranty costs have not been material for the periods presented. A summary of the accrued warranty, which is included in accrued liabilities, is as follows (in thousands):
| |
Year Ended December 31, |
||||||||||
|---|---|---|---|---|---|---|---|---|---|---|---|
| |
2009 | 2008 | 2007 | ||||||||
Balance at beginning of the period |
$ | 34 | $ | 50 | $ | 47 | |||||
Accruals for sales in the period |
54 | — | 25 | ||||||||
Cost incurred |
(25 | ) | (16 | ) | (22 | ) | |||||
Balance at end of the period |
$ | 63 | $ | 34 | $ | 50 | |||||
Research and Development. Research and development costs are expensed as incurred.
Advertising Costs. Advertising costs are expensed as incurred and are not significant in any of the periods presented.
Deferred Taxes and Uncertain Tax Positions. The Company utilizes the asset and liability method of accounting for income taxes, under which deferred taxes are determined based on the temporary differences between the financial statement and tax basis of assets and liabilities using tax rates expected to be in effect during the years in which the basis differences reverse. A valuation allowance is recorded when it is more likely than not that some of the deferred tax assets will not be realized.
Income tax positions must meet a more-likely-than-not recognition threshold to be recognized. Income tax positions that previously failed to meet the more-likely-than-not threshold are recognized in the first subsequent financial reporting period in which that threshold is met. Previously recognized tax positions that no longer meet the more-likely-than-not threshold are derecognized in the first subsequent financial reporting period in which that threshold is no longer met. The Company recognizes potential accrued interest and penalties related to unrecognized tax benefits within the consolidated statements of operations as income tax expense.
The Company and its subsidiaries file income tax returns in the U.S. federal jurisdiction, various states and foreign jurisdictions. The Company is currently under examination by the U.S. Internal Revenue Service for the tax years 2007 and 2008. Management believes that it has adequately provided for any adjustments that may result from this examination, however, the outcome of tax audits cannot be predicted with certainty. Should any issues addressed in the Company's tax audits be resolved in a manner not consistent with management's expectations, the Company will be required to adjust its provision for income tax in the period such resolution occurs.
Stock-Based Compensation. The Company accounts for stock-based compensation in accordance with authoritative guidance. In 2009, 2008 and 2007, stock-based compensation expense includes compensation costs related to estimated fair values of stock options and awards granted after January 1, 2006 and compensation costs related to awards outstanding at January 1, 2006, such as unvested stock options, that were recognized based on the intrinsic values. For options granted after January 1, 2006, the Company uses the straight-line method for expense attribution. For options granted prior to January 1, 2006, the Company uses the multiple grant approach for expense
53
TECHWELL, INC.
NOTES TO CONSOLIDATED FINANCIAL STATEMENTS (Continued)
1. ORGANIZATION AND SUMMARY OF SIGNIFICANT ACCOUNTING POLICIES (Continued)
attribution, which results in substantially higher amounts of amortization in earlier years as opposed to the straight-line method, which results in equal amortization over the vesting period of the options.
The fair value of options granted after January 1, 2006 is estimated on the grant date using the Black-Scholes option valuation model. For 2009 and 2008, the expected term assumption calculation was based on historical data as adjusted for any changes in future expectations. For 2007, the Company used the simplified calculation of expected term. For 2009 and 2008, the Company relied exclusively on historical volatility for the expected volatility assumption calculation since it does not have any publicly traded options. For 2007, volatility was based on an average of the historical volatilities of the common stock of several entities with characteristics similar to the Company since its stock had been actively trading for only a short period of time. The risk-free rate is based on the U.S. Treasury yield curve in effect at the time of grant for periods corresponding with the expected term of the option and the estimated forfeiture rate is based on the Company's historical pre-vest cancellation experience.
The following assumptions were used to value stock options granted in the periods presented:
| |
Year Ended December 31, | |||||||||
|---|---|---|---|---|---|---|---|---|---|---|
| |
2009 | 2008 | 2007 | |||||||
Expected term (years) |
4.34 | 4.28 | 6.08 | |||||||
Risk-free interest rate |
1.5–2.0% | 1.8–2.9% | 4.6–4.8% | |||||||
Expected volatility |
53.0–54.0% | 51.0–64.0% | 65.1–70.6% | |||||||
Expected dividend |
— | — | — | |||||||
Stock-based compensation expense for restricted stock awards is determined using the fair value of the Company's stock on the date of the grant and is recognized on a straight-line basis over the service period.
Stock-based compensation expense is allocated among cost of revenue, research and development expenses and selling, general and administrative expenses, respectively, based upon the employee's job function.
Net Income Per Share. Basic net income per share is calculated by dividing net income by the weighted-average number of common shares outstanding during the reporting period excluding shares subject to repurchase. Diluted net income per common share reflects the effects of potentially dilutive securities, which consist of common stock options (calculated using the treasury stock method) and
54
TECHWELL, INC.
NOTES TO CONSOLIDATED FINANCIAL STATEMENTS (Continued)
1. ORGANIZATION AND SUMMARY OF SIGNIFICANT ACCOUNTING POLICIES (Continued)
restricted awards and shares subject to repurchase. A reconciliation of shares used in the calculation of basic and diluted net income per share is as follows (in thousands):
| |
Year Ended December 31, | ||||||||||
|---|---|---|---|---|---|---|---|---|---|---|---|
| |
2009 | 2008 | 2007 | ||||||||
Weighted average common shares outstanding |
21,549 | 21,127 | 20,814 | ||||||||
Weighted average shares subject to repurchase |
(4 | ) | (15 | ) | (42 | ) | |||||
Shares used to calculate basic net income per share |
21,545 | 21,112 | 20,772 | ||||||||
Effect of dilutive securities: |
|||||||||||
Common stock options and restricted awards and unvested common shares subject to repurchase or cancellations |
773 | 955 | 1,046 | ||||||||
Shares used to calculate diluted net income per share |
22,318 | 22,067 | 21,818 | ||||||||
In 2009, 2008 and 2007, respectively, 2.1 million, 1.2 million and 1.3 million shares associated with stock options and restricted awards outstanding and unvested shares subject to repurchase have been excluded from the weighted-average number of common shares outstanding for the diluted net income per share computation as they are anti-dilutive.
Accumulated Other Comprehensive Income. Accumulated other comprehensive income consists of net unrealized gains on available-for-sale investments. The change in unrealized gains on investments in 2009, 2008 and 2007 was an increase of $43,000, $0.1 million and $0.1 million, respectively. Total comprehensive income for 2009, 2008 and 2007 was $3.5 million, 7.9 million and $14.8 million, respectively.
Recent Accounting Pronouncements. In December 2007 the FASB issued authoritative guidance on business combinations, which established principles and requirements for the acquirer of a business to recognize and measure in its financial statements the identifiable assets (including in-process research and development and defensive assets) acquired, the liabilities assumed, and any noncontrolling interest in an acquiree. The guidance is effective for financial statements issued for fiscal years beginning after December 15, 2008. Prior to the adoption of this guidance, in-process research and development costs were immediately expensed and acquisition costs were capitalized. Under this guidance, all acquisition costs are expensed as incurred. The standard also provides guidance for recognizing and measuring the goodwill acquired in the business combination and determines what information to disclose to enable users of financial statements to evaluate the nature and financial effects of the business combination. In April 2009, the FASB updated this guidance to amend the provisions for the initial recognition and measurement, subsequent measurement and accounting, and disclosures for assets and liabilities arising from contingencies in business combinations. This update also eliminates the distinction between contractual and non-contractual contingencies. The effect of this authoritative guidance has been applied to the acquisition completed by the Company during 2009 and is reflected in the 2009 consolidated financial statements.
In April 2009, the FASB issued authoritative guidance for determining fair value when the volume and level of activity for an asset or liability have significantly decreased and identifying transactions that are not orderly, recognition and presentation of other-than-temporary impairments and interim
55
TECHWELL, INC.
NOTES TO CONSOLIDATED FINANCIAL STATEMENTS (Continued)
1. ORGANIZATION AND SUMMARY OF SIGNIFICANT ACCOUNTING POLICIES (Continued)
disclosures about fair value of financial instruments, which are effective for interim and annual periods ending after June 15, 2009. This authoritative guidance provides guidance on how to determine the fair value of assets and liabilities in the current economic environment and reemphasizes that the objective of a fair value measurement remains an exit price, modifies the requirements for recognizing other-than-temporarily impaired debt securities and revises the existing impairment model for such securities, by modifying the current intent and ability indicator in determining whether an investment in a debt security is other-than-temporarily impaired, and enhances the disclosure of instruments for both interim and annual periods. Effective April 1, 2009, the Company adopted the provisions of the guidance. The adoption of the guidance did not have an impact on the Company's consolidated financial position, results of operations or cash flows.
2. FINANCIAL INSTRUMENTS
The Company's investments consist of corporate bonds, U.S. government agency securities, commercial paper and auction rate securities ("ARS"). Investments, with the exception of ARS which are currently classified as trading, are considered available-for-sale. With the exception of ARS, they are all carried at fair market value based on market quotes. The Company's investment in ARS was intended to provide liquidity via an auction process that resets the applicable interest rate at predetermined calendar intervals, allowing investors to either roll over their holdings or gain immediate liquidity by selling such interests at par. During 2008, uncertainties in the credit markets affected all of the Company's holdings in ARS investments and auctions for the Company's investments in these securities failed to settle on their respective settlement dates. Consequently, the investments are not currently liquid and the Company will not be able to access these funds until a future auction of these investments is successful or a buyer is found outside of the auction process. All of the ARS investments were investment grade quality and were in compliance with the Company's investment policy at the time of acquisition.
During the fourth quarter of 2008, the Company entered into an agreement with one of its investment providers, which currently holds its ARS and from whom it had purchased the ARS, to sell, at the Company's discretion, at par value all of the ARS currently held by the Company back to the investment provider at anytime starting in June 2010. The rights granted under the agreement represent a firm agreement, which is as an agreement with an unrelated party, binding on both parties and legally enforceable, with the following characteristics: a) the agreement specifies all significant terms, including the quantity to be exchanged, the fixed price and the time of transaction and b) the agreement includes a disincentive for nonperformance that is sufficiently large to make performance probable. The enforceability of the agreement results in a put option and should be recognized as a free standing asset separate from the ARS. The put option does not meet the definition of a derivative instrument. Therefore, the Company has elected to measure the put option at fair value, based on authoritative guidance which permits an entity to elect the fair value option for recognized financial assets. As a result, realized gains and losses will be included in earnings in the period in which they arise.
With the acceptance of the offer, the Company recorded $1.0 million as the fair value of the put option asset with a corresponding gain to interest income. Additionally, the Company transferred its ARS from investments classified as available-for-sale to trading. The transfer to trading reflects the Company's intent to exercise the put option, whereas, prior to the agreement, the Company's intent was to hold the ARS until the market recovered. Upon transfer to trading, the Company recognized a loss of $1.0 million, included as a reduction to interest income, for the amount of unrealized loss not
56
TECHWELL, INC.
NOTES TO CONSOLIDATED FINANCIAL STATEMENTS (Continued)
2. FINANCIAL INSTRUMENTS (Continued)
previously recognized in earnings. As a result of this transfer unrealized gains or losses will be included in earnings in future periods, and the Company anticipates future changes in fair value of the put option will approximate the fair value movement of the related ARS. The net impact of the change in fair value of the ARS and related put option to the Company's operating results was nil for 2009 and 2008.
As of December 31, 2009, the entire ARS investment balance of $6.3 million is classified as short-term investments on the consolidated balance sheet because the sale of the ARS back to the investment provider is expected to occur in June 2010. As of December 31, 2008, the entire ARS investment balance of $6.0 million was classified as long-term investment on the consolidated balance sheet.
Typically the fair value of ARS investments approximates par value due to the frequent resets through the auction process. While the Company continues to earn interest on its ARS investments at the maximum contractual rate, these investments are not currently trading and therefore do not currently have a readily determinable market value. Accordingly, the estimated fair value of ARS no longer approximates par value.
The Company has used a discounted cash flow model to determine the estimated fair value of its investment in ARS in 2009 and 2008. The assumptions used in preparing the discounted cash flow model include estimates for interest rates, estimates for discount rates using yields of comparable traded instruments adjusted for illiquidity and other risk factors, amount of cash flows and expected holding periods of the ARS. These inputs reflect the Company's own assumptions about the assumptions market participants would use in pricing the ARS, including assumptions about risk, developed based on the best information available in the circumstances.
The put option is a free standing asset separate from the ARS, and represents the Company's contractual right to require its investment provider to purchase the ARS at par at anytime starting in June 2010. The Company values the put option based on the amount of cash flows and expected holding periods of the related ARS, time value of money and the Company's assessment of the credit worthiness of its investment provider.
The following is a summary of the Company's available-for-sale securities as of December 31, 2009 (in thousands):
| |
|
|
Less than 12 Months |
12 Months or Longer |
|
||||||||||||
|---|---|---|---|---|---|---|---|---|---|---|---|---|---|---|---|---|---|
| |
Amortized Cost |
Unrealized Gains |
Unrealized Losses |
Unrealized Losses |
Estimated Fair Value |
||||||||||||
Money market funds |
$ | 1,746 | $ | — | $ | — | $ | — | $ | 1,746 | |||||||
Corporate bonds |
38,929 | 255 | (64 | ) | — | 39,120 | |||||||||||
Municipal bonds |
1,500 | 2 | — | — | 1,502 | ||||||||||||
Treasuries and federal agencies |
38,134 | 65 | (46 | ) | — | 38,153 | |||||||||||
Commercial paper |
2,991 | — | — | — | 2,991 | ||||||||||||
Total |
$ | 83,300 | $ | 322 | $ | (110 | ) | $ | — | $ | 83,512 | ||||||
57
TECHWELL, INC.
NOTES TO CONSOLIDATED FINANCIAL STATEMENTS (Continued)
2. FINANCIAL INSTRUMENTS (Continued)
The following is a summary of the Company's available-for-sale securities as of December 31, 2008 (in thousands):
| |
|
|
Less than 12 Months |
12 Months or Longer |
|
||||||||||||
|---|---|---|---|---|---|---|---|---|---|---|---|---|---|---|---|---|---|
| |
Amortized Cost |
Unrealized Gains |
Unrealized Losses |
Unrealized Losses |
Estimated Fair Value |
||||||||||||
Money market funds |
$ | 33,998 | $ | — | $ | — | $ | — | $ | 33,998 | |||||||
Corporate bonds |
19,710 | 97 | (57 | ) | — | 19,750 | |||||||||||
Treasuries and federal agencies |
5,023 | 103 | — | — | 5,126 | ||||||||||||
Commercial paper |
12,061 | 26 | — | — | 12,087 | ||||||||||||
Total |
$ | 70,792 | $ | 226 | $ | (57 | ) | $ | — | $ | 70,961 | ||||||
As of December 31, 2009, the effective maturities of the Company's available-for-sale securities are $54.8 million within one year and $35.0 million within two years. As of December 31, 2008, the effective maturities of the Company's available-for-sale securities are $57.6 million within one year and $13.4 million within two years.
As of December 31, 2009, the unrealized losses on our available-for-sale securities were insignificant in relation to our total available-for-sale securities. Substantially all of our unrealized losses on our available-for-sale investments can be attributed to fair value fluctuations in an unstable credit environment. The Company considers the declines in market value of its available-for-sale securities to be temporary in nature. When evaluating the investments for other-than-temporary impairment, the Company reviews factors such as the length of time and extent to which fair value has been below cost basis, the financial condition of the issuer and any changes thereto, and the Company's intent to sell, or whether it is more likely than not it will be required to sell, the investment before recovery of the investment's amortized cost basis. The Company believes that the unrealized losses are temporary and do not require an other-than-temporary impairment. The Company did not recognize any other-than-temporary impairment charges on outstanding available-for-sale securities in 2009, 2008 and 2007.
Effective January 1, 2008, the Company adopted the authoritative guidance for fair value measurements and the fair value option for financial assets and financial liabilities. The authoritative guidance establishes a fair value hierarchy that prioritizes the inputs to valuation techniques used to measure fair value. The hierarchy gives the highest priority to unadjusted quoted prices in active markets for identical assets or liabilities (level 1 measurements) and the lowest priority to unobservable inputs (level 3 measurements). The three levels of the fair value hierarchy are described below:
Level 1: Quoted prices (unadjusted) in active markets that are accessible at the measurement date for assets or liabilities. The fair value hierarchy gives the highest priority to level 1 inputs.
Level 2: Observable prices that are based on inputs not quoted on active markets, but corroborated by market data.
Level 3: Unobservable inputs are used when little or no market date is available. The fair value hierarchy gives the lowest priority to level 3 inputs.
58
TECHWELL, INC.
NOTES TO CONSOLIDATED FINANCIAL STATEMENTS (Continued)
2. FINANCIAL INSTRUMENTS (Continued)
The table below represents the fair value hierarchy of the Company's financial instruments measured at fair value as of December 31, 2009 (in thousands):
| |
Total | Level 1 | Level 2 | Level 3 | |||||||||||
|---|---|---|---|---|---|---|---|---|---|---|---|---|---|---|---|
Money market funds |
$ | 1,746 | $ | 1,746 | $ | — | $ | — | |||||||
Corporate bonds |
39,120 | 39,120 | — | — | |||||||||||
Municipal bonds |
1,502 | 1,502 | — | — | |||||||||||
Treasuries and federal agencies |
38,153 | 38,153 | — | — | |||||||||||
Commercial paper |
2,991 | 2,991 | — | — | |||||||||||
Put option |
806 | — | — | 806 | |||||||||||
Auction rate securities |
6,294 | — | — | 6,294 | |||||||||||
Total |
$ | 90,612 | $ | 83,512 | $ | — | $ | 7,100 | |||||||
Amount included in: |
|||||||||||||||
Cash and cash equivalents |
$ | 1,746 | $ | 1,746 | $ | — | $ | — | |||||||
Short-term investments |
53,093 | 46,799 | — | 6,294 | |||||||||||
Long-term investments |
34,967 | 34,967 | — | — | |||||||||||
Prepaid expenses and other current assets |
806 | — | — | 806 | |||||||||||
Total |
$ | 90,612 | $ | 83,512 | $ | — | $ | 7,100 | |||||||
The table below represents the fair value hierarchy of the Company's financial instruments measured at fair value as of December 31, 2008 (in thousands):
| |
Total | Level 1 | Level 2 | Level 3 | |||||||||||
|---|---|---|---|---|---|---|---|---|---|---|---|---|---|---|---|
Money market funds |
$ | 33,998 | $ | 33,998 | $ | — | $ | — | |||||||
Corporate bonds |
19,750 | 19,750 | — | — | |||||||||||
Treasuries and federal agencies |
5,126 | 5,126 | — | — | |||||||||||
Commercial paper |
12,087 | 12,087 | — | — | |||||||||||
Put option |
1,101 | — | — | 1,101 | |||||||||||
Auction rate securities |
5,999 | — | — | 5,999 | |||||||||||
Total |
$ | 78,061 | $ | 70,961 | $ | — | $ | 7,100 | |||||||
Amount included in: |
|||||||||||||||
Cash and cash equivalents |
$ | 40,028 | $ | 40,028 | $ | — | $ | — | |||||||
Short-term investments |
17,582 | 17,582 | — | — | |||||||||||
Long-term investments |
19,350 | 13,351 | — | 5,999 | |||||||||||
Other assets |
1,101 | — | — | 1,101 | |||||||||||
Total |
$ | 78,061 | $ | 70,961 | $ | — | $ | 7,100 | |||||||
59
TECHWELL, INC.
NOTES TO CONSOLIDATED FINANCIAL STATEMENTS (Continued)
2. FINANCIAL INSTRUMENTS (Continued)
The following table provides a reconciliation of the beginning and ending balances for the assets measured at fair value using significant unobservable inputs (Level 3) (in thousands):
| |
Put Option | Auction Rate Securities |
|||||
|---|---|---|---|---|---|---|---|
Balances as of January 1, 2008 |
$ | — | $ | — | |||
Transfer into level 3 |
— | 7,100 | |||||
Receipt of put option |
1,012 | — | |||||
Unrealized gains (losses) included in earnings |
89 | (1,101 | ) | ||||
Balances as of December 31, 2008 |
1,101 | 5,999 | |||||
Unrealized gains (losses) included in earnings |
(295 | ) | 295 | ||||
Balances as of December 31, 2009 |
$ | 806 | $ | 6,294 | |||
3. DETAILS OF CERTAIN BALANCE SHEET COMPONENTS
| |
December 31, | |||||||
|---|---|---|---|---|---|---|---|---|
| |
2009 | 2008 | ||||||
| |
(in thousands) |
|||||||
Inventory: |
||||||||
Finished goods |
$ | 5,649 | $ | 2,750 | ||||
Work-in-process |
2,288 | 2,030 | ||||||
|
$ | 7,937 | $ | 4,780 | ||||
Property and equipment, net: |
||||||||
Equipment |
$ | 2,163 | $ | 1,888 | ||||
Software |
820 | 779 | ||||||
Furniture and fixtures |
337 | 308 | ||||||
Leasehold improvements |
414 | 454 | ||||||
|
3,734 | 3,429 | ||||||
Accumulated depreciation and amortization |
(2,701 | ) | (2,139 | ) | ||||
|
$ | 1,033 | $ | 1,290 | ||||
Accrued liabilities: |
||||||||
Accrued compensation |
$ | 2,108 | $ | 1,168 | ||||
Customer advance |
1,541 | — | ||||||
Income taxes payable |
1,315 | 169 | ||||||
Other |
1,045 | 780 | ||||||
|
$ | 6,009 | $ | 2,117 | ||||
4. STOCK INCENTIVE PLANS
The Company has equity incentive plans under which it may grant stock options, restricted stock awards, stock units and stock appreciation rights to employees, consultants and directors. Currently, the Company is granting stock options and restricted stock awards under its 2006 stock incentive plan
60
TECHWELL, INC.
NOTES TO CONSOLIDATED FINANCIAL STATEMENTS (Continued)
4. STOCK INCENTIVE PLANS (Continued)
("Plan") which was adopted by the Board of Directors in November 2005. As of December 31, 2009, the total number of shares available for issuance under the Plan was 5.1 million. The Plan contains a provision that automatically increases the number of shares of common stock reserved for issuance on January 1 of each succeeding year. On January 1, 2010, the shares reserved for issuance under the Company's Incentive Plans increased by 878,316 shares.
Under the terms of the Incentive Plans, incentive options may be granted only to employees at a price not to be less than 100 percent of the fair market value of the Company's common stock on the grant date. Non-statutory options may be granted at a price that is not less than 85 percent of the fair market value on the date of grant. Stock options and awards granted under the Plans have a contractual term of up to ten years, generally vest over four years at the rate of 25 percent on the one-year anniversary of the vesting commencement date and ratably each month thereafter and are exercisable under conditions determined by the Board of Directors or committee thereof as permissible under the terms of the Plan.
At December 31, 2009, 1.8 million shares were available for grant under the Incentive Plan.
Stock option activity is summarized as follows (in thousands, except weighted-average price):
| |
Number Outstanding |
Weighted-Average Exercise Price |
||||||
|---|---|---|---|---|---|---|---|---|
Options outstanding at December 31, 2006 (959 shares exercisable at a weighted-average exercise price of $1.02 per share) |
2,222 | $ | 4.20 | |||||
Options granted |
625 | $ | 13.96 | |||||
Options exercised |
(352 | ) | $ | 2.02 | ||||
Options cancelled |
(106 | ) | $ | 7.20 | ||||
Options outstanding at December 31, 2007 (1,136 shares exercisable at a weighted-average exercise price of $3.04 per share) |
2,389 | $ | 6.94 | |||||
Options granted |
50 | $ | 12.99 | |||||
Options exercised |
(174 | ) | $ | 2.63 | ||||
Options cancelled |
(65 | ) | $ | 6.67 | ||||
Options outstanding at December 31, 2008 (1,585 shares exercisable at a weighted-average exercise price of $5.77 per share) |
2,200 | $ | 7.42 | |||||
Options granted |
201 | $ | 11.09 | |||||
Options exercised |
(296 | ) | $ | 1.21 | ||||
Options cancelled |
(36 | ) | $ | 10.69 | ||||
Options outstanding at December 31, 2009 (1,662 shares exercisable at a weighted-average exercise price of $7.71 per share) |
$ | 2,069 | $ | 8.62 | ||||
Options vested and expected to vest at December 31, 2009 |
$ | 2,027 | $ | 8.54 | ||||
61
TECHWELL, INC.
NOTES TO CONSOLIDATED FINANCIAL STATEMENTS (Continued)
4. STOCK INCENTIVE PLANS (Continued)
The aggregate intrinsic value of options outstanding, options vested and expected to vest and options exercisable as of December 31, 2009, is $10.1 million, $10.0 million and $9.6 million, respectively. The weighted average remaining contractual life of options outstanding, options vested and expected to vest and options exercisable as of December 31, 2009, is 5.88 years, 5.81 years and 5.26 years, respectively.
The stock options outstanding and exercisable by exercise price at December 31, 2009, are as follows:
| |
Options Outstanding | Options Outstanding and Exercisable |
||||||||||||||
|---|---|---|---|---|---|---|---|---|---|---|---|---|---|---|---|---|
| |
|
Weighted Average Remaining Contractual Life (Years) |
|
|||||||||||||
| |
Number Outstanding |
Weighted-Average Exercise Price |
Number Outstanding |
Weighted-Average Exercise Price |
||||||||||||
| |
(in thousands) |
|
|
(in thousands) |
|
|||||||||||
$0.45 |
313 | 0.72 | $ | 0.45 | 313 | $ | 0.45 | |||||||||
$0.90–$1.50 |
300 | 4.78 | $ | 1.12 | 300 | $ | 1.12 | |||||||||
$3.00–$10.69 |
331 | 7.53 | $ | 8.06 | 191 | $ | 6.76 | |||||||||
$11.00 |
323 | 6.25 | $ | 11.00 | 304 | $ | 11.00 | |||||||||
$12.38–$13.84 |
177 | 8.62 | $ | 13.26 | 91 | $ | 13.08 | |||||||||
$13.94 |
525 | 7.14 | $ | 13.94 | 372 | $ | 13.94 | |||||||||
$14.00—$17.24 |
100 | 7.14 | $ | 14.64 | 91 | $ | 14.57 | |||||||||
|
2,069 | 5.88 | $ | 8.62 | 1,662 | $ | 7.71 | |||||||||
62
TECHWELL, INC.
NOTES TO CONSOLIDATED FINANCIAL STATEMENTS (Continued)
4. STOCK INCENTIVE PLANS (Continued)
Restricted stock award activity is summarized as follows (in thousands, except weighted-average price):
| |
Number Outstanding |
Weighted-Average Fair Value |
||||||
|---|---|---|---|---|---|---|---|---|
Restricted stock awards outstanding at December 31, 2006 |
63 | $ | 15.11 | |||||
Restricted stock awards granted |
913 | $ | 13.92 | |||||
Restricted stock awards vested |
(18 | ) | $ | 16.67 | ||||
Restricted stock awards cancelled |
(80 | ) | $ | 15.13 | ||||
Restricted stock awards outstanding at December 31, 2007 |
878 | $ | 13.84 | |||||
Restricted stock awards granted |
721 | $ | 10.15 | |||||
Restricted stock awards vested |
(402 | ) | $ | 13.35 | ||||
Restricted stock awards cancelled |
(74 | ) | $ | 12.09 | ||||
Restricted stock awards outstanding at December 31, 2008 |
1,123 | $ | 11.77 | |||||
Restricted stock awards granted |
734 | $ | 9.86 | |||||
Restricted stock awards vested |
(456 | ) | $ | 11.63 | ||||
Restricted stock awards cancelled |
(112 | ) | $ | 11.85 | ||||
Restricted stock awards outstanding at December 31, 2009 |
1,289 | $ | 10.72 | |||||
5. STOCK-BASED COMPENSATION
The total intrinsic value of options exercised in 2009, 2008 and 2007 was $2.7 million, $1.2 million and $3.8 million respectively.
The total grant date fair value of stock options vested in 2009, 2008, and 2007 was $1.9 million, $3.2 million and $574,000, respectively.
The total intrinsic value of restricted awards vested in 2009, 2008 and 2007 was $3.9 million, $4.0 million and $0.2 million respectively.
The total grant date fair value of restricted stock awards vested in 2009, 2008, and 2007 was $5.3 million, $5.4 million and $319,000, respectively.
In 2009, 2008 and 2007, stock-based compensation expense includes compensation cost related to estimated fair values of stock options and awards granted after January 1, 2006 and stock-based compensation costs related to awards outstanding at January 1, 2006, such as unvested stock options, that were recognized based on intrinsic value.
Employee Options and Awards
In connection with certain employee stock option grants prior to January 1, 2006, the Company recognized deferred stock-based compensation based on the excess of the deemed fair value of the
63
TECHWELL, INC.
NOTES TO CONSOLIDATED FINANCIAL STATEMENTS (Continued)
5. STOCK-BASED COMPENSATION (Continued)
underlying stock over the stock option exercise price at the date of grant, which was amortized over the vesting periods of the related options and stock, generally four years, using the multiple grant method.
The weighted-average grant-date fair value of options granted in 2009, 2008 and 2007 is $4.92, $5.70 and $9.28 per share, respectively. The fair value per share is being recognized as stock-based compensation expense over the applicable vesting period (which equals the service period).
Consultant Awards
In 2009, 2008 and 2007, the Company granted restricted stock awards to consultants in exchange for services.
The Company recorded $293,000, $21,000 and $64,000 in 2009, 2008 and 2007, respectively.
Stock-Based Compensation Expense
The following table summarizes the distribution of stock-based compensation expense (in thousands):
| |
Year Ended December 31, | |||||||||
|---|---|---|---|---|---|---|---|---|---|---|
| |
2009 | 2008 | 2007 | |||||||
Cost of revenue |
$ | 483 | $ | 492 | $ | 297 | ||||
Research and development |
3,939 | 3,339 | 1,830 | |||||||
Selling, general and administrative |
3,269 | 3,506 | 2,423 | |||||||
Related tax-effect |
(2,337 | ) | (2,483 | ) | (1,391 | ) | ||||
Total costs and expenses |
$ | 5,354 | $ | 4,854 | $ | 3,159 | ||||
Total compensation cost attributable to activities capitalized into inventory was not significant in any period presented.
Stock-based compensation expense is allocated among cost of revenue, research and development expenses and selling, general and administrative expenses, respectively, based upon the employee's job function.
As required, the cash flows resulting from the tax benefits for tax deductions resulting from the exercise of stock options in excess of the compensation expense recorded for those options (excess tax benefits) are classified as cash flows from financing activities. The Company recorded excess tax benefits of $49,000, nil and $23,000 in 2009, 2008 and 2007, respectively.
Future Amortization of Deferred Stock-Based Compensation.
Total compensation cost, excluding estimated future forfeitures, of options granted but not yet vested as of December 31, 2009 was $2.9 million, which is expected to be recognized over the weighted-average period of 2.00 years. Total compensation cost, excluding estimated future forfeitures, of restricted stock awards granted but not yet vested as of December 31, 2009 was $15.7 million, which is expected to be recognized over the weighted-average period of 2.82 years.
64
TECHWELL, INC.
NOTES TO CONSOLIDATED FINANCIAL STATEMENTS (Continued)
6. BUSINESS COMBINATIONS
On October 9, 2009, the Company acquired substantially all of the assets of a development stage company with operations based in China. The purchase price for the asset acquisition was $3.2 million, less assumed liabilities of approximately $0.7 million. The Company paid the net purchase price in cash. In addition, the Company issued restricted stock awards, which will vest over four years, to employees in connection with their new employment with the Company. The Company also agreed to pay $1.1 million cash compensation to the new employees of which $0.8 million has been paid as of December 31, 2009. The compensation is subject to repayment upon termination prior to the completion of two years of employment. The new employees are focused on developing video solutions for the security surveillance market. As part of the purchase agreement, the Company extended employment offers to approximately 40 employees, substantially all of whom are research and development personnel. The Company incurred $0.6 million of acquisition related costs. This acquisition was accounted for using the purchase method of accounting.
Purchase Price Allocation
The allocation of the purchase price of the tangible and identifiable intangible assets acquired and liabilities assumed in the acquisition was based on their estimated fair values.
The purchase price allocation is as follows (in thousands):
Cash |
$ | 25 | ||
Property and equipment, net |
60 | |||
Developed technology |
1,400 | |||
In-process research and development |
1,662 | |||
Other assets |
46 | |||
Assumed liabilities |
(573 | ) | ||
Accrued liabilities |
(88 | ) | ||
Total consideration |
$ | 2,532 | ||
Developed technology consists of products that have reached technological feasibility. The Company valued the developed technology utilizing a Relief from Royalty method, which is based on the assumption that a company would be willing to pay a royalty to the owner of an asset to exploit the economic benefits deriving from the asset. The royalty rate used is based on an analysis of empirical, market-derived royalty rates for guideline intangible assets. Typically, revenue is projected over the expected remaining useful life of the completed technology. The market-derived royalty rate is then applied to estimate the royalty savings. Completed technology is specific to certain products acquired that have also passed technological feasibility.
The fair value of the IPR&D was determined using the income approach. Under the income approach, the expected future cash flows from each project under development are estimated and discounted to their net present values at an appropriate risk-adjusted rate of return. Significant factors considered in the calculation of the rate of return are the weighted average cost of capital and return on assets, as well as the risks inherent in the development process, including the likelihood of achieving technological success and market acceptance. Each project was analyzed to determine the unique technological innovations, the existence and reliance on core technology, the existence of any alternative future use or current technological feasibility, and the complexity, cost and time to complete
65
TECHWELL, INC.
NOTES TO CONSOLIDATED FINANCIAL STATEMENTS (Continued)
6. BUSINESS COMBINATIONS (Continued)
the remaining development. Future cash flows for each project were estimated based on forecasted revenue and costs, taking into account the expected product life cycles, market penetration and growth rates.
The Company allocated the purchase price to tangible assets, liabilities and identifiable intangible assets acquired, as well as IPR&D, if identified, based on their estimated fair values. The fair value assigned to identifiable intangible assets acquired was based on estimates and assumptions made by management. Intangible Assets, with finite useful lives are amortized on a straight-line basis over their respective useful lives
The integration of the technology acquired in the acquisition with our products will complement the Company's suite of products and enhances research and development capabilities, which will allow the Company to pursue expanded market opportunities.
Supplemental Pro Forma Data (Unaudited)
The unaudited financial information in the table below summarizes the combined results of operations of the Company and the acquired company on a pro forma basis for 2009, as though the company had been combined as of the beginning of the period presented. Pro forma financial information for 2008 and 2007 has not been included as the financial results of the acquired company during these periods were deemed insignificant. The pro forma financial information is presented for informational purposes only and is not indicative of the results of operations that would have been achieved if the acquisitions had taken place at the beginning of the period presented.
The following table summarizes the pro forma financial information (in thousands, except per share amounts):
| |
Year Ended December 31, |
||||
|---|---|---|---|---|---|
| |
2009 | ||||
Revenue |
$ | 63,174 | |||
Net income |
$ | 3,090 | |||
Net income per share: |
|||||
Basic |
$ | 0.14 | |||
Diluted |
$ | 0.14 | |||
7. OTHER INTANGIBLE ASSETS
Intangible Assets
The following table summarizes the acquisition-related intangibles that were acquired during 2009 and are being amortized as of December 31, 2009 (in thousands):
| |
As of December 31, 2009 | |||||||||
|---|---|---|---|---|---|---|---|---|---|---|
| |
Gross Carrying Amount |
Accumulated Amortization |
Net Carrying Value |
|||||||
Developed technology |
$ | 1,400 | $ | (66 | ) | $ | 1,334 | |||
In-process research and development |
1,662 | — | 1,662 | |||||||
|
$ | 3,062 | $ | (66 | ) | $ | 2,996 | |||
66
TECHWELL, INC.
NOTES TO CONSOLIDATED FINANCIAL STATEMENTS (Continued)
7. OTHER INTANGIBLE ASSETS (Continued)
Developed technology is currently being amortized over 5 years and in-process research and development will not be amortized until the related development has been completed.
Amortization expense of acquisition-related intangible assets in 2009 was $66,000.
Anticipated future amortization expense for acquisition-related intangible assets is as follows (in thousands):
| |
Amortization Expense |
|||
|---|---|---|---|---|
Year ending December 31, 2010 |
$ | 267 | ||
Year ending December 31, 2011 |
267 | |||
Year ending December 31, 2012 |
267 | |||
Year ending December 31, 2013 |
267 | |||
Thereafter |
266 | |||
|
$ | 1,334 | ||
8. COMMITMENTS AND CONTINGENCIES
Indemnification Obligations
Subject to certain limitations, the Company is obligated to indemnify its current and former directors, officers and employees in connection with government inquiries and litigation. These obligations arise under the terms of the Company's certificate of incorporation, its bylaws, applicable contracts, and Delaware and California law. The obligation to indemnify generally means that the Company is required to pay or reimburse the individuals' reasonable legal expenses and possibly damages and other liabilities incurred in connection with these matters. Additionally, the Company has certain indemnification obligations to customers under its contract development projects with respect to any infringement of third-party patents and intellectual property rights by its products.
Rights Agreement
On August 4, 2009, the Company entered into a Rights Agreement (the "Rights Agreement") with Computershare Trust Company, N.A. (as "Rights Agent"). In connection with entering into the Rights Agreement, the Company's Board of Directors declared a dividend distribution of one "Right" for each outstanding share of common stock of the Company to stockholders of record at the close of business on August 18, 2009. Subject to certain limitations and exceptions, each Right, when exercisable, entitles the registered holder to purchase from the Company one one-thousandth of a share of a new series of preferred stock, designated as Series A Participating Preferred Stock (the "Preferred Stock"), at a price of Fifty Dollars ($50.00) per one one-thousandth of a share (the "Purchase Price"), subject to adjustment. The Rights become exercisable upon certain events described in the Rights Agreement. The Company and the Rights Agent retain broad authority to amend the Rights Agreement.
Other Legal Matters
The Company is currently not a party to any material legal proceedings. The Company may be named from time to time as a party to lawsuits in the normal course of its business. Litigation in general and intellectual property and securities litigation in particular, can be expensive and disruptive to normal business operations. Moreover, the results of legal proceedings are difficult to predict.
67
TECHWELL, INC.
NOTES TO CONSOLIDATED FINANCIAL STATEMENTS (Continued)
8. COMMITMENTS AND CONTINGENCIES (Continued)
Leases
The Company leases its primary facility and other offices, under operating leases which expire at various dates through 2014.
Rent expense in 2009, 2008 and 2007 was $0.7 million, $0.6 million and $0.6 million respectively. The Company recognizes rent expense on a straight-line basis over the lease period.
Future minimum lease payments under non-cancellable operating leases as of December 31, 2009 are as follows (in thousands):
| |
Operating Leases |
|||
|---|---|---|---|---|
Year ending December 31, 2010 |
$ | 748 | ||
Year ending December 31, 2011 |
658 | |||
Year ending December 31, 2012 |
90 | |||
Year ending December 31, 2013 |
35 | |||
Thereafter |
20 | |||
|
$ | 1,551 | ||
Purchase Commitments
As of December 31, 2009, the Company has purchase commitments of $3.0 million with its inventory suppliers with due dates within the next twelve months. Both the quantities and purchase prices are fixed in the noncancelable commitments.
9. INCOME TAXES
The components of income before income taxes are as follows (in thousands):
| |
Year Ended December 31, | ||||||||||
|---|---|---|---|---|---|---|---|---|---|---|---|
| |
2009 | 2008 | 2007 | ||||||||
United States |
$ | 4,983 | $ | 12,056 | $ | 14,005 | |||||
Foreign |
380 | 455 | 207 | ||||||||
Income before income taxes |
$ | 5,363 | $ | 12,511 | $ | 14,212 | |||||
68
TECHWELL, INC.
NOTES TO CONSOLIDATED FINANCIAL STATEMENTS (Continued)
9. INCOME TAXES (Continued)
The components of the income tax provision (benefit) are as follows (in thousands):
| |
December 31, | |||||||||||
|---|---|---|---|---|---|---|---|---|---|---|---|---|
| |
2009 | 2008 | 2007 | |||||||||
Current: |
||||||||||||
Federal |
$ | 1,660 | $ | 4,298 | $ | 4,840 | ||||||
State |
206 | 269 | 24 | |||||||||
Foreign |
116 | 171 | 53 | |||||||||
Total current |
1,982 | 4,738 | 4,917 | |||||||||
Deferred: |
||||||||||||
Federal |
324 | 277 | (4,444 | ) | ||||||||
State |
(439 | ) | (291 | ) | (991 | ) | ||||||
Total deferred |
(115 | ) | (14 | ) | (5,435 | ) | ||||||
Total income tax provision (benefit) |
$ | 1,867 | $ | 4,724 | $ | (518 | ) | |||||
The components of deferred tax assets for federal and state income taxes are as follows (in thousands):
| |
December 31, | ||||||||
|---|---|---|---|---|---|---|---|---|---|
| |
2009 | 2008 | |||||||
Deferred tax assets: |
|||||||||
Net operating loss carryforwards |
— | 323 | |||||||
Research and other credits |
1,375 | 1,330 | |||||||
Stock-based compensation |
3,132 | 2,838 | |||||||
Accruals |
739 | 803 | |||||||
Other |
202 | 90 | |||||||
Deferred tax assets |
$ | 5,448 | $ | 5,384 | |||||
As required, the Company assessed the recoverability of its deferred tax assets. To assess the likelihood that the deferred tax assets will be recovered from taxable income, the Company considered both positive evidence that indicates a valuation allowance is not needed and negative evidence that indicates a valuation allowance is needed. As a result of this assessment as of December 31, 2009 in which the Company considered its recent history of consecutive profitable quarters and anticipated profit in future periods, the Company believes that it is more likely than not the deferred tax assets will be realized in the future.
As a result of the Company's assessment in 2007, in which the company considered its recent history of consecutive profitable quarters and anticipated profit in future periods, the company released the valuation allowance recorded against its deferred tax assets of approximately $5.5 million as it believed that it was more likely than not the deferred tax assets would be realized in the future.
As of December 31, 2009, the Company had no federal or state net operating loss carryforwards available to offset future taxable income. As of December 31, 2009, the Company also has research and other tax credit carryforwards of approximately $0.1 million and $2.7 million for federal and state income tax purposes, respectively. If not utilized, the federal carryforwards, will expire in various
69
TECHWELL, INC.
NOTES TO CONSOLIDATED FINANCIAL STATEMENTS (Continued)
9. INCOME TAXES (Continued)
amounts beginning in 2029. The state tax credit can be carried forward indefinitely. The Company also has a California alternative minimum tax credit carryover of $12,000, and this credit does not expire.
The effective tax rate differs from the applicable U.S. statutory federal income tax rate as follows:
| |
Year Ended December 31, |
||||||||||
|---|---|---|---|---|---|---|---|---|---|---|---|
| |
2009 | 2008 | 2007 | ||||||||
U.S. statutory federal taxes at statutory rate |
35.0 | % | 35.0 | % | 35.0 | % | |||||
State taxes—net of federal benefit |
1.5 | 1.8 | 1.5 | ||||||||
Research and development credits |
(17.0 | ) | (6.2 | ) | (4.4 | ) | |||||
Stock-based compensation |
17.4 | 6.6 | 1.9 | ||||||||
Other |
(2.1 | ) | 0.6 | 1.2 | |||||||
Change in valuation allowance |
— | — | (38.8 | ) | |||||||
Effective tax rate |
34.8 | % | 37.8 | % | (3.6 | )% | |||||
A reconciliation of the beginning and ending amount of gross unrecognized tax benefits is as follows (in thousands):
| |
Unrecognized Tax Benefits |
|||
|---|---|---|---|---|
Balance at January 1, 2007 |
$ | 410 | ||
Gross increases—tax position in prior period |
— | |||
Gross decreases—tax position in prior period |
— | |||
Gross increases—tax positions related to the current year |
198 | |||
Gross decreases—tax positions related to the current year |
— | |||
Settlements |
— | |||
Lapse of statute of limitations |
— | |||
Balance at December 31, 2007 |
608 | |||
Gross increases—tax position in prior period |
— | |||
Gross decreases—tax position in prior period |
(12 | ) | ||
Gross increases—tax positions related to the current year |
247 | |||
Gross decreases—tax positions related to the current year |
— | |||
Settlements |
— | |||
Lapse of statute of limitations |
— | |||
Balance at December 31, 2008 |
843 | |||
Gross increases—tax position in prior period |
— | |||
Gross decreases—tax position in prior period |
— | |||
Gross increases—tax positions related to the current year |
285 | |||
Gross decreases—tax positions related to the current year |
— | |||
Settlements |
— | |||
Lapse of statute of limitations |
— | |||
Balance at December 31, 2009 |
$ | 1,128 | ||
For 2009, 2008 and 2007, the Company had a total of $1.1 million, $0.8 million and $0.6 million, respectively, of unrecognized tax benefits, of which $0.9 million, $0.8 million and $0.5 million,
70
TECHWELL, INC.
NOTES TO CONSOLIDATED FINANCIAL STATEMENTS (Continued)
9. INCOME TAXES (Continued)
respectively, would affect the effective tax rate, if recognized. The Company does not expect its unrecognized tax benefits to change significantly over the next 12 months.
The Company files U.S. federal, state and foreign income tax returns in jurisdictions with varying statutes of limitations. The 1997 through 2009 tax years generally remain subject to examination by federal and most state tax authorities. The Company is currently under examination by the Internal Revenue Service for the tax years 2007 and 2008. The Company does not expect the results of these examinations to have a material effect on its financial condition or results of operations.
In significant foreign jurisdictions, the 2004 through 2009 tax years generally remain subject to examination by their respective tax authorities.
United States federal income taxes have not been provided for the undistributed earnings of the Company's foreign subsidiaries. These undistributed earnings aggregated approximately $0.4 million at December 31, 2009, and it is the Company's intention that such undistributed earnings be permanently reinvested offshore. The Company would be subject to additional United States taxes if these earnings were repatriated. Determination of the amount of unrecognized deferred income tax liability related to these earnings is not practicable.
10. EMPLOYEE BENEFIT PLAN
The Company sponsors a 401(k) savings plan for all employees who meet certain eligibility requirements. Participants may contribute, on a pretax basis, an amount of their annual compensation, not to exceed a maximum contribution pursuant to Section 401(k) of the Internal Revenue Code. The Company may contribute to the plan on a discretionary basis, but is not required, nor has it contributed, to the plan in 2009, 2008 and 2007. The contributions to the 401(k) Plan, and income earned on plan contributions, are not taxable to employees until withdrawn from the 401(k) Plan.
11. SEGMENT INFORMATION
The Company currently operates in one reportable segment, the designing, marketing and selling of mixed signal integrated circuits for multiple video applications primarily for the security surveillance and automotive infotainment markets. The Company's chief operating decision maker is the Chief Executive Officer.
The percentage of total revenue by geographic location is as follows:
| |
Year Ended December 31, | ||||||||||
|---|---|---|---|---|---|---|---|---|---|---|---|
| |
2009 | 2008 | 2007 | ||||||||
China |
54 | % | 37 | % | 26 | % | |||||
South Korea |
21 | 27 | 29 | ||||||||
Taiwan |
16 | 29 | 40 | ||||||||
Japan |
6 | 5 | 3 | ||||||||
Other |
3 | 2 | 2 | ||||||||
Total revenue |
100 | % | 100 | % | 100 | % | |||||
71
TECHWELL, INC.
NOTES TO CONSOLIDATED FINANCIAL STATEMENTS (Continued)
11. SEGMENT INFORMATION (Continued)