Attached files
| file | filename |
|---|---|
| EX-32.1 - EXHIBIT 32.1 - PROTECTION ONE INC | a2197400zex-32_1.htm |
| EX-23.1 - EXHIBIT 23.1 - PROTECTION ONE INC | a2197400zex-23_1.htm |
| EX-10.2 - EXHIBIT 10.2 - PROTECTION ONE INC | a2197400zex-10_2.htm |
| EX-21.1 - EXHIBIT 21.1 - PROTECTION ONE INC | a2197400zex-21_1.htm |
| EX-10.3 - EXHIBIT 10.3 - PROTECTION ONE INC | a2197400zex-10_3.htm |
| EX-32.2 - EXHIBIT 32.2 - PROTECTION ONE INC | a2197400zex-32_2.htm |
| EX-31.2 - EXHIBIT 31.2 - PROTECTION ONE INC | a2197400zex-31_2.htm |
| EX-31.1 - EXHIBIT 31.1 - PROTECTION ONE INC | a2197400zex-31_1.htm |
| EX-10.20 - EXHIBIT 10.20 - PROTECTION ONE INC | a2197400zex-10_20.htm |
| EX-10.26 - EXHIBIT 10.26 - PROTECTION ONE INC | a2197400zex-10_26.htm |
Use these links to rapidly review the document
TABLE OF CONTENTS
UNITED STATES
SECURITIES AND EXCHANGE COMMISSION
WASHINGTON, D.C. 20549
FORM 10-K
| ý | ANNUAL REPORT PURSUANT TO SECTION 13 OR 15(d) OF THE SECURITIES EXCHANGE ACT OF 1934 | |
| For the fiscal year ended December 31, 2009 | ||
| OR | ||
| o | TRANSITION REPORT PURSUANT TO SECTION 13 OR 15(d) OF THE SECURITIES EXCHANGE ACT OF 1934 | |
| For the transition period
from to
|
||
Commission file number: 1-12181-01
Protection One, Inc.
(Exact name of registrant as specified in its charter)
| Delaware (State or Other Jurisdiction of Incorporation or Organization) |
93-1063818 (I.R.S. Employer Identification No.) |
|
1035 N. 3rd Street, Suite 101, Lawrence, KS (Address of Principal Executive Offices) |
66044 (Zip Code) |
785-856-5500
(Registrant's Telephone Number, Including Area Code)
N/A
(Former name, former address and former fiscal year, if changed since last report)
Securities registered pursuant to Section 12(b) of the Act:
| Title of each class | Name of each exchange on which registered | |
|---|---|---|
| Common Stock, par value $.01 per share, of Protection One, Inc. | The Nasdaq Global Market |
Securities registered pursuant to Section 12(g) of the Act:
None
Indicate by check mark if the registrant is a well-known seasoned issuer, as defined in Rule 405 of the Securities Act.
Yes o No ý
Indicate by check mark if the registrant is not required to file reports pursuant to Section 13 or Section 15(d) of the Exchange Act.
Yes o No ý
Indicate by check mark whether the registrant (1) has filed all reports required to be filed by Section 13 or 15(d) of the Securities Exchange Act of 1934 during the preceding 12 months (or for such shorter period that the registrant was required to file such reports), and (2) has been subject to such filing requirements for the past 90 days.
Yes ý No o
Indicate by check mark whether each registrant has submitted electronically and posted on its corporate Web site, if any, every Interactive Data File required to be submitted and posted pursuant to Rule 405 of Regulation S-T (§ 232.405 of this chapter) during the preceding 12 months (or for such shorter period that the registrant was required to submit and post such files).
Yes o No o
Indicate by check mark if disclosure of delinquent filers pursuant to Item 405 of Regulation S-K is not contained herein, and will not be contained, to the best of registrant's knowledge, in definitive proxy or information statements incorporated by reference in Part III of this Form 10-K or any amendment to this Form 10-K. ý
Indicate by check mark whether the registrant is a large accelerated filer, an accelerated filer, a non-accelerated filer or a smaller reporting company. See definitions of "large accelerated filer," "accelerated filer," and "smaller reporting company" in Rule 12b-2 of the Exchange Act.
| Large accelerated filer o | Accelerated filer o | Non-accelerated filer o (Do not check if a smaller reporting company) |
Smaller reporting company ý |
Indicate by check mark whether the registrant is a shell company (as defined in Rule 12b-2 of the Exchange Act).
Yes o No ý
As of June 30, 2009, the aggregate market value of the registrant's common stock held by non-affiliates of the registrant was $31,226,063 based on the closing sale price as reported on the NASDAQ Global Market.
The number of outstanding shares of the registrant's common stock, $0.01 par value per share, as of March 5, 2010 was 25,333,371.
DOCUMENTS INCORPORATED BY REFERENCE
| Document | Parts Into Which Incorporated | |
|---|---|---|
| Information Statement for the Annual Meeting of Stockholders to be held on or before July 25, 2010 (Information Statement) | Part I, II, III and IV |
2
FORWARD-LOOKING STATEMENTS
This Annual Report on Form 10-K and the materials incorporated by reference herein include "forward-looking statements" intended to qualify for the safe harbor from liability established by the Private Securities Litigation Reform Act of 1995. Statements that are not historical fact are forward-looking statements. These forward-looking statements generally can be identified by, among other things, the use of forward-looking language such as the words "estimate," "project," "intend," "believe," "expect," "anticipate," "may," "will," "would," "should," "could," "seeks," "plans," "intends," or other words of similar import or their negatives. Such statements include those made on matters such as our earnings and financial condition, our process to explore strategic alternatives, litigation, accounting matters, our business, our efforts to consolidate and reduce costs, our customer account acquisition strategy and attrition, our liquidity and sources of funding and our capital expenditures. All forward-looking statements are subject to certain risks and uncertainties that could cause actual results to differ materially from those in the forward-looking statements. The forward-looking statements included herein are made only as of the date of this report and we undertake no obligation to publicly update such forward-looking statements to reflect subsequent events or circumstances, except as required by federal securities laws. Certain factors that could cause actual results to differ include:
- •
- our substantial indebtedness and restrictive covenants governing our indebtedness;
- •
- our history of losses;
- •
- a change in ownership of the company or other effects from the process to explore and evaluate strategic alternatives;
- •
- changes in technology that may make our services less attractive or obsolete or require significant expenditures to
upgrade;
- •
- loss of a relationship with alarm system manufacturers, suppliers and third party service providers;
- •
- competition, including competition from companies that are larger than we are and have greater resources than we do;
- •
- the development of new services or service innovations by our competitors;
- •
- losses of our customers over time and difficulty acquiring new customers;
- •
- changes in federal, state or local government or other regulations or standards affecting our operations;
- •
- limited access to capital which may affect our ability to invest in the acquisition of new customers;
- •
- the potential for environmental or man-made catastrophes in areas of high customer concentration;
- •
- changes in conditions affecting the economy or security alarm monitoring service providers generally;
- •
- potential liability for failure to respond adequately to alarm activations; and
- •
- changes in management.
New factors emerge from time to time, and it is not possible for us to predict all of such factors or the impact of each such factor on our business or the extent to which any factor, or combination of factors, may cause actual results to differ materially from those contained in any forward-looking statements.
See also Item 1A, "Risk Factors" for a discussion of these and other risks and uncertainties that could cause actual results to differ materially from those contained in our forward-looking statements.
3
Unless the context otherwise indicates, all references in this report to the "Company," "Protection One," "we," "us" or "our" or similar words are to Protection One, Inc. and its wholly owned subsidiaries. Protection One, Inc. is a Delaware corporation organized in September 1991.
Stockholders and other security holders or buyers of our securities or our other creditors should not assume that material events subsequent to the date of this Form 10-K have not occurred.
On January 20, 2010, we announced the commencement of a process to explore and evaluate strategic alternatives, including a possible sale of the Company. There can be no assurance that this review of strategic alternatives will result in us pursuing any transaction, or that any transaction pursued will be completed.
4
Overview
We are a leading national provider of electronic security alarm monitoring services, providing installation, maintenance and electronic monitoring of alarm systems to single-family residential, commercial, multifamily and wholesale customers. We monitor signals from burglary, fire, medical and environmental alarm systems and manage information from access control and closed-circuit-television ("CCTV") systems. Most of our monitoring services revenue and a large portion of the maintenance services we provide our customers are governed by multi-year contracts with automatic renewal provisions that provide us with recurring monthly revenue ("RMR"). As of December 31, 2009 we monitored approximately 1.4 million sites. Based on information provided by a leading industry publication, we are the third largest provider of electronic security monitoring services in the United States based on RMR.
We conduct our business through the following operating segments:
- •
- Retail. Our Retail segment provides monitoring and maintenance services for
electronic security systems directly to residential and business customers. We also sell and install electronic security systems for homes and businesses through our Retail segment in order to meet
their security needs. Our Retail business serves approximately 540,000 Retail customers with no single customer comprising more than 1% of our total consolidated revenue. Retail serves customers from
60 field locations and two centralized monitoring centers. Except for the customers acquired in our merger with Integrated Alarm Services Group, Inc. ("IASG") on April 2, 2007 (the
"Merger"), the majority of our new Retail customers are generated organically through our internal sales force, with approximately 3.4% of our customer additions in 2009 acquired by purchase of
customer contracts. Our Retail segment accounted for 80.2% of our RMR at December 31, 2009, of which 30.2% was attributable to commercial customers. Our Retail business accounted for 78.6% of
our consolidated revenue for the year ended December 31, 2009.
- •
- Wholesale. We contract with independent security alarm dealers nationwide to provide
alarm system monitoring services to their residential and business customers. We also provide business support services as well as financing assistance for these independent dealers by providing loans
secured by alarm contracts and by purchasing alarm contracts. Our top 10 wholesale dealers, based on RMR, accounted for 28.7% of wholesale monitored sites and 13.0% of Wholesale RMR as of
December 31, 2009. For the year ended December 31, 2009, our Wholesale business accounted for 13.6% of our consolidated revenue. Our Wholesale business serves approximately 4,600
independent alarm monitoring companies representing approximately 677,000 monitored sites.
- •
- Multifamily. We provide monitoring and maintenance services for electronic security systems to tenants of multifamily residences, including apartments, condominiums and other multifamily dwellings, under long-term contracts with building owners and managers. For the year ended December 31, 2009, our Multifamily segment accounted for 7.8% of our consolidated revenue. Our Multifamily segment serves approximately 213,000 units in more than 1,300 properties in 461 cities.
5
Our RMR and our monitored sites composition at December 31, 2009, 2008 and 2007 were as follows:
| |
Percentage of Total | ||||||||||||||||||
|---|---|---|---|---|---|---|---|---|---|---|---|---|---|---|---|---|---|---|---|
| |
2009 | 2008 | 2007 | ||||||||||||||||
Segment
|
RMR | Sites | RMR | Sites | RMR | Sites | |||||||||||||
Retail |
80.2 | % | 37.8 | % | 76.8 | % | 31.8 | % | 77.3 | % | 34.5 | % | |||||||
Wholesale |
12.1 | 47.3 | 15.0 | 54.9 | 13.5 | 49.6 | |||||||||||||
Multifamily |
7.7 | 14.9 | 8.2 | 13.3 | 9.2 | 15.9 | |||||||||||||
Total |
100.0 | % | 100.0 | % | 100.0 | % | 100.0 | % | 100.0 | % | 100.0 | % | |||||||
The table below identifies our consolidated revenue by segment for the periods presented (dollars in thousands):
| |
Year ended December 31, | ||||||||||||||||||
|---|---|---|---|---|---|---|---|---|---|---|---|---|---|---|---|---|---|---|---|
| |
2009 | 2008 | 2007 | ||||||||||||||||
Segment
|
Revenue | Percent | Revenue | Percent | Revenue | Percent | |||||||||||||
Retail |
$ | 289,315 | 78.6 | % | $ | 291,795 | 78.4 | % | $ | 277,490 | 79.8 | % | |||||||
Wholesale |
50,188 | 13.6 | 49,477 | 13.3 | 37,978 | 10.9 | |||||||||||||
Multifamily |
28,549 | 7.8 | 30,749 | 8.3 | 32,403 | 9.3 | |||||||||||||
Total |
$ | 368,052 | 100.0 | % | $ | 372,021 | 100.0 | % | $ | 347,871 | 100.0 | % | |||||||
Financial information for the past three years for each of our business segments is presented in Item 7, "Management's Discussion and Analysis of Financial Condition and Results of Operations—Results of Operations" and in Note 16 of the Notes to Consolidated Financial Statements, included in Part II of this Annual Report on Form 10-K, and is incorporated herein by reference.
Sources of Revenue
Revenue is primarily generated from providing monitoring and maintenance services in our Retail, Wholesale and Multifamily segments. For the year ended December 31, 2009, revenue generated from monitoring and related services accounted for approximately 90% of our total revenue.
Monitoring revenue is generated based on our contracts with residential and commercial Retail, Wholesale and Multifamily customers. The initial contract term is typically three years for residential customers, five years for commercial customers and five to ten years, with an average of eight years, for Multifamily customers, with automatic renewal provisions where permitted. Our Wholesale customer contracts are generally month-to-month agreements. We generate incremental contractual recurring revenue from the majority of our residential and commercial customers by providing additional services, such as maintenance.
For the year ended December 31, 2009, installation and other revenue, derived principally from the sale of electronic security systems, contributed approximately 10% of our total revenue. Electronic security systems typically are sold at a loss in connection with generating new contracts for recurring monitoring services.
Industry and Competition
According to an industry publication and industry analysts, the market for electronic security system sales, leasing, installation, monitoring and service totaled an estimated $44.7 billion in 2009 with the monitoring and service market accounting for an estimated $16.3 billion. While total revenue for
6
the industry was slightly lower in 2009 compared to 2008, monitoring and service revenue increased approximately 3%.
The industry is comprised of small and mid-sized regional participants, the vast majority of which generate annual revenue of less than $500,000. The top five companies, based on RMR, comprise approximately 36% of the industry's RMR. We believe our primary competitors with national scope include the following:
- •
- ADT Security Services, Inc., a subsidiary of Tyco International, Ltd:
- •
- Broadview Security, which is under agreement to be acquired by a subsidiary of Tyco International Ltd.;
- •
- Monitronics International, Inc.; and
- •
- Stanley Security Solutions, a subsidiary of The Stanley Works.
Competition in the security alarm industry is based primarily on brand awareness and company reputation, price, quality and reliability of services and systems, product solutions offered and the ability to identify and solicit prospective customers as they move into homes and businesses or experience major life events such as marriage or the birth of a child. We believe that we compete effectively with other national, regional and local security alarm companies in both the residential and commercial markets.
Centralized Monitoring, Customer Service and Enhanced Services
Customer Security Solutions
Intrusion and fire alarm systems include many different types of devices installed at customer premises designed to detect or react to various occurrences or conditions, such as intrusion, environmental issues like a water leakage or the presence of fire or smoke. These devices are connected to a computerized control panel that communicates through wire line and/or wireless communication channels to one of our monitoring facilities. In most systems, control panels can identify the nature of the alarm and the areas within the building where the sensor was activated and can transmit that information to one of our central monitoring stations.
Access control systems provide physical security for a customer facility. They do this by limiting access to areas through locks and door mechanisms that are controlled by a computer or web service. Customers may establish schedules when doors are unlocked or they may define access to individuals via uniquely identified cards. The cards are electronically validated at each door through an electronic card reader. By limiting, enabling or disabling each user's card through the central controller, access control systems replace the need to manage keys.
Video solutions provide customers with the ability to monitor remote locations via cameras. Video may be viewed live over a network, recorded on site or sent electronically upon a specified event. Video solutions may be coupled with alarm systems to provide verification of alarm conditions.
Web control and notification provides our customers an array of tools to manage their alarm, video or access control systems, including options for electronic notification.
Customer Contracts
Our existing Retail monitoring customer contracts generally have initial terms ranging from three to five years in duration, and, in most states, provide for automatic renewals unless we or the customer elect to cancel the contract at the end of its term. New single-family residential customers typically have an initial contract term of three years, and most new commercial customers typically have an initial contract term of five years. The majority of our Retail customers sign alarm monitoring contracts
7
that include a bundled monthly charge for monitoring and extended service protection, which covers the costs of normal repairs of the security system. Customers may elect to sign an alarm monitoring contract providing for a reduced monthly charge that excludes extended service protection. A significant percentage of new residential and commercial customers also elect to include cellular backup technology for line security in their service bundle. Multifamily contracts have initial terms that range from five to ten years with an average of eight years. Our Wholesale customer contracts are generally month-to-month contracts.
Primary Monitoring Facilities
We provide monitoring services to our customer base from several monitoring facilities. The table below provides additional detail about our monitoring facilities:
Location
|
Approximate Number of Customer Sites Monitored |
Primary Markets | |||
|---|---|---|---|---|---|
| Irving, TX | 298,000 | Retail and Multifamily | |||
Longwood, FL |
237,000 |
Wholesale |
|||
Wichita, KS |
456,000 |
Retail |
|||
Cypress, CA |
203,000 |
Wholesale |
|||
Manasquan, NJ |
237,000 |
Wholesale |
|||
Our monitoring facilities operate 24 hours per day, seven days a week, including all holidays. Each monitoring facility incorporates the use of communications and computer systems that route incoming alarm signals and telephone calls to operators. Each operator within a monitoring facility monitors a computer screen that presents information concerning the nature of the alarm signal, the customer whose alarm has been activated and the premises at which such alarm is located. Other non-emergency administrative signals are generated by low battery status, arming and disarming of the alarm monitoring system and test signals, with such signals processed automatically by computer. Depending upon the type of service for which the customer has contracted, monitoring facility personnel respond to alarms by relaying information to local fire or police departments, notifying the customer, or taking other appropriate action, such as dispatching alarm response personnel to the customer premises where this service is available. In advanced video solutions, operators may be presented with a video clip associated with the alarm condition, further enhancing the response capabilities. Customers may also contract for remote video monitoring whereby operators will be prompted on a specified schedule to view live video of customer locations and respond upon abnormal conditions.
All of our monitoring facilities are listed by Underwriters Laboratories, Inc. ("UL") as protective signaling services stations. UL specifications for monitoring facilities include building integrity, back-up computer and power systems, staffing and standard operating procedures. In many jurisdictions, applicable law requires the security and life safety alarms for certain buildings be monitored by UL listed facilities. In addition, such listing is required by certain commercial customers' insurance companies as a condition to insurance coverage.
Retail Backup Monitoring Facility
Our Retail backup facility in Wichita, Kansas is a fully operable resource with the ability to backup all mission critical operations normally performed at our primary Retail monitoring centers. The facility is equipped with diverse voice and data telecommunication paths, backup power that includes standby uninterruptible power supplies, access control, video surveillance and data vaults. In addition, we have deployed hot redundancy for our entire complement of equipment essential in the remote monitoring
8
of the Retail security systems we offer. Furthermore, we have replicated the computer systems that are used to maintain our mission critical applications.
Wholesale Monitoring
Each of our primary Wholesale monitoring facilities operates independently from our Retail and Multifamily facilities. Through our Wholesale monitoring facilities, we provide wholesale monitoring services to independent alarm companies. Under the typical arrangement, alarm companies subcontract monitoring services to us, primarily because they cannot cost-effectively provide their own monitoring service. We may also provide billing and other services. These independent alarm companies retain ownership of the monitoring contracts and are responsible for every other aspect of the relationship with customers, including field repair service. We have recently created one integrated network among our Wholesale monitoring centers that we believe will enable us to deliver a higher level of customer care while improving our efficiency. Our Wholesale monitoring centers are supported by redundant application databases in each location.
Retail Customer Care Services
Customer care personnel answer non-emergency telephone calls typically regarding services, billing and alarm activation issues. Customer care functions for our Retail customers are handled primarily by representatives in our monitoring facilities.
Customer care personnel assist customers in understanding and resolving minor service and operating issues related to security systems and also schedule technician appointments. We also operate a dedicated telesales center to address questions that Retail customers or potential customers have about our services.
We currently maintain approximately 60 field locations in the United States from which we provide some or all of the following services in our Retail and Multifamily segments: security system installation, field repair, alarm response and sales services. Our nationwide network of branches operates in some of the largest cities in the United States and plays a critical role in enhancing customer satisfaction, reducing customer loss and building brand awareness. Repair services generate revenue primarily through billable field service calls and recurring payments under our extended service protection program. By focusing growth in targeted areas, we hope to increase the density of our customer base, to permit more effective scheduling and routing of field service technicians and create economies of scale.
Wholesale Dealer Care Services
We offer alarm monitoring and administrative services to dealers, such as billing and collection, as well as new and emerging products and services. We also provide dealers with access to technical sophistication and back office services that they may not otherwise have (or be able to profitably operate), while allowing them to maintain visible contact with their local customers, the end-users of the alarm.
We provide financing to security alarm dealers in the form of loans or alarm monitoring contract purchases. We structure the payment terms and pricing of both our alarm monitoring contract purchases and loans to provide us with an acceptable internal rate of return. When providing financing to dealers, we obtain a security interest in the underlying alarm monitoring contracts. We generally require that dealers use us to monitor all of their alarm monitoring contracts, not just those that have been acquired or financed. This monitoring requirement enables us to control the quality of the monitoring services and reduce the risk of loan default.
9
Enhanced Services
As a means of increasing revenue and enhancing customer satisfaction, we offer Retail and Wholesale customers an array of enhanced security services discussed below. These services position us as a full service provider and give our sales representatives more features to sell in their solicitation of new customers.
- •
- Web Control and Notification provides our customers an array of tools to
manage their alarm, video or access control systems, including options for electronic notification.
- •
- Extended Service Protection covers the costs of normal repairs of the
security system for our residential and business customers.
- •
- Supervised Monitoring Service allows the alarm system to send various
types of signals containing information on the use of the system, such as which users armed or disarmed the system and at what time of day. This information is supplied to customers for use in
connection with the management of their households or businesses. Supervised monitoring service can also include a daily automatic test feature.
- •
- Wireless Back-Up permits the alarm system to send signals over
a cellular telephone or dedicated radio system in the event that regular telephone service is interrupted.
- •
- Video Verification and Management allows remote activity verification at
customer sites via live or recorded video. This capability is often used to verify alarm events or to provide a reliable and economic alternative to private security services.
- •
- Inspection Service, within our Retail segment, provides our customers with periodic verification of their fire alarm system to ensure the system is functioning as designed and in accordance with the requirements of the local fire jurisdiction.
Sales and Marketing
Our Retail, Wholesale and Multifamily segments market our services to these customer segments through limited, but separate internal sales and installation branch networks. Our current customer acquisition strategy for our Retail segment relies primarily on internally generated sales, utilizing personnel in our existing branch infrastructure. The internal sales program for our Retail segment generated $1.8 million of new Retail RMR in 2009 and $2.3 million of new Retail RMR in each of 2008 and 2007. We operate a dedicated telesales center from which we respond to questions that customers or potential customers have about our services and provide quality control follow-up calls to customers for whom we recently provided installation or maintenance services. In late 2009 we created an internal sales group to sell systems and services over the phone. We plan to continue to analyze opportunities for alliance partnerships which benefit our Retail segment.
Our integrated marketing program focuses on awareness for the Protection One® brand name nationally and generation of new lead sources and opportunities. We reach out to targeted customers, both residential and commercial, through a variety of mediums in a planned and sequenced manner. These channels include, but are not limited to, on-line programs and placements, third-party purchases and outbound calling and traditional mass communications, such as radio, print and direct mail.
Leads resulting from these activities are directed to our internal sales representatives and branch-based Retail sales professionals for closing sales of monitoring systems and services. The sales force also generates revenue from selling equipment upgrades and add-ons to existing customers and by competing for those customers who are terminating their relationships with our competitors.
Our Wholesale segment employs a salaried and commissioned sales force that is geographically distributed throughout the United States and is responsible for identifying sales opportunities. This
10
sales force is supported by an internal sales and marketing team that tracks prospects and coordinates selling efforts. We also employ financial product specialists who assist the sales force in identifying and proposing financing alternatives and billing services and account managers who provide ongoing operational support to our Wholesale customers.
Our Multifamily segment sales force has reduced its focus on developing new multi-dwelling unit customers and plans to maintain a lower level of investment in sales expense and in new customer systems until economic conditions become more favorable. In 2009 and 2008, Multifamily made other related operating cost reductions to keep costs in line with revenue. Multifamily remains focused on serving the needs of its existing customer base.
We continually evaluate our customer creation and marketing strategy, including evaluating each respective channel for economic returns, volume and other factors and may shift our strategy or focus, including the elimination of a particular channel.
Attrition
See Item 7, "Management's Discussion and Analysis of Financial Condition and Results of Operations—Attrition," which is incorporated herein by reference, for more information regarding attrition calculations, the impact of attrition on our operating results and customer attrition by business segment.
Intellectual Property
We own trademarks related to the name and logo for Protection One, Network Multifamily Security, King Central and Criticom Monitoring Services, as well as a variety of trade and service marks related to individual services we provide. While we believe our trademarks, service marks and proprietary information are important to our business, we do not believe our inability to use any one of them, other than the trademarks we own in our name and logo, would have a material adverse effect on our business as a whole.
Regulatory Matters
A number of local governmental authorities have adopted or are considering various measures aimed at reducing the number of false alarms. See Item 1A, "Risk Factors," for additional information. Such measures include:
- •
- requiring permits for individual alarm systems and the revocation of such permits following a specified number of false
alarms;
- •
- imposing fines on alarm customers or alarm monitoring companies for false alarms;
- •
- imposing limitations on the number of times the police will respond to alarms at a particular location after a specified
number of false alarms;
- •
- requiring further verification of an alarm signal before the police will respond; and
- •
- imposing fines or penalties on alarm monitoring companies for transmitting false alarms.
Our operations are subject to a variety of other laws, regulations, and licensing requirements of federal, state and local authorities. In certain jurisdictions, we are required to obtain licenses or permits, to comply with standards governing employee selection and training, and to meet certain standards in the conduct of our business.
11
The alarm industry is also subject to requirements imposed by various insurance, approval, listing and standards organizations. Depending upon the type of customer served, the type of security service provided, and the requirements of applicable local governmental jurisdiction, adherence to the requirements and standards of such organizations is mandatory in some instances and voluntary in others.
Our advertising and sales practices are regulated in the United States by both the Federal Trade Commission and state consumer protection laws. In addition, certain administrative requirements and laws of the jurisdictions in which we operate also regulate such practices. Such laws and regulations include restrictions on the manner in which we promote the sale of our security alarm systems and the obligation to provide purchasers of our alarm systems with rescission rights.
Our alarm monitoring business utilizes wire line and wireless telephone lines, radio frequencies, and broadband data circuits to transmit alarm signals. The cost of telephone lines and the type of equipment which may be used in telephone line transmissions are currently regulated by both federal and state governments. The Federal Communications Commission and state public utilities commissions regulate the operation and utilization of radio frequencies.
Risk Management
The nature of the services we provide potentially exposes us to greater risks of liability for employee acts or omissions, or system failure, than may be inherent in other businesses. Substantially all of our alarm monitoring agreements and other agreements, pursuant to which we sell our products and services, contain provisions limiting liability to customers in an attempt to reduce this risk.
We carry insurance of various types, including general liability and professional liability insurance in amounts management considers adequate and customary for our industry and business. Our loss experience, and the loss experiences of other security service companies, may affect the availability and cost of such insurance. Some of our insurance policies, and the laws of some states, may limit or prohibit insurance coverage for punitive or certain other types of damages, or liability arising from gross negligence.
Employees
At December 31, 2009 we had approximately 2,600 full and part time employees. Our workforce is not unionized. We generally consider our relationship with our employees to be good.
Code of Ethics
We have adopted a code of ethics that applies to all employees, including executive officers and senior financial and accounting employees. It is our policy to comply strictly with the letter and spirit of all laws affecting our business and the conduct of our officers, directors and employees in business matters. We make available the code of ethics, free of charge, on our website at www.protectionone.com and by responding to requests addressed to our investor relations department. The investor relations department can be contacted by mail at Protection One, Inc., Attn: Investor Relations, 1035 N. 3rd Street, Suite 101, Lawrence, KS 66044 or by calling (785) 856-9368.
Access to Company Information
We electronically file our annual report on Form 10-K, quarterly reports on Form 10-Q and current reports on Form 8-K with the Securities and Exchange Commission ("SEC"). The SEC maintains a website (www.sec.gov) that contains reports, proxy and information statements and other information regarding issuers that file electronically.
12
We make available, free of charge, through our website at www.protectionone.com, and by responding to requests addressed to our investor relations department, our annual report on Form 10-K, quarterly reports on Form 10-Q and current reports on Form 8-K. These reports are available as soon as reasonably practicable after such material is electronically filed with or furnished to the SEC. We also make available through our website other important information and news about Protection One and provide users with an opportunity to register to receive automatic, electronic delivery of Protection One news alerts. The information contained on our website is not part of this document.
You should read the following risk factors in conjunction with discussions of factors discussed elsewhere in this and other of our filings with the SEC. These cautionary statements are intended to highlight certain factors that may affect our financial condition and results of operations and are not meant to be an exhaustive discussion of risks that apply to public companies with broad operations, such as us.
We have a substantial amount of indebtedness, which could have a material adverse effect on our financial condition and our ability to obtain financing in the future or to react to changes in our business.
We have, and will continue to have, a substantial amount of indebtedness, which requires significant principal and interest payments. As of December 31, 2009, the face value of our total indebtedness, including capital leases, was approximately $447.3 million, and our cash interest expense for the year ended December 31, 2009 was $47.0 million. Our level of indebtedness could limit our ability to operate our business and impair our competitive position. For example, it could:
- •
- limit our ability to obtain debt or equity financing to fund working capital, capital expenditures, acquisitions and debt
service requirements;
- •
- limit our flexibility in planning for, or reacting to, changes in our business and future business opportunities;
- •
- make us more vulnerable to a downturn in our business or in the economy or to an increase in interest rates;
- •
- place us at a disadvantage to some of our competitors that may be less highly leveraged than us; and
- •
- require a substantial portion of our cash flow from operations to be used for debt service, thereby reducing the availability of our cash flow to fund working capital, capital expenditures, acquisitions and other general corporate purposes.
One or a combination of these factors could adversely affect our financial condition. Subject to restrictions in the agreements governing our indebtedness, we may incur additional indebtedness which could increase the risks associated with our already substantial amount of indebtedness.
Restrictive covenants restrict our ability to operate our business and to pursue our business strategies, and our failure to comply with these covenants could result in an acceleration of our indebtedness.
The credit agreement governing our senior credit facility (as amended, the "Senior Credit Agreement") and the credit agreement governing our unsecured term loan facility ("Unsecured Term Loan Agreement") contain covenants that restrict our ability to finance future operations or capital needs, to respond to changing business and economic conditions or to engage in other transactions or business activities that may be important to our growth strategy or otherwise important to us. See Item 7, "Management's Discussion and Analysis of Financial Condition and Results of Operations—Liquidity and Capital Resources—Debt Obligations," for more information on our indebtedness. Our
13
Senior Credit Agreement and the Unsecured Term Loan Agreement restrict, among other things, our ability to:
- •
- incur additional indebtedness or enter into sale and leaseback transactions;
- •
- pay any cash dividends or make distributions on our capital stock or certain other restricted payments or investments;
- •
- purchase or redeem stock;
- •
- issue stock of our subsidiaries;
- •
- make investments and extend credit;
- •
- engage in transactions with affiliates;
- •
- transfer and sell assets;
- •
- effect a consolidation or merger or sell, transfer, lease or otherwise dispose of all or substantially all of our assets;
and
- •
- create liens on our assets to secure debt.
In addition, our Senior Credit Agreement requires us to meet certain financial ratios and to repay outstanding borrowings with portions of the proceeds we receive from certain sales of property or assets and specified future debt and equity offerings. Our financial results may be affected by unforeseen adverse events, and we may not be able to meet the financial ratio requirements.
Any breach of the covenants in our Senior Credit Agreement or Unsecured Term Loan Agreement could cause a default under such instruments. If there were an event of default under any of our debt instruments that was not cured or waived, the holders of the defaulted debt could cause all amounts outstanding with respect to the debt instrument to be due and payable immediately. Our assets and cash flow would not be sufficient to fully repay borrowings under our outstanding debt instruments if accelerated upon an event of default. If, as or when required, we are unable to repay, refinance or restructure our indebtedness under, or amend the covenants contained in our Senior Credit Agreement, the lenders under our senior credit facility could institute foreclosure proceedings against the assets securing borrowings under our senior credit facility.
We have a history of losses.
We recorded net income of $17.5 million for the year ended December 31, 2009, and net losses of $50.5 million and $32.2 million for the years ended December 31, 2008 and 2007, respectively. The net income in 2009 is primarily the result of our settlement agreement with Westar. See Item 7, "Management's Discussion and Analysis of Financial Condition and Results of Operations-Significant Activities." Our results of operations reflect the following, among other factors:
- •
- substantial charges incurred by us for amortization of customer accounts;
- •
- interest incurred on indebtedness;
- •
- loss on retirement of debt in 2008;
- •
- Merger-related costs in 2007; and
- •
- other charges required to manage operations.
We will continue to incur substantial interest expenses. As long as we continue to add to our existing customer base, we will incur substantial amortization of customer accounts.
14
Our Board of Directors has announced its intention to explore and evaluate strategic alternatives, which could include a sale of the Company.
On January 20, 2010, our Board of Directors announced commencement of a process to explore and evaluate strategic alternatives, including a possible sale of the Company. There can be no assurance that this review of strategic alternatives will result in pursuit of any transaction, or that any transaction pursued by the Company will be completed. We may be unable to retain the services of some of our key employees and may experience difficulty in obtaining new customers and maintaining relationships with suppliers and other service providers due to the uncertainty of the process and changes that may occur as a result of the process. The market price of our stock may be volatile as we explore strategic alternatives, and volatility may persist or be increased if and when a decision to pursue a specific transaction is announced or we announce that we are no longer exploring strategic alternatives.
The price of our common stock may continue to fluctuate or decline over time.
The price at which our common stock trades may fluctuate substantially or decline due to:
- •
- our historical and anticipated quarterly and annual operating results;
- •
- loss of one or more significant customers;
- •
- significant acquisitions, strategic alliances, joint ventures or capital commitments by us or our competitors;
- •
- legal or regulatory matters;
- •
- additions or departures of any key employee;
- •
- investor perceptions of our company and comparable companies;
- •
- our ability to comply with financial covenants in our Senior Credit Agreement or Unsecured Term Loan Agreement;
- •
- the large number of shares held by the Principal Stockholders;
- •
- our process to explore strategic alternatives;
- •
- price and volume fluctuations in the overall stock market; and
- •
- general market conditions and trends.
Entities affiliated with Quadrangle Group and Monarch Alternative Capital are our principal stockholders and together can exercise a controlling influence over us, which may adversely affect the trading price of our common stock.
Quadrangle Capital Partners LP, Quadrangle Capital Partners-A LP and Quadrangle Select Partners LP (collectively "Quadrangle") and Monarch Debt Recovery Master Fund Ltd and Monarch Opportunities Master Fund Ltd (collectively "Monarch" and together with Quadrangle the "Principal Stockholders"), collectively own approximately 70% of our outstanding common stock. Pursuant to a stockholders agreement, subject to the Principal Stockholders, acting together, maintaining a certain threshold of ownership in us, the Principal Stockholders will be able to control the election of a majority of our directors and accordingly exercise a controlling influence over our business and affairs, including any determinations with respect to mergers or other business combinations involving us, appointment of our officers, our acquisition or disposition of material assets and our incurrence of indebtedness. Similarly, the Principal Stockholders, acting together, will continue to have the power to determine matters submitted to a vote of our stockholders without the consent of other stockholders and to take other actions that are in the interests of the Principal Stockholders. There can be no assurance that the interests of the Principal Stockholders will coincide with our interests or the interests of our other stockholders.
15
We rely on technology that may become obsolete, which could require significant capital expenditures.
Our monitoring services depend upon the technology (hardware and software) of security alarm systems. In order to maintain our customer base that currently uses security alarm components that are or could become obsolete, we may be required to upgrade or implement new technologies that could require significant capital expenditures. In the future, we may not be able to successfully implement new technologies or adapt existing technologies to changing market demands. If we are unable to adapt in response to changing technologies, market conditions or customer requirements in a timely manner, such inability could adversely affect our business.
Shifts in our current and future customers' selection of telecommunications services could increase customer attrition and could adversely impact our earnings and cash flow.
Certain elements of our operating model rely on our customers' selection and continued use of traditional, land-line telecommunications services, which we use to communicate with our monitoring operations. In order to continue to service existing customers who cancel their land-line telecommunications services and to service new customers who do not subscribe to land-line telecommunications services, some customers must upgrade to alternative and often more expensive wireless or internet based technologies. Higher costs may reduce the market for new customers of alarm monitoring services, and the trend away from traditional land lines to alternatives may mean more existing customers will cancel service with us. Our Multifamily segment, in particular, has experienced customer cancellations which we believe are due in part to low penetration of land-line based phone services in rental units. Continued shifts in customers' preferences regarding telecommunications services could continue to have an adverse impact on our earnings, cash flow and customer attrition.
We depend on our relationships with alarm system manufacturers and suppliers and our hosted services suppliers. If we are not able to maintain or renew these alliances or our manufacturers and suppliers fail to provide us with innovative product offerings or hosted services, our ability to create new customers and service our existing account base could be negatively affected.
We currently have agreements with certain electronic security system manufacturers and suppliers of hardware for products that we install in customer locations as part of new systems or as replacement parts for existing systems. We may not be able to maintain or renew our existing product sourcing arrangements on terms and conditions acceptable to us, or at all, if one or more of our suppliers discontinue offering a technology we have relied on or if one or more of our suppliers exits the electronic security system market. If we are unable to maintain or renew our existing relationships, we may incur additional costs creating new supplier arrangements and in servicing existing customers.
We are also dependent on our electronic security system manufacturers for continued technological innovation. If the electronic security system product families we have invested in fail to keep pace with other manufacturers' and suppliers' technologies, we may incur additional training and inventory costs and our ability to attract new customers and service our existing customers could be adversely affected.
We depend on third party suppliers to provide our e-Secure and cellular backup services. If those services become unavailable or if the price for those services fluctuates significantly, we may lose existing customers and have difficulty attracting new customers.
We face continuing competition and pricing pressure from other companies in our industry and, if we are unable to compete effectively with these companies, our sales and profitability could be adversely affected.
We compete with a number of major domestic security monitoring services companies, as well as a large number of smaller, regional competitors. We believe that this competition is a factor in our attrition, limits our ability to raise prices, and, in some cases, requires that we lower prices. Some of our competitors, either alone or in conjunction with their respective parent corporate groups, are larger
16
than we are and have greater financial resources, sales, marketing or operational capabilities or brand recognition than we do. In addition, opportunities to take market share using innovative products, services and sales approaches may attract new entrants to the field. We may not be able to compete successfully with the offerings and sales tactics of other companies, which could result in the loss of customers and, as a result, decreased revenue and operating results.
We may not be able to realize any or all of the anticipated benefits from prior or future acquisitions of portfolio alarm monitoring contracts.
Acquisitions of end-user alarm monitoring contracts involve a number of risks, including the possibility that the acquiring company will not be able to realize the recurring monthly revenue stream it contemplated at the time of acquisition because of higher than expected attrition rates or fraud. Although we generally complete an extensive due diligence process prior to acquiring alarm monitoring contracts and obtain representations and warranties from sellers, we may not detect fraud, if any, on the part of any seller, including the possibility that any seller misrepresented the historical attrition rates of the sold contracts or sold or pledged the contracts to a third party. If the sale of alarm monitoring contracts involves fraud or the representations and warranties are otherwise inaccurate, it may not be possible to recover from the seller damages in an amount sufficient to fully compensate us for any resulting losses. In such event, we may incur significant costs in litigating ownership or breach of acquisition contract terms.
Our customer acquisition and creation strategies and the competitive market for the acquisition and creation of customer accounts may affect our future profitability.
Our account acquisition strategy has evolved to emphasize our internal sales force, supported by traditional marketing practices and by forming marketing alliances. In addition, we seek to augment our internal efforts with acquisitions when suitable market conditions exist. The success or failure of our current strategy could impact our customer base.
If we are successful executing a customer acquisition strategy emphasizing internal sales, selling costs will increase our expenses and uses of cash. Failure to replace customers lost through attrition or increased use of cash to replace those customers could have a material adverse effect on our business, financial condition, results of operations and ability to service debt obligations. Increased competition from other alarm monitoring companies could require us to reduce our prices for installations, decrease the monitoring fees we charge our customers and take other measures that could reduce our margins. These decreases and other measures could have a material adverse effect on us.
We compete with several companies that have account acquisition and loan programs for independent dealers and some of those competitors are larger than we are and have more capital than we do. Increased competition from other alarm monitoring companies could require us to pay more for account acquisitions and take other measures that could reduce returns from investing in acquisitions of customer accounts. These measures could have a material adverse effect on us.
Loss of customer accounts could materially adversely affect our operations.
We experience the loss of accounts as a result of, among other factors:
- •
- customers' inability or unwillingness to pay our charges;
- •
- adverse financial and economic conditions, the impact of which may be particularly acute among our small business and
multifamily customers;
- •
- relocation of customers;
- •
- the customers' perceptions of value;
- •
- competition from other alarm service companies;
17
- •
- declines in occupancy rates for Multifamily dwellings;
- •
- Wholesale dealers' perception of channel conflict with us;
- •
- the sale of accounts by Wholesale dealers to third parties who choose to monitor the purchased accounts elsewhere;
- •
- the purchase of our Wholesale dealers by third parties who choose to monitor elsewhere; and
- •
- large Wholesale customers who have the scale to monitor their own accounts cost-effectively and may choose to do so for cost and other reasons.
We may experience the loss of newly acquired or created accounts to the extent we do not integrate or adequately service those accounts. Customer loss may not become evident for some time after an acquisition is consummated because some acquired accounts are prepaid on an annual, semiannual or quarterly basis. Retail RMR and attrition rates could be impacted by higher attrition rates from the retail portfolio acquired from IASG. We also expect Multifamily account and RMR losses to exceed additions until the efforts we are making to further reduce our rate of attrition become more successful than they have been to date. Wholesale attrition could increase if our largest Wholesale customers, who have the scale to monitor their own accounts in a cost effective manner, chose to do so for cost or other reasons. Loss of a large Wholesale dealer could result in a significant reduction in RMR. Net losses of customer accounts could materially and adversely affect our business, financial condition and results of operations.
Increased adoption of "false alarm" ordinances by local governments may adversely affect our business.
An increasing number of local governmental authorities have adopted, or are considering the adoption of, laws, regulations or policies aimed at reducing the perceived costs to municipalities of responding to false alarm signals. Such measures could include:
- •
- requiring permits for the installation and operation of individual alarm systems and the revocation of such permits
following a specified number of false alarms;
- •
- imposing limitations on the number of times the police will respond to alarms at a particular location after a specified
number of false alarms;
- •
- requiring further verification of an alarm signal before the police will respond; and
- •
- subjecting alarm monitoring companies to fines or penalties for transmitting false alarms.
Enactment of these measures could adversely affect our future business and operations. For example, concern over false alarms in communities adopting these ordinances could cause a decrease in the timeliness of police response to alarm activations. As a result, the propensity of consumers to purchase or maintain alarm monitoring services could decrease and our costs to service affected accounts could increase.
Increased adoption of statutes and governmental policies purporting to void automatic renewal provisions in our customer contracts, or purporting to characterize certain of our charges as unlawful, may adversely affect our business.
Our customer contracts typically contain provisions automatically renewing the term of the contract at the end of the initial term, unless cancellation notice is delivered in accordance with the terms of the contract. If the customer cancels prior to the end of the contract term, other than in accordance with the contract, we may charge the customer the amounts that would have been paid over the remaining term of the contract, or charge an early cancellation fee.
Several states have adopted, or are considering the adoption of, consumer protection policies or legal precedents which purport to void the automatic renewal provisions of our customer contracts, or otherwise restrict the charges we can impose upon contract cancellation. Such initiatives could compel
18
us to increase the length of the initial term of our contracts, increase our charges during the initial term, or both, and consequently lead to less demand for our services and increase our attrition. Adverse judicial determinations regarding these matters could cause us to incur legal exposure to customers against whom such charges have been imposed, and the risk that certain of our customers may seek to recover such charges through litigation. In addition, the costs of defending such litigation and enforcement actions could have an adverse effect on us.
Due to a concentration of accounts in California, Florida and Texas, we are susceptible to environmental incidents that may negatively impact our results of operations.
Almost 44% of our RMR at December 31, 2009 was derived from customers located in California, Florida and Texas. A major earthquake, hurricane or other environmental disaster in an area of high account concentration could disrupt our ability to serve those customers or render those customers uninterested in continuing to retain us to provide alarm monitoring services.
We are susceptible to downturns in the housing market which may negatively impact our results of operations.
We believe demand for alarm monitoring services in our Retail segment is affected by the turnover in the single family housing market. Downturns in the rate of sale of existing single family homes would reduce opportunities to make sales of new security systems and services and reduce opportunities to take over existing security systems that had previously been monitored by our competitors. These reduced opportunities to add RMR could negatively affect our results of operations.
Declines in rents, occupancy rates and new construction of multifamily dwellings may affect our sales in this marketplace.
We believe demand for alarm monitoring services in the Multifamily segment is tied to the general health of the multifamily housing industry. This industry is dependent upon prevailing rent levels and occupancy rates as well as the demand for construction of new properties. Given the generally cyclical nature of the real estate market, we believe that, in the event of a decline in the market factors described above, it is likely that demand for our alarm monitoring services to multifamily dwellings would also decline, which could negatively impact our results of operations.
We could face liability for our failure to respond adequately to alarm activations.
The nature of the services we provide potentially exposes us to greater risks of liability for employee acts or omissions or system failures than may be inherent in other businesses. In an attempt to reduce this risk, our alarm monitoring agreements and other agreements pursuant to which we sell our products and services contain provisions limiting our liability to customers and third parties. In the event of litigation with respect to such matters, however, these limitations may not be enforced. In addition, judgments against us and the costs of such litigation could have an adverse effect on us.
In the event that adequate insurance is not available or our insurance is not deemed to cover a claim, we could face liability.
We carry insurance of various types, including general liability and professional liability insurance, in amounts management considers adequate and customary for the industry. Some of our insurance policies, and the laws of some states, may limit or prohibit insurance coverage for punitive or certain other types of damages, or liability arising from gross negligence. If we incur increased losses related to employee acts or omissions, or system failure, or if we are unable to obtain adequate insurance coverage at reasonable rates, or if we are unable to receive reimbursements from insurance carriers, our financial condition and results of operations could be materially and adversely affected.
19
Future government regulations or other standards could have an adverse effect on our operations.
Our operations are subject to a variety of laws, regulations and licensing requirements of federal, state and local authorities. In certain jurisdictions, we are required to obtain licenses or permits to comply with standards governing employee selection and training and to meet certain standards in the conduct of our business. The loss of such licenses, or the imposition of conditions to the granting or retention of such licenses, could have an adverse effect on us. In the event that these laws, regulations and/or licensing requirements change, we may be required to modify our operations or to utilize resources to maintain compliance with such rules and regulations. In addition, new regulations may be enacted that could have an adverse effect on us.
The loss of our Underwriter Laboratories listing could negatively impact our competitive position.
All of our alarm monitoring centers are Underwriters Laboratories ("UL") listed. To obtain and maintain a UL listing, an alarm monitoring center must be located in a building meeting UL's structural requirements, have back-up and uninterruptible power supplies, have secure telephone lines and maintain redundant computer systems. UL conducts periodic reviews of alarm monitoring centers to ensure compliance with their regulations. Non-compliance could result in a suspension of our UL listing. The loss of our UL listing could negatively impact our competitive position.
We are dependent upon our experienced senior management, who would be difficult to replace.
The success of our business is largely dependent upon the active participation of our executive officers, who have extensive experience in the industry. The loss of service of one or more of such officers or the inability to attract or retain qualified personnel for any reason may have an adverse effect on our business.
ITEM 1B. UNRESOLVED STAFF COMMENTS.
None.
We maintain our executive offices at 1035 N. 3rd Street, Suite 101, Lawrence, Kansas 66044. We operate primarily from the following facilities, although we also lease office space for our approximately 60 field locations.
Location
|
Approximate Size (sq. ft.) |
Lease/Own | Principal Purpose | ||||
|---|---|---|---|---|---|---|---|
| Irving, TX | 53,750 | Lease | Retail and Multifamily monitoring facility/administrative functions | ||||
| Longwood, FL | 20,000 | Lease | Wholesale monitoring facility/administrative functions | ||||
| Lawrence, KS | 21,000 | Lease | Financial/administrative headquarters | ||||
| Cypress, CA | 17,000 | Lease | Wholesale monitoring facility | ||||
| Manasquan, NJ | 7,200 | Own | Wholesale monitoring facility | ||||
| Wichita, KS | 50,000 | Own | Retail monitoring facility/administrative functions | ||||
| Wichita, KS | 122,000 | Own | Backup Retail monitoring center/administrative functions | ||||
Information on our legal proceedings is set forth in Item 8, Note 13 of the Notes to the Consolidated Financial Statements, included in Part II of this Annual Report on Form 10-K, which are incorporated herein by reference.
20
ITEM 5. MARKET FOR REGISTRANT'S COMMON EQUITY AND RELATED STOCKHOLDER MATTERS AND ISSUER PURCHASES OF EQUITY SECURITIES.
Market Price Information
Our common stock has been listed on the NASDAQ Global Market under the symbol "PONE" since April 2, 2007. The table below sets forth for each of the calendar quarters indicated the high and low sales prices per share of our common stock, as reported by the NASDAQ Global Market.
| |
High | Low | |||||
|---|---|---|---|---|---|---|---|
2009: |
|||||||
First Quarter |
$ | 5.17 | $ | 0.83 | |||
Second Quarter |
4.99 | 1.95 | |||||
Third Quarter |
4.84 | 3.04 | |||||
Fourth Quarter |
7.00 | 4.36 | |||||
2008: |
|||||||
First Quarter |
$ | 13.00 | $ | 8.52 | |||
Second Quarter |
11.50 | 6.84 | |||||
Third Quarter |
10.12 | 6.43 | |||||
Fourth Quarter |
9.47 | 4.13 | |||||
Dividend Information
We are prohibited from paying cash dividends to our stockholders under covenants contained in our Senior Credit Agreement. We did not declare or pay any dividends for the years ended December 31, 2009 or 2008. Any future determination to pay dividends will be at the discretion of our board of directors, subject to compliance with covenants in current and future agreements governing our indebtedness, and will depend upon our results of operations, financial condition, capital requirements and other factors that our board of directors deems relevant. We currently intend to retain all available funds and any future earnings to fund the development and growth of our business and to repay indebtedness, and therefore we do not anticipate paying any cash dividends in the foreseeable future.
Number of Stockholders
As of March 5, 2010, there were approximately 436 stockholders of record who held shares of our common stock.
21
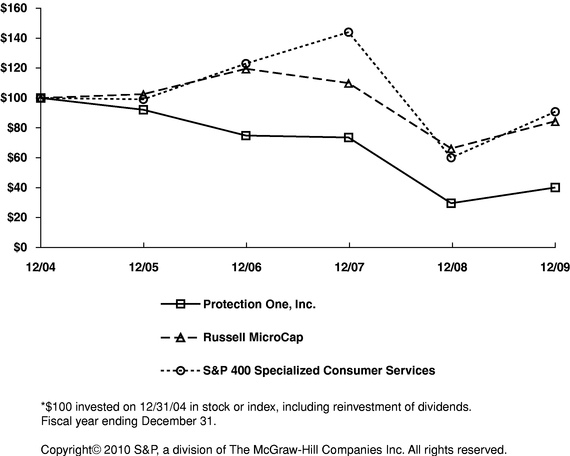
Performance Graph
The following chart compares the cumulative total stockholder returns on the Common Stock since December 31, 2004 to (1) the cumulative total returns over the same period of the Russell MicroCap index and (2) the S&P 400 Specialized Consumer Services index. The chart assumes the value of the investment in the Common Stock and each index was $100 at December 31, 2004 and that all dividends were reinvested.
COMPARISON OF 5 YEAR CUMULATIVE TOTAL RETURN*
Among Protection One, Inc., The Russell MicroCap Index
And S&P 400 Specialized Consumer Services
22
ITEM 6. SELECTED FINANCIAL DATA.
The selected consolidated financial data set forth below should be read in conjunction with Item 7, "Management's Discussion and Analysis of Financial Condition and Results of Operations" and the audited consolidated financial statements and notes to the financial statements of Protection One, Inc., which can be found in Item 8.
As a result of the Principal Stockholders obtaining over 95% of our common stock on February 8, 2005, we "pushed down" the Principal Stockholders' basis to a proportionate amount of our underlying assets and liabilities acquired based on the estimated fair market values of the assets and liabilities. The primary changes to the balance sheet reflect (1) the reduction of deferred customer acquisition costs and revenue, which were subsumed into the estimated fair market value adjustment for customer accounts; (2) adjustments to the carrying values of debt to estimated fair market value (or the Principal Stockholders' basis in the case of the credit facility); (3) adjustments to historical goodwill to reflect goodwill arising from the push down accounting adjustments; (4) the recording of a value for our trade names; and (5) an increase to the equity section from these adjustments. The primary changes to the income statement include (1) the reduction in installation and other revenue due to a lower level of amortization from the reduced amortizable base of deferred customer acquisition revenue; (2) the reduction in installation and other costs of revenue and selling expenses due to a lower level of amortization from the reduced amortizable base of deferred customer acquisition costs; (3) an increase in interest expense due to amortization of debt discounts arising from differences in fair values and carrying values of our debt instruments; and (4) the reduction in amortization related to the reduction in the amortizable base of customer accounts. Due to the impact of the changes resulting from the push down accounting, the statement of operations data and cash flow data presentations for 2005 results are separated into two periods: (1) the period prior to the February 8, 2005 consummation of the exchange transaction and (2) the period beginning after that date utilizing the new basis of accounting. The results are further separated by a heavy black line to indicate the effective date of the new basis of accounting.
23
The condensed financial data set forth below includes the financial results for IASG subsequent to the Merger. See Note 9 of the Notes to Consolidated Financial Statements, included in Part II of this Annual Report on Form 10-K, for additional information related to the Merger. All amounts are in thousands, except per share data, unless otherwise noted.
| |
SELECTED CONSOLIDATED FINANCIAL DATA | ||||||||||||||||||||
|---|---|---|---|---|---|---|---|---|---|---|---|---|---|---|---|---|---|---|---|---|---|
| |
Year Ended December 31, 2009 |
Year Ended December 31, 2008 |
Year Ended December 31, 2007 |
Year Ended December 31, 2006 |
February 9 through December 31, 2005 |
|
January 1 through February 8, 2005 |
||||||||||||||
Statements of operations data |
|||||||||||||||||||||
Revenue |
$ | 368,052 | $ | 372,021 | $ | 347,871 | $ | 270,552 | $ | 234,481 | $ | 28,543 | |||||||||
Cost of revenue (exclusive of amortization and depreciation shown below) |
150,268 | 159,730 | 140,705 | 101,387 | 81,059 | 10,714 | |||||||||||||||
Selling, general and administrative expenses |
127,403 | 136,813 | 125,398 | 103,916 | 86,014 | 12,093 | |||||||||||||||
Merger-related costs |
— | — | 4,344 | — | — | — | |||||||||||||||
Change in control, restructuring, recapitalization and corporate consolidation costs |
— | — | — | 4,472 | 2,339 | 5,939 | |||||||||||||||
Amortization and depreciation expense |
50,096 | 64,275 | 62,064 | 41,667 | 43,742 | 6,638 | |||||||||||||||
Impairment of trade name |
— | 925 | — | — | — | — | |||||||||||||||
Operating income (loss) |
40,285 | 10,278 | 15,360 | 19,110 | 21,327 | (6,841 | ) | ||||||||||||||
Interest expense, net |
45,311 | 47,745 | 46,977 | 35,900 | 30,634 | 4,544 | |||||||||||||||
(Gain) loss on retirement of debt |
(1,956 | ) | 12,788 | — | — | 6,657 | — | ||||||||||||||
Gain on settlement agreement |
(22,867 | ) | — | — | — | — | — | ||||||||||||||
Other income |
— | (54 | ) | (90 | ) | (52 | ) | (688 | ) | (15 | ) | ||||||||||
Income (loss) before income taxes |
19,797 | (50,201 | ) | (31,527 | ) | (16,738 | ) | (15,276 | ) | (11,370 | ) | ||||||||||
Income tax expense |
2,290 | 341 | 713 | 667 | 312 | 35 | |||||||||||||||
Net income (loss) |
$ | 17,507 | $ | (50,542 | ) | $ | (32,240 | ) | $ | (17,405 | ) | $ | (15,588 | ) | $ | (11,405 | ) | ||||
Basic and diluted net income (loss) per share of common stock(a) |
$ | 0.69 | $ | (2.00 | ) | $ | (1.37 | ) | $ | (0.95 | ) | $ | (0.86 | ) | $ | (5.80 | ) | ||||
Weighted average number of shares of common stock outstanding(a) |
25,324,440 | 25,310,364 | 23,525,652 | 18,233,221 | 18,198,571 | 1,965,654 | |||||||||||||||
Consolidated balance sheet data |
|||||||||||||||||||||
Working capital (deficit) |
$ | (18,406 | ) | $ | (1,777 | ) | $ | 5,555 | $ | (4,990 | ) | $ | (5,067 | ) | |||||||
Customer accounts, net |
203,453 | 237,718 | 282,396 | 200,371 | 232,875 | ||||||||||||||||
Goodwill |
43,853 | 41,604 | 41,604 | 12,160 | 12,160 | ||||||||||||||||
Total assets |
571,895 | 639,054 | 672,717 | 443,953 | 436,302 | ||||||||||||||||
Long term debt, including capital leases, net of current portion |
436,550 | 523,927 | 521,180 | 391,991 | 321,293 | ||||||||||||||||
Total stockholders' equity (deficiency in assets) |
(59,063 | ) | (80,250 | ) | (22,517 | ) | (79,943 | ) | 8,067 | ||||||||||||
Cash flow data |
|||||||||||||||||||||
Cash flows provided by operations |
$ | 105,397 | $ | 59,654 | $ | 57,664 | $ | 49,527 | $ | 40,413 | $ | 3,710 | |||||||||
Cash flows used in investing activities |
(31,792 | ) | (48,357 | ) | (34,670 | ) | (36,687 | ) | (24,151 | ) | (2,473 | ) | |||||||||
Cash flows used in financing activities |
(86,420 | ) | (13,413 | ) | (6,595 | ) | (8,133 | ) | (50,134 | ) | — | ||||||||||
- (a)
- On May 12, 2006, a cash dividend of $3.86 per share was paid to all holders of record of common stock on May 8, 2006. Loss per share and weighted average number of shares presented give retroactive effect to the one-share-for-fifty shares reverse stock split on February 8, 2005.
24
ITEM 7. MANAGEMENT'S DISCUSSION AND ANALYSIS OF FINANCIAL CONDITION AND RESULTS OF OPERATIONS.
Overview
We are a leading national provider of electronic security alarm monitoring services, providing installation, maintenance and electronic monitoring of alarm systems to single-family residential, commercial, multifamily and wholesale customers. We monitor signals from burglary, fire, medical and environmental alarm systems and manage information from access control and CCTV systems.
Our business consists of three primary segments: Retail, Wholesale and Multifamily which market our services to these customer segments through limited, but separate internal sales and installation branch networks. Our Retail segment provides monitoring and maintenance services for electronic security systems directly to residential and business customers. We also sell and install electronic security systems for homes and businesses through our Retail segment in order to meet their security needs. In late 2009, we created an internal sales group to sell systems and services over the phone. Our Wholesale segment contracts with independent security alarm dealers nationwide to provide alarm system monitoring services to their residential and business customers. We also provide business support services as well as financing assistance for these independent dealers by providing loans secured by alarm contracts and by purchasing alarm contracts. Our Multifamily segment provides monitoring and maintenance services for electronic security systems to tenants of multifamily residences, including apartments, condominiums and other multifamily dwellings, under long-term contracts with building owners and managers.
As you read this section, please refer to our Consolidated Financial Statements and accompanying notes in Item 8 of this Annual Report.
Sources of Revenue
For both Retail and Multifamily segments, revenue is primarily generated from providing monitoring services. Monitoring revenue is generated based on our contracts with our customers. Our Retail customer contracts typically have three-year initial terms for residential customers and five-year initial terms for commercial customers. Our Multifamily customer contracts have initial terms that fall within a range of five to ten years and average eight years at inception. Our contracts generally also provide for automatic renewal provisions where permitted. Many of our residential and commercial contracts require us to provide additional services, such as maintenance services, generating incremental revenue for us. Wholesale revenue includes monitoring services as well as business support services with contracts generally on a month-to-month basis. Installation and other revenue consists primarily of sales of burglar alarms, closed circuit television systems, fire alarms and card access control systems to commercial customers as well as amortization of previously deferred revenue.
Costs of Revenue; Expenses
Monitoring and related services costs generally relate to the cost of providing monitoring service and include the costs of monitoring, billing, customer service and field operations. Installation and other costs of revenue consist primarily of equipment and labor charges to install alarm systems, closed circuit television systems, fire alarms and card access control systems sold to our customers as well as amortization of previously deferred costs.
Selling expenses include employee compensation, benefits and recruiting for our internal sales force, spending on marketing and selling programs, advertising, customer signage, marketing materials, trade show expense and amortization of previously deferred selling costs. General and administrative expenses include employee compensation and benefits, lease expenses on office space and office equipment, costs of debt collection efforts, professional service fees and other miscellaneous expenses.
25
Amortization of intangibles and depreciation includes amortization of customer accounts, dealer relationships and non-competition agreements as well as depreciation on property and equipment.
Business Strategy
Our overall goal is to improve returns on invested capital while increasing our market share in select segments for Retail and Wholesale electronic security systems and services in the largest cities and metropolitan areas in the United States. Specific goals include:
- •
- delivering value-added customer solutions, such as our e-Secure web-based intrusion control
solution, to attract new customers as well as drive RMR growth;
- •
- utilizing technology improvements and our national infrastructure more effectively to continue service improvements while
reducing costs to serve our customer base and maintaining our focus on reducing attrition;
- •
- investing more resources, both personnel and systems-based, to increase our share of the market for integrated electronic
security systems and services in targeted mid-market commercial segments;
- •
- focusing residential investment within targeted residential segments to drive brand awareness and customer acquisition
through multiple channels, including direct sales, telesales, alliances and the Internet, for interactive electronic security systems and service; and
- •
- investing in order to offer the most advanced web-based Wholesale services with national disaster recovery while targeting Wholesale customers who value these services along with close geographic proximity.
We plan to achieve these objectives by building upon our core strengths, including our multiple monitoring centers and national branch platform, our brand recognition, our internal sales force model and our highly skilled and experienced management team and workforce.
Significant Activities
Second Amended and Restated Credit Agreement and Debt Retirement
On November 17, 2009, we amended our senior credit agreement (as amended, the "Senior Credit Agreement") which (i) increased our term loan borrowings by $75 million (the "New Term Loans") to an aggregate of $364.5 million, (ii) divided all of our term loans into a tranche equal to $86.5 million (the "Non-Extending Term Loans") and a tranche equal to $278.0 million (the "New and Extending Term Loans") and (iii) replaced our $25 million revolving credit facility with a $15 million revolving credit facility.
The proceeds from the New Term Loans under the Senior Credit Agreement, together with excess cash, were deposited with the trustee under the indenture governing Protection One Alarm Monitoring, Inc.'s ("POAMI") 12% Senior Secured Notes due 2011 (the "Senior Secured Notes") in order to redeem the Senior Secured Notes in full. The Senior Secured Notes were called for redemption effective December 17, 2009 and the obligations of POAMI, Protection One and other guarantors under the indenture were satisfied and discharged. We wrote-off $4.7 million, net, of unamortized premium and debt issue costs in connection with the redemption. In addition, payments of $4.7 million were made for termination fees and make-whole payments.
The New and Extending Term Loans are scheduled to mature on March 31, 2014, provided, however, that the New and Extending Term Loans will mature on December 14, 2012 if prior to December 14, 2012 the maturity date for our Unsecured Term Loan Agreement is not extended to at least 91 days after March 31, 2014 or the borrowings under the Unsecured Term Loan Agreement are
26
not refinanced with permitted refinancing indebtedness having a maturity date at least 91 days after March 31, 2014. The New and Extending Term Loans bear interest at a margin of 4.25% over the Eurodollar Base Rate (as defined in the Senior Credit Agreement and subject to a 2% floor) for Eurodollar borrowings and 3.25% over the Base Rate (as defined in the Senior Credit Agreement and subject to a 3% floor) for Base Rate borrowings. The Non-Extending Term Loans are scheduled to mature on March 31, 2012 and bear interest at a margin of 2.25% over the Eurodollar Base Rate for Eurodollar borrowings and 1.25% over the Base Rate for Base Rate Borrowings.
The revolving credit facility is scheduled to mature on March 31, 2013, provided, however, that the revolving credit facility will mature on December 14, 2012 if prior to December 14, 2012 the maturity date of the Unsecured Term Loan Agreement is not extended to at least 91 days after March 31, 2014 or the borrowings under the Unsecured Term Loan Agreement are not refinanced with permitted refinancing indebtedness having a maturity date at least 91 days after March 31, 2014. Borrowings under the revolving credit facility will bear interest at a margin of 4.25% over the Eurodollar Base Rate for Eurodollar borrowings and 3.25% over the Base Rate for Base Rate borrowings. The revolving credit facility includes an unused commitment fee equal to 1.0%. We may request letters of credit to be issued under the revolving credit facility of up to $7.5 million, with any outstanding letters of credit reducing the total amount available for borrowing under the revolving credit facility.
We made $30.0 million in principal prepayments on the Non-Extending Term Loans in December 2009 which can be applied to offset any required Excess Cash Flow payment as defined in the Senior Credit Agreement. As a result, we will not be required to make additional principal prepayments in the first quarter of 2010.
Westar Final Settlement Agreement
On December 30, 2009, we entered into a Final Settlement Agreement with Westar Energy, Inc. and its wholly-owned subsidiary, Westar Industries, Inc. (together, "Westar"), our former owner, to settle all claims between Westar and us related to certain agreements entered into in connection with Westar's sale of us to POI Acquisition I, Inc. in February 2004. Pursuant to the Final Settlement Agreement, we received $22.75 million from Westar on December 31, 2009.
APX Agreement
On October 2, 2009, we entered into an agreement with Apx Alarm Security Solutions, Inc. ("APX") under which APX assumed operating control of our monitoring center located in South St. Paul, Minnesota, effective November 1, 2009 (the "APX Agreement"). As a result of this arrangement, APX will now provide the monitoring services to their customer base that we previously provided through our South St. Paul, Minnesota facility (the "Facility"). We agreed to, among other things, (i) license to APX certain intellectual property used in the operation of the Facility, (ii) assign ownership to APX of the fixed assets at the Facility and (iii) provide support services to APX, including emergency technical services and disaster recovery planning and recovery services, through December 31, 2010, all in exchange for a monthly service fee. In addition, APX agreed to assume the lease for the Facility and to offer employment under similar terms to certain personnel working at the Facility. We will cease providing any services to APX after December 31, 2010. APX accounted for approximately 377,000 of our Wholesale monitored sites and $1.1 million of Wholesale RMR at November 1, 2009. APX contributed $11.0 million of Wholesale segment monitoring revenue in 2009. Although we expect a decline in Wholesale monitoring revenue as a result of this arrangement, we do not expect that our quarterly operating income and net cash flows will decrease materially through December 31, 2010 because the revenue from the monthly service fee under the arrangement is expected to be at significantly higher margins since the Facility costs (including Facility personnel costs) will no longer be included in our results of operations.
27
Performance Metrics
Recurring Monthly Revenue
We measure all of the recurring monthly revenue we are entitled to receive under contracts with customers in effect at the end of the period. Our computation of RMR may not be comparable to other similarly titled measures of other companies, in part because our proportion of Retail, Wholesale, and Multifamily RMR may vary significantly from the mix at other companies. RMR should not be viewed by investors as an alternative to actual monthly revenue, as determined in accordance with generally accepted accounting principles and is a non-GAAP measure. We had approximately $25.1 million of RMR as of December 31, 2009 and $26.7 million of RMR as of December 31, 2008 and 2007. A significant portion of the decrease in RMR as of December 31, 2009 is a result of our agreement with APX which resulted in a reduction of Wholesale RMR of $1.1 million as well as lower Retail investment in customer acquisition activities. See "Significant Activities, APX Agreement" above, for additional information related to the agreement.
Even though our proportions of Retail, Wholesale and Multifamily RMR may differ significantly from other companies' mix, and even though contributions from each type of RMR varies, we believe the presentation of RMR is useful to investors because the measure is used by investors and lenders to value companies such as ours with recurring revenue streams. Management monitors RMR, among other things, to evaluate our ongoing performance. In order to enhance investors' understanding of the components of our RMR, we include roll-forwards for each segment below. The table below reconciles our RMR to revenue reflected on our consolidated statements of operations (in thousands).
| |
2009 | 2008 | 2007 | ||||||||
|---|---|---|---|---|---|---|---|---|---|---|---|
RMR at December 31 |
$ | 25,057 | $ | 26,746 | $ | 26,706 | |||||
Amounts excluded from RMR: |
|||||||||||
Amortization of deferred revenue |
1,694 | 1,211 | 1,036 | ||||||||
Other revenue(a) |
3,533 | 3,303 | 2,974 | ||||||||
Revenue (GAAP basis): |
|||||||||||
December |
30,284 | 31,260 | 30,716 | ||||||||
January – November |
337,768 | 340,761 | 317,155 | ||||||||
Total period revenue |
$ | 368,052 | $ | 372,021 | $ | 347,871 | |||||
- (a)
- Revenue that is not pursuant to monthly contractual billings.
Our RMR includes amounts billable to customers with past due balances that we believe are collectible. We seek to preserve the revenue stream associated with each customer contract, primarily to maximize our return on the investment we made to generate each contract. As a result, we actively work to collect amounts owed to us and to retain the customers at the same time. In some instances, we may allow up to six months to collect past due amounts, while evaluating the ongoing customer relationship. When we categorize accounts as at-risk because accounts receivable balances exceed certain guidelines or because notice of intent to cancel or move has been provided by the customer, we include the account in attrition calculations. After we have made every reasonable effort to collect past due balances, we will disconnect the customer and include the loss in attrition calculations.
Our RMR calculation is not considered an alternative to revenue calculated under accounting principles generally accepted in the United States of America ("GAAP") and is not a substitute indication of our operating performance under GAAP. We believe, however, that the supplemental presentation of RMR is useful to investors because the measure is used by investors and lenders to value companies such as ours with recurring revenue streams.
28
The following table provides a roll-forward of RMR by segment and in total for the years indicated (in thousands).
| |
Year Ended December 31, | ||||||||||||||||||||||||||||||||||||
|---|---|---|---|---|---|---|---|---|---|---|---|---|---|---|---|---|---|---|---|---|---|---|---|---|---|---|---|---|---|---|---|---|---|---|---|---|---|
| |
2009 | 2008 | 2007 | ||||||||||||||||||||||||||||||||||
| |
Retail | Whole- sale |
Multi- family |
Total | Retail | Whole- sale |
Multi- family |
Total | Retail | Whole- sale |
Multi- family |
Total | |||||||||||||||||||||||||
Beginning RMR balance |
$ | 20,543 | $ | 3,998 | $ | 2,205 | $ | 26,746 | $ | 20,628 | $ | 3,615 | $ | 2,463 | $ | 26,706 | $ | 16,429 | $ | 963 | $ | 2,596 | $ | 19,988 | |||||||||||||
RMR additions from direct sales |
1,775 | — | 101 | 1,876 | 2,316 | — | 98 | 2,414 | 2,331 | — | 86 | 2,417 | |||||||||||||||||||||||||
RMR additions from Merger |
— | — | — | — | — | — | — | — | 4,133 | 2,549 | — | 6,682 | |||||||||||||||||||||||||
RMR additions from account purchases |
38 | — | — | 38 | 44 | — | — | 44 | 32 | — | — | 32 | |||||||||||||||||||||||||
Net change in Wholesale RMR |
— | 145 | — | 145 | — | 383 | — | 383 | — | 103 | — | 103 | |||||||||||||||||||||||||
RMR losses(a) |
(2,713 | ) | — | (396 | ) | (3,109 | ) | (2,823 | ) | — | (428 | ) | (3,251 | ) | (2,583 | ) | — | (269 | ) | (2,852 | ) | ||||||||||||||||
Price increases and other(b) |
464 | (1,112 | ) | 9 | (639 | ) | 378 | — | 72 | 450 | 286 | — | 50 | 336 | |||||||||||||||||||||||
Ending RMR balance |
$ | 20,107 | $ | 3,031 | $ | 1,919 | $ | 25,057 | $ | 20,543 | $ | 3,998 | $ | 2,205 | $ | 26,746 | $ | 20,628 | $ | 3,615 | $ | 2,463 | $ | 26,706 | |||||||||||||
- (a)
- RMR
losses include price decreases
- (b)
- Price increases and other for our Wholesale segment in 2009 reflects the RMR impact of the APX Agreement. See "Significant Activities, APX Agreement" above, for additional information related to the agreement.
The table below reconciles our RMR by segment to revenue reflected in our segment results of operations (in thousands).
| |
Year Ended December 31, | |||||||||||||||||||||||||||
|---|---|---|---|---|---|---|---|---|---|---|---|---|---|---|---|---|---|---|---|---|---|---|---|---|---|---|---|---|
| |
2009 | 2008 | 2007 | |||||||||||||||||||||||||
| |
Retail | Whole- sale |
Multi- family |
Retail | Whole- sale |
Multi- family |
Retail | Whole- sale |
Multi- family |
|||||||||||||||||||
RMR at December 31 |
$ | 20,107 | $ | 3,031 | $ | 1,919 | $ | 20,543 | $ | 3,998 | $ | 2,205 | $ | 20,628 | $ | 3,615 | $ | 2,463 | ||||||||||
Amounts excluded from RMR: |
||||||||||||||||||||||||||||
Amortization of deferred revenue |
1,683 | — | 11 | 1,197 | — | 14 | 1,025 | — | 12 | |||||||||||||||||||
Other revenue(a) |
2,960 | 390 | 183 | 2,829 | 263 | 211 | 2,400 | 425 | 148 | |||||||||||||||||||
Revenue (GAAP basis): |
||||||||||||||||||||||||||||
December |
24,750 | 3,421 | 2,113 | 24,569 | 4,261 | 2,430 | 24,053 | 4,040 | 2,623 | |||||||||||||||||||
January – November |
264,565 | 46,767 | 26,436 | 267,226 | 45,216 | 28,319 | 253,437 | 33,938 | 29,780 | |||||||||||||||||||
Total period revenue |
$ | 289,315 | $ | 50,188 | $ | 28,549 | $ | 291,795 | $ | 49,477 | $ | 30,749 | $ | 277,490 | $ | 37,978 | $ | 32,403 | ||||||||||
- (a)
- Revenue that is not pursuant to monthly contractual billings.
Monitoring and Related Services Margin
In each of the last three years, monitoring and related service revenue comprised approximately 90% of our total revenue. The table below identifies the monitoring and related services gross margin
29
and gross margin percentage for the presented periods, which is exclusive of amortization and depreciation (dollar amounts in thousands).
| |
Year Ended December 31, | ||||||||||||||||||||||||
|---|---|---|---|---|---|---|---|---|---|---|---|---|---|---|---|---|---|---|---|---|---|---|---|---|---|
| |
2009 | 2008 | |||||||||||||||||||||||
| |
Retail | Whole- sale |
Multi- family |
Total | Retail | Whole- sale |
Multi- family |
Total | |||||||||||||||||
Monitoring and related services revenue |
$ | 251,585 | $ | 49,021 | $ | 27,395 | $ | 328,001 | $ | 255,104 | $ | 48,660 | $ | 30,361 | $ | 334,125 | |||||||||
Cost of monitoring and related services (exclusive of depreciation) |
67,709 | 26,169 | 7,105 | 100,983 | 75,154 | 28,108 | 7,718 | 110,980 | |||||||||||||||||
Gross margin |
$ | 183,876 | $ | 22,852 | $ | 20,290 | $ | 227,018 | $ | 179,950 | $ | 20,552 | $ | 22,643 | $ | 223,145 | |||||||||
Gross margin % |
73.1 | % | 46.6 | % | 74.1 | % | 69.2 | % | 70.5 | % | 42.2 | % | 74.6 | % | 66.8 | % | |||||||||
| |
Year Ended December 31, 2007 | ||||||||||||
|---|---|---|---|---|---|---|---|---|---|---|---|---|---|
| |
Retail | Whole- sale |
Multi- family |
Total | |||||||||
Monitoring and related services revenue |
$ | 243,963 | $ | 37,432 | $ | 31,935 | $ | 313,330 | |||||
Cost of monitoring and related services (exclusive of depreciation) |
72,526 | 19,599 | 7,710 | 99,835 | |||||||||
Gross margin |
$ | 171,437 | $ | 17,833 | $ | 24,225 | $ | 213,495 | |||||
Gross margin % |
70.3 | % | 47.6 | % | 75.9 | % | 68.1 | % | |||||
Our total monitoring and related services gross margin percentage increased from the prior periods primarily due to our efforts to reduce costs. Retail gross margin improved in 2009 due to the centralization of customer care and field technical support functions as well as a decrease in fuel costs. Retail gross margin percentage was consistent between 2008 and 2007. Wholesale gross margin increased in 2009 due to labor efficiencies achieved through the integration of our billing and monitoring systems. Multifamily gross margin has declined as our cost saving initiatives have not kept pace with the decline in revenue.
The Wholesale gross margin percentage is typically lower than Retail and Multifamily gross margin percentages due to the reduced number of services we provide to dealers compared to the number of services we provide to our Retail and Multifamily customers. Acquisition costs per monitored wholesale site are also significantly lower.
Attrition
Our customer base reflected a net decrease in 2009, primarily due to a decrease in monitored sites in our Wholesale segment as a result of the APX Agreement. See "Significant Activities-APX Agreement," above, for additional information. Our Retail and Multifamily segments also experienced a decrease in monitored sites because we were unable to replace our cancelled customers with new customers from our sales efforts. Our customer base reflected a net increase in monitored sites during 2008 primarily due to growth in our Wholesale operations. The increase in 2007 is primarily the result of the Merger, through which a significant amount of Retail and Wholesale customers were acquired. Net losses of customer accounts materially and adversely affect our business, financial condition and results of operations.
Attrition has a direct impact on our results of operations as it affects our revenue, amortization expense and cash flow. We monitor attrition each quarter based on a quarterly annualized and trailing twelve-month basis. This method utilizes each segment's average RMR base for the applicable period in measuring attrition. Therefore, in periods of RMR growth, the computation of RMR attrition may result in a number less than would be expected in periods when RMR remains stable. In periods of
30
RMR decline, the computation of RMR attrition may result in a number greater than would be expected in periods when RMR remains stable. We believe the presentation of RMR attrition is useful to investors because the measure is used by investors and lenders to value companies such as ours with recurring revenue streams. In addition, we believe RMR attrition information is more useful than customer account attrition because it reflects the economic impact of customer losses and price decreases.
In the table below, we define attrition as a ratio, the numerator of which is the gross amount of lost RMR, which includes price decreases, for a given period, net of the adjustments described below, and the denominator of which is the average amount of RMR for a given period. In some instances, we use estimates to derive attrition data. In the calculations directly below, we do not reduce the gross RMR lost during a period by RMR added from "new owner" accounts, which are accounts where a new customer moves into a location installed with our security system and vacated by a prior customer, or from "relocation" accounts, which are accounts where an existing customer moves and transfers service to their new location.
As defined above, RMR attrition by business segment is summarized at December 31, 2009, 2008 and 2007. Our Retail gross attrition improved slightly in 2009 compared to 2008 due to a smaller net loss of customers in 2009. Our Multifamily segment attrition was slightly higher in 2009 compared to 2008 because of an increase in RMR at-risk and customers terminating services for financial reasons.
| |
Recurring Monthly Revenue Attrition | ||||||||||||||||||
|---|---|---|---|---|---|---|---|---|---|---|---|---|---|---|---|---|---|---|---|
| |
December 31, 2009 | December 31, 2008 | December 31, 2007 | ||||||||||||||||
| |
Annualized Fourth Quarter |
Trailing Twelve Month |
Annualized Fourth Quarter |
Trailing Twelve Month |
Annualized Fourth Quarter |
Trailing Twelve Month |
|||||||||||||
Retail |
12.8 | % | 13.3 | % | 13.9 | % | 13.7 | % | 13.3 | % | 13.2 | % | |||||||
Multifamily |
21.9 | % | 19.2 | % | 21.3 | % | 18.3 | % | 9.0 | % | 10.6 | % | |||||||
In the table below, in order to enhance the comparability of our Retail segment attrition results with those of other industry participants, many of which report attrition net of new owner and relocation accounts and exclude price decreases, we define the denominator the same as above but define the numerator as the gross amount of lost RMR, excluding price decreases, for a given period reduced by RMR added from new owners and relocation accounts.
| |
Recurring Monthly Revenue Attrition | ||||||||||||||||||
|---|---|---|---|---|---|---|---|---|---|---|---|---|---|---|---|---|---|---|---|
| |
December 31, 2009 | December 31, 2008 | December 31, 2007 | ||||||||||||||||
| |
Annualized Fourth Quarter |
Trailing Twelve Month |
Annualized Fourth Quarter |
Trailing Twelve Month |
Annualized Fourth Quarter |
Trailing Twelve Month |
|||||||||||||
Retail |
9.7 | % | 10.3 | % | 10.9 | % | 10.5 | % | 9.9 | % | 9.5 | % | |||||||
Our actual attrition experience shows that the relationship period with any individual customer can vary significantly. Customers discontinue service with us for a variety of reasons, including relocation, service issues and cost. A portion of the customer base can be expected to discontinue service every year. Any significant change in the pattern of our historical attrition experience would have a material effect on our results of operations. To a much greater extent than Retail, Wholesale attrition can be affected by the decisions of its largest dealers.
We evaluate the Wholesale segment based on the net change in RMR because added RMR typically does not require an up-front investment by us. Wholesale RMR fluctuates as our customers, the independent dealers, add and lose their customers for whom we are providing monitoring and other services. As noted above in "Significant Activities—APX Agreement" we entered into a new services agreement with our largest customer resulting in a decrease of $1.1 million of RMR in our Wholesale
31
segment. Exclusive of that decrease, the net change in Wholesale RMR was an increase of $145,000, a 3.6% increase in RMR for the year. The net change in RMR for 2008 was $383,000, a 10.6% increase in RMR for the year. The net change in 2007, exclusive of the increase related to the RMR acquired in the IASG merger was $103,000, a 3.6% increase in RMR for the year, adjusted for the added RMR from the IASG merger.
Adjusted EBITDA
We manage our business segments based on earnings before interest, income taxes, depreciation, amortization (including amortization of deferred customer acquisition costs and revenue) and other items shown in the tables below, referred to as Adjusted EBITDA and is a non-GAAP measure. Adjusted EBITDA is used by management and reviewed by the Board of Directors in evaluating segment performance and determining how to allocate resources across segments for investments in customer acquisition activities, capital expenditures and spending in general. We believe it is also utilized by the investor community that follows the security monitoring industry. Adjusted EBITDA is useful because it allows investors and management to evaluate and compare operating results from period to period in a meaningful and consistent manner in addition to standard GAAP financial measures. Specifically, Adjusted EBITDA allows management to evaluate segment results of operations, including operating performance of monitoring and service activities, effects of investments in creating new customer relationships, and sales and installation of security systems, without the effects of non-cash amortization and depreciation. Adjusted EBITDA by segment for the years ended December 31, 2009, 2008 and 2007 was as follows (in thousands):
| |
For the year ended December 31, | |||||||||
|---|---|---|---|---|---|---|---|---|---|---|
| |
2009 | 2008 | 2007 | |||||||
Retail |
$ | 95,611 | $ | 87,186 | $ | 82,232 | ||||
Wholesale |
13,199 | 9,575 | 10,375 | |||||||
Multifamily |
14,022 | 12,552 | 14,805 | |||||||
Retail Adjusted EBITDA increased $8.4 million in 2009 compared to 2008. Retail Adjusted EBITDA increased due to lower overall net costs incurred in customer acquisition activities. In addition, reductions in Retail monitoring and service costs more than offset the decline in the related revenue. Wholesale Adjusted EBITDA increased $3.6 million in 2009 compared to 2008 primarily because of improvements in operating margin resulting from the integration of our Wholesale monitoring centers. Multifamily Adjusted EBITDA increased $1.5 million in 2009 compared to 2008. The increase is the result of a decrease in general and administrative expenses, primarily the cost of corporate administrative support services, such as Human Resources and Information Technology, allocated to the Multifamily segment.
32
The following tables provide a reconciliation of loss before income taxes to Adjusted EBITDA by segment (in thousands):
| |
For the year ended December 31, 2009 | |||||||||
|---|---|---|---|---|---|---|---|---|---|---|
| |
Retail | Wholesale | Multifamily | |||||||
Income before income taxes |
$ | 3,876 | $ | 8,384 | $ | 7,537 | ||||
Plus: |
||||||||||
Interest expense, net |
44,792 | — | 519 | |||||||
Amortization and depreciation expense |
41,943 | 4,713 | 3,440 | |||||||
Amortization of deferred costs in excess of amortization of deferred revenue |
28,006 | — | 2,508 | |||||||
Stock based compensation expense |
496 | — | — | |||||||
Other costs(a) |
1,321 | 102 | 18 | |||||||
Less: |
||||||||||
Gain on retirement of debt |
(1,956 | ) | ||||||||
Gain on settlement agreement |
(22,867 | ) | — | — | ||||||
Adjusted EBITDA |
$ | 95,611 | $ | 13,199 | $ | 14,022 | ||||
| |
For the year ended December 31, 2008 | |||||||||
|---|---|---|---|---|---|---|---|---|---|---|
| |
Retail | Wholesale | Multifamily | |||||||
(Loss) Income before income taxes |
$ | (55,768 | ) | $ | 2,212 | $ | 3,355 | |||
Plus: |
||||||||||
Interest expense, net |
47,386 | 3 | 356 | |||||||
Amortization and depreciation expense |
51,474 | 7,216 | 5,585 | |||||||
Amortization of deferred costs in excess of amortization of deferred revenue |
28,556 | — | 2,176 | |||||||
Stock based compensation expense |
1,448 | — | — | |||||||
Other costs(a) |
1,356 | 144 | 155 | |||||||
Loss on retirement of debt |
12,788 | — | — | |||||||
Loss on impairment of trade name |
— | — | 925 | |||||||
Less: |
||||||||||
Other income |
(54 | ) | — | — | ||||||
Adjusted EBITDA |
$ | 87,186 | $ | 9,575 | $ | 12,552 | ||||
| |
For the year ended December 31, 2007 | |||||||||
|---|---|---|---|---|---|---|---|---|---|---|
| |
Retail | Wholesale | Multifamily | |||||||
(Loss) Income before income taxes |
$ | (39,135 | ) | $ | 1,482 | $ | 6,126 | |||
Plus: |
||||||||||
Interest expense, net |
43,920 | 2,619 | 438 | |||||||
Amortization and depreciation expense |
49,501 | 6,274 | 6,289 | |||||||
Amortization of deferred costs in excess of amortization of deferred revenue |
22,223 | — | 1,952 | |||||||
Stock based compensation expense |
1,469 | — | — | |||||||
Other costs, including Merger related expenses(a) |
4,344 | — | — | |||||||
Less: |
||||||||||
Other income |
(90 | ) | — | — | ||||||
Adjusted EBITDA |
$ | 82,232 | $ | 10,375 | $ | 14,805 | ||||
- (a)
- Other costs include non-recurring costs and other items permitted to be excluded from the calculation of Consolidated EBITDA under the Senior Credit Agreement.
33
Critical Accounting Policies
Our discussion and analysis of results of operations and financial condition are based upon our consolidated financial statements, which have been prepared in accordance with GAAP. The preparation of these consolidated financial statements requires us to make estimates and judgments that affect the reported amounts of assets, liabilities, revenue and expenses, and related disclosure of contingent assets and liabilities. We evaluate our estimates on an on-going basis, including those related to customer accounts, goodwill, intangible assets, income taxes, bad debts, inventories, investments, contingencies and litigation. We base our estimates on historical experience and on various other assumptions that we believe to be reasonable under the circumstances, the results of which form the basis for making judgments about the carrying values of assets and liabilities that are not readily apparent from other sources. Actual results may differ from these estimates under different assumptions or conditions.
Revenue and Expense Recognition
Revenue is recognized when security services are provided. System installation revenue, sales revenue on equipment upgrades and direct and incremental costs of installations and sales are deferred for residential customers with monitoring service contracts. For commercial customers and our national account customers, revenue recognition is dependent upon each specific customer contract. In instances when we pass title to a system, we recognize the associated revenue and costs related to the sale of the equipment in the period that title passes regardless of whether the sale is accompanied by a service agreement. In cases where we retain title to the system, we defer and amortize revenue and direct costs.
Deferred system and upgrade installation revenue are recognized over the estimated life of the customer utilizing an accelerated method for our Retail customers. We amortize deferred revenue from customer acquisitions related to our Retail customers over a fifteen-year period on an accelerated basis. The associated deferred customer acquisition costs are amortized, annually and in total, over a fifteen-year period on an accelerated basis in amounts that are equal to the amount of revenue amortized, annually and in total, over the fifteen-year period. The deferred customer acquisition costs in excess of the deferred customer acquisition revenue are amortized over the initial term of the contract on a straight-line basis.
We amortize deferred customer acquisition costs and revenue related to our Retail customers using an accelerated basis because we believe this method best approximates the results that would be obtained if we accounted for these deferred costs and revenue on a specific contract basis utilizing a straight-line amortization method with write-off upon customer termination. We do not track deferred customer acquisition costs and revenue on a contract by contract basis in our Retail segment, and as a result, we are not able to write-off the remaining balance of a specific contract when the customer relationship terminates. Deferred customer acquisition costs and revenue are accounted for using pools, with separate pools based on the month and year of acquisition.
We periodically perform a lifing study with the assistance of a third-party appraisal firm to estimate the average expected life and attrition pattern of our customers. The lifing study is based on historical customer terminations. The results of our lifing studies indicate that our customer pools can expect a declining revenue stream. We evaluate the differing rates of declining revenue streams for each customer pool and select an amortization rate that closely matches the respective decline curves. Such analysis is used to establish the amortization rates of our customer account pools in order to reflect the pattern of future benefit. Given that the amortization lives and methods are developed using historical attrition patterns and consider actual customer termination experience, we believe such amortization lives and methods approximate the results of amortizing on a specific contract basis with write-off upon termination.
34
For our Multifamily segment, we track the deferred revenues on a contract by contract basis which are recognized over the estimated life of the customer over a fifteen-year period on an accelerated basis. The deferred customer acquisition costs in excess of the deferred customer acquisition revenues are amortized over the initial term of the contract. We write off the unamortized portion of the Multifamily deferred customer acquisition revenues and costs when the customer relationship terminates.
The table below reflects the impact of our accounting policy on the respective line items of the Statement of Operations for the years ended December 31, 2009, 2008 and 2007. The "Total amount incurred" line represents the current amount of billings that were made and the current costs that were incurred for the period. We then subtract the deferral amount and add back the amortization of previous deferral amounts to determine the amount we report on the Statement of Operations (in thousands).
| |
For the Year Ended December 31, | |||||||||||||||||||||||||||
|---|---|---|---|---|---|---|---|---|---|---|---|---|---|---|---|---|---|---|---|---|---|---|---|---|---|---|---|---|
| |
2009 | 2008 | 2007 | |||||||||||||||||||||||||
| |
Revenue— other |
Cost of revenue— other |
Selling expense |
Revenue— other |
Cost of revenue— other |
Selling expense |
Revenue— other |
Cost of revenue— other |
Selling expense |
|||||||||||||||||||
Retail segment: |
||||||||||||||||||||||||||||
Total amount incurred |
$ | 42,211 | $ | 48,256 | $ | 42,398 | $ | 52,040 | $ | 63,572 | $ | 52,986 | $ | 52,648 | $ | 58,778 | $ | 47,921 | ||||||||||
Amount deferred |
(19,707 | ) | (28,527 | ) | (11,217 | ) | (28,747 | ) | (41,727 | ) | (18,047 | ) | (29,790 | ) | (37,317 | ) | (19,209 | ) | ||||||||||
Amount amortized |
15,226 | 26,226 | 17,006 | 13,398 | 24,335 | 17,619 | 10,669 | 16,906 | 15,986 | |||||||||||||||||||
Amount included in Statement of Operations |
$ | 37,730 | $ | 45,955 | $ | 48,187 | $ | 36,691 | $ | 46,180 | $ | 52,558 | $ | 33,527 | $ | 38,367 | $ | 44,698 | ||||||||||
Wholesale segment: |
||||||||||||||||||||||||||||
Total amount incurred(a) |
$ | 1,167 | $ | — | $ | 1,776 | $ | 817 | $ | — | $ | 2,253 | $ | 546 | $ | — | $ | 1,430 | ||||||||||
Multifamily segment: |
||||||||||||||||||||||||||||
Total amount incurred |
$ | 1,012 | $ | 2,872 | $ | 857 | $ | 325 | $ | 4,077 | $ | 1,703 | $ | 308 | $ | 3,473 | $ | 1,749 | ||||||||||
Amount deferred |
(50 | ) | (1,976 | ) | (292 | ) | (90 | ) | (3,631 | ) | (472 | ) | (20 | ) | (2,957 | ) | (470 | ) | ||||||||||
Amount amortized |
192 | 2,434 | 266 | 153 | 2,124 | 205 | 180 | 1,987 | 145 | |||||||||||||||||||
Amount included in Statement of Operations |
$ | 1,154 | $ | 3,330 | $ | 831 | $ | 388 | $ | 2,570 | $ | 1,436 | $ | 468 | $ | 2,503 | $ | 1,424 | ||||||||||
Total Company: |
||||||||||||||||||||||||||||
Total amount incurred |
$ | 44,390 | $ | 51,128 | $ | 45,031 | $ | 53,182 | $ | 67,649 | $ | 56,942 | $ | 53,502 | $ | 62,251 | $ | 51,100 | ||||||||||
Amount deferred |
(19,757 | ) | (30,503 | ) | (11,509 | ) | (28,837 | ) | (45,358 | ) | (18,519 | ) | (29,810 | ) | (40,274 | ) | (19,679 | ) | ||||||||||
Amount amortized |
15,418 | 28,660 | 17,272 | 13,551 | 26,459 | 17,824 | 10,849 | 18,893 | 16,131 | |||||||||||||||||||
Amount reported in Statement of Operations |
$ | 40,051 | $ | 49,285 | $ | 50,794 | $ | 37,896 | $ | 48,750 | $ | 56,247 | $ | 34,541 | $ | 40,870 | $ | 47,552 | ||||||||||
- (a)
- The Wholesale segment revenue-other represents interest and fee income generated from our dealer loan program.
In addition to the amounts reflected in the table above relating to our costs incurred to create new accounts, our Retail segment also capitalized purchases of rental equipment in the amount of $2.3 million, $5.3 million and $4.4 million for the years ended December 31, 2009, 2008 and 2007, respectively. We purchased customer accounts valued at $1.0 million, $1.2 million and $1.0 million in the years ended December 31, 2009, 2008 and 2007, respectively. We acquired $130.3 million in customer accounts in 2007 in connection with the Merger. The decrease in Retail costs incurred in 2009 is due to fewer opportunities to invest in customer acquisition activities. The increase in Retail costs incurred during 2008 relates to an increase in the sale of commercial lease products, which have higher upfront costs, as well as an increase in fuel costs.
35
Valuation of Goodwill and Indefinite-Lived Intangible Assets
Goodwill is recorded in the Retail, Wholesale and Multifamily operating segments, which are also our reporting units for purposes of evaluating our recorded goodwill for impairment. Goodwill was $43.9 million and $41.6 million as of December 31, 2009 and 2008, respectively. We completed our annual impairment testing during the third quarter of 2009 and determined that goodwill was not impaired. The fair value of all reporting units is substantially in excess of the respective reporting unit's carrying value.
Goodwill originated with the adoption of push down accounting and the related adjustments during 2005, which was associated with the acquisition of the Company by a new controlling shareholder group. Additional goodwill was recorded in connection with the Merger during 2007. We determined the fair value of each reporting unit acquired in the Merger and then allocated goodwill to each reporting unit based on the amount of excess fair value determined after assigning values to the individual assets acquired and liabilities assumed related to each reporting unit.
We evaluate goodwill for impairment annually as of the beginning of the third quarter and any time an event occurs or circumstances change that would more likely than not reduce the fair value of a reporting unit below its carrying value in accordance with Accounting Standards of Codification ("ASC") 350, Intangibles-Goodwill and Other.
The goodwill impairment test involves a two-step process. The first step is a comparison of each reporting unit's fair value to its carrying value. If the carrying value of a reporting unit exceeds its fair value, goodwill is considered potentially impaired and we must complete the second step of the goodwill impairment test. The amount of impairment is determined by comparing the implied fair value of reporting unit goodwill to the carrying value of the goodwill in the same manner as if the reporting unit was being acquired in a business combination. Specifically, we would allocate the fair value to all of the assets and liabilities of the reporting unit, including internally developed intangible assets with a zero carrying value, in a hypothetical analysis that would calculate the implied fair value of goodwill. If the implied fair value of goodwill is less than the recorded goodwill, we would recognize an impairment charge for the difference.
Fair value of the reporting units is determined using a combined income and market approach. The income approach uses a reporting unit's projection of estimated cash flows discounted using a weighted-average cost of capital analysis that reflects current market conditions. The market approach may involve use of the guideline transaction method, the guideline company method, or both. The guideline transaction method makes use of available transaction price data of companies engaged in the same or a similar line of business as the respective reporting unit. The guideline company method uses market multiples of publicly traded companies with operating characteristics similar to the respective reporting unit. We consider value indications from both the income approach and market approach in estimating the fair value of each reporting unit. We also perform a sensitivity analysis on our estimated fair value using the income and market approach.
The income approach was given significant weight for all three reporting units because management considers this method a reasonable indicator of fair value. The market transaction method was also given significant weight for all three reporting units because transactions in the industry are commonly valued as a multiple of RMR. Based on management's experience along with a review of recent industry transactions, management concluded the weighting of the market transaction method was appropriate. The market guideline company method was given a small weight for Retail because, although the guideline companies are generally comparable, they are not similar enough to warrant a significant weight in estimating fair value. The market guideline company method was given no weight for the Wholesale and Multifamily reporting units because management determined that there were no sufficiently comparable companies or there was a lack of market data for businesses engaged in these specialized monitored security operations.
36
The weighting for each of the methods used in connection with our annual goodwill impairment testing for 2009 is detailed in the table below:
| |
Income Approach | Market—Guideline | Market—Transaction | |||||||
|---|---|---|---|---|---|---|---|---|---|---|
Retail |
60 | % | 10 | % | 30 | % | ||||
Wholesale |
50 | % | 0 | % | 50 | % | ||||
Multifamily |
50 | % | 0 | % | 50 | % | ||||
Management judgment is a significant factor in determining whether an indicator of impairment has occurred. Management relies on estimates in determining the fair value of each reporting unit, which include the following critical quantitative factors:
Anticipated future cash flows and terminal value for each reporting unit. The income approach to determining fair value relies on the timing and estimates of future cash flows, including an estimate of terminal value. The projections use management's estimates of economic and market conditions over the projected period including growth rates in revenue, customer attrition and estimates of expected changes in operating margins. Our projections of future cash flows are subject to change as actual results are achieved that differ from those anticipated. Because management frequently updates its projections, we would expect to identify on a timely basis any significant differences between actual results and recent estimates. We are not expecting actual results to vary significantly from estimates.
Selection of an appropriate discount rate. The income approach requires the selection of an appropriate discount rate, which is based on a weighted average cost of capital analysis. The discount rate is affected by changes in short-term interest rates and long-term yield as well as variances in the typical capital structure of marketplace participants in the security monitoring industry. The discount rate is determined based on assumptions that would be used by marketplace participants, and for that reason, the capital structure of selected marketplace participants was used in the weighted average cost of capital analysis. We selected a weighted average cost of capital of 12.0% for the Retail and Wholesale reporting units and 11.3% for the Multifamily reporting unit. Given the current economic conditions, it is possible that the discount rate will fluctuate in the near term.
Identification of comparable transactions within the industry. The market approach relies on a calculation that uses a multiple of RMR based on actual transactions involving industry participants. RMR multiples are a commonly used valuation metric in the security monitoring industry. The market approach estimates fair value by applying RMR multiples to the reporting unit's RMR balance as of the testing date. Although RMR multiples are subject to change, there has not been a noticeable deterioration in transaction values compared to prior years.
Our principal indefinite-lived intangible assets are trade names, which had a book value of $27.7 million as of December 31, 2009 and 2008. Trade name values were based on the identifiable revenue associated with each segment. Fair value is determined based on the income approach using the relief from royalty method, which requires assumptions related to projected revenues and assumptions regarding the royalty rate and discount rate. We completed our annual impairment testing during the third quarter of 2009 and determined that our trade names were not impaired. Fair value of the trade name in the Multifamily segment was approximately 9% in excess of carrying value. The carrying value of this trade name was $1.9 million as of December 31, 2009. A change in the discount rate, projected Multifamily revenue or royalty rate could result in future impairment. Due to the decline in Multifamily total revenue, we have been closely monitoring this trade name balance for potential impairment.
37
Long-Lived Assets
Long-lived assets include property and equipment, customer accounts, dealer relationships, deferred customer acquisition costs and other amortizable intangible assets. We review long-lived assets for impairment in accordance with the guidance in ASC 360, Property, Plant, and Equipment. Recoverability of long-lived assets is measured by a comparison of the carrying value to the future undiscounted cash flows expected to be generated by the assets. If we determine an impairment exists, the amount of impairment recognized is the amount by which the carrying value exceeds fair value. Projections of future cash flows are subject to change as a result of actual results differing from expectation as well as higher than expected levels of customer attrition. Though we are not expecting actual results to vary significantly from our projections, long-lived assets are reviewed for impairment when events or changes in circumstances indicate the carrying value may not be recoverable.
Customer Account and Dealer Relationship Amortization
The choice of an amortization life and method is based on our estimates and judgments about the amounts and timing of expected future revenue from customer accounts and average customer account life. Amortization methods and amortization periods were determined because, in our opinion, they would adequately match amortization cost with anticipated revenue. We evaluate the appropriateness of the amortization life and method of each of our customer account pools based on the actual historical attrition experience of each pool and, when deemed necessary, perform a lifing study on our customer accounts to assist us in determining appropriate lives of our customer accounts. These analyses are needed in light of the inherent declining revenue curve over the life of a pool of customer accounts. We have identified two distinct pools of customer accounts in our Retail segment and one customer pool in each of our Wholesale and Multifamily segments, as shown in the table below, each of which has distinct attributes that affect differing attrition characteristics. We believe it is appropriate to segregate the acquired IASG customer accounts into a separate pool as the historical attrition since the Merger has been significantly higher than the attrition for existing customers. The result of lifing studies indicated to us that we can expect attrition to be greatest in the initial years of asset life and that a declining balance (accelerated) method therefore best matches the future amortization cost with the estimated revenue stream from these customer pools. We switch from the declining balance method to the straight-line method in the year the straight-line method results in greater amortization expense. Our amortization rates consider the average estimated remaining and historical projected attrition rates. We completed a lifing study during the fourth quarter of 2008, which resulted in changes in estimated useful life and amortization methods, as shown in the tables below.
38
Our amortization rates consider the average estimated remaining and historical projected attrition rates. The amortization method for each customer pool is as follows:
| Pool | Method | |
|---|---|---|
| Prior to October 1, 2008: | ||
| Customer Accounts: | ||
| Retail-Protection One | Ten-year 135% declining balance | |
| Retail-IASG | Nine-year 150% declining balance | |
| Multifamily | Nine-year straight-line | |
| Dealer Relationships: | ||
| Wholesale | Fifteen-year 150% declining balance | |
October 1, 2008 and after: |
||
| Customer Accounts: | ||
| Retail-Protection One | Fifteen-year double declining balance | |
| Retail-IASG | Nine-year 150% declining balance | |
| Multifamily | Fifteen-year 180% declining balance | |
| Dealer Relationships: | ||
| Wholesale | Twenty-year 140% declining balance |
We conduct comprehensive reviews of our attrition experience on an ongoing basis and adjust the estimated lives of our customer accounts and dealer relationships as needed.
Acquisitions
We account for our acquisitions of security monitoring businesses using the acquisition method. The acquisition method requires that we estimate the fair value of the individual assets and liabilities acquired. The estimation of the fair value of the assets and liabilities acquired and consideration given involves a number of judgments and estimates.
Income Taxes
As part of the process of preparing our consolidated financial statements, we are required to estimate our income taxes in each of the jurisdictions in which we operate. Significant management judgment is required in determining our provision for income taxes and our deferred tax assets and liabilities. This process involves us estimating our actual current tax exposure together with assessing temporary differences resulting from differing treatment of items, such as depreciation and amortization, for tax and accounting purposes. These differences result in deferred tax assets and liabilities, which are included within our consolidated balance sheet. We must then assess the likelihood that our deferred tax assets will be recovered. To the extent we believe that recovery is not likely, we must establish a valuation allowance. We believe that recovery of most of our deferred tax assets is not likely. Accordingly, a valuation allowance for virtually all of our deferred tax assets has been established. We currently do not expect to be in a position to record tax benefits for losses incurred in the future.
New accounting standards
See Item 8, Note 2 of the Notes to Consolidated Financial Statements, included in Part II of this Annual Report on Form 10-K, for new accounting standards, including the expected dates of adoption and estimated effects on our Consolidated Financial Statements, which information is incorporated herein by reference.
39
Results of Operations
Protection One Consolidated
Revenue decreased $3.9 million, or 1.1%, to $368.1 million in 2009 from $372.0 million in 2008. Monitoring and related services revenue decreased $6.1 million, or 1.8%, to $328.0 million in 2009 compared to $334.1 million in 2008, primarily as a result of our inability to replace lost customers with new ones, due to general economic conditions. Installation and other revenue increased to $40.1 million in 2009 from $37.9 million in 2008 due to an increase in amortization of previously deferred customer acquisition revenue.
Revenue increased $24.1 million, or 6.9%, to $372.0 million in 2008 from $347.9 million in 2007. Monitoring and related services revenue increased $20.8 million, or 6.6%, to $334.1 million in 2008 compared to $313.3 million in 2007, primarily as a result of the Merger. Installation and other revenue increased to $37.9 million in 2008 from $34.5 million in 2007 due to an increase in amortization of previously deferred customer acquisition revenue.
Cost of revenue decreased $9.5 million, or 5.9%, to $150.3 million in 2009 from $159.7 million in 2008. Cost of monitoring and related services revenue decreased approximately $10.0 million, or 9.0%, to $101.0 million in 2009 compared to $111.0 million in 2008, primarily due to our efforts to reduce costs. Monitoring and related services margin as a percentage of related revenue was 69.2% and 66.8% in 2009 and 2008, respectively. Our monitoring and related services gross margin percentage increased in 2009 due to a decrease in costs for the reasons described above.
Cost of revenue increased $19.0 million, or 13.5%, to $159.7 million in 2008 compared to $140.7 million in 2007, primarily as a result of the Merger. Cost of monitoring and related services revenue increased $11.2 million, or 11.2%, to $111.0 million in 2008 compared to $99.8 million in 2007, primarily due to our increased customer base and increases in Retail and Wholesale monitoring and service costs. Installation and other cost of revenue increased to $48.8 million in 2008 from $40.9 million in 2007 due to an increase in amortization of previously deferred customer acquisition costs.
Net income of $17.5 million, or earnings per diluted share of common stock of $0.69, was recorded in 2009 compared to a net loss of $50.5 million, or loss per diluted share of common stock of $2.00 in 2008. A $22.9 million gain due to the Westar settlement agreement was the primary reason for net income in 2009 as well as lower amortization and depreciation, selling and general and administrative expenses. A $12.8 million loss on the early retirement of our Senior Subordinated Notes, interest expense, as identified above, and depreciation and amortization expense of $64.3 million contributed to the net loss for the year ended December 31, 2008. For the year ended December 31, 2007, we incurred a consolidated net loss of $32.2 million or loss per diluted share of common stock of $1.37. Interest expense and Merger-related costs of $4.3 million as well as amortization and depreciation expense of $62.1 million contributed to the net loss for the year ended December 31, 2007.
Interest expense decreased $3.1 million, or 6.5%, to $45.4 million in 2009 compared to $48.5 million in 2008 primarily due to a decrease in interest rates for our variable rate senior credit facility and a decrease in amortization of debt discounts related to the redemption of our Senior Subordinated Notes in 2008, partially offset by an increase in interest expense related to payments made under our rate swap agreements. Interest expense in 2008 decreased 1.9% compared to 2007 due to a decrease in amortization of debt discounts related to the redemption of our Senior Subordinated Notes, partially offset by an increase in interest expense due to our $110.3 million Unsecured Term Loan. Interest expense was reduced by approximately $30 thousand due to amortization of debt premium, debt discounts and debt issue costs for the year ended December 31, 2009, and includes $1.5 million and $6.9 million of amortization of debt issue costs, debt discounts and debt premium for the years ended December 31, 2008 and 2007, respectively.
40
Retail
We present the table below to show how the operating results for the Retail segment have changed over the periods presented. Next to each period's results of operations, we provide the relevant percentage of total revenue so that you can make comparisons about the relative change in revenue and expenses (dollar amounts in thousands).
| |
For the year ended December 31, | ||||||||||||||||||||
|---|---|---|---|---|---|---|---|---|---|---|---|---|---|---|---|---|---|---|---|---|---|
| |
2009 | 2008 | 2007 | ||||||||||||||||||
Revenue |
|||||||||||||||||||||
Monitoring and related services |
$ | 251,585 | 87.0 | % | $ | 255,104 | 87.4 | % | $ | 243,963 | 87.9 | % | |||||||||
Installation and other |
37,730 | 13.0 | 36,691 | 12.6 | 33,527 | 12.1 | |||||||||||||||
Total Revenue |
289,315 | 100.0 | 291,795 | 100.0 | 277,490 | 100.0 | |||||||||||||||
Cost of revenue (exclusive of amortization and depreciation shown below) |
|||||||||||||||||||||
Monitoring and related services |
67,709 | 23.4 | 75,154 | 25.8 | 72,526 | 26.2 | |||||||||||||||
Installation and other |
45,955 | 15.9 | 46,180 | 15.8 | 38,367 | 13.8 | |||||||||||||||
Total cost of revenue (exclusive of amortization and depreciation shown below) |
113,664 | 39.3 | 121,334 | 41.6 | 110,893 | 40.0 | |||||||||||||||
Operating Expenses |
|||||||||||||||||||||
Selling expenses |
48,187 | 16.7 | 52,558 | 18.0 | 44,698 | 16.1 | |||||||||||||||
General and administrative expenses |
61,676 | 21.3 | 62,077 | 21.3 | 63,359 | 22.8 | |||||||||||||||
Merger-related costs |
— | — | — | — | 4,344 | 1.6 | |||||||||||||||
Amortization of intangibles and depreciation expense |
41,943 | 14.5 | 51,474 | 17.6 | 49,501 | 17.8 | |||||||||||||||
Total operating expenses |
151,806 | 52.5 | 166,109 | 56.9 | 161,902 | 58.3 | |||||||||||||||
Operating income |
$ | 23,845 | 8.2 | % | $ | 4,352 | 1.5 | % | $ | 4,695 | 1.7 | % | |||||||||
The change in our Retail segment customer base is shown below for the periods indicated.
| |
2009 | 2008 | 2007 | |||||||
|---|---|---|---|---|---|---|---|---|---|---|
Beginning Balance, January 1, |
574,001 | 602,519 | 506,688 | |||||||
Customer additions, excluding additions from Merger |
37,939 | 50,843 | 56,788 | |||||||
Customer additions from Merger |
— | — | 115,175 | |||||||
Customer losses |
(72,021 | ) | (79,662 | ) | (74,696 | ) | ||||
Other adjustments |
1,049 | 301 | (1,436 | ) | ||||||
Ending Balance, December 31, |
540,968 | 574,001 | 602,519 | |||||||
For a roll-forward of Retail segment RMR, see the segment table in "—Performance Metrics—Recurring Monthly Revenue," above.
2009 Compared to 2008
Revenue decreased $2.5 million, or 0.8%, to $289.3 million in 2009 compared to $291.8 million in 2008. Monitoring and related services revenue decreased due to attrition of customers and lower service call volume. Installation revenue increased $1.0 million primarily due to an increase in amortization of previously deferred customer acquisition revenue partially offset by a decrease of $0.7 million in security system equipment sales to commercial customers. Amortization of previously deferred customer acquisition revenue increased $1.8 million in 2009 to $15.2 million compared to
41
$13.4 million in 2008. Revenue consists primarily of (1) contractual revenue derived from providing monitoring and maintenance service, (2) revenue from our installations of new alarm systems, consisting primarily of sales of burglar alarm, CCTV, fire alarm and card access control systems to commercial customers, and (3) amortization of previously deferred revenue.
Cost of revenue decreased $7.6 million, or 6.3%, to $113.7 million in 2009 compared to $121.3 million in 2008, primarily due to a decrease in the cost of monitoring and related services revenue. This decrease is primarily due to a reduction in labor costs related to centralization of our customer care functions as well as the stabilization of fuel costs. Installation cost of revenue decreased slightly, less than one half of one percent. A decrease in the cost of security system outright equipment sales to commercial customers was offset by a similar increase in amortization of previously deferred customer acquisition costs. These costs include the costs of monitoring, billing, customer service, field operations, and equipment and labor charges to install alarm systems, CCTV, fire alarms and card access control systems sold to our commercial customers, as well as amortization of previously deferred customer acquisition costs.
Operating expenses decreased $14.3 million, or 8.6%, to $151.8 million in 2009 compared to $166.1 million in 2008, primarily due to a decrease in costs associated with our marketing programs, a reduction in sales headcount and a decrease in amortization of intangibles and depreciation. Amortization of intangibles and depreciation decreased $9.5 million, or 18.5%, to $41.9 million in 2009 compared to $51.4 million in 2008, primarily due to a decrease in amortization of customer accounts resulting from changes in estimates based on our lifing study in 2008.
2008 Compared to 2007
On April 2, 2007, we acquired IASG, which resulted in the acquisition of sizeable Retail and Wholesale operations. The financial results of IASG have been consolidated from the date of the Merger.
Revenue increased $14.3 million, or 5.2%, to $291.8 million in 2008 compared to $277.5 million in 2007. Monitoring and related services revenue increased due to an increase in the customer base related to the Merger, an increase in service revenues and modest price increases, which was offset by attrition of customers acquired in the Merger. Installation revenue increased due to an increase in amortization of previously deferred customer acquisition revenue. Amortization of previously deferred customer acquisition revenue increased $2.7 million in 2008 to $13.4 million compared to $10.7 million in 2007.
Cost of revenue increased $10.4 million, or 9.4%, to $121.3 million in 2008 compared to $110.9 million in 2007. Increases in fuel costs and higher costs to service the increased customer base are the primary reasons for increases in our monitoring and related services cost of revenue. Installation cost of revenue increased due to amortization of previously deferred customer acquisition costs which increased $7.4 million in 2008 to $24.3 million compared to $16.9 million in 2007.
Operating expenses increased $4.2 million, or 2.6%, to $166.1 million in 2008 compared to $161.9 million in 2007, primarily due to an increase in spending on our marketing and selling programs, partially offset by a decrease in Merger-related costs. During 2008, we implemented an integrated marketing program to increase awareness for the Protection One® brand name nationally and to generate new lead sources and opportunities. We reached out to targeted customers, both residential and commercial, through a variety of mediums in a planned and sequenced manner. Amortization of intangibles and depreciation increased in 2008 primarily due to a partial year of amortization in 2007 related to the acquisition of additional customers in the Merger. General and administrative expense as a percentage of revenue decreased to 21.3% in 2008 from 22.8% in 2007 as a result of increased scale arising from the Merger.
42
Wholesale
We present the table below to show how the operating results of the Wholesale segment have changed over the periods presented. Next to each period's results of operations, we provide the relevant percentage of total revenue so that you can make comparisons about the relative change in revenue and expenses (dollar amounts in thousands).
| |
For the year ended December 31, | ||||||||||||||||||||
|---|---|---|---|---|---|---|---|---|---|---|---|---|---|---|---|---|---|---|---|---|---|
| |
2009 | 2008 | 2007 | ||||||||||||||||||
Revenue |
|||||||||||||||||||||
Monitoring and related services |
$ | 49,021 | 97.7 | % | $ | 48,660 | 98.3 | % | $ | 37,432 | 98.6 | % | |||||||||
Installation and other |
1,167 | 2.3 | 817 | 1.7 | 546 | 1.4 | |||||||||||||||
Total Revenue |
50,188 | 100.0 | 49,477 | 100.0 | 37,978 | 100.0 | |||||||||||||||
Cost of revenue (exclusive of amortization and depreciation shown below) |
|||||||||||||||||||||
Monitoring and related services |
26,169 | 52.1 | 28,108 | 56.8 | 19,599 | 51.6 | |||||||||||||||
Operating Expenses |
|||||||||||||||||||||
Selling expenses |
1,776 | 3.5 | 2,253 | 4.6 | 1,430 | 3.8 | |||||||||||||||
General and administrative expenses |
9,146 | 18.3 | 9,685 | 19.5 | 6,574 | 17.3 | |||||||||||||||
Amortization of intangibles and depreciation expense |
4,713 | 9.4 | 7,216 | 14.6 | 6,274 | 16.5 | |||||||||||||||
Total operating expenses |
15,635 | 31.2 | 19,154 | 38.7 | 14,278 | 37.6 | |||||||||||||||
Operating income |
$ | 8,384 | 16.7 | % | $ | 2,215 | 4.5 | % | $ | 4,101 | 10.8 | % | |||||||||
The change in our Wholesale segment monitored site base is shown below for the periods indicated.
| |
2009 | 2008 | 2007 | |||||||
|---|---|---|---|---|---|---|---|---|---|---|
Beginning Balance, January 1, |
991,014 | 865,163 | 194,185 | |||||||
Monitored site additions, excluding additions from Merger |
272,729 | 349,053 | 209,957 | |||||||
Monitored site additions from Merger |
— | — | 597,478 | |||||||
Monitored site losses |
(209,510 | ) | (224,007 | ) | (136,107 | ) | ||||
Other adjustments(a) |
(376,947 | ) | 805 | (350 | ) | |||||
Ending Balance, December 31, |
677,286 | 991,014 | 865,163 | |||||||
- (a)
- Other adjustments in 2009 include the impact of the APX Agreement. See "—Significant Activities, APX Agreement" above, for additional information related to the agreement.
For a roll-forward of Wholesale segment RMR, see the segment table in "—Performance Metrics-Recurring Monthly Revenue," above.
2009 compared to 2008
Revenue increased $0.7 million, or 1.4%, to $50.2 million in 2009 compared to $49.5 million in 2008 due to the addition of monitored sites from our largest wholesale dealer. Installation and other revenue in 2009 includes $0.5 million related to services provided under the APX Agreement. See "—Significant Activities-APX Agreement," above, for additional information related to the agreement. This revenue consists primarily of contractual revenue derived from providing monitoring and maintenance service, as well as interest and fee income generated from our dealer loan program.
43
Cost of revenue decreased $1.9 million, or 6.9%, to $26.2 million in 2009 compared to $28.1 million in 2008 due to a more efficient operating structure from consolidating our monitoring centers onto a common monitoring and billing platform as well as the impact of the APX Agreement. These costs generally relate to the cost of providing monitoring service, including the costs of monitoring and dealer care.
Operating expenses decreased $3.6 million, or 18.4%, to $15.6 million in 2009 compared to $19.2 million in 2008 primarily due to a decrease of $2.5 million in amortization of intangibles and depreciation expense resulting from changes in estimates based on our lifing study in 2008 and certain intangible assets being fully amortized. Selling expense decreased $0.5 million in 2009 compared to 2008 due to a decrease in internal marketing and sales compensation expense.
2008 compared to 2007
Revenue increased $11.5 million, or 30.3%, to $49.5 million in 2008 compared to $38.0 million in 2007 due to the addition of monitored sites acquired in the Merger and from our largest wholesale dealer. Wholesale average RMR was $3.8 million in 2008 compared to $3.6 million in 2007.
Cost of revenue increased $8.5 million, or 43.4%, to $28.1 million in 2008 compared to $19.6 million in 2007 because (1) we improved service levels in the acquired monitoring centers by increasing staffing; (2) revenue growth came from monitored sites with lower than average RMR and higher costs to service, including two-way voice verification and line security; and (3) we increased staffing levels in 2008 in connection with the integration of our Wholesale monitoring centers.
Operating expenses increased $4.9 million, or 34.2%, to $19.2 million in 2008 compared to $14.3 million in 2007 due to an expansion of our sales force and an increase in internal marketing and selling efforts, including advertising and trade show participation, to support the increased size of the Wholesale operations; and an increase in Wholesale's share of corporate shared services, such as human resources and legal costs, which is based on each segment's contribution to total revenue. Amortization of intangibles and depreciation expense increased in 2008 due to a partial year of amortization in 2007 related to dealer relationships acquired in the Merger.
Multifamily
The following table provides information for comparison of the Multifamily operating results for the periods presented. Next to each period's results of operations, we provide the relevant percentage
44
of total revenue so that comparisons about the relative change in revenue and expenses can be made (dollar amounts in thousands).
| |
For the year ended December 31, | |||||||||||||||||||
|---|---|---|---|---|---|---|---|---|---|---|---|---|---|---|---|---|---|---|---|---|
| |
2009 | 2008 | 2007 | |||||||||||||||||
Revenue |
||||||||||||||||||||
Monitoring and related services |
$ | 27,395 | 96.0 | % | $ | 30,361 | 98.7 | % | $ | 31,935 | 98.6 | % | ||||||||
Installation and other |
1,154 | 4.0 | 388 | 1.3 | 468 | 1.4 | ||||||||||||||
Total Revenue |
28,549 | 100.0 | 30,749 | 100.0 | 32,403 | 100.0 | ||||||||||||||
Cost of revenue (exclusive of amortization and depreciation shown below) |
||||||||||||||||||||
Monitoring and related services |
7,105 | 24.9 | 7,718 | 25.1 | 7,710 | 23.8 | ||||||||||||||
Installation and other |
3,330 | 11.7 | 2,570 | 8.4 | 2,503 | 7.7 | ||||||||||||||
Total cost of revenue (exclusive of amortization and depreciation shown below) |
10,435 | 36.6 | 10,288 | 33.5 | 10,213 | 31.5 | ||||||||||||||
Operating Expenses |
||||||||||||||||||||
Selling expenses |
831 | 2.9 | 1,436 | 4.7 | 1,424 | 4.4 | ||||||||||||||
General and administrative expenses |
5,787 | 20.3 | 8,804 | 28.6 | 7,913 | 24.4 | ||||||||||||||
Amortization of intangibles and depreciation expense |
3,440 | 12.0 | 5,585 | 18.2 | 6,289 | 19.4 | ||||||||||||||
Impairment of trade name |
— | — | 925 | 3.0 | — | — | ||||||||||||||
Total operating expenses |
10,058 | 35.2 | 16,750 | 54.5 | 15,626 | 48.2 | ||||||||||||||
Operating income |
$ | 8,056 | 28.2 | % | $ | 3,711 | 12.0 | % | $ | 6,564 | 20.3 | % | ||||||||
The change in our Multifamily segment monitored site base is shown below for the periods indicated.
| |
2009 | 2008 | 2007 | |||||||
|---|---|---|---|---|---|---|---|---|---|---|
Beginning Balance, January 1, |
240,648 | 277,743 | 293,139 | |||||||
Monitored site additions |
9,655 | 9,058 | 8,277 | |||||||
Monitored site losses |
(37,278 | ) | (46,153 | ) | (24,141 | ) | ||||
Other |
— | — | 468 | |||||||
Ending Balance, December 31, |
213,025 | 240,648 | 277,743 | |||||||
For a roll-forward of Multifamily segment RMR, see the segment table in "—Performance Metrics—Recurring Monthly Revenue," above.
2009 compared to 2008
Revenue decreased $2.2 million, or 7.2%, to $28.5 million in 2009 compared to $30.7 million in 2008 as a result of the decline in the monitored site base. Installation and other revenue increased $0.8 million in 2009 due to an increase in security system equipment sales. Revenue consists primarily of contractual revenue derived from providing monitoring and maintenance service, the sale of access control systems and amortization of previously deferred customer acquisition revenue.
Cost of revenue in 2009 increased $0.1 million, or 1.4%, to $10.4 million in 2009 compared to $10.3 million in 2008. Cost of monitoring and service decreased $0.6 million in 2009 due to a decline in the related revenue. Installation costs increased in 2009 as a result of increased sales of security systems. Cost of revenue includes monitoring, billing, customer service and field operations related to
45
providing our monitoring services, as well as the cost to install security and access control systems and amortization of previously deferred costs.
Operating expenses decreased $6.6 million, or 39.9%, to $10.1 million in 2009 compared to $16.7 million in 2008. This decrease is primarily due to a decrease in the cost of corporate administrative services allocated to the Multifamily segment, a lower sales force head count and a decrease in amortization of customer accounts resulting from changes in estimates based on our lifing study in 2008.
2008 compared to 2007
Revenue decreased $1.7 million, or 5.1%, to $30.7 million in 2008 compared to $32.4 million in 2007 as a result of the decline in the monitored site base and from declines in installation activity and the sale of access control systems.
Cost of revenue in 2008 was consistent with 2007 but increased as a percentage of revenue to 33.5% in 2008 compared to 31.5% in 2007 because cost savings initiatives did not keep pace with the decline in revenue.
Operating expenses increased $1.1 million, or 7.2%, to $16.7 million in 2008 compared to $15.6 million in 2007. This increase is primarily attributable to the trade name impairment, as well as an increase in bad debt expense on uncollectible accounts. Amortization of intangibles and depreciation expense decreased in 2008 as a result of the change in amortization method and estimated useful life for Multifamily customer accounts.
Liquidity and Capital Resources
As of December 31, 2009, we had cash and cash equivalents of $26.1 million. The face value of our long-term debt and capital leases was $447.3 million as of December 31, 2009. In December 2009, we made $30.0 million in principal prepayments on the Non-Extending Term Loans which can be applied to offset any required Excess Cash Flow payment as defined in the Senior Credit Agreement. As a result, we will not be required to make additional principal prepayments in the first quarter of 2010.
We expect to generate cash flow in excess of that required for operations, interest payments and principal payments required under all of our debt obligations during the twelve months following the date of the financial statements included in this report.
Credit Risk
Our cash and cash equivalents are deposited in a mutual fund invested exclusively in U.S. Treasury securities. Although the mutual fund is permitted seven days to satisfy withdrawal requests, the financial institution has never exercised the provision. We believe, based on information available to management at this time, that there is minimal risk regarding liquidity of our approximately $26.1 million cash and cash equivalents as of December 31, 2009.
We have assessed our credit exposure to various other factors including (1) our ability to draw funds under our revolving credit facility; (2) counterparty default risk associated with our interest rate cap and swaps; (3) our need to enter the capital markets; and (4) exposure related to our existing insurance policies. We believe we have sufficient liquidity for our currently foreseeable operational needs. With respect to our interest rate swaps and cap, we believe that counterparty default is not probable. We also believe there should be sufficient time for the capital markets to stabilize before we have a need for additional financing. Lastly, we have assessed exposure on our existing insurance policies and believe the insurers are financially solvent and well-capitalized.
46
We also considered our supply chain risk. Two vendors are the principal providers of our security-related products and services for our Retail and Multifamily segments. We believe we can obtain alternative supply in the event such products and services are not available from our existing Retail supplier. We also believe we have sufficient product on hand for our Multifamily segment to continue to provide ongoing services in the short-term in the event we are unable to obtain products from our primary supplier to this segment.
We entered into three interest rate swaps in the second quarter of 2008 to fix the interest rate on $250 million of the variable rate debt under the Company's then existing credit facility. The interest rate swaps mature from September 2010 to November 2010. The interest rate swaps were de-designated as cash flow hedges in conjunction with the debt refinancing that occurred in the fourth quarter of 2009.
Debt Obligations
On November 17, 2009, we amended our senior credit agreement which (i) increased term loan borrowings by $75 million under the New Term Loans to an aggregate of $364.5 million, (ii) divided all of our term loans into Non-Extending Term Loans equal to $86.5 million and New and Extending Term Loans equal to $278.0 million and (iii) replaced our $25 million revolving credit facility with a $15 million revolving credit facility. We intend to use any borrowings under the revolving credit facility, from time to time, for working capital and general corporate purposes.
The New and Extending Term Loans are scheduled to mature on March 31, 2014, provided, however, that the New and Extending Term Loans will mature on December 14, 2012 if prior to December 14, 2012 the maturity date for our Unsecured Term Loan Agreement is not extended to at least 91 days after March 31, 2014 or the borrowings under the Unsecured Term Loan Agreement are not refinanced with permitted refinancing indebtedness having a maturity date at least 91 days after March 31, 2014. The New and Extending Term Loans bear interest at a margin of 4.25% over the Eurodollar Base Rate (as defined in the Senior Credit Agreement and subject to a 2% floor) for Eurodollar borrowings and 3.25% over the Base Rate (as defined in the Senior Credit Agreement and subject to a 3% floor) for Base Rate borrowings. The Non-Extending Term Loans are scheduled to mature on March 31, 2012 and bear interest at a margin of 2.25% over the Eurodollar Base Rate for Eurodollar borrowings and 1.25% over the Base Rate for Base Rate Borrowings. Prior to the amendment of the senior credit facility in November of 2009, our borrowings under the senior credit agreement bore interest at a margin of 2.25% over the Eurodollar Base Rate for Eurodollar borrowings and 1.25% over the Base Rate for Base Rate Borrowings. The interest rate at December 31, 2009, was 6.25% and 2.48% for the New and Extending Term Loans and the Non-Extending Tern Loans, respectively, not including the impact of interest rate swaps. The weighted average annual interest rate before fees on our senior credit agreement at December 31, 2008, including the impact of interest rate swaps, was 5.1%.
The revolving credit facility is scheduled to mature on March 31, 2013, provided, however, that the revolving credit facility will mature on December 14, 2012 if prior to December 14, 2012 the maturity date of our Unsecured Term Loan Agreement is not extended to at least 91 days after March 31, 2014 or the borrowings under the Unsecured Term Loan Agreement are not refinanced with permitted refinancing indebtedness having a maturity date at least 91 days after March 31, 2014. Borrowings under the revolving credit facility will bear interest at a margin of 4.25% over the Eurodollar Base Rate for Eurodollar borrowings and 3.25% over the Base Rate for Base Rate borrowings. The revolving credit facility includes an unused commitment fee equal to 1.0%. We may request letters of credit to be issued under the revolving credit facility of up to $7.5 million, with any outstanding letters of credit reducing the total amount available for borrowing under the revolving credit facility. Approximately $11.0 million remained available for borrowing under our revolving credit facility as of
47
March 5, 2010 after reducing total availability by approximately $4.0 million for an outstanding letter of credit.
On March 14, 2008, we borrowed approximately $110.3 million under an unsecured term loan facility to allow us to redeem all of the Senior Subordinated Notes. The Unsecured Term Loan bears interest at the prime rate plus 11.5% per annum and matures in 2013.
The senior credit facility is secured by substantially all of our assets, requires quarterly principal payments of $0.8 million and requires potential annual prepayments based on a calculation of "Excess Cash Flow," as defined in the Senior Credit Agreement and due in the first quarter of the subsequent year. We made $30.0 million in principal prepayments on the Non-Extending Term Loans in December 2009 which can be applied to offset any required Excess Cash Flow prepayment. As a result, we will not be required to make additional principal prepayments in the first quarter of 2010. We were not required and did not make a prepayment in the first quarter of 2009.
The Senior Credit Agreement and Unsecured Term Loan Agreement contain certain covenants and restrictions, including with respect to our ability to incur debt and pay dividends, based on earnings before interest, taxes, depreciation and amortization, or EBITDA. While the definition of EBITDA varies slightly among the Senior Credit Agreement and Unsecured Term Loan Agreement, EBITDA is generally derived by adding to income (loss) before income taxes, the sum of interest expense, depreciation and amortization expense, including amortization of deferred customer acquisition costs less amortization of deferred customer acquisition revenue.
The following table presents the financial ratios required by our Senior Credit Agreement and Unsecured Term Loan Agreement through December 31, 2010 and our actual ratios as of December 31, 2009.
Debt Instrument
|
Financial Covenants | Ratio Requirements | Actual Ratio as of December 31, 2009 |
|||
|---|---|---|---|---|---|---|
Senior Credit Agreement |
Consolidated Leverage Ratio (consolidated total debt on last day of period/consolidated EBITDA for most recent four fiscal quarters) | Q4 2009 through Q3 2010: Less than 5.5:1.0 Q4 2010; less than 5.25:1.0 |
3.11:1.0 | |||
|
Consolidated Interest Coverage Ratio (consolidated EBITDA for most recent four fiscal quarters/consolidated interest expense for most recent four fiscal quarters) |
Q4 2009 through Q3 2010: Greater than 2.0:1.0 |
3.21:1.0 |
|||
Unsecured Term Loan Agreement |
Consolidated Fixed Charge Coverage Ratio (consolidated EBITDA for most recent four fiscal quarters/consolidated interest expense for most recent four fiscal quarters) |
Greater than 2.25:1.0 |
2.98:1.0 |
At December 31, 2009, we were in compliance with the financial covenants and other maintenance tests for all our debt obligations. The Consolidated Leverage Ratio and Consolidated Interest Coverage Ratio contained in our Senior Credit Agreement are maintenance tests and the Consolidated Fixed
48
Charge Coverage Ratio contained in our Unsecured Term Loan Agreement is a debt incurrence test. We cannot be deemed to be in default solely due to failure to meet debt incurrence tests. However, failure to meet debt incurrence tests could result in restriction on our ability to incur additional ratio indebtedness. We believe that should we fail to meet the minimum Consolidated Fixed Charge Coverage Ratios in our Unsecured Term Loan Agreement, our ability to borrow additional funds under other permitted indebtedness provisions in our Unsecured Term Loan Agreement and Senior Credit Agreement would provide us with sufficient liquidity for our currently foreseeable operational needs. We are prohibited from paying cash dividends to our stockholders under covenants contained in our Senior Credit Agreement.
Cash Flow
Operating Cash Flows
Our operating activities provided net cash flows of $105.4 million, $59.7 million and $57.7 million for the years ended December 31, 2009, 2008 and 2007, respectively. Working capital was a deficit of $18.4 million and $1.8 million as of December 31, 2009 and 2008, respectively. The decline in working capital in 2009 is primarily the result of a decrease in our cash balance used to pay long term debt and the amendment of the senior credit facility. We also received $22.75 million under the Final Settlement Agreement with Westar in 2009. Cash interest payments were $47.0 million for each of the years ended December 31, 2009 and 2008 and $47.1 million for the year ended December 31, 2007. We made Merger-related payments, primarily severance, of $4.3 million in 2007.
Investing Cash Flows
We used a net $31.8 million for our investing activities for the year ended December 31, 2009. We invested a net $25.6 million in cash to install and acquire new accounts, including rental equipment, and $6.8 million to acquire fixed assets, received $0.5 million from the sale of accounts and other assets and reduced restricted cash by $0.1 million in 2009. We used a net $48.4 million for our investing activities for the year ended December 31, 2008. We invested a net $41.6 million in cash to install and acquire new accounts, including rental equipment, and $7.7 million to acquire fixed assets in 2008. For the year ended December 31, 2008, we decreased restricted cash by $0.6 million and received $0.3 million in proceeds from the sale of accounts and other assets. We used a net $34.7 million for our investing activities for the year ended December 31, 2007. We invested a net $35.5 million in cash to install and acquire new accounts, including rental equipment, and $8.1 million to acquire fixed assets in 2007. For the year ended December 31, 2007, we decreased restricted cash by $0.2 million, received $5.8 million from the sale of accounts and other assets, which is primarily due to proceeds of $5.4 million related to the assets and liabilities of the IASG business that were transferred prior to the Merger, and acquired a net $2.9 million from the Merger.
Financing Cash Flows
Financing activities used a net $86.4 million in the year ended December 31, 2009. We used $354.9 million to retire debt, which include $30.0 million in principal prepayments on our senior credit facility. We used $3.9 million for debt issuance costs and received $272.4 million in proceeds from additional borrowings under our senior credit facility. Financing activities used $13.4 million in the year ended December 31, 2008. We paid $121.7 million for the redemption of our Senior Subordinated Notes and the repayment of borrowings under our senior credit facility and capital leases. We also paid $2.0 million for debt issuance costs related to the $110.3 million proceeds received under the Unsecured Term Loan. Financing activities used $6.6 million in the year ended December 31, 2007. We used $4.8 million to retire senior credit facility and capital lease debt and $1.8 million for debt and stock issuance costs.
49
Capital Expenditures
As discussed above, we made capital expenditures of approximately $32.4 million in 2009. Of such amount, we invested approximately $23.3 million in net customer acquisition costs, $2.3 million in rental equipment and $6.8 million for fixed assets. Assuming we have available funds, capital expenditures for 2010 are expected to be approximately $43 million of which approximately $6 million would be used for fixed asset purchases, with the balance to be used for customer acquisition costs and rental equipment. These estimates are prepared for planning purposes and are revised from time to time. Actual expenditures for these and other items not presently anticipated may vary materially from these estimates during the course of the years presented.
Off Balance Sheet Arrangements
We had no off-balance sheet arrangements at December 31, 2009, other than as discussed below.
Material Commitments
We had the following future, material, long-term commitments as of December 31, 2009 (in thousands):
| |
Payment Due by Period | |||||||||||||||
|---|---|---|---|---|---|---|---|---|---|---|---|---|---|---|---|---|
At December 31, 2009:
|
Total | Less than 1 year |
1-3 years | 3-5 years | More than 5 years |
|||||||||||
Contractual Obligations |
||||||||||||||||
Long-Term Debt Obligations(a)(c) |
$ | 444,004 | $ | 3,345 | $ | 330,319 | $ | 110,340 | $ | — | ||||||
Interest Obligations on Long-Term Debt and Capital Lease Obligations(b)(c) |
118,004 | 41,466 | 68,400 | 8,138 | — | |||||||||||
Operating Leases Obligations |
19,481 | 6,319 | 10,021 | 3,091 | 50 | |||||||||||
Capital Leases Obligations |
3,285 | 1,942 | 1,342 | 1 | — | |||||||||||
Purchase Obligations(d) |
3,690 | 3,620 | 70 | — | — | |||||||||||
Total |
$ | 588,464 | $ | 56,692 | $ | 410,152 | $ | 121,570 | $ | 50 | ||||||
- (a)
- In
addition to the amounts disclosed in the table above, the senior credit facility requires potential annual prepayments based on a calculation of "Excess
Cash Flow," due in the first quarter of each subsequent fiscal year. We made $30.0 million in principal prepayments on the Non-Extending Term Loans in December 2009 which can be
applied to offset any required Excess Cash Flow prepayment. As a result, we will not be required to make additional principal prepayments in the first quarter of 2010.
- (b)
- The
interest rate used to calculate the interest obligation on the variable rate senior credit facility and the Unsecured Term Loan is the interest rate at
December 31, 2009.
- (c)
- Assumes
(i) payment of Unsecured Term Loan at contractual maturity date of March 14, 2013; and (ii) senior credit facility subject to
early maturity date of December 14, 2012. Interest obligation on long-term debt and capital leases would increase by $20.9 million in the 3-5 year period
if the senior credit facility is outstanding until its scheduled maturity.
- (d)
- Contract tariff for telecommunication services.
50
The table below shows our total commercial commitments and the expected expiration per period (in thousands):
| |
Amount of Commitment Expiration Per Period | ||||||||||||||||
|---|---|---|---|---|---|---|---|---|---|---|---|---|---|---|---|---|---|
At December 31, 2009:
|
Total | 2010 | 2011-2012 | 2013-2014 | Thereafter | ||||||||||||
Other Commercial Commitments |
|||||||||||||||||
Standby letters of credit |
$ | 4,000 | $ | 4,000 | $ | — | $ | — | $ | — | |||||||
Total commercial commitments |
$ | 4,000 | $ | 4,000 | $ | — | $ | — | $ | — | |||||||
Credit Ratings
As of March 5, 2010, our public debt was rated as follows:
| |
Senior credit facility |
Outlook | ||
|---|---|---|---|---|
S & P |
BB | Negative | ||
Moody's |
Ba3 | Stable |
On January 22, 2010, Standard and Poor's Ratings Services placed its rating of us on CreditWatch with negative implications following our announcement to explore strategic alternatives to enhance shareholder value.
ITEM 7A. QUANTITATIVE AND QUALITATIVE DISCLOSURES ABOUT MARKET RISK
Our senior credit facility is a variable rate debt instrument, and as of March 5, 2010, we had borrowings of $333.7 million outstanding. As of December 31, 2009 and 2008 we had outstanding borrowings of $333.7 million and $291.8 million, respectively, under our senior credit facility. In addition, our Unsecured Term Loan is a variable rate debt instrument with borrowings of $110.3 million outstanding as of December 31, 2009, December 31, 2008 and March 5, 2010. The New and Extending Term Loans of the senior credit facility have a floor of 2.0% for the applicable index rate. We have three interest rate swap agreements to fix the interest rate of $250 million of our variable rate debt under the senior credit facility, which fix the interest rate at a one month LIBOR rate of 3.15% to 3.19%. The interest rate swaps were de-designated as cash flow hedges in conjunction with the debt refinancing that occurred in the fourth quarter of 2009.
As of March 5, 2010, LIBOR was 0.23% and the prime rate was 3.25%. The table below reflects the impact on pre-tax income of changes in the rates at March 5, 2010 in LIBOR and the prime rate on our debt and the impact on pre-tax income of changes in LIBOR on the interest rate swaps (in thousands):
(Decrease) Increase in index rate |
(2.00 | )% | (1.00 | )% | 0.00 | % | 1.00 | % | 2.00 | % | 3.00 | % | 4.00 | % | |||||||||
Increase (Decrease) in pre-tax income: |
|||||||||||||||||||||||
Debt |
$ | 2,336 | $ | 1,233 | $ | 0 | $ | (1,667 | ) | $ | (3,972 | ) | $ | (8,412 | ) | $ | (12,853 | ) | |||||
Interest rate swaps |
(534 | ) | (534 | ) | 0 | 2,162 | 4,323 | 6,485 | 8,647 | ||||||||||||||
Net increase (decrease) in pre-tax income: |
$ | 1,802 | $ | 699 | $ | 0 | $ | 495 | $ | 351 | $ | (1,927 | ) | $ | (4,206 | ) | |||||||
51
ITEM 8. FINANCIAL STATEMENTS AND SUPPLEMENTARY DATA.
REPORT OF INDEPENDENT REGISTERED PUBLIC ACCOUNTING FIRM
To
the Board of Directors and Stockholders of
Protection One, Inc.
Lawrence, Kansas
We have audited the accompanying consolidated balance sheets of Protection One, Inc. and subsidiaries (the "Company") as of December 31, 2009 and 2008, and the related consolidated statements of operations and comprehensive income (loss), stockholders' equity (deficiency in assets) and cash flows for each of the three years in the period ended December 31, 2009. Our audits also included the financial statement schedule listed in the Index at Item 15(a)2. These financial statements and financial statement schedule are the responsibility of the Company's management. Our responsibility is to express an opinion on these financial statements and financial statement schedule based on our audits.
We conducted our audits in accordance with the standards of the Public Company Accounting Oversight Board (United States). Those standards require that we plan and perform the audit to obtain reasonable assurance about whether the financial statements are free of material misstatement. An audit includes examining, on a test basis, evidence supporting the amounts and disclosures in the financial statements. An audit also includes assessing the accounting principles used and significant estimates made by management, as well as evaluating the overall financial statement presentation. We believe that our audits provide a reasonable basis for our opinion.
In our opinion, such consolidated financial statements present fairly, in all material respects, the financial position of Protection One, Inc. and subsidiaries as of December 31, 2009 and 2008, and the results of their operations and their cash flows for each of the three years in the period ended December 31, 2009, in conformity with accounting principles generally accepted in the United States of America. Also, in our opinion, such financial statement schedule, when considered in relation to the basic consolidated financial statements taken as a whole, presents fairly, in all material respects, the information set forth therein.
We have also audited, in accordance with the standards of the Public Company Accounting Oversight Board (United States), the Company's internal control over financial reporting as of December 31, 2009, based on the criteria established in Internal Control—Integrated Framework issued by the Committee of Sponsoring Organizations of the Treadway Commission and our report dated March 23, 2010 expressed an unqualified opinion on the Company's internal control over financial reporting.
/s/ DELOITTE AND TOUCHE LLP
Kansas
City, Missouri
March 23, 2010
52
PROTECTION ONE, INC. AND SUBSIDIARIES
CONSOLIDATED BALANCE SHEETS
(Dollar amounts in thousands, except for per share amounts)
| |
December 31, | |||||||
|---|---|---|---|---|---|---|---|---|
| |
2009 | 2008 | ||||||
ASSETS |
||||||||
Current assets: |
||||||||
Cash and cash equivalents |
$ | 26,068 | $ | 38,883 | ||||
Accounts receivable (net of allowance of $7,147 and $6,199 at December 31, 2009 and 2008, respectively) |
32,719 | 39,281 | ||||||
Notes receivable |
674 | 1,143 | ||||||
Inventories, net |
5,067 | 4,973 | ||||||
Prepaid expenses |
4,073 | 4,646 | ||||||
Other |
2,273 | 3,022 | ||||||
Total current assets |
70,874 | 91,948 | ||||||
Restricted cash |
2,180 | 2,245 | ||||||
Property and equipment, net |
32,068 | 36,168 | ||||||
Customer accounts, net |
203,453 | 237,718 | ||||||
Dealer relationships, net |
34,965 | 37,597 | ||||||
Goodwill |
43,853 | 41,604 | ||||||
Trade name |
27,687 | 27,687 | ||||||
Notes receivable (net of current portion) |
2,275 | 3,049 | ||||||
Deferred customer acquisition costs |
146,024 | 150,848 | ||||||
Other |
8,516 | 10,190 | ||||||
Total Assets |
$ | 571,895 | $ | 639,054 | ||||
LIABILITIES AND STOCKHOLDERS' EQUITY (DEFICIENCY IN ASSETS) |
||||||||
Current liabilities: |
||||||||
Current portion of long-term debt and capital leases |
$ | 5,358 | $ | 5,361 | ||||
Accounts payable |
5,009 | 3,315 | ||||||
Accrued liabilities |
34,633 | 39,022 | ||||||
Deferred revenue |
44,280 | 46,027 | ||||||
Total current liabilities |
89,280 | 93,725 | ||||||
Long-term debt and capital leases, net of current portion |
436,550 | 523,927 | ||||||
Deferred customer acquisition revenue |
98,323 | 95,028 | ||||||
Deferred tax liability |
4,879 | 1,166 | ||||||
Other liabilities |
1,926 | 5,458 | ||||||
Total Liabilities |
630,958 | 719,304 | ||||||
Commitments and contingencies (see Note 13) |
||||||||
Stockholders' equity: |
||||||||
Preferred stock, $.10 par value, 5,000,000 shares authorized |
— | — | ||||||
Common stock, $.01 par value, 150,000,000 shares authorized, 25,333,371 and 25,316,529 shares issued and outstanding at December 31, 2009 and 2008, respectively |
253 | 253 | ||||||
Additional paid-in capital |
181,296 | 180,800 | ||||||
Accumulated other comprehensive loss |
(5,985 | ) | (9,169 | ) | ||||
Deficit |
(234,627 | ) | (252,134 | ) | ||||
Total stockholders' equity (deficiency in assets) |
(59,063 | ) | (80,250 | ) | ||||
Total Liabilities and Stockholders' Equity (Deficiency in Assets) |
$ | 571,895 | $ | 639,054 | ||||
The accompanying notes are an integral part of these consolidated financial statements.
53
PROTECTION ONE, INC. AND SUBSIDIARIES
CONSOLIDATED STATEMENTS OF OPERATIONS AND COMPREHENSIVE INCOME (LOSS)
(Dollar amounts in thousands, except for
per share amounts)
| |
Year Ended December 31, | |||||||||||
|---|---|---|---|---|---|---|---|---|---|---|---|---|
| |
2009 | 2008 | 2007 | |||||||||
Revenue: |
||||||||||||
Monitoring and related services |
$ | 328,001 | $ | 334,125 | $ | 313,330 | ||||||
Installation and other |
40,051 | 37,896 | 34,541 | |||||||||
Total revenue |
368,052 | 372,021 | 347,871 | |||||||||
Cost of revenue (exclusive of amortization and depreciation shown below): |
||||||||||||
Monitoring and related services |
100,983 | 110,980 | 99,835 | |||||||||
Installation and other |
49,285 | 48,750 | 40,870 | |||||||||
Total cost of revenue (exclusive of amortization and depreciation shown below) |
150,268 | 159,730 | 140,705 | |||||||||
Operating expenses: |
||||||||||||
Selling |
50,794 | 56,247 | 47,552 | |||||||||
General and administrative |
76,609 | 80,566 | 77,846 | |||||||||
Merger-related costs |
— | — | 4,344 | |||||||||
Amortization and depreciation |
50,096 | 64,275 | 62,064 | |||||||||
Impairment of trade name |
— | 925 | — | |||||||||
Total operating expenses |
177,499 | 202,013 | 191,806 | |||||||||
Operating income |
40,285 | 10,278 | 15,360 | |||||||||
Other expense (income): |
||||||||||||
Interest expense |
45,386 | 48,539 | 49,486 | |||||||||
Interest income |
(75 | ) | (794 | ) | (2,509 | ) | ||||||
(Gain) loss on retirement of debt |
(1,956 | ) | 12,788 | — | ||||||||
Gain on settlement agreement |
(22,867 | ) | — | — | ||||||||
Other |
— | (54 | ) | (90 | ) | |||||||
Total other expenses |
20,488 | 60,479 | 46,887 | |||||||||
Income (loss) before income taxes |
19,797 | (50,201 | ) | (31,527 | ) | |||||||
Income tax expense |
2,290 | 341 | 713 | |||||||||
Net income (loss) |
$ | 17,507 | $ | (50,542 | ) | $ | (32,240 | ) | ||||
Other comprehensive income, net of tax: |
||||||||||||
Net change in fair value of derivatives |
3,184 | (8,639 | ) | (212 | ) | |||||||
Comprehensive income (loss) |
$ | 20,691 | $ | (59,181 | ) | $ | (32,452 | ) | ||||
Basic and diluted per share information: |
||||||||||||
Net income (loss) per common share |
$ | 0.69 | $ | (2.00 | ) | $ | (1.37 | ) | ||||
Weighted average common shares outstanding (in thousands) |
25,324 | 25,310 | 23,525 | |||||||||
The accompanying notes are an integral part of these consolidated financial statements.
54
PROTECTION ONE, INC. AND SUBSIDIARIES
CONSOLIDATED STATEMENTS OF CASH FLOWS
(Dollar amounts in thousands)
| |
Year Ended December 31, | ||||||||||
|---|---|---|---|---|---|---|---|---|---|---|---|
| |
2009 | 2008 | 2007 | ||||||||
Cash flows from operating activities: |
|||||||||||
Net income (loss) |
$ | 17,507 | $ | (50,542 | ) | $ | (32,240 | ) | |||
Adjustments to reconcile net income (loss) to net cash provided by operating activities: |
|||||||||||
Gain on sale of assets |
(150 | ) | (185 | ) | (224 | ) | |||||
(Gain) loss on retirement of debt |
(1,956 | ) | 12,788 | — | |||||||
Loss on impairment of trade name |
— | 925 | — | ||||||||
Amortization and depreciation |
50,096 | 64,275 | 62,064 | ||||||||
Amortization of debt costs, discounts and premium |
(33 | ) | 1,538 | 6,878 | |||||||
Amortization of deferred customer acquisition costs in excess of amortization of deferred revenue |
30,514 | 30,732 | 24,175 | ||||||||
Stock based compensation |
496 | 1,448 | 1,469 | ||||||||
Deferred income taxes |
1,564 | (53 | ) | (8 | ) | ||||||
Provision for doubtful accounts |
5,723 | 4,644 | 3,455 | ||||||||
Other |
979 | 25 | (90 | ) | |||||||
Changes in assets and liabilities, net of effects of acquisitions and dispositions: |
|||||||||||
Accounts receivable |
965 | (6,199 | ) | (8,307 | ) | ||||||
Notes receivable, net |
1,242 | 1,559 | 2,817 | ||||||||
Other assets |
2,854 | 2,093 | 1,268 | ||||||||
Accounts payable |
1,694 | (734 | ) | (1,019 | ) | ||||||
Deferred revenue |
(2,039 | ) | (1,698 | ) | 5,204 | ||||||
Other liabilities |
(4,059 | ) | (962 | ) | (7,778 | ) | |||||
Net cash provided by operating activities |
105,397 | 59,654 | 57,664 | ||||||||
Cash flows from investing activities: |
|||||||||||
Deferred customer acquisition costs |
(42,012 | ) | (63,877 | ) | (59,953 | ) | |||||
Deferred customer acquisition revenue |
19,757 | 28,837 | 29,810 | ||||||||
Purchase of rental equipment |
(2,286 | ) | (5,329 | ) | (4,440 | ) | |||||
Purchase of property and equipment |
(6,794 | ) | (7,690 | ) | (8,064 | ) | |||||
Purchases of new accounts |
(1,048 | ) | (1,250 | ) | (952 | ) | |||||
Reduction of restricted cash |
72 | 575 | 257 | ||||||||
Proceeds from disposition of assets and other |
519 | 377 | 5,751 | ||||||||
Net cash acquired in merger with IASG |
— | — | 2,921 | ||||||||
Net cash used in investing activities |
(31,792 | ) | (48,357 | ) | (34,670 | ) | |||||
Cash flows from financing activities: |
|||||||||||
Payments on long-term debt and capital leases |
(354,951 | ) | (121,733 | ) | (4,790 | ) | |||||
Proceeds from borrowings |
272,440 | 110,340 | — | ||||||||
Debt and stock issue costs |
(3,909 | ) | (2,020 | ) | (1,805 | ) | |||||
Net cash used in financing activities |
(86,420 | ) | (13,413 | ) | (6,595 | ) | |||||
Net (decrease) increase in cash and cash equivalents |
(12,815 | ) | (2,116 | ) | 16,399 | ||||||
Cash and cash equivalents: |
|||||||||||
Beginning of period |
38,883 | 40,999 | 24,600 | ||||||||
End of period |
$ | 26,068 | $ | 38,883 | $ | 40,999 | |||||
Cash paid for interest |
$ | 47,012 | $ | 46,986 | $ | 47,087 | |||||
Cash paid for taxes |
$ | 658 | $ | 763 | $ | 590 | |||||
Non-cash investing and financing activity: |
|||||||||||
Vehicle additions under capital leases |
$ | 389 | $ | 2,121 | $ | 3,843 | |||||
The accompanying notes are an integral part of these consolidated financial statements.
55
PROTECTION ONE, INC. AND SUBSIDIARIES
CONSOLIDATED STATEMENTS OF STOCKHOLDERS' EQUITY (DEFICIENCY IN ASSETS)
(Dollar amounts in thousands, except
for share amounts)
| |
|
|
|
|
|
Total Stockholders' Equity (Deficiency in Assets) |
|||||||||||||
|---|---|---|---|---|---|---|---|---|---|---|---|---|---|---|---|---|---|---|---|
| |
Common Stock | |
|
Accumulated Other Comprehensive Loss |
|||||||||||||||
| |
Additional Paid-In Capital |
|
|||||||||||||||||
| |
Shares | Amount | Deficit | ||||||||||||||||
December 31, 2006 |
18,239,953 | $ | 182 | $ | 89,545 | $ | (169,352 | ) | $ | (318 | ) | $ | (79,943 | ) | |||||
Equity issued in Merger |
7,066,960 | 71 | 88,479 | — | — | 88,550 | |||||||||||||
Stock compensation expense |
— | — | 1,469 | — | — | 1,469 | |||||||||||||
Stock issue costs |
— | — | (141 | ) | — | — | (141 | ) | |||||||||||
Net change in fair value of derivatives |
— | — | — | — | (212 | ) | (212 | ) | |||||||||||
Net loss |
— | — | — | (32,240 | ) | — | (32,240 | ) | |||||||||||
December 31, 2007 |
25,306,913 | $ | 253 | $ | 179,352 | $ | (201,592 | ) | $ | (530 | ) | $ | (22,517 | ) | |||||
Vesting of restricted stock units |
9,616 | — | — | — | — | — | |||||||||||||
Stock compensation expense |
— | — | 1,448 | — | — | 1,448 | |||||||||||||
Net change in fair value of derivatives |
— | — | — | — | (8,639 | ) | (8,639 | ) | |||||||||||
Net loss |
— | — | — | (50,542 | ) | — | (50,542 | ) | |||||||||||
December 31, 2008 |
25,316,529 | $ | 253 | $ | 180,800 | $ | (252,134 | ) | $ | (9,169 | ) | $ | (80,250 | ) | |||||
Vesting of restricted stock units |
16,842 | — | — | — | — | — | |||||||||||||
Stock compensation expense |
— | — | 496 | — | — | 496 | |||||||||||||
Net change in fair value of derivatives |
— | — | — | — | 3,184 | 3,184 | |||||||||||||
Net income |
— | — | — | 17,507 | — | 17,507 | |||||||||||||
December 31, 2009 |
25,333,371 | $ | 253 | $ | 181,296 | $ | (234,627 | ) | $ | (5,985 | ) | $ | (59,063 | ) | |||||
The accompanying notes are an integral part of these consolidated financial statements.
56
PROTECTION ONE, INC. AND SUBSIDIARIES
NOTES TO CONSOLIDATED FINANCIAL STATEMENTS
1. The Company:
Protection One, Inc. (the "Company") is principally engaged in the business of providing security alarm monitoring services, including sales, installation and related servicing of security alarm systems for residential and business customers. The Company also provides monitoring and support services to independent security alarm dealers on a wholesale basis. Affiliates of Quadrangle Group LLC and Monarch Alternative Capital LP (collectively, the "Principal Stockholders") own approximately 70% of the Company's common stock.
On November 17, 2009, the Company amended its senior credit agreement (as amended, the "Senior Credit Agreement") which (i) increased term loan borrowings by $75 million (the "New Term Loans") to an aggregate of $364.5 million, (ii) divided all term loans into a tranche equal to $86.5 million (the "Non-Extending Term Loans") and a tranche equal to $278.0 million (the "New and Extending Term Loans") and (iii) replaced its $25 million revolving credit facility with a $15 million revolving credit facility. The proceeds from the New Term Loans under the Senior Credit Agreement, together with excess cash, were deposited with the trustee under the indenture governing Protection One Alarm Monitoring, Inc's ("POAMI") 12% Senior Secured Notes due 2011 (the "Senior Secured Notes") in order to redeem the Senior Secured Notes in full. The Senior Secured Notes were called for redemption effective December 17, 2009 and the obligations of POAMI, Protection One and other guarantors under the indenture were satisfied and discharged.
On December 30, 2009, the Company entered into a Final Settlement Agreement with Westar Energy, Inc. and its wholly owned subsidiary, Westar Industries, Inc. (together, "Westar"), its former owner, to settle all claims between Westar and the Company related to certain agreements entered into in connection with Westar's sale of the Company to POI Acquisition I, Inc. in February 2004. Pursuant to the Final Settlement Agreement, the Company received $22.75 million from Westar on December 31, 2009.
The Company prepares its financial statements in conformity with accounting principles generally accepted in the United States of America ("GAAP"), which require management to make estimates and assumptions that affect the reported amounts of assets and liabilities and disclosures of contingent assets and liabilities at the date of the financial statements and the reported amounts of revenue and expenses during the reporting period. Actual results could differ from those estimates. The accompanying consolidated financial statements include the accounts of Protection One's wholly owned subsidiaries. Inter-company balances have been eliminated in consolidation.
2. Summary of Significant Accounting Policies:
(a) Revenue Recognition
Revenue is recognized when security services are provided. System installation revenue, sales revenue on equipment upgrades and direct and incremental costs of installations and sales are deferred for residential Retail customers with monitoring service contracts. For commercial Retail customers and national account customers, revenue recognition is dependent upon each specific customer contract. In instances when the Company passes title to a system, the Company recognizes the associated revenue and costs related to the sale of the equipment in the period that title passes regardless of whether the sale is accompanied by a service agreement. In cases where the Company retains title to the system, the Company defers and amortizes revenue and direct costs.
The Company defers certain system sales and installation revenue and expenses, primarily equipment, direct labor and direct and incremental sales commissions incurred. Deferred system and upgrade installation revenue are recognized over the estimated life of the customer utilizing an
57
accelerated method for our Retail and Multifamily customers. The Company amortizes deferred revenue from customer acquisitions related to its Retail customers over a fifteen-year period on an accelerated basis. The associated deferred customer acquisition costs are amortized, annually and in total, over a fifteen-year period on an accelerated basis in amounts that are equal to the amount of revenue amortized, annually and in total, over the fifteen-year period. The deferred customer acquisition costs in excess of the deferred customer acquisition revenues are amortized over the initial term of the contract on a straight-line basis.
The Company amortizes deferred customer acquisition costs and revenue related to its Retail customers using an accelerated basis because it believes this method best approximates the results that would be obtained if the Company accounted for these deferred costs and revenue on a specific contract basis utilizing a straight-line amortization method with write-off upon customer termination. The Company does not track deferred customer acquisition costs and revenue on a contract by contract basis in its Retail segment, and as a result, is not able to write-off the remaining balance of a specific contract when the customer relationship terminates. Deferred customer acquisition costs and revenue are accounted for using pools, with separate pools based on the month and year of acquisition.
The Company periodically performs a lifing study with the assistance of a third-party appraisal firm to estimate the average expected life and attrition pattern of its customers. The lifing study is based on historical customer terminations. The results of the lifing studies indicate that the Company's customer pools can expect a declining revenue stream. The Company evaluates the differing rates of declining revenue streams for each customer pool and selects an amortization rate that closely matches the respective decline curves. Such analysis is used to establish the amortization rates of the Company's customer account pools in order to reflect the pattern of future benefit.
Given that the amortization lives and methods are developed using historical attrition patterns and consider actual customer termination experience, the Company believes such amortization lives and methods approximate the results of amortizing on a specific contract basis with write-off upon termination.
For its Multifamily segment, the Company tracks the deferred revenues on a contract by contract basis and amortizes deferred customer acquisition revenue and an equal amount of associated deferred customer acquisition costs over a fifteen-year period on an accelerated basis. The deferred customer acquisition costs in excess of the deferred customer acquisition revenues are amortized over the initial term of the contract. The Company writes off the unamortized portion of the Multifamily deferred customer acquisition revenues and costs when the customer relationship terminates.
The Company follows Accounting Standards Codification ("ASC") 840, Leases, for its arrangements whereby security equipment that does not require monitoring is leased to customers, typically over a five year initial lease term. This equipment typically consists of closed circuit television equipment and card access control equipment. The Company records these arrangements as operating leases and records revenue on a straight line basis over the life of the lease.
Deferred revenue also results from customers who are billed for monitoring and extended service protection in advance of the period in which such services are provided, on a monthly, quarterly or annual basis. Revenue from monitoring activities are recognized in the period such services are provided.
(b) Inventories
Inventories, primarily comprised of alarm systems and parts, are stated at the lower of average cost or market. Inventory is shown net of an obsolescence reserve of $0.7 million and $0.6 million at December 31, 2009 and 2008, respectively. This reserve is determined based primarily upon current usage of the individual parts included in inventory.
58
(c) Property and Equipment
Property and equipment are stated at cost and are depreciated using the straight-line method over estimated useful lives. Gains or losses from retirements and dispositions of property and equipment are recognized in operations in the period realized. Repair and maintenance costs are expensed as incurred. The Company performs impairment tests for long-lived assets when the Company determines that indicators of impairment are present.
Estimated useful lives of property and equipment are as follows:
Furniture and fixtures |
4-7 years | |
Data processing and telecommunication equipment and software |
1-5 years | |
Rental equipment |
generally 7 years | |
Leasehold improvements |
lesser of lease term or useful life; generally 5-10 years | |
Vehicles |
2-5 years | |
Buildings |
19-40 years |
(d) Income Taxes
The Company recognizes a liability or asset for the deferred tax consequences of temporary differences between the tax basis of assets and liabilities and their reported amounts in the financial statements. These temporary differences will result in taxable or deductible amounts in future years when reported amounts of the assets or liabilities are recovered or settled. The deferred tax assets are periodically reviewed for recoverability and a valuation allowance is recorded to reduce the deferred tax assets to an amount that is more likely than not realizable.
(e) Comprehensive Income (Loss)
Comprehensive income (loss) comprises net income (loss) and other comprehensive income (loss). Other comprehensive income (loss) includes the unrealized gains and losses associated with cash flow hedging instruments.
(f) Customer Accounts and Dealer Relationships
Additions to customer accounts and dealer relationships are stated at cost and are amortized over the estimated customer and dealer life, respectively. Internal costs incurred in support of acquiring customer accounts and dealer relationships are expensed as incurred.
The choice of an amortization life and method is based on estimates and judgments about the amounts and timing of expected future revenue from customer accounts and average customer account life. Amortization methods and amortization periods were determined because, in management's opinion, they would adequately match amortization cost with anticipated revenue. The Company evaluates the appropriateness of the amortization life and method of each of the customer account pools based on the actual historical attrition experience of each pool and, when deemed necessary, performs a lifing study on its customer accounts to assist in determining appropriate lives of customer accounts. These analyses are needed in light of the inherent declining revenue curve over the life of a pool of customer accounts. The Company has identified two distinct pools of customer accounts in the Retail segment and one customer pool in each of the Wholesale and Multifamily segments, as shown in the table below, each of which has distinct attributes that affect differing attrition characteristics. The Company believes it is appropriate to segregate the acquired Integrated Alarm Services Group, Inc. ("IASG") customer accounts into a separate pool as the historical attrition since the merger with IASG on April 2, 2007 (the "Merger") has been significantly higher than the attrition for existing customers.
59
The results of lifing studies indicated that the Company can expect attrition to be greatest in the initial years of asset life and that a declining balance (accelerated) method therefore best matches the future amortization cost with the estimated revenue stream from these customer pools. The Company switches from the declining balance method to the straight-line method in the year the straight-line method results in greater amortization expense. The amortization rates consider the average estimated remaining and historical projected attrition rates. The Company completed a lifing study during the fourth quarter of 2008, the results of which are discussed in the following paragraphs.
Effective as of the beginning of the fourth quarter of 2008, the Company changed the estimated useful life used to account for Retail customer accounts from an accelerated method with a useful life of ten years to a more accelerated method with a useful life of fifteen years. The change in estimated useful life for Retail customer accounts results from management's ongoing analysis of all pertinent factors, including actual historical customer attrition data, demand and competition. In accordance with ASC 250, Accounting Changes and Error Corrections, the change in estimated useful life is accounted for prospectively. The change is based on information obtained by continued observation of the pattern of expected benefits derived from these assets. The effects of the change in estimated useful life described above decreased depreciation and amortization expense by $6.7 million and $1.0 million for the years ended December 31, 2009 and 2008, respectively. Basic and diluted income per share was increased by $0.26 for the year ended December 31, 2009 as a result of the change. Basic and diluted loss per share was decreased by $0.04 for the year ended December 31, 2008 as a result of the change.
Effective as of the beginning of the fourth quarter of 2008, the Company also changed the method and estimated useful life used to account for Multifamily customer accounts from the straight-line method with a useful life of nine years to an accelerated method with a useful life of fifteen years. In accordance with ASC 250, the change in method and estimated useful life represents a change in accounting estimates effected by a change in accounting principle and is accounted for prospectively. The change is based on information obtained by continued observation of the pattern of expected benefits derived from these assets and is preferable, as it results in amortization that is more reflective of the pattern of expected benefits to be derived from these assets. The effects of the change in estimated useful life described above decreased depreciation and amortization expense by $2.6 million and $0.5 million for the years ended December 31, 2009 and 2008, respectively. Basic and diluted income per share was increased by $0.10 for the year ended December 31, 2009 as a result of the change. Basic and diluted loss per share was decreased by $0.02 for the year ended December 31, 2008 as a result of the change.
Effective as of the beginning of the fourth quarter of 2008, the Company also changed the estimated useful life used to account for Wholesale dealer relationships from an accelerated method with a useful life of fifteen years to a more accelerated method with a useful life of twenty years. In accordance with ASC 250, the change in estimated useful life is accounted for prospectively. The effects of the change described above decreased depreciation and amortization expense by $1.3 million and $0.4 million for the years ended December 31, 2009 and 2008, respectively. Basic and diluted income per share was increased by $0.05 for the year ended December 31, 2009 and basic and diluted loss per share was decreased by $0.01 for the year ended December 31, 2008 as a result of the change.
60
The amortization rates consider the average estimated remaining life and historical and projected attrition rates. The amortization method for each pool is as follows:
| Pool | Method | |
|---|---|---|
| Prior to October 1, 2008 | ||
| Customer Accounts: | ||
| Retail-Protection One | Ten-year 135% declining balance | |
| Retail-IASG | Nine-year 150% declining balance | |
| Multifamily | Nine-year straight-line | |
Dealer Relationships: |
||
| Wholesale | Fifteen year 150% declining balance | |
October 1, 2008 and after |
||
Customer Accounts: |
||
| Retail-Protection One | Fifteen-year double declining balance | |
| Retail-IASG | Nine-year 150% declining balance | |
| Multifamily | Fifteen-year 180% declining balance | |
Dealer Relationships: |
||
| Wholesale | Twenty-year 140% declining balance |
The Company is required to perform impairment tests for long-lived assets when the Company determines that indicators of impairment are present. Declines in market value of its business or the value of its customer accounts that may have incurred may also require additional impairment charges. No impairment charges were recorded for customer accounts or dealer relationships in the periods presented herein.
(g) Goodwill and Other Indefinite-Lived Intangible Assets
Goodwill is recorded in the Retail, Wholesale and Multifamily operating segments, which are also the Company's reporting units for purposes of evaluating its recorded goodwill for impairment. Goodwill was $43.9 million and $41.6 million as of December 31, 2009 and 2008, respectively. The principal indefinite-lived intangible assets are trade names, which had a book value of $27.7 million as of December 31, 2009 and 2008. The Company performs its annual impairment testing during the third quarter of each year and also monitors for events or circumstances that may indicate potential impairment of goodwill and indefinite-lived intangible assets each reporting period.
Goodwill originated with the adoption of push down accounting and the related adjustments during 2005, which was associated with the acquisition of the Company by a new controlling shareholder group. Additional goodwill was recorded in connection with the Merger during 2007. The Company determined the fair value of each reporting unit acquired in the Merger and then allocated goodwill to each reporting unit based on the amount of excess fair value determined after assigning values to the individual assets acquired and liabilities assumed related to each reporting unit.
The Company evaluates goodwill for impairment annually as of the beginning of the third quarter and any time an event occurs or circumstances change that would more likely than not reduce the fair value of a reporting unit below its carrying value in accordance with ASC 350, Intangibles—Goodwill and Other.
The goodwill impairment test involves a two-step process. The first step is a comparison of each reporting unit's fair value to its carrying value. If the carrying value of a reporting unit exceeds its fair value, goodwill is considered potentially impaired and the Company must complete the second step of the goodwill impairment test. The amount of impairment is determined by comparing the implied fair value of reporting unit goodwill to the carrying value of the goodwill in the same manner as if the
61
reporting unit was being acquired in a business combination. Specifically, the Company would allocate the fair value to all of the assets and liabilities of the reporting unit, including internally developed intangible assets with a zero carrying value, in a hypothetical analysis that would calculate the implied fair value of goodwill. If the implied fair value of goodwill is less than the recorded goodwill, the Company would recognize an impairment charge for the difference.
Fair value of the reporting units is determined using a combined income and market approach. The income approach uses a reporting unit's projection of estimated cash flows discounted using a weighted-average cost of capital analysis that reflects current market conditions. The market approach may involve use of the guideline transaction method, the guideline company method, or both. The guideline transaction method makes use of available transaction price data of companies engaged in the same or a similar line of business as the respective reporting unit. The guideline company method uses market multiples of publicly traded companies with operating characteristics similar to the respective reporting unit. The Company considers value indications from both the income approach and market approach in estimating the fair value of each reporting unit. The Company also performs a sensitivity analysis on the estimated fair value using the income and market approach.
The income approach was given significant weight for all three reporting units because the Company's management considers this method a reasonable indicator of fair value. The market transaction method was also given significant weight for all three reporting units because transactions in the industry are commonly valued as a multiple of Recurring Monthly Revenue ("RMR"). Based on management's experience along with a review of recent industry transactions, management concluded the weighting of the market transaction method was appropriate. The market guideline company method was given a small weight for Retail because, although the guideline companies are generally comparable, they are not similar enough to warrant a significant weight in estimating fair value. The market guideline company method was given no weight for the Wholesale and Multifamily reporting units because management determined that there were no sufficiently comparable companies or there was a lack of market data for businesses engaged in these specialized monitored security operations.
Management judgment is a significant factor in determining whether an indicator of impairment has occurred. Management relies on estimates in determining the fair value of each reporting unit, which include the following critical quantitative factors:
Anticipated future cash flows and terminal value for each reporting unit. The income approach to determining fair value relies on the timing and estimates of future cash flows, including an estimate of terminal value. The projections use management's estimates of economic and market conditions over the projected period including growth rates in revenue, customer attrition and estimates of expected changes in operating margins. Projections of future cash flows are subject to change as actual results are achieved that differ from those anticipated. Because the Company's management frequently updates its projections, the Company would expect to identify on a timely basis any significant differences between actual results and recent estimates. The Company is not expecting actual results to vary significantly from estimates.
Selection of an appropriate discount rate. The income approach requires the selection of an appropriate discount rate, which is based on a weighted average cost of capital analysis. The discount rate is affected by changes in short-term interest rates and long-term yield as well as variances in the typical capital structure of marketplace participants. The discount rate is determined based on assumptions that would be used by marketplace participants, and for that reason, the capital structure of selected market place participants was used in the weighted average cost of capital analysis. Given the current economic conditions, it is possible that the discount rate could change.
62
Identification of comparable transactions within the industry. The market approach relies on a calculation that uses a multiple of RMR based on actual transactions involving industry participants. RMR multiples are a commonly used valuation metric in the security monitoring industry. The market approach estimates fair value by applying RMR multiples to the reporting unit's RMR balance as of the testing date. Although RMR multiples are subject to change, there has not been a noticeable deterioration in transaction values compared to prior years.
(h) Impairment of Long-Lived Assets
Long-lived assets include property and equipment, customer accounts, dealer relationships, deferred customer acquisition costs and other amortizable intangible assets. The Company reviews long-lived assets for impairment in accordance with the guidance in ASC 360, Property, Plant, and Equipment. Recoverability of long-lived assets is measured by a comparison of the carrying value to the future undiscounted cash flows expected to be generated by the assets. If management determines an impairment exists, the amount of impairment recognized is the amount by which the carrying value exceeds fair value. Projections of future cash flows are subject to change as a result of actual results differing from expectation as well as higher than expected levels of customer attrition. Though the Company is not expecting actual results to vary significantly from projections, long-lived assets are reviewed for impairment when events or changes in circumstances indicate the carrying value may not be recoverable.
(i) Cash and Cash Equivalents
All highly liquid investments purchased with a remaining maturity of three months or less at the date acquired are cash equivalents. These investments, typically consisting of money market funds and 30-day, 60-day or 90-day commercial paper or certificates of deposit, are stated at cost, which approximates market. At December 31, 2009 and 2008, all investments were in treasury only money market funds.
(j) Restricted Cash
Restricted cash on the accompanying balance sheet represents a trust account established as collateral for the benefit of the former insurer of the Company's workers' compensation claims and collateral for the Company's surety bonding and credit card requirements. The workers' compensation collateral is required to support reserves established on claims filed during the period covered by the former insurer. The Company receives interest income earned by the trust. The surety bond collateral is required by the Company's casualty and surety insurance carrier and is deposited in an interest bearing money market account. The credit card collateral is required by the issuer of the credit cards used by company employees and is in the form of an interest bearing certificate of deposit.
(k) Accounts Receivable
Gross receivables, which consist primarily of trade accounts receivable, of $39.8 million at December 31, 2009 and $45.5 million at December 31, 2008 have been reduced by allowances for doubtful accounts of $7.1 million and $6.2 million, respectively.
The Company's policy for Retail is to establish a reserve for a percentage of a customer's total receivable balance when any portion of that receivable balance is greater than 30 days past due. This percentage, which is based on the Company's historical collections experience, is increased as any portion of the receivable ages until it is fully reserved and written off when it is 120 days past due, or when the account is disconnected and turned over to a collection agency. Additionally, once the customer's balance is greater than 120 days past due, all other receivable balances associated with that customer, irrespective of how many days past due, are deemed to be 120 days past due and fully
63
reserved. In certain instances, based upon the discretion of management, credit can be extended and the account may remain active. The Company's policy for Wholesale's reserve also includes a specific identification approach in assessing the collectability of balances with large dealer accounts. The Company's policy for Multifamily's reserve is based on the specific identification approach.
(l) Notes Receivable
Notes receivable on the balance sheet represent loans to dealers collateralized by the dealers' portfolios of customer monitoring contracts, which are carried at the lower of the principal amount outstanding or the net realizable value. Management periodically evaluates the loan portfolio to assess the collectability of dealer notes and adequacy of the allowance for loan losses, including past loan loss experience, known and inherent risks in the portfolio, adverse situations that may affect the borrower's ability to repay, the estimated value of any underlying collateral and current economic conditions. Loans are generally considered non-performing if they are 120 days in arrears of contractual terms. The Company had no non-performing loans at December 31, 2009 and had $0.1 million in non-performing loans at December 31, 2008. Interest income is not accrued on non-performing loans. The Company had outstanding notes receivable of $2.9 million and $4.2 million at December 31, 2009 and 2008, respectively. The short-term portion of notes receivable is calculated in accordance with the terms of the agreements. As part of the Merger, the Company assumed obligations to provide open lines of credit to dealers, subject to the terms of the agreements with the dealers. At December 31, 2009 and 2008, the amount available to dealers under these lines of credit was $0.2 million and $0.5 million, respectively. Interest income from dealer loans is recorded in installation and other revenue.
For most of the dealers in their loan program, the Company bills the dealers' customers and collects funds from those customers. Cash collected in excess of fees and loan payments is then remitted to the dealer.
(m) Advertising Costs
Printed materials are expensed as incurred. Broadcast advertising costs are expensed upon the first broadcast of the respective advertisement. Total advertising expense was $3.1 million, $4.7 million and $3.5 million for the years ended December 31, 2009, 2008 and 2007, respectively.
(n) Derivative Financial Instruments
The Company utilizes derivatives to manage interest rate risk associated with its variable rate borrowings. All derivatives are recognized on the balance sheet at their fair value. Changes in the fair value of a derivative that is highly effective and that is designated and qualifies as a cash flow hedge, to the extent that the hedge is effective, are recorded in other comprehensive income (loss), until earnings are affected by the variability of cash flows of the hedged transaction (i.e., until periodic settlements of a variable-rate asset or liability are recorded in earnings). Changes in the fair value of a derivative that is considered an economic derivative are recorded to interest expense. For cash flow hedges, any hedge ineffectiveness (the amount by which the changes in fair value of the derivative exceeds the variability in cash flows of the forecasted transaction) is recorded in current-period earnings as other income or expense.
64
The Company documents all relationships between hedging instruments and hedged items, as well as its risk-management objectives and strategies for undertaking various hedge transactions. This process includes linking all derivatives that are designated as cash flow hedges to specific forecasted transactions (e.g., interest payments). On a quarterly basis the Company assesses counterparty credit risk, whether the derivatives that are used in hedging transactions have been highly effective in offsetting changes in the cash flows of hedged items, and whether those derivatives may be expected to remain highly effective in future periods. The Company uses the dollar offset method to perform the analysis and measure any ineffectiveness. The Company discontinues hedge accounting prospectively when (1) it determines that the derivative is no longer effective in offsetting changes in the cash flows of the hedged item; (2) the derivative expires or is sold, terminated or exercised; (3) it is no longer probable that the forecasted transaction will occur; or (4) management determines that designating the derivative as a hedging instrument is no longer appropriate or desired.
When the Company discontinues hedge accounting, the existing gain or loss on the derivative on the date of de-designation remains in accumulated other comprehensive income (loss) and is reclassified into earnings as the forecasted transaction affects earnings (interest payments). However, if it is probable that a forecasted transaction will not occur by the end of the originally specified time period or within an additional two-month period of time thereafter, the gains and losses that were accumulated in other comprehensive income (loss) will be recognized immediately in earnings. In all situations in which hedge accounting is discontinued and the derivative remains outstanding, the Company will carry the derivative at its fair value on the balance sheet, recognizing changes in the fair value in current-period earnings.
(o) Concentrations of Credit Risk
Financial instruments which potentially subject the Company to concentrations of credit risk consist principally of trade receivables from a large number of customers, including both residential and commercial Retail customers as well as Wholesale dealers, dispersed across a wide geographic base. The Company extends credit to its customers in the normal course of business, performs periodic credit evaluations and maintains allowances for the potential credit losses. The Company has customers and dealers located throughout the United States with almost 44% of its recurring monthly revenue derived from customers located in California, Florida and Texas. A major earthquake, hurricane or other environmental disaster in an area of high account concentration could disrupt the Company's ability to serve those customers or render those customers uninterested in continuing alarm monitoring services. The Company's top 10 wholesale dealers, based on RMR, accounted for 28.7% of wholesale monitored sites and 13.0% of Wholesale RMR as of December 31, 2009. No single Retail customer comprises more than 1% of total consolidated revenue
(p) Stock Based Compensation
The Company accounts for stock based compensation using the provisions of ASC 718, Compensation—Stock , which require the measurement and recognition of compensation expense for all share-based payment awards to employees and directors based on estimated fair values. The Company values its stock options using the Black-Scholes model to determine fair value.
(q) Earnings (Loss) Per Share
Earnings (loss) per share are presented in accordance ASC 260, Earnings Per Share. Weighted average shares outstanding were as follows:
| |
December 31, | |||||||||
|---|---|---|---|---|---|---|---|---|---|---|
| |
2009 | 2008 | 2007 | |||||||
Weighted average shares outstanding |
25,324,440 | 25,310,364 | 23,525,652 | |||||||
65
For the year ended December 31, 2009, the Company had no outstanding stock options or other awards that represented dilutive potential common shares. For the years ended December 31, 2008 and 2007, the Company had outstanding stock options that represented 0.3 million and 0.8 million dilutive potential common shares, respectively. These securities were not included in the computation of diluted earnings per share for the years ending December 31, 2008 and 2007 since to do so would have been anti-dilutive for those periods. The Company has concluded that the impact of the two class method on its basic earnings per share is not material.
(r) Fair Value Measurements
The Company applies ASC 820, Fair Value Measurements and Disclosures, to determine fair value whenever other accounting pronouncements require or permit assets or liabilities to be measured at fair value. ASC 820 establishes a fair value hierarchy that prioritizes the information used to develop assumptions used to determine the exit price. ASC 820 also establishes valuation techniques that are used to measure fair value. To increase consistency and comparability in fair value measurements and related disclosures, the fair value hierarchy prioritizes the inputs to valuation techniques used to measure fair value into three broad levels:
Level 1—quoted
prices in active markets for identical assets or liabilities;
Level 2—directly or indirectly observable inputs other than quoted prices; and
Level 3—unobservable inputs.
ASC 820 establishes a hierarchy which requires an entity to maximize the use of quoted market prices and minimize the use of unobservable inputs. An asset or liability's level is based on the lowest level of input that is significant to the fair value measurement.
The following table sets forth the Company's financial assets and liabilities that were measured at fair value on a recurring basis by level within the fair value hierarchy at December 31, for the years identified (in thousands):
| |
Fair Value Measurements | |||||||||||||
|---|---|---|---|---|---|---|---|---|---|---|---|---|---|---|
| |
Level 1 | Level 2 | Level 3 | Total | ||||||||||
Assets: |
||||||||||||||
Money Market Fund |
||||||||||||||
2009 |
$ | 25,492 | $ | — | $ | — | $ | 25,492 | ||||||
2008 |
$ | 40,616 | $ | — | $ | — | $ | 40,616 | ||||||
Liabilities: |
||||||||||||||
Derivatives |
||||||||||||||
2009 |
$ | — | $ | (5,719 | ) | $ | — | $ | (5,719 | ) | ||||
2008 |
$ | — | $ | (8,867 | ) | $ | — | $ | (8,867 | ) | ||||
Marketable securities are included within cash and cash equivalents in the consolidated balance sheets, which generally consist of money market funds with original maturities less than 90 days and were measured using a level 1 fair value measurement with carrying value equal to fair value. Derivatives consist of interest rate swap agreements and are valued using observable benchmark rates at commonly quoted intervals for the life of the instruments.
(s) New Accounting Standards
In November 2009, the Financial Accounting Standards Board (the "FASB") issued Accounting Standards Update ("ASU") 2009-13 and ASU 2009-14 on revenue arrangements with multiple deliverables and software revenue recognition. ASU 2009-13 addresses the unit of accounting for arrangements involving multiple deliverables. The guidance revises the determination of when the
66
individual deliverables included in a multiple-element arrangement may be treated as separate units of accounting. The guidance also revises the manner in which the transaction consideration is allocated across the separately identified deliverables. ASU 2009-14 addresses revenue arrangements that contain both hardware elements and software elements. ASU 2009-13 and ASU 2009-14 are effective for fiscal years beginning on or after June 15, 2010. The Company is currently evaluating the impact, if any, adoption of ASU 2009-13 and ASU 2009-14 will have on its consolidated financial statements.
In August 2009, the FASB issued ASU 2009-05 to provide guidance on measuring the fair value of liabilities. The Company adopted ASU 2009-05 during the third quarter of 2009 and adoption did not have a material impact on its consolidated financial statements.
In June 2009, the FASB issued guidance related to the FASB Accounting Standards Codification (the "Codification"), as the single source of authoritative accounting and reporting standards in the United States applicable for all non-governmental entities, with the exception of the SEC and its staff. The Codification, which changes the referencing of financial standards, is effective for interim or annual financial periods ending after September 15, 2009. All references made to US GAAP will use the new Codification numbering system prescribed by the FASB. The Codification is not intended to change or alter existing US GAAP. The Company adopted the Codification during the third quarter of 2009 and adoption did not have any impact on its consolidated financial statements.
In June 2008, the FASB issued guidance relating to participating securities, codified as ASC 260-10-45-60, Determining Whether Instruments Granted in Share-Based Payment Transactions are Participating Securities. ASC 260-10-45-60 requires that all outstanding unvested share-based payment awards that contain rights to non-forfeitable dividends participate in undistributed earnings with common shareholders. The Company adopted the provisions of ASC 260-10-45-60 as of January 1, 2009 and adoption did not have a material impact on its consolidated financial statements.
In March 2008, the FASB issued guidance relating to derivative disclosures, codified as ASC 815-10-50, Disclosures about Derivative Instruments and Hedging Activities. ASC 815-10-50 requires enhanced disclosures about how and why an entity uses derivative instruments, how derivative instruments and related hedged items are accounted for, and how derivative instruments and related hedged items affect an entity's financial position, results of operations and cash flows. The Company adopted the provisions of ASC 815-10-50 as of January 1, 2009 and adoption did not have a material impact on its consolidated financial statements.
During February 2008, the FASB issued guidance relating to nonrecurring fair value measurements in ASC 820, which delays the effective date for all nonrecurring fair value measurements of nonfinancial assets and liabilities until fiscal years beginning after November 15, 2008. Based on this guidance, the Company adopted the additional provisions of ASC 820 as they relate to long-lived assets, including goodwill and intangibles, effective January 1, 2009. The adoption of these provisions did not have a material impact on its consolidated financial statements.
In December 2007, the FASB issued guidance relating to non-controlling interests in ASC 810, Non-controlling Interests in Consolidated Financial Statements. ASC 810 establishes accounting and reporting standards that require non-controlling interests in a subsidiary to be reported as a component of equity, changes in a parent's ownership interest while the parent retains its controlling interest to be accounted for as equity transactions, and any retained non-controlling equity investment upon the deconsolidation of a subsidiary to be initially measured at fair value. ASC 810 also establishes reporting requirements that clearly identify and distinguish between the interests of the parent and the interests of the non-controlling owners. The Company adopted the additional provisions of ASC 810 as of January 1, 2009 and adoption did not have a material impact on its consolidated financial statements.
67
3. Property and Equipment:
The following reflects the Company's carrying value in property and equipment as of the following dates (in thousands):
| |
December 31, | ||||||
|---|---|---|---|---|---|---|---|
| |
2009 | 2008 | |||||
Furniture, fixtures and equipment |
$ | 7,463 | $ | 7,061 | |||
Data processing and telecommunication |
43,889 | 39,002 | |||||
Leasehold improvements |
8,123 | 7,544 | |||||
Vehicles |
6,122 | 6,427 | |||||
Vehicles under capital leases |
9,529 | 9,572 | |||||
Buildings and other |
6,403 | 6,320 | |||||
Rental equipment |
14,233 | 13,318 | |||||
|
95,762 | 89,244 | |||||
Less accumulated depreciation |
(63,694 | ) | (53,076 | ) | |||
Property and equipment, net |
$ | 32,068 | $ | 36,168 | |||
Depreciation expense was $12.5 million, $12.6 million and $11.0 million for the years ended December 31, 2009, 2008 and 2007, respectively.
The amount of fixed asset additions included in accounts payable as of December 31, 2009 and 2008 was $0.3 million and $0.7 million, respectively.
Fixed Assets under Operating Leases
Rental equipment is comprised of commercial security equipment that does not require monitoring services by the Company and is leased to customers, typically over a 5-year initial lease term. Accumulated depreciation of approximately $4.4 million and $2.6 million was recorded on these assets as of December 31, 2009 and 2008, respectively. Deferred revenue of $5.8 million was recorded at December 31, 2009 and will be amortized to income over the remaining lease term. The following is a schedule by year of minimum future rental receipts on non-cancelable operating leases as of December 31, 2009 and does not include payments received at the inception of the lease (in thousands):
2010 |
$ | 1,219 | ||
2011 |
939 | |||
2012 |
692 | |||
2013 |
390 | |||
2014 |
109 | |||
Total minimum future rentals |
$ | 3,349 | ||
4. Goodwill and Intangible Assets:
The Company completed its annual impairment testing during the third quarter of 2009 and determined that goodwill was not impaired. The Company also monitors for events or circumstances that may indicate potential impairment of goodwill and intangible assets each reporting period. There were no such events or circumstances identified during 2009.
68
A roll-forward of the Company's goodwill and unamortizable intangible assets is presented by segment and in total in the following table (in thousands):
| |
Retail | Wholesale | Multifamily | Total Company |
|||||||||
|---|---|---|---|---|---|---|---|---|---|---|---|---|---|
Goodwill |
|||||||||||||
January 1, 2008 |
$ | 19,676 | $ | 17,198 | $ | 4,730 | $ | 41,604 | |||||
Additions |
— | — | — | — | |||||||||
Impairment |
— | — | — | — | |||||||||
December 31, 2008 |
19,676 | 17,198 | 4,730 | 41,604 | |||||||||
Additions(a) |
— | 1,120 | 1,129 | 2,249 | |||||||||
Impairment |
— | — | — | — | |||||||||
December 31, 2009 |
$ | 19,676 | $ | 18,318 | $ | 5,859 | $ | 43,853 | |||||
Trade Name |
|||||||||||||
January 1, 2008 |
$ | 22,987 | $ | 2,800 | $ | 2,825 | $ | 28,612 | |||||
Additions |
— | — | — | — | |||||||||
Impairment |
— | — | (925 | ) | (925 | ) | |||||||
December 31, 2008 |
22,987 | 2,800 | 1,900 | 27,687 | |||||||||
Additions |
— | — | — | — | |||||||||
Impairment |
— | — | — | — | |||||||||
December 31, 2009 |
$ | 22,987 | $ | 2,800 | $ | 1,900 | $ | 27,687 | |||||
- (a)
- Represents an out-of-period adjustment impacting the carrying value of goodwill. See Note 11, "Income Taxes," for additional information related to this adjustment.
The Company's amortizable intangible assets are presented in the following table (in thousands):
| |
Year Ended December 31, | ||||||
|---|---|---|---|---|---|---|---|
| |
2009 | 2008 | |||||
Customer Accounts |
|||||||
Gross carrying amount |
$ | 439,440 | $ | 439,033 | |||
Less: accumulated amortization |
(235,987 | ) | (201,315 | ) | |||
Carrying amount, end of period |
203,453 | 237,718 | |||||
Dealer Relationships |
|||||||
Gross carrying amount |
$ | 47,116 | $ | 47,116 | |||
Less: accumulated amortization |
(12,151 | ) | (9,519 | ) | |||
Carrying amount, end of period |
34,965 | 37,597 | |||||
Other Intangibles |
|||||||
Gross carrying amount |
$ | 26 | $ | 4,000 | |||
Less: accumulated amortization |
(7 | ) | (3,791 | ) | |||
Carrying amount, end of period |
$ | 19 | $ | 209 | |||
Amortization expense was $37.6 million, $51.7 million and $51.1 million for the years ended December 31, 2009, 2008 and 2007, respectively. The table below reflects the estimated aggregate
69
intangible amortization expense for each of the five succeeding fiscal years on the existing customer account and dealer relationship base as of December 31, 2009 (in thousands):
| |
2010 | 2011 | 2012 | 2013 | 2014 | |||||||||||
|---|---|---|---|---|---|---|---|---|---|---|---|---|---|---|---|---|
Estimated amortization expense |
$ | 32,203 | $ | 29,209 | $ | 27,818 | $ | 27,543 | $ | 27,543 | ||||||
5. Accrued Liabilities:
The following reflects the components of accrued liabilities as of the dates indicated (in thousands):
| |
December 31, | ||||||
|---|---|---|---|---|---|---|---|
| |
2009 | 2008 | |||||
Accrued interest |
$ | 4,912 | $ | 6,879 | |||
Accrued vacation pay |
4,594 | 4,821 | |||||
Accrued salaries, bonuses and employee benefits |
10,282 | 11,199 | |||||
Derivative liability |
5,719 | 5,562 | |||||
Other accrued liabilities |
9,126 | 10,561 | |||||
Total accrued liabilities |
$ | 34,633 | $ | 39,022 | |||
6. Debt and Capital Leases:
Long-term debt and capital leases are as follows (in thousands):
| |
December 31, | ||||||
|---|---|---|---|---|---|---|---|
| |
2009 | 2008 | |||||
New and Extending Term Loans under the Senior Credit Agreement, maturing March 31, 2014, variable at LIBOR + 4.25% |
$ | 277,305 | $ | — | |||
Non-Extending Term Loans under the Senior Credit Agreement, maturing March 31, 2012, variable at LIBOR + 2.25% |
56,359 | 291,750 | |||||
Unamortized discount on the New and Extending Term Loans under the Senior Credit Agreement |
(5,381 | ) | — | ||||
Senior Secured Notes, maturing November 2011, fixed 12.0%, face value |
— | 115,345 | |||||
Unamortized premium on Senior Secured Notes |
— | 6,713 | |||||
Unsecured Term Loan, maturing March 14, 2013, variable at Prime + 11. 5% |
110,340 | 110,340 | |||||
Capital leases |
3,285 | 5,140 | |||||
|
441,908 | 529,288 | |||||
Less current portion (including $2,013 and $2,361 in capital leases at December 31, 2009 and 2008, respectively) |
(5,358 | ) | (5,361 | ) | |||
Total long-term debt and capital leases |
$ | 436,550 | $ | 523,927 | |||
Senior Credit Agreement
On November 17, 2009, the Company amended its senior credit agreement which (i) increased term loan borrowings by $75 million under the New Term Loans to an aggregate of $364.5 million, (ii) divided all of its term loans into Non-Extending Term Loans equal to $86.5 million and New and Extending Term Loans equal to $278.0 million and (iii) replaced its $25 million revolving credit facility with a $15 million revolving credit facility.
The modification to the extending term loans of $203.0 million was considered a significant modification in accordance with ASC 470-50-40-10 and extinguishment accounting was therefore
70
applied to $203 million of the original term loans. The present value of the cash flows of the modified term loans was determined to be more than 10% greater than the present value of the cash flows of the original term loans primarily due to the increased interest rate on the modified debt which includes an increased interest rate margin of 2.0% and 2.0% LIBOR floor. The interest rate on these term loans prior to the modification was 2.48% while the interest rate after the amendment was 6.25%.
The New and Extending Term Loans were recorded as new debt at fair value which was determined to be at 98% of par. The fair value determination was based on the 2% discount on the issuance of the $75 million of New Term Loans which have the same terms and conditions as the $203.0 million of extending term loans. Consequently, a debt discount of $5.6 million was recorded on the $278.0 million of New and Extending Term Loans. The $203.0 million of original term loans were deemed to have been retired at the fair value of the modified term loans resulting in an extinguishment gain of $4.1 million which was partially offset by $0.6 million of fees paid directly to the lenders related to the amendment and $1.5 million of debt issue costs associated with the original debt for a net extinguishment gain of $2.0 million. The Company capitalized $3.9 million of debt issue costs associated with the amendment to the Senior Credit Agreement in 2009.
Under the Senior Credit Agreement, the New and Extending Term Loans are scheduled to mature on March 31, 2014, provided, however, that the New and Extending Term Loans will mature on December 14, 2012 if prior to December 14, 2012, the maturity date of the unsecured term loan facility maturing March 14, 2013 ("Unsecured Term Loan") is not extended to at least 91 days after March 31, 2014 or the borrowings under the Unsecured Term Loan Agreement are not refinanced with permitted refinancing indebtedness having a maturity date at least 91 days after March 31, 2014. The New and Extending Term Loans bear interest at a margin of 4.25% over the Eurodollar Base Rate (as defined in the Senior Credit Agreement and subject to a 2% floor) for Eurodollar borrowings and 3.25% over the Base Rate (as defined in the Senior Credit Agreement and subject to a 3% floor) for Base Rate borrowings. The Non-Extending Term Loans are still scheduled to mature on March 31, 2012 and bear interest at a margin of 2.25% over the Eurodollar Base Rate for Eurodollar borrowings and 1.25% over the Base Rate for Base Rate Borrowings.
The interest rate at December 31, 2009, was 6.25% and 2.48% for the New and Extending Term Loans and the Non-Extending Term Loans, respectively. Borrowings under the Senior Credit Agreement are secured by substantially all assets of the Company and require quarterly principal payments of $0.8 million and potential annual prepayments based on a calculation of "Excess Cash Flow," as defined in the Senior Credit Agreement due in the first quarter of each subsequent fiscal year. The Company made $30.0 million in principal prepayments on the Non-Extending Term Loans in December 2009 which can be applied toward the required Excess Cash Flow prepayment, resulting in no additional required prepayment in the first quarter of 2010.
Senior Secured Notes
The proceeds from the new term loans under the Senior Credit Agreement, together with excess cash, were deposited with the trustee under the indenture governing the Senior Secured Notes in order to redeem the Senior Secured Notes in full. The Senior Secured Notes were called for redemption effective December 17, 2009 and the obligations of POAMI, Protection One and other guarantors under the Indenture were satisfied and discharged as of November 17, 2009. The Company wrote-off a net of $4.7 million, primarily unamortized premium, in connection with the redemption. In addition, payments of $4.7 million were made for termination fees and make-whole payments.
Unsecured Term Loan
On March 14, 2008, POAMI borrowed approximately $110.3 million under the Unsecured Term Loan to allow it to redeem all of the Senior Subordinated Notes. Using the proceeds from the
71
Unsecured Term Loan and available cash on hand, POAMI redeemed all of the Senior Subordinated Notes. The senior credit facility would have been subject to an early maturity date of June 30, 2008 had the Senior Subordinated Notes not been refinanced. A loss of $12.8 million was recorded in connection with the retirement of the Senior Subordinated Notes, which was comprised of the non-cash write-off of $7.0 million in unamortized discount and $5.8 million in make-whole payments and termination fees.
The Unsecured Term Loan bears interest at the prime rate plus 11.5% per annum and matures in 2013. Interest is payable semi-annually in arrears on March 14 and September 14 of each year. The annual interest rate was 14.75% at December 31, 2009. The Unsecured Term Loan lenders include, among others, entities affiliated with the Principal Stockholders and Arlon Group. Affiliates of the Principal Stockholders collectively owned approximately 70% of the Company's common stock as of December 31, 2009, and one of the Company's former directors is affiliated with Arlon Group. The Company recorded $6.7 million and $5.9 million of related party interest expense for the years ended December 31, 2009 and 2008, respectively.
Capital Leases
The Company acquired vehicles under capital lease arrangements. Accumulated depreciation on these assets at December 31, 2009 and 2008 was approximately $6.2 million and $4.4 million, respectively. The following is a schedule of future minimum lease payments under capital leases together with the present value of net minimum lease payments as of December 31, 2009 (in thousands):
2010 |
$ | 2,272 | ||
2011 |
1,228 | |||
2012 |
343 | |||
2013 |
2 | |||
Total minimum lease payments |
3,845 | |||
Less: Estimated executory costs |
(272 | ) | ||
Net minimum lease payments |
3,573 | |||
Less: Amount representing interest |
(288 | ) | ||
Present value of net minimum lease payments(a) |
$ | 3,285 | ||
- (a)
- Reflected in the condensed consolidated balance sheet as current and non-current obligations under debt and capital leases of $2,013 and $1,272, respectively.
72
Debt Maturities
Excluding capital lease agreements and any discounts described above, debt maturities over the succeeding five years and thereafter are as follows (in thousands):
2010 |
$ | 3,345 | ||
2011 |
3,345 | |||
2012(a) |
326,974 | |||
2013(a) |
110,340 | |||
2014(a) |
— | |||
Thereafter |
— | |||
Total |
$ | 444,004 | ||
- (a)
- Assumes (i) payment of Unsecured Term Loan at contractual maturity date of March 14, 2013; and (ii) senior credit facility subject to early maturity date of December 14, 2012.
Debt Covenants
The agreement governing the Unsecured Term Loan (the "Unsecured Term Loan Agreement") and the Senior Credit Agreement contain certain covenants and restrictions, including with respect to the Company's ability to incur debt and pay dividends, based on earnings before interest, taxes, depreciation and amortization, or EBITDA. While the definition of EBITDA varies slightly among the Unsecured Term Loan Agreement and Senior Credit Agreement, EBITDA is generally derived by adding to income (loss) before income taxes, the sum of interest expense, depreciation and amortization expense, including amortization of deferred customer acquisition costs less amortization of deferred customer acquisition revenue.
The following table presents the financial ratios required by the Company's Senior Credit Agreement and Unsecured Term Loan Agreement through December 31, 2010.
Debt Instrument
|
Financial Covenants | Ratio Requirements | ||
|---|---|---|---|---|
| Senior Credit Agreement | Consolidated Leverage Ratio (consolidated total debt on last day of period/consolidated EBITDA for most recent four fiscal quarters) | Q4 2009 through Q3 2010: Less than 5.5:1.0 Q4 2010; Less than 5.25:1.0 |
||
Consolidated Interest Coverage Ratio (consolidated EBITDA for most recent four fiscal quarters/consolidated interest expense for most recent four fiscal quarters) |
Q4 2009 through Q3 2010: Greater than 2.0:1.0 Q4 2010; Greater than 2.05:1.0 |
|||
Unsecured Term Loan Agreement |
Consolidated Fixed Charge Coverage Ratio (consolidated EBITDA for most recent four fiscal quarters/consolidated interest expense for most recent four fiscal quarters) |
Greater than 2.25:1.0 |
73
At December 31, 2009, the Company was in compliance with the financial covenants and other maintenance tests for all its debt obligations. The Consolidated Leverage Ratio and Consolidated Interest Coverage Ratio contained in the Senior Credit Agreement are maintenance tests and the Consolidated Fixed Charge Coverage Ratio contained in the Unsecured Term Loan Agreement is a debt incurrence test. The Company cannot be deemed to be in default solely due to failure to meet debt incurrence tests. However, failure to meet such debt incurrence test could result in restriction on the Company's ability to incur additional ratio indebtedness. The Company believes that should it fail to meet the minimum Consolidated Fixed Charge Coverage Ratio in its Unsecured Term Loan Agreement, its ability to borrow additional funds under other permitted indebtedness provisions of the Unsecured Term Loan Agreement and Senior Credit Agreement would provide sufficient liquidity for currently foreseeable operational needs. The Company is prohibited from paying cash dividends to its stockholders under covenants contained in the Senior Credit Agreement.
7. Share-Based Employee Compensation:
The Company accounts for stock based compensation using the provisions of ASC 718 which require the measurement and recognition of compensation expense for all share-based payment awards to employees and directors based on estimated fair values.
The Company had the following stock option plans under which shares were available for grant at December 31, 2009: the 2008 Long-Term Incentive Plan (the "2008 LTIP") and the 2004 Stock Option Plan (the "2004 Plan").
2008 Long-Term Incentive Plan
The 2008 LTIP, approved by the Company's stockholders on June 4, 2008, is an equity compensation plan that satisfies certain requirements of the Marketplace Rules of The Nasdaq Stock Market and certain requirements of the Internal Revenue Code of 1986, as amended, and regulations there under, referred to collectively as the Code, relating to deductibility of certain performance-based executive compensation. The 2008 LTIP provides for the granting of incentive and nonqualified stock options, stock appreciation rights, restricted shares and restricted share units, performance awards and other equity-based awards to directors, officers and key employees. Under the 2008 LTIP, 1.5 million shares are reserved for issuance, subject to such adjustment as may be necessary to reflect changes in the number or kinds of shares of common stock or other securities of Protection One.
No options have been granted under the plan as of December 31, 2009. A total of 65,000 and 31,900 restricted stock units were issued to directors on June 24, 2009 and June 4, 2008, respectively.
2004 Stock Option Plan
The 2004 Plan was approved by the Protection One stockholders and became effective on February 8, 2005. Under the 2004 Plan, certain executive officers and selected management employees were granted options in 2005, which are subject to vesting, exercise and delivery restriction described below, to purchase an aggregate of 1,782,947 shares of common stock. A total of 1,996,184 shares are reserved for issuance under the 2004 Plan subject to such adjustment as may be necessary to reflect changes in the number or kinds of shares of common stock or other securities of the Company. To the extent an option expires or is canceled, forfeited, settled in cash or otherwise terminated or concluded without a delivery of shares to which the option related, the undelivered shares will again be available for options. The options initially granted under the 2004 Plan will vest ratably each month during the 48 months after the date of grant, subject to accelerated vesting, in the case of certain senior executive officers, under certain circumstances following a qualified sale. Under the option agreements applicable to the options granted, any shares of stock purchased through the exercise of options generally will be issued and delivered to the option holder, and any net payment that may be due to such holder in
74
accordance with the 2004 Plan, will be paid to such holder upon the earlier of: (1) specified dates following the occurrence of certain permissible distribution events, as defined in the Company's Stock Appreciation Rights Plan (the "SAR Plan") and (2) February 8, 2011, provided that if an option holder's right to receive stock is converted pursuant to the 2004 Plan into a right to receive cash, the amount of cash payable will be credited with interest at 6% per annum, compounded annually, from the date such conversion is effective until the applicable payment date. See "Stock Appreciation Rights Plan" below for additional information related to the SAR Plan.
On July 25, 2006 an additional 42,500 options were granted under the 2004 Plan with an exercise price of $14.02 per share. On May 7, 2007, an additional 100,000 options were granted under the 2004 Stock Option Plan with an exercise price of $14.50 per share.
Share-Based Employee Compensation Expense
Share-based compensation related to stock options granted to employees of approximately $0.5 million, or $0.02 per share (basic and fully diluted), $1.4 million, or $0.06 per share (basic and fully diluted), and $1.5 million, or $0.06 per share (basic and fully diluted), for the years ended December 31, 2009, 2008 and 2007, respectively, was recorded in general and administrative expense. No tax benefit was recorded since the Company does not have taxable income and is currently reserving for its federal tax assets. There were no amounts capitalized relating to share-based employee compensation for the any of the years ended December 31, 2009, 2008 and 2007.
The amount of expense to be recognized over the remaining service period of the modified 2005 options, the 2006 options, and the 2007 options as of December 31, 2009 is expected to be approximately $0.1 million through July 2010.
The table below summarizes stock options and warrants for the Company's common stock outstanding as of December 31, 2009. All non-vested options at December 31, 2009 are expected to vest in the future.
Description
|
Exercise Price/Range of Exercise Prices |
Number of Shares of Common Stock |
Weighted- Average Remaining Contractual Life in years |
Weighted Average Exercise Price |
Aggregate Intrinsic Value |
||||||||||
|---|---|---|---|---|---|---|---|---|---|---|---|---|---|---|---|
| |
|
|
|
|
(Dollars in Thousands) |
||||||||||
Exercisable |
|||||||||||||||
2000 Options |
65.625 - 71.875 | 2,089 | $ | 71.52 | |||||||||||
2001 Options |
60.30 - 67.50 | 24,550 | 65.00 | ||||||||||||
2001 Warrants |
65.825 | 5,000 | 65.83 | ||||||||||||
2002 Options |
103.50 - 137.50 | 6,400 | 116.59 | ||||||||||||
2005 Options |
6.52 | 1,548,829 | 6.52 | ||||||||||||
2006 Options |
14.02 | 16,230 | 14.02 | ||||||||||||
IASG converted Options |
19.83 - 31.90 | 617,839 | 29.78 | ||||||||||||
|
2,220,937 | 1.8 years | 14.12 | $ | 0 | ||||||||||
Not exercisable |
|||||||||||||||
2006 Options |
14.02 | 2,770 | 2.6 years | 14.02 | |||||||||||
Outstanding |
2,223,707 | 1.8 years | $ | 14.12 | $ | 0 | |||||||||
75
A summary of the Company's non-vested stock options activity for the years ended December 31, 2009, 2008 and 2007 follows:
| |
Shares | Weighted- Average Grant-Date Fair Value |
Total Grant-Date Fair Value |
|||||||
|---|---|---|---|---|---|---|---|---|---|---|
| |
|
|
(Dollars in Thousands) |
|||||||
Non-vested at January 1, 2007 |
882,438 | $ | 2.81 | $ | 2,479 | |||||
Granted |
100,000 | 9.88 | 988 | |||||||
Vested—modified 2005 options(a) |
(389,701 | ) | 2.51 | (978 | ) | |||||
Vested—2006 options |
(10,627 | ) | 9.52 | (101 | ) | |||||
Vested—2007 options |
(14,583 | ) | 9.88 | (144 | ) | |||||
Forfeited |
— | — | — | |||||||
Non-vested at December 31, 2007 |
567,527 | 3.96 | 2,244 | |||||||
Granted |
— | — | — | |||||||
Vested—modified 2005 options(a) |
(388,875 | ) | 2.51 | (976 | ) | |||||
Vested—2006 options |
(7,833 | ) | 9.52 | (75 | ) | |||||
Vested—2007 options |
(25,000 | ) | 9.88 | (247 | ) | |||||
Forfeited |
(9,385 | ) | 8.59 | (81 | ) | |||||
Non-vested at December 31, 2008 |
136,434 | 6.36 | 865 | |||||||
Granted |
— | — | — | |||||||
Vested—modified 2005 options(a) |
(64,539 | ) | 2.51 | (162 | ) | |||||
Vested—2006 options |
(5,375 | ) | 9.52 | (51 | ) | |||||
Vested—2007 options |
(8,333 | ) | 9.88 | (82 | ) | |||||
Forfeited |
(55,417 | ) | 9.86 | (543 | ) | |||||
Non-vested at December 31, 2009 |
2,770 | $ | 9.52 | $ | 27 | |||||
- (a)
- The weighted-average grant-date fair value of options granted during the first quarter of 2005 was $5.39 per option. The terms of the options granted in 2005 under the 2004 Plan included anti-dilution provisions and were modified accordingly because of the distribution made in May 2006. A compensatory make-whole payment of $4.5 million or $2.89 per option was also made and resulted in a reduction of the fair value of the original award by the amount of cash received resulting in an adjusted grant-date fair value of $2.51.
The Company estimated fair value of the options on the date of grant using the Black-Scholes option-pricing model with the assumptions included in the table below. The Company uses historical data, among other factors, to estimate the expected stock price volatility, the expected option life and the expected forfeiture rate. The risk-free rate is based on the U.S. Treasury yield curve in effect at the time of grant for the estimated life of the option. The following assumptions were used to estimate the fair value of options granted:
| |
May 7, 2007 | |||
|---|---|---|---|---|
Expected stock price volatility |
73.9 | % | ||
Risk free interest rate |
4.52 | % | ||
Expected option life |
6 years | |||
Expected dividend yield |
— | |||
76
The following table summarizes the Company's activities with respect to its stock option plans for the years presented:
| |
Warrants And Options |
Weighted Average Exercise Price |
Weighted Average Grant Date Fair Value |
|||||||
|---|---|---|---|---|---|---|---|---|---|---|
| |
|
|
(Dollars in Thousands) |
|||||||
Outstanding at January 1, 2007 |
1,655,875 | $ | 10.41 | |||||||
Granted |
100,000 | 14.50 | $ | 988 | ||||||
IASG options converted |
713,104 | 29.77 | $ | 2,900 | ||||||
Forfeited |
(31,314 | ) | 27.95 | |||||||
Outstanding at December 31, 2007 |
2,437,665 | 16.19 | ||||||||
Forfeited |
(20,958 | ) | 118.02 | |||||||
Outstanding at December 31, 2008 |
2,416,707 | 15.02 | ||||||||
Forfeited |
(193,000 | ) | 19.40 | |||||||
Outstanding at December 31, 2009 |
2,223,707 | $ | 14.12 | |||||||
Restricted Share Units
Annual grants of RSUs are awarded to the Company's independent board members under the Company's 2008 LTIP approved by shareholders in June 2008. An award of 65,000 RSUs was granted on June 24, 2009 with a per unit fair value of $4.00. An award of 31,900 RSUs was granted on June 4, 2008 with a per unit fair value of $8.15. An award of 40,570 RSUs was granted on August 23, 2007 with a per unit fair value of $12.94. The RSUs vest ratably over a 4-year period, provided, however, that any and all unvested RSUs shall be immediately forfeited in the event the board member ceases to serve on the Company's board. A total of 16,840, 8,864 and 750 RSUs vested during the years ended December 31, 2009, 2008 and 2007, respectively, and 105,402 RSUs remained unvested as of December 31, 2009.
Stock Appreciation Rights Plan
On February 8, 2005, pursuant to the SAR Plan, the Company's senior management team received an aggregate of 1,996,183 Stock Appreciation Rights, or SARs. The SARs vest and become payable upon the earlier of (1) a qualified sale as defined in the SAR Plan, which generally means the Principal Stockholders' sale of at least 60% of their equity interest in the Company, provided that if the qualified sale is not a permissible distribution event (as defined in the SAR Plan) the payment will be made, with interest, in connection with a subsequent permissible distribution event, and (2) February 8, 2011. The exercise price of the SARs was $4.50 on the grant date and increases by 9% per annum, which is referred to as the fixed return, compounded annually, beginning on February 8, 2006. If the Principal Stockholders sell less than 60% of their equity interest in the Company, the exercise price applicable to an equivalent percentage of management's SARs would be based on the fixed return through the date of such sale. Each SAR that vests and becomes payable in connection with a qualified sale will generally entitle the holder of a SAR to receive the difference between the exercise price and the lesser of (1) the value of the consideration paid for one share of stock in such qualified sale, or the fair market value of one share of stock if the qualified sale is not a sale to a third party and (2) $7.50, provided that if a SAR holder's right to receive stock is converted pursuant to the SAR Plan into a right to receive cash from a grantor trust that the Company may establish, the amount of cash payable will be credited with interest at 6% per annum, compounded annually, from the date such conversion is effective until the applicable payment date.
77
The SAR Plan provides that the exercise price of the SARs shall be equitably adjusted or modified as necessary to preserve the intended economic benefit of the original grant in the event there is, among other things, a recapitalization, and the SAR Plan provides that the exercise price of the SARs may be adjusted or modified upon the occurrence of any event that makes adjustment or modification appropriate and equitable to prevent inappropriate penalties or windfalls with respect to the terms of the SAR Plan and the holders of the SARs. On May 12, 2006, after determining that the $70.5 million cash dividend declared on April 27, 2006 would adversely impact the SARs granted in 2005, the Company's board of directors agreed to amend the SARs agreements by effectively fixing the exercise price on 439,160 outstanding SARs (the modified SARs) at $5.02. Therefore, if there is not a qualified sale prior to February 8, 2011, the holders of these modified SARs will be entitled to receive the difference between $7.50 and $5.02 per SAR, or $2.48, from the Company for a total cash outlay of approximately $1.1 million on February 8, 2011.
In November 2006, the Company's board of directors approved the reallocation of SARs forfeited by a former executive officer to the other SAR Plan participants, Messrs. Ginsburg, Nevin and Pefanis. As proposed by the Company's Chief Executive Officer and approved by its board of directors, the SARs were reallocated to the applicable named executive officers in proportion to the number of SARs that they held immediately before the reallocation. Except for a reallocation upon any forfeiture by a former executive officer, the SAR Plan does not allow for any grant of additional SARs.
As of December 31, 2009 and 2008, respectively, the Company had established a liability of approximately $0.8 million and $0.6 million to reflect the portion of the modified SARs that have been earned since the date of the modification with the associated expense reflected in general and administrative expense. Assuming there is no qualified sale prior to February 8, 2011, the Company expects to record approximately $0.3 million in expense through 2011, the majority of which will be in 2010, related to these SARs. As of December 31, 2009 and 2008, no value has been ascribed to the SARs that have not been modified and no value will be allocated to those SARs unless and until it becomes probable that a qualified sale will occur.
IASG Converted Options
In connection with the Merger, options to acquire shares of IASG common stock were converted into options to acquire a number of shares of Protection One, Inc. common stock equal to the number of shares of IASG common stock that were issuable upon exercise of the options multiplied by 0.29, rounded down to the nearest whole share, at an exercise price per share equal to the exercise price per share under the options before the completion of the Merger divided by 0.29, rounded up to the nearest whole cent.
The fair value of the converted options, net of the fair value of unvested options, represents additional purchase consideration. Substantially all outstanding options issued to IASG employees vested prior to the Merger. A total of 713,104 options for the Company's common stock were issued in exchange for 2,459,001 outstanding IASG options. The fair value of these options was calculated as of December 20, 2006, the announcement date of the Merger, using the Black-Scholes option pricing model. The Company's historical data, among other factors, were used to estimate the expected price volatility and the expected option life. The risk-free rate is based on the U.S. Treasury yield curve in effect at the time of grant for the estimated life of the option. The table below reflects the assumption
78
used for each of the exchanged option awards (dollars in thousands, except per share amounts, ratios, number of options and percentages):
Expiration Date
|
# of Options(a) |
Exercise Price/Option |
Award Value/Option |
Expected Life (yrs) |
Expected Volatility |
Risk-free Rate |
Total Fair Value |
|||||||||||||||
|---|---|---|---|---|---|---|---|---|---|---|---|---|---|---|---|---|---|---|---|---|---|---|
July 23, 2013 |
591,594 | $ | 31.90 | $ | 4.22 | 3.28 | 81.4 | % | 4.55 | % | $ | 2,497 | ||||||||||
July 24, 2013 |
13,920 | $ | 31.90 | $ | 4.22 | 3.28 | 81.4 | % | 4.55 | % | 58 | |||||||||||
June 15, 2014 |
33,785 | $ | 19.83 | $ | 5.67 | 3.73 | 77.2 | % | 4.53 | % | 191 | |||||||||||
April 4, 2015 |
7,250 | $ | 16.76 | $ | 6.31 | 4.13 | 74.9 | % | 4.52 | % | 46 | |||||||||||
May 2, 2014 |
725 | $ | 12.93 | $ | 6.80 | 3.67 | 77.2 | % | 4.53 | % | 5 | |||||||||||
Dec. 31, 2010 |
580 | $ | 19.31 | $ | 2.10 | 2.00 | 53.3 | % | 4.69 | % | 1 | |||||||||||
April 23, 2009 |
43,500 | $ | 18.10 | $ | 1.30 | 1.16 | 52.4 | % | 4.85 | % | 57 | |||||||||||
April 23, 2009 |
21,750 | $ | 14.66 | $ | 2.07 | 1.16 | 52.4 | % | 4.85 | % | 45 | |||||||||||
Totals |
713,104 | $ | 2,900 | |||||||||||||||||||
- (a)
- There are 617,839 stock options exercisable as of December 31, 2009, none of which have an exercise price below the market price at that date.
In accordance with ASC 718, an additional fair value measurement of both the IASG vested options immediately prior to their conversion into options to acquire the Company's common stock and the options to acquire the Company's common stock which replaced the IASG options held by employees was made as of the closing date of the Merger. The fair value of the Company's common stock options exceeded the fair value of the IASG options held by employees by approximately $0.2 million and such excess was reflected as compensation expense in the Statement of Operations in 2007.
8. Derivatives:
The Company holds one interest rate cap and three interest rate swaps to manage interest rate exposure on its variable rate borrowings. The derivatives are accounted for as economic hedges of the Company's debt subsequent to their de-designation which is further discussed below. Prior to de-designation, the derivatives were considered cash flow hedges and changes resulting from fair market value adjustments were reflected in accumulated other comprehensive loss in the condensed consolidated balance sheet and as a component of unrealized other comprehensive income in the condensed consolidated statement of operations and comprehensive income (loss). Subsequent to de-designation, the derivatives are considered economic hedges and changes in fair value are recorded as interest expense.
The interest rate cap was entered into during the second quarter of 2005 as required by the Company's then existing credit agreement. The objective was to manage interest rate exposure caused by fluctuation in the LIBOR interest rate. The cap provides protection on $75 million of the Company's long term debt over a five-year period ending May 24, 2010 if LIBOR exceeds 6%. In the second quarter of 2008, in connection with the interest rate swaps entered into and described below, the interest rate cap was de-designated as a cash flow hedge. The cap had no fair value at December 31, 2009 or 2008.
The Company entered into three interest rate swaps in the second quarter of 2008 to fix the interest rate on $250 million of the variable rate debt under the Company's then existing credit facility. The interest rate swaps mature from September 2010 to November 2010. The interest rate swaps were de-designated as cash flow hedges in conjunction with the debt refinancing that occurred in the fourth quarter of 2009. See Note 6, "Debt and Capital Leases," for additional discussion of the debt refinancing.
79
The fair value of the interest rate swaps are reflected in accrued liabilities and other liabilities based on the timing of discounted expected future cash flows. At December 31, 2009, the Company recorded $5.7 million as a current liability in accrued liabilities. At December 31, 2008 the Company recorded $5.6 million as a current liability in accrued liabilities and $3.3 million as a long term liability in other liabilities. The table below is a summary of the Company's derivative positions as of December 31, 2009 and 2008 (in thousands):
Derivative Type
|
Notional | December 31, 2009 Fair Value |
December 31, 2008 Fair Value |
|||||||
|---|---|---|---|---|---|---|---|---|---|---|
Interest Rate Swaps |
$ | 250,000 | $ | (5,719 | ) | $ | (8,867 | ) | ||
Interest Rate Cap |
75,000 | 0 | 0 | |||||||
Total |
$ | 325,000 | $ | (5,719 | ) | $ | (8,867 | ) | ||
Below is a summary of the amounts charged to interest expense and accumulated other comprehensive income for the periods indicated (in thousands). No ineffectiveness was recorded for any of the periods presented.
| |
Loss Reclassified from Accumulated Other Comprehensive Income (Loss) to Interest Expense |
Loss Recognized in Accumulated Other Comprehensive Income (Loss) |
|||||||||||
|---|---|---|---|---|---|---|---|---|---|---|---|---|---|
| |
Year Ended December 31, | Year Ended December 31, | |||||||||||
Derivatives in ASC 815 Cash Flow Hedge Relationships |
|||||||||||||
| 2009 | 2008 | 2009 | 2008 | ||||||||||
Interest Rate Swaps(b) |
$ | (5,890 | ) | $ | (940 | ) | $ | (4,174 | ) | $ | (9,804 | ) | |
Interest Rate Cap(a) |
— | (134 | ) | — | (28 | ) | |||||||
Total |
$ | (5,890 | ) | $ | (1,074 | ) | $ | (4,174 | ) | $ | (9,832 | ) | |
- (a)
- Interest
rate caps were de-designated as cash flow hedges in the second quarter of 2008.
- (b)
- Interest rate swaps were de-designated as cash flow hedges in the fourth quarter of 2009.
| |
Amount of Loss on Derivatives Recognized in Interest Expense |
||||||
|---|---|---|---|---|---|---|---|
| |
Year Ended December 31, | ||||||
Derivatives Not Designated as Hedging Instruments under ASC 815 |
|||||||
| 2009 | 2008 | ||||||
Interest Rate Swaps(b) |
$ | (1,097 | ) | $ | — | ||
Interest Rate Cap(a) |
(211 | ) | (93 | ) | |||
Total |
$ | (1,308 | ) | $ | (93 | ) | |
- (a)
- Interest
rate caps were de-designated as cash flow hedges in the second quarter of 2008.
- (b)
- Interest rate swaps were de-designated as cash flow hedges in the fourth quarter of 2009.
The Company estimates the remaining $5.7 million of the net unrealized loss existing at December 31, 2009 will be reclassified to earnings within the next twelve months.
80
9. IASG Acquisition:
The Company acquired all of the outstanding common stock of IASG in connection with the Merger. Holders of IASG common stock received 0.29 shares of Protection One, Inc. common stock for each share of IASG common stock held. Cash was paid in lieu of fractional shares. The Company issued 7,066,960 shares of its common stock and 713,104 stock options in exchange for the outstanding IASG common stock and IASG stock options, respectively. The consideration associated with the common stock and stock options was based on $12.125 per share, the average closing price of the Company's common stock for the two trading days immediately prior and subsequent to December 20, 2006, the announcement date of the Merger. Upon consummation of the Merger, the Principal Stockholders' ownership percentage decreased to 70.0% and former IASG stockholders were issued 27.9% of the Company's common stock. IASG financial results subsequent to April 2, 2007 are consolidated with the Company's financial results.
The Merger was accounted for using the purchase method of accounting under ASC 805, Business Combinations. Under the purchase method of accounting, the Company was considered the acquirer of IASG for accounting purposes and the total purchase price was allocated to the assets acquired and liabilities assumed from IASG based on their fair values as of April 2, 2007. Under the purchase method of accounting, the net consideration was approximately $96.7 million, comprised of the Company's common stock of $85.7 million, the assumption of IASG stock options that were converted into the Company's stock options with a value of $2.9 million, and approximately $8.1 million in transaction costs, including investment banker fees, consulting fees and professional fees.
Pro Forma Financial Information (Unaudited)
The results of operations of IASG from April 2, 2007 through December 31, 2007 are included in the Company's condensed consolidated statement of operations for the year ended December 31, 2007. The financial information in the table below summarizes the combined results of operations of the Company and IASG, on a pro forma basis, as though the companies had been combined as of the beginning of the period presented. These results have been prepared by adjusting the historical results of the Company to include the historical results of IASG and the impact of the purchase price allocation. The pro forma combined results of operations for the year ended December 31, 2007 exclude Merger-related costs of $3.9 million, which primarily consist of investment banker fees and debt redemption costs incurred by IASG prior to completion of the Merger.
The following pro forma combined results of operations have been provided for illustrative purposes only and do not purport to be indicative of the actual results that would have been achieved by the combined companies for the period presented or that will be achieved by the combined company in the future (in thousands, except per share information).
| |
Year ended December 31, 2007 |
|||
|---|---|---|---|---|
| |
(unaudited) |
|||
Pro forma: |
||||
Revenue |
$ | 371,178 | ||
Net loss |
$ | (34,317 | ) | |
Basic and diluted earnings per share |
$ | (1.12 | ) | |
81
10. Leases:
The Company leases office facilities and equipment for lease terms maturing through 2015. Future minimum lease payments under non-cancelable operating leases are as follows (in thousands):
| |
|
|||
|---|---|---|---|---|
Year ended December 31, |
||||
2010 |
$ | 6,319 | ||
2011 |
5,732 | |||
2012 |
4,289 | |||
2013 |
2,285 | |||
2014 |
807 | |||
Thereafter |
50 | |||
|
$ | 19,482 | ||
Total rent expense was $6.6 million for each of the years ended December 31, 2009 and 2008 and was $7.1 million for the year ended December 31, 2007.
11. Income Taxes:
Components of income tax (expense) benefit are as follows (in thousands):
| |
Year Ended December 31, | ||||||||||
|---|---|---|---|---|---|---|---|---|---|---|---|
| |
2009 | 2008 | 2007 | ||||||||
Federal |
|||||||||||
Current |
$ | — | $ | — | $ | — | |||||
Deferred |
(3,255 | ) | — | — | |||||||
State |
|||||||||||
Current |
(635 | ) | (322 | ) | (721 | ) | |||||
Deferred |
1,600 | (19 | ) | 8 | |||||||
Total |
$ | (2,290 | ) | $ | (341 | ) | $ | (713 | ) | ||
The difference between the income tax expense or benefit at the federal statutory rate and income tax expense in the accompanying statements of operations is as follows:
| |
Year ended December 31, | |||||||||
|---|---|---|---|---|---|---|---|---|---|---|
| |
2009 | 2008 | 2007 | |||||||
Federal statutory tax rate |
35 | % | 35 | % | 35 | % | ||||
State income tax benefit, net of federal expense |
15 | 3 | 4 | |||||||
State tax credits |
— | — | 10 | |||||||
Other |
— | (3 | ) | (2 | ) | |||||
Valuation allowance |
(38 | ) | (36 | ) | (49 | ) | ||||
|
12 | % | (1 | )% | (2 | )% | ||||
Management believes the Company's net federal deferred tax assets, including those related to net operating losses, are not likely realizable and therefore its federal deferred tax assets are fully reserved. The Company had no federal deferred tax assets recorded as of December 31, 2009 or 2008. The Company had $2.9 million and $0.1 million of state deferred tax assets recorded as of December 31, 2009 and 2008, respectively, which relate primarily to benefits expected to be received for state tax credits. In assessing whether deferred taxes are realizable, management considers whether it is more likely than not that some portion or all deferred tax assets will be realized. The ultimate realization of
82
deferred tax assets is dependent upon the generation of future taxable income during the periods in which those temporary differences become deductible. Management considers the projected future taxable income and tax planning strategies in making this assessment.
The Company has indefinite-lived intangible assets consisting of trade names and goodwill which are not amortized for financial reporting purposes. These indefinite-lived intangible assets are tax deductible, and therefore, are amortized over fifteen years for tax purposes. The tax-deductibility of these indefinite-lived intangible assets results in a deferred tax liability which only reverses at the time of impairment of the related asset or ultimate sale of the underlying intangible asset. Due to the uncertain timing of this reversal, the difference cannot be considered as a source of future taxable income and cannot be used to offset the Company's deferred tax assets. As a result, the Company does not net such deferred tax liabilities against the Company's deferred tax assets, which related primarily to net operating loss carryforwards, when determining its valuation allowance. The Company also has a state deferred tax liability of approximately $1.3 million and $1.2 million at December 31, 2009 and 2008, respectively, related to states that impose a tax on a separate company basis.
Deferred income tax assets and (liabilities) were composed of the following (in thousands):
| |
December 31, | |||||||
|---|---|---|---|---|---|---|---|---|
| |
2009 | 2008 | ||||||
Deferred taxes, current: |
||||||||
Accrued liabilities |
$ | 4,899 | $ | 4,362 | ||||
Accounts receivable, due to allowance |
2,742 | 2,249 | ||||||
Other |
(302 | ) | (435 | ) | ||||
Valuation allowance |
(7,339 | ) | (6,176 | ) | ||||
|
$ | — | $ | — | ||||
Deferred taxes, noncurrent: |
||||||||
Net operating loss carry-forwards |
$ | 56,653 | $ | 63,385 | ||||
State tax credits |
3,196 | 3,273 | ||||||
Property & equipment |
8,205 | 12,460 | ||||||
Deferred customer acquisition costs (net of revenue) |
(17,377 | ) | (20,410 | ) | ||||
Customer accounts |
17,394 | 15,719 | ||||||
Dealer relationships |
(7,476 | ) | (7,917 | ) | ||||
Goodwill |
(2,004 | ) | 3,420 | |||||
Other intangibles |
(3,262 | ) | (2,524 | ) | ||||
Debt |
274 | 4,094 | ||||||
Other |
4,644 | 5,644 | ||||||
Valuation allowance |
(65,126 | ) | (78,211 | ) | ||||
|
$ | (4,879 | ) | $ | (1,067 | ) | ||
Income tax expense recorded in the fourth quarter of 2009 includes a $1.1 million out-of-period adjustment to correct an error in the calculation of the deferred tax valuation allowance. The correction relates to the inappropriate (1) netting of deferred tax liabilities acquired in 2005 and 2007 and generated thereafter from the tax amortization of indefinite-lived intangible assets against deferred tax assets; and (2) valuation of a state of Texas franchise tax credit during 2007. The correction resulted in an increase of $2.2 million and $3.3 million to Goodwill and Deferred Tax Liability, respectively. The Company has evaluated this out-of-period correction from both qualitative and quantitative perspectives and has concluded that it is immaterial to the previously issued annual and quarterly financial statements.
83
At December 31, 2009, the Company had approximately $157 million of net operating loss carry-forwards which begin to expire in 2020. Total state net operating losses of approximately the same amount have various expiration dates.
As a result of ownership changes related to the Merger and previous IASG acquisitions, approximately $53 million of these net operating losses are subject to Internal Revenue Code ("IRC") Section 382 limitations, which limit the Company's ability to utilize these net operating losses on an annual basis. As a result of IRC Section 382 limitations, approximately $10 million of the net operating loss cannot be utilized. Approximately $13 million of these net operating losses are currently available and approximately $30 million of the carry-forwards, subject to certain limitations, will become available in future years.
As a result of certain realization requirements of ASC 718, the table of deferred tax assets and liabilities shown above does not include certain deferred tax assets at December 31, 2009 and 2008 that arose directly from tax deductions related to equity compensation in excess of compensation recognized for financial reporting. Equity will be increased by approximately $0.6 million if and when such deferred tax assets are ultimately realized.
A reconciliation of the beginning and ending balances of the total amount of gross unrecognized tax benefit is as follows (in thousands):
| |
2009 | 2008 | 2007 | |||||||
|---|---|---|---|---|---|---|---|---|---|---|
Gross unrecognized tax benefit at January 1, |
$ | 63 | $ | — | $ | — | ||||
Increases in tax positions for prior years |
59 | 15 | — | |||||||
Decreases in tax positions for prior years |
(15 | ) | — | — | ||||||
Increases in tax positions for current years |
42 | 48 | — | |||||||
Gross unrecognized tax benefit at December 31, |
$ | 149 | $ | 63 | $ | — | ||||
The balance of unrecognized tax benefits that, if recognized, would favorably impact the effective tax rate at December 31, 2009 and 2008, are tax benefits of $149 thousand and $63 thousand, respectively.
The Company recognizes interest and penalties related to unrecognized tax benefits as deferred income tax expense. Related to the unrecognized tax benefit noted above, the Company accrued penalties of $5 thousand and no interest during the year ended December 31, 2009 and, in total, as of December 31, 2009, has recorded a liability of $11 thousand and $3 thousand for penalties and interest, respectively. During the year ended December 31, 2008, the Company accrued $6 thousand and $3 thousand for penalties and interest, respectively, and, in total, as of December 31, 2008, had recorded a liability of $6 thousand and $3 thousand for penalties and interest, respectively. The Company had no liability related to unrecognized tax benefits at December 31, 2007.
With limited exception, the company is subject to U.S. federal, state and local tax audits by taxing authorities for years subsequent to 2005. These years contain matters that could be the subject of differing interpretations of applicable tax laws and regulations as it relates to the amount and/or timing of income, deductions and tax credits. Although the outcome of tax audits is always uncertain, the Company believes that adequate amounts of tax and interest have been provided for any adjustments that are expected to result for these years. The Company does not currently expect the resolution of these matters to result in significant changes during the next twelve months.
84
12. Related Party Transactions:
Principal Stockholders Management Agreements
On April 18, 2005, the Company entered into management agreements with each of Quadrangle Advisors LLC ("QA") and Quadrangle Debt Recovery Advisors LLC ("QDRA," and together with QA, the "Advisors"). The Principal Stockholders management agreements were terminated as of April 2, 2007 in connection with the completion of the Merger.
The Company paid the Advisors aggregate management fees of $2.7 million in 2007 pursuant to the terms of the management agreements. This amount includes $375,000 paid in connection with the termination of the management agreements, representing the second quarterly installments of the 2007 annual fees due to the Advisors under the management agreements, and approximately $1.9 million for services rendered in connection with the Merger, or 1% of the aggregate value of the Merger. The $1.9 million fee was capitalized as a direct cost of the Merger.
Board of Directors and Amended Bylaws
If and for so long as POI Acquisition, L.L.C. owns at least 40% of the outstanding shares of the Company's common stock, it shall have the right to elect to increase the size of the board by two directors, which it shall be entitled to designate.
The stockholders agreement also includes voting agreements, certain restrictions on the transfer of the Company's common stock, drag-along rights in favor of POI Acquisition, L.L.C. and tag-along rights in favor of Monarch, all upon customary terms and subject to certain customary exceptions (including exceptions for certain transfers among affiliates). In addition, the stockholders agreement provides the Principal Stockholders with the right to participate on a proportional basis in any future equity issuance by the Company, except for issuances pursuant to registered public offerings, business combination transactions or officer, employee, director or consultant arrangements.
Registration Rights Agreement
As a condition to the consummation of the debt-for-equity exchange with the Principal Stockholders in 2005, the Company entered into a registration rights agreement with POI Acquisition, L.L.C. and Monarch. The registration rights agreement provides, among other things, that the Company will register, upon notice, shares of its common stock owned by such parties. Under the registration rights agreement, POI Acquisition, L.L.C. is permitted up to four demand registrations and Monarch is permitted up to two demand registrations, subject to certain conditions described in the agreement. POI Acquisition, L.L.C. and Monarch also received piggyback registration rights whereby they shall have the opportunity to register their securities pursuant to any registration statement the Company may file in the future, subject to certain conditions. The Company is also obligated to pay certain of their expenses pursuant to the registration of their securities under the registration rights agreement.
13. Commitments and Contingencies:
In addition to the matters described below, the Company is a defendant in a number of pending legal proceedings incidental to the normal course of its business and operations. The Company does not expect the outcome of these proceedings, either individually or in the aggregate, to have a material adverse effect on the Company's financial condition, results of operations or liquidity.
An estimate of the probable loss, if any, or the range of loss cannot be made for the following cases, and therefore, the Company has not accrued loss contingencies related to the following matters.
85
Scardino Litigation
On April 17, 2006, the Company was named a defendant in a litigation proceeding brought by Frank and Anne Scardino arising out of a June 2005 fire at their home in Villanova, Pennsylvania. (Frank and Anne Scardino v. Eagle Systems, Inc., Eagle Monitoring, Inc. and Protection One Alarm Monitoring, Inc. d/b/a Dynawatch, Delaware County, Pennsylvania Court of Common Pleas, Cause No. 06-4485). The original complaint asserted six counts for negligence, gross negligence, breach of contract, breach of implied warranty of merchantability, breach of implied warranty of fitness for a particular purpose and violation of the Unfair Trade Practices and Consumer Protection Law ("UTPCPL"). The UTPCPL claim carried the risk of treble damages, attorneys' fees and costs. Plaintiffs initially claimed direct and consequential damages in excess of $3 million. Plaintiffs have since claimed damages close to $5 million. The Company's preliminary objections to the negligence and gross negligence claims were granted by the court in September 2007, and these claims were accordingly dismissed.
The Company notified its liability insurance carriers of the claim and answered the remaining counts. On January 28, 2009, the plaintiffs, in response to the Company's motion for summary judgment, voluntarily withdrew three of the four remaining claims, including the UTPCPL claim, thereby leaving only one count for breach of a written alarm agreement. However, plaintiffs were later granted leave to assert three additional claims for breach of oral contracts in an amended complaint, which was filed on or about June 25, 2009. The amended complaint improperly included claims against the Company which were previously dismissed. The plaintiffs served a second amended complaint on August 6, 2009, which did not assert the improperly included claims.
On October 14, 2009, the Company filed preliminary objections to the three new claims for breach of oral contracts, contending that the three new claims in the second amended complaint were insufficient as a matter of law and contractually time barred. The preliminary objections were not sustained by the Court, but the Company intends to bring a separate motion asserting that the new claims are statutorily time-barred.
The Company answered the second amended complaint and filed counterclaims for breach of contract and for contractual indemnification for the uninsured portion of plaintiffs' loss. Plaintiffs filed preliminary objections to the Company's counterclaims.
At a settlement conference held on March 1, 2010, the parties tentatively reached an agreement to settle the matter, however such settlement terms have not yet been agreed to in writing and there can be no assurance that a settlement will be reached.
By the Carat, Inc. Litigation
On April 30, 2007, IASG and certain of its subsidiaries, Criticom International Corporation and Monital Signal Corporation (collectively, the "Company"), were served in a lawsuit brought by By the Carat, Inc. and John P. Humbert, Jr. and his wife, Valery Humbert, its owners, in connection with a December 2004 armed robbery of their jewelry business. (By the Carat, Inc., John P. Humbert, Jr. and Valery Humbert v. Knightwatch Security Systems, Criticom International Corporation, Monital Signal Corporation, Integrated Alarm Services Group, Inc., et al, Superior Court of New Jersey, Monmouth County Law Division, Docket No.: MON-L-5830-06.) The complaint sought unspecified damages for alleged bodily injury and property losses based on various causes of action, including breach of contract, breach of the covenant of good faith and fair dealing, consumer fraud, intentional and negligent infliction of emotional distress, breach of warranty and gross negligence.
On June 26, 2009, the Court dismissed plaintiffs' complaint without prejudice, due to the plaintiffs' failure to comply with discovery orders. Since the dismissal, plaintiffs have replaced their original counsel with new attorneys. The new attorneys assisted the plaintiffs in complying with the outstanding
86
discovery and the complaint was reinstated. Fact and expert discovery have been progressing and are nearly complete. In January 2010, the parties attempted to resolve the dispute through mediation. The mediation was not successful, but the parties may revisit mediation in the future. Among other things, the Company will request that partial summary judgment be granted as to the plaintiffs' property damage claims based on a contractual limitation of the liability. The Company anticipates filing its motion for summary judgment in early 2010. A trial date has not been set.
Paradox Litigation
On March 13, 2008, plaintiffs Paradox Security Systems, LTD., Samuel Hershkovitz and Pinhas Shpater filed a Second Amended Complaint in Civil Action No. 2:06-cv-462 in the Eastern District of Texas, Marshall Division, and added the Company as a defendant. The complaint alleges that the Company infringes U.S. Patent No. 5,751,803 and U.S. Reissue Patent No. 39,406 (collectively, the "Patents-in-Suit"), by its sale and use of certain control panels made by Digital Security Controls, LTD. ("DSC"). The Company answered the complaint by denying infringement, alleging invalidity and unenforceability of the Patents-in-Suit, and asserting other defenses and related declaratory judgment counterclaims.
At the April 2009 trial, the Court determined that the plaintiffs had not presented sufficient evidence to support plaintiffs' allegations against the Company and the other defendants, and granted the defendants' motions for judgment of non-infringement as a matter of law.
On September 14, 2009, final judgment was entered by the court, and on September 23, 2009, plaintiffs filed a notice of appeal to the Federal Circuit Court. On December 21, 2009, plaintiffs filed their opening appellate brief, wherein they asserted that the trial court erred in entering judgments as a matter of law in favor of the defendants. The Company's reply brief, and the reply briefs of the other defendants, was filed in February 2010. Oral arguments are expected to be conducted in late spring 2010, and a final decision by the Federal Circuit Court is expected in late 2010.
Consumer Complaints
The Company occasionally receives notices of consumer complaints filed with various state agencies. The Company has developed a dispute resolution process for addressing these administrative complaints. The ultimate outcome of such matters cannot presently be determined; however, in the opinion of management, the resolution of such matters will not have a material adverse effect on the Company's consolidated financial position, results of operations or liquidity.
Funding Commitment
Notes receivable were $2.9 million and $4.2 million at December 31, 2009 and 2008, respectively, and represent loans to dealers collateralized by the dealers' portfolios of customer monitoring contracts. The Company has obligations to provide open lines of credit to dealers, subject to the terms of the agreements with the dealers. At December 31, 2009 and 2008, the amount available to dealers under these lines of credit was $0.2 million and $0.5 million, respectively.
14. Employee Benefit Plans:
The Company maintains a tax-qualified, defined contribution plan that meets the requirements of Section 401(k) of the Internal Revenue Code.
Protection One 401(k) Plan. The Company makes contributions to the Protection One 401(k) Plan, that are allocated among participants based upon the respective contributions made by the participants through salary reductions during the applicable plan year. The Company's matching contribution is made in cash. For the years ended December 31, 2009, 2008 and 2007, the Company
87
made matching cash contributions to the plan of $2.2 million, $2.5 million and $1.9 million, respectively. The funds of the plan are deposited with a trustee and at each participant's option in one or more investment funds. The plan was amended and restated effective January 1, 2007.
Management Employment Agreements and Key Employee Retention Plan. In July and August 2004, the Company's senior executives entered into employment agreements with the Company. These employment agreements provide for, among other things, minimum annual base salaries, bonus awards, payable in cash or otherwise, and participation in all of the Company's employee benefit plans and programs in effect for the benefit of senior executives, including stock option, 401(k) and insurance plans, and reimbursement for all reasonable expenses incurred in connection with the conduct of the business of the Company, provided the executive officers properly account for any such expenses in accordance with Company policies. The employment agreements also contain provisions providing for compensation to the senior executives under certain circumstances after a change in control of the Company and in certain other circumstances. On February 22, 2010 these employment agreements were amended and restated for each of the Company's senior executives.
15. Fair Market Value of Financial Instruments:
For certain of the Company's financial instruments, including cash and cash equivalents, accounts receivable, accounts payable and other accrued liabilities, the carrying amounts approximate fair market value due to their short maturities. The book value of notes receivable approximates fair market value.
The fair value of the Company's debt instruments are estimated based on quoted market prices except for the Unsecured Term Loan at December 31, 2009, which had no available quote and was estimated by the Company based on the terms of the loan and comparison to fair value of its other debt. At December 31, the fair value and carrying amount of the Company's debt for the years indicated were as follows (in thousands):
| |
Fair Value | Carrying Value | |||||||||||
|---|---|---|---|---|---|---|---|---|---|---|---|---|---|
| |
2009 | 2008 | 2009 | 2008 | |||||||||
New and Extending Term Loans under the Senior Credit Agreement |
$ | 273,145 | $ | — | $ | 271,924 | $ | — | |||||
Non-Extending Term Loans under the Senior Credit Agreement(a) |
52,977 | 195,473 | 56,359 | 291,750 | |||||||||
Senior Secured Notes (12.0%) |
— | 92,391 | — | 122,058 | |||||||||
Unsecured Term Loan |
124,684 | 94,349 | 110,340 | 110,340 | |||||||||
|
$ | 450,806 | $ | 382,213 | $ | 438,623 | $ | 524,148 | |||||
- (a)
- The 2008 amounts reflect the senior credit facility term loans as of December 31, 2008 which included $203.0 million of term loans that were later amended and extended as part of the refinancing in November 2009.
The estimated fair values may not be representative of actual values of the financial instruments that could have been realized at year-end or may be realized in the future.
16. Segment Reporting:
The Company organizes its operations into three business segments: Retail, Wholesale and Multifamily. The Company's operating segments are defined as components for which separate financial information is available that is evaluated regularly by the chief operating decision maker. The operating segments are managed separately because each operating segment represents a strategic
88
business unit that serves different markets. All of the Company's reportable segments operate in the United States of America.
The Company's Retail segment provides security alarm monitoring services, which include sales, installation and related servicing of security alarm systems for residential and business customers. The Company's Wholesale segment provides monitoring, financing and business support services to independent security alarm dealers. The Company's Multifamily segment provides security alarm services to apartments, condominiums and other multi-family dwellings.
The accounting policies of the operating segments are the same as those described in Note 2, "Summary of Significant Accounting Policies." The Company manages its business segments based on earnings before interest, income taxes, depreciation, amortization (including amortization of deferred customer acquisition costs and revenue) and other items, referred to as Adjusted EBITDA.
Reportable segments (in thousands):
| |
For the year ended December 31, 2009 | |||||||||||||||
|---|---|---|---|---|---|---|---|---|---|---|---|---|---|---|---|---|
| |
Retail | Wholesale | Multifamily | Adjustments(a) | Consolidated | |||||||||||
Revenue |
$ | 289,315 | $ | 50,188 | $ | 28,549 | $ | — | $ | 368,052 | ||||||
Adjusted EBITDA(b) |
95,611 | 13,199 | 14,022 | — | 122,832 | |||||||||||
Amortization and depreciation expense |
41,943 | 4,713 | 3,440 | — | 50,096 | |||||||||||
Amortization of deferred costs in excess of amortization of deferred revenue |
28,006 | — | 2,508 | — | 30,514 | |||||||||||
Segment assets |
460,376 | 70,933 | 46,607 | (6,021 | ) | 571,895 | ||||||||||
Expenditures for property, exclusive of rental equipment |
5,784 | 1,399 | — | — | 7,183 | |||||||||||
Investment in new accounts and rental equipment, net |
23,371 | — | 2,218 | — | 25,589 | |||||||||||
| |
For the year ended December 31, 2008 | |||||||||||||||
|---|---|---|---|---|---|---|---|---|---|---|---|---|---|---|---|---|
| |
Retail | Wholesale | Multifamily | Adjustments(a) | Consolidated | |||||||||||
Revenue |
$ | 291,795 | $ | 49,477 | $ | 30,749 | $ | — | $ | 372,021 | ||||||
Adjusted EBITDA(b) |
87,186 | 9,575 | 12,552 | — | 109,313 | |||||||||||
Amortization and depreciation expense |
51,474 | 7,216 | 5,585 | — | 64,275 | |||||||||||
Amortization of deferred costs in excess of amortization of deferred revenue |
28,556 | — | 2,176 | — | 30,732 | |||||||||||
Segment assets |
532,522 | 74,798 | 50,221 | (18,487 | ) | 639,054 | ||||||||||
Expenditures for property, exclusive of rental equipment |
8,002 | 1,569 | 240 | — | 9,811 | |||||||||||
Investment in new accounts and rental equipment, net |
37,605 | — | 4,014 | — | 41,619 | |||||||||||
89
| |
For the year ended December 31, 2007 | |||||||||||||||
|---|---|---|---|---|---|---|---|---|---|---|---|---|---|---|---|---|
| |
Retail | Wholesale | Multifamily | Adjustments(a) | Consolidated | |||||||||||
Revenue |
$ | 277,490 | $ | 37,978 | $ | 32,403 | $ | — | $ | 347,871 | ||||||
Adjusted EBITDA(b) |
82,232 | 10,375 | 14,805 | — | 107,412 | |||||||||||
Amortization and depreciation expense |
49,501 | 6,274 | 6,289 | — | 62,064 | |||||||||||
Amortization of deferred costs in excess of amortization of deferred revenue |
22,223 | — | 1,952 | — | 24,175 | |||||||||||
Merger-related costs |
4,344 | — | — | — | 4,344 | |||||||||||
Segment assets |
558,717 | 81,300 | 54,705 | (22,005 | ) | 672,717 | ||||||||||
Expenditures for property, exclusive of rental equipment |
7,743 | 3,782 | 383 | — | 11,908 | |||||||||||
Investment in new accounts and rental equipment, net |
32,128 | — | 3,407 | — | 35,535 | |||||||||||
- (a)
- Adjustment
to eliminate intersegment accounts receivable.
- (b)
- Adjusted EBITDA is used by the Company's management and reviewed by the Board of Directors in evaluating segment performance and determining how to allocate resources across segments for investments in customer acquisition activities, capital expenditures and spending in general. The Company believes it is also utilized by the investor community which follows the security monitoring industry. Adjusted EBITDA is useful because it allows investors and management to evaluate and compare operating results from period to period in a meaningful and consistent manner in addition to standard GAAP financial measures. Specifically, Adjusted EBITDA allows the chief operating decision maker to evaluate segment results of operations, including operating performance of monitoring and service activities, effects of investments in creating new customer relationships, and sales and installation of security systems, without the effects of non-cash amortization and depreciation. This information should not be considered as an alternative to any measure of performance as promulgated under GAAP, such as income (loss) before income taxes or cash flow from operations. Items excluded from Adjusted EBITDA are significant components in understanding and assessing the consolidated financial performance of the Company. The Company's calculation of Adjusted EBITDA may be different from the calculation used by other
90
companies and comparability may be limited. The table below reconciles Adjusted EBITDA to consolidated income (loss) before income taxes (in thousands).
| |
Consolidated Year Ended December 31, |
|||||||||
|---|---|---|---|---|---|---|---|---|---|---|
| |
2009 | 2008 | 2007 | |||||||
Income (loss) before income taxes |
$ | 19,797 | $ | (50,201 | ) | $ | (31,527 | ) | ||
Plus: |
||||||||||
Interest expense, net |
45,311 | 47,745 | 46,977 | |||||||
Amortization and depreciation expense |
50,096 | 64,275 | 62,064 | |||||||
Amortization of deferred costs in excess of amortization of deferred revenue |
30,514 | 30,732 | 24,175 | |||||||
Amortization of stock based compensation costs |
496 | 1,448 | 1,469 | |||||||
Other costs, including merger related, recapitalization and consolidation costs |
1,441 | 1,655 | 4,344 | |||||||
Loss on retirement of debt |
— | 12,788 | — | |||||||
Loss on impairment of trade name |
— | 925 | — | |||||||
Less: |
||||||||||
Gain on retirement of debt |
(1,956 | ) | — | — | ||||||
Gain on settlement agreement |
(22,867 | ) | — | — | ||||||
Other income |
— | (54 | ) | (90 | ) | |||||
Adjusted EBITDA |
$ | 122,832 | $ | 109,313 | $ | 107,412 | ||||
17. Subsequent Events:
On January 20, 2010, the Company's Board of Directors announced commencement of a process to explore and evaluate strategic alternatives, including a possible sale of the Company, in order to maximize shareholder value.
On February 22, 2010, the Company entered into amended and restated employment agreements with the Company's three most senior executive officers (collectively, the "Senior Executives").
On February 22, 2010 the Company granted equity awards to the Senior Executives, consisting of (i) an aggregate of 439,160 stock appreciation rights ("SARs") under the Company's 2010 Stock Appreciation Rights Plan (the "2010 SAR Plan"), which was adopted by the Company on February 22, 2010; (ii) an aggregate of 439,160 stock options under the 2008 LTIP; and (iii) restricted share awards for an aggregate of 100,000 shares of restricted stock under the 2008 LTIP (collectively, the "equity awards"). The exercise price for each stock option is $9.50, the closing price of the Company's common stock on the date of grant. The payout for each SAR is equal to the difference between (x) $7.50, and (y) the lesser of: (i) $9.50, the closing price of the Company's common stock on the date of grant, and (ii) the value of a share of Company common stock on the date of exercise. The equity awards vest in one-half increments on each of the second and third anniversary of the grant date so long as the Executive is employed with the Company. Vesting of the equity awards will accelerate upon a change of control of the Company if (x) the Executive is employed with the Company at the time of the change of control or (y) the change of control occurs within two years of the date of grant and within 90 days of the Executive's termination that is a qualifying termination (as defined in each Senior Executive's amended and restated employment agreement). Both the stock options and the restricted shares are subject to all the terms and conditions of the 2008 LTIP as well as the individual award agreements. The SARs are subject to all of the terms and conditions of the 2010 SAR Plan as well as the individual grant agreements.
91
18. Unaudited Quarterly Financial Information:
The following is a summary of the unaudited quarterly financial information for 2009 and 2008, respectively (in thousands, except per share amounts):
| |
Quarter Ended | ||||||||||||
|---|---|---|---|---|---|---|---|---|---|---|---|---|---|
2009
|
March 31 | June 30 | September 30 | December 31 | |||||||||
Revenue |
$ | 93,002 | $ | 92,146 | $ | 92,560 | $ | 90,344 | |||||
Net (loss) income |
$ | (2,801 | ) | $ | (2,535 | ) | $ | (122 | ) | $ | 22,965 | (a) | |
Basic and diluted (loss) income per share |
$ | (0.11 | ) | $ | (0.10 | ) | $ | (0.00 | ) | $ | 0.90 | ||
Weighted average number of shares of common stock outstanding |
25,317 | 25,319 | 25,329 | 25,333 | |||||||||
- (a)
- Fourth quarter results include a $22.9 million gain from the Westar settlement agreement.
| |
Quarter Ended | ||||||||||||
|---|---|---|---|---|---|---|---|---|---|---|---|---|---|
2008
|
March 31 | June 30 | September 30 | December 31 | |||||||||
Revenue |
$ | 91,577 | $ | 92,401 | $ | 94,056 | $ | 93,987 | |||||
Net loss |
$ | (23,078 | ) | $ | (9,090 | ) | $ | (11,144 | ) | $ | (7,230 | ) | |
Basic and diluted loss per share |
$ | (0.91 | ) | $ | (0.36 | ) | $ | (0.44 | ) | $ | (0.29 | ) | |
Weighted average number of shares of common stock outstanding |
25,307 | 25,307 | 25,311 | 25,317 | |||||||||
92
PROTECTION ONE, INC. AND SUBSIDIARIES
SCHEDULE II—VALUATION AND QUALIFYING ACCOUNTS
(In thousands)
Description
|
Balance at Beginning of period |
Charged to costs and expenses |
Deductions(a) | Balance at End of Period |
|||||||||
|---|---|---|---|---|---|---|---|---|---|---|---|---|---|
Year ended December 31, 2007 |
|||||||||||||
Allowances deducted from assets for doubtful accounts |
$ | 7,258 | $ | 3,455 | $ | (4,853 | ) | $ | 5,860 | ||||
Year ended December 31, 2008 |
|||||||||||||
Allowances deducted from assets for doubtful accounts |
$ | 5,860 | $ | 4,644 | $ | (4,305 | ) | $ | 6,199 | ||||
Year ended December 31, 2009 |
|||||||||||||
Allowances deducted from assets for doubtful accounts |
$ | 6,199 | $ | 5,723 | $ | (4,775 | ) | $ | 7,147 | ||||
- (a)
- Results from write-offs.
93
ITEM 9. CHANGES IN AND DISAGREEMENTS WITH ACCOUNTANTS ON ACCOUNTING AND FINANCIAL DISCLOSURE.
There have been no changes in or disagreements with our accountants on any matter of accounting principles or practices, financial statement disclosure, or auditing scope of procedure during the two most recent fiscal years.
ITEM 9A. CONTROLS AND PROCEDURES
Disclosure Controls and Procedures. As of December 31, 2009, the end of the period covered by this report, the Company's management, under the supervision and with the participation of our chief executive officer and our chief financial officer, concluded that, based on the evaluation described below performed for the Company, including both Protection One, Inc. and its subsidiary Protection One Alarm Monitoring, Inc., pursuant to paragraph (b) of Rule 13a-15 or Rule 15d-15 under the Securities Exchange Act of 1934 (the "Exchange Act"), its disclosure controls and procedures are effective (a) to ensure that information required to be disclosed by the Company in reports that it files or submits under the Exchange Act is recorded, processed, summarized and reported and (b) include, without limitation, controls and procedures designed to ensure that information required to be disclosed by us in reports filed or submitted under the Exchange Act is accumulated and communicated to management, including our chief executive officer and chief financial officer, as appropriate to allow timely decisions regarding required disclosure within the time periods specified in Securities and Exchange Commission rules and forms. Our management, including our chief executive officer and chief financial officer, recognize that any set of controls and procedures, no matter how well designed and operated, can provide only reasonable assurance of achieving management's control objectives.
Management's Report on Internal Control over Financial Reporting. The Company's management is responsible for establishing and maintaining adequate internal control over financial reporting, as such term is defined in Rule 13a-15(f) of the Exchange Act. Under the supervision and with the participation of the Company's management, including our chief executive officer and our chief financial officer, the Company conducted an evaluation of the effectiveness of its internal control over financial reporting based upon the framework in Internal Control—Integrated Framework issued by the Committee of Sponsoring Organizations of the Treadway Commission (the "COSO Framework") for Protection One, Inc. and its subsidiaries.
Based on the evaluation under the COSO Framework, the Company's management concluded that the Company's internal control over financial reporting is effective as of December 31, 2009. The Company's independent registered public accounting firm has audited the consolidated financial statements included in this Annual Report on Form 10-K and, as part of their audit, has issued their attestation report on the effectiveness of the Company's internal controls over financial reporting herein as of December 31, 2009. The attestation report is included herein.
Changes in Internal Control over Financial Reporting. There were no changes in the Company's internal control over financial reporting that have materially affected, or are reasonably likely to materially affect, its internal control over financial reporting during the fourth fiscal quarter of 2009.
94
REPORT OF INDEPENDENT REGISTERED PUBLIC ACCOUNTING FIRM
To
the Board of Directors and Stockholders of
Protection One, Inc.
Lawrence, Kansas
We have audited the internal control over financial reporting of Protection One, Inc. and subsidiaries (the "Company") as of December 31, 2009, based on criteria established in Internal Control—Integrated Framework issued by the Committee of Sponsoring Organizations of the Treadway Commission. The Company's management is responsible for maintaining effective internal control over financial reporting and for its assessment of the effectiveness of internal control over financial reporting, included in the accompanying Management's Report on Internal Control over Financial Reporting. Our responsibility is to express an opinion on the Company's internal control over financial reporting based on our audit.
We conducted our audit in accordance with the standards of the Public Company Accounting Oversight Board (United States). Those standards require that we plan and perform the audit to obtain reasonable assurance about whether effective internal control over financial reporting was maintained in all material respects. Our audit included obtaining an understanding of internal control over financial reporting, assessing the risk that a material weakness exists, testing and evaluating the design and operating effectiveness of internal control based on the assessed risk, and performing such other procedures as we considered necessary in the circumstances. We believe that our audit provides a reasonable basis for our opinion.
A company's internal control over financial reporting is a process designed by, or under the supervision of, the company's principal executive and principal financial officers, or persons performing similar functions, and effected by the company's board of directors, management, and other personnel to provide reasonable assurance regarding the reliability of financial reporting and the preparation of financial statements for external purposes in accordance with generally accepted accounting principles. A company's internal control over financial reporting includes those policies and procedures that (1) pertain to the maintenance of records that, in reasonable detail, accurately and fairly reflect the transactions and dispositions of the assets of the company; (2) provide reasonable assurance that transactions are recorded as necessary to permit preparation of financial statements in accordance with generally accepted accounting principles, and that receipts and expenditures of the company are being made only in accordance with authorizations of management and directors of the company; and (3) provide reasonable assurance regarding prevention or timely detection of unauthorized acquisition, use, or disposition of the company's assets that could have a material effect on the financial statements.
Because of the inherent limitations of internal control over financial reporting, including the possibility of collusion or improper management override of controls, material misstatements due to error or fraud may not be prevented or detected on a timely basis. Also, projections of any evaluation of the effectiveness of the internal control over financial reporting to future periods are subject to the risk that the controls may become inadequate because of changes in conditions, or that the degree of compliance with the policies or procedures may deteriorate.
In our opinion, the Company maintained, in all material respects, effective internal control over financial reporting as of December 31, 2009, based on the criteria established in Internal Control—Integrated Framework issued by the Committee of Sponsoring Organizations of the Treadway Commission.
95
We have also audited, in accordance with the standards of the Public Company Accounting Oversight Board (United States), the consolidated financial statements and financial statement schedule as of and for the year ended December 31, 2009 of the Company and our report dated March 23, 2010, expressed an unqualified opinion on those financial statements and financial statement schedule.
/s/ DELOITTE & TOUCHE LLP
Kansas
City, Missouri
March 23, 2010
There were no items required to be disclosed in a report on Form 8-K during the fourth quarter that were not reported.
96
ITEM 10. DIRECTORS, EXECUTIVE OFFICERS AND CORPORATE GOVERNANCE.
Information relating to our directors, nominees for directors and executive officers is set forth under the heading "Election of Directors" and "Information About the Board of Directors," information relating to our executive officers is set forth under the headings "Executive Officers" and "Executive Compensation and Related Information," and information relating to compliance with Section 16(a) of the Exchange Act and our code of ethics is set forth under the heading "Additional Information," each in the Proxy Statement or Information Statement relating to the Annual Meeting of Stockholders to be held in 2010, which will be filed with the Securities and Exchange Commission no later than April 30, 2010, and which is incorporated herein by reference.
ITEM 11. EXECUTIVE COMPENSATION.
Information relating to our executive officers and executive compensation is set forth under the heading "Executive Compensation and Related Information" in the Proxy Statement or Information Statement relating to the Annual Meeting of Stockholders to be held in 2010, which will be filed with the Securities and Exchange Commission no later than April 30, 2010, and which is incorporated herein by reference.
ITEM 12. SECURITY OWNERSHIP OF CERTAIN BENEFICIAL OWNERS AND MANAGEMENT AND RELATED STOCKHOLDER MATTERS.
Information relating to the security ownership of certain beneficial owners and management is set forth under the heading "Security Ownership of Certain Beneficial Owners" and information relating to securities authorized for issuance under equity compensations plans is set forth under the heading "Executive Compensation and Related Information" in the Proxy Statement or Information Statement relating to the Annual Meeting of Stockholders to be held in 2010, which will be filed with the Securities and Exchange Commission no later than April 30, 2010, and which is incorporated herein by reference.
ITEM 13. CERTAIN RELATIONSHIPS AND RELATED TRANSACTIONS, AND DIRECTOR INDEPENDENCE.
Information relating to certain relationships and related transactions concerning directors and executive officers is set forth under the heading "Certain Relationships and Related Transactions" and information related to director independence is set forth under the heading "Information About the Board of Directors" in the Proxy Statement or Information Statement relating to the Annual Meeting of Stockholders to be held in 2010, which will be filed with the Securities and Exchange Commission no later than April 30, 2010, and which is incorporated herein by reference.
ITEM 14. PRINCIPAL ACCOUNTING FEES AND SERVICES.
Information relating to our principal accounting fees and services is set forth under the heading "Relationship with Independent Registered Public Accounting Firm" in the Proxy Statement or Information Statement relating to the Annual Meeting of Stockholders to be held in 2010, which will be filed with the Securities and Exchange Commission no later than April 30, 2010, and which is incorporated herein by reference.
97
ITEM 15. EXHIBITS, FINANCIAL STATEMENT SCHEDULES.
(a) 1. The following financial statements are included in Item 8, "Financial Statements and Supplementary Data."
Consolidated Balance Sheets
Consolidated Statements of Operations and Comprehensive Income (Loss)
Consolidated Statements of Cash Flows
Consolidated Statements of Stockholders' Equity (Deficiency in Assets)
2. The following financial statement schedule is included in Item 8, "Financial Statements and Supplementary Data."
Schedule II—Valuation and Qualifying Accounts.
All other schedules for which provision is made in the applicable accounting regulations of the Commission are not required under the related instructions or are inapplicable and, therefore, have been omitted.
3. The following documents are filed or furnished as a part of this report:
Exhibit No.
|
Exhibit Description | ||
|---|---|---|---|
| 2.1 | Agreement and Plan of Merger, dated as of December 20, 2006, by and among the Company, IASG and Tara Acquisition Corp. (incorporated by reference to Exhibit 2.1 of the Current Report on Form 8-K dated December 21, 2006). | ||
3.1 |
Amended and Restated Certificate of Incorporation of the Company, effective as of February 8, 2005 (incorporated by reference to Exhibit 3.1 to the Annual Report on Form 10-K filed by the Company and POAMI for the year ended December 31, 2004, as amended (the "Fiscal 2004 Form 10-K, as amended")). |
||
3.2 |
By-laws of the Company, as amended and restated March 17, 2005 (incorporated by reference to Exhibit 3.1 of the Current Report on Form 8-K dated March 17, 2005). |
||
10.1 |
1997 Long-Term Incentive Plan of the Company, as amended (incorporated by reference to Exhibit 10.3 to the Fiscal 2004 Form 10-K, as amended).* |
||
10.2 |
Integrated Alarm Services Group, Inc. 2003 Stock Option Plan.*+ |
||
10.3 |
Integrated Alarm Services Group, Inc. 2004 Stock Incentive Plan.*+ |
||
10.4 |
2004 Stock Option Plan (incorporated by reference to Exhibit 10.3 of the Current Report on Form 8-K filed by the Company and POAMI dated February 8, 2005).* |
||
10.5 |
Form of Option Agreement for Named Executive Officers under 2004 Stock Option Plan (incorporated by reference to Exhibit 10.4 of the Current Report on Form 8-K dated February 8, 2005).* |
||
10.6 |
Form of Option Agreement for Non-Named Executive Officers under 2004 Stock Option Plan (incorporated by reference to Exhibit 10.5 of the Current Report on Form 8-K dated February 8, 2005).* |
||
10.7 |
Stock Appreciation Rights Plan (incorporated by reference to Exhibit 10.6 of the Current Report on Form 8-K dated February 8, 2005).* |
||
98
Exhibit No.
|
Exhibit Description | ||
|---|---|---|---|
| 10.8 | Form of Grant Agreement under Stock Appreciation Rights Plan (incorporated by reference to Exhibit 10.7 of the Current Report on Form 8-K dated February 8, 2005).* | ||
10.9 |
Protection One, Inc. 2008 Long-Term Incentive Plan (incorporated by reference to Appendix A to the Company's Schedule 14C Definitive Information Statement, filed with the Securities and Exchange Commission on April 29, 2008).* |
||
10.10 |
Form of Restricted Share Unit Agreement (incorporated by reference to Exhibit I to Appendix A to the Company's Schedule 14C Definitive Information Statement, filed with the Securities and Exchange Commission on April 29, 2008).* |
||
10.11 |
2009 Short-Term Incentive Plan of the Company (incorporated by reference to Exhibit 10.1 of the Current Report on Form 8-K dated June 3, 2009).* |
||
10.12 |
Protection One, Inc. 2010 Stock Appreciation Rights Plan (incorporated by reference to Exhibit 10.6 of the Current Report on Form 8-K dated February 22, 2010).* |
||
10.13 |
Form of Stock Option Agreement (incorporated by reference to Exhibit 10.4 of the Current Report on Form 8-K dated February 22, 2010).* |
||
10.14 |
Form of Restricted Shares Award Agreement (incorporated by reference to Exhibit 10.5 of the Current Report on Form 8-K dated February 22, 2010).* |
||
10.15 |
Amended and Restated Employment Agreement by and between Protection One, Inc. and Protection One Alarm Monitoring, Inc. and Richard Ginsburg dated as of February 22, 2010 (incorporated by reference to Exhibit 10.1 of the Current Report on Form 8-K dated February 22, 2010).* |
||
10.16 |
Amended and Restated Employment Agreement by and between Protection One, Inc. and Protection One Alarm Monitoring, Inc. and Darius G. Nevin dated as of February 22, 2010 (incorporated by reference to Exhibit 10.2 of the Current Report on Form 8-K dated February 22, 2010).* |
||
10.17 |
Amended and Restated Employment Agreement by and between Protection One, Inc. and Protection One Alarm Monitoring, Inc. and Peter J. Pefanis dated as of February 22, 2010 (incorporated by reference to Exhibit 10.3 of the Current Report on Form 8-K dated February 22, 2010).* |
||
10.18 |
Employment Agreement dated July 23, 2004 between Protection One, Inc., Protection One Alarm Monitoring, Inc and J. Eric Griffin (incorporated by reference to Exhibit 10.58 to the Fiscal 2004 Form 10-K, as amended).* |
||
10.19 |
First Amendment to Employment Agreement dated February 8, 2005 between Protection One, Inc., Protection One Alarm Monitoring, Inc and J. Eric Griffin (incorporated by reference to Exhibit 10.59 to the Fiscal 2004 Form 10-K, as amended).* |
||
10.20 |
Second Amendment to Employment Agreement, dated December 3, 2008, between and among Protection One, Inc., Protection One Alarm Monitoring, Inc. and J. Eric Griffin.*+ |
||
10.21 |
Employment Agreement, dated July 23, 2004, between Protection One, Inc., Protection One Alarm Monitoring, Inc., Security Monitoring Services, Inc. (d/b/a CMS), and Anthony Wilson (incorporated by reference to Exhibit 10.1 to the Quarterly Report on Form 10-Q filed by the Company and POAMI for the quarter ended March 31, 2009).* |
||
99
Exhibit No.
|
Exhibit Description | ||
|---|---|---|---|
| 10.22 | First Amendment to Employment Agreement, dated February 8, 2005, between Protection One, Inc., Protection One Alarm Monitoring, Inc., Security Monitoring Services, Inc. (d/b/a CMS), and Anthony Wilson (incorporated by reference to Exhibit 10.2 to the Quarterly Report on Form 10-Q filed by the Company and POAMI for the quarter ended March 31, 2009).* | ||
10.23 |
Second Amendment to Employment Agreement, dated December 3, 2008, between Protection One, Inc., Protection One Alarm Monitoring, Inc., Security Monitoring Services, Inc. (d/b/a CMS), and Anthony Wilson (incorporated by reference to Exhibit 10.3 to the Quarterly Report on Form 10-Q filed by the Company and POAMI for the quarter ended March 31, 2009).* |
||
10.24 |
Employment Agreement dated July 23, 2004 between Protection One, Inc., Protection One Alarm Monitoring, Inc and Joseph Sanchez (incorporated by reference to Exhibit 10.12 to the Fiscal 2006 Form 10-K).* |
||
10.25 |
First Amendment to Employment Agreement dated February 8, 2005 between Protection One, Inc., Protection One Alarm Monitoring, Inc and Joseph Sanchez (incorporated by reference to Exhibit 10.13 to the Fiscal 2006 Form 10-K).* |
||
10.26 |
Second Amendment to Employment Agreement, dated December 3, 2008, between and among Protection One, Inc., Protection One Alarm Monitoring, Inc. and Joseph Sanchez.*+ |
||
10.27 |
Registration Rights Agreement, dated as of February 8, 2005, by and between the Company and Quadrangle (incorporated by reference to Exhibit 10.2 of the Current Report on Form 8-K dated February 8, 2005). |
||
10.28 |
Management Stockholder's Agreement, dated as of February 8, 2005 (incorporated by reference to Exhibit 10.8 of the Current Report on Form 8-K dated February 8, 2005).* |
||
10.29 |
Reorganization Agreement, dated as of December 18, 2006, by and among Protection One, Inc., POI Acquisition I, Inc. and the other affiliates of Quadrangle Group LLC named therein (incorporated by reference to Exhibit 10.4 of the Current Report on Form 8-K dated December 21, 2006). |
||
10.30 |
Amended and Restated Stockholders Agreement dated April 2, 2007, among Quadrangle Master Funding Ltd., POI Acquisition, LLC and the Company (incorporated by reference to Exhibit 10.1 of the Current Report on Form 8-K dated April 2, 2007). |
||
10.31 |
Credit Agreement dated March 14, 2008, among the Company and other parties named therein (incorporated by reference to Exhibit 10.1 of the Current Report on Form 8-K dated March 14, 2008). |
||
10.32 |
Second Amended and Restated Credit Agreement dated November 17, 2009, by and among Protection One Alarm Monitoring, Inc., Protection One, Inc., the lenders party thereto and J.P. Morgan Securities Inc., as sole lead arranger and sole book manager, Bank of America N.A., as documentation agent and JPMorgan Chase Bank, N.A., as administrative agent (incorporated by reference to Exhibit 10.1 of the Current Report on Form 8-K dated November 17, 2009). |
||
21.1 |
Subsidiaries of the Company.+ |
||
23.1 |
Consent of Deloitte & Touche LLP, Independent Registered Public Accounting Firm + |
||
100
Exhibit No.
|
Exhibit Description | ||
|---|---|---|---|
| 31.1 | Certification pursuant to Section 302 of the Sarbanes-Oxley Act of 2002 for Protection One, Inc. + | ||
31.2 |
Certification pursuant to Section 302 of the Sarbanes-Oxley Act of 2002 for Protection One, Inc. + |
||
32.1 |
Certification of Principal Executive Officer pursuant to 18 U.S.C. Section 1350, as adopted pursuant to Section 906 of the Sarbanes-Oxley Act of 2002 for Protection One, Inc. + |
||
32.2 |
Certification of Principal Financial Officer pursuant to 18 U.S.C. Section 1350, as adopted pursuant to Section 906 of the Sarbanes-Oxley Act of 2002 for Protection One, Inc. + |
||
- *
- Each
Exhibit marked with an asterisk constitutes a management contract or compensatory plan or arrangement required to be filed or incorporated by reference
as an Exhibit to this report pursuant to Item 15(c) of Form 10-K.
- +
- Filed or furnished herewith.
(b) The exhibits required by Item 601 of Regulation S-K are filed or furnished herewith.
101
Pursuant to the requirements of Section 13 and 15(d) of the Securities Exchange Act of 1934, the Registrants have duly caused this report to be signed on their behalf by the undersigned, thereunto duly authorized.
| PROTECTION ONE, INC. | ||||
Date: March 23, 2010 |
By: |
/s/ DARIUS G. NEVIN Darius G. Nevin, Executive Vice President and Chief Financial Officer |
||
Pursuant to the requirements of the Securities Exchange Act of 1934, this report has been signed below by the following persons on behalf of the registrant and in the capacities and on the dates indicated.
Signature
|
Title
|
Date
|
||
|---|---|---|---|---|
| /s/ RICHARD GINSBURG Richard Ginsburg |
President, Chief Executive Officer and Director (Principal Executive Officer) | March 23, 2010 | ||
/s/ DARIUS G. NEVIN Darius G. Nevin |
Executive Vice President and Chief Financial Officer (Principal Financial Officer) |
March 23, 2010 |
||
/s/ SARAH STRAHM Sarah Strahm |
Chief Accounting Officer (Principal Accounting Officer) |
March 23, 2010 |
||
/s/ PETER R. EZERSKY Peter R. Ezersky |
Director |
March 23, 2010 |
||
/s/ ALEX HOCHERMAN Alex Hocherman |
Director |
March 23, 2010 |
||
/s/ RAYMOND C. KUBACKI Raymond C. Kubacki |
Director |
March 23, 2010 |
||
/s/ ROBERT J. MCGUIRE Robert J. McGuire |
Director |
March 23, 2010 |
||
/s/ THOMAS J. RUSSO Thomas J. Russo |
Director |
March 23, 2010 |
||
/s/ EDWARD SIPPEL Edward Sippel |
Director |
March 23, 2010 |
||
/s/ MICHAEL WEINSTOCK Michael Weinstock |
Director |
March 23, 2010 |
||
/s/ ARLENE M. YOCUM Arlene M. Yocum |
Director |
March 23, 2010 |
102