Attached files
| file | filename |
|---|---|
| 8-K - FORM 8-K - KINDRED HEALTHCARE, INC | d8k.htm |
 Kindred Healthcare NYSE:KND Investor Presentation March 2010 EXHIBIT 99.1 |
 FORWARD-LOOKING STATEMENTS This presentation includes forward-looking statements within the meaning of Section 27A of the
Securities Act of 1933, as amended, and Section 21E of the Securities Exchange Act of 1934, as
amended. All statements regarding the Company’s expected future financial position, results of operations, cash flows, financing plans, business strategy, budgets, capital expenditures, competitive positions, growth opportunities, plans and objectives of management and statements containing
words such as “anticipate,” “approximate,” “believe,” “plan,” “estimate,” “expect,” “project,” “could,” “should,” “will,” “intend,”
“may” and other similar expressions, are forward-looking statements. Such
forward-looking statements are inherently uncertain, and stockholders and other potential investors must recognize that actual results may differ materially from the Company’s expectations as a result of a variety of factors, including, without limitation, those discussed below.
Such forward-looking statements are based upon management’s current expectations and include known and unknown risks, uncertainties and other factors, many of which the Company is unable to
predict or control, that may cause the Company’s actual results or performance to differ
materially from any future results or performance expressed or implied by such forward-looking statements. These statements involve risks, uncertainties and other factors discussed below and detailed from time to time in the Company's filings with the Securities and Exchange Commission.
In addition to the factors set forth above, other factors that may affect the Company’s
plans or results include, without limitation, (a) the potential impact of healthcare reform, which would initiate significant reforms to the United States healthcare system, including potential material changes
to the delivery of healthcare services and the reimbursement paid for such services by the
government or other third party payors. Healthcare reform would impact each of the Company’s businesses in some manner. Due to the substantial regulatory changes that would need to be implemented by the Center for Medicare and Medicaid Services and others, and the numerous processes
required to implement these reforms, the Company cannot predict which healthcare initiatives
will be implemented at the federal or state level, the timing of any such reforms, or the effect such reforms or any other future legislation or regulation will have on the Company’s business, financial position, results of operations and liquidity, (b) changes in the
reimbursement rates or the methods or timing of payment from third party payors, including the Medicare and Medicaid programs, changes arising from and related to the Medicare prospective payment system
for long-term acute care (“LTAC”) hospitals, including potential changes in the
Medicare payment rules, Medicare Part D and changes in Medicare and Medicaid reimbursements for the Company’s nursing centers, and the expiration of the Medicare Part B therapy cap exception process, (c) the effects of additional legislative changes and government regulations,
interpretation of regulations and changes in the nature and enforcement of regulations governing the healthcare industry, (d) the impact of the SCHIP Extension Act of 2007 (the “SCHIP
Extension Act”), including the ability of the Company’s hospitals to adjust to potential LTAC certification, medical necessity reviews and the three-year moratorium on future hospital development
that expires December 29, 2010, (e) the impact of the expiration of several moratoriums under
the SCHIP Extension Act which could impact the short stay rules, the budget neutrality adjustment as well as implement the so-called “25 Percent Rule,” which would limit certain patient admissions, (f) failure of the Company’s facilities to meet applicable licensure and certification
requirements, (g) the further consolidation and cost containment efforts of managed care organizations and other third party payors, (h) the Company’s ability to meet its rental and debt
service obligations, (i) the Company’s ability to operate pursuant to the terms of its debt obligations and its master lease agreements with Ventas, Inc. (NYSE:VTR), (j) the condition of the
financial markets, including volatility and weakness in the equity, capital and credit markets, which could limit the availability and terms of debt and equity financing sources to fund the requirements
of the Company’s businesses, or which could negatively impact its investment portfolio,
(k) national and regional economic, financial, business and political conditions, including their effect on the availability and cost of labor, credit, materials and other services, (l) the Company’s ability to control costs, particularly labor and employee benefit costs, (m) increased
operating costs due to shortages in qualified nurses, therapists and other healthcare personnel, (n) the Company’s ability to attract and retain key executives and other healthcare personnel, (o) the
increase in the costs of defending and insuring against alleged professional liability claims and the Company’s ability to predict the estimated costs related to such claims, including the impact
of differences in actuarial assumptions and estimates compared to eventual outcomes, (p) the
Company’s ability to successfully reduce (by divestiture of operations or otherwise) its exposure to professional liability claims, (q) the Company’s ability to successfully pursue its development activities, including through acquisitions, and successfully integrate new operations,
including the realization of anticipated revenues, economies of scale, cost savings and productivity gains associated with such operations, (r) the Company’s ability to successfully dispose
of unprofitable facilities, (s) events or circumstances which could result in impairment of an asset or other charges, (t) changes in generally accepted accounting principles or practices, and (u) the
Company’s ability to maintain an effective system of internal control over financial reporting. Many of these factors are beyond the Company’s control. The Company cautions investors that
any forward-looking statements made by the Company are not guarantees of future performance. The Company disclaims any obligation to update any such factors or to announce publicly the
results of any revisions to any of the forward-looking statements to reflect future events
or developments. The information being provided today is as of this date only and the Company
disclaims any obligation to update any such factors or to announce publicly the results of any revisions to any of the forward-looking statements to reflect future events or developments. Additional information
concerning the Company, including our fourth quarter 2009 earnings release is available along with our other SEC filings and a copy of this presentation, on our website www.kindredhealthcare.com, under
the heading “Investor Information.” Reconciliation of non-GAAP Financial Measures
Our website also includes reconciliations of any non-GAAP financial measures we mention in
our presentations to their corresponding GAAP measures. These reconciliations may be found at www.kindredhealthcare.com under the heading “Investor Information.” 2 |
 3 621 (3) sites of service, 305 facilities in 41 states 54,100 (3) dedicated employees, making Kindred a top-200 private employer in the U.S. (4) 32,000 (3) patients and residents per day $4.3 billion (2) consolidated revenues LARGEST DIVERSIFIED POST-ACUTE PROVIDER IN THE UNITED STATES (1) (1) Ranking based on revenues. (2) Revenues for the fiscal year ended December 31, 2009. (3) As of December 31, 2009. (4) Ranking provided by TMP, Inc. |
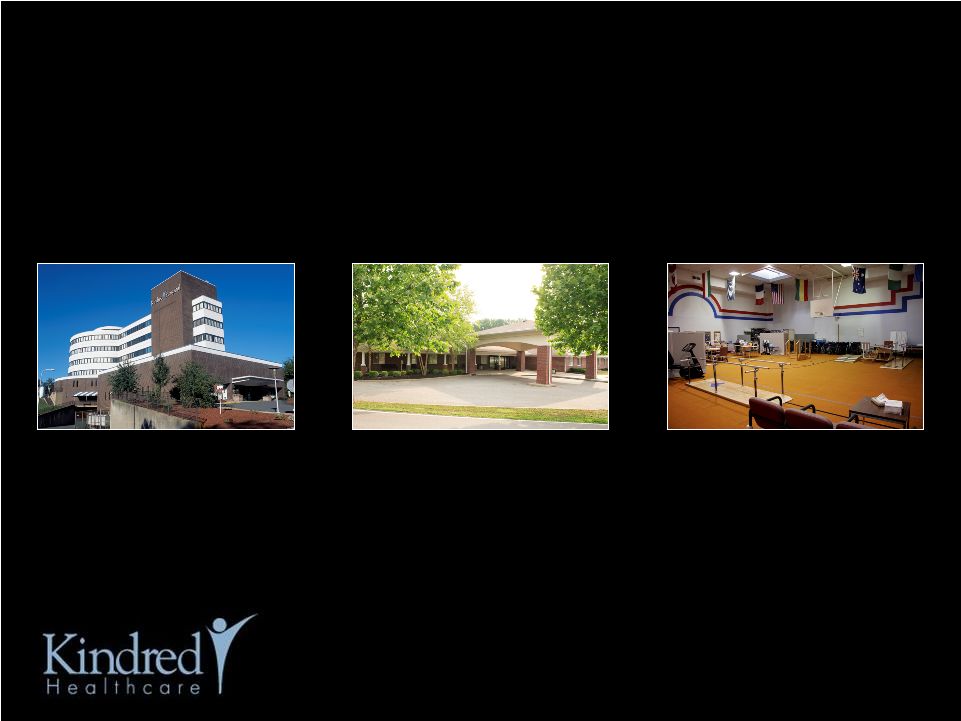 4 $1.9 billion revenues (1) HOSPITAL Long-term Acute Care Hospitals $2.2 billion revenues (1) HEALTH SERVICES Nursing and Rehabilitation Centers $475 million revenues (1) REHABILITATION Peoplefirst Rehabilitation Services (1) Revenues for the fiscal year ended December 31, 2009 (divisional revenues before intercompany eliminations). (2) Ranking based on revenues. THREE MARKET LEADING BUSINESSES, POSITIONED FOR GROWTH IN A CHANGING POST-ACUTE ENVIRONMENT • Largest operator in U.S. (2) • 83 hospitals with 6,580 licensed beds • Second largest nursing center operator in U.S. (2) • 222 nursing centers with 27,196 licensed beds • 6 assisted living residences with 327 licensed beds • Second largest contract therapy company in U.S. (2) • 316 external locations served through 5,000 therapists and 8,400 total employees |
 5 DIVERSE GEOGRAPHIC PORTFOLIO WITH INCREASED FOCUS ON CLUSTER MARKET DEVELOPMENT 83 HOSPITALS 222 NURSING CENTERS 316 EXTERNAL REHAB CUSTOMERS CLUSTER MARKET DEVELOPMENT FOCUS As of December 31, 2009 |
 6 |
 7 POST-ACUTE LANDSCAPE CHANGE DRIVERS • Long-term growth prospects supported by strong demographic trends and significant increase in the incidence of chronic diseases • Advances in medical technology, clinical practice and new integrated delivery models • Payors and consumers looking for lower cost settings and clinical differentiation • Government policy and healthcare reform |
 8 HEALTHCARE REFORM • The Senate legislation passed by the House and signed by President Obama extends the therapy cap exception process through December 2010 and the MMSEA LTACH provisions for two additional years until the end of 2012 • System and payment reforms will accelerate under healthcare reform and expanded HHS and Medicare Commission authority • Projects and pilots will focus on integrated and coordinated care and payment, e.g. Bundling, Accountable Care Organizations (ACOs), and Continuing Care Hospitals • Payment reforms will occur over 10 years through market basket reductions, productivity adjustments and other performance factors, e.g., avoidable hospital readmissions |
 9 OPPORTUNITIES FOR GROWTH WITHIN CHANGING POST-ACUTE LANDSCAPE Patient Illness Severity SKILLED NURSING FACILITIES HOSPICE HOME HEALTH CARE ADULT DAY CARE OUTPATIENT REHAB ASSISTED LIVING ACUTE CARE HOSPITALS TRANS TRANS CARE CAR
E RE
E ICU ICU IN-PATIENT REHAB LTACs FREESTANDING/ HIH HOME |
 10 Portfolio Strategy Current Business Strategy Long-Term Strategic Initiatives |
 11 Portfolio Strategy • Reinvest in our SNFs and selectively acquire SNFs and ALFs in Cluster Markets • Reinvest/develop new LTACs and hospital-based subacute units • Build our Peoplefirst Rehab business (SNF/Hospital/inpatient and outpatient) |
 12 • Leverage Culture and Performance Improvement Process including: – Company-wide Service Excellence Program – Employee Satisfaction and Engagement Programs • Continue to energize our Sales and Marketing efforts • Execute on a market specific Managed Care Strategy • Develop and expand Physician Services and relationships Current Business Strategy |
 13 Long-Term Strategic Initiatives • Develop Centers of Clinical Excellence • Develop Post-Acute Service Lines and better manage patients across the continuum (i.e., LTAC to subacute or SNF to Homecare/Hospice/ALF) • Cluster Market Development • Execute on Hospice/Home Health strategy • Promote our Value Proposition |
 14 • Orthopedic and other Rehab • Cardio/Pulmonary Rehab • Complex Wound, Stroke Recovery and other Medically Complex Care • Respiratory Therapy, including Vent/Trach Care • Diabetes, Renal Care and Infectious Disease Management, including dialysis services DEVELOPING CENTERS OF CLINCIAL EXCELLENCE AND EXPANDING CLINICAL PROGRAMS (BASED ON MARKET NEED CAPABILITIES) |
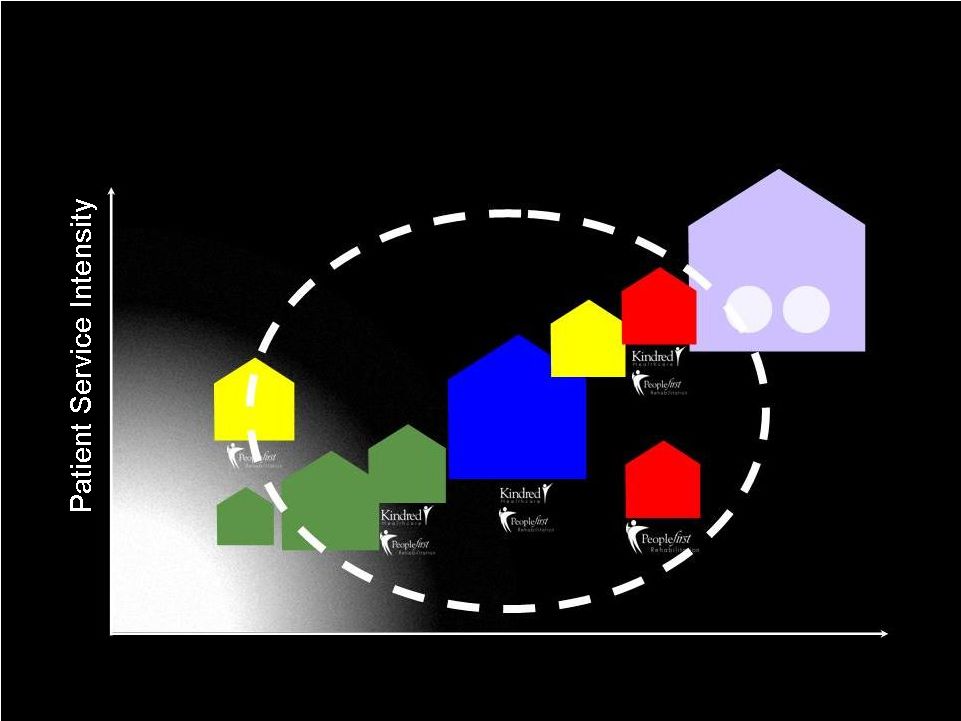
 15 Typical Reimbursement Per Patient Day $130-180 92+ days 1.0-1.5 Yes 0 3.25-3.4 every 30 days Yes Kindred Long Term Care SNFs (Including Alzheimer's, Hospice and Palliative Care) (84) $300-600 20-40 days 2.0-3.0 Yes 0-1.0 4.0-5.0 2-3 times weekly Yes Kindred Transitional Care Units (TCU) (102 Units) $300-600 20-40 days 2.0-3.0 Yes 0-1.0 4.0-5.0 2-3 times weekly Yes Kindred Transitional Care Centers (TCC) (32 Centers) $400-700 15-30 days 2.5-3.5 Yes 1.0-1.5 5.0-6.5 3-4 times weekly/offered daily Yes Kindred Hospital Based Sub-Acute Units (12 Units) $1,200-1,800 26 days 0-2 Yes (Interdisciplinary) 2-3 6-9 Daily Yes Kindred LTACs (83 Hospitals) $850-1,250 12 - 18 days Typical Length-of-Stay at least 3.0 Rehab Therapy Yes Multidisciplinary Team Approach 0 Respiratory Therapy Hours 5.0-7.5 Nursing Hours Per Patient Day 3-4 times weekly/offered daily Active Physician Supervision Yes 24-hour Registered Nursing Care General Inpatient Rehab Facilities KINDRED’S DEVELOPING POST-ACUTE SERVICE LINES Kindred’s targeted staffing and service approaches |
 16 • A framework and strategy to improve operations in sites of service that are geographically proximate • A business strategy to position assets/service lines and deploy capital to take advantage of an increasingly integrated healthcare delivery system in certain local markets • A competitive strategy to differentiate Kindred in certain local markets CLUSTER MARKET DEFINED |
 17 • Centralized Business Office Operations • Coordinated Human Resource and Staffing Functions • Shared Services (e.g., lab, radiology, etc.) • Collaborative Sales and Marketing • Collaborative Managed Care Strategy • Collaborative Physician Services Strategy • Coordinated Care, Continuum of Care Management and/or integrated case management opportunities ASPECTS OF A CLUSTER MARKET STRATEGY |
 18 SERVICE LINE COVERAGE IN CLUSTER MARKETS Reflects anticipated development activity - - - 2 3 - - 2 1 2 Cleveland - 1 1 1 3 Las Vegas 1 6 - 1 2 Louisville - 2 5 - 2 Indianapolis 12 11 2 - 5 Boston Long-Term Care SNFs (Including Alzheimer's, Hospice and Palliative Care) Transitional Care Units (TCU) Transitional Care Centers (TCC) Subacut e Units LTACHs Decreasing Patient Acuity/Intensity of Service Houston - - - - 1 1 HomeCare and Hospice 5 5 6 10 10 31 Total Sites of Service |
 19 SPECIFIC GROWTH INITIATIVES |
 20 HEALTH SERVICES DIVISION GROWTH INITIATIVES • Organic growth driven by improving quality, enhancing clinical capabilities and improving customer service • Improving productivity and accountability of sales and marketing team • Improved contracting and relationship management with managed care organizations • Execution of our TCC and TCU strategy – Primary Growth Driver for nursing center business in 2010 – Strategy is to drive growth by focusing on highest potential subset of nursing centers in portfolio – Represents three to five year program |
 21 HEALTH SERVICES FACILITY COMPARISON EBITDARM Margin % Occupancy % Medicare & Managed Care Census % Capital Investment Transitional Care Centers (TCCs) (32) 16% to 18% 92% 44% to 52% $25 million Transitional Care Units (TCUs) (102) 14% to 16% 90% 31% to 35% $23 million Traditional Nursing Centers (84) 12% to 14% 90% 23% to 28% $12 million Comparison does not include data for four managed facilities.
|
 22 HOSPITAL DIVISION GROWTH INITIATIVES • Organic opportunities – Deepen relationships with referral sources and physician groups – Increase admissions through managed care contracting – Use new technology to increase speed of referrals/admissions – electronic referral software, automate patient assessment documentation, laptops and hand-held devices for sales team • Service Line Development – Continue to expand clinical capabilities and programs including ICU and telemetry units. Enhance diagnostic and treatment capabilities including CT scanners and hyperbaric chambers for complex wound care – Expand existing co-located hospital-based subacute units from 7 to 12 • Continue to selectively develop new hospitals in cluster markets |
 23 HOSPITAL DEVELOPMENT 2008 - 2011 83 HOSPITALS AS OF DEC. 31, 2009 HOSPITALS EXPECTED TO BE OPENED IN ‘10 AND ‘11 HOSPITALS OPENED ‘08 AND ‘09 REPLACEMENT HOSPITALS • The Palm Beaches 70-bed LTAC Opened: Aug. 2008 Total Capital: $31 Million • Melbourne 60-bed LTAC Opened: Dec. 2009 Total Capital: $31 Million • Springfield 50-bed LTAC Opening date: Q4 2010 Total Capital: $24 Million • Torrance 50-bed HIH Opening date: Q4 2010 Total Capital: $6 Million • Seattle First Hill 50-bed LTAC Opening date: Q3 2011 Total Capital: $23 Million • Sacramento 58-bed LTAC Opening date: Q3 2010 Total Capital: $43 Million • Houston 72-bed LTAC Opening date: Q2 2010 |
 24 HOSPITAL-BASED SUBACUTE UNIT DEVELOPMENT 2009 - 2012 83 HOSPITALS AS OF DEC. 31, 2009 HOSPITAL-BASED SUBACUTE UNITS EXPECTED TO BE OPENED IN ‘10 AND ‘11 EXISTING HOSPITAL-BASED SUBACUTE UNITS • Pittsburgh 39-bed unit • Springfield - Parkview 28-bed unit • Louisville 47-bed unit • Greensboro 23-bed unit • Las Vegas - Flamingo 50-bed unit • Brea 38-bed co-located subacute unit Opened: Mar. 2009 Total Capital: $3 Million • Cleveland Expanding 40-bed co-located subacute unit to 70 beds Opening date: Q2 2012 Total Capital: $4 Million • Houston Medical Center 28-bed co-located subacute unit Opening date: Q3 2011 Total Capital: $2 Million • Houston - Bay Area converting existing hospital into a subacute facility • Dallas 32-bed co-located subacute unit Opening date: Q3 2011 Total Capital: $2 Million • Seattle - First Hill 30-bed co-located subacute unit Opening date: Q3 2011 Total Capital: $9 Million • Seattle - Northgate 30-bed co-located subacute unit Opening date: Q4 2010 Total Capital: $4 Million |
 25 PEOPLEFIRST REHABILITATION GROWTH INITIATIVES • New Contract Growth and Customer Marketing Program • New Patient Case Management Initiative • Services Expansion (Cardio-Pulmonary Rehab, Wound Care, Stroke Recovery) • RehabMax – Operational and capital program ($10 million) to refurbish and expand gym space, upgrade equipment and enhance brand image in all rehab departments at our hospital-based subacute units, TCCs and TCUs |
 26 FINANCIAL REVIEW |
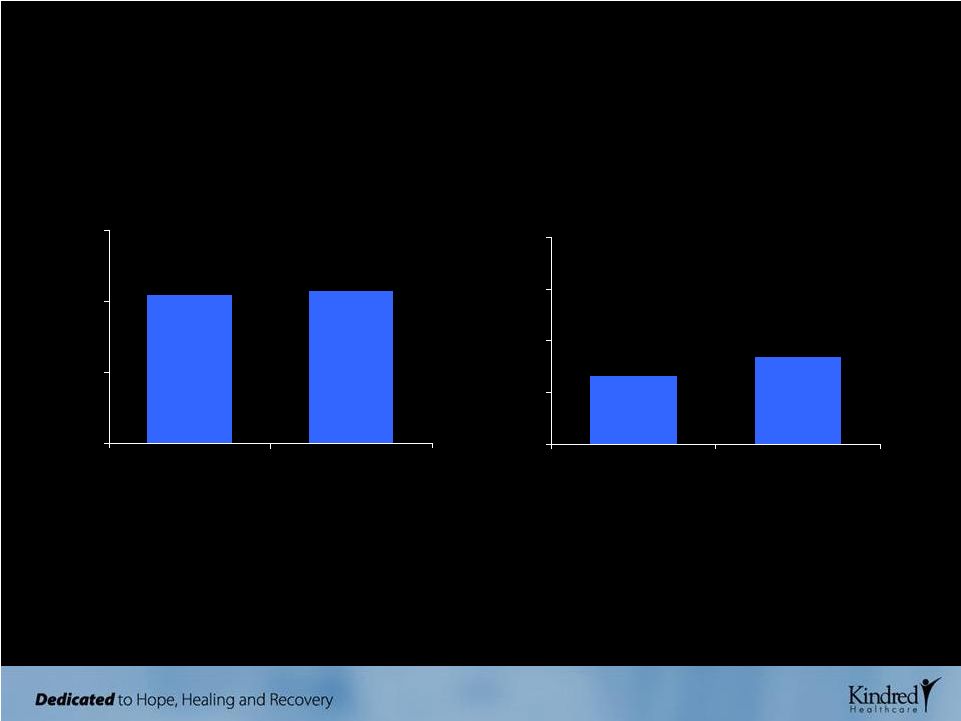 27 Q4 HIGHLIGHTS CONTINUING OPERATIONS CONSOLIDATED REVENUES ($ millions) $1,037 $1,070 $0 $500 $1,000 $1,500 Q4 '08 Q4 '09 DILUTED EPS Diluted EPS reported at $0.42, exceeding our guidance of $0.30 to $0.35 $0.33 $0.42 $0.00 $0.25 $0.50 $0.75 $1.00 Midpoint of Q4 '09 Guidance Q4 '09 Consolidated revenues grew 3% compared to Q4 ‘08 |
 28 Q4 HIGHLIGHTS CONTINUING OPERATIONS HOSPITAL ADMISSIONS PEOPLEFIRST OPERATING INCOME Peoplefirst Rehabilitation operating income grew 19% from last year’s fourth quarter. $8,959 $10,628 $0 $4,000 $8,000 $12,000 Q4 '08 Q4 '09 2,695 3,199 10,792 11,466 0 5,000 10,000 15,000 Q4 '08 Q4 '09 Non-Government Total Admissions Hospitals reported strong admissions growth over the same period last year. ($ thousands) |
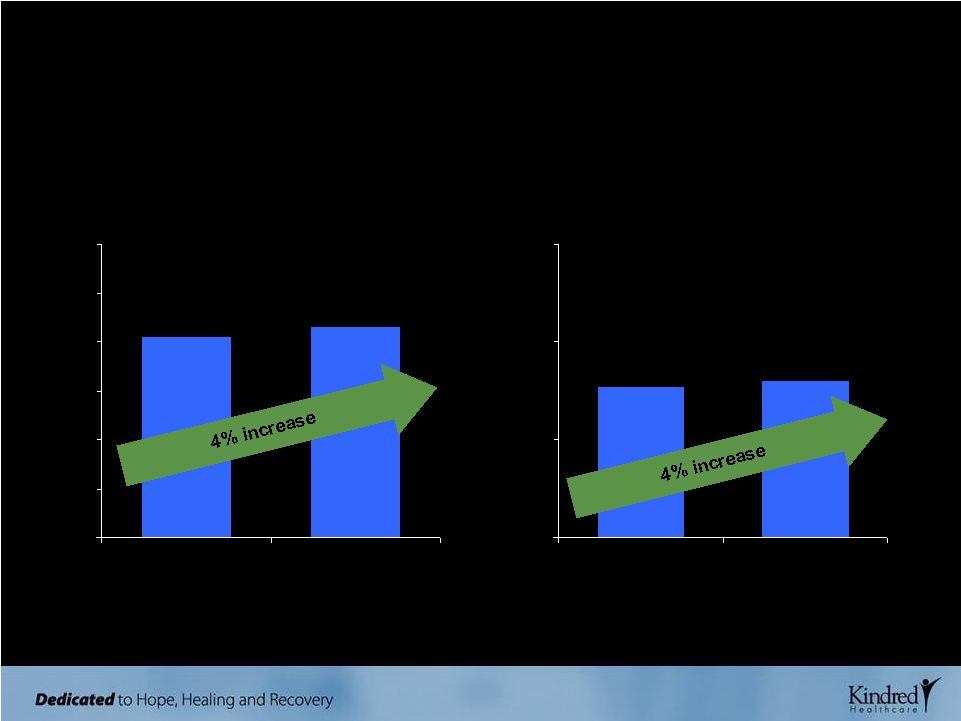 29 2009 FULL YEAR HIGHLIGHTS CONTINUING OPERATIONS CONSOLIDATED REVENUES ($ billions) $4.1 $4.3 $0.0 $1.0 $2.0 $3.0 $4.0 $5.0 $6.0 2008 2009 DILUTED EPS $1.54 $1.60 $0.00 $1.00 $2.00 $3.00 2008 2009 |
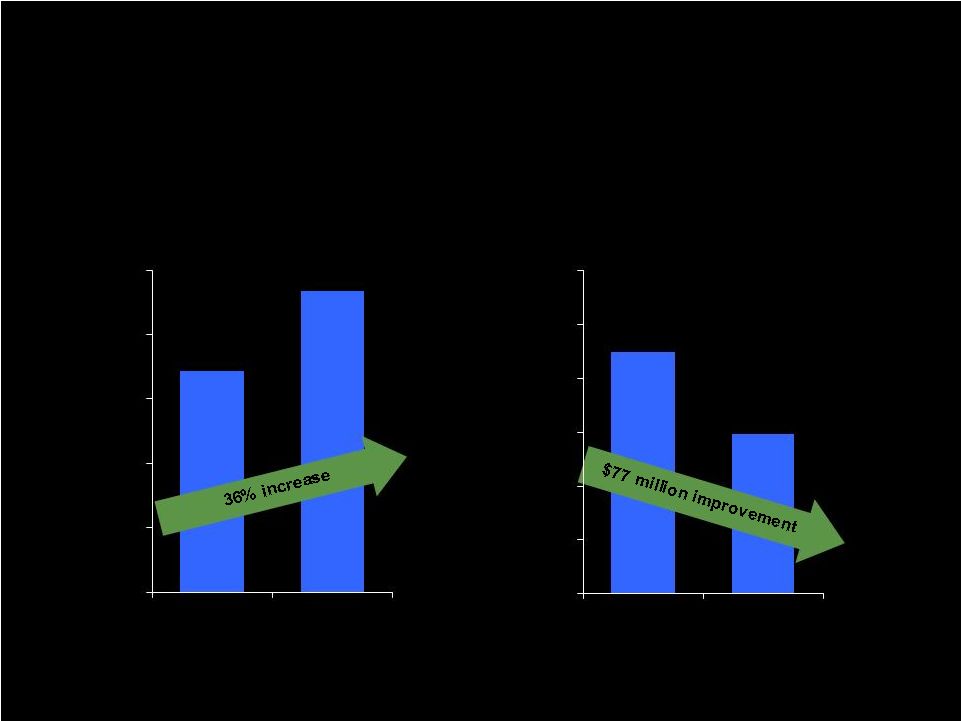 30 2009 FINANCIAL HIGHLIGHTS ($ IN MILLIONS) OPERATING CASH FLOWS LONG-TERM DEBT, NET OF EXCESS CASH $172 $234 $0 $50 $100 $150 $200 $250 2008 2009 $225 $148 $0 $50 $100 $150 $200 $250 $300 Dec. '08 Dec. '09 |
 31 • Consolidated revenues are expected to approximate $4.5 billion • Operating income is expected to range from $571 million to $579 million • Rent expense is expected to approximate $360 million, while depreciation, amortization and net interest expense are expected to approximate $128 million • Income from continuing operations is expected to approximate $48 million to $54 million or $1.20 to $1.35 per diluted share (based upon diluted shares of 39 million) 2010 EARNINGS GUIDANCE AS ISSUED ON FEBRUARY 22, 2010 |
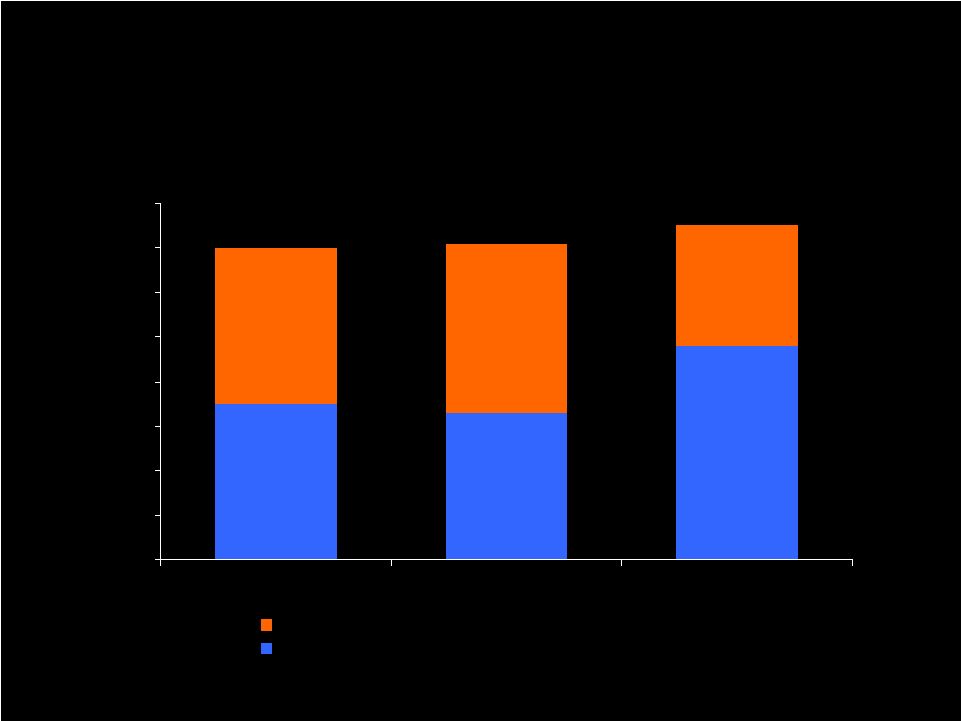
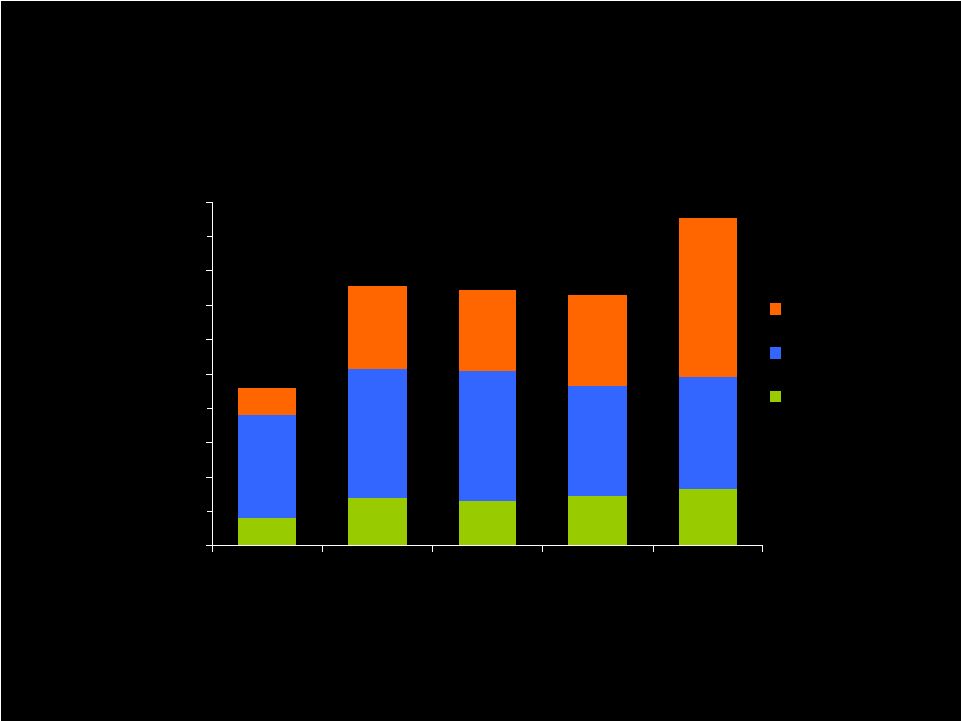 32 CAPITAL INVESTMENTS ($ millions) CONSOLIDATED CAPITAL INITIATIVES $16 $28 $26 $29 $33 $60 $75 $76 $64 $65 $16 $48 $47 $53 $93 $0 $20 $40 $60 $80 $100 $120 $140 $160 $180 $200 2004 2006 2008 2009 Projected '10 Organic Growth & Development Routine Commitments Information Systems $92 $151 $149 $146 $191 Capital investments in 2009 and in 2008 were fully funded through internal resources in both years. |
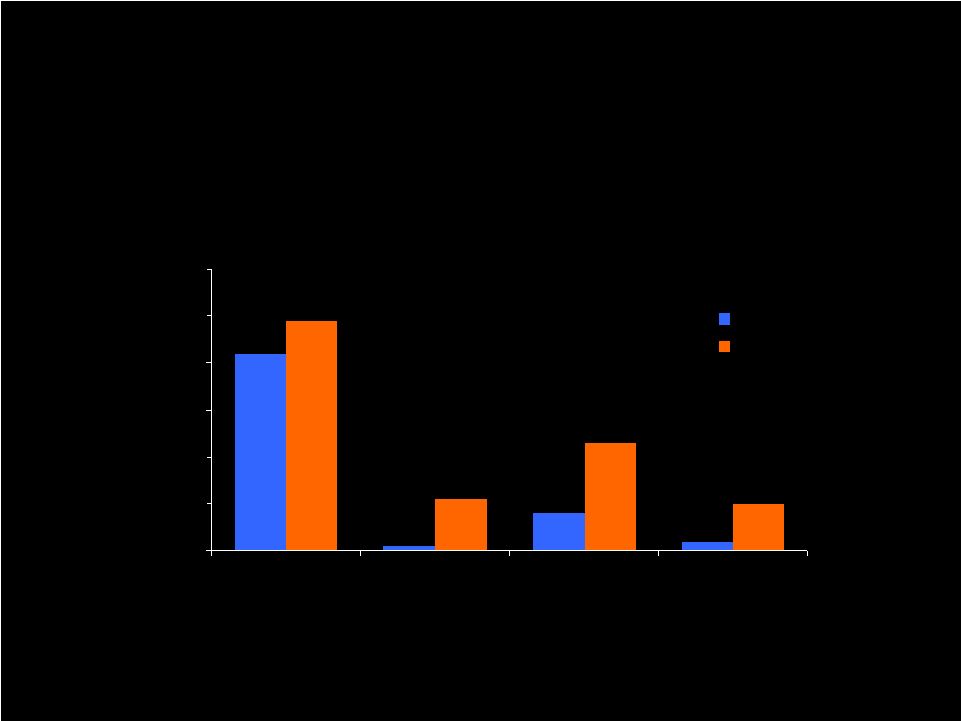 33 $42 $1 $8 $2 $49 $11 $23 $10 $0 $10 $20 $30 $40 $50 $60 Hospital Development Hospital-Based Subacute Units and Other Projects TCC/TCU Development Peoplefirst Rehab MAX 2009 2010 2009 AND PROJECTED 2010 GROWTH AND DEVELOPMENT CAPITAL INITIATIVES CAPITAL INVESTMENTS ($ millions) |
 34 • $500 million asset-based revolver – Expiration - July 2012 – Thirteen member lender group – Pricing determined by average daily borrowings – Current level priced at LIBOR + 150 basis points – $353 million of revolver capacity at December 2009 • Operational flexibility in Master Leases facilitate service line development and organic growth – 828 nursing center beds delicensed to accommodate TCC and TCU growth strategy – LTAC beds reconfigured to add service lines (e.g., subacute units) CAPITAL STRUCTURE, FINANCIAL CAPACITY AND OPERATIONAL FLEXIBILITY |
 35 • Track record for operational success based on commitment to quality, service excellence and a disciplined approach to the business • Experience management team, robust technology platform, processes and systems, and a demonstrated ability to adapt to change • Growing businesses through disciplined organic development and acquisition strategies • Strong cash flows with financial flexibility to finance acquisitions and development activities • Well positioned to succeed in changing post-acute landscape INVESTMENT CONSIDERATIONS |
 36 APPENDIX |
 RECONCILIATION OF NON-GAAP MEASURES Year ended December 31, Operating income (loss): 2005 2006 2007 2008 Hospital division Health services division Rehabilitation division Pharmacy division Corporate: Overhead Insurance subsidiary Reorganization items Operating income Rent Depreciation and amortization Interest, net Income before income taxes Income taxes Income from cont. ops. $420 209 32 57 (135) (10) (145) 2 575 (245) (95) 3 238 95 $143 $383 239 30 49 (157) (7) (164) - 537 (289) (115) 1 134 53 $81 $365 295 34 18 (168) (7) (175) - 537 (338) (118) (1) 80 37 $43 $346 322 38 - (133) (7) (140) - 566 (339) (120) (8) 99 39 $60 $364 305 51 - (135) (6) (141) - 579 (348) (126) (3) 102 39 $63 $ Millions 2009 Fourth Quarter 2008 $98 82 9 - (34) (2) (36) - 153 (85) (30) (2) 36 14 $22 $93 77 11 - (33) (2) (35) - 146 (88) (32) - 26 9 $17 Fourth Quarter 2009 37 |
 38 2010 EARNINGS GUIDANCE RANGES (a) (IN MILLIONS, EXCEPT PER SHARE AMOUNTS) Low High Operating income $ 571 $ 579 Rent 360 360 Depr. & amort. 123 123 Interest, net 5 5 Income from continuing operations before income taxes 83 91 Provision for income taxes 35 37 Income from continuing operations 48 54 As issued on February 22, 2010 Earnings Guidance Ranges Revenues $ 4,500 Diluted EPS $1.20 $1.35 Diluted shares 39.0 39.0 As issued on November 2, 2009 Low High $ 575 $ 583 364 364 123 123 5 5 83 91 35 37 48 54 $ 4,500 $1.20 $1.35 39.0 39.0 Allocation to participating unvested restricted stockholders 1 1 Available to common stockholders $47 $53 1 1 $47 $53 (a) The Company indicated that the earnings guidance includes the estimated impact of the new RUGs IV Medicare payment system changes for nursing centers as well as the new Medicare rules regarding
concurrent therapy, both of which are scheduled to become effective on
October 1, 2010. The Company also indicated that the earnings guidance does not reflect other significant changes in reimbursement, any material acquisitions or divestitures or
any repurchases of common stock. |
 39 PROFESSIONAL LIABILITY EXPENSE ($ IN MILLIONS) $35 $33 $48 $35 $38 $27 $0 $10 $20 $30 $40 $50 $60 $70 $80 2007 2008 2009 Reduction of expense after changes in prior years' estimates Final net expense |
 40 People Quality & Service Growth Efficiency Capital Organizational Excellence Operating Income Employee Turnover Average Deficiency Index Average Daily Census Nursing Hours PPD ADR Acceptance Clearing Tags on First Follow-up Quality Mix Customer Service Satisfaction ED Turnover Discharge to Hospital M Admissions Total Labor Hours PPD Bad Debt DNS Turnover Discharge to Home Revenue PPD Total Ancillary Expense PPD Nursing Turnover Clinical Indicators Rehab RUG Distribution Employee Retention Clinical Quality Review Score Average Wage Rate Overtime & Contract Labor 2009 BALANCED SCORECARD HEALTH SERVICES DIVISION - YEAR RESULTS Legend: Maximum Achieved Between Maximum & Target Between Target & Minimum Below Minimum 24/7 RN Coverage A/R Days Consistent Staffing Assignments Angel Care Total Controllable Expense PPD Employee Satisfaction 2 |
 41 People Quality & Service Growth Efficiency Capital Organizational Excellence Operating Income Employee Turnover Clinical Quality Index Operating Cost PPD A/R Days (Non-Medicare) CEO & CCO Turnover Customer Service Index Average Daily Census (ADC) Total Labor Cost PPD Total Hours PPD Employee Retention Wound Care Improvement Net Revenue PPD Contract Labor Adm Conversion Rate Arbitration Agreement Acceptance Rate Adm Growth Length of Stay Case Mix Index Controllable Costs PPD 2009 BALANCED SCORECARD HOSPITAL DIVISION - YEAR RESULTS Legend: Maximum Achieved Between Maximum & Target Between Target & Minimum Below Minimum Admissions Implementation of Service Excellence Program Cash Collections Net Promoter Score Urinary Tract Infection Nursing & Resp. Therapist Turnover Employee Satisfaction |
 People Quality & Service Growth Efficiency Capital Organizational Excellence Operating Income Therapist Turnover Net New Contracts Days Sales Outstanding (DSO) Functional Outcome Measurement (FOM) Data Entry Manager Turnover New Contract Incremental Revenue $ Nursing Centers Revenue per Minute Employee Satisfaction Outcomes Measurement Handheld Utilization Compliance Audit Results Leadership Development (including Clinical Ladder Track) Orientation Completed Legend: Maximum Achieved Between Maximum & Target Between Target & Minimum Below Minimum 2009 BALANCED SCORECARD PEOPLEFIRST REHABILITATION - YEAR RESULTS Acute Direct Labor % of Revenue Hospitals Revenue per Patient Day Customer Satisfaction Post-Acute Outcomes Measurement RUGS Utilization Medicare Part B Utilization Acute Productivity Post-Acute Productivity Post-Acute Cost per minute |
 Kindred Healthcare NYSE:KND Investor Presentation March 2010 |