Attached files
| file | filename |
|---|---|
| EX-21 - LIST OF SUBSIDIARIES OF ISS - AUTOSCOPE TECHNOLOGIES CORP | image101352_ex21.htm |
| EX-31.1 - CERTIFICATION OF CEO PURSUANT TO SECTION 302 - AUTOSCOPE TECHNOLOGIES CORP | image101352_ex31-1.htm |
| EX-32.1 - CERTIFICATION OF CEO PURSUANT TO SECTION 906 - AUTOSCOPE TECHNOLOGIES CORP | image101352_ex32-1.htm |
| EX-31.2 - CERTIFICATION OF CFO PURSUANT TO SECTION 302 - AUTOSCOPE TECHNOLOGIES CORP | image101352_ex31-2.htm |
| EX-32.2 - CERTIFICATION OF CFO PURSUANT TO SECTION 906 - AUTOSCOPE TECHNOLOGIES CORP | image101352_ex32-2.htm |
| EX-10.19 - PROMISSORY NOTE - AUTOSCOPE TECHNOLOGIES CORP | image101352_ex10-19.htm |
| EX-10.18 - MODIFICATION AGREEMENT - AUTOSCOPE TECHNOLOGIES CORP | image101352_ex10-18.htm |
| EX-23.1 - CONSENT OF INDEPENDENT REGISTERED PUBLIC ACCOUNTING FIRM - AUTOSCOPE TECHNOLOGIES CORP | image101352_ex23-1.htm |
SECURITIES AND EXCHANGE COMMISSION
WASHINGTON, D.C. 20549
|
|
|
|
|
|
|
|
|
FORM 10-K |
||
|
|
|
|
|
|
|
|
|
x |
ANNUAL REPORT PURSUANT TO SECTION 13 OR 15(d) OF THE SECURITIES EXCHANGE ACT OF 1934 |
|
|
|
|
|
|
|
For the fiscal year ended December 31, 2009 |
|
|
|
|
|
|
|
OR |
|
|
|
|
|
|
o |
TRANSITION REPORT PURSUANT TO SECTION 13 OR 15(d) OF THE SECURITIES EXCHANGE ACT OF 1934 |
|
|
|
|
|
|
|
For the transition period from ____________ to ____________ |
|
Commission file number: 0-26056
|
|
|
|
|
|
|
|
|
|
|
|
|
Image Sensing Systems, Inc. |
||
|
(Exact name of registrant as specified in its charter) |
||
|
|
|
|
|
Minnesota |
|
41-1519168 |
|
(State or other jurisdiction of incorporation or organization) |
|
(I.R.S. Employer Identification No.) |
|
|
|
|
|
500 Spruce Tree Centre, 1600 University Avenue West, |
|
55104 |
|
(Address of principal executive offices) |
|
(Zip Code) |
(651) 603-7700
(Registrant’s
telephone number, including area code)
Not applicable.
(Former name, former address and former fiscal year, if changed since last
report)
Securities registered pursuant to Section 12(b) of the Act:
|
|
|
|
|
|
|
|
Title of each class |
|
Name of each exchange on which registered |
|
|
|
|
|
|
|
|
|
Common Stock, $0.01 par value |
|
The NASDAQ Capital Market |
|
Securities registered pursuant to Section 12(g) of the Act: None.
Indicate by check mark if the registrant is a well-known seasoned issuer, as defined in Rule 405 of the Securities Act. Yes o No x
Indicate by check mark if the registrant is not required to file reports pursuant to Section 13 or 15(d) of the Act. Yes o No x
Indicate by check mark whether the registrant (1) has filed all reports required to be filed by Section 13 or 15(d) of the Securities Exchange Act of 1934 during the preceding 12 months (or for such shorter period that the registrant was required to file such reports) and (2) has been subject to such filing requirements for the past 90 days. Yes x No o
Indicate by check mark whether the registrant has submitted electronically and posted on its corporate Web site, if any, every Interactive Data File required to be submitted and posted pursuant to Rule 405 of Regulation S-T during the preceding 12 months (or for such shorter period that the registrant was required to submit and post such files). Yes o No o
Indicate by check mark if disclosure of delinquent filers pursuant to Item 405 of Regulation S-K is not contained herein, and will not be contained, to the best of registrant’s knowledge, in definitive proxy or information statements incorporated by reference in Part III of this Form 10-K or any amendment to this Form 10-K. x
Indicate by check mark whether the registrant is a large accelerated filer, an accelerated filer, a non-accelerated filer or a smaller reporting company. See the definitions of “large accelerated filer,” “accelerated filer,” and “smaller reporting company” in Rule 12b-2 of the Exchange Act. (Check one):
|
|
|
|
|
|
|
Large accelerated filer o |
|
Accelerated filer o |
|
|
|
|
|
|
|
Non-accelerated filer o |
|
Smaller reporting company x |
|
|
(Do not check if a smaller reporting company.) |
|
|
Indicate by check mark whether the registrant is a shell company (as defined in Rule 12b-2 of the Act). Yes o No x
As of June 30, 2009, the aggregate market value of the registrant’s common stock held by non-affiliates of the registrant was $32,910,719 based on the closing sale price as reported on The NASDAQ Capital Market. The number of shares outstanding of the registrant’s $0.01 par value common stock as of March 12, 2010 was 3,993,919 shares.
DOCUMENTS INCORPORATED BY REFERENCE
|
|
|
|
|
Document |
|
Parts Into Which Incorporated |
|
|
|
|
|
|
|
|
|
Proxy Statement for the Annual Meeting of Shareholders to be held May 26, 2010 (Proxy Statement) |
|
Part III |
PART I
|
|
|
|
Item 1. |
Business |
Image Sensing Systems, Inc. (referred to in this report as “we,” “us,” “our” and the “Company”) develops and markets video and radar image processing products for use in traffic applications such as intersection control, highway, bridge and tunnel traffic management and traffic data collection.
We are the leading provider of software-based computer enabled detection, or CED, products and solutions for the intelligent transportation systems, or ITS, industry. Our family of products, which we market as Autoscope® and RTMS®, provides end users with the tools needed to optimize traffic flow, enhance driver safety, regulate air quality and address emerging security/surveillance concerns. Our technology analyzes signals from sophisticated sensors and transmits the information to management systems and controllers or directly to users.
CED is a process in which software rather than humans examines outputs from various types of sophisticated sensors to determine what is happening in a field of view. In the ITS industry, CED is a critical component of managing congestion and traffic flow. In many markets, it is not possible to build roads, bridges and highways quickly enough to accommodate increasing automobile ownership. For example, in 2007 there were approximately 3.0 million vehicles in Moscow, and the number of vehicles is expected to increase by 50% to 4.5 million vehicles by 2012. In China, 13.6 million vehicles were introduced in 2009, up 45% from the 9.4 million vehicles introduced in 2008. We believe this growing use of vehicles worldwide will make CED-based ITS solutions increasingly necessary to complement existing and new roadway infrastructure to manage traffic flow and optimize throughput.
We believe our CED solutions are technically superior to those of our competitors because they have a higher level of accuracy, limit the occurrence of false detection, are generally easier to install with lower costs of ownership, work effectively in a multitude of light and weather conditions, and provide end users the ability to manage inputs from a variety of sensors for a number of tasks. It is our view that the technical advantages of our products make our solutions ideally suited for use in ITS as well as adjacent markets. We believe that the market for CED is increasingly favoring converged solutions that include ITS, security/surveillance and environmental management, which we expect to increase demand for CED products such as ours.
We believe the strength of our distribution channels positions us to increase the penetration of our technology-driven solutions in the marketplace. We market our Autoscope products in North America, the Caribbean and Latin America through an exclusive agreement with Econolite Control Products, Inc., or Econolite, which we believe is the leading distributor of ITS intersection control products in North America and the Caribbean. We market our Autoscope products outside of North America, the Caribbean and Latin America and our RTMS products through a combination of distribution and direct sales channels, including our wholly-owned subsidiaries in Hong Kong, Poland and the United Kingdom. Our end users primarily include governmental agencies and municipalities, and, as of December 31, 2009, we had sold over 100,000 instances in more than 60 countries.
In December 2007, we completed our purchase of certain assets of EIS Electronic Integrated Systems, Inc., or EIS. EIS was a leading provider of radar-based detection solutions. In addition to the increased scale we gained through the EIS asset purchase, the addition of EIS’ RTMS radar products enables us to provide a wider array of CED products to our end users and support the introduction of hybrid product offerings to help drive market demand. We operate the EIS asset purchase business through ISS Image Sensing Systems Canada Ltd., our wholly-owned subsidiary in Toronto, Ontario, Canada.
Industry Overview
The Intelligent Transportation Systems Market. The market for ITS is large and growing. According to a December 2007 report by Global Industry Analysts, Inc., total ITS sales in the United States and Europe for 2007 were approximately $3.4 billion and $2.8 billion, respectively, and total global ITS sales were approximately $8.7 billion. Global Industry Analysts expects total global ITS sales to reach $12.5 billion by the end of 2010, representing a compound annual growth rate of 11.6% for the period from 2000 to 2010.
1
ITS encompasses a broad range of information processing and control electronics technologies that, when integrated into roadway infrastructure, help monitor and manage traffic flow, reduce congestion and enhance driver safety. The ITS market has been built around the detection of conditions that impact the proper operation of roadway infrastructure. ITS applications include a wide array of traffic management systems, such as traffic signal control, automatic number plate recognition and variable messaging signs. ITS technologies include video vehicle detection, inductive loop detection, sensing technologies (such as radars), floating cellular data, computational technologies and wireless communications.
In traffic management applications, CED products are used for automated vehicle detection and are a primary data source upon which ITS solutions are built. Traditionally, automated vehicle detection is performed using inductive wire loops buried in the pavement. However, in-pavement loop detectors are costly to install, difficult to maintain, expensive to repair and not capable of wide-area vehicle detection without installations of multiple loops.
Above-ground CED solutions for ITS offer several advantages to in-pavement loop detectors. Above-ground CED solutions tend to have lower total cost of ownership than in-pavement loop detectors because above-ground CED solutions are non-destructive to road surfaces, do not require closing roadways to install or repair, and are capable of wide-area vehicle detection with a single device, thus enabling one input device to do the work of many in-pavement loops. Due to their location above ground, CED solutions have no exposure to the wear and tear associated with expanding and contracting pavement and generally less exposure to the vibration and compaction caused by traffic. Furthermore, in the event of malfunction or product failure, above-ground CED solutions can be serviced and repaired without shutting down the roadway. Each of these factors results in greater up-time and increased reliability of above-ground CED solutions compared to in-pavement loop detectors. Above-ground CED solutions also tend to offer a broader set of detection capabilities and a wider field of view than in-pavement loop detectors. For example, unlike in-pavement loops, above-ground CED solutions can detect smoke and debris. In addition, a single unit video- or radar-based CED system can detect and measure a variety of data points, including vehicle presence, counts, speed, length, time occupancy, headway and flow rate as well as environmental factors and obstructions to the roadway. An equivalent installation using loops would require many installations per lane.
We believe our Autoscope and RTMS products are competitive with and can take market share from in-pavement loop detectors. Based on our determination, the U.S. ITS video detection market sales in 2008 were approximately $110 million and were growing on average approximately 15% per year until the recession of 2009. We believe that we are the leader in the U.S. video detection market in terms of unit sales, and we estimate that U.S. sales of the in-pavement loop detectors our products can supplant were approximately $500 million in 2008.
We believe that several trends are driving the growth in ITS and adjacent market segments:
Proliferation of Traffic. In many countries, there has been a surge in the number of vehicles on roadways. Due to the growth of emerging economies and elevated standards of living, more people desire and are able to afford automobiles. For example, in China, 13.6 million vehicles were introduced in 2009, up 45% from the 9.4 million vehicles introduced in 2008. The number of vehicles utilizing the world’s roadway infrastructure is growing at a quicker pace than new roads, bridges and highways are being constructed. The population of the United States has grown by about 30% or 70 million from 1982 to 2007, while highway miles have increased by approximately 5% in the same period. Between 1970 and 2005, the number of registered highway vehicles in the U.S. increased from 111 million to 247 million. Overall, the growth in roadway infrastructure is failing to match the surge in the number of vehicles using it. CED-based traffic management and control systems attempt to solve the problem by monitoring high traffic areas and analyzing data that can be used to mitigate traffic problems.
The Demographics of Urbanization. Accelerated worldwide urbanization drives the creation and expansion of middle classes and produces heightened demand for automobiles. Currently, there are over 400 cities in the world with over 1 million people. Since automobiles can be introduced to a metropolitan area faster than roadway infrastructure can be constructed, the result is continuously worsening traffic. Because expanding the roadway infrastructure is slow and costly to implement, and often environmentally undesirable, government agencies are increasingly turning to technology-based congestion solutions that optimize performance and throughput of existing and new roadway infrastructure. Detection is the requisite common denominator for any technology-based solution.
2
The Melding of Large City Service Domains. Large cities require a wide range of service domains, including traffic, security/surveillance and environmental protection. These cities are increasingly turning to centralized management of these service domains, employing a command and control model that requires sharing and integrating data across service domains to operate effectively. For example, data collected for the traffic management service domain is relevant to all of the other service domains. This means that each CED sensor can supply information to multiple domain services. In turn, the sharing of detection information across service domains should increase the level of sophistication required to process and interpret that information.
Advances in Wireless Technology Create the Ubiquitous Network. Businesses and government entities, motivated by the need for improved productivity and functionality, are increasingly adopting pervasive, networked information systems. The internet and widely available broadband networks, including recent advances in wireless technologies such as mesh networks, have greatly reduced the deployment costs of adding broadly distributed CED solutions to existing information systems. The lower cost of deployment should increase demand for CED.
The Ascendancy of CED. Electronics of all sorts are becoming smaller and less costly to manufacture, while becoming more capable of performing certain complicated tasks than humans. CED solutions benefit from these trends. Of particular significance is the evolving concept of hybrid detection in which two or more sensing types such as radar and video are combined in a common CED device in which the weaknesses of each are synergistically offset by the strengths of the other. By leveraging a common digital signal processor and network interface, we believe the incremental cost of a hybrid device will be significantly lower than deploying multiple, single-sensor CED devices. This makes the concepts of “rich sensing” and “instrumenting the city” through CED solutions cost effective, which we believe will result in extensive proliferation of sophisticated sensors and detection devices.
Solutions for Adjacent Markets. We believe that the adjacent markets of ITS, security/surveillance and environmental management are converging, and that this convergence will accelerate as CED systems become more cost-effective when a single CED unit can be used for multiple purposes. Because the CED technologies involved are closely related, our CED technology can be adapted to or is already capable of addressing these adjacent markets.
We believe that environmental management systems will become a necessity, especially in large cities where the costs of air pollution are being increasingly borne by city residents. Long traffic delays ensure that idling vehicles have adverse effects on urban areas. In conjunction with video detection for ITS, CED products can help governmental agencies reduce air pollution and energy consumption by controlling traffic flow and reducing travel time, accidents and delays. The convergence of traffic, security/surveillance and environmental management should drive significant continued CED demand growth.
Our Competitive Strengths
We are the leading provider of software-based CED products and solutions for the ITS industry. We have the following competitive strengths that we expect will continue to enhance our leadership position in ITS and adjacent industries:
Leading Proprietary Technologies. Over the last two decades, we have developed a proprietary portfolio of complex software algorithms and applications that we have continuously enhanced and refined. These algorithms, which include our advanced signal processing technologies, allow our video and radar detection products to capture and analyze objects in diverse weather and lighting conditions and to balance the accuracy of positive detection and the avoidance of false detections. Due to the strength of our proprietary technologies, we believe we command premium pricing. CED technologies similar to ours are also difficult to develop and refine in a commercially viable manner. We therefore should be well positioned to quickly introduce next-generation products to market and continue our historically strong growth.
3
Proven Ability to Develop, Enhance and Market New Products. We are developing and enhancing our product offerings. Over the last two decades, we have demonstrated the ability to lead the market with new products and product enhancements. For example, we were the first company to provide our end users with a fully integrated color camera, zoom lens and machine vision processor in our Autoscope Solo system. Additionally, EIS was one of the first companies to introduce radar-based technology solutions for ITS applications, and it has continued to lead the market with technology enhancements and new products, such as RTMS. We have successfully collaborated with our long-term channel partners to market these new products. We believe that developing, enhancing and marketing new products with our partners translates into strong organic revenue growth and high levels of profitability.
Leading Distribution Channel. We have maintained a relationship with Econolite for the distribution of our Autoscope products in North America and the Caribbean since 1991 and in Latin America since 2002. We believe that Econolite is the leading distributor of ITS control products in North America and the Caribbean. In our view, this relationship enhances our ability to commercialize and market new products and allows us to focus on our core business of advanced signal processing software algorithms. Although we expect our percentage of revenue attributable to Econolite to somewhat lessen over the next few years due to international diversification, we expect that our revenue dollars attributable to Econolite will continue to grow.
Broad Product Portfolio. Our product portfolio leverages our core software-based algorithms for CED to enable end users to detect and monitor objects in a designated field of view. We believe that our family of Autoscope and RTMS products allows us to offer a broad product portfolio that meets the needs of our end users. Additionally, our intention is to use our broad product portfolio to offer hybrid products that satisfy traffic, security/surveillance and environmental management requirements.
Experienced Management Team and Engineering Staff. We transitioned to a new management team in 2007 charged with executing our growth strategy. Our management team is highly experienced in the ITS and software industries. Additionally, the continuity of our engineering staff should allow us to continuously develop improved products.
Strong Financial Performance. Prior to the recession in 2009, we had grown our revenue organically at an average double-digit compound annual growth rate over the six year period from 2003 through 2008. During this time, we maintained average net margins approaching 25%. As of December 31, 2009, we had $32.7 million in shareholders’ equity. Our financial performance and strength gives us the ability to take advantage of favorable market trends without the restrictions that often handicap other technology companies similar to us in size.
Our Growth Strategy
As part of our growth strategy, we seek to:
Enhance and Extend Our Technology Leadership in ITS. We believe we have established ourselves as the leading provider of CED in the ITS market segment. We believe that we now have an opportunity to accelerate our growth while maintaining our traditionally high level of profitability. We plan to do this by improving the accuracy and functionality of our products, opportunistically expanding our product offering into adjacent markets, as well as expanding our portfolio and channels through licensing or selected acquisitions. We intend to develop and introduce hybrid CED products to take advantage of our technical leadership in ITS and further differentiate us from our competitors.
Expand into Adjacent Markets. Our core skill is the implementation of software-based CED products and solutions. Over the past two decades, we have been developing and refining our complex signal processing software algorithms. We should be able to effectively utilize our core software skills more broadly as markets, including security/surveillance and environmental management systems, converge. We believe that a driver of this convergence is that CED systems will become more cost-effective when a single CED unit can be used for multiple purposes. As a result, our objective is to become the leading supplier of critical CED components to third party management systems, particularly those that exploit the convergence of traffic, security/surveillance and environmental management systems. To do this, we are integrating this concept into our long-range engineering development road-map and will evaluate the use of technology licensing, acquisition and channel strategies that support this vision.
4
Increase the Scope of Our Distribution and Direct Sales. We have made substantial investments in product adjustments to tailor our solutions to the differing needs of our international end users. We have also invested in the expansion of our European and Asian subsidiaries. Markets in Eastern Europe, the Asia/Pacific region, the Middle East, Africa and South America, which have historically lagged North America and Western Europe in their use of CED, have recently begun to increase the adoption of CED in their traffic, security/surveillance and environmental management systems. We intend to continue to refine our product offerings through engineering development, technology licensing and/or acquisitions to take advantage of the accelerated pace of the adoption of CED throughout the developing world.
Grow Through Complementary Acquisitions. We intend to pursue strategic acquisitions that extend our technology leadership, breadth of product offerings and market share in ITS and adjacent market segments. We expect to target acquisitions that will serve as a platform for additional growth opportunities, including new product offerings, technology enhancements and the introduction of new sales and distribution channels. We intend to employ a selective and disciplined approach when evaluating acquisition opportunities.
Our Products and Solutions
Our vehicle and traffic detection products are critical components of many ITS applications, including intersection control, highway management and tunnel safety. Our Autoscope video systems and RTMS radar systems convert sensory input collected by video cameras and radar units into vehicle detection and traffic data used to operate, monitor and improve the efficiency of roadway infrastructure. At the core of each product line are proprietary digital signal processing algorithms and sophisticated embedded software that analyze sensory input and deliver actionable data to integrated ITS applications. Between ISS and EIS, we spent approximately $3.3 million, $2.9 million, and $2.8 million on research and development in 2009, 2008 and 2007, respectively, to develop and enhance our Autoscope and RTMS technology. Our digital signal processing software algorithms represent a foundation on which support for additional sensory inputs such as audio, chemical, smoke, weather and vibration sensors may be added in the future. A diagram displaying our fundamental product architecture is shown below.
The Image Sensing Product Architecture
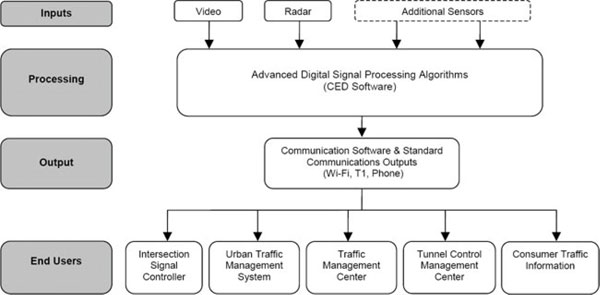
5
Autoscope. Our Autoscope system processes video input from a traffic scene in real time and extracts the required traffic data, including vehicle presence, counts, speed, length, time occupancy (percent of time the detection zone is occupied), average headway (time interval between vehicles) and flow rate (vehicles per hour per lane). Autoscope supports a variety of standard video cameras or can be purchased with an integrated video camera. For intersections, the system communicates with the intersection signal controller, which changes the traffic lights based on the data provided. In highway applications, the system gathers vehicle count and flow rates and detects anomalous incidents, such as stopped or wrong-way vehicles. In tunnel safety applications, Autoscope provides alerts to operators upon detecting stopped, wrong-way or slow moving vehicles and upon detecting pedestrians, debris or smoke. In any application, the data may also be transmitted to a traffic management center via the internet or other standard communication means and processed in real time to assist in traffic management and stored for later analysis for traffic planning purposes.
All systems come with our latest Autoscope software suite, which provides a communications server and applications software for configuring, monitoring and maintaining system installations. Using a computer mouse, desired detection zones within a camera’s field of view are programmed to specify where and what type of traffic data is collected. The application’s software graphical user interface is currently available in 15 languages. A translation kit is available to translate the graphical user interface into other local languages as may be necessary or desired.
The Autoscope system runs on our Terra platform, which we introduced in April 2007. Enhancements to the Terra platform include the use of the Texas Instruments DaVinci dual core advanced RISCTM machine and digital signal processor, digital MPEG-4 streaming, high speed Ethernet interface, web browser maintenance and data and video over power line communications.
The Terra platform comes in the following two varieties:
Autoscope Solo Terra. The Autoscope Solo Terra is an integrated color zoom camera and machine vision processing computer contained in one compact housing unit that is situated on roadway infrastructure overlooking the traffic scene. The Solo Terra provides the best performance of our platforms due to the high-quality video resulting from the integration of camera and processor. The Solo Terra is our leading Autoscope offering in the North American market.
Autoscope RackVision Terra. The Autoscope RackVision Terra allows end users to use standard video cameras (both new or previously installed) with Autoscope technology. The RackVision Terra consists of a machine vision processing computer that is located in an intersection signal controller, control hub, incident management center or traffic management center that receives video from a separate camera. The RackVision Terra is our top selling Autoscope product in international markets.
RTMS. Our RTMS systems use radar to measure vehicle presence, volume, occupancy, speed and classification information for roadway monitoring applications. Data is transmitted to a central computer at a traffic management center via the internet or other standard communication means, including wireless. Data can be processed in real time to assist in traffic management and stored for later analysis for traffic planning purposes.
RTMS is an integrated radar transmitter/receiver and special purpose computer contained in a compact, self-contained unit. The unit is typically situated on roadway poles and side-fired, making it especially well suited for highway detection applications.
Comparison of Video and Radar Detection. Video detection is best suited to applications in which the ability to act on complex and detailed information is desired. However, video can encounter difficulties in poorly-lit environments, adverse weather conditions (such as fog or driving snow), in situations in which vehicles are obscured (for example, by other vehicles), or in extraordinarily dirty environments in which airborne particulates obscure the view. Also, despite the compensating factors of using high-quality color video, video can be susceptible to false detections due to shadows or reflections. Radar is less able to distinguish fine details than video but is considerably less affected by adverse environmental conditions and to some degree can see through certain kinds of obstructions. It also does not recognize shadows or visual reflections.
By combining video and radar sensors and algorithmically comparing their outputs, we believe we will be able to offer our end users products that provide superior accuracy. Hybrid CED detectors should be able to coalesce the strengths of each type of sensor to overcome the other’s limitations. The result will be improved overall performance in a broader range of circumstances.
6
Distribution, Sales and Marketing
We market and sell our products globally. As of December 31, 2009, we had supplied systems for more than 100,000 instances in more than 60 countries. Together with our partners, we offer a combination of high-performance CED technology and experienced local support. Our end users primarily consist of federal, state, city and county departments of transportation, road commissions and port, highway, tunnel and other transportation authorities. The decision-makers within these governmental entities typically are traffic planners and government engineers, who in turn often rely on consulting firms that perform planning and feasibility studies for the governmental entities. Our products sometimes are sold directly to system integrators or other suppliers of systems and services who are operating under subcontracts in connection with major road construction contracts.
Autoscope North American, Caribbean and Latin American Sales. We have granted Econolite an exclusive right to market and distribute the Autoscope system in North America, the Caribbean and Latin America. The agreement with Econolite grants it a first refusal right that arises when we make a proposal to Econolite to extend the license to additional products in North America, the Caribbean and Latin America and a first negotiation right that arises when we make a proposal to Econolite to include rights corresponding to Econolite’s rights under our current agreement in countries not in these territories. Econolite provides the marketing and technical support needed for its sales in these territories. Econolite pays us a royalty on the revenue derived from its sales of the Autoscope system. We cooperate in marketing Autoscope products with Econolite for North America, the Caribbean and Latin America and provide second-tier technical support. We have the right to terminate our agreement with Econolite if it does not meet minimum annual sales levels or if Econolite fails to make payments as required by the agreement. In 2008, the term of the agreement was extended to 2028. The agreement can be terminated by either party upon three years’ notice.
RTMS North American, Caribbean and Latin American Sales. We market the RTMS system to a network of distributors covering countries in North America, the Caribbean and Latin America. We provide technical support to these distributors from our office in Toronto, Ontario, Canada.
European and Asian Sales. We market Autoscope and RTMS to a network of distributors covering countries in Europe, the Middle East, Africa and Asia through our wholly-owned subsidiaries that have offices in Hong Kong, Poland and the United Kingdom. Technical support to these distributors is provided by our wholly-owned subsidiaries in Europe and Asia, with second-tier support provided by our Toronto office or our corporate headquarters in St. Paul, Minnesota.
Competition
We compete with companies that develop, manufacture and sell traffic management devices using machine vision and radar sensing technologies as well as other above-ground CED technologies based on laser, infrared and acoustic sensors. We also compete with providers of in-pavement loop detectors and estimate that more than 80% of the traffic management systems currently in use in the U.S. use in-pavement loop detectors. For competition with other above-ground CED products, we typically compete on performance and functionality, and to a lesser extent on price. When competing against providers of loop detectors, we compete principally on ease of installation and the total cost of ownership over a multi-year period, and to a lesser extent on functionality.
Among the companies that provide direct competition to the Autoscope system worldwide are Traficon N.V., Signal Group Inc. (Semex), Iteris, Inc. and Citilog S.A. Among the companies that provide direct competition to RTMS worldwide are Wavetronix, LLC and Xtralis, LLC. All of these companies have working installations of their machine vision or radar systems in the U.S. and other parts of the world. To our knowledge, however, these companies do not have as many installations as we have. In addition, there are local companies providing direct competition in specific markets such as Korea, China and Japan. We are aware that these and other companies will continue to develop technologies for use in traffic management and surveillance. One or more of these technologies could in the future provide increased competition for our Autoscope and RTMS systems.
Other potential competitors of which we are aware include Siemens AG, Cognex Corp., Matsushita Electric Industrial Co., Ltd. (Panasonic), Sumitomo Corporation, Omron Electronics LLC and 3M Company. These companies have machine vision or radar capabilities and have substantially more financial, technological, marketing, personnel and research and development resources than we have.
7
Manufacturing
We currently have the Autoscope family of products for sale in North America, the Caribbean and Latin America manufactured through agreements with Econolite and Wireless Technology, Inc., or WTI. In 1991, we appointed Econolite as our exclusive licensee to manufacture and sell the Autoscope system and related technology and to sell the products in North America and the Caribbean. In 2002, we granted Econolite an exclusive license to sell Autoscope products in Latin America, and we granted WTI a non-transferable license to use any of our intellectual property as needed to manufacture Autoscope products for our use and Econolite’s use. In Europe and Asia, we engage contract manufacturers to manufacture the Autoscope family of products. Econolite provides a one-year warranty on the Autoscope system and must provide all service required under this warranty. WTI provides Econolite a limited two-year warranty on material and workmanship on the products it manufactures. The terms of the warranties vary for overseas manufacturers.
For RTMS products, we engage contract manufacturers to produce subassemblies based on our designs. These subassemblies are then shipped to our facilities in Toronto, where we perform final assembly, testing and calibration and packaging of finished units for shipment. For most RTMS products, we provide a two-year warranty. We also perform warranty and post-warranty repairs of RTMS units in Toronto.
Most of the hardware components used to manufacture our products are standard electronics components that are available from multiple sources. Although some of the components used in our products are obtained from single-source suppliers, we believe other component vendors are available should the necessity arise. To our knowledge, our contract manufacturing and component vendors in Europe and Asia comply with the European directive on RoHS, which is the restriction of the use of certain hazardous substances in electrical and electronic equipment.
Intellectual Property
To protect our rights to our proprietary know-how, technology and other intellectual property, it is our policy to require all employees and consultants to sign confidentiality agreements that prohibit the disclosure of confidential information to any third parties. These agreements also require disclosure and assignment to us of any discoveries and inventions made by employees and consultants while they are devoted to our business activities. In addition, in the EIS asset purchase, we acquired six patent applications on file with the U.S. Patent and Trademark Office relating to the RTMS products. We have been issued patents on five of these applications, and the remaining application is pending. We also rely on trade secret, copyright and trademark laws to protect our intellectual property.
We intend to protect our intellectual property assets and will actively seek, when appropriate, protection for owned or licensed products and proprietary information by means of U.S. and foreign copyrights, trademarks, patents and contractual arrangements. We have registered trademark rights to “Autoscope” and “Autoscope Solo” in 33 countries, including the U.S. and most European countries, and we also have registered RTMS in the U.S.
We entered into a license agreement with the University of Minnesota in 1991. Under the agreement, the University granted us the exclusive right to make, have made, use, sell and lease any product that incorporated knowledge, information, know-how, software and devices in the possession of the University, including a patent held by the University, related to a video vehicle detection system developed by the University, including improvements to the technology. The patent expired in July 2006. The expiration of the University patent in July 2006 made the technology covered by the patent available to the public, allowing others to use the technology to design, manufacture and sell a product which could compete with our Autoscope product. However, since 1991, we have extensively added to the technology and product design to include our own intellectual property, and we have made extensive moderations and revisions to the University technology. We also developed our own techniques to made the technology commercially feasible. Consequently, we believe that the expiration of the University patent is not a threat to our business.
Employees
As of February 28, 2010, we had 97 employees. We have 72 employees in our main offices in St. Paul and Toronto and 25 employees in our overseas subsidiaries in Hong Kong, the United Kingdom and Poland. None of our employees is represented by a union. We believe our employee relations are good.
8
Cautionary Statement
This Annual Report on Form 10-K contains forward-looking statements within the meaning of Section 27A of the Securities Act of 1933, as amended, and Section 21E of the Securities Exchange of 1934, as amended. Forward-looking statements represent our expectations or beliefs concerning future events and can be identified by the use of forward-looking words such as “believes,” “may,” “will,” “should,” “intends,” “plans,” “estimates,” or “anticipates” or other comparable terminology. Forward-looking statements are subject to risks and uncertainties that may cause our actual results to differ materially from the results discussed in the forward-looking statements. Some factors that might cause these differences include the factors listed below. Although we have attempted to list these factors comprehensively, we wish to caution investors that other factors may prove to be important in the future and may affect our operating results. New factors may emerge from time to time, and it is not possible to predict all of these factors, nor can we assess the affect each factor or combination of factors may have on our business.
We further caution you not to unduly rely on any forward-looking statements, because they reflect our views only as of the date the statements were made. We undertake no obligation to publicly update or revise any forward-looking statements whether as a result of new information, future events or otherwise.
|
|
|
|
Item 1A. |
Risk Factors |
If governmental entities elect not to use our products due to budgetary constraints, project delays or other reasons, our revenue may fluctuate severely or be substantially diminished.
The Autoscope and RTMS systems are sold primarily to governmental entities for use in large traffic control projects using advanced technologies. We expect that we will continue to rely substantially on revenue and royalties from sales of the Autoscope and RTMS systems to governmental entities. In addition to normal business risks, it often takes considerable time before governmental traffic control projects are developed to the point at which a purchase of the Autoscope and RTMS systems would be made, and a purchase of our products also may be subject to a time-consuming approval process. Additionally, governmental budgets and plans may change without warning. Other risks of selling to governmental entities include dependence on appropriations and administrative allocation of funds, changes in governmental procurement legislation and regulations and other policies that may reflect political developments, significant changes in contract scheduling, intense competition for government business and termination of purchase decisions for the convenience of the governmental entity. Substantial delays in purchase decisions by governmental entities, or governmental budgetary constraints, could cause our revenue and income to drop substantially or to fluctuate significantly between fiscal periods.
A majority of our revenue has been generated from sales of our Autoscope family of products, and if we do not maintain the market for these products, our business will be harmed.
Historically, a majority of our revenue has been generated from sales of, or royalties from the sales of, the Autoscope Vehicle Detection System. Sales of our Autoscope System accounted for 66% of our revenue in 2009, 71% in 2008 and 99% in 2007. We anticipate that revenue from the sale of the Autoscope system will continue to account for a substantial portion of our revenue for the foreseeable future. As such, any decline in sales of our Autoscope system would have a material adverse impact on our business, financial condition and results of operations.
If Econolite’s sales volume decreases or if it fails to pay royalties to us in a timely manner or at all, our financial results will suffer.
We have an agreement with Econolite under which Econolite is the exclusive distributor of the Autoscope system in North America, the Caribbean and Latin America. The agreement grants Econolite a first refusal right that arises when we make a proposal to Econolite to extend the license to additional products in North America, the Caribbean and Latin America. In addition, the agreement grants Econolite a first negotiation right that arises when we make a proposal to Econolite to include rights corresponding to Econolite’s rights under our current agreement in countries not in these territories. In exchange for its rights under the agreement, Econolite pays us royalties for sales of the Autoscope system. Since 2002, a substantial portion of our revenue has consisted of royalties resulting from sales made by Econolite, including 49% in 2009, 50% in 2008 and 71% in 2007. Econolite’s account receivable represented 39% of our accounts receivable at December 31, 2009 and 44% of our accounts receivable at December 31, 2008. We expect that Econolite will continue to account for a significant portion of our revenue for the foreseeable future. Any decrease in Econolite’s sales volume could significantly reduce our royalty revenue and adversely impact earnings. A failure by Econolite to make royalty payments to us in a timely manner or at all will harm our financial condition. In addition, we believe sales of our products are a material part of Econolite’s business, and any significant decrease in Econolite’s sales of the other products it sells could harm Econolite, which could have a material adverse effect on our business and prospects.
9
The features and functions in our products have not been as widely utilized as traditional products offered by our competitors, and the failure of our end users to provide greater demand for the features and functions in our products could adversely affect our business and growth prospects.
Machine vision and radar technologies have not been utilized in the traffic management industry as extensively as other more traditional technologies, mainly in-pavement loop detectors. Our financial success and growth prospects depend on the continued development of the market for advanced technology solutions for traffic management and the acceptance of our current Autoscope and RTMS systems and also future systems we may develop as reliable, cost-effective alternatives to traditional vehicle detection systems. We cannot assure you that we will be able to utilize our technology profitably in other products or markets. If our end users do not continue to increase their demand for the features and functions provided by our current Autoscope and RTMS systems or hybrid or other systems we may develop in the future, our business and growth prospects could be adversely affected.
Our operating costs tend to be fixed, while our revenue tends to be seasonal, thereby resulting in operating results that fluctuate from quarter to quarter.
Our expense levels are based in part on our product development efforts and our expectations regarding future revenues and, in the short-term, are generally fixed. Our quarterly revenues, however, have varied significantly in the past, with our first quarter historically being the weakest due to weather conditions in North America, Europe and northern Asia that make roadway construction more difficult. Additionally, our international revenues have a significant large project component, resulting in a varying revenue stream. We expect the seasonality of our revenue and the fixed nature of our operating costs to continue in the foreseeable future. Therefore, we may be unable to adjust our spending in a timely manner to compensate for any unexpected revenue shortfall. As a result, if anticipated revenues in any quarter do not occur or are delayed, our operating results for the quarter would be disproportionately affected. Operating results also may fluctuate due to factors such as the demand for our products; product life cycle; the development, introduction and acceptance of new products and product enhancements by us or our competitors; changes in the mix of distribution channels through which our products are offered; changes in the level of operating expenses; end user order deferrals in anticipation of new products; competitive conditions in the industry; and economic conditions generally. No assurance can be given that we will be able to achieve or maintain profitability on a quarterly or annual basis in the future.
Increased competition may make it difficult for us to acquire and retain end users. If we are unsuccessful in developing new applications and product enhancements, our products may become noncompetitive or obsolete.
Competition in the area of advanced traffic management and surveillance is continuing to grow. Some of the companies that may compete with us in the business of developing and implementing traffic control systems have substantially more financial, technological, marketing, personnel and research and development resources than we have. Therefore, they may be able to respond more quickly than we can to new or changing opportunities, technologies, standards or end user requirements. If we are unable to compete successfully with these companies, the market share for our products will decrease, and competitive pressures may seriously harm our business.
Additionally, the market for vehicle detection is continuously seeking more advanced technological solutions to traffic management and control problems. Technologies such as embedded loop detectors, pressure plates, pneumatic tubes, radars, lasers, magnetometers, acoustics and microwaves that have been used as traffic sensing devices in the past will be enhanced for use in the traffic management industry, and new technologies may be developed. We are aware of several companies that are developing traffic management devices using machine vision technology or other advanced technology. We expect to face increasingly competitive product developments, applications and enhancements. New technologies or applications in traffic control systems may provide our end users with alternatives to the Autoscope and RTMS systems and could render our solutions noncompetitive or obsolete. If we are unable to increase the number of our applications and develop and commercialize product enhancements and applications in a timely manner that respond to changing technology and satisfy the needs of our end users, our business and financial results will suffer.
10
Our dependence on third parties for manufacturing and marketing our products may prevent us from meeting customers’ needs in a timely manner.
We do not have, and do not intend to develop in the near future, internal capabilities to manufacture our products. We have entered into agreements with Econolite and Wireless Technology, Inc., or WTI, to manufacture the Autoscope system and related products for sales in North America, the Caribbean and Latin America. The hardware components for our RTMS products are made by manufacturers in Taiwan and Canada, and the components are assembled and tested in Canada. In addition, we work with suppliers, some of whom are overseas, to manufacture Autoscope and RTMS products that need to comply with the European Union’s regulatory RoHS directive on the restriction of the use of certain hazardous substances in electrical and electronic equipment. If Econolite, WTI or our suppliers are unable to manufacture our products in the future, we may be unable to identify other manufacturers able to meet product and quality demands in a timely manner or at all. Our inability to find suitable manufacturers for our products could result in delays or reductions in product shipments, which in turn may harm our business reputation and results of operations. In addition, we have granted Econolite the exclusive right to market the Autoscope system and related products in North America, the Caribbean and Latin America. Consequently, our revenue depends to a significant extent on Econolite’s marketing efforts. Econolite’s inability to effectively market the Autoscope system, or the disruption or termination of that relationship, could result in reduced revenue and market share for our products.
We and our third party manufacturers obtain some of the components of our products from a single source, and an interruption in the supply of those components may prevent us from meeting customers’ needs in a timely manner and could therefore reduce our sales.
Although substantially all of the hardware components incorporated into the Autoscope and RTMS systems are standard electronics components that are available from multiple sources, we and our third party manufacturers obtain some of the components from a single source. The loss or interruption of any of these supply sources could force us or our manufacturers to identify new suppliers, which could increase our costs, reduce our sales and profitability, or harm our customer relations by delaying product deliveries.
We may face increased competition if we fail to adequately protect our intellectual property rights, and any efforts to protect our intellectual property rights may result in costly litigation.
Our success depends in large measure on the protection of our proprietary technology rights. We rely on trade secret, copyright and trademark laws, and confidentiality agreements with employees and third parties, all of which offer only limited protection. We acquired six patent applications filed with the U.S. Patent and Trademark Office, or USPTO, in the EIS asset purchase. We have been issued patents on five of these applications. The remaining application is pending. However, we cannot assure you that the scope of these or any future patents relating to our products will exclude competitors or provide competitive advantages to us. We also cannot assure you that we will become aware of all instances in which others develop similar products, duplicate any of our products, or reverse engineer or misappropriate our proprietary technology. If our proprietary technology is misappropriated, our business and financial results could be adversely affected. Litigation may be necessary in the future to enforce our intellectual property rights, to protect our trade secrets or to determine the validity and scope of the proprietary rights of others. In addition, we may be the subject of lawsuits by others who claim we violate their intellectual property rights. Even if the result is favorable, litigation could result in substantial costs and the diversion of management resources, either of which could harm our business.
We have not applied for patent protection in all countries in which we market and sell the Autoscope and RTMS systems. Consequently, our proprietary rights in the technology underlying the Autoscope and RTMS systems in countries other than the U.S. will be protected only to the extent that trade secret, copyright or other non-patent protection is available and to the extent we are able to enforce our rights. The laws of other countries in which we market our products may afford little or no effective protection of our proprietary technology, which could harm our business.
The expiration of the University of Minnesota patent for certain aspects of our Autoscope system may result in additional competition, which could adversely affect our revenue and earnings.
The patent rights for certain aspects of the underlying technology for the Autoscope system previously owned by the University of Minnesota expired in July 2006. Other businesses may choose to use the University patent technology to develop a product that competes with the Autoscope system, and this competition could adversely impact our revenue and earnings.
11
We plan to continue introducing new products and technologies and may not realize the degree or timing of benefits we initially anticipated, which could adversely affect our business and results of operations.
We regularly invest substantial amounts in research and development efforts that pursue advancements in a range of technologies, products and services. Our ability to realize the anticipated benefits of these advancements depends on a variety of factors, including meeting development, production, certification and regulatory approval schedules; execution of internal and external performance plans; availability of supplier-produced parts and materials; performance of suppliers and vendors; achieving cost efficiencies; validation of innovative technologies; and the level of end user interest in new technologies and products. These factors involve significant risks and uncertainties. We may encounter difficulties in developing and producing these new products and may not realize the degree or timing of benefits initially anticipated. In particular, we cannot predict with certainty whether, when or in what quantities our current or potential end users will have a demand for products currently in development or pending release. Moreover, as new products are announced, sales of current products may decrease as end users delay making purchases until such new products are available. Any of the foregoing could adversely affect our business and results of operations.
We price our products at a premium compared to other technologies. As such, we may not be able to quickly respond to emerging low-cost competitors, and our inability to do so could adversely affect revenue and profitability.
We price our products at a premium as compared to products using less sophisticated technologies. As the technological sophistication of our competitors and the size of the market increase, competing low-cost developers of machine vision products for traffic are likely to emerge and grow stronger. If end users prefer low-cost alternatives over our products, our revenue and profitability could be adversely affected.
Our revenue could be adversely affected by the emergence of local competitors and local biases in international markets.
Our experience indicates that local officials that purchase traffic management products in the international markets we serve favor products that are developed and manufactured locally. As local competitors to our products emerge, local biases could erode our revenue in Europe and Asia and adversely affect our sales and revenue in those markets.
Failure to predict technological convergence could harm our business and could reduce our sales.
With our Autoscope and RTMS product families, we currently utilize only certain detection technologies available in the ITS field. If we fail to predict convergence of technology preferences in the market for ITS, or fail to identify and acquire complementary businesses or products that broaden our current product offerings, we may fail to capture certain segments of the market, which could harm our business and reduce our sales.
We sell our products internationally and are subject to various risks relating to such international activities, which could harm our international sales and profitability.
During 2009, 2008 and 2007, 25%, 28% and 27% of our total revenue, respectively, was attributable to international sales. We sell outside of the U.S. through our agreement with Econolite, through our wholly-owned subsidiaries and through our distributor network. By doing business in international markets, including Canada, we are exposed to risks separate and distinct from those we face in our U.S. operations. Our international business may be adversely affected by changing economic conditions in foreign countries. Because most of our sales are currently denominated in U.S. dollars, if the value of the U.S. dollar increases relative to foreign currencies, our products could become more costly to the international consumer and therefore less competitive in international markets, which could adversely affect our profitability. Furthermore, although currently only a small percentage of our sales is denominated in non-U.S. currency, this percentage may increase in the future, in which case fluctuations in exchange rates could affect demand for our products. Engaging in international business inherently involves a number of other difficulties and risks, including:
|
|
|
|
|
|
• |
export restrictions and controls relating to technology; |
|
|
|
|
|
|
• |
pricing pressure that we may experience internationally; |
|
|
|
|
|
|
• |
required compliance with existing and new foreign regulatory requirements and laws; |
12
|
|
|
|
|
|
• |
laws and business practices favoring local companies; |
|
|
|
|
|
|
• |
longer payment cycles; |
|
|
|
|
|
|
• |
difficulties in enforcing agreements and collecting receivables through foreign legal systems; |
|
|
|
|
|
|
• |
political and economic instability; |
|
|
|
|
|
|
• |
potentially adverse tax consequences, tariffs and other trade barriers; |
|
|
|
|
|
|
• |
international terrorism and anti-American sentiment; |
|
|
|
|
|
|
• |
difficulties and costs of staffing and managing foreign operations; |
|
|
|
|
|
|
• |
changes in currency exchange rates; and |
|
|
|
|
|
|
• |
difficulties in enforcing intellectual property rights. |
Our exposure to each of these risks may increase our costs, lengthen our sales cycle and require significant management attention. We cannot assure you that one or more of these factors will not harm our business.
Our inability to comply with European and Asian regulatory restrictions over hazardous substances and electronic waste could restrict product sales in those markets and reduce profitability in the future.
The European Union has finalized the Waste Electrical and Electronic Equipment, or WEEE, directive, which makes producers of electrical goods financially responsible for specified collection, recycling, treatment and disposal of past and future covered products. This directive must now be enacted and implemented by individual European Union governments, and certain producers will be financially responsible under the WEEE legislation. This may impose requirements on us, which, if we are unable to meet them, could adversely affect our ability to market our products in European Union countries, and sales revenues and profitability would suffer as a consequence. In addition, the European Parliament has enacted a directive for the restriction of the use of certain hazardous substances in electrical and electronic equipment, or RoHS. This legislation restricts the use of such substances as mercury, lead, cadmium and hexavalent cadmium. If we are unable to have our products manufactured in compliance with the RoHS directive, we would be unable to market our products in European Union countries, and our sales revenues and profitability would suffer. In addition, various Asian governments could adopt their own versions of environment-friendly electronic regulations similar to the European directives, RoHS and WEEE. This could require new and unanticipated manufacturing changes, product testing and certification requirements, thereby increasing cost, delaying sales and lowering revenue and profitability.
Our inability to manage growth effectively could seriously harm our business.
Growth and expansion of our business could significantly strain our capital resources as well as the time and abilities of our management personnel. Our ability to manage growth effectively will require continued improvement of our operational, financial and management systems and the successful training, motivation and management of our employees. If we are unable to manage growth successfully, our business and operating results will suffer.
Our business operations will be severely disrupted if we lose key personnel or if we fail to attract and retain qualified personnel.
Our technology depends upon the knowledge, experience and skills of our key management and scientific and technical personnel. Additionally, our ability to continue technological developments and to market our products, and thereby develop a competitive edge in the marketplace, depends in large part on our ability to attract and retain qualified scientific and technical personnel. Competition for qualified personnel is intense, and we cannot assure you that we will be able to attract and retain the individuals we need, especially if our business expands and requires us to employ additional personnel. In addition, the loss of personnel or our failure to hire additional personnel could materially and adversely affect our business, operating results and ability to expand. The loss of key personnel, including Kenneth R. Aubrey, our President and Chief Executive Officer, or our inability to hire and retain qualified personnel, would harm our business.
13
Our stock is thinly traded and our stock price is volatile.
Our common stock is thinly traded, with 3,549,387 shares of our 3,993,919 outstanding shares held by non-affiliates as of March 12, 2010. Based on the trading history of our common stock and the nature of the market for publicly traded securities of companies in evolving high-tech industries, we believe there are several factors that have caused and are likely to continue to cause the market price of our common stock to fluctuate substantially. The fluctuations may occur on a day-to-day basis or over a longer period of time. Factors that may cause fluctuations in our stock price include announcements of large orders obtained by us or our competitors, substantial cutbacks in government funding of highway projects or of the potential availability of alternative technologies for use in traffic control and safety, quarterly fluctuations in our financial results or the financial results of our competitors, consolidation among our competitors, fluctuations in stock market prices and volumes, and the volatility of the stock market.
We may not be successful in implementing our acquisition strategy. Future acquisitions could result in disruptions to our business by, among other things, distracting management time and diverting financial resources. Further, if we are unsuccessful in integrating acquired companies into our business, it could materially and adversely affect our financial condition and operating results.
Part of our continuing business strategy is to acquire or invest in companies, products or technologies that complement our current products, enhance our market coverage or technical capabilities or offer growth opportunities. As part of this strategy, in December 2007, we completed the EIS asset purchase. We may not be able to identify suitable acquisition candidates or investment partners or products in the future or, if we do, we may not be able to make such acquisitions on commercially acceptable terms or at all. For any acquisitions, a significant amount of management’s time and financial resources may be required to complete the acquisition and integrate the acquired business into our existing operations. Even with this investment of management time and financial resources, an acquisition may not produce the revenue, earnings or business synergies anticipated. Acquisitions involve numerous other risks, including assumption of unanticipated operating problems or legal liabilities; problems integrating the purchased operations, technologies or products; diversion of management’s attention from our core businesses; restrictions on the manner in which we may use purchased companies or assets imposed by acquisition agreements; adverse effects on existing business relationships with suppliers and customers; incorrect estimates made in the accounting for acquisitions and amortization of acquired intangible assets that would reduce future reported earnings (such as goodwill impairments); ensuring acquired companies’ compliance with the requirements of the Sarbanes-Oxley Act; and potential loss of customers or key employees of acquired businesses. We cannot assure you that any acquisitions, investments, strategic alliances or joint ventures will be completed in a timely manner or achieve anticipated synergies, will be structured or financed in a way that will enhance our business or creditworthiness, or will meet our strategic objectives or otherwise be successful. In addition, we may not be able to secure the financing necessary to consummate future acquisitions, and future acquisitions and investments could involve the issuance of additional equity securities or the incurrence of additional debt, which could increase dilution or harm our financial condition or creditworthiness.
Amounts recorded for goodwill could be adversely impacted by current market conditions.
Our recorded goodwill of approximately $7.6 million at December 31, 2009 relates to our Hong Kong-based subsidiary, Flow Traffic Ltd., and the assets purchased in the EIS asset purchase. Each year, we perform an impairment test of goodwill in October for the EIS assets and in December for Flow Traffic or whenever an impairment indicator arises, and we test our long-lived assets for impairment when indicators of impairment are present. The impairment test requires us to estimate the fair value of our reporting units and then compare it to the carrying value of the reporting units. If the carrying value exceeds the fair value, further analysis is performed to determine if there is an impairment charge. We estimate the fair value primarily by using a combination of income and market approaches, where fair value under the income approach is dependent on the present value of future economic benefits to be derived from ownership of Flow Traffic and the EIS assets and fair value under the market approach considers recently completed transactions within our industry sectors, comparable trading values and other market conditions. The future economic benefits are significantly dependent on future revenue growth. If Flow Traffic and the EIS assets do not provide the future economic benefits we project, the fair value of these assets may become impaired, and we would need to record an impairment loss. Fair market valuation requires assumptions and estimates of many critical factors, including revenue and market growth, operating cash flows, market multiples and discount rates. As general market conditions have deteriorated, our Flow Traffic subsidiary and the EIS assets could experience a decline in fair market value, which could adversely affect the results of the impairment testing that we perform in the future and could potentially lead to a future impairment charge of some or all of our goodwill at one or both of our reporting units. In addition, the financial markets turmoil appears to be impacting common stock trading prices for many companies, including ours. If our market capitalization falls below our shareholders’ equity, it could trigger an impairment of goodwill in the future.
14
Difficult and volatile conditions in the capital, credit and commodities markets and in the overall economy could continue to adversely affect our financial position, results of operations and cash flows, and we do not know if these conditions will improve in the near future.
Our financial position, results of operations and cash flows could continue to be adversely affected by difficult conditions and significant volatility in the capital, credit and commodities markets and in the overall worldwide economy. These factors, combined with declining business and consumer confidence and increased unemployment, have precipitated a worldwide economic slowdown and recession in the United States and other parts of the world. The continuing impact that these factors might have on us and our business is uncertain and cannot be estimated at this time. Current economic conditions have accentuated each of these risks and magnified their potential effect on us and our business. The difficult conditions in these markets and the overall economy affect our business in a number of ways. For example:
|
|
|
|
|
|
• |
Although we believe we have sufficient liquidity under our financing arrangement with Associated Bank, National Association, to run our business, under extreme market conditions, there can be no assurance that such funds would be available or sufficient, and, in such a case, we may not be able to successfully obtain additional financing on favorable terms, or at all. |
|
|
|
|
|
|
• |
Recent market volatility has exerted downward pressure on our stock price, which may make it more difficult for us to raise additional capital in the future. |
|
|
|
|
|
|
• |
Economic conditions could result in customers in our markets continuing to experience financial difficulties or electing to limit spending because of the economy which may result, for example, in declining tax revenue for our customers that are governmental entities, which in turn could result in decreased sales and earnings for us. |
We do not know if market conditions or the state of the overall economy will improve in the near future or when improvement will occur.
Our directors and executive officers have substantial control over us and could limit the ability of our other shareholders to influence the outcome of key transactions, including changes of control.
Our executive officers and directors and entities affiliated with them, in the aggregate, beneficially owned 15% of our outstanding common stock as of March 12, 2010, assuming the exercise by them of all of their options that were currently exercisable or that vest within 60 days of March 12, 2010. Our executive officers and directors and their affiliated entities, if acting together, thus are able to control or influence significantly all matters requiring approval by our shareholders, including the election of directors and the approval of mergers or other significant corporate transactions. These shareholders may have interests that differ from other shareholders, and they may vote in a way with which other shareholders disagree and that may be adverse to other shareholders’ interests. The concentration of ownership of our common stock may have the effect of delaying, preventing or deterring a change of control of our company, could deprive our shareholders of an opportunity to receive a premium for their common stock as part of a sale of our company, and may affect the market price of our common stock. This concentration of ownership of our common stock may also have the effect of influencing the completion of a change in control that may not necessarily be in the best interests of all of our shareholders.
Our articles of incorporation and bylaws, Minnesota law and the terms of the EIS asset purchase agreement may inhibit a takeover that shareholders consider favorable.
Provisions of our articles of incorporation and bylaws and applicable provisions of Minnesota law may delay or discourage transactions involving an actual or potential change in our control or change in our management, including transactions in which shareholders might otherwise receive a premium for their shares or transactions that our shareholders might otherwise deem to be in their best interests. These provisions:
|
|
|
|
|
|
• |
permit our board of directors to issue up to 5,000,000 shares of preferred stock with any rights, preferences and privileges as it may designate, including the right to approve an acquisition or other change in our control; |
15
|
|
|
|
|
|
• |
provide that the authorized number of directors may be changed by resolution of the board of directors; |
|
|
|
|
|
|
• |
provide that all vacancies, including newly-created directorships, may, except as otherwise required by law, be filled by the affirmative vote of a majority of directors then in office, even if less than a quorum; and |
|
|
|
|
|
|
• |
eliminate cumulative voting rights, therefore allowing the holders of a majority of the shares of common stock entitled to vote in any election of directors to elect all of the directors standing for election, if they should so choose. |
In addition, Section 302A.671 of the Minnesota Business Corporation Act, or MBCA, generally limits the voting rights of a shareholder acquiring a substantial percentage of our voting shares in an attempted takeover or otherwise becoming a substantial shareholder of our company unless holders of a majority of the voting power of the disinterested shares approve full voting rights for the substantial shareholder. Section 302A.673 of the MBCA generally limits our ability to engage in any business combination with certain persons who own 10% or more of our outstanding voting stock or any of our associates or affiliates who at any time in the past four years have owned 10% or more of our outstanding voting stock. These provisions of the MBCA may have the effect of entrenching our management team and may deprive shareholders of the opportunity to sell their shares to potential acquirers at a premium over prevailing prices. This potential inability to obtain a control premium could reduce the price of our common stock.
The EIS asset purchase agreement also accelerates earn-out payments we must make to EIS if we are acquired or sell substantially all of our assets before December 6, 2010. The required acceleration of these payments could negatively affect the ability of our shareholders to obtain a premium over our prevailing stock price and reduce our stock price generally.
We can issue shares of preferred stock without shareholder approval, which could adversely affect the rights of common shareholders.
Our articles of incorporation permit our board of directors to establish the rights, privileges, preferences and restrictions, including voting rights, of future series of our preferred stock and to issue such stock without approval from our shareholders. The rights of holders of our common stock may suffer as a result of the rights granted to holders of preferred stock that may be issued in the future. In addition, we could issue preferred stock to prevent a change in control of our company, depriving common shareholders of an opportunity to sell their stock at a price in excess of the prevailing market price.
We do not intend to declare dividends on our stock in the foreseeable future.
We currently intend to retain all future earnings for the operation and expansion of our business and, therefore, do not anticipate declaring or paying cash dividends on our common stock in the foreseeable future. Any payment of cash dividends on our common stock will be at the discretion of our board of directors and will depend upon our operating results, earnings, current and anticipated cash needs, capital requirements, financial condition, future prospects, any contractual restrictions and any other factors deemed relevant by our board of directors. Therefore, shareholders should not expect to receive dividend income from shares of our common stock.
|
|
|
|
Item 1B. |
Unresolved Staff Comments |
None.
|
|
|
|
Item 2. |
Properties |
We currently lease and occupy 16,115 square feet in St. Paul, Minnesota for our headquarters. This lease expires in May 2013, and we have the right to renew the lease for two additional three-year terms. Our office in Toronto, Ontario, Canada consists of 6,227 square feet of space, and our lease for this space expires in December 2010. We also lease smaller facilities in Hong Kong, the United Kingdom and Poland. We believe that our facilities are adequate to meet our current and expected needs.
We believe that our current space is generally adequate in the United States, Asia and Europe, and we do not intend to lease significantly more space in 2010.
16
|
|
|
|
Item 3. |
Legal Proceedings |
We are not currently a party to any material pending legal proceedings.
|
|
|
|
Item 4. |
Reserved |
17
PART II
|
|
|
|
Item 5. |
Market for Registrant’s Common Equity, Related Stockholder Matters and Issuer Purchases of Equity Securities |
Market Information
Our common stock is traded on The NASDAQ Capital Market under the symbol “ISNS.” The quarterly high and low sales prices for our common stock for our last two fiscal years are set forth below.
|
|
|
|
|
|
|
|
|
|
|
|
|
|
|
|
|
|
2009 |
|
2008 |
|
||||||||
|
|
|
|
|
|
|
||||||||
|
Quarter |
|
High |
|
Low |
|
High |
|
Low |
|
||||
|
|
|
|
|
|
|
|
|
|
|
||||
|
|
|
|
|
|
|
|
|
|
|
|
|
|
|
|
First |
|
$ |
10.51 |
|
$ |
6.69 |
|
$ |
17.50 |
|
$ |
12.08 |
|
|
Second |
|
|
10.25 |
|
|
8.19 |
|
|
16.40 |
|
|
11.37 |
|
|
Third |
|
|
13.11 |
|
|
8.61 |
|
|
15.12 |
|
|
10.71 |
|
|
Fourth |
|
|
14.10 |
|
|
11.40 |
|
|
12.00 |
|
|
6.12 |
|
Shareholders
As of March 5, 2010, there were 24 holders of record of our common stock and approximately 1,702 beneficial holders of our common stock.
Dividends
We have never declared or paid a cash dividend on our common stock. We currently intend to retain earnings for use in the operation and expansion of our business, and, consequently, we do not anticipate paying any dividends in the foreseeable future.
18
Comparative Stock Performance Graph
The graph below compares the five-year cumulative total stockholder return on our common stock with the cumulative total stockholder return of (i) the Dow Jones Wilshire 5000 Index, and (ii) the Dow Jones Wilshire Electronic Equipment Index, assuming an investment of $100 on December 31, 2004, including reinvestment of dividends.
Notwithstanding anything to the contrary set forth in any of our previous or future filings under the Securities Act of 1933 or the Securities Exchange Act of 1934 that might incorporate future filings by reference, including this Annual Report on Form 10-K, in whole or in part, the following performance graph and accompanying data shall not be deemed to be incorporated by reference into any such filings and shall not otherwise be deemed filed under such Acts.
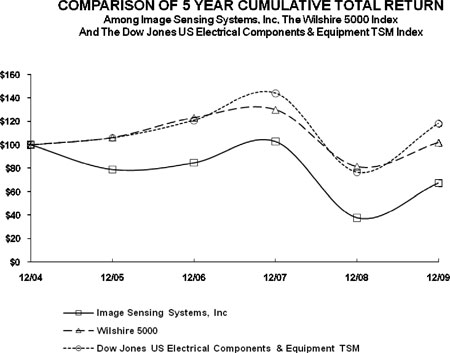
|
|
|
|
|
|
|
|
|
|
|
|
|
|
|
|
|
|
|
|
|
|
|
|
|
|
|
|
|
|
|
|
|
|
|
|
||||||
|
|
|
12/04 |
|
12/05 |
|
12/06 |
|
12/07 |
|
12/08 |
|
12/09 |
|
||||||
|
|
|
|
|
|
|
|
|
|
|
|
|
|
|
|
|
|
|
|
|
|
|
|
|
|
|
|
|
|
|
|
|
|
|
|
|
|
|
|
|
|
|
Image Sensing Systems, Inc. |
|
|
100.00 |
|
|
78.93 |
|
|
84.73 |
|
|
102.84 |
|
|
37.69 |
|
|
67.46 |
|
|
|
|||||||||||||||||||
|
Wilshire 5000 |
|
|
100.00 |
|
|
106.38 |
|
|
123.16 |
|
|
130.07 |
|
|
81.64 |
|
|
102.00 |
|
|
|
|||||||||||||||||||
|
Dow Jones US Electrical Components & Equipment TSM |
|
|
100.00 |
|
|
106.11 |
|
|
120.92 |
|
|
144.16 |
|
|
76.84 |
|
|
118.25 |
|
19
|
|
|
|
Item 6. |
Selected Financial Data |
The following table sets forth selected consolidated financial data for each of the five fiscal years ended December 31, 2009. The statement of income and balance sheet data for the years ended and as of December 31, 2009, 2008, 2007, 2006 and 2005 are derived from our audited consolidated financial statements. The following information should be read in conjunction with “Management’s Discussion and Analysis of Financial Condition and Results of Operations” and with our consolidated financial statements and the related notes thereto included elsewhere in this report.
|
|
|
|
|
|
|
|
|
|
|
|
|
|
|
|
|
|
|
|
|
Fiscal Years Ended December 31, |
|
|||||||||||||
|
|
|
|
|
|||||||||||||
|
|
|
2009 |
|
2008 |
|
2007 |
|
2006 |
|
2005 |
|
|||||
|
|
|
|
|
|||||||||||||
|
|
|
(in thousands, except per share data) |
|
|||||||||||||
|
Consolidated Statement of Income Data: |
|
|
|
|
|
|
|
|
|
|
|
|
|
|
|
|
|
Revenue: |
|
|
|
|
|
|
|
|
|
|
|
|
|
|
|
|
|
International sales |
|
$ |
6,162 |
|
$ |
7,455 |
|
$ |
4,067 |
|
$ |
2,980 |
|
$ |
2,407 |
|
|
North American sales |
|
|
6,321 |
|
|
5,689 |
|
|
269 |
|
|
— |
|
|
— |
|
|
Royalties |
|
|
12,110 |
|
|
13,321 |
|
|
10,747 |
|
|
10,136 |
|
|
8,595 |
|
|
|
|
|
|
|
|
|
|
|
|
|
|
|
|
|
|
|
|
Total revenue |
|
|
24,593 |
|
|
26,465 |
|
|
15,083 |
|
|
13,116 |
|
|
11,002 |
|
|
Cost of revenue: |
|
|
|
|
|
|
|
|
|
|
|
|
|
|
|
|
|
International sales |
|
|
2,063 |
|
|
2,805 |
|
|
1,927 |
|
|
1,501 |
|
|
1,042 |
|
|
North American sales |
|
|
2,234 |
|
|
2,107 |
|
|
60 |
|
|
— |
|
|
— |
|
|
Royalties |
|
|
— |
|
|
— |
|
|
— |
|
|
220 |
|
|
383 |
|
|
|
|
|
|
|
|
|
|
|
|
|
|
|
|
|
|
|
|
Total cost of revenue |
|
|
4,297 |
|
|
4,912 |
|
|
1,987 |
|
|
1,721 |
|
|
1,425 |
|
|
|
|
|
|
|
|
|
|
|
|
|
|
|
|
|
|
|
|
Gross profit |
|
|
20,296 |
|
|
21,553 |
|
|
13,096 |
|
|
11,395 |
|
|
9,577 |
|
|
Operating expenses: |
|
|
|
|
|
|
|
|
|
|
|
|
|
|
|
|
|
Selling, marketing and product support |
|
|
7,201 |
|
|
6,680 |
|
|
3,463 |
|
|
2,850 |
|
|
2,567 |
|
|
General and administrative |
|
|
3,779 |
|
|
4,069 |
|
|
2,653 |
|
|
2,383 |
|
|
1,400 |
|
|
Research and development |
|
|
3,336 |
|
|
2,908 |
|
|
2,299 |
|
|
2,639 |
|
|
1,516 |
|
|
Amortization of intangible assets |
|
|
768 |
|
|
768 |
|
|
51 |
|
|
— |
|
|
— |
|
|
In-process research and development |
|
|
— |
|
|
— |
|
|
4,500 |
|
|
— |
|
|
— |
|
|
|
|
|
|
|
|
|
|
|
|
|
|
|
|
|
|
|
|
|
|
|
15,084 |
|
|
14,425 |
|
|
12,966 |
|
|
7,871 |
|
|
5,483 |
|
|
|
|
|
|
|
|
|
|
|
|
|
|
|
|
|
|
|
|
Income from operations |
|
|
5,212 |
|
|
7,128 |
|
|
130 |
|
|
3,524 |
|
|
4,094 |
|
|
Other income, net |
|
|
7 |
|
|
43 |
|
|
543 |
|
|
523 |
|
|
252 |
|
|
|
|
|
|
|
|
|
|
|
|
|
|
|
|
|
|
|
|
Income before income taxes |
|
|
5,219 |
|
|
7,171 |
|
|
673 |
|
|
4,047 |
|
|
4,346 |
|
|
Income tax expense (benefit) |
|
|
1,354 |
|
|
2,207 |
|
|
(199 |
) |
|
942 |
|
|
1,505 |
|
|
|
|
|
|
|
|
|
|
|
|
|
|
|
|
|
|
|
|
Net income |
|
$ |
3,865 |
|
$ |
4,964 |
|
$ |
872 |
|
$ |
3,105 |
|
$ |
2,841 |
|
|
|
|
|
|
|
|
|
|
|
|
|
|
|
|
|
|
|
|
|
|
|
|
|
|
|
|
|
|
|
|
|
|
|
|
|
|
Net income per share: |
|
|
|
|
|
|
|
|
|
|
|
|
|
|
|
|
|
Basic |
|
$ |
0.97 |
|
$ |
1.26 |
|
$ |
0.23 |
|
$ |
0.83 |
|
$ |
0.79 |
|
|
Diluted |
|
|
0.95 |
|
|
1.24 |
|
|
0.22 |
|
|
0.80 |
|
|
0.73 |
|
|
|
|
|
|
|
|
|
|
|
|
|
|
|
|
|
|
|
|
Weighted average number of common shares outstanding: |
|
|
|
|
|
|
|
|
|
|
|
|
|
|
|
|
|
Basic |
|
|
3,985 |
|
|
3,943 |
|
|
3,789 |
|
|
3,725 |
|
|
3,602 |
|
|
Diluted |
|
|
4,081 |
|
|
4,001 |
|
|
3,881 |
|
|
3,891 |
|
|
3,868 |
|
|
|
|
|
|
|
|
|
|
|
|
|
|
|
|
|
|
|
|
|
|
At December 31, |
|
|||||||||||||
|
|
|
|
|
|||||||||||||
|
|
|
2009 |
|
2008 |
|
2007 |
|
2006 |
|
2005 |
|
|||||
|
|
|
|
|
|||||||||||||
|
|
|
(in thousands) |
|
|||||||||||||
|
Consolidated Balance Sheet Data: |
|
|
|
|
|
|
|
|
|
|
|
|
|
|
|
|
|
Total assets |
|
$ |
41,150 |
|
$ |
36,108 |
|
$ |
30,388 |
|
$ |
21,224 |
|
$ |
16,791 |
|
|
Bank debt |
|
|
4,000 |
|
|
3,750 |
|
|
5,000 |
|
|
— |
|
|
— |
|
|
Total shareholders’ equity |
|
|
32,713 |
|
|
28,530 |
|
|
23,225 |
|
|
19,333 |
|
|
15,722 |
|
20
|
|
|
|
Item 7. |
Management’s Discussion and Analysis of Financial Condition and Results of Operations |
The following discussion and analysis of our financial condition and results of operations should be read in conjunction with the Selected Financial Data and our financial statements and the accompanying notes. Our actual results could differ materially from those anticipated in the forward-looking statements included in this discussion as a result of certain factors, including, but not limited to, those discussed in “Risk Factors” and “Information Regarding Forward-Looking Statements” included elsewhere in this Annual Report.
Overview
General. We provide software-based computer enabled detection, or CED, products and solutions that use advanced signal processing software algorithms to detect and monitor objects in a designated field of view. Our technology analyzes the signal from a sophisticated sensor and passes the information along to management systems, controllers or directly to users. Our core products, the Autoscope® Video Vehicle Detection System and the RTMS® Radar Detection System, operate using our proprietary software in conjunction with video cameras or radar and commonly available electronic components. Each of these systems is used by traffic managers primarily to improve the flow of vehicle traffic and to enhance safety at intersections, main thoroughfares, freeways and tunnels.
Autoscope systems are sold to distributors and end users of traffic management products in North America, the Caribbean and Latin America by Econolite Control Products, Inc., or Econolite, our exclusive licensee in these regions. We sell RTMS systems to distributors and end users in North America. We also sell both Autoscope and RTMS to distributors and end users in Europe and Asia through our European and Hong Kong subsidiaries, respectively. End users of our products throughout the world are generally funded by government agencies responsible for traffic management or traffic law enforcement.
EIS Asset Purchase. On December 6, 2007, we purchased certain assets from EIS Electronic Integrated Systems Inc., or EIS, including its principal product line, the RTMS System. In its fiscal year ended September 30, 2007, EIS had revenue of $8.7 million, substantially all of which related to RTMS sales. Our consolidated financial statements include revenue and expenses related to the operations of the former EIS business from December 7, 2007 through December 31, 2009.
|
|
|
|
|
|
Trends and Challenges in Our Business |
|
|
|
|
|
|
|
We believe the growth in our business can be attributed primarily to the following global trends: |
|
|
|
|
|
|
|
• |
worsening traffic caused by increased numbers of vehicles in metropolitan areas without corresponding expansions of road infrastructure, which has increased demand for our products; |
|
|
|
|
|
|
• |
advances in information technology, which have made our products easier to market and implement; |
|
|
|
|
|
|
• |
the continuing rise in funding allocations in large cities for centralized traffic management services, which has increased the ability of our primary end users to implement our products; and |
|
|
|
|
|
|
• |
general increases in the cost-effectiveness of electronics, which make our products more affordable for end users. |
|
|
|
|
|
|
We believe our continued growth primarily depends upon: |
|
|
|
|
|
|
|
• |
continued adoption and governmental funding of intelligent transportation systems, or ITS, for traffic control in developed countries; |
|
|
|
|
|
|
• |
countries in the developing world adopting above-ground detection technology, such as video or radar, instead of in-pavement loop technology to manage traffic; |
21
|
|
|
|
|
|
• |
use of CED to provide solutions to security/surveillance and environmental issues associated with increasing automobile use in metropolitan areas; and |
|
|
|
|
|
|
• |
our ability to develop new products, such as hybrid CED devices incorporating, for example, radar and video technologies, that provide increasingly accurate information and enhance the end users’ ability to cost-effectively manage traffic, security/surveillance and environmental issues. |
Because our principal end users are governmental entities, we are faced with challenges related to potential delays in purchase decisions by those entities and changes in budgetary constraints. These contingencies could result in significant fluctuations in our revenue between periods. The current worldwide recession is further adding to the unpredictability of purchase decisions, creating more delays than usual and decreasing governmental budgets, and it is likely to continue to negatively affect our 2010 revenue. We believe we will continue to be a beneficiary of the federal stimulus bill enacted early in 2009, but it is difficult to determine the level of impact it has on our operations.
Key Financial Terms and Metrics
Revenue. Revenue historically has been derived from two sources: (1) royalties received from Econolite for sales of the Autoscope system in North America, the Caribbean and Latin America and (2) revenue received from direct sales of Autoscope systems in Europe and Asia. Royalties from Econolite historically have provided the majority of our revenue. We calculate the royalties using a profit sharing model where we split the gross profit on sales of Autoscope product made through Econolite. This royalty arrangement has the benefit of decreasing our cost of revenues and our selling, marketing and product support expenses because these costs and expenses are borne primarily by Econolite. Although this royalty model has a positive impact on our gross margin, it also negatively impacts our total revenue, which would be higher if all the sales made by Econolite were made directly by us. The royalty arrangement is exclusive under a long-term agreement. Our acquisition of the RTMS product line in December 2007 gives us an additional source of revenue that increased our overall revenue and helped to lessen fluctuations in our revenue from period to period due to our ownership of more than one product line and the higher volumes it brings, notwithstanding normal seasonality.
Cost of Revenue. There is no cost of revenue related to royalties, as virtually all manufacturing, warranty and related costs are incurred by Econolite. Cost of revenue related to direct product sales consists primarily of the amount charged by our third party contractors to manufacture the Autoscope and RTMS hardware platforms, which is influenced mainly by the cost of electronic components. The cost of revenue also includes logistics costs and estimated expenses for product warranties and inventory reserves. The key metric that we follow is achieving certain gross margin percentages by geographic region.
Operating Expenses. Our operating expenses fall into three categories: (1) selling, marketing and product support; (2) general and administrative; and (3) research and development. Selling, marketing and product support expenses consist of various costs related to sales and support of our products, including salaries, benefits and commissions paid to our personnel; commissions paid to third parties; travel, trade show and advertising costs; second-tier technical support for Econolite; and general product support, where applicable. General and administrative expenses consist of certain corporate and administrative functions that support the development and sales of our products and provide an infrastructure to support future growth. General and administrative expenses reflect management, supervisory and staff salaries and benefits, legal and auditing fees, travel, rent and costs associated with being a public company, such as board of director fees, Sarbanes-Oxley compliance, listing fees and annual reporting expenses. Research and development expenses consist mainly of salaries and benefits for our engineers and third party costs for consulting and prototyping. We measure all operating expenses against our annually approved budget, which is developed with achieving a certain operating margin as a key focus. Also included in operating expenses is non-cash expense for intangible asset amortization.
Seasonality. Our quarterly revenues and operating results have varied significantly in the past due to the seasonality of our business. Our first quarter generally is the weakest due to weather conditions that make roadway construction more difficult in North America, Europe and northern Asia. We expect such seasonality to continue for the foreseeable future. Additionally, our international revenues have a significant large project component, resulting in a varying revenue stream. Accordingly, we believe that quarter-to-quarter comparisons of our financial results should not be relied upon as an indication of our future performance. No assurance can be given that we will be able to achieve or maintain profitability on a quarterly or annual basis in the future.
22
History. We were incorporated in the state of Minnesota in December 1984 and began operations by pioneering the commercial application of wide-area video vehicle detection for traffic management. The technology underlying our products was initially developed at the University of Minnesota. In 1989, the University was awarded a patent for that technology, which it exclusively licensed to us. In 1991, we sub-licensed this technology to Econolite, a leading manufacturer and seller of traffic control products in North America and the Caribbean, to manufacture and distribute products incorporating the technology.
Segments. We currently operate in two reportable segments: Autoscope and RTMS. Autoscope is our machine-vision product line, and revenue consists of royalties (all of which are received from Econolite), as well as a portion of international sales. RTMS is our radar product line acquired in the EIS asset purchase in December 2007, and revenue consists of all North American sales and a portion of international sales. All segment revenues are derived from external customers.
The following tables set forth selected unaudited financial information for each of the Company’s reportable segments (in thousands):
|
|
|
|
|
|
|
|
|
|
|
|
|
|
|
For the year ended December 31, 2009 |
|
|||||||
|
|
|
|
|
|||||||
|
|
|
Autoscope |
|
RTMS |
|
Total |
|
|||
|
|
|
|
|
|
|
|
|
|||
|
Revenue |
|
$ |
16,240 |
|
$ |
8,353 |
|
$ |
24,593 |
|
|
Depreciation |
|
|
292 |
|
|
132 |
|
|
424 |
|
|
Amortization of intangible assets |
|
|
— |
|
|
768 |
|
|
768 |
|
|
Income before income taxes |
|
|
3,807 |
|
|
1,412 |
|
|
5,219 |
|
|
Capital expenditures |
|
|
555 |
|
|
139 |
|
|
694 |
|
|
Total assets |
|
|
29,752 |
|
|
11,398 |
|
|
41,150 |
|
|
|
|
|
|
|
|
|
|
|
|
|
|
|
|
For the year ended December 31, 2008 |
|
|||||||
|
|
|
|
|
|||||||
|
|
|
Autoscope |
|
RTMS |
|
Total |
|
|||
|
|
|
|
|
|
|
|
|
|||
|
Revenue |
|
$ |
18,705 |
|
$ |
7,760 |
|
$ |
26,465 |
|
|
Depreciation |
|
|
242 |
|
|
115 |
|
|
357 |
|
|
Amortization of intangible assets |
|
|
— |
|
|
768 |
|
|
768 |
|
|
Income before income taxes |
|
|
5,939 |
|
|
1,232 |
|
|
7,171 |
|
|
Capital expenditures |
|
|
273 |
|
|
112 |
|
|
385 |
|
|
Total assets |
|
|
24,135 |
|
|
11,973 |
|
|
36,108 |
|
Results of Operations
The following table sets forth, for the periods indicated, certain statements of income data as a percent of total revenue and gross margin on international sales and royalties as a percentage of international sales and royalties, respectively.
|
|
|
|
|
|
|
|
|
|
|
|
|
|
|
Year Ended December 31, |
|
|||||||
|
|
|
|
|
|||||||
|
|
|
2009 |
|
2008 |
|
2007 |
|
|||
|
|
|
|
|
|
|
|
|
|||
|
International sales |
|
|
25.1 |
% |
|
28.2 |
% |
|
27.0 |
% |
|
North American sales |
|
|
25.7 |
|
|
21.5 |
|
|
1.8 |
|
|
Royalties |
|
|
49.2 |
|
|
50.3 |
|
|
71.2 |
|
|
|
|
|
|
|
|
|
|
|
|
|
|
Total revenue |
|
|
100.0 |
|
|
100.0 |
|
|
100.0 |
|
|
|
|
|
|
|
|
|
|
|
|
|
|
Gross margin–international sales |
|
|
66.5 |
|
|
62.4 |
|
|
52.4 |
|
|
Gross margin–North American sales |
|
|
64.7 |
|
|
63.0 |
|
|
77.7 |
|
|
Gross margin–royalties |
|
|
100.0 |
|
|
100.0 |
|
|
100.0 |
|
|
Selling, marketing and product support |
|
|
29.3 |
|
|
25.2 |
|
|
23.0 |
|
|
General and administrative |
|
|
15.4 |
|
|
15.4 |
|
|
17.6 |
|
|
Research and development |
|
|
13.6 |
|
|
11.0 |
|
|
15.2 |
|
|
Amortization of intangibles |
|
|
3.1 |
|
|
2.9 |
|
|
0.3 |
|
|
In process research and development |
|
|
― |
|
|
― |
|
|
29.8 |
|
|
Income from operations |
|
|
21.2 |
|
|
26.9 |
|
|
0.9 |
|
|
Income tax expense (benefit) |
|
|
5.5 |
|
|
8.3 |
|
|
(1.3 |
) |
|
Net income |
|
|
15.7 |
|
|
18.8 |
|
|
5.8 |
|
23
Year Ended December 31, 2009 Compared to Year Ended December 31, 2008. Total revenue decreased to $24.6 million in 2009 from $26.5 million in 2008, a decrease of 7.1%. Royalty income decreased to $12.1 million in 2009 from $13.3 million in 2008, a decrease of 9.1%. We attribute the decrease in royalties to the economic recession in North America and its negative impact on state and federal spending. North American sales, which are sales of RTMS in North America, increased to $6.3 million in 2009 from $5.7 million in 2008, an increase of 11.1%. International sales, which include both Autoscope and RTMS sales outside of North America, decreased to $6.2 million in 2009 from $7.5 million in 2008, a decrease of 17.3%. The decrease in international sales was mainly due to weakness in the Asian market in the first half of 2009. Revenue for the Autoscope segment decreased to $16.2 million in 2009 from $18.7 million in 2008, a decrease of 13.2%. The decrease related to lower royalties and weakness in Asia as discussed above. Revenue for the RTMS segment increased to $8.4 million in 2009 from $7.8 million in 2008, an increase of 7.6%. The increase resulted mainly as a result of improved sales in North America.
Gross margins for international sales increased to 66.5% in 2009 from 62.4% in 2008. The increase resulted mainly from the increase in RTMS revenue, which typically earns higher margins than Autoscope, and to a lesser extent by a revenue mix shift to higher margin product within the Autoscope product family. Gross margins for North American sales increased to 64.7% in 2009 from 63.0% in 2008. The change was impacted by fewer lower of cost or market adjustments to inventory in 2009 as compared to 2008. Gross margins on royalty income remained consistent at 100% in 2009 and 2008. We anticipate that gross margins for our international and North American sales will be in the ranges of 60% to 65% in 2010, while we expect royalty gross margins will be 100% in 2010.
Selling, marketing and product support expense increased to $7.2 million or 29.3% of total revenue in 2009 from $6.7 million or 25.2% of total revenue in 2008. The selling, marketing and product support expense increased in 2009 as we invested in market expansion activities in Europe and Asia and realized the impact of headcount additions made late in 2008. We anticipate that selling, marketing and product support expense will increase in terms of actual expense in 2010, as compared to 2009, as we continue to invest in market expansion activities in Europe and Asia.
General and administrative expense decreased to $3.8 million or 15.4% of total revenue in 2009, down from $4.1 million or 15.4% of total revenue in 2008. The general and administrative expenses decrease in 2009 resulted mainly from lower incentive pay expense and higher foreign currency transaction gains, which were partially offset by increased professional services expense. We anticipate that general and administrative expense will increase both in terms of actual costs and as a percentage of revenue in 2010 as compared to 2009.
Research and development expense increased to $3.3 million or 13.6% of total revenue in 2009, up from $2.9 million or 11.0% of total revenue in 2008. The increase was directly related to our investment in video/radar hybrid solutions and tailored international offerings, development projects to reduce manufacturing costs, and the realization of the impact of headcount additions made late in 2008. We anticipate that research and development expense will increase both in terms of dollar amount and as a percentage of revenue in 2010 as compared to 2009 as we continue to invest in hybrid and international offerings and manufacturing cost reduction projects.
Amortization of intangibles expense was $768,000 in 2009 and reflects the amortization of intangible assets acquired in the EIS asset purchase. Assuming there are no changes to our intangible assets, we anticipate amortization expense will be $768,000 in 2010.
Other income decreased to $7,000 in 2009 from $43,000 in 2008 mainly due to lower interest rates. In 2008, other income fell due to lower cash and investment balances, lower interest rates and interest expense on debt incurred for the EIS asset purchase.
Income before income taxes for the Autoscope segment decreased to $3.8 million in 2009 from $5.9 million in 2008, a decrease of 35.9%. The decrease was mainly due to lower revenues in the segment. Income before income taxes for the RTMS segment increased to $1.4 million in 2009 from $1.2 million in 2008, an increase of 14.6%. The increase was due to higher revenues in the segment, which were partially offset by increased expenses, a majority of which were caused by the U.S. Dollar weakening over the course of 2009 against the Canadian Dollar.
Our income tax effective rate was 25.9% in 2009 compared to 30.8% in 2008. The 2009 effective rate was positively impacted by the realization of $236,000 in foreign tax credits whose status was uncertain prior to 2009. We expect the effective rate in 2010 to be below 30%.
24
Year Ended December 31, 2008 Compared to Year Ended December 31, 2007. Total revenue increased to $26.5 million in 2008 from $15.1 million in 2007, an increase of 75.5%. Royalty income increased to $13.3 million in 2008 from $10.8 million in 2007, an increase of 24.0%. The increase in royalty income reflected the continued success of Econolite’s distribution of Autoscope in the North American market. North American sales, which are sales of RTMS in North America, were $5.7 million in 2008. International sales, which include both Autoscope and RTMS sales outside of North America, increased to $7.5 million in 2008 from $4.1 million in 2007, an increase of 83.3%. The increase in international sales was mainly due to the addition of RTMS but also reflected market gains for Autoscope. We acquired the RTMS family of products in December 2007.
Gross margins for international sales increased to 62.4% in 2008 from 52.4% in 2007. The increase resulted mainly from the addition of RTMS, which typically earns higher margins than Autoscope, and to a lesser extent from a revenue mix shift to higher margin product in Autoscope. Gross margins on royalty income remained consistent at 100.0% in 2008 and 2007.
Selling, marketing and product support expense increased to $6.7 million or 25.2% of total revenue in 2008 from $3.5 million or 23.0% of total revenue in 2007. The change related mostly to the addition of RTMS related expenses and to a lesser extent to headcount additions in sales and product support.
General and administrative expense increased to $4.1 million or 15.4% of total revenue in 2008, up from $2.7 million or 17.6% of total revenue in 2007. The 2008 increase in costs resulted mainly from the addition of RTMS related expenses and increased professional services expenses, including the costs of our withdrawn follow-on offering.
Research and development expense increased to $2.9 million or 11.0% of total revenue in 2008, up from $2.3 million or 15.2% of total revenue in 2007. The increase was directly related to the addition of RTMS related expenses and headcount additions towards the end of the year.
Amortization of intangibles expense was $768,000 in 2008 and reflects the amortization of intangible assets acquired in the EIS asset purchase.
Other income decreased to $43,000 in 2008 from $543,000 in 2007. In 2008, other income fell due to lower cash and investment balances, lower interest rates and interest expense on debt incurred for the EIS asset purchase. In 2007, other income was mainly tax-exempt interest income, which was partially offset by interest expense on bank debt incurred in December 2007.
Our income tax effective rate was 30.8% in 2008. Our 2007 income tax effective rate was not meaningful due to the significant in-process research and development expense impact on pre-tax book income coupled with federal tax credits that brought our position to a benefit.
Liquidity and Capital Resources
At December 31, 2009, we had $14.1 million in cash and cash equivalents and $3.9 million in short-term investments, compared to $10.3 million in cash and cash equivalents and $4.0 million in short-term investments at December 31, 2008. Our investments held at December 31, 2008 were auction rate securities that were redeemed at par in January 2009.
Net cash provided by operating activities was $5.4 million in 2009, compared to $5.2 million and $1.5 million in 2008 and 2007, respectively. In 2009 as compared to 2008, our lower net income and increased inventory balances were offset by decreased accounts receivable outstanding. The primary reasons for the 2008 change compared to 2007 were the incremental net income increase in 2008, significant increases in depreciation and amortization, and stabilization of working capital because of the EIS asset purchase. In 2009, investment balances were similar to those of 2008. We purchased $4.0 million in investments, net of redemptions, in 2008 as opposed to selling $4.1 million in investments, net of purchases, in 2007. We anticipate that average receivable collection days in 2010 will be similar to 2009 and that it will not have a material impact on our liquidity. Our planned additions of property and equipment are discretionary, and we do not expect them to exceed historical levels in 2010.
In December 2009, we entered into a term loan agreement for $4.0 million with Associated Bank, National Association, or Associated Bank. The interest rate for the term loan is based on a formula of LIBOR plus 3.75% (current rate is 4.0%). The term loan has $4.0 million outstanding and contains a call provision that would require us to repay the note in full in May 2010 if we do not meet certain covenants. We previously had a separate $4.0 million term note with Associated Bank that originated in May 2008 and was fully repaid in February 2009.
25
We also have a revolving line of credit agreement with Associated Bank. The revolving line of credit provides for up to $5.0 million at an annual interest rate equal to the greater of 4.5% or LIBOR plus 2.75%, as reset from time to time by the bank. Advances on the line of credit cannot exceed a borrowing base determined under a formula, which is a percentage of the amounts of eligible receivables. The line of credit currently has no borrowings outstanding and matures on May 1, 2011. We believe, on an ongoing basis, we will have regular availability to draw a minimum of $3.0 million on our line of credit based on our qualifying assets.
In conjunction with our EIS asset purchase, the sellers have an earn-out arrangement over approximately three years from the December 2007 date of purchase. The earn-out is based on earnings before taxes from RTMS sales less related cost of revenue and operating expenses, excluding depreciation, amortization and interest expenses, and it is calculated annually. If the earnings are at target levels, the sellers would receive $2.0 million annually, or $6.0 million in total. Superior performance of the assets could lead to an earn-out in excess of $2 million, as the earn-out is not capped. Earn-out payments generally are due within three months of the end of an earn-out period. The first earn-out period ran from December 6, 2007 to December 31, 2008. Based on the results for RTMS for the first earn-out period, which ended December 31, 2008, the sellers of the EIS assets were entitled to receive a $1.2 million earn-out payment, which was paid in March and April 2009. Based on 2009 results for RTMS, the sellers are entitled to a $1.5 million earn-out for the second earn-out period, which ran from January 1, 2009 to December 31, 2009. The earn-out is expected to be paid in March 2010, with the liability recorded on our balance sheet as of December 31, 2009. If we are acquired or sell substantially all of our assets before December 6, 2010, we must pay EIS $6.0 million less earn-out amounts previously paid as an acceleration of potential earn-out payments under the EIS asset purchase agreement.
EIS was named in a U.S. lawsuit in 2006 for infringement of a patent. This lawsuit was dismissed upon appeal in August 2009 and is no longer contested by the plaintiff. We incurred no expense over the life of the lawsuit, as EIS was responsible for costs of defense.
We believe that cash and cash equivalents on hand at December 31, 2009, along with the availability of funds under our $5.0 million revolving line of credit and cash provided by operating activities, will satisfy our projected working capital needs, payments under the EIS earn-out, investing activities, and other cash requirements for the foreseeable future.
Off-Balance Sheet Arrangements
We do not participate in transactions or have relationships or other arrangements with an unconsolidated entity, including special purpose and similar entities or other off-balance sheet arrangements.
Critical Accounting Policies
Goodwill and Intangible Assets. Goodwill is not amortized but is tested for impairment annually or whenever an impairment indicator arises. Our goodwill related to our Flow Traffic subsidiary is tested for impairment on December 31 of each year. EIS asset purchase (RTMS) related goodwill is tested on October 1 of each year.
On an annual basis, we reconcile our market value to the estimated combined fair value of our business segments and reporting units as a separate measure to determine whether goodwill is impaired.
For Flow Traffic, we estimate the fair value by using a combination of the income approach, where fair value is dependent on the present value of future economic benefits to be derived from ownership of Flow Traffic, and the comparable market transactions method. The future economic benefits are significantly dependent on sustaining revenue levels for all product lines. For the RTMS reporting units, we estimate fair value by using a combination of the income approach, where fair value is dependent on the present value of future economic benefits to be derived from the RTMS product line, and the market valuation approach, where the business was compared to guideline public company price-earning multiples with a significant weighting to companies in the traffic detection business. The future economic benefits are mainly dependent on future revenue growth of the RTMS product line. No impairment of goodwill was recorded as of December 31, 2009, 2008 and 2007. If Flow Traffic and/or the RTMS reporting units do not provide the future economic benefits we project, the fair value of these assets may become impaired, and we would need to record an impairment loss.
26
Intangible assets are stated at their estimated value at the time of acquisition. Amortization is computed by the straight-line method over a five- to eight-year period for financial reporting purposes based on their estimated useful lives.
Earn-outs related to the EIS asset purchase are recorded as additional goodwill in the year earned. Intangible assets are related to the EIS asset purchase for trade names and technology and are amortized over their anticipated useful lives of five to eight years.
Revenue Recognition. Royalty income is recognized based upon a monthly royalty report provided to us by Econolite. This report is prepared by Econolite based on its sales of products we developed and is based on sales delivered and accepted by its customers. We recognize revenue from North American and international sales at the time of delivery and acceptance; the selling price is fixed or determinable; and collectability is reasonably assured. We record provisions against sales revenue for estimated returns and allowances in the period when the related revenue is recorded based upon historical sales returns and changes in end user demands. Sales returns and warranty allowances are estimated at the time of sale based on historical experience.
Income Taxes. Income taxes are accounted for under the liability method. Deferred income taxes reflect the effects of temporary differences between the carrying amounts of assets and liabilities for financial reporting purposes and amounts used for income tax purposes. Deferred tax assets are offset by a valuation allowance as deemed necessary based on our estimate of our future sources of taxable income and the expected timing of temporary difference reversals. Uncertain tax positions are recognized if the tax position is more likely than not of being sustained on audit based on the technical merits of the position.
Inventories. Inventories are stated at the lower of cost (first-in, first-out method) or market and allowances have been made for obsolete, excess or unmarketable inventories based on estimated future usage or actual or anticipated product line changes.
New and Recently Adopted Accounting Pronouncements
Effective September 15, 2009, we adopted Accounting Standards Codification (“ASC”) 105-10, making the ASC of the Financial Accounting Standards Board (“FASB”) the single source of authoritative nongovernmental U.S. generally accepted accounting principles (“GAAP”). Rules and interpretive releases of the Securities and Exchange Commission (“SEC”) under authority of federal securities laws are also sources of authoritative GAAP for SEC registrants. All other accounting literature not included in the ASC is non-authoritative. The Codification did not have a significant impact on our consolidated financial statements or disclosures.
In December 2007, the FASB issued ASC 805, Business Combinations. ASC 805 significantly changed the accounting for business combinations. Under ASC 805, an acquiring entity will be required to recognize all the assets acquired and liabilities assumed in a transaction at the acquisition-date fair value with limited exceptions. ASC 805 will change the accounting treatment for certain specific items. ASC 805 also includes a substantial number of new disclosure requirements. ASC 805 applies to us prospectively for business combinations beginning in 2009, and this adoption did not have a material impact on our consolidated financial statements.
In December 2007, the FASB issued ASC 810, Consolidation. ASC 810 establishes new accounting and reporting standards for the noncontrolling interest in a subsidiary and for the deconsolidation of a subsidiary. ASC 810 also includes expanded disclosure requirements regarding the interests of the parent and its noncontrolling interest. ASC 810 is effective for fiscal years, and interim periods within those fiscal years, beginning on or after December 15, 2008. The adoption of ASC 810 did not have a material impact on our consolidated financial statements.
27
In June 2009, the FASB amended ASC 810, Consolidation, to improve how enterprises disclose their involvement with variable interest entities (VIE), which are special-purpose entities, and other entities whose equity at risk is insufficient or lacks certain characteristics. Among other things, ASC 810 changes how an entity determines whether it is the primary beneficiary of a VIE and whether that VIE should be consolidated. ASC 810 requires an entity to provide significantly more disclosures about its involvement with a VIE. Companies must comprehensively review involvements with potential VIEs, including those previously considered to be qualifying special-purpose entities, to determine the effect on their consolidated financial statements and related disclosures. ASC 810 is effective prospectively for interim or annual reporting periods beginning after December 15, 2009. We do not believe that the adoption of this portion of ASC 810 will have a significant effect on our consolidated financial statements.
Item 7A. Quantitative and Qualitative Disclosures About Market Risks
Our foreign sales and results of operations are subject to the impact of foreign currency fluctuations. From time to time, we enter into currency hedges to attempt to lower our exposure to translation gains and losses as well as to limit the impact of foreign currency translation upon the consolidation of our foreign subsidiaries. A 10% adverse change in foreign currency rates, if we have not hedged, could have a material effect on our results of operations or financial position. Our current greatest exposure for a negative material impact to our operations is a rising Canadian Dollar versus the U.S. Dollar.
28
|
|
|
|
Item 8. |
Financial Statements and Supplementary Data |
IMAGE SENSING SYSTEMS, INC.
CONSOLIDATED BALANCE SHEETS
(in thousands, except share data)
|
|
|
|
|
|
|
|
|
|
|
|
December 31 |
|
||||
|
|
|
|
|
||||
|
|
|
2009 |
|
2008 |
|
||
|
|
|
|
|
|
|
||
|
|
|
|
|
|
|
|
|
|
ASSETS |
|
|
|
|
|
|
|
|
Current assets: |
|
|
|
|
|
|
|
|
Cash and cash equivalents |
|
$ |
14,084 |
|
$ |
10,289 |
|
|
Investments |
|
|
3,935 |
|
|
4,000 |
|
|
Accounts receivable, net of allowance for returns and doubtful accounts of $90 ($96 in 2008) |
|
|
5,660 |
|
|
6,620 |
|
|
Inventories |
|
|
2,734 |
|
|
1,608 |
|
|
Prepaid expenses |
|
|
588 |
|
|
376 |
|
|
Deferred income taxes |
|
|
328 |
|
|
376 |
|
|
|
|
|
|
|
|
|
|
|
Total current assets |
|
|
27,329 |
|
|
23,269 |
|
|
|
|
|
|
|
|
|
|
|
Property and equipment: |
|
|
|
|
|
|
|
|
Furniture and fixtures |
|
|
274 |
|
|
265 |
|
|
Leasehold improvements |
|
|
92 |
|
|
64 |
|
|
Equipment |
|
|
2,288 |
|
|
1,631 |
|
|
|
|
|
|
|
|
|
|
|
|
|
|
2,654 |
|
|
1,960 |
|
|
Accumulated depreciation |
|
|
1,656 |
|
|
1,232 |
|
|
|
|
|
|
|
|
|
|
|
|
|
|
998 |
|
|
728 |
|
|
|
|
|
|
|
|
|
|
|
Deferred income taxes |
|
|
1,485 |
|
|
1,575 |
|
|
Intangible assets |
|
|
3,714 |
|
|
4,481 |
|
|
Goodwill |
|
|
7,624 |
|
|
6,055 |
|
|
|
|
|
|
|
|
|
|
|
TOTAL ASSETS |
|
$ |
41,150 |
|
$ |
36,108 |
|
|
|
|
|
|
|
|
|
|
|
|
|
|
|
|
|
|
|
|
LIABILITIES AND SHAREHOLDERS’ EQUITY |
|
|
|
|
|
|
|
|
Current liabilities: |
|
|
|
|
|
|
|
|
Accounts payable |
|
$ |
953 |
|
$ |
251 |
|
|
Current portion of bank debt |
|
|
4,000 |
|
|
1,000 |
|
|
Accrued compensation |
|
|
858 |
|
|
1,091 |
|
|
Accrued warranty and other |
|
|
643 |
|
|
793 |
|
|
EIS earn-out payable |
|
|
1,541 |
|
|
1,164 |
|
|
Income taxes payable |
|
|
234 |
|
|
283 |
|
|
|
|
|
|
|
|
|
|
|
Total current liabilities |
|
|
8,229 |
|
|
4,582 |
|
|
|
|
|
|
|
|
|
|
|
Bank debt, less current portion |
|
|
— |
|
|
2,750 |
|
|
Income taxes payable |
|
|
208 |
|
|
246 |
|
|
|
|
|
|
|
|
|
|
|
Shareholders’ equity: |
|
|
|
|
|
|
|
|
Preferred stock, $.01 par value; 5,000,000 shares authorized, none issued or outstanding |
|
|
— |
|
|
— |
|
|
Common stock, $.01 par value; 20,000,000 shares authorized, 3,985,819 issued and outstanding (3,985,219 in 2008) |
|
|
40 |
|
|
40 |
|
|
Additional paid-in capital |
|
|
11,994 |
|
|
11,652 |
|
|
Accumulated other comprehensive loss |
|
|
(171 |
) |
|
(147 |
) |
|
Retained earnings |
|
|
20,850 |
|
|
16,985 |
|
|
|
|
|
|
|
|
|
|
|
Total shareholders’ equity |
|
|
32,713 |
|
|
28,530 |
|
|
|
|
|
|
|
|
|
|
|
TOTAL LIABILITIES AND SHAREHOLDERS’ EQUITY |
|
$ |
41,150 |
|
$ |
36,108 |
|
|
|
|
|
|
|
|
|
|
See accompanying notes to the consolidated financial statements.
29
IMAGE SENSING SYSTEMS, INC.
CONSOLIDATED STATEMENTS OF INCOME
(in thousands, except share data)
|
|
|
|
|
|
|
|
|
|
|
|
|
|
|
Years ended December 31 |
|
|||||||
|
|
|
|
|
|||||||
|
|
|
2009 |
|
2008 |
|
2007 |
|
|||
|
|
|
|
|
|
|
|
|
|||
|
Revenue: |
|
|
|
|
|
|
|
|
|
|
|
International sales |
|
$ |
6,162 |
|
$ |
7,455 |
|
$ |
4,067 |
|
|
North American sales |
|
|
6,321 |
|
|
5,689 |
|
|
269 |
|
|
Royalties |
|
|
12,110 |
|
|
13,321 |
|
|
10,747 |
|
|
|
|
|
|
|
|
|
|
|
|
|
|
|
|
|
24,593 |
|
|
26,465 |
|
|
15,083 |
|
|
Cost of revenue: |
|
|
|
|
|
|
|
|
|
|
|
International sales |
|
|
2,063 |
|
|
2,805 |
|
|
1,927 |
|
|
North American sales |
|
|
2,234 |
|
|
2,107 |
|
|
60 |
|
|
Royalties |
|
|
— |
|
|
— |
|
|
— |
|
|
|
|
|
|
|
|
|
|
|
|
|
|
|
|
|
4,297 |
|
|
4,912 |
|
|
1,987 |
|
|
|
|
|
|
|
|
|
|
|
|
|
|
Gross profit |
|
|
20,296 |
|
|
21,553 |
|
|
13,096 |
|
|
|
|
|
|
|
|
|
|
|
|
|
|
Operating expenses: |
|
|
|
|
|
|
|
|
|
|
|
Selling, marketing and product support |
|
|
7,201 |
|
|
6,680 |
|
|
3,463 |
|
|
General and administrative |
|
|
3,779 |
|
|
4,069 |
|
|
2,653 |
|
|
Research and development |
|
|
3,336 |
|
|
2,908 |
|
|
2,299 |
|
|
Amortization of intangible assets |
|
|
768 |
|
|
768 |
|
|
51 |
|
|
In-process research and development |
|
|
— |
|
|
— |
|
|
4,500 |
|
|
|
|
|
|
|
|
|
|
|
|
|
|
|
|
|
15,084 |
|
|
14,425 |
|
|
12,966 |
|
|
|
|
|
|
|
|
|
|
|
|
|
|
Income from operations |
|
|
5,212 |
|
|
7,128 |
|
|
130 |
|
|
|
|
|
|
|
|
|
|
|
|
|
|
Other income, net |
|
|
7 |
|
|
43 |
|
|
543 |
|
|
|
|
|
|
|
|
|
|
|
|
|
|
Income before income taxes |
|
|
5,219 |
|
|
7,171 |
|
|
673 |
|
|
Income tax expense (benefit) |
|
|
1,354 |
|
|
2,207 |
|
|
(199 |
) |
|
|
|
|
|
|
|
|
|
|
|
|
|
Net income |
|
$ |
3,865 |
|
$ |
4,964 |
|
$ |
872 |
|
|
|
|
|
|
|
|
|
|
|
|
|
|
Net income per share: |
|
|
|
|
|
|
|
|
|
|
|
Basic |
|
$ |
0.97 |
|
$ |
1.26 |
|
$ |
0.23 |
|
|
Diluted |
|
|
0.95 |
|
|
1.24 |
|
|
0.22 |
|
|
|
|
|
|
|
|
|
|
|
|
|
|
Weighted average number of common shares outstanding: |
|
|
|
|
|
|
|
|
|
|
|
Basic |
|
|
3,985 |
|
|
3,943 |
|
|
3,789 |
|
|
Diluted |
|
|
4,081 |
|
|
4,001 |
|
|
3,881 |
|
See accompanying notes to the consolidated financial statements.
30
IMAGE SENSING SYSTEMS, INC.
CONSOLIDATED STATEMENTS OF CASH FLOW
(in thousands)
|
|
|
|
|
|
|
|
|
|
|
|
|
|
|
Years ended December 31 |
|
|||||||
|
|
|
|
|
|||||||
|
|
|
2009 |
|
2008 |
|
2007 |
|
|||
|
|
|
|
|
|
|
|
|
|||
|
Operating activities: |
|
|
|
|
|
|
|
|
|
|
|
Net income |
|
$ |
3,865 |
|
$ |
4,964 |
|
$ |
872 |
|
|
Adjustments to reconcile net income to net cash provided by operating activities: |
|
|
|
|
|
|
|
|
|
|
|
Depreciation |
|
|
424 |
|
|
357 |
|
|
226 |
|
|
Amortization |
|
|
768 |
|
|
768 |
|
|
51 |
|
|
In-process research and development |
|
|
— |
|
|
— |
|
|
4,500 |
|
|
Tax benefit from disqualifying disposition |
|
|
— |
|
|
137 |
|
|
112 |
|
|
Stock option expense |
|
|
341 |
|
|
339 |
|
|
194 |
|
|
Deferred income taxes |
|
|
138 |
|
|
(133 |
) |
|
(1,653 |
) |
|
Changes in operating assets and liabilities: |
|
|
|
|
|
|
|
|
|
|
|
Accounts receivable |
|
|
960 |
|
|
(1,623 |
) |
|
(2,040 |
) |
|
Inventories |
|
|
(1,126 |
) |
|
(29 |
) |
|
(909 |
) |
|
Prepaid expenses |
|
|
(212 |
) |
|
(148 |
) |
|
(102 |
) |
|
Accounts payable |
|
|
702 |
|
|
(565 |
) |
|
200 |
|
|
Accrued liabilities |
|
|
(384 |
) |
|
671 |
|
|
177 |
|
|
Income taxes payable |
|
|
(87 |
) |
|
445 |
|
|
(147 |
) |
|
|
|
|
|
|
|
|
|
|
|
|
|
Net cash provided by operating activities |
|
|
5,389 |
|
|
5,183 |
|
|
1,481 |
|
|
|
|
|
|
|
|
|
|
|
|
|
|
Investing activities: |
|
|
|
|
|
|
|
|
|
|
|
Purchase of EIS assets |
|
|
— |
|
|
— |
|
|
(11,406 |
) |
|
EIS earn-out payment |
|
|
(1,192 |
) |
|
— |
|
|
— |
|
|
Purchase of short-term investments |
|
|
(6,640 |
) |
|
(7,400 |
) |
|
— |
|
|
Sale of short-term investments |
|
|
6,705 |
|
|
3,400 |
|
|
1,800 |
|
|
Maturity of callable FHLB bonds |
|
|
— |
|
|
— |
|
|
2,300 |
|
|
Purchases of property and equipment |
|
|
(694 |
) |
|
(385 |
) |
|
(104 |
) |
|
|
|
|
|
|
|
|
|
|
|
|
|
Net cash used in investing activities |
|
|
(1,821 |
) |
|
(4,385 |
) |
|
(7,410 |
) |
|
|
|
|
|
|
|
|
|
|
|
|
|
Financing activities: |
|
|
|
|
|
|
|
|
|
|
|
Proceeds from exercise of stock options |
|
|
1 |
|
|
173 |
|
|
34 |
|
|
Proceeds from bank debt |
|
|
4,000 |
|
|
— |
|
|
5,000 |
|
|
Repayment of bank debt |
|
|
(3,750 |
) |
|
(1,250 |
) |
|
— |
|
|
Cash (restricted for) released from restriction on bank debt |
|
|
— |
|
|
5,263 |
|
|
(5,263 |
) |
|
|
|
|
|
|
|
|
|
|
|
|
|
Net cash provided by (used in) financing activities |
|
|
251 |
|
|
4,186 |
|
|
(229 |
) |
|
|
|
|
|
|
|
|
|
|
|
|
|
Effect of exchange rate changes on cash |
|
|
24 |
|
|
(308 |
) |
|
145 |
|
|
|
|
|
|
|
|
|
|
|
|
|
|
Increase (decrease) in cash and cash equivalents |
|
|
3,795 |
|
|
4,676 |
|
|
(6,013 |
) |
|
|
|
|
|
|
|
|
|
|
|
|
|
Cash and cash equivalents at beginning of year |
|
|
10,289 |
|
|
5,613 |
|
|
11,626 |
|
|
|
|
|
|
|
|
|
|
|
|
|
|
Cash and cash equivalents at end of year |
|
$ |
14,084 |
|
$ |
10,289 |
|
$ |
5,613 |
|
|
|
|
|
|
|
|
|
|
|
|
|
|
|
|
|
|
|
|
|
|
|
|
|
|
Supplemental disclosure: |
|
|
|
|
|
|
|
|
|
|
|
Income taxes paid |
|
$ |
1,488 |
|
$ |
1,680 |
|
$ |
1,352 |
|
|
Interest expense paid |
|
$ |
33 |
|
$ |
278 |
|
$ |
35 |
|
|
|
|
|
|
|
|
|
|
|
|
|
|
Supplemental non-cash disclosure: |
|
|
|
|
|
|
|
|
|
|
|
Common stock issued in connection with EIS asset purchase |
|
$ |
— |
|
$ |
— |
|
$ |
2,534 |
|
|
EIS earn-out payable recorded as additional goodwill |
|
$ |
1,541 |
|
$ |
1,164 |
|
$ |
— |
|
See accompanying notes to the consolidated financial statements.
31
IMAGE SENSING SYSTEMS, INC.
CONSOLIDATED STATEMENTS OF SHAREHOLDERS’ EQUITY AND COMPREHENSIVE INCOME
(in thousands, except share data)
|
|
|
|
|
|
|
|
|
|
|
|
|
|
|
|
|
|
|
|
|
|
|
|
Shares |
|
Common |
|
Additional |
|
Accumulated |
|
Retained Earnings |
|
Total |
|
||||||
|
|
|
|
|
|
|
|
|
|
|
|
|
|
|
||||||
|
Balance at December 31, 2006 |
|
|
3,761,804 |
|
$ |
38 |
|
$ |
8,130 |
|
$ |
16 |
|
$ |
11,149 |
|
$ |
19,333 |
|
|
|
|
|
|
|
|
|
|
|
|
|
|
|
|
|
|
|
|
|
|
|
Tax benefit from disqualifying disposition |
|
|
— |
|
|
— |
|
|
112 |
|
|
— |
|
|
— |
|
|
112 |
|
|
Common stock issued for options exercised |
|
|
18,800 |
|
|
— |
|
|
34 |
|
|
— |
|
|
— |
|
|
34 |
|
|
Common stock issued in EIS asset purchase |
|
|
147,202 |
|
|
1 |
|
|
2,534 |
|
|
— |
|
|
— |
|
|
2,535 |
|
|
Stock option expense |
|
|
— |
|
|
— |
|
|
194 |
|
|
— |
|
|
— |
|
|
194 |
|
|
Foreign currency translation adjustment |
|
|
— |
|
|
— |
|
|
— |
|
|
145 |
|
|
— |
|
|
145 |
|
|
Net income |
|
|
— |
|
|
— |
|
|
— |
|
|
— |
|
|
872 |
|
|
872 |
|
|
|
|
|
|
|
|
|
|
|
|
|
|
|
|
|
|
|
|
|
|
|
Comprehensive income |
|
|
— |
|
|
— |
|
|
— |
|
|
— |
|
|
— |
|
|
1,017 |
|
|
|
|
|
|
|
|
|
|
|
|
|
|
|
|
|
|
|
|
|
|
|
Balance at December 31, 2007 |
|
|
3,927,806 |
|
|
39 |
|
|
11,004 |
|
|
161 |
|
|
12,021 |
|
|
23,225 |
|
|
|
|
|
|
|
|
|
|
|
|
|
|
|
|
|
|
|
|
|
|
|
Tax benefit from disqualifying disposition |
|
|
— |
|
|
— |
|
|
137 |
|
|
— |
|
|
— |
|
|
137 |
|
|
Common stock issued for options exercised |
|
|
59,000 |
|
|
1 |
|
|
194 |
|
|
— |
|
|
— |
|
|
195 |
|
|
Common stock retired |
|
|
(1,587 |
) |
|
— |
|
|
(22 |
) |
|
— |
|
|
— |
|
|
(22 |
) |
|
Stock option expense |
|
|
— |
|
|
— |
|
|
339 |
|
|
— |
|
|
— |
|
|
339 |
|
|
Foreign currency translation adjustment |
|
|
— |
|
|
— |
|
|
— |
|
|
(308 |
) |
|
— |
|
|
(308 |
) |
|
Net income |
|
|
— |
|
|
— |
|
|
— |
|
|
— |
|
|
4,964 |
|
|
4,964 |
|
|
|
|
|
|
|
|
|
|
|
|
|
|
|
|
|
|
|
|
|
|
|
Comprehensive income |
|
|
— |
|
|
— |
|
|
— |
|
|
— |
|
|
— |
|
|
4,656 |
|
|
|
|
|
|
|
|
|
|
|
|
|
|
|
|
|
|
|
|
|
|
|
Balance at December 31, 2008 |
|
|
3,985,219 |
|
|
40 |
|
|
11,652 |
|
|
(147 |
) |
|
16,985 |
|
|
28,530 |
|
|
|
|
|
|
|
|
|
|
|
|
|
|
|
|
|
|
|
|
|
|
|
Common stock issued for options exercised |
|
|
600 |
|
|
— |
|
|
1 |
|
|
— |
|
|
— |
|
|
1 |
|
|
|
|
|
|
|
|
|
|
|
|
|
|
|
|
|
|
|
|
|
|
|
Stock option expense |
|
|
— |
|
|
— |
|
|
341 |
|
|
— |
|
|
— |
|
|
341 |
|
|
Foreign currency translation adjustment |
|
|
— |
|
|
— |
|
|
— |
|
|
(24 |
) |
|
— |
|
|
(24 |
) |
|
Net income |
|
|
— |
|
|
— |
|
|
— |
|
|
— |
|
|
3,865 |
|
|
3,865 |
|
|
|
|
|
|
|
|
|
|
|
|
|
|
|
|
|
|
|
|
|
|
|
Comprehensive income |
|
|
— |
|
|
— |
|
|
— |
|
|
— |
|
|
— |
|
|
3,841 |
|
|
|
|
|
|
|
|
|
|
|
|
|
|
|
|
|
|
|
|
|
|
|
Balance at December 31, 2009 |
|
|
3,985,819 |
|
$ |
40 |
|
$ |
11,994 |
|
$ |
(171 |
) |
$ |
20,850 |
|
$ |
32,713 |
|
|
|
|
|
|
|
|
|
|
|
|
|
|
|
|
|
|
|
|
|
|
See accompanying notes to the consolidated financial statements.
32
Notes to Consolidated Financial Statements
December 31, 2009
1. DESCRIPTION OF BUSINESS AND SIGNIFICANT ACCOUNTING POLICIES
DESCRIPTION OF BUSINESS
Image Sensing Systems, Inc. (referred to herein as “we,” the “Company,” “us” and “our”) develops and markets software-based computer enabled detection products for use in advanced traffic management systems and traffic data collection. We sell our products primarily to distributors and also receive royalties under a license agreement with a manufacturer/distributor for one of our product lines. Our products are used primarily by governmental entities.
PRINCIPLES OF CONSOLIDATION
The consolidated financial statements include the accounts of Image Sensing Systems, Inc. and its wholly-owned subsidiaries: Flow Traffic Ltd. (Flow Traffic) located in Hong Kong, Image Sensing Systems Europe Ltd. (ISS/Europe), located in the United Kingdom, Image Sensing Systems Europe Limited SP.Z.O.O. (ISS/Poland), located in Poland, and ISS Image Sensing Systems Canada Ltd (ISS/Canada) and ISS Canada Sales Corp. (Canada Sales Corp.), both located in Ontario, Canada. All significant inter-company transactions and accounts have been eliminated in consolidation.
REVENUE RECOGNITION
Royalty income is recognized based upon a monthly royalty report provided to us by Econolite Control Products, Inc. (Econolite), a licensee that sells one of our products in North America, the Caribbean and Latin America. The royalty is calculated using a profit sharing model where we split evenly the gross profit on sales of our Autoscope product made by Econolite. The royalty report is prepared by Econolite based on its sales of licensed products delivered and accepted by its customers. Payment of royalties is due after Econolite has received payment from its customer.
We recognize revenue from international and North American sales at the time of shipment or delivery, the selling price is fixed or determinable and collection of payment is reasonably assured. We record provisions against sales revenue for estimated returns and allowances in the period when the related revenue is recorded based on historical sales returns and changes in end user demand.
CASH AND CASH EQUIVALENTS
We consider all highly liquid investments with an original maturity of three months or less to be cash equivalents. Cash equivalents consist of money market funds. Cash located in foreign banks was $3.6 million and $1.0 million at December 31, 2009 and 2008, respectively. We hold our cash and cash equivalents with financial institutions and, at times, the amounts of our balances may be in excess of insurance limits.
INVESTMENTS
Investments and marketable securities held at December 31, 2009 that do not qualify as cash equivalents have been designated as “available for sale”. The estimated fair value of the investments held at December 31, 2009 was determined using level 1 measurements under the fair value hierarchy.
At December 31, 2008, we held $4.0 million (par value) of investments comprised of auction rate securities, or ARS, which were designated as “trading”. The balance of investments at December 31, 2008, consisted of the combination of the fair value of ARS and the fair value of the settlement rights that we received from the broker/dealer under a settlement agreement reached in November 2008. The settlement rights allowed us to “put” the ARS to the broker/dealer at par between the dates of January 2, 2009 and January 2, 2011. In January 2009, our ARS were purchased by the broker/dealer at par.
33
ACCOUNTS RECEIVABLE
We grant credit to customers in the normal course of business and generally do not require collateral. Management performs on-going credit evaluations of customers. We have fixed payment terms with each of our customers that vary in length. Accounts receivable that are outstanding longer than the fixed payment term are considered past due. We determine an allowance for doubtful accounts by considering a number of factors, including any on-going technical problems with product in the field, the length of time trade accounts receivable are past due, our previous loss history with the customer and the customer’s current ability to pay. We write-off accounts receivable when they become uncollectible, and payments subsequently received on such receivables are credited to the allowance for doubtful accounts.
INVENTORIES
Inventories are primarily electronic components and finished goods and are valued at the lower of cost or market on the first-in, first-out (FIFO) method. Adjustments to record inventory at the lower of cost or market are charged to cost of revenue in the period incurred and totaled $6,000, $211,000 and $253,000 for the years ended December 31, 2009, 2008 and 2007, respectively.
PROPERTY AND EQUIPMENT
Property and equipment are stated at cost. Depreciation is computed by the straight-line method over a three- to seven-year period for financial reporting purposes and by accelerated methods for income tax purposes.
INCOME TAXES
Income taxes are accounted for under the liability method. Deferred income taxes are provided for temporary differences between the carrying amounts of assets and liabilities for financial reporting purposes and amounts used for income tax purposes. Deferred taxes are reduced by a valuation allowance when, in the opinion of management, it is more likely than not that some portion or the entire deferred tax asset will not be realized. Deferred tax assets and liabilities are adjusted for the effects of changes in tax laws and rates on the date of the enactment. We recognize tax benefits when we believe the benefit is more likely than not to be sustained upon review from the relevant authorities. We recognize penalties and interest expense related to unrecognized tax benefits in income tax expense.
FAIR VALUE MEASUREMENTS
Fair value is determined on the exchange price that would be received for an asset or paid to transfer a liability (an exit price) in the principal or most advantageous market for the asset or liability in an orderly transaction between market participants. Each major asset and liability category is measured at fair value on either a recurring or nonrecurring basis using a three-tier fair value hierarchy which prioritizes the inputs used in fair value measurements. The three-tier hierarchy for inputs used in measuring fair value is as follows:
|
|
|
|
|
|
Level 1. |
Observable inputs such as quoted prices in active markets; |
|
|
|
|
|
|
Level 2. |
Inputs, other than the quoted prices in active markets, that are observable either directly or indirectly; and |
|
|
|
|
|
|
Level 3. |
Unobservable inputs in which there is little or no market data, which require the reporting entity to develop its own assumptions. |
INTANGIBLE ASSETS
Intangible assets are stated at their estimated value at the time of acquisition. Amortization is computed by the straight-line method over a five- to eight-year period for financial reporting purposes based on their estimated useful lives.
GOODWILL
Goodwill is not amortized but is tested for impairment annually or whenever an impairment indicator arises. Our goodwill related to our Flow Traffic subsidiary is tested for impairment on December 31 of each year. EIS asset purchase related goodwill is tested on October 1 of each year.
34
During our annual impairment testing, we reconcile our market value, based on the value of our common stock, to the estimated combined fair value of our reporting units, to ensure that goodwill is not impaired. At December 31, 2008, we performed a reconciliation, as our market capitalization was similar to our consolidated shareholders’ equity. We determined that no goodwill impairment existed.
IMPAIRMENT OF LONG-LIVED ASSETS
Long-lived assets are reviewed for impairment when indicators of impairment are present. Impairment is recognized when the undiscounted cash flows estimated to be generated by those assets are less than the assets’ carrying amount. No such losses were recorded during the years ended December 31, 2009, 2008 or 2007.
USE OF ESTIMATES
Preparing financial statements in conformity with accounting principles generally accepted in the United States of America requires management to make estimates and assumptions that affect the reported amounts of assets and liabilities and disclosure of contingent assets and liabilities at the date of the consolidated financial statements and reported amounts of revenues and expenses during the reporting periods. Actual results could differ from the estimates.
RESEARCH AND DEVELOPMENT
Research and development costs are charged to operations in the period incurred.
WARRANTY
We provide a standard two-year warranty on international and North American product sales. Warranty expense was $175,000, $153,000, and $44,000 for the years ended December 31, 2009, 2008 and 2007, respectively, and our warranty liability was $289,000 and $217,000 at December 31, 2009 and 2008, respectively.
ADVERTISING
Advertising costs are charged to operations in the period incurred and totaled $151,000, $196,000 and $247,000 for the years ended December 31, 2009, 2008 and 2007, respectively.
FOREIGN CURRENCY
All assets and liabilities of Flow Traffic, ISS/Europe, ISS/Poland, ISS/Canada and Canada Sales Corp. are translated from their respective foreign currency to United States dollars at period-end rates of exchange, while the statement of income is translated at the average exchange rates during the period. Accumulated translation adjustments are shown in equity under “Accumulated other comprehensive loss.”
NET INCOME PER SHARE
Our basic net income per share amounts have been computed by dividing net income by the weighted average number of outstanding common shares. Diluted net income per share amounts have been computed by dividing net income by the weighted average number of outstanding common shares and common share equivalents relating to stock options, when dilutive.
For the years ended December 31, 2009, 2008 and 2007, respectively, 95,000, 58,000 and 92,000 common share equivalents were included in the computation of diluted net income per share.
At December 31, 2009, 2008 and 2007, the exercise prices of 36,000, 253,500 and 66,000 outstanding options, respectively, were greater than the average market price of the common shares during the period and were excluded from the calculation of diluted net income per share.
35
STOCK OPTIONS
We recognize compensation expense for share-based awards using the fair value of the option at the time of the grant and amortizing the fair value over the estimated service period on the straight-line attribute method. Unrecognized compensation costs were $792,655 at December 31, 2009, with a weighted average remaining life of 2.9 years.
NEW ACCOUNTING PRONOUNCEMENTS
Effective September 15, 2009, we adopted Accounting Standards Codification (“ASC”) 105-10, making the ASC of the Financial Accounting Standards Board (“FASB”) the single source of authoritative nongovernmental U.S. generally accepted accounting principles (“GAAP”). Rules and interpretive releases of the Securities and Exchange Commission (“SEC”) under authority of federal securities laws are also sources of authoritative GAAP for SEC registrants. All other accounting literature not included in the ASC is non-authoritative. The Codification did not have a significant impact on our consolidated financial statements or disclosures.
In December 2007, the FASB issued ASC 805, Business Combinations. ASC 805 significantly changed the accounting for business combinations. Under ASC 805, an acquiring entity will be required to recognize all the assets acquired and liabilities assumed in a transaction at the acquisition-date fair value with limited exceptions. ASC 805 will change the accounting treatment for certain specific items. ASC 805 also includes a substantial number of new disclosure requirements. ASC 805 applies to us prospectively for business combinations beginning in 2009, and this adoption did not have a material impact on our consolidated financial statements.
In December 2007, the FASB issued ASC 810, Consolidation. ASC 810 establishes new accounting and reporting standards for the noncontrolling interest in a subsidiary and for the deconsolidation of a subsidiary. ASC 810 also includes expanded disclosure requirements regarding the interests of the parent and its noncontrolling interest. ASC 810 is effective for fiscal years, and interim periods within those fiscal years, beginning on or after December 15, 2008. The adoption of ASC 810 did not have a material impact on our consolidated financial statements.
In June 2009, the FASB amended ASC 810, Consolidation, to improve how enterprises disclose their involvement with variable interest entities (VIE), which are special-purpose entities, and other entities whose equity at risk is insufficient or lacks certain characteristics. Among other things, ASC 810 changes how an entity determines whether it is the primary beneficiary of a VIE and whether that VIE should be consolidated. ASC 810 requires an entity to provide significantly more disclosures about its involvement with a VIE. Companies must comprehensively review involvements with potential VIEs, including those previously considered to be qualifying special-purpose entities, to determine the effect on its consolidated financial statements and related disclosures. It is effective prospectively for interim or annual reporting periods beginning after December 15, 2009. We do not believe that the adoption of this portion of ASC 810 will have a significant effect on our consolidated financial statements.
RECLASSIFICATIONS
Certain prior year amounts have been reclassified to conform to the current year presentation.
2. INVESTMENTS
Investments and marketable securities held at December 31, 2009 that do not qualify as cash equivalents have been designated as “available for sale”. The estimated fair value of the investments held at December 31, 2009 was determined using level 1 measurements.
At December 31, 2008, we held $4.0 million (par value) of investments comprised of auction rate securities, or ARS, which were designated as “trading”. The balance of investments at December 31, 2008 consisted of the combination of the fair value of ARS and the fair value of the settlement rights that we received from the broker/dealer under a settlement agreement reached in November 2008. The settlement rights allowed us to “put” the ARS to the broker/dealer at par between the dates of January 2, 2009 and January 2, 2011. In January 2009, our ARS were purchased by the broker/dealer at par.
36
Our current portfolio is composed of high-grade tax-exempt municipal bonds. The maximum term to maturity or time to next reset is six months.
Proceeds from maturities and sales of investments totaled $6.7 million, $3.4 million and $4.1 million for the years ended December 31, 2009, 2008 and 2007, respectively. As described above, in the year ended December 31, 2008, we realized a $700,000 loss on our ARS and a $700,000 gain on the ARS settlement rights. There were no realized gains or losses related to sales during the years ended December 31, 2009 and 2007.
3. INVENTORIES
Inventories, net of reserves, consisted of the following (in thousands):
|
|
|
|
|
|
|
|
|
|
|
|
December 31, |
|
||||
|
|
|
|
|
||||
|
|
|
2009 |
|
2008 |
|
||
|
|
|
|
|
|
|
||
|
Electronic components |
|
$ |
1,733 |
|
$ |
1,097 |
|
|
Finished goods |
|
|
1,001 |
|
|
511 |
|
|
|
|
|
|
|
|
|
|
|
|
|||||||
|
Total |
|
$ |
2,734 |
|
$ |
1,608 |
|
|
|
|
|
|
|
|
|
|
4. ACQUISITIONS
On December 6, 2007, we purchased certain assets of EIS Electronic Integrated Systems, Inc. (EIS), including its RTMS radar product line. The purchase price was $10.9 million in cash plus 147,202 shares of our common stock valued at approximately $2.5 million. In addition to the purchase price, we incurred $506,000 in direct acquisition costs. As part of the purchase agreement, the sellers are eligible to receive an earn-out based on the performance of the assets for the next three years. Earn-outs will be calculated and paid annually. Based on target achievement, the sellers would receive $2.0 million annually or a total of $6.0 million. Superior performance of the assets could lead to an earn-out in excess of $2 million, as the earn-out is not capped.
Earn-out payments related to the EIS asset purchase will be recorded as additional goodwill when earned. In 2008, the sellers were entitled to receive an earn-out of $1.2 million, which was paid in March and April 2009. Based on 2009 results for RTMS, the sellers are entitled to a $1.5 million earn-out for the second earn-out period, which is expected to be paid in March 2010.
Prior to the asset purchase, EIS was engaged in research and development activity with respect to its next generation product line, known internally as “G4.” G4 research activity began in 2006. Because G4 had not yet reached technological feasibility, the value of the G4 program was expensed as in-process research and development at the date of transaction. As of the date of the EIS asset purchase, the program was estimated to be between 50% and 75% complete.
The results of ISS/Canada and Canada Sales Corp., which were formed to assume the operations of EIS, are included in the consolidated financial statements since the date of the EIS asset purchase.
EIS was named in a U.S. lawsuit in 2006 for infringement of a patent. This lawsuit was dismissed upon appeal in August 2009 and is no longer contested by the plaintiff. We incurred no expense over the life of the lawsuit, as EIS was responsible for costs of defense.
5. GOODWILL AND INTANGIBLE ASSETS
Goodwill consists of $1.1 million related to our acquisition of Flow Traffic (Autoscope segment) and $6.6 million related to the EIS asset purchase (RTMS segment), consisting of $3.8 million recorded at the time of the purchase and an additional $1.5 million and $1.2 million, recorded in 2009 and 2008, respectively, in conjunction with earn-out payments due.
37
Intangible assets consisted of the following (dollars in thousands):
|
|
|
|
|
|
|
|
|
|
|
|
December 31, |
|
||||
|
|
|
|
|
||||
|
|
|
2009 |
|
2008 |
|
||
|
|
|
|
|
|
|
||
|
Developed technology (8 year life) |
|
$ |
3,900 |
|
$ |
3,900 |
|
|
Trade names (5 year life) |
|
|
1,200 |
|
|
1,200 |
|
|
Other intangibles (5 year life) |
|
|
200 |
|
|
200 |
|
|
Less: Accumulated amortization |
|
|
(1,586 |
) |
|
(819 |
) |
|
|
|
|
|
|
|
|
|
|
Total identifiable intangible assets, net |
|
$ |
3,714 |
|
$ |
4,481 |
|
|
|
|
|
|
|
|
|
|
We expect to recognize amortization expense for the intangible assets in the above table of $768,000 in each of our years ending December 31, 2010 and 2011 and of $749,000 in 2012. The weighted average amortization period remaining for intangible assets is 5.2 years. Goodwill and intangible assets related to the EIS asset purchase are deductible for tax purposes over 15 years.
6. CREDIT FACILITIES
We have a revolving line of credit and a term loan with our bank. These credit agreements were entered into on May 1, 2008 and replaced all prior bank agreements, including the repayment of loans under the previous agreements.
The revolving line of credit agreement provides up to $5.0 million in short-term borrowings at the bank’s prime rate expiring May 1, 2011. Any loans are secured by inventories, accounts receivable and equipment, and the bank has the right of setoff against our checking, savings and other accounts. We had $2.0 million of outstanding borrowings under the line of credit at December 31, 2008. There was no outstanding balance at December 31, 2009.
In December 2009, we entered into a term loan agreement for $4.0 million with Associated Bank, National Association, or Associated Bank. The interest rate for the term loan is based on a formula of LIBOR plus 3.75% (current rate is 4.0%). We had $4.0 million of outstanding borrowings under the term loan at December 31, 2009. The term loan has a call provision that would require us to repay the note in full in May 2010 if we do not meet certain covenants.
Principal and accrued interest on the term loan are due and payable in installments beginning on March 31, 2010 and continuing on the last day of each successive June, September, December and March. Each of such installments is to be equal to the sum of (a) all accrued and unpaid interest on the term loan as of the due date of payment; (b) on each of March 31, 2010 and June 30, 2010, a principal payment of $100,000; and (c) beginning with the installment due on September 30, 2010, and continuing for each installment thereafter, a principal payment of $380,000. The term note matures and becomes due and payable on December 31, 2012, subject to earlier repayment as set forth in a related Modification Agreement. It may be prepaid, without premium or fee, in whole or in part, at any time, with partial prepayments in the minimum amount of $10,000.
We previously had a separate $4.0 million term note with Associated Bank that originated in May 2008 and was fully repaid in February 2009.
7. LEASE COMMITMENTS
We rent office space and equipment under operating lease agreements expiring at various dates through May 2013. The leases provide for monthly payments of $40,000, and we are responsible for our proportionate share of increases in operating expenses that exceed a base rent factor. Rent expense amounted to $585,000 in 2009, $555,000 in 2008, and $319,000 in 2007.
Future minimum annual lease payments under noncancelable operating leases for the years ending December 31, 2010, 2011, 2012 and 2013 are $354,000, $199,000, $128,000 and $53,000, respectively.
38
8. INCOME TAXES
Our deferred tax assets (liabilities) are as follows (in thousands):
|
|
|
|
|
|
|
|
|
|
|
|
December 31, |
|
||||
|
|
|
|
|
||||
|
|
|
2009 |
|
2008 |
|
||
|
|
|
|
|
|
|
||
|
|
|||||||
|
Current deferred tax assets (liabilities): |
|
|
|
|
|
|
|
|
Accrued compensation |
|
$ |
47 |
|
$ |
40 |
|
|
Prepaid expenses |
|
|
(48 |
) |
|
(43 |
) |
|
Inventory reserves |
|
|
66 |
|
|
165 |
|
|
Stock option expense (non-qualified) |
|
|
131 |
|
|
90 |
|
|
Other |
|
|
132 |
|
|
124 |
|
|
Foreign net operating loss carryforwards |
|
|
55 |
|
|
9 |
|
|
Less valuation allowance |
|
|
(55 |
) |
|
(9 |
) |
|
|
|
|
|
|
|
|
|
|
|
|
|
328 |
|
|
376 |
|
|
Non-current deferred tax assets (liabilities): |
|
|
|
|
|
|
|
|
Intangible asset amortization |
|
|
1,525 |
|
|
1,611 |
|
|
Other |
|
|
(40 |
) |
|
(36 |
) |
|
|
|
|
|
|
|
|
|
|
|
|
|
1,485 |
|
|
1,575 |
|
|
|
|
|
|
|
|
|
|
|
Net deferred tax assets |
|
$ |
1,813 |
|
$ |
1,951 |
|
|
|
|
|
|
|
|
|
|
Deferred tax assets have been offset by a valuation allowance as deemed necessary based on our estimates of future sources of taxable income and the expected timing of temporary difference reversals.
There were $3.3 million, $2.0 million and $913,000 in undistributed earnings of our wholly-owned foreign subsidiaries at December 31, 2009, 2008 and 2007, respectively. We have not provided any additional federal or state income taxes or foreign withholding taxes on the undistributed earnings, as such earnings have been indefinitely reinvested in the business.
We realize an income tax benefit from the exercise or early disposition of certain stock options. This benefit results in a decrease in current income taxes payable and an increase in additional paid-in capital.
The components of income tax expense (benefit) are as follows (in thousands):
|
|
|
|
|
|
|
|
|
|
|
|
|
|
|
Years Ended December 31, |
|
|||||||
|
|
|
|
|
|||||||
|
|
|
2009 |
|
2008 |
|
2007 |
|
|||
|
|
|
|
|
|
|
|
|
|||
|
Current: |
|
|
|
|
|
|
|
|
|
|
|
Federal |
|
$ |
1,222 |
|
$ |
1,738 |
|
$ |
1,318 |
|
|
State |
|
|
23 |
|
|
38 |
|
|
20 |
|
|
Foreign |
|
|
(29 |
) |
|
564 |
|
|
116 |
|
|
|
|
|
|
|
|
|
|
|
|
|
|
|
|
|
1,216 |
|
|
2,340 |
|
|
1,454 |
|
|
|
|
|
|
|
|
|
|
|
|
|
|
Deferred: |
|
|
|
|
|
|
|
|
|
|
|
Federal |
|
|
82 |
|
|
(59 |
) |
|
(1,638 |
) |
|
State |
|
|
5 |
|
|
(23 |
) |
|
(15 |
) |
|
Foreign |
|
|
51 |
|
|
(51 |
) |
|
— |
|
|
|
|
|
|
|
|
|
|
|
|
|
|
|
|
|
138 |
|
|
(133 |
) |
|
(1,653 |
) |
|
|
|
|
|
|
|
|
|
|
|
|
|
Total income tax expense (benefit) |
|
$ |
1,354 |
|
$ |
2,207 |
|
$ |
(199 |
) |
|
|
|
|
|
|
|
|
|
|
|
|
Income before taxes for the foreign operations were $1.3 million, $1.7 million and $509,000 for the years ended December 31, 2009, 2008 and 2007.
A reconciliation of income taxes to the statutory federal rate is as follows (in thousands):
|
|
|
|
|
|
|
|
|
|
|
|
|
|
|
December 31, |
|
|||||||
|
|
|
|
|
|||||||
|
|
|
2009 |
|
2008 |
|
2007 |
|
|||
|
|
|
|
|
|
|
|
|
|||
|
Federal tax statutory rate |
|
$ |
1,774 |
|
$ |
2,438 |
|
$ |
225 |
|
|
State taxes, net of federal benefit |
|
|
18 |
|
|
10 |
|
|
2 |
|
|
Tax exempt interest |
|
|
(4 |
) |
|
— |
|
|
(146 |
) |
|
Research and development tax credits |
|
|
(301 |
) |
|
(120 |
) |
|
(120 |
) |
|
Domestic production activity deduction |
|
|
(62 |
) |
|
(83 |
) |
|
(61 |
) |
|
Effect of lower rates on foreign income |
|
|
(58 |
) |
|
(125 |
) |
|
(57 |
) |
|
Use of foreign loss carryforwards |
|
|
— |
|
|
(77 |
) |
|
— |
|
|
Stock option expense |
|
|
74 |
|
|
66 |
|
|
32 |
|
|
Adjustment of prior year tax credits and refunds |
|
|
(77 |
) |
|
(50 |
) |
|
(26 |
) |
|
Uncertain tax positions |
|
|
(38 |
) |
|
96 |
|
|
50 |
|
|
Other |
|
|
(42 |
) |
|
52 |
|
|
(98 |
) |
|
|
|
|
|
|
|
|
|
|
|
|
|
|
|
$ |
1,354 |
|
$ |
2,207 |
|
$ |
(199 |
) |
|
|
|
|
|
|
|
|
|
|
|
|
39
A reconciliation of the beginning and ending amount of the tax liability for uncertain tax benefits is as follows (in thousands):
|
|
|
|
|
|
|
Balance at January 1, 2008 |
|
$ |
150 |
|
|
Additions for current year tax positions |
|
|
96 |
|
|
Reductions |
|
|
— |
|
|
|
|
|
|
|
|
Balance at December 31, 2008 |
|
|
246 |
|
|
Additions for current year tax positions |
|
|
— |
|
|
Reductions as a result of tax positions taken in the current period |
|
|
(38 |
) |
|
|
|
|
|
|
|
Balance at December 31, 2009 |
|
$ |
208 |
|
|
|
|
|
|
|
We are subject to income taxes in the U.S. federal jurisdiction and various state and foreign jurisdictions. Tax regulations within each jurisdiction are subject to the interpretation of the related tax laws and require significant judgment to apply. Generally, we are subject to U.S. federal, state, local and foreign tax examinations by taxing authorities for years after the fiscal year ended December 31, 2005.
9. LICENSING
We have sublicensed the right to manufacture and market the Autoscope technology in North America, the Caribbean and Latin America to Econolite and receive royalties from Econolite on sales of the Autoscope system in those territories. We may terminate our agreement with Econolite if a minimum annual sales level is not met or Econolite fails to make royalty payments as required by the agreement. The agreement’s initial term as amended was 20 years, ending in 2011. In 2008, we extended the agreement to 2028, unless terminated by either party upon three years’ notice.
We recognized royalty income from this agreement of $12.1 million, $13.3 million and $10.7 million in 2009, 2008 and 2007, respectively.
10. REVENUE FROM FOREIGN COUNTRIES
We derived the following percentages of our net revenues from the following geographic regions:
|
|
|
|
|
|
|
|
|
|
|
|
|
|
|
2009 |
|
2008 |
|
2007 |
|
|||
|
|
|
|
|
|
|
|
|
|||
|
Asia Pacific |
|
10 |
% |
|
12 |
% |
|
11 |
% |
|
|
Europe |
|
15 |
% |
|
16 |
% |
|
16 |
% |
|
|
North America |
|
75 |
% |
|
72 |
% |
|
73 |
% |
|
Revenue originating from Poland was 11% of our revenue in the year ended December 31, 2007. The aggregate net book value of long-lived assets held outside of the United States was $288,000 and $258,000 at December 31, 2009 and 2008, respectively.
11. SIGNIFICANT CUSTOMERS AND CONCENTRATION OF CREDIT RISK
Royalty income from Econolite comprised 49%, 50% and 71% of revenue in the years ended December 31, 2009, 2008 and 2007, respectively. Accounts receivable from Econolite were $2.2 million and $2.9 million at December 31, 2009 and 2008, respectively. Major disruptions in the manufacturing and distribution of our products by Econolite or the inability of Econolite to make payments on their accounts receivable with us could have a material adverse effect on our business, financial condition and results of operations. One international customer comprised 10% of accounts receivable at December 31, 2009 and 13% of accounts receivable at December 31, 2008.
40
12. RETIREMENT PLANS
Substantially all of our employees in the United States are eligible to participate in a qualified defined contribution 401(k) plan in which participants may elect to have a specified portion of their salary contributed to the plan and we may make discretionary contributions to the plan. Flow Traffic is obligated to contribute to an employee pension plan. We made contributions totaling $98,000, $97,000 and $89,000 to the plans for 2009, 2008 and 2007, respectively.
13. STOCK OPTIONS
In February 1995 and April 2005, we adopted the 1995 Long-Term Incentive and Stock Option Plan (the 1995 Plan) and the 2005 Stock Incentive Plan (the 2005 Plan), respectively, which provide for the granting of incentive (ISO) and non-qualified (NQO) stock options, stock appreciation rights, restricted stock awards and performance awards to our officers, directors, employees, consultants and independent contractors. The 1995 Plan terminated in February 2005, although the options granted under the 1995 Plan remain outstanding according to their terms. Options granted under the Plans generally vest over three to five years based on service and have a contractual term of six to ten years and are amortized to expense on a straight-line basis. The following table summarizes stock option activity for 2009 and 2008:
|
|
|
|
|
|
|
|
|
|
|
|
|
|
|
|
|
|
|
|
|
Plan |
|
Plan Options |
|
Non-Plan |
|
Weighted |
|
|||||||
|
|
|
|
|
|
|
|
|
|
|
|
|
|||||
|
|
|
|
|
|
ISO |
|
NQO |
|
|
|
|
|
|
|
||
|
|
|
|
|
|
|
|
|
|
|
|
|
|
|
|
|
|
|
Balance at December 31, 2007 |
|
|
122,200 |
|
|
119,988 |
|
|
175,245 |
|
|
42,000 |
|
$ |
8.47 |
|
|
|
|
|
|
|
|
|
|
|
|
|
|
|
|
|
|
|
|
Granted |
|
|
(95,500 |
) |
|
48,130 |
|
|
47,370 |
|
|
— |
|
|
13.58 |
|
|
Exercised |
|
|
— |
|
|
(13,000 |
) |
|
(10,000 |
) |
|
(36,000 |
) |
|
3.31 |
|
|
Plan addition |
|
|
138,800 |
|
|
— |
|
|
— |
|
|
— |
|
|
|
|
|
|
|
|
|
|
|
|
|
|
|
|
|
|
|
|
|
|
|
Balance at December 31, 2008 |
|
|
165,500 |
|
|
155,118 |
|
|
212,615 |
|
|
6,000 |
|
$ |
10.59 |
|
|
|
|
|
|
|
|
|
|
|
|
|
|
|
|
|
|
|
|
Granted |
|
|
(68,000 |
) |
|
19,000 |
|
|
49,000 |
|
|
— |
|
|
8.62 |
|
|
Exercised |
|
|
— |
|
|
(600 |
) |
|
— |
|
|
— |
|
|
1.30 |
|
|
Forfeited |
|
|
10,000 |
|
|
(10,000 |
) |
|
— |
|
|
— |
|
|
9.22 |
|
|
|
|
|
|
|
|
|
|
|
|
|
|
|
|
|
|
|
|
Balance at December 31, 2009 |
|
|
107,500 |
|
|
163,518 |
|
|
261,615 |
|
|
6,000 |
|
$ |
8.10 |
|
|
|
|
|
|
|
|
|
|
|
|
|
|
|
|
|
|
|
In June 2009, under a shareholder approved plan, we exchanged options to purchase 168,500 shares with exercise prices ranging from $12.37 to $17.50 on a one-for-one basis for options with an exercise price of $9.22. This option exchange did not have a material effect on the compensation expense for the year ended December 31, 2009.
The following table summarizes information about the stock options outstanding at December 31, 2009:
|
|
|
|
|
|
|
|
|
|
|
|
|
|
|
|
|
|
|
|
|
|
|
|
|
|
|
Options Outstanding |
|
Options Exercisable |
|
|||||||||||||||||
|
|
|
|
|
|
|
|||||||||||||||||
|
Range of |
|
Number |
|
Weighted |
|
Weighted |
|
Aggregate |
|
Number |
|
Weighted |
|
Aggregate |
|
|||||||
|
|
|
|
|
|
|
|
|
|
|
|
|
|
|
|
|
|
|
|
|
|
|
|
|
$1.30-1.99 |
|
|
58,500 |
|
|
2.2 years |
|
$ |
1.34 |
|
$ |
665,342 |
|
|
58,500 |
|
$ |
1.34 |
|
$ |
665,342 |
|
|
2.00-2.99 |
|
|
16,200 |
|
|
2.1 years |
|
|
2.35 |
|
|
167,959 |
|
|
16,200 |
|
|
2.35 |
|
|
167,959 |
|
|
3.00-3.99 |
|
|
38,933 |
|
|
2.8 years |
|
|
3.15 |
|
|
372,639 |
|
|
38,933 |
|
|
3.15 |
|
|
372,639 |
|
|
7.00-7.93 |
|
|
10,000 |
|
|
1.9 years |
|
|
7.30 |
|
|
54,178 |
|
|
6,000 |
|
|
7.50 |
|
|
31,307 |
|
|
|
|
|
|
|
|
|
|
|
|
|
|
|
|
|
|
|
|
|
|
|
|
|
|
8.00-8.99 |
|
|
48,000 |
|
|
6.9 years |
|
|
8.63 |
|
|
196,335 |
|
|
— |
|
|
— |
|
|
— |
|
|
9.00-9.99 |
|
|
174,500 |
|
|
5.3 years |
|
|
9.20 |
|
|
613,888 |
|
|
— |
|
|
— |
|
|
— |
|
|
12.00-12.99 |
|
|
49,000 |
|
|
5.2 years |
|
|
12.46 |
|
|
12,723 |
|
|
25,750 |
|
|
12.54 |
|
|
4,636 |
|
|
15.00-15.99 |
|
|
36,000 |
|
|
2.0 years |
|
|
15.31 |
|
|
— |
|
|
36,000 |
|
|
15.31 |
|
|
— |
|
|
|
|
|
|
|
|
|
|
|
|
|
|
|
|
|
|
|
|
|
|
|
|
|
|
|
|
|
431,133 |
|
|
|
|
$ |
8.10 |
|
$ |
2,083,064 |
|
|
181,383 |
|
$ |
6.39 |
|
$ |
1,241,883 |
|
|
|
|
|
|
|
|
|
|
|
|
|
|
|
|
|
|
|
|
|
|
|
|
|
41
The weighted average fair value of the 68,000, 95,500 and 141,000 options granted during 2009, 2008 and 2007, respectively, was $278,840, $387,975 and $851,910.
The total intrinsic value of options exercised during 2009, 2008 and 2007 was $7,000, $292,000 and $255,000, respectively. The total fair value of shares vested during 2009, 2008 and 2007 was $578,000, $807,000 and $25,000, respectively. The fair value of each option granted is estimated on the date of grant using the Black-Scholes option-pricing model with the following weighted-average assumptions used during 2009, 2008 and 2007, respectively: zero dividend yield; expected volatility of 45%, 41% and 127%; risk-free interest rate of 3.19%, 3.68% and 4.75%; and expected life of 3.0, 3.5 and 3.9 years. The expected life of the options is based on evaluations of historical and expected future exercise behavior. The risk-free interest rate is based on the U.S. Treasury rates at the date of grant, with maturity dates approximately equal to the expected life at the grant date. Volatility is based on historical volatility of our stock over the past three years. We have not historically paid any dividends and do not expect to in the foreseeable future. We recognized stock option expense of $341,000, $339,000 and $194,000 in the years ended December 31, 2009, 2008 and 2007, respectively, and the expense is included within general and administrative expense on the consolidated statements of income.
There were 181,383 and 183,633 options exercisable at December 31, 2009 and 2008, respectively. The weighted average exercise price of these options was $6.39 and $2.94 at December 31, 2009 and 2008, respectively.
14. SEGMENT INFORMATION
We currently operate in two reportable segments: Autoscope and RTMS. Autoscope is our machine-vision product line, and revenue consists of royalties (all of which are received from Econolite), as well as a portion of international sales. RTMS is our radar product line acquired in the EIS asset purchase in December 2007, and revenue consists of all North American sales and a portion of international sales. All segment revenues are derived from external customers.
The following tables set forth selected unaudited financial information for each of the Company’s reportable segments (in thousands):
|
|
|
|
|
|
|
|
|
|
|
|
|
|
|
For the year ended December 31, 2009 |
|
|||||||
|
|
|
|
|
|||||||
|
|
|
Autoscope |
|
RTMS |
|
Total |
|
|||
|
|
|
|
|
|
|
|
|
|||
|
Revenue |
|
$ |
16,240 |
|
$ |
8,353 |
|
$ |
24,593 |
|
|
Depreciation |
|
|
292 |
|
|
132 |
|
|
424 |
|
|
Amortization of intangible assets |
|
|
— |
|
|
768 |
|
|
768 |
|
|
Income before income taxes |
|
|
3,807 |
|
|
1,412 |
|
|
5,219 |
|
|
Capital expenditures |
|
|
555 |
|
|
139 |
|
|
694 |
|
|
Total assets |
|
|
29,752 |
|
|
11,398 |
|
|
41,150 |
|
|
|
|
|
|
|
|
|
|
|
|
|
|
|
|
For the year ended December 31, 2008 |
|
|||||||
|
|
|
|
|
|||||||
|
|
|
Autoscope |
|
RTMS |
|
Total |
|
|||
|
|
|
|
|
|
|
|
|
|||
|
Revenue |
|
$ |
18,705 |
|
$ |
7,760 |
|
$ |
26,465 |
|
|
Depreciation |
|
|
242 |
|
|
115 |
|
|
357 |
|
|
Amortization of intangible assets |
|
|
— |
|
|
768 |
|
|
768 |
|
|
Income before income taxes |
|
|
5,939 |
|
|
1,232 |
|
|
7,171 |
|
|
Capital expenditures |
|
|
273 |
|
|
112 |
|
|
385 |
|
|
Total assets |
|
|
24,135 |
|
|
11,973 |
|
|
36,108 |
|
15. RELATED PARTY TRANSACTIONS
Dan Manor, who is a named executive officer, is a beneficiary of the earn-out for the EIS asset purchase as further described in Note 4.
42
Report of Independent Registered Public Accounting Firm
Board of Directors and
Shareholders
Image Sensing Systems, Inc.
We have audited the accompanying consolidated balance sheets of Image Sensing Systems, Inc. (a Minnesota Corporation) and subsidiaries as of December 31, 2009 and 2008, and the related consolidated statements income, shareholders’ equity and comprehensive income, and cash flows for each of the three years in the period ended December 31, 2009. These consolidated financial statements are the responsibility of the Company’s management. Our responsibility is to express an opinion on these financial statements based on our audits.
We conducted our audits in accordance with the standards of the Public Company Accounting Oversight Board (United States). Those standards require that we plan and perform the audit to obtain reasonable assurance about whether the financial statements are free of material misstatement. The Company is not required to have, nor were we engaged to perform an audit of its internal control over financial reporting. Our audit included consideration of internal control over financial reporting as a basis for designing audit procedures that are appropriate in the circumstances, but not for the purpose of expressing an opinion on the effectiveness of the Company’s internal control over financial reporting. Accordingly, we express no such opinion. An audit also includes examining, on a test basis, evidence supporting the amounts and disclosures in the financial statements, assessing the accounting principles used and significant estimates made by management, as well as evaluating the overall financial statement presentation. We believe that our audits provide a reasonable basis for our opinion.
In our opinion, the consolidated financial statements referred to above present fairly, in all material respects, the financial position of Image Sensing Systems, Inc. and subsidiaries as of December 31, 2009 and 2008, and the results of their operations and their cash flows for each of the three years in the period ended December 31, 2009 in conformity with accounting principles generally accepted in the United States of America.
|
|
|
/s/ GRANT THORNTON LLP |
|
|
|
Minneapolis, Minnesota |
|
March 23, 2010 |
43
|
|
|
|
Item 9. |
Changes in and Disagreements with Accountants on Accounting and Financial Disclosure |
None.
|
|
|
|
Item 9A(T). |
Controls and Procedures |
Evaluation of disclosure controls and procedures
We maintain disclosure controls and procedures (as defined in Rules 13a-15(e) and 15d-15(e) under the Securities Exchange Act of 1934, as amended (Exchange Act)), that are designed to reasonably ensure that information required to be disclosed by us in the reports we file or submit under the Exchange Act is recorded, processed, summarized and reported within the time periods specified in the SEC’s rules and forms and that such information is accumulated and communicated to our management, including our principal executive officer and principal financial officer, or persons performing similar functions, as appropriate to allow timely decisions regarding required disclosure. Under the supervision and with the participation of our management, including our Chief Executive Officer and Chief Financial Officer, we evaluated the effectiveness of the design and operation of our disclosure controls and procedures. Based upon that evaluation, the Chief Executive Officer and Chief Financial Officer concluded that, as of the end of the period covered by this report, our disclosure controls and procedures were effective.
Management’s report on internal control over financial reporting
Our management is responsible for establishing and maintaining adequate internal control over financial reporting. Our internal control over financial reporting is a process designed to provide reasonable assurance regarding the reliability of financial reporting and the preparation of financial statements for external purposes in accordance with generally accepted accounting principles in the United States of America. Our internal control over financial reporting includes those policies and procedures that (i) pertain to the maintenance of records that, in reasonable detail, accurately and fairly reflect our transactions and dispositions of our assets; (ii) provide reasonable assurance that transactions are recorded as necessary to permit preparation of the financial statements in accordance with generally accepted accounting principles in the United States of America, and that our receipts and expenditures are being made only in accordance with authorizations of our management and directors; and (iii) provide reasonable assurance regarding prevention or timely detection of unauthorized acquisition, use or disposition of our assets that could have a material effect on the financial statements.
Internal control over financial reporting cannot provide absolute assurance of achieving financial reporting objectives because of its inherent limitations. Internal control over financial reporting is a process that involves human diligence and is subject to lapses in judgment or breakdowns resulting from human failures. Internal control over financial reporting also can be circumvented by collusion or improper management override. Because of such limitations, there is a risk that material misstatements may not be prevented or detected on a timely basis by internal control over financial reporting. However, these inherent limitations are known features of the financial reporting process. Therefore, it is possible to design into the process safeguards to reduce, though not eliminate, this risk.
Because of its inherent limitations, internal control over financial reporting may not prevent or detect all misstatements. Further, projections of any evaluation of effectiveness to future periods are subject to the risk that controls may become inadequate because of changes in conditions, or that the degree of compliance with the policies or procedures may deteriorate.
Management assessed the effectiveness of our internal control over financial reporting as of December 31, 2009. In making this assessment, management used the criteria set forth by the Committee of Sponsoring Organizations of the Treadway Commission (COSO) in “Internal Control—Integrated Framework”. Based on this assessment, management has concluded that our internal control over financial reporting was effective as of December 31, 2009.
44
This annual report does not include an attestation report of our registered public accounting firm regarding internal control over financial reporting. Internal control over financial reporting was not subject to attestation by our registered public accounting firm pursuant to temporary rules of the Securities and Exchange Commission that permit us to provide only management’s report in this annual report.
Changes in internal control over financial reporting
During the most recent fiscal quarter covered by this report, there has been no change in our internal control over financial reporting (as defined in Rule 13a-15(f) and 15d-15(f) under the Exchange Act) that has materially affected, or is reasonably likely to materially affect, our internal control over financial reporting.
|
|
|
|
Item 9B. |
Other Information |
None.
45
PART III
|
|
|
|
Item 10. |
Directors, Executive Officers and Corporate Governance |
We have adopted a Code of Ethics which applies to our principal executive, accounting and financial officers. The Code of Ethics is published on our website at www.imagesensing.com. Any amendments to the Code of Ethics and waivers of the Code of Ethics for our principal executive, accounting and financial officers will be published on our website.
The sections entitled “Proposal I - Election of Directors,” “Audit Committee” and “Section 16(a) Beneficial Ownership Reporting Compliance” in our definitive proxy statement for our 2010 annual meeting of shareholders are incorporated into this Annual Report on Form 10-K by reference.
|
|
|
|
Item 11. |
Executive Compensation |
The sections entitled “Executive Compensation” and “Compensation of Directors” in our definitive proxy statement for the 2010 annual meeting of shareholders are incorporated into this Annual Report on Form 10-K by reference.
|
|
|
|
Item 12. |
Security Ownership of Certain Beneficial Owners and Management and Related Stockholder Matters |
Equity Compensation Plan Information
The following table provides information as of December 31, 2009 about our shares of common stock subject to outstanding awards or available for future awards under our equity compensation plans and arrangements.
|
|
|
|
|
|
|
|
|
|
|
|
|
Plan Category |
|
Number of securities to |
|
Weighted-average exercise |
|
Number of securities remaining |
|
|||
|
|
|
|
|
|
|
|
|
|
|
|
|
Equity compensation plans approved by shareholders(1) |
|
|
425,133 |
|
$ |
8.11 |
|
|
107,500 |
|
|
Equity compensation plans not approved by shareholders |
|
|
6,000 |
|
$ |
7.50 |
|
|
— |
|
|
|
|
|
|
|
|
|
|
|
|
|
|
Total |
|
|
431,133 |
|
$ |
8.10 |
|
|
107,500 |
|
|
|
|
|
|
|
|
|
|
|
|
|
|
|
|
|
|
(1) Includes shares underlying stock options under the Image Sensing Systems, Inc. 1995 Long-Term Incentive and Stock Option Plan (1995 Plan) and non-qualified stock options granted outside the 1995 Plan between 1996 and 2000 to current and former members of the Board of Directors. |
|
|
|
(2) The 107,500 shares available for grant under the 2005 Stock Incentive Plan may become the subject of future awards in the form of stock options, stock appreciation rights, restricted stock, performance awards or other stock-based awards. |
The section entitled “Security Ownership of Certain Beneficial Owners and Management” in our definitive proxy statement for the 2009 annual meeting of shareholders is incorporated into this Form Annual Report on 10-K by reference.
|
|
|
|
Item 13. |
Certain Relationships and Related Transactions, and Director Independence |
The section entitled “Certain Relationships and Related Transactions” in our definitive proxy statement for the 2010 annual meeting of shareholders is incorporated into this Annual Report on Form 10-K by reference.
46
|
|
|
|
Item 14. |
Principal Accountant Fees and Services |
The sections entitled “Audit Fees,” “Audit-Related Fees,” “Tax Fees,” “All Other Fees” and “Policy on Audit Committee Pre-Approval of Audit and Permissible Non-Audit Services Provided by Our Independent Registered Public Accounting Firm” in our definitive proxy statement for our 2010 annual meeting of shareholders are incorporated into this Annual Report on Form 10-K by reference.
PART IV
|
|
|
|
Item 15. |
Exhibits and Financial Statement Schedules |
(b) The following documents are filed as exhibits to this report:
|
|
|
|
|
Exhibit No. |
Description |
|
|
|
|
|
|
|
2.1* |
Asset Purchase Agreement dated December 6, 2007 by and among Image Sensing Systems, Inc. (ISS), EIS Electronic Integrated Systems Inc., Dan Manor and the other parties named therein, incorporated by reference to Exhibit 2.1 to ISS’ Annual Report on Form 10-K for the year ended December 31, 2007 (2007 Form 10-K). (Schedules to this Agreement have not been filed in reliance on Item 601(b)(2) of Regulation S-K of the Securities and Exchange Commission (SEC). ISS will furnish supplementally copies of such schedules to the SEC upon its request.) |
|
|
|
|
|
|
3.1 |
Restated Articles of Incorporation of ISS, incorporated by reference to Exhibit 3.1 to ISS’ Registration Statement on Form SB-2 (Registration No. 33-90298C) filed on March 14, 1995, as amended (Registration Statement). |
|
|
|
|
|
|
3.2 |
Articles of Amendment to Articles of Incorporation of ISS, incorporated by reference to Exhibit 3.2 to ISS’ Quarterly Report on Form 10-QSB for the quarter ended June 30, 2001. |
|
|
|
|
|
|
3.3 |
Bylaws of ISS, incorporated by reference to Exhibit 3.3 to ISS’ Registration Statement. |
|
|
|
|
|
|
4.1 |
Specimen form of ISS’ common stock certificate, incorporated by reference to Exhibit 4.1 to ISS’ Registration Statement. |
|
|
|
|
|
|
10.1 |
Form of Distributor Agreement, incorporated by reference to Exhibit 10.1 to ISS’ Registration Statement. |
|
|
|
|
|
|
10.2** |
1995 Long-Term Incentive and Stock Option Plan, amended and restated through May 17, 2001, incorporated by reference to Exhibit 10.10 to ISS’ Annual Report on Form 10-KSB for the year ended December 31, 2001. |
|
|
|
|
|
|
10.3** |
Employment Agreement between ISS and Kenneth R. Aubrey, dated December 12, 2006, effective on or about January 15, 2007 (in capacity as President) and effective on or about June 1, 2007 (in capacity of President and Chief Executive Officer), incorporated by reference to Exhibit 10.1 to ISS’ Current Report on Form 8-K dated December 14, 2006. |
|
|
|
|
|
|
10.4** |
Employment Agreement between ISS and Gregory R. L. Smith, dated December 8, 2006, incorporated by reference to Exhibit 10.1 to ISS’ Current Report on Form 8-K dated December 8, 2006. |
|
|
|
|
|
|
10.5 |
Amendment VII to Office Lease Agreement dated April 26, 2007 by and between ISS and Spruce Tree Centre L.L.P., incorporated by reference to Exhibit 10.11 to ISS’ Annual Report on Form 10-K for the year ended December 31, 2007 (2007 Form 10-K). |
|
|
|
|
|
|
10.6 |
Modification to Manufacturing, Distributing and Technology License Agreement dated September 1, 2000 by and between ISS and Econolite Control Products, Inc. (Econolite), incorporated by reference to Exhibit 10.12 to ISS’ 2007 Form 10-K. |
|
|
|
|
|
|
10.7** |
Image Sensing Systems, Inc. 2005 Stock Incentive Plan, incorporated by reference to Appendix A to ISS’ proxy statement filed with the SEC on April 19, 2005. |
|
|
|
|
47
|
|
|
|
|
|
10.8 |
Manufacturing, Distributing and Technology License Agreement dated June 11, 1991 by and between ISS and Econolite Control Products, Inc. (Econolite), incorporated by reference to Exhibit 10.1 to the Registration Statement. |
|
|
|
|
|
|
10.09 |
Extension and Second Modification to License Agreement dated July 13, 2001 by and between ISS and Econolite, incorporated by reference to Exhibit 10.12 to ISS’ Annual Report on Form 10-KSB for the year ended December 31, 2001. |
|
|
|
|
|
|
10.10 |
Office Lease Agreement dated November 24, 1998 by and between ISS and Spruce Tree Centre L.L.P., incorporated by reference to Exhibit 10.18 to ISS’ Annual Report on Form 10-KSB for the year ended December 31, 1998. |
|
|
|
|
|
|
10.11 |
Production Agreement dated February 14, 2002 by and among ISS, Wireless Technology, Inc. and Econolite, incorporated by reference to Exhibit 10.20 to ISS’ Annual Report on Form 10-KSB for the year ended December 31, 2001. |
|
|
|
|
|
|
10.12 |
Extension and Third Modification to Manufacturing Distributing and Technology License Agreement dated July 3, 2008 by and between ISS and Econolite, incorporated by reference to Exhibit 10.1 to ISS’ Current Report on Form 8-K dated July 3, 2008. |
|
|
|
|
|
|
10.13** |
Employment Agreement dated December 6, 2007 by and between ISS Image Sensing Systems Canada Ltd. and Dan Manor, incorporated by reference to Exhibit 99.1 to ISS’ 2007 Form 10-K. |
|
|
|
|
|
|
10.14 |
Loan Agreement dated May 1, 2008 by and between ISS and Associated Bank, National Association (Associated Bank), incorporated by reference to Exhibit 10.19 to ISS’ Registration Statement on Form S-1 filed on May 12, 2008 (Form S-1). |
|
|
|
|
|
|
10.15 |
Security Agreement dated May 1, 2008 by and between ISS and Associated Bank, incorporated by reference to Exhibit 10.20 to ISS’ Form S-1. |
|
|
|
|
|
|
10.16 |
Promissory Note (Line of Credit) dated May 1, 2008 in the original principal amount of $5,000,000 issued by ISS to Associated Bank, incorporated by reference to Exhibit 10.21 to ISS’ Form S-1. |
|
|
|
|
|
|
10.17 |
Promissory Note (Loan) dated May 1, 2008 in the original principal amount of $3,000,000 issued by ISS to Associated Bank, incorporated by reference to Exhibit 10.22 to ISS’ Form S-1. |
|
|
|
|
|
|
10.18 |
Modification Agreement dated December 28, 2009 by and between ISS and Associated Bank under which ISS and Associated Bank amended the Loan Agreement dated as of May 1, 2008 by and between ISS and Associated Bank (filed herewith). |
|
|
|
|
|
|
10.19 |
Promissory Note (Loan) dated December 28, 2009 in the original principal amount of $4,000,000 issued by ISS to Associated Bank (filed herewith). |
|
|
|
|
|
|
21 |
List of Subsidiaries of ISS (filed herewith). |
|
|
|
|
|
|
23.1 |
Consent of Independent Registered Public Accounting Firm. |
|
|
|
|
|
|
24 |
Power of Attorney (included on signature page). |
|
|
|
|
|
|
31.1 |
Certification of Chief Executive Officer Pursuant to Section 302 of the Sarbanes-Oxley Act of 2002. |
|
|
|
|
|
|
31.2 |
Certification of Chief Financial Officer Pursuant to Section 302 of the Sarbanes-Oxley Act of 2002. |
|
|
|
|
|
|
32.1 |
Certification of Chief Executive Officer Pursuant to Section 906 of the Sarbanes-Oxley Act of 2002. |
|
|
|
|
|
|
32.2 |
Certification of Chief Financial Officer Pursuant to Section 906 of the Sarbanes-Oxley Act of 2002. |
|
|
|
|
|
|
99.1 |
Extension of Modification to Manufacturing, Distributing and Technology License Agreement dated May 31, 2002 by and between ISS and Econolite, incorporated by reference to Exhibit 99.2 to ISS’ 2007 Form 10-K. |
48
|
|
|
|
|
|
99.2 |
Letter agreement dated June 19, 1997 by and between ISS and Econolite, incorporated by reference to Exhibit 99.3 to ISS’ 2007 Form 10-K. |
|
|
|
|
|
|
|
* |
Portions of this exhibit are treated as confidential pursuant to a request for confidential treatment filed by ISS with the SEC. |
|
|
|
|
** |
Management contract or compensatory plan or arrangement. |
|
|
|
|
|
Copies of all exhibits not attached will be furnished without charge upon written request to the Company at the address set forth on the inside back cover page of this Annual Report. |
49
SIGNATURES
Pursuant to the requirements of Section 13 or 15(d) of the Securities Exchange Act of 1934, the registrant has duly caused this report to be signed on its behalf by the undersigned, thereunto duly authorized.
Image Sensing Systems, Inc.
|
|
|
|
|
/s/ Kenneth R. Aubrey |
|
Date: March 23, 2010 |
|
|
|
|
|
Kenneth R. Aubrey |
|
|
|
President and Chief Executive Officer |
|
|
|
(Principal Executive Officer) |
|
|
Each person whose signature to this Annual Report on Form 10-K appears below hereby constitutes and appoints Kenneth R. Aubrey and Gregory R. L. Smith, and each of them, as his or her true and lawful attorney-in-fact and agent, with full power of substitution, to sign on his or her behalf individually and in the capacity stated below and to perform any acts necessary to be done in order to file all amendments to this Annual Report on Form 10-K, and any and all instruments or documents filed as part of or in connection with this Annual Report on Form 10-K or any amendments hereto, and each of the undersigned does hereby ratify and confirm all that said attorney-in-fact and agent, or his substitutes, shall do or cause to be done by virtue hereof.
In accordance with the Exchange Act, this report has been signed below by the following persons on behalf of the registrant and in the capacities and on the dates indicated:
|
|
|
|
|
/s/ Kenneth R. Aubrey |
|
Date: March 23, 2010 |
|
|
|
|
|
Kenneth R. Aubrey |
|
|
|
President and Chief Executive Officer |
|
|
|
(Principal Executive Officer) |
|
|
|
|
|
|
|
/s/ Gregory R. L. Smith |
|
Date: March 23, 2010 |
|
|
|
|
|
Gregory R. L. Smith |
|
|
|
Chief Financial Officer |
|
|
|
(Principal Financial and Principal Accounting Officer) |
|
|
|
|
|
|
|
/s/ James Murdakes |
|
Date: March 23, 2010 |
|
|
|
|
|
James Murdakes |
|
|
|
Chairman of the Board of Directors |
|
|
|
|
|
|
|
/s/ Panos G. Michalopoulos |
|
Date: March 23, 2010 |
|
|
|
|
|
Panos G. Michalopoulos |
|
|
|
Director |
|
|
|
|
|
|
|
/s/ Michael G. Eleftheriou |
|
Date: March 23, 2010 |
|
|
|
|
|
Michael G. Eleftheriou |
|
|
|
Director |
|
|
|
|
|
|
|
/s/ Sven A. Wehrwein |
|
Date: March 23, 2010 |
|
|
|
|
|
Sven A. Wehrwein |
|
|
|
Director |
|
|
|
|
|
|
|
/s/ James W. Bracke |
|
Date: March 23, 2010 |
|
|
|
|
|
James W. Bracke |
|
|
|
Director |
|
|
50