Attached files
| file | filename |
|---|---|
| EX-32.2 - EXHIBIT 32.2 - CAPITAL TRUST HOLDINGS INC. | a2197481zex-32_2.htm |
| EX-31.1 - EXHIBIT 31.1 - CAPITAL TRUST HOLDINGS INC. | a2197481zex-31_1.htm |
| EX-32.1 - EXHIBIT 32.1 - CAPITAL TRUST HOLDINGS INC. | a2197481zex-32_1.htm |
| EX-31.2 - EXHIBIT 31.2 - CAPITAL TRUST HOLDINGS INC. | a2197481zex-31_2.htm |
| EX-21.1 - EXHIBIT 21.1 - CAPITAL TRUST HOLDINGS INC. | a2197481zex-21_1.htm |
| EX-23.1 - EXHIBIT 23.1 - CAPITAL TRUST HOLDINGS INC. | a2197481zex-23_1.htm |
Use these links to rapidly review the document
TABLE OF CONTENTS
UNITED STATES
SECURITIES AND EXCHANGE COMMISSION
Washington, D.C.
FORM 10-K
| (Mark One) | ||
ý |
ANNUAL REPORT UNDER SECTION 13 OR 15(d) OF THE SECURITIES EXCHANGE ACT OF 1934. |
|
For the fiscal year ended December 31, 2009. |
||
or |
||
o |
TRANSITION REPORT PURSUANT TO SECTION 13 OR 15(d) OF THE SECURITIES EXCHANGE ACT OF 1934 |
|
For the transition period from |
||
Commission file number 0-21815
FIRST MARINER BANCORP
(Exact name of registrant as specified in its charter)
| Maryland (State of incorporation) |
52-1834860 (IRS Employer Identification Number) |
|
1501 S. Clinton Street, Baltimore, MD (Address of principal executive offices) |
21224 (zip code) |
|
410-342-2600 (Telephone number) |
||
Securities registered under Section 12(b) of the Exchange Act:
Title of Each Class
|
Name of Each Exchange on which registered
|
|
|---|---|---|
| Common Stock, par value $0.05 per share | The Nasdaq Stock Market LLC |
Securities registered under Section 12 (g) of the Exchange Act:
None
Indicate by check mark if the registrant is a well-known seasoned issuer, as defined in Rule 405 of the Securities Act. Yes o No ý
Indicate by check mark if the registrant is not required to file reports pursuant to Section 13 or Section 15(d) of the Act. Yes o No ý
Indicate by check mark whether the registrant (1) has filed all reports required to be filed by Section 13 or 15(d) of the Securities Exchange Act of 1934 during the preceding 12 months (or for such shorter period that the registrant was required to file such reports, and (2) has been subject to such filing requirements for the past 90 days. Yes ý No o
Indicate by check mark whether the registrant has submitted electronically and posted on its corporate Web site, if any, every Interactive Data File required to be submitted and posted pursuant to Rule 405 of Regulation S-T (§ 232.405 of this chapter) during the preceding 12 months (or for such shorter period that the registrant was required to submit and post such files). Yes o No o
Indicate by check mark if disclosure of delinquent filers in response to Item 405 of Regulation S-K is not contained herein and will not be contained, to the best of registrant's knowledge, in definitive proxy or information statements incorporated by reference in Part III of this Form 10-K or any amendment to this Form 10-K. o
Indicate by check mark whether the registrant is a large accelerated filer, an accelerated filer, a non-accelerated filer, or a smaller reporting company. See the definitions of "large accelerated filer," "accelerated filer," and "smaller reporting company" in Rule 12b-2 of the Exchange Act. (Check one):
| Large accelerated filer o | Accelerated filer o | Non-accelerated filer o | Smaller reporting company ý |
Indicate by check mark whether the registrant is a shell company (as defined in Rule 12b-2 of the Act). Yes o No ý
The aggregate market value of the voting stock held by non-affiliates of the registrant as of the last business day of the registrant's most recently completed second fiscal quarter was approximately $7.234 million.
The number of shares of common stock outstanding as of March 19, 2010 was 6,452,631 shares.
Documents incorporated by reference:
Proxy Statement—Part III
FIRST MARINER BANCORP
Annual Report on Form 10-K
December 31, 2009
TABLE OF CONTENTS
CAUTIONARY NOTE REGARDING FORWARD-LOOKING STATEMENTS
Some of our statements contained in, or incorporated by reference into, this Annual Report on Form 10-K are "forward-looking statements" within the meaning of the Section 27A of the Securities Act of 1933 and Section 21E of the Securities Exchange Act of 1934. We intend such forward-looking statements to be covered by the safe harbor provisions for forward-looking statements contained in the Private Securities Litigation Reform Act of 1995 and are including this statement for purposes of invoking these safe harbor provisions. Forward-looking statements are not guarantees of performance or results. When we use words like "may," "plan," "contemplate," "anticipate," "believe," "intend," "continue," "expect," "project," "predict," "estimate," "target," "could," "is likely," "should," "would," "will," and similar expressions, you should consider them as identifying forward-looking statements, although we may use other phrasing. These forward-looking statements involve risks and uncertainties and are based on our beliefs and assumptions and on the information available to us at the time that these disclosures were prepared. These forward-looking statements involve risks and uncertainties and may not be realized due to a variety of factors, including, but not limited to, the following:
- •
- the unfavorable effects of future economic conditions, including inflation, recession, or a continuing decrease in real
estate values;
- •
- the failure of assumptions underlying the establishment of our allowance for loan losses, that may prove to be materially
incorrect or may not be borne out by subsequent events;
- •
- the success and timing of our business strategies and our ability to effectively carry out our business plan;
- •
- our inability to realize the benefits from our cost saving initiatives, branch sales, and/or branch closings;
- •
- our inability to continue to operate as a going concern;
- •
- increased loan delinquencies;
- •
- an escalation in problem assets and foreclosures;
- •
- a decline in demand for our products and services;
- •
- a reduction in the value of the collateral for loans made by us, especially real estate, which, in turn would likely
reduce our customers' borrowing power and the value of assets and collateral associated with our existing loans;
- •
- a reduction in the value of certain assets held by us;
- •
- an inability to meet our liquidity needs;
- •
- an inability to raise sufficient capital to comply with the requirements of our regulators and for continued support of
operations;
- •
- adverse changes in the securities' markets;
- •
- changes in governmental monetary and fiscal policies, as well as legislative and regulatory changes;
- •
- the risks of changes in interest rates on the level and composition of deposits, loan demand and the values of loan
collateral, securities, and interest sensitive assets and liabilities;
- •
- the imposition of additional enforcement action by bank regulatory authorities upon First Mariner Bank or First Mariner;
- •
- governmental action as a result of our inability to comply with regulatory orders and agreements;
- •
- the effects of terrorism and efforts to combat it;
3
- •
- our ability to effectively manage market risk, credit risk, and operational risk;
- •
- the effects of competition from other commercial banks, thrifts, mortgage banking firms, consumer finance companies,
credit unions, securities brokerage firms, insurance companies, money market and other mutual funds, and other financial institutions operating in our market area and elsewhere, including institutions
operating regionally, nationally, and internationally, together with competitors offering banking products and services by mail, telephone, and the Internet;
- •
- our ability to successfully implement our capital plan;
- •
- our ability to successfully implement our plan to reduce the Bank's risk exposure on each asset classified as
"Substandard";
- •
- our ability to successfully implement our liquidity contingency plan;
- •
- the effect of an impairment charge on our deferred tax assets;
- •
- the effect of any mergers, acquisitions, or other transactions to which we or our subsidiaries may from time to time be a
party, including our ability to successfully integrate any businesses that we acquire; and
- •
- the risks described in this Annual Report on Form 10-K.
All written or oral forward-looking statements attributable to us are expressly qualified in their entirety by this Cautionary Note. Our actual results may differ significantly from those we discuss in these forward-looking statements. For other factors, risks, and uncertainties that could cause our actual results to differ materially from estimates and projections contained in these forward-looking statements, please read the "Risk Factors" in Item 1A in this section of this Form 10-K. Any forward-looking statement speaks only as of the date which such statement was made, and, except as required by law, we expressly disclaim any obligation or undertaking to disseminate any updates or revisions to any forward-looking statement to reflect events or circumstances after the date on which such statement is made or to reflect the occurrence of unanticipated events.
Except as expressly provided otherwise, the terms "First Mariner" and "Company" as used in this report refer to First Mariner Bancorp and the terms "we," "us," and "our" refer collectively to First Mariner Bancorp and its consolidated subsidiaries.
General
First Mariner Bancorp is a bank holding company whose business is conducted primarily through its wholly owned operating subsidiaries, First Mariner Bank (the "Bank") and FM Appraisals, LLC ("FM Appraisals"). First Mariner was formed in 1995 and has total assets in excess of $1.384 billion as of December 31, 2009. Our executive offices are located in the Canton area of Baltimore City at 1501 South Clinton Street, Baltimore, Maryland 21224. Our telephone number is (410) 342-2600.
We maintain the following Internet sites: www.1stmarinerbank.com; www.1stmarinerbancorp.com; www.1stmarinermortgage.com; and www.vamortgage.com. Information on these websites is not part of, and is not incorporated herein by reference to, this annual report. Our annual report on Form 10-K, quarterly reports on Form 10-Q, and current reports on Form 8-K and amendments to these reports are available, free of charge, in the investor relations section of our Internet site at www.1stmarinerbancorp.com as soon as reasonably practicable after we have filed them with the Securities and Exchange Commission (the "SEC").
4
The Bank is our largest operating subsidiary with assets exceeding $1.372 billion as of December 31, 2009 and is the largest bank headquartered in Baltimore, Maryland. The Bank was formed in 1995 through the merger of several small financial institutions. The Bank's primary market area for its core banking operations, which consist of traditional commercial and consumer lending, as well as retail and commercial deposit operations, is central Maryland, as well as portions of Maryland's eastern shore. First Mariner Bank is an independent community bank, and its deposits are insured by the Federal Deposit Insurance Corporation ("FDIC").
The Bank is engaged in the general commercial banking business, with particular attention and emphasis on the needs of individuals and small to mid-sized businesses, and delivers a wide range of financial products and services that are offered by many larger competitors. Products and services include traditional deposit products, a variety of consumer and commercial loans, residential and commercial mortgage and construction loans, money transfer services, nondeposit investment products, and Internet banking and similar services. Most importantly, the Bank provides customers with access to local Bank officers who are empowered to act with flexibility to meet customers' needs in an effort to foster and develop long-term loan and deposit relationships.
First Mariner Mortgage, a division of the Bank, engages in mortgage-banking activities, providing mortgage loans and associated products to customers and selling most of those mortgage loans into the secondary market. First Mariner Mortgage currently operates offices in Maryland, Delaware, Virginia, and North Carolina. First Mariner Mortgage originated $1.625 billion in loans in 2009.
Next Generation Financial Services ("NGFS"), a division of the Bank, engages in the origination of reverse and conventional mortgage loans, providing these products directly through commission based loan officers throughout the United States. NGFS originates reverse mortgage loans for sale to unaffiliated parties (primarily Fannie Mae). The Bank does not originate any reverse mortgage loans for its portfolio, but does retain the servicing rights on reverse mortgage loans originated by NGFS and sold to Fannie Mae. The Bank has entered into a profit sharing agreement with a private company related to NGFS, which may result in the acquisition of NGFS if certain requirements are satisfied by the end of the first quarter of 2011. The closing of the transaction is subject to numerous conditions, including, without limitation, that the parties obtain consents and approvals from certain lenders and governmental agencies that license and supervise the Bank. Accordingly, there can be no assurance that the closing will occur when expected, if at all. The Bank does not anticipate any benefit that results from the sale to be material.
FM Appraisals is a residential real estate appraisal preparation and management company that is headquartered in Baltimore City. FM Appraisals offers appraisal services for residential real estate lenders, including appraisal preparation, the compliance oversight of subcontracted appraisers, appraisal ordering and administration, and appraisal review services. FM Appraisals provides these services to First Mariner Mortgage and NGFS.
We sold our consumer finance subsidiary, Mariner Finance, LLC, ("Mariner Finance") during 2009. See "Sale of Mariner Finance" in Item 7 of Part II of this Form 10-K for additional information.
We do not conduct any foreign operations.
We operate in two business segments—commercial and consumer banking and mortgage-banking. Financial information related to our operations in these segments for each of the three years ended December 31, 2009 is provided in Note 20 to our Consolidated Financial Statements included in Item 8 of Part II of this Form 10-K.
5
Our Business Strategy
We are currently focused on improving earnings, liquidity, and capital adequacy and controlling asset growth. In order to achieve our objectives, our strategy is to:
- •
- Raise equity capital to strengthen the capital position of the Company and the Bank;
- •
- Reduce our long-term debt;
- •
- Aggressively improve the quality of assets currently in our portfolio;
- •
- Adhere to rigorous credit standards in the origination of new loans;
- •
- Reduce our controllable operating expenses to improve our efficiency ratios;
- •
- Work towards obtaining termination of Regulatory Enforcement Actions (See discussions in Item 1A of this Part of
this Form 10-K);
- •
- Review our branch performance to evaluate possible consolidations or relocations that may increase our efficiency;
- •
- Cross-sell our products and services to our existing customers to leverage relationships and enhance our
profitability;
- •
- Capitalize on our personal relationship approach that we believe differentiates us from our larger competitors;
- •
- Provide our customers with access to local executives who make key credit and other decisions;
- •
- Maximize mortgage-banking opportunities;
- •
- Pursue commercial lending opportunities with small to mid-sized businesses that are underserved by our larger
competitors; and
- •
- Develop innovative financial products and services to generate additional sources of revenue.
Financial Services We Provide
Commercial Banking
Our commercial loan unit focuses on loan originations from small and mid-sized businesses (generally up to $20.0 million in annual sales) and such loans are usually accompanied by significant related deposits. Our commercial loan products include commercial mortgage loans for the purchase or refinance of commercial properties; residential and commercial real estate construction and development loans; working capital loans and lines of credit; demand, term, and time loans; and equipment, inventory, and accounts receivable financing. We also offer an array of cash management services and deposit products to our commercial customers. Computerized on-line banking and remote deposit are currently available to our commercial customers.
Retail Banking
Our retail banking activities emphasize consumer deposit and checking accounts. We offer an extensive range of services to meet the varied needs of our customers of all age demographics. In addition to traditional products and services, we offer contemporary products and services, such as debit cards, mutual funds, annuities, insurance products, Internet banking, and electronic bill payment services. Our consumer loan products include home equity lines of credit, fixed rate second mortgages, new and used auto loans, new and used boat loans, overdraft protection, and unsecured personal credit lines.
6
Mortgage-Banking
Our mortgage-banking business is structured to provide a source of fee income largely from the process of originating residential mortgage loans for sale on the secondary market, as well as the origination of loans to be held in our loan portfolio. Mortgage-banking products include Federal Housing Administration ("FHA") and the federal Veterans Administration ("VA") loans, conventional and nonconforming first- and second-lien mortgages, reverse mortgages, and construction and permanent financing.
Community Reinvestment Act
We have a strong commitment to our responsibilities under the federal Community Reinvestment Act ("CRA") and actively search for opportunities to meet the development needs of all members of the communities we serve, including persons of low to moderate income in a manner consistent with safe and sound banking practices. We currently fulfill this commitment primarily by participating in loan programs sponsored or guaranteed by the FHA, the VA, the federally funded American Dream Downpayment Initiative, the Maryland Mortgage Program ("CDA"), the U.S. Department of Agriculture Rural Development Loans Program, the Federal Home Loan Bank of Atlanta Closing Cost Assistance Program, the Section 8 to Home-Ownership Program, and the Settlement Expense Loan Program.
Our Lending Activities
Loan Portfolio Composition
At December 31, 2009, our loan portfolio totaled $890.951 million, representing approximately 64.3% of our total assets of $1.385 billion. The majority of our lending activity is in the Mid-Atlantic region and our loans are generally secured by residential and commercial real estate. At December 31, 2009 over 88% of our total loans were secured by real estate.
Real Estate Development and Construction Loans
The Bank provides interim real estate acquisition, development, and construction loans to builders, developers, and persons who will ultimately occupy their single-family dwellings. These loans are made within the Federal regulatory guidelines for maximum loan to value ratios. Generally, residential construction loans are made for up to 85% of the appraised value of the property for individuals and 80% of the appraised value of the property for developers. Residential construction loans are made for over 80% of the appraised value of the property with additional credit enhancements, such as additional collateral and/or private mortgage insurance. Commercial real estate construction loans are generally made for 75% or less of the appraised value of the property. Development loans, made to improve raw land into lots on which structures may be built, are generally made for 75% or less of the appraised value of the property. The Bank's real estate development and construction loan funds are disbursed periodically at pre-specified stages of completion. We carefully monitor these loans with on-site inspections and control of disbursements. The Bank's real estate development and construction loans are typical debt obligations of the borrowers and do not provide for our participation in residual profits or losses of the projects or involve equity positions through partnerships, joint ventures, or other similar structures.
Loans to individuals for the construction of their primary residences are typically secured by the property under construction, frequently include additional collateral (such as a second mortgage on the borrower's present home), and commonly have maturities of nine to twelve months.
Loans to residential builders for the construction of residential homes require binding sales contracts on the property and pre-qualification of the prospective buyers for permanent mortgage financing. Development loans are made only to developers with a proven track record. Generally, these
7
loans are extended only when the borrower provides evidence that the lots under development will be sold to builders satisfactory to us.
The Bank secures development and construction loans with the properties under development or construction and we typically obtain personal guarantees from the principals. Further, to assure that we do not place reliance solely in the value of the underlying property, we consider the financial condition and reputation of the borrower and any guarantors, the amount of the borrowers' equity in the project, independent appraisals, costs estimates, and preconstruction sales information.
Residential Real Estate Mortgage Loans
The Bank originates adjustable- and fixed-rate residential mortgage loans, including reverse mortgages. These mortgage loans are generally originated under terms, conditions, and documentation acceptable to the secondary mortgage market. With the current exception of reverse mortgages, the Bank will place some of these loans into our portfolio, although the vast majority are ultimately sold to investors.
Commercial Real Estate Mortgage Loans
The Bank originates mortgage loans secured by commercial real estate. These loans are primarily secured by office buildings, retail buildings, warehouses, and general-purpose business space. Although terms may vary, these commercial mortgage loans generally have maturities of 10 years or less. It is our general policy to obtain personal guarantees from the principals of the borrowers and assignments of all leases related to the collateral.
Commercial Loans
The Bank originates a variety of loans for business purposes. The majority of our commercial loans are secured. The Bank makes loans to provide working capital to businesses in the form of lines of credit, which may be secured by real estate, accounts receivable, inventory, equipment, or other assets. The financial condition and cash flow of our commercial borrowers are closely monitored by the submission of corporate financial statements, personal financial statements, and income tax returns. The frequency of submissions of required financial information depends on the size and complexity of the credit and the collateral that secures our loan. It is our general policy to obtain personal guarantees from the principals of our commercial loan borrowers.
Consumer Loans
The Bank offers a variety of consumer loans, typically secured by residential real estate or personal property, including automobiles and boats. Our home equity loans (closed-end and lines of credit) are typically made up to 70% of the appraised value, less the amount of any existing prior liens on the property and generally have maximum terms of 15 years. The interest rates on our closed-end home equity loans are generally fixed, while interest rates on our home equity lines of credit are variable.
See Item 7 of Part II of this Form 10-K for more detailed information concerning our loan portfolio, the individual portfolio types, and their effect on 2009 operations.
Our Credit Administration Process
Our lending activities are subject to written policies approved by the Bank's Board of Directors to ensure proper management of credit risk. We make loans that are subject to a well defined credit process that includes credit evaluation of borrowers, risk-rating of credits, establishment of lending limits and application of lending procedures, including the holding of adequate collateral and the maintenance of compensating balances, as well as procedures for on-going identification and management of credit deterioration. We conduct regular portfolio reviews to identify potential
8
underperforming credits, estimate loss exposure, geographic and industry concentrations, and to ascertain compliance with our policies. For significant problem loans, we review and evaluate the financial strengths of our borrower and the guarantor, the related collateral, and the effects of economic conditions.
The loan committee of the Bank's Board of Directors is authorized to approve loans up to the Bank's legal lending limit, which approximates $13.9 million as of December 31, 2009. We have established an in-house limit of $5.0 million, which is reviewed periodically by the Board of Directors, but do have loans to a limited number of customers in excess of that amount.
We generally do not make loans to be held in our loan portfolio outside our market area unless the borrower has an established relationship with us and conducts its principal business operations within our market area. Consequently, we, and our borrowers, are affected by the economic conditions prevailing in our market area. Approximately 81% of our residential real estate development and construction loan portfolio consisted of loans to Maryland customers; an additional 18% consisted of loans to customers in the surrounding states and the District of Columbia; and approximately 1% consisted of loans to customers in other states in the country. Approximately 83% of our commercial loan portfolio (commercial, commercial real estate, and commercial construction) consisted of loans to Maryland customers with an additional 11% consisting of loans to customers in the surrounding states and the District of Columbia. Commercial and commercial real estate loans to customers in other states in the country amounted to approximately 6% of our portfolio.
Market
We consider our core market area to be the communities within the Baltimore/Washington corridor, particularly Baltimore City and the Maryland counties of Baltimore, Anne Arundel, Harford, and Howard, as well as the eastern shore of Maryland. Lending activities are broader and include areas outside of our core market area such as other Maryland counties, the District of Columbia and certain markets in contiguous states, as well as certain regional and national markets.
Our Competition
Banking
We operate in a highly competitive environment, competing for deposits and loans with commercial banks, thrifts, credit unions, mortgage companies, finance companies, Internet-based financial companies, and other financial entities. Our principal competitors include other community commercial banks and larger financial institutions with branches in our market area. Numerous mergers and consolidations involving financial entities in our market area have occurred in recent years, requiring us to compete with banks and finance companies with greater resources. Additionally, certain financial institutions have received various amounts of government financial assistance in recent months, in accordance with legislation passed in late 2008, giving those institutions greater resources with which to compete in our market. See "Supervision and Regulation" later in this section for further information on the recent government legislation.
The primary factors we face in competing for deposits are interest rates, personalized service, the quality and range of financial services, convenience of office locations, and office hours. Competition for deposits comes primarily from other commercial banks, savings associations, credit unions, money market funds, Internet based banks, and other investment alternatives. The primary factors in competing for loans are interest rates, loan origination fees, the quality and range of lending services, responsiveness, and personalized service. Competition for loans comes primarily from other commercial banks, savings associations, mortgage-banking firms, credit unions, finance companies, and other financial intermediaries. Many of the financial institutions operating in our market area offer certain services such as trust and international banking, which we do not offer, and have greater financial resources or have substantially higher lending limits.
9
To compete with other financial services providers, we principally rely upon local promotional activities, personal relationships established by our officers, directors, and employees with our customers, and specialized services tailored to meet our customers' needs. In those instances where we are unable to accommodate a customer's needs, we will arrange for those services to be provided by other financial institutions with which we have a relationship.
Current banking laws facilitate interstate branching and merger activity among banks. This may result in an even greater degree of competition in the banking industry and we may be brought into competition with institutions with which we do not currently compete. As a result, intense competition in our market area may be expected to continue for the foreseeable future.
Mortgage-banking
Our mortgage-banking division also operates in an extremely competitive environment. In addition to competing with mortgage-banking divisions of other financial institutions, we compete with mortgage-banking firms that are not under the same level of regulation as we are. Without similar regulatory constraints, these lesser-regulated firms can be more responsive to customers. Additionally, competition in the mortgage-banking industry comes from the continuing evolution of the secondary mortgage market, the proliferation of mortgage products, increasing interest rate volatility, compounded by homeowners' increasing tendency to refinance their mortgages as the refinance process becomes more efficient and cost effective. These swings in mortgage origination volume have placed significant operational and financial pressures on mortgage lenders.
To compete effectively in this environment, we maintain a very high level of operational, technological, and managerial expertise, consistently offer a wide selection of mortgage loans through all marketing channels on a regional scale, provide high-quality service, and price our mortgage loans at competitive rates.
Supervision and Regulation
General
First Mariner and the Bank are extensively regulated under federal and state law. As a registered bank holding company, First Mariner is subject to supervision and examination by and reporting to the Federal Reserve Board ("FRB" or "Federal Reserve").
The Bank is a member of the Federal Home Loan Bank System and, with respect to deposit insurance, of the Deposit Insurance Fund managed by the FDIC. The Bank must file reports with the Maryland Commissioner of Financial Regulation ("Commissioner") and the FDIC concerning its activities and financial condition and obtain regulatory approvals prior to entering into certain transactions such as mergers with, or acquisitions of, other banks. The Commissioner and/or the FDIC conduct periodic examinations to test the Bank's safety and soundness and compliance with various regulatory requirements. This regulation and supervision is intended primarily for the protection of the insurance fund and depositors. The regulatory structure also gives the regulatory authorities extensive discretion in connection with their supervisory and enforcement activities and examination policies, including with respect to the classification of assets and the establishment of adequate loan loss reserves for regulatory purposes. Any change in such regulatory requirements and policies, whether by the Commissioner, the FDIC or legislative bodies, could have a material adverse impact on First Mariner, the Bank, and their operations.
Certain regulatory requirements applicable to First Mariner and the Bank are referred to below or elsewhere in this Form 10-K. The summary of statutory provisions and regulations set forth below or elsewhere does not purport to be a complete description of such statutes and regulations and their effects on First Mariner and the Bank and is qualified in its entirety by reference to the actual laws and regulations.
10
Regulation of First Mariner
General
First Mariner, as the sole shareholder of the Bank, is a bank holding company and is registered as such with the Federal Reserve. Bank holding companies are subject to comprehensive regulation and examination by the FRB under the Bank Holding Company Act of 1956, as amended (the "BHCA"), and the regulations of the FRB. The Federal Reserve also has extensive enforcement authority over bank holding companies, including, among other things, the ability to assess civil money penalties, issue cease and desist or removal orders, and require that a holding company divest subsidiaries. In general, enforcement actions may be initiated for violations of law and regulations and unsafe or unsound practices. First Mariner has entered into a written agreement with the FRB. See "We are subject to restrictions and conditions of Cease and Desist Orders issued by the FDIC and the Commissioner ("September Order"), and agreements with the FRB ("FRB Agreement" and "New FRB Agreement") and have incurred and expect to continue to incur significant additional regulatory compliance expense in connection with these enforcement actions" in Item 1A later in this Part of this Form 10-K. See also "Capital Resources" in Item 7 of Part II of this Form 10-K.
Under the BHCA, a bank holding company must obtain Federal Reserve approval before: (i) acquiring, directly or indirectly, ownership or control of any voting shares of another bank or bank holding company if, after such acquisition, it would own or control more than 5% of such shares (unless it already owns or controls the majority of such shares); (ii) acquiring all or substantially all of the assets of another bank or bank holding company; or (iii) merging or consolidating with another bank holding company. In evaluating such applications, the Federal Reserve considers a variety of financial, managerial, and competitive factors and the convenience and needs of the communities involved.
The BHCA also prohibits a bank holding company, with certain exceptions, from acquiring direct or indirect ownership or control of more than 5% of the voting shares of any company which is not a bank or bank holding company, or from engaging directly or indirectly in activities other than those of banking, managing, or controlling banks or providing services for its subsidiaries. The principal exceptions to these prohibitions involve certain nonbanking activities which, by statute or by Federal Reserve Board regulation or order, have been identified as activities closely related to the business of banking or managing or controlling banks. The list of activities includes, among others, operating a savings association, mortgage company, finance company, credit card company, or factoring company; performing certain data processing operations; providing certain investment and financial advice; real estate and personal property appraising; providing tax planning and preparation services; and, subject to certain limitations, providing securities brokerage services for customers.
The Gramm-Leach-Bliley Act of 1999 authorized bank holding companies that meet certain management, capital, and other criteria to choose to become a "financial holding company" and thereby engage in a broader array of financial activities including insurance underwriting and investment banking. First Mariner elected to become a financial holding company in 2002, but withdrew that election in 2007.
Dividends
The Federal Reserve has issued a policy statement on the payment of cash dividends by bank holding companies. That expresses the FRB's view that a bank holding company should pay cash dividends only to the extent that the company's net income for the past year is sufficient to cover both the cash dividends and a rate of earning retention that is consistent with the company's capital needs, asset quality, and overall financial condition. The Federal Reserve has indicated that it would be inappropriate for a company experiencing serious financial problems to borrow funds to pay dividends. Furthermore, under the prompt corrective action regulations adopted by the Federal Reserve pursuant to the Federal Deposit Insurance Corporation Improvement Act of 1991 ("FDICIA"), the Federal
11
Reserve Board may prohibit a bank holding company from paying any dividends if the holding company's bank subsidiary is classified as "undercapitalized." See "Federal and State Bank Regulation—Prompt Corrective Regulatory Action" later in this section.
Capital Requirements
The Federal Reserve has established consolidated capital requirements, for bank holding companies that are structured similarly to the capital requirements for FDIC-insured state banks described below. See "Federal and State Bank Regulation: Capital Requirements" later in this section.
Stock Repurchases
A bank holding company is required to give the FRB prior written notice of any purchase or redemption of its outstanding equity securities if the gross consideration for the purchase or redemption, when combined with the net consideration paid for all such purchases or redemptions during the preceding 12 months, is equal to 10% or more of the company's consolidated net worth. The Federal Reserve may disapprove such a purchase or redemption if it determines that the proposal would violate any law, regulation, Federal Reserve order, directive, or any condition imposed by, or written agreement with, the FRB. This requirement does not apply to bank holding companies that are "well-capitalized," received one of the two highest examination ratings at their last examination, and are not the subject of any unresolved supervisory issues.
Source of Strength
Under Federal Reserve policy, a bank holding company is expected to act as a source of financial strength to its subsidiary banks and to make capital injections into a troubled subsidiary bank, and generally the Federal Reserve may charge the bank holding company with engaging in unsafe and unsound practices for failure to commit resources to a subsidiary bank when required. A required capital injection may be called for at a time when the holding company does not have the resources to provide it. In addition, depository institutions insured by the FDIC can be held liable for any losses incurred by, or reasonably anticipated to be incurred by, the FDIC in connection with the default of, or assistance provided to, a commonly controlled FDIC-insured depository institution. Accordingly, in the event that any insured subsidiary of First Mariner causes a loss to the FDIC, other insured subsidiaries could be required to compensate the FDIC by reimbursing it for the estimated amount of such loss. Such cross guaranty liabilities generally are superior in priority to the obligations of the depository institution to its stockholders due solely to their status as stockholders and obligations to other affiliates.
Acquisitions of Bank Holding Companies and Banks
Under the BHCA, any company must obtain approval of the Federal Reserve prior to acquiring control of First Mariner or the Bank. For purposes of the BHCA, control is defined as ownership of more than 25% of any class of voting securities of First Mariner or the Bank, the ability to control the election of a majority of the directors, or the exercise of a controlling influence over management or policies of First Mariner or the Bank. Any bank holding company must secure Federal Reserve approval prior to acquiring 5% or more of the stock of the Company or the Bank.
The Change in Bank Control Act and the related regulations of the FRB require any person or persons acting in concert (except for companies required to make application under the BHCA), to file a written notice with, and review the nonobjection of, the Federal Reserve before such person or persons may acquire direct or indirect control of First Mariner. The Change in Bank Control Act implementing regulations presume control as the power, directly or indirectly, to vote 10% or more of any voting securities or to direct the management or policies of a bank holding company, such as First Mariner, that has securities registered under the Securities Exchange Act of 1934.
12
Maryland Bank Holding Company Regulation
Under Maryland law, acquisitions of 25% or more of the voting stock of a Maryland commercial bank or a Maryland bank holding company and other acquisitions of voting stock of such entities which affect the power to direct or to cause the direction of the management or policy of a commercial bank or a bank holding company must be approved in advance by the Commissioner. Any voting stock acquired without the approval required under the statute may not be voted for a period of five years. Certain acquisitions by bank holding companies of 5% or more of the stock of Maryland banks or Maryland bank holding companies are governed by Maryland's holding company statute and also require prior approval of the Commissioner. Also, a bank holding company and its Maryland chartered bank subsidiary, must generally obtain the prior approval of the Commissioner prior to, directly or indirectly, acquiring nonbanking subsidiaries or affiliates.
Federal and State Bank Regulation
The Bank is a Maryland chartered trust company, with all the powers of a commercial bank, regulated and examined by the Commissioner and the FDIC.
Business Activities
Maryland law and Commissioner regulate the Bank's internal organization as well as deposit, lending, and investment activities. In its lending activities, the maximum legal rate of interest, fees, and charges that may be charged on a particular loan depends on a variety of factors such as the type of borrower, the purpose of the loan, the amount of the loan, and the date the loan is made. Other laws tie the maximum amount that may be loaned to any one customer and related interests to a financial institution's capital levels. Additionally, Maryland law contains a parity statute by which Maryland institutions may, with the approval of the Commissioner, engage in any additional activity, service, or other practice that is permitted for national banks.
The FDIC also regulates many of the areas regulated by the Commissioner and federal law may limit some of the authority provided by Maryland law. Approval of the Commissioner and the FDIC is required for, among other things, business combinations and the establishment of branch offices.
Branching Activities
Any Maryland-chartered bank meeting certain requirements may, with the approval of the Commissioner and the FDIC, establish and operate branches anywhere in the state.
Interstate Branching
Federal law authorizes the responsible federal banking agencies to approve merger transactions between banks located in different states unless the state in which the target is located has opted out. Accordingly, a Maryland bank may acquire branches in a state other than Maryland unless the other state has enacted legislation opting out. Federal law also authorizes de novo branching into another state if the host state enacts a law expressly permitting out of state banks to establish such branches within its borders.
Activities and Investments
Since the enactment of FDICIA, all state-chartered FDIC insured banks have generally been limited to activities as principal to those authorized for national banks, notwithstanding any broader authority that may exist in state law. Additionally, FDICIA limits equity investments by state banks to the types and amounts permitted national banks. Certain exceptions exist. For example, the FDIC is authorized to permit banks to engage in state-authorized activities or investments that are impermissible for national banks (other than nonsubsidiary equity investments) if the bank meets all
13
applicable capital requirements and it is determined that the activities or investments do not pose a significant risk to the Deposit Insurance Fund.
Capital Requirements
The Bank is subject to the FDIC's regulatory capital requirements. The capital regulations currently require state banks to meet two minimum capital standards: a 4% leverage ratio (3% for institutions receiving the highest rating on the depository institution examination rating system) and an 8% risk-based capital ratio.
The leverage ratio requires a minimum ratio of Tier 1 (or "core") capital to adjusted average assets of 4% (3% for institutions with the highest examination rating). Tier 1 capital is generally defined as common stockholders' equity (including retained earnings), certain noncumulative perpetual preferred stock, and related surplus and minority interests in equity accounts of consolidated subsidiaries, less certain deferred tax assets and intangibles other than certain mortgage servicing rights and credit card relationships.
The risk-based capital standard requires the maintenance of Tier 1 and total capital (which is defined as Tier 1 capital plus Tier 2 (or "supplementary") capital) to risk-weighted assets of at least 4% and 8%, respectively. In determining risk-weighted assets, all assets, including certain off-balance sheet assets, recourse obligations, residual interests, and direct credit substitutes, are multiplied by risk weightings of 0% to 200%, which are assigned by the FDIC capital regulation based on the risks believed inherent in the type of asset. The components of Tier 2 capital currently include cumulative preferred stock, long-term perpetual preferred stock, mandatory convertible securities, subordinated debt and intermediate preferred stock, the allowance for loan and lease losses up to a maximum of 1.25% of risk-weighted assets, and up to 45% of unrealized gains on available-for-sale equity securities with readily determinable fair market values. Overall, the amount of Tier 2 capital included as total capital cannot exceed 100% of Tier 1 capital.
The FDIC also has authority to establish individual minimum capital requirements in appropriate cases upon a determination that an institution's capital level is or may become inadequate in light of the particular circumstances. The FDIC has done so in the case of the Bank. See "We are subject to restrictions and conditions of Cease and Desist Orders issued by the FDIC and the Commissioner ("September Order"), and agreements with the FRB ("FRB Agreement" and "New FRB Agreement") and have incurred and expect to continue to incur significant additional regulatory compliance expense in connection with these enforcement actions" in Item 1A later in this Part of this Form 10-K. See also "Capital Resources" in Item 7 of Part II of this Form 10-K.
Prompt Corrective Regulatory Action
Federal law requires the appropriate federal regulatory agency to take certain supervisory actions against undercapitalized institutions, the severity of which depends upon the institution's degree of undercapitalization. Generally, a bank that has a ratio of total capital to risk weighted assets of less than 8%, a ratio of Tier 1 capital to risk-weighted assets of less than 4% or a ratio of Tier 1 capital to total assets of less than 4% (3% or less for institutions with the highest examination rating) is considered to be "undercapitalized." A bank that has a total risk-based capital ratio of less than 6%, a Tier 1 capital ratio of less than 3% or a leverage ratio that is less than 3% is considered to be "significantly undercapitalized" and a bank that has a tangible capital to assets ratio equal to or less than 2% is deemed to be "critically undercapitalized." Subject to a narrow exception, a receiver or conservator must be appointed within specified time frames for an institution that is "critically undercapitalized." The law also provides that an acceptable restoration plan must be filed within 45 days of the date a bank receives notice that it is "undercapitalized," "significantly undercapitalized," or "critically undercapitalized." Compliance with the plan must be guaranteed by any parent company up to the lesser of 5% of the Bank's total assets when deemed to be undercapitalized or the amount
14
necessary to achieve compliance with all applicable capital requirements. In addition, certain mandatory supervisory actions become applicable to any undercapitalized institution including, but not limited to, increased monitoring by regulators and restrictions on growth, capital distributions (including dividends), and expansion. The FDIC could also take additional discretionary supervisory actions, including the issuance of a capital directive, requiring the sale of the institution, and the replacement of senior executive officers and directors.
Safety and Soundness Guidelines
Federal law requires each federal banking agency to establish safety and soundness standards for institutions under its authority. The federal banking agencies, including the FDIC, have released Interagency Guidelines Establishing Standards for Safety and Soundness. The guidelines specify basic standards for matters such as internal controls and information systems, internal audit systems, loan documentation, credit underwriting, interest rate risk exposure and asset growth, asset quality, earnings, and employee compensation. If the appropriate federal banking agency determines that a depository institution is not in compliance with the safety and soundness guidelines, it may require the institution to submit an acceptable plan to achieve compliance with the guidelines. The institution must submit an acceptable compliance plan within 30 days of receipt of a request for such a plan. Failure to submit or implement a compliance plan may result in regulatory sanctions.
Uniform Lending Standards
Under FDIC's regulations, state banks must adopt and maintain written policies that establish appropriate limits and standards for loans that are secured by interests in real estate or are made for the purpose of financing permanent improvements to real estate. The policies must establish loan portfolio diversification standards, prudent underwriting standards, including loan-to-value limits that are clear and measurable, loan administration procedures and documentation, and loan approval and reporting requirements. Such real estate lending policies must reflect the Interagency Guidelines for Real Estate Lending Policies that have been adopted by the federal banking agencies.
Transactions with Related Parties
Transactions between a bank and any affiliate are governed by Sections 23A and 23B of the Federal Reserve Act. An affiliate is any company or entity, which controls, is controlled by or is under common control with the bank. For example, First Mariner is an affiliate of the Bank's for purposes of those laws. Generally, Sections 23A and 23B: (i) limit the extent to which an institution or its subsidiaries may engage in "covered transactions" with any one affiliate to an amount equal to 10% of such institution's capital stock and surplus, and contain an aggregate limit on all such transactions with all affiliates to an amount equal to 20% of such capital stock and surplus, (ii) impose collateral requirements on certain transactions with, including loans to, affiliates, and (iii) require that all such transactions be on terms substantially the same, or at least as favorable, to the institution or subsidiary as those provided to a nonaffiliate. The term "covered transaction" includes loans to, purchases of assets from, and the issuance of guarantees on behalf of an affiliate and certain other transactions.
15
Banks also are subject to the federal restrictions on loans to executive officers, directors, and greater than 10% stockholders (collectively, "insiders"). Generally, loans to insiders and certain related interests must be approved in advance by a majority of the board of directors of the institution, with any "interested" director not participating in the voting, if the loan exceeds the greater of $25,000 or 5% of the bank's capital. Any loan which, combined with prior loans to the insider and their related interest, aggregates $500,000 or more are subject to the board's approval requirements in all cases. Loans to insiders must be made on terms substantially the same as offered in comparable transactions to outside parties. There is an exception for extensions of credit made to officers and directors as part of a bank-wide compensation or benefit program that does not favor directors or officers over other employees. There are further restrictions on loans that can be made to executive officers.
Additionally, Maryland law imposes restrictions on loans to directors, officers, or employees of Maryland commercial banks. Generally, a director, officer, or employee of a commercial bank may not borrow, directly or indirectly, any money from the bank, unless the loan has been approved by the board of directors, or the executive committee of the bank, if that committee is authorized to approve loans. Commercial loans made to nonemployee directors of a bank and certain consumer loans made to nonofficer and nondirector employees of a bank are exempted.
Dividend Restrictions
A Maryland bank's ability to pay dividends is governed by the Maryland law and the regulations of the FDIC. Under Maryland law, if the surplus of a commercial bank is less than 100% of its capital stock then, until the surplus equals at least 100% of the capital stock, the commercial bank: (i) must transfer to its surplus annually at least 10% of its net earnings and (ii) may not declare or pay any cash dividends that exceed 90% of its net earnings. Maryland law provides for dividends only out of undivided profits or, with the approval of the Commissioner, surplus in excess of 100% of required capital stock. Also, under FDIC regulations, no bank may pay a dividend if it would be "undercapitalized" within the meaning of the prompt corrective action laws, or if it is in default of any deposit insurance assessment. See also "Our ability to pay cash dividends is limited" in Item 1A later in this Part of this Form 10-K.
Enforcement
The Commissioner has extensive enforcement authority over Maryland banks. Such authority includes the ability to issue cease and desist orders and civil money penalties and to remove directors or officers. The Commissioner may also take possession of a Maryland bank whose capital is impaired and seek to have a receiver appointed by a court.
The FDIC has primary federal enforcement responsibility over state banks under its jurisdiction, including the authority to bring enforcement action against all "institution-related parties," including stockholders, and any attorneys, appraisers and accountants who knowingly or recklessly participate in wrongful action likely to have an adverse effect on an institution. Formal enforcement action may range from the issuance of a capital directive or cease and desist order to removal of officers and/or directors, receivership, conservatorship, or termination of deposit insurance. Civil money penalties cover a wide range of violations and actions and range up to $25,000 per day or even up to $1 million per day (in the most egregious cases). Criminal penalties for most financial institution crimes include fines of up to $1 million and imprisonment for up to 30 years.
The Bank has entered into a Consent Order with the FDIC and the Commissioner. See "Capital Resources" in Item 7 of Part II of this Form 10-K.
16
Community Reinvestment Act
Under the CRA, as implemented by FDIC regulations, a bank has a continuing and affirmative obligation, consistent with its safe and sound operation, to help meet the credit needs of its entire community, including low and moderate income neighborhoods. The CRA does not establish specific lending requirements or programs for financial institutions, nor does it limit an institution's discretion to develop the types of products and services that it believes are best suited to its particular community. The CRA requires the FDIC, in connection with its examination of a bank, to assess the institution's record of meeting the credit needs of its community and to take the record into account in its evaluation of certain applications by the institution.
Assessments
Maryland banks are required to pay annual assessments to the Commissioner's office to cover the cost of regulating Maryland institutions. The Bank's asset size determines the amount of the assessment.
Insurance of Deposit Accounts
The Bank's deposits are insured up to applicable limits by the Deposit Insurance Fund of the FDIC. The Deposit Insurance Fund is the successor to the Bank Insurance Fund and the Savings Association Insurance Fund, which were merged in 2006.
Under the FDIC's risk-based assessment system, insured institutions are assigned to one of four risk categories based on supervisory evaluations, regulatory capital levels, and certain other factors, with less risky institutions paying lower assessments. An institution's assessment rate depends upon the category to which it is assigned. For calendar 2008, assessments ranged from five to forty-three basis points of each institution's deposit assessment base. Due to losses incurred by the Deposit Insurance Fund ("DIF") in 2008 as a result of failed institutions, and anticipated future losses, the FDIC adopted an across the board seven basis point increase in the assessment range for the first quarter of 2009. The FDIC made further refinements to its risk-based assessment that were effective April 1, 2009 and that effectively made the range 7.0 to 77.5 basis points. The FDIC may adjust rates uniformly from one quarter to the next, except that no adjustment can deviate more than three basis points from the base scale without notice and comment rulemaking. No institution may pay a dividend if in default of the FDIC assessment.
The FDIC imposed on each insured institution a special emergency assessment of five basis points of total assets minus Tier 1 capital, as of June 30, 2009 (capped at ten basis points of an institution's deposit assessment base on the same date) in order to cover losses to the Deposit Insurance Fund. That special assessment was collected on September 30, 2009. The FDIC provided for similar special assessments during the last two fiscal quarters of 2009, if deemed necessary. However, in lieu of further special assessments, the FDIC required insured institutions to prepay estimated quarterly risk-based assessments for the fourth quarter of 2009 through the fourth quarter of 2012. The Bank received an automatic waiver of the prepayment requirement.
Due to the recent difficult economic conditions, deposit insurance per account owner has been raised to $250,000 for all types of accounts until January 1, 2014. In addition, the FDIC adopted an optional Temporary Liquidity Guarantee Program by which, for a fee, noninterest-bearing transaction accounts would receive unlimited insurance coverage until December 31, 2009, subsequently extended until June 30, 2010. Certain senior unsecured debt issued by institutions and their holding companies between specified time frames could also be guaranteed by the FDIC through June 30, 2012, or in some cases, December 31, 2012. The Bank made a business decision to participate in the unlimited noninterest-bearing transaction account coverage and the Bank and First Mariner opted to participate in the unsecured debt guarantee program.
17
The Federal Deposit Insurance Corporation has authority to increase insurance assessments. A significant increase in insurance premiums would likely have an adverse effect on the operating expenses and results of operations of the Company. Management cannot predict what insurance assessment rates will be in the future.
Insurance of deposits may be terminated by the FDIC upon a finding that the institution has engaged in unsafe or unsound practices, is in an unsafe or unsound condition to continue operations, or has violated any applicable law, regulation, rule, order or condition imposed by the FDIC.
Federal Reserve System
Federal Reserve regulations require depository institutions to maintain reserves against their transaction accounts (primarily NOW and regular checking accounts). The regulations currently provide that reserves be maintained against aggregate transaction accounts as follows: a 3% reserve ratio is assessed on net transaction accounts up to and including $55.2 million; a 10% reserve ratio is applied above $55.2 million. The first $10.87 million of otherwise reservable balances are exempted from the reserve requirements. These amounts are adjusted annually.
Federal Securities Laws
The shares of First Mariner common stock are registered with the SEC under Section 12(b) of the Securities Exchange Act of 1934, as amended (the "Exchange Act"), and listed on the NASDAQ Global Select Market. First Mariner is subject to information reporting requirements, proxy solicitation requirements, insider trading restrictions, and other requirements of the Exchange Act, including the requirements imposed under the federal Sarbanes-Oxley Act of 2002. Among other things, loans to and other transactions with insiders are subject to restrictions and heightened disclosure, directors and certain committees of the Board must satisfy certain independence requirements, and First Mariner is generally required to comply with certain corporate governance requirements.
Economic Monetary Policies and Economic Controls
We are affected by monetary policies of regulatory agencies, including the FRB, which regulates the national money supply in order to mitigate recessionary and inflationary pressures. Among the techniques available to the FRB are: engaging in open market transactions in U.S. Government securities, changing the discount rate on bank borrowings, changing reserve requirements against bank deposits, prohibiting the payment of interest on demand deposits, and imposing conditions on time and savings deposits. These techniques are used in varying combinations to influence the overall growth of bank loans, investments, and deposits. Their use may also affect interest rates charged on loans or paid on deposits. The effect of governmental policies on our earnings cannot be predicted. However, our earnings will be impacted by movement in interest rates, as discussed in Item 7A of Part II of this Form 10-K.
We are subject to restrictions and conditions of a Cease and Desist Order issued by the FDIC and the Commissioner of the Maryland Division of Financial Regulation (the "Commissioner") ("September Order"), and agreements with the FRB ("FRB Agreement" and "New FRB Agreement") and have incurred and expect to continue to incur significant additional regulatory compliance expense in connection with these enforcement actions.
The FDIC and the Commissioner have issued Cease and Desist Orders against the Bank and the Company has entered into the FRB Agreement and the New FRB Agreement. The September Order contains a number of significant directives, including higher capital requirements, requirements to reduce the level of our classified assets, operating restrictions, and restrictions on dividend payments by
18
the Bank. These restrictions may impede our ability to operate our own business. If we fail to comply with the terms and conditions of the September Order or the New FRB Agreement, the appropriate regulatory authority could take additional enforcement action against us, including the imposition of further operating restrictions and monetary penalties. We could also be directed to seek a merger partner. We have incurred and expect to continue to incur significant additional regulatory compliance expense in connection with the enforcement actions, and we will incur ongoing expenses attributable to compliance with the terms of the enforcement actions. Although we do not expect it, it is possible regulatory compliance expenses related to the enforcement actions could have a material adverse impact on us in the future. In addition, our ability to independently make certain changes to our business is restricted by the terms of the September Order and the New FRB Agreement, which could negatively impact the scope and flexibility of our business activities. While we believe that we will be able to take actions that will result in the September Order and the New FRB Agreement being terminated in the future, we cannot guarantee that such actions will result in the termination of the September Order and/or the New FRB Agreement. Further, the imposition of the September Order and the New FRB Agreement may make it more difficult to attract and retain qualified employees. For more information on the September Order and the New FRB Agreement, see "Capital Resources" in Item 7 of Part II of this Form 10-K.
As of December 31, 2009, the Bank's capital levels were not sufficient to achieve compliance with the higher capital requirements we must meet by June 30, 2010, nor were they, on a consolidated basis, sufficient to satisfy the FRB's minimum capital requirements.
In the September Order, the FDIC and the Commissioner directed the Bank to raise its Tier 1 leverage and total risk-based capital ratios to 6.5% and 10%, respectively, by March 31, 2010 and to 7.5% and 11%, respectively, by June 30, 2010. At December 31, 2009, we did not meet these requirements and would have needed approximately $8.200 million in additional capital, based on assets at such date, to meet both of the March requirements and approximately $15.000 million in additional capital to meet both of the June requirements. First Mariner currently does not have any capital available to invest in the Bank and any further increases to our allowance for loan losses and operating losses would negatively impact our capital levels and make it more difficult to achieve the capital levels directed by the FDIC and the Commissioner. When combined with the assets and liabilities that we are selling or of which we are otherwise disposing, the amount of capital we may raise in any stock offerings (see "Subsequent Events" in Item 7 of Part II of this Form 10-K) may not be sufficient to achieve and maintain compliance with the capital requirements mandated by our regulators. The failure to meet these capital requirements could result in further action by our regulators.
Additionally, on November 24, 2009, First Mariner's primary regulator, the FRB, required the Company to enter into the New FRB Agreement. The New FRB Agreement required the Company to submit a written plan by January 25, 2010 to maintain sufficient capital at the holding company level, such that First Mariner satisfies the FRB's requirements to be considered "adequately capitalized." To be considered adequately capitalized, First Mariner's consolidated Tier 1 capital to average assets, Tier 1 capital to risk-weighted assets and total capital to risk-weighted assets ratios must be at least 4.0%, 4.0% and 8.0%, respectively. As of December 31, 2009, the Company's consolidated capital ratios did not meet the FRB's requirements to be considered "adequately capitalized." If the Company does not satisfy the requirements of an FRB approved written plan, the FRB could take additional enforcement action against us, including the imposition of monetary penalties, as well as further operating restrictions.
19
If the amount of capital we raise in stock offerings and other actions we are taking to reduce assets is insufficient to satisfy capital requirements, we may need to take additional actions to reduce the amounts of our assets and liabilities or we may need to raise additional capital through a share issuance in the future that could dilute your ownership interest.
Should we in the future need to raise additional capital, we might seek to do so through one or more offerings of our common stock, securities convertible into common stock, or rights to acquire such securities of our common stock. Our ability to raise additional capital, if needed, will depend on conditions in the capital markets at that time and on our financial performance. Our stock price has declined in recent periods and was $ 0.95 at December 31, 2009. Moreover, the volatility and disruption in the capital and credit markets have reached unprecedented levels, producing downward pressure on stock prices and credit availability for numerous issuers. If current levels of market disruption and volatility continue or worsen, and if our stock price remains at its current level, we may be unable to raise additional capital, or we may be able to raise capital only at prices that would be unfavorable and dilutive to our shareholders. If we cannot raise additional capital when needed, our results of operations and financial condition may be adversely affected, and our banking regulators may subject the Bank and the Company to further regulatory enforcement action.
The issuance of any additional shares of common stock or convertible securities could be substantially dilutive to shareholders of our common stock, particularly those who are not able to or choose not to participate in such additional issuances. Holders of our shares of common stock have no preemptive rights that entitle them to purchase their pro-rata share of any offering of shares of any class or series and, therefore, our shareholders may not be permitted to invest in future issuances of our common stock and as a result will be diluted. See "Subsequent Events" in Item 7 of Part II of this Form 10-K for additional information on shares of our common stock that may be issued in our current rights offering and that are expected to be issued in the Exchange. (See description of the Exchange in "Subsequent Events" in Item 7 of Part II of this Form 10-K.)
We have taken actions, and may take additional actions, to help us meet immediate needs for capital, including reducing our assets and liabilities.
In December, 2009, we completed the sale of our consumer finance company subsidiary, Mariner Finance, for a purchase price of approximately $10.459 million. We received $8.734 million in cash at closing and a 5% ownership stake in the new Mariner Finance entity. Under terms of the sale, $1.1 million was placed in an escrow account to be paid to First Mariner no later than 18 months after the closing, after deducting any indemnification claims. While this transaction provided First Mariner with $8.734 million in cash to invest in the Bank to increase the Bank's capital, we will realize only 5% of any future income generated by Mariner Finance. During 2009, we realized a net loss of $9.060 million (including the loss on sale of $11.110 million) from the operations of Mariner Finance. For the years ended December 31, 2008 and 2007, we earned $1.721 million and $1.640 million of net income from our investment in Mariner Finance.
We have also identified certain Bank branches that we intend to close or sell in 2010. The successful completion of these actions is expected to reduce overhead costs by approximately $3.0 million and support our strategy of prudently reducing assets and liabilities. Total aggregate deposits in the branches identified for sale and closure are approximately $50.000 million. The Bank has not entered into any agreement to sell any branch office and no guarantee can be made that any such agreement will be entered into and if such agreement is entered into, whether such sale will be consummated. The approval of the FDIC and the Commissioner will also need to be obtained by any acquirer before buying any of our branch offices. While we anticipate that such approvals would be received, there can be no guarantee that such approvals will be received. While these branch sales, if completed, will reduce our assets and liabilities and thereby increase our Bank capital ratios, we expect
20
that our net income in the future will be reduced as a result of the loss of income generated by these branches.
The Company and the Bank are deemed to be in "troubled condition" within the meaning of federal statutes and regulations.
The Company and Bank are deemed to be in "troubled condition" within the meaning of federal statutes and regulations. As a result, certain limitations and regulatory requirements apply to the Company and the Bank with respect to future changes to senior executive management and directors and the payment of, or the agreement to pay, certain severance payments to officers, directors, and employees. The Bank must also comply with specified recordkeeping requirements in connection with transactions involving certain securities contracts, commodities contracts, repurchase agreements, and other "Qualified Financial Contracts."
Liquidity risk could impair our ability to fund operations and jeopardize our financial viability.
Liquidity is essential to our business. An inability to raise funds through deposits, borrowings, the sale of loans, and other sources could have a material adverse effect on our liquidity. Our access to funding sources in amounts adequate to finance our activities could be impaired by factors that affect us specifically or the financial services industry in general. The Federal Home Loan Bank of Atlanta ("FHLB") has reduced our line of credit from $202.21 million to $107.00 million, our outstanding balance as of December 31, 2009. The FRB has also notified the Bank that it will permit the Bank to draw on its line of credit with the Federal Reserve Bank only in limited circumstances and for a short duration. Factors that could further detrimentally impact our access to liquidity sources include a decrease in the level of our business activity due to a market downturn or adverse regulatory action against us. As part of the September Order, we are not allowed to purchase brokered deposits without first obtaining a regulatory waiver. We are also required to comply with restrictions on deposit rates that we may offer. These factors could significantly affect our ability to fund normal operations. Our ability to acquire deposits or borrow could also be impaired by factors that are not specific to us, such as a severe disruption of the financial markets or negative views and expectations about the prospects for the financial services industry as a whole as the recent turmoil faced by banking organizations in the domestic and worldwide credit markets deteriorates. At December 31, 2009, management considered the Bank's liquidity level to be sufficient for the purposes of meeting the Bank's cash flow requirements.
We have elected to defer the payment of interest on $73.724 million in face amount of outstanding trust preferred securities issued by trust subsidiaries of our holding company and expect to continue to defer the payment of interest for the foreseeable future.
Though we have deferred the payment of interest on the subordinated debentures related to the trust preferred securities, we continue to accrue interest expense related to the trust preferred securities. First Mariner recognized interest expense of $3.127 million and $4.640 million on the trust preferred securities during the years ended December 31, 2009 and 2008, respectively.
Under the terms of the subordinated debentures, our deferral of interest payments for up to 20 consecutive quarters does not constitute an event of default. During the deferral period, the deferred interest payments continue to accrue. To the extent applicable law permits interest on interest, the deferred interest payments also accrue interest at the rates specified in the corresponding indentures, compounded quarterly. All of the deferred interest and the compound interest are due in full at the end of the applicable deferral period. If we fail to pay the deferred and compound interest at the end of the deferral period, each trustee of the various trusts, or in most cases the holders of 25% of the outstanding principal amount of any issue of trust preferred securities, would have the right, after any applicable grace period, to declare an event of default. The occurrence of an event of default on the
21
subordinated debentures would entitle the trustees and holders of the trust preferred securities to exercise various remedies, including demanding immediate payment in full of the entire outstanding principal amount of the subordinated debentures.
Currently we have no cash available at First Mariner to resume the payment of interest on the subordinated debentures, and the September Order prohibits our use of the proceeds from any stock offerings for this purpose. Accordingly, our ability to resume the payment of interest on the subordinated debentures will depend on the Bank's ability to generate earnings and pay dividends to First Mariner. In addition, the terms of the September Order currently prohibits the payment of dividends by the Bank without regulatory approval. As a result, if by January 2014 the September Order is not terminated, or if we do not achieve sufficient profitability for the Bank so that our regulators would grant approval for the Bank to pay dividends, we will be unable to resume the payment of interest on the subordinated debentures. Even if the Bank is able to resume paying dividends, we cannot be assured that the amount of dividends would be sufficient to pay the entire amount of interest due under the subordinated debentures at the end of the deferral period.
See "Subsequent Events" in Item 7 of Part II of this Form 10-K for information regarding the subsequent event related to the Trust Preferred Securities.
We have had losses in recent periods.
We incurred a net loss of $22.284 million for the year ended December 31, 2009, including a one-time charge of $11.110 million relating to the sale of Mariner Finance. For the year ended December 31, 2008, we incurred a net loss of $15.088 million. Our earnings in these periods have been hurt by adverse economic conditions, including falling home prices, increasing foreclosures, and increasing unemployment, in our markets, and our losses for the years ended December 31, 2009 and 2008 included $11.660 million and $10.856 million, respectively, of provisions for loan losses. Our ability to return to profitability will depend on whether we are able to reduce credit losses in the future, which will depend, in part, on whether economic conditions in our markets improve. Our management believes that our current business plan will be successful and believes we will be able to limit our losses; however, our business plan is subject to current market conditions and its successful implementation is uncertain. There is no assurance that we will be successful in executing our business plan or that even if we successfully implement our business plan, we will be able to curtail our losses now or in the future. If we continue to incur significant operating losses, our stock price may further decline. Even if we raise enough capital in the current offering (See "Subsequent Events" in Item 7 of Part II of this Form 10-K) to allow us to meet the Bank and consolidated capital levels mandated by our regulators, if we incur further operating losses, we may in the future need to raise additional capital to maintain Bank and consolidated capital levels that meet or exceed the levels mandated by our regulators.
Higher loan losses could require us to increase our allowance for loan losses through a charge to earnings.
When we loan money we incur the risk that our borrowers do not repay their loans. We reserve for loan losses by establishing an allowance through a charge to earnings. The amount of this allowance is based on our assessment of loan losses inherent in our loan portfolio. The process for determining the amount of the allowance is critical to our financial results and condition. It requires subjective and complex judgments about the future, including forecasts of economic or market conditions that might impair the ability of our borrowers to repay their loans. We might underestimate the loan losses inherent in our loan portfolio and have loan losses in excess of the amount reserved. We might increase the allowance because of changing economic conditions. For example, in a rising interest rate environment, borrowers with adjustable-rate loans could see their payments increase. There may be a significant increase in the number of borrowers who are unable or unwilling to repay their loans,
22
resulting in our charging off more loans and increasing our allowance. In addition, when real estate values decline, the potential severity of loss on a real estate-secured loan can increase significantly, especially in the case of loans with high combined loan-to-value ratios. The recent decline in the national economy and the local economies of the areas in which the loans are concentrated could result in an increase in loan delinquencies, foreclosures, or repossessions resulting in increased charge-off amounts and the need for additional loan loss allowances in future periods. In addition, our determination as to the amount of our allowance for loan losses is subject to review by regulatory authorities, as part of their examination process, which may result in the establishment of an additional allowance after a review of the information available at the time of their examination. Our allowance for loan losses amounted to $11.639 million, or 1.31% of total loans outstanding and 17.5% of nonperforming assets ($57.429 million) and loans past-due 90 days or more and accruing ($9.224 million), as of December 31, 2009. Our allowance for loan losses at December 31, 2009 may not be sufficient to cover future loan losses. A large loss could deplete the allowance and require increased provisions to replenish the allowance, which would decrease our earnings. As of December 31, 2009, we had outstanding loan balances exceeding $833.000 million that were performing according to their original terms. However, the deterioration of one or more of these performing loans could result in a significant increase in our nonperforming loans and our provision for loan losses, which would negatively impact our results of operations.
We have a high percentage of commercial real estate and real estate construction loans in relation to our total loans.
At December 31, 2009, we had $339.794 million in loans secured by commercial real estate and $146.869 million in real estate construction loans, which included $47.379 million in residential construction loans and $99.490 million for the construction of commercial properties. Commercial real estate loans and construction loans represented 38.1% and 16.5%, respectively, of our net loan portfolio. While commercial real estate and construction loans are generally more interest rate sensitive and carry higher yields than do residential mortgage loans, these types of loans generally expose a lender to greater risk of nonpayment and loss than single-family residential mortgage loans because repayment of the loans often depends on the successful operation of the property, the income stream of the borrowers, and, for construction loans, the accuracy of the estimate of the property's value at completion of construction and the estimated cost of construction. Such loans typically involve larger loan balances to single borrowers or groups of related borrowers compared to single-family residential mortgage loans.
Current regulatory guidance suggests that institutions whose commercial real estate loans exceed certain percentages of capital should implement heightened risk management practices appropriate to their concentration risk and may be required to maintain higher capital ratios than institutions with lower concentrations in commercial real estate lending. Based on our commercial real estate concentration as of December 31, 2009, we may be subject to further supervisory analysis during future examinations. Although we continuously evaluate our concentration and risk management strategies, we cannot guarantee that any risk management practices we implement will be effective to prevent losses relating to our commercial real estate portfolio. Management cannot predict the extent to which this guidance will impact our operations or capital requirements.
Mortgage banking activities generate a significant portion of our noninterest income.
A significant portion of our business involves originating residential mortgage loans through our mortgage division, which accounted for approximately 57.0% and 54.6% of our noninterest income for the years ended December 31, 2009 and 2008, respectively. Real estate loan origination activity, including refinancing, is generally greater during periods of low or declining interest rates and favorable economic conditions. Continued adverse changes in market conditions could have an adverse impact on our earnings through lower origination volumes.
23
We face interest rate risk on our loans held for sale portfolio.
We are exposed to interest rate risk in both our pipeline of mortgage originations (loans that have yet to close with the borrower) and in our warehouse loans (those loans that have closed with the borrower but have yet to be funded by investors). We have managed this interest rate risk through hedging strategies. We hedge a portion of our mortgage loan pipeline and warehouse utilizing forward sales of mortgage-backed securities. We expect that these derivative financial instruments (forward sales of mortgage-backed securities) will experience changes in fair value opposite to the change in fair value of the derivative loan commitments and our warehouse. However, the process of selling loans and the use of forward sales of mortgage-backed securities to hedge interest rate risk associated with customer interest rate lock commitments involves greater risk than selling loans on an individual basis through best efforts forward delivery commitments. Hedging interest rate risk requires management to estimate the expected "fallout" (rate lock commitments with customers that do not complete the loan process). Additionally, the fair value of the hedge may not correlate precisely with the change in fair value of the rate lock commitments with the customer due to changes in market conditions, such as demand for loan products, or prices paid for differing types of loan products. Variances from management's estimates for customer fallout or market changes making the forward sale of mortgage-backed securities ineffective may result in higher volatility in our profits from selling mortgage loans originated for sale. We engage an experienced third party to assist us in managing our activities in hedging and marketing sales strategy.
We face credit risk related to our residential mortgage production activities.
We face credit risk related to our residential mortgage production activities. Credit risk is the potential for financial loss resulting from the failure of a borrower or an institution to honor its contractual obligations to us. We manage mortgage credit risk principally by selling substantially all of the mortgage loans that we produce, limiting credit recourse to the Bank in those transactions, and by retaining high credit quality mortgages in our loan portfolio. We also limit our risk of loss on mortgage loan sales by establishing limits on activity to any one investor and by entering into contractual relationships with only those financial institutions that are approved by our Secondary Marketing Committee. The period of time between closing on a loan commitment with the borrower and funding by the investor ranges from between 15 and 90 days.
We face risk related to covenants in our loan sales agreements with investors.
Our sales agreements with investors who buy our loans generally contain covenants which may require us to repurchase loans under certain provisions, including delinquencies, or return premiums paid by these investors should the loan be paid off early. Any loans we are required to repurchase may be considered impaired loans, with the potential for charge-offs and/or loss provision charges. The addition of these repurchased loans to our portfolio could adversely affect our earnings and asset quality ratios.
There may be certain loans in our portfolio that were originated for sale, but for various reasons, are unable to be sold. These loans are transferred to our loan portfolio at fair value. Any deterioration in value of the loan during the period held in the portfolio is charged to the allowance.
Declines in asset values may result in impairment charges and adversely impact the value of our investments, financial performance, and capital.
We maintain an investment portfolio that includes, but is not limited to, mortgage-backed securities and pooled trust preferred collateralized debt obligations. The market value of investments may be affected by factors other than the underlying performance of the issuer, such as adverse changes in business climate and lack of liquidity for the resale of certain investment securities. As of
24
December 31, 2009, we had $28.275 million, representing 72.5% of our securities portfolio, classified as available for sale pursuant to Financial Accounting Standards Board ("FASB") guidance. Unrealized gains and losses in the estimated value of the available-for-sale ("AFS") portfolio are "marked to market" and reflected as a separate item in stockholders' equity (net of tax) as accumulated other comprehensive income. The remaining investment securities are classified as trading and are stated at fair value with changes in value reflected in income.
There can be no assurance that future market performance of our securities portfolio will enable us to realize income from sales of securities. Stockholders' equity will continue to reflect the unrealized gains and losses (net of tax) of these securities. There can be no assurance that the market value of our securities portfolio will not decline, causing a corresponding decline in stockholders' equity.
The Bank is a member of the FHLB. A member of the FHLB system is required to purchase stock issued by the relevant FHLB bank based on how much it borrows from the FHLB and the quality of the collateral pledged to secure that borrowing. Included in our investment portfolio as of December 31, 2009 is $7.869 million in capital stock of the FHLB. The FHLB is experiencing a potential capital shortfall, has suspended its quarterly cash dividend, and could possibly require its members, including First Mariner, to make additional capital investments in the FHLB. There can be no guarantee that the FHLB will declare future dividends. In order to avail itself of correspondent banking services offered by the FHLB, we must remain a member of the FHLB. If the FHLB were to cease operations, or if we were required to write-off our investment in the FHLB, our business, financial condition, liquidity, capital, and results of operations may be materially and adversely affected.
We periodically, but not less than quarterly, evaluate investments and other assets for impairment indicators. We may be required to record additional impairment charges if investments suffer a decline in value that is considered other than temporary. If we determine that a significant impairment has occurred, we would be required to charge against earnings the credit-related portion of the other-than-temporary impairment ("OTTI"), which could have a material adverse effect on results of operations in the period in which the write-off occurs. Accounting guidance indicates that an investor in FHLB stock should recognize impairment if it concludes that it is not probable that it will ultimately recover the par value of its shares. The decision of whether impairment exists is a matter of judgment that should reflect the investor's analysis of the FHLB's long-term performance, which includes factors such as its operating performance, the severity and duration of declines in the market value of its net assets related to its capital stock amount, its commitment to make payments required by law or regulation and the level of such payments in relation to its operating performance, the impact of legislation and regulatory changes on the FHLB, and accordingly, on the members of the FHLB and its liquidity and funding position. After evaluating all of these considerations, we believe the par value of our FHLB stock will be recovered, but future evaluations of the above mentioned factors could result in the Bank recognizing an impairment charge.
Management believes that several factors will affect the market values of our securities portfolio. These include, but are not limited to, changes in interest rates or expectations of changes, the degree of volatility in the securities markets, inflation rates or expectations of inflation, and the slope of the interest rate yield curve (the yield curve refers to the differences between shorter-term and longer-term interest rates; a positively sloped yield curve means shorter-term rates are lower than longer-term rates). Also, the passage of time will affect the market values of our investment securities, in that the closer they are to maturing, the closer the market price should be to par value. These and other factors may impact specific categories of the portfolio differently, and management cannot predict the effect these factors may have on any specific category.
25
Negative conditions in the general economy and financial services industry may limit our access to additional funding and adversely impact liquidity.
An inability to raise funds through deposits, borrowings, and other sources could have a substantial negative effect on our liquidity. Our access to funding sources in amounts adequate to finance our activities could be impaired by factors that affect us specifically or the financial services industry in general. Factors that could detrimentally impact our access to liquidity sources include a decrease in the level of our business activity due to a market down turn or adverse regulatory action against it. Our ability to borrow could also be impaired by factors that are nonspecific to us, such as severe disruption of the financial markets or negative news and expectations about the prospects for the financial services industry as a whole as evidenced by recent turmoil in the domestic and worldwide credit markets.
Increased and/or special FDIC assessments will hurt our earnings.
Beginning in late 2008, the economic environment caused higher levels of bank failures, which dramatically increased FDIC resolution costs and led to a significant reduction in the DIF. As a result, the FDIC has significantly increased the initial base assessment rates paid by financial institutions for deposit insurance. The base assessment rate was increased by seven basis points (7 cents for every $100 of deposits) for the first quarter of 2009. The FDIC made further refinements to its risk-based assessment that were effective April 1, 2009 and that effectively made the range seven to 77.5 basis points. These increases in the base assessment rate have increased our deposit insurance costs and negatively impacted our earnings. In addition, in May 2009, the FDIC imposed a special assessment on all insured institutions due to recent bank and savings association failures. The emergency assessment amounted to 5 basis points on each institution's assets minus Tier one (core) capital as of June 30, 2009, subject to a maximum equal to 10 basis points times the institution's assessment base. Our special assessment, which was reflected in earnings for the quarter ended June 30, 2009, was $638,000. The FDIC may impose additional emergency special assessments if necessary to maintain public confidence in federal deposit insurance or as a result of deterioration in the deposit insurance fund reserve ratio due to institution failures. Any additional emergency special assessment imposed by the FDIC will negatively impact our earnings.
On November 12, 2009, the FDIC adopted a final rule requiring that all institutions prepay their assessments for the fourth quarter of 2009 and all of 2010, 2011, and 2012. This prepayment was due on December 30, 2009. However, the FDIC may exempt certain institutions from the prepayment requirement if the FDIC determines that the prepayment would adversely affect the safety and soundness of the institution. We have been granted an exemption to this prepayment requirement.
Our ability to pay cash dividends is limited.
Holders of shares of our common stock are entitled to dividends if declared by our board of directors out of funds legally available for that purpose. In general, future dividend policy is subject to the discretion of the board of directors and will depend upon our future earnings, capital requirements, regulatory constraints, and our financial condition, as well as that of the Bank.
Although the board of directors has declared cash dividends in the past, it has discontinued such payments to conserve cash and capital resources and does not intend to declare cash dividends until current earnings are sufficient to generate adequate internal capital to support growth. Our current ability to pay dividends is largely dependent upon the receipt of dividends from the Bank. Both federal and state laws impose restrictions on the ability of the Bank to pay dividends. Federal law prohibits the payment of a dividend by an insured depository institution if the depository institution is considered "undercapitalized" or if the payment of the dividend would make the institution "undercapitalized." For a Maryland commercial bank, dividends may be paid out of undivided profits or, with the prior approval of the Maryland Commissioner, from surplus in excess of 100% of required capital stock. If,
26
however, the surplus of a Maryland bank is less than 100% of its required capital stock, then cash dividends may not be paid in excess of 90% of net earnings.
Our ability to pay dividends is further subject to our ability to make payments of interest under junior subordinated debentures due through 2035 held by our statutory trusts Mariner Capital Trust II, III, IV, V, VI, VII, and VIII (collectively, the "Trusts"). These payments are necessary to fund the distributions that the Trusts each must pay to holders of its trust preferred securities (collectively, the "Trust Preferred Securities"). The terms of debentures permit us to defer interest payments for up to 20 quarterly periods. We have elected to defer interest payments on the debentures, beginning with the January 2009 payments. This deferment is permitted by the terms of the debentures and does not constitute an event of default thereunder. Interest on the debentures and dividends on the related Trust Preferred Securities continue to accrue and will have to be paid in full prior to the expiration of the deferral period, which may not exceed 20 consecutive quarters, and prior to the declaration of any dividends.
Finally, First Mariner and the Bank have entered into regulatory agreements with our regulators which, among other things, require us to seek prior regulatory approval before the Bank pays dividends to First Mariner and/or before First Mariner pays dividends on its common stock.
Our funding sources may prove insufficient to replace deposits and support our future growth.
We rely on customer deposits, advances from the FHLB, and lines of credit at other financial institutions to fund our operations. Although we have historically been able to replace maturing deposits and advances if desired, no assurance can be given that we would be able to replace such funds in the future if our financial condition or the financial condition of the FHLB or market conditions were to change. Our financial flexibility will be severely constrained and/or our cost of funds will increase if we are unable to maintain our access to funding or if financing necessary to accommodate future growth is not available at favorable interest rates. Finally, if we are required to rely more heavily on more expensive funding sources to support future growth, our revenues may not increase proportionately to cover our costs. In this case, our profitability would be adversely affected.
We currently hold a significant amount of bank owned life insurance.
We currently hold a significant amount of bank owned life insurance ("BOLI") on key employees and executives that have cash surrender values of $34.773 million as of December 31, 2009. The eventual repayment of the cash surrender value is subject to the ability of various insurance companies to pay benefits in the event of the death of an insured employee, or return the cash surrender value to us in the event of our need for liquidity. We continuously monitor the financial strength of the various insurance companies with whom we carry policies. However, there is no assurance that one or more of these companies will not experience a decline in financial strength, which could impair its ability to pay benefits or return our cash surrender value. Additionally, should we need to liquidate these policies for liquidity needs, we would be subject to taxation on the increase in cash surrender value as well as penalties for early termination of the insurance contracts. These events would have a negative impact on our earnings.
Fluctuating interest rates can adversely affect our profitability.
Our profitability is dependent to a large extent upon net interest income, which is the difference, or spread, between the interest earned on loans, securities, and other interest-earning assets and the interest paid on deposits, borrowings, and other interest-bearing liabilities. Because of the differences in maturities and repricing characteristics of our interest-earning assets and interest-bearing liabilities, changes in interest rates do not produce equivalent changes in interest income earned on interest-earning assets and interest paid on interest-bearing liabilities. We principally manage interest
27
rate risk by managing our volume and mix of our earning assets and funding liabilities. In a rapidly changing interest rate environment, we may not be able to manage this risk effectively. Changes in interest rates also can affect: (1) our ability to originate and/or sell loans; (2) the value of our interest-earning assets, which would negatively impact shareholders' equity, and our ability to realize gains from the sale of such assets; (3) our ability to obtain and retain deposits in competition with other available investment alternatives; and (4) the ability of our borrowers to repay adjustable or variable rate loans. Interest rates are highly sensitive to many factors, including government monetary policies, domestic and international economic and political conditions, and other factors beyond our control. If we are unable to manage interest rate risk effectively, our business, financial condition, and results of operations could be materially adversely affected.
We operate in a highly regulated environment and may be adversely affected by changes in federal and state laws and regulations, including changes that may restrict our ability to foreclose on single-family home loans and offer overdraft protection.
We are subject to extensive regulation, supervision, and examination by federal and state banking authorities. Any change in applicable regulations or laws could have a substantial impact on us and our operations. Additional legislation and regulations that could significantly affect our powers, authority, and operations may be enacted or adopted in the future, which could have a material adverse effect on our financial condition and results of operations. New legislation proposed by Congress may give bankruptcy courts the power to reduce the increasing number of home foreclosures by giving bankruptcy judges the authority to restructure mortgages and reduce a borrower's payments. Property owners would be allowed to keep their property while working out their debts. Other similar bills placing additional temporary moratoriums on foreclosure sales or otherwise modifying foreclosure procedures to the benefit of borrowers and the detriment of lenders may be enacted by either Congress or the State of Maryland in the future. These laws may further restrict our collection efforts on one-to-four single-family mortgage loans. Additional legislation proposed or under consideration in Congress would give current debit and credit card holders the chance to opt out of an overdraft protection program and limit overdraft fees, which could result in additional operational costs and a reduction in our noninterest income.
Further, our regulators have significant discretion and authority to prevent or remedy unsafe or unsound practices or violations of laws by financial institutions and holding companies in the performance of their supervisory and enforcement duties. In this regard, banking regulators are considering additional regulations governing compensation, which may adversely affect our ability to attract and retain employees. On June 17, 2009, the Obama Administration published a comprehensive regulatory reform plan that is intended to modernize and protect the integrity of the United States financial system. The President's plan contains several elements that would have a direct effect on the Company and the Bank. The reform plan proposes the creation of a new federal agency, the Consumer Financial Protection Agency, which would be dedicated to protecting consumers in the financial products and services market. The creation of this agency could result in new regulatory requirements and raise the cost of regulatory compliance. In addition, legislation stemming from the reform plan could require changes in regulatory capital requirements and compensation practices. If implemented, the foregoing regulatory reforms may have a material impact on our operations. However, because the final legislation may differ significantly from the legislation proposed by the Administration, we cannot determine the specific impact of regulatory reform at this time.
We face significant operational risks.
We operate in many different businesses in diverse markets and rely on the ability of our employees and systems to process a high number of transactions. Operational risk is the risk of loss resulting from our operations, including, but not limited to, the risk of fraud by employees or persons
28
outside of the Company and the Bank, the execution of unauthorized transactions by employees, errors relating to transaction processing and technology, and catastrophic failures resulting from terrorist acts or natural disasters, breaches of the internal control system, and compliance requirements and business continuation and disaster recovery. This risk of loss also includes the potential legal actions that could arise as a result of an operational deficiency or as a result of noncompliance with applicable regulatory standards, adverse business decisions or their implementation, and customer attrition due to potential negative publicity. We maintain a system of internal controls to mitigate against such occurrences and maintain insurance coverage for such risks that are insurable, but should such an event occur that results in a breakdown in the internal control system, improper operation of systems, or improper employee actions, we could suffer financial loss, face regulatory action, and suffer damage to our reputation.
Additionally, the financial services industry is continually undergoing rapid technological change with frequent introductions of new technology-driven products and services. The effective use of technology increases efficiency and enables financial institutions to better serve customers and to reduce costs. Our future success depends, in part, upon our ability to address the needs of our customers by using technology to provide products and services that will satisfy customer demands, as well as to create additional efficiencies in our operations. Many of our competitors have substantially greater resources to invest in technological improvements. We may not be able to effectively implement new technology-driven products and services or be successful in marketing these products and services to our customers. Failure to successfully keep pace with technological change affecting the financial services industry could have a material adverse impact on our business and, in turn, our financial condition and results of operations.
Severe weather, natural disasters, acts of war or terrorism, and other adverse external events could have a significant impact on our ability to conduct business. Such events could affect the stability of our deposit base, impair the ability of borrowers to repay outstanding loans, impair the value of collateral securing loans, cause significant property damage, result in loss of revenue, and/or cause us to incur additional expenses. Operations in several of our markets could be disrupted by both the evacuation of large portions of the population as well as damage and/or lack of access to our banking and operation facilities. Although we have not experienced such an occurrence to date, severe weather or natural disasters, acts of war or terrorism, or other adverse external events may occur in the future. Although management has established disaster recovery policies and procedures, the occurrence of any such event could have a material adverse effect on our business, which, in turn, could have a material adverse effect on our financial condition and results of operations.
Our management controls a significant percentage of our common stock.
At December 31, 2009, our directors and executive officers beneficially owned approximately 1,844,780 shares of our common stock (amount includes shares that could be acquired pursuant to immediately exercisable stock options), or 26.0% of our outstanding shares of common stock plus exercisable options. Edwin F. Hale, Sr., who is our Chairman, Chief Executive Officer, and largest stockholder, beneficially owns 1,451,483 shares of common stock, including exercisable options to purchase common stock, or 20.4% of our outstanding shares of common stock, including exercisable options to purchase common stock as of December 31, 2009. Because of the large percentage of stock held by our directors and executive officers, these persons could influence the outcome of any matter submitted to a vote of our shareholders.
See "Subsequent Events" in Item 7 of Part II of this Form 10-K for additional information on shares of all common stock that are expected to be issued in the Exchange.
29
Contracts with our officers may discourage a takeover or adversely affect our takeover value.
We have entered into change in control agreements with four of our officers. These agreements provide for a payment to each officer of a multiple (ranging from 1 to 2.99) of his or her salary and bonus upon the occurrence of either a change in control that results in the loss of employment or a significant change in his or her employment. Thus, we may be required to make significant payments in the event that the rights under these agreements are triggered by a change in control. As a result, these contracts may discourage a takeover, or adversely affect the consideration payable to stockholders in the event of a takeover. Notwithstanding the foregoing, because the Company and the bank are considered to be in "troubled condition" for regulatory purposes, payments made under any change of control agreement are subject to certain regulatory restrictions and limitations. The Company and the Bank must apply for and receive the approval of the FRB and the FDIC, respectively, in order to make payments under these agreements. See "The Company and the Bank are deemed to be in troubled condition" above.
Our Articles and Bylaws and Maryland law may discourage a corporate takeover.
Our Articles and Amended and Restated Bylaws ("Bylaws") contain certain provisions designed to enhance the ability of the board of directors to deal with attempts to acquire control of the Company. These provisions provide for the classification of our board of directors into three classes; directors of each class serve for staggered three year periods. The Articles also provide for supermajority voting provisions for the approval of certain business combinations.
Maryland law also contains anti-takeover provisions that apply to us. The Maryland Business Combination Act generally prohibits, subject to certain limited exceptions, corporations from being involved in any "business combination" (defined as a variety of transactions, including a merger, consolidation, share exchange, asset transfer, or issuance or reclassification of equity securities) with any "interested shareholder" for a period of five years following the most recent date on which the interested shareholder became an interested shareholder. An interested shareholder is defined generally as a person who is the beneficial owner of 10% or more of the voting power of the outstanding voting stock of the corporation after the date on which the corporation had 100 or more beneficial owners of its stock or who is an affiliate or associate of the corporation and was the beneficial owner, directly or indirectly, of 10% or more of the voting power of the then outstanding stock of the corporation at any time within the two-year period immediately prior to the date in question and after the date on which the corporation had 100 or more beneficial owners of its stock. The Maryland Control Share Acquisition Act applies to acquisitions of "control shares," which, subject to certain exceptions, are shares the acquisition of which entitle the holder, directly or indirectly, to exercise or direct the exercise of the voting power of shares of stock of the corporation in the election of directors within any of the following ranges of voting power: one-tenth or more, but less than one-third of all voting power; one-third or more, but less than a majority of all voting power or a majority or more of all voting power. Control shares have limited voting rights.
Although these provisions do not preclude a takeover, they may have the effect of discouraging a future takeover attempt which would not be approved by our board of directors, but pursuant to which stockholders might receive a substantial premium for their shares over then-current market prices. As a result, stockholders who might desire to participate in such a transaction might not have the opportunity to do so. Such provisions will also render the removal of our board of directors and of management more difficult and, therefore, may serve to perpetuate current management. Further, such provisions could potentially adversely affect the market price of our common stock.
30
A continuation of recent turmoil in the financial markets could have an adverse effect on our financial position or results of operations.
Beginning in 2008, United States and global financial markets have experienced severe disruption and volatility, and general economic conditions have declined significantly. Adverse developments in credit quality, asset values, and revenue opportunities throughout the financial services industry, as well as general uncertainty regarding the economic, industry, and regulatory environment, have had a marked negative impact on the industry. Dramatic declines in the U.S. housing market over the past two years, with falling home prices, increasing foreclosures, and increasing unemployment, have negatively affected the credit performance of mortgage loans and resulted in significant write-downs of asset values by many financial institutions. The United States and the governments of other countries have taken steps to try to stabilize the financial system, including investing in financial institutions, and have also been working to design and implement programs to improve general economic conditions. Notwithstanding the actions of the United States and other governments, these efforts may not succeed in restoring industry, economic, or market conditions and may result in adverse unintended consequences. Factors that could continue to pressure financial services companies, including First Mariner, are numerous and include (i) worsening credit quality, leading among other things to increases in loan losses and reserves, (ii) continued or worsening disruption and volatility in financial markets, leading among other things to continuing reductions in asset values, (iii) capital and liquidity concerns regarding financial institutions generally, (iv) limitations resulting from or imposed in connection with governmental actions intended to stabilize or provide additional regulation of the financial system, or (v) recessionary conditions that are deeper or last longer than currently anticipated.
Our financial condition and results of operations are dependant on the economy in the Bank's market area.
First Mariner Bank's primary market area for its core banking operations consists of central Maryland and portions of Maryland's eastern shore. Because of the Bank's concentration of business activities in its market area, our financial condition and results of operations depend upon economic conditions in the Bank's market area. Adverse economic conditions in our market area could reduce our growth rate, affect the ability of our customers to repay their loans and generally affect our financial condition and results of operations. Conditions such as inflation, recession, unemployment, high interest rates, short money supply, scarce natural resources, international disorders, terrorism, and other factors beyond our control may adversely affect our profitability. We are less able than a larger institution to spread the risks of unfavorable local economic conditions across a large number of diversified economies. Any sustained period of increased payment delinquencies, foreclosures, or losses caused by adverse market or economic conditions in the State of Maryland could adversely affect the value of our assets, revenues, results of operations, and financial condition. Moreover, we cannot give any assurance we will benefit from any market growth or favorable economic conditions in our primary market areas if they do occur.
We currently have a significant amount of deferred tax assets.
We had $28.214 million of deferred tax assets as of December 31, 2009. The analysis of the realization of deferred tax assets requires making various forecasts and assumptions, including future flows of taxable income. Actual results may differ from forecasts and assumptions, which could cause a write-down of our deferred tax assets and have a negative impact on our financial condition and results of operations.
31
We could, as a result of a stock offering or future trading activity in our common stock, experience an "ownership change" for tax purposes that could cause us to permanently lose a portion of our U.S. federal deferred tax assets.
The completion of any stock offering could cause us to experience an "ownership change" as defined for U.S. federal income tax purposes. Even if these transactions do not cause us to experience an "ownership change," these transactions materially increase the risk that we could experience an "ownership change" in the future. As a result, issuances or sales of common stock or other securities in the future (including common stock issued in the stock offering), or certain other direct or indirect changes in ownership, could result in an "ownership change" under Section 382 of the Internal Revenue Code of 1986, as amended. In the event an "ownership change" were to occur, we could realize a permanent loss or a portion of our U.S. federal deferred tax assets as a result of limitations on certain built-in losses that have not been recognized for tax purposes, including, for example, losses on existing nonperforming assets. The amount of the permanent loss would depend on the size of the annual limitation (which is in part a function of our market capitalization at the time of an ownership change) and the applicable carryforward period (U.S. federal net operating losses generally may be carried forward for a period of 20 years). Any permanent loss could have a material adverse effect on our results of operations and financial condition.
We have not established a valuation allowance against our U.S. federal deferred tax assets of December 31, 2009, as we believed, based on our analysis as of that date, that it was more likely than not that all of these assets would be realized. Section 382 of the Internal Revenue Code imposes restrictions on the use of a corporation's net operating losses, certain recognized built-in losses, and other carryovers after an "ownership change" occurs. An "ownership change" is generally a greater than 50 percentage point increase by certain "5% shareholders" during the testing period, which is generally the three year-period ending on the transaction date. Upon an "ownership change," a corporation generally is subject to an annual limitation on its prechange losses and certain recognized built-in losses equal to the value of the corporation's market capitalization immediately before the "ownership change" multiplied by the long-term tax-exempt rate (subject to certain adjustments). The annual limitation is increased each year to the extent that there is an unused limitation in a prior year. Since U.S. federal net operating losses generally may be carried forward for up to 20 years, the annual limitation also effectively provides a cap on the cumulative amount of prechange losses and certain recognized built-in losses that may be utilized. Prechange losses and certain recognized built-in losses in excess of the cap are effectively lost.
The relevant calculations under Section 382 of the Internal Revenue Code are technical and highly complex. Any stock offering, combined with other ownership changes, could cause First Mariner to experience an "ownership change." If an "ownership change" were to occur, we believe it could permanently lose the ability to realize a portion of its deferred tax asset, resulting in reduction to total shareholders' equity. This could also decrease the Bank's regulatory capital. We do not believe, however, that any such decrease in regulatory capital would be material because, among other things, only a small portion of the federal deferred tax asset is currently included in the Bank's regulatory capital.
Although publicly traded, our common stock has substantially less liquidity than the average liquidity of stocks listed on the NASDAQ Global Market.
Although our common stock is listed for trading on the Nasdaq Global Market our common stock has substantially less liquidity than the average liquidity for companies listed on the Nasdaq Global Market. A public trading market having the desired characteristics of depth, liquidity, and orderliness depends on the presence in the marketplace of willing buyers and sellers of our common stock at any given time. This marketplace depends on the individual decisions of investors and general economic and market conditions over which we have no control. This limited market may affect your ability to
32
sell your shares on short notice and the sale of a large number of shares at one time could temporarily depress the market price of our common stock. For these reasons, our common stock should not be viewed as a short-term investment.
The market price of our common stock may fluctuate in the future and this volatility may be unrelated to our performance. General market price declines or overall market swings in the future could adversely affect the price of our common stock and the current market price may not be indicative of future market prices.
If we are unable to satisfy the continued listing standards of NASDAQ, our stock may be delisted from the NASDAQ Stock Market, which could adversely affect its market price and liquidity.
We are required to meet NASDAQ's continued listing requirements in order to remain listed on The NASDAQ Stock Market. We are listed on The NASDAQ Global Market. On December 10, 2009, the Company received a letter from The NASDAQ Stock Market providing notice that, for 30 consecutive business days, the Company's common stock had not maintained a minimum market value of publicly held shares ("MVPHS") of $5 million as required for continued inclusion on The NASDAQ Global Market by Listing Rule 5450(b)(1)(c). For NASDAQ purposes, MVPHS is the market value of the Company's publicly held shares, which is calculated by subtracting all shares held by officers, directors or beneficial owners of 10% or more of the total shares outstanding. NASDAQ provided the Company until March 10, 2010 to regain compliance with Listing Rule 5450(b)(1)(c). Also on December 10, 2009, the Company received a letter from The NASDAQ Stock Market providing notice that, for 30 consecutive business days, the Company's common stock had not maintained a minimum bid price of $1.00 per share as required for continued inclusion on The NASDAQ Global Market by Listing Rule 5450(a)(1). NASDAQ provided the until June 8, 2010 to regain compliance with Listing Rule 5450(a)(1). On February 3, 2010, the NASDAQ provided us with a letter that our common stock had regained compliance with these Listing Rules and both matters were now closed.
In the future, if our common stock were unable to satisfy The NASDAQ Stock Market's listing standards and we were not able to regain compliance with the listing standards, our stock could be delisted from The NASDAQ Stock Market. If our common stock is delisted, it could be more difficult to buy or sell our common stock and to obtain accurate quotations, and the price of our stock could suffer a material decline. Delisting may also impair our ability to raise capital. Furthermore, if our common stock is delisted, we would apply to have our common stock quoted on the OTC Bulletin Board, and our common stock would become subject to the SEC's penny stock regulations. A penny stock, as defined by the Penny Stock Reform Act, is any equity security not traded on a national securities exchange that has a market price of less than $5.00 per share. The penny stock regulations generally require that a disclosure schedule explaining the penny stock market and the risks associated therewith be delivered to purchasers of penny stocks and impose various sales practice requirements on broker-dealers who sell penny stocks to persons other than established customers and accredited investors. The broker-dealer must make a suitability determination for each purchaser and receive the purchaser's written agreement prior to the sale. In addition, the broker-dealer must make certain mandated disclosures, including the actual sale or purchase price and actual bid offer quotations, as well as the compensation to be received by the broker-dealer and certain associated persons. The regulations applicable to penny stocks may severely affect the market liquidity for our common stock and could limit your ability to sell your securities in the secondary market.
We lease our executive offices located at 1501 South Clinton Street, Baltimore, Maryland. This location also houses our headquarters branch office. We occupy approximately 84,000 square feet at this location, which is adjacent to our former headquarters building.
33
We own our former headquarters branch office (now a satellite office) located at 3301 Boston Street, Baltimore, Maryland. This location houses drive-up banking and customer parking facilities, as well as other administration offices.
We operate retail bank branches at the following locations:*
Maryland: Annapolis (2) 161 A Jennifer Road Annapolis, MD 21401 Arbutus (2) 3720 Washington Blvd., Suite 100 Baltimore, MD 21227 Bel Air (3) 12 A Bel Air South Parkway Bel Air, MD 21015 Canton Drive-Thru (1) (4) 3301 Boston Street Baltimore, MD 21224 Canton Tower/Headquarters (2) 1501 South Clinton Street Baltimore, MD 21224 Carroll Island (2) 176 Carroll Island Road Baltimore, MD 21220 Cockeysville (3) 9840 York Road Cockeysville, MD 21030 Columbia (2) 8835 Centre Park Drive, Suite 100 Columbia, MD 21045 Downtown Baltimore (2)(5) 300 N. Charles Street Baltimore, MD 21201 |
Dundalk (2) 7860 Wise Avenue Baltimore, MD 21222 Easton (1) 8662 Alicia Drive Easton, MD 21601 Ellicott City (3) 10065 Baltimore National Pike Ellicott City, MD 21042 Glen Burnie (3) 305 South Crain Highway Glen Burnie, MD 21061 Hickory (3) 1403 Conowingo Road Belair, MD 21014 Loch Raven (1) 1641 East Joppa Road Baltimore, MD 21286 Lutherville/Timonium (2) 1738 York Road Lutherville, MD 21093 Odenton (1) 1600 Annapolis Road Odenton, MD 21113 Owings Mills (1) 4800 Painters Mill Road Owings Mills, MD 21117 |
Perry Hall (1) 8843 Bel Air Road Perry Hall, MD 21236 Pikesville (1) 1013 Reisterstown Road Baltimore, MD 21208 Pikesville Drive-Thru (2)(4) 1100 Reisterstown Road Baltimore, MD 21208 Severna Park (2) 366A Gov Ritchie Highway Severna Park, MD 21146 Westminster (1) 1010 Baltimore Boulevard Westminster, MD 21157 White Marsh (1) 10101 Philadelphia Road White Marsh, MD 21237 Woodlawn (3) 7007 Security Boulveard Baltimore, MD 21244 Pennsylvania: Shrewsbury (2)(6) Market Square Shopping Center 549 South Main Street Shrewsbury, PA 17361 |
- *
- For our branch hours and remote ATM locations, please refer to our website at www.1stmarinerbank.com.
- (1)
- Company owns branch
- (2)
- Company leases branch
- (3)
- Company owns branch, but leases related land
- (4)
- Office is a satellite branch
- (5)
- Branch closed in February, 2010
- (6)
- Branch to be closed during the second quarter of 2010
For more information on our lease commitments and costs see Note 6 of the Notes to Consolidated Financial Statements, included in Item 8 of Part II of this Form 10-K.
34
We operate mortgage offices at the following locations:
Maryland: Annapolis (2) 2661 Riva Road Annapolis, MD 21401 Canton/Former Headquarters (1) 3301 Boston Street Baltimore, MD 21224 Eldersburg (2) 10065 Baltimore National Pike Ellicott City, MD 21042 Ellicott City (3) 10065 Baltimore National Pike Ellicott City, MD 21042 Rockville (2) 15722 Crabbs Branch Way Rockville, MD 20855 |
Severna Park (2) 838 Ritchie Highway Severna Park, MD 21146 Waldorf (2) 3200 Crain Hwy, Units 102 & 103 Waldorf, MD 20603 White Marsh (1) 10101 Philadelphia Road White Marsh, MD 21237 North Carolina: VA Mortgage (2) 203 Wolf Creek Professional Center Havelock, NC 28532 |
Delaware: Bethany Beach (2) 35550 Marketplace Unit 3 Bethany Beach, DE 19930 Seaford (2) 604 North Porter Street Seaford, DE 19973 Virginia: Ashburn (2) 44081 Pipeline Plaza Ste 215 Ashburn, VA 20147 |
- (1)
- Company owns office
- (2)
- Company leases office
- (3)
- Company owns office, but leases related land
The Bank's branches range in total size from 2,000 to 4,000 square feet and mortgage offices generally range in size from 1,200 to 2,000 square feet. We believe that all of our locations are suitable and adequate to conduct business and support growth in customer and transaction volume.
We are party to certain legal actions that are routine and incidental to our business. In management's opinion, the outcome of these matters, individually or in the aggregate, will not have a material effect on our results of operations or financial position.
35
ITEM 5 MARKET FOR THE REGISTRANT'S COMMON EQUITY, RELATED STOCKHOLDER MATTERS AND ISSUER PURCHASES OF EQUITY SECURITIES
Market for Common Stock
First Mariner's common stock trades on The NASDAQ Global Market under the symbol "FMAR." Currently, there are approximately 2,900 holders of First Mariner common stock. The table below sets forth for the periods indicated the low and high market prices of the common stock as reported on The NASDAQ Global Market. On March 19, 2010, the closing sales price of First Mariner common stock was $1.24 per share.
| |
Low | High | ||||||
|---|---|---|---|---|---|---|---|---|
2009 Quarter ended: |
||||||||
Fourth quarter |
$ | 0.55 | $ | 1.36 | ||||
Third quarter |
1.10 | 2.20 | ||||||
Second quarter |
0.65 | 4.50 | ||||||
First quarter |
0.50 | 1.30 | ||||||
2008 Quarter ended: |
||||||||
Fourth quarter |
$ | 0.50 | $ | 2.50 | ||||
Third quarter |
0.22 | 3.95 | ||||||
Second quarter |
3.11 | 5.99 | ||||||
First quarter |
5.06 | 8.05 | ||||||
We do not pay cash dividends on our shares of common stock. Currently, we have no plans to resume the payment of cash dividends on our common stock. For a discussion of the limitations on First Mariner's ability to pay dividends, see Item 1 of Part I of this Form 10-K under the heading "Supervision and Regulation."
Equity Compensation Plan Information
The following table sets forth the securities authorized for issuance under the Company's equity compensation plans as of December 31, 2009:
Plan category
|
(A) Number of securities to be issued upon exercise of outstanding options, warrants and rights |
(B) Weighted-average exercise price of outstanding options, warrants and rights |
(C) Number of securities remaining available for future issuance under equity compensation plans (excluding securities reflected in column (A)) |
|||||||
|---|---|---|---|---|---|---|---|---|---|---|
Equity compensation plans approved by security holders |
668,593 | $ | 12.20 | 300,107 | ||||||
Equity compensation plans not approved by security holders |
— | — | — | |||||||
Total |
668,593 | $ | 12.20 | 300,107 | ||||||
See "Subsequent Events" in Item 7 of Part II of this Form 10-K for modifications to our Long-Term Incentive Plan.
36
Issuer Purchases of Equity Securities
None.
Performance Graph
The following graph compares the performance of the Company's Common Stock, with the performance of a broad market index and a nationally-recognized industry standard assuming in each case both an initial $100 investment on December 31, 2004 and reinvestment of dividends as of the end of the Company's last five fiscal years. The Company has selected the Nasdaq Market Index as the relevant broad market index because prices for the Company's Common Stock are quoted on Nasdaq National Market. Additionally, the Company has selected the Nasdaq Bank Index as the relevant industry standard because such index consists of financial institutions which the Company believes generally possess assets, liabilities, and operations more similar to the Company than other publicly-available indices. However, given the short history of the Company's operations and its rapid growth, the Company believes no truly appropriate comparative index exists.
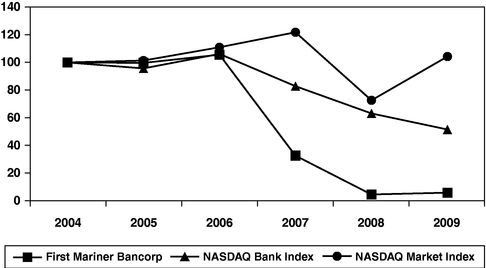
| |
Period Ending | ||||||||||||||||||
|---|---|---|---|---|---|---|---|---|---|---|---|---|---|---|---|---|---|---|---|
| |
12/31/2004 | 12/31/2005 | 12/31/2006 | 12/31/2007 | 12/31/2008 | 12/31/2009 | |||||||||||||
First Mariner Bancorp |
$ | 100 | $ | 99.66 | $ | 105.64 | $ | 32.29 | $ | 4.10 | $ | 5.41 | |||||||
NASDAQ Bank Index |
100 | 95.67 | 106.20 | 82.76 | 62.96 | 51.31 | |||||||||||||
NASDAQ Market Index |
100 | 101.37 | 111.03 | 121.92 | 72.49 | 104.31 | |||||||||||||
37
ITEM 6 SELECTED FINANCIAL DATA
| |
2009 | 2008 | 2007 | 2006 | 2005 | ||||||||||||
|---|---|---|---|---|---|---|---|---|---|---|---|---|---|---|---|---|---|
| |
(dollars in thousands, except per share data) |
||||||||||||||||
Consolidated Statement of Operations Data: |
|||||||||||||||||
Net interest income |
$ | 27,112 | $ | 28,440 | $ | 32,195 | $ | 38,502 | $ | 39,261 | |||||||
Provision for loan losses |
11,660 | 10,856 | 6,700 | 150 | 1,575 | ||||||||||||
Noninterest income |
28,271 | 17,227 | 20,757 | 20,706 | 20,488 | ||||||||||||
Noninterest expense |
67,834 | 65,252 | 67,297 | 59,874 | 48,637 | ||||||||||||
Income tax (benefit) expense before discontinued operations |
(10,887 | ) | (13,632 | ) | (9,342 | ) | (1,282 | ) | 2,681 | ||||||||
(Loss) income from discontinued operations (1) |
(9,060 | ) | 1,721 | 1,640 | 1,458 | 966 | |||||||||||
Net (loss) income |
(22,284 | ) | (15,088 | ) | (10,063 | ) | 1,924 | 7,822 | |||||||||
Consolidated Statement of Financial Condition Data: |
|||||||||||||||||
Total assets |
$ | 1,384,551 | $ | 1,307,497 | $ | 1,246,822 | $ | 1,263,290 | $ | 1,362,478 | |||||||
Loans receivable, net |
879,312 | 961,919 | 842,131 | 854,060 | 839,843 | ||||||||||||
Deposits |
1,146,504 | 950,233 | 904,953 | 924,938 | 876,010 | ||||||||||||
Long-term borrowings |
95,672 | 177,868 | 155,130 | 132,557 | 131,000 | ||||||||||||
Junior subordinated deferrable interest debentures |
73,724 | 73,724 | 73,724 | 73,724 | 73,724 | ||||||||||||
Stockholders' equity |
26,987 | 46,015 | 64,570 | 78,629 | 72,375 | ||||||||||||
Per Share Data: |
|||||||||||||||||
Number of shares of common stock outstanding at year end |
6,452,631 | 6,452,631 | 6,351,611 | 6,427,725 | 6,262,442 | ||||||||||||
Net (loss) income per common share: |
|||||||||||||||||
Basic |
$ | (3.45 | ) | $ | (2.36 | ) | $ | (1.57 | ) | $ | 0.30 | $ | 1.28 | ||||
Diluted |
(3.45 | ) | (2.36 | ) | (1.57 | ) | 0.29 | 1.20 | |||||||||
Cash dividends declared |
— | — | — | — | — | ||||||||||||
Performance and Capital Ratios: |
|||||||||||||||||
Return on average assets |
(1.69 | )% | (1.16 | )% | (0.79 | )% | 0.14 | % | 0.59 | % | |||||||
Return on average equity |
(53.81 | )% | (24.37 | )% | (13.83 | )% | 2.53 | % | 11.44 | % | |||||||
Net interest margin |
2.43 | % | 2.74 | % | 3.12 | % | 3.22 | % | 3.30 | % | |||||||
Average equity to average assets |
3.15 | % | 4.78 | % | 5.75 | % | 5.50 | % | 5.09 | % | |||||||
Year-end Tier 1 leverage ratio (Bank) |
6.2 | % | 5.8 | % | 7.1 | % | 7.3 | % | 6.8 | % | |||||||
Tier 1 capital to risk-weighted assets (Bank) |
7.9 | % | 6.8 | % | 8.6 | % | 9.6 | % | 9.0 | % | |||||||
Total capital to risk-weighted assets (Bank) |
9.1 | % | 8.8 | % | 10.4 | % | 11.7 | % | 10.7 | % | |||||||
Asset Quality Ratios: |
|||||||||||||||||
Nonperforming assets to total assets |
4.15 | % | 4.42 | % | 3.48 | % | 0.52 | % | 0.29 | % | |||||||
Allowance for loan losses at year-end to: |
|||||||||||||||||
Total loans, net of unearned income |
1.31 | % | 1.71 | % | 1.50 | % | 1.43 | % | 1.38 | % | |||||||
Nonperforming assets and 90 day past-due loans |
17.46 | % | 24.88 | % | 27.57 | % | 36.61 | % | 244.14 | % | |||||||
Net charge-offs to average total loans, net of unearned income |
1.37 | % | 1.35 | % | 1.09 | % | 0.21 | % | 0.15 | % | |||||||
- (1)
- Reflects (loss) income from discontinued operations of Mariner Finance. See "Sale of Mariner Finance" in Item 7 of Part II of this Form 10-K for additional information.
38
ITEM 7 MANAGEMENT'S DISCUSSION AND ANALYSIS OF FINANCIAL CONDITION AND RESULTS OF OPERATIONS
The Company
The Company is a bank holding company incorporated under the laws of Maryland and registered under the federal Bank Holding Company Act of 1956, as amended. The Company's business is conducted primarily through its wholly owned subsidiaries: First Mariner Bank and FM Appraisals, LLC. The Company had over 1,100 employees (approximately 950 full-time equivalent employees) as of December 31, 2009.
The Bank, which is the largest operating subsidiary of the Company with assets exceeding $1.372 billion at December 31, 2009 and the largest bank headquartered in Baltimore, Maryland, is engaged in the general commercial banking business, with particular attention and emphasis on the needs of individuals and small to mid-sized businesses, and delivers a wide range of financial products and services that are offered by many larger competitors. The Bank's primary market area for its core banking operations, which consist of traditional commercial and consumer lending, as well as retail and commercial deposit operations, is central Maryland as well as portions of Maryland's eastern shore. The Bank also has one branch in Pennsylvania. Products and services of the Bank include traditional deposit products, a variety of consumer and commercial loans, residential and commercial mortgage and construction loans, money transfer services, nondeposit investment products, and Internet banking and similar services. Most importantly, the Bank provides customers with access to local Bank officers who are empowered to act with flexibility to meet customers' needs in an effort to foster and develop long-term loan and deposit relationships. The Bank is an independent community bank and its deposits are insured by the FDIC.
First Mariner Mortgage, a division of the Bank, engages in mortgage-banking activities, providing mortgages and associated products to customers and selling most of those mortgages into the secondary market. First Mariner Mortgage has offices in Maryland, Delaware, Virginia, and North Carolina.
NGFS, a division of the Bank, engages in the origination of reverse and conventional mortgages, providing these products directly through commission based loan officers throughout the United States. NGFS originates reverse mortgages for sale to unaffiliated third parties (primarily Fannie Mae). The Bank does not originate any reverse mortgages for its portfolio, but it does retain the servicing rights on reverse mortgages originated by NGFS and sold to Fannie Mae. The Bank has entered into a profit sharing agreement with a private company related to NGFS, which may result in the acquisition of NGFS if certain requirements are satisfied by the end of the first quarter of 2011. The closing of the transaction is subject to numerous conditions, including, without limitation, that the parties obtain consents and approvals from certain lenders and governmental agencies that license and supervise the Bank. Accordingly, there can be no assurance that the closing will occur when expected, if at all. The Bank does not anticipate any benefit that results from the sale to be material.
FM Appraisals is a residential real estate appraisal preparation and management company that is headquartered in Baltimore City. FM Appraisals offers appraisal services for residential real estate lenders, including appraisal preparation, the compliance oversight of subcontracted appraisers, appraisal ordering and administration, and appraisal review services. FM Appraisals provides these services to First Mariner Mortgage and NGFS.
Sale of Mariner Finance
In December, 2009, we completed the sale of our consumer finance company subsidiary, Mariner Finance, for a purchase price of approximately $10.459 million. We received $8.734 million in cash at closing and a 5% ownership stake in the new Mariner Finance entity. Under terms of the sale, $1.1 million was placed in an escrow account to be paid to First Mariner no later than 18 months after
39
the closing, after deducting any indemnification claims. In accordance with FASB guidance, the results of Mariner Finance operations are not included in our consolidated continuing operations, but are shown on the consolidated statement of operations as discontinued operations. We recorded a loss on the sale of Mariner Finance of $11.110 million during 2009. See additional information on the discontinued operations of Mariner Finance in Note 2 to the Consolidated Financial Statements in Item 8 of Part II of this Form 10-K.
Critical Accounting Policies
The Company's consolidated financial statements are prepared in accordance with accounting principles generally accepted in the United States of America ("GAAP") detailed in the FASB Accounting Codification ("Codification") and follow general practices within the industry in which it operates. Application of these principles requires management to make estimates, assumptions, and judgments that affect the amounts reported in the consolidated financial statements and accompanying notes. These estimates, assumptions, and judgments are based on information available as of the date of the consolidated financial statements; accordingly, as this information changes, the consolidated financial statements could reflect different estimates, assumptions, and judgments. Certain policies inherently have a greater reliance on the use of estimates, assumptions, and judgments and, as such, have a greater possibility of producing results that could be materially different than originally reported. Estimates, assumptions, and judgments are necessary when assets and liabilities are required to be recorded at fair value, when a decline in the value of an asset not carried on the consolidated financial statements at fair value warrants an impairment write-down or valuation reserve to be established, or when an asset or liability needs to be recorded contingent upon a future event. Carrying assets and liabilities at fair value inherently results in more financial statement volatility. When applying accounting policies in such areas that are subjective in nature, management must use its best judgment to arrive at the carrying value of certain assets and liabilities. Below is a discussion of our critical accounting policies.
Allowance for loan losses
A variety of estimates impact the carrying value of the loan portfolio including the calculation of the allowance for loan losses, valuation of underlying collateral, and the timing of loan charge-offs.
The allowance is established and maintained at a level that management believes is adequate to cover losses resulting from the inability of borrowers to make required payments on loans. Estimates for loan losses are arrived at by analyzing risks associated with specific loans and the loan portfolio. Current trends in delinquencies and charge-offs, the views of Bank regulators, changes in the size and composition of the loan portfolio, and peer comparisons are also factors. The analysis also requires consideration of the economic climate and direction and change in the interest rate environment, which may impact a borrower's ability to pay, legislation impacting the banking industry, and environmental and economic conditions specific to the Bank's service areas. Because the calculation of the allowance for loan losses relies on estimates and judgments relating to inherently uncertain events, results may differ from our estimates.
Securities available for sale
Securities available for sale are evaluated periodically to determine whether a decline in their value is other than temporary. The term "other than temporary" is not intended to indicate a permanent decline in value. Rather, it means that the prospects for near term recovery of value are not necessarily favorable, or that there is a lack of evidence to support fair values equal to, or greater than, the carrying value of the security.
40
The initial indication of OTTI for both debt and equity securities is a decline in the market value below the amount recorded for an investment, and the severity and duration of the decline. In determining whether an impairment is other than temporary, we consider the length of time and the extent to which the market value has been below cost, recent events specific to the issuer, including investment downgrades by rating agencies and economic conditions of its industry, our intent to sell the investment, and if it is more likely than not that we will be required to sell the security before recovery of its amortized cost basis. For marketable equity securities, we also consider the issuer's financial condition, capital strength, and near-term prospects. For debt securities and for perpetual preferred securities that are treated as debt securities for the purpose of OTTI analysis, we also consider the cause of the price decline (general level of interest rates and industry- and issuer-specific factors), the issuer's financial condition, near-term prospects and current ability to make future payments in a timely manner, the issuer's ability to service debt, and any change in agencies' ratings at evaluation date from acquisition date and any likely imminent action. Once a decline in value is determined to be other than temporary, the security is segmented into credit- and noncredit-related componenets. Any impairment adjustment due to indentified credit-related components is recorded as an adjustment to current period earnings, while noncredit-related fair value adjustments are recorded through other comprehensive income. In situations where we intend to sell or it is more likely than not that we will be required to sell the security, the entire OTTI loss must be recognized in earnings.
Income Taxes
Income taxes are provided based on the liability method of accounting, which includes the recognition of deferred tax assets and liabilities for the temporary differences between carrying amounts and tax bases of assets and liabilities, computed using enacted tax rates. In general, we record deferred tax assets when the event giving rise to the tax benefit has been recognized in the Consolidated Financial Statements.
A valuation allowance is recognized to reduce any deferred tax assets that, based upon available information, it is more likely than not all, or any portion, of the deferred tax asset will not be realized. Assessing the need for, and amount of, a valuation allowance for deferred tax assets requires significant judgment and analysis of evidence regarding realization of the deferred tax assets. In most cases, the realization of deferred tax assets is dependent upon us generating a sufficient level of taxable income in future periods, which can be difficult to predict. Given the nature of our deferred tax assets, management determined no valuation allowances were needed at either December 31, 2009 or 2008.
The calculation of tax liabilities is complex and requires the use of estimates and judgment since it involves the application of complex tax laws that are subject to different interpretations by us and the various tax authorities. These interpretations are subject to challenge by the tax authorities upon audit or to reinterpretation based on management's ongoing assessment of facts and evolving case law.
Periodically and in the ordinary course of business, we are involved in inquiries and reviews by tax authorities that normally require management to provide supplemental information to support certain tax positions we take in our tax returns. Uncertain tax positions are initially recognized in the financial statements when it is more likely than not the position will be sustained upon examination by the tax authorities. Such tax positions are initially and subsequently measured as the largest amount of tax benefit that is greater than 50% likely of being realized upon ultimate settlement with the tax authority assuming full knowledge of the position and all relevant facts. Management believes it has taken appropriate positions on its tax returns, although the ultimate outcome of any tax review cannot be predicted with certainty. Still, no assurance can be given that the final outcome of these matters will not be different than what is reflected in the current and historical financial statements.
41
Loan income recognition
Interest income on loans is accrued at the contractual rate based on the principal outstanding. Loan origination fees and certain direct loan origination costs are deferred and amortized as a yield adjustment over the contractual loan terms. Accrual of interest is discontinued when its receipt is in doubt, which typically occurs when a loan becomes impaired. Any interest accrued to income in the year when interest accruals are discontinued is generally reversed. Management may elect to continue the accrual of interest when a loan is in the process of collection and the estimated fair value of the collateral is sufficient to satisfy the principal balance and accrued interest. Loans are returned to accrual status once the doubt concerning collectibility has been removed and the borrower has demonstrated the ability to pay and remain current. Payments on nonaccrual loans are generally applied to principal.
Real estate acquired through foreclosure
We record foreclosed real estate assets at the lower of cost or estimated fair value on the acquisition date and at the lower of such initial amount or estimated fair value less estimated selling costs thereafter. Estimated fair value is based upon many subjective factors, including location and condition of the property and current economic conditions, among other things. Because the calculation of fair value relies on estimates and judgments relating to inherently uncertain events, results may differ from our estimates.
Write-downs at time of transfer are made through the allowance for loan losses. Write-downs subsequent to transfer are included in our noninterest expenses, along with operating income, net of related expenses of such properties and gains or losses realized upon disposition.
Results of Operations and Financial Condition
The following discussion compares our financial condition at December 31, 2009 to the financial condition at December 31, 2008 and results of operations for the years ended December 31, 2009, 2008, and 2007. This discussion should be read in conjunction with our accompanying financial statements and related notes as well as statistical information included elsewhere in this report.
Performance Overview
We recorded a net loss of $22.284 million for 2009 compared to net loss of $15.088 million for 2008, with diluted losses per share totaling $(3.45) for 2009 compared to diluted losses per share of $(2.36) in 2008. The decrease in net income and earnings per share was primarily a result of a loss on the discontinued operations of Mariner Finance of $9.060 million in 2009, compared to income from those operations of $1.721 million in 2008. Our net loss from continuing operations decreased by $3.585 million, with increased noninterest income that was partially offset by decreased net interest income, increased provision for loan losses, increased noninterest expenses, and a decreased income tax benefits.
Our results for 2009 were significantly impacted by persistent negative trends in both commercial and residential real estate markets. We experienced significant charge offs in those loan types in 2009 ($4.546 million in residential real estate, $871,000 in commercial real estate, and $3.863 million in real estate construction) and a substantial amount of these loans were moved to real estate acquired through foreclosure ($1.324 million of residential real estate loans, $2.658 million in commercial real estate loans, and $9.539 million in real estate construction loans). In addition, as declines in real estate values have continued, we recorded additional write-downs and losses on and expenses related to real estate acquired through foreclosure of $6.832 million in 2009. The Company provided for additional loan loss reserves throughout 2008 and 2009 for the anticipated loss exposure caused by the depressed real estate market. In addition to these losses, earnings were further impacted by the loss of interest
42
income on loans placed on nonaccrual status, the cost of carrying foreclosed properties, and higher legal and collection expenses relating to these loans.
Our largest category of revenue, net interest income, decreased $1.328 million or 4.7% due to lower yields earned on average earning assets, coupled with a lower level of noninterest-bearing liabilities. Noninterest income increased $11.044 million or 64.1% due primarily to increased mortgage-banking revenue, decreased OTTI charges, and a recovery in value on our assets and liabilities carried at fair value.
Our increase in total expenses resulted primarily due to increased deposit insurance premiums and increased expenses related to loan collections and foreclosures, including related professional fees. The increase of $804,000 in the provision for loan losses reflects needed increases in the allowance for loan losses relating to weaknesses in the residential construction and development loan portfolio and to maintain reserve levels and replenish charge-offs of residential mortgage and residential construction and development loans. We recorded a loss on the discontinued operations of Mariner Finance of $9.060 million in 2009, compared to income from those operations in 2008 of $1.721 million. We recorded an income tax benefit from continuing operations of $10.887 million in 2009 compared to $13.632 million in 2008.
The return on average assets was (1.69)% for 2009 compared to (1.16)% for 2008. The return on average equity for 2009 was (53.81)% compared to (24.37)% for 2008. Average equity to average assets was 3.15% for 2009 compared to 4.78% for 2008. The decrease in the return on average assets reflected the continuing effect of nonperforming assets and loan charge-offs. The decrease in the return on average equity was the result of the higher net loss in 2009.
Our total assets increased by $77.054 million or 5.9% during 2009, a result of increased deposits, which increased cash and due from Banks. Earning assets decreased $77.168 million or 6.7% from $1.144 billion in 2008 to $1.067 billion in 2009. Deposits increased by $196.271 million to $1.147 billion at December 31, 2009 from $950.233 million at December 31, 2008. Stockholders' equity decreased $19.028 million or 41.4%, reflecting the 2009 loss, partially offset by a decrease in other comprehensive loss due to the increase in the market value of securities classified as available for sale.
Our asset quality showed improvement at December 31, 2009 compared to December 31, 2008. At December 31, 2009, our allowance for loan losses amounted to $11.639 million, which totaled 20.3% of nonperforming assets as of December 31, 2009, compared to 29.1% as of December 31, 2008. Our level of nonperforming assets decreased to 4.15% of total assets at December 31, 2009 from 4.42% of total assets at December 31, 2008 and our level of loans 90 days delinquent and still accruing interest decreased to $9.224 million from $9.679 million in 2008. Our ratio of net chargeoffs to average total loans was 1.37% in 2009 compared to 1.35% in 2008.
Bank capital adequacy levels (as defined by banking regulation) improved slightly from 2008 to 2009 and the Bank was still considered "adequately capitalized." The ratios for the Bank as of December 31, 2009 for our capital leverage, Tier 1 capital to risk weighted assets, and total capital to risk weighted assets were 6.2%, 7.9%, and 9.1%, respectively, compared to 5.8%, 6.8%, and 8.8%, respectively, at December 31, 2008. Our regulatory capital levels increased due primarily to the sale of Mariner Finance, which provided First Mariner with the ability to infuse additional capital into the Bank. As a result of being below "well-capitalized" levels, the Bank may not place brokered certificates of deposits without the granting of a waiver from its regulators. We are under agreements with regulators to raise our capital levels as described in additional detail later in this Item under "Capital Resources." See also "Subsequent Events" later in this Item for information on our attempts to raise additional capital.
43
Results of Operations
Net Interest Income/Margins
Our primary source of earnings is net interest income, which is the difference between the interest income we earn on interest-earning assets, such as loans and investment securities, and the interest expense we pay on interest-bearing sources of funds, such as deposits and borrowings. The level of net interest income we earn is determined mostly by the average balances ("volume") and the rate spreads between our interest-earning assets and our funding sources.
Net interest income for 2009 decreased by $1.328 million to $27.112 million compared to $28.440 million for 2008 due to an increase in volume of interest-bearing liabilities, combined with a decrease in the yield on interest-earning assets from 6.11% in 2008 to 5.36% in 2009 and a decrease in our level of noninterest-bearing deposits. Partially offsetting this decrease was a decline in the rate paid on interest-bearing liabilities from 3.45% in 2008 to 2.84% in 2009.
The net interest margin is the key performance measure for our net interest income. Our net interest margin is affected by our loan pricing, our mix of earning assets, levels of nonperforming assets, and our distribution and pricing of deposits and borrowings. Our net interest margin (net interest income divided by average earning assets) decreased to 2.43% for 2009, compared to 2.74% for 2008. The decrease in the rates paid on interest-bearing sources of funds slightly mitigated the net interest margin decline.
Interest income
Total interest income decreased by $3.515 million from 2008 to 2009 due primarily to the decreased yield on average earning assets. Yields on earning assets for the year decreased to 5.36% from 6.11%, while average earning assets increased $80.605 million. We experienced decreased yields on most major earning asset categories, primarily a result of the lower interest rate environment in 2009. Additionally, our interest income was negatively affected by increased interest reversals on and increased average balances of nonaccrual loans. The yields on interest-bearing deposits and restricted stock investments were particularly affected by the low rate environment in 2009. The yield on loans decreased from 6.55% for 2008 to 5.81% for 2009, due to lower rates and higher nonperforming assets.
Average loans outstanding for 2009 increased by $67.646 million when compared to 2008. We experienced increases in commercial loans and lines of credit (+$7.889 million), commercial mortgages (+$38.940 million), residential mortgages (+$48.113 million), and consumer loans (+$17.479 million), which were partially offset by decreases in commercial and consumer construction loans (-$15.442 million and -$29.333 million, respectively). Average loans held for sale increased $39.578 million.
The decrease in both commercial and consumer residential construction loans was due primarily to the deterioration of the real estate market, which has led to the reduction of new construction, as well as increased write-downs of nonperforming loans and increased foreclosures in these sectors, which have caused management to strategically reduce lending in these areas. The increases in commercial loans and lines of credit and in commercial mortgages were due to a focus on commercial lending in 2008, which was altered in 2009 away from loan growth towards improved asset quality. The increase in residential mortgage loans was due primarily to increased mortgage lending activity, which reflected management's strategic decision to focus on mortgage lending while stabilizing the asset quality of the commercial loan portfolio. The increased mortgage lending activity was also reflected in the increase in average loans held for sale. Consumer loans increased due to increased demand for consumer products in 2009. Average securities decreased by $27.227 million, due primarily to normal principal repayments on mortgage-backed securities and deteriorations in value on certain securities due to the current economic conditions.
44
Interest expense
Interest expense decreased by $2.187 million to $32.698 million for 2009, compared to $34.885 million for the same period in 2008. We experienced a decrease in the average rate paid on interest-bearing liabilities, from 3.45% for 2008 to 2.84% for 2009, which was partially offset by a higher level of interest-bearing liabilities. The decrease in the rate paid on interest-bearing deposits from 3.06% in 2008 to 2.65% in 2009 was driven primarily by decreases in the rates on money market accounts and time deposits, partially offset by increases in the rates on NOW accounts. Average interest-bearing deposits increased by $135.822 million primarily due to an increase in the volume of time deposits, including brokered deposits. In addition, during the second quarter of 2009, we began a national certificate of deposit campaign (nonbrokered) which offers certificates of deposit for terms from six months to five years at a maximum of 75 basis points above the national average. This campaign has brought in approximately $217.542 million in new time deposits. An increase in average borrowings of $4.916 million was due primarily to increases in our short-term FHLB advances. We experienced a decrease in the costs of borrowed funds from 4.95% for 2008 to 3.67% for 2009 due to the decline in variable-rate trust preferred security costs, as well as lower short-term borrowing costs.
The table below sets forth the average balances, net interest income and expense and average yields and rates for our interest-earning assets and interest-bearing liabilities for 2009, 2008, and 2007.
45
Comparative Average Balances Yields and Rates
| |
2009 | 2008 | 2007 | ||||||||||||||||||||||||||
|---|---|---|---|---|---|---|---|---|---|---|---|---|---|---|---|---|---|---|---|---|---|---|---|---|---|---|---|---|---|
| (dollars in thousands) | Average Balance (4) |
Interest (1) | Yield/ Rate |
Average Balance (4) |
Interest (1) | Yield/ Rate |
Average Balance (4) |
Interest (1) | Yield/ Rate |
||||||||||||||||||||
ASSETS |
|||||||||||||||||||||||||||||
Loans (2): |
|||||||||||||||||||||||||||||
Commercial loans and lines of credit |
$ | 87,421 | $ | 4,415 | 5.05% | $ | 79,532 | $ | 4,780 | 6.01% | $ | 78,182 | $ | 5,933 | 7.59% | ||||||||||||||
Commercial construction |
102,097 | 5,352 | 5.24% | 117,539 | 7,320 | 6.23% | 134,521 | 10,632 | 7.90% | ||||||||||||||||||||
Commercial mortgages |
337,803 | 22,743 | 6.73% | 298,863 | 22,111 | 7.40% | 292,612 | 21,662 | 7.40% | ||||||||||||||||||||
Consumer residential construction |
58,498 | 3,352 | 5.73% | 87,831 | 5,497 | 6.26% | 91,472 | 7,565 | 8.27% | ||||||||||||||||||||
Residential mortgages |
152,280 | 8,937 | 5.87% | 104,167 | 6,165 | 5.92% | 65,917 | 3,238 | 4.91% | ||||||||||||||||||||
Consumer |
151,246 | 6,860 | 4.54% | 133,767 | 7,979 | 5.96% | 119,139 | 8,867 | 7.44% | ||||||||||||||||||||
Total loans |
889,345 | 51,659 | 5.81% | 821,699 | 53,852 | 6.55% | 781,843 | 57,897 | 7.41% | ||||||||||||||||||||
Loans held for sale |
99,503 | 5,080 | 5.11% | 59,925 | 3,447 | 5.75% | 77,580 | 5,285 | 6.81% | ||||||||||||||||||||
Securities, trading and available for sale |
48,274 | 2,955 | 6.12% | 75,501 | 4,486 | 5.94% | 99,121 | 5,372 | 5.42% | ||||||||||||||||||||
Interest-bearing deposits |
71,963 | 108 | 0.15% | 72,701 | 1,303 | 1.79% | 68,694 | 3,411 | 4.97% | ||||||||||||||||||||
Restricted stock investments, at cost |
7,770 | 8 | 0.10% | 6,424 | 237 | 3.69% | 6,123 | 363 | 5.93% | ||||||||||||||||||||
Total earning assets |
1,116,855 | 59,810 | 5.36% | 1,036,250 | 63,325 | 6.11% | 1,033,361 | 72,328 | 7.00% | ||||||||||||||||||||
Allowance for loan losses |
(11,979 | ) | (10,301 | ) | (8,838 | ) | |||||||||||||||||||||||
Cash and other nonearning assets |
211,014 | 270,303 | 242,002 | ||||||||||||||||||||||||||
Total assets |
$ | 1,315,890 | 59,810 | $ | 1,296,252 | 63,325 | $ | 1,266,525 | 72,328 | ||||||||||||||||||||
LIABILITIES AND STOCKHOLDERS' EQUITY |
|||||||||||||||||||||||||||||
Interest-bearing deposits: |
|||||||||||||||||||||||||||||
NOW deposits |
$ | 6,784 | 44 | 0.65% | $ | 13,249 | 77 | 0.58% | $ | 9,858 | 21 | 0.21% | |||||||||||||||||
Savings deposits |
55,122 | 178 | 0.32% | 54,897 | 180 | 0.33% | 56,935 | 178 | 0.31% | ||||||||||||||||||||
Money market deposits |
163,910 | 1,376 | 0.84% | 210,003 | 3,085 | 1.47% | 287,837 | 10,127 | 3.52% | ||||||||||||||||||||
Time deposits |
713,855 | 23,275 | 3.26% | 525,700 | 21,242 | 4.04% | 384,157 | 17,446 | 4.54% | ||||||||||||||||||||
Total interest-bearing deposits |
939,671 | 24,873 | 2.65% | 803,849 | 24,584 | 3.06% | 738,787 | 27,772 | 3.76% | ||||||||||||||||||||
Borrowings |
213,011 | 7,825 | 3.67% | 208,095 | 10,301 | 4.95% | 211,205 | 12,361 | 5.85% | ||||||||||||||||||||
Total interest-bearing liabilities |
1,152,682 | 32,698 | 2.84% | 1,011,944 | 34,885 | 3.45% | 949,992 | 40,133 | 4.22% | ||||||||||||||||||||
Noninterest-bearing demand deposits |
116,508 | 131,242 | 163,011 | ||||||||||||||||||||||||||
Other noninterest-bearing liabilities |
5,285 | 91,150 | 80,750 | ||||||||||||||||||||||||||
Stockholders' equity |
41,415 | 61,916 | 72,772 | ||||||||||||||||||||||||||
Total liabilities and stockholders' equity |
$ | 1,315,890 | 32,698 | $ | 1,296,252 | 34,885 | $ | 1,266,525 | 40,133 | ||||||||||||||||||||
Net interest income/net interest spread |
$ | 27,112 | 2.52% | $ | 28,440 | 2.66% | $ | 32,195 | 2.78% | ||||||||||||||||||||
Net interest margin (3) |
2.43% | 2.74% | 3.12% | ||||||||||||||||||||||||||
- (1)
- There
are no tax equivalency adjustments
- (2)
- The
average balances of nonaccrual loans for the years ended December 31, 2009, 2008, and 2007, which are included in the average loan balances for
these years, were $35.308 million, $30.111 million, and $18.465 million, respectively.
- (3)
- Net
interest margin is calculated as net interest income divided by average earning assets
- (4)
- Average assets and liabilities of our discontinued subsidiary, Mariner Finance, are included in other nonearning assets and other noninterest-bearing liabilities
46
The "Rate/Volume Analysis" below indicates the changes in our net interest income as a result of changes in volume and rates. We maintain an asset and liability management policy designed to provide a proper balance between rate sensitive assets and rate sensitive liabilities to attempt to optimize interest margins while providing adequate liquidity for our anticipated needs.
Rate/Volume Analysis (1)
| |
2009 Compared to 2008 | 2008 Compared to 2007 | |||||||||||||||||||
|---|---|---|---|---|---|---|---|---|---|---|---|---|---|---|---|---|---|---|---|---|---|
| |
Change Due to Variance In | Change Due to Variance In | |||||||||||||||||||
| (dollars in thousands) | Rates | Volume | Total | Rates | Volume | Total | |||||||||||||||
INTEREST INCOME |
|||||||||||||||||||||
Loans: |
|||||||||||||||||||||
Commercial loans and lines of credit |
$ | (810 | ) | $ | 445 | $ | (365 | ) | $ | (1,254 | ) | $ | 101 | $ | (1,153 | ) | |||||
Commercial construction |
(1,075 | ) | (893 | ) | (1,968 | ) | (2,076 | ) | (1,236 | ) | (3,312 | ) | |||||||||
Commercial mortgages |
(2,095 | ) | 2,727 | 632 | (14 | ) | 463 | 449 | |||||||||||||
Consumer residential construction |
(433 | ) | (1,712 | ) | (2,145 | ) | (1,777 | ) | (291 | ) | (2,068 | ) | |||||||||
Residential mortgages |
(52 | ) | 2,824 | 2,772 | 764 | 2,163 | 2,927 | ||||||||||||||
Consumer |
(2,073 | ) | 954 | (1,119 | ) | (1,894 | ) | 1,006 | (888 | ) | |||||||||||
Total loans |
(6,538 | ) | 4,345 | (2,193 | ) | (6,251 | ) | 2,206 | (4,045 | ) | |||||||||||
Loans held for sale |
(425 | ) | 2,058 | 1,633 | (746 | ) | (1,092 | ) | (1,838 | ) | |||||||||||
Securities, trading and available for sale |
125 | (1,656 | ) | (1,531 | ) | 482 | (1,368 | ) | (886 | ) | |||||||||||
Interest-bearing deposits |
(1,182 | ) | (13 | ) | (1,195 | ) | (2,296 | ) | 188 | (2,108 | ) | ||||||||||
Restricted stock investments, at cost |
(270 | ) | 41 | (229 | ) | (143 | ) | 17 | (126 | ) | |||||||||||
Total interest income |
(8,290 | ) | 4,775 | (3,515 | ) | (8,954 | ) | (49 | ) | (9,003 | ) | ||||||||||
INTEREST EXPENSE |
|||||||||||||||||||||
Interest-bearing deposits: |
|||||||||||||||||||||
NOW deposits |
8 | (41 | ) | (33 | ) | 47 | 9 | 56 | |||||||||||||
Savings deposits |
(3 | ) | 1 | (2 | ) | 8 | (6 | ) | 2 | ||||||||||||
Money market deposits |
(1,130 | ) | (579 | ) | (1,709 | ) | (4,809 | ) | (2,233 | ) | (7,042 | ) | |||||||||
Time deposits |
(4,616 | ) | 6,649 | 2,033 | (2,087 | ) | 5,883 | 3,796 | |||||||||||||
Total interest-bearing deposits |
(5,741 | ) | 6,030 | 289 | (6,841 | ) | 3,653 | (3,188 | ) | ||||||||||||
Borrowings |
(2,712 | ) | 236 | (2,476 | ) | (1,880 | ) | (180 | ) | (2,060 | ) | ||||||||||
Total interest expense |
(8,453 | ) | 6,266 | (2,187 | ) | (8,721 | ) | 3,473 | (5,248 | ) | |||||||||||
Net interest income |
$ | 163 | $ | (1,491 | ) | $ | (1,328 | ) | $ | (233 | ) | $ | (3,522 | ) | $ | (3,755 | ) | ||||
- (1)
- Changes in interest income and interest expense that result from variances in both volume and rates have been allocated to rate and volume changes in proportion to the absolute dollar amounts of the change in each.
Noninterest Income
We derive noninterest income principally from mortgage-banking activities, service fees on our deposit accounts, ATM fees, commissions on sales of nondeposit investment products ("brokerage fees"), and income from BOLI. Our noninterest income for the year ended December 31, 2009 totaled $28.271 million, compared to $17.227 million for the year ended December 31, 2008, an increase of $11.044 million or 64.1%, due primarily to an increase in mortgage-banking revenue, an insurance recovery of $850,000, a recovery in value on our assets and liabilities carried at fair value, and a decrease in net OTTI charges of $2.669 million.
47
Mortgage-banking revenue increased from $9.410 million in 2008 to $16.112 million in 2009 due to a larger volume of originations of loans and higher margins on loans sold. The volume of loans sold increased from $1.149 billion in 2008 to $1.625 billion in 2009 and reflects strong reverse mortgage originations and continued customer refinance activity.
We recognized $420,000 in gains on sales of securities in 2009, compared to $229,000 during 2008. During 2009, we also recognized $2.936 million in net OTTI charges on securities available for sale, compared to $5.605 million in net OTTI charges recorded in 2008. See "Securities" discussion later in this Item for more information on these OTTI charges and the related securities.
Deposit service charges declined to $5.261 million in 2009 from $6.319 million in 2008 due to lower overdraft income and to a decline in the number of accounts. During 2009, we experienced a recovery of value of our trading assets and certain long-term borrowings of $3.038 million, compared to a loss in value of $814,000 for 2008.
Other income increased $27,000 for 2009. Included in this line item for 2009 is an insurance recovery of $850,000 related to high loan-to-value ratio/low documentation ("ALT A") loans originated in 2006 and 2007. Other income for 2008 included Visa IPO income of $156,000 and we recorded $819,000 in gains on the sales of two former branch facilities.
The following table shows the detail of our noninterest income for the years ended December 31:
| (dollars in thousands) | 2009 | 2008 | 2007 | |||||||
|---|---|---|---|---|---|---|---|---|---|---|
Net OTTI charges on securities available for sale |
$ | (2,936 | ) | $ | (5,605 | ) | $ | — | ||
Origination fees and gain on sale of mortgage loans |
12,169 | 6,730 | 4,430 | |||||||
Other mortgage-banking revenue |
3,943 | 2,680 | 2,295 | |||||||
ATM fees |
3,072 | 3,188 | 3,219 | |||||||
Service fees on deposits |
5,261 | 6,319 | 6,463 | |||||||
Gain (loss) on financial instruments carried at fair value |
3,038 | (814 | ) | (702 | ) | |||||
Gain on sales of securities, net |
420 | 229 | 943 | |||||||
Gain on sale of branches |
— | 819 | — | |||||||
Commissions on sales of nondeposit investment products |
540 | 816 | 1,049 | |||||||
Income from bank-owned life insurance |
1,377 | 1,505 | 1,439 | |||||||
Other |
1,387 | 1,360 | 1,621 | |||||||
|
$ | 28,271 | $ | 17,227 | $ | 20,757 | ||||
Noninterest Expense
Our noninterest expenses increased $2.582 million, or 3.9%, to $67.834 million compared to $65.252 million for the same period of 2008, primarily due to increased costs related to real estate acquired through foreclosure, deposit insurance premiums, loan collections, and professional services.
Write-downs and costs of real estate acquired through foreclosure increased $1.030 million, as nonperforming commercial, commercial construction, consumer construction, and ALT A loans moved through the foreclosure process. Management regularly updates its values of foreclosed properties and continued declines in the value of residential real estate have required further write-downs in our carrying value. Professional fees increased primarily due to legal fees associated with the sale of Mariner Finance, regulatory issues, and loan workouts. Loan collection expenses, included in other noninterest expenses, increased $930,000 due to costs associated with loan workouts.
Deposit insurance costs increased due to an increase in our rates assessed by the FDIC, including total special assessments of approximately $638,000 in 2009. Our regular FDIC rates have increased
48
due to our capital adequacy levels and financial condition. See "Capital Resources" later in this Item for additional information on capital adequacy.
The following table shows the detail of our noninterest expense for the years ended December 31:
| (dollars in thousands) | 2009 | 2008 | 2007 | |||||||
|---|---|---|---|---|---|---|---|---|---|---|
Salaries and employee benefits |
$ | 26,469 | $ | 27,901 | $ | 28,925 | ||||
Occupancy |
8,974 | 9,369 | 8,615 | |||||||
Furniture, fixtures, and equipment |
2,941 | 3,425 | 3,223 | |||||||
Professional services |
3,866 | 1,669 | 1,409 | |||||||
Advertising |
915 | 921 | 1,219 | |||||||
Data processing |
1,880 | 2,149 | 1,941 | |||||||
ATM expenses |
944 | 1,014 | 1,030 | |||||||
Write-downs, losses, and costs of real estate acquired through foreclosure |
6,832 | 5,802 | 4,477 | |||||||
Secondary marketing valuation |
— | 355 | 3,934 | |||||||
FDIC insurance premiums |
3,480 | 887 | 605 | |||||||
Service and maintenance |
2,437 | 2,216 | 2,098 | |||||||
Office supplies |
504 | 539 | 606 | |||||||
Printing |
332 | 437 | 394 | |||||||
Corporate insurance |
1,035 | 720 | 560 | |||||||
Consulting fees |
1,049 | 766 | 789 | |||||||
Marketing/promotion |
286 | 404 | 717 | |||||||
Postage |
763 | 600 | 660 | |||||||
Overnight delivery/courier |
525 | 735 | 788 | |||||||
Security |
259 | 195 | 258 | |||||||
Dues and subscriptions |
490 | 468 | 505 | |||||||
Loan collection expenses |
1,394 | 464 | 618 | |||||||
Regulatory compliance settlement |
— | 1,040 | — | |||||||
Loan origination expense |
— | 254 | 863 | |||||||
Director fees |
276 | 289 | 254 | |||||||
Employee education and training |
161 | 193 | 184 | |||||||
Automobile expense |
144 | 172 | 163 | |||||||
Travel and entertainment |
332 | 435 | 502 | |||||||
Other |
1,546 | 1,833 | 1,960 | |||||||
|
$ | 67,834 | $ | 65,252 | $ | 67,297 | ||||
Income Tax Expense
We recorded an income tax benefit of $10.887 million on a net loss before taxes and discontinued operations of $24.111 million, resulting in an effective tax rate before discontinued operations of (45.2)% for 2009 in comparison to an income tax benefit of $13.632 million on a net loss before taxes and discontinued operations of $30.441 million, resulting in an effective tax rate before discontinued operations of (44.8)% for 2008.
The Bank has earned significant state tax incentives totaling $5.5 million through its participation in the One Maryland Economic Development ("One Maryland") and Job Creation Tax Credit programs. We will realize the benefits of the incentives in our reported earnings as the credits can be utilized, in accordance with accounting standards that govern the recognition of investment tax credits. The amount of the credit that we can utilize will largely be determined by the level of Maryland taxable income for the Bank only, and will be recognized as a reduction in our income tax expense. During 2009 and 2008, we utilized $591,000 and $585,000, respectively, in credit related to this
49
incentive program as a portion of the credits earned are funded regardless of taxable income levels. Any unused One Maryland credits can be carried forward and will expire in 2016. The Job Creation Tax Credit can be carried forward for five years.
At December 31, 2009, we had approximately $64.000 million in state operating loss carryforwards, representing a deferred income tax asset of $3.437 million, and approximately $30.000 million in federal operating loss carryforwards, representing a deferred income tax asset of $10.635 million. Management has determined that a valuation allowance for deferred tax assets was not required as of December 31, 2009.
Discontinued Operations
In accordance with FASB guidance, the operating results of Mariner Finance, along with the loss recognized on the sale are included in the Consolidated Statement of Operations as discontinued operations. Such discontinued operations are detailed as follows for the years ended December 31:
| (dollars in thousands) | 2009 | 2008 | 2007 | ||||||||
|---|---|---|---|---|---|---|---|---|---|---|---|
Interest income |
$ | 24,262 | $ | 20,987 | $ | 16,574 | |||||
Interest expense |
(3,147 | ) | (3,381 | ) | (4,089 | ) | |||||
Net interest income |
21,115 | 17,606 | 12,485 | ||||||||
Provision for loan losses |
(4,865 | ) | (3,927 | ) | (2,215 | ) | |||||
Noninterest income |
4,467 | 3,959 | 3,482 | ||||||||
Noninterest expenses |
(17,332 | ) | (14,796 | ) | (11,080 | ) | |||||
Net income before income taxes |
3,385 | 2,842 | 2,672 | ||||||||
Income tax expense |
(1,335 | ) | (1,121 | ) | (1,032 | ) | |||||
Net income |
2,050 | 1,721 | 1,640 | ||||||||
Loss on write-down of Mariner Finance to fair value |
(9,485 | ) | — | — | |||||||
Write-off of deferred taxes related to Mariner Finance |
(1,625 | ) | — | — | |||||||
Net loss on disposal of Mariner Finance |
(11,110 | ) | — | — | |||||||
Net (loss) income from discontinued operations |
$ | (9,060 | ) | $ | 1,721 | $ | 1,640 | ||||
Financial Condition
At December 31, 2009, our total assets were $1.385 billion compared to $1.307 billion at December 31, 2008, an increase of 5.9%. Earning assets decreased $77.168 million or 6.7% to $1.067 billion at December 31, 2009 from $1.144 billion at December 31, 2008. We experienced growth in cash and due from banks (+$145.329 million) and loans held for sale (+$61.882 million), partially offset by decreases in total securities (-$13.208 million), net loans receivable (-$82.607 million), and federal funds sold and interest-bearing deposits (-$38.965 million). We funded the growth in overall assets with increases in deposits (+$196.271 million).
Securities
Our investment portfolio at December 31, 2009 is comprised of marketable securities. The maturity structure of our investment portfolio is significantly influenced by the level of prepayment activity on mortgage-backed securities. At December 31, 2009, the average duration of our investment portfolio was 2.68 years, significantly shorter than the average duration of 4.98 years at December 31, 2008, primarily due to the decrease in the projected lives of mortgage-backed securities.
50
We utilize the securities portfolio as part of our overall asset/liability management practices to enhance interest revenue while providing necessary liquidity for the funding of loan growth or deposit withdrawals. We continually monitor the credit risk associated with corporate investments and diversify the risk in the corporate portfolio. As of December 31, 2009, we held $10.749 million in securities classified as trading and $28.275 million in securities classified as AFS. As of December 31, 2008, we held $12.566 million in securities classified as trading and $39.666 million in securities classified as AFS.
Changes in current market conditions, such as interest rates and the economic uncertainties in the mortgage, housing, and banking industries have severely impacted the securities market. The secondary market for various types of securities has been limited and has negatively impacted security values. Quarterly, we review each security in our AFS portfolio to determine the nature of any decline in value and evaluate if any impairment should be classified as OTTI.
Trading Securities
Trading securities decreased $1.817 million or 14.5% from the December 31, 2008 level of $12.566 million due to principal repayments. The entire trading portfolio consisted of mortgage-backed securities at December 31, 2009 and 2008.
The estimated fair values and weighted average yields of trading debt securities at December 31, 2009, by contractual maturity, are shown below. Actual maturities may differ from contractual maturities because issuers have the right to call or prepay obligations.
| (dollars in thousands) | Estimated Fair Value |
Weighted- Average Yield |
||||||
|---|---|---|---|---|---|---|---|---|
Mortgage-backed securities— |
||||||||
Due five to ten years |
$ | 9,240 | 4.15 | % | ||||
Due after ten years |
1,509 | 4.30 | % | |||||
|
$ | 10,749 | 4.17 | % | ||||
Mortgage-backed securities are assigned to maturity categories based on their final maturity.
Securities Available for Sale
Securities AFS declined $11.391 million due to normal principal payments on mortgage-backed securities, scheduled maturities of other securities, $9.279 million in securities sales, and a decline in market values of certain securities, partially offset by purchases of securities of $1.749 million during 2009. In addition, we recorded $2.936 million in net OTTI charges during 2009, most of which was related to pooled trust preferred obligations. At December 31, 2009, our net unrealized loss on securities classified as available for sale totaled $5.669 million compared to a net unrealized loss of $8.191 million at December 31, 2008. The increase in value resulted primarily from improved values of our mortgage-backed securities. In addition, in 2009, we recognized credit-related OTTI on our holdings of four pooled trust preferred obligations that are considered impaired and that were in an unrealized loss position in 2008.
Changes in current market conditions, such as interest rates and the economic uncertainties in the mortgage, housing, and banking industries, have severely impacted the securities market. The secondary market for various types of securities has been limited and has negatively impacted securities values. Quarterly, we review each security in our AFS portfolio to determine the nature of any decline in value and evaluate if any impairment should be classified as OTTI.
51
The trust preferred securities we hold in our securities portfolio were issued by other banks and bank holding companies. Certain of these securities have experienced declines in credit ratings from credit rating firms, which have devalued these specific securities. These declines have occurred primarily over the past two years due to changes in the market which has limited the demand for these securities and reduced their liquidity. While some of these issuers have reported weaker financial performance since acquisition of these securities, in management's opinion, they continue to possess acceptable credit risk. We monitor the actual default rates and interest deferrals for possible losses and contractual shortfalls of interest or principal, which could warrant further recognition of impairment. We recorded net OTTI charges of $2.602 million during the year ended December 31, 2009 on trust preferred securities.
We recorded net OTTI of $334,000 on two of our equity securities during the year ended December 31, 2009.
All of the remaining securities that are temporarily impaired are impaired due to declines in fair values resulting from changes in interest rates or increased credit/liquidity spreads compared to the time they were purchased. We have the intent to hold these securities to maturity and it is more likely than not that we will not be required to sell the securities before recovery of value. As such, management considers the impairments to be temporary.
Our total investments in trust preferred securities, corporate obligations, and common equity securities totaled $15.180 million as of December 31, 2009 compared to $15.665 million as of December 31, 2008.
Our securities available for sale portfolio composition is as follows as of December 31:
| (dollars in thousands) | 2009 | 2008 | 2007 | 2006 | 2005 | |||||||||||
|---|---|---|---|---|---|---|---|---|---|---|---|---|---|---|---|---|
Mortgage-backed securities |
$ | 11,742 | $ | 22,248 | $ | 18,079 | $ | 62,281 | $ | 161,112 | ||||||
Trust preferred securities |
13,338 | 12,866 | 19,034 | 33,028 | 34,087 | |||||||||||
U.S. government agency notes |
— | — | — | 39,894 | 68,271 | |||||||||||
U.S. Treasury securities |
1,003 | 1,003 | 1,017 | 998 | 986 | |||||||||||
Obligations of state and municipal subdivisions |
— | — | 2,975 | 2,965 | 2,969 | |||||||||||
Corporate obligations |
930 | 2,548 | 1,915 | 1,988 | 1,777 | |||||||||||
Equity securities—Banks |
912 | 251 | 478 | 1,395 | 1,310 | |||||||||||
Foreign government bonds |
350 | 750 | 1,500 | 1,750 | 1,481 | |||||||||||
Other investment securities |
— | — | — | 2,991 | 4,946 | |||||||||||
|
$ | 28,275 | $ | 39,666 | $ | 44,998 | $ | 147,290 | $ | 276,939 | ||||||
The amortized cost, estimated fair values, and weighted average yields of debt securities at December 31, 2009, by contractual maturity, are shown below. Actual maturities may differ from
52
contractual maturities because issuers have the right to call or prepay obligations. Equity securities are excluded as they have no stated maturity.
| |
|
Unrealized | |
|
|||||||||||||
|---|---|---|---|---|---|---|---|---|---|---|---|---|---|---|---|---|---|
| |
Amortized Cost |
Estimated Fair Value |
Weighted- Average Yield |
||||||||||||||
| (dollars in thousands) | Gains | Losses | |||||||||||||||
Mortgage-backed securities: |
|||||||||||||||||
Due five to ten years |
$ | 229 | $ | 16 | $ | — | $ | 245 | 6.00 | % | |||||||
Due after ten years |
11,043 | 461 | 7 | 11,497 | 5.45 | % | |||||||||||
Trust preferred securities: |
|||||||||||||||||
Due one to five years |
2,953 | 47 | 28 | 2,972 | 7.75 | % | |||||||||||
Due five to ten years |
1,031 | — | 125 | 906 | 8.00 | % | |||||||||||
Due after ten years |
15,497 | — | 6,037 | 9,460 | 5.56 | % | |||||||||||
U.S. Treasury securities: |
|||||||||||||||||
Due one to five years |
999 | 4 | — | 1,003 | 0.88 | % | |||||||||||
Corporate obligations: |
|||||||||||||||||
Due one to five years |
877 | 53 | — | 930 | 4.63 | % | |||||||||||
Foreign government bonds: |
|||||||||||||||||
Due within one year |
350 | — | — | 350 | 4.05 | % | |||||||||||
|
$ | 32,979 | $ | 581 | $ | 6,197 | $ | 27,363 | 5.62 | % | |||||||
Weighted yields are based on amortized cost. Mortgage-backed securities are assigned to maturity categories based on their final maturity.
Loans
Our loan portfolio is expected to produce higher yields than investment securities and other interest-earning assets; the absolute volume and mix of loans and the volume and mix of loans as a percentage of total earning assets is an important determinant of our net interest margin.
The following table sets forth the composition of our loan portfolio as of December 31:
| (dollars in thousands) | 2009 | 2008 | 2007 | 2006 | 2005 | ||||||||||||
|---|---|---|---|---|---|---|---|---|---|---|---|---|---|---|---|---|---|
Commercial loans and lines of credit |
$ | 77,634 | $ | 91,111 | $ | 72,590 | $ | 79,016 | $ | 67,759 | |||||||
Commercial construction |
99,490 | 109,484 | 129,272 | 137,155 | 112,383 | ||||||||||||
Commercial mortgages |
339,794 | 319,143 | 279,578 | 317,848 | 349,430 | ||||||||||||
Consumer residential construction |
47,379 | 69,589 | 86,621 | 98,066 | 126,708 | ||||||||||||
Residential mortgages |
176,159 | 138,323 | 84,892 | 56,221 | 40,817 | ||||||||||||
Consumer |
150,495 | 251,046 | 201,967 | 178,153 | 154,489 | ||||||||||||
Total loans |
$ | 890,951 | $ | 978,696 | $ | 854,920 | $ | 866,459 | $ | 851,586 | |||||||
Total loans decreased $87.745 million during 2009. We experienced higher balances in commercial mortgage loans (+$20.651 million) and residential mortgage loans (+$37.836 million). Commercial and consumer residential construction balances decreased (-$9.994 million and -$22.210 million, respectively), as did commercial loans and lines of credit (-$13.477 million). The decline in consumer loans is a result of the sale of our consumer finance subsidiary, Mariner Finance. During 2009, we were less aggressive in our loan origination activity, as we focused on improving asset quality in the current poor market environment.
Approximately 46.6% of our loans have adjustable rates as of December 31, 2009 compared to approximately 41.3% at December 31, 2008, including adjustable rate first mortgage loans indexed to either U.S. Treasury obligations or LIBOR and variable home equity lines of credit tied to the Prime
53
interest rate. Our variable rate loans adjust to the current interest rate environment, whereas fixed rates do not allow this flexibility. If interest rates were to increase in the future, our interest earned on the variable rate loans would improve, and if rates were to fall, the interest we earn would decline, thus impacting our interest income. Some variable rate loans have rate floors which may delay changes in interest income in a period of changing rates. See our discussion in "Interest Rate Sensitivity" later in this section for more information on interest rate fluctuations.
The following table sets forth the maturity distribution for our loan portfolio at December 31, 2009. Some of our loans may be renewed or repaid prior to maturity. Therefore, the following table should not be used as a forecast of our future cash collections.
| |
Maturing | |
|||||||||||||||||||||
|---|---|---|---|---|---|---|---|---|---|---|---|---|---|---|---|---|---|---|---|---|---|---|---|
| |
In one year or less | After 1 through 5 years |
After 5 years | |
|||||||||||||||||||
| (dollars in thousands) | Fixed | Variable | Fixed | Variable | Fixed | Variable | Total | ||||||||||||||||
Commercial loans and lines of credit |
$ | 20,869 | $ | 31,780 | $ | 13,116 | $ | 8,906 | $ | 1,124 | $ | 1,839 | $ | 77,634 | |||||||||
Commercial construction |
16,202 | 43,867 | 20,506 | 6,693 | 8,771 | 3,451 | 99,490 | ||||||||||||||||
Commercial mortgages |
78,987 | 24,365 | 158,353 | 39,795 | 14,314 | 23,980 | 339,794 | ||||||||||||||||
Consumer residential construction |
44,630 | — | 2,309 | — | 440 | — | 47,379 | ||||||||||||||||
Residential mortgages |
5,569 | 1,829 | 2,984 | 9,272 | 34,489 | 122,016 | 176,159 | ||||||||||||||||
Consumer |
4,573 | 14,869 | 9,937 | 56,023 | 38,599 | 26,494 | 150,495 | ||||||||||||||||
Total loans |
$ | 170,830 | $ | 116,710 | $ | 207,205 | $ | 120,689 | $ | 97,737 | $ | 177,780 | $ | 890,951 | |||||||||
Commercial Construction Portfolio
Our commercial construction portfolio consists of construction and development loans for commercial purposes and includes loans made to builders and developers of residential real estate projects. Of the total included above, $49.451 million represents loans made to borrowers for the development of residential real estate at December 31, 2009. This segment of the portfolio has exhibited greater weakness during 2009 due to overall weakness in the residential housing sector. As of December 31, 2009, $10.992 million (22%) of these loans are on nonaccrual.
The breakdown of the portion of the commercial construction portfolio made to borrowers for residential real estate is as follows as of December 31:
| (dollars in thousands) | 2009 | 2008 | |||||
|---|---|---|---|---|---|---|---|
Raw residential land |
$ | 6,946 | $ | 6,630 | |||
Residential subdivisions |
17,708 | 23,407 | |||||
Single residential lots |
5,228 | 4,338 | |||||
Single family construction |
6,940 | 12,547 | |||||
Townhome construction |
1,785 | 2,817 | |||||
Condominium unit construction |
956 | 1,410 | |||||
Multi-family unit construction |
9,888 | 10,907 | |||||
|
$ | 49,451 | $ | 62,056 | |||
Credit Risk Management
Credit risk is the risk of loss arising from the inability of a borrower to meet its obligations. We manage credit risk by evaluating the risk profile of the borrower, repayment sources, the nature of the underlying collateral, and other support given current events, conditions, and expectations. We attempt
54
to manage the risk characteristics of our loan portfolio through various control processes, such as credit evaluation of borrowers, establishment of lending limits, and application of lending procedures, including the holding of adequate collateral and the maintenance of compensating balances. However, we seek to rely primarily on the cash flow of our borrowers as the principal source of repayment. Although credit policies and evaluation processes are designed to minimize our risk, management recognizes that loan losses will occur and the amount of these losses will fluctuate depending on the risk characteristics of our loan portfolio, as well as general and regional economic conditions.
We provide for loan losses through the establishment of an allowance for loan losses by provisions charged against earnings. Our allowance represents an estimated reserve for existing losses in the loan portfolio. We deploy a systematic methodology for determining our allowance that includes a quarterly review process, risk rating, and adjustment to our allowance. We classify our portfolios as either consumer or commercial and monitor credit risk separately as discussed below. We evaluate the adequacy of our allowance continually based on a review of all significant loans, with a particular emphasis on nonaccruing, past due, and other loans that we believe require special attention.
The allowance consists of three elements: (1) specific reserves and valuation allowances for individual credits; (2) general reserves for types or portfolios of loans based on historical loan loss experience, judgmentally adjusted for current conditions and credit risk concentrations; and (3) unallocated reserves. Combined specific reserves and general reserves by loan type are considered allocated reserves. All outstanding loans are considered in evaluating the adequacy of the allowance.
Commercial
Our commercial portfolio includes all secured and unsecured loans to borrowers for commercial purposes, including commercial lines of credit and commercial real estate. Our process for evaluating commercial loans includes performing updates on all loans that we have rated for risk. Our commercial loans are generally reviewed individually, in accordance with the FASB's guidance on accounting for loan impairment, to determine impairment, accrual status, and the need for specific reserves. Our methodology incorporates a variety of risk considerations, both qualitative and quantitative. Quantitative factors include our historical loss experience by loan type, collateral values, financial condition of borrowers, and other factors. Qualitative factors include judgments concerning general economic conditions that may affect credit quality, credit concentrations, the pace of portfolio growth, and delinquency levels; these qualitative factors are evaluated in connection with the unallocated portion of our allowance for loan losses. We periodically engage outside firms and experts to independently assess our methodology and perform various loan review functions.
The process of establishing the allowance with respect to our commercial loan portfolio begins when a loan officer initially assigns each loan a risk rating, using established credit criteria. Approximately 50% of our risk grades are subject to review and validation annually by an independent consulting firm, as well as periodically by our internal credit review function. Our methodology employs management's judgment as to the level of future losses on existing loans based on our internal review of the loan portfolio, including an analysis of the borrowers' current financial position, and the consideration of current and anticipated economic conditions and their potential effects on specific borrowers and/or lines of business. In determining our ability to collect certain loans, we also consider the fair value of any underlying collateral. In addition, we evaluate credit risk concentrations, including trends in large dollar exposures to related borrowers, industry and geographic concentrations, and economic and environmental factors.
A commercial loan is determined to be impaired when, based on current information and events, it is probable that we will be unable to collect all amounts due according to the contractual terms of the loan agreement. In general, impaired loans (both commercial and consumer) include nonaccrual loans and troubled debt restructure ("TDR") loans. Such a loan is not considered impaired during a minimal
55
period of delay in payment if we expect to collect all amounts due, including past-due interest. We generally consider a minimal period of delay in payment to include delinquency up to 90 days. Commercial loans we consider impaired at December 31, 2009 and December 31, 2008 totaled $33.639 million and $26.695 million, respectively. The reserve for loan losses for commercial impaired loans was $328,000 at December 31, 2009 and $1.264 million at December 31, 2008. The average recorded investment in commercial impaired loans was approximately $25.844 million, $21.530 million, and $14.287 million for the years ended December 31, 2009, 2008, and 2007, respectively, and no income has been accrued or collected on the majority of these loans while they have been classified as impaired.
The allowance for impaired loans (both commercial and consumer) represents the fair value deficiencies for those loans for which the estimated fair value of the collateral was less than our carrying amount of the loan as of December 31, 2009. Not all of the loans newly classified as impaired since December 31, 2008 required impairment reserves, as some of the loans' collateral had estimated fair values greater than the carrying amount of the loan or the loan has been written down to its estimated fair value.
Consumer
Our consumer portfolio includes first- and second-lien mortgage loans and other loans to individuals. Generally, consumer loans are segregated into homogeneous pools with similar risk characteristics. Trends and current conditions in consumer and residential mortgage pools are analyzed and historical loss experience is adjusted accordingly. Quantitative and qualitative adjustment factors for the consumer and residential mortgage portfolios are consistent with those for the commercial portfolios. Consumer loans that are greater than 120 days past due are generally charged off.
Consumer loans we consider impaired at December 31, 2009 and December 31, 2008 totaled $15.208 million and $20.945 million, respectively. The reserve for loan losses for consumer impaired loans was $405,000 at December 31, 2009 and $1.444 million at December 31, 2008. The average recorded investment in consumer impaired loans was approximately $17.466 million, $26.214 million, and $26.071 million for the years ended December 31, 2009, 2008, and 2007, respectively.
Additional information about our nonaccrual loans, including interest income that we would have received had these loans been performing according to their contractual terms, is found in Note 5 to our Consolidated Financial Statements included in Item 8 of Part II of this Form 10-K.
Residential Mortgage Loans
Residential mortgage loans, including ALT A second mortgages, are analyzed as pools with historical loss rates applied. Management generally may modify the historical loss rates based upon prevailing economic conditions or trends in delinquency and loss. Loans delinquent greater than 90 days are individually reviewed and assessed for accrual status and the need for specific reserves.
Repurchased Loans. In accordance with relevant accounting guidance on accounting for loans and debt securities acquired in a transfer, we record repurchased loans at their estimated fair value at the time of repurchase. At December 31, 2009 and 2008, we maintained $3.894 million and $6.335 million, respectively, in loans repurchased in accordance with covenants in our sales agreements with investors.
All repurchased loans which were 90 days delinquent as of December 31, 2009 were evaluated individually for impairment, with any estimated loss compared to the carrying amount recorded as a specific reserve. All other repurchased loans were evaluated collectively for impairment.
All repurchased nonaccrual loans are currently in the process of collection and the resolution of many of these loans may be through foreclosure of the property.
56
Transferred Loans. In accordance with the FASB's guidance on accounting for certain mortgage- banking activities, any loans which are originally originated for sale into the secondary market and which we subsequently elect to transfer into the Company's loan portfolio are valued at fair value at the time of the transfer with any decline in value recorded as a charge to operating expense.
We maintain $22.439 million in first-lien mortgage loans and $1.713 million in second-lien mortgage loans that were transferred from loans held for sale to our mortgage and consumer loan portfolios, respectively at December 31, 2009. We maintained $11.799 million in transferred first-lien mortgage loans and $2.811 million in transferred second-lien mortgage loans at December 31, 2008.
In establishing a loan's estimated fair value, management makes significant assumptions concerning the ultimate collectibility of delinquent loans and their ultimate realizable value. While these projections are made with the most current data available to management, actual realized losses could differ due to the changes in the borrowers' willingness or ability to resolve the delinquency status, changes in the actual volume of future repurchases, changes in the real estate market, or changes in market values of those loans which are liquidated. Management updates these assumptions continually as greater experience becomes available.
Unallocated
The unallocated portion of the allowance is intended to provide for losses that are not identified when establishing the specific and general portions of the allowance and is based upon management's evaluation of various conditions that are not directly measured in the determination of the formula and specific allowances. Such conditions include general economic and business conditions affecting key lending areas, credit quality trends (including trends in delinquencies and nonperforming loans expected to result from existing conditions), loan volumes and concentrations, specific industry conditions within portfolio categories, recent loss experience in particular loan categories, duration of the current business cycle, bank regulatory examination results, findings of external loan review examiners, and management's judgment with respect to various other conditions including loan administration and management and the quality of risk identification systems. Executive management reviews these conditions quarterly. We have risk management practices designed to ensure timely identification of changes in loan risk profiles; however, undetected losses may exist inherently within the loan portfolio. The judgmental aspects involved in applying the risk grading criteria, analyzing the quality of individual loans, and assessing collateral values can also contribute to undetected, but probable, losses.
Our total allowance at December 31, 2009 is considered by management to be sufficient to address the credit losses inherent in the current loan portfolio. However, our determination of the appropriate allowance level is based upon a number of assumptions we make about future events, which we believe are reasonable, but which may or may not prove valid. Thus, there can be no assurance that our charge-offs in future periods will not exceed our allowance for loan losses or that we will not need to make additional increases in our allowance for loan losses.
57
The following table summarizes the activities in our allowance for loan losses for the years ended December 31:
| (dollars in thousands) | 2009 | 2008 | 2007 | 2006 | 2005 | |||||||||||||
|---|---|---|---|---|---|---|---|---|---|---|---|---|---|---|---|---|---|---|
Allowance for loan losses, beginning of year |
$ | 16,777 | $ | 12,789 | $ | 12,399 | $ | 11,743 | $ | 9,580 | ||||||||
Loans charged off: |
||||||||||||||||||
Commercial loans and lines of credit |
(517 | ) | — | (67 | ) | — | (15 | ) | ||||||||||
Commercial construction |
(2,370 | ) | (401 | ) | (1,481 | ) | — | — | ||||||||||
Commercial mortgages |
(871 | ) | (630 | ) | (495 | ) | — | — | ||||||||||
Consumer residential construction |
(1,493 | ) | (331 | ) | — | (186 | ) | — | ||||||||||
Residential mortgages |
(4,546 | ) | (4,658 | ) | (1,038 | ) | (99 | ) | — | |||||||||
Consumer (1) |
(2,650 | ) | (5,446 | ) | (5,908 | ) | (1,740 | ) | (1,492 | ) | ||||||||
Total loans charged off |
(12,447 | ) | (11,466 | ) | (8,989 | ) | (2,025 | ) | (1,507 | ) | ||||||||
Recoveries: |
||||||||||||||||||
Commercial loans and lines of credit |
— | 13 | — | — | — | |||||||||||||
Commercial construction |
— | — | — | — | — | |||||||||||||
Commercial mortgages |
4 | 3 | — | — | — | |||||||||||||
Consumer residential construction |
— | — | — | 22 | 89 | |||||||||||||
Residential mortgages |
46 | 9 | 43 | — | — | |||||||||||||
Consumer (2) |
231 | 367 | 421 | 344 | 294 | |||||||||||||
Total recoveries |
281 | 392 | 464 | 366 | 383 | |||||||||||||
Net charge-offs |
(12,166 | ) | (11,074 | ) | (8,525 | ) | (1,659 | ) | (1,124 | ) | ||||||||
Allowance for acquired loans (3) |
— | 279 | — | — | — | |||||||||||||
Provision for loan losses—Bank |
11,660 | 10,856 | 6,700 | 150 | 1,575 | |||||||||||||
Provision for loan losses—Mariner Finance |
— | 3,927 | 2,215 | 2,165 | 1,712 | |||||||||||||
Mariner Finance allowance for loan losses |
(4,632 | ) | — | — | — | — | ||||||||||||
Allowance for loan losses, end of period |
$ | 11,639 | $ | 16,777 | $ | 12,789 | $ | 12,399 | $ | 11,743 | ||||||||
Loans (net of premiums and discounts): |
||||||||||||||||||
Period-end balance |
$ | 890,951 | $ | 978,696 | $ | 854,920 | $ | 866,459 | $ | 851,586 | ||||||||
Average balance during period |
889,345 | 821,699 | 781,843 | 808,034 | 764,785 | |||||||||||||
Allowance as a percentage of period-end loan balance |
1.31 | % | 1.71 | % | 1.50 | % | 1.43 | % | 1.38 | % | ||||||||
Percent of average loans: |
||||||||||||||||||
Provision for loan losses (4) |
1.31 | % | 1.32 | % | 0.86 | % | 0.02 | % | 0.21 | % | ||||||||
Net charge-offs |
1.37 | % | 1.35 | % | 1.09 | % | 0.21 | % | 0.15 | % | ||||||||
- (1)
- For
2008, 2007, 2006, and 2005, includes charge-offs of $3.398 million, $2.160 million, $1.673 million, and
$1.391 million, respectively, related to Mariner Finance consumer loans. 2009 does not include any activity from the discontinued operations of Mariner Finance.
- (2)
- For
2008, 2007, 2006, and 2005, includes recoveries of $298,000, $387,000, $312,000, and $281,000, respectively, related to Mariner Finance consumer loans.
2009 does not include any activity from the discontinued operations of Mariner Finance.
- (3)
- Allowance
acquired by Mariner Finance in a transaction with Loans, USA.
- (4)
- For 2008, 2007, 2006, and 2005, includes only the provision related to the Bank.
58
The following table summarizes our allocation of allowance by loan type as of December 31:
| |
2009 | 2008 | 2007 | |||||||||||||||||||||||||
|---|---|---|---|---|---|---|---|---|---|---|---|---|---|---|---|---|---|---|---|---|---|---|---|---|---|---|---|---|
| (dollars in thousands) | Amount | Percent of Total |
Percent of Loans to Total Loans |
Amount | Percent of Total |
Percent of Loans to Total Loans |
Amount | Percent of Total |
Percent of Loans to Total Loans |
|||||||||||||||||||
Commercial loans and lines of credit |
$ | 817 | 7.0 | % | 8.7 | % | $ | 824 | 4.9 | % | 9.3 | % | $ | 606 | 4.7 | % | 8.5 | % | ||||||||||
Commercial construction |
1,647 | 14.1 | % | 11.2 | % | 2,702 | 16.1 | % | 11.2 | % | 1,456 | 11.4 | % | 15.1 | % | |||||||||||||
Commercial mortgages |
3,336 | 28.7 | % | 38.1 | % | 2,985 | 17.8 | % | 32.6 | % | 2,316 | 18.1 | % | 32.7 | % | |||||||||||||
Consumer residential construction |
293 | 2.5 | % | 5.3 | % | 583 | 3.5 | % | 7.1 | % | 719 | 5.6 | % | 10.1 | % | |||||||||||||
Residential mortgages |
834 | 7.2 | % | 19.8 | % | 1,576 | 9.4 | % | 14.1 | % | 1,542 | 12.1 | % | 10.0 | % | |||||||||||||
Consumer |
882 | 7.6 | % | 16.9 | % | 4,683 | 27.9 | % | 25.7 | % | 4,021 | 31.4 | % | 23.6 | % | |||||||||||||
Unallocated |
3,830 | 32.9 | % | — | 3,424 | 20.4 | % | — | 2,129 | 16.7 | % | — | ||||||||||||||||
Total |
$ | 11,639 | 100.0 | % | 100.0 | % | $ | 16,777 | 100.0 | % | 100.0 | % | $ | 12,789 | 100.0 | % | 100.0 | % | ||||||||||
| |
2006 | 2005 | |||||||||||||||||
|---|---|---|---|---|---|---|---|---|---|---|---|---|---|---|---|---|---|---|---|
| (dollars in thousands) | Amount | Percent of Total |
Percent of Loans to Total Loans |
Amount | Percent of Total |
Percent of Loans to Total Loans |
|||||||||||||
Commercial loans and lines of credit |
$ | 926 | 7.5 | % | 9.1 | % | $ | 1,302 | 11.1 | % | 8.0 | % | |||||||
Commercial construction |
2,749 | 22.2 | % | 15.8 | % | 1,031 | 8.8 | % | 13.2 | % | |||||||||
Commercial mortgages |
3,073 | 24.8 | % | 36.7 | % | 2,908 | 24.8 | % | 41.0 | % | |||||||||
Consumer residential construction |
1,068 | 8.6 | % | 11.3 | % | 1,461 | 12.4 | % | 14.9 | % | |||||||||
Residential mortgages |
28 | 0.2 | % | 6.5 | % | 18 | 0.1 | % | 4.8 | % | |||||||||
Consumer |
2,928 | 23.6 | % | 20.6 | % | 2,242 | 19.1 | % | 18.1 | % | |||||||||
Unallocated |
1,627 | 13.1 | % | — | 2,781 | 23.7 | % | — | |||||||||||
Total |
$ | 12,399 | 100.0 | % | 100.0 | % | $ | 11,743 | 100.0 | % | 100.0 | % | |||||||
Based upon management's evaluation, provisions are made to maintain the allowance as a best estimate of inherent losses within the portfolio. The allowance for loan losses totaled $11.639 million and $16.777 million as of December 31, 2009 and December 31, 2008, respectively. The changes in the allowance from period to period reflects management's ongoing application of its methodologies to establish the allowance, which, in 2009, included increases in the allowance for commercial mortgage loans which received internal risk rating downgrades during the year, as well as increases to reflect negative market trends and other qualitative factors. The allowance for loan losses may not move in direct proportion to changes in our overall trends in delinquent, nonperforming, or impaired loans. The specific loans that make up those categories change from period to period. Impairment on those loans, which would be reflected in the allowance for loan losses, might or might not exist, depending on the specific circumstances of each loan.
Specific and general reserves for the commercial construction and the residential mortgage portfolios decreased (-$1.055 million and -$742,000, respectively) and reflect the movement of delinquent loans through the foreclosure process and the partial charge-offs of certain loans with specific reserves as of December 31, 2008. During 2009, we charged-off $2.370 million in commercial construction loans and $4.546 million in residential mortgage loans. The specific and general reserves for commercial mortgages increased as delinquencies increased and collateral values decreased. Specific and general reserves for consumer loans decreased due to the sale of our consumer finance subsidiary, Mariner Finance. Unallocated reserves increased primarily based upon qualitative market area factors, including, among other things, the current poor market environment. In 2009, $19.809 million in loans were transferred to real estate acquired through foreclosure as they moved through the foreclosure process.
59
The provision for loan losses recognized to maintain the allowance was $11.660 million for 2009 compared to $14.783 million for 2008 ($3.927 million of which was attributable to Mariner Finance). We recorded net charge-offs of $12.166 million during 2009 compared to net charge-offs of $11.074 million in 2008, primarily due to increases in net charge-offs of construction loans, commercial loans, and commercial mortgages. During 2009, net charge-offs as compared to average loans outstanding increased to 1.37%, compared to 1.35% during 2008.
Our allowance as a percentage of outstanding loans has decreased from 1.71% as of December 31, 2008 to 1.31% as of December 31, 2009, reflecting the changes in our loss estimates and the results of the application of our loss estimate methodology. Charge-offs and transfers to real estate acquired through foreclosure continued to be significant in 2009; however, asset quality began improving at the end of 2009, with fewer loans becoming delinquent and/or impaired. Management believes the allowance for loan losses is adequate as of December 31, 2009.
Although management uses available information to establish the appropriate level of the allowance for loan losses, future additions or reductions to the allowance may be necessary based on estimates that are susceptible to change as a result of changes in economic conditions and other factors. As a result, our allowance for loan losses may not be sufficient to cover actual loan losses, and future provisions for loan losses could materially adversely affect the Company's operating results. In addition, various regulatory agencies, as an integral part of their examination process, periodically review the Company's allowance for loan losses. Such agencies may require the Company to recognize adjustments to the allowance based on their judgments about information available to them at the time of their examination.
60
Nonperforming Assets
Nonperforming assets, expressed as a percentage of total assets, totaled 4.15% at December 31, 2009 and 4.42% at December 31, 2008. The following tables show the distribution of nonperforming assets and loans greater than 90 days past due and still accruing as of December 31:
| (dollars in thousands) | 2009 | 2008 | 2007 | 2006 | 2005 | ||||||||||||
|---|---|---|---|---|---|---|---|---|---|---|---|---|---|---|---|---|---|
Nonaccruing loans: |
|||||||||||||||||
Commercial loans and lines of credit |
$ | 535 | $ | 603 | $ | — | $ | 1,158 | $ | 1,015 | |||||||
Commercial construction |
10,992 | 14,544 | 5,268 | — | — | ||||||||||||
Commercial mortgages |
9,773 | 4,134 | 3,926 | 575 | 687 | ||||||||||||
Consumer residential construction |
3,815 | 8,222 | 3,362 | 539 | 393 | ||||||||||||
Alt A mortgages (1) |
3,114 | 6,772 | 9,203 | 613 | — | ||||||||||||
Other residential mortgages |
6,219 | 1,343 | 823 | 257 | 45 | ||||||||||||
Other consumer |
1,351 | 3,145 | 1,807 | 1,016 | 879 | ||||||||||||
|
35,799 | 38,763 | 24,389 | 4,158 | 3,019 | ||||||||||||
Real estate acquired through foreclosure: |
|||||||||||||||||
Commercial loans and lines of credit |
— | — | — | — | — | ||||||||||||
Commercial construction |
9,347 | 4,909 | 3,601 | — | — | ||||||||||||
Commercial mortgages |
4,112 | 2,080 | 1,101 | — | 866 | ||||||||||||
Consumer residential construction |
4,203 | 2,826 | 2,299 | 349 | 65 | ||||||||||||
Alt A mortgages (1) |
1,858 | 9,079 | 11,980 | 527 | — | ||||||||||||
Other residential mortgages |
240 | — | — | 1,564 | — | ||||||||||||
Other consumer |
1,870 | 100 | — | — | — | ||||||||||||
|
21,630 | 18,994 | 18,981 | 2,440 | 931 | ||||||||||||
Total nonperforming assets |
$ | 57,429 | $ | 57,757 | $ | 43,370 | $ | 6,598 | $ | 3,950 | |||||||
Loans past-due 90 days or more and accruing: |
|||||||||||||||||
Commercial loans and lines of credit |
$ | 499 | $ | — | $ | 92 | $ | — | $ | — | |||||||
Commercial construction |
— | 210 | — | 14,339 | — | ||||||||||||
Commercial mortgages |
3,886 | 1,634 | 663 | 1,939 | — | ||||||||||||
Consumer residential construction |
— | 1,587 | 219 | 1,044 | 531 | ||||||||||||
Alt A mortgages (1) |
65 | 1,519 | 1,825 | 9,842 | — | ||||||||||||
Other residential mortgages |
4,642 | 1,739 | — | — | 328 | ||||||||||||
Other consumer |
132 | 2,990 | 220 | 110 | 1 | ||||||||||||
|
$ | 9,224 | $ | 9,679 | $ | 3,019 | $ | 27,274 | $ | 860 | |||||||
- (1)
- Includes both first- and second-lien loans
Nonaccrual loans decreased $2.964 million between December 31, 2008 and December 31, 2009, as troubled loans moved through the process of charge-off and/or foreclosure. Additionally, the nonaccrual balance at December 31, 2008 included $2.988 million in Mariner Finance consumer loans. Although total nonaccrual loans decreased, we did experience increases in nonaccrual commercial mortgages and other residential mortgages. The commercial mortgage loan nonaccrual balance consisted of 19 loans, with the largest balance amounting to $4.209 million. All of these loans were placed on nonaccrual status during 2009. All of the commercial mortgage loans that were on nonaccrual in 2008 were paid off by the borrower, charged-off and/or foreclosed, or otherwise resolved as a performing asset during 2009. The residential mortgage nonaccrual balance consisted of 48 loans, with the largest balance amounting to $899,000. The majority of these loans were placed on nonaccrual status during 2009.
61
Real estate acquired through foreclosure increased $2.636 million when compared to December 31, 2008 as more loans moved through the foreclosure process. Commercial and consumer construction properties increased due to the addition of 15 properties for $9.539 million, partially offset by write-downs and disposals of properties. The increase in commercial mortgages was due to the addition of 4 properties in the amount of $2.658 million, partially offset by write-downs and disposals of properties. Foreclosed consumer properties consisted primarily of two properties, one in the amount of $1.800 million.
Real estate acquired through foreclosure is carried at estimated fair value, less estimated costs to sell.
Loans 90 days delinquent and accruing, which are loans that are well secured and in the process of collection, decreased from $9.679 million at December 31, 2008 to $9.224 million as of December 31, 2009. Included in the decrease are decreases in consumer residential construction loans of $1.587 million and Alt A residential mortgage loans of $1.454 million. Increases occurred in the commercial, commercial mortgage, and residential mortgage portfolios. The commercial mortgage total, which increased due to the deterioration of the commercial real estate market, is made up of 5 loans, with the largest balance amounting to $1.378 million. The other residential mortgage total is made up of 14 loans, with the largest loan totaling $638,000. The residential real estate market continues to be depressed in our market area. We had one commercial loan in the amount of $499,000 included in loans 90 days delinquent and accruing.
Troubled Debt Restructures
Troubled debt restructures, which are loans that have been restructured due to the borrower's inability to maintain a current status on the loan, that are not included in the nonaccrual balance above amounted to approximately $13.048 million for 2009 and $9.074 million for 2008. Our TDRs are generally reviewed individually, at the time of restructure, to determine impairment, accrual status, and the need for specific reserves. For collateral dependent loans, we utilize the fair value of the collateral in determining impairment. For noncollateral dependent loans, we calculate the present value of expected future cash flows to determine fair value and impairment.
Potential Problem Loans
Potential problem loans consist of loans that are currently performing in accordance with contractual terms; however, management has designated these assets as potential problem loans due to concerns about the ability of the obligor to continue to comply with repayment terms that may result from the obligor's potential operating or financial difficulties. At the end of 2009, loans of this type that are not included in the above table of nonperforming and past-due loans amounted to approximately $102.460 million, compared to $74.158 million at the end of 2008. Potential problem commercial loans, including loans secured by real estate, increased $26.962 million, while consumer residential construction potential problem loans decreased by $1.660 million. Seventy-nine of the loans (94% of total potential problem loans) are commercial relationships that are secured by commercial real estate and other business assets that are considered sufficient to collect all amounts due in the event of deterioration in the customer's financial condition. The remaining 9 loans (6% of total potential problem loans) are consumer residential construction loans that are secured by property with residential real estate as the highest and best use and have an appraised value in excess of the carrying value of the loan. The average relationship was $782,141 and the largest relationship outstanding balance was $6.782 million at December 31, 2009. Depending on changes in the economy and other future events, these loans and others not presently identified as potential problem loans could be reclassified as nonperforming or impaired loans in the future.
62
Deposits
We use deposits as the primary source of funding of our loans. We offer individuals and businesses a wide variety of deposit accounts. These accounts include checking, savings, money market, and certificates of deposit and are obtained primarily from communities we serve.
Deposits totaled $1.147 billion as of December 31, 2009, increasing $196.271 million or 20.7% over the December 31, 2008 balance of $950.233 million, primarily due to an aggressive time deposit marketing campaign. We took in approximately $217.542 million in time deposits associated with a newly launched program for acquiring nonbrokered national deposits.
The following table details the average amount and the average rate paid for each category of deposits as of December 31:
| |
2009 | 2008 | 2007 | ||||||||||||||||
|---|---|---|---|---|---|---|---|---|---|---|---|---|---|---|---|---|---|---|---|
| (dollars in thousands) | Average Balance |
Average Rate |
Average Balance |
Average Rate |
Average Balance |
Average Rate |
|||||||||||||
NOW accounts |
$ | 6,784 | 0.65 | % | $ | 13,249 | 0.58 | % | $ | 9,858 | 0.21 | % | |||||||
Money market accounts |
163,910 | 0.84 | % | 210,003 | 1.47 | % | 287,837 | 3.52 | % | ||||||||||
Savings accounts |
55,122 | 0.32 | % | 54,897 | 0.33 | % | 56,935 | 0.31 | % | ||||||||||
Time deposits |
713,855 | 3.26 | % | 525,700 | 4.04 | % | 384,157 | 4.54 | % | ||||||||||
Total interest-bearing deposits |
939,671 | 2.65 | % | 803,849 | 3.06 | % | 738,787 | 3.76 | % | ||||||||||
Noninterest-bearing demand deposits |
116,508 | 131,242 | 163,011 | ||||||||||||||||
Total deposits |
$ | 1,056,179 | 2.35 | % | $ | 935,091 | 2.63 | % | $ | 901,798 | 3.08 | % | |||||||
The following table provides the maturities of certificates of deposit in amounts of $100,000 or more at December 31:
| (dollars in thousands) | 2009 | 2008 | ||||||
|---|---|---|---|---|---|---|---|---|
Maturing in: |
||||||||
3 months or less |
$ | 40,999 | $ | 27,740 | ||||
Over 3 months through 6 months |
94,940 | 35,029 | ||||||
Over 6 months through 12 months |
134,651 | 63,940 | ||||||
Over 12 months |
127,304 | 62,181 | ||||||
|
$ | 397,894 | $ | 188,890 | ||||
Core deposits represent deposits which we believe will not be affected by changes in interest rates and, therefore, will be retained regardless of the movement of interest rates. We consider our core deposits to be all noninterest-bearing, NOW, money market accounts less than $100,000, and saving deposits, as well as all time deposits less than $100,000 that mature in greater than one year. At December 31, 2009, our core deposits were $426.217 million. The remainder of our deposits could be susceptible to attrition due to interest rate movements.
Borrowings
Our borrowings consist of short-term promissory notes issued to certain qualified investors, short-term and long-term advances from the FHLB, and a mortgage loan at December 31, 2009. At December 31, 2008, our borrowings also included a line of credit to finance consumer receivables held by Mariner Finance. Our short-term promissory notes are in the form of commercial paper, which reprice daily and have maturities of 270 days or less. Our advances from the FHLB may be in the form of short-term or long-term obligations. Short-term advances have maturities for one year or less and
63
can be paid without penalty. Long-term borrowings through the FHLB have original maturities up to 15 years and generally contain prepayment penalties.
Long-term borrowings, which totaled $95.672 million and $177.868 million at December 31, 2009 and December 31, 2008, respectively, consist of long-term advances from the FHLB and a mortgage loan on our former headquarters building, and, in 2008, Mariner Finance's consumer finance receivable line of credit. The amortized cost of long-term FHLB advances totaled $85.000 million at December 31, 2009 and December 31, 2008; however, $60.000 million of the advances are recorded at fair value ($61.592 million at December 31, 2009 and $64.073 million at December 31, 2008) in accordance with FASB guidance, making the total carrying amount of long-term FHLB advances $86.592 million at December 31, 2009 and $89.073 million at December 31, 2008. As of December 31, 2009 and December 31, 2008, the balance on the mortgage loan was $9.080 million and $9.249 million, respectively. The December 31, 2008 balance on the consumer receivable line of credit was $79.546 million.
Short-term borrowings consist of short-term promissory notes and short-term advances from the FHLB. These borrowings decreased from $43.128 million at December 31, 2008 to $26.365 million at December 31, 2009.
In the past, to further our funding and capital needs, we raised capital by issuing Trust Preferred Securities through statutory trusts (the "Trusts"), which are wholly-owned by First Mariner Bancorp. The Trusts used the proceeds from the sales of the Trust Preferred Securities, combined with First Mariner Bancorp's equity investment in these Trusts, to purchase subordinated deferrable interest debentures from First Mariner Bancorp. The debentures are the sole assets of the Trusts. Aggregate debentures as of December 31, 2009 and December 31, 2008 were $73.724 million.
The Trust Preferred Securities are mandatorily redeemable, in whole or in part, upon repayment of their underlying subordinated debentures at their respective maturities or their earlier redemption. The subordinated debentures are redeemable prior to maturity at First Mariner's option on or after the optional redemption dates. Beginning with January 2009 payments, First Mariner suspended interest payments on the debentures, as permitted under the terms of the debentures. The suspension does not constitute an event of default. The debentures continue to accrue interest, which will have to be fully repaid prior to the expiration of the deferral period. The total deferral period may not exceed 20 consecutive quarters.
First Mariner Bancorp has fully and unconditionally guaranteed all of the obligations of the Trusts.
Under applicable regulatory guidelines, a portion of the Trust Preferred Securities will qualify as Tier I capital, and the remaining portion will qualify as Tier II capital. Under applicable regulatory guidelines, $10.158 million of the outstanding Trust Preferred Securities qualify as Tier I capital and $6.854 million of the remaining Trust Preferred Securities qualify as Tier II capital at December 31, 2009. The total amount of our Trust Preferred Securities allowable as part of capital was limited to $17.012 million as of December 31, 2009.
See Notes 8 and 9 to the Consolidated Financial Statements included in Item 8 of Part II of this Form 10-K for further details about our borrowings and additional borrowing capacity. See "Subsequent Events" later in this section for information regarding the subsequent event related to the Trust Preferred Securities.
Capital Resources
Stockholders' equity decreased $19.028 million during 2009 to $26.987 million at December 31, 2009 from $46.015 million at December 31, 2008. The retained deficit increased by the net loss of $22.284 million for 2009, partially offset by the cumulative effect of accounting change adjustment related to securities of $1.148 million.
64
Common stock and additional paid-in-capital increased by $30,000 due to the vesting of previously granted stock options during 2009. We did not repurchase any common stock during 2009, nor was any stock issued through the employee stock purchase plan. Accumulated other comprehensive loss, which is derived from the fair value calculations for securities available for sale, decreased by $2.078 million.
See "Subsequent Events" later in this section for subsequent events related to authorized shares and other capital considerations.
Banking regulatory authorities have implemented strict capital guidelines directly related to the credit risk associated with an institution's assets. Banks and bank holding companies are required to maintain capital levels based on their "risk-adjusted" assets so that categories of assets with higher "defined" credit risks will require more capital support than assets with lower risk. Additionally, capital must be maintained to support certain off-balance sheet instruments.
Capital is classified as Tier 1 capital (common stockholders' equity less certain intangible assets plus a portion of the Trust Preferred Securities) and Total Capital (Tier 1 plus the allowed portion of the allowance for loan losses plus any off-balance sheet reserves and the portion of Trust Preferred Securities not included in Tier 1 capital). Minimum required levels must at least equal 4% for Tier 1 capital and 8% for Total Capital. In addition, institutions must maintain a minimum of 4% leverage capital ratio (Tier 1 capital to average total assets for the previous quarter).
We regularly monitor our capital adequacy ratios and attempt to ensure that we meet our regulatory capital requirements. The regulatory capital ratios are shown below as of December 31:
| |
December 31, |
Minimum Requirements for Capital Adequacy Purposes |
|
|||||||||||||||
|---|---|---|---|---|---|---|---|---|---|---|---|---|---|---|---|---|---|---|
| |
To be Well Capitalized Under Prompt Corrective Action Provision |
|||||||||||||||||
| |
2009 | 2008 | 2007 | |||||||||||||||
Regulatory capital ratios: |
||||||||||||||||||
Leverage: |
||||||||||||||||||
Consolidated |
1.4 | % | 4.3 | % | 6.9 | % | 4.0 | % | 5.0 | % | ||||||||
Bank |
6.2 | % | 5.8 | % | 7.1 | % | 4.0 | % | 5.0 | % | ||||||||
Tier 1 capital to risk-weighted assets: |
||||||||||||||||||
Consolidated |
1.8 | % | 5.0 | % | 8.2 | % | 4.0 | % | 6.0 | % | ||||||||
Bank |
7.9 | % | 6.8 | % | 8.6 | % | 4.0 | % | 6.0 | % | ||||||||
Total capital to risk-weighted assets: |
||||||||||||||||||
Consolidated |
3.6 | % | 9.9 | % | 14.2 | % | 8.0 | % | 10.0 | % | ||||||||
Bank |
9.1 | % | 8.8 | % | 10.4 | % | 8.0 | % | 10.0 | % | ||||||||
On September 18, 2009, the Bank entered into an Agreement with the FDIC and the Maryland Division of Financial Regulation (the "Division"), pursuant to which it consented to the entry of an Order to Cease and Desist ("the September Order"), which directs the Bank to (i) increase its capitalization, (ii) improve earnings, (iii) reduce nonperforming loans, (iv) strengthen management policies and practices, and (v) reduce reliance on noncore funding. The September Order replaces the informal agreement that was previously in place among the parties. The September Order requires the Bank to adopt a plan to achieve and maintain a Tier 1 Leverage Capital ratio of at least 7.5% of the Bank's average total assets and a Total Risk-Based Capital ratio of at least 11% of its Total Risk Weighted Assets by June 30, 2010. The Bank has presented a plan to the FDIC and the Division detailing how it will achieve a Tier 1 Leverage Capital ratio of 6.5% and a Total Risk-Based Capital ratio of 10% by March 31, 2010, and a Tier 1 Leverage Capital ratio of 7.5% and a Total Risk-Based Capital ratio of 11% by June 30, 2010. At December 31, 2009, the Bank reported a Tier 1 Leverage Capital ratio of 6.2% and a Total Risk-Based Capital ratio of 9.1%. Within 30 days after the end of each calendar year, the Bank must submit an annual budget and profit plan and a plan that takes into account the Bank's pricing structure, the Bank's cost of funds and how this can be reduced, and the
65
level of provision expense for adversely classified loans. To address reliance on noncore funding, the Bank must adopt and submit a liquidity plan intended to reduce the Bank's reliance on noncore funding, wholesale funding sources, and high-cost rate-sensitive deposits. While the September Order is in effect, the Bank may not pay dividends or management fees without the FDIC's prior consent, the Bank may not accept, renew, or roll over any brokered deposits or pay effective yields on deposits that are greater than those generally paid in its markets. A copy of the September Order was filed as an exhibit to the Company's Form 8-K filed with the SEC on September 21, 2009 and is filed as Exhibit 10.33 hereto.
First Mariner Bancorp is also a party to an agreement with the FRB (the "FRB Agreement"), which requires it to: (i) develop and implement a strategic business plan that includes (a) actions that will be taken to improve our operating performance and reduce the level of parent company leverage, (b) a comprehensive budget and an expanded budget review process, (c) a description of the operating assumptions that form the basis for major projected income and expense components and provisions needed to maintain an adequate loan loss reserve, and (d) a capital plan incorporating all capital needs, risks and regulatory guidelines; and (ii) submit plans to improve enterprise-wide risk management and effectiveness of internal audit programs. First Mariner Bancorp has also agreed to provide the FRB with advance notice of any significant capital transactions. The new FRB Agreement ("New FRB Agreement") prohibits First Mariner and the Bank from taking any of the following actions without the FRB's prior written approval: (i) declaring or paying any dividends; (ii) taking dividends from the Bank; (iii) making any distributions of interest, principal or other sums on First Mariners' subordinated debentures or trust preferred securities; (iv) incurring, increasing or guaranteeing any debt; or (v) repurchasing, redeeming any shares of its stock. Under the New FRB Agreement, First Mariner had to submit a written plan to the FRB by January 28, 2010 to maintain sufficient capital, on a consolidated basis, such that First Mariner satisfies the FRB's minimum capital requirements. To satisfy the FRB's minimum capital requirements, First Mariner's consolidated Tier 1 capital to average assets, Tier 1 capital to risk-weighted assets, and total capital to risk-weighted assets ratios at each quarter end must be at least 4.0%, 4.0%, and 8.0%, respectively. At December 31, 2009, those capital ratios were 1.4%, 1.8%, and 3.6%%, respectively, which were at an "under-capitalized" level under the prompt corrective action regulations of the FRB. A copy of the New FRB Agreement is an exhibit to the Company's Form 8-K filed with the SEC on November 27, 2009 and is filed as Exhibit 10.34 hereto. See discussion later in this section related to a trust preferred exchange subsequent event that is expected to raise our capital level to above adequately capitalized subsequent to December 31, 2009.
On April 22, 2009, the Bank entered into an agreement (the "April Agreement") with the FDIC relating to alleged violations of consumer protection regulations relative to its fair lending practices pursuant to which it consented to the issuance of an Order ("April Order"). The April Order requires the Bank to pay up to $950,000 in restitution to the Affected Borrowers. It also imposes a civil money penalty of $50,000, all amounts for which were fully reserved in the final quarter of 2008. In addition to requiring the Bank to cease and desist from violating certain federal fair lending laws, the April Orders also requires the Bank to develop and implement policies and procedures to (i) monitor and ensure compliance with fair lending laws and disclosure laws and regulations, (ii) ensure that the costs, terms, features and risks of the loans and services are adequately disclosed to applicants, and (iii) develop an operating plan to maintain quality control, internal audit, and compliance management systems that are effective in ensuring that the Bank's residential mortgage lending activities comply with all applicable laws, regulations, and Bank policies. The Bank must also conduct or sponsor quarterly financial literacy and education courses where it provides residential mortgage loans. Further, the Bank is prohibited from offering "payment-option" adjustable rate mortgage loans, although the Bank ceased offering these loans in 2007. A copy of the April Order is an exhibit to the Company's Form 8-K filed with the SEC on May 7, 2009 and is filed as Exhibit 10.31 hereto.
66
Management does not believe that the April Order will have a material impact on the Bank's financial performance. Management believes the successful satisfaction of the September Order's requirements and the requirements of the FRB Agreement and New FRB Agreement will strengthen the financial condition of the Bank for future periods.
The foregoing will subject us to increased regulatory scrutiny and may have an adverse impact on our business operations. Failure to comply with the provisions of these regulatory requirements may result in more restrictive actions from our regulators, including more severe and restrictive enforcement actions.
As of December 31, 2009, First Mariner had a total of $71.500 million in outstanding Trust Preferred Securities, of which amount, $10.158 million was eligible for and included in Tier 1 capital and $6.854 million of the remaining Trust Preferred Securities was eligible for and included in Tier II capital. The total amount of our Trust Preferred Securities allowable as part of capital was limited to $17.012 million as of December 31, 2009. See "Subsequent Events" later in this section for a subsequent event related to the Trust Preferred Securities.
Liquidity
Liquidity describes our ability to meet financial obligations, including lending commitments and contingencies, which arise during the normal course of business. Liquidity is primarily needed to meet the borrowing and deposit withdrawal requirements of our customers, as well as to meet current and planned expenditures. These cash requirements are met on a daily basis through the inflow of deposit funds, and the maintenance of short-term overnight investments, maturities and calls in our investment portfolio, and available lines of credit with the FHLB, which requires pledged collateral. Fluctuations in deposit and short-term borrowing balances may be influenced by the interest rates paid, general consumer confidence, and the overall economic environment. There can be no assurances that deposit withdrawals and loan fundings will not exceed all available sources of liquidity on a short-term basis. Such a situation would have an adverse effect on our ability to originate new loans and maintain reasonable loan and deposit interest rates, which would negatively impact earnings.
The borrowing requirements of customers include commitments to extend credit and the unused portion of lines of credit (collectively "commitments"), which totaled $199.757 million at December 31, 2009. Historically, many of the commitments expire without being fully drawn; therefore, the total commitment amounts do not necessarily represent future cash requirements. Commitments for real estate development and construction, which totaled $36.613 million at December 31, 2009, are generally short-term in nature, satisfying cash requirements with principal repayments as construction properties financed are generally repaid with permanent financing. Available credit lines represent the unused portion of credit previously extended and available to the customer as long as there is no violation of material contractual conditions. Commitments to extend credit for residential mortgage loans of $65.871 million at December 31, 2009 generally expire within 60 days. Commercial commitments to extend credit and unused lines of credit of $16.038 million at December 31, 2009 generally do not extend for more than 12 months. Consumer commitments to extend credit and unused lines of credit of $12.402 million at December 31, 2009 are generally open ended. At December 31, 2009, available home equity lines totaled $68.833 million. Home equity credit lines generally extend for a period of 10 years.
Capital expenditures for various branch locations and equipment can be a significant use of liquidity. As of December 31, 2009, we plan on expending approximately $1.000 million on our premises and equipment over the next 12 months.
Customer withdrawals are also a principal use of liquidity, but are generally mitigated by growth in customer funding sources, such as deposits and short-term borrowings. While balances may fluctuate up and down in any given period, historically we have experienced a steady increase in total customer funding sources.
67
The Bank's principal sources of liquidity are cash and cash equivalents (which are cash on hand or amounts due from financial institutions, federal funds sold, money market mutual funds, and interest-bearing deposits), available for sale and trading securities, loans held for sale, deposit accounts, brokered deposits, and borrowings. The levels of such sources are dependent on the Bank's operating, financing, and investing activities at any given time. We continue to primarily rely on core deposits from customers to provide stable and cost-effective sources of funding to support our loan growth. We also seek to augment such deposits with longer term and higher yielding certificates of deposit. Cash and cash equivalents, which totaled $173.703 million at December 31, 2009, have immediate availability to meet our short-term funding needs. Our entire investment portfolio is classified as either available for sale or trading, is highly marketable, excluding our holdings of pooled trust preferred securities, and available to meet our liquidity needs. Loans held for sale, which totaled $122.085 million at December 31, 2009, are committed to be sold into the secondary market and generally are funded within 60 days. Our residential real estate portfolio includes loans that are underwritten to secondary market criteria and provide us an additional source of liquidity. Additionally, our residential construction loan portfolio provides a source of liquidity as construction periods generally range from 9-12 months, and these loans are subsequently financed with permanent first-lien mortgages and sold into the secondary market. Our loan to deposit ratio stood at 77.7% as of December 31, 2009 and 103.0% at December 31, 2008.
We also have the ability to utilize established credit lines as additional sources of liquidity. To utilize the vast majority of our credit lines, we must pledge certain loans and/or securities before advances can be obtained. As of December 31, 2009, we maintained lines of credit totaling $127.000 million and funding capacity of $10.545 million based upon loans and securities available for pledging and available overnight deposits. The FHLB has reduced our line of credit from $202.210 million to $107.000 million, our current outstanding balance. The Federal Reserve Board has also notified the Bank that it will permit the Bank to draw on its line of credit with the Federal Reserve Bank only in limited circumstances and for a short duration.
We are not permitted to purchase brokered deposits without first obtaining a regulatory waiver. We are also required to comply with restrictions on deposit rates that we may offer. These factors could significantly affect our ability to fund normal operations. Our ability to acquire deposits or borrow could also be impaired by factors that are not specific to us, such as a severe disruption of the financial markets or negative views and expectations about the prospects for the financial services industry as a whole as the recent turmoil faced by banking organizations in the domestic and worldwide credit markets deteriorates. At December 31, 2009, management considered the Bank's liquidity level to be sufficient for the purposes of meeting the Bank's cash flow requirements.
First Mariner Bancorp is a separate entity and apart from First Mariner Bank and must provide for its own liquidity. In addition to its operating expenses, First Mariner Bancorp is responsible for the payment of any dividends that may be declared for its shareholders, and interest and principal on outstanding debt. At times, First Mariner Bancorp has repurchased its stock. A significant amount of First Mariner Bancorp's revenues are obtained from subsidiary service fees and dividends. Payment of such dividends to First Mariner Bancorp by First Mariner Bank is limited under Maryland law. For a Maryland chartered bank or trust company, dividends may be paid out of undivided profits or, with the prior approval of the Commissioner, from surplus in excess of 100% of required capital stock. If, however, the surplus of a Maryland bank is less than 100% of its required capital stock, cash dividends may not be paid in excess of 90% of net earnings. In addition to these specific restrictions, bank regulatory agencies also have the ability to prohibit proposed dividends by a financial institution which would otherwise be permitted under applicable regulations if the regulatory body determines that such distribution would constitute an unsafe or unsound practice. As noted earlier, First Mariner and its bank subsidiary have entered into agreements with the FRB, FDIC, and the Maryland Banking Commissioner that, among other things, require us to obtain the prior approval of our regulators
68
before paying a dividend or otherwise making a distribution on our stock. In addition, First Mariner elected to defer regularly scheduled quarterly interest payments on its junior subordinated debentures issued in connection with its trust preferred securities offerings. First Mariner is prohibited from paying any dividends or making any other distribution on its common stock for so long as interest payments are being deferred.
We are not aware of any known trends, demands, commitments, or uncertainties that are reasonably likely to result in material changes in our liquidity.
Interest Rate Sensitivity
Interest rate sensitivity is an important factor in the management of the composition and maturity configurations of our earning assets and our funding sources. The primary objective of our asset/liability management is to ensure the steady growth of our primary earnings component, net interest income. Our net interest income can fluctuate with significant interest rate movements. We may attempt to structure the statement of financial condition so that repricing opportunities exist for both assets and liabilities in roughly equivalent amounts at approximately the same time intervals. However, imbalances in these repricing opportunities at any point in time may be appropriate to mitigate risks from fee income subject to interest rate risk, such as mortgage-banking activities.
The measurement of our interest rate sensitivity, or "gap," is one of the techniques used in asset/liability management. Interest sensitive gap is the dollar difference between our assets and liabilities which are subject to interest rate pricing within a given time period, including both floating rate or adjustable rate instruments and instruments which are approaching maturity.
Our management and our board of directors oversee the asset/liability management function and meet periodically to monitor and manage the statement of financial condition, control interest rate exposure, and evaluate pricing strategies. We evaluate the asset mix of the statement of financial condition continually in terms of several variables: yield, credit quality, funding sources, and liquidity. Our management of the liability mix of the statement of financial condition focuses on expanding our various funding sources and promotion of deposit products with desirable repricing or maturity characteristics.
In theory, we can diminish interest rate risk through maintaining a nominal level of interest rate sensitivity. In practice, this is made difficult by a number of factors including cyclical variation in loan demand, different impacts on our interest-sensitive assets and liabilities when interest rates change, and the availability of our funding sources. Accordingly, we strive to manage the interest rate sensitivity gap by adjusting the maturity of and establishing rates on the earning asset portfolio and certain interest-bearing liabilities commensurate with our expectations relative to market interest rates. Additionally, we may employ the use of off-balance sheet instruments, such as interest rate swaps or caps, to manage our exposure to interest rate movements. Generally, we attempt to maintain a balance between rate-sensitive assets and liabilities that is appropriate to minimize our overall interest rate risk, not just our net interest margin.
69
Our interest rate sensitivity position as of December 31, 2009 is presented in the following table. Our assets and liabilities are scheduled based on maturity or repricing data except for mortgage loans and mortgage-backed securities that are based on prevailing prepayment assumptions and core deposits which are based on core deposit studies done for banks in the Mid-Atlantic region. These assumptions are validated periodically by management. The difference between our rate-sensitive assets and rate-sensitive liabilities, or the interest rate sensitivity gap, is shown at the bottom of the table. As of December 31, 2009, our cumulative interest sensitive liabilities exceeded our cumulative interest sensitive assets within a one year period by $65.313 million or 4.7% of total assets, compared to interest sensitive liabilities exceeding interest sensitive assets by $59.830 million or 4.6% of total assets as of December 31, 2008.
| (dollars in thousands) | 180 days or less | 181 days– one year |
One–five years |
> 5 years or non- sensitive |
Total | ||||||||||||
|---|---|---|---|---|---|---|---|---|---|---|---|---|---|---|---|---|---|
Interest-earning assets: |
|||||||||||||||||
Interest-bearing deposits |
$ | 7,329 | $ | — | $ | — | $ | — | $ | 7,329 | |||||||
Securities |
25,222 | 2,183 | 10,894 | 725 | 39,024 | ||||||||||||
Restricted stock investments |
7,934 | — | — | — | 7,934 | ||||||||||||
Loans held for sale |
122,085 | — | — | — | 122,085 | ||||||||||||
Loans |
543,592 | 71,939 | 237,571 | 37,849 | 890,951 | ||||||||||||
Total interest-earning assets |
$ | 706,162 | $ | 74,122 | $ | 248,465 | $ | 38,574 | $ | 1,067,323 | |||||||
Interest-bearing liabilities: |
|||||||||||||||||
Savings accounts |
$ | 5,066 | $ | 4,168 | $ | 33,530 | $ | 10,547 | $ | 53,311 | |||||||
NOW accounts |
836 | 840 | 6,839 | 3,209 | 11,724 | ||||||||||||
Money market accounts |
124,261 | 2,634 | 21,215 | 9,809 | 157,919 | ||||||||||||
Certificates of deposit |
315,152 | 232,810 | 262,696 | 700 | 811,358 | ||||||||||||
Borrowings and junior subordinated debentures |
122,830 | 37,000 | 25,259 | 10,672 | 195,761 | ||||||||||||
Total interest-bearing liabilities |
$ | 568,145 | $ | 277,452 | $ | 349,539 | $ | 34,937 | $ | 1,230,073 | |||||||
Interest rate sensitive gap position: |
|||||||||||||||||
Period |
$ | 138,017 | $ | (203,330 | ) | $ | (101,074 | ) | $ | 3,637 | |||||||
% of assets |
9.97 | % | (14.69 | )% | (7.30 | )% | 0.26 | % | |||||||||
Cumulative |
$ | 138,017 | $ | (65,313 | ) | $ | (166,387 | ) | $ | (162,750 | ) | ||||||
% of assets |
9.97 | % | (4.72 | )% | (12.02 | )% | (11.76 | )% | |||||||||
Cumulative risk sensitive assets to risk sensitive liabilities |
124.29 | % | 92.28 | % | 86.08 | % | 86.77 | % | |||||||||
While we monitor interest rate sensitivity gap reports, we primarily test our interest rate sensitivity through the deployment of simulation analysis. We use earnings simulation models to estimate what effect specific interest rate changes would have on our net interest income and net income. Simulation analysis provides us with a more rigorous and dynamic measure of interest sensitivity. Changes in prepayments have been included where changes in behavior patterns are assumed to be significant to the simulation, particularly mortgage related assets. Call features on certain securities and borrowings are based on their call probability in view of the projected rate change, and pricing features such as interest rate floors are incorporated. Our fee income produced by mortgage-banking operations may also be impacted by changes in rates. As long-term rates increase, the volume of fixed rate mortgage loans originated for sale in the secondary market may decline and reduce our revenues generated by this line of business. We attempt to structure our asset and liability management strategies to mitigate the impact on net interest income by changes in market interest rates. However, there can be no assurance that we will be able to manage interest rate risk so as to avoid significant adverse effects on
70
net interest income. At December 31, 2009, the simulation model provided the following profile of our interest rate risk measured over a one-year time horizon, assuming a parallel shift in a yield curve based off the U.S. dollar forward swap curve adjusted for certain pricing assumptions:
| |
Immediate Rate Change | ||||||
|---|---|---|---|---|---|---|---|
| |
+200BP | -200BP | |||||
Net interest income |
(3.38 | )% | (10.95 | )% | |||
Both of the above tools used to assess interest rate risk have strengths and weaknesses. Because the gap analysis reflects a static position at a single point in time, it is limited in quantifying the total impact of market rate changes which do not affect all earning assets and interest-bearing liabilities equally or simultaneously. In addition, gap reports depict the existing structure, excluding exposure arising from new business. While the simulation process is a powerful tool in analyzing interest rate sensitivity, many of the assumptions used in the process are highly qualitative and subjective, and are subject to the risk that past historical activity may not generate accurate predictions of the future. The model also assumes parallel movements in interest rates, which means both short-term and long-term rates will change equally. Nonparallel changes in interest rates (short-term rates changing differently from long-term rates) could result in significant differences in projected income amounts when compared to parallel tests. Both measurement tools taken together, however, provide an effective evaluation of our exposure to changes in interest rates, enabling management to better control the volatility of earnings.
We are party to mortgage rate lock commitments to fund mortgage loans at interest rates previously agreed (locked) by both us and the borrower for specified periods of time. When the borrower locks an interest rate, we effectively extend a put option to the borrower, whereby the borrower is not obligated to enter into the loan agreement, but we must honor the interest rate for the specified time period. We are exposed to interest rate risk during the accumulation of interest rate lock commitments and loans prior to sale. We utilize forward sales commitments to economically hedge the changes in fair value of the loan due to changes in market interest rates.
Off-Balance Sheet Arrangements
We enter into off-balance sheet arrangements in the normal course of business. These arrangements consist primarily of commitments to extend credit, lines of credit, and letters of credit. In addition, the Company has certain operating lease obligations.
Credit Commitments
Credit commitments are agreements to lend to a customer as long as there is no violation of any condition to the contract. Loan commitments generally have interest rates fixed at current market amounts, fixed expiration dates, and may require payment of a fee. Lines of credit generally have variable interest rates. Such lines do not represent future cash requirements because it is unlikely that all customers will draw upon their lines in full at any time. Letters of credit are commitments issued to guarantee the performance of a customer to a third party.
Our exposure to credit loss in the event of nonperformance by the borrower is the contract amount of the commitment. Loan commitments, lines of credit, and letters of credit are made on the same terms, including collateral, as outstanding loans. We are not aware of any accounting loss we would incur by funding our commitments.
See detailed information on credit commitments above under "Liquidity."
71
Contractual Obligations
First Mariner has certain obligations to make future payments under contract. At December 31, 2009, the aggregate contractual obligations and commitments are:
| |
Payments Due by Period | |||||||||||||||
|---|---|---|---|---|---|---|---|---|---|---|---|---|---|---|---|---|
| (dollars in thousands) | Total | Less than one year |
Over 1–3 Years |
Over 3–5 years |
After 5 years |
|||||||||||
Certificates of deposit |
$ | 811,358 | $ | 535,898 | $ | 230,152 | $ | 45,308 | $ | — | ||||||
Borrowings and junior subordinated debentures |
195,761 | 87,957 | — | — | 107,804 | |||||||||||
Annual rental commitments under noncancelable leases |
24,516 | 3,823 | 5,894 | 5,653 | 9,146 | |||||||||||
|
$ | 1,031,635 | $ | 627,678 | $ | 236,046 | $ | 50,961 | $ | 116,950 | ||||||
Derivatives
We maintain and account for derivatives, in the form of IRLCs, in accordance with FASB guidance on accounting for derivative instruments and hedging activities. We recognize gains and losses on interest rate lock commitments or forward sales commitments on loan pipeline through mortgage-banking revenue in the Consolidated Statements of Operations.
The Bank, through First Mariner Mortgage, enters into IRLCs, under which we originate residential mortgage loans with interest rates determined prior to funding. IRLCs on mortgage loans that we intend to sell in the secondary market are considered derivatives. The period of time between issuance of a loan commitment and closing and sale of the loan generally ranges from 14 days to 60 days. For these IRLCs, we protect the Company from changes in interest rates through the use of forward sales of to be issued ("TBA") mortgage-backed securities.
We are exposed to price risk from the time a mortgage loan closes until the time the loan is sold. To manage this risk, we also utilize forward sales of TBA mortgage-backed securities. During the period of the rate lock commitment and from the time a loan is closed with the borrowers and sold to investors, we remain exposed to basis (execution, timing, and/or volatility) risk in that the changes in value of our hedges may not equal or completely offset the changes in value of the rate commitments being hedged. This can result due to changes in the market demand for our mortgage loans brought about by supply and demand considerations and perceptions about credit risk relative to the agency securities. We also mitigate counterparty risk by entering into commitments with proven counterparties and pre-approved financial intermediaries.
The market value of IRLCs is not readily ascertainable with precision because they are not actively traded in stand-alone markets. The Bank determines the fair value of IRLCs by measuring the change in the value of the underlying asset, while taking into consideration the probability that the IRLCs will close.
Information pertaining to the carrying amounts of our derivative financial instruments follows as of December 31:
| |
2009 | 2008 | |||||||||||
|---|---|---|---|---|---|---|---|---|---|---|---|---|---|
| (dollars in thousands) | Notional Amount |
Estimated Fair Value |
Notional Amount |
Estimated Fair Value |
|||||||||
Interest rate swaps |
$ | — | $ | — | $ | 60,000 | $ | 61,199 | |||||
Interest rate lock commitments |
62,925 | 62,971 | 166,894 | 169,957 | |||||||||
Forward contracts to sell mortgage-backed securities |
79,000 | 79,790 | 100,000 | 98,496 | |||||||||
72
The interest rate swaps held in 2008 were connected to Mariner Finance borrowings.
Changes in interest rates could materially affect the fair value of the IRLCs or the forward commitments. In the case of the loan related derivatives, fair value is also impacted by the probability that the IRLCs will close ("fallout factor"). In addition, changes in interest rates could result in changes in the fallout factor, which might magnify or counteract the sensitivities. This is because the impact of an interest rate shift on the fallout ratio is nonsymmetrical and nonlinear.
Impact of Inflation and Changing Prices
Inflation may be expected to have an impact on our operating costs and thus on net income. A prolonged period of inflation could cause interest rates, wages, and other costs to increase and could adversely affect our results of operations unless the fees we charge could be increased correspondingly.
Our consolidated financial statements and notes thereto included in Item 8 of Part II of this report have been prepared in accordance with accounting principles generally accepted in the United States of America, which require the measurement of financial position and operating results in terms of historical dollars without considering the change in the relative purchasing power of money over time and due to inflation. The impact of inflation is reflected in the increased cost of our operations. Unlike most industrial companies, nearly all of our assets are monetary in nature. As a result, interest rates have a greater impact on our performance than do the effects of general levels of inflation. Interest rates do not necessarily move in the same direction or to the same extent as the price of goods and services. We believe that the impact of inflation was not material for 2009 or 2008.
Recent Accounting Pronouncements
See Note 23 to our Consolidated Financial Statements included in Item 8 of Part II of this report for discussion of recent accounting pronouncements.
Financial Review 2008/2007
For the year ended December 31, 2008, we recorded a net loss of $15.088 million or $(2.36) per diluted share, a decrease of 49.9% from a net loss of $10.063 million or $(1.57) per diluted share in 2007. Our gross revenue (net interest income and noninterest income) decreased $7.285 million and our noninterest expenses, the provision for credit losses, and income taxes decreased by $2.179 million.
Our net interest income for 2008 decreased $3.755 million or 11.7% from 2007, primarily due to lower yields on earning assets, higher levels of nonperforming assets, and a higher level of interest-bearing liabilities, which more than offset the decrease in the rates on interest-bearing liabilities. The yield on average earning assets decreased from 7.00% for 2007 to 6.11% for 2008 and the rates on average interest-bearing liabilities decreased from 4.22% for 2007 to 3.45% for 2008. Rates on both earning assets and interest-bearing liabilities decreased due to decreased market interest rates. The 2008 yields were also impacted by the increased level of nonperforming assets. Average earning assets remained relatively stable at $1.036 billion in 2008 compared to $1.033 billion for 2007, while average interest-bearing liabilities increased from the 2007 level of $949.992 million to $1.012 billion for 2008. Our net interest margin decreased 38 basis points to 2.74% in 2008 compared to 3.12% in 2007.
Our provision for loan losses increased to $10.856 million in 2008 from $6.700 million in 2007. Our allowance for loan losses at December 31, 2008 represented 1.71% of loans outstanding, an increase from December 31, 2007 of 1.50% of loans outstanding. We recognized net chargeoffs of $11.074 million in 2008 compared to $8.525 million in 2007.
Our total noninterest income decreased 17.0% to $17.227 million, due primarily to net OTTI charges recorded on certain investment securities, partially offset by an increase in total mortgage-banking revenue, including gains on sales of mortgage loans, and gains on the sales of former branches.
73
Mortgage-banking revenue increased from $6.725 million for 2007 to $9.410 million for 2008 due to a larger volume of originations of loans, higher margins on loans sold, as well as increased values derived from rate lock commitments on loans in the mortgage loan pipeline. Deposit service charges declined to $6.319 million in 2008 from $6.463 million for 2007 due to lower overdraft income and to a decline in the number of accounts. We recognized an $814,000 net trading loss during 2008, compared to a net trading loss of $702,000 for 2007, mainly due to declines in the value of borrowings accounted for at fair value ($950,000). These losses were partially offset by improved market values of trading assets of $136,000. Brokerage fees decreased $233,000 during 2008, as we realized lower mutual fund and annuity sales.
We recognized $229,000 in gains on sales of securities in 2008, compared to $943,000 during 2007. During 2008, we also recognized $5.605 million in net OTTI charges on three of our securities available for sale.
Our noninterest expenses decreased $2.045 million or 3.0% to $65.252 million for 2008 compared to $67.297 million for the same period of 2007 due to across the board cost cutting in 2008, including staff reductions.
Secondary marketing valuation expense decreased $3.579 million for 2008, and write-downs and costs of real estate acquired through foreclosure increased $1.325 million, as nonperforming ALT A loans moved through the foreclosure process. Our salary and employee benefits expenses decreased $1.024 million, or 3.5%, due to staff reductions. Occupancy expenses and furniture, fixtures, and equipment expenses increased by $754,000 and $202,000, respectively, for the year ended December 31, 2008 due primarily to increases in lease rates at Bank facilities.
We recorded $1.040 million for a potential FDIC penalty related to prior lending practices. Professional fees increased $260,000 as a result of increased legal fees associated with foreclosures and regulatory compliance legal costs. FDIC insurance premiums increased $282,000 from $605,000 in 2007 to $887,000 in 2008 due to an increase in our insurance rates during 2008.
We recorded an income tax benefit of $13.632 million on a net loss before taxes and discontinued operations of $30.441 million, resulting in an effective tax rate of (44.8)% for 2008 in comparison to an income tax benefit of $9.342 million on a net loss before taxes and discontinued operations of $21.045 million, resulting in an effective tax rate of (44.4)% for 2007.
We recognized $1.721 million in income from the discontinued operations of Mariner Finance in 2008, compared to $1.640 million in 2007.
Subsequent Events
Debt Extinguishment
In February, 2010, the Company entered into an agreement with its Chairman and Chief Executive Officer, Edwin F. Hale, Sr., who purchased trust preferred securities issued by Mariner Capital Trust II, Mariner Capital Trust IV, and Mariner Capital Trust VIII. Mr. Hale, through the agreement with First Mariner Bancorp, has agreed to exchange $20.0 million of the trust preferred securities for $2.0 million in common stock of First Mariner Bancorp plus warrants to purchase shares equal to 20% of the shares issued in the exchange (the "Exchange"). Mr. Hale purchased the trust preferred securities, which have an aggregate liquidation amount of $20.0 million, for $2.0 million. Upon completion of the agreed upon exchange, the Company intends to cancel the $20.0 million in trust preferred securities in exchange for common stock and warrants, eliminating this long term debt.
The Exchange also will increase the Company's total stockholders' equity by approximately $12.8 million, although the exact amount is subject to variation based on the valuation of the warrants at closing, from the cancellation of the trust preferred securities, the common securities and the
74
subordinated debentures. The Exchange would be recorded during the quarter in which the trust preferred securities were cancelled, which is expected to be the first or second quarter of calendar year 2010. The aggregate number of shares of common stock to be exchanged (the "Initial Shares") will be valued at $2.0 million based on the average daily closing price of the common stock over the 20 trading days prior to the closing of the transaction (the "Conversion Price"). In the event that by June 30, 2010 the Company completes a public or private offering of its common stock at a price per share below the Conversion Price, then Mr. Hale will be issued additional shares of common stock such that the total shares to be issued to Mr. Hales would equal $2.0 million divided by the price per share at which shares were sold in the public or private offering. If common stock is sold in the rights offering (see below) at a price below the Conversion Price, the rights offering will result in the issuance of additional shares of common stock to Mr. Hale.
Mr. Hale also will receive warrants (the "A Warrants") to purchase in the aggregate 20% of the Initial Shares. In addition, Mr. Hale will receive additional warrants (the "B Warrants" and, together with the A Warrants, the "Warrants") in the event that on or prior to June 30, 2010 First Mariner Bancorp enters into another agreement to acquire other trust preferred securities and the value of the consideration to be issued in that transaction relative to the aggregate liquidation amount of trust preferred securities to be acquired is greater than the value of the consideration to be issued by First Mariner Bancorp in the Exchange relative to the $20.0 million aggregate liquidation amount of trust preferred securities to be exchanged. In that event, Mr. Hale would receive additional warrants such that the relative value of the aggregate consideration to be paid in the Exchange equals the relative value of the aggregate consideration to be paid in the subsequent transaction, provided that the number of shares subject to the B Warrants could not exceed 20% of the Initial Shares.
In the event Mr. Hale's ownership of Company common stock immediately following the closing would be equal to or greater than 41.33% (the "Threshold"), assuming exercise of the A Warrants, then the amount of trust preferred securities Mr. Hale would exchange initially would be reduced by the minimum amount necessary so that immediately following the closing, Mr. Hale's ownership of Company common stock would be below the Threshold. If such a reduction occurs at the closing, the remaining trust preferred securities held by Mr. Hale could be exchanged in the future subject to the terms of the exchange agreement assuming such exchange would not cause Mr. Hale's ownership of Company common stock to exceed the Threshold.
The Warrants are exercisable for five years following the closing at a price equal to the lesser of (i) the Conversion Price, (ii) if on or prior to June 30, 2010 the Company sells shares of common stock in a public or private offering, the price at which shares are sold in that offering, or (iii) the price utilized in any subsequent agreement for the acquisition of trust preferred securities to determine the number of shares of common stock to be exchanged for such trust preferred securities exclusive of any warrants, warrant shares, or warrant prices.
Shareholder Actions
At a Special Meeting of Stockholders held February 12, 2010, stockholders approved: an amendment to the Company's Articles of Incorporation to increase the authorized number of shares of common stock from 20,000,000 to 75,000,000; an amendment to the Company's Articles of Incorporation to grant the Board of Directors the authority to affect a reverse stock split of the Company's outstanding shares of common stock, if necessary; and an amendment to the Company's 2004 Long Term Incentive Plan to increase the number of shares of common stock that may be issued under the Plan.
At a Special Meeting of Stockholders held March 19, 2010, stockholders approved the redemption of up to $26.0 million aggregate liquidation amount of trust preferred securities in exchange for up to $2.6 million of common stock and warrants to acquire common stock.
75
Rights Offering
On February 16, 2010, we commenced a rights offering pursuant to which we distributed, at no charge to our shareholders, nontransferable subscription rights to purchase up to 17,391,131 shares of our common stock, par value $0.05 per share. Subscription rights were distributed to persons who owned shares of our common stock as of 5:00 p.m. Eastern Time, on February 12, 2010, the record date of the rights offering.
Each subscription right entitles right holders to purchase 2.6952 shares of our common stock at the subscription price of $1.15 per share, which we refer to as the basic subscription privilege. The subscription rights will expire if they are not exercised by 5:00 p.m., Eastern Time, on March 24, 2010. We reserve the right to extend the expiration date one or more times, but in no event will we extend the rights offering beyond March 29, 2010. Shares of common stock that remain unsubscribed (after taking into account all over-subscription rights exercised) at the expiration of the rights offering and that are not purchased by standby investors may be offered to the public at $1.15 per share. The public offering of the unsubscribed shares shall terminate on April 12, 2010. We must receive minimum proceeds of $10.0 million, in the aggregate, to complete the rights offering, the sale of shares to standby purchasers and the re-offering of unsubscribed shares to the public. Maximum proceeds from these offerings will not exceed $20.0 million.
ITEM 7A QUANTITATIVE AND QUALITATIVE DISCLOSURES ABOUT MARKET RISK
Results of operations for financial institutions, including us, may be materially and adversely affected by changes in prevailing economic conditions, including declines in real estate values, rapid changes in interest rates and the monetary and fiscal policies of the federal government. Our loan portfolio is concentrated primarily in central Maryland and portions of Maryland's eastern shore and is, therefore, subject to risks associated with these local economies.
The United States has entered into an economic downturn. The economic downturn generally, and the disruptions in the capital markets in particular, have decreased liquidity and increased our cost of debt and equity capital, where available. The longer these conditions persist, the greater the probability that these factors could continue to increase our costs and significantly limit our access to debt and equity capital, and thus have an adverse effect on our operations and financial results. Many of the customers to which we have made, or will make, loans may also be susceptible to the economic downturn, which may affect the ability of our customers to repay loans, thereby, increasing the level of our nonperforming assets. The economic downturn may also decrease the value of collateral securing some of our loans, as well as the value of our securities investments, which could affect our operations and financial results, as well as decrease our ability to borrow under our credit facilities or raise equity capital. The economic downturn has affected the availability of credit generally and may prevent us from replacing or renewing our credit facilities on reasonable terms, if at all. We do not know when market conditions will stabilize, if adverse conditions will intensify, or the full extent to which the disruptions will affect us. Also, it is possible that continued instability of the financial markets could have other, unforeseen material effects on our business.
We also face market risk related to interest rates that arises from our lending, investing, and deposit taking activities. Our profitability is largely dependent on the Bank's net interest income. Interest rate risk can significantly affect net interest income to the degree that interest bearing liabilities mature or reprice at different intervals than interest earning assets. For a discussion of this interest rate risk, see Item 7 of Part II of this Form 10-K under the heading "Interest Rate Sensitivity."
76
ITEM 8 FINANCIAL STATEMENTS AND SUPPLEMENTARY DATA
Report of Independent Registered Public Accounting Firm
Board
of Directors and Stockholders
First Mariner Bancorp
Baltimore, Maryland
We have audited the accompanying consolidated statements of financial condition of First Mariner Bancorp and Subsidiaries (the "Company") as of December 31, 2009 and 2008 and the related consolidated statements of operations, changes in stockholders' equity, and cash flows for each of the years in the three-year period ended December 31, 2009. The Company's management is responsible for these consolidated financial statements. Our responsibility is to express an opinion on these consolidated financial statements based on our audits.
We conducted our audits in accordance with the standards of the Public Company Accounting Oversight Board (United States). Those standards require that we plan and perform the audit to obtain reasonable assurance about whether the consolidated financial statements are free of material misstatement. The Company is not required to have, nor were we engaged to perform, an audit of their internal control over financial reporting. Our audit included consideration of internal control over financial reporting as a basis for designing audit procedures that are appropriate in the circumstances, but not for the purpose of expressing an opinion on the effectiveness of the Company's internal control over financial reporting. Accordingly, we express no such opinion. An audit also includes examining, on a test basis, evidence supporting the amounts and disclosures in the consolidated financial statements, assessing the accounting principles used and significant estimates made by management, as well as evaluating the overall financial statement presentation. We believe that our audits provide a reasonable basis for our opinion.
In our opinion, the consolidated financial statements referred to above present fairly, in all material respects, the financial position of the Company as of December 31, 2009 and 2008, and the results of their operations and cash flows for each of the years in the three-year period ended December 31, 2009, in conformity with accounting principles generally accepted in the United States of America.
|
/S/ STEGMAN & COMPANY |
Baltimore,
Maryland
March 23, 2010
77
FIRST MARINER BANCORP AND SUBSIDIARIES
Consolidated Statements of Financial Condition
| |
December 31, 2009 |
December 31, 2008 |
||||||||
|---|---|---|---|---|---|---|---|---|---|---|
| |
(dollars in thousands) |
|||||||||
ASSETS |
||||||||||
Cash and due from banks |
$ | 166,374 | $ | 21,045 | ||||||
Federal funds sold and interest-bearing deposits |
7,329 | 46,294 | ||||||||
Trading securities, at fair value |
10,749 | 12,566 | ||||||||
Securities available for sale, at fair value |
28,275 | 39,666 | ||||||||
Loans held for sale |
122,085 | 60,203 | ||||||||
Loans receivable |
890,951 | 978,696 | ||||||||
Allowance for loan losses |
(11,639 | ) | (16,777 | ) | ||||||
Loans, net |
879,312 | 961,919 | ||||||||
Real estate acquired through foreclosure |
21,630 | 18,994 | ||||||||
Restricted stock investments |
7,934 | 7,066 | ||||||||
Premises and equipment, net |
44,504 | 49,964 | ||||||||
Accrued interest receivable |
4,960 | 6,335 | ||||||||
Income tax recoverable |
5,670 | 1,812 | ||||||||
Deferred income taxes |
28,214 | 26,057 | ||||||||
Bank-owned life insurance |
34,773 | 36,436 | ||||||||
Prepaid expenses and other assets |
22,742 | 19,140 | ||||||||
Total assets |
$ | 1,384,551 | $ | 1,307,497 | ||||||
LIABILITIES AND STOCKHOLDERS' EQUITY |
||||||||||
Liabilities: |
||||||||||
Deposits: |
||||||||||
Noninterest-bearing |
$ | 112,192 | $ | 114,751 | ||||||
Interest-bearing |
1,034,312 | 835,482 | ||||||||
Total deposits |
1,146,504 | 950,233 | ||||||||
Short-term borrowings |
26,365 | 43,128 | ||||||||
Long-term borrowings, at fair value |
61,592 | 64,073 | ||||||||
Long-term borrowings |
34,080 | 113,795 | ||||||||
Junior subordinated deferrable interest debentures |
73,724 | 73,724 | ||||||||
Accrued expenses and other liabilities ($0 and $1,199 at fair value, respectively) |
15,299 | 16,529 | ||||||||
Total liabilities |
1,357,564 | 1,261,482 | ||||||||
Stockholders' equity: |
||||||||||
Common stock, $.05 par value; 20,000,000 shares authorized; 6,452,631 shares issued and outstanding for both 2009 and 2008 |
323 | 323 | ||||||||
Additional paid-in capital |
56,771 | 56,741 | ||||||||
Retained deficit |
(26,621 | ) | (5,485 | ) | ||||||
Accumulated other comprehensive loss |
(3,486 | ) | (5,564 | ) | ||||||
Total stockholders' equity |
26,987 | 46,015 | ||||||||
Total liabilities and stockholders' equity |
$ | 1,384,551 | $ | 1,307,497 | ||||||
See accompanying notes to Consolidated Financial Statements
78
FIRST MARINER BANCORP AND SUBSIDIARIES
Consolidated Statements of Operations
| |
For the Years Ended December 31, |
|||||||||||
|---|---|---|---|---|---|---|---|---|---|---|---|---|
| |
2009 | 2008 | 2007 | |||||||||
| |
(dollars in thousands, except per share data) |
|||||||||||
Interest income: |
||||||||||||
Loans |
$ | 56,739 | $ | 57,299 | $ | 63,182 | ||||||
Securities and other earning assets |
3,071 | 6,026 | 9,146 | |||||||||
Total interest income |
59,810 | 63,325 | 72,328 | |||||||||
Interest expense: |
||||||||||||
Deposits |
24,873 | 24,584 | 27,772 | |||||||||
Short-term borrowings |
644 | 766 | 1,316 | |||||||||
Long-term borrowings |
7,181 | 9,535 | 11,045 | |||||||||
Total interest expense |
32,698 | 34,885 | 40,133 | |||||||||
Net interest income |
27,112 | 28,440 | 32,195 | |||||||||
Provision for loan losses |
11,660 | 10,856 | 6,700 | |||||||||
Net interest income after provision for loan losses |
15,452 | 17,584 | 25,495 | |||||||||
Noninterest income: |
||||||||||||
Total other-than-temporary impairment charges |
(3,307 | ) | (5,605 | ) | — | |||||||
Less: Portion included in other comprehensive income (pre-tax) |
371 | — | — | |||||||||
Net other-than-temporary impairment charges on securities available for sale |
(2,936 | ) | (5,605 | ) | — | |||||||
Origination fees and gain on sale of mortgage loans |
12,169 | 6,730 | 4,430 | |||||||||
Other mortgage-banking revenue |
3,943 | 2,680 | 2,295 | |||||||||
ATM fees |
3,072 | 3,188 | 3,219 | |||||||||
Service fees on deposits |
5,261 | 6,319 | 6,463 | |||||||||
Gain (loss) on financial instruments carried at fair value |
3,038 | (814 | ) | (702 | ) | |||||||
Gain on sale of securities, net |
420 | 229 | 943 | |||||||||
Gain on sale of branches |
— | 819 | — | |||||||||
Commissions on sales of nondeposit investment products |
540 | 816 | 1,049 | |||||||||
Income from bank-owned life insurance |
1,377 | 1,505 | 1,439 | |||||||||
Other |
1,387 | 1,360 | 1,621 | |||||||||
Total noninterest income |
28,271 | 17,227 | 20,757 | |||||||||
Noninterest expense: |
||||||||||||
Salaries and employee benefits |
26,469 | 27,901 | 28,925 | |||||||||
Occupancy |
8,974 | 9,369 | 8,615 | |||||||||
Furniture, fixtures, and equipment |
2,941 | 3,425 | 3,223 | |||||||||
Professional services |
3,866 | 1,669 | 1,409 | |||||||||
Advertising |
915 | 921 | 1,219 | |||||||||
Data processing |
1,880 | 2,149 | 1,941 | |||||||||
ATM servicing expenses |
944 | 1,014 | 1,030 | |||||||||
Write-downs, losses, and costs of real estate acquired through foreclosure |
6,832 | 5,802 | 4,477 | |||||||||
Secondary marketing valuation |
— | 355 | 3,934 | |||||||||
FDIC insurance premiums |
3,480 | 887 | 605 | |||||||||
Service and maintenance |
2,437 | 2,216 | 2,098 | |||||||||
Other |
9,096 | 9,544 | 9,821 | |||||||||
Total noninterest expense |
67,834 | 65,252 | 67,297 | |||||||||
Net loss from continuing operations before income taxes and discontinued operations |
(24,111 | ) | (30,441 | ) | (21,045 | ) | ||||||
Income tax benefit—continuing operations |
(10,887 | ) | (13,632 | ) | (9,342 | ) | ||||||
Net loss from continuing operations |
(13,224 | ) | (16,809 | ) | (11,703 | ) | ||||||
(Loss) income from discontinued operations—including loss on disposal of $11.110 million in 2009 |
(9,060 | ) | 1,721 | 1,640 | ||||||||
Net loss |
$ | (22,284 | ) | $ | (15,088 | ) | $ | (10,063 | ) | |||
Net loss per common share from continuing operations: |
||||||||||||
Basic |
$ | (2.05 | ) | $ | (2.63 | ) | $ | (1.83 | ) | |||
Diluted |
$ | (2.05 | ) | $ | (2.63 | ) | $ | (1.83 | ) | |||
Net (loss) income per common share from discontinued operations: |
||||||||||||
Basic |
$ | (1.40 | ) | $ | 0.27 | $ | 0.26 | |||||
Diluted |
$ | (1.40 | ) | $ | 0.27 | $ | 0.26 | |||||
Net loss per common share: |
||||||||||||
Basic |
$ | (3.45 | ) | $ | (2.36 | ) | $ | (1.57 | ) | |||
Diluted |
$ | (3.45 | ) | $ | (2.36 | ) | $ | (1.57 | ) | |||
See accompanying notes to the consolidated financial statements.
79
FIRST MARINER BANCORP AND SUBSIDIARIES
Consolidated Statements of Changes in Stockholders' Equity
| |
For the Years Ended December 31, 2009, 2008, and 2007 | ||||||||||||||||||
|---|---|---|---|---|---|---|---|---|---|---|---|---|---|---|---|---|---|---|---|
| |
Number of Shares of Common Stock |
Common Stock |
Additional Paid-in Capital |
Retained (Deficit) Earnings |
Accumulated Other Comprehensive Loss |
Total Stockholders' Equity |
|||||||||||||
| |
(dollars in thousands, except number of shares) |
||||||||||||||||||
Balance at January 1, 2007 |
6,427,725 | $ | 321 | $ | 57,123 | $ | 22,109 | $ | (924 | ) | $ | 78,629 | |||||||
Cumulative effect of accounting changes |
— | — | — | (2,443 | ) | 993 | (1,450 | ) | |||||||||||
Net loss |
— | — | — | (10,063 | ) | — | (10,063 | ) | |||||||||||
Common stock issued, net of costs |
43,486 | 2 | 369 | — | — | 371 | |||||||||||||
Common stock repurchased, net of costs |
(119,600 | ) | (5 | ) | (1,157 | ) | — | — | (1,162 | ) | |||||||||
Stock-based compensation expense |
— | — | 123 | — | — | 123 | |||||||||||||
Other comprehensive loss |
— | — | — | — | (1,878 | ) | (1,878 | ) | |||||||||||
Balance at December 31, 2007 |
6,351,611 | 318 | 56,458 | 9,603 | (1,809 | ) | 64,570 | ||||||||||||
Net loss |
— | — | — | (15,088 | ) | — | (15,088 | ) | |||||||||||
Common stock issued, net of costs |
118,020 | 6 | 277 | — | — | 283 | |||||||||||||
Common stock repurchased, net of costs |
(17,000 | ) | (1 | ) | (66 | ) | — | — | (67 | ) | |||||||||
Stock-based compensation expense |
— | — | 72 | — | — | 72 | |||||||||||||
Other comprehensive loss |
— | — | — | — | (3,755 | ) | (3,755 | ) | |||||||||||
Balance at December 31, 2008 |
6,452,631 | 323 | 56,741 | (5,485 | ) | (5,564 | ) | 46,015 | |||||||||||
Cumulative effect of accounting change |
— | — | — | 1,148 | — | 1,148 | |||||||||||||
Net loss |
— | — | — | (22,284 | ) | — | (22,284 | ) | |||||||||||
Stock-based compensation expense |
— | — | 30 | — | — | 30 | |||||||||||||
Other comprehensive income |
— | — | — | — | 2,078 | 2,078 | |||||||||||||
Balance at December 31, 2009 |
6,452,631 | $ | 323 | $ | 56,771 | $ | (26,621 | ) | $ | (3,486 | ) | $ | 26,987 | ||||||
See accompanying notes to Consolidated Financial Statements
80
FIRST MARINER BANCORP AND SUBSIDIARIES
Consolidated Statements of Cash Flows
| |
For the Years Ended December 31, | |||||||||||
|---|---|---|---|---|---|---|---|---|---|---|---|---|
| |
2009 | 2008 | 2007 | |||||||||
| |
(dollars in thousands) |
|||||||||||
Cash flows from operating activities: |
||||||||||||
Net loss |
$ | (22,284 | ) | $ | (15,088 | ) | $ | (10,063 | ) | |||
Adjustments to reconcile net loss to net cash from operating activities: |
||||||||||||
Loss (income) from discontinued operations |
9,060 | (1,721 | ) | (1,640 | ) | |||||||
Stock-based compensation |
30 | 72 | 114 | |||||||||
Depreciation and amortization |
4,632 | 5,062 | 4,798 | |||||||||
Amortization of unearned loan fees and costs, net |
(54 | ) | 60 | (597 | ) | |||||||
Amortization of premiums and discounts on loans, net |
— | (1,639 | ) | (997 | ) | |||||||
Amortization of premiums and discounts on mortgage-backed securities, net |
(9 | ) | 11 | 10 | ||||||||
(Gain) loss on financial instruments carried at fair value |
(3,038 | ) | 814 | 702 | ||||||||
Origination fees and gain on sale of mortgage loans |
(12,169 | ) | (6,730 | ) | (4,430 | ) | ||||||
Gain on sale of securities, net |
(420 | ) | (229 | ) | (943 | ) | ||||||
Net other-than-temporary impairment charges on securities available for sale |
2,936 | 5,605 | — | |||||||||
Loss (gain) on disposal of premises and equipment |
11 | (819 | ) | 70 | ||||||||
Write-downs and losses on real estate acquired through foreclosure |
6,261 | 5,162 | 3,720 | |||||||||
Repurchase of mortgage loans |
(113 | ) | (120 | ) | (30,797 | ) | ||||||
Secondary marketing valuation |
— | 355 | 3,934 | |||||||||
Decrease in accrued interest receivable |
137 | 846 | 3,398 | |||||||||
Provision for loan losses |
11,660 | 10,856 | 6,700 | |||||||||
Increase in cash surrender value of bank-owned life insurance |
(1,377 | ) | (1,505 | ) | (1,439 | ) | ||||||
Originations of mortgage loans held for sale |
(1,625,187 | ) | (1,149,319 | ) | (965,865 | ) | ||||||
Proceeds from mortgage loans held for sale |
1,560,667 | 1,175,307 | 953,355 | |||||||||
Deferred income taxes |
(3,663 | ) | (10,989 | ) | (3,578 | ) | ||||||
Net increase (decrease) in accrued expenses and other liabilities |
1,606 | 5,238 | (5,683 | ) | ||||||||
Net (increase) decrease in prepaids and other assets |
(11,379 | ) | 4,986 | 953 | ||||||||
Net cash (used in) provided by operating activities |
(82,693 | ) | 26,215 | (48,278 | ) | |||||||
Cash flows from investing activities: |
||||||||||||
Principal loan (disbursements), net of repayments |
(32,480 | ) | (146,431 | ) | 41,387 | |||||||
Proceeds from sale of Mariner Finance |
8,734 | — | — | |||||||||
Purchases of premises and equipment |
(689 | ) | (3,858 | ) | (8,463 | ) | ||||||
Proceeds from disposals of premises and equipment |
31 | 1,367 | — | |||||||||
(Purchases) sales of restricted stock investments, net |
(868 | ) | (1,083 | ) | 466 | |||||||
Activity in securities available for sale: |
||||||||||||
Sales |
9,279 | 3,853 | 1,445 | |||||||||
Maturities/calls/repayments |
7,133 | 5,097 | 58,768 | |||||||||
Purchases |
(1,749 | ) | (16,405 | ) | (999 | ) | ||||||
Sales of trading securities |
— | 21,038 | — | |||||||||
Maturities/calls/repayments of trading securities |
2,374 | 3,481 | 4,577 | |||||||||
Additional disbursements on real estate acquired through foreclosure |
— | (32 | ) | — | ||||||||
Proceeds from sales of real estate acquired through foreclosure |
10,912 | 9,873 | 4,150 | |||||||||
Redemption of bank-owned life insurance |
3,040 | — | — | |||||||||
Net cash provided by (used in) investing activities |
5,717 | (123,100 | ) | 101,331 | ||||||||
Cash flows from financing activities: |
||||||||||||
Net increase (decrease) in deposits |
196,271 | 45,280 | (19,985 | ) | ||||||||
Net (decrease) increase in other borrowed funds |
(12,931 | ) | 27,407 | 16,075 | ||||||||
Proceeds from stock issuance, net of costs |
— | 283 | 371 | |||||||||
Repurchase of common stock, net of costs |
— | (67 | ) | (1,162 | ) | |||||||
Net cash provided by (used in) financing activities |
183,340 | 72,903 | (4,701 | ) | ||||||||
Net increase (decrease) in cash and cash equivalents |
106,364 | (23,982 | ) | 48,352 | ||||||||
Cash and cash equivalents at beginning of period |
67,339 | 91,321 | 42,969 | |||||||||
Cash and cash equivalents at end of period |
$ | 173,703 | $ | 67,339 | $ | 91,321 | ||||||
Supplemental information: |
||||||||||||
Interest paid on deposits and borrowed funds |
$ | 30,981 | $ | 37,071 | $ | 43,700 | ||||||
Income taxes paid |
— | — | — | |||||||||
Real estate acquired through foreclosure |
19,809 | 15,016 | 24,410 | |||||||||
Transfer of loans held for sale to loan portfolio |
14,808 | 1,458 | 16,685 | |||||||||
See accompanying notes to Consolidated Financial Statements
81
FIRST MARINER BANCORP AND SUBSIDIARIES
Notes to Consolidated Financial Statements
for the Years Ended December 31, 2009, 2008, and 2007
(1) Summary of Significant Accounting Policies
Organization, Basis of Presentation, and Use of Estimates
First Mariner Bancorp ("First Mariner," on a parent only basis and "we," "our," or "us" on a consolidated basis) is a bank holding company incorporated under the laws of the state of Maryland. First Mariner is headquartered in Baltimore, Maryland, and was originally organized as "MarylandsBank Corp." in May 1994. MarylandsBank Corp.'s name was changed to "First Mariner Bancorp" in May 1995. First Mariner Bancorp owns 100% of common stock of First Mariner Bank (the "Bank") and 100% of the interests in FM Appraisals, LLC ("FM Appraisals"). We sold our consumer finance company subsidiary, Mariner Finance, LLC ("Mariner Finance") in December, 2009.
Most of our activities are with customers within the Central Maryland region. A portion of activities related to mortgage lending are more dispersed and cover parts of the Mid-Atlantic region and other regions outside of the state of Maryland. Note 4 describes the types of securities that we invest in, and Note 5 discusses our lending activities. We do not have any concentrations to any one industry or customer.
Our consolidated financial statements include the accounts of First Mariner and its subsidiaries. All significant intercompany accounts and transactions have been eliminated in consolidation. Events occurring after the date of the financial statements were considered in the preparation of the financial statements and are disclosed in Note 24. Certain reclassifications have been made to amounts previously reported to conform with classifications made in 2009.
The preparation of the financial statements in conformity with accounting principles generally accepted in the United States of America ("GAAP") requires management to make estimates and judgments that affect the reported amounts of assets and liabilities and disclosure of contingent assets and liabilities as of the date of the financial statements and the reported amounts of revenues and expenses during the reporting period. Actual results could differ from those estimates. Material estimates that are particularly susceptible to significant change in the near term relate to the determination of the allowance for loan losses (the "allowance"), loan repurchases and related valuations, real estate acquired through foreclosure, impairment of securities available for sale, and deferred taxes. In connection with these determinations, management evaluates historical trends and ratios and, where appropriate, obtains independent appraisals for significant properties and prepares fair value analyses. Actual results could differ significantly from those estimates.
Cash and Cash Equivalents
We consider all highly liquid securities with original maturities of three months or less to be cash equivalents. For reporting purposes, assets grouped in the Statement of Financial Condition under the captions "Cash and due from banks" and "Federal funds sold and interest-bearing deposits" are considered cash or cash equivalents. For financial statement purposes, these assets are carried at cost. Cash and due from banks, federal funds sold, and interest-bearing deposits have overnight maturities and are generally in excess of amounts that would be recoverable under Federal Deposit Insurance Corporation ("FDIC") insurance.
82
Securities
We designate securities into one of three categories at the time of purchase. Debt securities that we have the intent and ability to hold to maturity are classified as held to maturity and recorded at amortized cost. Debt and equity securities are classified as trading if bought and held principally for the purpose of selling them in the near term. Trading securities are reported at estimated fair value, with unrealized gains and losses included in earnings. Debt securities not classified as held to maturity and debt and equity securities not classified as trading securities are considered available for sale and are reported at estimated fair value, with unrealized gains and losses reported as a separate component of stockholders' equity, net of tax effects, in accumulated other comprehensive income.
Securities available for sale are evaluated periodically to determine whether a decline in their value is other than temporary. The term "other than temporary" is not intended to indicate a permanent decline in value. Rather, it means that the prospects for near term recovery of value are not necessarily favorable, or that there is a lack of evidence to support fair values equal to, or greater than, the carrying value of the security.
The initial indication of other-than-temporary impairment ("OTTI") for both debt and equity securities is a decline in the market value below the book value of an investment. In determining whether impairment is other than temporary, we consider our intent to sell the security or whether it is more likely than not that we will be required to sell the security before full recovery of the value. For marketable equity securities, we also consider the issuer's financial condition, capital strength, and near-term prospects. For debt securities and for perpetual preferred securities that are treated as debt securities for the purpose of OTTI analysis, we also consider the cause of the price decline (general level of interest rates and industry- and issuer-specific factors), the issuer's financial condition, near-term prospects and current ability to make future payments in a timely manner, the issuer's ability to service debt, and any change in agencies' ratings at evaluation date from acquisition date and any likely imminent action. Once a decline in value is determined to be other than temporary, the security is segmented into credit- and noncredit-related components. Any impairment adjustment due to identified credit-related components is recorded as an adjustment to current period earnings, while noncredit-related fair value adjustments are recorded through other comprehensive income. In situations where we intend to sell or when it is more likely than not that we will be required to sell a security, the entire OTTI loss must be recognized in earnings.
On April 9, 2009, the Financial Accounting Standards Board ("FASB") issued additional application and disclosure guidance regarding fair value measurements and impairments of securities in order to enhance consistency by increasing the frequency and clarity of fair value disclosures. The guidance was effective for interim and annual periods ending after June 15, 2009, with earlier adoption permitted. We elected to adopt the new guidance effective with the quarter ended March 31, 2009 and recorded a $1.148 million cumulative effect of accounting change to our retained deficit for the noncredit-related component of OTTI charges recorded in 2008.
Gains or losses on the sales of securities are calculated using a specific-identification basis and are determined on a trade-date basis. Premiums and discounts on securities are amortized over the term of the security using methods that approximate the interest method. Gains and losses on trading securities are recognized regularly in income as the fair value of those securities changes.
Loans Held for Sale
Loans originated for sale are carried at the lower of aggregate cost or market value. Market value is determined based on outstanding investor commitments or, in the absence of such commitments, based on current investor yield requirements or third party pricing models. Gains and losses on loan sales are determined using the specific-identification method.
83
Loans Receivable
Our loans receivable are stated at their principal balance outstanding, net of related deferred fees and costs. Interest income on our loans is accrued at the contractual rate based on the principal outstanding. For smaller loans, we place loans in nonaccrual status when they are contractually past due 90 days as to either principal or interest, unless the loan is well secured and in the process of collection, or earlier, when, in the opinion of management, the collection of principal and interest is in doubt. Management may grant a waiver from nonaccrual status for a 90-day past-due loan that is both well secured and in the process of collection. For larger loans and certain mortgage loans, management applies FASB guidance on impaired loan accounting to determine accrual status. Under that guidance, when it is probable that we will be unable to collect all payments due, including interest, we place the loan on nonaccrual. A loan remains in nonaccrual status until the loan is current as to payment of both principal and interest and the borrower demonstrates the ability to pay and remain current. As a result of our ongoing review of the loan portfolio, we may classify loans as nonaccrual even though the presence of collateral or the borrower's financial strength may be sufficient to provide for ultimate repayment. We recognize interest on nonaccrual loans only when it is received. Loans are charged-off when a loan or a portion thereof is considered uncollectible.
We identify impaired loans and measure impairment (i) at the present value of expected cash flows discounted at the loan's effective interest rate, (ii) at the observable market price, or (iii) at the fair value of the collateral if the loan is collateral dependent. If our measure of the impaired loan is less than the recorded investment in the loan, we recognize an impairment loss through a valuation allowance and corresponding charge to provision for loan losses. We do not apply these provisions to larger groups of smaller-balance homogeneous loans such as consumer installment and residential first-and second-lien mortgage loans. We evaluate these loans collectively for impairment, except for 90 days past due high loan-to-value ratio/low documentation ("ALT A") loans, to which we apply the guidance on impaired loan accounting.
We determine a loan to be impaired when, based on current information and events, it is probable that we will be unable to collect all amounts due according to the contractual terms of the loan agreement. We do not consider a loan impaired during a period of delay in payment if we expect to collect all amounts due, including interest past-due. Generally we consider a period of delay in payment to include delinquency up to 90 days, but may extend this period if the loan is collateralized by residential or commercial real estate with a low loan-to-value ratio, and where collection and repayment efforts are progressing.
When the ultimate collectibility of an impaired loan's principal is in doubt, wholly or partially, all cash receipts are applied to principal. Once the recorded principal balance has been reduced to zero, future cash receipts are applied to interest income, to the extent any interest has been foregone, and then they are recorded as recoveries of any amounts previously charged off. When this doubt no longer exists, cash receipts are applied under the contractual terms of the loan agreements. Origination and commitment fees and direct origination costs on loans held for investment generally are deferred and amortized to income over the contractual lives of the related loans using the interest method. Under certain circumstances, commitment fees are recognized over the commitment period or upon expiration of the commitment. Fees to extend loans three months or less are recognized in income upon receipt. Unamortized loan fees are recognized in income when the related loans are sold or prepaid.
Transfers of Financial Assets
Transfers of financial assets are accounted for as sales, when control over the assets has been surrendered. Control over transferred assets is deemed to be surrendered when (1) the assets have been isolated from the Company, (2) the transferee obtains the right (free of conditions that constrain it from taking advantage of that right) to pledge or exchange the transferred assets, and (3) the
84
Company does not maintain effective control over the transferred assets through an agreement to repurchase them before their maturity.
Transferred Loans
In accordance with FASB guidance on mortgage-banking activities, any loans which are originally originated for sale into the secondary market and which we subsequently elect to transfer into the Company's loan portfolio are valued at fair value at the time of the transfer with any decline in value recorded as a charge to operating expense.
Allowance for Loan Losses
Our allowance for loan losses represents an estimated amount that, in management's judgment, will be adequate to absorb probable incurred losses on existing loans. The allowance for loan losses consists of an allocated component and an unallocated component. The components of the allowance for loan losses represent an estimation done pursuant to FASB guidance on accounting for contingencies and for loan impairment, depending on the specific circumstances of the loan or loan type. The adequacy of the allowance for loan losses is determined through careful and continuous review and evaluation of the loan portfolio and involves the balancing of factors as outlined below to establish a prudent level. Loans deemed uncollectible are charged against, while recoveries are credited to, the allowance. Management adjusts the level of the allowance through the provision for loan losses, which is recorded as a current period operating expense. Our methodology for assessing the appropriateness of the allowance consists of several key elements, which include the formula allowance, specific allowance, and the unallocated allowance.
The formula allowance is calculated by applying loss factors to corresponding categories of outstanding homogenous loans. Loss factors are based on our historical loss experience, with more weight applied to recent loss history, or for newer classes of loans, management's estimate of probable losses. The use of these loss factors is intended to reduce the difference between estimated losses inherent in the portfolio and observed losses.
Specific allowances are established in cases where management has identified significant conditions or circumstances related to a loan that leads management to believe the probability that a loss may be incurred in an amount different from the amount determined by the formula allowance calculation. Management determines fair value of the loan and recognizes any impairment in accordance with FASB guidance on impaired loans and recognizes any such impairment as a specific allowance.
The unallocated allowance is based upon management's evaluation of various conditions that are not directly measured in the determination of the formula and specific allowances. Such conditions include, but are not limited to, general economic and business conditions affecting key lending areas, credit quality trends (including trends in delinquencies and nonperforming loans expected to result from existing conditions), loan volumes and concentrations, specific industry conditions within portfolio categories, recent loss experience in particular loan categories, duration of the current business cycle, bank regulatory examination results, findings of internal loan examiners, and management's judgment with respect to various other conditions including loan administration and management and the quality of risk identification systems. Executive management and the Board of Directors review these conditions quarterly.
Management believes that the allowance for loan losses is adequate. However, the determination of the allowance requires significant judgment and estimates of probable incurred losses inherent in the loan portfolio can vary significantly from the amounts actually observed. While management uses all available information to recognize probable incurred losses, future additions to the allowance may be necessary based on changes in the loans comprising the loan portfolio and changes in the financial condition of borrowers which may result from changes in economic conditions. In addition, various
85
regulatory agencies, as an integral part of their examination process, periodically review the Bank's loan portfolio and allowance for loan losses. Such review may result in recognition of additions to the allowance based on their judgments of information available to them at the time of their examination.
Real Estate Acquired Through Foreclosure
We record foreclosed real estate assets at the lower of cost or estimated fair value on the acquisition date and at the lower of such initial amount or estimated fair value less estimated selling costs thereafter. Subsequent write-downs are included in our noninterest expenses, along with operating income, net of related expenses of such properties and gains or losses realized upon disposition.
Restricted Stock Investments
The Bank, as a member of the Federal Home Loan Bank System, is required to maintain an investment in capital stock of the Federal Home Loan Bank of Atlanta ("FHLB") in varying amounts based on asset size and on amounts borrowed from the FHLB. Because no ready market exists for this stock and it has no quoted market value, the Bank's investment in this stock is carried at cost.
The Bank maintains an investment in capital stock of several bankers' banks. Because no ready market exists for these stocks and they have no quoted market values, the Bank's investment in these stocks is carried at cost.
Premises and Equipment
Our premises and equipment are stated at cost less accumulated depreciation and amortization. Depreciation and amortization are accumulated using straight-line and accelerated methods over the estimated useful lives of the assets. Additions and betterments are capitalized and charges for repairs and maintenance are expensed when incurred. The cost and accumulated depreciation or amortization is eliminated from the accounts when an asset is sold or retired and the resultant gain or loss is credited or charged to income. Premises and equipment have estimated useful lives ranging from 3 to 39 years. We capitalize the cost of imputed interest we incur for significant real estate construction and development and charge the amount of capitalized interest to depreciation expense on a straight-line basis over the useful life of the asset. Capitalized interest is computed and capitalized based on the average invested amount in the development project over the construction period at the rate of the Company's incremental borrowing cost for the construction period.
Bank Owned Life Insurance ("BOLI")
Bank owned life insurance is carried at the aggregate cash surrender value of life insurance policies owned where the Company or its subsidiaries are named beneficiaries. Increases in cash surrender value derived from crediting rates for underlying insurance policies is credited to noninterest income.
Borrowings
We record certain of our long-term borrowings at fair value, with corresponding changes in fair values recorded in income. The determination of which borrowings are accounted for using the fair value option is made based upon interest rates and maturities and how those correspond to the interest rates and maturities of assets accounted for using the fair value option.
Comprehensive Income
Comprehensive income includes all changes in stockholders' equity during a period, except those relating to investments by and distributions to stockholders. Our comprehensive income consists of net
86
earnings and unrealized gains and losses on securities available for sale and is presented in Note 14. Accumulated other comprehensive income is displayed as a separate component of stockholders' equity.
Income Taxes
Deferred income taxes are recognized for the tax consequences of temporary differences between financial statement carrying amounts and the tax bases of assets and liabilities. Deferred income taxes are provided on income and expense items when they are reported for financial statement purposes in periods different from the periods in which these items are recognized in the income tax returns. Deferred tax assets are recognized only to the extent that it is more likely than not that such amounts will be realized based upon consideration of available evidence, including tax planning strategies and other factors.
We recognize a tax position as a benefit only if it is "more likely than not" that the tax position would be sustained in a tax examination, with a tax examination being presumed to occur. The amount recognized is the largest amount of tax benefit that is greater than 50% likely to be realized on examination. For tax positions not meeting the "more likely than not" test, no tax benefit is recorded.
We recognize interest and penalties related to income tax matters in income tax (benefit) expense.
Net (Loss) Income Per Share
Our basic (loss) income per share is computed by dividing net loss from continuing operations, net (loss) income from discontinued operations, and net loss, respectively, available to common stockholders by the weighted-average number of common shares outstanding during the year. The dilutive effect per share is computed after adjusting the denominator of the basic computation for the effect of all dilutive potential common shares outstanding during the period. The dilutive effects of options, warrants, and their equivalents are computed under the "treasury stock" method, and are provided in Note 13. See also Note 24 for a subsequent event related to capital and authorized shares.
Stock-Based Compensation
We account for stock-based compensation under the fair value-based compensation method in accordance with FASB guidance.
Loan Servicing
We recognize as assets the rights to service mortgage loans for others ("MSRs") based on their estimated fair value at the time of sale of the underlying mortgage loan. We account for MSRs in accordance with FASB guidance on accounting for the servicing of financial assets. Fair value is determined through a review of valuation assumptions that are supported by market and economic data collected from various outside sources.
Amortization of MSRs is recorded based on the cash flows as estimated by future net servicing income, including the write-off of MSRs associated with loans that are paid in full. The projected future cash flows are calculated and updated monthly by applying market-based assumptions. Impairment for MSRs is determined based on the fair value of the rights, stratified by predominate risk characteristics. Any impairments would be recognized through a valuation allowance with a corresponding charge recorded in income.
Advertising
We expense our advertising costs as incurred, except payments for major sponsorships which are amortized over an estimated life not to exceed one year. Advertising expenses were $915,000, $921,000, and $1.219 million for the years ended December 31, 2009, 2008, and 2007, respectively.
87
Derivatives and Hedging Activities
We account for derivates in accordance with FASB literature on accounting for derivative instruments and hedging activities. When we enter into the derivative contract, we designate a derivative as held for trading, an economic hedge, or a qualifying hedge as detailed in the literature. The designation may change based upon management's reassessment or changing circumstances. Derivatives utilized by the Company include interest rate swaps ("swap" or swaps"), interest rate lock commitments ("IRLC" or "IRLCs"), and forward settlement contracts. A swap agreement is a contract between two parties to exchange cash flows based on specified underlying notional amounts, assets and/or indices. IRLCs occur when we originate mortgage loans with interest rates determined prior to funding. Forward settlement contracts are agreements to buy or sell a quantity of a financial instrument, index, currency or commodity at a predetermined future date, and rate or price.
We designate at inception whether a derivative contract is considered hedging or nonhedging. All of our derivatives are nonexchange traded contracts, and as such, their fair value is based on dealer quotes, pricing models, discounted cash flow methodologies, or similar techniques for which the determination of fair value may require significant management judgment or estimation.
For qualifying hedges, we formally document at inception all relationships between hedging instruments and hedged items, as well as risk management objectives and strategies for undertaking various accounting hedges. We utilize derivatives to manage interest rate sensitivity in certain cases.
Cash flow hedges, which consist of swaps, are hedges that are used to minimize the variability in cash flows of assets or liabilities, or forecasted transactions caused by interest rate or foreign exchange fluctuation. We use dollar offset or regression analysis at the hedge's inception and for each reporting period thereafter to assess whether the derivative used in a hedging transaction is expected to be, and has been, effective in offsetting changes in the fair value of the hedged item.
For all hedges, we discontinue hedge accounting if it is determined that a derivative is not expected to be, or has ceased to be, effective as a hedge.
We recognize gains and losses on swap contracts in the Consolidated Statements of Financial Condition in accumulated other comprehensive loss, net of tax effects; such gains and losses are reclassified into the line item in the Consolidated Statements of Operations in which the hedged item is recorded in the same period the hedged item affects earnings. Hedge ineffectiveness and gains and losses on the excluded component of a derivative in assessing hedge effectiveness are recorded in earnings in the same income statement line item that is used to record hedge effectiveness.
We do not designate IRLCs or forward sales commitments on residential mortgage originations as hedges. We recognize any gains and losses on IRLCs and forward sales commitments on residential mortgage originations through mortgage-banking revenue in the Consolidated Statements of Operations.
(2) Discontinued Operations
In December, 2009, we completed the sale of our consumer finance company subsidiary, Mariner Finance, LLC, for a purchase price of approximately $10.459 million. We received $8.734 million in cash at closing and a 5% ownership stake in the new Mariner Finance entity. Under terms of the sale, $1.1 million was placed in an escrow account to be paid to First Mariner no later than 18 months after the closing, after deducting any indemnification claims. In accordance with FASB guidance, the results of Mariner Finance operations are not included in our consolidated continuing operations, but are shown on the consolidated statement of operations as discontinued operations. We recorded a loss on the sale of Mariner Finance of $11.110 million during 2009.
88
Discontinued operations are detailed as follows for the years ended December 31:
| (dollars in thousands) | 2009 | 2008 | 2007 | ||||||||
|---|---|---|---|---|---|---|---|---|---|---|---|
Interest income |
$ | 24,262 | $ | 20,987 | $ | 16,574 | |||||
Interest expense |
(3,147 | ) | (3,381 | ) | (4,089 | ) | |||||
Net interest income |
21,115 | 17,606 | 12,485 | ||||||||
Provision for loan losses |
(4,865 | ) | (3,927 | ) | (2,215 | ) | |||||
Noninterest income |
4,467 | 3,959 | 3,482 | ||||||||
Noninterest expenses |
(17,332 | ) | (14,796 | ) | (11,080 | ) | |||||
Net income before income taxes |
3,385 | 2,842 | 2,672 | ||||||||
Income tax expense |
(1,335 | ) | (1,121 | ) | (1,032 | ) | |||||
Net income |
2,050 | 1,721 | 1,640 | ||||||||
Loss on write-down of Mariner Finance to fair value |
(9,485 | ) | — | — | |||||||
Write-off of deferred taxes related to |
|||||||||||
Mariner Finance |
(1,625 | ) | — | — | |||||||
Net loss on disposal of Mariner Finance |
(11,110 | ) | — | — | |||||||
Net (loss) income from discontinued operations |
$ | (9,060 | ) | $ | 1,721 | $ | 1,640 | ||||
The following table shows the net assets of Mariner Finance as of December 14, 2009, the date of the sale of Mariner Finance, and December 31, 2008:
| |
December 14, 2009 |
December 31, 2008 |
||||||
|---|---|---|---|---|---|---|---|---|
Cash and due from banks and interest-bearing deposits |
$ | 1,220 | $ | 2,509 | ||||
Loans receivable |
109,983 | 103,224 | ||||||
Allowance for loan losses |
(5,216 | ) | (4,632 | ) | ||||
Loans, net |
104,767 | 98,592 | ||||||
Real estate acquired through foreclosure |
360 | — | ||||||
Other assets |
2,677 | 3,560 | ||||||
Total assets |
109,024 | 104,661 | ||||||
Borrowings |
83,792 | 83,546 | ||||||
Other liabilities |
4,555 | 4,036 | ||||||
Total liabilities |
88,347 | 87,582 | ||||||
Net assets of Mariner Finance |
$ | 20,677 | $ | 17,079 | ||||
(3) Restrictions on Cash and Due From Banks
The Bank is required by the Federal Reserve Board ("FRB") to maintain certain cash reserve balances based principally on deposit liabilities. At both December 31, 2009 and 2008, the required reserve balance was $1.000 million. The Bank has also pledged $3.105 million in cash for exposure on debit card transactions as of December 31, 2009.
89
(4) Securities
The composition of our securities portfolio is as follows at December 31:
| |
2009 | |||||||||||||
|---|---|---|---|---|---|---|---|---|---|---|---|---|---|---|
| (dollars in thousands) | Amortized Cost |
Unrealized Gains |
Unrealized Losses |
Estimated Fair Value |
||||||||||
Available for Sale: |
||||||||||||||
Mortgage-backed securities |
$ | 11,272 | $ | 477 | $ | 7 | $ | 11,742 | ||||||
Trust preferred securities |
19,481 | 47 | 6,190 | 13,338 | ||||||||||
Equity securities—Banks |
965 | 1 | 54 | 912 | ||||||||||
U.S. Treasury securities |
999 | 4 | — | 1,003 | ||||||||||
Corporate obligations |
877 | 53 | — | 930 | ||||||||||
Foreign government bonds |
350 | — | — | 350 | ||||||||||
|
$ | 33,944 | $ | 582 | $ | 6,251 | 28,275 | |||||||
Trading: |
||||||||||||||
Mortgage-backed securities |
10,749 | |||||||||||||
|
$ | 39,024 | ||||||||||||
| |
2008 | |||||||||||||
|---|---|---|---|---|---|---|---|---|---|---|---|---|---|---|
| (dollars in thousands) | Amortized Cost |
Unrealized Gains |
Unrealized Losses |
Estimated Fair Value |
||||||||||
Available for Sale: |
||||||||||||||
Mortgage-backed securities |
$ | 22,423 | $ | 609 | $ | 784 | $ | 22,248 | ||||||
Trust preferred securities |
20,460 | — | 7,594 | 12,866 | ||||||||||
Equity securities—Banks |
549 | — | 298 | 251 | ||||||||||
U.S. Treasury securities |
1,000 | 3 | — | 1,003 | ||||||||||
Corporate obligations |
2,675 | — | 127 | 2,548 | ||||||||||
Foreign government bonds |
750 | — | — | 750 | ||||||||||
|
$ | 47,857 | $ | 612 | $ | 8,803 | 39,666 | |||||||
Trading: |
||||||||||||||
Mortgage-backed securities |
12,566 | |||||||||||||
|
$ | 52,232 | ||||||||||||
90
Contractual maturities of debt securities at December 31, 2009 are shown below. Actual maturities may differ from contractual maturities because borrowers have the right to call or prepay obligations with or without call or prepayment penalties.
| (dollars in thousands) | Amortized Cost |
Estimated Fair Value |
||||||
|---|---|---|---|---|---|---|---|---|
Available for Sale: |
||||||||
Due in one year or less |
$ | 350 | $ | 350 | ||||
Due after one year through five years |
4,829 | 4,905 | ||||||
Due after five through ten years |
1,031 | 906 | ||||||
Due after ten years |
15,497 | 9,460 | ||||||
Mortgage-backed securities |
11,272 | 11,742 | ||||||
|
$ | 32,979 | 27,363 | |||||
Trading: |
||||||||
Mortgage-backed securities |
10,749 | |||||||
|
$ | 38,112 | ||||||
The following table shows the level of our gross unrealized losses and the fair value of the associated securities by type and maturity for securities available for sale at December 31, 2009:
| |
Less than 12 months | 12 months or more | Total | ||||||||||||||||
|---|---|---|---|---|---|---|---|---|---|---|---|---|---|---|---|---|---|---|---|
| (dollars in thousands) | Estimated Fair Value |
Unrealized Losses |
Estimated Fair Value |
Unrealized Losses |
Estimated Fair Value |
Unrealized Losses |
|||||||||||||
Mortgage-backed securities |
$ | — | $ | — | $ | 3,402 | $ | 7 | $ | 3,402 | $ | 7 | |||||||
Trust preferred securities |
546 | 2,275 | 10,548 | 3,915 | 11,094 | 6,190 | |||||||||||||
Equity securities |
— | — | 161 | 54 | 161 | 54 | |||||||||||||
|
$ | 546 | $ | 2,275 | $ | 14,111 | $ | 3,976 | $ | 14,657 | $ | 6,251 | |||||||
For securities available for sale, gross unrealized losses totaled $6.251 million as of December 31, 2009 and equaled 42.6% of the fair value of securities with unrealized losses as of this date. A total of 21 securities were in an unrealized loss position as of December 31, 2009, with the largest single unrealized loss in any one security totaling $1.938 million. Nineteen securities were in an unrealized loss position for twelve months or more.
The trust preferred securities that we hold in our securities portfolio are issued by other banks and bank holding companies. Certain of these securities have experienced declines in value since acquisition. These declines have occurred due to changes in the market which has limited the demand for these securities and reduced their liquidity. We recorded net OTTI charges of $2.936 million on positions in pooled trust preferred collateralized debt obligations and certain bank stock securities during 2009 and $5.605 million on positions in pooled trust preferred collateralized debt obligations and certain corporate securities in 2008. As a result of the adoption of FASB guidance related to determining fair value and OTTI, during the first quarter of 2009 we added back to retained earnings as a cumulative effect of accounting change $1.148 million, net of taxes of $750,000, in OTTI previously recorded that was determined to not be related to credit deterioration (see Notes 16 and 23 for additional information). At the time of adoption, we determined that the remaining trust preferred securities were temporarily impaired.
91
The following shows the activity in OTTI related to credit losses for the years ended December 31:
| (dollars in thousands) | 2009 | 2008 | |||||
|---|---|---|---|---|---|---|---|
Balance at beginning of period |
$ | 5,605 | $ | — | |||
Reduction—cumulative effect of accounting change |
(1,898 | ) | — | ||||
Additional OTTI recorded for credit losses |
2,936 | 5,605 | |||||
Balance at end of period |
$ | 6,643 | $ | 5,605 | |||
All of the remaining securities that are temporarily impaired are impaired due to declines in fair values resulting from changes in interest rates or increased credit/liquidity spreads since the time they were purchased. We have the intent to hold these debt securities to maturity, and, for debt and equity securities in a loss position, for the foreseeable future, and do not intend nor do we believe it is more likely than not that the we will be required to sell the securities before anticipated recovery. We expect these securities will be repaid in full, with no losses realized. As such, management considers the impairments to be temporary.
During 2009, 2008, and 2007, we recognized gross losses on the sale of securities of $20,000, $50,000, and $0, respectively. During 2009, 2008, and 2007, we recognized gross gains on sale of securities of $440,000, $279,000, and $943,000, respectively.
At December 31, 2009, we held securities with an aggregate carrying value (fair value) of $29.007 million that we have pledged as collateral for certain hedging activities, borrowings, and customer deposits.
(5) Loans Receivable and Allowance for Loan Losses
Approximately 95% of our loans receivable are to customers located in the state of Maryland. Loans are extended only after evaluation by management of customers' creditworthiness and other relevant factors on a case-by-case basis. For loans with real estate collateral, we generally do not lend more than 90% of the appraised value of a property at origination and require private mortgage insurance on residential mortgages with loan-to-value ratios in excess of 80% at origination. In addition, we generally obtain personal guarantees of repayment from our borrowers and/or others for construction, commercial, and multi-family residential loans and disburse the proceeds of construction and similar loans only as work progresses on the related projects.
We generally consider our residential lending to involve less risk than other forms of lending, although our payment experience on these loans is dependent, to some extent, on economic and market conditions in our primary lending area. However, in 2009 and 2008, loss levels on residential real estate loans were significantly higher than on other loan types due to the significant declines in residential real estate values and higher defaults experienced in this portfolio. Commercial and construction loan repayments are generally dependent on the operations of the related properties or the financial condition of the borrower or guarantor. Accordingly, repayment of such loans can be more susceptible to adverse conditions in the real estate market and the regional economy.
92
Loans receivable are summarized as follows at December 31:
| (dollars in thousands) | 2009 | 2008 | ||||||
|---|---|---|---|---|---|---|---|---|
Loans secured by first mortgages on real estate: |
||||||||
Residential |
$ | 176,084 | $ | 138,551 | ||||
Commercial |
340,349 | 319,591 | ||||||
Consumer residential construction |
47,689 | 69,496 | ||||||
Commercial construction |
99,562 | 109,773 | ||||||
|
663,684 | 637,411 | ||||||
Commercial |
77,474 | 90,896 | ||||||
Loans secured by second mortgages on real estate |
127,011 | 135,873 | ||||||
Consumer |
17,181 | 112,941 | ||||||
Loans secured by deposits and other |
4,598 | 3,526 | ||||||
Total loans |
889,948 | 980,647 | ||||||
Unamortized loan discounts, net |
— | (386 | ) | |||||
Unearned loan fees, net |
1,003 | (1,565 | ) | |||||
|
$ | 890,951 | $ | 978,696 | ||||
Included in consumer loan totals in the above table are overdrawn commercial and retail checking accounts totaling $247,000 and $378,000 as of December 31, 2009 and 2008, respectively. Included in net unearned loan fees and costs as of December 31, 2008 in the above table is unearned income on installment loans of Mariner Finance of $2.674 million.
In accordance with the FASB's guidance on mortgage-banking activities, any loans which are originally originated for sale into the secondary market and which we subsequently elect to transfer into the Company's loan portfolio are valued at fair value at the time of the transfer with any decline in value recorded as a charge to operating expense.
Information on the activity in transferred loans and related accretable yield is as follows for the years ended December 31:
| |
Loan Balance | Accretable Yield | Total | ||||||||||||||||
|---|---|---|---|---|---|---|---|---|---|---|---|---|---|---|---|---|---|---|---|
| (dollars in thousands) | 2009 | 2008 | 2009 | 2008 | 2009 | 2008 | |||||||||||||
Beginning balance |
$ | 15,441 | $ | 16,907 | $ | 831 | $ | 1,114 | $ | 14,610 | $ | 15,793 | |||||||
Additional transfers |
14,808 | 1,655 | — | 197 | 14,808 | 1,458 | |||||||||||||
Loans moved to real estate acquired through foreclosure |
(1,301 | ) | (1,338 | ) | (10 | ) | (47 | ) | (1,291 | ) | (1,291 | ) | |||||||
Charge-offs |
(3,881 | ) | (1,314 | ) | (182 | ) | (8 | ) | (3,699 | ) | (1,306 | ) | |||||||
Payments/amortization |
(492 | ) | (469 | ) | (216 | ) | (425 | ) | (276 | ) | (44 | ) | |||||||
Ending balance |
$ | 24,575 | $ | 15,441 | $ | 423 | $ | 831 | $ | 24,152 | $ | 14,610 | |||||||
The following table provides information concerning nonperforming assets and past-due loans at December 31:
| (dollars in thousands) | 2009 | 2008 | |||||
|---|---|---|---|---|---|---|---|
Nonaccruing loans |
$ | 35,799 | $ | 38,763 | |||
Real estate acquired through foreclosure |
21,630 | 18,994 | |||||
Total nonperforming assets |
$ | 57,429 | $ | 57,757 | |||
Loans past-due 90 days or more and accruing |
$ | 9,224 | $ | 9,679 | |||
93
The interest income which would have been recorded on nonaccrual loans if those loans had been performing in accordance with their contractual terms was approximately $4.624 million, $4.737 million, and $2.778 million in 2009, 2008, and 2007, respectively. The actual interest income recorded on these loans in 2009, 2008, and 2007 was approximately $1.193 million, $1.264 million, and $731,000, respectively.
Commercial loans we consider impaired at December 31, 2009 and 2008 totaled $33.639 million and $26.695 million, respectively. The reserve for loan losses for commercial impaired loans was $328,000 at December 31, 2009 and $1.264 million at December 31, 2008. The average recorded investment in commercial impaired loans was approximately $25.844 million, $21.530 million, and $14.287 million for the years ended December 31, 2009, 2008, and 2007, respectively, and no income has been accrued or collected on the majority of these loans while they have been classified as impaired.
The following table shows the breakout of commercial impaired loans at December 31:
| (dollars in thousands) | 2009 | 2008 | |||||
|---|---|---|---|---|---|---|---|
Impaired loans with allocated allowance for loan losses |
$ | 6,482 | $ | 8,155 | |||
Impaired loans with no allocated allowance for loan losses |
27,157 | 18,540 | |||||
|
$ | 33,639 | $ | 26,695 | |||
Consumer loans we consider impaired at December 31, 2009 and 2008 totaled $15.208 million and $20.945 million, respectively. The reserve for loan losses for consumer impaired loans was $405,000 at December 31, 2009 and $1.444 million at December 31, 2008. The average recorded investment in consumer impaired loans was approximately $17.466 million, $26.214 million, and $26.071 million for the years ended December 31, 2009, 2008, and 2007, respectively, and no income has been accrued or collected on the majority of these loans while they have been classified as impaired.
The following table shows the breakout of consumer impaired loans at December 31:
| (dollars in thousands) | 2009 | 2008 | |||||
|---|---|---|---|---|---|---|---|
Impaired loans with allocated allowance for loan losses |
$ | 4,687 | $ | 7,410 | |||
Impaired loans with no allocated allowance for loan losses |
10,521 | 13,535 | |||||
|
$ | 15,208 | $ | 20,945 | |||
Troubled debt restructures ("TDRs"), which are loans that have been restructured due to the borrower's inability to maintain a current status on the loan, that are not included in the nonaccrual balance above amounted to approximately $13.048 million as of December 31, 2009 and $9.074 million as of December 31, 2008. Our TDRs are generally reviewed individually to determine impairment, accrual status, and the need for specific reserves. For collateral dependent loans, we utilize the fair value of the collateral in determining impairment. For noncollateral dependent loans, we calculate the present value of expected future cash flows to determine fair value and impairment. The interest income which would have been recorded on TDRs if those loans had been handled in accordance with their contractual terms was approximately $865,000 in 2009, $916,000 in 2008, and $588,000 in 2007 and the actual interest income recorded on these loans in 2009, 2008, and 2007 was approximately $661,000, $496,000, and $186,000, respectively.
94
Changes in the allowance for losses on loans are summarized as follows for the years ended December 31:
| (dollars in thousands) | 2009 | 2008 | 2007 | |||||||
|---|---|---|---|---|---|---|---|---|---|---|
Balance at beginning of year |
$ | 16,777 | $ | 12,789 | $ | 12,399 | ||||
Provision for loan losses—Bank |
11,660 | 10,856 | 6,700 | |||||||
Provision for loan losses—Mariner Finance |
— | 3,927 | 2,215 | |||||||
Charge-offs (1) |
(12,447 | ) | (11,466 | ) | (8,989 | ) | ||||
Recoveries (2) |
281 | 392 | 464 | |||||||
Allowance for acquired loans |
— | 279 | — | |||||||
Mariner Finance allowance |
(4,632 | ) | — | — | ||||||
Balance at end of year |
$ | 11,639 | $ | 16,777 | $ | 12,789 | ||||
- (1)
- For
2008 and 2007, includes charge-offs of $3.398 million and $2.160 million, respectively, related to Mariner Finance consumer
loans. 2009 does not include any activity from the discontinued operations of Mariner Finance.
- (2)
- For 2008 and 2007, includes recoveries of $298,000 and $387,000, respectively, related to Mariner Finance consumer loans. 2009 does not include any activity from the discontinued operations of Mariner Finance.
As of December 31, 2009 and 2008, we maintained servicing on reverse mortgage loans sold to Fannie Mae of approximately $309.000 million and $206.000 million, respectively.
At December 31, 2009, we have pledged loans with a carrying value of $186.605 million as collateral for short-term promissory notes and FHLB advances.
(6) Premises and Equipment
We own property and equipment as follows at December 31:
| (dollars in thousands) | 2009 | 2008 | |||||
|---|---|---|---|---|---|---|---|
Land |
$ | 10,554 | $ | 10,554 | |||
Buildings and improvements |
28,076 | 27,965 | |||||
Leasehold improvements |
9,722 | 10,346 | |||||
Furniture, fixtures, automobiles, and equipment |
25,813 | 28,007 | |||||
Total, at cost |
74,165 | 76,872 | |||||
Less: accumulated depreciation and amortization |
(29,661 | ) | (26,908 | ) | |||
Net premises and equipment |
$ | 44,504 | $ | 49,964 | |||
Depreciation and amortization expense for the years ended December 31, 2009, 2008, and 2007 was $4.632 million, $5.062 million, and $4.798 million, respectively.
We lease various branch and general office facilities to conduct our operations. The leases have remaining terms which range from a period of less than 1 year to 27 years. Most leases contain renewal options which are generally exercisable at increased rates. Some of the leases provide for increases in the rental rates at specified times during the lease terms, prior to the expiration dates.
The leases generally provide for payment of property taxes, insurance, and maintenance costs by the Company. The total rental expense for all real property leases amounted to $4.627 million, $4.938 million, and $4.651 million for 2009, 2008, and 2007, respectively.
95
Our minimum lease payments due for each of the next five years are as follows (1):
| (dollars in thousands) | |
|||
|---|---|---|---|---|
2010 |
$ | 3,823 | ||
2011 |
3,086 | |||
2012 |
2,808 | |||
2013 |
2,837 | |||
2014 |
2,816 | |||
Thereafter |
9,146 | |||
|
$ | 24,516 | ||
- (1)
- Includes an estimated 3% annual increase cap (based on the change in the consumer price index) on our headquarters lease
(7) Deposits
Deposits are summarized as follows at December 31:
| |
2009 | 2008 | |||||||||||||
|---|---|---|---|---|---|---|---|---|---|---|---|---|---|---|---|
| (dollars in thousands) | Amount | Weighted- Average Effective Rate |
Amount | Weighted- Average Effective Rate |
|||||||||||
Noncertificate: |
|||||||||||||||
Savings |
$ | 53,311 | 0.32 | % | $ | 51,550 | 0.33 | % | |||||||
Interest-bearing demand |
11,724 | 0.65 | % | 10,076 | 0.58 | % | |||||||||
Money market accounts |
157,919 | 0.84 | % | 162,614 | 1.47 | % | |||||||||
Noninterest-bearing demand |
112,192 | 114,751 | |||||||||||||
Total noncertificate deposits |
335,146 | 338,991 | |||||||||||||
Certificates of deposit: |
|||||||||||||||
Original maturities: |
|||||||||||||||
Under 12 months |
247,175 | 2.87 | % | 103,124 | 4.01 | % | |||||||||
12 to 60 months |
504,898 | 3.34 | % | 452,669 | 4.07 | % | |||||||||
IRA and KEOGH |
59,285 | 3.47 | % | 55,449 | 3.80 | % | |||||||||
Total certificates of deposit |
811,358 | 611,242 | |||||||||||||
Total deposits |
$ | 1,146,504 | $ | 950,233 | |||||||||||
Time deposits mature as follows:
| |
2009 | 2008 | |||||||||||
|---|---|---|---|---|---|---|---|---|---|---|---|---|---|
| (dollars in thousands) | Amount | % of Total |
Amount | % of Total |
|||||||||
Within 6 months |
$ | 284,337 | 35.04 | % | $ | 200,367 | 32.78 | % | |||||
Over 6 months - 12 months |
251,561 | 31.00 | % | 206,153 | 33.73 | % | |||||||
Over 12 months - 24 months |
194,403 | 23.96 | % | 123,622 | 20.23 | % | |||||||
Over 24 months - 36 months |
35,749 | 4.41 | % | 39,333 | 6.43 | % | |||||||
Over 36 months - 48 months |
35,090 | 4.33 | % | 9,297 | 1.52 | % | |||||||
Over 48 months |
10,218 | 1.26 | % | 32,470 | 5.31 | % | |||||||
|
$ | 811,358 | 100.00 | % | $ | 611,242 | 100.00 | % | |||||
96
The Bank offers certain certificate products that provide customers a "one-time" withdrawal option that the customer may exercise at any time without penalty. As of December 31, 2009, certificates that permitted early withdrawal totaled $31.237 million.
Certificates of deposit of $100,000 or more totaled $397.894 million and $188.890 million at December 31, 2009 and 2008, respectively.
We have pledged securities with an aggregate carrying value (fair value) of $2.224 million for certain customer deposits.
(8) Borrowings
Our borrowings consist of short-term promissory notes, short-term and long-term advances from the FHLB, a mortgage warehouse line of credit (closed in 2007), a line of credit to finance consumer receivables, and a mortgage loan.
The FHLB advances are available under a specific collateral pledge and security agreement, which requires that we maintain collateral for all of our borrowings equal to 100% of advances. We may pledge as collateral specific first- and second-lien mortgage loans or commercial mortgages up to 10% of the Bank's total assets. Long-term FHLB advances are fixed-rate instruments with various call provisions. Short-term advances are in the form of overnight borrowings with rates changing daily. Due to our capital adequacy status (see Note 10), the FHLB has limited our borrowings to the current amount outstanding of $107.000 million.
We maintained a $75.000 million mortgage warehouse line of credit to assist in the funding of our mortgage-banking business that was secured by the pledging of loans from the Company's loans held for sale portfolio. The line of credit was closed in 2007.
The line of credit for consumer finance receivables represents borrowings by Mariner Finance and was a line of credit maintained with a commercial bank. As a result of the sale of Mariner Finance, we no longer maintain this line of credit.
The mortgage loan on our former headquarters building is with a commercial bank on which we pay a fixed rate of 5.58% until maturity in 2031. The carrying value of the property securing the loan was approximately $18.324 million as of December 31, 2009.
97
Certain information regarding our borrowings is as follows as of December 31:
| (dollars in thousands) | 2009 | 2008 | 2007 | ||||||||
|---|---|---|---|---|---|---|---|---|---|---|---|
Amount outstanding at year-end: |
|||||||||||
FHLB short-term advances |
$ | 22,000 | $ | 25,000 | $ | — | |||||
Short-term promissory notes |
4,365 | 18,128 | 37,509 | ||||||||
Mortgage warehouse line of credit (1) |
— | — | — | ||||||||
Consumer finance line of credit (2) |
— | 79,546 | 57,600 | ||||||||
FHLB long-term advances |
86,592 | 89,073 | 88,123 | ||||||||
Mortgage loan |
9,080 | 9,249 | 9,407 | ||||||||
Weighted-average interest rate at year-end: |
|||||||||||
FHLB short-term advances |
0.90 | % | 2.49 | % | — | ||||||
Short-term promissory notes |
0.73 | % | 0.84 | % | 3.11 | % | |||||
Mortgage warehouse line of credit (1) |
— | — | — | ||||||||
Consumer finance line of credit (2) |
— | 3.78 | % | 6.65 | % | ||||||
FHLB long-term advances |
4.15 | % | 4.75 | % | 5.68 | % | |||||
Mortgage loan |
5.58 | % | 5.58 | % | 5.58 | % | |||||
Maximum outstanding at any month-end: |
|||||||||||
FHLB short-term advances |
$ | 42,000 | $ | 35,000 | $ | — | |||||
Short-term promissory notes |
17,870 | 38,129 | 58,704 | ||||||||
Mortgage warehouse line of credit (1) |
— | — | 16,878 | ||||||||
Consumer finance line of credit (2) |
81,297 | 79,546 | 57,600 | ||||||||
FHLB long-term advances |
88,744 | 89,567 | 88,123 | ||||||||
Mortgage loan |
9,236 | 9,395 | 9,546 | ||||||||
Average outstanding: |
|||||||||||
FHLB short-term advances |
$ | 31,014 | $ | 10,137 | $ | 696 | |||||
Short-term promissory notes |
11,316 | 26,184 | 39,614 | ||||||||
Mortgage warehouse line of credit (1) |
— | — | 1,184 | ||||||||
Consumer finance line of credit (2) |
79,422 | 65,380 | 48,947 | ||||||||
FHLB long-term advances |
88,005 | 88,695 | 86,513 | ||||||||
Mortgage loan |
9,158 | 9,355 | 9,476 | ||||||||
Weighted-average interest rate during the year: |
|||||||||||
FHLB short-term advances |
1.86 | % | 2.95 | % | 5.58 | % | |||||
Short-term promissory notes |
0.59 | % | 1.78 | % | 3.00 | % | |||||
Mortgage warehouse line of credit (1) |
— | — | 7.34 | % | |||||||
Consumer finance line of credit (2) |
3.62 | % | 4.75 | % | 7.54 | % | |||||
FHLB long-term advances |
4.30 | % | 4.91 | % | 5.67 | % | |||||
Mortgage loan |
5.66 | % | 5.66 | % | 5.66 | % | |||||
- (1)
- Line
of credit closed in 2007
- (2)
- Indebtedness of Mariner Finance, which was sold in 2009
98
The principal maturities of long-term borrowings are as follows as of December 31, 2009:
| (dollars in thousands) | |
|||
|---|---|---|---|---|
2010 |
$ | 61,592 | ||
2011 |
— | |||
2012 |
— | |||
2013 |
— | |||
2014 |
— | |||
After 2014 |
34,080 | |||
|
$ | 95,672 | ||
The maturities listed in the above table for 2010 are callable immediately at the option of the issuer, while $25.000 million maturing after 2014 is callable beginning in 2010.
We have pledged securities with an aggregate carrying value (fair value) of $20.262 million and loans with a carrying value of $186.605 million as collateral for short-term promissory notes and FHLB advances.
(9) Junior Subordinated Deferrable Interest Debentures
The following table shows the subordinated debt issued by First Mariner Bancorp and the related Trust Preferred Securities issued at December 31, 2009 (dollars in thousands):
| Trust | Subordinated Debt Issued to Trust |
Security Title | Trust Preferred Securities Issued by Trust |
Date of Original Issue |
Optional Redemption Date |
Stated Maturity |
|||||||||
|---|---|---|---|---|---|---|---|---|---|---|---|---|---|---|---|
MCT II |
$ | 10,310 | Floating rate Trust Preferred Securities | $ | 10,000 | December 10, 2002 | December 15, 2007 | December 10, 2032 | |||||||
MCT III |
14,949 | Floating rate Trust Preferred Securities | 14,500 | June 18, 2003 | July 7, 2008 | July 7, 2033 | |||||||||
MCT IV |
12,380 | Floating rate Trust Preferred Securities | 12,000 | August 18, 2003 | August 18, 2008 | August 18, 2033 | |||||||||
MCT V |
10,310 | Floating rate Trust Preferred Securities | 10,000 | September 25, 2003 | October 8, 2008 | October 8, 2033 | |||||||||
MCT VI |
10,310 | Floating rate Trust Preferred Securities | 10,000 | October 21, 2004 | January 7, 2010 | January 7, 2035 | |||||||||
MCT VII |
5,155 | Floating rate Trust Preferred Securities | 5,000 | August 18, 2005 | September 15, 2010 | September 15, 2035 | |||||||||
MCT VIII |
10,310 | 5-year Fixed Trust Preferred Securities (1) | 10,000 | December 28, 2005 | December 30, 2010 | December 30, 2035 | |||||||||
|
$ | 73,724 | $ | 71,500 | |||||||||||
- (1)
- Reset to floating rate in December, 2010
First Mariner issued junior subordinated deferrable interest debentures to seven statutory trust subsidiaries, Mariner Capital Trust ("MCT") II, MCT III, MCT IV, MCT V, MCT VI, MCT VII, and MCT VIII (collectively, the "Trusts"). The Trusts are Delaware business trusts for which all the common securities are owned by First Mariner and which were formed for the purpose of issuing Trust Preferred Securities. In accordance with FASB guidance, we have deconsolidated the Trusts, and their financial position and results of operations are not included in our consolidated financial position and results of operations. The terms payment and redemption of the debentures and related Trust Preferred Securities are substantially identical.
The Trust Preferred Securities are mandatorily redeemable, in whole or in part, upon repayment of their underlying subordinated debt at their respective maturities or their earlier redemption. The junior subordinated deferrable interest debentures are redeemable prior to maturity at our option on or after their optional redemption dates.
The Floating Rate Trust Preferred Securities issued by MCT II accrue interest at a variable rate of interest equal to the 3-month LIBOR rate plus 335 basis points. The Floating Rate Trust Preferred Securities issued by MCT III accrue interest at a variable rate of interest equal to 3-month LIBOR rate
99
plus 325 basis points. The Floating Rate Trust Preferred Securities issued by MCT IV accrue interest at a variable rate of interest equal to the 3-month LIBOR rate plus 305 basis points. The Floating Rate Trust Preferred Securities issued by MCT V accrue interest at a variable rate of interest equal to the 3-month LIBOR rate plus 310 basis points. The Floating Rate Trust Preferred Securities issued by MCT VI accrue interest at a variable rate of interest equal to the 3-month LIBOR rate plus 205 basis points. The Floating Rate Trust Preferred Securities issued by MCT VII accrue interest at a variable rate of interest equal to the 3-month LIBOR rate plus 195 basis points. The Trust Preferred Securities issued by MCT VIII accrue interest at an initial fixed rate of interest of 6.26%, then reset on December 30, 2010 to the 3-month LIBOR rate plus 150 basis points.
The interest expense (including amortization of the cost of issuance) on junior subordinated deferrable interest debentures was $3.127 million in 2009, $4.640 million in 2008, and $5.501 million in 2007. We elected to defer interest payments on the debentures, beginning with the January 2009 payments. This deferment is permitted by the terms of the debentures and does not constitute an event of default thereunder. Interest on the debentures and dividends on the related Trust Preferred Securities continue to accrue and will have to be paid in full prior to the expiration of the deferral period. The total deferral period may not exceed 20 consecutive quarters.
The junior subordinated deferrable interest debentures are the sole assets of the Trusts. First Mariner has fully and unconditionally guaranteed all of the obligations of the Trusts.
Under applicable regulatory guidelines, a portion of the Trust Preferred Securities will qualify as Tier I capital, and the remaining portion will qualify as Tier II capital. Under applicable regulatory guidelines, $10.158 million of the outstanding Trust Preferred Securities qualify as Tier I capital and $6.854 million of the remaining Trust Preferred Securities qualify as Tier II capital at December 31, 2009. The total amount of our Trust Preferred Securities allowable as part of capital was limited to $17.012 million as of December 31, 2009.
See Note 24 to the Consolidated Financial Statements in Item 8 of Part II of this report for a subsequent event related to the Trust Preferred Securities.
(10) Regulatory Matters
Various regulatory capital requirements administered by the federal banking agencies apply to First Mariner and the Bank. Failure to meet minimum capital requirements can initiate certain mandatory, and possibly additional discretionary, actions by regulators that, if undertaken, could have a direct material effect on our financial statements. Under capital adequacy guidelines and the regulatory framework for prompt corrective action, the Bank must meet specific capital guidelines that involve quantitative measures of assets, liabilities, and certain off-balance sheet items as calculated under regulatory accounting practices. The Bank's capital amounts and classification are also subject to qualitative judgments by the regulators about components, risk weightings, and other factors.
Quantitative measures established by regulation to ensure capital adequacy require the Bank to maintain minimum amounts and ratios of Total and Tier 1 capital to risk-weighted assets, and of Tier 1 capital to average assets. As of December 31, 2009 and 2008, the Bank was "adequately capitalized" under the regulatory framework for prompt corrective action.
100
Our regulatory capital amounts and ratios as of December 31, 2009 and 2008, were as follows:
| |
|
|
|
|
To be Well Capitalized Under Prompt Corrective Action Provision |
|||||||||||||||
|---|---|---|---|---|---|---|---|---|---|---|---|---|---|---|---|---|---|---|---|---|
| |
|
|
Minimum Requirements for Capital Adequacy Purposes |
|||||||||||||||||
| |
Actual Amount |
|
||||||||||||||||||
| (dollars in thousands) | Ratio | Amount | Ratio | Amount | Ratio | |||||||||||||||
As of December 31, 2009 |
||||||||||||||||||||
Total capital (to risk-weighted assets): |
||||||||||||||||||||
Consolidated |
$ | 37,124 | 3.6 | % | $ | 82,070 | 8.0 | % | $ | 102,588 | 10.0 | % | ||||||||
Bank |
92,651 | 9.1 | % | 81,778 | 8.0 | % | 102,222 | 10.0 | % | |||||||||||
Tier 1 capital (to risk-weighted assets): |
||||||||||||||||||||
Consolidated |
18,562 | 1.8 | % | 41,035 | 4.0 | % | 61,553 | 6.0 | % | |||||||||||
Bank |
80,946 | 7.9 | % | 40,889 | 4.0 | % | 61,333 | 6.0 | % | |||||||||||
Tier 1 capital (to average fourth quarter assets): |
||||||||||||||||||||
Consolidated |
18,562 | 1.4 | % | 52,703 | 4.0 | % | 65,879 | 5.0 | % | |||||||||||
Bank |
80,946 | 6.2 | % | 51,910 | 4.0 | % | 64,888 | 5.0 | % | |||||||||||
As of December 31, 2008 |
||||||||||||||||||||
Total capital (to risk-weighted assets): |
||||||||||||||||||||
Consolidated |
$ | 110,650 | 9.9 | % | $ | 89,212 | 8.0 | % | $ | 111,515 | 10.0 | % | ||||||||
Bank |
90,367 | 8.8 | % | 80,322 | 8.0 | % | 100,403 | 10.0 | % | |||||||||||
Tier 1 capital (to risk-weighted assets): |
||||||||||||||||||||
Consolidated |
55,325 | 5.0 | % | 44,606 | 4.0 | % | 66,909 | 6.0 | % | |||||||||||
Bank |
70,693 | 6.8 | % | 40,161 | 4.0 | % | 60,242 | 6.0 | % | |||||||||||
Tier 1 capital (to average fourth quarter assets): |
||||||||||||||||||||
Consolidated |
55,325 | 4.3 | % | 51,122 | 4.0 | % | 63,903 | 5.0 | % | |||||||||||
Bank |
70,693 | 5.8 | % | 47,052 | 4.0 | % | 58,815 | 5.0 | % | |||||||||||
The FDIC, through the Deposit Insurance Fund ("DIF"), insures deposits of accountholders up to $250,000. The Bank pays an annual premium to provide for this insurance. As part of the Emergency Economic Stabilization Act of 2008 and subsequent regulatory developments, this maximum was raised from $100,000 to $250,000 through December 31, 2013. Unless extended again, the maximum will revert back to the $100,000 amount at December 31, 2013.
The Bank is a member of the Federal Home Loan Bank System and is required to maintain an investment in the stock of the FHLB based on specific percentages of outstanding mortgages, total assets, or FHLB advances. Purchases and sales of stock are made directly with the Bank at par value.
On September 18, 2009, the Bank entered into an Agreement with the FDIC and the Maryland Division of Financial Regulation (the "Division"), pursuant to which it consented to the entry of an Order to Cease and Desist ("the September Order"), which directs the Bank to (i) increase its capitalization, (ii) improve earnings, (iii) reduce nonperforming loans, (iv) strengthen management policies and practices, and (v) reduce reliance on noncore funding. The September Order replaces the informal agreement that was previously in place among the parties. The September Order requires the Bank to adopt a plan to achieve and maintain a Tier 1 Leverage Capital ratio of at least 7.5% of the Bank's average total assets and a Total Risk-Based Capital ratio of at least 11% of its Total Risk Weighted Assets by June 30, 2010. The Bank has presented a plan to the FDIC and the Division detailing how it will achieve a Tier 1 Leverage Capital ratio of 6.5% and a Total Risk-Based Capital ratio of 10% by March 31, 2010, and a Tier 1 Leverage Capital ratio of 7.5% and a Total Risk-Based Capital ratio of 11% by June 30, 2010. At December 31, 2009, the Bank reported a Tier 1 Leverage Capital ratio of 6.2% and a Total Risk-Based Capital ratio of 9.1%. Within 30 days after the end of
101
each calendar year, the Bank must submit an annual budget and profit plan and a plan that takes into account the Bank's pricing structure, the Bank's cost of funds and how this can be reduced, and the level of provision expense for adversely classified loans. To address reliance on noncore funding, the Bank must adopt and submit a liquidity plan intended to reduce the Bank's reliance on noncore funding, wholesale funding sources, and high-cost rate-sensitive deposits. While the September Order is in effect, the Bank may not pay dividends or management fees without the FDIC's prior consent, the Bank may not accept, renew, or roll over any brokered deposits or pay effective yields on deposits that are greater than those generally paid in its markets. A copy of the September Order was filed as an exhibit to the Company's Form 8-K filed with the SEC on September 21, 2009 and is filed as Exhibit 10.33 hereto.
First Mariner Bancorp is also a party to an agreement with the FRB (the "FRB Agreement"), which requires it to: (i) develop and implement a strategic business plan that includes (a) actions that will be taken to improve our operating performance and reduce the level of parent company leverage, (b) a comprehensive budget and an expanded budget review process, (c) a description of the operating assumptions that form the basis for major projected income and expense components and provisions needed to maintain an adequate loan loss reserve, and (d) a capital plan incorporating all capital needs, risks, and regulatory guidelines; and (ii) submit plans to improve enterprise-wide risk management and effectiveness of internal audit programs. First Mariner Bancorp has also agreed to provide the FRB with advance notice of any significant capital transactions. The new FRB Agreement ("New FRB Agreement") prohibits First Mariner and the Bank from taking any of the following actions without the FRB's prior written approval: (i) declaring or paying any dividends; (ii) taking dividends from the Bank; (iii) making any distributions of interest, principal or other sums on First Mariners' subordinated debentures or trust preferred securities; (iv) incurring, increasing or guaranteeing any debt; or (v) repurchasing, redeeming any shares of its stock. Under the New FRB Agreement, First Mariner had to submit a written plan to the FRB by January 28, 2010 to maintain sufficient capital, on a consolidated basis, such that First Mariner satisfies the FRB's minimum capital requirements. To satisfy the FRB's minimum capital requirements, First Mariner's consolidated tier 1 capital to average assets, tier 1 capital to risk-weighted assets, and total capital to risk-weighted assets ratios at each quarter end must be at least 4.0%, 4.0%, and 8.0%, respectively. At December 31, 2009, those capital ratios were 1.4%, 1.8%, and 3.6%, respectively, which were at an "under-capitalized" level under the prompt corrective action regulations of the FRB. A copy of the New FRB Agreement is an exhibit to the Company's Form 8-K filed with the SEC on November 27, 2009 and is filed as Exhibit 10.34 hereto.
On April 22, 2009, the Bank entered into an agreement (the "April Agreement") with the FDIC relating to alleged violations of consumer protection regulations relative to its fair lending practices pursuant to which it consented to the issuance of an Order ("April Order"). The April Order requires the Bank to pay up to $950,000 in restitution to the Affected Borrowers. It also imposes a civil money penalty of $50,000, all amounts for which were fully reserved in the final quarter of 2008. In addition to requiring the Bank to cease and desist from violating certain federal fair lending laws, the April Orders also requires the Bank to develop and implement policies and procedures to (i) monitor and ensure compliance with fair lending laws and disclosure laws and regulations, (ii) ensure that the costs, terms, features and risks of the loans and services are adequately disclosed to applicants, and (iii) develop an operating plan to maintain quality control, internal audit, and compliance management systems that are effective in ensuring that the Bank's residential mortgage lending activities comply with all applicable laws, regulations, and Bank policies. The Bank must also conduct or sponsor quarterly financial literacy and education courses where it provides residential mortgage loans. Further, the Bank is prohibited from offering "payment-option" adjustable rate mortgage loans, although the Bank ceased offering these loans in 2007. A copy of the April Order is an exhibit to the Company's Form 8-K filed with the SEC on May 7, 2009 and is filed as Exhibit 10.31 hereto.
102
Management does not believe that the April Order will have a material impact on the Bank's financial performance. Management believes the successful satisfaction of the September Order's requirements and the requirements of the FRB Agreement and New FRB Agreement will strengthen the financial condition of the Bank and Company for future periods.
The foregoing will subject us to increased regulatory scrutiny and may have an adverse impact on our business operations. Failure to comply with the provisions of these regulatory requirements may result in more restrictive actions from our regulators, including more severe and restrictive enforcement actions.
See Note 24 for subsequent events related to authorized shares and other capital considerations.
(11) Other Expenses
The following summarizes our other noninterest expenses for the years ended December 31:
| (dollars in thousands) | 2009 | 2008 | 2007 | |||||||
|---|---|---|---|---|---|---|---|---|---|---|
Office supplies |
$ | 504 | $ | 539 | $ | 606 | ||||
Printing |
332 | 437 | 394 | |||||||
Corporate insurance |
1,035 | 720 | 560 | |||||||
Consulting fees |
1,049 | 766 | 789 | |||||||
Marketing/promotion |
286 | 404 | 717 | |||||||
Postage |
763 | 600 | 660 | |||||||
Overnight delivery/courier |
525 | 735 | 788 | |||||||
Security |
259 | 195 | 258 | |||||||
Dues and subscriptions |
490 | 468 | 505 | |||||||
Loan collection expenses |
1,394 | 464 | 618 | |||||||
Regulatory compliance settlement |
— | 1,040 | — | |||||||
Loan origination expense |
— | 254 | 863 | |||||||
Director fees |
276 | 289 | 254 | |||||||
Employee education and training |
161 | 193 | 184 | |||||||
Automobile expense |
144 | 172 | 163 | |||||||
Travel and entertainment |
332 | 435 | 502 | |||||||
Other |
1,546 | 1,833 | 1,960 | |||||||
|
$ | 9,096 | $ | 9,544 | $ | 9,821 | ||||
(12) Income Taxes
Our income tax benefit from continuing operations consists of the following for the years ended December 31:
| (dollars in thousands) | 2009 | 2008 | 2007 | |||||||
|---|---|---|---|---|---|---|---|---|---|---|
Current |
$ | (7,224 | ) | $ | (2,643 | ) | $ | (5,764 | ) | |
Deferred |
(3,663 | ) | (10,989 | ) | (3,578 | ) | ||||
Income tax benefit—continuing operations |
$ | (10,887 | ) | $ | (13,632 | ) | $ | (9,342 | ) | |
103
The income tax benefit from continuing operations is reconciled to the amount computed by applying the federal corporate tax rate of 35% in 2009 and 2008 and 34% in 2007 to the net loss before taxes and discontinued operations as follows for the years ended December 31:
| |
2009 | 2008 | 2007 | ||||||||||||||||
|---|---|---|---|---|---|---|---|---|---|---|---|---|---|---|---|---|---|---|---|
| (dollars in thousands) | Amount | Rate | Amount | Rate | Amount | Rate | |||||||||||||
Tax at statutory federal rate |
$ | (8,439 | ) | (35.0 | )% | $ | (10,654 | ) | (35.0 | )% | $ | (7,155 | ) | (34.0 | )% | ||||
State income taxes, net of federal income tax benefit |
(1,381 | ) | (5.7 | )% | (1,559 | ) | (5.1 | )% | (919 | ) | (4.3 | )% | |||||||
Investment income |
— | — | (29 | ) | (0.1 | )% | (37 | ) | (0.2 | )% | |||||||||
Bank-owned life insurance |
(482 | ) | (2.0 | )% | (527 | ) | (1.8 | )% | (489 | ) | (2.3 | )% | |||||||
Insurance income |
(87 | ) | (0.4 | )% | (5 | ) | — | (55 | ) | (0.3 | )% | ||||||||
Federal and state income tax credits |
(758 | ) | (3.1 | )% | (753 | ) | (2.5 | )% | (168 | ) | (0.8 | )% | |||||||
Other |
260 | 1.0 | % | (105 | ) | (0.3 | )% | (519 | ) | (2.5 | )% | ||||||||
|
$ | (10,887 | ) | (45.2 | )% | $ | (13,632 | ) | (44.8 | )% | $ | (9,342 | ) | (44.4 | )% | ||||
The tax effects of temporary differences between the financial reporting basis and income tax basis of assets and liabilities relate to the following at December 31:
| (dollars in thousands) | 2009 | 2008 | ||||||
|---|---|---|---|---|---|---|---|---|
Deferred tax assets: |
||||||||
Allowance for losses on loans |
$ | 4,728 | $ | 6,771 | ||||
Amortization of intangible assets |
80 | 93 | ||||||
Valuation allowance and secondary marketing reserve |
1,708 | 3,235 | ||||||
State net operating loss carryforward |
3,437 | 2,073 | ||||||
Federal net operating loss carryforward |
10,635 | 5,951 | ||||||
Other-than-temporary impairment |
3,468 | 2,262 | ||||||
Nonaccrual interest |
1,206 | 1,295 | ||||||
Tax credit carryforward |
337 | 193 | ||||||
Other |
— | 91 | ||||||
Total deferred tax assets |
25,599 | 21,964 | ||||||
Deferred tax liabilities: |
||||||||
Depreciation |
424 | 736 | ||||||
Excess servicing fees |
478 | 436 | ||||||
Other |
242 | — | ||||||
Total deferred tax liabilities |
1,144 | 1,172 | ||||||
Net deferred tax asset attributable to operations |
24,455 | 20,792 | ||||||
Unrealized loss on interest rate swap charged to other comprehensive income |
— | 484 | ||||||
Unrealized loss on investments charged to other comprehensive income |
3,759 | 4,781 | ||||||
Net deferred tax assets |
$ | 28,214 | $ | 26,057 | ||||
We have net operating loss carryforwards for state and federal income tax purposes of approximately $64.000 million and $30.000 million, respectively, which are available to offset future taxable income and which expire in 2024 through 2029. Management expects to fully realize the benefits of these tax loss carryforwards before their expiration.
104
The Bank has earned significant state tax incentives totaling $5.5 million through its participation in the One Maryland Economic Development ("One Maryland") and Job Creation Tax Credit programs. We will realize the benefits of the incentives in our reported earnings as the credits can be utilized, in accordance with accounting standards that govern the recognition of investment tax credits. The amount of the credit that we can utilize will be determined by the level of Maryland taxable income for the Bank only and will be recognized as a reduction in our income tax expense. During 2009 and 2008, we utilized $591,000 and $585,000, respectively, in credits related to this incentive program. Any unused One Maryland credits can be carried forward and will expire in 2016. The Job Creation Tax Credit can be carried forward for five years. The total amount of tax credits not utilized as of December 31, 2009 is approximately $2.924 million.
The Bank has invested in a partnership that owns and manages seven affordable housing projects in the Mid-Atlantic area. Through its interest in the partnership, the Bank receives tax incentives in the form of Federal tax credits that can be used to offset current Federal income taxes. Tax credits associated with the limited partnership (assuming the 5% limited partnership interest currently owned by the Bank) is projected to total $1.599 million and will be available to the limited partners from January 2003 through December 2012. The annual tax credits anticipated to be available approximate $168,000. The Bank invested $1.5 million to obtain its 5% interest in the partnership in July of 2003, and recognized $168,000 in tax credits in 2007. As a result of tax losses incurred in 2009 and 2008, annual credits of $168,000 were not realized in either year and were carried forward. Total credits utilized to date through December 31, 2009 amounted to $754,000.
Our income tax returns are subject to review and examination by federal and state taxing authorities. We are currently open to audit under the applicable statutes of limitations by the Internal Revenue Service for the years ended December 31, 2006 through 2008. The years open to examination by state taxing authorities vary by jurisdiction.
(13) Dividends and Earnings Per Share
As a depository institution whose deposits are insured by the FDIC, the Bank may not pay dividends or distribute any of its capital assets while it remains in default on any assessment due the FDIC. The Bank currently is not in default under any of its obligations to the FDIC. As a commercial bank under the Maryland Financial Institution Law, the Bank may declare cash dividends from undivided profits or, with the prior approval of the Commissioner of Financial Regulation, out of surplus in excess of 100% of its required capital stock, after providing for due or accrued expenses, losses, interest, and taxes.
First Mariner's current ability to pay dividends to stockholders is largely dependent upon the receipt of dividends from the Bank. Both federal and state laws impose restrictions on the ability of the Bank to pay dividends. Federal law prohibits the payment of a dividend by an insured depository institution if the depository institution is considered "under-capitalized" or if the payment of the dividend would make the institution "under-capitalized." For a Maryland state-chartered bank or trust company, dividends may be paid out of undivided profits or, with the prior approval of the Commissioner, from surplus in excess of 100% of required capital stock. Cash dividends may not be paid in excess of 90% of net earnings.
First Mariner is deferring interest payments under its outstanding junior subordinated deferrable interest debentures related to the Trust Preferred Securities. This deferred interest will have to be fully repaid before First Mariner can pay any cash dividends to stockholders. Additionally, First Mariner and the Bank have entered into agreements with their regulators which require, among other things, prior consultation with those regulators before dividends are paid. See Note 10.
105
Information relating to the calculations of our loss per common share is summarized as follows for the years ended December 31:
| (dollars in thousands, except for per share data) | 2009 | 2008 | 2007 | ||||||||
|---|---|---|---|---|---|---|---|---|---|---|---|
Weighted-average share outstanding—basic |
6,452,631 | 6,390,046 | 6,396,142 | ||||||||
Dilutive securities—options and warrants |
— | — | — | ||||||||
Adjusted weighted-average shares outstanding—dilutive |
6,452,631 | 6,390,046 | 6,396,142 | ||||||||
Net loss from continuing operations |
$ | (13,224 | ) | $ | (16,809 | ) | $ | (11,703 | ) | ||
Net (loss) income from discontinued operations |
(9,060 | ) | 1,721 | 1,640 | |||||||
Net loss |
$ | (22,284 | ) | $ | (15,088 | ) | $ | (10,063 | ) | ||
Basic: |
|||||||||||
Net loss from continuing operations |
$ | (2.05 | ) | $ | (2.63 | ) | $ | (1.83 | ) | ||
Net (loss) income from discontinued operations |
(1.40 | ) | 0.27 | 0.26 | |||||||
Net loss |
$ | (3.45 | ) | $ | (2.36 | ) | $ | (1.57 | ) | ||
Diluted: |
|||||||||||
Net loss from continuing operations |
$ | (2.05 | ) | $ | (2.63 | ) | $ | (1.83 | ) | ||
Net (loss) income from discontinued operations |
(1.40 | ) | 0.27 | 0.26 | |||||||
Net loss |
$ | (3.45 | ) | $ | (2.36 | ) | $ | (1.57 | ) | ||
For the years ended December 31, 2009, 2008, and 2007, all options were antidilutive due to our realized net loss.
(14) Comprehensive Income
Comprehensive income is defined as net income plus transactions and other occurrences which are the result of nonowner changes in equity. Our nonowner equity changes are comprised of unrealized gains or losses on available-for-sale securities and interest rate swaps that are accumulated with net income in determining comprehensive income.
Components of our comprehensive loss are as follows for the years ended December 31:
| (dollars in thousands) | 2009 | 2008 | 2007 | ||||||||
|---|---|---|---|---|---|---|---|---|---|---|---|
Net loss |
$ | (22,284 | ) | $ | (15,088 | ) | $ | (10,063 | ) | ||
Other comprehensive income items: |
|||||||||||
Cumulative effect of accounting change for certain investments, net of tax (benefit) expense of $(750), $0, and $625, respectively |
(1,148 | ) | — | 993 | |||||||
Deconsolidation of Mariner Finance, net of tax expense of $484, $0, and $0, respectively |
715 | — | — | ||||||||
Unrealized holding gains (losses) arising during the period (net of tax expense (benefit) of $643, $(4,227), and $(817), respectively) |
987 | (6,246 | ) | (1,299 | ) | ||||||
Unrealized holding losses on swaps arising during the period (net of tax benefit of $0, $484, and $0, respectively) |
— | (715 | ) | — | |||||||
Reclassification adjustment for losses (gains) (net of tax (benefit) expense of $(992), $(2,170), and $364, respectively) included in net loss |
1,524 | 3,206 | (579 | ) | |||||||
Total other comprehensive income (loss) |
2,078 | (3,755 | ) | (885 | ) | ||||||
Total comprehensive loss |
$ | (20,206 | ) | $ | (18,843 | ) | $ | (10,948 | ) | ||
106
(15) Employee Benefit Plans
Profit Sharing Plan
We established a defined contribution plan in 1997, covering our employees meeting certain age and service eligibility requirements. The Plan provides for cash deferrals qualifying under Section 401(k). As of December 31, 2008, we discontinued the company-match contributions. In 2008 and 2007, we made matching contributions to the plan which totaled $639,000 and $583,000, respectively.
Stock Options
We have stock option plans, which provide for the granting of options to acquire First Mariner common stock to our directors and key employees. Option exercise prices are equal to or greater than the fair market value of the common stock on the date of the grant. As of December 31, 2009, options to purchase 654,593 shares of common stock were fully vested and options to purchase 14,000 shares of common stock vest over a two-year period. All options expire 10 years after the date of grant. See Note 24 on subsequent events for plan modifications.
We account for stock options issued under our stockholder-approved Long-Term Incentive Plan (the "Plan") in accordance with FASB guidance on share-based payments. The plan permits the granting of share options and shares to our directors and key employees. We recognized stock based compensation cost of $30,000, $72,000, and $114,000 for the years ended December 31, 2009, 2008, and 2007, respectively. We expect to incur approximately $33,000 in additional stock based compensation expense related to the unvested portion of options over the next two years.
Information with respect to stock options is as follows for the years ended December 31, 2009, 2008, and 2007:
| |
2009 | Weighted- Average Remaining Contractual Term (in years) |
|
2008 | Weighted- Average Remaining Contractual Term (in years) |
|
||||||||||||||||||||
|---|---|---|---|---|---|---|---|---|---|---|---|---|---|---|---|---|---|---|---|---|---|---|---|---|---|---|
| |
Number of Shares |
Weighted- Average Exercise Price |
Aggregate Intrinsic Value (in thousands) |
Number of Shares |
Weighted- Average Exercise Price |
Aggregate Intrinsic Value (in thousands) |
||||||||||||||||||||
Outstanding at beginning |
||||||||||||||||||||||||||
of year |
850,919 | $ | 12.09 | 813,788 | $ | 12.47 | ||||||||||||||||||||
Granted |
— | — | 55,600 | 5.32 | ||||||||||||||||||||||
Exercised |
— | — | — | — | ||||||||||||||||||||||
Forfeited/cancelled |
(182,326 | ) | 11.70 | (18,469 | ) | 8.27 | ||||||||||||||||||||
Oustanding at end of year |
668,593 | 12.20 | 3.8 | $ | — | 850,919 | 12.09 | 4.5 | $ | — | ||||||||||||||||
Exercisable at end of year |
654,593 | 12.34 | 3.7 | $ | — | 823,683 | 12.29 | 4.3 | $ | — | ||||||||||||||||
107