Attached files
| file | filename |
|---|---|
| EX-99.1 - EX-99.1 - ACCURIDE CORP | a10-6949_1ex99d1.htm |
| 8-K - 8-K - ACCURIDE CORP | a10-6949_18k.htm |
Exhibit 99.2
|
|
4th Quarter 2009 Earnings Call March 24, 2010 |
|
|
2 Company Positioned for Market Upturn Industry Snapshot 2009 Financial Update Restructuring Update 2010 Outlook Q&A Closing Comments Bill Lasky Bill Lasky Jim Woodward Jim Woodward Jim Woodward Bill Lasky Jim Woodward Bill Lasky Agenda |
|
|
3 Statements contained in this news release that are not purely historical are forward-looking statements within the meaning of Section 27A of the Securities Act of 1933, as amended, and Section 21E of the Securities Exchange Act of 1934, as amended, including statements regarding Accuride’s expectations, hopes, beliefs and intentions with respect to consummation of the Plan and its ability to transition out of Chapter 11. Such statements are subject to the impact on Accuride’s business and prospects generally of, among other factors, market demand in the commercial vehicle industry, general economic, business and financing conditions, labor relations, governmental action, competitor pricing activity, expense volatility and other risks detailed from time to time in Accuride’s Securities and Exchange Commission filings, including those described in Item 1A of Accuride’s Annual Report on Form 10-K for the fiscal year ended December 31, 2008. Any forward-looking statement reflects only Accuride’s belief at the time the statement is made. Although Accuride believes that the expectations reflected in these forward-looking statements are reasonable, it cannot guarantee its future results, levels of activity, performance or achievements. Except as required by law, Accuride undertakes no obligation to update any forward-looking statements to reflect events or developments after the date of this news release. Forward Looking Statements |
|
|
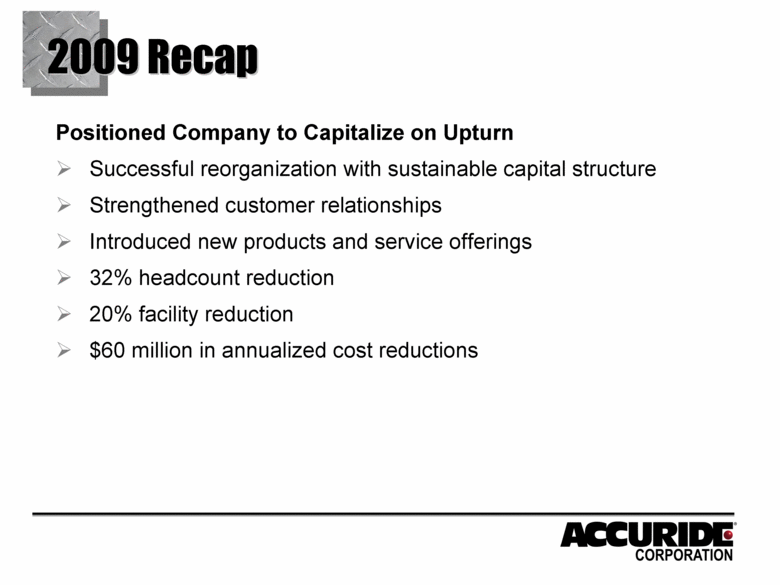
2009 Recap Positioned Company to Capitalize on Upturn Successful reorganization with sustainable capital structure Strengthened customer relationships Introduced new products and service offerings 32% headcount reduction 20% facility reduction $60 million in annualized cost reductions |
|
|
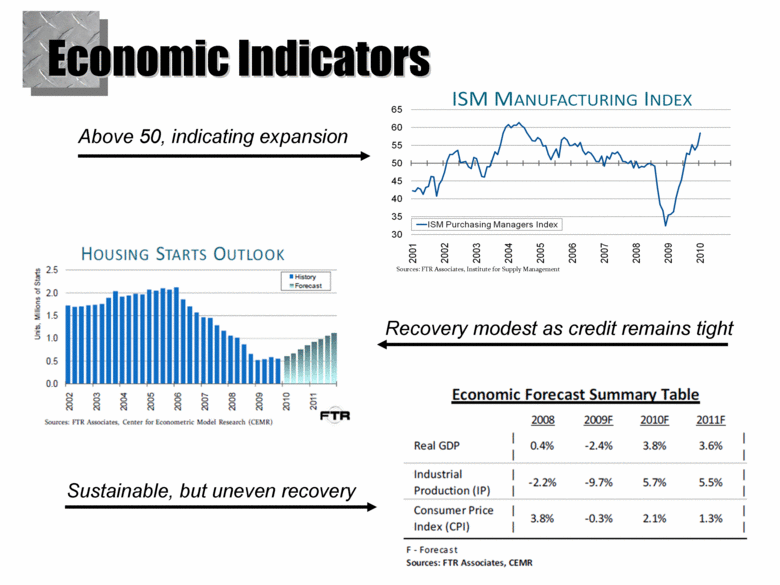
Economic Indicators Sustainable, but uneven recovery Recovery modest as credit remains tight Above 50, indicating expansion Sources: FTR Associates, Institute for Supply Management Economic Forecast Summary Table 2008 2009F 2010F 2011F Real GDP 0.4% -2.4% 3.8% 3.6% Industrial Production (IP) -2.2% -9.7% 5.7% 5.5% Consumer Price Index (CPI) 3.8% -0.3% 2.1% 1.3% F - Forecast Sources: FTR Associates, CEMR |
|
|
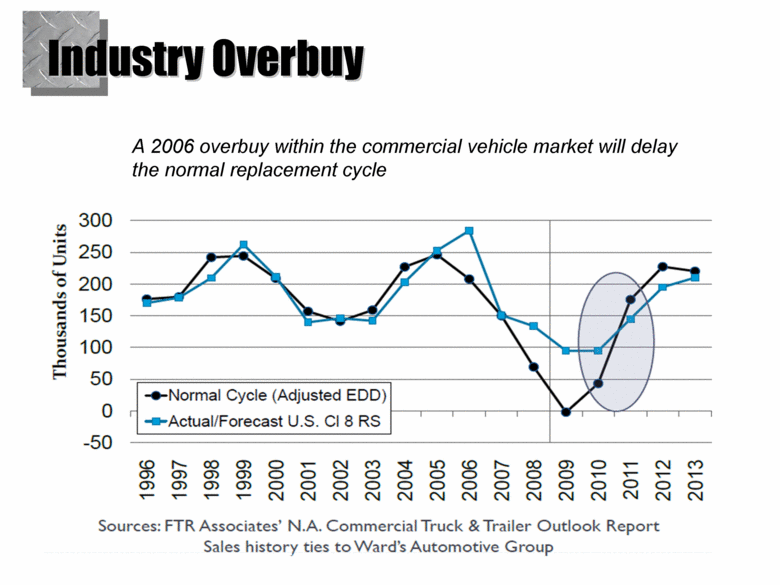
A 2006 overbuy within the commercial vehicle market will delay the normal replacement cycle Industry Overbuy Thousands 300 250 200 150 100 50 0 -50 Normal Cycle (Adjusted EDD) Actual/Forecast U.S. CI&RS 1996 1997 1998 1999 2000 2001 2002 2003 2004 2005 2006 2007 2008 2009 2010 2011 2012 2013 Sources: FTR Associates’ N.A. Commercial Truck & Trailer Outlook Report Sales history ties to Word’s Automotive Group |
|
|
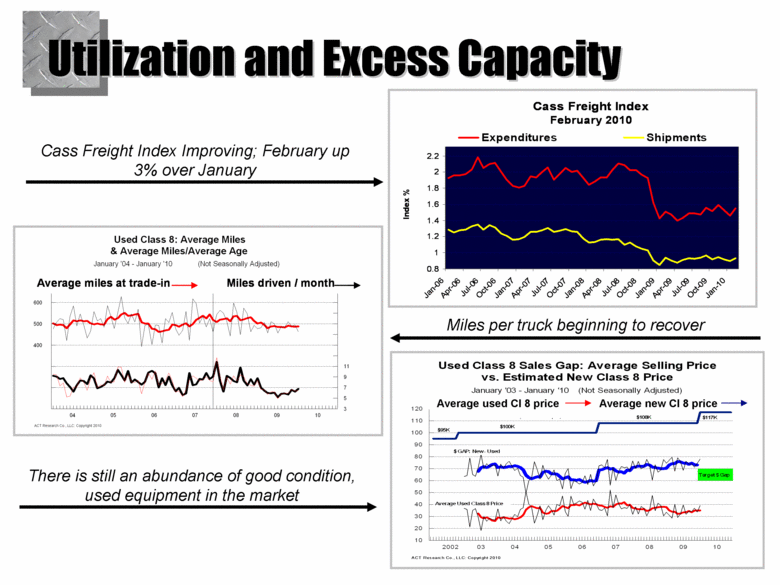
Cass Freight Index Improving; February up 3% over January Miles per truck beginning to recover There is still an abundance of good condition, used equipment in the market Average used Cl 8 price Average new Cl 8 price Utilization and Excess Capacity Used Class 8 Sales Gap: Average Selling Price vs. Estimated New Class 8 Price January '03 - January '10 (Not Seasonally Adjusted) ACT Research Co., LLC: Copyright 2010 2002 03 04 05 06 07 08 09 10 10 20 30 40 50 60 70 80 90 100 110 120 Average Used Class 8 Price $95K $117K $108K $100K $ GAP: New - Used Target $ Gap Cass Freight Index February 2010 0.8 1 1.2 1.4 1.6 1.8 2 2.2 2.4 Jan-06 Apr-06 Jul-06 Oct-06 Jan-07 Apr-07 Jul-07 Oct-07 Jan-08 Apr-08 Jul-08 Oct-08 Jan-09 Apr-09 Jul-09 Oct-09 Jan-10 Index % Expenditures Shipments Average miles at trade - in Miles driven / month Average miles at trade - in Miles driven / month |
|
|
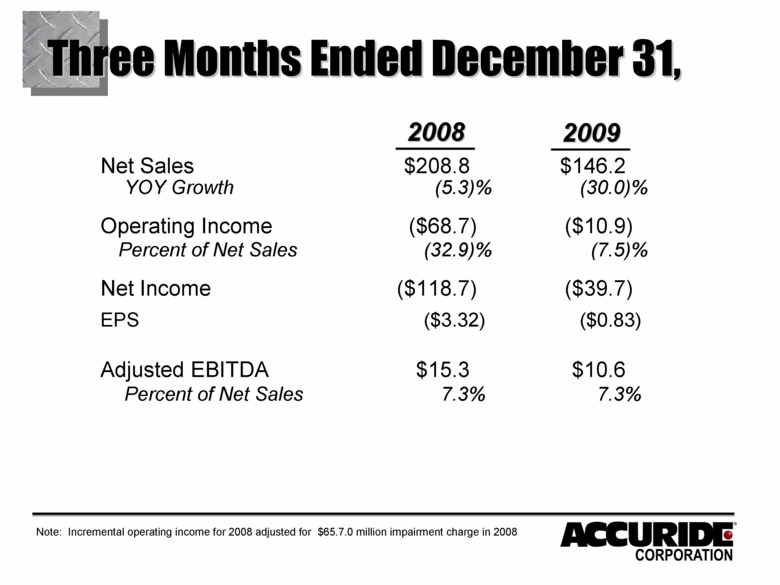
Three Months Ended December 31, Net Sales $208.8 $146.2 YOY Growth (5.3)% (30.0)% Operating Income ($68.7) ($10.9) Percent of Net Sales (32.9)% (7.5)% Net Income ($118.7) ($39.7) EPS ($3.32) ($0.83) Adjusted EBITDA $15.3 $10.6 Percent of Net Sales 7.3% 7.3% 2008 2009 Note: Incremental operating income for 2008 adjusted for $65.7.0 million impairment charge in 2008 |
|
|
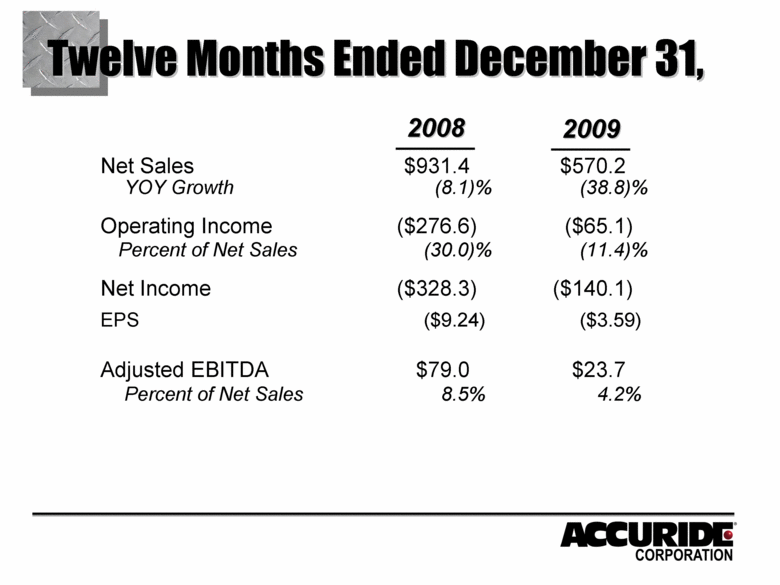
Twelve Months Ended December 31, Net Sales $931.4 $570.2 YOY Growth (8.1)% (38.8)% Operating Income ($276.6) ($65.1) Percent of Net Sales (30.0)% (11.4)% Net Income ($328.3) ($140.1) EPS ($9.24) ($3.59) Adjusted EBITDA $79.0 $23.7 Percent of Net Sales 8.5% 4.2% 2008 2009 |
|
|
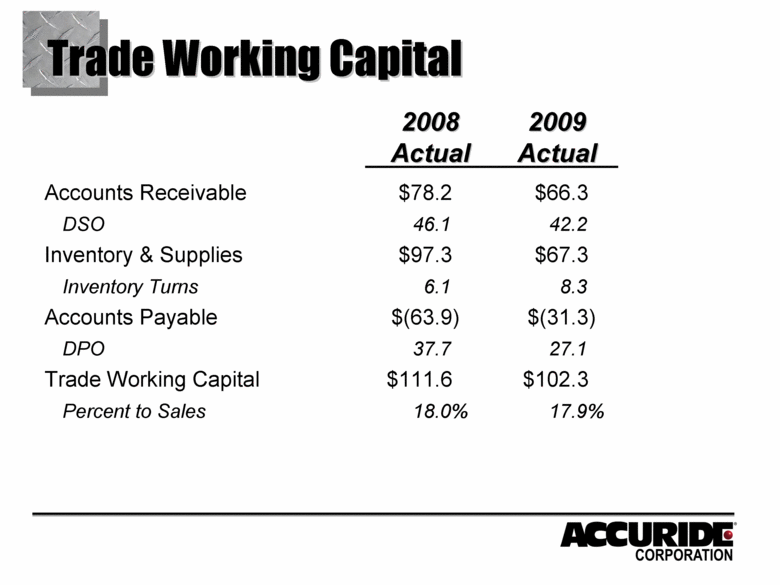
Trade Working Capital Accounts Receivable $78.2 $66.3 DSO 46.1 42.2 Inventory & Supplies $97.3 $67.3 Inventory Turns 6.1 8.3 Accounts Payable $(63.9) $(31.3) DPO 37.7 27.1 Trade Working Capital $111.6 $102.3 Percent to Sales 18.0% 17.9% 2008 Actual 2009 Actual |
|
|
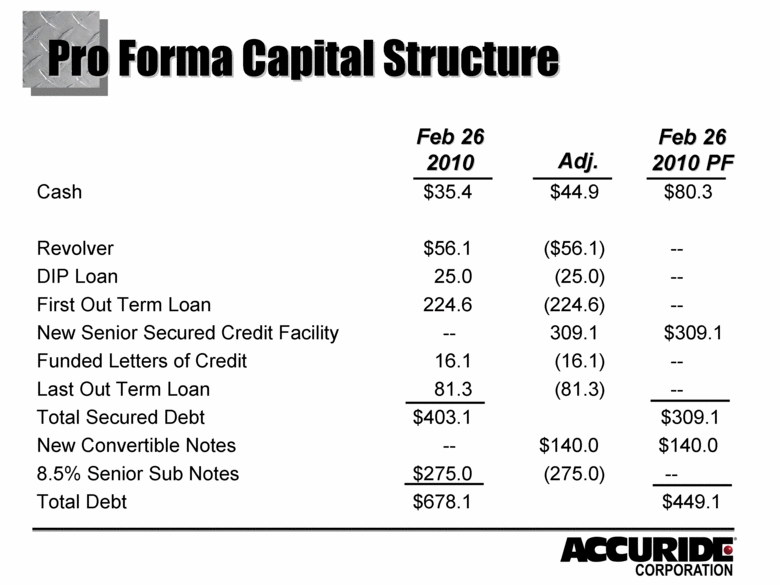
Cash $35.4 $44.9 $80.3 Revolver $56.1 ($56.1) -- DIP Loan 25.0 (25.0) -- First Out Term Loan 224.6 (224.6) -- New Senior Secured Credit Facility -- 309.1 $309.1 Funded Letters of Credit 16.1 (16.1) -- Last Out Term Loan 81.3 (81.3) -- Total Secured Debt $403.1 $309.1 New Convertible Notes -- $140.0 $140.0 8.5% Senior Sub Notes $275.0 (275.0) -- Total Debt $678.1 $449.1 Pro Forma Capital Structure Feb 26 2010 Feb 26 2010 PF Adj. |
|
|
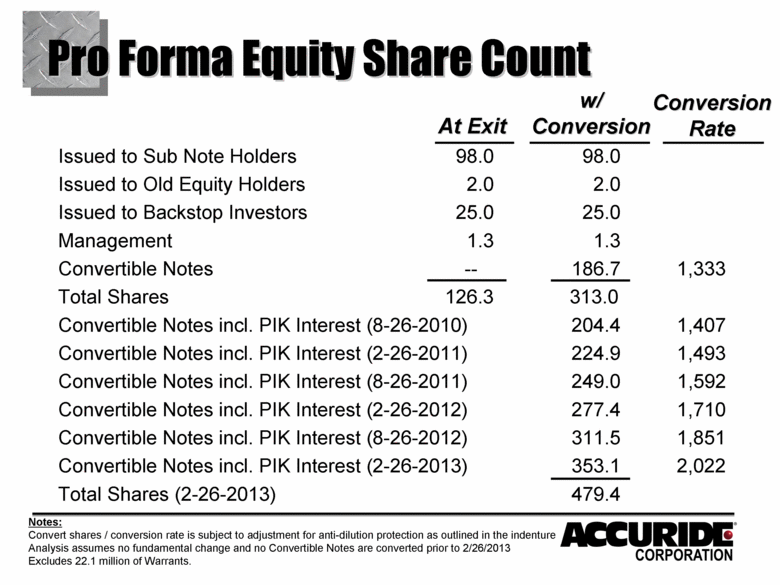
Issued to Sub Note Holders 98.0 98.0 Issued to Old Equity Holders 2.0 2.0 Issued to Backstop Investors 25.0 25.0 Management 1.3 1.3 Convertible Notes -- 186.7 1,333 Total Shares 126.3 313.0 Convertible Notes incl. PIK Interest (8-26-2010) 204.4 1,407 Convertible Notes incl. PIK Interest (2-26-2011) 224.9 1,493 Convertible Notes incl. PIK Interest (8-26-2011) 249.0 1,592 Convertible Notes incl. PIK Interest (2-26-2012) 277.4 1,710 Convertible Notes incl. PIK Interest (8-26-2012) 311.5 1,851 Convertible Notes incl. PIK Interest (2-26-2013) 353.1 2,022 Total Shares (2-26-2013) 479.4 Pro Forma Equity Share Count At Exit w/Conversion Conversion Rate Notes: Convert shares / conversion rate is subject to adjustment for anti-dilution protection as outlined in the indenture Analysis assumes no fundamental change and no Convertible Notes are converted prior to 2/26/2013 Excludes 22.1 million of Warrants. |
|
|
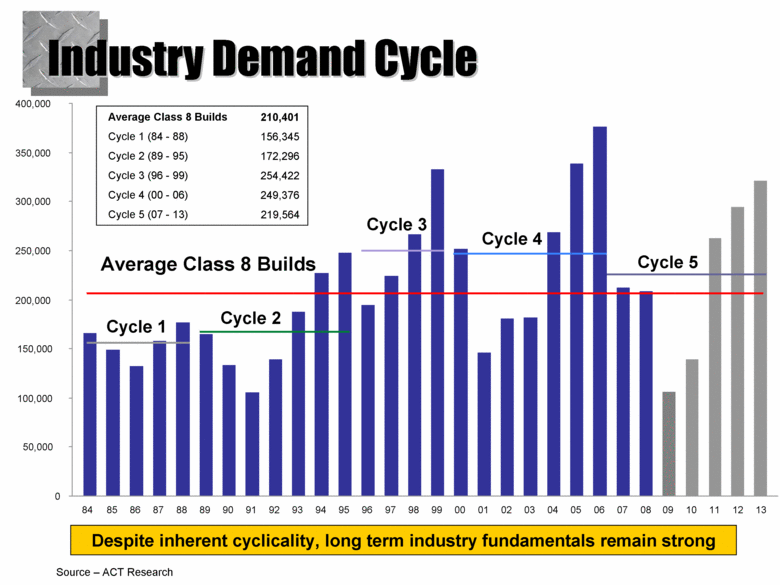
Industry Demand Cycle Despite inherent cyclicality, long term industry fundamentals remain strong Cycle 2 Cycle 1 Cycle 3 Cycle 4 Average Class 8 Builds 0 50,000 100,000 150,000 200,000 250,000 300,000 350,000 400,000 84 85 86 87 88 89 90 91 92 93 94 95 96 97 98 99 00 01 02 03 04 05 06 07 08 09 10 11 12 13 Cycle 5 Average Class 8 Builds Cycle 1 (84 - 88) Cycle 2 (89 - 95) Cycle 3 (96 - 99) Cycle 4 (00 - 06) Cycle 5 (07 - 13) 210,401 156,345 172,296 254,422 249,376 219,564 Source – ACT Research |
|
|
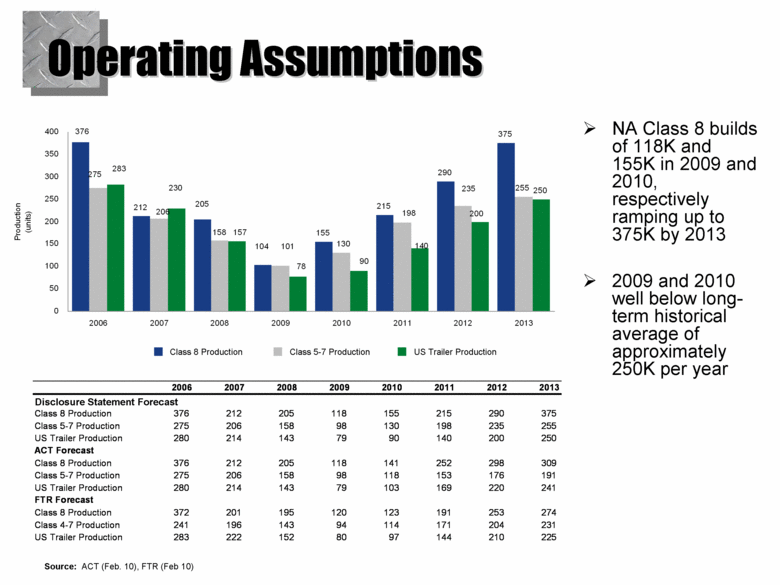
NA Class 8 builds of 118K and 155K in 2009 and 2010, respectively ramping up to 375K by 2013 2009 and 2010 well below long-term historical average of approximately 250K per year Source: ACT (Feb. 10), FTR (Feb 10) Class 8 Production Class 5-7 Production US Trailer Production Operating Assumptions Disclosure Statement Forecast 212 155 215 290 375 255 250 104 376 205 275 206 158 101 130 198 235 283 230 78 90 140 200 157 0 50 100 150 200 250 300 350 400 2006 2007 2008 2009 2010 2011 2012 2013 Production (units) 2006 2007 2008 2009 2010 2011 2012 2013 Company Forecast Class 8 Production 376 212 205 118 155 215 290 375 Class 5-7 Production 275 206 158 98 130 198 235 255 US Trailer Production 280 214 143 79 90 140 200 250 ACT Forecast Class 8 Production 376 212 205 118 141 252 298 309 Class 5-7 Production 275 206 158 98 118 153 176 191 US Trailer Production 280 214 143 79 103 169 220 241 FTR Forecast Class 8 Production 372 201 195 120 123 191 253 274 Class 4-7 Production 241 196 143 94 114 171 204 231 US Trailer Production 283 222 152 80 97 144 210 225 212 155 215 290 375 255 250 118 376 205 275 206 158 98 130 198 235 280 214 79 90 140 200 143 0 50 100 150 200 250 300 350 400 2006 2007 2008 2009 2010 2011 2012 2013 Production (units) |
|
|
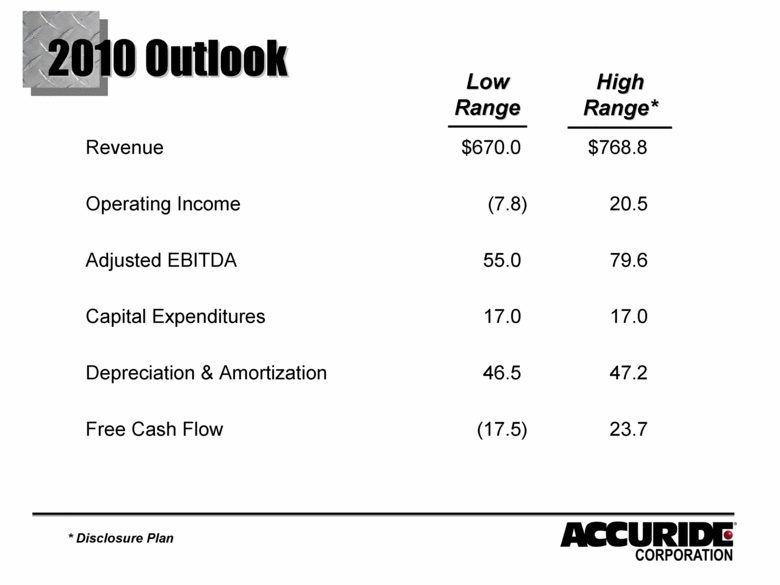
2010 Outlook Revenue $670.0 $768.8 Operating Income (7.8) 20.5 Adjusted EBITDA 55.0 79.6 Capital Expenditures 17.0 17.0 Depreciation & Amortization 46.5 47.2 Free Cash Flow (17.5) 23.7 Low Range High Range* * Disclosure Plan |
|
|
Solid company Leading brands Positioned to capitalize on industry upturn |
|
|
Appendix |
|
|
ADJUSTED EBITDA IS NOT INTENDED TO REPRESENT CASH FLOW AS DEFINED BY GENERALLY ACCEPTED ACCOUNTING PRINCIPLES (“GAAP”) AND SHOULD NOT BE CONSIDERED AS AN INDICATOR OF CASH FLOW FROM OPERATIONS. ADJUSTED EBITDA REPRESENTS NET INCOME BEFORE NET INTEREST EXPENSE, INCOME TAX (EXPENSE) BENEFIT, DEPRECIATION AND AMORTIZATION PLUS NON-RECURRING ITEMS. HOWEVER, OTHER COMPANIES MAY CALCULATE ADJUSTED EBITDA DIFFERENTLY. ACCURIDE HAS INCLUDED INFORMATION CONCERNING ADJUSTED EBITDA IN THIS PRESENTATION BECAUSE ACCURIDE’S MANAGEMENT AND OUR BOARD OF DIRECTORS USE IT AS A MEASURE OF OUR PERFORMANCE TO INTERNAL BUSINESS PLANS TO WHICH A SIGNIFICANT PORTION OF MANAGEMENT INCENTIVE PROGRAMS ARE BASED. IN ADDITION, FUTURE INVESTMENT AND CAPITAL ALLOCATION DECISIONS ARE BASED ON ADJUSTED EBITDA. INVESTORS AND INDUSTRY ANALYSTS USE ADJUSTED EBITDA TO MEASURE THE COMPANY’S PERFORMANCE TO HISTORIC RESULTS AND TO THE COMPANY’S PEER GROUP. THE COMPANY HAS HISTORICALLY PROVIDED THE MEASURE IN PREVIOUS PRESS RELEASES AND BELIEVES IT PROVIDES TRANSPARENCY AND CONTINUITY TO INVESTORS FOR COMPARABLE PURPOSES. CERTAIN FINANCIAL COVENANTS IN OUR BORROWING ARRANGEMENTS ARE TIED TO SIMILAR MEASURES. Non-GAAP Financial Data |
|
|
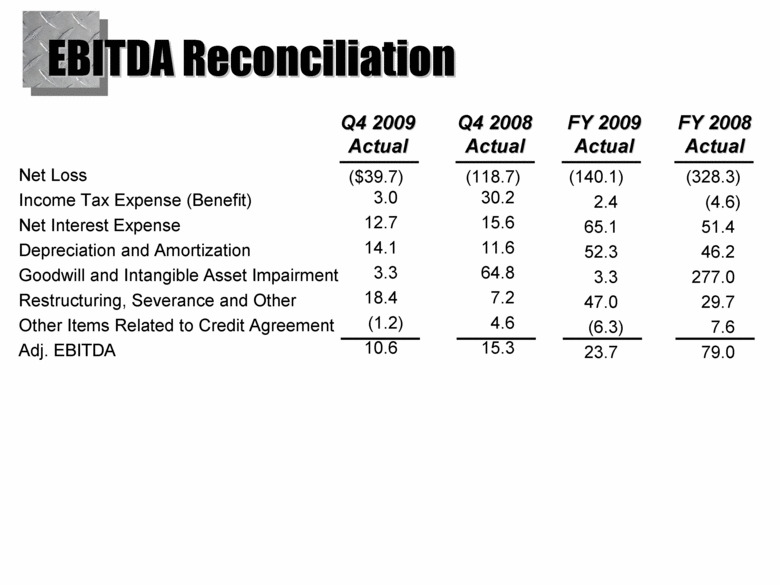
(140.1) (328.3) 2.4 (4.6) 65.1 51.4 52.3 46.2 3.3 277.0 47.0 29.7 (6.3) 7.6 23.7 79.0 ($39.7) (118.7) 3.0 30.2 12.7 15.6 14.1 11.6 3.3 64.8 18.4 7.2 (1.2) 4.6 10.6 15.3 EBITDA Reconciliation Net Loss Income Tax Expense (Benefit) Net Interest Expense Depreciation and Amortization Goodwill and Intangible Asset Impairment Restructuring, Severance and Other Other Items Related to Credit Agreement Adj. EBITDA Q4 2009 Actual Q4 2008 Actual FY 2009 Actual FY 2008 Actual |

