UNITED STATES
SECURITIES AND EXCHANGE COMMISSION
WASHINGTON, D.C. 20549
FORM
10-K/A
Amendment
No. 1
(Mark One)
| |
|
|
| þ |
|
ANNUAL REPORT PURSUANT TO SECTION 13 OR 15(d) OF THE SECURITIES EXCHANGE ACT OF 1934 |
For Fiscal Year Ended December 31, 2009.
or
| |
|
|
| o |
|
TRANSITION REPORT PURSUANT TO SECTION 13 OR 15(d) OF THE SECURITIES EXCHANGE ACT OF 1934 |
For the Transition Period from to .
Commission File Number 001-16249
INTERNET CAPITAL GROUP, INC.
(Exact Name of
Registrant as Specified in Its Charter)
| |
|
|
Delaware
(State or Other Jurisdiction of
Incorporation or Organization)
|
|
23-2996071
(I.R.S. Employer
Identification Number) |
| |
|
|
690 Lee Road, Suite 310, Wayne, PA
(Address of Principal Executive Offices)
|
|
19087
(Zip Code) |
(610) 727-6900
(Registrant’s telephone number, including area code)
| |
|
|
Securities registered pursuant to Section 12(b) of the Act:
Common stock, par value $.001 per share
(Title of Class)
|
|
The NASDAQ Stock Market LLC
(The NASDAQ Global Market)
(Name of Each Exchange on Which Registered) |
Securities registered pursuant to Section 12(g) of the Act: None
Indicate by check mark if the registrant is a well-known seasoned issuer, as defined in Rule
405 of the Securities Act. Yes
o
No þ
Indicate by check mark if the registrant is not required to file reports pursuant to Section
13 or 15(d) of the Exchange Act. Yes o No þ
Indicate by check mark whether the registrant (1) has filed all reports required to be filed
by Section 13 or 15(d) of the Exchange Act during the preceding 12 months (or for such shorter
period that the registrant was required to file such reports) and (2) has been subject to such
filing requirements for the past 90 days. Yes þ No o
Indicate by check mark
whether the registrant has submitted electronically and posted on its corporate
Web site, if any, every Interactive Data File required to be submitted and
posted pursuant to Rule 405 of Regulation S-T during the preceding
12 months (or for such shorter period that the registrant was required to
submit and post such files). Yes o No o
Indicate by check mark if disclosure of delinquent filers pursuant to Item 405 of Regulation
S-K is not contained herein, and will not be contained, to the best of registrant’s knowledge, in
definitive proxy or information statements incorporated by reference in Part III of this Form 10-K
or any amendment to this Form 10-K. þ
Indicate by check mark whether the registrant is a large accelerated filer, an accelerated
filer, a non-accelerated filer or a smaller reporting company. See the definitions of “large
accelerated filer,” “accelerated filer” and “smaller reporting company” in Rule 12b-2 of the
Exchange Act. Check one:
| |
|
|
|
|
|
|
| Large accelerated filer o |
|
Accelerated filer þ
|
|
Non-accelerated filer o |
|
Smaller reporting company o |
Indicate by check mark whether the registrant is a shell company (as defined in Exchange Act
Rule 12b-2). Yes o No þ
The aggregate market value of the 35,329,064 shares of Common Stock held by non-affiliates of
the registrant as of March 1, 2010 was $237.8 million, based upon the closing price of $6.73 on the
NASDAQ Global Market on June 30, 2009. (For this computation, the registrant has excluded the
market value of all shares of its Common Stock held by its executive officers and
directors; such exclusion shall not be deemed to constitute an admission that any such person is an
“affiliate” of the Registrant.)
As of March 1, 2010, there were 36,423,789 shares of Common Stock outstanding.
DOCUMENTS INCORPORATED BY REFERENCE
Portions of the definitive proxy statement to be filed
with the Securities and Exchange Commission (the “SEC”) relative to the Company’s 2010 Annual
Meeting of Stockholders (the “Definitive Proxy Statement”) are incorporated by reference into Part III of this Report.
EXPLANATORY NOTE REGARDING THIS FORM 10-K/A
In accordance with Exchange Act Rule 12b-15, Internet Capital Group, Inc. (the “Registrant”) is
filing this Amendment No. 1 to its Annual Report on Form 10-K for the year ended December 31, 2009,
which was initially filed with the Securities and Exchange Commission on March 16, 2010 (the
“Original Filing”), to include audited financial statements of StarCite, Inc. (“StarCite”), a
subsidiary of the Registrant accounted for under the equity method, with respect to the years ended
December 31, 2009, 2008 and 2007 that were not available at the time of the Original Filing, along
with related materials.
This Amendment No. 1 amends Part IV, Item 15, “Exhibits and Financial Statement Schedules,” to
reflect (1) the inclusion of the consolidated financial statements of StarCite as Exhibit 99.2
hereto, (2) the inclusion of the Consent of KPMG LLP regarding the consolidated financial
statements of StarCite as Exhibit 23.3 hereto and (3) the inclusion of updated certifications from
the Registrant’s principal executive officer and principal financial officer as required by
Sections 302 and 906 of the Sarbanes-Oxley Act of 2002, as amended. This Form 10-K/A restates the
Original Filing in its entirety by presenting the relevant text of these amended items, as amended.
Except for the amended information referred to above, this Form 10-K/A continues to describe
conditions as of the date of the Original Filing, and the Registrant has not modified or updated
any other disclosures presented in the Original Filing. Accordingly, except as specifically
referenced herein, this Amendment No. 1 does not restate the Registrant’s financial statements
previously filed in the Original Filing, does not reflect events occurring after the filing of the
Original Filing and does not modify or update those disclosures in the Original Filing affected by
subsequent events. Information not affected by this Amendment No. 1 is unchanged and reflects the
disclosures made at the time of the Original Filing on March 16, 2010.
INTERNET CAPITAL GROUP, INC.
FORM 10-K/A
DECEMBER 31, 2009
INDEX
2
Forward-Looking Statements
Forward-looking statements made with respect to our financial condition and results of operations
and business in this Annual Report on Form 10-K/A (this “Report”) and those made from time to time by
us through our senior management are made pursuant to the “safe harbor” provisions of the Private
Securities Litigation Reform Act of 1995. These forward-looking statements are based on our
current expectations and projections about future events but are subject to known and unknown
risks, uncertainties and assumptions about us and our partner companies that may cause our actual
results, levels of activity, performance or achievements to be materially different from any future
results, levels of activity, performance or achievements expressed or implied by such
forward-looking statements.
Factors that could cause our actual results, levels of activity, performance or achievements to
differ materially from those anticipated in forward-looking statements include, but are not limited
to, factors discussed elsewhere in this Report and include, among other things:
| |
• |
|
economic conditions generally; |
| |
| |
• |
|
capital spending by our partner companies’ customers; |
| |
| |
• |
|
our partner companies’ collective ability to compete successfully against their
respective competitors; |
| |
| |
• |
|
rapid technological developments in the respective markets in which our partner
companies operate and our partner companies’ collective ability to respond to such changes
in a timely and effective manner; |
| |
| |
• |
|
our ability to deploy capital effectively and on acceptable terms; |
| |
| |
• |
|
our ability to maximize value in connection with divestitures; |
| |
| |
• |
|
our ability to retain key personnel; and |
| |
| |
• |
|
our ability to have continued access to capital and to manage capital resources
effectively. |
In some cases, you can identify forward-looking statements by terminology such as “may,” “will,”
“should,” “could,” “would,” “expect,” “plan,” “anticipate,” “believe,” “estimate,” “continue” or
the negative of such terms or other similar expressions. All forward-looking statements
attributable to us or persons acting on our behalf are expressly qualified in their entirety by the
cautionary statements included in this Report. We undertake no obligation to publicly update or
revise any forward-looking statements, whether as a result of new information, future events or
otherwise. In light of these risks, uncertainties and assumptions, the forward-looking events
discussed in this Report might not occur.
3
PART I
Although we refer in this Report to companies in which we have acquired a convertible debt interest
or an equity ownership interest as our “partner companies” and indicate that we have a
“partnership” with these companies, we do not act as an agent or legal representative for any of
our partner companies, we do not have the power or authority to legally bind any of our partner
companies, and we do not have the types of liabilities in relation to our partner companies that a
general partner of a partnership would have.
Overview
Internet Capital Group, Inc. (referred to in this Report as “ICG,” the “Company,” “we,” “our,” or
“us”) was formed on March 4, 1996 and is headquartered in Wayne, Pennsylvania. Since our
inception, we have focused on acquiring and building Internet software and services companies that
improve the productivity and efficiency of their business customers. We call these companies our
“partner companies.”
As of December 31, 2009 and the date of this Report,
we hold ownership interests in 13 companies that we consider our partner companies. Additionally, we hold marketable
securities in other companies, which, as of December 31, 2009 and the date of this Report, consist primarily of
Blackboard, Inc. common stock (NASDAQ: BBBB) (“Blackboard”). The results of operations of our partner
companies are reported within two segments: the “core” reporting segment and the “venture”
(formerly “other holdings”) reporting segment. The core reporting segment includes those
consolidated and equity method partner companies in which ICG owns a principal controlling equity voting interest (53% on average as of December 31, 2009)
and in which ICG’s management takes a very active role in providing strategic direction and management
assistance. We expect to devote relatively large initial amounts of capital to acquire our core partner companies.
The venture reporting segment includes partner companies to which we generally devote less capital than we do to
our core companies and, therefore, in which we hold relatively
smaller ownership stakes than we do in our core
companies (24% on average as of December 31, 2009) and have less influence over their strategic direction and
management decisions than we do over those of our core companies. At the end of 2009, ICG began implementing
a shift in its business strategy, under which the Company is focusing on acquiring and holding majority voting
equity stakes in a relatively smaller number of operating companies that would be included in our core segment.
For information regarding the results of operations of our reporting segments, as well as their respective
contributions to ICG's consolidated results of operations, see “Item 7—Management’s Discussion and Analysis
of Financial Condition and Results of Operations” and “Item 8—Financial Statements and Supplementary Data,”
including Note 8, “Segment Information,” to our Consolidated Financial Statements. Such information is
incorporated herein by reference.
Over the past decade, businesses have increasingly looked to realize increased productivity and
efficiency through Internet-based software and services and other services that streamline,
automate or otherwise improve their business processes. Moreover, it is our view that businesses
will rely increasingly on these solutions in times of both economic growth and economic decline.
We believe that these factors create a compelling opportunity for companies that are able to
deliver these solutions and services, thereby expanding their customers’ access to new and existing
customers and suppliers, increasing their customers’ efficiency, reducing their customers’ costs
and/or allowing their customers to focus on their core competencies and outsource their non-core,
non-strategic processes. In some cases, this outsourcing will be to labor-based firms that provide
deep expertise, and in some cases, this outsourcing will be to technology-intensive firms that
provide platforms to automate functions.
4
We feel that the expertise we have developed in connection with our fourteen-year active
involvement with Internet software and services companies allows us to identify companies that are
positioned to succeed and to accelerate the growth of these companies. We intend to continue to expand
our network of partner companies and allocate our financial and human resources to partner
companies that we believe have significant long-term value potential. In particular, we seek to
acquire interests in software as a service (“SaaS”), technology-enabled business process outsourcing
(“BPO”) and Internet marketing companies, which offer solutions that:
| |
• |
|
automate complex workflow processes, with focus on the “white space” between companies; |
| |
| |
• |
|
are comprehensive, meaning that they include software, content data and transaction
capabilities (with content being a long-term differentiator); |
| |
| |
• |
|
have the ability to generate recurring revenue streams and allow their providers to
retain fixed costs; |
| |
| |
• |
|
are delivered to clients through long-term relationships; and |
| |
| |
• |
|
have the potential to evolve into ecosystems. |
After we identify a potential partner company, we negotiate the acquisition of an equity stake in
that company, typically seeking an interest as the principal controlling equity holder. We
generally require representation on the partner company’s board of directors to ensure our ability
to provide active guidance to the partner company. We place an extremely high value on quality,
motivated management teams and, accordingly, seek to structure acquisitions to permit the partner
company’s management and key personnel to retain a meaningful equity stake in the company. During
our negotiations with potential partner companies, we emphasize the value of our network and
resources and our focus on long-term value, which we believe give us a competitive advantage over
other potential funding sources when we seek to acquire partner companies.
Our focus on the software and services markets, particularly SaaS, technology-enabled BPO and
Internet marketing companies and the knowledge base of our partner companies, our management and our Board
of Directors give us valuable experience that we share with our partner companies. Once we acquire
an interest in a partner company, we work to assume an active role in the development and growth of
the company, providing both strategic guidance and operational support. We provide strategic
guidance to our partner companies relating to, among other things, market positioning, business
model and product development, strategic capital expenditures, mergers and acquisitions and exit
opportunities. Additionally, we provide operational support to help our partner companies manage
day-to-day business and operational issues and implement best practices in the areas of finance,
sales and marketing, business development, human resources and legal services. Once a company joins
our partner company network, our collective expertise is leveraged to help position that company to
produce high-margin, recurring and predictable earnings and generate long-term value that we
believe can ultimately be captured for our stockholders through continued ownership by ICG, an initial public offering, or a
strategic sale.
Our Partner Companies
At December 31, 2009, our core partner companies consisted of:
Channel Intelligence, Inc. (“Channel Intelligence”)
Channel Intelligence is a data solutions company that provides innovative suites of services for
manufacturers, retailers and publishers that help consumers work with retailers to find and buy
products, whether they start at retailer sites, manufacturer sites or destination shopping sites,
through the use of Channel Intelligence’s patented optimization technology and data solutions.
5
Freeborders, Inc. (“Freeborders”)
Freeborders is a provider of technology solutions and outsourcing from China. Freeborders provides
industry expertise to North American and European companies in financial services, technology,
retail/consumer goods, manufacturing and transportation and logistics. Freeborders’ offerings help
companies seeking cost-effective technology solutions.
GovDelivery Holdings, Inc. (“GovDelivery”)
GovDelivery is a leading provider of government-to-citizen communication solutions. GovDelivery’s
digital subscription management SaaS platform enables government organizations to provide citizens
with access to relevant information by delivering new information through e-mail mobile text
alerts, RSS and social media channels from U.S. and U.K. government
entities at the national, state and
local levels.
ICG Commerce Holdings, Inc. (“ICG Commerce”)
ICG Commerce is a procurement services provider delivering total procurement cost savings through a
combination of deep expertise and hosted technology. ICG Commerce provides a comprehensive range
of solutions to help companies identify savings through sourcing, realize savings through
implementation of purchase-to-pay automation and drive continuous improvements through ongoing
category management.
Investor Force Holdings, Inc. (“InvestorForce”)
InvestorForce is a financial software company specializing in the development of online
applications for the financial services industry. InvestorForce provides pension consultants and
other financial intermediaries with a Web-based enterprise platform that integrates data management
with robust analytic and reporting capabilities in support of their institutional and other
clients. InvestorForce’s applications provide investment consultants with the ability to conduct
real-time analysis and research into client, manager and market movement and to produce timely,
automated client reports.
Metastorm Inc. (“Metastorm”)
Metastorm is an enterprise software and service provider that enables its customers to turn
business strategies into business processes by fully integrating the work that people do with
software systems that optimize business performance. Metastorm delivers a complete set of scalable
business process management solutions that leverage existing information technology investments to
unite people, processes and technology in a service-based architecture.
StarCite, Inc. (“StarCite”)
StarCite provides a comprehensive suite of software applications and services to the meeting and
events industry. StarCite helps drive efficiencies and cost savings to both corporate buyers and
suppliers. Corporate, association and third-party meeting buyers rely on StarCite’s enterprise
meeting solutions for workflow, procurement, supply chain management, spend analysis and attendee
management. Thousands of industry suppliers rely on the StarCite online marketplace, supplier
marketing programs and enabling technologies to increase meeting revenues. StarCite’s
international division represents destination management companies and other premier international
travel suppliers, using both technology and traditional means.
WhiteFence, Inc. (“WhiteFence”)
WhiteFence is a Web services provider used by household consumers to compare and purchase essential
home services, such as electricity, natural gas, telephone and cable/satellite television.
WhiteFence reaches customers directly through company-owned websites and through its network of
exclusive channel partners which integrate the Web services applications into their own business
processes and websites.
6
At December 31, 2009, our venture partner companies consisted of:
Acquirgy, Inc. (“Acquirgy”)
Acquirgy specializes in Search Engine Marketing (SEM) and Direct Response Television (DRTV)
services and provides comprehensive account services, as well as creative and production expertise
with integrated multichannel software platforms. SEM services include outsourced paid search
management, SEM Performance Consulting (SEMpcTM) for clients managing search internally
and search engine optimization. DRTV services include comprehensive script-to-screen DRTV
creative, production and media services.
Anthem Ventures Fund, L.P. (“Anthem”)
Anthem provides resources to enhance the development of emerging technology companies by providing
financial investment, operational and management advice, as well as access to a network of
professional relationships.
ClickEquations, Inc. (f/k/a Commerce360, Inc.) (“ClickEquations”)
ClickEquations is a software-based search marketing company that improves paid and organic search
campaign performance for its clients, which include Internet Retailer 500 and Fortune 100
companies. Its proprietary technology uses advanced mathematics and statistical analysis to
optimize campaigns across the entire search chain and deliver improved campaign efficiency and
performance.
GoIndustry-DoveBid plc (“GoIndustry”) (LSE.AIM:GOI)
GoIndustry is a leader in auction sales and valuations of used industrial machinery and equipment.
GoIndustry combines traditional asset sales experience with innovative e-commerce technology and
advanced direct marketing to service the needs of multi-national corporations, insolvency
practitioners, dealers and asset-based lenders around the world.
SeaPass Solutions Inc. (“SeaPass”)
SeaPass
develops and markets processing solutions that enable insurance
carriers, agents and brokers to transmit and receive data in real-time by leveraging existing
systems to interact automatically. With the company’s technology, information accessed in real-time
allows for increased efficiency across all lines of the insurance business.
Concentration of Customer Base and Credit Risk
In each of the years ended December 31, 2009 and 2008, two customers of ICG Commerce, which is a
consolidated core partner company, accounted for more than 10% of our consolidated revenue. The
Hertz Corporation and Kimberly-Clark Corporation each represented approximately 13% and 17% of our
consolidated revenue for the years ended December 31, 2009 and 2008, respectively. Accounts
receivable, including unbilled amounts, from The Hertz Corporation and Kimberly-Clark Corporation as of December 31, 2009
were $1.7 million and $1.5 million, respectively. Accounts
receivable, including unbilled amounts, from the Hertz Corporation and Kimberly-Clark Corporation
as of December 31, 2008 were $2.9 million and $1.4 million, respectively.
7
Competition Facing Our Partner Companies
Competition for information technology and Internet products and services is intense. As the
market for e-commerce continues to grow, we expect that competition will continue to intensify.
Barriers to entry are minimal, and competitors can offer products and services at a relatively low
cost. Our partner companies compete with established information systems and management consulting
firms, as well as with traditional distribution channels and other online providers, for shares of
their customers’ purchasing budgets for information technology and consulting services.
Many companies offer information technology solutions and other solutions that compete with our
partner companies. We expect that additional companies will offer competing solutions in the
future. Furthermore, our partner companies’ competitors may develop information technology and
Internet products or other services that are superior to, or have greater market acceptance than,
the solutions offered by our partner companies. Many of our partner companies’ competitors have
greater brand recognition and greater financial, marketing and other resources than our partner
companies. This may place our partner companies at a disadvantage in responding to their
competitors’ pricing strategies, technological advances, advertising campaigns, strategic
partnerships and other initiatives. If our partner companies are unable to compete successfully
against their competitors, our partner companies may fail.
We may compete with our partner companies to acquire interests in software and services companies
and our partner companies may compete with each other for these opportunities. This competition
may deter companies from partnering with us and may limit our business opportunities.
Employees
Corporate headcount at ICG as of March 1, 2010 was 27. Headcount at our consolidated partner
companies as of March 1, 2010 was 648.
Financial Information About Geographic Areas
Financial information regarding geographic areas is contained in Note 8, “Segment Information,” to
our Consolidated Financial Statements included in “Item 8—Financial Statements and Supplementary
Data” and is incorporated herein by reference.
Availability of Reports and Other Information
Our Internet website address is www.internetcapital.com. Unless this Report explicitly states
otherwise, neither the information on our website, nor the information on the website of any of our
partner companies, is incorporated by reference into this Report.
Our Annual Reports on Form 10-K, Quarterly Reports on Form 10-Q, Current Reports on Form 8-K and
all amendments to those reports filed by us with the SEC pursuant to Sections 13(a) and 15(d) of
the Securities Exchange Act of 1934, as amended (the “Exchange Act”), are accessible free of charge
through our website as soon as reasonably practicable after we electronically file those documents
with, or otherwise furnish them to, the SEC.
The public may read and copy any of the reports that are filed with the SEC at the SEC’s Public
Reference Room at 450 Fifth Street, NW, Washington, DC 20549. The public may obtain information on
the operation of the Public Reference Room by calling the SEC at 1-800-SEC-0330. The SEC maintains
an internet site (www.sec.gov) that contains reports, proxy and information statements, and other
information regarding issuers that file electronically with the SEC.
8
Our business involves a number of risks, some of which are beyond our control. You should
carefully consider each of the risks and uncertainties we describe below and all of the other
information in this Report before deciding to invest in our Common
Stock. The risks and uncertainties we
describe below are not the only ones we face. Additional risks and uncertainties about which we
currently do not know or that we currently believe to be immaterial may also adversely affect our
business, financial condition or operating results.
Numerous
external forces, including ongoing weak economic conditions, have
negatively affected our
and our partner companies’ respective businesses, results of
operations and financial condition and continued weak economic
conditions could result in additional declines in our revenues and
operating results.
Numerous external forces, including the state of global financial markets and general economic
conditions, lack of consumer confidence, lack of availability of credit, interest rate and currency
rate fluctuations and national and international political circumstances (including wars and
terrorist acts) have negatively affected our and our partner companies’ respective businesses,
results of operations and financial condition. Our and our partner
companies’ businesses may also be negatively impacted by ongoing weak economic conditions affecting the
banking system, financial markets and financial institutions, which have resulted in a tightening in the
credit markets, a low level of liquidity in many financial markets and extreme volatility in credit
and equity markets. The length of time or severity with which these conditions may persist is
unknown. As a consequence, our and our partner companies’ respective operating results for a
particular period are difficult to predict and, therefore, prior results are not necessarily
indicative of expected results in future periods. In response to current financial conditions, many
customers and potential customers of our partner companies may forgo, delay or reduce technology
and other purchases. In connection with these conditions, our partner companies may experience
reductions in the sales of their products and services, extended sales cycles, difficulties in
collecting (or the inability to collect) accounts receivable, slower adoption of new technologies,
increased price competition and difficulties in obtaining (or the inability to obtain) financing.
The current volatility in the financial markets and overall economic uncertainty increase the risk
that the value of our partner companies and our other assets will be impaired and that the value to
be captured in the future in connection with the disposition of our partner companies will be
significantly lower than we initially expected.
If we are not able to deploy capital effectively and on acceptable terms, we may not be able to
execute our business strategy.
Our strategy includes effectively deploying capital by acquiring interests in new partner
companies. We may not be able to identify attractive acquisition candidates that fit our strategy.
Even if we are able to identify acquisition candidates, we may not be able to acquire interests in
those companies due to an inability to reach mutually acceptable financial or other terms with
those companies or due to competition from other potential acquirers that may have greater
resources, brand name recognition, industry contacts or flexibility of structure than we do. The
recent turmoil in the global economy has caused significant declines and fluctuations in the
valuations of publicly-traded companies and privately-held companies. Uncertainty regarding the
extent to which valuations of companies that fit our acquisition criteria will continue to
fluctuate may affect our ability to accurately value potential acquisition candidates.
Additionally, ongoing weak economic conditions may make it more difficult for us to obtain capital
needed to deploy to new and existing partner companies. If we are unable to effectively deploy
capital to partner companies on acceptable terms, we may not be able to execute on our strategy,
and our business may be adversely impacted.
9
If our partner companies are unable to attract new customers or retain customers, including certain
significant customers, our and our partner companies’ respective businesses, results of operations
and financial conditions could be negatively affected.
Our partner companies may not be able to attract or retain customers due to a variety of reasons,
including increased competition, the unwillingness of customers and potential customers to spend
money on products and services during periods of economic turmoil and uncertainty, insolvency and
the unavailability of credit. If our partner companies are unable to attract new customers or
retain existing customers, our and our partner companies’ respective businesses, results of
operations and financial conditions could be negatively affected.
During the year ended December 31, 2009, two customers of ICG Commerce, The Hertz Corporation and
Kimberly-Clark Corporation, each represented approximately 13% of our consolidated revenue. For
the year ended December 31, 2008, these two customers each represented approximately 17% of our
consolidated revenue. If our partner companies are not able to retain significant customers, such
partner companies and our respective businesses, results of operations and financial positions
could be negatively affected.
The inability of our partner companies’ customers to pay their obligations to them in a timely
manner, or at all, could have an adverse effect on our partner companies.
The financial resources of our partner companies’ customers may be negatively affected by the
continuing economic downturn. As a result, these customers may have inadequate financial resources
to meet all their obligations to our partner companies and may not make payments in a timely manner
or at all. Additionally, if our partner companies’ customers do not have adequate financial
resources, they may attempt to terminate or renegotiate existing contracts with our partner
companies and may refrain from purchasing additional products and services from our partner
companies. These factors may cause our partner companies’ results of operations and financial
condition to be adversely affected.
Our partner companies may not be able to compete successfully.
If our partner companies are unable to compete successfully against their competitors, our partner
companies may fail. Competition for Internet software and services is intense and is expected to
intensify. Our partner companies’ competitors may develop products or services that are superior
to, or have greater market acceptance than, the solutions offered by our partner companies. Many of
our partner companies’ competitors have greater brand recognition and greater financial, marketing
and other resources than our partner companies. This may place our partner companies at a
disadvantage in responding to their competitors’ pricing strategies, technological advances,
marketing campaigns, strategic partnerships and other initiatives.
The Internet software and services industry is characterized by evolving industry standards,
coupled with frequent and related new service and product introductions and enhancements. The
development of new service and product introductions and enhancements in response to evolving
industry standards requires significant time and resources, and our partner companies may not be
able to adapt quickly enough and/or in a cost-effective manner to these changes, and our partner
companies’ failure to do so could adversely affect our partner companies’ businesses, financial
condition and results of operations.
We may compete with some of our partner companies, and our partner companies may compete with each
other, which could deter companies from partnering with us and may limit future business
opportunities.
We may compete with our partner companies to acquire interests in new partner companies, and our
partner companies may compete with each other for business opportunities. This competition may
deter potential acquisition targets from partnering with us and may limit our business
opportunities.
10
Our operations and growth and that of our partner companies could be impaired by limitations on our
and/or their ability to raise capital or borrow money on favorable terms.
We and our partner companies may need to raise additional capital or borrow money in order to
sustain operations or to grow. If we or our partner companies are unable to raise capital or
obtain credit on favorable terms, our ability and the ability of our partner companies to operate
and grow may be impaired. This may require us or our partner companies to take other actions, such
as borrowing money on terms that may be unfavorable, or divesting of assets prematurely to raise
capital. If we or our partner companies need capital and are unable to raise it, then we or they
may need to limit or cease operations.
Adverse changes in economic conditions and reduced information technology spending may adversely
impact our business.
Our and our partner companies’ respective businesses depend on the overall demand for information
technology, and in particular for Internet software and services that improve the productivity of
our customers’ businesses. In addition, the acquisition of our partner companies’ Internet
software and services is often discretionary and may require customers to make significant initial
contributions of capital and other resources. During the recent global financial crisis, business
spending on technology infrastructure decreased dramatically. Continued weak economic conditions
or, even if general economic conditions improve, a reduction in information technology spending,
could adversely impact our business and the businesses of our partner companies in a number of ways
that negatively impact our operating results and financial condition.
Acquisitions by our partner companies could result in operating difficulties, dilution and other
harmful consequences.
As part of their growth strategies, our partner companies have and may continue to strategically
acquire other companies, business and technologies. The process of integrating an acquired
company, business or technology involves numerous risks, including difficulties in the integration
of the operations, technologies, services and products of the acquired company or business and the
diversion of management’s attention from other business concerns. Although we and our partner
companies will endeavor to evaluate the risks inherent in any particular acquisition transaction,
there can be no assurance that we or our partner companies will properly ascertain all such risks.
In addition, acquisitions may result in the incurrence of substantial additional indebtedness and
other expenses for our partner companies; they may also result in potentially dilutive issuances of
a partner company’s equity securities. Accordingly, difficulties encountered with acquisitions may
have a material adverse effect on our or our partner companies’ businesses, financial condition and
results of operations.
Our inability to maintain or be able to increase our ownership stakes in partner
companies with significant growth opportunities could negatively impact our ability to execute our strategy.
One of our strategies is to maintain and increase our ownership in those partner companies that we
believe have major growth opportunities such that we would have
consolidated stakes in those
companies. We may not be able to achieve this goal because of limited resources and/or the
unwillingness of such companies and/or the stockholders of such companies to enter into a
transaction that would result in an increase in our ownership stake. Moreover, certain
transactional growth opportunities, such as mergers and consolidations, may arise with respect to
any of these partner companies that would result in potentially dilutive issuances of such partner
companies’ equity securities. In the event that any of these select partner companies enters into
such a transaction, with or without our support, we may have a decreased ability to direct the
policies and affairs of the partner company or the surviving entity following the consummation of
the transaction.
11
If
we do not participate in follow-on financings at our partner companies, our stakes in such
companies will be diluted, which could materially reduce the value of those stakes.
From time to time our partner companies raise capital by issuing and selling additional equity. We
generally have preemptive rights to participate in these follow-on rounds of financing; however, we
may elect not to participate in such rounds or may be required to waive our preemptive rights in
whole or in part so that outside investors can participate. If we do not participate in a
follow-on round of a partner company, our ownership interest in such company will be diluted.
Additionally, in connection with new rounds of financing, our partner companies may issue preferred
stock with liquidation preferences that are senior to existing preferred stock and common stock.
If we do not participate in a follow-on round at a partner company, our ownership stake will
decrease and our rights to receive proceeds in connection with the sale of that partner company
will be diminished, which could result in a material reduction in the value of our stake in that
partner company.
Moreover, in the event that we pay a control premium in connection
with our acquisition of a majority stake in a partner company, we
would not be able to command a similar premium upon the disposition
of that stake if, through dilutive events, the stake becomes a
minority interest.
We may have to buy, sell or retain assets when we would otherwise choose not to buy, sell or retain
in order to avoid registration under the Investment Company Act, which would impact our business
strategy.
Under the Investment Company Act of 1940, as amended (the “Investment Company Act”), a company is
considered to be an investment company if, among other things, it is primarily engaged in the
business of investing, reinvesting, owning, holding or trading in securities. It is not feasible
for us to be regulated as an investment company because the Investment Company Act rules are
inconsistent with our strategy of actively managing, operating and promoting collaboration among
our network of partner companies. On August 23, 1999, the SEC granted our request for an exemption
under Section 3(b)(2) of the Investment Company Act, declaring us to be primarily engaged in a
business other than that of investing, reinvesting, owning, holding or trading in securities. This
exemptive order reduces, but does not eliminate, the risk that we may have to take action to avoid
registration as an investment company. For example, we might be considered to be in violation of
our exemptive order if more than a certain percentage of our total assets consist of, or more than
certain percentages of our income/loss and revenue over the last four quarters is derived from,
ownership interests in companies that we do not primarily control. Because we do not have primary
control of many of our partner companies, changes in the value of our interests in such partner
companies and the income/loss and revenue attributable to such partner companies could subject us
to regulation under the Investment Company Act unless we take precautionary steps. For example, we
may retain interests in partner companies we would otherwise want to sell and we may sell stakes in
non-controlled partner companies that we would otherwise want to retain. In order to ensure that
the requisite percentage of our total assets relates to partner companies that we primarily
control, we may participate in follow-on financings at our controlled partner companies and refrain
from participating in such financings at our non-controlled partner companies. In addition, we may
have to acquire additional income or loss generating majority-owned or controlled interests that we
might not otherwise have acquired and may not be able to acquire “non-controlling” interests in
companies that we would otherwise want to acquire.
Our partner companies could make financial or other business decisions that are not in our best
interests or that we do not agree with, which could impair the value of our partner company
interests.
Although we generally seek to acquire a controlling equity interest and participate in the
management of our partner companies, we may not acquire or maintain a controlling interest in each
partner company. If we lack control or share control in a partner company we may not be able to
control significant financial or other business decisions of such partner company. Management or
other stockholders of a partner company could have economic or business interests or objectives
that are different from ours or disagree with our advice regarding financial or operating
decisions, which could impair the value of our interest, prevent us from monetizing our interest at
a time or at a price that is favorable to us or negatively affect our operating results.
Additionally, our inability to prevent dilution of our ownership interests in a partner company or
our inability to otherwise have a controlling influence over the management and operations of a
partner company could have an adverse impact on our status under the Investment Company Act.
12
We may not be able to extract cash from those partner companies that achieve profitability and may
need to continue to rely on existing cash, liquidity events and additional capital raises to fund
our operations.
We currently rely on existing cash, partner company liquidity events and the issuance and sale of
additional securities in order to fund our operations. One of our goals is to help our partner
companies achieve profitability so that we can access their cash flow.
Moreover, we are focusing on acquiring majority voting stakes in an increasing number of partner companies in part so that we have increased access to the cash flow of our partner companies.
However, even if certain of
our partner companies do meet that goal, we may not be able to access cash generated by such
partner companies to fund our operations due to a number of factors, including the needs of such
companies to reinvest in their own businesses and our inability to control the significant business
or financial decisions of such companies. Our inability to access the cash of our partner
companies could have a negative impact on our operations.
We may be unable to obtain maximum value in connection with the divesture of partner company and
marketable security interests.
From time to time, we may divest of interests in partner companies or marketable securities to
generate cash or for strategic reasons. The timing of such divestures, particularly with respect
to our privately-held partner companies, may not be within our control. If we need to quickly
divest partner company interests to satisfy immediate cash requirements or to avoid registration as
an investment company under the Investment Company Act, we may be forced to sell our assets prior
to canvassing the market or at a time when market conditions valuations are unfavorable. We also
may not be able to identify buyers for certain of our assets, particularly given the difficulty
that potential acquirers may currently face in obtaining financing. Furthermore, in connection
with the sale of a private partner company, we may not receive the full amount of proceeds to which
we would otherwise be entitled under such company’s certificate of incorporation if additional
payments to management and/or other stockholders are made to secure the approval and/or execution
of such transaction. We may be unable to sell our interests in publicly-traded companies at
then-quoted market prices, if at all, because low trading volumes of these companies may limit our
ability to sell a significant amount of such companies’ stock in the open market. Registration and
other requirements under applicable securities laws may also adversely affect our ability to
dispose of our interests on a timely basis. Based on the foregoing factors, when we divest of an
interest in a partner company or a marketable security, we may not receive maximum value for that
asset and the realizable value of our interest in such asset may ultimately be lower than the
carrying value currently reflected in our consolidated financial statements and/or the expectations
our investors or securities analysts.
In addition, the market for initial public offerings has experienced significant weakness in
connection with recent market volatility. If this market is weak, we may not be able to capture
stockholder value by taking our partner companies public.
Our accounting estimates with respect to the ultimate recoverability of our basis in our partner
companies could change materially in the near term.
Our accounting estimates with respect to the useful life and ultimate recoverability of our
carrying basis, including goodwill, in our partner companies could change in the near term, and the
effect of those changes on our consolidated financial statements could be significant. During the
years ended December 31, 2009 and 2008 we recorded impairment charges of $5.4 million and $23.2
million, respectively. It is possible that a significant write-down or write-off of our carrying basis in our partner companies, including goodwill, may be required in the future, or that a significant
loss will be recorded in the future upon the sale of one or more partner companies. Any write-down
or write-off of this type could cause a decline in the price of our Common Stock.
13
Our stock price has been volatile in the past and may continue to be volatile in the future.
Our stock price has historically been volatile. This volatility may continue in the future,
particularly in light of the current uncertainty about global economic conditions.
The following factors, among others, may add to our Common Stock price’s volatility:
| |
• |
|
general economic conditions, such as a recession or interest rate or currency rate
fluctuations; |
| |
| |
• |
|
the reluctance of enterprises to increase spending on new products or services; |
| |
| |
• |
|
actual or anticipated variations in our quarterly results and those of our partner
companies; |
| |
| |
• |
|
changes in the market valuations of our partner companies and other similar
companies; |
| |
| |
• |
|
conditions or trends related to Internet software and services companies; |
| |
| |
• |
|
changes in our financial estimates and those of our partner companies by securities
analysts; |
| |
| |
• |
|
new products or services offered by us, our partner companies and their
competitors; |
| |
| |
• |
|
announcements by our partner companies and their competitors of technological
innovations; |
| |
| |
• |
|
announcements by us, our partner companies or our competitors of significant
acquisitions, strategic partnerships or joint ventures; |
| |
| |
• |
|
additional sales or repurchases of our securities; and |
| |
| |
• |
|
additions to or departures of our key personnel or the key personnel of our partner
companies. |
Many of these factors are beyond our control. These factors may decrease the market price of our
Common Stock.
Fluctuations in our quarterly results may adversely affect our stock price.
We expect that our quarterly results will fluctuate significantly due to many factors, including:
| |
• |
|
the acquisition of interests in partner companies; |
| |
| |
• |
|
the operating results of our partner companies; |
| |
| |
• |
|
sales of our ownership interests in our partner companies, which could cause us to
recognize gains or losses under applicable accounting rules; |
| |
| |
• |
|
significant fluctuations in the financial results of Internet software and services
companies generally; |
| |
| |
• |
|
changes in estimated quarterly equity losses or income; |
| |
| |
• |
|
changes in our methods of accounting for our partner company interests, which may
result from changes in our ownership percentages of our partner companies; |
| |
| |
• |
|
the pace of development or a decline in growth of the Internet software and
services markets; and |
| |
| |
• |
|
competition for the goods and services offered by our partner companies. |
If our operating results in one or more quarters do not meet securities analysts’ or investors’
expectations, the price of our Common Stock could decrease.
14
Fluctuations in the price of the common stock of our publicly-traded holdings may affect the price
of our Common Stock.
Currently, we hold stock of Blackboard and GoIndustry, each of which is a publicly-traded entity.
Fluctuations in the price of the common stock of Blackboard, GoIndustry or any other
publicly-traded holdings we may hold from time to time are likely to affect the price of our Common Stock. The price of these
publicly-traded companies’ common stock has been highly volatile. As of December 31, 2009, the
market value of our interest in these publicly-traded companies was $79.4 million, which was based
upon a $45.39 per share closing price for Blackboard and a $0.02 per share closing price for
GoIndustry. The results of operations and, accordingly, the price of the stock of Blackboard and
GoIndustry may be adversely affected by the occurrence of the risk factors contained in this
Report. In addition, the results of operations and stock price of Blackboard may be adversely
affected by the risk factors in Blackboard’s SEC filings, which are publicly available at
www.sec.gov, and the results of operations and common stock price of GoIndustry may be adversely
affected by the factors set forth in GoIndustry’s submissions on the AIM market of the London Stock
Exchange, which are publicly available at www.londonstockexchange.com.
We have had a general history of operating losses and expect continued operating losses in the foreseeable future.
We have had significant operating losses and, excluding the effect of any future non-operating
gains, such as from the sale of interests in partner companies, we expect to continue incurring
operating losses in the future. As a result, we may not have sufficient resources to expand or
maintain our operations in the future. We can give no assurances as to when or whether we will
achieve profitability, and if we ever have profits, we may not be able to sustain them.
Certain of our partner companies have a limited operating history and may never be profitable.
Certain of our partner companies have limited operating histories. As a result, they have only
short operating histories to aid in assessing future prospects. Additionally, certain of our
partner companies have significant historical losses and may never be profitable. Many of our
partner companies have incurred substantial costs to develop and market their products and expand
operations, have incurred net losses and cannot fund their cash needs from operations. Operating
expenses of these companies could increase in the foreseeable future as they continue to develop
products, increase sales and marketing efforts and expand operations.
The loss of our or our partner companies’ executive officers or other key personnel or our or our
partner companies’ inability to attract additional key personnel could disrupt our business and
operations.
If one or more of our executive officers or key personnel, or our partner companies’ executive
officers or key personnel, including highly trained information technology personnel, were unable
or unwilling to continue in their present positions, or if we or our partner companies were unable
to hire qualified personnel, our business and operations could be disrupted and our operating
results and financial condition could be seriously harmed.
15
Our partner companies’ success depends on the integrity of their systems and infrastructure.
Interruptions in their information systems may adversely affect their businesses.
To succeed, our partner companies’ systems and infrastructure must perform well on a consistent
basis. From time to time, our partner companies may experience occasional system interruptions
that make some or all of their systems or data unavailable or prevent them from providing services,
which could adversely affect their businesses. Moreover, as traffic to their various websites and
the related number of uses and customers increase and the number products and services that they
introduce continues to grow, they will need to upgrade their systems, infrastructure and
technologies generally to facilitate this growth. If our partner companies do not do so or if they
experience inefficiencies and/or operational failures in connection with current or future
upgrades, third parties with which they do business may not be able to access their services on an
intermittent or prolonged basis and the quality of experience that users and customers encounter
with their products and services generally could diminish. The occurrence of any of these events
could adversely affect their businesses, financial condition and results of operations.
We and our partner companies may be subject to litigation proceedings or government regulation that
could harm our respective businesses.
We and our partner companies may be subject to legal claims involving stockholder, consumer,
competition and other matters. Litigation is subject to inherent uncertainties, and unfavorable
rulings could occur. An unfavorable ruling could include monetary damages or, in cases for which
injunctive relief is sought, an injunction prohibiting one of our partner companies from performing
a critical activity, such as selling its software and services. If we or one of our partner
companies were to receive an unfavorable ruling in a litigation matter, our and our partner
companies’ respective businesses, financial condition and results of operations could be materially
harmed. Even if legal claims brought against us or our partner companies are without merit,
defending lawsuits may take significant time, be expensive and divert our or our partner companies’
management attention from other business concerns.
Our partner companies’ software and services offerings are subject to government regulation
domestically and internationally in many areas, including regulation of the Internet regarding user
privacy, telecommunications, data protection and online content. The application of these laws and
regulations to our partner companies’ businesses is often unclear and sometimes may conflict.
Compliance with these regulations may involve significant costs or require changes in business
practices that result in reduced revenue. Noncompliance could result in monetary penalties being
imposed on our partner companies or orders that our partner companies cease performing a critical
activity, such as selling their software and services.
We have implemented certain anti-takeover provisions that could make it more difficult for a third
party to acquire us.
Provisions of our amended certificate of incorporation and bylaws, as well as provisions of
Delaware law, could make it more difficult for a third party to acquire us, even if doing so would
be beneficial to our stockholders. Our amended certificate of incorporation provides that our
board of directors may issue preferred stock without stockholder approval and also provides for a
staggered board of directors. We are subject to the provisions of Section 203 of the Delaware
General Corporation Law, which restricts certain business combinations with interested
stockholders. Additionally, we have a rights agreement which has the effect of discouraging any
person or group from beneficially owning more than 15% of our outstanding Common Stock unless our
board has amended the plan or redeemed the rights. The combination of these provisions may inhibit
a non-negotiated merger or other business combination.
|
|
|
| ITEM 1B. |
|
Unresolved Staff Comments |
None.
16
The location and general description of our properties as of March 1, 2010 are as follows:
Corporate Offices
Our corporate headquarters are located at 690 Lee Road, Suite 310 in an office facility located in
Wayne, Pennsylvania, where we lease approximately 11,000 square feet.
Partner Company Properties
Our consolidated partner companies lease approximately 128,229 square feet of office,
administrative, sales and marketing, operations and data center space, principally in Georgia,
Minnesota, New York, Pennsylvania, Texas and Washington, D.C. in the United States and
administrative offices in China, India and the United Kingdom.
|
|
|
| ITEM 3. |
|
Legal Proceedings |
In May and June 2001, certain of the Company’s present directors, along with the Company, certain
of its former directors, certain of its present and former officers and its underwriters, were
named as defendants in nine class action complaints filed in the United States District Court for
the Southern District of New York. The plaintiffs and the putative classes they seek to represent
include present and former stockholders of the Company. The complaints generally allege violations
of Sections 11 and 12 of the Securities Act of 1933, as amended (the “Securities Act”), and
Rule 10b-5 promulgated under the Exchange Act, based on, among other things, the dissemination of
statements allegedly containing material misstatements and/or omissions concerning the commissions
received by the underwriters of the initial public offering and follow-on public offering of the
Company as well as failure to disclose the existence of purported agreements by the underwriters
with some of the purchasers in these offerings to buy additional shares of the Company’s stock
subsequently in the open market at pre-determined prices above the initial offering prices. The
plaintiffs seek for themselves and the alleged class members an award of damages and litigation
costs and expenses. The claims in these cases have been consolidated for pre-trial purposes
(together with claims against other issuers and underwriters) before one judge in the Southern
District of New York federal court. In April 2002, a consolidated, amended complaint was filed
against these defendants which generally alleges the same violations and also refers to alleged
misstatements or omissions that relate to the recommendations regarding the Company’s stock by
analysts employed by the underwriters. In June and July 2002, defendants, including the Company
defendants, filed motions to dismiss plaintiffs’ complaints on numerous grounds. The Company’s
motion was denied in its entirety in an opinion dated February 19, 2003. In July 2003, a committee
of the Company’s Board of Directors approved a proposed settlement with the plaintiffs in this
matter, which was preliminarily approved by the District Court overseeing the litigation in
February 2005. A final fairness hearing on the settlement was held on April 24, 2006. On December
5, 2006, however, the Second Circuit Court of Appeals reversed the certification of plaintiff
classes in six actions related to other issuers that had been designated as test cases with respect
to the non-settling defendants in those matters (the “Focus Cases”) and made other rulings that
drew into question the legal viability of the claims in the Focus Cases. The Court of Appeals
later rejected the plaintiffs’ request that it reconsider that decision. As a result, on June 25,
2007, the District Court approved a stipulation and order terminating the proposed settlement.
While the Court of Appeals decision did not automatically apply to the case against the Company,
the defendants moved for, and the Court granted, an order that would apply the decision to all
cases, including the consolidated action against the Company. On August 14, 2007, the plaintiffs
filed an amended “master” complaint containing allegations purportedly common to all defendants in
all actions and filed amended complaints containing specific allegations against the six issuer
defendants in the Focus Cases. In addition, on September 27, 2007, the plaintiffs again moved to
certify classes in each of the Focus Cases. The defendants in the Focus Cases moved to dismiss the
amended complaints. Rulings on both the motion to certify the Focus Cases as class actions and to
dismiss those cases remain outstanding. The District Court has approved a stipulation extending the
time within which the plaintiffs must file amended pleadings containing specific allegations
against the other issuer defendants, including the Company, and the time within which those
defendants must move, answer or otherwise respond to those specific allegations.
17
On April 2, 2009, the plaintiffs filed a motion for preliminary approval of a proposed global
settlement of all claims asserted in the coordinated class action securities litigation on behalf
of the class plaintiffs in the respective actions against the various issuer and underwriter
defendants, including all claims asserted against the Company. The motion further seeks
certification of settlement classes as to each action against the defendants, including the
Company. The Company has assented to the proposed settlement, which does not require any monetary
contribution from the Company and would be funded by various underwriter defendants and
the defendants’ insurers. On June 10, 2009, the District Court granted preliminary approval of the
proposed settlement and of the form of notice of the proposed settlement to be provided to members
of the proposed settlement class. The District Court scheduled a hearing for September 10, 2009 to
determine whether to approve the proposed settlement.
The final hearing was held on September 10, 2009. On October 5, 2009, the District Court granted
final approval of the proposed global settlement, subject to the rights of the parties to appeal
the settlement within 30 days of such approval. Pursuant to the terms of the approved settlement,
the Company is not required to make any monetary contribution to fund the required settlement
payments, which are being funded by various underwriter defendants and the defendants’ insurers.
On or about October 23, 2009, three members of the settlement class who had been shareholders of an
issuer other than the Company filed a petition seeking leave to appeal the District Court’s final
approval to the Second Circuit Court of Appeals on an interlocutory basis. No judicial ruling or
action has been taken on the motion. On or before November 6, 2009, three notices of appeal were
filed with respect to the District Court’s order granting final approval of the global settlement.
No further action has been taken with respect to such notices. On December 14, 2009, the District
Court entered a final judgment approving and giving effect to the global settlement as it related
to the consolidated actions against the Company. The final judgment created a settlement class of
plaintiffs comprised of persons who purchased or otherwise acquired the common stock and call
options of the Company during the period of August 4, 1999 through December 6, 2000, provided for
the distribution of settlement proceeds to the members of the class and approval of attorneys’ fees
to class counsel consistent with the terms of the global settlement, barred prosecution of all
settled claims by members of the class and their representatives, released the defendants and other
protected persons from such claims and dismissed all claims against the Company and other
defendants in the consolidated amended action with prejudice. No notices of appeal have been filed
with respect to the December 14, 2009 final judgment.
|
|
|
| ITEM 4. |
|
(Removed and Reserved) |
18
PART II
|
|
|
| ITEM 5. |
|
Market For Registrant’s Common Equity, Related Stockholder Matters and Issuer Purchases of
Equity Securities |
Market Information. Our Common Stock is currently traded on the NASDAQ Global Market under the
symbol “ICGE.” The price range per share reflected in the table below is the highest and lowest
sale price for our Common Stock as reported by the NASDAQ Global Market during each quarter period
of our two most recent fiscal years.
| |
|
|
|
|
|
|
|
|
|
|
|
|
|
|
|
|
|
|
|
|
|
|
|
|
|
|
|
|
|
|
|
|
| |
|
2009 |
|
|
2008 |
|
| |
|
March 31 |
|
|
June 30 |
|
|
Sept. 30 |
|
|
Dec. 31 |
|
|
March 31 |
|
|
June 30 |
|
|
Sept. 30 |
|
|
Dec. 31 |
|
| |
|
(1st) |
|
|
(2nd) |
|
|
(3rd) |
|
|
(4th) |
|
|
(1st) |
|
|
(2nd) |
|
|
(3rd) |
|
|
(4th) |
|
High |
|
$ |
5.95 |
|
|
$ |
6.85 |
|
|
$ |
8.62 |
|
|
$ |
8.43 |
|
|
$ |
11.82 |
|
|
$ |
11.35 |
|
|
$ |
9.84 |
|
|
$ |
8.00 |
|
Low |
|
$ |
3.25 |
|
|
$ |
3.85 |
|
|
$ |
6.17 |
|
|
$ |
5.76 |
|
|
$ |
7.66 |
|
|
$ |
7.71 |
|
|
$ |
6.79 |
|
|
$ |
3.04 |
|
Holders. As of March 1, 2010, there were approximately 818 holders of record of our Common Stock,
although there is a much larger number of beneficial owners.
Dividends. We have never declared or paid cash dividends on our capital stock and we do not intend
to pay cash dividends in the foreseeable future. We plan to retain any earnings for use in the
operation of our business and to fund future growth.
19
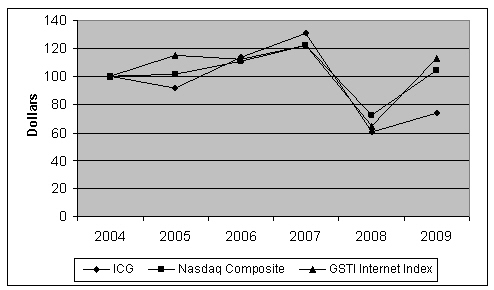
Stock Performance Graph
The following graph shall not be deemed “filed” for purposes of Section 18 of the Exchange Act, or
otherwise subject to the liabilities under that section, and shall not be deemed to be incorporated
by reference into any filing of the Company under the Securities Act or the Exchange Act.
The following graph presents a comparison of the Company’s stock performance with that of the
NASDAQ Composite Index and the Goldman Sachs Technology Internet Index from December 31, 2004 to
December 31, 2009.
COMPARISON OF CUMULATIVE TOTAL RETURN* SINCE DECEMBER 31, 2004
AMONG INTERNET CAPITAL GROUP, INC.,
THE NASDAQ COMPOSITE INDEX AND
THE GSTI INTERNET INDEX
| |
|
|
| * |
|
$100 invested at closing prices on December 31, 2004 in ICG shares or in a
stock index, including reinvestment of dividends. |
20
Issuer Purchases of Equity Securities
In 2008, the Company announced the approval by its Board of Directors of a share repurchase program
under which the Company could repurchase, from time to time, up to $25 million of shares of its
Common Stock in the open market, in privately negotiated transactions or pursuant to trading plans
meeting the requirements of Rule 10b5-1 under the Exchange Act. The table below contains
information relating to the repurchases of Company Common Stock that occurred during the year ended
December 31, 2009 and through the date of the filing of this Report.
| |
|
|
|
|
|
|
|
|
|
|
|
|
|
|
|
|
| |
|
|
|
|
|
|
|
|
|
Total Number of |
|
|
Approximate Dollar |
|
| |
|
|
|
|
|
|
|
|
|
Shares Purchased as |
|
|
Value That May Yet |
|
| |
|
|
|
|
|
|
|
|
|
Part of Publicly |
|
|
Be Purchased |
|
| |
|
Total Number of |
|
|
Average Price Paid |
|
|
Announced |
|
|
Under the |
|
| Monthly Period |
|
Shares Purchased(1) |
|
|
per Share(2) |
|
|
Program(1) |
|
|
Program |
|
|
|
|
|
|
|
|
|
|
|
|
|
|
|
|
|
|
Repurchased as of 12/31/08 |
|
|
1,948,158 |
|
|
$ |
4.75 |
|
|
|
1,948,158 |
|
|
$ |
15.7 million |
|
1/1/09 to 1/31/09 |
|
|
25,042 |
|
|
$ |
3.98 |
|
|
|
25,042 |
|
|
$ |
15.6 million |
|
2/1/09 to 2/28/09 |
|
|
67,200 |
|
|
$ |
3.96 |
|
|
|
67,200 |
|
|
$ |
15.4 million |
|
3/1/09 to 3/31/09 |
|
|
0 |
|
|
|
— |
|
|
|
0 |
|
|
$ |
15.4 million |
|
4/1/09 to 4/30/09 |
|
|
0 |
|
|
|
— |
|
|
|
0 |
|
|
$ |
15.4 million |
|
5/1/09 to 5/31/09 |
|
|
0 |
|
|
|
— |
|
|
|
0 |
|
|
$ |
15.4 million |
|
6/1/09 to 6/30/09 |
|
|
0 |
|
|
|
— |
|
|
|
0 |
|
|
$ |
15.4 million |
|
7/1/09 to 7/31/09 |
|
|
0 |
|
|
|
— |
|
|
|
0 |
|
|
$ |
15.4 million |
|
8/1/09 to 8/30/09 |
|
|
0 |
|
|
|
— |
|
|
|
0 |
|
|
$ |
15.4 million |
|
9/1/09 to 9/30/09 |
|
|
0 |
|
|
|
— |
|
|
|
0 |
|
|
$ |
15.4 million |
|
10/1/09 to 10/31/09 |
|
|
0 |
|
|
|
— |
|
|
|
0 |
|
|
$ |
15.4 million |
|
11/1/09 to 11/30/09 |
|
|
0 |
|
|
|
— |
|
|
|
0 |
|
|
$ |
15.4 million |
|
12/1/09 to 12/31/09 |
|
|
400,000 |
|
|
$ |
5.79 |
|
|
|
400,000 |
|
|
$ |
13.1 million |
|
1/1/10 to 1/31/10 |
|
|
0 |
|
|
|
— |
|
|
|
0 |
|
|
$ |
13.1 million |
|
2/1/10 to 2/28/10 |
|
|
0 |
|
|
|
— |
|
|
|
0 |
|
|
$ |
13.1 million |
|
3/1/10 to 3/15/10 |
|
|
0 |
|
|
|
— |
|
|
|
0 |
|
|
$ |
13.1 million |
|
Total |
|
|
2,440,400 |
|
|
$ |
4.89 |
|
|
|
2,440,400 |
|
|
$ |
13.1 million |
|
| |
|
|
| (1) |
|
All shares purchased in open market transactions. |
| |
| (2) |
|
Average price paid per share excludes commissions. |
21
|
|
|
| ITEM 6. |
|
Selected Financial Data |
The following table summarizes certain selected historical consolidated financial information of
ICG that has been derived from our audited Consolidated Financial Statements for each one-year
period for the five years ended December 31, 2009, 2008, 2007, 2006 and 2005. The financial
information may not be indicative of our future performance. The information set forth below
should be read in conjunction with “Management’s Discussion and Analysis of Financial Condition and
Results of Operations” and our Consolidated Financial Statements and the related Notes thereto
included in this Report.
| |
|
|
|
|
|
|
|
|
|
|
|
|
|
|
|
|
|
|
|
|
| |
|
Year Ended December 31, |
|
| |
|
2009 |
|
|
2008 |
|
|
2007 |
|
|
2006(1) |
|
|
2005(1) |
|
| |
|
(in thousands, except per share data) |
|
Consolidated Statements of Operations Data: |
|
|
|
|
|
|
|
|
|
|
|
|
|
|
|
|
|
|
|
|
Revenues |
|
$ |
90,252 |
|
|
$ |
71,181 |
|
|
$ |
52,923 |
|
|
$ |
64,749 |
|
|
$ |
47,568 |
|
Operating expenses |
|
|
|
|
|
|
|
|
|
|
|
|
|
|
|
|
|
|
|
|
Cost of revenue |
|
|
56,920 |
|
|
|
46,400 |
|
|
|
39,523 |
|
|
|
42,439 |
|
|
|
28,460 |
|
Selling, general and administrative |
|
|
34,578 |
|
|
|
36,165 |
|
|
|
32,781 |
|
|
|
42,108 |
|
|
|
40,795 |
|
Research and development |
|
|
9,015 |
|
|
|
10,212 |
|
|
|
6,033 |
|
|
|
8,755 |
|
|
|
12,276 |
|
Impairment related and other |
|
|
5,397 |
|
|
|
10,052 |
|
|
|
188 |
|
|
|
1,873 |
|
|
|
5,571 |
|
|
|
|
|
|
|
|
|
|
|
|
|
|
|
|
|
Total operating expenses |
|
|
105,910 |
|
|
|
102,829 |
|
|
|
78,525 |
|
|
|
95,175 |
|
|
|
87,102 |
|
|
|
|
|
|
|
|
|
|
|
|
|
|
|
|
|
|
|
|
(15,658 |
) |
|
|
(31,648 |
) |
|
|
(25,602 |
) |
|
|
(30,426 |
) |
|
|
(39,534 |
) |
Other income (loss), net |
|
|
16,578 |
|
|
|
43,225 |
|
|
|
6,830 |
|
|
|
34,605 |
|
|
|
135,489 |
|
Interest income (expense), net |
|
|
230 |
|
|
|
1,516 |
|
|
|
5,062 |
|
|
|
7,345 |
|
|
|
523 |
|
|
|
|
|
|
|
|
|
|
|
|
|
|
|
|
|
Income (loss) from continuing operations before income taxes
and equity loss |
|
|
1,150 |
|
|
|
13,093 |
|
|
|
(13,710 |
) |
|
|
11,524 |
|
|
|
96,478 |
|
Income tax benefit (expense) |
|
|
39,510 |
|
|
|
(357 |
) |
|
|
3,992 |
|
|
|
40 |
|
|
|
(18,640 |
) |
Equity loss |
|
|
(12,131 |
) |
|
|
(33,702 |
) |
|
|
(14,416 |
) |
|
|
(5,461 |
) |
|
|
(6,703 |
) |
|
|
|
|
|
|
|
|
|
|
|
|
|
|
|
|
Income (loss) from continuing operations |
|
|
28,529 |
|
|
|
(20,966 |
) |
|
|
(24,134 |
) |
|
|
6,103 |
|
|
|
71,135 |
|
Income (loss) on discontinued operations |
|
|
— |
|
|
|
— |
|
|
|
995 |
|
|
|
8,289 |
|
|
|
(1,130 |
) |
|
|
|
|
|
|
|
|
|
|
|
|
|
|
|
|
Net income (loss) |
|
|
28,529 |
|
|
|
(20,966 |
) |
|
|
(23,139 |
) |
|
|
14,392 |
|
|
|
70,005 |
|
Less: Net income (loss) attributable to
non-controlling interest |
|
|
12,995 |
|
|
|
1,960 |
|
|
|
468 |
|
|
|
(1,232 |
) |
|
|
(2,513 |
) |
|
|
|
|
|
|
|
|
|
|
|
|
|
|
|
|
Net income (loss) attributable to Internet Capital
Group, Inc. |
|
$ |
15,534 |
|
|
$ |
(22,926 |
) |
|
$ |
(23,607 |
) |
|
$ |
15,624 |
|
|
$ |
72,518 |
|
|
|
|
|
|
|
|
|
|
|
|
|
|
|
|
|
|
|
|
|
|
|
|
|
|
|
|
|
|
|
|
|
|
|
|
|
|
Basic Income (loss) Per Share Attributable to Internet Capital Group, Inc.: |
|
|
|
|
|
|
|
|
|
|
|
|
|
|
|
|
|
|
|
|
Income (loss) from continuing operations |
|
$ |
0.42 |
|
|
$ |
(0.60 |
) |
|
$ |
(0.64 |
) |
|
$ |
0.20 |
|
|
$ |
1.98 |
|
Income (loss) on discontinued operations |
|
|
— |
|
|
|
— |
|
|
|
0.02 |
|
|
|
0.22 |
|
|
|
(0.03 |
) |
|
|
|
|
|
|
|
|
|
|
|
|
|
|
|
|
Basic income (loss) per share |
|
$ |
0.42 |
|
|
$ |
(0.60 |
) |
|
$ |
(0.62 |
) |
|
$ |
0.42 |
|
|
$ |
1.95 |
|
|
|
|
|
|
|
|
|
|
|
|
|
|
|
|
|
Shares used in computation of basic income (loss)
per share |
|
|
36,660 |
|
|
|
38,106 |
|
|
|
37,916 |
|
|
|
37,570 |
|
|
|
37,109 |
|
|
|
|
|
|
|
|
|
|
|
|
|
|
|
|
|
|
|
|
|
|
|
|
|
|
|
|
|
|
|
|
|
|
|
|
|
|
Diluted Income (loss) Per Share Attributable to Internet Capital Group, Inc.: |
|
|
|
|
|
|
|
|
|
|
|
|
|
|
|
|
|
|
|
|
Income (loss) from continuing operations |
|
$ |
0.42 |
|
|
$ |
(0.60 |
) |
|
$ |
(0.64 |
) |
|
$ |
0.19 |
|
|
$ |
1.76 |
|
Income (loss) on discontinued operations |
|
|
— |
|
|
|
— |
|
|
|
0.02 |
|
|
|
0.22 |
|
|
|
(0.03 |
) |
|
|
|
|
|
|
|
|
|
|
|
|
|
|
|
|
Diluted income (loss) per share |
|
$ |
0.42 |
|
|
$ |
(0.60 |
) |
|
$ |
(0.62 |
) |
|
$ |
0.41 |
|
|
$ |
1.73 |
|
|
|
|
|
|
|
|
|
|
|
|
|
|
|
|
|
Shares used in computation of diluted income
(loss) per share |
|
|
36,705 |
|
|
|
38,106 |
|
|
|
37,916 |
|
|
|
38,106 |
|
|
|
43,670 |
|
|
|
|
|
|
|
|
|
|
|
|
|
|
|
|
|
|
|
|
|
|
|
|
|
|
|
|
|
|
|
|
|
|
|
|
|
|
Consolidated Balance Sheet Data: |
|
|
|
|
|
|
|
|
|
|
|
|
|
|
|
|
|
|
|
|
Cash, cash equivalents and short-term investments |
|
$ |
55,528 |
|
|
$ |
89,527 |
|
|
$ |
82,031 |
|
|
$ |
120,808 |
|
|
$ |
147,912 |
|
Working capital |
|
$ |
71,700 |
|
|
$ |
83,285 |
|
|
$ |
78,749 |
|
|
$ |
78,939 |
|
|
$ |
140,504 |
|
Total assets |
|
$ |
330,087 |
|
|
$ |
285,580 |
|
|
$ |
332,431 |
|
|
$ |
354,427 |
|
|
$ |
346,532 |
|
Other long-term debt, net of current portion |
|
$ |
645 |
|
|
$ |
3,916 |
|
|
$ |
191 |
|
|
$ |
544 |
|
|
$ |
4,407 |
|
Senior convertible notes |
|
$ |
— |
|
|
$ |
— |
|
|
$ |
— |
|
|
$ |
26,590 |
|
|
$ |
37,000 |
|
Total Internet Capital Group, Inc.’s
stockholders’ equity |
|
$ |
280,665 |
|
|
$ |
247,509 |
|
|
$ |
304,658 |
|
|
$ |
298,538 |
|
|
$ |
256,245 |
|
| |
|
|
| (1) |
|
The selected financial data tables for 2006 and 2005 are
not comparable to the periods for which audited financial
statements are provided due to the adoption of the transitional provisions of Accounting Standards
Codification (“ASC”) section 470,
subsection 20, “Debt with Conversion and Other Options.” See Note 7, “Debt”
in “Item 8-Financial Statements and Supplementary Data” of
this Report for further disclosures. |
22
|
|
|
| ITEM 7. |
|
Management’s Discussion and Analysis of Financial Condition and Results of Operations |
Introduction
The following Management’s Discussion and Analysis of Financial Condition and Results of Operations
contains forward-looking statements that involve risks and uncertainties. Our actual results could
differ materially from those anticipated in these forward-looking statements as a result of certain
factors, including those set forth elsewhere in this Report and the risks discussed in our other
SEC filings. The following discussion should be read in conjunction with our audited Consolidated
Financial Statements and the related Notes thereto included in this Report.
Although we refer in this Report to companies in which we have acquired a convertible debt or an
equity ownership interest as our “partner companies” and indicate that we have a “partnership” with
these companies, we do not act as an agent or legal representative for any of our partner
companies, we do not have the power or authority to legally bind any of our partner companies, and
we do not have the types of liabilities in relation to our partner companies that a general partner
of a partnership would have.
The Consolidated Financial Statements include the consolidated accounts of Internet Capital Group,
Inc., a company incorporated in Delaware, and its subsidiaries, both wholly-owned and consolidated
(Internet Capital Group, Inc. and all such subsidiaries, are hereinafter referred to as “we,” “us,”
“our,” “ICG,” the “Company” or “Internet Capital Group”), and have been prepared in accordance with
Generally Accepted Accounting Principles in the United States of America (“GAAP”).
Executive Summary
Since our inception in 1996, we have focused on acquiring and building Internet software and services companies that improve the
productivity and efficiency of their business customers. We call these companies our “partner companies.” As of December 31,
2009 and the date of this Report, we hold ownership interests in 13 companies that we consider our partner companies.
Additionally, from time to time we hold marketable securities in other companies, which, including amounts held in escrow,
as of December 31, 2009 and the date of this Report, consist of Blackboard common stock and common stock of Intercontinental
Exchange, Inc. (“ICE”). The results of operations of our partner companies are reported within two segments: the “core” reporting
segment and the “venture” reporting segment. The core reporting segment includes those
consolidated and equity method partner companies in which ICG owns a principal
controlling equity voting interest (53% on average as of December 31, 2009) and in which ICG’s management takes a very active role in
providing strategic direction and management assistance. We expect to devote relatively large initial amounts of capital to acquire our
core partner companies. The venture reporting segment includes partner companies in which we generally devote less capital than we do to
our core companies and, therefore, in which we hold relatively smaller ownership stakes than we do in our core companies (24% on average
as of December 31, 2009) and have less influence over their strategic direction and management decisions than we do over those of our core
companies.
The various interests that we acquire in our partner companies are accounted for under one of three
accounting methods: the consolidation method, the equity method and the cost method. The applicable
accounting method is generally determined based on our voting interest in a partner company.
Generally, if we own more than 50% of the outstanding voting securities of a partner company, and
other stockholders do not possess the right to affect the significant operational management decisions of that
partner company, the partner company’s accounts are reflected within our Consolidated Financial
Statements. Generally, if we own between 20% and 50% of the outstanding voting securities of a
partner company, that partner company’s accounts are not reflected within our Consolidated
Financial Statements, but our share of the earnings or losses of the partner company is reflected
in the caption “Equity loss” in our consolidated statements of operations. Partner companies not
accounted for under either the consolidation or the equity method of accounting are accounted for
under the cost method of accounting. Under this method, our share of the earnings or losses of
these companies is not included in our consolidated statements of operations.
Because we own significant interests in software and services companies, many of which have
generated net losses, we have experienced, and expect to continue to experience, significant
volatility in our results. While many of our partner companies have consistently reported losses,
we have recorded net income in certain periods and experienced significant volatility from
period-to-period due to infrequently occurring
transactions and other events relating to our ownership interests in partner companies. These
transactions and events are described in more detail in our Notes to Consolidated Financial
Statements included herein and include dispositions of, changes to and impairment of our partner
company ownership interests, dispositions of our holdings of marketable securities and debt
repurchases.
23
Liquidity and Capital Resources
The following table summarizes our and our consolidated subsidiaries’ cash and cash equivalents,
restricted cash and marketable securities as of December 31, 2009 and 2008:
| |
|
|
|
|
|
|
|
|
|
|
|
|
|
|
|
|
|
|
|
|
|
|
|
|
| |
|
December 31, 2009 |
|
|
December 31, 2008 |
|
| |
|
|
|
|
|
Consolidated |
|
|
|
|
|
|
|
|
|
|
Consolidated |
|
|
|
|
| |
|
Corporate |
|
|
Subsidiaries |
|
|
Total |
|
|
Corporate |
|
|
Subsidiaries |
|
|
Total |
|
| |
|
(in thousands) |
|
Cash and cash equivalents |
|
$ |
29,443 |
|
|
$ |
26,038 |
|
|
$ |
55,481 |
|
|
$ |
73,208 |
|
|
$ |
16,087 |
|
|
$ |
89,295 |
|
Restricted Cash |
|
|
— |
|
|
|
47 |
|
|
|
47 |
|
|
|
— |
|
|
|
232 |
|
|
|
232 |
|
|
|
|
|
|
|
|
|
|
|
|
|
|
|
|
|
|
|
|
|
|
$ |
29,443 |
|
|
$ |
26,085 |
|
|
$ |
55,528 |
|
|
$ |
73,208 |
|
|
$ |
16,319 |
|
|
$ |
89,527 |
|
|
|
|
|
|
|
|
|
|
|
|
|
|
|
|
|
|
|
|
|
|
|
|
|
|
Marketable securities (1) |
|
$ |
72,965 |
|
|
$ |
— |
|
|
$ |
72,965 |
|
|
$ |
63,918 |
|
|
$ |
— |
|
|
$ |
63,918 |
|
| |
|
|
| (1) |
|
Includes an offsetting liability of $0.5 million at December 31, 2009 and a
contributing asset of $6.5 million at December 31, 2008 related to derivative instruments
associated with our marketable securities. |
We believe existing cash and cash equivalents and proceeds from the potential sales of all or a
portion of our interests in certain marketable securities and partner companies to be sufficient to
fund our cash requirements for the foreseeable future, including any future commitments to partner
companies, debt obligations and general operations requirements. As of the date of this filing, we
were not obligated for any material funding and guarantee commitments to existing partner
companies. We will continue to evaluate acquisition opportunities and may acquire additional
ownership interests in new and existing partner companies in the next twelve months; however, such
acquisitions will generally be made at our discretion.
ICG Commerce and InvestorForce have funded their operations through a combination of cash flow from
operations, borrowings and equity issuances. ICG Commerce expects that its existing cash balance
and cash flow from operations will be sufficient to fund its operations through 2010, while
InvestorForce is likely to require additional borrowings and/or equity issuances to fund its operations through 2010. We acquired a majority interest in GovDelivery through a
merger transaction that was consummated on December 31, 2009. GovDelivery expects that its
existing cash balance will be sufficient to fund its operations through 2010.
Our consolidated working capital decreased $11.6 million, from $83.3 million as of December 31, 2008 to $71.7
million as of December 31, 2009. The reduction to working capital in 2009 primarily relates to acquisitions of ownership interests in partner companies, partially offset by sales of marketable securities.
24
Summary of Statements of Cash Flows
| |
|
|
|
|
|
|
|
|
|
|
|
|
| |
|
Year Ended December 31, |
|
| |
|
2009 |
|
|
2008 |
|
|
2007 |
|
| |
|
(in thousands) |
|
Cash used in operating activities |
|
$ |
(8,979 |
) |
|
$ |
(12,385 |
) |
|
$ |
(16,174 |
) |
Cash provided by (used in) investing activities |
|
$ |
(22,245 |
) |
|
$ |
28,964 |
|
|
$ |
15,428 |
|
Cash used in financing activities |
|
$ |
(2,935 |
) |
|
$ |
(8,593 |
) |
|
$ |
(37,960 |
) |
The $3.4 million decrease in cash
used in operating activities from 2008 to 2009 is primarily due to the increase to net income of
$15.5 million in 2009 compared to net loss of $(22.9) million in 2008, a decrease in other income
(loss) of $26.7 million and an increase in income attributable to noncontrolling interests of
$11.0 million from 2008 to 2009. These items were partially offset by a deferred tax benefit
recorded in 2009 and a reduction in equity loss of $28.9 million and $21.6 million, respectively.
Additionally, net changes in working capital components decreased $14.6 million from 2008 to 2009,
primarily driven by income tax receivables of $10.6 million in 2009.
The change from cash provided by investing activities in 2008 to cash used in investing activities
in 2009 is primarily related to decreased proceeds of $38.6 million from sales of marketable securities
from 2008 to 2009, as well as a $11.2 million increase in acquisitions of ownership interests in
partner companies during that period.
The decrease in cash used in financing activities from 2008 to 2009 primarily relates to a $6.6
million decrease in our common stock repurchases under the Share Repurchase Program discussed in
the subsection entitled, “Issuer Purchases of Equity Securities,” in “Item 5—Market For
Registrant’s Common Equity, Related Stockholder Matters and Issuer Purchases of Equity Securities.”
The decrease in cash used in operating activities from 2007 to 2008 was due to an improved net loss
position, other income from sales of partner companies and the receipt of a $4.9 million federal
income tax refund in 2008, offset by greater equity loss and impairment charges in 2008.
The increase in cash provided by investing activities from 2007 to 2008 was primarily related to
proceeds received from the sale of marketable securities, partially offset by greater net
acquisitions of ownership interests in partner companies in 2008 versus 2007.
The decrease in cash used in financing activities from 2007 to 2008 was the result of the
repurchases of the Company’s Common Stock in 2008 being less than the repurchase of all outstanding
senior convertible notes that occurred in 2007.
We and our consolidated subsidiaries are involved in various claims and legal actions arising in
the ordinary course of business. We do not expect any ultimate liability with respect to these
actions will materially affect our financial position or cash flows.
Contractual Cash Obligations and Commercial Commitments
The following table summarizes our contractual cash obligations and commercial commitments as of
December 31, 2009:
| |
|
|
|
|
|
|
|
|
|
|
|
|
|
|
|
|
|
|
|
|
| |
|
Payments due by period |
|
| |
|
|
|
|
|
Less than |
|
|
1-3 |
|
|
3-5 |
|
|
More than |
|
| |
|
Total |
|
|
1 year |
|
|
years |
|
|
years |
|
|
5 years |
|
| |
|
(in thousands) |
|
Operating leases |
|
$ |
12,658 |
|
|
$ |
2,536 |
|
|
$ |
4,376 |
|
|
$ |
2,774 |
|
|
$ |
2,972 |
|
Capital leases |
|
|
241 |
|
|
|
117 |
|
|
|
109 |
|
|
|
15 |
|
|
|
— |
|
Other debt |
|
|
785 |
|
|
|
264 |
|
|
|
521 |
|
|
|
— |
|
|
|
— |
|
|
|
|
|
|
|
|
|
|
|
|
|
|
|
|
|
|
|
$ |
13,684 |
|
|
$ |
2,917 |
|
|
$ |
5,006 |
|
|
$ |
2,789 |
|
|
$ |
2,972 |
|
|
|
|
|
|
|
|
|
|
|
|
|
|
|
|
|
25
Off-Balance Sheet Arrangements
We are not involved in any off-balance sheet arrangements that have or are reasonably likely to
have a material future effect on our financial condition, changes in financial condition, revenues
or expenses, results of operations, liquidity, capital expenditures or capital resources.
Our Partner Companies
As of December 31, 2009, we owned interests in 13 partner companies that are categorized below
based on segment and method of accounting.
| |
|
|
|
|
|
|
| CORE PARTNER COMPANIES (%Voting Interest) |
| Consolidated |
|
Equity |
|
Cost |
| GovDelivery (89%) |
|
Channel Intelligence (50%)(1) |
|
(none) |
| ICG Commerce (64%) |
|
Freeborders (31%) |
|
|
|
|
| InvestorForce (81%) |
|
Metastorm (33%) |
|
|
|
|
| |
|
StarCite (36%) |
|
|
|
|
| |
|
WhiteFence (36%) |
|
|
|
|
| |
|
|
|
|
|
|
| VENTURE PARTNER COMPANIES (%Voting Interest) |
| Consolidated |
|
Equity |
|
Cost |
| (none) |
|
Acquirgy (25%) |
|
|
Anthem (9 |
%) |
|
|
ClickEquations (33%) |
|
|
|
|
|
|
GoIndustry (26%) (2) |
|
|
|
|
|
|
SeaPass (26%) |
|
|
|
|
| |
|
|
| (1) |
|
Our ownership percentage rounds up to 50%. We do not
consolidate Channel Intelligence since we do not own a majority interest, and
additional factors support that we do not exert control over Channel
Intelligence. See Note 3, “Ownership Interests in Partner Companies,
Goodwill and Intangibles, net,” to our Consolidated Financial Statements. |
| |
| (2) |
|
As of December 31, 2009 and March 1, 2010, we owned
254,674,377 shares, or approximately 26% of the voting securities, of
GoIndustry. GoIndustry’s common stock is traded on the AIM market of the
London Stock Exchange under ticker symbol GOI. See Note 3, “Ownership
Interests in Partner Companies, Goodwill and Intangibles, net,” to the
Consolidated Financial Statements. |
Results of Operations
The following table summarizes the unaudited selected financial information related to our
segments. Each segment includes the results of our consolidated partner companies and records our
share of the earnings and losses of partner companies accounted for under the equity method of
accounting. The partner companies included within the segments are consistently the same partner
companies for 2009, 2008 and 2007. GovDelivery was acquired on December 31, 2009; therefore, only
balance sheet information as of December 31, 2009 is included in our consolidated financial
information. Additionally, Acquirgy and SeaPass, the partner companies in which we acquired an
interest during 2009, are included in the venture segment from their respective acquisition dates,
and ClickEquations is included in the venture segment beginning on March 7, 2008, at which time we
acquired more than 20% of its voting securities and began to record our share of the earnings and
losses of ClickEquations under the equity method of accounting. The method of accounting for any
particular partner company may change based on our ownership interest.
“Discontinued Operations and Dispositions” are those partner companies that have been sold or
ceased operations and are no longer included in a segment for the periods presented. “Corporate”
expenses represent the general and administrative expenses of our business operations, which
include supporting our partner companies and operating as a public company. The measure of segment
net loss reviewed by us does not include items such as gains on the disposition of partner company
ownership interests and marketable securities holdings, losses on convertible note repurchases and
transactions, income taxes, accounting changes and impairment charges associated with partner
companies, which are reflected in “Other” reconciling items in the information that follows.
26
Segment Information
(in thousands)
| |
|
|
|
|
|
|
|
|
|
|
|
|
|
|
|
|
|
|
|
|
|
|
|
|
|
|
|
|
| |
|
|
|
|
|
|
|
|
|
|
|
|
|
Reconciling Items |
|
|
|
|
| |
|
|
|
|
|
|
|
|
|
|
|
|
Discontinued |
|
|
|
|
|
|
|
|
|
|
|
|
| |
|
|
|
|
|
|
|
|
|
Total |
|
|
Operations and |
|
|
|
|
|
|
|
|
|
|
Consolidated |
|
| |
|
Core |
|
|
Venture |
|
|
Segment |
|
|
Dispositions |
|
|
Corporate |
|
|
Other |
|
|
Results |
|
For the Year Ended
December 31, 2009 |
|
|
|
|
|
|
|
|
|
|
|
|
|
|
|
|
|
|
|
|
|
|
|
|
|
|
|
|
Revenues |
|
$ |
90,252 |
|
|
$ |
— |
|
|
$ |
90,252 |
|
|
$ |
— |
|
|
$ |
— |
|
|
$ |
— |
|
|
$ |
90,252 |
|
Net income (loss) attributable to Internet Capital Group, Inc. |
|
$ |
26,049 |
|
|
$ |
(2,845 |
) |
|
$ |
23,204 |
|
|
$ |
— |
|
|
$ |
(15,858 |
) |
|
$ |
8,188 |
|
|
$ |
15,534 |
|
|
|
|
|
|
|
|
|
|
|
|
|
|
|
|
|
|
|
|
|
|
|
|
|
|
|
|
|
|
For the Year Ended
December 31, 2008 |
|
|
|
|
|
|
|
|
|
|
|
|
|
|
|
|
|
|
|
|
|
|
|
|
|
|
|
|
Revenues |
|
$ |
71,181 |
|
|
$ |
— |
|
|
$ |
71,181 |
|
|
$ |
— |
|
|
$ |
— |
|
|
$ |
— |
|
|
$ |
71,181 |
|
Net income (loss) attributable to Internet Capital Group, Inc. |
|
$ |
(23,758 |
) |
|
$ |
(4,381 |
) |
|
$ |
(28,139 |
) |
|
$ |
— |
|
|
$ |
(18,966 |
) |
|
$ |
24,179 |
|
|
$ |
(22,926 |
) |
|
|
|
|
|
|
|
|
|
|
|
|
|
|
|
|
|
|
|
|
|
|
|
|
|
|
|
|
|
For the Year Ended
December 31, 2007 |
|
|
|
|
|
|
|
|
|
|
|
|
|
|
|
|
|
|
|
|
|
|
|
|
|
|
|
|
Revenues |
|
$ |
52,923 |
|
|
$ |
— |
|
|
$ |
52,923 |
|
|
$ |
— |
|
|
$ |
— |
|
|
$ |
— |
|
|
$ |
52,923 |
|
Net income (loss) attributable to Internet Capital Group, Inc. |
|
$ |
(18,194 |
) |
|
$ |
(856 |
) |
|
$ |
(19,050 |
) |
|
$ |
1,849 |
|
|
$ |
(17,022 |
) |
|
$ |
10,616 |
|
|
$ |
(23,607 |
) |
For the Years Ended December 31, 2009, 2008 and 2007
Results of Operations — Core Partner Companies
The following presentation of our Results of Operations — Core Partner Companies includes the
results of our consolidated core partner companies and our share of the results of our equity
method core partner companies.
| |
|
|
|
|
|
|
|
|
|
|
|
|
| |
|
Year Ended December 31, |
|
| |
|
2009 |
|
|
2008 |
|
|
2007 |
|
| |
|
(in thousands) |
|
Selected data: |
|
| |
|
|
| |
|
|
| |
|
Revenues |
|
$ |
90,252 |
|
|
$ |
71,181 |
|
|
$ |
52,923 |
|
|
|
|
|
|
|
|
|
|
|
Cost of revenue |
|
|
(56,920 |
) |
|
|
(46,400 |
) |
|
|
(39,523 |
) |
Selling, general and administrative |
|
|
(18,321 |
) |
|
|
(16,390 |
) |
|
|
(11,101 |
) |
Research and development |
|
|
(9,015 |
) |
|
|
(10,212 |
) |
|
|
(6,033 |
) |
Impairment related and other |
|
|
(521 |
) |
|
|
(994 |
) |
|
|
(188 |
) |
|
|
|
|
|
|
|
|
|
|
Operating expenses |
|
|
(84,777 |
) |
|
|
(73,996 |
) |
|
|
(56,845 |
) |
Interest and other |
|
|
433 |
|
|
|
(1,139 |
) |
|
|
451 |
|
Income tax benefit (expense) |
|
|
28,883 |
|
|
|
(687 |
) |
|
|
(309 |
) |
Equity loss |
|
|
(8,742 |
) |
|
|
(19,117 |
) |
|
|
(14,414 |
) |
|
|
|
|
|
|
|
|
|
|
Net income (loss) |
|
$ |
26,049 |
|
|
$ |
(23,758 |
) |
|
$ |
(18,194 |
) |
|
|
|
|
|
|
|
|
|
|
Revenues
Revenue increased from $71.2 million in 2008 to $90.3 million in 2009, an increase of $19.1
million. The majority of this increase is attributable to continued revenue growth at ICG
Commerce. ICG Commerce’s revenue increased 28% in 2009 from 2008 due to significant new customers, as well as an increase in
revenues from existing customers. The majority of ICG Commerce’s contracts are terminable by the
customer on short notice or without notice, sometimes without financial penalty. Accordingly, we
do not believe it is appropriate to characterize the total contract value of these long-term
relationships as backlog. Increased revenues at InvestorForce in 2009 also contributed to the
annual increase in consolidated revenue, while revenues of Vcommerce Corporation (“Vcommerce”) from
January 2009 through the date of its deconsolidation in August 2009 decreased slightly from the
eight months of revenue consolidated in 2008.
27
Revenue increased from $52.9 million in 2007 to $71.2 million in 2008, an increase of $18.3
million. $11.9 million of the increase is attributable to ICG Commerce. ICG Commerce’s revenue
increased 23% in 2008 over 2007 due to its expanding customer base and the continuation of long-term
relationships. The consolidation of Vcommerce beginning in May 2008 contributed the majority of
the residual increase.
Operating Expenses
Operating expenses increased from $74.0 million in 2008 to $84.8 million in 2009, an increase of
$10.8 million. This increase is the result of increases in the cost of revenues and selling, general
and administrative expenses, primarily expenses related to an increase in headcount of
approximately 100 employees in 2009 needed to service new customers at ICG Commerce. An increase in selling,
general and administrative expenses at InvestorForce also contributed to the increase in operating
expenses from 2008 to 2009 and is related to the hiring of certain additional key personnel in late
2008 and early 2009. The decrease in research and development costs from 2008 to 2009 is
related to cost reduction efforts at Vcommerce in the first half of 2009.
Operating expenses increased from $56.8 million in 2007 to $74.0 million in 2008, an increase of
$17.2 million. This increase is the result of the consolidation of Vcommerce beginning in May
2008, which contributed $9.5 million, as well as an increase in operating expenses related to ICG
Commerce’s increased revenues in 2008.
Income Tax
ICG Commerce recorded an income tax benefit of $28.9 million for the year ended December 31, 2009 related
to the reduction of a portion of ICG Commerce’s valuation allowance. Based on ICG Commerce’s
recent history of profitability and estimates of continued profitability, ICG Commerce now believes
it is more likely than not that the majority of its available net deferred tax assets will be
realized.
Income tax expense increased $0.4 million from 2007 to 2008 due to an increase in net income at ICG
Commerce.
Equity Loss
A portion of our net results from our core partner companies is derived from those partner companies in
which we hold a substantial noncontrolling ownership interest. Our share of the net income or net
losses of these partner companies is recorded in our Consolidated Statements of Operations under “Equity
loss.”
| |
|
|
|
|
|
|
|
|
|
|
|
|
| |
|
Year Ended December 31, |
|
| |
|
2009 |
|
|
2008 |
|
|
2007 |
|
| |
|
(in thousands) |
|
| |
|
|
|
|
|
|
|
|
|
|
|
|
Selected data: |
|
|
|
|
|
|
|
|
|
|
|
|
Total revenues |
|
$ |
184,309 |
|
|
$ |
193,328 |
|
|
$ |
160,985 |
|
Total net loss |
|
$ |
(15,733 |
) |
|
$ |
(44,928 |
) |
|
$ |
(40,973 |
) |
Our share of total net loss |
|
$ |
(6,653 |
) |
|
$ |
(17,705 |
) |
|
$ |
(14,160 |
) |
Amortization of intangible assets |
|
|
(2,089 |
) |
|
|
(1,412 |
) |
|
|
(254 |
) |
| |
|
|
|
|
|
|
|
|
|
Equity loss |
|
$ |
(8,742 |
) |
|
$ |
(19,117 |
) |
|
$ |
(14,414 |
) |
| |
|
|
|
|
|
|
|
|
|
Revenue from our core partner companies accounted for under the equity method of accounting
decreased from $193.3 million in 2008 to $184.3 million in 2009, a decrease of $9.0 million,
primarily due to decreases in revenue at Metastorm, StarCite and WhiteFence. These decreases were
driven by the difficult macroeconomic conditions that began in late 2008 and continue through
2009. Despite the decrease in aggregate revenue, net results at each of our equity method core
companies improved from 2008 to 2009 due to improved cost management and the absence of one-time
charges recorded in 2008, resulting in a decrease in aggregate net loss in 2009 compared to 2008
and a significant decrease in our share of this aggregate net loss.
Revenue from our equity-method core partner companies increased from $161.0 million in 2007 to
$193.3 million in 2008, an increase of $32.3 million. This increase relates to increases in
revenue at Metastorm partially as the result of an acquisition, as well as at many of our other core partner
companies. Aggregate net loss also increased from 2007 to 2008, which was primarily the result of
increased net losses at Metastorm and StarCite. Metastorm’s net loss increased as the result of
increased amortization expense associated with an
acquisition, litigation expenses and expenses associated with an initial public offering that was
not consummated. StarCite’s net loss increased as the result of severance and merger integration
expenses. Accordingly, our share of the total net loss also increased during this period.
28
Results of Operations — Venture Partner Companies
The following presentation of our Results of Operations — Venture Partner Companies includes our
share of the results of our equity method venture partner companies. There are currently no
consolidated partner companies that we consider to be part of our venture reporting segment. Accordingly,
our share of the results of our venture partner companies is recorded in our Consolidated Statements of Operations under
“Equity loss.”
| |
|
|
|
|
|
|
|
|
|
|
|
|
| |
|
Year Ended December 31, |
|
| |
|
2009 |
|
|
2008 |
|
|
2007 |
|
| |
|
(in thousands) |
|
Selected data: |
|
| | |
|
| | |
|
| | |
Our share of total net loss (“Equity loss”) |
|
$ |
(2,845 |
) |
|
$ |
(4,381 |
) |
|
$ |
(856 |
) |
Equity loss related to our venture partner companies decreased from 2008 to 2009 due to the
improvement of GoIndustry’s net results in 2009, partially offset by a full year of equity loss related to
ClickEquations in 2009 compared with ten months in 2008 and the acquistions of Acquirgy and SeaPass
in 2009.
Equity loss related to our venture partner companies increased from 2007 to 2008 as a result of
GoIndustry recording more net losses in the 2008 period and the addition of ClickEquations as an
equity method company in 2008.
Results of Operations — Reconciling Items
Discontinued Operations and Dispositions
The following is a summary of the components included in “Discontinued Operations and
Dispositions,” a reconciling item for segment reporting purposes:
| |
|
|
|
|
|
|
|
|
|
|
|
|
| |
|
Year Ended December 31, |
|
| |
|
2009 |
|
|
2008 |
|
|
2007 |
|
| |
|
(in thousands) |
|
Discontinued operations |
|
$ |
— |
|
|
$ |
— |
|
|
$ |
995 |
|
Equity
income (loss) of partner companies
sold/disposed of |
|
|
— |
|
|
|
— |
|
|
|
854 |
|
|
|
|
|
|
|
|
|
|
|
Net income |
|
$ |
— |
|
|
$ |
— |
|
|
$ |
1,849 |
|
|
|
|
|
|
|
|
|
|
|
In 2007, InvestorForce received $1.0 million from an escrow release related to its sale of its
database division to Morningstar, Inc. (“Morningstar”), which we recorded as a gain in that period.
The operating activities for InvestorForce’s database division for 2007 was a loss of $0.2
million. Also in 2007, we received $0.2 million of additional proceeds from the sale of the assets
of Delphion, Inc., which was recorded as a gain during the year ended December 31, 2007. In
accordance with accounting guidance for the presentation of financial statements, these operations
have been treated as discontinued operations. Accordingly, the operating results of these
discontinued operations have been presented separately from continuing operations and include the
gains or losses recognized on disposition. See Note 15, “Discontinued Operations” to our
Consolidated Financial Statements.
The impact to our consolidated results of equity method partner companies in which we disposed of
our ownership interest, or which have ceased operations, during 2007 is also included in the
caption “Dispositions” for segment reporting purposes. Equity income primarily relates to
Marketron International, Inc. (“Marketron”) in 2007.
29
Corporate
| |
|
|
|
|
|
|
|
|
|
|
|
|
| |
|
Year Ended December 31, |
|
| |
|
2009 |
|
|
2008 |
|
|
2007 |
|
| |
|
(in thousands) |
|
| |
|
|
|
|
|
|
|
|
|
|
|
|
General and administrative |
|
$ |
(16,257 |
) |
|
$ |
(19,775 |
) |
|
$ |
(21,680 |
) |
Impairment related and other |
|
|
— |
|
|
|
(794 |
) |
|
|
— |
|
Interest income (expense), net |
|
|
399 |
|
|
|
1,603 |
|
|
|
4,658 |
|
|
|
|
|
|
|
|
|
|
|
Net loss |
|
$ |
(15,858 |
) |
|
$ |
(18,966 |
) |
|
$ |
(17,022 |
) |
|
|
|
|
|
|
|
|
|
|
General and Administrative
The decrease of $3.5 million in general and administrative expenses from 2008 to 2009 is primarily
due to a decrease of $3.1 million in equity based compensation, coupled with decreases of $0.3
million in consulting fees, $0.2 million in financial reporting costs and $0.2 million in insurance
premiums, partially offset by an increase in employee-related expenses of $0.3 million primarily
related to increased headcount.
Our general and administrative expenses decreased $1.9 million from 2007 to 2008, primarily due to
decreases in employee-related expenses associated with our annual bonus program of $1.4 million and
stock-based compensation of $0.7 million, partially offset by other outside services of $0.2
million.
Impairment-Related and Other
Our impairment related and other expenses in 2008 of $0.8 million related to severance charges.
Those charges primarily related to cash payments of $0.7 million paid in January 2009. The
residual balance is associated with related benefits, which were paid during 2009.
Interest Income/Expense
The net decrease of $1.2 million and $3.1 million in our interest income (expense) from 2008 to
2009 and 2007 to 2008, respectively, is attributable to the decrease in our average cash balances
compounded with decreases in interest rates.
Other
| |
|
|
|
|
|
|
|
|
|
|
|
|
| |
|
Year Ended December 31, |
|
| |
|
2009 |
|
|
2008 |
|
|
2007 |
|
| |
|
(in thousands) |
|
|
|
|
|
|
|
|
|
|
|
|
|
|
Other income (loss), net (excluding
impairments of cost method partner
companies) |
|
$ |
15,976 |
|
|
$ |
49,012 |
|
|
$ |
6,783 |
|
Impairments of cost method partner companies |
|
|
— |
|
|
|
(4,735 |
) |
|
|
— |
|
|
|
|
|
|
|
|
|
|
|
Other income (loss), net |
|
|
15,976 |
|
|
|
44,277 |
|
|
|
6,783 |
|
|
|
|
|
|
|
|
|
|
|
Impairment of carrying value of GoIndustry
(venture) (equity method partner company) |
|
|
(544 |
) |
|
|
(10,204 |
) |
|
|
— |
|
Impairment of goodwill related to Vcommerce
(core) (consolidated partner company) |
|
|
(4,876 |
) |
|
|
(8,264 |
) |
|
|
— |
|
Income tax benefit (expense) |
|
|
10,627 |
|
|
|
330 |
|
|
|
4,301 |
|
Noncontrolling interest |
|
|
(12,995 |
) |
|
|
(1,960 |
) |
|
|
(468 |
) |
|
|
|
|
|
|
|
|
|
|
Net income |
|
$ |
8,188 |
|
|
$ |
24,179 |
|
|
$ |
10,616 |
|
|
|
|
|
|
|
|
|
|
|
30
Other Income (Loss), Net
Other income (loss), net of $16.0 million in 2009 relates primarily to a gain on the sale of
marketable securities of $21.3 million, coupled with gains totaling $2.6 million related to the
sale of interests in partner companies. These gains are offset by unrealized losses related to the
mark-to-market impact of marketable securities hedges of $7.6 million and a $0.3 million net dilution loss
resulting from equity transactions at certain of our partner companies during 2009, which
affected our ownership in those partner companies.
Other income (loss), net of $44.3 million in 2008 relates primarily to the sale of interests in
partner companies of $38.0 million and unrealized gains related to the mark-to-market impact of marketable
securities hedges of $10.2 million.
Other income (loss), net of $(0.2) million in 2007 relates primarily to the loss on the repurchases
of our senior convertible notes of $3.8 million, partially offset by an $8.8 million gain on the
sale of Marketron.
See Note 13, “Other Income (Loss),” to our Consolidated Financial Statements.
Impairment Charges
We recorded impairment charges of $5.4 million in 2009. Of this amount, $4.9 million related to
the impairment of goodwill associated with Vcommerce, and the remaining $0.5 million was an
impairment charge related to our carrying value of GoIndustry.
We recorded impairment charges of $23.2 million in 2008. Of this amount, $8.3 million related to
the impairment of goodwill
associated with our partner companies, and $14.9 million was a reduction to our basis in certain cost and
equity method partner companies.
See Note 3, “Ownership Interests in Partner Companies, Goodwill and Intangibles, net,” to our
Consolidated Financial Statements.
Corporate Income Tax
The income tax benefit recorded in 2009 and 2008 represents amounts that can
now be carried back to 2005 as a result of newly-enacted legislation, as well as, the results of the Internal Revenue Service examination of the
Company’s federal income
tax returns for the years 2005, 2006 and 2007.
See Note 14, “Income Taxes,” to our Consolidated Financial Statements.
Critical Accounting Policies
Our discussion and analysis of our financial condition and results of operations are based upon our
Consolidated Financial Statements, which have been prepared in accordance with GAAP. The
preparation of these financial statements requires us to make estimates and judgments that affect
the reported amounts of assets, liabilities, revenues and expenses and related disclosure of
contingent assets and liabilities. On an ongoing basis, we evaluate our estimates, including those
related to our interests in our partner companies, marketable securities, revenues, income taxes
and commitments and contingencies. We base our estimates on historical experience and on various
other assumptions that are believed to be reasonable under the circumstances, the results of which
form the basis for making judgments about the carrying values of assets and liabilities. Actual
results may differ from these estimates under different assumptions or conditions.
We believe the following critical accounting policies are important to the presentation of our
financial statements and require the most difficult, subjective and complex judgments.
31
Valuation of Goodwill, Intangible Assets and Ownership Interests in Partner Companies
We test goodwill for impairment annually, or more frequently as conditions warrant, and intangible
assets when events or changes in circumstances indicate that the carrying amount of an asset may
not be recoverable. Additionally, we perform ongoing business reviews to evaluate our ownership
interests in partner companies accounted for under the equity and cost methods of accounting to
determine whether an other than temporary decline in the value of a partner company should be
recognized. We use quantitative and qualitative measures to assess the need to record impairment
losses on goodwill, intangible assets and ownership interests in our partner companies when
impairment indicators are present. Where impairment indicators are present, we determine the
amount of the impairment charge as the excess of the carrying value over the fair value. We
determine fair value using a combination of the discounted cash flow methodology, which is based
upon converting expected future cash flows to present value, and the market approach, which
includes analysis of market price multiples of companies engaged in lines of business similar to
the company being evaluated. The market price multiples are selected and applied to the company
based on relative performance, future prospects and risk profile of the company in comparison to
the guideline companies. Significant assumptions relating to future operating results must be made
when estimating the future cash flows associated with these companies. Significant assumptions
relating to the achievement of business plan objectives and milestones must be made when evaluating
whether impairment indicators are present. Should unforeseen events occur or should operating
trends change significantly, additional impairment losses could occur.
Revenue Recognition
ICG Commerce may assume all or a part of a customer’s procurement function as part of sourcing
arrangements. Typically, in these engagements, ICG Commerce is paid a fixed fee agreed upon in
advance and/or a fee based on a percentage of the amount spent by its customers’ respective
purchasing departments in the specified areas ICG Commerce manages. Additionally, in some cases,
ICG Commerce has the opportunity to earn additional fees based on the level of savings achieved for
customers. ICG Commerce recognizes revenue and any additional fees as earned, which is typically
over the life of the customer contract, which approximates the life of the customer relationship.
Vcommerce was a consolidated company from May 2008, when our ownership stake increased to 53%,
through August 2009, at which time it sold substantially all of its
assets and liabilities. Vcommerce generated revenue from service fees earned by it in connection
with the development and operations of its clients’ e-commerce businesses. Service fee revenue
primarily consisted of transaction fees, implementation fees and professional services fees, as
well as access and maintenance fees. Vcommerce recognized revenue from services provided in
accordance with general revenue recognition criteria either over the term of the customer contract
or as services were rendered, depending on the type of revenue.
Equity Income/Loss
We record our share of the net income/loss of our partner companies’ that are accounted for under
the equity method of accounting as equity income/loss. Since we do not control these companies, this
equity income/loss is based on unaudited results of operations of our partner companies and may
require adjustment in the future when the audits of our partner companies are complete. The
compilation and review of these results of operations require significant judgment and estimates by
management.
Deferred Income Taxes
We record a valuation allowance to reduce our net deferred tax assets to the amount that is more
likely than not to be realized. We consider future taxable income and prudent and feasible tax
planning strategies in determining the need for a valuation allowance. In the event that we
determine that we would not be able to realize all or part of our net deferred tax assets, an
adjustment to the deferred tax assets would be charged to earnings in the period such determination
is made. Likewise, if we later determine that it is more likely than not that the net deferred tax
assets would be realized, the previously provided valuation allowance would be reversed.
32
Commitments and Contingencies
From time to time, we are a defendant or plaintiff in various legal actions that arise in the
normal course of business. From time to time, we are also a guarantor of various third-party
obligations and commitments. We are required to assess the likelihood of any adverse judgments or
outcomes to these matters, as well as potential ranges of probable losses. A determination of the
amount of reserves required for these contingencies, if any, which would be charged to earnings, is
made after careful analysis of each individual matter. The required reserves may change in the
future due to new developments in each matter or changes in circumstances, such as a change in
settlement strategy. Changes in required reserves could increase or decrease our earnings in the
period the changes are made.
Recent Accounting Pronouncements
In January 2010, the Financial Accounting Standards Board (“FASB”) issued amended guidance
requiring additional fair value disclosures about inputs and valuation techniques used to measure
fair value as well as disclosures about significant transfers between levels in the hierarchy of
fair value measurement. This guidance is effective for us beginning on January 1, 2010, and is
not expected to have a significant impact on our consolidated financial statements.
In October 2009, the FASB issued accounting guidance for revenue recognitions with multiple
deliverables, which impacts the determination of when the individual deliverables included in a
multiple-element arrangement may be treated as separate units of accounting. This guidance is
effective for us beginning on January 1, 2011. We are currently evaluating the effect this
guidance will have on our consolidated financial statements.
In October 2009, the FASB issued accounting guidance related to certain revenue arrangements that
include software elements, which amends the scope of pre-existing software revenue guidance. This
guidance is effective for us beginning on January 1, 2011. We are currently evaluating the effect
this guidance will have on our consolidated financial statements.
In June 2009, the FASB issued accounting guidance that requires former “qualifying special-purpose
entities” to be evaluated for consolidation, changes the approach to determining a variable
interest entity’s primary beneficiary and revises the frequency with which reassessments of this
determination should be made, and requires additional disclosures related to these items. This
guidance is effective for us beginning on January 1, 2010, and is not expected to have a
significant impact on our consolidated financial statements.
33
|
|
|
| ITEM 7A. |
|
Quantitative and Qualitative Disclosures About Market Risk |
We are exposed to equity price risks on the marketable portion of our equity securities. Our
public holdings at December 31, 2009 include equity positions in companies in sectors that have
experienced significant historical volatility in their stock prices. A 20% adverse change in
equity prices, based on a sensitivity analysis of our public holdings as of December 31, 2009,
would result in approximately a $14.5 million decrease in the fair value of our public holdings.
At December 31, 2009, the Company was party to cashless collar contracts with various expiration
dates in 2010 to hedge 1,000,000 shares of its total holdings of 1,619,571 shares of Blackboard
common stock at weighted average minimum and maximum prices per share of $25.44 and $57.60,
respectively. In January 2010, the Company reduced the amount of hedged shares
by 250,000 by settling those hedge contracts with the counterparty. As of the end of
January 2010 and March 1,2010, the Company remains a party to cashless collar
contracts with various expiration dates in 2010 to hedge 750,000 shares of its total holdings of
831,866 shares of Blackboard common stock at weighted average minimum and maximum prices per share
of $25.96 and $58.09, respectively. Each of these contracts limits the Company’s exposure to price
declines in the underlying equity securities. Additionally, each of these contracts limits the
Company’s maximum benefits from price increases in the underlying equity securities.
Cash and cash equivalents, accounts receivable and accounts payable are carried at cost, which
approximates fair value due to the short-term maturity of these instruments. Marketable securities
are carried at fair value.
We have historically had very low exposure to changes in foreign currency exchange rates and, as
such, have not used derivative financial instruments to manage foreign currency fluctuation risk.
34
|
|
|
| ITEM 8. |
|
Financial Statements and Supplementary Data |
The following Consolidated Financial Statements, and the related Notes thereto, of Internet Capital
Group, Inc. and the Report of Independent Registered Public Accounting Firm are filed as a part of
this Annual Report on Form 10-K/A.
| |
|
|
|
|
| |
|
Page |
|
| |
|
Number |
|
|
|
|
36 |
|
|
|
|
|
|
|
|
|
37 |
|
|
|
|
|
|
|
|
|
38 |
|
|
|
|
|
|
|
|
|
39 |
|
|
|
|
|
|
|
|
|
40 |
|
|
|
|
|
|
|
|
|
41 |
|
|
|
|
|
|
|
|
|
42 |
|
|
|
|
|
|
35
REPORT OF INDEPENDENT REGISTERED PUBLIC ACCOUNTING FIRM
The Board of Directors and Stockholders
Internet Capital Group, Inc.:
We have audited the accompanying consolidated balance sheets of Internet Capital Group, Inc. and
subsidiaries (the Company) as of December 31, 2009 and 2008, and the related consolidated
statements of operations, changes in equity, comprehensive income (loss) and cash flows for each
of the years in the three-year period ended December 31, 2009. These consolidated financial
statements are the responsibility of the Company’s management. Our responsibility is to express an
opinion on these consolidated financial statements based on our audits.
We conducted our audits in accordance with the standards of the Public Company Accounting Oversight
Board (United States). Those standards require that we plan and perform the audit to obtain
reasonable assurance about whether the financial statements are free of material misstatement. An
audit includes examining, on a test basis, evidence supporting the amounts and disclosures in the
financial statements. An audit also includes assessing the accounting principles used and
significant estimates made by management, as well as evaluating the overall financial statement
presentation. We believe that our audits provide a reasonable basis for our opinion.
In our opinion, the consolidated financial statements referred to above present fairly, in all
material respects, the financial position of Internet Capital Group, Inc. and subsidiaries as of
December 31, 2009 and 2008, and the results of their operations and their cash flows for each of
the years in the three-year period ended December 31, 2009, in conformity with U. S. generally
accepted accounting principles.
As discussed in Note 7 to the consolidated financial statements, the
Company retrospectively changed its method of accounting for convertible debt instruments that may be settled in cash
upon conversion due to the adoption of a new accounting standard issued by the Financial Accounting Standards Board, as of
January 1, 2009.
We also have audited, in accordance with the standards of the Public Company Accounting Oversight
Board (United States), Internet Capital Group, Inc.’s internal control over financial reporting as
of December 31, 2009, based on criteria established in Internal Control—Integrated Framework issued
by the Committee of Sponsoring Organizations of the Treadway Commission (COSO), and our report
dated March 16, 2010 expressed an unqualified opinion on the effectiveness of the Company’s
internal control over financial reporting.
/s/ KPMG LLP
Philadelphia, Pennsylvania
March 16, 2010
36
INTERNET CAPITAL GROUP, INC.
CONSOLIDATED BALANCE SHEETS
| |
|
|
|
|
|
|
|
|
| |
|
December 31, |
|
|
December 31, |
|
| |
|
2009 |
|
|
2008 |
|
|
|
(in thousands, except per share data) |
|
Assets |
|
|
|
|
|
|
|
|
Current Assets |
|
|
|
|
|
|
|
|
Cash and cash equivalents |
|
$ |
55,481 |
|
|
$ |
89,295 |
|
Restricted cash |
|
|
47 |
|
|
|
232 |
|
Accounts receivable, net of allowance ($590-2009; $721-2008) |
|
|
19,411 |
|
|
|
14,526 |
|
Deferred tax assets |
|
|
8,147 |
|
|
|
— |
|
Income tax receivable |
|
|
11,071 |
|
|
|
444 |
|
Prepaid expenses and other current assets |
|
|
2,183 |
|
|
|
2,624 |
|
|
|
|
|
|
|
|
Total current assets |
|
|
96,340 |
|
|
|
107,121 |
|
Marketable securities |
|
|
73,512 |
|
|
|
57,367 |
|
Hedges of marketable securities |
|
|
— |
|
|
|
6,551 |
|
Fixed assets, net |
|
|
4,177 |
|
|
|
1,783 |
|
Ownership interests in partner companies |
|
|
97,777 |
|
|
|
83,751 |
|
Goodwill |
|
|
20,588 |
|
|
|
26,658 |
|
Intangibles, net |
|
|
15,940 |
|
|
|
713 |
|
Deferred tax assets |
|
|
20,724 |
|
|
|
— |
|
Other |
|
|
1,029 |
|
|
|
1,636 |
|
|
|
|
|
|
|
|
Total Assets |
|
$ |
330,087 |
|
|
$ |
285,580 |
|
|
|
|
|
|
|
|
|
|
|
|
|
|
|
|
|
Liabilities |
|
|
|
|
|
|
|
|
Current Liabilities |
|
|
|
|
|
|
|
|
Current maturities of other long-term debt |
|
$ |
381 |
|
|
$ |
318 |
|
Accounts payable |
|
|
1,656 |
|
|
|
2,026 |
|
Accrued expenses |
|
|
4,464 |
|
|
|
4,461 |
|
Accrued compensation and benefits |
|
|
12,227 |
|
|
|
10,385 |
|
Deferred revenue |
|
|
5,912 |
|
|
|
6,646 |
|
|
|
|
|
|
|
|
Total current liabilities |
|
|
24,640 |
|
|
|
23,836 |
|
Long-term debt |
|
|
645 |
|
|
|
3,916 |
|
Hedges of marketable securities |
|
|
547 |
|
|
|
— |
|
Deferred revenue |
|
|
83 |
|
|
|
1,910 |
|
Other |
|
|
1,010 |
|
|
|
1,092 |
|
|
|
|
|
|
|
|
Total Liabilities |
|
|
26,925 |
|
|
|
30,754 |
|
|
|
|
|
|
|
|
|
|
|
|
|
|
|
|
|
Equity |
|
|
|
|
|
|
|
|
Internet Capital Group, Inc.’s Stockholders’ Equity |
|
|
|
|
|
|
|
|
Preferred stock, $0.01 par value; 10,000 shares authorized, none issued or
outstanding |
|
|
— |
|
|
|
— |
|
Common stock, $0.001 par value; 2,000,000 shares authorized, 38,796 (2009)
and 38,703 (2008) issued |
|
|
39 |
|
|
|
39 |
|
Additional paid-in capital |
|
|
3,573,347 |
|
|
|
3,569,919 |
|
Treasury stock, at cost, 2,440 shares (2009) and 1,948 shares (2008) |
|
|
(12,031 |
) |
|
|
(9,329 |
) |
Accumulated deficit |
|
|
(3,351,888 |
) |
|
|
(3,367,422 |
) |
Accumulated other comprehensive income |
|
|
71,198 |
|
|
|
54,302 |
|
|
|
|
|
|
|
|
Total Internet Capital Group, Inc.’s Stockholders’ Equity |
|
|
280,665 |
|
|
|
247,509 |
|
Noncontrolling Interest |
|
|
22,497 |
|
|
|
7,317 |
|
|
|
|
|
|
|
|
Total Equity |
|
|
303,162 |
|
|
|
254,826 |
|
|
|
|
|
|
|
|
Total Liabilities and Equity |
|
$ |
330,087 |
|
|
$ |
285,580 |
|
|
|
|
|
|
|
|
See accompanying notes to Consolidated Financial Statements.
37
INTERNET CAPITAL GROUP, INC.
CONSOLIDATED STATEMENTS OF OPERATIONS
| |
|
|
|
|
|
|
|
|
|
|
|
|
| |
|
Year Ended December 31, |
|
| |
|
2009 |
|
|
2008 |
|
|
2007 |
|
| |
|
(in thousands, except per share data) |
|
|
|
|
|
|
|
|
|
|
|
|
|
|
Revenues |
|
$ |
90,252 |
|
|
$ |
71,181 |
|
|
$ |
52,923 |
|
|
|
|
|
|
|
|
|
|
|
|
|
|
Operating expenses |
|
|
|
|
|
|
|
|
|
|
|
|
Cost of revenue |
|
|
56,920 |
|
|
|
46,400 |
|
|
|
39,523 |
|
Selling, general and administrative |
|
|
34,578 |
|
|
|
36,165 |
|
|
|
32,781 |
|
Research and development |
|
|
9,015 |
|
|
|
10,212 |
|
|
|
6,033 |
|
Impairment related and other |
|
|
5,397 |
|
|
|
10,052 |
|
|
|
188 |
|
|
|
|
|
|
|
|
|
|
|
Total operating expenses |
|
|
105,910 |
|
|
|
102,829 |
|
|
|
78,525 |
|
|
|
|
|
|
|
|
|
|
|
|
|
|
(15,658 |
) |
|
|
(31,648 |
) |
|
|
(25,602 |
) |
Other income (loss), net |
|
|
16,578 |
|
|
|
43,225 |
|
|
|
6,830 |
|
Interest income |
|
|
446 |
|
|
|
1,850 |
|
|
|
5,338 |
|
Interest expense |
|
|
(216 |
) |
|
|
(334 |
) |
|
|
(276 |
) |
|
|
|
|
|
|
|
|
|
|
Income (loss) from continuing operations before income taxes and equity loss |
|
|
1,150 |
|
|
|
13,093 |
|
|
|
(13,710 |
) |
Income tax benefit (expense) |
|
|
39,510 |
|
|
|
(357 |
) |
|
|
3,992 |
|
Equity loss |
|
|
(12,131 |
) |
|
|
(33,702 |
) |
|
|
(14,416 |
) |
|
|
|
|
|
|
|
|
|
|
Income (loss) from continuing operations |
|
|
28,529 |
|
|
|
(20,966 |
) |
|
|
(24,134 |
) |
Income (loss) on discontinued operations |
|
|
— |
|
|
|
— |
|
|
|
995 |
|
|
|
|
|
|
|
|
|
|
|
Net income (loss) |
|
|
28,529 |
|
|
|
(20,966 |
) |
|
|
(23,139 |
) |
Less: Net income attributable to the noncontrolling interest |
|
|
12,995 |
|
|
|
1,960 |
|
|
|
468 |
|
|
|
|
|
|
|
|
|
|
|
Net income (loss) attributable to Internet Capital Group, Inc. |
|
$ |
15,534 |
|
|
$ |
(22,926 |
) |
|
$ |
(23,607 |
) |
|
|
|
|
|
|
|
|
|
|
|
|
|
|
|
|
|
|
|
|
|
|
|
Basic income (loss) per share
attributable to Internet Capital Group, Inc.: |
|
|
|
|
|
|
|
|
|
|
|
|
Income (loss) from continuing operations |
|
$ |
0.42 |
|
|
$ |
(0.60 |
) |
|
$ |
(0.64 |
) |
Income (loss) on discontinued operations |
|
|
— |
|
|
|
— |
|
|
|
0.02 |
|
Net income (loss) |
|
$ |
0.42 |
|
|
$ |
(0.60 |
) |
|
$ |
(0.62 |
) |
|
|
|
|
|
|
|
|
|
|
|
|
|
|
|
|
|
|
|
|
|
|
|
Shares used in computation of basic income (loss) per share |
|
|
36,660 |
|
|
|
38,106 |
|
|
|
37,916 |
|
|
|
|
|
|
|
|
|
|
|
|
|
|
|
|
|
|
|
|
|
|
|
|
Diluted income (loss) per share
attributable to Internet Capital Group, Inc.: |
|
|
|
|
|
|
|
|
|
|
|
|
Income (loss) from continuing operations |
|
$ |
0.42 |
|
|
$ |
(0.60 |
) |
|
$ |
(0.64 |
) |
Income (loss) on discontinued operations |
|
|
— |
|
|
|
— |
|
|
|
0.02 |
|
|
|
|
|
|
|
|
|
|
|
Net income (loss) |
|
$ |
0.42 |
|
|
$ |
(0.60 |
) |
|
$ |
(0.62 |
) |
|
|
|
|
|
|
|
|
|
|
|
|
|
|
|
|
|
|
|
|
|
|
|
Shares used in computation of diluted income (loss) per share |
|
|
36,705 |
|
|
|
38,106 |
|
|
|
37,916 |
|
|
|
|
|
|
|
|
|
|
|
See accompanying notes to Consolidated Financial Statements.
38
INTERNET CAPITAL GROUP, INC.
CONSOLIDATED
STATEMENTS OF CHANGES IN EQUITY
| |
|
|
|
|
|
|
|
|
|
|
|
|
|
|
|
|
|
|
|
|
|
|
|
|
|
|
|
|
|
|
|
|
|
|
|
|
| |
|
Internet
Capital Group, Inc. Stockholders’ Equity |
|
|
|
|
|
| |
|
|
|
|
|
|
|
|
|
|
|
|
|
|
|
|
|
Additional |
|
|
|
|
|
|
Accumulated Other |
|
|
|
|
|
|
|
| |
|
Common Stock |
|
|
Treasury Stock, at cost |
|
|
Paid-In |
|
|
Accumulated |
|
|
Comprehensive |
|
|
Noncontrolling |
|
|
|
|
| |
|
Shares |
|
|
Amount |
|
|
Shares |
|
|
Amount |
|
|
Capital |
|
|
Deficit |
|
|
Income |
|
|
Interest |
|
|
Total |
|
Balance as of December 31, 2006 |
|
|
38,598 |
|
|
$ |
39 |
|
|
|
— |
|
|
$ |
— |
|
|
$ |
3,552,681 |
|
|
$ |
(3,317,095 |
) |
|
$ |
62,913 |
|
|
$ |
4,123 |
|
|
$ |
302,661 |
|
Cumulative effect of change in accounting principle for convertible debt |
|
|
— |
|
|
|
— |
|
|
|
— |
|
|
|
— |
|
|
|
8,361 |
|
|
|
(3,794 |
) |
|
|
— |
|
|
|
— |
|
|
|
4,567 |
|
|
|
|
|
|
|
|
|
|
|
|
|
|
|
|
|
|
|
|
|
|
|
|
|
|
|
|
|
Balance at December 31, 2006, as adjusted |
|
|
38,598 |
|
|
|
39 |
|
|
|
— |
|
|
|
— |
|
|
|
3,561,042 |
|
|
|
(3,320,889 |
) |
|
|
62,913 |
|
|
|
4,123 |
|
|
|
307,228 |
|
Reacquisition of equity (Note 7) |
|
|
— |
|
|
|
— |
|
|
|
— |
|
|
|
— |
|
|
|
(11,588 |
) |
|
|
— |
|
|
|
— |
|
|
|
— |
|
|
|
(11,588 |
) |
Share-based compensation expense related to restricted stock |
|
|
— |
|
|
|
— |
|
|
|
— |
|
|
|
— |
|
|
|
2,334 |
|
|
|
— |
|
|
|
— |
|
|
|
— |
|
|
|
2,334 |
|
Impact of partner company equity transactions (Note 3) |
|
|
— |
|
|
|
— |
|
|
|
— |
|
|
|
— |
|
|
|
7,309 |
|
|
|
— |
|
|
|
— |
|
|
|
533 |
|
|
|
7,842 |
|
Issuance of restricted stock |
|
|
15 |
|
|
|
— |
|
|
|
— |
|
|
|
— |
|
|
|
— |
|
|
|
— |
|
|
|
— |
|
|
|
— |
|
|
|
— |
|
Forfeitures of restricted stock |
|
|
(36 |
) |
|
|
— |
|
|
|
— |
|
|
|
— |
|
|
|
— |
|
|
|
— |
|
|
|
— |
|
|
|
— |
|
|
|
— |
|
Share-based compensation related to stock appreciation rights and stock options |
|
|
— |
|
|
|
— |
|
|
|
— |
|
|
|
— |
|
|
|
4,031 |
|
|
|
— |
|
|
|
— |
|
|
|
— |
|
|
|
4,031 |
|
Issuance of deferred stock units to Board of Directors |
|
|
74 |
|
|
|
— |
|
|
|
— |
|
|
|
— |
|
|
|
808 |
|
|
|
— |
|
|
|
— |
|
|
|
— |
|
|
|
808 |
|
Equity-based compensation tax benefit |
|
|
— |
|
|
|
— |
|
|
|
— |
|
|
|
— |
|
|
|
332 |
|
|
|
— |
|
|
|
— |
|
|
|
— |
|
|
|
332 |
|
Noncontrolling owners share of AOCI of consolidated subsidiary |
|
|
— |
|
|
|
— |
|
|
|
— |
|
|
|
— |
|
|
|
— |
|
|
|
— |
|
|
|
(19 |
) |
|
|
19 |
|
|
|
— |
|
Net unrealized appreciation in marketable securities and reclassification
adjustments |
|
|
— |
|
|
|
— |
|
|
|
— |
|
|
|
— |
|
|
|
— |
|
|
|
— |
|
|
|
21,953 |
|
|
|
— |
|
|
|
21,953 |
|
Net income (loss) |
|
|
— |
|
|
|
— |
|
|
|
— |
|
|
|
— |
|
|
|
— |
|
|
|
(23,607 |
) |
|
|
— |
|
|
|
468 |
|
|
|
(23,139 |
) |
|
|
|
|
|
|
|
|
|
|
|
|
|
|
|
|
|
|
|
|
|
|
|
|
|
|
|
|
|
|
|
|
|
|
|
|
|
|
|
|
|
|
|
|
|
|
|
|
|
|
|
|
|
|
|
|
|
|
|
|
|
|
|
|
|
Balance as of December 31, 2007 |
|
|
38,651 |
|
|
|
39 |
|
|
|
— |
|
|
|
— |
|
|
|
3,564,268 |
|
|
|
(3,344,496 |
) |
|
|
84,847 |
|
|
|
5,143 |
|
|
|
309,801 |
|
Share-based compensation expense related to restricted stock |
|
|
— |
|
|
|
— |
|
|
|
— |
|
|
|
— |
|
|
|
1,577 |
|
|
|
— |
|
|
|
— |
|
|
|
— |
|
|
|
1,577 |
|
Impact of partner company equity transactions (Note 3) |
|
|
— |
|
|
|
— |
|
|
|
— |
|
|
|
— |
|
|
|
(629 |
) |
|
|
— |
|
|
|
— |
|
|
|
331 |
|
|
|
(298 |
) |
Issuance of restricted stock |
|
|
36 |
|
|
|
— |
|
|
|
— |
|
|
|
— |
|
|
|
— |
|
|
|
— |
|
|
|
— |
|
|
|
— |
|
|
|
— |
|
Surrenders of restricted stock |
|
|
(17 |
) |
|
|
— |
|
|
|
— |
|
|
|
— |
|
|
|
(87 |
) |
|
|
— |
|
|
|
— |
|
|
|
— |
|
|
|
(87 |
) |
Share-based compensation related to stock appreciation rights and stock options |
|
|
— |
|
|
|
— |
|
|
|
— |
|
|
|
— |
|
|
|
4,167 |
|
|
|
— |
|
|
|
— |
|
|
|
— |
|
|
|
4,167 |
|
Exercise of stock appreciation rights, net of surrenders |
|
|
3 |
|
|
|
— |
|
|
|
— |
|
|
|
— |
|
|
|
(6 |
) |
|
|
— |
|
|
|
— |
|
|
|
— |
|
|
|
(6 |
) |
Issuance of deferred stock units to Board of Directors |
|
|
30 |
|
|
|
— |
|
|
|
— |
|
|
|
— |
|
|
|
616 |
|
|
|
— |
|
|
|
— |
|
|
|
— |
|
|
|
616 |
|
Repurchase of common stock |
|
|
— |
|
|
|
— |
|
|
|
(1,948 |
) |
|
|
(9,329 |
) |
|
|
— |
|
|
|
— |
|
|
|
— |
|
|
|
— |
|
|
|
(9,329 |
) |
Noncontrolling owners share of AOCI of consolidated subsidiary |
|
|
— |
|
|
|
— |
|
|
|
— |
|
|
|
— |
|
|
|
— |
|
|
|
— |
|
|
|
117 |
|
|
|
(117 |
) |
|
|
— |
|
2008 LP capital contribution |
|
|
— |
|
|
|
— |
|
|
|
— |
|
|
|
— |
|
|
|
13 |
|
|
|
— |
|
|
|
— |
|
|
|
— |
|
|
|
13 |
|
Net unrealized depreciation in marketable securities and reclassification
adjustments |
|
|
— |
|
|
|
— |
|
|
|
— |
|
|
|
— |
|
|
|
— |
|
|
|
— |
|
|
|
(30,662 |
) |
|
|
— |
|
|
|
(30,662 |
) |
Net income (loss) |
|
|
— |
|
|
|
— |
|
|
|
— |
|
|
|
— |
|
|
|
— |
|
|
|
(22,926 |
) |
|
|
— |
|
|
|
1,960 |
|
|
|
(20,966 |
) |
|
|
|
|
|
|
|
|
|
|
|
|
|
|
|
|
|
|
|
|
|
|
|
|
|
|
|
|
|
|
|
|
|
|
|
|
|
|
|
|
|
|
|
|
|
|
|
|
|
|
|
|
|
|
|
|
|
|
|
|
|
|
|
|
|
Balance as of December 31, 2008 |
|
|
38,703 |
|
|
|
39 |
|
|
|
(1,948 |
) |
|
|
(9,329 |
) |
|
|
3,569,919 |
|
|
|
(3,367,422 |
) |
|
|
54,302 |
|
|
|
7,317 |
|
|
|
254,826 |
|
Share-based compensation expense related to restricted stock |
|
|
— |
|
|
|
— |
|
|
|
— |
|
|
|
— |
|
|
|
256 |
|
|
|
— |
|
|
|
— |
|
|
|
— |
|
|
|
256 |
|
Impact of partner company equity transactions (Note 3) |
|
|
— |
|
|
|
— |
|
|
|
— |
|
|
|
— |
|
|
|
331 |
|
|
|
— |
|
|
|
— |
|
|
|
2,115 |
|
|
|
2,446 |
|
Issuance of restricted stock |
|
|
24 |
|
|
|
— |
|
|
|
— |
|
|
|
— |
|
|
|
— |
|
|
|
— |
|
|
|
— |
|
|
|
— |
|
|
|
— |
|
Surrenders of restricted stock |
|
|
(1 |
) |
|
|
— |
|
|
|
— |
|
|
|
— |
|
|
|
(8 |
) |
|
|
— |
|
|
|
— |
|
|
|
— |
|
|
|
(8 |
) |
Share-based compensation related to stock appreciation rights and stock options |
|
|
— |
|
|
|
— |
|
|
|
— |
|
|
|
— |
|
|
|
2,633 |
|
|
|
— |
|
|
|
— |
|
|
|
— |
|
|
|
2,633 |
|
Issuance of deferred stock units to Board of Directors |
|
|
70 |
|
|
|
— |
|
|
|
— |
|
|
|
— |
|
|
|
202 |
|
|
|
— |
|
|
|
— |
|
|
|
— |
|
|
|
202 |
|
Repurchase of common stock |
|
|
— |
|
|
|
— |
|
|
|
(492 |
) |
|
|
(2,702 |
) |
|
|
— |
|
|
|
— |
|
|
|
— |
|
|
|
— |
|
|
|
(2,702 |
) |
Noncontrolling owners share of AOCI of consolidated subsidiary |
|
|
— |
|
|
|
— |
|
|
|
— |
|
|
|
— |
|
|
|
— |
|
|
|
— |
|
|
|
(70 |
) |
|
|
70 |
|
|
|
— |
|
2009 LP capital contribution |
|
|
— |
|
|
|
— |
|
|
|
— |
|
|
|
— |
|
|
|
14 |
|
|
|
— |
|
|
|
— |
|
|
|
— |
|
|
|
14 |
|
Net unrealized depreciation in marketable securities and reclassification
adjustments |
|
|
— |
|
|
|
— |
|
|
|
— |
|
|
|
— |
|
|
|
— |
|
|
|
— |
|
|
|
16,966 |
|
|
|
— |
|
|
|
16,966 |
|
Net income (loss) |
|
|
— |
|
|
|
— |
|
|
|
— |
|
|
|
— |
|
|
|
— |
|
|
|
15,534 |
|
|
|
— |
|
|
|
12,995 |
|
|
|
28,529 |
|
|
|
|
|
|
|
|
|
|
|
|
|
|
|
|
|
|
|
|
|
|
|
|
|
|
|
|
|
|
|
|
|
|
|
|
|
|
|
|
|
|
|
|
|
|
|
|
|
|
|
|
|
|
|
|
|
|
|
|
|
|
|
|
|
|
Balance as of December 31, 2009 |
|
|
38,796 |
|
|
$ |
39 |
|
|
|
(2,440 |
) |
|
$ |
(12,031 |
) |
|
$ |
3,573,347 |
|
|
$ |
(3,351,888 |
) |
|
$ |
71,198 |
|
|
$ |
22,497 |
|
|
$ |
303,162 |
|
|
|
|
|
|
|
|
|
|
|
|
|
|
|
|
|
|
|
|
|
|
|
|
|
|
|
|
|
See accompanying notes to Consolidated Financial Statements.
39
INTERNET CAPITAL GROUP, INC.
CONSOLIDATED STATEMENTS OF COMPREHENSIVE INCOME (LOSS)
| |
|
|
|
|
|
|
|
|
|
|
|
|
| |
|
Year Ended December 31, |
|
| |
|
2009 |
|
|
2008 |
|
|
2007 |
|
| |
|
(in thousands) |
|
|
|
|
|
|
|
|
|
|
|
|
|
|
Net income (loss) |
|
$ |
28,529 |
|
|
$ |
(20,966 |
) |
|
$ |
(23,139 |
) |
|
|
|
|
|
|
|
|
|
|
Other comprehensive income (loss) |
|
|
|
|
|
|
|
|
|
|
|
|
Unrealized holding gains (losses) in marketable
securities |
|
|
38,251 |
|
|
|
(30,028 |
) |
|
|
22,333 |
|
Reclassification adjustments/realized net
(gains) loss on marketable securities |
|
|
(21,285 |
) |
|
|
(634 |
) |
|
|
(380 |
) |
Other accumulated other comprehensive income (loss) |
|
|
(70 |
) |
|
|
117 |
|
|
|
(19 |
) |
|
|
|
|
|
|
|
|
|
|
Comprehensive income (loss) |
|
|
45,425 |
|
|
|
(51,511 |
) |
|
|
(1,205 |
) |
Less:
Comprehensive income attributable to the noncontrolling interest |
|
|
12,925 |
|
|
|
2,077 |
|
|
|
449 |
|
|
|
|
|
|
|
|
|
|
|
|
|
|
|
|
|
|
|
|
|
|
|
|
Comprehensive income (loss) attributable to Internet Capital Group, Inc. |
|
$ |
32,500 |
|
|
$ |
(53,588 |
) |
|
$ |
(1,654 |
) |
|
|
|
|
|
|
|
|
|
|
See accompanying notes to Consolidated Financial Statements.
40
INTERNET CAPITAL GROUP, INC.
CONSOLIDATED STATEMENTS OF CASH FLOWS
| |
|
|
|
|
|
|
|
|
|
|
|
|
| |
|
Year Ended December 31, |
|
| |
|
2009 |
|
|
2008 |
|
|
2007 |
|
| |
|
(in thousands) |
|
|
|
|
|
|
|
|
|
|
|
|
|
|
Operating Activities |
|
|
|
|
|
|
|
|
|
|
|
|
Net income (loss) |
|
$ |
28,529 |
|
|
$ |
(20,966 |
) |
|
$ |
(23,139 |
) |
Income
(loss) from discontinued operations |
|
|
— |
|
|
|
— |
|
|
|
995 |
|
Income
(loss) on continuing operations |
|
|
28,529 |
|
|
|
(20,966 |
) |
|
|
(24,134 |
) |
Adjustments to reconcile net loss to cash used in operating activities: |
|
|
|
|
|
|
|
|
|
|
|
|
Depreciation and amortization |
|
|
1,747 |
|
|
|
1,858 |
|
|
|
1,502 |
|
Impairment related and other |
|
|
5,021 |
|
|
|
9,392 |
|
|
|
59 |
|
Equity-based compensation |
|
|
3,851 |
|
|
|
7,090 |
|
|
|
7,781 |
|
Equity loss |
|
|
12,131 |
|
|
|
33,702 |
|
|
|
14,416 |
|
Other (income) loss |
|
|
(16,580 |
) |
|
|
(43,225 |
) |
|
|
(6,830 |
) |
Deferred income tax benefit |
|
|
(28,871 |
) |
|
|
— |
|
|
|
— |
|
Changes in assets and liabilities, net of effect of acquisitions: |
|
|
|
|
|
|
|
|
|
|
|
|
Accounts receivable, net |
|
|
(4,083 |
) |
|
|
(6,409 |
) |
|
|
(1,452 |
) |
Income tax receivable |
|
|
(10,627 |
) |
|
|
(444 |
) |
|
|
— |
|
Prepaid expenses and other assets |
|
|
(71 |
) |
|
|
4,130 |
|
|
|
(4,526 |
) |
Accounts payable |
|
|
(349 |
) |
|
|
618 |
|
|
|
486 |
|
Accrued expenses |
|
|
1,786 |
|
|
|
(126 |
) |
|
|
(1,271 |
) |
Deferred revenue |
|
|
(1,472 |
) |
|
|
1,672 |
|
|
|
(2,153 |
) |
Other liabilities |
|
|
9 |
|
|
|
323 |
|
|
|
(52 |
) |
|
|
|
|
|
|
|
|
|
|
Cash
provided by (used in) operating activities |
|
|
(8,979 |
) |
|
|
(12,385 |
) |
|
|
(16,174 |
) |
|
|
|
|
|
|
|
|
|
|
|
|
|
Investing Activities |
|
|
|
|
|
|
|
|
|
|
|
|
Capital expenditures |
|
|
(2,995 |
) |
|
|
(1,192 |
) |
|
|
(1,226 |
) |
Advanced deposits for acquisition of fixed assets |
|
|
274 |
|
|
|
(422 |
) |
|
|
— |
|
Proceeds from disposition of fixed assets |
|
|
— |
|
|
|
30 |
|
|
|
— |
|
Changes in restricted cash |
|
|
172 |
|
|
|
(27 |
) |
|
|
99 |
|
Proceeds from sales of marketable securities |
|
|
21,625 |
|
|
|
60,233 |
|
|
|
24 |
|
Proceeds from sales of Partner Company ownership interests |
|
|
2,607 |
|
|
|
3,267 |
|
|
|
34,725 |
|
Proceeds from sale of discontinued operations |
|
|
— |
|
|
|
— |
|
|
|
1,200 |
|
Acquisitions of ownership interests in Partner Companies |
|
|
(46,654 |
) |
|
|
(35,478 |
) |
|
|
(19,394 |
) |
Increase in cash due to consolidation of Partner Companies |
|
|
2,807 |
|
|
|
2,553 |
|
|
|
— |
|
Reduction in cash due to sale of subsidiary assets |
|
|
(81 |
) |
|
|
— |
|
|
|
— |
|
|
|
|
|
|
|
|
|
|
|
Cash
provided by (used in) investing activities |
|
|
(22,245 |
) |
|
|
28,964 |
|
|
|
15,428 |
|
|
|
|
|
|
|
|
|
|
|
|
|
|
Financing Activities |
|
|
|
|
|
|
|
|
|
|
|
|
Repurchase of senior convertible notes |
|
|
— |
|
|
|
— |
|
|
|
(37,087 |
) |
Borrowings of long-term debt |
|
|
— |
|
|
|
1,500 |
|
|
|
— |
|
Long term debt and capital lease obligations, net |
|
|
(150 |
) |
|
|
(696 |
) |
|
|
(873 |
) |
Line of credit repayments |
|
|
(115 |
) |
|
|
(68 |
) |
|
|
— |
|
Share repurchases |
|
|
(2,702 |
) |
|
|
(9,329 |
) |
|
|
— |
|
Other financing activities |
|
|
32 |
|
|
|
— |
|
|
|
— |
|
|
|
|
|
|
|
|
|
|
|
Cash provided by (used in) financing activities |
|
|
(2,935 |
) |
|
|
(8,593 |
) |
|
|
(37,960 |
) |
Net increase (decrease) in Cash and Cash Equivalents |
|
|
(34,159 |
) |
|
|
7,986 |
|
|
|
(38,706 |
) |
Effect of exchange rates on cash |
|
|
345 |
|
|
|
(722 |
) |
|
|
(71 |
) |
Cash and Cash Equivalents at the beginning of year |
|
|
89,295 |
|
|
|
82,031 |
|
|
|
120,808 |
|
|
|
|
|
|
|
|
|
|
|
Cash and Cash Equivalents at end of year |
|
$ |
55,481 |
|
|
$ |
89,295 |
|
|
$ |
82,031 |
|
|
|
|
|
|
|
|
|
|
|
|
|
|
|
|
|
|
|
|
|
|
|
|
Supplemental disclosures of cash flow information: |
|
|
|
|
|
|
|
|
|
|
|
|
Cash paid during the year for: |
|
|
|
|
|
|
|
|
|
|
|
|
Interest |
|
$ |
164 |
|
|
$ |
309 |
|
|
$ |
539 |
|
Income tax payments (refunds), net |
|
$ |
794 |
|
|
$ |
(4,317 |
) |
|
|
— |
|
See accompanying notes to Consolidated Financial Statements.
41
INTERNET CAPITAL GROUP, INC.
NOTES TO CONSOLIDATED FINANCIAL STATEMENTS
1. The Company
Description of the Company
Internet Capital Group, Inc. (the “Company”) acquires and builds Internet software and services
companies that improve the productivity and efficiency of their business customers. Founded in
1996, the Company devotes its expertise and capital to maximizing the success of these companies.
Although the Company refers to companies in which it has acquired a convertible debt or an equity
ownership interest as its “partner companies” and indicates that it has a “partnership” with these
companies, it does not act as an agent or legal representative for any of its partner companies, it
does not have the power or authority to legally bind any of its partner companies and it does not
have the types of liabilities in relation to its partner companies that a general partner of a
partnership would have.
2. Significant Accounting Policies
Basis of Presentation
The Consolidated Financial Statements include the accounts of the Company and its wholly-owned
subsidiaries. The Consolidated Financial Statements also include the following majority-owned
subsidiaries for all or a portion of the periods indicated, each of which has been consolidated
since the date the Company acquired majority voting control (collectively, the “Consolidated
Subsidiaries”).
The Consolidated Statements of Operations include the results of the following majority-owned
subsidiaries:
| |
|
|
|
|
| Year Ended December 31, |
| 2009 |
|
2008 |
|
2007 |
ICG Commerce
|
|
ICG Commerce
|
|
ICG Commerce |
InvestorForce
|
|
InvestorForce
|
|
InvestorForce |
Vcommerce (1)
|
|
Vcommerce (1) |
|
|
The Consolidated Balance Sheets include the following majority-owned subsidiaries:
| |
|
|
| December 31, |
| 2009 |
|
2008 |
GovDelivery (2)
|
|
ICG Commerce |
ICG Commerce
|
|
InvestorForce |
InvestorForce
|
|
Vcommerce (1) |
| |
|
|
| (1) |
|
On May 1, 2008, Vcommerce became a consolidated partner company when the
Company’s voting interest increased to 53%. Vcommerce’s results of operations are included in
the Company’s Consolidated Statements of Operations beginning May 1, 2008. On August 28,
2009, substantially all of Vcommerce’s assets were sold to Channel Intelligence, and Vcommerce
is not included in the Company’s Consolidated Financial Statements subsequent to that date.
See Note 3, “Ownership Interests in Partner Companies, Goodwill and Intangibles, net.” |
| |
| (2) |
|
On December 31, 2009, the Company acquired 89% of GovDelivery and began
consolidating the financial position of GovDelivery as of that date. See Note 3, “Ownership
Interests in Partner Companies, Goodwill and Intangibles, net.” |
42
INTERNET CAPITAL GROUP, INC.
NOTES TO CONSOLIDATED FINANCIAL STATEMENTS — (Continued)
2. Significant Accounting Policies — (Continued)
Principles of Accounting for Ownership Interests in Partner Companies
The
various interests that the Company acquires in its partner companies
are accounted for under one of
three methods: the consolidation method, the equity method and the cost method. The applicable
accounting method is generally determined based on the Company’s voting interest in a partner
company.
Consolidation. Partner companies in which the Company directly or indirectly owns more than 50% of
the outstanding voting securities, and for which other stockholders do not possess the right to
affect significant operational management decisions, are accounted for under the consolidation method of
accounting. Under this method, a partner company’s balance sheet and results of operations are
reflected within the Company’s Consolidated Financial Statements, and all significant intercompany
accounts and transactions have been eliminated. Participation of other partner company
stockholders in the net assets and in the earnings or losses of a consolidated partner company is
reflected in the caption “Noncontrolling interest” in the Company’s Consolidated Balance Sheets and
Statements of Operations. Noncontrolling interest adjusts the Company’s consolidated results of
operations to reflect only the Company’s share of the earnings or losses of the consolidated
partner company. The results of operations and cash flows of a consolidated partner company are
included through the latest interim period in which the Company owned a greater than 50% direct or
indirect voting interest for the entire interim period or otherwise exercised control over the
partner company. Upon a reduction of the Company’s ownership interest to below 50% of the
outstanding voting securities, the accounting method is adjusted to the equity or cost method of
accounting, as appropriate, for subsequent periods.
Equity Method. Partner companies that are not consolidated, but over which the Company exercises
significant influence, are accounted for under the equity method of accounting. Whether or not the
Company exercises significant influence with respect to a partner company depends on an evaluation
of several factors, including, among others, representation on the partner company’s board of
directors and ownership level, which is generally between a 20% and a 50% interest in the voting
securities of the partner company, as well as voting rights associated with the Company’s holdings
in common stock, preferred stock and other convertible instruments in the partner company. Under
the equity method of accounting, a partner company’s accounts are not reflected within the
Company’s Consolidated Balance Sheets and Statements of Operations. The Company’s share of the
earnings or losses of the partner company, as well as any adjustments resulting from prior period
finalizations of equity income/losses, are reflected in the caption “Equity loss” in the
Consolidated Statements of Operations. In 2009, those prior period finalizations are not material.
The carrying values of the Company’s equity method partner companies are reflected in “Ownership
interests in partner companies” in the Company’s Consolidated Balance Sheets.
When the Company’s interest in an equity method partner company is reduced to zero, no further
losses are recorded in the Company’s Consolidated Financial Statements, unless the Company has
guaranteed obligations of the partner company or has committed to additional funding. When the
partner company subsequently reports income, the Company will not record its share of such income
until it equals the amount of its share of losses not previously recognized.
Cost Method. Partner companies not accounted for under the consolidation or the equity method of
accounting are accounted for under the cost method of accounting. The Company’s share of the
earnings or losses of cost method companies is not included in the Consolidated Balance Sheets or
Consolidated Statements of Operations. However, cost method partner company impairment charges are
recognized in the Consolidated Statements of Operations. If circumstances suggest that the value
of the partner company has subsequently recovered, such recovery is not recorded.
When a cost method partner company qualifies for use of the equity method, the Company’s interest
is adjusted retroactively for its share of the past results of its operations. Therefore, prior
losses could significantly decrease the Company’s carrying value balance at that time.
43
INTERNET CAPITAL GROUP, INC.
NOTES TO CONSOLIDATED FINANCIAL STATEMENTS — (Continued)
2. Significant Accounting Policies — (Continued)
The Company records its ownership interest in equity securities of partner companies accounted for
under the cost method at cost, unless these securities have readily determinable fair values based
on quoted market prices, in which case these interests are valued at fair value and classified as
marketable securities or some other classification in accordance with guidance for ownership
interests in debt and equity securities.
Use of Estimates
The preparation of financial statements in conformity with GAAP requires management to make
estimates and assumptions that affect the amounts reported in the financial statements and
accompanying notes. Actual results could differ from these estimates. These estimates include
evaluation of the Company’s holdings in its partner companies, holdings in marketable securities,
asset impairment, revenue recognition, income taxes and commitments and contingencies. These
estimates and assumptions are based on management’s best judgments. Management evaluates its
estimates and assumptions on an ongoing basis using historical experience and other factors,
including the current economic environment, which management believes to be reasonable under the
circumstances. Management adjusts such estimates and assumptions when facts and circumstances
dictate. Volatile equity markets and reductions in information technology spending have combined
to increase the uncertainty inherent in such estimates and assumptions. It is reasonably possible
that the Company’s accounting estimates with respect to the useful life of intangible assets and
the ultimate recoverability of ownership interests in partner companies and goodwill could change
in the near term and that the effect of such changes on the Company’s financial statements could be
material. The Company believes the recorded amount of ownership interests in partner companies and
goodwill is not impaired at December 31, 2009.
Ownership Interests in partner companies, Goodwill and Intangibles, net
The
Company tests goodwill for impairment annually, or more frequently as conditions
warrant, and intangible assets when events or changes in circumstances indicate that the carrying
amount of an asset may not be recoverable. Additionally, the Company evaluates
its equity method ownership interests in partner companies to determine whether an other than
temporary decline in the carrying value of a partner company exists and should be recognized.
The Company continually evaluates the carrying value of its
ownership interest in each of its
partner companies for possible impairment based on achievement of business plan objectives and
milestones, the fair value of each ownership interest in the partner company relative to carrying value,
the financial condition and prospects of the partner company, and other relevant factors. The
business plan objectives and milestones the Company considers include, among others, those related
to financial performance, such as achievement of planned financial results or completion of capital
raising activities, and those that are not primarily financial in nature, such as obtaining key
business partnerships or the hiring of key employees. Impairment charges are determined by
comparing the estimated fair value of our ownership interest in a partner company with its carrying value. Fair value is
determined by using a combination of estimating the cash flows related to the relevant asset,
including estimated proceeds on disposition, and an analysis of market price multiples of companies
engaged in lines of business similar to the company being evaluated.
The Company’s policy is to perform ongoing business reviews for all partner companies and goodwill
impairment tests annually in the fourth quarter of each fiscal year, or more frequently if
conditions warrant. At various times during the year ended December 31, 2009, the Company
determined that impairment analyses were warranted with respect to certain partner companies. As a
result of these analyses, the Company recorded impairment charges of $5.4 million during the year
ended December 31, 2009. Of this amount, approximately $4.9 million was related to the impairment
of goodwill associated with Vcommerce, and the remaining $0.5 million was an impairment charge
recorded in the first quarter to the basis of GoIndustry. The Company performed its annual
impairment test during the fourth quarter of 2009 and concluded that the carrying value of its
ownership interest in partner companies, goodwill and net intangible assets did not require further
impairment as of December 31, 2009. At December 31, 2009, the Company’s carrying value of its
ownership interests in partner companies totaled $97.8 million, goodwill
totaled $20.6 million and intangibles, net totaled $15.9 million. See Note 3, “Ownership Interests
in Partner Companies, Goodwill and Intangibles, net” for additional information regarding our
ownership interest in partner companies, goodwill and intangibles, net and related impairment
charges.
44
INTERNET CAPITAL GROUP, INC.
NOTES TO CONSOLIDATED FINANCIAL STATEMENTS — (Continued)
2. Significant Accounting Policies — (Continued)
Revenue Recognition
During 2009, the Company’s consolidated revenues were primarily attributable to ICG Commerce.
During 2008, the Company’s consolidated revenues were primarily attributable to ICG Commerce and
Vcommerce. During 2007, the Company’s consolidated revenues were primarily attributable to ICG
Commerce.
ICG Commerce generates revenue from sourcing consulting and procurement outsourcing services.
Procurement outsourcing services generally include a combination of services and technology
designed to help companies achieve unit cost savings and process efficiencies. ICG Commerce earns
fees for implementation services, start-up services, content and category management (which may
include sourcing as described below), hosting fees, buying center management fees, and certain
transaction fees. ICG Commerce estimates the total contract value under these arrangements and
generally recognizes revenue under these arrangements, excluding transaction fees and gain-share
fees, on a straight-line basis over the term of the contract, which
approximates the life of the customer relationship. Additionally, performance based/gain share fees are deferred until the
contingency is achieved or it is determined from existing data and past experience that the savings
will be achieved, and then generally recognized on a straight-line basis over the life of the
contract, which approximates the life of the
customer relationship. Sourcing programs are engagements in which ICG Commerce negotiates prices from certain
suppliers on behalf of its customers in certain categories in which ICG Commerce has sourcing
expertise. Under sourcing programs, either the customer pays a fixed-fee or a gain-share amount for
use of the negotiated rates. In fixed-fee sourcing arrangements, revenue is recognized on a
proportional performance basis, provided that there is no uncertainty as to ICG Commerce’s ability
to fulfill its obligations under the contract or other services that are to be rendered under the
contract. Gain-share sourcing revenue is recognized when earned.
Vcommerce
generated revenue from service fees earned in connection with the development and
operation of its clients’ e-commerce businesses. Service fee
revenue primarily consisted of
transaction fees, implementation fees and professional services, as well as access and maintenance
fees. Vcommerce recognized revenue from services provided when the following revenue recognition
criteria were met: persuasive evidence of an arrangement existed, services
had been rendered, the
fee was fixed or determinable and collectibility is reasonably assured. Generally, Vcommerce
recognized revenue related to implementation as well as access and maintenance services over the
term of the customer contract, and transaction fees and professional
services as services were rendered.
Deferred Revenue
Deferred revenue consists primarily of payments received in advance of revenue being earned under
procurement sourcing arrangements and future implementation, professional services and transaction
fees.
Cash and Cash Equivalents
The Company considers all highly liquid instruments with an original maturity of 90 days or less at
the time of purchase to be cash equivalents. Cash and cash equivalents at December 31, 2009 and
2008 were invested principally in money market accounts.
Restricted Cash
The Company considers cash that is legally restricted and cash that is held as a compensating
balance for letter of credit arrangements as restricted cash. At December 31, 2009 and 2008,
restricted cash was held primarily in money market accounts. The Company had no long-term
restricted cash at December 31, 2009.
45
INTERNET CAPITAL GROUP, INC.
NOTES TO CONSOLIDATED FINANCIAL STATEMENTS — (Continued)
2. Significant Accounting Policies — (Continued)
Marketable Securities
Marketable securities are reported at fair value, based on quoted market prices, with the net
unrealized gain or loss reported as a component of “Accumulated
other comprehensive income” in Internet Capital Group. Inc.’s
Stockholders’ Equity.
Financial Instruments
Cash and cash equivalents, accounts receivable and accounts payable are carried at cost, which
approximates fair value due to the short-term maturity of these instruments. Marketable securities
are carried at fair value.
Research and Development
Research and development costs are charged to expense as incurred.
Income Taxes
Income taxes are accounted for under the asset and liability method, whereby deferred tax assets
and liabilities are recognized for the estimated future tax consequences attributable to
differences between the financial statement carrying amounts of existing assets and liabilities and
their respective tax bases. Deferred tax assets and liabilities are measured using enacted tax
rates in effect for the year in which the temporary differences are expected to be recovered or
settled. The effect on deferred tax assets and liabilities of a change in tax rates is recognized
in income in the period that includes the enactment date.
Net Income (Loss) Per Share
Basic net income (loss) per share (“EPS”) is computed using the weighted average number of common
shares outstanding during each period. Diluted EPS includes shares, unless anti-dilutive, that
would arise from the exercise of stock options and conversion of other convertible securities and
is adjusted, if applicable, for the effect on net income (loss) of such transactions. In 2009, the Company included all quarters for purposes of the year to date net
income included in the diluted EPS calculation. Because the Company incurred losses for 2008
and 2007, the effects of potentially dilutive securities are not included, as they would be
anti-dilutive. See Note 16, “Net Income (Loss) per Share.”
Issuances of Stock by Partner Companies
The effects of any changes in the Company’s ownership interest resulting from the issuance of
equity interests by a partner company accounted for under the consolidation or equity method of
accounting are accounted for in accordance with guidance for accounting for the sales of stock of a
subsidiary. In 2008 and 2007, this guidance required the difference between the carrying amount of the Company’s
investment in the partner company and the underlying net book value of the partner company after
the issuance of stock by the partner company be reflected as either a gain or loss in the Company’s
Consolidated Statements of Operations if the appropriate recognition criteria has been met or
reflected as an equity transaction in the Company’s Consolidated
Statements of Changes in
Equity. All such gains
and losses related to the issuance of equity interests by partner
companies for the years ended
December 31, 2008 and 2007 have been recorded in the Company’s Consolidated Statements of
changes in Equity. In 2009, the guidance requires the difference
between the carrying value of the Company’s investment in the
partner company and the underlying net book value of the partner
company after the issuance of stock by the partner company to be
reflected as an equity transaction in the Company’s Consolidated
Statements of Changes in Equity for consolidated partner companies
and to be reflected as a gain or loss in the Company’s Consolidated
Statements of Operations for equity method partner companies. During the year ended
December 31, 2009, net losses of $0.3 million were recorded in the
Company’s Statement of Operations, and net gains of $0.3 million were recorded in
the Company’s
Consolidated Statements of changes in Equity. See Note 3, “Ownership Interests in Partner Companies, Goodwill and
Intangibles, net.”.
46
INTERNET CAPITAL GROUP, INC.
NOTES TO CONSOLIDATED FINANCIAL STATEMENTS — (Continued)
2. Significant Accounting Policies — (Continued)
Escrowed Proceeds
When an interest in one of the Company’s partner companies is sold, a portion of the sale
consideration may be held in escrow primarily to satisfy purchase price adjustments and/or
indemnity claims. The Company records escrow arrangements at the time the Company is entitled to
the escrow proceeds, the amount is fixed or determinable and realization is assured. At December
31, 2009, the Company has aggregate contingent gains of $9.3 million associated with these
outstanding escrows, which are scheduled to expire at various dates within the next three years, subject
to indemnity claims pursuant to the terms of the specific sale agreements. See Note 3, “Ownership
Interests in Partner Companies, Goodwill and Intangibles, net.”
Concentration of Customer Base and Credit Risk
For the year ended December 31, 2009, two customers of ICG Commerce, The Hertz Corporation and
Kimberly-Clark Corporation, each represented approximately 13% of ICG’s consolidated revenue. For
the year ended December 31, 2008, these two customers each represented approximately 17% of ICG’s
consolidated revenue. For the year ended December 31, 2007, Kimberly-Clark Corporation and another
customer of ICG Commerce, The Goodyear Tire & Rubber Company, represented approximately 24% and
10%, respectively, of ICG’s consolidated revenue. Accounts receivable from The Hertz Corporation
and Kimberly-Clark Corporation as of December 31, 2009 were $1.7 million and $1.5 million,
respectively. Accounts receivable from The Hertz Corporation and Kimberly-Clark Corporation as of
December 31, 2008 were $2.9 million and $1.4 million, respectively. The accounts receivable
balances as of December 31, 2009 for The Hertz Corporation and Kimberly-Clark Corporation includes
$0.2 million and $0.1 million, respectively, of unbilled accounts receivable. The accounts
receivable balances as of December 31, 2008 for The Hertz Corporation and Kimberly-Clark
Corporation include $1.2 million and $0.3 million, respectively, of unbilled accounts receivable.
Equity-Based Compensation
We
recognize equity-based compensation expense in our Consolidated Financial Statements for all share options and other equity-based
arrangements that are expected to vest. Equity-based compensation
expense is measured at
the date of grant, based on the fair value of the award, and is recognized over the employee’s
requisite service period.
Comprehensive Income (Loss)
The Company reports and displays comprehensive income (loss) and its components in the Consolidated
Statements of Comprehensive Income (loss). Comprehensive income (loss) is the change in equity of
a business enterprise during a period from non-owner sources. In
addition to net income (loss), the
Company’s sources of comprehensive income (loss) are from net unrealized appreciation on its
marketable securities and foreign currency translation adjustments. Reclassification adjustments
result from the recognition of gains or losses in net income that were included in comprehensive
income (loss) in prior periods.
Reclassifications
Certain amounts in the prior-year financial statements have been reclassified to conform with the
current-year presentation.
47
INTERNET CAPITAL GROUP, INC.
NOTES TO CONSOLIDATED FINANCIAL STATEMENTS — (Continued)
2. Significant Accounting Policies — (Continued)
Recent Accounting Pronouncements
In January 2010, the FASB issued amended guidance requiring additional fair value disclosures
related to inputs and valuation techniques used to measure fair value as well as disclosures about
significant transfers between levels in the hierarchy of fair value measurement. This guidance is
effective for the Company beginning on January 1, 2010, and is not expected to have a significant
impact on its consolidated financial statements.
In
October 2009, the FASB issued accounting guidance related to
revenue recognition for transactions with multiple
deliverables, which impacts the determination of when the individual deliverables included in a
multiple-element arrangement may be treated as separate units of accounting. This guidance is
effective for the Company beginning on January 1, 2011. The Company is currently evaluating the
effect this guidance will have on its consolidated financial statements.
In October 2009, the FASB issued accounting guidance related to certain revenue arrangements that
include software elements, which amends the scope of pre-existing software revenue guidance. This
guidance is effective for the Company beginning on January 1, 2011. The Company is currently
evaluating the effect this guidance will have on its consolidated financial statements.
In June 2009, the FASB released the Accounting Standards Codification (“ASC”), which became the
single source of authoritative nongovernmental GAAP, superseding existing accounting literature.
The ASC became effective for the Company beginning with the interim
period ended September 30,
2009. The adoption of the ASC resulted in the revision of the Company’s disclosures to eliminate
all references to pre-ASC standards.
In June 2009, the FASB issued accounting guidance that requires former “qualifying special-purpose
entities” to be evaluated for consolidation, changes the approach to determining a variable
interest entity’s primary beneficiary and revises the frequency with which reassessments of this
determination should be made, and requires additional disclosures related to these items. This
guidance is effective for the Company beginning on January 1, 2010, and is not expected to have a
significant impact on its consolidated financial statements.
In May 2009, the FASB issued new guidance for accounting for subsequent events, which establishes
general standards of accounting for and disclosures of events that occur after the balance sheet
date but before financial statements are issued or are available to be issued. In particular, this
guidance establishes that entities must evaluate subsequent events through the date the financial
statements are issued, the circumstances under which a subsequent event should be recognized, and
the circumstances for which a subsequent event should be disclosed. This guidance became effective
for the Company beginning with the interim period ended June 30, 2009. The adoption of this
guidance did not have a significant impact on the Company’s consolidated financial statements.
In April 2009, the FASB issued guidance requiring disclosures about fair value of financial
instruments for interim reporting periods of publicly traded companies as well as in annual
financial statements. This guidance became effective for the Company beginning with the interim
period ended June 30, 2009. The adoption of this guidance did not have a significant impact on the
Company’s consolidated financial statements.
48
INTERNET CAPITAL GROUP, INC.
NOTES TO CONSOLIDATED FINANCIAL STATEMENTS — (Continued)
2. Significant Accounting Policies — (Continued)
In April 2009, the FASB issued new guidance for the accounting of other-than-temporary impairments,
which is intended to bring greater consistency to the timing of impairment recognition and provide
greater clarity to investors about the credit and noncredit components of impaired debt securities
that are not expected to be sold. This guidance also requires increased and timelier disclosures
regarding expected cash flows, credit losses and an aging of securities with unrealized losses.
This guidance became effective for the Company beginning with the interim period ended June 30,
2009. The adoption of this guidance did not have a significant impact on the Company’s
consolidated financial statements.
In April 2009, the FASB issued additional guidance for fair value measurement, specifically related
to determining the fair value of assets and liabilities when the volume and level of activity for
the asset/liability has significantly decreased and identifying circumstances that indicate a
transaction is not orderly. This guidance became effective for the Company beginning with the
interim period ended June 30, 2009. The adoption of this guidance did not have a significant
impact on the Company’s consolidated financial statements.
In November 2008, the FASB issued guidance that clarifies how to account for certain transactions
involving equity method companies. Specifically, it addresses the initial measurement, decreases
in value and changes in the level of ownership of equity method companies. This guidance became
effective for the Company beginning on January 1, 2009. The adoption of this guidance did not have
a material impact on the Company’s consolidated financial
statements. See Note 3, “Ownership Interests in Partner
Companies Goodwill and Intangibles, net.”
In June 2008, the FASB issued guidance clarifying the determination of whether an instrument (or an
embedded feature) is indexed to an entity’s own stock and would therefore qualify as a scope
exception to derivative accounting. This guidance became effective for the Company beginning on
January 1, 2009. The adoption of this guidance did not have a material impact on the Company’s
consolidated financial statements.
In May 2008, the FASB issued new guidance that requires the issuer of convertible debt instruments
with cash settlement features to separately account for the liability and equity components of the
instrument. In accordance with this guidance, the debt is recognized at the present value of its cash flows discounted using the
issuer’s nonconvertible debt borrowing rate. The equity component is recognized as the difference
between the proceeds from the issuance of the note and the fair value of the liability. This
guidance required retrospective application to all periods presented. This guidance was effective
for the Company beginning on January 1, 2009. The adoption of this guidance resulted in the
revision of the loss on the repurchase of the Senior convertible
notes included in “Other income (loss)” on the Company’s Consolidated Statement of
Operations for the year ended December 31, 2007, as well as a reclassification
between “Additional paid-in capital” and “Accumulated deficit” on the Company’s Consolidated
Balance Sheets in subsequent periods. The adoption is discussed further in Note 7, “Debt.”
In March 2008, the FASB issued new guidance on the disclosure of derivative instruments and hedging
activities. This guidance requires enhanced disclosures to enable financial statement users to
better understand the effects of derivatives and hedging on an entity’s financial position,
financial performance and cash flows. This guidance became effective for the Company beginning on
January 1, 2009. The adoption of this guidance did not have a material impact on the Company’s
consolidated financial statements.
In December 2007, the FASB issued revised guidance for the accounting for business combinations.
The revised guidance requires most identifiable assets, liabilities, noncontrolling interests and
goodwill acquired in a business combination to be recorded at “full fair value.” This guidance
is required to be applied prospectively to business combinations that occur after the effective date. This
guidance became effective
for the Company beginning on January 1, 2009. The adoption of this guidance did not have a
material impact on the Company’s consolidated financial statements.
49
INTERNET CAPITAL GROUP, INC.
NOTES TO CONSOLIDATED FINANCIAL STATEMENTS — (Continued)
2. Significant Accounting Policies — (Continued)
In December 2007, the FASB issued accounting guidance requiring noncontrolling interests
(previously referred to as minority interests) to be reported as a
separate component of equity and changed
the accounting for transactions with noncontrolling interest holders. This guidance became
effective for the Company beginning on January 1, 2009. The adoption of this guidance did not have
a material impact on the Company’s consolidated financial statements other than the presentation
of noncontrolling interests in our consolidated financial statements.
3. Ownership Interests in Partner Companies, Goodwill and Intangibles, net
The following table summarizes the Company’s goodwill, other intangibles, and ownership interests
in partner companies.
| |
|
|
|
|
|
|
|
|
| |
|
December 31, |
|
|
December 31, |
|
| |
|
2009 |
|
|
2008 |
|
| |
|
(in thousands) |
|
Goodwill |
|
$ |
20,588 |
|
|
$ |
26,658 |
|
|
|
|
|
|
|
|
|
|
|
|
|
|
|
|
|
Intangibles,
net of accumulated amortization of $0 (2009) and $205 (2008) |
|
$ |
15,940 |
|
|
$ |
713 |
|
|
|
|
|
|
|
|
|
|
|
|
|
|
|
|
|
Ownership interests in partner
companies — Equity Method |
|
$ |
97,777 |
|
|
$ |
83,751 |
|
|
|
|
|
|
|
|
The following table summarizes the activity related to Goodwill:
| |
|
|
|
|
Goodwill at December 31, 2007 |
|
$ |
17,084 |
|
Additional acquisition of Vcommerce |
|
|
17,978 |
|
Impairment of Vcommerce |
|
|
(8,264 |
) |
Reduction due to dilution of a consolidated partner company’s ownership |
|
|
(140 |
) |
|
|
|
|
Goodwill at December 31, 2008 |
|
|
26,658 |
|
Vcommerce activity (see subsection “Impairments — Consolidated
Company”) |
|
|
(9,714 |
) |
Increase due to acquisition of GovDelivery on December 31, 2009 |
|
|
3,644 |
|
|
|
|
|
Goodwill at December 31, 2009 |
|
$ |
20,588 |
|
|
|
|
|
As of December 31, 2009 and 2008, all of the Company’s goodwill
was allocated to the core segment.
Amortization expense for intangible
assets during the two years ended December 31, 2009 and 2008 was $0.2 million and
$0.2 million, respectively. The Company recorded no amortization expense
related to intangible assets during the year ended December 31, 2007. The Company amortizes
intangibles using the straight line method.
Remaining estimated amortization expense is as follows (in thousands):
| |
|
|
|
|
2010 |
|
$ |
1,456 |
|
2011 |
|
$ |
1,456 |
|
2012 |
|
$ |
1,456 |
|
2013 |
|
$ |
1,456 |
|
2014 |
|
$ |
1,456 |
|
Thereafter |
|
$ |
8,660 |
|
|
|
|
|
Remaining amortization expense |
|
$ |
15,940 |
|
|
|
|
|
50
INTERNET CAPITAL GROUP, INC.
NOTES TO CONSOLIDATED FINANCIAL STATEMENTS — (Continued)
3. Ownership Interests in Partner Companies, Goodwill and Intangibles, net — (Continued)
Acquisitions — Consolidated Company
On December 31, 2009, the Company acquired 89% of the equity of GovDelivery, which was accounted for under
the acquisition method. The Company has allocated the purchase price to the assets and the
liabilities based upon their respective fair values at the date of acquisition, which are as
follows:
| |
|
|
|
|
| |
|
GovDelivery |
|
|
|
|
|
|
Net assets acquired: |
|
|
|
|
Goodwill |
|
$ |
3,644 |
|
Customer lists (11 year life) |
|
|
13,910 |
|
Trademarks/trade names (11 year life) |
|
|
1,320 |
|
Technology
(10 year life) |
|
|
710 |
|
Other net assets (liabilities) |
|
|
1,506 |
|
|
|
|
|
|
|
|
21,090 |
|
Noncontrolling
interest(1) |
|
|
(1,420 |
) |
|
|
|
|
|
|
$ |
19,670 |
|
|
|
|
|
(1) The
Company determined the noncontrolling interest of GovDelivery with
consideration of discounts for lack of control and lack of
marketability.
Since GovDelivery was acquired on December 31, 2009, no results of GovDelivery’s operations
are included in the Company’s Consolidated Statement of
Operations for the year ended December 31, 2009. The following reflects unaudited selected pro forma financial
information had the Company consolidated GovDelivery for the full year ended December 31, 2009:
revenue, net income and net income per diluted share would have been
$99.6 million, $13.3 million
and $0.36 per diluted share, respectively.
During 2008, the Company acquired additional ownership in Vcommerce, which was accounted for under
the purchase method of accounting. The purchase price, including the carrying value of the
ownership interest for Vcommerce previously accounted for under the equity method, was
allocated to the assets and the liabilities based upon their respective fair values at the date of
the acquisition, as follows:
| |
|
|
|
|
| |
|
Vcommerce |
|
|
|
|
|
|
Net Assets Acquired: |
|
|
|
|
Goodwill |
|
$ |
17,978 |
|
Technology |
|
|
918 |
|
Other net assets (liabilities) |
|
$ |
(3,651 |
) |
|
|
|
|
|
|
$ |
15,245 |
|
|
|
|
|
Vcommerce was consolidated beginning May 1, 2008. The following reflects unaudited selected pro
forma financial information had the Company consolidated Vcommerce for the full year ended December
31, 2008: revenue, net loss and net loss per diluted share would have been $73.4 million, $(23.0)
million and $(0.60) per diluted share, respectively.
51
INTERNET CAPITAL GROUP, INC.
NOTES TO CONSOLIDATED FINANCIAL STATEMENTS — (Continued)
3. Ownership Interests in Partner Companies, Goodwill and Intangibles, net — (Continued)
Impairments
The Company completed its annual impairment testing in the fourth quarter of 2009. The Company
also performs ongoing business reviews of its partner companies. The following table reflects the
amounts of impairments recorded and how the Company presents impairment charges under the various
methods of accounting:
| |
|
|
|
|
|
|
|
|
|
|
|
|
|
|
| |
|
Statement of Operations |
|
Year Ended December 31, |
|
| |
|
Presentation |
|
2009 |
|
|
2008 |
|
|
2007 |
|
Consolidation Method |
|
Impairment related and other |
|
$ |
4,876 |
|
|
$ |
8,264 |
|
|
$ |
— |
|
Equity Method |
|
Equity loss |
|
|
544 |
|
|
|
10,204 |
|
|
|
— |
|
Cost Method
(Note 13) |
|
Other income (loss), net |
|
|
— |
|
|
|
4,735 |
|
|
|
— |
|
|
|
|
|
|
|
|
|
|
|
|
|
|
|
|
|
$ |
5,420 |
|
|
$ |
23,203 |
|
|
$ |
— |
|
|
|
|
|
|
|
|
|
|
|
|
|
Impairments — Consolidated Company
During 2009, the Company concluded that the estimated fair value of Vcommerce had declined.
Accordingly, the Company performed its goodwill impairment testing as described in Note 2,
“Significant Accounting Policies,” and recorded a goodwill impairment charge of $3.8 million
during the three months ended June 30, 2009. Subsequent to recording this impairment, in August 2009,
Channel Intelligence acquired substantially all of the assets and certain liabilities of Vcommerce.
As a result of this transaction, the Company recorded an additional impairment charge during the
three months ended September 30, 2009 in the amount of $1.1 million to eliminate the Company’s
remaining basis in Vcommerce, which has ceased operations. The Company has no future obligation
for Vcommerce’s liabilities and does not expect any future proceeds. Following the Channel Intelligence
transaction, Vcommerce’s residual assets and liabilities are immaterial and not included on the
Company’s Consolidated Balance Sheet at December 31, 2009, which resulted in the elimination of the
Company’s remaining goodwill balance and intangible assets related to Vcommerce of $4.8 million and $0.5 million, respectively
The completion of the
Company’s annual impairment testing did not result in any additional impairment charge related to
the Company’s consolidated partner companies as of December 31, 2009.
Equity Method Companies
The following unaudited summarized financial information relates to the Company’s partner companies
accounted for under the equity method of accounting at December 31, 2009 and 2008. This aggregate
information has been compiled from the financial statements of the Company’s equity method partner
companies.
52
INTERNET CAPITAL GROUP, INC.
NOTES TO CONSOLIDATED FINANCIAL STATEMENTS — (Continued)
3. Ownership Interests in Partner Companies, Goodwill and Intangibles, net — (Continued)
Balance Sheets (Unaudited)
| |
|
|
|
|
|
|
|
|
| |
|
As of December 31, |
|
| |
|
2009 (1) |
|
|
2008 (2) |
|
| |
|
(in thousands) |
|
|
|
|
|
|
|
|
|
|
Cash and cash equivalents |
|
$ |
72,469 |
|
|
$ |
47,749 |
|
Other current assets |
|
|
60,186 |
|
|
|
72,732 |
|
Non-current assets |
|
|
157,455 |
|
|
|
163,216 |
|
|
|
|
|
|
|
|
Total assets |
|
$ |
290,110 |
|
|
$ |
283,697 |
|
|
|
|
|
|
|
|
|
|
|
|
|
|
|
|
|
Current liabilities |
|
$ |
122,762 |
|
|
$ |
141,510 |
|
Non-current liabilities |
|
|
11,192 |
|
|
|
8,791 |
|
Long-term debt |
|
|
15,117 |
|
|
|
1,843 |
|
Stockholders’ equity |
|
|
141,039 |
|
|
|
131,553 |
|
|
|
|
|
|
|
|
Total liabilities and stockholders’ equity |
|
$ |
290,110 |
|
|
$ |
283,697 |
|
|
|
|
|
|
|
|
|
|
|
|
|
|
|
|
|
Total carrying value |
|
$ |
97,777 |
|
|
$ |
83,751 |
|
|
|
|
|
|
|
|
| |
|
|
| (1) |
|
Includes (ICG voting ownership): Acquirgy (25%), Channel Intelligence (50%),
ClickEquations (33%), Freeborders (31%), GoIndustry (26%), Metastorm (33%), SeaPass (26%), StarCite (36%) and
WhiteFence (36%). |
| |
| (2) |
|
Includes (ICG voting ownership): Channel Intelligence (46%), ClickEquations (30%),
Freeborders (31%), GoIndustry (29%), Metastorm (33%), StarCite (34%) and WhiteFence (36%). |
In 2009, the Company acquired
ownership interests in Acquirgy and SeaPass and increased its
existing ownership interests in Channel Intelligence, ClickEquations and StarCite through the
Company’s acquisition of outstanding equity securities and/or participation in financing
rounds. In addition, in 2009, the Company acquired convertible notes
and warrants issued by WhiteFence. The total amount of these acquisitions was $23.2 million.
In 2008, the Company increased its ownership interests in Channel Intelligence, ClickEquations,
Metastorm and StarCite through the Company’s acquisition of outstanding equity securities and/or
participation in financing rounds. The total amount of these acquisitions was $24.2 million.
As of December 31, 2009, the Company’s aggregate carrying value in equity method partner companies
exceeded the Company’s share of the net assets of these equity method partner companies by
approximately $54.1 million. Of this excess, $40.0 million is allocated to goodwill, which is not
amortized, and $14.1 million is allocated to intangibles, which are generally being amortized over
three to seven years. As of December 31, 2008, this excess was $33.6 million, which was allocated
$25.8 million to goodwill and $7.8 million to intangibles. Amortization expense of $2.3 million, $1.4 million and $0.3 million associated with these
intangibles for the years ended December 31, 2009, 2008 and 2007, respectively, is included in the table
below in the line item “Equity income (loss) excluding impairments” and is included in “Equity
loss” on the Company’s Consolidated Statements of Operations.
In 2008, ClickEquations, which was previously accounted for under the cost method, became an equity
method company due to an increase in ownership resulting from the Company’s participation in a financing round. Prior periods have not
been restated to reflect prior equity losses from the original acquisition of an interest in
ClickEquations as that acquisition was immaterial.
53
INTERNET CAPITAL GROUP, INC.
NOTES TO CONSOLIDATED FINANCIAL STATEMENTS — (Continued)
3. Ownership Interests in Partner Companies, Goodwill and Intangibles, net — (Continued)
Results of Operations (Unaudited)
| |
|
|
|
|
|
|
|
|
|
|
|
|
| |
|
Year Ended December 31, |
|
| |
|
2009(1) |
|
|
2008(2) |
|
|
2007 (3) |
|
| |
|
(in thousands) |
|
Revenues |
|
$ |
229,640 |
|
|
$ |
243,762 |
|
|
$ |
206,279 |
|
|
|
|
|
|
|
|
|
|
|
|
|
|
|
|
|
|
|
|
|
|
|
|
Net income (loss) |
|
$ |
(26,511 |
) |
|
$ |
(57,943 |
) |
|
$ |
(40,125 |
) |
|
|
|
|
|
|
|
|
|
|
|
|
|
|
|
|
|
|
|
|
|
|
|
Equity income (loss) excluding impairments and amortization of intangible assets |
|
$ |
(9,321 |
) |
|
$ |
(22,086 |
) |
|
$ |
(14,162 |
) |
Impairment charge of GoIndustry |
|
|
(544 |
) |
|
|
(10,204 |
) |
|
|
— |
|
Amortization of intangible assets |
|
|
(2,266 |
) |
|
|
(1,412 |
) |
|
|
(254 |
) |
|
|
|
|
|
|
|
|
|
|
Total equity income (loss) |
|
$ |
(12,131 |
) |
|
$ |
(33,702 |
) |
|
$ |
(14,416 |
) |
|
|
|
|
|
|
|
|
|
|
| |
|
|
| (1) |
|
Includes Acquirgy (from date of acquisition), Channel Intelligence, ClickEquations, Freeborders, GoIndustry,
Metastorm, SeaPass (from date of acquisition), StarCite and WhiteFence. |
| |
| (2) |
|
Includes Channel Intelligence, ClickEquations, Freeborders, GoIndustry, Metastorm, StarCite, Vcommerce (to date
of consolidation) and WhiteFence. |
| |
| (3) |
|
Includes Channel Intelligence, Freeborders,
GoIndustry, Marketron (to date of
disposition), Metastorm, StarCite, Vcommerce and WhiteFence. |
Other Equity Company Information
In
2007, GoIndustry, the securities of which are listed on the AIM
market of the London Stock Exchange, issued equity in connection with a financing round and reverse merger. As a
result of these transactions, the Company’s ownership in GoIndustry was reduced from 35% to 31%.
In February 2008, GoIndustry issued additional shares of common stock in conjunction with a
financing and the acquisition of DoveBid, Inc. In conjunction with the financing, the Company
purchased an additional 52,690,950 shares of GoIndustry for $10.5 million. As a
result of these transactions, the Company’s ownership in GoIndustry was reduced from
31% to 29%. In January 2009, the Company purchased $1.4 million of convertible
long-term notes from GoIndustry. In September 2009, in conjunction with a financing transaction,
these long-term notes were converted to 56,952,636 shares of GoIndustry and the Company purchased
an additional 63,888,889 shares of GoIndustry for $1.9 million. At December 31,
2009, the Company owned 254,674,377 shares of GoIndustry, or 26% of the outstanding
shares, as compared to 133,832,852 shares of GoIndustry, or 29% of the outstanding
shares as of December 31, 2008. All of the reductions in the Company’s ownership interests in
GoIndustry for 2009, 2008 and 2007 were accounted for as dispositions of shares and resulted in a
dilution loss of $0.4 million, a dilution loss of $1.3 million and a dilution gain of $5.0 million,
respectively, for accounting purposes. The dilution loss of $1.3 million in 2008 and the dilution
gain of $5.0 million in 2007 were recorded as equity transactions as a decrease and an increase,
respectively, to additional paid-in capital in the Company’s Consolidated Statements of Changes in Equity. In accordance with revised accounting guidance for equity method companies, the $0.4 million
dilution loss in 2009 was recorded in “Other income (loss), net” on the Company’s Consolidated
Statements of Operations. Due to the Company’s 26% ownership, GoIndustry continues to be accounted
for under the equity method. See the “Issuance of Stock by Partner Companies” subsection below.
In 2009 and 2008, the Company determined that its holdings of GoIndustry common stock experienced
an other-than-temporary decline in fair market value. As a result, the Company recorded impairment charges of
$0.5 million and $10.2 million during the years ended December 31, 2009 and 2008, respectively, to
reduce the Company’s carrying value to GoIndustry’s fair market value. As of December
31, 2009, based on the fair value of GoIndustry’s common stock, no further impairment was required.
Subsequent to December 31, 2009, the value of GoIndustry’s common stock has declined.
Accordingly, the Company will continue to evaluate the fair value of GoIndustry and will record
further impairment charges in 2010 if the Company determines that a decline in GoIndustry’s fair
market value is other than temporary. The carrying value of the Company’s investment in GoIndustry is $5.7 million as of
December 31, 2009.
54
INTERNET CAPITAL GROUP, INC.
NOTES TO CONSOLIDATED FINANCIAL STATEMENTS — (Continued)
3. Ownership Interests in Partner Companies, Goodwill and Intangibles, net — (Continued)
In 2007, the Company sold its ownership in Marketron for gross proceeds of $36.7 million, of
which approximately $4.8 million was placed in escrow to be released over a three-year period,
subject to purchase price adjustments and indemnity claims pursuant to the terms of the related
agreement. The Company recorded a gain on the transaction of $8.2 million in 2007, which is included in
“Other income (loss), net” on the Company’s Consolidated Statements of Operations. The Company
received $1.2 million, which was net of indemnity claims, $1.4 million and $0.6 million of the escrowed amounts in 2009, 2008 and
2007, respectively, and recorded these amounts as gains,
which are included in “Other income (loss), net” on the Company’s Consolidated Statements of
Operations in the respective periods. The remaining $1.4
million in escrow, plus any accumulated interest, will be recognized as additional gain if and when
the amount of the escrow proceeds is fixed or determinable and realization is assured.
In 2007, Metastorm issued equity in conjunction with a financing and an acquisition transaction.
As a result of these transactions, the Company’s ownership interest in Metastorm was reduced from
41% to 32%. Accordingly, the Company recorded a dilution gain of $2.2 million in 2007 as an increase to
additional paid-in capital in the Company’s Consolidated Statement of Changes in Equity. See subsection “Issuance of Stock by Partner Companies” below.
Issuances of Stock by Partner Companies
The following table summarizes the impact to the
Company’s Consolidated Statements of Changes in
Equity for issuances of stock by partner companies.
| |
|
|
|
|
|
|
|
|
|
|
|
|
|
|
| |
|
Issuance of Stock by |
|
Year Ended December 31, |
|
| Partner Company |
|
Partner Company for: |
|
2009 |
|
|
2008 |
|
|
2007 |
|
| |
GoIndustry |
|
Financing/Acquisition/Merger Transactions |
|
$ |
— |
|
|
$ |
(1,344 |
) |
|
$ |
4,996 |
|
Metastorm |
|
Financing and Acquisition Transaction |
|
|
— |
|
|
|
— |
|
|
|
2,224 |
|
Other |
|
Restricted Stock/Stock Option Activity |
|
|
331 |
|
|
|
715 |
|
|
|
89 |
|
|
|
|
|
|
|
|
|
|
|
|
|
| |
| Impact of partner company equity transactions |
|
$ |
331
|
|
|
$ |
(629)
|
|
|
$ |
7,309
|
|
|
|
|
|
|
|
|
|
|
|
|
Other Partner Company Information
In 2008, Creditex Group, Inc. (“Creditex”), which was accounted for using the cost method, was
acquired by IntercontinentalExchange, Inc. (“ICE”). The Company’s share of the merger consideration
was 737,471 shares of ICE common stock, which, based on the stock’s August 29, 2008 closing price,
were valued at approximately $64.9 million. At closing, 60,440 of these shares were placed into
escrow to satisfy potential indemnification claims. The Company recorded a gain of $34.8 million
on the sale of Creditex during the year ended December 31, 2008. Between August 29, 2008 and
December 31, 2008, the Company sold 677,031 shares of ICE common stock for cash proceeds of $60.2
million. The Company recorded a gain on the ICE common stock sales of $0.6 million during the year
ended December 31, 2008. In February 2009, the Company received an additional 7,549 shares of ICE
common stock in connection with a post-merger closing-related adjustment. The shares were valued
based on the closing stock price of ICE common stock on the date the shares were received,
resulting in a gain recorded of $0.4 million during the first quarter of 2009. The Company
subsequently sold these additional shares of ICE common stock, and recorded a gain of $0.2 million
during the first quarter of 2009. Total gains related to these transactions of $0.6 million and
$35.4 million are reflected in “Other income (loss), net” on the Company’s Consolidated Statement
of Operations for the years ended December 31, 2009 and 2008, respectively. In March 2010, 46,751
shares of ICE common stock were released from escrow, which, based on
the stock’s March 1, 2010 closing price, were valued at
$5.0 million. The Company will record a gain during the three
months ending March 31, 2010 for this amount. Following the
receipt of the 46,751 shares, the Company sold these shares for
approximately $5.1 million and will record the incremental gain
of $0.1 million on the sale during the three months ending
March 31, 2010. Of the remaining 13,689 shares held in
escrow, up to 4,541 may be released to the Company dependent upon the
resolution of outstanding indemnity claims, and, subject to certain potential tax-related indemnity
claims, 9,148 shares are scheduled to be released to the Company in 2012.
55
INTERNET CAPITAL GROUP, INC.
NOTES TO CONSOLIDATED FINANCIAL STATEMENTS — (Continued)
3. Ownership Interests in Partner Companies, Goodwill and Intangibles, net — (Continued)
Additionally, during 2009, 2008 and 2007, the Company received $1.0 million, $1.9 million and $1.0 million,
respectively, of escrow releases in connection with the disposition of various other partner companies,
and recorded these amounts as gains, which are included in “Other income
(loss), net” on the Company’s Consolidated Statement of Operations in the respective periods.
Escrow Information
As of December 31, 2009, the Company has outstanding aggregate cash proceeds, subject to indemnity
claims, of approximately $3.0 million associated with escrowed proceeds from sales of former equity
method partner companies. Additionally, the Company had 60,440 outstanding shares of ICE common
stock, valued at approximately $6.3 million based on the December 31, 2009 closing stock price of
ICE’s common stock, being held in escrow. These share escrows primarily relate to sale
consideration that was set aside to satisfy potential purchase price adjustments and/or potential
indemnity claims in connection with the sale of Creditex to ICE on August 29, 2008. The
release of escrowed proceeds, if any, to the Company would result in gains at
the time the Company is entitled to such proceeds, the amount is fixed or determinable and
realization is assured, which is anticipated to occur at various times between March 2010 and
August 2012.
On March 1, 2010, 46,751 shares of ICE common stock were released from escrow to the Company.
Based on the closing price of ICE common stock on that date, these shares were valued at $5.1 million.
The Company will record a gain during the three months ending March 31, 2010 of $5.1 million related
to this escrow release.
4. Marketable Securities and Related Derivatives
Marketable securities represent the
Company’s holdings in publicly-traded equity securities
accounted for as available-for-sale securities. At December 31, 2009, the Company held a
noncontrolling interest in Blackboard, Inc. (“Blackboard”), which is traded on the NASDAQ Global
Market. The cost, unrealized holding gains/(losses), and fair value of marketable securities at
December 31, 2009 and December 31, 2008 were as follows:
| |
|
|
|
|
|
|
|
|
|
|
|
|
|
|
|
|
| |
|
|
|
|
|
|
|
|
|
Unrealized |
|
|
|
|
| |
|
Common Shares |
|
|
|
|
|
|
Holding |
|
|
|
|
| |
|
Owned |
|
|
Cost |
|
|
Gains/(Losses) |
|
|
Fair Value |
|
| |
|
(in thousands, except shares) |
|
|
|
|
|
|
|
|
|
|
|
|
|
|
|
|
|
|
December 31, 2009 |
|
|
|
|
|
|
|
|
|
|
|
|
|
|
|
|
Blackboard |
|
|
1,619,571 |
|
|
$ |
2,342 |
|
|
$ |
71,170 |
|
|
$ |
73,512 |
|
|
|
|
|
|
|
|
|
|
|
|
|
|
December 31, 2008 |
|
|
|
|
|
|
|
|
|
|
|
|
|
|
|
|
Blackboard |
|
|
2,187,060 |
|
|
$ |
3,162 |
|
|
$ |
54,205 |
|
|
$ |
57,367 |
|
|
|
|
|
|
|
|
|
|
|
|
|
|
The tables above do not reflect the Company’s holdings of ICE common stock, which were both
obtained and sold during the years ended December 31, 2009 and 2008. See Note 3, “Ownership
Interests in Partner Companies, Goodwill and Intangibles, net.”
56
INTERNET CAPITAL GROUP, INC.
NOTES TO CONSOLIDATED FINANCIAL STATEMENTS — (Continued)
4. Marketable Securities and Related Derivatives — (Continued)
The amounts reflected as the Company’s cost for Blackboard include the carrying value on the date
Blackboard converted to marketable securities and the value of Blackboard warrants exercised.
During 2009, the Company sold 567,489 shares of Blackboard common stock at an average price of
$38.69 per share. The Company received total proceeds of $21.9 million and recognized a gain on
the sale of these securities in the amount of $21.1 million. This gain is included in “Other
income (loss), net” on the Company’s Consolidated Statements of Operations in the year ended December 31, 2009.
The Company manages its exposure to and benefits from price fluctuations of Blackboard common stock
by using derivative securities or hedges. Although these instruments are derivative securities,
their economic risks are similar to, and managed on the same basis as, the risks associated with
the Blackboard shares the Company holds. As of December 31, 2009, the Company was party to cashless
collar contracts with various expiration dates in 2010 to hedge 1,000,000 shares of its total
holdings of 1,619,571 shares of Blackboard common stock at weighted average minimum and maximum
prices per share of $25.44 and $57.60, respectively. During the year ended December 31, 2009, the
Company incurred costs of $0.5 million to terminate two of these contracts related to a total of
625,000 shares. The Company recorded a loss of $0.5 million, the cost to terminate the contracts,
during the year ended December 31, 2009, which is included in “Other income (loss), net” on the
Company’s Consolidated Statements of Operation.
In
accordance with the applicable accounting rules, these instruments
are marked to market through earnings.
The mark-to-market impact to earnings of the Blackboard hedge instruments was a loss of $7.1
million for the year ended December 31, 2009, income of $10.2 million for the year ended December 31, 2008,
and loss of $3.7 million for the year ended December 31, 2007, based
on Blackboard’s closing stock prices of
$45.39, $26.23 and $40.25 at December 31, 2009, 2008 and 2007, respectively.
These amounts are reflected in
“Other income (loss), net” on the Company’s Consolidated Statements of Operations in the relevant
period.
The income or loss is primarily driven by the change in the closing price of Blackboard stock from
the beginning of the period to the end of the period. The price per share is reflected in the
table below as reported by the NASDAQ Global Market:
| |
|
|
|
|
|
|
|
|
|
|
|
|
|
|
|
|
|
|
|
|
|
|
|
|
|
|
|
|
|
|
|
|
|
|
|
|
| |
|
Dec. 31, |
|
|
Mar. 31, |
|
|
June. 30, |
|
|
Sep. 30, |
|
|
Dec. 31, |
|
|
Mar. 31, |
|
|
June. 30, |
|
|
Sep. 30, |
|
|
Dec. 31, |
|
| |
|
2007 |
|
|
2008 |
|
|
2008 |
|
|
2008 |
|
|
2008 |
|
|
2009 |
|
|
2009 |
|
|
2009 |
|
|
2009 |
|
Blackboard
closing
stock price |
|
$ |
40.25 |
|
|
$ |
33.33 |
|
|
$ |
38.23 |
|
|
$ |
40.29 |
|
|
$ |
26.23 |
|
|
$ |
31.74 |
|
|
$ |
28.86 |
|
|
$ |
37.78 |
|
|
$ |
45.39 |
|
In future quarters, the mark-to-market impact will generally be an expense if Blackboard’s stock
price rises, or income if Blackboard’s stock price declines, during the relevant quarter. If the
Company holds these hedges through their maturity dates and Blackboard’s stock price remains within
the weighted average minimum and maximum prices per share, the value of the hedges will be zero at
maturity.
The fair value of these instruments was a liability of $0.5 million at December 31, 2009 and an
asset of $6.5 million at December 31, 2008, and, for each period, is included in “Hedges of
marketable securities” on the Company’s Consolidated Balance Sheets. See Note 5, “Financial
Instruments.”
Subsequent to December 31, 2009, the Company sold 787,705 additional shares of Blackboard common
stock at an average price per share of $45.82 for total proceeds of $36.1 million. The Company
will record a gain during the quarter ending March 31, 2010 in the amount of $34.9 million on these
transactions. Additionally, the Company terminated two additional cashless collar contracts related to 250,000
shares of Blackboard common stock in
advance of the respective maturity dates for total costs of $0.2 million. The Company will record
a loss in this amount during the quarter ending March 31, 2010.
57
INTERNET CAPITAL GROUP, INC.
NOTES TO CONSOLIDATED FINANCIAL STATEMENTS — (Continued)
5. Financial Instruments
Derivative Financial Instruments
The
Company utilizes derivative financial instruments, primarily the Blackboard security hedges and forward
exchange contracts to manage its exposure to and benefits from price fluctuations of Blackboard
common stock and foreign currency risk, respectively. The cashless collar contracts related to
Blackboard common stock are discussed in Note 4, “Marketable Securities and Related Derivatives.”
During the years ended December 31, 2009, 2008 and 2007, ICG
Commerce utilized put
options and a forward contract to mitigate the risk of currency fluctuations at ICG Commerce’s operations in the United
Kingdom and Europe. The net mark-to-market loss recognized by ICG Commerce in 2009 was less than
$0.1 million and represents the premium paid for the options.
ICG Commerce recognized a net mark-to-market loss of $0.1 million in
2008. These losses were recognized in “Other
income (loss), net” on the Company’s Consolidated
Statements of Operations. There were no losses related to ICG
Commerce’s financial instruments in 2007.
The following table presents the classifications and fair values of our derivative instruments as
of December 31, 2009 and 2008:
| |
|
|
|
|
|
|
|
|
|
|
| Consolidated Balance Sheets |
|
| |
|
|
|
December 31, |
|
|
December 31, |
|
| Derivative
Instrument |
|
Classification |
|
2009 |
|
|
2008 |
|
| |
|
|
|
(in thousands) |
|
|
|
|
|
|
|
|
|
|
|
|
Cashless collar contracts |
|
Hedges of marketable securities |
|
$ |
(547 |
) |
|
$ |
6,551 |
|
Foreign exchange put option |
|
Other assets, net |
|
$ |
— |
|
|
$ |
— |
|
The following table presents the mark-to-market impact on earnings resulting from our
hedging activities for the years ended December 31, 2009 and 2008:
| |
|
|
|
|
|
|
|
|
|
|
|
|
|
|
| Consolidated Statements of Operations |
|
| |
|
|
|
Year ended December 31, |
|
| Derivative Instrument |
|
Classification |
|
2009 |
|
|
2008 |
|
|
2007 |
|
| |
|
|
|
(in thousands) |
|
Cashless collar contracts |
|
Other income (loss), net |
|
$ |
(7,098 |
) |
|
$ |
10,204 |
|
|
$ |
(3,651 |
) |
Foreign
exchange instruments |
|
Other income (loss), net |
|
$ |
(33 |
) |
|
$ |
(132 |
) |
|
$ |
— |
|
Fair Value Measurements
Fair value is the price that would be received from selling an asset or paid to transfer a
liability in an orderly transaction between market participants at the measurement date. There are
three levels of inputs that may be used to measure fair value, which are as follows:
Level
1 — Observable inputs such as quoted market prices for identical assets and liabilities in active public markets.
Level 2 — Observable inputs other than Level 1 prices based on quoted prices in markets with
insufficient volume or infrequent transactions, or valuations in which all significant inputs are
observable for substantially the full term of the asset or liability.
Level 3 — Unobservable inputs to the valuation techniques that are significant to the fair value of
the asset or liability.
58
INTERNET CAPITAL GROUP, INC.
NOTES TO CONSOLIDATED FINANCIAL STATEMENTS — (Continued)
5. Financial Instruments — (Continued)
The fair value hierarchy of the Company’s financial assets measured at fair value on a
recurring basis was as follows:
| |
|
|
|
|
|
|
|
|
|
|
|
|
|
|
|
|
| |
|
Balance at |
|
|
|
|
|
|
|
|
|
|
| |
|
December 31, |
|
|
|
|
|
|
|
|
|
|
| |
|
2009 |
|
|
Level 1 |
|
|
Level 2 |
|
|
Level 3 |
|
| |
|
(in thousands) |
|
Cash equivalents (money market accounts) |
|
$ |
49,972 |
|
|
$ |
49,972 |
|
|
$ |
— |
|
|
$ |
— |
|
Marketable securities (see Note 4) |
|
|
73,512 |
|
|
|
73,512 |
|
|
|
— |
|
|
|
— |
|
Hedges of marketable securities (see Note 5) |
|
|
(547 |
) |
|
|
— |
|
|
|
(547 |
)(a) |
|
|
— |
|
|
|
|
|
|
|
|
|
|
|
|
|
|
|
|
$ |
122,937 |
|
|
$ |
123,484 |
|
|
$ |
(547 |
) |
|
$ |
— |
|
|
|
|
|
|
|
|
|
|
|
|
|
|
| |
|
|
|
|
|
|
|
|
|
|
|
|
|
|
|
|
| |
|
Balance at |
|
|
|
|
|
|
|
|
|
|
| |
|
December 31, |
|
|
|
|
|
|
|
|
|
|
| |
|
2008 |
|
|
Level 1 |
|
|
Level 2 |
|
|
Level 3 |
|
Cash equivalents (money market accounts) |
|
$ |
84,470 |
|
|
$ |
84,470 |
|
|
$ |
— |
|
|
$ |
— |
|
Marketable securities (see Note 4) |
|
|
57,367 |
|
|
|
57,367 |
|
|
|
— |
|
|
|
— |
|
Hedges of marketable securities (see Note 5) |
|
|
6,551 |
|
|
|
— |
|
|
|
6,551 |
(a) |
|
|
— |
|
|
|
|
|
|
|
|
|
|
|
|
|
|
|
|
$ |
148,388 |
|
|
$ |
141,837 |
|
|
$ |
6,551 |
|
|
$ |
— |
|
|
|
|
|
|
|
|
|
|
|
|
|
|
| |
|
|
| (a) |
|
The Company’s counterparty under these arrangements provides the Company with quarterly
statements of the market values of these instruments based on significant inputs that are
observable or can be derived principally from, or corroborated by, observable market data for
substantially the full term of the asset or liability. |
6. Fixed Assets
Fixed assets consist of the following:
| |
|
|
|
|
|
|
|
|
|
|
|
|
| |
|
|
|
|
|
As of December 31, |
|
| |
|
Useful Life |
|
|
2009 |
|
|
2008 |
|
| |
|
|
|
|
|
(in thousands) |
|
Computer equipment and software,
office equipment and furniture |
|
3-7 years |
|
$ |
15,292 |
|
|
$ |
18,184 |
|
Leasehold improvements |
|
3-6 years |
|
|
971 |
|
|
|
1,084 |
|
|
|
|
|
|
|
|
|
|
|
|
|
|
|
|
|
|
|
16,263 |
|
|
|
19,268 |
|
Less:
accumulated depreciation and amortization |
|
|
|
|
|
|
(12,086 |
) |
|
|
(17,485 |
) |
|
|
|
|
|
|
|
|
|
|
|
|
|
|
|
|
|
$ |
4,177 |
|
|
$ |
1,783 |
|
|
|
|
|
|
|
|
|
|
|
|
Depreciation expense for the years ended December 31, 2009, 2008 and 2007 was $1.5 million, $1.6
million and $1.4 million, respectively. The Company uses the straight line method of depreciation.
7. Debt
Long-Term Debt
The Company’s long-term debt at December 31, 2009
of $0.6 million related to its consolidated
partner companies. The Company’s long-term debt of
$3.9 million at December 31, 2008 related to
its consolidated partner companies, and primarily consisted of notes at Vcommerce.
| |
|
|
|
|
|
|
|
|
|
|
|
|
| |
|
|
|
|
|
As of December 31, |
|
| |
|
Interest Rates |
|
|
2009 |
|
|
2008 |
|
| |
|
|
|
|
(in thousands) |
|
|
|
|
|
|
|
|
|
|
|
|
|
|
Capital leases |
|
2.25-12.98% |
|
|
$ |
241 |
|
|
$ |
153 |
|
Other debt |
|
10.27-13.00% |
|
|
|
785 |
|
|
|
4,081 |
|
|
|
|
|
|
|
|
|
|
|
|
|
|
|
|
|
|
|
1,026 |
|
|
|
4,234 |
|
Current maturities |
|
|
|
|
|
|
(381 |
) |
|
|
(318 |
) |
|
|
|
|
|
|
|
|
|
|
|
Other long-term debt |
|
|
|
|
|
$ |
645 |
|
|
$ |
3,916 |
|
|
|
|
|
|
|
|
|
|
|
|
59
INTERNET CAPITAL GROUP, INC.
NOTES TO CONSOLIDATED FINANCIAL STATEMENTS — (Continued)
7. Debt — (Continued)
The Company’s long-term debt matures as follows:
| |
|
|
|
|
2010 |
|
$ |
381 |
|
2011 |
|
|
384 |
|
2012 |
|
|
247 |
|
2013 |
|
|
13 |
|
2014 |
|
|
1 |
|
|
|
|
|
|
|
$ |
1,026 |
|
|
|
|
|
Loan and Credit Agreements
On December 18, 2009, the Company entered into an amended and restated loan agreement with Comerica
Bank (the “Loan Agreement”) that provides for the issuance of letters of credit up to $10.0 million,
subject to a cash-secured borrowing base as defined by the Loan Agreement. The Loan Agreement
expires on December 17, 2010 and replaces the Letter of Credit
Agreement, as amended,
between the same parties, which expired December 12, 2009. Issuance fees of 0.50% per annum of the
face amount of each letter of credit will be paid to Comerica Bank subsequent to issuance. The
Loan Agreement also is subject to a 0.25% per annum unused commitment fee payable to the bank
quarterly. No amounts were outstanding under these agreements at December 31, 2009 or 2008.
On May 8, 2008, the Company entered into a series of loan agreements with Credit Suisse Capital
LLC. Pursuant to these agreements, the Company may, from time to time, borrow funds secured by the
cashless collar contracts that the Company previously entered into with respect to 1,000,000 of its
shares of Blackboard common stock. The loans bear interest, which is payable quarterly in arrears,
at the three-month U.S. dollar LIBOR rate, computed on the basis of a 30-day month and a 360-day
year. This interest rate resets on the first day of each calendar quarter. The maturity of each
of the loans corresponds with the expiration of the underlying cashless collar contract.
Accordingly, the maturity dates of the loans range from March 15, 2010 to October 15, 2010. The
maximum borrowing capacity under each of the loan agreements equals the present value of the
minimum value of the underlying cashless collar contract, computed using the three month U. S.
dollar LIBOR rate. The aggregate maximum borrowing capacity under the loan agreements is
approximately $25.4 million as of December 31, 2009.
Following the termination of two cashless
collar contracts in January 2010, the aggregate maximum borrowing capacity under the loan
agreements is approximately $19.5 million. The Company has not drawn any amounts under the loan
agreements to date.
In 2008, ICG Commerce and a number of its wholly-owned subsidiaries entered into a loan agreement
with PNC Bank, pursuant to which ICG Commerce and such subsidiaries may borrow up to $10.0 million
under a revolving line of credit. The line of credit matured on December 31, 2009.
There were no amounts outstanding under the loan agreement (including
letters of credit) at December 31, 2009.
On February
25, 2010, ICG Commerce and PNC Bank agreed to extend the line of credit to December 31, 2010. The
credit facility is secured by the assets of the borrowing companies. Interest on any outstanding
amounts is computed at a rate to be selected by ICG Commerce from the following: (1) the highest of
PNC Bank’s prime rate, the sum of the Federal Funds Open Rates plus 0.5% or the sum of the daily
LIBOR rate plus 1.0%, plus a margin of 0.75%, or LIBOR plus a margin of 1.75%, depending on the
then-current debt-to-EBITDA ratio of the borrowing companies, and (2) the highest of PNC Bank’s
prime rate, the sum of the Federal Funds Open Rates plus 0.5% or the sum of the daily LIBOR rate
plus 1.0%, plus a margin of 1.0%, or LIBOR plus a margin of 2%, depending on the then-current
debt-to-EBITDA ratio of the borrowing companies. The loan agreement also provides for the issuance
by the bank of letters of credit, subject to specified fees and other terms. The loan agreement is
subject to a 0.25% per annum unused commitment fee that is payable to the bank quarterly. There
were no amounts outstanding under the loan agreement (including
letters of credit) through the date of
this Report.
60
INTERNET CAPITAL GROUP, INC.
NOTES TO CONSOLIDATED FINANCIAL STATEMENTS — (Continued)
7. Debt — (Continued)
Senior Convertible Notes
On
January 1, 2007, the Company had $26.6 million outstanding
of its senior convertible notes
issued in April 2004 that were set to mature in April 2009. The Company repurchased and
extinguished the remainder of its senior convertible notes on
February 12, 2007, recording a loss, including
accelerated deferred financing fees, of $10.8 million. This
loss was included in “Other income
(loss), net” on the Company’s Consolidated Statements of
Operations during 2007. Additionally, the Company
recorded interest expense related to its senior convertible notes of $0.2 million for the year ended December 31,
2007. There were no senior convertible notes outstanding as of
December 31, 2009, 2008 or 2007.
During
the year ended December 31, 2009, the Company adopted certain
accounting guidance which requires issuers
of certain convertible debt instruments that may be settled wholly or partially in cash on
conversion or settlement to separately account for the liability (debt) and equity (conversion
feature) components of the instrument in a manner that reflected the issuers’ non-convertible debt
borrowing rate. This accounting guidance requires retrospective application for all periods presented; early
adoption was not permitted.
The
retrospective application of this accounting guidance resulted in a decrease to the net loss
recorded in 2007 in the amount of $7.0 million, related to the repurchase of the Company’s remaining senior convertible notes,
including accelerated deferred financing fees, versus what was
recorded under previous accounting guidance.
This retrospective application impacted the following line items on the
Company’s Consolidated Statements of Operations for 2007:
| |
|
|
|
|
Other income (loss), as previously reported |
|
$ |
(167 |
) |
Impact of retrospective application |
|
|
6,997 |
|
|
|
|
|
Other income (loss), as adjusted |
|
$ |
6,830 |
|
|
|
|
|
|
|
Interest expense, as previously reported |
|
$ |
(300 |
) |
Impact of retrospective application |
|
|
24 |
|
|
|
|
|
Interest expense, as adjusted |
|
$ |
(276 |
) |
|
|
|
|
| |
|
|
|
|
Income (loss) from continuing operations, as previously reported |
|
$ |
(31,155 |
) |
Impact of retrospective application |
|
|
7,021 |
|
|
|
|
|
Income (loss) from continuing operations, as adjusted |
|
$ |
(24,134 |
) |
|
|
|
|
|
|
Net income (loss), as previously reported |
|
$ |
(30,160 |
) |
Impact of retrospective application |
|
|
7,021 |
|
|
|
|
|
Net income (loss), as adjusted |
|
$ |
(23,139 |
) |
|
|
|
|
In addition, the 2007 repurchase of the Company’s
senior convertible notes resulted in a reduction to additional paid-in capital of $11.6 million,
reflected as “Reacquisition of equity” on the Company’s Consolidated Statements of Changes in
Equity. Activity prior to January 1, 2007 has been adjusted in opening balances of “Additional
paid in capital” and “Accumulated Deficit” and is
reflected as “Cumulative effect of change in accounting
principle for convertible debt”
on the Company’s Consolidated Statements of Changes in Equity.
In
accordance with the retrospective application of the above transaction, the following method was used to
determine the liability and equity components of the Company’s senior convertible notes. Upon the
2004 issuance of the Company’s senior convertible notes, the Company determined that there was an
$8.6 million debt discount. The debt discount was calculated by comparing the fair value of the
liability, using the debt’s term and the Company’s determined interest spread of 12% over the five
year treasury rate at the time of issuance, to the fair value of the consideration received as a
result of the transaction. This $8.6 million debt discount would have been amortized over the five
year term of the senior convertible notes. Through 2006, using the interest method, amortization
on the debt discount, including net adjustments to amortization of
debt issuance costs, would have been $3.8 million. As a result, on January 1, 2007, the remaining
balance of the debt discount was $4.6 million. From January 1, 2007 to February 12, 2007, the
Company would have recorded additional amortization of debt discount of $0.2 million. Upon
repurchase of the Company’s senior convertible notes on February 12, 2007, the Company determined
the fair value of the liability component using the remaining term of the debt and the Company’s
determined interest spread of 3% over the interpolated treasury rate for the respective term. The
difference between the fair value of the consideration paid and the fair value of the liability
component resulted in an $11.6 million reduction to additional paid-in capital due to the
reacquisition of the equity component reference above.
61
INTERNET CAPITAL GROUP, INC.
NOTES TO CONSOLIDATED FINANCIAL STATEMENTS — (Continued)
8. Segment Information
The Company’s reportable segments consist of two reporting segments, the “core” segment and the
“venture” segment. At December 31, 2009, the core segment includes the results of the Company’s
consolidated partner companies, records the Company’s share of earnings and losses of partner
companies accounted for under the equity method of accounting and captures the Company’s basis in
the assets of its core segment partner companies. At December 31, 2009, the venture segment
records the Company’s share of earnings and losses of partner companies accounted for under the
equity method of accounting and captures the Company’s basis in the assets of its venture segment
partner companies. Marketable securities are considered “corporate” assets whereas, prior to
becoming marketable securities, the partner company to which they relate would have been included
in the core or venture category.
The core reporting segment includes those consolidated and equity method partner companies in which ICG owns a principal
controlling equity voting interest (53% on average as of December 31, 2009) and in which ICG’s
management takes a very active role in providing strategic direction and management assistance.
The Company expects to devote relatively large initial amounts of capital to acquire core partner
companies. The venture reporting segment includes partner companies in which the Company generally
devotes less capital than it does to its core companies and, therefore, in which it holds
relatively smaller ownership stakes than it does in its core companies (24% on average as of
December 31, 2009) and has less influence over their strategic direction and management decisions
than it does over those of its core companies.
Approximately 10%, 13% and 10% of the Company’s
consolidated revenues for the years ended December 31, 2009, 2008 and 2007, respectively, relate to
sales generated in the United Kingdom. The remaining consolidated revenues for the years ended
December 31, 2009 and 2008 primarily relate to sales generated in the United States. As of December
31, 2009 and 2008, the Company’s assets were located primarily in the United States.
The following summarizes selected information related to the Company’s segments for the years ended
December 31, 2009, 2008 and 2007. All significant intersegment activity has been eliminated.
Assets are owned or allocated assets are used by each operating segment.
Segment Information
(in thousands)
| |
|
|
|
|
|
|
|
|
|
|
|
|
|
|
|
|
|
|
|
|
|
|
|
|
|
|
|
|
| |
|
|
|
|
|
|
|
|
|
|
|
|
|
Reconciling Items |
|
| |
|
|
|
|
|
|
|
|
|
|
|
|
|
Discontinued |
|
|
|
|
|
|
|
|
|
|
|
|
| |
|
|
|
|
|
|
|
|
|
|
|
|
|
Operations |
|
|
|
|
|
|
|
|
|
|
|
|
| |
|
|
|
|
|
|
|
|
|
Total |
|
|
and |
|
|
|
|
|
|
|
|
|
|
Consolidated |
|
| |
|
Core |
|
|
Venture |
|
|
Segment |
|
|
Dispositions* |
|
|
Corporate |
|
|
Other** |
|
|
Results |
|
Year Ended December 31,
2009 |
|
|
|
|
|
|
|
|
|
|
|
|
|
|
|
|
|
|
|
|
|
|
|
|
|
|
|
|
Revenues |
|
$ |
90,252 |
|
|
$ |
— |
|
|
$ |
90,252 |
|
|
$ |
— |
|
|
$ |
— |
|
|
$ |
— |
|
|
$ |
90,252 |
|
Net income
(loss) attributable to Internet Capital Group, Inc. |
|
$ |
26,049 |
|
|
$ |
(2,845 |
) |
|
$ |
23,204 |
|
|
$ |
— |
|
|
$ |
(15,858 |
) |
|
$ |
8,188 |
|
|
$ |
15,534 |
|
Assets |
|
$ |
192,786 |
|
|
$ |
21,832 |
|
|
$ |
214,618 |
|
|
$ |
— |
|
|
$ |
115,469 |
|
|
$ |
— |
|
|
$ |
330,087 |
|
|
|
|
|
|
|
|
|
|
|
|
|
|
|
|
|
|
|
|
|
|
|
|
|
|
|
|
|
|
Year Ended December 31,
2008 |
|
|
|
|
|
|
|
|
|
|
|
|
|
|
|
|
|
|
|
|
|
|
|
|
|
|
|
|
Revenues |
|
$ |
71,181 |
|
|
$ |
— |
|
|
$ |
71,181 |
|
|
$ |
— |
|
|
$ |
— |
|
|
$ |
— |
|
|
$ |
71,181 |
|
Net income (loss)
attributable to Internet Capital Group, Inc. |
|
$ |
(23,758 |
) |
|
$ |
(4,381 |
) |
|
$ |
(28,139 |
) |
|
$ |
— |
|
|
$ |
(18,966 |
) |
|
$ |
24,179 |
|
|
$ |
(22,926 |
) |
Assets |
|
$ |
138,374 |
|
|
$ |
8,281 |
|
|
$ |
146,655 |
|
|
$ |
— |
|
|
$ |
138,925 |
|
|
$ |
— |
|
|
$ |
285,580 |
|
|
|
|
|
|
|
|
|
|
|
|
|
|
|
|
|
|
|
|
|
|
|
|
|
|
|
|
|
|
Year Ended December 31,
2007 |
|
|
|
|
|
|
|
|
|
|
|
|
|
|
|
|
|
|
|
|
|
|
|
|
|
|
|
|
Revenues |
|
$ |
52,923 |
|
|
$ |
— |
|
|
$ |
52,923 |
|
|
$ |
— |
|
|
$ |
— |
|
|
$ |
— |
|
|
$ |
52,923 |
|
Net income (loss)
attributable to Internet Capital Group, Inc. |
|
$ |
(18,194 |
) |
|
$ |
(856 |
) |
|
$ |
(19,050 |
) |
|
$ |
1,849 |
|
|
$ |
(17,022 |
) |
|
$ |
10,616 |
|
|
$ |
(23,607 |
) |
Assets |
|
$ |
153,365 |
|
|
$ |
14,982 |
|
|
$ |
168,347 |
|
|
$ |
— |
|
|
$ |
164,084 |
|
|
$ |
— |
|
|
$ |
332,431 |
|
| |
|
|
| * |
|
Discontinued operations represent net income of $995 for the year ended December 31, 2007. All
other amounts relate to dispositions for the year ended December 31, 2007. |
| |
| ** |
|
Other reconciling items to net income (loss) are as follows: |
| |
|
|
|
|
|
|
|
|
|
|
|
|
| |
|
Year Ended December 31, |
|
| |
|
2009 |
|
|
2008 |
|
|
2007 |
|
|
|
|
|
|
|
|
|
|
|
|
|
|
Other income (loss) (Note 13) |
|
$ |
15,976 |
|
|
$ |
44,277 |
|
|
$ |
6,783 |
|
Income taxes (Note 14) |
|
|
10,627 |
|
|
|
330 |
|
|
|
4,301 |
|
Noncontrolling interest |
|
|
(12,995 |
) |
|
|
(1,960 |
) |
|
|
(468 |
) |
Impairment of GoIndustry (Venture) (Note 3) |
|
|
(544 |
) |
|
|
(10,204 |
) |
|
|
— |
|
Impairment of Vcommerce (Core) (Note 3) |
|
|
(4,876 |
) |
|
|
(8,264 |
) |
|
|
— |
|
|
|
|
|
|
|
|
|
|
|
|
|
$ |
8,188 |
|
|
$ |
24,179 |
|
|
$ |
10,616 |
|
|
|
|
|
|
|
|
|
|
|
62
INTERNET CAPITAL GROUP, INC.
NOTES TO CONSOLIDATED FINANCIAL STATEMENTS — (Continued)
9. Parent Company Financial Information
Parent company financial information is provided to present the financial position and results of
operations of the Company and its wholly-owned subsidiaries as if the
partner companies accounted
for under the consolidation method of accounting were accounted for under the equity method of
accounting for all applicable periods presented. The Company’s
share of the consolidated partner
companies’ losses is included in “Equity loss” in the Parent Company Statements of Operations for
all periods presented based on the Company’s ownership percentage in each period. The carrying
value of the consolidated companies as of December 31, 2009 and 2008 is included in “Ownership
interests in Partner Companies” in the Parent Company Balance Sheets.
Parent Company Balance Sheets
| |
|
|
|
|
|
|
|
|
| |
|
As of December 31, |
|
| |
|
2009 |
|
|
2008 |
|
| |
|
(in thousands) |
|
Assets |
|
|
|
|
|
|
|
|
Cash and cash equivalents |
|
$ |
29,443 |
|
|
$ |
73,208 |
|
Income tax receivable |
|
|
11,071 |
|
|
|
444 |
|
Other current assets |
|
|
562 |
|
|
|
961 |
|
|
|
|
|
|
|
|
Current assets |
|
|
41,076 |
|
|
|
74,613 |
|
Ownership
interests in partner companies |
|
|
170,498 |
|
|
|
113,395 |
|
Marketable securities |
|
|
73,512 |
|
|
|
57,367 |
|
Hedges of marketable securities |
|
|
— |
|
|
|
6,551 |
|
Other |
|
|
881 |
|
|
|
394 |
|
|
|
|
|
|
|
|
Total assets |
|
$ |
285,967 |
|
|
$ |
252,320 |
|
|
|
|
|
|
|
|
|
|
|
|
|
|
|
|
|
Liabilities and stockholders’ equity |
|
|
|
|
|
|
|
|
Current liabilities |
|
$ |
4,433 |
|
|
$ |
4,011 |
|
Hedges of marketable securities |
|
|
547 |
|
|
|
— |
|
Non-current liabilities |
|
|
350 |
|
|
|
898 |
|
Stockholders’ equity |
|
|
280,637 |
|
|
|
247,411 |
|
|
|
|
|
|
|
|
Total liabilities and stockholders’ equity |
|
$ |
285,967 |
|
|
$ |
252,320 |
|
|
|
|
|
|
|
|
Parent Company Statements of Operations
| |
|
|
|
|
|
|
|
|
|
|
|
|
| |
|
Year Ended December 31, |
|
| |
|
2009 |
|
|
2008 |
|
|
2007 |
|
| |
|
(in thousands) |
|
|
|
|
|
|
|
|
|
|
|
|
|
|
Revenues |
|
$ |
— |
|
|
$ |
— |
|
|
$ |
— |
|
Operating expenses |
|
|
|
|
|
|
|
|
|
|
|
|
General and administrative |
|
|
16,257 |
|
|
|
19,755 |
|
|
|
21,680 |
|
Impairment related and other |
|
|
4,876 |
|
|
|
9,058 |
|
|
|
— |
|
|
|
|
|
|
|
|
|
|
|
Total operating expenses |
|
|
21,133 |
|
|
|
28,813 |
|
|
|
21,680 |
|
|
|
|
|
|
|
|
|
|
|
|
|
|
(21,133 |
) |
|
|
(28,813 |
) |
|
|
(21,680 |
) |
Other income (loss), net * |
|
|
15,976 |
|
|
|
44,277 |
|
|
|
6,960 |
|
Interest income (expense), net |
|
|
399 |
|
|
|
1,603 |
|
|
|
4,682 |
|
|
|
|
|
|
|
|
|
|
|
Income (loss) before income taxes and equity loss |
|
|
(4,758 |
) |
|
|
17,067 |
|
|
|
(10,038 |
) |
|
|
|
|
|
|
|
|
|
|
Income tax benefit (expense) |
|
|
10,627 |
|
|
|
330 |
|
|
|
4,301 |
|
Equity income (loss) |
|
|
9,665 |
|
|
|
(40,323 |
) |
|
|
(17,870 |
) |
|
|
|
|
|
|
|
|
|
|
Net income (loss) |
|
$ |
15,534 |
|
|
$ |
(22,926 |
) |
|
$ |
(23,607 |
) |
|
|
|
|
|
|
|
|
|
|
| |
|
|
| * |
|
For purposes of parent company reporting, discontinued operations (see Note 15,
“Discontinued Operations”) are included in the “Other income (loss), net” line item. |
63
INTERNET CAPITAL GROUP, INC.
NOTES TO CONSOLIDATED FINANCIAL STATEMENTS — (Continued)
9. Parent Company Financial Information — (Continued)
Parent Company Statements of Cash Flows
| |
|
|
|
|
|
|
|
|
|
|
|
|
| |
|
Year Ended December 31 |
|
| |
|
2009 |
|
|
2008 |
|
|
2007 |
|
| |
|
(in thousands) |
|
|
|
|
|
|
|
|
|
|
|
|
|
|
Operating Activities |
|
|
|
|
|
|
|
|
|
|
|
|
Net income (loss) |
|
$ |
15,534 |
|
|
$ |
(22,926 |
) |
|
$ |
(23,607 |
) |
Adjustments
to reconcile net income (loss) to cash used in operating activities |
|
|
|
|
|
|
|
|
|
|
|
|
Depreciation and amortization |
|
|
90 |
|
|
|
133 |
|
|
|
140 |
|
Impairment related and other |
|
|
4,876 |
|
|
|
9,058 |
|
|
|
— |
|
Equity-based compensation |
|
|
3,089 |
|
|
|
6,298 |
|
|
|
7,173 |
|
Equity (income) loss |
|
|
(9,665 |
) |
|
|
40,323 |
|
|
|
17,870 |
|
Other (income) loss |
|
|
(15,918 |
) |
|
|
(44,277 |
) |
|
|
(6,960 |
) |
Changes in assets and liabilities, net of effect of acquisitions: |
|
|
|
|
|
|
|
|
|
|
|
|
Taxes receivable |
|
|
(10,627 |
) |
|
|
4,889 |
|
|
|
(4,301 |
) |
Prepaid expenses and other assets |
|
|
299 |
|
|
|
(8 |
) |
|
|
(32 |
) |
Accounts payable |
|
|
(6 |
) |
|
|
6 |
|
|
|
(33 |
) |
Accrued expenses |
|
|
(51 |
) |
|
|
(1,480 |
) |
|
|
(254 |
) |
Other liabilities |
|
|
(60 |
) |
|
|
403 |
|
|
|
— |
|
|
|
|
|
|
|
|
|
|
|
Cash used in operating activities |
|
|
(12,439 |
) |
|
|
(7,581 |
) |
|
|
(10,004 |
) |
Investing Activities |
|
|
|
|
|
|
|
|
|
|
|
|
Capital expenditures, net |
|
|
(52 |
) |
|
|
(47 |
) |
|
|
(63 |
) |
Proceeds from sales of marketable securities |
|
|
21,625 |
|
|
|
60,233 |
|
|
|
24 |
|
Proceeds from sales of ownership interests in
partner companies |
|
|
2,607 |
|
|
|
3,267 |
|
|
|
34,925 |
|
Acquisitions
of ownership interests in partner companies, net |
|
|
(52,804 |
) |
|
|
(42,460 |
) |
|
|
(22,919 |
) |
|
|
|
|
|
|
|
|
|
|
Cash provided by (used in) investing activities |
|
|
(28,624 |
) |
|
|
20,993 |
|
|
|
11,967 |
|
Financing Activities |
|
|
|
|
|
|
|
|
|
|
|
|
Repurchase of senior convertible notes |
|
|
— |
|
|
|
— |
|
|
|
(37,087 |
) |
Share repurchases |
|
|
(2,702 |
) |
|
|
(9,329 |
) |
|
|
— |
|
|
|
|
|
|
|
|
|
|
|
Cash provided by (used in) financing activities |
|
|
(2,702 |
) |
|
|
(9,329 |
) |
|
|
(37,087 |
) |
|
|
|
|
|
|
|
|
|
|
Net increase (decrease) in cash and cash equivalents |
|
|
(43,765 |
) |
|
|
4,083 |
|
|
|
(35,124 |
) |
Cash and cash equivalents at beginning at year |
|
|
73,208 |
|
|
|
69,125 |
|
|
|
104,249 |
|
|
|
|
|
|
|
|
|
|
|
Cash and cash equivalents at end of year |
|
$ |
29,443 |
|
|
$ |
73,208 |
|
|
$ |
69,125 |
|
|
|
|
|
|
|
|
|
|
|
10.
Internet Capital Group, Inc.’s Stockholders’ Equity
Holders of the Company’s Common Stock are entitled to one vote per share and are entitled to
dividends as declared. No cash dividends have been declared to date, and the Company does not
intend to pay cash dividends in the foreseeable future.
The Company may establish one or more classes or series of preferred stock. The holders of the
preferred stock may be entitled to preferences over common stockholders with respect to dividends,
liquidation, dissolution, or winding up of the Company, as established by the Company’s Board of
Directors. As of December 31, 2009, 10,000,000 shares of preferred stock were authorized; none of
these shares have been issued, and the Company does not have any plan
to issue any of these shares in the foreseeable future.
64
INTERNET CAPITAL GROUP, INC.
NOTES TO CONSOLIDATED FINANCIAL STATEMENTS — (Continued)
10.
Internet Capital Group, Inc.’s Stockholders’ Equity — (Continued)
Stockholder Rights Plan
During 2000, the Company enacted a stockholder rights plan, which is set to expire on November 22,
2010. Under the stockholder rights plan, preferred stock purchase rights were distributed as a
dividend at the rate of one right for each share of Common Stock outstanding as of the close of
business on December 6, 2000, and one right per share has been issued in connection with shares
issued subsequent to such date. Each right entitles the holder to purchase from the Company one
ten-thousandth of a share of series A junior participating preferred stock of the Company at an
exercise price of $100 per right. The rights attached to the Company’s Common Stock are not
currently exercisable. The rights become exercisable and will separate from the Common Stock upon
the earlier to occur of (i) ten calendar days after a person or group acquires, or announces the
intent to acquire, beneficial ownership of 15% or more of the Company’s Common Stock, or (ii) ten
business days (or a later date following such announcement if determined by the Board of Directors
of the Company in accordance with the plan) after the announcement of a tender offer or an exchange
offer to acquire 15% or more of the Company’s outstanding Common Stock.
The rights are redeemable for $0.0001 per right at the option of the Company’s Board of Directors
at any time prior to the close of business on the tenth business day after the announcement of a
stock acquisition event described above. If not redeemed, the rights will expire on November 22,
2010. Prior to the date upon which the rights would become exercisable under the plan, the
Company’s outstanding stock certificates will represent both the shares of Common Stock and the
rights will trade only with the shares of Common Stock.
Generally, if the rights become exercisable, then each stockholder other than the acquirer is
entitled to purchase, for the exercise price, that number of shares of Common Stock that, at the
time of the transaction, will have a market value of three times the exercise price of the rights.
In addition, if, after the rights become exercisable, the Company is acquired in a merger or other
business combination, or 50% or more of its assets or earning power are sold, each right will
entitle the holder to purchase, at the exercise price of the rights, that number of shares of
Common Stock of the acquiring company that, at the time of the transaction, will have a market
value of three times the exercise price of the rights.
11. Equity-Based Compensation
As of December 31, 2009, incentive or non-qualified stock options may be granted to Company
employees, directors and consultants under the 2005 Omnibus Equity Compensation Plan (the “2005
Equity Plan”) or the LGO Corporation 2001 Equity Compensation Plan (f/k/a Logistics.com 2001 Equity
Compensation Plan) (the “LGO Plan” and, together with the 2005 Equity Plan, the “Plans”).
Generally, the grants vest over a one-to four-year period and expire eight to ten years after the
grant date. At December 31, 2009, the Company had 2,628,038 shares of Common Stock reserved under
the Plans for possible future issuance. Most partner companies also
maintain their own equity incentive/compensation
plans.
Total equity-based compensation
for the years ended December 31, 2009, 2008, and 2007 was $3.7
million, $6.8 million and $7.3 million, respectively. Equity-based compensation for these periods
is included primarily in “Selling, General and Administrative” on the Company’s consolidated
Statements of Operations. Not included in the table below is the expense associated with quarterly
Deferred Stock Unit grants to non-management directors in lieu of cash for service. See the
subsection entitled “Deferred Stock Units
(“DSUs”)” below in this Note 11.
65
INTERNET CAPITAL GROUP, INC.
NOTES TO CONSOLIDATED FINANCIAL STATEMENTS — (Continued)
11. Equity-Based Compensation — (Continued)
The following table provides additional information related to the Company’s equity-based
compensation:
| |
|
|
|
|
|
|
|
|
|
|
|
|
|
|
|
|
|
|
|
|
| |
|
|
|
|
|
|
|
|
|
|
|
|
|
|
|
|
|
Weighted |
|
| |
|
|
|
|
|
|
|
|
|
|
|
|
|
|
|
|
|
Average Years |
|
| |
|
|
|
|
|
|
|
|
|
|
|
|
|
|
|
|
|
Remaining of |
|
| |
|
|
|
|
|
|
|
|
|
|
|
|
|
|
|
|
|
Stock-Based |
|
| |
|
|
|
|
|
|
|
|
|
|
|
|
|
Unrecognized Stock- |
|
|
Compensation |
|
| |
|
|
|
|
Based Compensation |
|
|
Expense at |
|
| |
|
Year Ended December 31, |
|
|
at December 31, |
|
|
December 31, |
|
| |
|
2009 |
|
|
2008 |
|
|
2007 |
|
|
2009 |
|
|
2009 |
|
| |
Stock Appreciation Rights |
|
$ |
2,629 |
|
|
$ |
4,138 |
|
|
$ |
3,909 |
|
|
$ |
1,825 |
|
|
|
2.8 |
|
Stock Options |
|
|
3 |
|
|
|
29 |
|
|
|
122 |
|
|
|
1 |
|
|
|
2.9 |
|
Restricted Stock |
|
|
82 |
|
|
|
1,577 |
|
|
|
2,333 |
|
|
|
257 |
|
|
|
3.0 |
|
Deferred Stock Units |
|
|
174 |
|
|
|
320 |
|
|
|
330 |
|
|
|
24 |
|
|
|
0.2 |
|
|
|
|
|
|
|
|
|
|
|
|
|
|
|
|
|
|
Equity-Based Compensation |
|
$ |
2,888 |
|
|
$ |
6,064 |
|
|
$ |
6,694 |
|
|
$ |
2,107 |
|
|
|
|
|
|
|
|
|
|
|
|
|
|
|
|
|
|
|
|
|
|
|
|
|
|
Equity-Based Compensation
for Consolidated
Partner Companies: |
|
|
|
|
|
|
|
|
|
|
|
|
|
|
|
|
|
|
|
|
|
|
|
|
|
|
|
|
|
|
|
|
|
|
|
|
|
|
|
|
|
Restricted Stock |
|
|
763 |
|
|
|
770 |
|
|
|
559 |
|
|
|
766 |
|
|
|
1.8 |
|
|
|
|
|
|
|
|
|
|
|
|
|
|
|
|
|
|
|
|
|
|
|
|
|
|
|
|
|
|
|
|
|
|
|
|
|
|
|
|
|
$ |
3,651 |
|
|
$ |
6,834 |
|
|
$ |
7,253 |
|
|
$ |
2,873 |
|
|
|
|
|
|
|
|
|
|
|
|
|
|
|
|
|
|
|
|
|
|
Stock Appreciation Rights (“SARs”) and Stock Options Fair Value Assumptions
The following assumptions were used to determine the fair value of stock options and SARs granted
to employees by the Company for the three years ended December 31, 2009, 2008 and 2007:
| |
|
|
|
|
|
|
| |
|
2009 |
|
2008 |
|
2007 |
Expected volatility |
|
60% |
|
60% |
|
60% |
Average expected option life |
|
6.25 years |
|
6.25 years |
|
6.25 years |
Risk-free interest rate |
|
2.00-2.54% |
|
3.08% |
|
3.51-5.10% |
Dividend yield |
|
0.0% |
|
0.0% |
|
0.0% |
The Company estimates the grant date fair value of SARs and stock options using the Black-Scholes
option-pricing model, which requires the input of highly subjective assumptions. These assumptions
include estimating the expected life of the award and the estimated volatility of our stock price
over the expected term. Expected volatility is based on historical volatility of our Common Stock
over the period commensurate with the expected term of the stock options. The expected term
calculation for stock options granted is based on an average of the
stock option vest term and the life of the option. The risk-free interest rate is based on the U.S. Treasury yield in effect at the time of
grant for an instrument with a maturity that is commensurate with the expected term of the options.
Changes in these assumptions as well as a change in the estimated forfeitures of SARs and stock
option awards can materially affect the amount of equity-based compensation recognized in the
Company’s Consolidated Statements of Operations. Changes in the requisite service period
can materially affect the amount of equity-based compensation recognized in the Company’s
Consolidated Statements of Operations.
66
INTERNET CAPITAL GROUP, INC.
NOTES TO CONSOLIDATED FINANCIAL STATEMENTS — (Continued)
11. Equity-Based Compensation — (Continued)
SARs
In 2009, 2008 and 2007, the Company issued SARs to certain employees. Prior to February 28, 2007,
the Company granted SARs at a base price equal to the fair market value of its common stock on the
grant date, as determined by the most recent closing share price of the Company’s Common Stock
prior to the Board of Directors meeting at which the grant was made,
as reported on The NASDAQ Global Market. On February 28, 2007, the Company amended the definition of fair market value in its
equity compensation plans to provide that fair market value would be determined for future grants
by reference to the closing price of the Company’s Common Stock on the date of grant (or the
closing price of the next trading day if there are no trades in the Company’s stock on the date of
grant). Each SAR represents the right of the holder to receive, upon exercise of the SAR, shares
of Common Stock equal to the amount by which the fair market value of a share of common stock on
the date of exercise of the SAR exceeds the base price of the SAR.
Changes in SARs for the year ended December 31, 2009 were as follows:
| |
|
|
|
|
|
|
|
|
|
|
|
|
| |
|
|
|
|
|
Weighted |
|
|
Weighted |
|
| |
|
|
|
|
|
Average |
|
|
Average |
|
| |
|
SARs |
|
|
Base Price |
|
|
Fair Value |
|
Issued at December 31, 2006 |
|
|
3,650,179 |
|
|
$ |
7.45 |
|
|
$ |
4.50 |
|
|
|
|
|
|
|
|
|
|
|
|
|
SARs cancelled |
|
|
(134,064 |
) |
|
$ |
7.34 |
|
|
$ |
4.43 |
|
SARs granted |
|
|
100,000 |
|
|
$ |
11.96 |
|
|
$ |
7.18 |
|
|
|
|
|
|
|
|
|
|
|
|
|
Issued at December 31, 2007 |
|
|
3,616,115 |
|
|
$ |
7.58 |
|
|
$ |
4.58 |
|
SARs exercised |
|
|
(67,363 |
) |
|
$ |
7.34 |
|
|
$ |
4.43 |
|
SARs cancelled |
|
|
(782 |
) |
|
$ |
7.34 |
|
|
$ |
4.43 |
|
SARs granted |
|
|
322,400 |
|
|
$ |
8.41 |
|
|
$ |
4.96 |
|
|
|
|
|
|
|
|
|
|
|
|
|
Issued at December 31, 2008 |
|
|
3,870,370 |
|
|
$ |
7.65 |
|
|
$ |
4.61 |
|
SARs granted |
|
|
100,000 |
|
|
$ |
7.00 |
|
|
$ |
4.07 |
|
|
|
|
|
|
|
|
|
|
|
|
|
Issued at December 31, 2009 |
|
|
3,970,370 |
|
|
$ |
7.63 |
|
|
$ |
4.60 |
|
|
|
|
|
|
|
|
|
|
|
|
|
The following table summarizes information about SARs outstanding at December 31, 2009:
| |
|
|
|
|
|
|
|
|
|
|
|
|
|
|
|
|
| |
|
|
|
|
|
|
|
|
|
Weighted Average |
|
|
Aggregate Intrinsic |
|
| |
|
|
|
|
|
|
|
|
|
Remaining |
|
|
Value of SARs |
|
| |
|
|
|
|
|
|
|
|
|
Contractual Life |
|
|
Outstanding at |
|
| |
|
SARs |
|
|
SARs |
|
|
of SARs Outstanding |
|
|
December 31, 2009 |
|
| Grant Price |
|
Outstanding |
|
|
Exercisable |
|
|
(in years) |
|
|
(in thousands) |
|
$7.00 |
|
|
100,000 |
|
|
|
— |
|
|
|
9.8 |
|
|
$ |
— |
|
$7.34 |
|
|
3,241,520 |
|
|
|
3,241,520 |
|
|
|
6.0 |
|
|
$ |
— |
|
$8.14 – $8.18 |
|
|
55,000 |
|
|
|
49,792 |
|
|
|
6.4 |
|
|
$ |
— |
|
$8.41 |
|
|
322,400 |
|
|
|
101,259 |
|
|
|
8.7 |
|
|
$ |
— |
|
$9.50 – $12.01 |
|
|
251,450 |
|
|
|
198,565 |
|
|
|
6.8 |
|
|
$ |
— |
|
|
|
|
|
|
|
|
|
|
|
|
|
|
|
|
|
|
3,970,370 |
|
|
|
3,591,136 |
|
|
|
|
|
|
$ |
— |
|
|
|
|
|
|
|
|
|
|
|
|
|
|
|
At December 31, 2009, the Company expects an additional 342,671 SARs to vest.
67
INTERNET CAPITAL GROUP, INC.
NOTES TO CONSOLIDATED FINANCIAL STATEMENTS — (Continued)
11. Equity-Based Compensation — (Continued)
Stock Options
The fair value of each stock option is estimated on the grant date using the Black-Scholes
option-pricing model. Stock options generally vest over four years.
Changes in stock options for the year ended December 31, 2009 were as follows:
| |
|
|
|
|
|
|
|
|
|
|
|
|
| |
|
|
|
|
|
Weighted |
|
|
Weighted |
|
| |
|
|
|
|
|
Average |
|
|
Average |
|
| |
|
|
|
|
|
Grant Date |
|
|
Grant Date |
|
| |
|
Shares |
|
|
Exercise Price |
|
|
Fair Value |
|
Outstanding at December 31, 2006 and 2007 |
|
|
637,454 |
|
|
$ |
37.13 |
|
|
$ |
29.69 |
|
Options granted |
|
|
500 |
|
|
$ |
7.22 |
|
|
$ |
4.26 |
|
Options forfeited |
|
|
(23,000 |
) |
|
$ |
19.76 |
|
|
$ |
15.70 |
|
|
|
|
|
|
|
|
|
|
|
|
|
Outstanding at December 31, 2008 |
|
|
614,954 |
|
|
$ |
36.58 |
|
|
$ |
29.81 |
|
Options granted |
|
|
250 |
|
|
$ |
4.30 |
|
|
$ |
2.47 |
|
Options forfeited |
|
|
(85,800 |
) |
|
$ |
42.75 |
|
|
$ |
34.35 |
|
|
|
|
|
|
|
|
|
|
|
|
|
Outstanding at December 31, 2009 |
|
|
529,404 |
|
|
$ |
35.56 |
|
|
$ |
29.06 |
|
|
|
|
|
|
|
|
|
|
|
|
|
At December 31, 2009, 2008 and 2007 there were 528,351, 613,818 and 629,937 options exercisable,
respectively, at a weighted average exercise price of $35.63, $36.64 and $37.48 per share,
respectively, under the Plans.
The following tables summarize information about stock options outstanding at December 31, 2009:
| |
|
|
|
|
|
|
|
|
|
|
|
|
|
|
|
|
| |
|
|
|
|
|
|
|
|
|
Weighted Average |
|
|
|
|
| |
|
|
|
|
|
|
|
|
|
Remaining |
|
|
Aggregate Intrinsic |
|
| |
|
|
|
|
|
|
|
|
|
Contractual Life |
|
|
Value at |
|
| |
|
Shares |
|
|
Shares |
|
|
of Shares Outstanding |
|
|
December 31, 2009 |
|
| Exercise Price |
|
Outstanding |
|
|
Vested |
|
|
(in years) |
|
|
(in thousands) |
|
$4.30 – $8.00 |
|
|
137,474 |
|
|
|
136,588 |
|
|
|
3.3 |
|
|
$ |
211 |
|
$8.01 – $12.00 |
|
|
163,483 |
|
|
|
163,316 |
|
|
|
3.3 |
|
|
$ |
— |
|
$12.01 – $20.00 |
|
|
102,699 |
|
|
|
102,699 |
|
|
|
2.0 |
|
|
$ |
— |
|
$20.01 – $2,210.00 |
|
|
125,748 |
|
|
|
125,748 |
|
|
|
1.0 |
|
|
$ |
— |
|
|
|
|
|
|
|
|
|
|
|
|
|
|
|
|
|
|
529,404 |
|
|
|
528,351 |
|
|
|
|
|
|
$ |
211 |
|
|
|
|
|
|
|
|
|
|
|
|
|
|
|
At December 31, 2009, the Company expects an additional 1,053 shares to vest.
68
INTERNET CAPITAL GROUP, INC.
NOTES TO CONSOLIDATED FINANCIAL STATEMENTS — (Continued)
11. Equity-Based Compensation — (Continued)
Restricted Stock
Changes in restricted stock for the years ended December 31, 2009, 2008 and 2007 are shown in the
following table:
| |
|
|
|
|
|
|
|
|
| |
|
|
|
|
|
Weighted |
|
| |
|
|
|
|
|
Average Grant |
|
| |
|
Shares |
|
|
Date Fair Value |
|
Issued and unvested, December 31, 2006 |
|
|
818,622 |
|
|
$ |
7.28 |
|
|
|
|
|
|
|
|
|
Granted |
|
|
15,000 |
|
|
$ |
12.01 |
|
Vested |
|
|
(311,499 |
) |
|
$ |
7.22 |
|
Forfeited |
|
|
(35,844 |
) |
|
$ |
7.23 |
|
|
|
|
|
|
|
|
|
Issued and unvested December 31, 2007 |
|
|
486,279 |
|
|
$ |
7.39 |
|
Vested |
|
|
(468,729 |
) |
|
$ |
7.20 |
|
Forfeited |
|
|
(250 |
) |
|
$ |
6.98 |
|
|
|
|
|
|
|
|
Issued and unvested, December 31, 2008 |
|
|
17,300 |
|
|
$ |
10.82 |
|
Granted |
|
|
24,000 |
|
|
$ |
7.00 |
|
Vested |
|
|
(6,775 |
) |
|
$ |
10.49 |
|
|
|
|
|
|
|
|
|
Issued and unvested, December 31, 2009 |
|
|
34,525 |
|
|
$ |
8.23 |
|
|
|
|
|
|
|
|
|
The total aggregate fair value of restricted stock awards that vested and were converted to the
Company’s Common Stock during the years ended December 31, 2009, 2008 and 2007 was $0.1 million,
$3.3 million and $3.8 million, respectively. During the year ended December 31, 2009, 1,182 shares
were surrendered for satisfying withholding taxes. At December 31, 2009, the Company expects the
27,025 outstanding restricted shares to vest.
Recipients of restricted stock did not pay any cash consideration to the Company for the shares and
have the right to vote all shares subject to the grant and receive all dividends with respect to
the shares, whether or not the shares have vested. The 2009 and 2007 restricted stock grants were
each valued at $0.2 million, and are being amortized over the vesting period. There were no
restricted stock grants in 2008. The 2009 restricted stock grants vest 25% in 2010 and ratably 25%
each October through 2013. The 2007 restricted stock grants vest 25% in 2008 and ratably 25% each
November through 2011.
Deferred Stock Units (“DSUs”)
In 2009, 2008 and 2007, each non-management member of the Company’s Board of Directors received
DSUs for his service on the Board and its committees under the Company’s Non-Management Director
Compensation Plan (the “Director Plan”). DSUs received by directors in conjunction with their
service on the Board and its committees vest on the anniversary date of the grant. Also in 2009,
2008 and 2007, the Company issued quarterly compensation payments to each non-management director
for his service on the Board and its committees under the Director Plan. The director had the
right to elect to receive such payments in whole or in part in the form of DSUs in lieu of cash
under the Internet Capital Group, Inc. Director Deferred Stock Unit Program. Through 2007, if
directors elected to receive DSUs in conjunction with the quarterly compensation payments, the
directors were entitled to the right to receive the number of shares of Common Stock of the Company
equal to the fees earned by the director divided by 75% of the fair market value of a share of the
Company’s Common Stock as of the date on which the fees would have been paid. Beginning in 2008,
the number of shares the directors received was based on their fees earned and 100% of the fair
market value of a share of the Company’s common stock as of the date on which the fees would have
been paid. The Company recorded expense when these DSUs were issued as they are immediately vested
on the grant date.
69
INTERNET CAPITAL GROUP, INC.
NOTES TO CONSOLIDATED FINANCIAL STATEMENTS — (Continued)
11. Equity-Based Compensation — (Continued)
During the years ended December 31, 2009, 2008 and 2007, the Company issued DSUs to the Company’s
non-management directors valued at $0.3 million, $0.5 million and $0.5 million, respectively. The
expense of $0.1 million, $0.3 million and $0.3 million for the years ended December 31, 2009, 2008
and 2007, respectively, associated with the annual DSU grants is included in equity-based
compensation expense. The expense of $0.2 million, $0.2 million and $0.6 million for the years
ended December 31, 2009, 2008 and 2007, respectively, associated with the quarterly grants for
service, is included in “Selling, General and Administrative” (but is not reflected in summarized
Equity-Based Compensation table above) on the Company’s Consolidated Statements of Operations.
Changes in DSUs for the year ended December 31, 2009 are shown in the following table:
| |
|
|
|
|
|
|
|
|
| |
|
|
|
|
|
Weighted Average |
|
| |
|
DSUs |
|
|
Grant Date Fair Value |
|
Issued and unvested, December 31, 2006 |
|
|
21,500 |
|
|
$ |
9.20 |
|
Granted |
|
|
74,375 |
|
|
$ |
11.33 |
|
Vested |
|
|
(64,375 |
) |
|
$ |
11.43 |
|
|
|
|
|
|
|
|
|
Issued and unvested, December 31, 2007 |
|
|
31,500 |
|
|
$ |
11.37 |
|
Granted |
|
|
36,000 |
|
|
$ |
8.70 |
|
Vested |
|
|
(31,500 |
) |
|
$ |
11.37 |
|
|
|
|
|
|
|
|
|
Issued and unvested, December 31, 2008 |
|
|
36,000 |
|
|
$ |
8.70 |
|
Granted |
|
|
36,000 |
|
|
$ |
4.05 |
|
Vested |
|
|
(36,000 |
) |
|
$ |
8.70 |
|
|
|
|
|
|
|
|
|
Issued and unvested, December 31, 2009 |
|
|
36,000 |
|
|
$ |
4.05 |
|
|
|
|
|
|
|
|
|
Consolidated Partner Companies
The Company’s consolidated partner companies recorded $0.8 million, $0.8 million and $0.6 million
of equity based compensation related to stock-based awards during the years ended December 31, 2009, 2008
and 2007, respectively.
In December 2007, ICG Commerce exchanged its employee stock options for restricted stock and
granted restricted stock to its new Chief Executive Officer. The total fair value associated with
these activities was $0.6 million in 2007.
At December 31, 2009, the total unrecognized compensation cost related to non-vested stock-based
awards granted under the consolidated partner companies’ plans was $0.8 million. That cost is
expected to be recognized over a weighted-average period of 1.8 years.
12. Commitments and Contingencies
The Company and its consolidated subsidiaries are involved in various claims and legal actions
arising in the ordinary course of business. In the opinion of management, the amount of the
ultimate liability with respect to these actions will not materially affect the financial position,
results of operations or cash flows of the Company and its subsidiaries.
The Company and its consolidated partner companies lease their facilities under operating lease
agreements expiring 2010 through 2014 and thereafter. Future minimum lease payments as of December
31, 2009 under the leases are as follows (in thousands):
| |
|
|
|
|
2010 |
|
$ |
2,536 |
|
2011 |
|
$ |
2,458 |
|
2012 |
|
$ |
1,917 |
|
2013 |
|
$ |
1,375 |
|
2014 |
|
$ |
1,399 |
|
Thereafter |
|
$ |
2,972 |
|
70
INTERNET CAPITAL GROUP, INC.
NOTES TO CONSOLIDATED FINANCIAL STATEMENTS — (Continued)
12. Commitments and Contingencies — (Continued)
Rent expense under the non-cancelable operating leases was $2.5 million in 2009, $1.9 million in
2008 and $1.5 million in 2007.
Some of the Company’s partner companies are not presumed by the SEC to be controlled by the
Company. Increases in the value of the Company’s interests in non-controlled partner companies and
changes in income or loss and revenue attributable to them could result in the Company’s inability
to comply with the order exempting it from registering under the Investment Company Act unless it
takes action to come into compliance with the order. The Company believes it can take actions to
maintain compliance with its exemptive order that will not adversely affect its operations or
stockholder value.
13. Other Income (Loss)
Other Income (Loss), net
Other income (loss), net consists of the effect of transactions and other events relating to the
Company’s ownership interests in its partner companies and its operations in general.
| |
|
|
|
|
|
|
|
|
|
|
|
|
| |
|
Year Ended December 31, |
|
| |
|
2009 |
|
|
2008 |
|
|
2007 |
|
| |
|
(in thousands) |
|
Sales/distributions of ownership interests in Partner
Companies (Note 3) |
|
$ |
2,607 |
|
|
$ |
38,007 |
|
|
$ |
9,786 |
|
Losses on debt extinguishment (Note 7) |
|
|
— |
|
|
|
— |
|
|
|
(3,812 |
) |
Unrealized gain (loss) on mark-to-market of hedges (Note 4) |
|
|
(7,098 |
) |
|
|
10,204 |
|
|
|
(3,651 |
) |
Realized gains (losses) on marketable securities |
|
|
21,285 |
|
|
|
634 |
|
|
|
23 |
|
Impairments of cost method Partner Companies |
|
|
— |
|
|
|
(4,735 |
) |
|
|
— |
|
Loss on termination of cashless collar contracts (Note 4) |
|
|
(480 |
) |
|
|
— |
|
|
|
— |
|
Other |
|
|
(338 |
) |
|
|
167 |
|
|
|
4,437 |
|
|
|
|
|
|
|
|
|
|
|
|
|
$ |
15,976 |
|
|
$ |
44,277 |
|
|
$ |
6,783 |
|
Total other income (loss) for Consolidated Partner Companies |
|
|
602 |
|
|
|
(1,052 |
) |
|
|
71 |
|
|
|
|
|
|
|
|
|
|
|
|
|
$ |
16,578 |
|
|
$ |
43,225 |
|
|
$ |
6,854 |
|
|
|
|
|
|
|
|
|
|
|
During the year ended December 31, 2009, the Company sold shares of Blackboard and ICE and
recorded gains of $21.1 million and $0.2 million, respectively.
See Note 4,
“Marketable Securities” and Note 3, “Ownership Interests in Partner Companies, Goodwill and
Intangibles, net.”
During the year ended December 31, 2008, the Company sold shares of ICE common stock and recorded
gains of $0.6 million on these sales. See Note 3,
“Ownership Interest in Partner Companies, Goodwill and Intangibles, net.”
During the year ended December 31, 2008, the Company concluded that the carrying value of several
cost method companies would not be recoverable and recorded impairments totaling $4.7 million to
reduce the Company’s carrying value of these cost method companies. During 2007, the Company
reversed a $3.0 million accrual related to costs directly associated with the acquisition of
partner company ownership interests in 2001, since the statute of limitations with respect to such
matters has expired.
71
INTERNET CAPITAL GROUP, INC.
NOTES TO CONSOLIDATED FINANCIAL STATEMENTS — (Continued)
14. Income Taxes
Total
income tax (benefit) expense was allocated as follows:
| |
|
|
|
|
|
|
|
|
|
|
|
|
| |
|
Year Ended December 31, |
|
| |
|
2009 |
|
|
2008 |
|
|
2007 |
|
| |
|
(in thousands) |
|
Income tax (benefit) expense
from continuing operations: |
|
|
|
|
|
|
|
|
|
|
|
|
Current taxes |
|
|
|
|
|
|
|
|
|
|
|
|
Federal taxes |
|
$ |
(10,455 |
) |
|
$ |
(147 |
) |
|
$ |
(4,252 |
) |
State taxes |
|
|
(9 |
) |
|
|
53 |
|
|
|
— |
|
Foreign taxes |
|
|
(175 |
) |
|
|
451 |
|
|
|
260 |
|
|
|
|
|
|
|
|
|
|
|
Current taxes |
|
$ |
(10,639 |
) |
|
$ |
357 |
|
|
$ |
(3,992 |
) |
|
|
|
|
|
|
|
|
|
|
|
|
|
|
|
|
|
|
|
|
|
|
|
Deferred taxes |
|
|
|
|
|
|
|
|
|
|
|
|
Federal taxes |
|
|
(28,702 |
) |
|
|
— |
|
|
|
— |
|
State taxes |
|
|
65 |
|
|
|
— |
|
|
|
— |
|
Foreign taxes |
|
|
(234 |
) |
|
|
— |
|
|
|
— |
|
|
|
|
|
|
|
|
|
|
|
Deferred taxes |
|
|
(28,871 |
) |
|
|
— |
|
|
|
— |
|
|
|
|
|
|
|
|
|
|
|
Income tax
(benefit) expense |
|
$ |
(39,510 |
) |
|
$ |
357 |
|
|
$ |
(3,992 |
) |
|
|
|
|
|
|
|
|
|
|
The
Company and InvestorForce join in filing a consolidated federal income tax return. As a
result of a change in ownership of the Company under Internal Revenue Code Section 382 that
occurred in 2004, its net operating loss carryforwards, capital loss carryforwards and certain
other deferred tax assets are subject to an annual limitation. The annual limitation on the
utilization of these carryforwards is approximately $14.5 million. This annual limitation can be
carried forward if it is not used. The Company did not use the
limitation in 2009; therefore, the
amount available for 2010 is $29 million. The total amount
available For these carryforwards at
December 31, 2009 is $217.8 million. These losses expire in
varying amounts between 2010 and 2023.
Additionally,
at December 31, 2009 the Company and InvestorForce have $25.4 million of net
operating loss carryforwards and $3.0 million of capital loss carryforwards that are not subject to
the Section 382 annual limitation. The net operating losses expire between 2026 and 2029 and the
capital losses expire in 2014.
GovDelivery will join in filing the consolidated federal income tax return with the
Company and InvestorForce beginning in 2010. As of December 31, 2009, GovDelivery has
approximately $2.8 million of net operating loss carryforwards. The Company’s acquisition
of GovDelivery in 2009 constituted a change in ownership under Internal Revenue Code
Section 382. As a result, GovDelivery’s net operating losses are limited to approximately
$1.0 million per year plus any recognized built-in gains. GovDelivery’s net deferred tax
liability after acquisition accounting of $4.8 million reduced the Company’s valuation allowance.
During
2009, the Internal Revenue Service completed its audit of the Company’s federal income tax returns for the
years 2005 through 2007. As a result of this audit, the Company is entitled to a refund in the
amount of $4.7 million. The refund is primarily related to the Company’s ability to utilize
certain capital losses which the Company previously thought were not utilizable as a result of the
Company’s ownership change in 2004.
In
November 2009, the Worker, Homeownership and Business Assistance Act of 2009, which
expanded the ability of businesses to carry back net operating losses
was enacted. This legislation allows the
Company to carry back its net operating loss from 2008 or 2009 to
2005, when the Company paid
federal income taxes. The Company expects to carry back its net operating loss, excluding the net
operating loss attributable to InvestorForce from 2009, which will result in a refund of
approximately $5.9 million.
A
valuation allowance has been provided for the Company’s net deferred tax assets as the Company
believes, after evaluating all positive and negative evidence, both historical and prospective, that it
is more likely than not that these benefits will not be realized.
72
INTERNET CAPITAL GROUP, INC.
NOTES TO CONSOLIDATED FINANCIAL STATEMENTS — (Continued)
14. Income Taxes — (Continued)
ICG Commerce files its own consolidated federal income tax return, separate from the Company. Due
to ICG Commerce’s prior equity transactions, it experienced a change in ownership under
Internal Revenue Code Section 382 in 2003. As a result, its net operating loss carryforwards are subject
to an annual
limitation. Based on an Internal Revenue Code Section 382 study completed in early 2010,
approximately $74.0 million of net operating loss carryforwards are expected to be available to the
Company between December 31, 2009 and December 31, 2023. The annual limitation ICG Commerce has on
the utilization of its net operating losses is approximately $3.1 million per year. The amount
available in 2010 is approximately $34.1 million.
As of December 31, 2009, in light of ICG Commerce’s consistent recent history of profitability,
current-year results and its estimates of projected future profitability, management believes that
it is more likely than not that the benefit of the majority of its net deferred tax assets will be
realized and therefore a reduction of the valuation allowance against its net deferred tax asset is
appropriate. Accordingly the Company recognized a deferred tax benefit of $28.7 million related to the
reduction of the valuation allowance in 2009.
ICG Commerce maintains a valuation allowance for its state net operating losses and its capital
loss carryovers. The valuation allowance on the state net operating loss deferred tax assets is
necessary due to the expectation that most will expire unused due to the timing and the amount of
taxable income apportioned to these states on a separate company basis. A valuation allowance for
the deferred tax asset associated with the capital loss carryovers is appropriate because ICG
Commerce does not expect to generate any capital gains before the losses expire.
The Company’s net deferred tax asset (liability) consists of the following:
| |
|
|
|
|
|
|
|
|
| |
|
As of December 31, |
|
| |
|
2009 |
|
|
2008 |
|
| |
|
(in thousands) |
|
Deferred tax assets: |
|
|
|
|
|
|
|
|
|
|
|
|
|
|
|
|
|
Net operating loss and capital loss carryforward — 382 limited |
|
$ |
121,103 |
|
|
$ |
115,641 |
|
Net operating loss carryforward — not 382 limited |
|
|
8,907 |
|
|
|
7,346 |
|
Capital loss carryforward — not 382 limited |
|
|
2,063 |
|
|
|
984 |
|
Partner Company basis difference |
|
|
121,058 |
|
|
|
138,199 |
|
Reserves and accruals |
|
|
3,743 |
|
|
|
2,007 |
|
Stock-based compensation expense |
|
|
8,270 |
|
|
|
6,991 |
|
AMT and other credits |
|
|
406 |
|
|
|
188 |
|
Other, net |
|
|
2,524 |
|
|
|
2,278 |
|
|
|
|
|
|
|
|
Total deferred tax assets |
|
|
268,074 |
|
|
|
273,634 |
|
Valuation allowance |
|
|
(208,395 |
) |
|
|
(254,663 |
) |
|
|
|
|
|
|
|
Deferred tax asset |
|
|
59,679 |
|
|
|
18,971 |
|
|
|
|
|
|
|
|
|
|
|
|
|
|
|
|
|
Deferred tax liabilities: |
|
|
|
|
|
|
|
|
Intangible assets |
|
|
(5,898 |
) |
|
|
— |
|
Other comprehensive income |
|
|
(24,910 |
) |
|
|
(18,971 |
) |
|
|
|
|
|
|
|
Total deferred tax liabilities |
|
|
(30,808 |
) |
|
|
(18,971 |
) |
|
|
|
|
|
|
|
|
|
|
|
|
|
|
|
|
Total net deferred tax assets |
|
$ |
28,871 |
|
|
$ |
— |
|
|
|
|
|
|
|
|
Beginning in 2009, the Company has modified its presentation of deferred tax assets and
liabilities. ICG Commerce’s deferred tax assets and liabilities have been combined with the
Company’s, and the Company has reduced the gross amount of its net operating loss and capital loss
carryforwards that are subject to the Section 382 limitation to the amount of the limitation
available until the carryforwards expire.
In connection with the decrease in the valuation allowance, ICG Commerce evaluated its exposure
under the provisions of ASC 740-10, “Accounting for Uncertainty in Income Taxes,” and as a result,
recorded a liability for unrecognized income tax expenses of $0.3 million at December 31, 2009. The
unrecognized tax expenses relate to ICG Commerce’s treatment of accrued bonuses, the treatment of
an alternative minimum tax foreign tax credit, and unfiled state tax returns.
The Company’s practice is to recognize interest and/or penalties related to income tax matters in
income tax expense. The Company had no material accrual for interest or penalties on the Company’s
Consolidated Balance Sheets at December 31, 2009 or 2008, and has not recognized any material
interest and/or penalties in the Company’s Consolidated Statement of Operations for the year ended
December 31, 2009.
73
INTERNET CAPITAL GROUP, INC.
NOTES TO CONSOLIDATED FINANCIAL STATEMENTS — (Continued)
14. Income Taxes — (Continued)
The effective tax rate differs from the federal statutory rate as follows:
| |
|
|
|
|
|
|
|
|
|
|
|
|
| |
|
Year Ended December 31, |
|
| |
|
2009 |
|
|
2008 |
|
|
2007 |
|
Tax expense (benefit) at statutory rate |
|
|
(35.0 |
)% |
|
|
(35.0 |
)% |
|
|
(35.0 |
)% |
IRS audit
adjustment |
|
|
(43.4 |
)% |
|
|
— |
|
|
|
— |
|
Foreign and state taxes |
|
|
(3.2 |
)% |
|
|
2.1 |
% |
|
|
— |
|
Non-deductible expenses and other |
|
|
(2.9 |
)% |
|
|
1.2 |
% |
|
|
10.9 |
% |
Valuation allowance |
|
|
(275.3 |
)% |
|
|
33.2 |
% |
|
|
12.9 |
% |
|
|
|
|
|
|
|
|
|
|
|
|
|
(359.8 |
)% |
|
|
1.5 |
% |
|
|
(11.2 |
)% |
|
|
|
|
|
|
|
|
|
|
15. Discontinued Operations
The Company recorded a gain of approximately $1.0 million in 2007 related to escrow proceeds
received from the sale of the database division of InvestorForce in 2006. The Company recognized
$0.2 million in the year ended December 31, 2007 related to its share of net loss for the 2006
operating activities of InvestorForce’s database division.
During 2007, the Company received $0.2 million of additional proceeds from the sale of the assets
of Delphion, Inc.
These partner
companies have been treated as discontinued operations. Accordingly, the operating results of
these discontinued operations have been presented separately from continuing operations and include
the gains or losses recognized on disposition in the line item “Income (loss) on discontinued
operations” in the Company’s Consolidated Statements of Operations.
16. Net Income (Loss) per Share
The calculations of net income (loss) per share were:
| |
|
|
|
|
|
|
|
|
|
|
|
|
| |
|
Year Ended December 31, |
|
| |
|
2009 |
|
|
2008 |
|
|
2007 |
|
| |
|
(in thousands, except shares and per share data) |
|
Income
(loss) attributable to Internet Capital Group, Inc.: |
|
|
|
|
|
|
|
|
|
|
|
|
Income (loss) from continuing operations |
|
$ |
15,534 |
|
|
$ |
(22,926 |
) |
|
$ |
(24,602 |
) |
Income (loss) on discontinued operations |
|
|
— |
|
|
|
— |
|
|
|
995 |
|
|
|
|
|
|
|
|
|
|
|
Net income (loss) |
|
$ |
15,534 |
|
|
$ |
(22,926 |
) |
|
$ |
(23,607 |
) |
|
|
|
|
|
|
|
|
|
|
|
|
|
|
|
|
|
|
|
|
|
|
|
Basic
income (loss) per share attributable to Internet Capital Group, Inc.: |
|
|
|
|
|
|
|
|
|
|
|
|
Income
(loss) from continuing operations per share |
|
$ |
0.42 |
|
|
$ |
(0.60 |
) |
|
$ |
(0.64 |
) |
Income (loss) on discontinued operations per share |
|
|
— |
|
|
|
— |
|
|
|
0.02 |
|
|
|
|
|
|
|
|
|
|
|
Net income (loss) per share |
|
$ |
0.42 |
|
|
$ |
(0.60 |
) |
|
$ |
(0.62 |
) |
|
|
|
|
|
|
|
|
|
|
|
|
|
|
|
|
|
|
|
|
|
|
|
Diluted
income (loss) per share attributable to Internet Capital Group, Inc.: |
|
|
|
|
|
|
|
|
|
|
|
|
Income
(loss) from continuing operations per share |
|
$ |
0.42 |
|
|
$ |
(0.60 |
) |
|
$ |
(0.64 |
) |
Income (loss) on discontinued operations per share |
|
|
— |
|
|
|
— |
|
|
|
0.02 |
|
|
|
|
|
|
|
|
|
|
|
Net income (loss) per share |
|
$ |
0.42 |
|
|
$ |
(0.60 |
) |
|
$ |
(0.62 |
) |
|
|
|
|
|
|
|
|
|
|
|
|
|
|
|
|
|
|
|
|
|
|
|
Basic weighted average common shares outstanding |
|
|
36,660,158 |
|
|
|
38,105,583 |
|
|
|
37,915,626 |
|
|
|
|
|
|
|
|
|
|
|
Incremental Diluted Shares Impact: |
|
|
|
|
|
|
|
|
|
|
|
|
Stock options |
|
|
22,776 |
|
|
|
— |
|
|
|
— |
|
Restricted stock |
|
|
241 |
|
|
|
— |
|
|
|
— |
|
DSUs |
|
|
21,801 |
|
|
|
— |
|
|
|
— |
|
SARs |
|
|
— |
|
|
|
— |
|
|
|
— |
|
|
|
|
|
|
|
|
|
|
|
Diluted weighted average common shares outstanding |
|
|
36,704,976 |
|
|
|
38,105,583 |
|
|
|
37,915,626 |
|
|
|
|
|
|
|
|
|
|
|
74
INTERNET CAPITAL GROUP, INC.
NOTES TO CONSOLIDATED FINANCIAL STATEMENTS — (Continued)
16. Net Income (Loss) per Share — (Continued)
The following potentially dilutive securities were not included in the computation of diluted net
loss per share, as their effect would have been anti-dilutive:
| |
|
|
|
|
|
|
|
|
| |
|
|
|
|
|
Weighted Average |
|
| |
|
Shares |
|
|
Price per Share |
|
|
|
|
|
|
|
|
|
|
Year ended December 31, 2009 |
|
|
|
|
|
|
|
|
Stock options |
|
|
406,730 |
|
|
$ |
46.57 |
|
SARs |
|
|
3,970,370 |
|
|
$ |
7.63 |
|
Restricted stock |
|
|
32,025 |
|
|
$ |
8.23 |
|
|
|
|
|
|
|
|
|
|
Year ended December 31, 2008 |
|
|
|
|
|
|
|
|
Stock options |
|
|
614,954 |
|
|
$ |
36.58 |
|
SARs |
|
|
3,870,370 |
|
|
$ |
7.65 |
|
Restricted stock |
|
|
17,300 |
|
|
$ |
10.82 |
|
DSUs |
|
|
36,000 |
|
|
$ |
8.70 |
|
|
|
|
|
|
|
|
|
|
Year Ended December 31, 2007 |
|
|
|
|
|
|
|
|
Stock options |
|
|
637,454 |
|
|
$ |
37.13 |
|
SARs |
|
|
3,616,115 |
|
|
$ |
7.58 |
|
Restricted stock |
|
|
486,279 |
|
|
$ |
7.39 |
|
DSUs |
|
|
31,500 |
|
|
$ |
11.37 |
|
Warrants |
|
|
12,500 |
|
|
$ |
6.00 |
|
17. Share Repurchase Program
In 2008, the Company announced the approval by its Board of Directors of a share repurchase program
under which the Company could repurchase, from time to time, up to $25.0 million of shares of
Common Stock in the open market, in privately negotiated transactions or pursuant to trading plans
meeting the requirements of Rule 10b5-1 under the Exchange Act. During the year ended December 31,
2009, the Company repurchased a total of 492,242 shares of its Common Stock at an average purchase
price of $5.45 per share. During the year ended December 31, 2008, the Company repurchased a total
of 1,948,158 shares of its Common Stock at an average purchase price of $4.75 per share.
18. Related Parties
During 2004, the Company entered into a consulting arrangement with an individual who served on the
Company’s Board of Directors from 2001 to 2007. The Company expensed $0.2 million for the year
ended December 31, 2007 related to this consulting arrangement, which is reflected in “Selling,
General and Administrative” on the Company’s Consolidated Statements of Operations. The Company
also expensed equity-based compensation of $0.3 million in 2007 related to this consulting
arrangement.
The Company provides strategic and operational support to its partner companies in the normal
course of its business. The Company’s employees and consultants generally provide these services.
The costs related to employees are paid by the Company and are reflected by the Company in general
and administrative expenses. Non-management members of the Company’s Board of Directors are
compensated with cash and equity grants in the Company that are accounted for in accordance with
guidance for share based payment compensation.
75
INTERNET CAPITAL GROUP, INC.
NOTES TO CONSOLIDATED FINANCIAL STATEMENTS — (Continued)
19. Selected Quarterly Financial Information (Unaudited)
The following table sets forth selected quarterly consolidated financial information for the years
ended December 31, 2009 and 2008. The operating results for any given quarter are not necessarily
indicative of results for any future period.
| |
|
|
|
|
|
|
|
|
|
|
|
|
|
|
|
|
|
|
|
|
|
|
|
|
|
|
|
|
|
|
|
|
| |
|
Fiscal 2009 Quarter Ended |
|
|
Fiscal 2008 Quarter Ended |
|
| |
|
Mar. 31 |
|
|
Jun. 30 |
|
|
Sep. 30 |
|
|
Dec. 31 |
|
|
Mar. 31 |
|
|
Jun. 30 |
|
|
Sep. 30 |
|
|
Dec. 31 |
|
| |
|
(in thousands, except per share data) |
|
Revenues |
|
$ |
21,652 |
|
|
$ |
22,077 |
|
|
$ |
22,572 |
|
|
$ |
23,951 |
|
|
$ |
16,022 |
|
|
$ |
17,581 |
|
|
$ |
17,104 |
|
|
$ |
20,474 |
|
Operating Expenses |
|
|
|
|
|
|
|
|
|
|
|
|
|
|
|
|
|
|
|
|
|
|
|
|
|
|
|
|
|
|
|
|
Cost of revenue |
|
|
13,205 |
|
|
|
14,598 |
|
|
|
14,402 |
|
|
|
14,715 |
|
|
|
11,371 |
|
|
|
11,575 |
|
|
|
11,687 |
|
|
|
11,767 |
|
Selling, general &
administrative |
|
|
9,216 |
|
|
|
9,158 |
|
|
|
8,347 |
|
|
|
7,857 |
|
|
|
8,662 |
|
|
|
9,830 |
|
|
|
8,336 |
|
|
|
9,337 |
|
Research and development |
|
|
2,648 |
|
|
|
2,592 |
|
|
|
2,178 |
|
|
|
1,597 |
|
|
|
1,465 |
|
|
|
2,771 |
|
|
|
3,112 |
|
|
|
2,864 |
|
Impairment related and other |
|
|
107 |
|
|
|
3,867 |
|
|
|
1,295 |
|
|
|
128 |
|
|
|
75 |
|
|
|
117 |
|
|
|
197 |
|
|
|
9,663 |
|
|
|
|
|
|
|
|
|
|
|
|
|
|
|
|
|
|
|
|
|
|
|
|
|
|
|
|
|
(3,524 |
) |
|
|
(8,138 |
) |
|
|
(3,650 |
) |
|
|
(346 |
) |
|
|
(5,551 |
) |
|
|
(6,712 |
) |
|
|
(6,228 |
) |
|
|
(13,157 |
) |
|
|
|
|
|
|
|
|
|
|
|
|
|
|
|
|
|
|
|
|
|
|
|
|
|
|
|
|
|
|
|
|
|
Other income (loss), net |
|
|
(2,247 |
) |
|
|
3,246 |
|
|
|
10,226 |
|
|
|
5,353 |
|
|
|
5,847 |
|
|
|
(359 |
) |
|
|
34,368 |
|
|
|
3,369 |
|
Interest income |
|
|
142 |
|
|
|
98 |
|
|
|
98 |
|
|
|
108 |
|
|
|
829 |
|
|
|
404 |
|
|
|
317 |
|
|
|
298 |
|
Interest expense |
|
|
(84 |
) |
|
|
(73 |
) |
|
|
(49 |
) |
|
|
(10 |
) |
|
|
(13 |
) |
|
|
(64 |
) |
|
|
(129 |
) |
|
|
(128 |
) |
|
|
|
|
|
|
|
|
|
|
|
|
|
|
|
|
|
|
|
|
|
|
|
|
|
Income
(loss) before income taxes and equity loss |
|
|
(5,713 |
) |
|
|
(4,867 |
) |
|
|
6,625 |
|
|
|
5,105 |
|
|
|
1,112 |
|
|
|
(6,731 |
) |
|
|
28,328 |
|
|
|
(9,618 |
) |
Income tax (expense) benefit |
|
|
53 |
|
|
|
(421 |
) |
|
|
(516 |
) |
|
|
40,394 |
|
|
|
(54 |
) |
|
|
(239 |
) |
|
|
224 |
|
|
|
(288 |
) |
Equity loss |
|
|
(4,953 |
) |
|
|
(2,924 |
) |
|
|
(2,761 |
) |
|
|
(1,493 |
) |
|
|
(7,081 |
) |
|
|
(4,741 |
) |
|
|
(6,020 |
) |
|
|
(15,860 |
) |
|
|
|
|
|
|
|
|
|
|
|
|
|
|
|
|
|
|
|
|
|
|
|
|
|
Net income (loss) |
|
|
(10,613 |
) |
|
|
(8,212 |
) |
|
|
3,348 |
|
|
|
44,006 |
|
|
|
(6,023 |
) |
|
|
(11,711 |
) |
|
|
22,532 |
|
|
|
(25,766 |
) |
Less: Net
income attributable to the noncontrolling interest |
|
|
392 |
|
|
|
337 |
|
|
|
277 |
|
|
|
11,989 |
|
|
|
530 |
|
|
|
584 |
|
|
|
34 |
|
|
|
812 |
|
|
|
|
|
|
|
|
|
|
|
|
|
|
|
|
|
|
|
|
|
|
|
|
|
|
Net income (loss) attributable to Internet
Capital Group, Inc. |
|
$ |
(11,005 |
) |
|
$ |
(8,549 |
) |
|
$ |
3,071 |
|
|
$ |
32,017 |
|
|
$ |
(6,553 |
) |
|
$ |
(12,295 |
) |
|
$ |
22,498 |
|
|
$ |
(26,578 |
) |
|
|
|
|
|
|
|
|
|
|
|
|
|
|
|
|
|
|
|
|
|
|
|
|
|
|
|
|
|
|
|
|
|
|
|
|
|
|
|
|
|
|
|
|
|
|
|
|
|
|
|
|
|
|
|
|
|
|
Basic income (loss) per share (1) |
|
|
|
|
|
|
|
|
|
|
|
|
|
|
|
|
|
|
|
|
|
|
|
|
|
|
|
|
|
|
|
|
Net income (loss) attributable to
Internet Capital Group, Inc. |
|
$ |
(0.30 |
) |
|
$ |
(0.23 |
) |
|
$ |
0.08 |
|
|
$ |
0.87 |
|
|
$ |
(0.17 |
) |
|
$ |
(0.32 |
) |
|
$ |
0.59 |
|
|
$ |
(0.71 |
) |
|
|
|
|
|
|
|
|
|
|
|
|
|
|
|
|
|
|
|
|
|
|
|
|
|
|
|
|
|
|
|
|
|
|
|
|
|
|
|
|
|
|
|
|
|
|
|
|
|
|
|
|
|
|
|
|
|
|
Shares used in computation
of basic income (loss)
per share (1) |
|
|
36,676 |
|
|
|
36,666 |
|
|
|
36,676 |
|
|
|
36,623 |
|
|
|
38,221 |
|
|
|
38,383 |
|
|
|
38,437 |
|
|
|
37,386 |
|
|
|
|
|
|
|
|
|
|
|
|
|
|
|
|
|
|
|
|
|
|
|
|
|
|
|
|
|
|
|
|
|
|
|
|
|
|
|
|
|
|
|
|
|
|
|
|
|
|
|
|
|
|
|
|
|
|
|
Diluted income (loss) per share (1) |
|
|
|
|
|
|
|
|
|
|
|
|
|
|
|
|
|
|
|
|
|
|
|
|
|
|
|
|
|
|
|
|
Net income (loss) attributable to
Internet Capital Group, Inc. |
|
$ |
(0.30 |
) |
|
$ |
(0.23 |
) |
|
$ |
0.08 |
|
|
$ |
0.87 |
|
|
$ |
(0.17 |
) |
|
$ |
(0.32 |
) |
|
$ |
0.58 |
|
|
$ |
(0.71 |
) |
|
|
|
|
|
|
|
|
|
|
|
|
|
|
|
|
|
|
|
|
|
|
|
|
|
|
|
|
|
|
|
|
|
|
|
|
|
|
|
|
|
|
|
|
|
|
|
|
|
|
|
|
|
|
|
|
|
|
Shares used in computation
of diluted income (loss)
per share (1) |
|
|
36,676 |
|
|
|
36,666 |
|
|
|
36,740 |
|
|
|
36,692 |
|
|
|
38,221 |
|
|
|
38,383 |
|
|
|
38,784 |
|
|
|
37,386 |
|
|
|
|
|
|
|
|
|
|
|
|
|
|
|
|
|
|
|
|
|
|
|
|
|
|
| |
|
|
| (1) |
|
The sum of quarterly income (loss) per share differs from the full year amount due to
changes in the number of shares outstanding during the year. |
76
|
|
|
| ITEM 9. |
|
Changes in and Disagreements with Accountants on Accounting and Financial Disclosures |
None.
|
|
|
| ITEM 9A. |
|
Controls and Procedures |
Disclosure Controls and Procedures
We carried out an evaluation, under the supervision and with the participation of management,
including the Chief Executive Officer and Chief Financial Officer, of the effectiveness of the
design and operation of our disclosure controls and procedures (as defined in Rules 13a-15(e) and
15d-15(e) under the Exchange Act) as of the end of the period covered in this Report. Based upon
that evaluation, the Chief Executive Officer and Chief Financial Officer concluded that, as of the
end of the period covered in this Report, our disclosure controls and procedures have been designed
and are effective to provide reasonable assurance that information required to be included in the
Company’s periodic SEC reports is recorded, processed, summarized and reported within the time
periods specified in the relevant SEC rules and forms, and is accumulated and communicated to
management, including the Chief Executive Officer and Chief Financial Officer, as appropriate, to
allow timely discussions regarding required disclosure.
Management’s Report on Internal Control Over Financial Reporting
The management of the Company is responsible for establishing and maintaining adequate internal
control over financial reporting (as defined in Rules 13a-15(f)
and 15d-15(f) under the Exchange Act). The
Company’s internal control over financial reporting is a process designed to provide reasonable
assurance regarding the reliability of financial reporting and the preparation of financial
statements for external purposes in accordance with generally accepted accounting principles. The
Company’s internal control over financial reporting includes those policies and procedures that (i)
pertain to the maintenance of records that, in reasonable detail, accurately and fairly reflect the
transactions and dispositions of the assets of the Company, (ii) provide reasonable assurance that
transactions are recorded as necessary to permit preparation of financial statements for external
purposes in accordance with generally accepted accounting principles, (iii) provide reasonable
assurance that receipts and expenditures of the Company are being made only in accordance with
authorizations of management and directors of the Company, and (iv) provide reasonable assurance
regarding prevention or timely detection of unauthorized acquisition, use or disposition of the
Company’s assets that could have a material effect on the financial statements.
The management of Internet Capital Group, Inc. evaluated the Company’s internal control over
financial reporting as of December 31, 2009. In making this assessment, it used the criteria set
forth by the Committee of Sponsoring Organizations of the Treadway Commission (COSO) in Internal
Control-Integrated Framework. Management’s assessment included an evaluation of the design of its
internal control over financial reporting and testing of the operational effectiveness of its
internal control over financial reporting. Management reviewed the results of its assessment with
the Audit Committee of the Board of Directors. Based on this assessment, as of December 31, 2009,
the Company’s internal control over financial reporting was effective based on those criteria.
The Company’s independent registered public accounting firm, KPMG LLP, has audited the Company’s
internal control over financial reporting. KPMG LLP’s report on the effectiveness of the Company’s
internal control over financial reporting appears below.
Changes
in Internal Control over Financial Reporting
There have been no changes in internal control over financial reporting during the period covered
by this Report that have materially affected, or are reasonably likely to materially affect, the
Company’s internal control over financial reporting.
Inherent Limitations on Effectiveness of Controls
The design of any system of control is based upon certain assumptions about the likelihood of
future events, and there can be no assurance that any design will succeed in achieving its stated
objectives under all future events, no matter how remote, that controls may become inadequate
because of changes in conditions, or that the degree of compliance with the policies or procedures
may not deteriorate. Because of their inherent limitations, systems of control may not prevent or
detect all misstatements. Accordingly, even effective systems of control can provide only
reasonable assurance of achieving their control objectives.
77
Report of Independent Registered Public Accounting Firm
The Board of Directors and Stockholders
Internet Capital Group, Inc.:
We have audited Internet Capital Group, Inc. and subsidiaries (the Company) internal control over
financial reporting as of December 31, 2009, based on criteria established in Internal
Control—Integrated Framework issued by the Committee of Sponsoring Organizations of the Treadway
Commission (COSO). Internet Capital Group, Inc.’s management is responsible for maintaining
effective internal control over financial reporting and for its assessment of the effectiveness of
internal control over financial reporting, included in the accompanying Management’s Report on
Internal Control Over Financial Reporting. Our responsibility is to express an opinion on the
Company’s internal control over financial reporting based on our audit.
We conducted our audit in accordance with the standards of the Public Company Accounting Oversight
Board (United States). Those standards require that we plan and perform the audit to obtain
reasonable assurance about whether effective internal control over financial reporting was
maintained in all material respects. Our audit included obtaining an understanding of internal
control over financial reporting, assessing the risk that a material weakness exists, and testing
and evaluating the design and operating effectiveness of internal control based on the assessed
risk. Our audit also included performing such other procedures as we considered necessary in the
circumstances. We believe that our audit provides a reasonable basis for our opinion.
A company’s internal control over financial reporting is a process designed to provide reasonable
assurance regarding the reliability of financial reporting and the preparation of financial
statements for external purposes in accordance with generally accepted accounting principles. A
company’s internal control over financial reporting includes those policies and procedures that (1)
pertain to the maintenance of records that, in reasonable detail, accurately and fairly reflect the
transactions and dispositions of the assets of the company; (2) provide reasonable assurance that
transactions are recorded as necessary to permit preparation of financial statements in accordance
with generally accepted accounting principles, and that receipts and expenditures of the company
are being made only in accordance with authorizations of management and directors of the company;
and (3) provide reasonable assurance regarding prevention or timely detection of unauthorized
acquisition, use, or disposition of the company’s assets that could have a material effect on the
financial statements.
Because of its inherent limitations, internal control over financial reporting may not prevent or
detect misstatements. Also, projections of any evaluation of effectiveness to future periods are
subject to the risk that controls may become inadequate because of changes in conditions, or that
the degree of compliance with the policies or procedures may deteriorate.
In our opinion, Internet Capital Group, Inc. and subsidiaries maintained, in all material respects,
effective internal control over financial reporting as of December 31, 2009, based on criteria
established in Internal Control—Integrated Framework issued by the Committee of Sponsoring
Organizations of the Treadway Commission.
We also have audited, in accordance with the standards of the Public Company Accounting Oversight
Board (United States), the consolidated balance sheets of Internet Capital Group, Inc. and
subsidiaries as of December 31, 2009 and 2008, and the related consolidated statements of
operations, changes in equity, comprehensive income (loss) and cash flows for each of the years
in the three-year period ended December 31, 2009, and our report
dated March 16, 2010 expressed an
unqualified opinion on those consolidated financial statements.
/s/ KPMG LLP
Philadelphia, Pennsylvania
March 16, 2010
78
|
|
|
| ITEM 9B. |
|
Other Information |
None.
PART III
|
|
|
| ITEM 10. |
|
Directors, Executive Officers and Corporate Governance |
We incorporate by reference the information contained under the captions “Election of Directors,”
“Section 16(a) Beneficial Ownership Reporting Compliance,” “Executive Officers” and “Corporate
Governance” in our Definitive Proxy Statement for our 2010 Annual Meeting of Stockholders to be
filed within 120 days after the end of the year covered by this Report pursuant to Regulation 14A
under the Exchange Act.
We have adopted a written code of business conduct and ethics, known as our Corporate Code of
Conduct, which applies to all of our directors, officers and employees, including our principal
executive officer and our principal financial and accounting officer. Our Corporate Code of
Conduct is available on our internet website, www.internetcapital.com. Any amendments to our
Corporate Code of Conduct or waivers from the provisions of the Corporate Code of Conduct for our
principal executive officer or our principal financial and accounting officer will be disclosed in
accordance with applicable SEC and stock exchange rules.
|
|
|
| ITEM 11. |
|
Executive Compensation |
We incorporate by reference the information contained under the caption “Executive Compensation” in
our Definitive Proxy Statement for our 2010 Annual Meeting of Stockholders to be filed within 120
days after the end of the year covered by this Report pursuant to Regulation 14A under the Exchange
Act.
|
|
|
| ITEM 12. |
|
Security Ownership of Certain Beneficial Owners and Management and Related Stockholder
Matters |
We incorporate by reference the information contained under the caption “Security Ownership of
Certain Beneficial Owners and Directors and Officers” in our Definitive Proxy Statement for our
2010 Annual Meeting of Stockholders to be filed within 120 days after the end of the year covered
by this Report pursuant to Regulation 14A under the Exchange Act.
|
|
|
| ITEM 13. |
|
Certain Relationships and Related Transactions, and Director Independence |
We incorporate by reference the information contained under the caption “Certain Relationships and
Related Transactions” in our Definitive Proxy Statement for our 2010 Annual Meeting of Stockholders
to be filed within 120 days after the end of the year covered by this Report pursuant to Regulation
14A under the Exchange Act.
|
|
|
| ITEM 14. |
|
Principal Accountant Fees and Services |
We incorporate by reference the information contained under the caption “Ratification of
Appointment of Independent Registered Public Accountant” in our Definitive Proxy Statement for our
2010 Annual Meeting of Stockholders to be filed within 120 days after the end of the year covered
by this Report pursuant to Regulation 14A under the Exchange Act.
79
PART IV
|
|
|
| ITEM 15. |
|
Exhibits and Financial Statement Schedules |
1. Consolidated Financial Statements
The Consolidated Financial Statements and related Notes thereto as set forth under Item 8 of this
Report are incorporated herein by reference.
The
audited financial statements of GoIndustry-DoveBid plc, which is accounted
for under the equity method, were not available as of the date of
this Report.
In accordance with Rule 3-09 of Regulation S-X, we expect to file those financial
statements by amendment to this Report within 180 days following the end of the Company’s fiscal
year. The audited financial statements for
GoIndustry-DoveBid plc, as of
December 31, 2008 are included as Exhibit 99.3 to our Form 10-K Amendment
No. 2 for the fiscal year ended December 31, 2008, which was filed on June 29, 2009.
2. Financial Statement Schedule
Report of Independent Registered Public Accounting Firm
The Board of Directors and Stockholders
Internet Capital Group, Inc.:
Under
date of March 16, 2010, we reported on the consolidated balance sheets of Internet Capital
Group, Inc. and subsidiaries (the Company) as of December 31, 2009 and 2008, and the related consolidated
statements of operations, changes in equity, comprehensive income (loss) and cash flows for each
of the years in the three-year period ended December 31, 2009. In connection with our audits of
the aforementioned consolidated financial statements, we also audited the related consolidated
financial statement schedule. The consolidated financial statement schedule is the responsibility
of the Company’s management. Our responsibility is to express an opinion on the consolidated
financial statement schedule based on our audits.
In our opinion, such consolidated financial statement schedule, when considered in relation to the
basic consolidated financial statements taken as a whole, presents fairly, in all material
respects, the information set forth therein.
As
discussed in Note 7 to the consolidated financial statements, the Company retrospectively changed
its method of accounting for convertible debt instruments that may be settled in cash upon
conversion due to the adoption of a new accounting standard issued by the Financial Accounting
Standards Board, as of January 1, 2009.
/s/ KPMG LLP
Philadelphia, Pennsylvania
March 16, 2010
The following financial statement schedule of Internet Capital Group, Inc. for each of the years
ended December 31, 2009, 2008 and 2007 should be read in conjunction with our Consolidated
Financial Statements and related Notes thereto.
INTERNET CAPITAL GROUP
SCHEDULE II —VALUATION AND QUALIFYING ACCOUNTS
Years Ended December 31, 2007, 2008 and 2009
(in thousands)
| |
|
|
|
|
|
|
|
|
|
|
|
|
|
|
|
|
|
|
|
|
| |
|
Balance at the |
|
|
Charged to |
|
|
Charged to |
|
|
|
|
|
|
Balance at the |
|
| |
|
beginning of |
|
|
costs and |
|
|
other |
|
|
|
|
|
|
end of |
|
| |
|
the year |
|
|
expenses |
|
|
accounts |
|
|
Write-offs |
|
|
the year |
|
Allowance for Doubtful Accounts: |
|
|
|
|
|
|
|
|
|
|
|
|
|
|
|
|
|
|
|
|
December 31, 2007 |
|
$ |
137 |
|
|
$ |
(45 |
) |
|
$ |
— |
|
|
$ |
(48 |
) |
|
$ |
44 |
|
December 31, 2008 |
|
$ |
44 |
|
|
$ |
750 |
(a) |
|
$ |
— |
|
|
|
(73 |
) |
|
$ |
721 |
|
December 31, 2009 |
|
$ |
721 |
|
|
$ |
(166 |
)(b) |
|
$ |
343 |
|
|
|
(308 |
) |
|
$ |
590 |
|
| |
|
|
| (a) |
|
Reserve of $411 was established upon acquisition of partner company during 2008. |
| |
| (b) |
|
Reserve of $79 was established upon acquisition of partner company during 2009; reserve of
$92 was eliminated upon sale of subsidiary assets during 2009. |
80
3. List of Exhibits
The following is a list of exhibits required by Item 601 of Regulation S-K filed as part of this
Report. Where so indicated, exhibits that were previously filed are incorporated by reference.
For exhibits incorporated by reference, the location of the exhibit in the previous filing is
indicated in parentheses.
| |
|
|
|
|
| Exhibit Number |
|
Document |
| |
2.1 |
|
|
Agreement of Merger, dated February 2, 1999, between Internet
Capital Group, L.L.C. and Internet Capital Group, Inc. (incorporated
by reference to Exhibit 2.1 to the Company’s Registration Statement
on Form S-1, filed May 11, 1999 (File No. 333-78193)). |
| |
|
|
|
|
| |
3.1.1 |
|
|
Restated Certificate of Incorporation of Internet Capital Group,
Inc. (incorporated by reference to Exhibit 2.1 to the Company’s
Registration Statement on Form 8-A, filed August 4, 1999 (File No.
000-26989)). |
| |
|
|
|
|
| |
3.1.2 |
|
|
Certificate of Amendment of Restated Certificate of Incorporation
(incorporated by reference to Exhibit 3.3 to the Company’s Annual
Report on Form 10-K for the year ended December 31, 2002, filed
March 31, 2003 (File No. 001-16249)). |
| |
|
|
|
|
| |
3.1.3 |
|
|
Second Amendment of Restated Certificate of Incorporation of
Internet Capital Group, Inc. (incorporated by reference to Exhibit
3.1 to the Company’s Quarterly Report on Form 10-Q for the quarter
ended June 30, 2004, filed August 9, 2004 (File No. 001-16249)). |
| |
|
|
|
|
| |
3.2 |
|
|
Amended and Restated By-laws of Internet Capital Group, Inc.
(incorporated by reference to Exhibit 3.1 to the Company’s Current
Report on Form 8-K, filed March 5, 2007 (File No. 001-16249)). |
| |
|
|
|
|
| |
4.1 |
|
|
Form of Certificate for Internet Capital Group, Inc. Common Stock
(incorporated by reference to Exhibit 4.1 to the Company’s Annual
Report on Form 10-K for the year ended December 31, 2004, filed
March 16, 2005 (File No. 001-16249)). |
| |
|
|
|
|
| |
4.2 |
|
|
Rights Agreement, dated as of November 22, 2000, between Internet
Capital Group, Inc. and ChaseMellon Shareholder Services, L.L.C., as
Rights Agent, including Form of Rights Certificate (incorporated by
reference to Exhibit 1.1 to the Company’s Registration Statement on
Form 8-A, filed December 1, 2000 (File No. 001-16249)). |
| |
|
|
|
|
| |
10.1 |
|
|
Internet Capital Group, Inc. Amended and Restated 1999 Equity
Compensation Plan (incorporated by reference to Exhibit 10.6 to the
Company’s Current Report on Form 8-K, filed March 5, 2007 (File No.
001-16249)).* |
| |
|
|
|
|
| |
10.2 |
|
|
Internet Capital Group, Inc. Second Amended and Restated 2005
Omnibus Equity Compensation Plan (incorporated by reference to
Appendix A to the Company’s definitive proxy statement relative to
the Company’s 2009 Annual Meeting of Stockholders, filed April 29,
2009).* |
| |
|
|
|
|
| |
10.3 |
|
|
Internet Capital Group, Inc. Amended and Restated Non-Management
Director Compensation Plan (incorporated by reference to Exhibit
10.4 to the Company’s Current Report on Form 8-K, filed March 5,
2007 (File No. 001-16249)).* |
| |
|
|
|
|
| |
10.4 |
|
|
Internet Capital Group, Inc. Amended and Restated Director Deferred
Stock Unit Program (incorporated by reference to Exhibit 10.5 to the
Company’s Current Report on Form 8-K, filed December 18, 2008 (File
No. 001-16249)).* |
| |
|
|
|
|
| |
10.5.1 |
|
|
Logistics.com, Inc. 2001 Equity Compensation Plan (incorporated by
reference to Exhibit 10.3 to the Company’s Annual Report on Form
10-K for the year ended December 31, 2002, filed March 31, 2003
(File No. 001-16249)).* |
81
| |
|
|
|
|
| Exhibit Number |
|
Document |
| |
10.5.2 |
|
|
Amendment No. 1 to the Logistics.com, Inc. 2001 Equity Compensation
Plan (incorporated by reference to Exhibit 10.3.1 to the Company’s
Annual Report on Form 10-K for the year ended December 31, 2002,
filed March 31, 2003 (File No. 001-16249)).* |
| |
|
|
|
|
| |
10.6 |
|
|
Internet Capital Group 2009 Performance Plan (incorporated by
reference to Exhibit 10.1 of the Company’s Current Report on Form
8-K, filed March 4, 2009 (File No. 001-16249)).* |
| |
|
|
|
|
| |
10.7 |
|
|
Internet Capital Group 2010 Performance Plan (incorporated by
reference to Exhibit 10.1 to the Company’s Current Report on Form
8-K, filed March 3, 2010 (File No. 001-16249)).* |
| |
|
|
|
|
| |
10.8 |
|
|
Form of Internet Capital Group, Inc. Restricted Stock Grant Without
Performance Acceleration (incorporated by reference to Exhibit 10.32
to the Company’s Annual Report on Form 10-K for the year ended
December 31, 2004, filed March 16, 2005 (File No. 001-16249)).* |
| |
|
|
|
|
| |
10.9 |
|
|
Form of Internet Capital Group, Inc. Restricted Stock Grant With
Performance Acceleration (incorporated by reference to Exhibit 10.33
to the Company’s Annual Report on Form 10-K for the year ended
December 31, 2004, filed March 16, 2005 (File No. 001-16249)).* |
| |
|
|
|
|
| |
10.10 |
|
|
Form of Internet Capital Group, Inc. Stock Option Grant Without
Performance Acceleration (incorporated by reference to Exhibit 10.34
to the Company’s Annual Report on Form 10-K for the year ended
December 31, 2004, filed March 16, 2005 (File No. 001-16249)).* |
| |
|
|
|
|
| |
10.11 |
|
|
Form of Internet Capital Group, Inc. Stock Option Grant With
Performance Acceleration (incorporated by reference to Exhibit 10.35
to the Company’s Annual Report on Form 10-K for the year ended
December 31, 2004, filed March 16, 2005 (File No. 001-16249)).* |
| |
|
|
|
|
| |
10.12 |
|
|
Form of Internet Capital Group, Inc. Non-Employee Director Initial
Stock Option Grant (incorporated by reference to Exhibit 10.36 to
the Company’s Annual Report on Form 10-K for the year ended December
31, 2004, filed March 16, 2005 (File No. 001-16249)).* |
| |
|
|
|
|
| |
10.13 |
|
|
Form of Internet Capital Group, Inc. Non-Employee Director Annual
Stock Option Grant (incorporated by reference to Exhibit 10.37 to
the Company’s Annual Report on Form 10-K for the year ended December
31, 2004, filed March 16, 2005 (File No. 001-16249)).* |
| |
|
|
|
|
| |
10.14 |
|
|
Form of Internet Capital Group, Inc. Stock Unit Award Agreement
(incorporated by reference to Exhibit 10.1 to the Company’s Current
Report on Form 8-K, filed July 28, 2005 (File No. 001-16249)).* |
| |
|
|
|
|
| |
10.15 |
|
|
Form of Internet Capital Group, Inc. Stock Appreciation Rights
Certificate (incorporated by reference to Exhibit 10.2 to the
Company’s Current Report on Form 8-K, filed July 28, 2005 (File No.
001-16249)).* |
| |
|
|
|
|
| |
10.16.1 |
|
|
Employment Agreement, dated February 28, 2007, by and among Internet
Capital Group Operations, Inc., Internet Capital Group, Inc. and
Walter W. Buckley, III (incorporated by reference to Exhibit 10.1 to
the Company’s Current Report on Form 8-K, filed March 5, 2007 (File
No. 001-16249)).* |
| |
|
|
|
|
| |
10.16.2 |
|
|
Amendment 2008-1 to the Employment Agreement, dated as of December
18, 2008, by and between Internet Capital Group Operations, Inc. and
Walter W. Buckley, III (incorporated by reference to Exhibit 10.2 to
the Company’s Current Report on Form 8-K, filed December 18, 2008
(File No. 001-16249)).* |
82
| |
|
|
|
|
| Exhibit Number |
|
Document |
| |
10.17 |
|
|
Letter Agreement, dated December 18, 2008, by and between Internet
Capital Group and R. Kirk Morgan (incorporated by reference to
Exhibit 10.4 to the Company’s Current Report on Form 8-K, filed
December 18, 2008 (File No. 001-16249)).* |
| |
|
|
|
|
| |
10.18.1 |
|
|
Employment Agreement, dated April 18, 2007, by and between Internet
Capital Group and Douglas A. Alexander (incorporated by reference to
Exhibit 10.1 to the Company’s Current Report on Form 8-K, filed
April 18, 2007 (File No. 001-16249)).* |
| |
|
|
|
|
| |
10.18.2 |
|
|
Amendment 2008-1 to the Employment Agreement, dated as of December
18, 2008, by and between Internet Capital Group Operations, Inc. and
Douglas A. Alexander (incorporated by reference to Exhibit 10.3 to
the Company’s Current Report on Form 8-K, filed December 18, 2008
(File No. 001-16249)).* |
| |
|
|
|
|
| |
10.19 |
|
|
Form of Restrictive Covenant Agreement (incorporated by reference to
Exhibit 10.4 to the Company’s Current Report on Form 8-K, filed July
28, 2005 (File No. 001-16249)).* |
| |
|
|
|
|
| |
10.20 |
|
|
Amended and Restated Letter of Credit Agreement, dated as of
December 18, 2009, by and between Comerica Bank, Internet Capital
Group, Inc., ICG Holdings, Inc. and Internet Capital Group
Operations, Inc. (incorporated by reference to Exhibit 10.1 to the
Company’s Current Report on Form 8-K, filed December 22, 2009 (File
No. 001-16249)). |
| |
|
|
|
|
| |
10.21 |
|
|
Letter Agreement, dated December 16, 2005, by and between ICG
Holdings, Inc. and Credit Suisse First Boston Capital LLC
(incorporated by reference to Exhibit 10.31 to the Company’s Annual
Report on Form 10-K for the year ended December 31, 2005, filed
March 15, 2006 (File No. 001-16249)). |
| |
|
|
|
|
| |
10.22 |
|
|
Form of Loan Agreements, each dated as of May 8, 2008, by and
between ICG Holdings, Inc. and Credit Suisse Capital LLC
(incorporated by reference to Exhibit 10.1 to the Company’s
Quarterly Report on Form 10-Q for the quarter ended March 31, 2008,
filed May 12, 2008 (File No. 001-16249)). |
| |
|
|
|
|
| |
10.23 |
|
|
Form of Promissory Note by ICG Holdings, Inc. in favor of Credit
Suisse Capital LLC (incorporated by reference to Exhibit 10.2 to the
Company’s Quarterly Report on Form 10-Q for the quarter ended March
31, 2008, filed May 12, 2008 (File No. 001-16249)). |
| |
|
|
|
|
| |
10.24.1 |
|
|
Agreement of Lease, dated June 30, 2003, between FV Office Partners,
L.P. and Internet Capital Group Operations, Inc. (incorporated by
reference to Exhibit 10.1 to the Company’s Quarterly Report on Form
10-Q for the quarter ended June 30, 2003, filed August 14, 2003
(File No. 001-16249)). |
| |
|
|
|
|
| |
10.24.2 |
|
|
First Amendment to Lease, dated November 20, 2003, between FV Office
Partners, L.P. and Internet Capital Group Operations, Inc.
(incorporated by reference to Exhibit 10.37 to the Company’s Annual
Report on Form 10-K for the year ended December 31, 2003, filed
March 15, 2004 (File No. 001-16249)). |
| |
|
|
|
|
| |
10.24.3 |
|
|
Second Amendment to Lease, dated August 21, 2006, by and between
Chesterbrook Partners, L.P. (as successor-in-interest to FV Office
Partners, L.P.) and Internet Capital Group Operations, Inc.
(incorporated by reference to Exhibit 10.33.3 to the Company’s
Annual Report on Form 10-K for the year ended December 31, 2006,
filed March 16, 2007 (File No. 001-16249)). |
83
| |
|
|
|
|
| Exhibit Number |
|
Document |
| |
10.25 |
|
|
Form of Agreement of Limited Partnership for Internet Capital Group,
Inc. Carried Interest Long-Term Incentive Plan (incorporated by
reference to Exhibit 10.2 to the Company’s Current report on Form
8-K, filed December 13, 2007 (File No. 001-16249)).* |
| |
|
|
|
|
| |
10.26 |
|
|
Form of Limited Partnership Interest Grant (incorporated by
reference to Exhibit 10.3 to the Company’s Current Report on Form
8-K, filed December 13, 2007 (File No. 001-16249)).* |
| |
|
|
|
|
| |
11.1 |
|
|
Statement Regarding Computation of Per Share Earnings (included
herein at Note 2-“Significant Accounting Policies” in the subsection
“Net Income (Loss) Per Share” to the Consolidated Financial
Statements and Note 16-“Net Income (Loss) Per Share” to the
Consolidated Financial Statements). |
| |
|
|
|
|
| |
14.1 |
|
|
Internet Capital Group Corporate Code of Conduct (incorporated by
reference to Exhibit 10.2 to the Company’s Current Report on Form
8-K, filed March 4, 2009 (File No. 001-16249)). |
| |
|
|
|
|
| |
21.1 |
|
|
Subsidiaries of Internet Capital Group, Inc. (filed herewith). |
| |
|
|
|
|
| |
23.1 |
|
|
Consent of KPMG LLP (filed herewith). |
| |
|
|
|
|
| |
23.2 |
|
|
Consent of Grant Thornton LLP/Metastorm Inc. (filed herewith). |
| |
|
|
|
|
| |
23.3 |
|
|
Consent
of KPMG LLP/StarCite, Inc. (filed herewith). |
| |
|
|
|
|
| |
31.1 |
|
|
Certification of Chief Executive Officer required by Section 302 of
the Sarbanes-Oxley Act of 2002 (filed herewith). |
| |
|
|
|
|
| |
31.2 |
|
|
Certification of Chief Financial Officer required by Section 302 of
the Sarbanes-Oxley Act of 2002 (filed herewith). |
| |
|
|
|
|
| |
32.1 |
|
|
Certification of the Chief Executive Officer required by Section 906
of the Sarbanes-Oxley Act of 2002 (filed herewith). |
| |
|
|
|
|
| |
32.2 |
|
|
Certification of the Chief Financial Officer required by Section 906
of the Sarbanes-Oxley Act of 2002 (filed herewith). |
| |
|
|
|
|
| |
99.1 |
|
|
Consolidated Financial Statements of Metastorm Inc. (filed herewith). |
| |
|
|
|
|
| |
99.2 |
|
|
Consolidated
Financial Statements of StarCite, Inc. (filed herewith). |
| |
|
|
| * |
|
Management
contract or compensatory plan or arrangement |
84
SIGNATURES
Pursuant to the requirements of Section 13 or 15(d) of the Security Exchange Act of 1934, the
Company has duly caused this Report to be signed on its behalf by the undersigned, thereunto duly authorized.
| |
|
|
|
|
| Date: March 22, 2010 |
INTERNET CAPITAL GROUP, INC.
|
|
| |
By: |
/s/ R. KIRK MORGAN
|
|
| |
|
Name: |
R. Kirk Morgan |
|
| |
|
Title: |
Chief Financial Officer |
|
Pursuant
to the requirements of the Securities Exchange Act of 1934, this Report has been signed below by the following persons on behalf of the Company and in the capacities indicated, and on the
date set forth above.
| |
|
|
| Signature |
|
Title |
|
|
|
/s/ WALTER W. BUCKLEY, III
|
|
Chief Executive Officer and Chairman of the Board |
|
|
of
Directors (Principal Executive Officer) |
|
|
|
/s/ R. KIRK MORGAN
|
|
Chief Financial Officer |
|
|
(Principal
Financial and Accounting Officer) |
|
|
|
/s/ DAVID J. BERKMAN
David J. Berkman
|
|
Director |
|
|
|
/s/ THOMAS A. DECKER
Thomas A. Decker
|
|
Director |
|
|
|
/s/ DAVID K. DOWNES
David K. Downes
|
|
Director |
|
|
|
/s/
THOMAS P. GERRITY
Thomas P. Gerrity
|
|
Director |
|
|
|
/s/ MICHAEL J. HAGAN
Michael J. Hagan
|
|
Director |
|
|
|
/s/ ROBERT E. KEITH, JR.
Robert E. Keith, Jr.
|
|
Director |
|
|
|
/s/ WARREN V. MUSSER
Warren V. Musser
|
|
Director |
|
|
|
/s/ PHILIP J. RINGO
Philip J. Ringo
|
|
Director |
85