Attached files
| file | filename |
|---|---|
| EX-21.1 - EXHIBIT 21.1 - HAMPSHIRE GROUP LTD | c98138exv21w1.htm |
| EX-23.2 - EXHIBIT 23.2 - HAMPSHIRE GROUP LTD | c98138exv23w2.htm |
| EX-31.1 - EXHIBIT 31.1 - HAMPSHIRE GROUP LTD | c98138exv31w1.htm |
| EX-31.2 - EXHIBIT 31.2 - HAMPSHIRE GROUP LTD | c98138exv31w2.htm |
| EX-32.2 - EXHIBIT 32.2 - HAMPSHIRE GROUP LTD | c98138exv32w2.htm |
| EX-32.1 - EXHIBIT 32.1 - HAMPSHIRE GROUP LTD | c98138exv32w1.htm |
| EX-23.1 - EXHIBIT 23.1 - HAMPSHIRE GROUP LTD | c98138exv23w1.htm |
Table of Contents
UNITED STATES
SECURITIES AND EXCHANGE COMMISSION
SECURITIES AND EXCHANGE COMMISSION
Washington, D.C. 20549
FORM 10-K
(Mark One)
| þ | ANNUAL REPORT PURSUANT TO SECTION 13 OR 15(d) OF THE SECURITIES EXCHANGE ACT OF 1934 |
For the fiscal year ended December 31, 2009
OR
| o | TRANSITION REPORT PURSUANT TO SECTION 13 OR 15(d) OF THE SECURITIES EXCHANGE ACT OF 1934 |
For the transition period from to
Commission File Number: 000-20201
HAMPSHIRE GROUP, LIMITED
(Exact name of registrant as specified in its charter)
| Delaware | 06-0967107 | |
| (State or other jurisdiction of | (I.R.S. Employer | |
| incorporation or organization) | Identification No.) | |
| 114 W. 41st Street, New York, New York | 10036 | |
| (Address of principal executive offices) | (Zip Code) |
Registrant’s telephone number, including area code: (212) 840-5666
Securities registered pursuant to Section 12(b) of the Act: None
Securities registered pursuant to Section 12(g) of the Act:
(Title of Class)
Common Stock, $0.10 par value
Securities registered pursuant to Section 12(g) of the Act:
(Title of Class)
Common Stock, $0.10 par value
Indicate by check mark if the registrant is a well-known seasoned issuer, as defined in Rule
405 of the Securities Act. Yes o No þ
Indicate by check mark if the registrant is not required to file reports pursuant to Section
13 or Section 15(d) of the Exchange Act. Yes o No þ
Indicate by check mark whether the registrant (1) has filed all reports required to be filed
by Section 13 or 15(d) of the Securities Exchange Act of 1934 during the preceding 12 months (or
for such shorter period that the registrant was required to file such reports), and (2) has been
subject to such filing requirements for the past 90 days. Yes þ No o
Indicate by check mark whether the registrant has submitted electronically and posted to its
corporate Web site, if any, every Interactive Data File required to be submitted and posted
pursuant to Rule 405 of Regulation S-T (§232.405 of this chapter) during the preceding 12 months
(or for such shorter period that the registrant was required to file such reports). Yes o
No o
Indicate by check mark if disclosure of delinquent filers pursuant to Item 405 of Regulation
S-K (§229.405 of this chapter) is not contained herein, and will not be contained, to the best of
the registrant’s knowledge, in definitive proxy or information statements incorporated by reference
in Part III of this Form 10-K or any amendment to this Form 10-K. o
Indicate by check mark whether registrant is a large accelerated filer, an accelerated filer,
a non-accelerated filer or a smaller reporting company. See definitions of “large accelerated
filer,” “accelerated filer,” and “smaller reporting company” in Rule 12b-2 of the Exchange Act.
| Large accelerated filer o | Accelerated filer o | Non-accelerated filer o | Smaller Reporting Company þ | |||
| (Do not check if Smaller Reporting Company) |
Indicate by check mark whether registrant is a shell company (as defined in Rule 12b-2 of the
Exchange Act). Yes o No þ
As of June 27, 2009, the aggregate market value of the voting and non-voting Common Stock held
by non-affiliates of the registrant was $13,651,903. Such aggregate market value was computed by
reference to the closing sale price of the Common Stock as reported on the Pink Sheets, a
centralized quotation service that collects and publishes market maker quotes for over-the-counter
securities, on such date. For purposes of making this calculation only, the Registrant has defined
“affiliates” as including all directors and executive officers, but excluding any institutional
stockholders owning more than ten percent of the Registrant’s Common Stock.
Number of shares of Common Stock outstanding as of March 1, 2010: 6,316,665
DOCUMENTS INCORPORATED BY REFERENCE
Certain portions of the Registrant’s Definitive Proxy Statement, relative to our 2010 Annual
Meeting of Stockholders to be filed with the
Securities and Exchange Commission not later than 120 days after the end of the fiscal year,
are incorporated by reference into Part III
of this Annual Report on Form 10-K.
HAMPSHIRE GROUP, LIMITED
ANNUAL REPORT ON FORM 10-K
For the Fiscal Year Ended December 31, 2009
| ii | ||||||||
| 1 | ||||||||
| 1 | ||||||||
| 5 | ||||||||
| 9 | ||||||||
| 10 | ||||||||
| 10 | ||||||||
| 10 | ||||||||
| 11 | ||||||||
| 11 | ||||||||
| 13 | ||||||||
| 14 | ||||||||
| 26 | ||||||||
| 27 | ||||||||
| 54 | ||||||||
| 54 | ||||||||
| 54 | ||||||||
| 55 | ||||||||
| 55 | ||||||||
| 55 | ||||||||
| 55 | ||||||||
| 55 | ||||||||
| 55 | ||||||||
| 56 | ||||||||
| 56 | ||||||||
| Exhibit 21.1 | ||||||||
| Exhibit 23.1 | ||||||||
| Exhibit 23.2 | ||||||||
| Exhibit 31.1 | ||||||||
| Exhibit 31.2 | ||||||||
| Exhibit 32.1 | ||||||||
| Exhibit 32.2 | ||||||||
i
Table of Contents
“SAFE HARBOR” STATEMENT
UNDER THE PRIVATE SECURITIES LITIGATION REFORM ACT OF 1995
UNDER THE PRIVATE SECURITIES LITIGATION REFORM ACT OF 1995
From time to time, we make oral and written statements that may constitute “forward looking
statements” (rather than historical facts) as defined in the Private Securities Litigation Reform
Act of 1995 or by the Securities and Exchange Commission (the “SEC”) in its rules, regulations and
releases, including Section 27A of the Securities Act of 1933, as amended (the “Securities Act”)
and Section 21E of the Securities Exchange Act of 1934, as amended (the “Exchange Act”). We desire
to take advantage of the “safe harbor” provisions in the Private Securities Litigation Reform Act
of 1995 for forward looking statements made from time to time, including, but not limited to, the
forward looking statements made in this Annual Report on Form 10-K (the “Annual Report”), as well
as those made in other filings with the SEC.
Forward looking statements can be identified by our use of forward looking terminology such as
“may,” “will,” “expect,” “anticipate,” “estimate,” “believe,” “continue,” or other similar words.
Such forward looking statements are based on our management’s current plans and expectations and
are subject to risks, uncertainties and changes in plans that could cause actual results to differ
materially from those described in the forward looking statements. Important factors that could
cause actual results to differ materially from those anticipated in our forward looking statements
include, but are not limited to, those described under “Risk Factors” set forth in Item 1A of this
Annual Report.
We expressly disclaim any obligation to release publicly any updates or any changes in our
expectations or any changes in events, conditions or circumstances on which any forward-looking
statement is based.
As used herein, except as otherwise indicated by the context, the terms “Hampshire,” “Company,”
“we,” and “us” are used to refer to Hampshire Group, Limited and our wholly-owned subsidiaries.
ii
Table of Contents
PART I.
Item 1. Business.
Company Overview
General
Hampshire Group, Limited is a provider of women’s and men’s sweaters, wovens and knits, and is a
designer and marketer of branded apparel in the United States. As a holding company, we operate
through our wholly-owned subsidiaries—Hampshire Designers, Inc. and Item-Eyes, Inc., which in turn
hold our operating divisions—Women’s and Men’s. The Company was established in 1977 and is
incorporated in the state of Delaware.
Our Women’s division is comprised of both our women’s knitwear business, known as Hampshire
Designers, and our women’s related sportswear business, known as Item Eyes. Our men’s division,
known as Hampshire Brands, offers both sweaters and sportswear.
Our products, both branded and private label, are marketed in the moderate markets through multiple
channels of distribution, including national and regional department and chain stores. All of our
divisions source their product with quality manufacturers. Keynote Services, Limited, our China
based subsidiary, assists with our sourcing needs and provides quality control services.
Recent Initiatives
The economic environment that we experienced in 2008, which continued throughout 2009, was
characterized by, among other things, a dramatic reduction in consumer spending and substantial
tightening of credit markets. Accordingly, our priorities in 2009 included:
| • | Restructuring of management. During 2009, in light of a prolonged and accelerating decline in operating results, our Board of Directors initiated a plan to restructure the management team to better position the Company to meet the challenges posed by the economic environment in 2009 and to establish a framework for future growth. This plan resulted in the reduction of senior management from eight to four positions, the departure of five executives, the appointment of Heath L. Golden as President and Chief Executive Officer, and the hiring of Howard L. Zwilling as President of Women’s Apparel. Mr. Zwilling joined us with more than 30 years of operational and merchandising expertise in the retail industry and a strong knowledge of the women’s apparel sector from former leadership roles at Jones Apparel Group. | |
| • | Reducing our overhead to a level commensurate with projected revenue. Our cost reduction efforts have included tighter controls surrounding discretionary spending, a temporary freeze on compensation increases, a temporary reduction in executive compensation, and streamlining initiatives. These initiatives included rationalization of office space and staff reductions, including the consolidation of certain support and production functions and outsourcing of certain corporate functions. In the aggregate, we believe our 2008 and 2009 restructuring efforts will result in over $14.2 million of selling, general and administrative expense savings on an annualized basis. | |
| • | Decentralizing our sourcing to achieve reductions in cost of goods sold. During 2008, we sourced over 95% of our goods within China largely through three Company offices in China, which employed over 130 people and were overseen by a global sourcing executive reporting to the Chief Executive Officer. During 2009, we reduced our China-based organizational structure to 26 employees and one office and are making a concerted effort to explore sourcing opportunities in, among other places, Bangladesh, Vietnam, India and Indonesia. In addition, rather than have sourcing as a corporate function, it is now handled at the division level. We believe this structure results in more effective collaboration between our sales and design teams, on the one hand, and our third party factories, on the other hand, which we believe will ultimately result in a lower cost of goods sold and better ingoing margins. | |
| • | Improving cash flow. Prior to 2009, we paid for virtually all of our goods using letters of credit, which required a credit facility with significant capacity and resulted in meaningful costs. During 2009, we obtained open terms from all of our major suppliers, which has resulted in us increasing our average time outstanding for trade payables to in excess of 39 days and which permitted us to significantly reduce the size of our credit facility and its associated costs. |
1
Table of Contents
Our Products
We have significantly expanded and diversified our product lines. In the 1990s, our product line
primarily consisted of women’s full-fashion, Luxelon® (acrylic yarn) sweaters marketed under the
Designers Originals® label. Although Designers Originals®, now in its 54th year, remains a leading
brand at retailers nationwide, our expanded product line permits us to supply many more departments
of our existing customers and helps us attract new customers.
Hampshire Designers. Hampshire Designers offers sweaters and knit tops for women under the brands
Designers Originals®, Hampshire Studio®, Mercer Street Studio®, and Spring+Mercer®, as well as the
private labels of our customers. Hampshire Studio® and Mercer Street Studio® are proprietary labels
for two of our largest accounts. Spring+Mercer® is a line that we introduced during 2006 that
features more contemporary styling.
Item-Eyes. Item-Eyes markets women’s related sportswear, including jackets, sweaters, pants,
skirts, and “soft dressing,” for the moderate market under labels such as Requirements®, and RQT by
Requirements®, as well as the private labels of our customers.
Hampshire Brands. For men, we offer sweaters under the licensed names of Geoffrey Beene® and
Dockers®, as well as the private labels of our customers. In Fall 2009, in an exclusive arrangement
with J. C. Penney Company, Inc. (“JC Penney”), we launched a full sportswear line under the
licensed JOE Joseph Abboud® label, which includes sweaters, knits, woven tops, blazers, and a range
of men’s bottoms, as well as a tops line under the licensed Alexander Julian Colours® label, which
includes sweaters, knits and woven tops. In addition, we introduced our own brand, Spring+Mercer®,
for men during 2006, which is a more upscale line featuring luxury blend sweaters, as well as knit
and woven tops.
The emphasis with each of the brands is a compelling product that features high quality and good
value. Our brands cover the entire range of moderate department store offerings, from “main floor”
traditional styles to fashion-forward designer styles.
Our Strengths
We believe that we occupy a strong competitive position in a consolidating industry, which we plan
to further solidify through:
Business Focus. We continually review our portfolio of labels, business lines, and divisions to
evaluate whether they meet profitability and performance requirements and are in line with our
business focus. As a result of this process in 2008, we sold certain non-strategic assets of the
Shane Hunter division, with the proceeds being redeployed to grow our core businesses. In addition,
given the challenging business climate in the better market, we also determined not to proceed with
the previously planned 2008 launch of a women’s line targeting the better market under a collection
label of the licensed Joseph Abboud® brand. During 2009, our review did not lead to any
dispositions of divisions, assets, or licenses. However, we initiated and completed the 2009
restructuring plan. See Item 7. Management’s Discussion and Analysis of Financial Condition and
Results of Operations — Restructuring and Cost Reduction Plans.
Solid Infrastructure. We are recognized by leading retailers for our compelling product design,
high quality-value proposition, sourcing expertise, and commitment to customer service, all of
which are important components for major retailers. Our international sourcing abilities permit us
to deliver trend right, quality product to each of the tiers of distribution we supply, which are
primarily located within the United States. The quality of our garments is assured in a variety of
ways. Each garment is manufactured using fine quality yarns and undergoes rigorous quality
assurance checks. We utilize our own personnel, as well as factory personnel, independent
inspection agencies, and independent test labs to ensure that our products meet the high quality
standards required for our brands.
Extensive and Diverse Retail Relationships. Our relationships with major retailers range from
national and regional department stores such as Macy’s, Inc. (“Macy’s”), Belk, Inc., and Bon-Ton
Stores, Inc., to national chain stores such as JC Penney and Kohl’s Department Stores, Inc.
(“Kohls”), to warehouse clubs such as Costco Wholesale Corporation, to off-price retailers such as
TJ Maxx, a division of The TJX Companies, Inc., and Ross Stores, Inc.
2
Table of Contents
Our Strategy
Hampshire’s strategies for the future include leveraging our:
Experienced Design and Sourcing Capabilities. We have and continue to invest in high quality
design talent and resources, including designers with years of experience, state of the art design
software and seamless, real time data and video connectivity to our China office. Each of these
initiatives is aimed at further strengthening our design and sourcing efficiencies to ensure our
brands fulfill the demand for high quality, value and trend-right product.
Strong Competitive Position. As our retail customers seek to differentiate their assortments from
competitors, they are increasingly turning to select designer and exclusive labels. We have
demonstrated our value to retailers by offering such well-known licensed brands as Geoffrey Beene®,
Dockers®, JOE Joseph Abboud® and Alexander Julian Colours® lines. In addition, we are continuing to
develop our own contemporary-styled brand, Spring+Mercer®, while concurrently managing our historic
core labels, which include Designers Originals®, Hampshire Studio®, Mercer Street Studio®,
Requirements®, RQT by Requirements®, and R.E.Q. by Requirements®.
Constant Improvement of our Infrastructure. As efficient systems and technologies are critical to
meeting our retail customers’ needs, we are constantly re-evaluating our infrastructure to obtain
additional synergies and efficiencies. In 2008, our enterprise resource planning platform was
extended across all divisions, and we streamlined back-office functions such as customer service,
quality assurance, and supply chain management. In 2009, we implemented a state-of-the-art
accounting , analysis, and payables imaging software platform, which we believe will continue to
drive efficiency.
Growth Opportunities in Existing and New Channels. We are focused both on growing our sales to
retailers in the moderate department and chain store channel, where we believe we are
under-penetrated, as well as actively exploring new sales channels including international and
shop-at-home.
Organization
We have a long history of supplying men’s and women’s branded and private label sweaters and
women’s woven and knit related sportswear to the moderate price sector of department stores, and
national chains throughout the United States. We utilize our own sales force to sell our product.
With our established international sourcing relationships, we have the ability to respond quickly
to changing fashion trends.
Customers
We have long term relationships with many of our customers. We sell our products principally into
the moderate price sector of most major department and chain stores in the United States. Over the
past few years, we have seen a decrease in the number of our significant retail customers due to
the consolidation of the retail industry and bankruptcy filings by several customers. Sales to our
three largest customers, JC Penney, Kohl’s, and Macy’s in 2009 represented 27%, 16%, and 11%,
respectively, of total annual sales. These same three customers represented 20%, 15%, and 12%,
respectively, of total sales during 2008; and 20%, 16%, and 12%, respectively, of total sales in
2007. For each of the last three years, more than 99% of our sales were to customers located in the
United States. Sales outside of the United States were principally to one account in Canada.
Suppliers
We primarily use foreign suppliers for our raw materials and the production of our product. During
2009, the majority of our product was produced by independent manufacturers located in China.
Competition
The apparel market remains highly competitive. Competition is primarily based on design, price,
quality, and service. While we face competition from domestic manufacturers and distributors, our
primary competition comes from private label programs of the internal sourcing organizations of
many of our customers and factories located in Southeast Asia.
Our ability to compete is enhanced by our in-house design capabilities and our international
sourcing relationships. Our launch of JOE Joseph Abboud® and Alexander Julian Colours® are the most
recent example of our ongoing efforts to deploy our financial resources in a manner that helps
develop a competitive advantage by broadening our apparel offering and product lines to reach
multiple tiers of distribution.
3
Table of Contents
Seasonality
Although we sell apparel throughout the year, our business is highly seasonal with approximately
70% of annual sales occurring during the third and fourth quarters of 2009, which is consistent
with our historical results. This is primarily due to the large concentration of sweaters in our
product mix and the seasonality of the apparel industry in general. Accordingly, our inventory
typically increases in the second and third quarters to accommodate such anticipated demand.
Effects of Changing Prices
We are subject to increased prices for the products we source. We have historically managed our
gross margin by achieving sourcing efficiencies, controlling costs in other parts of our operation
and, when appropriate, passing along a portion of our cost increases to our customers through
higher selling prices. During 2009, our margins were negatively impacted by the combined effect of
lower sales volumes, weak sourcing efforts prior to the 2009 restructuring, and higher customer
allowances due to a weak retail market.
Backlog
Our sales order backlog as of March 12, 2010 was approximately $101.2 million compared to
approximately $95.8 million as of March 12, 2009. The timing of the placement of seasonal orders by
customers affects the backlog; accordingly, a comparison of backlog from year to year is not
necessarily indicative of a trend in sales for the year. The backlog as of March 12, 2010 is
expected to be filled during 2010.
Trademarks and Licenses
We consider our owned trademarks to have significant value in the marketing of our products. In
addition, we have entered into licensing agreements to manufacture and market apparel under certain
labels for which we pay royalties based on the volume of sales. The licensing agreements are
generally for a three-year term, with an option to renew for an additional three-year period,
provided we have met certain sales thresholds. We do not own any patents.
Research and Development Activities
During the last two fiscal years, we did not spend any significant amounts on research and
development activities.
Electronic Information Systems
In order to schedule production, fill customer orders, transmit shipment data to our customers’
distribution centers, and invoice electronically, we have developed a number of integrated
electronic information systems applications. Over 90% of all of our customer orders for 2009 were
received electronically. In some instances, our customers’ computer systems generate these orders
based on sales and inventory levels. We electronically send advance shipment notices and invoices
to our customers, which result in the timely update of their inventory levels.
Credit and Collection
We manage our credit and collection functions by approving and monitoring our customers’ credit
lines. Credit limits are determined by past payment history and financial information obtained from
credit agencies and other sources. The majority of high risk accounts are factored without
recourse, if possible, with financial institutions to reduce our high credit risk exposure. We
believe that our review procedures and our credit and collection staff have contributed
significantly toward minimizing our losses from bad debt.
4
Table of Contents
Governmental Regulation and Trade Agreements
The apparel industry and our business are subject to a wide variety of international trade
agreements as well as federal, state, and local regulations. We believe we are in compliance in all
material respects with these agreements and regulations.
International trade agreements in particular can have a significant impact on the apparel industry
and consequently on our business. These agreements generally provide for tariffs, which impose a
duty charge on the product being imported, and quotas, which limit the amount of a product that may
be imported from a specific country, both of which increase the cost of importing a product.
Primary among the trade agreements existing between the United States and certain foreign countries
is the World Trade Organization (“WTO”), which is the governing body for international trade among
the 151 originating member countries, including the United States. As part of that agreement,
international textile and apparel quotas then in existence were phased out over ten years.
Effective January 1, 2005, all such quota restrictions involving trade with WTO member countries
were terminated. All of our product offerings are now quota free and therefore quantities exported
to the United States from China are no longer limited. In addition to the WTO, apparel imports into
the United States are affected by other trade agreements and legislation, including the North
American Free Trade Agreement, which has eliminated all apparel tariffs and quotas between Canada,
Mexico, and the United States, and legislation granting similar trade benefits to 23 Caribbean
countries. Further, Congress passed the African Growth and Opportunity Act in 2000, which gave 38
countries in sub-Saharan Africa similar trade privileges on apparel and certain other products
exported to the United States.
Compliance with Environmental Laws
We believe that we are in compliance with applicable environmental laws and that such compliance
will not have a major adverse financial impact on us. We further believe that there are no
environmental matters that are likely to have a significant financial impact on us.
Employees
As of March 1, 2010, we had approximately 149 full-time employees, one of whom is under a
collective bargaining agreement, and one part-time employee. We believe our relationship with our
employees is good.
Available Information
Our periodic and current reports, including amendments to such reports as filed or furnished
pursuant to Section 13(a) or 15(d) of the Securities Exchange Act of 1934, as amended, are
available, free of charge, on our website, www.hamp.com, as soon as reasonably practicable after
such material is electronically filed with, or furnished to, the SEC. Information contained on our
website is not and should not be deemed a part of this Annual Report or a part of any other report
or filing with the SEC.
Item 1A. Risk Factors.
In addition to the risks that are described below, there may be risks that we do not yet know of or
that we currently think are immaterial that may also impair our business. If any of the events or
circumstances described as risks below or elsewhere in this report actually occur, our business,
results of operations, or financial condition could be materially and adversely affected. The
following risks, as well as other information contained herein, including our consolidated
financial statements and notes thereto, should be carefully considered in evaluating our business
and any investment in our common stock.
The apparel industry is heavily influenced by general economic cycles that affect consumer
spending. A prolonged period of depressed consumer spending would have a material adverse effect on
us.
The apparel industry has historically been subject to cyclical variations, recessions in the
general economy and uncertainties regarding future economic prospects that affect consumer spending
habits, which could negatively impact our business. The success of our operations depends on a
number of factors impacting discretionary consumer spending, including general economic conditions,
consumer confidence, wages and unemployment, housing prices, consumer debt, interest rates, fuel
and energy costs, taxation and political conditions. A continuation or worsening of the current
downturn in the economy may affect consumer purchases of our products and adversely impact our
growth and profitability.
5
Table of Contents
There may not be an established public trading market for the Company’s common stock.
Effective with the opening of business on January 19, 2007, our common stock was delisted from the
Nasdaq Global Market. There is currently no established public trading market for our common stock.
Our common stock is currently quoted on the Pink Sheets under the symbol “HAMP.PK”. The Pink Sheets
is a centralized quotation service that collects and publishes market maker quotes for
over-the-counter securities in real time. Over-the-counter market quotations, like those on the
Pink Sheets, reflect inter-dealer prices, without retail mark-up, mark-down, or commission and may
not necessarily represent actual transactions. Currently, we are not actively seeking to become
listed on the Nasdaq Global Market or any other exchange. There can be no assurance that our common
stock will again be listed on the Nasdaq Global Market or any other exchange, or that a trading
market for our common stock will be established.
We rely on our key customers, and a significant decrease in business from or the loss of any
one of these key customers would substantially reduce our revenues and adversely affect our
business.
JC Penney, Kohl’s and Macy’s account for a significant portion of our revenues. We do not have long
term agreements with any of our customers and purchases generally occur on an order-by-order basis.
A decision by any of our major customers, whether motivated by marketing strategy, competitive
conditions, financial difficulties, or otherwise, to decrease significantly the amount of
merchandise purchased from us or to change their manner of doing business with us, could
substantially reduce our revenues and have a material adverse effect on our profitability.
The retail industry has, in the past several years, experienced a great deal of consolidation and
other ownership changes and we expect such changes to be ongoing. In the future, retailers may
further consolidate, undergo restructurings or reorganizations, realign their affiliations, or
re-position their stores’ target markets. Any of these types of actions could decrease the number
of stores that carry our products or increase the ownership concentration within the retail
industry. These changes could decrease our opportunities in the market, increase our reliance on a
smaller number of customers, and decrease our negotiating strength with them.
Our business has been and could continue to be adversely affected by financial instability
experienced by our customers.
During the past several years, various retailers have experienced significant financial
difficulties, which have resulted in bankruptcies, liquidations, and store closings. Over the last
few years, several of our customers, including Goody’s, Mervyns, Gottschalks, and Boscov’s, either
reorganized or liquidated. We sell our product primarily to national and regional department stores
in the United States on credit and evaluate each customer’s financial condition on a regular basis
in order to determine the credit risk we take in selling goods to them. The financial difficulties
of a customer could cause us to curtail business with that customer and we may be unable to shift
sales to another customer at comparable margins. We may also assume more credit risk relating to
receivables of a customer experiencing financial instability. Should these circumstances arise with
respect to our customers, our inability to shift sales or to collect on our trade accounts
receivable from any one of our customers could substantially reduce our revenues and have a
material adverse effect on our financial condition and results of operations.
Chargebacks and margin support payments may have a material adverse effect on our business.
Consistent with industry practice, we may allow customers to deduct agreed upon amounts from the
purchase price for sales allowances, co-op advertising, new store opening discounts, and other
marketing development funds, which in the opinion of management promotes brand awareness. In
addition, margin support payments may be required due to lower than anticipated sell through rates,
which may be caused by uncontrollable factors, such as general economic conditions, changing
fashion trends, and weather conditions, as well as controllable factors, such as wholesale prices,
design, merchandising, and the quality of our goods. During recent years, we have experienced a
significant increase in the annual amount of margin support needed. These deductions have a
dilutive effect on our business and results of operations since they reduce overall gross profit
margins on sales. As part of the 2009 restructuring and reorganization of our management team, we
believe we have made the internal changes necessary to improve decision-making on our part, which
we believe will lead to an improvement in our margin support needs. If our efforts to reduce the
trend in our margin support need are unsuccessful, we will likely continue to experience
significant levels of chargebacks and margin support payments, which may further reduce our
profitability resulting in a material adverse effect on our business.
We are dependent upon the revenues generated by our licensing alliances and the loss or
inability to renew certain licenses could reduce our revenue and consequently reduce our net
income.
We license from third parties such as Geoffrey Beene®, Dockers®, JOE Joseph Abboud®, and Alexander
Julian Colours® brands for specific products. The term of each of our licenses is generally three
years, and, we typically have the opportunity to renew or extend the licenses, which are sometimes
conditioned upon our meeting certain sales targets. We may not be able to renew or extend these
licenses on favorable terms, if at all. If we are unable to renew or extend any one of these
licenses, we could experience a decrease in net sales.
6
Table of Contents
We may not be able to anticipate consumer preferences and fashion trends, which could
negatively affect acceptance of our products by retailers and consumers and result in a significant
decrease in net sales.
Our failure to anticipate, identify, and respond effectively to changing consumer demands and
fashion trends could adversely affect acceptance of our products by retailers and consumers and may
result in a significant decrease in net sales or leave us with a substantial amount of unsold
inventory. Our products must appeal to a broad range of consumers whose preferences cannot be
predicted with certainty and are subject to rapid change. We may not be able to continue to develop
appealing styles or successfully meet constantly changing consumer demands in the future. In
addition, any new products or brands that we introduce may not be received successfully by
retailers and consumers. If our products are not received successfully by retailers and consumers
and we are left with a substantial amount of unsold inventory, we may be forced to rely on
markdowns or promotional sales to dispose of excess inventory. If this occurs, our business,
financial condition, and results of operations could be materially adversely affected.
We primarily use foreign suppliers for our raw materials and the manufacture of our products,
which poses risks to our business operations.
During 2009, most of our products were produced by independent manufacturers located in China.
Although no single supplier is critical to our production needs, any of the following could
adversely affect the production and delivery of our products and, as a result, have an adverse
effect on our business, financial condition, and results of operations:
| • | political or labor instability in countries where contractors and suppliers are located; | |
| • | political or military conflict involving the United States; | |
| • | heightened terrorism security concerns, which could subject imported goods to additional, more frequent or more thorough inspections, leading to delays in deliveries, or impoundment of goods for extended periods; | |
| • | a significant decrease in availability or continued increase in cost of raw materials, particularly petroleum-based synthetic fabrics; | |
| • | impact of the global economic downturn on third party factories and their viability; | |
| • | disease epidemics and health-related concerns, such as the SARS, Avian, and H1N1 flu outbreaks in recent years, which could result in closed factories, reduced workforces, and scrutiny or embargo of goods produced in infected areas; | |
| • | imposition of regulations, quotas or duties relating to imports, which, among other things, could limit our ability to produce products in cost effective countries that have the labor force and expertise required; | |
| • | any action that may change the currency exchange rate of the Yuan against the dollar or to permit the exchange rate to float; and | |
| • | significant fluctuation of the value of the dollar against other foreign currencies. |
The occurrence of any, some, or all of these events would result in an increase in our costs of
goods, which we may not be able to pass on to our customers. This reduction in our gross margin
would likely result in an adverse effect on our results of operations.
If our manufacturers fail to use acceptable ethical business practices, our business could be
adversely affected.
We require our manufacturers to operate in compliance with applicable laws, rules, and regulations
regarding working conditions, employment practices, and environmental compliance. However, we do
not control the labor and other business practices of the independent manufacturers of our
products. If one of our manufacturers violates labor or other laws or implements labor or other
business practices that are generally regarded as unethical in the United States, the shipment of
products to us could be interrupted and our reputation could be damaged. Any of these events could
have a material adverse effect on our results of operations.
Our business could be harmed if we do not deliver quality products in a timely manner.
Our sourcing, logistics, and technology functions operate within substantial production and
delivery requirements and subject us to the risks associated with unaffiliated manufacturers,
transportation, and other factors. If we do not comply with customer product requirements or meet
their delivery requirements, our customers could seek reduced purchase prices, require significant
margin support, reduce the amount of business they do with us, or cease to do business with us, all
of which would adversely affect our business.
7
Table of Contents
If we encounter problems with our distribution system, our ability to deliver our products to
the market would be adversely affected.
We rely on our third party distribution facilities to warehouse and to ship product to our
customers. Due to the fact that substantially all of our product is distributed from a relatively
small number of locations, our operations could be interrupted by earthquakes, floods, fires, or
other natural disasters near our distribution centers. We maintain business interruption insurance,
but it may not adequately protect us from the loss of customers. In addition, our distribution
capacity is dependent on the timely performance of services by third parties, including
transportation of product to and from distribution facilities. If we encounter problems with our
distribution system, our inability to meet customer expectations on managing inventory, complete
sales, and achieve objectives for operating efficiencies could have a material adverse effect on
our business.
Labor disruptions at ports or our suppliers’ facilities, manufacturers’ facilities, or
distribution facilities may adversely affect our business.
Our business depends on our ability to source and distribute product in a timely manner. As a
result, we rely on the free flow of goods on a consistent basis from our suppliers and
manufacturers. Labor disputes at various ports or at our suppliers, manufacturers, or our
distribution facilities create significant risks for our business, particularly if these disputes
result in work slowdowns, lockouts, strikes, or other disruptions during our peak importing or
manufacturing seasons. An interruption in the flow of goods could have a material adverse effect on
our business, potentially resulting in cancelled orders by customers, unanticipated inventory
accumulation, or shortages and reduced net sales and net income.
We rely significantly on information technology and any failure, inadequacy, interruption, or
security lapse of that technology could adversely affect our ability to effectively operate our
business.
Our ability to manage and maintain our inventory and internal reports and to ship products to
customers and invoice them on a timely basis depends significantly on our internally developed
enterprise resource planning system, as over 90% of our orders are received electronically. The
failure of this system to operate effectively or to integrate with other systems or a breach in
security of this system could cause delays in product fulfillment and reduced efficiency of our
operations, and it could require significant capital investments to remedy any such failure,
problem, or breach.
We operate in a highly competitive and fragmented industry and our failure to compete
successfully could result in a loss of one or more significant customers.
The apparel industry is highly competitive and fragmented. Our competitors include numerous apparel
designers, manufacturers, retailers, importers, and licensors, many of which have greater financial
and marketing resources than we possess. We believe that the principal competitive factors in the
apparel industry are:
| • | brand name and brand identity, | ||
| • | timeliness, reliability, and quality of product and services provided, | ||
| • | market share and visibility, | ||
| • | price, and | ||
| • | the ability to anticipate customer and consumer demands. |
The level of competition and the nature of our competitors vary by product segment with low margin
manufacturers being our main competitors in the less expensive segment of the market and with
domestic and foreign designers and licensors competing with us in the more upscale segment of the
market. Increasingly, we experience competition from our customers’ in-house private labels. If we
do not maintain our brand names and identities and continue to provide high quality and reliable
services on a timely basis at competitive prices, our ability to compete in our industry will be
adversely affected. If we are unable to compete successfully, we could lose one or more of our
significant customers, which could have a material adverse effect on our sales and financial
performance.
We may face challenges in the management of the sales and profitability of any acquisitions
that we may make, as well as in integrating the acquisitions, any of which may negatively impact
our business.
As part of our growth strategy, we may acquire or license new brands and product categories.
Acquisitions have inherent risks, including the risk that the projected sales and net income from
the acquisition may not be generated, the risk that the integration of the acquired business is
more costly and takes longer than anticipated, the risk of diversion of the attention and resources
of management, risks associated with additional customer concentration and related credit risk,
risks of retaining key personnel, and risks associated with unanticipated events and unknown legal
liabilities. Any of these risks could have a material adverse effect on our business.
8
Table of Contents
The ultimate resolution of income and other possible tax liabilities may require us to incur
expense beyond amounts reserved on our balance sheet or make cash payments beyond those that we
anticipated.
Our historic income and other tax positions may be challenged by the appropriate taxing
authorities. We believe that we have provided adequate reserves for these tax positions for all
periods open under the applicable statutes of limitations, but a challenge by a taxing authority
could prove costly to defend as well as to resolve. If the actual liability for taxes exceeds our
reserves, earnings could be materially adversely affected and we may be required to make cash
payments beyond what we anticipated.
We are dependent on certain key personnel, the loss of whom could negatively impact our ability
to manage our business and thereby adversely affect our business.
Our future success depends to a significant extent on retaining the services of key executive
officers, other key members of management, and directors. The loss of the services of any one of
these individuals, or any other key member of management, could have a material adverse effect on
our business.
The stockholders’ rights plan adopted by the Board of Directors in 2008 may inhibit takeovers
and may adversely affect the market price of our common stock.
In 2008, our Board of Directors (“Board”) approved the creation of our Series A Preferred Stock and
adopted a stockholders’ rights plan pursuant to which it declared a dividend of one Series A
Preferred Stock purchase right for each share of our common stock held by stockholders of record.
The preferred share purchase rights will also attach to any additional shares of common stock
issued. Initially, these rights will not be exercisable and will trade with the shares of our
common stock. Under the rights plan, these rights will generally be exercisable only if a person or
group acquires, or commences a tender or exchange offer, for 15% or more of our common stock. If
the rights become exercisable, each right will permit its holder to purchase one one-thousandth of
a share of Series A Preferred Stock for the exercise price of $33.00 per right. The rights plan
also contains customary “flip-in” and “flip-over” provisions such that if a person or group
acquires beneficial ownership of fifteen percent or more of our common stock, each right will
permit its holder, other than the acquiring person or group, to purchase shares of our common stock
for a price equal to the quotient obtained by dividing $33.00 per right by one-half the then
current market price of our common stock. In addition, if, after a person acquires such ownership,
we are later acquired in a merger or similar transaction, each right will permit its holder, other
than the acquiring person or group, to purchase shares of the acquiring corporation’s stock for a
price equal to the quotient obtained by dividing $33.00 per right by one-half of the then current
market price of the acquiring company’s common stock, based on the market price of the acquiring
corporation’s stock prior to such merger.
The stockholders’ rights plan and the associated Series A Preferred Stock purchase rights may
discourage a hostile takeover and prevent our stockholders from receiving a premium over the
prevailing market price for the shares of our common stock.
Global economic, political and social conditions may harm our ability to do business, increase
our costs and negatively affect our stock price.
The direction and relative strength of the global economy has recently deteriorated significantly
due to softness in the residential real estate and mortgage markets, volatility in fuel and other
energy costs, difficulties in the financial services sector and credit markets, continuing
geopolitical uncertainties and other macroeconomic factors affecting spending behavior. Economic
growth in the United States and other countries continues to be uncertain, and may cause customers
to further delay or reduce purchases. These and other macroeconomic factors had an adverse impact
in 2009 on the sales of our products.
The current global financial crisis affecting the banking system and financial markets and the
possibility that financial institutions may consolidate or go out of business have resulted in a
tightening of credit markets, lower levels of liquidity in many financial markets, and extreme
volatility in fixed income, credit, currency and equity markets. These conditions have made it more
difficult to obtain financing.
There could be a number of follow-on effects from the credit crisis on our business, including
additional insolvencies of certain of our customers and suppliers, and the inability of customers
and suppliers to obtain credit financing to finance purchases of our products or the materials used
to build those products.
Item 1B. Unresolved Staff Comments.
Not Applicable.
9
Table of Contents
Item 2. Properties.
We lease all of our administrative offices, operations center, sales offices, sourcing offices, and
showrooms. Our sales offices and showrooms are in New York, New York. We have administrative
offices in Anderson, South Carolina, an operations center in New York, New York, and a sourcing
office in Dongguan, China. We believe that all of our properties are well maintained and suitable
for their intended use, with the exception being that the landlord of our New York office is
currently involved in foreclosure proceedings, which have resulted in significant delays to a
building wide capital improvement project. The completion of this project is required under the
terms of the lease. We are vigorously pursuing all of our rights and remedies against this
landlord.
Item 3. Legal Proceedings.
In 2006, the Audit Committee of the Board commenced the Audit Committee Investigation related to,
among other things, the misuse and misappropriation of assets for personal benefit, certain related
party transactions, tax reporting, internal control deficiencies, financial reporting, and
accounting for expense reimbursements, in each case involving certain members of the Company’s
former management.
On March 7, 2008, the Company filed a complaint in the Court of Chancery of the State of Delaware
for the County of New Castle (the “Court”) against Messrs. Ludwig Kuttner, Charles Clayton, and
Roger Clark, former members of management. On August 4, 2008, the Company entered into a Stock
Purchase and Settlement Agreement and Mutual Releases with Mr. Kuttner, his wife, Beatrice
Ost-Kuttner, his son, Fabian Kuttner, and a limited liability company controlled by him, K Holdings
LLC (together, the “Kuttner Parties”). Under the Agreement, the Company and the Kuttner Parties
exchanged releases of ongoing and potential claims, the Kuttner Parties sold all of the stock of
the Company that they owned to the Company for approximately $12.0 million and Mr. Kuttner made a
$1.6 million payment to the Company.
On September 10, 2008 and September 19, 2008, Mr. Clayton and Mr. Clark, respectively, filed
answers with respect to the claims that the Company filed against them on March 7, 2008, as well as
counterclaims against the Company. Mr. Clayton and Mr. Clark denied the Company’s claims against
them and asserted claims against the Company for, among other things, certain compensation and
benefits, defamation and other damages.
On September 22, 2008, Mr. Clayton filed a third-party complaint against certain of the
Company’s directors and officers. Mr. Clayton’s complaint asserted claims against those directors
and officers for, among other things, contribution in the event that Mr. Clayton is found liable to
the Company for damages in relation to the Company’s complaint against him, defamation and other
damages allegedly stemming from the Company’s issuance of certain press releases related to the
Audit Committee Investigation. In accordance with Delaware law, the Company’s bylaws and agreements
with the directors and officers, the Company will indemnify the directors and officers if they are
held liable to Mr. Clayton for damages and the Company will advance them legal fees incurred in
their defense.
On June 12, 2009, the Company and its directors and officers who are parties to the litigation
filed a motion for summary judgment. On September 2, 2009, the Court granted the motion in part and
dismissed Mr. Clayton’s claim for intentional infliction of emotional distress against the Company,
as well as his defamation claim against the Company’s directors and officers. The Court denied the
remainder of the Company’s motion and set the remainder of the parties’ claims for trial.
On December 21-24, 2009, the Court
held a trial on the Company’s claims, Clayton’s and Clark’s
counterclaims, and Clayton’s third-party claims. On December 24, 2009, trial concluded and the
Court reserved decision. Pursuant to a scheduling order granted by the Court, the parties filed
their opening post-trial briefs on February 16, 2010 and filed their answering post-trial briefs on
March 12, 2010. A post-trial argument is scheduled for April 7, 2010.
Item 4. (Removed and Reserved).
10
Table of Contents
PART II.
Item 5. Market for Registrant’s Common Equity, Related Stockholder Matters, and Issuer
Purchases of Equity Securities.
Our common stock, $0.10 par value per share, was traded on the Nasdaq Global Market under the
symbol HAMP through January 18, 2007. Effective with the opening of business on January 19, 2007,
our common stock was delisted from the Nasdaq Global Market. (See Item 7. Management’s Discussion
and Analysis of Financial Condition and Results of Operations — Special Costs, as well as Item 8.
Financial Statements and Supplementary Data, Note 1 — Organization and Summary of Significant
Accounting Policies - Special Costs to the consolidated financial statements.) There is currently
no established public trading market for our common stock. Our common stock is currently quoted on
the Pink Sheets under the symbol “HAMP.PK”. The Pink Sheets is a centralized quotation service that
collects and publishes market maker quotes for over-the-counter securities in real time.
Over-the-counter market quotations, like those on the Pink Sheets, reflect inter-dealer prices,
without retail mark-up, mark-down, or commission and may not necessarily represent actual
transactions.
As of March 1, 2010, the Company had 14 stockholders of record of our common stock, although we
believe there are a significantly larger number of beneficial owners. The following table sets
forth the low and high sales prices of shares of our common stock for each of the quarters of 2009
and 2008 as reported by the Pink Sheets:
| 2009 | 2008 | |||||||||||||||
| Low | High | Low | High | |||||||||||||
First Quarter |
$ | 1.50 | $ | 5.50 | $ | 8.70 | $ | 14.75 | ||||||||
Second Quarter |
1.75 | 5.55 | 4.00 | 10.25 | ||||||||||||
Third Quarter |
2.00 | 3.05 | 5.15 | 9.00 | ||||||||||||
Fourth Quarter |
2.50 | 3.99 | 2.05 | 7.50 | ||||||||||||
The
closing stock price on March 17, 2010 was $4.00.
Any determination to pay dividends will be made by our Board and will be dependent upon our
financial condition, results of operations, capital requirements, and such other factors as our
Board may deem relevant. Our revolving credit facility contains restrictive covenants placing
limitations on payment of cash dividends. We have not declared or paid any dividends with respect
to our common stock except a two-for-one stock split in the form of a dividend in 2005.
We did not purchase any of our common stock during the fourth quarter of 2009.
See Item 12. Security Ownership of Certain Beneficial Owners and Management and Related Shareholder
Matters for information regarding our equity compensation plan.
11
Table of Contents
Performance Graph
The following information in this Item 5 of this Annual Report is not deemed to be “soliciting
material” or to be “filed” with the SEC or subject to Regulation 14A or 14C under the Exchange Act
or to the liabilities of Section 18 of the Exchange Act, and will not be deemed to be incorporated
by reference into any filing under the Securities Act or the Exchange Act, except to the extent we
specifically incorporate it by reference into such a filing.
The following graph sets forth a comparison of our stock performance, the S&P 500 Composite Index,
and the S&P 500 Apparel, Accessories & Luxury Goods Index, in each case assuming an investment of
$100 on the last trading day of calendar year 2004 and the accumulation and the reinvestment of
dividends, where applicable, paid thereafter through the last trading day of calendar year 2009.
The Company chose the S&P 500 Composite Index as a measure of the broad equity market and the S&P
500 Apparel, Accessories & Luxury Goods Index as a measure of its relative industry performance.
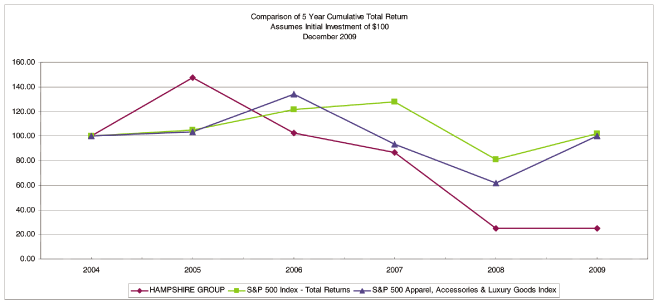
| 2004 | 2005 | 2006 | 2007 | 2008 | 2009 | |||||||||||||||||||
Hampshire Group, Limited |
$ | 100 | $ | 148 | $ | 103 | $ | 87 | $ | 25 | $ | 26 | ||||||||||||
S&P 500 Composite Index |
100 | 105 | 121 | 128 | 81 | 102 | ||||||||||||||||||
S&P 500 Apparel, Accessories & Luxury Goods Index |
100 | 103 | 134 | 93 | 62 | 100 | ||||||||||||||||||
12
Table of Contents
Item 6. Selected Financial Data.
The following selected consolidated financial data should be read in conjunction with Item 7.
Management’s Discussion and Analysis of Financial Condition and Results of Operations and the
consolidated financial statements, including the related notes, included herein in Item 8.
Financial Statements and Supplementary Data. The selected consolidated financial data under the
captions Statement of Operations Data and Balance Sheet Data as of and for the end of each of the
years in the five-year period ended December 31, 2009 are derived from our consolidated financial
statements. The statement of operations data includes results from continuing operations, which
excludes an extraordinary gain on an acquisition made in 2006 as well as the discontinued
operations Marisa Christina and Shane Hunter in 2009, 2008, 2007, and 2006 and of David Brooks in
each year presented. Our historical results are not necessarily indicative of results to be
expected in any future period. The number of shares and the per share data reflect the two-for-one
stock split effective June 28, 2005.
| Year Ended December 31, | ||||||||||||||||||||
| (in thousands, except per share data) | 2009 | 2008 | 2007 | 2006 | 2005 | |||||||||||||||
Statement of Operations Data: |
||||||||||||||||||||
Net sales |
$ | 165,178 | $ | 240,901 | $ | 257,046 | $ | 280,158 | $ | 322,368 | ||||||||||
Gross profit |
39,401 | 52,201 | 64,048 | 71,454 | 77,529 | |||||||||||||||
Selling, general, and administrative expenses |
39,715 | 57,632 | 57,985 | 59,256 | 62,695 | |||||||||||||||
Restructuring charges |
4,820 | 580 | — | — | — | |||||||||||||||
Goodwill impairment loss |
— | 8,162 | — | — | — | |||||||||||||||
Special costs |
4,547 | 2,995 | 5,291 | 6,159 | — | |||||||||||||||
Tender offer related costs |
2,053 | 386 | — | — | — | |||||||||||||||
Recovery of improper payments |
— | — | — | — | (6,013 | ) | ||||||||||||||
Income (loss) from operations |
$ | (11,734 | ) | $ | (17,554 | ) | $ | 772 | $ | 6,039 | $ | 20,847 | ||||||||
Income (loss) from continuing operations |
$ | (6,006 | ) | $ | (24,892 | ) | $ | 2,761 | $ | 3,341 | $ | 11,679 | ||||||||
Basic income (loss) per share from
continuing operations |
$ | (1.10 | ) | $ | (3.61 | ) | $ | 0.35 | $ | 0.43 | $ | 1.43 | ||||||||
Diluted income (loss) per share from
continuing operations |
$ | (1.10 | ) | $ | (3.61 | ) | $ | 0.35 | $ | 0.43 | $ | 1.43 | ||||||||
Basic weighted average common shares
outstanding |
5,482 | 6,884 | 7,860 | 7,855 | 8,153 | |||||||||||||||
Diluted weighted average common shares
outstanding |
5,482 | 6,884 | 7,860 | 7,862 | 8,168 | |||||||||||||||
| 2009 | 2008 | 2007 | 2006 | 2005 | ||||||||||||||||
Balance Sheet Data: |
||||||||||||||||||||
Cash and short term investments |
$ | 33,365 | $ | 35,098 | $ | 48,431 | $ | 70,210 | $ | 75,845 | ||||||||||
Working capital (1) |
59,627 | 61,643 | 81,466 | 82,029 | 91,403 | |||||||||||||||
Total assets |
86,929 | 98,706 | 156,468 | 147,234 | 140,120 | |||||||||||||||
Long-term liabilities (1) |
14,656 | 14,480 | 13,539 | 537 | 3,024 | |||||||||||||||
Total stockholders’ equity |
58,849 | 64,797 | 106,544 | 107,577 | 102,965 | |||||||||||||||
Book value per share outstanding |
9.32 | 11.85 | 13.56 | 13.69 | 13.08 | |||||||||||||||
| (1) | Excludes discontinued operations |
13
Table of Contents
Item 7. Management’s Discussion and Analysis of Financial Condition and Results of Operations.
The following discussion contains statements that are forward-looking. These statements are based
on expectations and assumptions that are subject to risks and uncertainties. Actual results could
differ materially because of, among other reasons, factors discussed in the “Safe Harbor” statement
on page ii of this report and Item 1A — Risk Factors and elsewhere in this report. The commentary
should be read in conjunction with the consolidated financial statements and related notes and
other statistical information included in this report.
OVERVIEW
OVERVIEW
The following is a graphical illustration (it does not represent an actual time period, actual
revenues, actual cash balances, etc.) of the historical seasonal nature of our business.
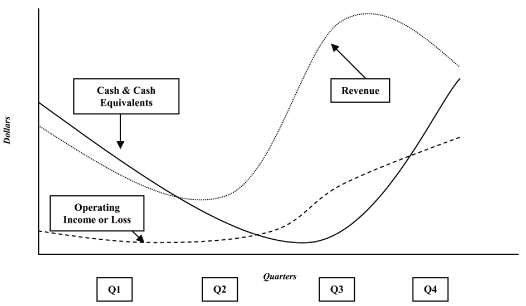
Our product mix, which has a high concentration of sweaters, skews our revenues to the third and
fourth quarters and accounted for approximately 70% of our net sales in 2009. Inventory begins to
rise in the second quarter and typically peaks during the third quarter before descending to its
cyclical low in the fourth quarter. Trade receivable balances rise commensurately with sales. Cash
balances follow the cycle as inventory is purchased, product is sold, and trade receivables are
collected. Funding inventory and pending trade receivable collections deplete cash balances,
generally requiring draws from our revolving credit facility in the third or fourth quarters. Our
income or loss from continuing operations has generally been correlated with revenue, as a large
percentage of our profits have historically been generated in the third and fourth fiscal quarters.
We are a provider of women’s and men’s sweaters, wovens and knits, and a designer and marketer of
branded apparel in the United States. As a holding company, we operate through our wholly-owned
subsidiaries: Hampshire Designers, Inc. and Item-Eyes, Inc. which in turn hold our operating
divisions — Women’s and Men’s. We were established in 1977 and are incorporated in the state of
Delaware.
Our Women’s division is comprised of both our women’s knitwear business, known as Hampshire
Designers, Inc. and our of women’s related sportswear business, known as Item Eyes. Our men’s
division, known as Hampshire Brands, offers both sweaters and sportswear.
14
Table of Contents
Our products, both branded and private label, are marketed in the moderate and better markets
through multiple channels of distribution including national and regional department and chain
stores. All of our divisions source their product with what we believe are quality manufacturers.
Keynote Services, Limited, our subsidiary based in China, assists with our sourcing needs and
provides quality control.
Our primary strength is our ability to design, develop, source, and deliver quality products within
a given price range, while providing superior levels of customer service. We have developed
international sourcing abilities that permit us to deliver quality merchandise at competitive
prices to our customers.
Our divisions source the manufacture of their product with factories primarily located in Southeast
Asia. Our products are subject to price increases, which we try to offset by achieving sourcing
efficiencies, controlling costs in other parts of our operations and, when necessary, passing along
a portion of our cost increases to our customers through higher selling prices. We purchase our
products from international suppliers in U.S. dollars.
The apparel market is highly competitive. Competition is primarily based on product design, price,
quality, and service. We face competition from apparel designers, manufacturers, importers,
licensors, and our own customers’ private label programs, many of which are larger and have greater
financial and marketing resources than we have available to us.
The 2009 economic environment, a continuation of what we experienced in 2008, was characterized by,
among other things, a dramatic reduction in consumer spending and substantial tightening of credit
markets. Accordingly, our priorities in 2009 included:
| • | Restructuring of management. During 2009, in light of a prolonged and accelerating decline in operating results, our Board initiated a plan to restructure the management team to better position the Company to meet the challenges posed by the economic environment in 2009 and to establish a framework for future growth. This plan resulted in the reduction of senior management from eight to four positions, the departure of five executives, the July 2009 appointment of Heath L. Golden as President and Chief Executive Officer, and the addition of Howard L. Zwilling as President of Women’s Apparel. Mr. Zwilling joined us with more than 30 years of operational and merchandising expertise in the retail industry and a strong knowledge of the women’s apparel sector from former leadership roles at Jones Apparel Group. | |
| • | Reducing our overhead to a level commensurate with projected revenue. Our cost reduction efforts have included tighter controls surrounding discretionary spending, a temporary freeze on compensation increases, a temporary reduction in executive compensation, and streamlining initiatives. These initiatives included rationalization of office space and staff reductions, including the consolidation of certain support and production functions and outsourcing certain corporate functions. In the aggregate, we believe our 2008 and 2009 restructuring efforts will result in over $14.2 million of selling, general, and administrative expense savings on an annualized basis. See Restructuring and Cost Reduction Plans. | |
| • | Decentralizing our sourcing to achieve reductions in cost of goods sold. During 2008, we sourced over 95% of our goods within China largely through three Company offices in China, which employed over 130 people and were overseen by a global sourcing executive reporting to the Chief Executive Officer. We reduced our China-based organizational structure to 26 employees and one office and are making a concerted effort to explore sourcing opportunities in, among other places, Bangladesh, Vietnam, India and Indonesia. In addition, rather than have sourcing as a corporate function, it is now handled at the division level. We believe this structure results in more effective collaboration between our sales and design teams, on the one hand, and our third party factories, on the other hand, which we believe will ultimately result in a lower cost of goods sold and better ingoing margins. See Restructuring and Cost Reduction Plans. | |
| • | Improving cash flow. Prior to 2009, we paid for virtually all of our goods using letters of credit, which required a credit facility with significant capacity and resulted in meaningful costs. During 2009, we obtained open terms from all of our major suppliers, which has resulted in us increasing our average time outstanding for trade payables to in excess of 39 days and which permitted us to significantly reduce the size of our credit facility and its associated costs. See Liquidity and Capital Resources. |
15
Table of Contents
In addition, we believe other 2009 initiatives will better the position the Company for the long
term.
In August 2009, we amended our $125.0 million credit facility to reduce and convert it to a $48.0
million asset based revolving credit facility including trade letters of credit with a $10.0
million sub-limit. Letters of credit outstanding were approximately $4.6 million at December 31,
2009, as compared to $29.8 million at December 31, 2008. We believe the reduction in letters of
credit in 2009 as compared to 2008 was primarily the result of achieving better terms with our
vendors. We had approximately $43.4 million of availability under the amended facility at December
31, 2009.
In October 2009, we adopted stock and cash incentive compensation plans, which will be administered
by the Board or a committee appointed by the Board. The plans are designed to assist us in
attracting, retaining, motivating, and rewarding key employees, officers, directors, and
consultants, and promoting the creation of long-term value for stockholders of the Company by
closely aligning the interests of these individuals with those of our stockholders.
Richard A. Mandell, who served as President and Chief Executive Officer from April 2009 to July
2009, remains a director of the Company and was appointed Chairman of the Board in February 2010.
Peter H. Woodward became a director and was named to the Audit Committee in December 2009 and
Chairman of the Nominating Committee in February 2010.
Restructuring and Cost Reduction Plans
Over the two most recent fiscal years, we initiated and implemented restructuring programs that
will result in over $14.2 million in total annualized savings, a portion of which was realized in
2008 and 2009.
In April 2009, we initiated the 2009 Restructuring (the “2009 Restructuring”) designed to
significantly reduce our fixed cost structure, improve our return on invested capital, increase our
operating efficiency, and better position us for the long term. The components of the 2009
Restructuring included a net reduction of over 170 employees, or approximately 50% of the our
global workforce, with approximately 110 of the positions associated with our China operations, a
temporary compensation reduction program applicable to senior-level employees, the suspension of
our 401(k) matching contribution, the reorganization of certain operating functions, and the
consolidation of our New York and Asian operations. The reduction in our workforce was necessitated
by reduced sales volume and the outsourcing of certain functions, which resulted in the elimination
of positions at every level of the Company.
In May 2008, we initiated a restructuring and cost reduction plan (the “2008 Restructuring”) that
involved a reduction of our workforce and included the consolidation and relocation of some of our
operations, including the closing of our Hauppauge, New York office. It also included
re-negotiations with our independent third party warehouse provider that led to contractual
reductions in pricing. The total personnel reductions during 2008 related to the 2008 Restructuring
consisted of approximately 41 employees primarily located in the New York metropolitan region and
South Carolina.
Our selling, general, and administrative expenses for the year ended December 31, 2009 were $39.7
million compared with $57.6 million for the same period last year, largely the result of the
restructurings.
Both the 2009 and the 2008 restructurings were completed in the fourth quarter of their respective
years at a cost of $4.8 million and $0.6 million, respectively, and are reflected in Restructuring
Charges on the Consolidated Statement of Operations. See Item 8. Financial Statements and
Supplementary Data Note 16 — Restructuring and Cost Reduction Plans to the audited consolidated
financial statements for additional discussion of these events.
Compensation Plans
On October 21, 2009, we adopted stock and cash incentive compensation plans, which are administered
by the Board or a committee appointed by the Board.
The Hampshire Group, Limited 2009 Stock Incentive Plan (the “Stock Plan”) is designed to assist us
in attracting, retaining, motivating, and rewarding key employees, officers, directors, and
consultants, and promoting the creation of long-term value for stockholders of the Company by
closely aligning the interests of these individuals with those of our stockholders. The Stock Plan
permits us to award eligible persons nonqualified stock options, restricted stock, and other
stock-based awards. In connection with the adoption of the Stock Plan, the Board approved grants of
restricted stock under the Stock Plan totaling 862,500 shares, which consisted of over 30 grants to
employees, managers, named executive officers, and directors. Ten percent of each award of
restricted stock will be subject to time-based vesting with the remaining 90% of each award subject
to performance-based vesting.
16
Table of Contents
In addition, we adopted the Hampshire Group, Limited 2010 Cash Incentive Bonus Plan (the “Bonus
Plan”) pursuant to which we will grant annual performance-based bonuses to approximately 30
employees, managers, and named executive officers. The goal of the Bonus Plan is to align the
annual interests of our management and other key employees with those of the Company and our
stockholders by providing a cash bonus incentive for meeting annual goals set by the Board. Target
bonus amounts under the Bonus Plan will be a percentage of each participant’s base salary, and
actual bonus amounts paid under the Bonus Plan will depend on the extent to which annual
performance metrics are achieved. See Item 8. Financial Statements and Supplementary Data Note 12
- Stock Awards, Compensation Plans, and Retirement Savings Plan to the audited consolidated
financial statements for additional discussion of these events.
The Board’s Compensation Committee
did not grant a long-term incentive bonus in 2009 or 2010. On
March 17, 2010, the Compensation Committee terminated the Long-Term Bonus Plan. Due to the separation from
employment of several award recipients, only $0.4 million will potentially be paid out of the $1.3
million in Long-Term Bonus Plan awards granted on February 28, 2008.
Discontinued Operations
We continually review our portfolio of labels, business lines, and divisions to evaluate whether
they meet profitability and performance requirements and are in line with our business focus. As a
part of this review, we disposed and discontinued operations of certain divisions as outlined
below.
In 2007, we sold certain assets of our Marisa Christina and David Brooks divisions and ceased their
domestic activities.
In 2008, we sold certain assets of our Shane Hunter division including inventory, trademarks, and
other assets to a buyer which included former members of Shane Hunter’s management. The total
purchase price was approximately $3.7 million. In addition, the buyer assumed $0.1 million of
liabilities of Shane Hunter. During the year ended December 31, 2008, we recognized a pre-tax loss
on the transaction of $3.5 million due to, among other things, the write off of an intangible,
severance, transaction related costs, and the acceleration of certain facility lease expenses.
In accordance with U.S. generally accepted accounting principles (“GAAP”), our 2008 consolidated
financial statements reflect the results of operations and financial position of the Marisa
Christina, David Brooks, and Shane Hunter divisions separately as discontinued operations. The loss
from discontinued operations, net of taxes, was $40,000, $5.0 million, and $2.8 million in the
years ended December 31, 2009, 2008, and 2007, respectively. See Item 8. Financial Statements and
Supplementary Data Note 14 — Dispositions and Discontinued Operations to the audited consolidated
financial statements for additional discussion of these events.
Tender Offer
The Company announced on February 24, 2009 that it reached a definitive agreement (the “Merger
Agreement”) to be acquired by NAF Acquisition Corp., a direct wholly owned subsidiary of NAF
Holdings II, LLC (together with NAF Acquisition Corp., “NAF”). On April 26, 2009, the Company
received a letter from NAF stating that NAF was terminating the Merger Agreement effective
immediately, as a result of one or more alleged breaches of covenants and agreements on the part of
the Company.
On September 28, 2009, the Company entered into a settlement and mutual release agreement
(“Settlement”) with NAF, pursuant to which the Company and NAF settled and discharged all claims
related to and arising under the Merger Agreement and any ancillary agreements entered into in
connection with the negotiation and execution of the Merger Agreement. Under the terms of the
Settlement, the Company agreed to reimburse NAF for approximately $0.8 million of approximately
$2.1 million in transaction related expenses incurred by NAF in connection with the Merger
Agreement.
Costs related to the tender offer are reflected in Tender offer related costs on the Consolidated
Statement of Operations and were $2.1 million and $0.4 million in the years ended December 31, 2009
and 2008, respectively. See Item 8. Financial Statements and Supplementary Data Note 17 — Tender
Offer to the audited consolidated financial statements for additional discussion of these events.
Change in Independent Accountants
On September 28, 2009, we dismissed Deloitte & Touche, LLP as our independent registered public
accountants. Concurrently, and upon the recommendation and approval of the Audit Committee, we
engaged BDO Seidman, LLP as our independent registered public accountants for the fiscal year ended
December 31, 2009. See “Item 4.01 Changes in Registrant’s Certifying Accountant” in our Form 8-K
filed with the SEC on October 2, 2009.
17
Table of Contents
RESULTS OF CONTINUING OPERATIONS
Years ended December 31, 2009 and 2008
Net Sales
Net sales decreased to $165.2 million in 2009 from $240.9 million in 2008. The $75.7 million
decrease resulted from a decline in volume, principally in our women’s division, and lower average
selling prices due to larger customer allowances as outlined in the table below:
| Annual Rate/Volume | ||||||||
| Percentage | ||||||||
| (In thousands) | Dollars | of 2008 | ||||||
Net sales for the year ended December
31, 2008 |
$ | 240,901 | 100.0 | % | ||||
Volume |
(64,328 | ) | (26.7 | %) | ||||
Average selling prices |
(11,395 | ) | (4.7 | %) | ||||
Net sales for the year ended December
31, 2009 |
$ | 165,178 | 68.6 | % | ||||
We believe that the decrease in 2009 volume reflected a weak retail market, poor execution in
certain areas of our business prior to the 2009 Restructuring, and the impact of customers
who filed for bankruptcy in 2008. If these retail conditions persist, which we believe appears
likely, our net sales and operating results will be likely be adversely affected in 2010.
Gross Profit
Gross profit for 2009 was $39.4 million compared with $52.2 million for the same period last year,
which reflected the decrease in net sales. The gross profit percentage was 23.9% of net sales for
2009 compared with 21.7% for the same period last year. The increase in the gross profit percentage
was due to a reversal of the $5.1 million reserve related to a supplier dispute established in
2002 that we determined in the fourth quarter of 2009 was no longer required. See Item 8. Financial
Statements and Supplementary Data Note 6 — Accrued Expenses and Other Liabilities to the audited
consolidated financial statements for additional discussion of these events. Excluding the reserve
reversal, gross profit declined to 20.8% of 2009 net sales. The decrease in the gross profit
percentage was primarily due to an increase in customer allowances. Economic indicators
suggest that retail conditions may continue to be uncertain and our gross profit may be adversely
affected in 2010.
Selling, General, and Administrative Expenses
Selling, general, and administrative (“SG&A”) expenses for the year ended December 31, 2009 were
$39.7 million compared with $57.6 million for the same period last year. The $17.9 million decrease
in 2009 as compared to 2008 was primarily due to the combined effect of lower compensation and
employee related expenses due to the 2008 and 2009 Restructurings, a $4.0 million decline in
warehousing costs due to lower volumes and negotiated reductions in pricing in the current period,
and our efforts to reduce other expenses across the Company. However, SG&A expenses remained
approximately flat at 24.0% and 23.9% of 2009 and 2008 net sales, respectively, due to the large
decline in net sales in 2009.
Special Costs
We report certain costs as Special Costs including, but not limited to, the costs associated with
the Audit Committee Investigation, the assessment and remediation of certain tax exposures, the
restatement of the financial statements which resulted from the findings of the Audit Committee
Investigation, investigations by the SEC and the U.S. Attorney’s Office, a stockholder derivative
suit, Nasdaq Global Market listing related costs, director and officer insurance expense, legal and
other expenses related to the now settled arbitration and litigation with Mr. Kuttner, legal
matters involving Messrs. Clayton and Clark, and related matters. See Item 3. Legal Proceedings and
Item 8. Financial Statements and Supplementary Data Note 1 — Organization and Summary of
Significant Accounting Policies to the audited consolidated financial statements for additional
discussion of these events.
During the year ended December 31, 2009, we incurred $4.5 million in Special Costs as compared to
$3.0 million during the year ended December 31, 2008. Professional fees, principally legal, were
higher in 2009, primarily due to ongoing litigation with Messrs. Clayton and Clark. We expect to
incur additional costs in connection with the lawsuit against Messrs. Clayton and Clark and related
matters. We cannot predict the total cost but believe that future costs could be material. Special
Costs incurred since inception of the Audit Committee Investigation were approximately $19.0
million through December 31, 2009.
18
Table of Contents
Other Income (Expense)
The Other, net component of Other income (expense) in the years ended December 31, 2009 and 2008
was $(0.4) million and $1.6 million, respectively. In 2008, $1.6 million was received pursuant to a
settlement agreement with Mr. Kuttner and accounted for a majority of the decline in Other, net
from 2008 to 2009. See Item 3. Legal Proceedings and Item 8. Financial Statements and Supplementary
Data Note 10 — Commitments and Contingencies for additional discussion regarding the settlement
agreement.
Income Taxes
Our income tax benefit for the year ended December 31, 2009 of $6.3 million was the result of a
$6.6 million receivable for a refund we recorded as a result of a change in U.S. tax laws during
the fourth quarter of 2009, allowing us to carry back losses to prior periods. The carry back
extended to periods in which statutes had lapsed, thereby re-opening those periods, and leading us
to re-establish income tax reserves, partially offsetting the benefit.
During the fourth quarter of 2008, we determined, in accordance with GAAP, it was more likely than
not, based on all of the relevant evidence that all of our deferred tax assets would not be
utilized in future periods and that a tax benefit for losses incurred would not be realized. See
Item 8. Financial Statements and Supplementary Data Note 9 — Income Taxes to the audited
consolidated financial statements for additional discussion of these events.
Years ended December 31, 2008 and 2007
Net Sales
Net sales decreased to $240.9 million in 2008 from $257.0 million in 2007. The $16.1 million
decrease was the result of a decline in volume partially offset by higher average selling prices as
outlined in the table below:
| Annual Rate/Volume | ||||||||
| Percentage | ||||||||
| (In thousands) | Dollars | of 2007 | ||||||
Net sales for the year ended December
31, 2007 |
$ | 257,046 | 100.0 | % | ||||
Volume |
(28,171 | ) | (11.0 | %) | ||||
Average selling prices |
12,026 | 4.7 | % | |||||
Net sales for the year ended December
31, 2008 |
$ | 240,901 | 93.7 | % | ||||
Our average selling prices increased as we were able to pass along some of the higher product costs
incurred in 2008. The decrease in volume was primarily caused by a weak retail market and its
negative impact on our customers that has led to the bankruptcies of several of our customers. In
addition, we experienced a significant increase in customer allowances during the fourth quarter of
2008, resulting from heavy discounting by our customers in order to accelerate the sale of
inventory.
Gross Profit
Gross profit for the year ended December 31, 2008 was $52.2 million compared with $64.0 million for
the same period last year, which reflected the combined effect of the decrease in net sales and a
decline in the 2008 gross profit percentage to 21.7% of net sales compared with 24.9% in 2007. The
decrease in the gross profit percentage was primarily due to a decline in net sales as a result of
increases in “in season” off price sales due to customers’ credit issues, bankruptcies,
cancellations, and increases in our cost of goods sold that we were unable to fully pass through to
our customers, particularly in men’s apparel.
Selling, General, and Administrative Expenses
SG&A expenses for the year ended December 31, 2008 were $57.6 million compared with $58.0 million
for the same period in the previous year. The decrease in 2008 as compared to 2007 was primarily
due to the combined effect of lower compensation and employee related expenses, largely due to the
2008 Restructuring. These decreases were partially offset by an increase in bad debt expenses for
customers who filed for bankruptcy protection, and increases in rent and depreciation, primarily
related to facilities in New York, NY as we consolidated operations formerly dispersed over a
number of locations during February 2008. SG&A expenses as a percent of net sales was 23.9% and
22.6% for 2008 and 2007, respectively. This increase as a percent of sales in 2008 is primarily due
to the decline in sales from 2007.
19
Table of Contents
Loss on Goodwill Impairment
The Company’s goodwill is tested for impairment at least on an annual basis and otherwise when
warranted. The impairment test involves a comparison of the fair value of its reporting unit to
carrying amounts. If the reporting unit’s aggregated carrying amount exceeds its fair value, then
an indication exists that the reporting unit’s goodwill may be impaired. The impairment to be
recognized is measured by the amount by which the carrying value of the reporting unit being
measured exceeds its fair value, up to the total amount of its assets.
Based upon tests performed for the fourth quarter of 2008, we recorded an impairment charge of $8.2
million, in connection with the goodwill related to Item-Eyes and Hampshire Designers, leaving no
goodwill balance. The 2008 impairment charge reflected the combined impact of deteriorating 2008
economic retail conditions and adverse equity market conditions, which caused a material decline in
industry market multiples and lower estimated future cash flows for Item-Eyes and Hampshire
Designers. In addition, the then Tender Offer to acquire the common stock of the Company indicated
the carrying value of goodwill exceeded its fair value.
Special Costs
During the year ended December 31, 2008, we incurred $3.0 million in Special Costs as compared to
$5.3 million during the year ended December 31, 2007. Professional fees, principally legal and
accounting, were higher in 2007 primarily due to the completion of the Audit Committee
Investigation in the second quarter of 2007, determining the necessary adjustments and restating
our Annual Report on Form 10-K for the year ended December 31, 2005, and for related matters.
Other Income (Expense)
The Other, net component of Other income (expense) in the year ended December 31, 2008 reflects the
$1.6 million received pursuant to a settlement agreement with Mr. Kuttner. See Item 3. Legal
Proceedings and Item 8. Financial Statements and Supplementary Data Note 10 — Commitments and
Contingencies for additional discussion regarding the settlement agreement.
Income Taxes
In 2008, we determined it was more likely than not, based on all of the relevant evidence in
accordance with GAAP that all of our deferred tax assets would not be utilized in future periods.
Our provision for income taxes for the year ended December 31, 2008 of $9.9 million reflects an
increase in our deferred tax valuation allowances of $18.9 million. Excluding the valuation
allowances, we would have recognized a tax benefit of $9.0 million due to the losses incurred in
2008. See Item 8. Financial Statements and Supplementary Data, Note 9 — Income Taxes to the audited
consolidated financial statements for additional discussion of these events.
We recognized an income tax benefit of $0.7 million in 2007 resulting in a negative 33.1% effective
tax rate, which primarily resulted from the release of tax reserves due to the settlement of
certain tax exposures and the lapsing of the statute of limitations of other tax exposures
partially offset by non-deductible tax items.
INFLATION
We are subject to increased prices for the products we source due to both inflation and exchange
rate fluctuations. We have historically managed to lessen the impact of inflation by achieving
sourcing efficiencies, controlling costs in other parts of our operations and, when necessary,
passing along a portion of our cost increases to our customers through higher selling prices. If,
however, costs continue to rise at rates higher than those we have historically experienced, there
can be no guarantee that we will be successful in passing a sufficient portion of such increases
onto our customers to preserve our gross profit.
20
Table of Contents
LIQUIDITY AND CAPITAL RESOURCES
Our primary liquidity and capital requirements are to fund working capital for current operations,
consisting of funding the seasonal buildup in inventories and accounts receivable and funding
markdown allowances. Due to the seasonality of the business, we generally reach our highest level
of borrowing under our revolving credit facility during the third and fourth quarters of the year.
Our primary sources of funds to meet our liquidity and capital requirements include funds generated
from operations and borrowings under our revolving credit facility.
On February 15, 2008, we amended and restated our 2003 Revolving Credit Facility by entering into a
$125.0 million Amended and Restated Credit Agreement and Guaranty (the “Credit Facility”) with HSBC
Bank USA, National Association (“HSBC”), other financial institutions named therein as bank parties
(together with HSBC, the “Banks”), and HSBC, as Letter of Credit Issuing Bank and as Agent for the
Banks (“Agent”). Our Amended and Restated Credit Agreement included certain financial and other
covenants, including a covenant that we maintain a fixed charge ratio of consolidated earnings
before interest, taxes, depreciation, and amortization of not less than 1.25 to 1.0 of certain
fixed charges on the last day of each fiscal quarter on a rolling four quarter basis.
Based on our 2008 results, we determined on March 13, 2009 that we were not in compliance with the
Credit Facility’s consolidated fixed charge ratio covenant and thus could not borrow or issue
letters of credit under the Credit Facility. The Banks accepted certain letter agreements, which
allowed us to issue letters of credit in exchange for cash collateral and other requirements after
March 13, 2009 and before the facility was amended and restated.
On August 7, 2009, we amended and restated our Credit Facility (the “Amended Facility”) with the
Banks to reduce and convert the facility to a $48.0 million asset based revolving credit facility
including trade letters of credit with a $10.0 million sub-limit for standby letters of credit. The
reduction in size reflects our current business needs and the success we have had in convincing our
vendors to accept open terms rather than requiring letters of credit. The financial covenants have
been adjusted to provide us with greater flexibility in the operation of our businesses. Fees and
interest rates under the facility increased to current market rates, although we expect that much
of this increase will be offset by the reduction in the size of the facility.
The Amended Facility is scheduled to expire on June 30, 2011 and is secured by substantially all
assets of the Company. Aggregate borrowing availability under the Amended Facility is limited to
the lesser of $48.0 million or a formula which considers cash, accounts receivable and inventory.
Interest rates under the Amended Facility vary with the prime rate or LIBOR. The Amended Facility
includes certain covenants, which include minimum earnings before interest, taxes, depreciation and
amortization (net of certain charges), maximum capital expenditures, minimum availability, minimum
liquidity, letters of credit tied to booked orders, and limitations on when direct debt is
permitted. Cash collateral and other requirements of the letter agreements executed after March 13,
2009 were fully rescinded and replaced by terms and conditions in the Amended Facility. The Amended
Facility has other customary provisions for periodic reporting, monitoring, and fees.
At December 31, 2009, there were no outstanding borrowings from the Amended Facility with
approximately $43.4 million of availability. The highest level of borrowings outstanding during
2009 was $8.4 million. At December 31, 2009, letters of credit outstanding were approximately $4.6
million as compared to $29.8 million at December 31, 2008, primarily the result of the Company
achieving better terms with vendors. The highest balance of letters of credit outstanding during
the year ended December 31, 2009 was approximately $30.0 million attained during January 2009, with
an average balance outstanding for the year of $12.4 million.
We, in the normal course of business, issue binding purchase orders to secure product for future
sales to our customers. At December 31, 2009, these open purchase orders amounted to approximately
$45.2 million, of which approximately $0.7 million were covered by open letters of credit. The
majority of the purchases made pursuant to open letters of credit will be received during the first
six months of 2010. In addition, there were standby letters of credit for approximately $3.9
million related to other matters.
We believe that the borrowings available to us under the Amended Facility along with cash flow from
operations will provide adequate resources to meet our capital requirements and operational needs
for the next twelve months.
21
Table of Contents
Future contractual obligations related to long-term debt, deferred compensation, non-cancelable
operating leases, minimum royalty payments, and other obligations at December 31, 2009 were as
follows:
Payments Due By Period
| Less | ||||||||||||||||||||
| than 1 | 1 – 3 | 3 – 5 | After 5 | |||||||||||||||||
| (in thousands) | Total | Year | Years | Years | Years | |||||||||||||||
Long-term debt |
$ | 118 | $ | 39 | $ | 79 | $ | — | $ | — | ||||||||||
Operating leases |
64,033 | 5,074 | 10,289 | 9,986 | 38,684 | |||||||||||||||
Royalty payments |
9,247 | 3,888 | 5,359 | — | — | |||||||||||||||
Standby letters of credit |
3,922 | 3,922 | — | — | — | |||||||||||||||
Open purchase orders |
45,226 | 45,226 | — | — | — | |||||||||||||||
Other commitments |
1,301 | 920 | 346 | 17 | 18 | |||||||||||||||
Total (1) |
$ | 123,847 | $ | 59,069 | $ | 16,073 | $ | 10,003 | $ | 38,702 | ||||||||||
| (1) | Contingent obligations such as those relating to uncertain tax positions generally do not have specific payment dates and accordingly have been excluded from the above table. We believe that within the next 12 months it is reasonably possible that we could pay approximately $0.6 million related to uncertain tax positions, which includes an estimate for interest and penalties. |
Net cash used in continuing operating activities was $0.4 million for the year ended December 31,
2009, as compared to net cash used in continuing operating activities of $1.1 million in 2008. The
decrease in net cash used by continuing operating activities in 2009 as compared with 2008 was
primarily the result of a decrease in the net changes in operating asset and liability balances.
Net cash used in continuing operating activities was $1.1 million for the year ended December 31,
2008, as compared to net cash used in continuing operating activities of $15.3 million in 2007. The
decrease in net cash used by continuing operating activities in 2008 as compared with 2007 was
primarily the result of a decrease in operating asset balances partially offset by a shift to a
loss from continuing operations in 2008 from continuing operations income in 2007. In 2007, there
was a build up in accounts receivable and inventory from customer-requested shipment delays of
goods throughout the fourth quarter, due to the weak retail environment. In addition, $4.1 million
in cash was used to purchase a directors and officers insurance related policy on December 3, 2007.
Though the 2008 loss from continuing operations before taxes was $24.9 million, its impact on cash
flow from continuing operating activity was much less due to non-cash charges such as depreciation
and amortization, the loss on goodwill impairment, and the deferred income tax provision of $1.9
million, $8.2 million, and $12.4 million, respectively.
We sold certain assets of our Shane Hunter subsidiary during April 2008 and retained approximately
$14.0 million in gross accounts receivable. As of December 31, 2008, all of those gross receivables
were collected and used to provide additional funds for our operations and other general corporate
purposes. These collections represent the primary component of the $6.8 million of net cash
contributed by discontinued operations during 2008.
Net cash used in continuing investing activities was approximately $0.3 million for the year ended
December 31, 2009, as compared to net cash used of $10.3 million and $3.8 million in 2008 and 2007,
respectively. The 2008 and 2007 activity primarily reflects capital expenditures related to
leasehold improvements to our New York facility, which were substantially completed in 2008.
Net cash used in continuing financing activities in the year ended December 31, 2009 was $0.8
million and primarily reflects costs capitalized with respect to the Amended Facility. Net cash
used in continuing financing activities was approximately $12.4 million for the year ended December
31, 2008 as compared to cash provided by continuing financing activities $0.1 million in 2007. We
entered into a settlement with the Kuttner parties and purchased their stock for approximately
$12.0 million in August 2008. The net cash used for this transaction was approximately $10.4
million. See Item 3. Legal Proceedings and Item 8. Financial Statements and Supplementary Data Note
10 — Commitments and Contingencies for additional discussion regarding the settlement agreement.
22
Table of Contents
OFF-BALANCE SHEET ARRANGEMENTS
We utilize letters of credit and are a party to operating leases. It is currently not our business
practice to have material relationships with unconsolidated entities or financial partnerships,
such as entities often referred to as structured finance or special purpose entities, which would
have been established for the purpose of facilitating off-balance sheet arrangements.
CRITICAL ACCOUNTING POLICIES AND ESTIMATES
The preparation of financial statements requires management to make estimates and judgments that
affect the reported amounts of assets, liabilities, revenues, and expenses, and related disclosure
of contingent assets and liabilities. On an ongoing basis, management evaluates its estimates,
including those related to allowances for markdowns, customer returns and adjustments, doubtful
accounts, inventory reserves, discontinued operations, and income taxes payable. Management basis
its estimates on historical information and experience and on various other assumptions that
management believes to be reasonable under the circumstances, the results of which form a basis for
making judgments about the carrying value of assets and liabilities that are not readily apparent
from other sources. Actual results may differ from these estimates because of conditions, which
differ from those assumed.
The following critical accounting policies relate to the more significant judgments and estimates
used in the preparation of the consolidated financial statements:
Income Taxes
We account for income taxes under the asset and liability method. We recognize deferred income
taxes, net of valuation allowances, for the estimated future tax effects of temporary differences
between the financial statement carrying amounts of existing assets and liabilities and their tax
basis and net operating loss carryforwards. Deferred tax assets and liabilities are measured using
enacted tax rates expected to apply to taxable income in the years in which those temporary
differences are expected to be recovered or settled. The effect on deferred tax assets and
liabilities of a change in tax rates is recognized in income in the period that includes the
enactment date. Changes in deferred tax assets and liabilities are recorded in the provision for
income taxes.
We evaluate the realizability of deferred tax assets on a regular basis for each taxable
jurisdiction. In making this assessment, we consider whether it is more likely than not that some
portion or all of deferred tax assets will not be realized. The ultimate realization of deferred
tax assets is dependent upon the generation of future taxable income during the periods in which
those temporary differences become deductible. We consider all available evidence, both positive
and negative, in making this assessment.
If we determine that we expect to realize deferred tax assets in excess of the recorded net
amounts, a reduction in the deferred tax asset valuation allowance would decrease income tax
expense in the period such determination is made. Alternatively, if we determine that we no longer
expect to realize a portion of our net deferred tax assets, an increase in the deferred tax asset
valuation allowance would increase income tax expense in the period such determination is made.
We assess our income tax positions and record tax benefits for all years subject to examination
based upon our evaluation of the facts, circumstances and information available at the reporting
date. For those tax positions where there is a greater than 50% likelihood that a tax benefit will
be sustained, we have recorded the largest amount of tax benefit that may potentially be realized
upon ultimate settlement with a taxing authority that has full knowledge of all relevant
information. For those income tax positions where there is less than 50% likelihood that a tax
benefit will be sustained, no tax benefit has been recognized in the financial statements.
23
Table of Contents
Intangible Assets
The Company’s goodwill, which represents the excess of purchase price over fair value of net assets
acquired, was tested for impairment at least on an annual basis. The impairment test involved a
comparison of the fair value of its reporting unit, with carrying amounts. If the reporting unit’s
aggregated carrying amount exceeds its fair value, then an indication exists that the reporting
unit’s goodwill may be impaired. The impairment to be recognized is measured by the amount by which
the carrying value of the reporting unit being measured exceeds its fair value, up to the total
amount of its assets. The Company determined fair value based on the income approach.
The Company performed its annual impairment test during the fourth quarter of each fiscal year and
when otherwise warranted. Management evaluated the carrying value of goodwill and determined that
the impairment to assets used in continuing operations as of December 31, 2008 was $8.2 million,
our entire goodwill balance. See Item 8. Financial Statements and Supplementary Data, Note 5 -
Goodwill and Intangible Assets to the audited consolidated financial statements.
Allowances for Customer Returns and Adjustments
We reserve for customer returns, trade discounts, advertising allowances, customer chargebacks, and
for sales and markdown allowances granted to customers at the end of selling seasons, which enable
customers to markdown the retail sales prices on closeout products. The estimates for these
allowances and discounts are based on a number of factors, including: (a) historical experience,
(b) industry trends, and (c) specific agreements or negotiated amounts with customers.
Further, while we believe that we have negotiated all substantial sales and markdown allowances
with our customers for the season recently completed, additional allowances for the spring season
are anticipated and have been provided for on goods shipped prior to year end and others may be
requested by customers for the concluded seasons. Likewise, should the performance of our products
at retail establishments exceed our historical performance levels and result in favorable
settlements of previously reserved amounts, we may reduce our recorded allowances.
Inventory Reserves
We analyze out-of-season merchandise to determine reserves, if any, that may be required to reduce
the carrying value to net realizable value. Additionally, we provide reserves for current season
merchandise whose carrying value is expected, based on historical experience, to exceed our net
realizable value. Factors considered in evaluating the requirement for reserves include product
styling, color, current fashion trends, and quantities on hand. Some of our products are “classics”
and remain saleable from one season to the next, and therefore, generally, no reserves are required
on these products. An estimate is made of the market value, less expense to dispose and a normal
profit margin, of products whose value is determined to be impaired. If these products are
ultimately sold at less than estimated amounts, additional losses will be recorded. Likewise, if
these products are sold for more than estimated amounts, additional profit will be realized.
Restructuring and Other Operating Lease Obligations
We recognize a liability for costs to terminate an operating lease obligation before the end of its
term if we no longer derive an economic benefit from the lease. The liability is recognized and
measured at its fair value when we determine that the cease use date has occurred and the fair
value of the liability is determined based on the remaining lease rentals due, reduced by estimated
sublease rental income that could be reasonably obtained for the property. The estimate of
subsequent sublease rental income may change and require future changes to the fair value of the
liabilities for the lease obligations.
Discontinued Operations
We have reclassified from continuing operations the results of operations and financial position of
the Marisa Christina, David Brooks, and Shane Hunter divisions separately as discontinued
operations.
24
Table of Contents
RECENT ACCOUNTING PRONOUNCEMENTS
In June 2009, the Financial Accounting Standards Board (“FASB”) issued Statement of Financial
Accounting Standard (“SFAS”) No. 168, “The FASB Accounting Standard Codificationtm (“Codification” or “ASC”) and the Hierarchy of Generally Accepted Accounting
Principles,” effective for interim and annual reporting periods ending after September 15, 2009.
This statement replaces SFAS No. 162, “The Hierarchy of Generally Accepted Accounting Principles”
and establishes the Codification as the source of authoritative U.S. accounting principles used in
the preparation of financial statements in conformity with GAAP. All guidance contained in the
Codification carries an equal level of authority. The Codification does not replace or affect
guidance issued by the SEC or its staff. The FASB will not issue new standards in the form of
Statements, FASB Staff Positions or Emerging Issues Task Force Abstracts. Instead, it will issue
Accounting Standards Updates (“ASUs”). The FASB will not consider ASUs as authoritative in their
own right; rather, ASUs will serve only to update the Codification, provide background information
about the guidance and provide the bases for conclusions on the change(s) in the Codification. This
statement became effective in the third quarter of 2009, and references made to FASB guidance
throughout this document have been updated for the Codification.
In September 2006, the FASB issued FAS No. 157 (codified as ASC 820), “Fair Value Measurements”
(“FAS No. 157”), which defines fair value, establishes a framework for measuring fair value in
accordance with GAAP and expands disclosures about fair value measurements. The following
amendments to FAS No. 157 were effective in 2009:
Financial Accounting Staff Bulletin Staff Position (“FSP”) 157-2 (“FSP FAS 157-2”) delayed the
effective date of FAS 157 until fiscal years beginning after November 15, 2008, and interim
periods within those fiscal years, for all nonfinancial assets and nonfinancial liabilities,
except for items that are recognized or disclosed at fair value in the financial statements on a
recurring basis (at least annually). We adopted the standard for all nonfinancial assets and
nonfinancial liabilities effective January 1, 2009, which had no material impact on our
consolidated financial statements.
In April 2009, the FASB issued FSP FAS 157-4, “Determining Fair Value When the Volume and Level
of Activity for the Asset or Liability Have Significantly Decreased and Identifying Transactions
That Are Not Orderly.” This FSP (codified as ASC Topic 820-10-65-4) provided additional guidance
for estimating fair value in accordance with FAS No. 157 when the volume and level of activity
for the asset or liability have significantly decreased. This FSP also included guidance on
identifying circumstances that indicate a transaction is not orderly. FSP FAS 157-4 was
effective for interim and annual reporting periods ending after June 15, 2009 and is applied
prospectively. We adopted the standard in the quarter ended June 27, 2009, which had no material
impact on our consolidated financial statements.
In August 2009, the FASB issued Accounting Standards Update No. 2009-05, “Measuring Liabilities
at Fair Value” (“ASU 2009-05”). ASU 2009-05 amends the Fair Value Measurements and Disclosures
Topic of the FASB ASC by providing additional guidance clarifying the measurement of liabilities
at fair value. ASU 2009-05 is effective for the Company for the reporting period ending December
31, 2009. We adopted the standard in the quarter ended December 31, 2009, which had no material
impact on our consolidated financial statements.
See Item 8. Financial Statements and Supplementary Data, Note 1 — Organization and Summary of
Significant Accounting Policies, and Note 11- Fair Value Measurements to our consolidated financial
statements.
In April 2009, the FASB issued Financial Accounting Staff Bulletin Staff Position FAS 107-1 and
Accounting Principle Bulletin 28-1, “Interim Disclosures about Fair Value of Financial
Instruments.” This guidance is now incorporated into ASC 825, “Financial Instruments.” This
guidance requires disclosures about fair values of financial instruments for interim reporting
periods of publicly traded companies as well as in annual financial statements. It also requires
those disclosures in summarized financial information at interim reporting periods. The guidance
became effective for interim and annual reporting periods ending after June 15, 2009. We adopted
ASC 825 for the period ended June 30, 2009, and the impact of the adoption was not significant. See
Item 8. Financial Statements and Supplementary Data, Note 1 — Organization and Summary of
Significant Accounting Policies, and Note 11- Fair Value Measurements to our consolidated financial
statements.
In May 2009, the FASB issued SFAS No. 165, “Subsequent Events,” which is now incorporated into ASC
855, “Subsequent Events.” ASC 855 establishes general standards of accounting for and disclosure of
events that occur after the balance sheet date but before the financial statements are issued or
are available to be issued. ASC 855 was amended in February 2010 and requires SEC filers to
evaluate subsequent events through the date financial statements are filed. ASC 855 became
effective for us for the period ended June 30, 2009 and was to be applied prospectively. The impact
of adoption was not significant.
25
Table of Contents
Item 7A. Quantitative and Qualitative Disclosures About Market Risk.
Market risk represents the risk of loss that may affect the financial position, results of
operations or cash flows of the Company due to adverse changes in financial and product market
prices and rates. We are exposed to market risk in the area of changing interest rates. We are also
exposed to market risk due to increased costs of our products.
Our short-term debt has variable rates based on, at our option, the prime interest rate of the
lending institution, or the Eurodollar Rate. The impact of a hypothetical 100 basis point increase
in interest rates on our variable rate debt (borrowings under the revolving Credit Facility) would
have been minimal in 2009 and 2008 due to the negligible short-term borrowings.
In purchasing apparel in international markets, we initiate production orders that require the
payment of dollars. Prices are fixed in U.S. dollars at the time the Company submits and order to a
vendor; therefore, we do not have any reason to engage in derivative financial instruments to
mitigate these market risks.
26
Table of Contents
Item 8. Financial Statements and Supplementary Data.
(a) Audited Financial Statements
REPORT OF INDEPENDENT REGISTERED PUBLIC ACCOUNTING FIRM
Board of Directors and Stockholders
Hampshire Group, Limited
New York, New York
Hampshire Group, Limited
New York, New York
We have audited the accompanying consolidated balance sheet of Hampshire Group, Limited and
Subsidiaries (the “Company”) as of December 31, 2009 and the related consolidated statements of
operations, stockholders’ equity, and cash flows for the year then ended. In connection with our
audit of the financial statements, we have also audited the financial statement schedule listed in
the accompanying index. These financial statements and schedule are the responsibility of the
Company’s management. Our responsibility is to express an opinion on these financial statements and
schedule based on our audit.
We conducted our audit in accordance with the standards of the Public Company Accounting Oversight
Board (United States). Those standards require that we plan and perform the audit to obtain
reasonable assurance about whether the financial statements are free of material misstatement. The
Company is not required to have, nor were we engaged to perform, an audit of its internal control
over financial reporting. Our audit included consideration of internal control over financial
reporting as a basis for designing audit procedures that are appropriate in the circumstances, but
not for the purpose of expressing an opinion on the effectiveness of the Company’s internal control
over financial reporting. Accordingly, we express no such opinion. An audit also includes
examining, on a test basis, evidence supporting the amounts and disclosures in the financial
statements, assessing the accounting principles used and significant estimates made by management,
as well as evaluating the overall presentation of the financial statements and schedule. We believe
that our audit provides a reasonable basis for our opinion.
In our opinion, the consolidated financial statements referred to above present fairly, in all
material respects, the financial position of Hampshire Group, Limited and Subsidiaries at December
31, 2009, and the results of their operations and their cash flows for the year then ended, in
conformity with accounting principles generally accepted in the United States of America.
Also, in our opinion, the financial statement schedule, when considered in relation to the basic
consolidated financial statements taken as a whole, present fairly, in all material respects, the
information set forth therein.
| /s/ BDO SEIDMAN, LLP | ||||
| BDO Seidman, LLP | ||||
Charlotte, North Carolina
March 22, 2010
March 22, 2010
27
Table of Contents
REPORT OF INDEPENDENT REGISTERED PUBLIC ACCOUNTING FIRM
To the Board of Directors and Stockholders of
Hampshire Group, Limited
Anderson, South Carolina
Hampshire Group, Limited
Anderson, South Carolina
We have audited the accompanying consolidated balance sheet of Hampshire Group, Limited and
subsidiaries (the “Company”) as of December 31, 2008, and the related consolidated statements of
operations, stockholders’ equity, and cash flows for each of the two years in the period ended
December 31, 2008. These financial statements are the responsibility of the Company’s management.
Our responsibility is to express an opinion on the financial statements based on our audits.
We conducted our audits in accordance with the standards of the Public Company Accounting Oversight
Board (United States). Those standards require that we plan and perform the audit to obtain
reasonable assurance about whether the financial statements are free of material misstatement. The
Company is not required to have, nor were we engaged to perform, an audit of its internal control
over financial reporting. Our audits included consideration of internal control over financial
reporting as a basis for designing audit procedures that are appropriate in the circumstances, but
not for the purpose of expressing an opinion on the effectiveness of the Company’s internal control
over financial reporting. Accordingly, we express no such opinion. An audit also includes
examining, on a test basis, evidence supporting the amounts and disclosures in the financial
statements, assessing the accounting principles used and significant estimates made by management,
as well as evaluating the overall financial statement presentation. We believe that our audits
provide a reasonable basis for our opinion.
In our opinion, such consolidated financial statements present fairly, in all material respects,
the financial position of Hampshire Group, Limited and subsidiaries as of December 31, 2008, and
the results of their operations and their cash flows for each of the two years in the period ended
December 31, 2008, in conformity with accounting principles generally accepted in the United States
of America.
As discussed in Note 9 to the
consolidated financial statements, beginning January 1, 2007, the Company
changed its method for measuring and recognizing tax benefits
associated with uncertain tax positions.
The accompanying consolidated financial statements have been prepared assuming that the Company
will continue as a going concern. As discussed in Note 7 to the consolidated financial statements,
during the quarter ended December 31, 2008, the Company was not in compliance with a covenant in
its Credit Facility which raises uncertainty regarding the Company’s ability to fulfill its
financial commitments as they become due during 2009. These conditions raise substantial doubt
about its ability to continue as a going concern. Management’s plans concerning these matters are
also discussed in Note 7 to the consolidated financial statements. The consolidated financial
statements do not include any adjustments that might result from the outcome of this uncertainty.
As discussed in Note 17 to the consolidated financial statements, on February 24, 2009, the Company
announced that it reached a definitive agreement to be acquired by NAF Acquisition Corp., a direct
wholly owned subsidiary of NAF Holdings II, LLC.
/s/ Deloitte & Touche LLP |
Charlotte, North Carolina
April 2, 2009
April 2, 2009
28
Table of Contents
Hampshire Group, Limited and Subsidiaries
Consolidated Balance Sheets
December 31, 2009 and 2008
| (In thousands, except par value and shares) | 2009 | 2008 | ||||||
Current assets: |
||||||||
Cash and cash equivalents |
$ | 33,365 | $ | 35,098 | ||||
Accounts receivable, net |
21,708 | 27,881 | ||||||
Other receivables |
7,663 | 4,007 | ||||||
Inventories, net |
8,137 | 10,911 | ||||||
Other current assets |
1,606 | 2,672 | ||||||
Assets of discontinued operations |
152 | 246 | ||||||
Total current assets |
72,631 | 80,815 | ||||||
Fixed assets, net |
11,283 | 13,207 | ||||||
Other assets |
3,015 | 4,684 | ||||||
Total assets |
$ | 86,929 | $ | 98,706 | ||||
Current liabilities: |
||||||||
Current portion of long-term debt |
$ | 39 | $ | 30 | ||||
Accounts payable |
7,256 | 7,759 | ||||||
Accrued expenses and other liabilities |
5,557 | 11,137 | ||||||
Liabilities of discontinued operations |
572 | 503 | ||||||
Total current liabilities |
13,424 | 19,429 | ||||||
Long-term debt less current portion |
79 | 3 | ||||||
Noncurrent income tax liabilities |
6,389 | 6,339 | ||||||
Deferred rent |
7,081 | 6,610 | ||||||
Other long-term liabilities |
1,107 | 1,528 | ||||||
Total liabilities |
28,080 | 33,909 | ||||||
Commitments and contingencies (Note 10) |
||||||||
Stockholders’ equity: |
||||||||
Preferred stock, $0.10 par value, 1,000,000 shares
authorized; none issued |
— | — | ||||||
Series A junior participating preferred stock,
$0.10 par value, 10,000 shares authorized at
December 31, 2009 and December 31, 2008,
respectively; none issued |
— | — | ||||||
Common stock, $0.10 par value, 10,000,000 shares
authorized; 8,243,784 shares issued at December 31,
2009 and 2008 |
824 | 824 | ||||||
Additional paid-in capital |
29,948 | 36,079 | ||||||
Retained earnings |
42,246 | 48,292 | ||||||
Treasury stock, 1,927,119 and 2,774,619 shares at
cost at December 31, 2009 and 2008, respectively |
(14,169 | ) | (20,398 | ) | ||||
Total stockholders’ equity |
58,849 | 64,797 | ||||||
Total liabilities and stockholders’ equity |
$ | 86,929 | $ | 98,706 | ||||
See accompanying notes to consolidated financial statements.
29
Table of Contents
Hampshire Group, Limited and Subsidiaries
Consolidated Statements of Operations
Years Ended December 31, 2009, 2008, and 2007
| (In thousands, except per share data) | 2009 | 2008 | 2007 | |||||||||
Net sales |
$ | 165,178 | $ | 240,901 | $ | 257,046 | ||||||
Cost of goods sold |
125,777 | 188,700 | 192,998 | |||||||||
Gross profit |
39,401 | 52,201 | 64,048 | |||||||||
Selling, general, and administrative expenses |
39,715 | 57,632 | 57,985 | |||||||||
Restructuring charges |
4,820 | 580 | — | |||||||||
Goodwill impairment loss |
— | 8,162 | — | |||||||||
Special costs |
4,547 | 2,995 | 5,291 | |||||||||
Tender offer related costs |
2,053 | 386 | — | |||||||||
Income (loss) from operations |
(11,734 | ) | (17,554 | ) | 772 | |||||||
Other income (expense): |
||||||||||||
Interest income |
176 | 1,141 | 1,698 | |||||||||
Interest expense |
(323 | ) | (195 | ) | (386 | ) | ||||||
Other, net |
(376 | ) | 1,622 | (10 | ) | |||||||
Income (loss) from continuing operations before income taxes |
(12,257 | ) | (14,986 | ) | 2,074 | |||||||
Income tax provision (benefit) |
(6,251 | ) | 9,906 | (687 | ) | |||||||
Income (loss) from continuing operations |
(6,006 | ) | (24,892 | ) | 2,761 | |||||||
Loss from discontinued operations, net of taxes |
(40 | ) | (5,005 | ) | (2,765 | ) | ||||||
Net loss |
$ | (6,046 | ) | $ | (29,897 | ) | $ | (4 | ) | |||
Basic earnings (loss) per share: |
||||||||||||
Income (loss) from continuing operations |
$ | (1.10 | ) | $ | (3.61 | ) | $ | 0.35 | ||||
Loss from discontinued operations, net of taxes |
(0.01 | ) | (0.73 | ) | (0.35 | ) | ||||||
Net loss |
$ | (1.11 | ) | $ | (4.34 | ) | $ | — | ||||
Diluted earnings (loss) per share: |
||||||||||||
Income (loss) from continuing operations |
$ | (1.10 | ) | $ | (3.61 | ) | $ | 0.35 | ||||
Loss from discontinued operations, net of taxes |
(0.01 | ) | (0.73 | ) | (0.35 | ) | ||||||
Net loss |
$ | (1.11 | ) | $ | (4.34 | ) | $ | — | ||||
Weighted average number of shares outstanding: |
||||||||||||
Basic weighted average number of common shares outstanding |
5,482 | 6,884 | 7,860 | |||||||||
Diluted weighted average number of common shares outstanding |
5,482 | 6,884 | 7,860 | |||||||||
See accompanying notes to consolidated financial statements.
30
Table of Contents
Hampshire Group, Limited and Subsidiaries
Consolidated Statements of Stockholders’ Equity
Years Ended December 31, 2009, 2008, and 2007
| Additional | Total | |||||||||||||||||||||||||||
| Common Stock | Paid-in | Retained | Treasury Stock | Stockholders’ | ||||||||||||||||||||||||
| (In thousands, except shares) | Shares | Amount | Capital | Earnings | Shares | Amount | Equity | |||||||||||||||||||||
Balance at December 31, 2006 |
8,243,784 | $ | 824 | $ | 35,747 | $ | 79,452 | 384,279 | $ | (8,446 | ) | $ | 107,577 | |||||||||||||||
Cumulative effect of change in accounting
principle (See Note 9) |
— | — | — | (1,259 | ) | — | — | (1,259 | ) | |||||||||||||||||||
Net loss |
— | — | — | (4 | ) | — | — | (4 | ) | |||||||||||||||||||
Tax benefits from share-based payment arrangements |
— | — | 230 | — | — | — | 230 | |||||||||||||||||||||
Deferred compensation payable in Company shares |
— | — | — | — | 58,100 | 261 | 261 | |||||||||||||||||||||
Shares held in trust for deferred compensation liability |
— | — | — | — | (58,100 | ) | (261 | ) | (261 | ) | ||||||||||||||||||
Balance at December 31, 2007 |
8,243,784 | 824 | 35,977 | 78,189 | 384,279 | (8,446 | ) | 106,544 | ||||||||||||||||||||
Net loss |
— | — | — | (29,897 | ) | — | — | (29,897 | ) | |||||||||||||||||||
Tax benefits from share-based payment arrangements |
— | — | 102 | — | — | — | 102 | |||||||||||||||||||||
Purchase of treasury stock |
— | — | — | — | 2,390,340 | (11,952 | ) | (11,952 | ) | |||||||||||||||||||
Balance at December 31, 2008 |
8,243,784 | 824 | 36,079 | 48,292 | 2,774,619 | (20,398 | ) | 64,797 | ||||||||||||||||||||
Net loss |
— | — | — | (6,046 | ) | — | — | (6,046 | ) | |||||||||||||||||||
Restricted stock grants |
— | — | (6,229 | ) | — | (847,500 | ) | 6,229 | — | |||||||||||||||||||
Stock based compensation — restricted stock |
— | — | 98 | — | — | — | 98 | |||||||||||||||||||||
Balance at December 31, 2009 |
8,243,784 | $ | 824 | $ | 29,948 | $ | 42,246 | 1,927,119 | $ | (14,169 | ) | $ | 58,849 | |||||||||||||||
See accompanying notes to consolidated financial statements.
31
Table of Contents
Hampshire Group, Limited and Subsidiaries
Consolidated Statements of Cash Flows
Years Ended December 31, 2009, 2008, and 2007
Years Ended December 31, 2009, 2008, and 2007
| (In thousands) | 2009 | 2008 | 2007 | |||||||||
Cash flows from operating activities: |
||||||||||||
Net loss |
$ | (6,046 | ) | $ | (29,897 | ) | $ | (4 | ) | |||
Less: Loss from discontinued operations, net of taxes |
40 | 5,005 | 2,765 | |||||||||
Loss from continuing operations |
(6,006 | ) | (24,892 | ) | 2,761 | |||||||
Adjustments to reconcile loss from continuing operations to net cash
provided by (used in) operating activities: |
||||||||||||
Depreciation and amortization |
2,549 | 1,902 | 783 | |||||||||
Loss on goodwill impairment |
— | 8,162 | — | |||||||||
Reversal of supplier dispute accrual |
(5,081 | ) | — | — | ||||||||
Non-cash restructuring charges |
1,210 | — | — | |||||||||
Non-cash equity compensation |
98 | — | — | |||||||||
Loss (gain) on sale of fixed assets |
331 | 203 | (55 | ) | ||||||||
Deferred income tax provision (benefit) |
— | 12,357 | (1,150 | ) | ||||||||
Deferred compensation expense, net |
— | 92 | 776 | |||||||||
Tax benefit from employee stock plans and other |
— | — | (6 | ) | ||||||||
Excess tax benefits from share-based payment arrangements |
— | (102 | ) | (230 | ) | |||||||
Changes in operating assets and liabilities: |
||||||||||||
Receivables, net |
2,517 | 1,411 | (7,714 | ) | ||||||||
Inventories, net |
2,774 | 6,551 | (1,077 | ) | ||||||||
Other assets |
2,263 | 32 | (4,395 | ) | ||||||||
Liabilities |
(1,104 | ) | (6,852 | ) | (5,010 | ) | ||||||
Net cash provided by (used in) continuing operating activities |
(449 | ) | (1,136 | ) | (15,317 | ) | ||||||
Net cash provided by (used in) discontinued operations |
(145 | ) | 6,782 | (8,159 | ) | |||||||
Net cash provided by (used in) operating activities |
(594 | ) | 5,646 | (23,476 | ) | |||||||
Cash flows from investing activities: |
||||||||||||
Capital expenditures |
(359 | ) | (10,291 | ) | (3,895 | ) | ||||||
Proceeds from sales of fixed assets |
27 | — | 128 | |||||||||
Net cash provided by (used in) continuing investing activities |
(332 | ) | (10,291 | ) | (3,767 | ) | ||||||
Net cash provided by (used in) discontinued operations |
— | 3,724 | 5,339 | |||||||||
Net cash provided by (used in) investing activities |
(332 | ) | (6,567 | ) | 1,572 | |||||||
Cash flows from financing activities: |
||||||||||||
Increase in cash restricted for the collateralization of letters of credit |
(13,523 | ) | — | — | ||||||||
Decrease in cash restricted for the collateralization of letters of credit |
13,523 | — | — | |||||||||
Proceeds from line of credit |
14,645 | 44,875 | 39,805 | |||||||||
Repayment of line of credit |
(14,645 | ) | (44,875 | ) | (39,805 | ) | ||||||
Purchase of treasury stock, net |
— | (11,952 | ) | — | ||||||||
Repayment of long-term debt and financing fees on credit facility |
(30 | ) | (41 | ) | (105 | ) | ||||||
Excess tax benefits from share-based payment arrangements |
— | 102 | 230 | |||||||||
Capitalized credit facility costs |
(777 | ) | (521 | ) | — | |||||||
Net cash provided by (used in) continuing financing activities |
(807 | ) | (12,412 | ) | 125 | |||||||
Net cash provided by (used in) discontinued operations |
— | — | — | |||||||||
Net cash provided by (used in) financing activities |
(807 | ) | (12,412 | ) | 125 | |||||||
Net increase (decrease) in cash and cash equivalents |
(1,733 | ) | (13,333 | ) | (21,779 | ) | ||||||
Cash and cash equivalents at beginning of year |
35,098 | 48,431 | 70,210 | |||||||||
Cash and cash equivalents at end of year |
$ | 33,365 | $ | 35,098 | $ | 48,431 | ||||||
Supplemental disclosures of cash flow information: |
||||||||||||
Cash paid during the year for income taxes |
$ | 554 | $ | 70 | $ | 1,979 | ||||||
Cash paid during the year for interest |
294 | 185 | 388 | |||||||||
Equipment acquired under capital lease |
115 | — | 85 | |||||||||
Settlement of deferred compensation liabilities with trading securities |
— | — | 3,040 | |||||||||
Liabilities for construction in progress |
— | — | 3,165 | |||||||||
See accompanying notes to consolidated financial statements.
32
Table of Contents
Note 1 — Organization and Summary of Significant Accounting Policies
Organization
Hampshire Group, Limited (“Hampshire Group” or the “Company”), through its wholly owned
subsidiaries Hampshire Designers, Inc. (“Hampshire Designers”), Item-Eyes, Inc. (“Item-Eyes”), and
Keynote Services, Limited (“Keynote Services”), engages in the apparel business and operates as one
segment as its subsidiaries have similar economic characteristics. The Company’s corporate offices,
sales, and showrooms are in New York, NY with back office functions in Anderson, SC. Hampshire
Designers and Item-Eyes, source the manufacture of their products worldwide from manufacturers and
their products are sold primarily in the United States to various national and regional department
stores and mass merchant retailers. Keynote Services, a subsidiary of Hampshire Designers based in
China, assists with the sourcing and quality control needs of Hampshire Designers and Item-Eyes.
Summary of Significant Accounting Policies
The preparation of financial statements in accordance with generally accepted accounting principles
in the United States of America (“GAAP”) requires management to make estimates and judgments that
affect the reported amounts of assets, liabilities, revenues, and expenses and related disclosure
of contingent assets and liabilities. On an ongoing basis management evaluates its estimates,
including those related to allowances for markdowns, customer returns and adjustments, doubtful
accounts, inventory reserves, discontinued operations, and income taxes. The Company’s revenues are
highly seasonal, causing significant fluctuations in financial results for interim periods. The
Company sells apparel throughout the year but approximately 70% of its annual sales historically
occur in the third and fourth quarters, primarily due to the large concentration of sweaters in the
product mix and seasonality of the apparel industry in general. Management bases its estimates on
historical experience and on various other assumptions that management believes to be reasonable
under the circumstances, the results of which form a basis for making judgments about the carrying
value of assets and liabilities that are not readily apparent from other sources. Actual results
may differ from these estimates under different assumptions or conditions; however, management
believes that its estimates, including those for the above described items, are reasonable and that
the actual results will not vary significantly from the estimated amounts.
Income Taxes
The Company accounts for income taxes under the asset and liability method. The Company recognizes
deferred income taxes, net of valuation allowances, for the estimated future tax effects of
temporary differences between the financial statement carrying amounts of existing assets and
liabilities and their tax basis and net operating loss carryforwards. Deferred tax assets and
liabilities are measured using enacted tax rates expected to apply to taxable income in the years
in which those temporary differences are expected to be recovered or settled. The effect on
deferred tax assets and liabilities of a change in tax rates is recognized in income in the period
that includes the enactment date.
Management evaluates the realizability of deferred tax assets on a regular basis for each taxable
jurisdiction. In making this assessment, management considers whether it is more likely than not
that some portion or all of deferred tax assets will not be realized. The ultimate realization of
deferred tax assets is dependent upon the generation of future taxable income during the periods in
which those temporary differences become deductible. Management considers all available evidence,
both positive and negative, in making this assessment.
If the Company determines that it expects to realize deferred tax assets in excess of the recorded
net amounts, a reduction in the deferred tax asset valuation allowance would decrease income tax
expense in the period such determination is made. Alternatively, if the Company determines that it
no longer expects to realize a portion of its net deferred tax assets, an increase in the deferred
tax asset valuation allowance would increase income tax expense in the period such determination is
made.
The Company assesses its income tax positions and records tax benefits for all years subject to
examination based upon its evaluation of the facts, circumstances and information available at the
reporting date. For those tax positions where there is a greater than 50% likelihood that a tax
benefit will be sustained, the Company has recorded the largest amount of tax benefit that may
potentially be realized upon ultimate settlement with a taxing authority that has full knowledge of
all relevant information. For those income tax positions where there is less than 50% likelihood
that a tax benefit will be sustained, no tax benefit has been recognized in the financial
statements. See Note 9 — Income Taxes.
33
Table of Contents
Allowances for Customer Returns and Adjustments
The Company reserves for customer returns, trade discounts, advertising allowances, customer
chargebacks, and for sales and markdown allowances granted to customers at the end of the selling
seasons, which enable customers to markdown the retail sales prices on closeout products. The
estimates for these allowances and discounts are based on a number of factors, including: (a)
historical experience, (b) industry trends, and (c) specific agreements or negotiated amounts with
customers.
Further, while the Company believes that it has negotiated all substantial sales and markdown
allowances with its customers for the season recently completed, additional allowances for the
spring season are anticipated and have been provided for goods shipped prior to year end and others
may be requested by customers for the concluded seasons. Likewise, should the performance of the
Company’s products at retail establishments exceed its historical performance levels and result in
favorable settlements of previously reserved amounts, recorded allowances may be reduced.
Inventory Reserves
The Company analyzes out-of-season merchandise on an individual stock keeping unit or SKU basis, to
determine reserves, if any, that may be required to reduce the carrying value to net realizable
value. Additionally, the Company provides reserves for current season merchandise whose carrying
value is expected, based on historical experience, to exceed its net realizable value. Factors
considered in evaluating the requirement for reserves include product styling, color, current
fashion trends and quantities on hand. Some of the Company’s products are “classics” and remain
saleable from one season to the next and therefore no reserves are generally required on these
products. An estimate is made of the market value, less expense to dispose and a normal profit
margin, of products whose value is determined to be impaired. If these products are ultimately sold
at less than estimated amounts, additional reserves may be required. Likewise, if these products
are sold for more than estimated amounts, reserves may be reduced.
Restructuring and Other Operating Lease Obligations
The Company recognizes a liability for costs to terminate an operating lease obligation before the
end of its term and no longer derives economic benefit from the lease. The liability is recognized
and measured at its fair value when the Company determines that the cease use date has occurred and
the fair value of the liability is determined based on the remaining lease rentals due, reduced by
estimated sublease rental income that could be reasonably obtained for the property. The estimate
of subsequent sublease rental income may change and require future changes to the fair value of the
liabilities for the lease obligations.
Intangible Assets
The Company’s goodwill, which represents the excess of purchase price over fair value of net assets
acquired, was tested for impairment at least on an annual basis. The impairment test involved a
comparison of the fair value of its reporting unit with carrying amounts. If the reporting unit’s
aggregated carrying amount exceeds its fair value, then an indication exists that the reporting
unit’s goodwill may be impaired. The impairment to be recognized is measured by the amount by which
the carrying value of the reporting unit being measured exceeds its fair value, up to the total
amount of its assets. The Company determined fair value based on the income approach.
The Company performed its annual impairment test during the fourth quarter of each fiscal year and
when otherwise warranted.
The Company also evaluates impairment of other intangible assets when events or changes in
circumstances indicate the recovery of the carrying amount should be addressed. Management has
evaluated the carrying value of intangible assets and has determined that the impairment to assets
used in continuing operations as of December 31, 2008 was $8.2 million, related to the impairment
of the entire goodwill balance. See Note 5 — Goodwill and Intangible Assets.
Principles of Consolidation
The consolidated financial statements include the accounts of the Company and its wholly owned
subsidiaries. The foreign currency translation gains or losses related to the Company’s foreign
subsidiary from its functional currency into U.S. dollars are not significant to the consolidated
financial statements. All significant intercompany accounts and transactions have been eliminated
in consolidation.
34
Table of Contents
Financial Instruments
The Company’s financial instruments primarily consist of cash and cash equivalents, short-term
investments, accounts receivable, accounts payable, and long-term debt. The fair value of long-term
debt is disclosed in Note 7 — Borrowings. The carrying amounts of the other financial instruments
are considered a reasonable estimate of their fair value at December 31, 2009 and 2008, due to the
short-term nature of the items. See Note 11 — Fair Value Measurements.
Concentrations of Credit Risk
Financial instruments which potentially expose the Company to concentrations of credit risk consist
primarily of trade accounts receivable.
Cash Equivalents
Cash equivalents consist of highly liquid investments with initial maturities of ninety days or
less from the date of purchase. At December 31, 2009 and 2008, interest bearing amounts were
approximately $31.2 million and $35.1 million, respectively. A significant amount of the Company’s
cash and cash equivalents are on deposit in financial institutions and exceed the maximum insurable
deposit limits. See Note 11 — Fair Value Measurements.
Inventories
Inventories are stated at the lower of cost or market. Cost is determined using the first-in,
first-out method for all inventories.
Fixed Assets
Fixed assets are recorded at cost. The Company provides for depreciation using the straight-line
method over the estimated useful lives of the assets. Additions and major replacements or
improvements are capitalized, while minor replacements and maintenance costs are charged to expense
as incurred. The cost and accumulated depreciation of assets sold or retired are removed from the
accounts and any gain or loss is included in the results of operations for the period of the
transaction.
Impairment of Long-Lived Assets
The Company evaluates the carrying value of its long-lived assets based on criteria set forth in
GAAP, and records impairment losses on such assets when indicators of impairment are present and
the undiscounted cash flows estimated to be generated by those assets are less than the assets’
carrying amount.
Other Assets
On December 3, 2007, the Company purchased an insurance policy that insures a person who was a
director or an officer of the Company for purposes of the Company’s 2005/2006 directors’ and
officers’ insurance policy (“Special D&O Insurance) against a suit brought either by any director
or officer of the Company who was terminated during 2006 or by the Company directly. The policy
provides coverage of $7.5 million, has a term of six years, and cost $4.1 million including taxes
and fees. This payment was treated as a prepaid expense and included in other current and long term
assets as the payment covers a six year policy period. The Company recognized expense related to
this policy in the amount of $0.7 million, $0.7 million, and $0.1 million in 2009, 2008, and 2007,
respectively, and anticipates recognizing $0.7 million in expense in each year from 2010 through
2012 and $0.6 million in 2013, which is the end of policy term. See Special Costs and Note 10 —
Commitments and Contingencies.
Revenue Recognition
The Company recognizes sales revenue upon shipment of goods to customers, net of discounts, and the
Company’s estimate of returns, allowances, and co-op advertising.
Advertising Costs
Advertising costs are expensed as incurred and are included in Selling, general, and administrative
expenses. Total advertising costs for the years ended December 31, 2009, 2008, and 2007 totaled
approximately $1.0 million, $1.9 million, and $2.1 million, respectively.
Shipping and Freight Costs
Costs to ship products to customers are expensed as incurred and are included in Selling, general,
and administrative expenses. Total shipping and freight costs for the years ended December 31,
2009, 2008, and 2007 totaled approximately $1.1 million, $2.0 million, and $1.8 million,
respectively.
35
Table of Contents
Special Costs
In 2006, the Audit Committee (the “Audit Committee”) of the Board of Directors (“Board”) commenced
an investigation related to, among other things, the misuse and misappropriation of assets for
personal benefit, certain related party transactions, tax reporting, internal control deficiencies,
financial reporting, and accounting for expense reimbursements, in each case involving certain
members of the Company’s former management (“Audit Committee Investigation”).
The Company reports certain costs as Special Costs including, but not limited to, the costs
associated with the Audit Committee Investigation, the assessment and remediation of certain tax
exposures, the restatement of the financial statements which resulted from the findings of the
Audit Committee Investigation, investigations by the Securities and Exchange Commission (“SEC”) and
the United States Attorney’s Office, a stockholder derivative suit, Nasdaq Global Market listing
related costs, the Special D&O Insurance expense, legal and other expenses related to the now
settled arbitration and litigation with Ludwig Kuttner, the Company’s former Chief Executive
Officer, former Chairman, and former Director of the Company, legal matters involving former
employees Charles Clayton and Roger Clark, and related matters. See Note 10 — Commitments and
Contingencies.
During the years ended December 31, 2009, 2008, and 2007, the Company incurred $4.5 million, $3.0
million, and $5.3 million in Special Costs, respectively. Special Costs incurred since inception of
the Audit Committee Investigation were approximately $19.0 million through December 31, 2009. The
Company expects to incur additional costs in connection with the lawsuit involving Messrs. Clayton
and Clark and related matters. The Company cannot predict the total cost but believes that future
costs could be material.
Earnings (Loss) Per Common Share
Basic earnings (loss) per common share are computed by dividing net income (loss) by the
weighted-average number of shares outstanding for the year. Diluted earnings per common share are
computed similarly; however, it is adjusted for the effects of the assumed exercise of the
Company’s outstanding restricted stock grants. The weighted-average number of shares outstanding
and the weighted-average number of diluted shares outstanding are calculated in accordance with
GAAP.
Stock Based Compensation
Stock-based compensation cost is measured at the grant date based on the fair value of the award
and is recognized as expense ratably over the requisite service period, net of estimated
forfeitures. The Company awards market-based restricted stock to employees, managers, named
executive officers, and directors.
The Company recorded expense related to stock based compensation of $0.1 million during the year
ended December 31, 2009. There was no stock based compensation expense in the years ended December
31, 2008 and 2007. The Company’s stock-based employee compensation plans are described more fully
in Note 12 — Stock Awards, Compensation Plans, and Retirement Savings Plan.
Treasury Stock
The Company accounts for treasury shares using the cost method. Purchases of shares of common stock
are recorded at cost and result in a reduction of stockholders’ equity. The Company holds
repurchased shares in treasury for general corporate purposes, including issuances under various
employee compensation plans. When treasury shares are reissued, the Company uses a weighted average
cost method. Purchase costs in excess of reissue price are treated as a reduction of retained
earnings. Reissue price in excess of purchase costs is treated as additional paid-in capital.
Discontinued Operations
In accordance with GAAP, the accompanying consolidated financial statements reflect the results of
operations and financial position of the Marisa Christina, David Brooks, and Shane Hunter divisions
separately as discontinued operations.
36
Table of Contents
Recent Accounting Standards
In June 2009, the Financial Accounting Standards Board (“FASB”)
issued Statement of Financial
Accounting Standard (“SFAS”) No. 168, “The FASB
Accounting Standard
CodificationTM (“Codification” or “ASC”) and the Hierarchy of Generally Accepted Accounting
Principles,” effective for interim and annual reporting periods ending after September 15, 2009.
This statement replaces SFAS No. 162, “The Hierarchy of Generally Accepted Accounting Principles”
and establishes the Codification (“ASC”) as the source of authoritative U.S. accounting principles
used in the preparation of financial statements in conformity with GAAP. All guidance contained in
the Codification carries an equal level of authority. The Codification does not replace or affect
guidance issued by the SEC or its staff. The FASB will not issue new standards in the form of
Statements, FASB Staff Positions or Emerging Issues Task Force Abstracts. Instead, it will issue
Accounting Standards Updates (“ASUs”). The FASB will not consider ASUs as authoritative in their
own right; rather, ASUs will serve only to update the Codification, provide background information
about the guidance and provide the bases for conclusions on the change(s) in the Codification. This
statement became effective in the third quarter of 2009, and references made to FASB guidance
throughout this document have been updated for the Codification.
In September 2006, the FASB issued FAS No. 157 (codified as ASC 820), “Fair Value Measurements”
(“FAS No. 157”), which defines fair value, establishes a framework for measuring fair value in
accordance with GAAP and expands disclosures about fair value measurements. The following
amendments to FAS No. 157 were effective in 2009:
Financial Accounting Staff Bulletin Staff Position (“FSP”) 157-2 (“FSP FAS 157-2”) delayed the
effective date of FAS 157 until fiscal years beginning after November 15, 2008, and interim
periods within those fiscal years, for all nonfinancial assets and nonfinancial liabilities,
except for items that are recognized or disclosed at fair value in the financial statements on a
recurring basis (at least annually). The Company adopted the standard for all nonfinancial
assets and nonfinancial liabilities effective January 1, 2009, which had no material impact on
the consolidated financial statements.
In April 2009, the FASB issued FSP FAS 157-4, “Determining Fair Value When the Volume and Level
of Activity for the Asset or Liability Have Significantly Decreased and Identifying Transactions
That Are Not Orderly.” This FSP (codified as ASC Topic 820-10-65-4) provided additional guidance
for estimating fair value in accordance with FAS No. 157 when the volume and level of activity
for the asset or liability have significantly decreased. This FSP also included guidance on
identifying circumstances that indicate a transaction is not orderly. FSP FAS 157-4 was
effective for interim and annual reporting periods ending after June 15, 2009 and is applied
prospectively. The Company adopted the standard in the quarter ended June 27, 2009, which had no
material impact on the consolidated financial statements.
In August 2009, the FASB issued Accounting Standards Update No. 2009-05, “Measuring Liabilities
at Fair Value” (“ASU 2009-05”). ASU 2009-05 amends the Fair Value Measurements and Disclosures
Topic of the FASB ASC by providing additional guidance clarifying the measurement of liabilities
at fair value. ASU 2009-05 is effective for the Company for the reporting period ending December
31, 2009. The Company adopted the standard in the quarter ended December 31, 2009, which had no
material impact on the consolidated financial statements.
See Item 8. Financial Statements and Supplementary Data, Note 1 — Organization and Summary of
Significant Accounting Policies, and Note 11- Fair Value Measurements to our consolidated financial
statements.
In April 2009, the FASB issued Financial Accounting Staff Bulletin Staff Position FAS 107-1 and
Accounting Principle Bulletin 28-1, “Interim Disclosures about Fair Value of Financial
Instruments.” This guidance is now incorporated into ASC 825, “Financial Instruments.” This
guidance requires disclosures about fair values of financial instruments for interim reporting
periods of publicly traded companies as well as in annual financial statements. It also requires
those disclosures in summarized financial information at interim reporting periods. The guidance
became effective for interim and annual reporting periods ending after June 15, 2009. The Company
adopted ASC 825 for the period ended June 30, 2009, and the impact of the adoption was not
significant; see Note 11 to the consolidated financial statements.
In May 2009, the FASB issued SFAS No. 165, “Subsequent Events,” which is now incorporated into ASC
855, “Subsequent Events.” ASC 855 establishes general standards of accounting for and disclosure of
events that occur after the balance sheet date but before the financial statements are issued or
are available to be issued. ASC 855 was amended in February 2010 and requires SEC filers to
evaluate subsequent events through the date financial statements are issued. ASC 855 became
effective for the Company for the period ended June 30, 2009 and was to be applied prospectively.
The impact of adoption was not significant.
37
Table of Contents
Note 2 — Receivables and Major Customers
The Company performs ongoing evaluations of the credit worthiness of its customers and maintains
allowances for potential doubtful accounts. The accounts receivable at December 31, 2009 and 2008
are stated net of allowances for doubtful accounts, customer returns, co-op advertising, customer
charge backs, and for sales and markdown allowances of approximately $21.8 million and $23.1
million, respectively.
The Company sells principally to department stores, catalog companies, specialty stores, mass
merchants, and other retailers located principally in the United States. The Company’s sales to its
three largest customers for the year ended December 31, 2009 represented 27%, 16%, and 11% of total
sales. For the year ended December 31, 2008, these three major customers represented 20%, 15%, and
12% of total sales. For the year ended December 31, 2007, these three customers represented 20%,
16%, and 12% of total sales. At December 31, 2009 and 2008, 72% and 63%, respectively, of the total
gross trade receivables were due from these major customers.
The major components of other receivables at December 31, 2009 and 2008 were as follows:
| (In thousands) | 2009 | 2008 | ||||||
Income tax refunds receivable |
$ | 6,650 | $ | 2,650 | ||||
Current duty refunds receivable and related interest |
724 | 854 | ||||||
Other |
289 | 503 | ||||||
Other receivables |
$ | 7,663 | $ | 4,007 | ||||
In addition, the Company had non-current duty refunds receivable and related interest of $0.6
million that was classified in Other assets at December 31, 2008.
Note 3 — Inventories
Inventories at December 31, 2009 and 2008 consisted of the following:
| (In thousands) | 2009 | 2008 | ||||||
Finished goods |
$ | 8,340 | $ | 13,118 | ||||
Raw materials and supplies |
37 | 54 | ||||||
Total cost |
8,377 | 13,172 | ||||||
Less: reserves |
(240 | ) | (2,261 | ) | ||||
Inventories, net |
$ | 8,137 | $ | 10,911 | ||||
38
Table of Contents
Note 4 — Fixed Assets
Fixed assets at December 31, 2009 and 2008 consisted of the following:
| (In thousands) | Estimated Useful Lives | 2009 | 2008 | |||||||
Leasehold improvements |
5 – 15 years | $ | 7,429 | $ | 7,461 | |||||
Machinery and equipment |
3 – 7 years | 3,833 | 5,492 | |||||||
Furniture and fixtures |
3 – 7 years | 3,995 | 4,205 | |||||||
Software |
3 years | 1,339 | 1,064 | |||||||
Vehicles |
3 years | — | 10 | |||||||
Construction in progress |
— | 20 | 182 | |||||||
Total cost |
16,616 | 18,414 | ||||||||
Less: accumulated depreciation |
(5,333 | ) | (5,207 | ) | ||||||
Fixed assets, net |
$ | 11,283 | $ | 13,207 | ||||||
The Company entered into a 15 year, one month lease of approximately 77,000 square feet of office
space in New York, NY on July 11, 2007. The Company’s capital expenditures related to the space was
approximately $12.6 million. The net cash outlays related to these capital expenditures was
approximately $8.3 million, as the lease provided for $4.3 million in landlord allowance
reimbursements that were received in 2008. These incentives are recorded as a reduction of rent
expense over the life of the lease. The Company has occupied the office space since February 2008.
See Note 10 — Commitments and Contingencies.
Depreciation expense for the years ended December 31, 2009, 2008, and 2007 was approximately $2.0
million, $1.8 million, and $0.8 million, respectively.
Note 5 — Goodwill and Other Intangible Assets
GAAP specifies criteria that intangible assets acquired in a purchase method business combination
must meet in order to be recognized and reported apart from goodwill and that goodwill and
intangible assets with indefinite useful lives no longer be amortized, but instead be tested for
impairment.
The Company’s goodwill is tested for impairment at least on an annual basis and otherwise when
warranted. The impairment test involves a comparison of the fair value of its reporting unit as
defined to carrying amounts. If the reporting unit’s aggregated carrying amount exceeds its fair
value, then an indication exists that the reporting unit’s goodwill may be impaired. The impairment
to be recognized is measured by the amount by which the carrying value of the reporting unit being
measured exceeds its fair value, up to the total amount of its assets.
Based upon tests performed during the fourth quarter of 2008, the Company recorded an impairment
charge of $8.2 million in connection with the goodwill primarily related to Item-Eyes. The 2008
impairment charge reflected economic conditions, adverse equity market conditions which have caused
a material decline in industry market multiples, and lower estimated future cash flows of Item-Eyes
as a result of the decline in retail activity during 2008.
The following tables highlight the Company’s intangible assets included in Other assets:
| December 31, 2009 | December 31, 2008 | |||||||||||||||
| Gross | Gross | |||||||||||||||
| Carrying | Accumulated | Carrying | Accumulated | |||||||||||||
| (In thousands) | Amount | Amortization | Amount | Amortization | ||||||||||||
Amortized Intangibles: |
||||||||||||||||
Capitalized credit facility Fees |
$ | 1,085 | $ | 357 | $ | 554 | $ | 93 | ||||||||
| (In thousands) | 2009 | 2008 | 2007 | |||||||||
Amortization Expense |
$ | 510 | $ | 93 | $ | — | ||||||
The credit facility expires in June 2011. Amortization expense for each fiscal year ending December
31, 2010 and 2011 is expected to be approximately $0.5 million and $0.2 million, respectively. See
Note 7 — Borrowings.
39
Table of Contents
Note 6 — Accrued Expenses and Other Liabilities
Accrued expenses and other liabilities at December 31, 2009 and 2008 consisted of the following:
| (In thousands) | 2009 | 2008 | ||||||
Reserve for supplier disputes |
$ | — | $ | 5,081 | ||||
Compensation, benefits, and related taxes |
1,162 | 2,100 | ||||||
Accrued rent |
901 | — | ||||||
Income tax reserves |
638 | 1,065 | ||||||
Loss on sublease |
565 | 66 | ||||||
Royalties |
325 | 695 | ||||||
Other |
1,966 | 2,130 | ||||||
Accrued expenses and other liabilities |
$ | 5,557 | $ | 11,137 | ||||
In addition, the Company has a non-current loss on sublease of $0.8 million and $0.2 million that
is classified in Other long-term liabilities at December 31, 2009 and 2008, respectively. See Note
16 — Restructuring and Cost Reduction Plans.
Prior to 2003, the Company was advised that certain of its suppliers would not be able to deliver
finished product as agreed. In connection with this situation, the Company established a reserve in
the amount of $7.5 million during 2002 for costs of past inventory purchases which had not yet been
paid to the supplier and other matters arising from these events and has accordingly adjusted the
reserve for ongoing activity. The reserve balance was $5.1 million at December 31, 2008 for such
unresolved matters. In the fourth quarter of 2009, the Company determined that the $5.1 million
liability was no longer probable for, among other things, the lapse of regulatory and contractual
statutes of limitations regarding potential claims by interested parties and reversed the reserve
against cost of sales.
Note 7 — Borrowings
Long-Term Debt
Long-term debt, which is collateralized by equipment, at December 31, 2009 and 2008 consisted of
the following:
| (In thousands) | 2009 | 2008 | ||||||
Note payable in monthly installments of $3 including interest at 5.66% |
$ | 3 | $ | 33 | ||||
Note payable in monthly installments of $4 including interest at 6.15% |
115 | — | ||||||
Total long-term debt |
118 | 33 | ||||||
Less: amount payable within one year |
(39 | ) | (30 | ) | ||||
Amount payable after one year |
$ | 79 | $ | 3 | ||||
The fair value of the long-term debt at December 31, 2009 and 2008, based on current market
interest rates discounted to present value, was approximately equal to the recorded amount.
Revolving Credit Facility
On February 15, 2008, the Company amended and restated its 2003 Revolving Credit Facility by
entering into an Amended and Restated Credit Agreement and Guaranty (the “Credit Facility”) with
HSBC Bank USA, National Association (“HSBC”), other financial institutions named therein as bank
parties (together with HSBC, the “Banks”), and HSBC, as Letter of Credit Issuing Bank and as Agent
for the Banks. The Credit Facility provided up to $125.0 million for revolving credit loans and
trade letters of credit with a $10.0 million sub-limit for standby letters of credit and was to
expire on April 30, 2013. The Company’s Credit Facility included certain financial and other
covenants, including a covenant that the Company maintain a fixed charge ratio of consolidated
earnings before interest, taxes, depreciation, and amortization of not less than 1.25 to 1.0 of
certain fixed charges on the last day of each fiscal quarter on a rolling four quarter basis.
40
Table of Contents
Based on the Company’s results for 2008, the Company determined on March 13, 2009 that it was not
in compliance with the Credit Facility’s consolidated fixed charge ratio covenant. As a result of
this non-compliance, the Banks were entitled to terminate the Credit Facility and demand immediate
repayment. The Company was not permitted to borrow under the Credit Facility and the issuance of
letters of credit for the Company’s account was restricted. Thus, it was uncertain as to whether
the Company’s cash balance and cash flows from operations would adequately meet the Company’s
obligations and, in turn, cause substantial liquidity problems and prevent the Company from
operating its business. On August 7, 2009, the Company and the Banks amended and restated the
Credit Facility (the “Amended Facility”) and the Company is now in compliance with the covenants of
the Amended Facility.
The Amended Facility with the Banks reduced and converted the facility to a $48.0 million
asset based revolving credit facility including trade letters of credit with a $10.0 million
sub-limit for standby letters of credit. The Amended Facility is scheduled to expire on June 30,
2011 and is secured by substantially all assets of the Company. Aggregate borrowing availability
under the Amended Facility is limited to the lesser of $48.0 million or a formula which considers
cash, accounts receivable and inventory. Interest rates under the Amended Facility vary with the
prime rate or LIBOR. The Amended Facility includes certain covenants, which include minimum
earnings before interest, taxes, depreciation and amortization (excluding certain charges), maximum
capital expenditures, minimum availability, minimum liquidity, letters of credit tied to booked
orders, and limitations on when direct debt is permitted. Cash collateral and other requirements of
the letter agreements executed after March 13, 2009 were fully rescinded and replaced by terms and
conditions of the Amended Facility. The Amended Facility has other customary provisions for
periodic reporting, monitoring, and fees. The Company’s 2009 borrowings, which covered a period of
approximately one month in the fourth quarter of 2009, were at an effective interest rate of 6.25%.
At December 31, 2009, there were no outstanding borrowings and approximately $4.6 million
outstanding under letters of credit. Borrowing availability was approximately $43.4 million at
December 31, 2009.
Note 8 — Stockholder Rights Plan
On August 13, 2008, the Board adopted a Stockholder Rights Plan (the “Rights Plan”) in which
preferred share purchase rights (a “Right”) were distributed as a dividend at the rate of one Right
for each outstanding share of common stock as of the close of business on August 25, 2008. There
were 5,469,165 outstanding shares of common stock on August 25, 2008, and the Rights extend to
shares issued after this date. The Rights are intended to enable all of the Company’s stockholders
to realize the long-term value of their investment in the Company. The Rights will not prevent a
takeover, but should encourage anyone seeking to acquire the Company to negotiate with the Board
prior to attempting a takeover. The Rights will expire on August 23, 2013.
Each Right will entitle stockholders, in certain circumstances, to buy one one-thousandth of a
newly issued share of Series A Junior Participating Preferred Stock of the Company at an exercise
price of $33.00. The Rights will be exercisable and transferable apart from the common stock only
if a person or group acquires beneficial ownership of 15% or more of the common stock (such person
or group, an “Acquiring Person”) (except, subject to certain limitations, for stockholders who,
together with their affiliates and associates, in excess of 15% of the common stock) as of August
13, 2008 or commences a tender or exchange offer upon consummation of which a person or group would
own 15% or more of the outstanding common stock.
If any person becomes an Acquiring Person other than pursuant to an offer for all shares which is
determined by the Board to be fair to and otherwise in the best interests of the Company and its
stockholders, then each Right not owned by an Acquiring Person or certain related parties will
entitle its holder to purchase, at the Right’s then-current exercise price, shares of common stock
(or, in certain circumstances as determined by the Board, cash, other property or other securities)
having a value of twice the Right’s exercise price. In addition, if, after any person has become an
Acquiring Person, the Company is involved in a merger or other business combination transaction
with another person in which its common stock is changed or converted, or sells 50% or more of its
assets or earning power to another person, each Right will entitle its holder to purchase, at the
Right’s then-current exercise price, shares of common stock of such other person having a value of
twice the Right’s exercise price.
The Company will generally be entitled to redeem the Rights at $0.01 per Right at any time until a
person or group has become an Acquiring Person.
41
Table of Contents
Note 9 — Income Taxes
The income tax provision (benefit) related to continuing operations consisted of the following:
| (In thousands) | 2009 | 2008 | 2007 | |||||||||
Current: |
||||||||||||
Federal |
$ | (6,539 | ) | $ | (1,817 | ) | $ | (147 | ) | |||
Foreign |
40 | 191 | 37 | |||||||||
State and local |
248 | (825 | ) | 573 | ||||||||
Total current |
(6,251 | ) | (2,451 | ) | 463 | |||||||
Deferred: |
||||||||||||
Federal |
— | 10,253 | (826 | ) | ||||||||
State and local |
— | 2,104 | (324 | ) | ||||||||
Total deferred |
— | 12,357 | (1,150 | ) | ||||||||
Total tax provision (benefit) |
$ | (6,251 | ) | $ | 9,906 | $ | (687 | ) | ||||
Deferred income taxes reflect the tax effects of temporary differences between the carrying amounts
of assets and liabilities for financial reporting purposes and the amounts used for income tax
purposes.
Significant components of the Company’s deferred tax assets and liabilities as of December 31, 2009
and 2008 are as follows:
| (In thousands) | 2009 | 2008 | ||||||
Deferred tax assets: |
||||||||
Basis in intangible assets |
$ | 805 | $ | 924 | ||||
Basis in fixed assets |
345 | 330 | ||||||
Accounts receivable reserves |
2,938 | 3,570 | ||||||
Inventory reserves |
456 | 1,424 | ||||||
Unrecognized tax benefits |
2,404 | 2,636 | ||||||
All other accrued expenses |
4,821 | 5,985 | ||||||
Deferred compensation |
23 | 396 | ||||||
Net operating loss carryforwards |
6,823 | 5,162 | ||||||
Charitable contribution and
capital loss carryforwards |
232 | 168 | ||||||
Total deferred tax assets |
18,847 | 20,595 | ||||||
Less: valuation allowances |
(18,847 | ) | (20,595 | ) | ||||
Net deferred tax assets |
$ | — | $ | — | ||||
GAAP requires companies to assess whether valuation allowances should be established against its
deferred tax assets based on consideration of all available evidence using a “more likely than not”
standard. In making such assessments, significant weight is to be given to evidence that can be
objectively verified. A company’s current and/or previous losses are given more weight than its
future projections. A recent three-year historical cumulative loss is considered a significant
factor that is difficult to overcome.
In 2008, the Company evaluated its deferred tax assets each reporting period, including assessment
of its cumulative loss over the prior three-year period, to determine if valuation allowances were
required. A significant negative factor that was difficult to overcome was the Company’s three-year
historical cumulative loss as of December 31, 2008. This, combined with uncertain near-term
economic conditions, reduced the Company’s ability to rely on its projections of future taxable
income in establishing its deferred tax assets valuation allowance. GAAP guidelines require that a
full valuation allowance be established on all of the Company’s net deferred tax assets due to
events and developments that occurred during the fourth quarter of 2008. Accordingly, the Company
increased its deferred tax asset valuation allowance by $18.9 million through a charge to tax
expense in the fourth quarter of 2008.
42
Table of Contents
The increase in the valuation allowance did not have an impact on the Company’s cash position, nor
did such an increase preclude the Company from using loss carryforwards or carrybacks, tax credits
or other deferred tax assets in the future. Further, the increase in the valuation allowance was
not the result of a significant change in the Company’s view of its long-term financial outlook.
During 2009, the Company was unable to produce enough positive evidence to overcome the
preponderance of negative evidence. Thus, as of December 31, 2009, the Company maintained a
valuation allowance equivalent to the total net deferred tax assets.
The following table reconciles income tax provision (benefit) from continuing operations computed
at the U.S. federal statutory tax rates to income tax provision (benefit):
| (In thousands except percentages) | 2009 | 2008 | 2007 | |||||||||
Federal income tax rate |
34 | % | 34 | % | 35 | % | ||||||
Rate applied to pre-tax income |
$ | (4,181 | ) | $ | (5,090 | ) | $ | 738 | ||||
State taxes, net of federal tax benefit |
(750 | ) | (793 | ) | 162 | |||||||
Changes in uncertain tax positions |
184 | (368 | ) | (1,093 | ) | |||||||
Changes in valuation allowances |
(1,748 | ) | 15,894 | (695 | ) | |||||||
Permanent differences, net |
(4 | ) | (224 | ) | 56 | |||||||
Other, net |
248 | 487 | 145 | |||||||||
Income tax provision (benefit) |
$ | (6,251 | ) | $ | 9,906 | $ | (687 | ) | ||||
The Company adopted the provisions of “Accounting for Uncertain Income Tax Positions” in the ASC on
January 1, 2007, which requires the Company to determine whether the benefits of tax positions are
more likely than not to be sustained upon audit based on the technical merits of the tax position.
For tax positions that are more likely than not to be sustained upon audit, the Company recognizes
the largest amount of the benefit that is more likely than not to be realized upon settlement with
the taxing authority. For tax positions that are not more likely than not to be sustained upon
audit, the Company does not recognize any portion of the benefit in the financial statements. The
Company recognizes interest and penalties associated with uncertain tax positions as a component of
taxes on income in the consolidated statements of operations. The Company recorded a charge of $1.3
million to 2007 opening retained earnings, which was required upon adoption.
The Company’s liability for unrecognized tax benefits is $7.0 million and $7.4 million as of
December 31, 2009 and 2008, respectively. The Company’s
liability for unrecognized tax benefits as of December 31, 2009 and 2008 includes accrued interest
of $2.3 million and $2.3 million, respectively, and penalties of $0.3 million and $0.4 million,
respectively. If the Company were to recognize these benefits, the effective rate would reflect a
favorable net impact of $3.0 million and $3.1 million, excluding interest and penalties, in 2009
and 2008, respectively. The Company recognized net tax expense of $0.2 million for interest during
2009 and a net benefit for interest of $0.1 million during 2008. The Company recognized net tax
expense for penalties of $0.0 million and $0.1 million during 2009 and 2008, respectively.
During 2010, the Company anticipates that total unrecognized tax benefits will decrease by
approximately $3.0 million, including interest of approximately $1.1 million and penalties of
approximately $0.1 million, due primarily to the settlement of certain state liabilities associated
with the 2004 and 2005 Internal Revenue Service examinations and the lapsing of statutes of
limitations related to certain compensation and benefit tax positions within 12 months of December
31, 2009.
43
Table of Contents
A reconciliation of the beginning and ending balances of the total amounts of gross unrecognized
tax benefits is as follows:
| (In thousands) | 2009 | 2008 | 2007 | |||||||||
Gross unrecognized tax benefits at January 1 |
$ | 4,773 | $ | 5,932 | $ | 8,707 | ||||||
Increases in tax positions for prior years |
915 | 332 | 23 | |||||||||
Decreases in tax positions for prior years |
— | (164 | ) | (324 | ) | |||||||
Increases in tax positions for current year |
143 | 100 | 747 | |||||||||
Settlements |
(305 | ) | (112 | ) | (949 | ) | ||||||
Lapse in statute of limitations |
(1,016 | ) | (1,315 | ) | (2,272 | ) | ||||||
Gross unrecognized tax benefits at
December 31 |
$ | 4,510 | $ | 4,773 | $ | 5,932 | ||||||
The Company plans to elect to carry back its 2009 federal net operating loss to tax year 2005. As a
result, the Company recognized an income tax benefit of $6.6 million in the fourth quarter of 2009.
Thus, the statute of limitations with respect to the Company’s federal income tax returns were
re-opened for tax years 2005 and beyond, which resulted in the recognition of $0.9 million in
associated tax expense during the fourth quarter of 2009. With limited exceptions, the statute of
limitations for state income tax returns remains open for the tax year 2002 and beyond. The Company
also files income tax returns in Hong Kong for which tax years 2006 and beyond remain open to
examination by the Hong Kong Inland Revenue Department.
At December 31, 2009, the Company has net operating loss carryforwards for U.S. federal income tax
purposes of $10.4 million, which expire in varying amounts from 2019 to 2029. Approximately $3.9
million of these federal net operating loss carryforwards were obtained in the acquisition of
Marisa Christina in May 2006; the remainder of the net operating loss carryforwards was established
during 2008 and 2009. The Company has state net operating loss carryforwards of $30.3 million at
December 31, 2009 expiring from 2021 to 2029. Approximately $0.7 million of these state net
operating loss carryforwards were obtained in the acquisition of Marisa Christina in May 2006; the
remainder of the state net operating loss carryforwards was established during 2006, 2007, 2008,
and 2009. Valuation allowances have been established for all of these federal and state net
operating loss carryforwards due to the uncertainty of their future usage.
Note 10 — Commitments and Contingencies
The Company leases premises and equipment under operating leases having terms from month-to-month
to fifteen years and six months. At December 31, 2009, future minimum lease payments under leases
having an initial or remaining non-cancelable term in excess of one year were as set forth in the
table below:
| Year | (In thousands) | |||
2010 |
$ | 5,074 | ||
2011 |
5,101 | |||
2012 |
5,188 | |||
2013 |
5,354 | |||
2014 |
4,632 | |||
Thereafter |
38,684 | |||
| $ | 64,033 | |||
Future rental revenue to be received under non-cancellable subleases having an initial or remaining
non-cancelable term in excess of one year were as set forth in the table below:
| Year | (In thousands) | |||
2010 |
$ | 651 | ||
2011 |
569 | |||
2012 |
541 | |||
2013 |
451 | |||
| $ | 2,212 | |||
44
Table of Contents
The Company entered into a 15 year, one month lease of approximately 77,000 square feet of office
space in New York, NY on July 11, 2007. The lease provides for minimum payments of $63.7 million
over the lease term. The Company’s possession of the space commenced in September 2007 and lease
payments began in March 2008. The lease includes guaranteed minimum consumer price index (“CPI”)
increases that commenced in 2009 and tiered rent escalations commencing in 2010. The lease and
associated incentives are being amortized on a straight-line basis over the expected lease term,
including any rent holidays, guaranteed minimum CPI increases, and tiered rent escalations.
For the years ended December 31, 2009, 2008, and 2007, rent expense for operating leases was
approximately $4.8 million, $5.7 million, and $3.9 million, respectively.
The Company has entered into licensing agreements with several companies for the use of certain
trademarks for the marketing of products produced by the Company. These contracts normally have a
term of three years and provide for minimum annual royalty payments. The future minimum royalty
payments as of December 31, 2009 are set forth in the table below:
| Year | (In thousands) | |||
2010 |
$ | 3,888 | ||
2011 |
3,631 | |||
2012 |
1,728 | |||
| $ | 9,247 | |||
For the years ended December 31, 2009, 2008, and 2007, royalty expenses for licensing were
approximately $3.9 million, $3.6 million, and $4.2 million, respectively.
The Company, in the normal course of business, issues binding purchase orders to secure product for
future sales to its customers. At December 31, 2009, these open purchase order commitments amounted
to approximately $45.2 million, of which approximately $0.7 million were covered by letters of
credit. The majority of the product is scheduled to be received during the first six months of
2010, at which time these commitments will be fulfilled. In addition, there were standby letters of
credit for approximately $3.9 million related to other matters.
Due to economic and market conditions, the Company decided to terminate the launch of a licensed
women’s label and negotiated a $0.4 million termination fee with the licensor, which is reflected
in Selling, general, and administrative expenses in the statement of operations for the year ended
December 31, 2008.
In 2006, the Audit Committee of the Board commenced the Audit Committee Investigation related to,
among other things, the misuse and misappropriation of assets for personal benefit, certain related
party transactions, tax reporting, internal control deficiencies, financial reporting, and
accounting for expense reimbursements, in each case involving certain members of the Company’s
former management.
On March 7, 2008, the Company filed a complaint in the Court of Chancery of the State of Delaware
for the County of New Castle (the “Court”) against Messrs. Ludwig Kuttner, Charles Clayton, and
Roger Clark, former members of management. On August 4, 2008, the Company entered into a Stock
Purchase and Settlement Agreement and Mutual Releases with Mr. Kuttner, his wife, Beatrice
Ost-Kuttner, his son, Fabian Kuttner, and a limited liability company controlled by him, K Holdings
LLC (together, the “Kuttner Parties”). Under the Agreement, the Company and the Kuttner Parties
exchanged releases of ongoing and potential claims, and the Kuttner Parties sold all of the stock
of the Company that they owned to the Company for approximately $12.0 million and Mr. Kuttner made
a $1.6 million payment to the Company.
On September 10, 2008 and September 19, 2008, Mr. Clayton and Mr. Clark, respectively, filed
answers with respect to the claims that the Company filed against them on March 7, 2008, as well as
counterclaims against the Company. Mr. Clayton and Mr. Clark denied the Company’s claims against
them and asserted claims against the Company for, among other things, certain compensation and
benefits, defamation and other damages.
45
Table of Contents
On September 22, 2008, Mr. Clayton filed a third-party complaint against certain of the Company’s
directors and officers. Mr. Clayton’s complaint asserted claims against those directors and
officers for, among other things, contribution in the event that Mr. Clayton is found liable to the
Company for damages in relation to the Company’s complaint against him, defamation and other
damages allegedly stemming from the Company’s issuance of certain press releases related to the
Audit Committee Investigation. In accordance with Delaware law, the Company’s bylaws and agreements
with the directors and officers, the Company will indemnify the directors and officers if they are
held liable to Mr. Clayton for damages and the Company will advance them legal fees incurred in
their defense.
On June 12, 2009, the Company and its directors and officers who are parties to the litigation
filed a motion for summary judgment. On September 2, 2009, the Court granted the motion in part and
dismissed Mr. Clayton’s claim for intentional infliction of emotional distress against the Company,
as well as his defamation claim against the Company’s directors and officers. The Court denied the
remainder of Hampshire’s motion and set the remainder of the parties’ claims for trial.
On December 21-24, 2009, the Court held a trial on the Company’s claims, Clayton’s and Clark’s
counterclaims, and Clayton’s third-party claims. On December 24, 2009, trial concluded and the
Court reserved decision. Pursuant to a scheduling order granted by the Court, the parties filed
their opening post-trial briefs on February 16, 2010 and filed their answering post-trial briefs on
March 12, 2010. A post-trial argument is scheduled for April 7, 2010.
The Company is from time to time involved in other litigation incidental to the conduct of its
business, none of which is expected to be material to its business, financial condition, or
operations.
Note 11 — Fair Value Measurements
GAAP defines fair value as the exchange price that would be received for an asset or paid to
transfer a liability (an exit price) in the principal or most advantageous market for the asset or
liability in an orderly transaction between market participants on the measurement date. GAAP also
established a fair value hierarchy which requires an entity to maximize the use of observable
inputs and minimize the use of unobservable inputs when measuring fair value. The standard
describes three levels of inputs that may be used to measure fair value:
Level 1 - Quoted prices in active markets for identical assets or liabilities.
Level 2 - Fair values utilize inputs other than quoted prices that are observable for the asset or
liability, and may include quoted prices for similar assets and liabilities in active markets, and
inputs other than quoted prices that are observable for the asset or liability.
Level 3 - Unobservable inputs that are supported by little or no market activity and that are
significant to the fair value of the assets or liabilities.
The following table presents information about the Company’s assets measured at fair value on a
recurring basis at December 31, 2009, and indicates the fair value hierarchy of the valuation
techniques utilized by the Company to determine such fair value:
| Fair Value Measurements at Reporting Date Using | ||||||||||||||||
| Quoted Prices | ||||||||||||||||
| in Active | Significant | |||||||||||||||
| Markets for | Other | Significant | ||||||||||||||
| Identical | Observable | Unobservable | ||||||||||||||
| (In thousands) | Assets | Inputs | Inputs | |||||||||||||
| Description | (Level 1) | (Level 2) | (Level 3) | December 31, 2009 | ||||||||||||
Assets: |
||||||||||||||||
Cash equivalents |
$ | 31,235 | $ | — | $ | — | $ | 31,235 | ||||||||
46
Table of Contents
Note 12 — Stock Plans, Compensation Plans, and Retirement Savings Plan
Equity and Cash Incentive Plans
On October 21, 2009, the Company adopted stock and cash incentive compensation plans, which will be
administered by the Board or a committee appointed by the Board.
The Hampshire Group, Limited 2009 Stock Incentive Plan (the “Stock Plan”) is designed to assist the
Company in attracting, retaining, motivating, and rewarding key employees, officers, directors, and
consultants, and promoting the creation of long-term value for stockholders of the Company by
closely aligning the interests of these individuals with those of the Company’s stockholders,
though the Company’s stockholder will experience dilution when such shares vest. The Stock Plan
permits the Company to award eligible persons nonqualified stock options, restricted stock, and
other stock-based awards. In connection with the adoption of the Stock Plan, the Board authorized
880,000 Stock Plan shares and approved grants of restricted stock under the Stock Plan totaling
862,500 shares, which consisted of grants to employees, managers, named executive officers, and
directors.
Ten percent of each award of restricted stock will be subject to time-based vesting (the
“Time-Vested Shares”), with 25% of the Time-Vested Shares vesting on March 31 of each of 2010,
2011, 2012, and 2013, subject to the respective grantee’s continued service through the applicable
vesting date. The remaining 90% of each award of restricted stock will be subject to
performance-based vesting (the “Performance-Vested Shares”), with 25% of the Performance-Vested
Shares vesting on March 31 of each of 2011, 2012, 2013, and 2014, provided that as of each such
vesting date the Company’s consolidated return on operating income for the preceding fiscal year as
a percent of average working capital (excluding discontinued operations) is equal to or greater
than 6%, with respect to the 2010 and 2011 fiscal years, and 8%, with respect to the 2012 and 2013
fiscal years. In the event the Company misses its target in a given year, the shares that would
otherwise have vested in that year will be rolled forward to the next year and will vest
simultaneously with the shares already allocated for that subsequent year should the Company exceed
that year’s target by an amount sufficient to cover the prior year’s or years’ cumulative
shortfall. This rollover mechanism will permit shares to be carried forward over multiple years
until the expiration of the Plan.
The following activity summarizes activity for non-vested restricted stock:
| December 31, 2009 | ||||||||
| Weighted Average | ||||||||
| Fair Value at Grant | ||||||||
| (In thousands) | Shares | Date | ||||||
Non-vested at beginning of period |
— | $ | — | |||||
Granted — restricted stock |
862,500 | 3.01 | ||||||
Forfeited |
(15,000 | ) | 3.00 | |||||
Vested |
— | — | ||||||
Non-vested at end of period |
847,500 | $ | 3.01 | |||||
In the year ended December 31, 2009, the Company recorded $0.1 million in compensation cost
related to the restricted stock grants and was reflected as non-cash equity compensation on the
Consolidated Statements of Cash Flows. At December 31, 2009, there was $1.3 million in unrecognized
compensation expense related to the restricted stock awards to be recognized over a period of
approximately four years.
In addition, the Company adopted The Hampshire Group, Limited 2010 Cash Incentive Bonus Plan (the
“Bonus Plan”) pursuant to which the Company will grant annual performance-based bonuses to certain
of its employees. The goal of the Bonus Plan is to align the annual interests of management and
other key employees with those of the Company and its stockholders by providing a cash bonus
incentive for meeting annual goals set by the Board. Target bonus amounts under the Bonus Plan will
be a percentage of each participant’s base salary, and actual bonus amounts paid under the Bonus
Plan will depend on the extent to which annual performance metrics are achieved.
Common Stock Purchase Plan
Pursuant to the Hampshire Group, Limited 1992 Common Stock Purchase Plan for Directors and
Executives (“Stock Purchase Plan”), key executives were permitted to use a portion of their annual
compensation to purchase common stock of the Company. Non-employee directors were permitted to
defer their fees to purchase common stock of the Company. The right to purchase shares under the
Stock Purchase Plan was terminated on December 31, 2002.
47
Table of Contents
The Company has established a trust to which it delivered the shares of the Company’s common stock
following the end of each plan year to satisfy such elections. The deferred compensation liability
and the Company’s shares are presented as offsetting amounts in the stockholders’ equity section.
Distributions from the plan commenced on January 15, 2003. 758,100 shares valued at approximately
$10.5 million have been distributed through December 31, 2008. All shares to be distributed to the
participants were distributed at December 31, 2008.
Deferred Compensation Plan
In accordance with the letter agreement dated October 8, 2007 with Michael Culang, the Company’s
Chief Executive Officer and President, the Company agreed to provide Mr. Culang a deferred bonus of
$0.5 million in December 2007. In addition, the agreement called for the Company to defer any
payments of his 2007 annual bonus that would cause his aggregate compensation to be in excess of
$1.0 million. As of December 31, 2007, the Company deferred $0.2 million of Mr. Culang’s 2007
performance bonus that would have been payable in December 2007. In addition, his remaining 2007
bonus of approximately $0.1 million which was to be paid during the first quarter of 2008, was
deferred. As required by his letter agreement, the Company established a Rabbi Trust for the
deferred compensation in 2008 and accrued interest on the balance at the rate of 5.32% per annum.
The balance in the Rabbi Trust was $0.9 million at December 31, 2008. The liability for deferred
compensation was included within other long term liabilities on the consolidated balance sheet.
The deferred compensation and applicable accrued interest was to be paid out upon termination of
his employment or change of control of the Company in a means that conforms with the requirements
of the Internal Revenue Code Section 409(A). Mr. Culang resigned as the President, Chief Executive
Officer, and a director of the Company in April 2009. The Company distributed the $0.9 million
Rabbi Trust to Mr. Culang in October 2009.
Long-Term Bonus Plan
On February 28, 2008, the Executive Committee of the Board adopted the Hampshire Group, Limited
Long-Term Bonus Plan (the “Long-Term Bonus Plan”). The purpose of the Long-Term Bonus Plan is to
promote the retention of certain key employees of the Company and its subsidiaries through the
grant of cash awards which vest and are paid over a three year period.
The Long-Term Bonus Plan provides that on February 28, 2008, and on January 1 each calendar year
thereafter, each participating employee will be granted a bonus award equal to a percentage,
determined by the Compensation Committee at the time of grant, of such employee’s annual target
bonus. Subject to a participant’s continued employment, a bonus award will vest as to 50% of such
award on March 15 of the second calendar year following the calendar year in which the date of
grant falls, and as to the remaining 50% of such award on March 15 of the third calendar year
following the calendar year in which the date of grant falls. In addition, vesting of a bonus award
will accelerate upon a change of control of the Company and upon a participant’s retirement, at a
time such participant is age 62 or greater and has completed five or more years of service with the
Company or its subsidiaries. Subject to applicable law, the portion of a bonus award that has
vested will be paid to a participant in a lump sum cash payment on the first regularly scheduled
payroll date following the vesting date applicable. The Company recognizes expense ratably over the
period in which long-term bonuses vest.
For the year ended December 31, 2008, the Company recorded approximately $0.3 million of expense
related to Long-Term Bonus Plan awards granted on February 28, 2008. During 2009, reversals related
to grants made to employees who were terminated from the Company offset the Long Term Bonus Plan
expense for 2009. Due to the separation from employment of several award recipients, only $0.4
million will potentially be paid out of the $1.3 million in Long-Term Bonus Plan awards granted on
February 28, 2008. The Compensation Committee terminated the Long-Term Bonus Plan on March 17, 2010.
Retirement Savings Plan
The Company and certain subsidiaries have 401(k) retirement savings plans under which employees may
participate after having completed certain service requirements and meeting certain age
requirements. The Company’s matching contribution is determined annually at the discretion of the
Board. Matching contributions for the years ended December 31, 2009, 2008, and 2007 were
approximately $0.1 million, $0.3 million, and $0.3 million, respectively. All Company matching
contributions vest fully after six years of employment. The Board temporarily suspended matching
contributions in May 2009.
48
Table of Contents
Note 13 — Related Party Transactions
Mr. Harvey Sperry, a Director of the Company, retired as a partner of the law firm of Willkie Farr
& Gallagher LLP in March of 2000. The firm has served as legal counsel for the Company since 1977.
In such capacity, for the years ended December 31, 2009, 2008, and 2007, this firm was paid
approximately $1.8 million, $2.1 million, and $2.4 million, respectively.
On August 30, 2005, the Company entered into a twelve-year, triple net, lease for 100% of the space
in a building located in Anderson, SC with another company in which Mr. Kuttner and Mr. Clayton are
the beneficial owners. Commencing February 1, 2006, the Company started utilizing the building as
its administrative offices. The Company occupies approximately 40% of the building, but under terms
of the lease it is required to pay for 100% of the space and may sublease any unused space. During
2006, the Company entered into a sublease for a portion of this unused space and took a charge of
approximately $47,000 due to the fact that the economic terms of the sublease were less favorable
than the lease. In 2007, the Company leased the remaining unused space at comparable terms to the
original lease. During 2009, the Company recorded a charge for approximately $0.2 million reflected
in Restructuring charges in the statement of operations for unused space it plans to sublease.
Lease payments made by the Company related to this facility were approximately $0.3 million, $0.4
million, and $0.3 million during the years ended December 31, 2009, 2008, and 2007, respectively.
Note 14 — Dispositions and Discontinued Operations
The Company continually reviews its portfolio of labels, business lines, and divisions to evaluate
whether they meet profitability and performance requirements and are in line with the Company’s
business focus. As a part of this review, the Company has disposed and discontinued operations of
certain divisions as outlined below.
In 2007, the Company sold certain assets of its Marisa Christina and David Brooks division and
ceased its domestic activities.
On April 15, 2008, the Company sold certain assets of its Shane Hunter division including
inventory, trademarks, and other assets to a buyer which included former members of Shane Hunter’s
management. The total purchase price was approximately $3.7 million. In addition, the buyer assumed
$0.1 million of liabilities of Shane Hunter. During the year ended December 31, 2008, the Company
recognized a pre-tax loss on the transaction of $3.5 million due to, among other things, the write
off of an intangible, severance, transaction related costs, and the acceleration of certain
facility lease expenses.
The Company retained the remaining assets of Shane Hunter including approximately $14.0 million
gross accounts receivable as of April 14, 2008 that were collected as of December 31, 2008. The
funds from the sale of assets and the liquidation of the remaining assets were used to provide
additional funds for operations and other general corporate purposes.
In accordance with the GAAP, the consolidated financial statements reflect the results of
operations and financial position of the Marisa Christina, David Brooks, and Shane Hunter divisions
separately as discontinued operations.
The assets and liabilities of the discontinued operations are presented in the consolidated balance
sheets under the captions Assets of discontinued operations and Liabilities of discontinued
operations. The underlying assets and liabilities of the discontinued operations are as follows:
| (In thousands) | December 31, 2009 | December 31, 2008 | ||||||
Other receivables |
$ | 152 | $ | 161 | ||||
Other current assets |
— | 6 | ||||||
Other assets |
— | 79 | ||||||
Assets of discontinued operations |
$ | 152 | $ | 246 | ||||
Accounts payable |
$ | — | $ | 263 | ||||
Accrued expenses and other liabilities |
572 | 240 | ||||||
Liabilities of discontinued
operations |
$ | 572 | $ | 503 | ||||
49
Table of Contents
The operating results for the discontinued operations for the years ended December 31, 2009,
2008, and 2007 were as follows:
| Year Ended | ||||||||||||
| (In thousands) | December 31, 2009 | December 31, 2008 | December 31, 2007 | |||||||||
Net sales |
$ | — | $ | 16,955 | $ | 65,462 | ||||||
Gross profit |
$ | — | $ | 4,567 | $ | 13,253 | ||||||
Loss on discontinued operations before income
taxes |
$ | (40 | ) | $ | (126 | ) | $ | (4,320 | ) | |||
Loss on sale of business |
— | (3,519 | ) | (672 | ) | |||||||
Provision (benefit) for income taxes |
— | 1,360 | (2,227 | ) | ||||||||
Loss from discontinued operations, net of taxes |
$ | (40 | ) | $ | (5,005 | ) | $ | (2,765 | ) | |||
Note 15 — Income (Loss) Per Share
Set forth in the table below is the reconciliation by year of the numerator (income from continuing
operations) and the denominator (shares) for the computation of basic and diluted earnings (loss)
per share (“EPS”):
| Numerator | Denominator | Per Share | ||||||||||
| (In thousands, except per share data) | Income (Loss) | Shares | Amount | |||||||||
2009: |
||||||||||||
Basic loss from continuing operations |
$ | (6,006 | ) | 5,482 | $ | (1.10 | ) | |||||
Effect of dilutive securities: |
||||||||||||
Preferred stock rights |
— | — | — | |||||||||
Restricted stock |
— | — | — | |||||||||
Diluted loss from continuing operations |
$ | (6,006 | ) | 5,482 | $ | (1.10 | ) | |||||
2008: |
||||||||||||
Basic loss from continuing operations |
$ | (24,892 | ) | 6,884 | $ | (3.61 | ) | |||||
Effect of dilutive securities: |
||||||||||||
Preferred stock rights |
— | — | — | |||||||||
Diluted loss from continuing operations |
$ | (24,892 | ) | 6,884 | $ | (3.61 | ) | |||||
2007: |
||||||||||||
Basic income from continuing operations |
$ | 2,761 | 7,860 | $ | 0.35 | |||||||
Effect of dilutive securities |
— | — | — | |||||||||
Diluted income from continuing
operations |
$ | 2,761 | 7,860 | $ | 0.35 | |||||||
For the year ended December 31, 2009, potentially dilutive shares of 847,500 were excluded
from the calculation of dilutive shares because their effect would have been anti-dilutive. There
were no potentially dilutive shares for the years ended December 31, 2008 and 2007.
50
Table of Contents
Note 16 — Restructuring and Cost Reduction Plans
In each of the two most recent fiscal years, the Company has initiated and implemented a
restructuring program.
In May 2008, the Company initiated a restructuring and cost reduction plan (the “2008
Restructuring”) that involved a reduction of its workforce and included the consolidation and
relocation of some of its operations, including the closing of its Hauppauge, NY office. In
addition to the reduction in workforce, the 2008 Restructuring eliminated certain non-payroll
expenses. Key objectives of the 2008 Restructuring included the consolidation of the Company’s
women’s divisions into one New York office and the consolidation of certain back office functions
into the Company’s South Carolina office. The total personnel reductions during 2008 related to the
2008 Restructuring consisted of approximately 41 employees, primarily located in the New York
metropolitan region and South Carolina.
In April 2009, the Company initiated a second restructuring and cost reduction plan (the “2009
Restructuring”) designed to significantly reduce its fixed cost structure, improve its return on
invested capital, increase its operating efficiency, and better position itself for the long term.
The components of the 2009 Restructuring included a net reduction of over 170 employees, or
approximately 50% of the Company’s global workforce, with approximately 110 of the positions
associated with its China operations, a temporary compensation reduction program applicable to
senior-level employees, a temporary suspension of the Company’s 401(k) matching contribution, the
reorganization of certain operating functions, and the consolidation of New York and Asian
operations. The reduction in the Company’s workforce was necessitated by reduced sales volume and
the outsourcing of certain functions, which resulted in the elimination of positions at every level
of the Company.
The following summarizes the charges recognized for the 2009 and 2008 Restructuring programs
through the periods ended December 31, 2009 and 2008:
| Year Ended | Year Ended | |||||||
| (In thousands) | December 31, 2008 | December 31, 2009 | ||||||
Personnel reductions |
$ | 517 | $ | 3,545 | ||||
Other costs |
63 | 1,275 | ||||||
Total |
$ | 580 | $ | 4,820 | ||||
A reconciliation of the beginning and ending liability balances for restructuring costs
included in the accrued expenses and other liabilities section of the consolidated balance sheet is
shown below:
| Twelve Months Ended | ||||||||||||||||||||||||
| December 31, 2008 | December 31, 2009 | |||||||||||||||||||||||
| Personnel | Other | Personnel | Other | |||||||||||||||||||||
| (In thousands) | Reductions | Costs | Total | Reductions | Costs | Total | ||||||||||||||||||
Beginning of period |
$ | — | $ | — | $ | — | $ | 72 | $ | — | $ | 72 | ||||||||||||
Costs charged to
expense |
517 | 63 | 580 | 3,545 | 1,440 | 4,985 | ||||||||||||||||||
Costs paid or settled |
(445 | ) | (63 | ) | (508 | ) | (3,585 | ) | (230 | ) | (3,815 | ) | ||||||||||||
End of period |
$ | 72 | $ | — | $ | 72 | $ | 32 | $ | 1,210 | $ | 1,242 | ||||||||||||
Personnel reductions and other costs, which consist primarily of exit costs related to leased
facilities and included the reversal of $0.2 million in deferred rent in 2009, were charged to
Restructuring charges in the consolidated statement of operations in the years ended December 31,
2009 and 2008.
51
Table of Contents
Note 17 — Tender Offer
The Company announced on February 24, 2009 that it had reached a definitive agreement (the “Merger
Agreement”) to be acquired by NAF Acquisition Corp., a direct wholly owned subsidiary of NAF
Holdings II, LLC (together with NAF Acquisition Corp., “NAF”). On April 26, 2009, the Company
received a letter from NAF stating that NAF was terminating the Merger Agreement effective
immediately, as a result of one or more alleged breaches of covenants and agreements on the part of
the Company.
On September 28, 2009, the Company entered into a settlement and mutual release agreement
(“Settlement”) with NAF, pursuant to which the Company and NAF settled and discharged all claims
related to and arising under the Merger Agreement and any ancillary agreements entered into in
connection with the negotiation and execution of the Merger Agreement. Under the terms of the
Settlement, the Company agreed to reimburse NAF for approximately $0.8 million of approximately
$2.1 million in transaction related expenses incurred by NAF in connection with the Merger
Agreement.
During the year ended December 31, 2009, the Company has incurred approximately $2.1 million in
costs related to the Merger Agreement which were recorded in “Tender offer related costs” in the
consolidated statement of operations. From the commencement of these activities in 2008, the
Company has incurred $2.4 million in such costs through December 31, 2009.
52
Table of Contents
(b) Unaudited Quarterly Financial Information
The tables herein set forth the Company’s unaudited condensed consolidated 2009 and 2008 quarterly
statements of operations.
The following tables set forth the Company’s unaudited condensed consolidated statement of
operations for the 2009 quarters ended:
| (In thousands, except per share data) | March 29, 2009 | June 27, 2009 | September 26, 2009 | December 31, 2009 | ||||||||||||
Net sales |
$ | 29,077 | $ | 20,968 | $ | 50,869 | $ | 64,264 | ||||||||
Gross profit |
6,172 | 5,039 | 11,054 | 17,136 | ||||||||||||
Selling, general, and administrative expenses |
10,945 | 8,747 | 9,725 | 10,298 | ||||||||||||
Restructuring charges |
— | 3,416 | 768 | 636 | ||||||||||||
Special costs |
1,924 | 1,072 | 588 | 963 | ||||||||||||
Tender offer related costs |
1,007 | 102 | 944 | — | ||||||||||||
Income (loss) from operations |
(7,704 | ) | (8,298 | ) | (971 | ) | 5,239 | |||||||||
Income (loss) from continuing operations before income
taxes |
(7,644 | ) | (8,321 | ) | (1,358 | ) | 5,066 | |||||||||
Provision (benefit) for income taxes |
96 | 110 | (785 | ) | (5,672 | ) | ||||||||||
Income (loss) before discontinued operations |
(7,740 | ) | (8,431 | ) | (573 | ) | 10,738 | |||||||||
Income (loss) from discontinued operations, net of taxes |
(25 | ) | (22 | ) | 1 | 6 | ||||||||||
Net income (loss) |
$ | (7,765 | ) | $ | (8,453 | ) | $ | (572 | ) | $ | 10,744 | |||||
Basic earnings per share: |
||||||||||||||||
Income (loss) from continuing operations |
$ | (1.42 | ) | $ | (1.54 | ) | $ | (0.10 | ) | $ | 1.95 | |||||
Loss from discontinued operations, net of taxes |
— | (0.01 | ) | — | — | |||||||||||
Net income (loss) |
$ | (1.42 | ) | $ | (1.55 | ) | $ | (0.10 | ) | $ | 1.95 | |||||
Diluted earnings per share: |
||||||||||||||||
Income (loss) from continuing operations |
$ | (1.42 | ) | $ | (1.54 | ) | $ | (0.10 | ) | $ | 1.81 | |||||
Loss from discontinued operations, net of taxes |
— | (0.01 | ) | — | — | |||||||||||
Net income (loss) |
$ | (1.42 | ) | $ | (1.55 | ) | $ | (0.10 | ) | $ | 1.81 | |||||
The following tables set forth the Company’s unaudited condensed consolidated statement of
operations for the 2008 quarters ended:
| (In thousands, except per share data) | March 29, 2008 | June 28, 2008 | September 27, 2008 | December 31, 2008 | ||||||||||||
Net sales |
$ | 39,763 | $ | 32,897 | $ | 80,962 | $ | 87,279 | ||||||||
Gross profit |
9,335 | 8,985 | 17,959 | 15,922 | ||||||||||||
Selling, general, and administrative expenses |
14,706 | 13,366 | 14,393 | 15,167 | ||||||||||||
Restructuring charges |
— | 441 | 96 | 43 | ||||||||||||
Goodwill impairment loss |
— | — | — | 8,162 | ||||||||||||
Special costs |
478 | 490 | 1,360 | 667 | ||||||||||||
Tender offer related costs |
— | — | 56 | 330 | ||||||||||||
Income (loss) from operations |
(5,849 | ) | (5,312 | ) | 2,054 | (8,447 | ) | |||||||||
Income (loss) from continuing operations before income
taxes |
(5,455 | ) | (5,023 | ) | 3,802 | (8,310 | ) | |||||||||
Provision (benefit) for income taxes |
(2,121 | ) | (1,902 | ) | 957 | 12,972 | ||||||||||
Income (loss) before discontinued operations |
(3,334 | ) | (3,121 | ) | 2,845 | (21,282 | ) | |||||||||
Income (loss) from discontinued operations, net of taxes |
(443 | ) | (1,898 | ) | (133 | ) | (2,531 | ) | ||||||||
Net income (loss) |
$ | (3,777 | ) | $ | (5,019 | ) | $ | 2,712 | $ | (23,813 | ) | |||||
Basic earnings per share: |
||||||||||||||||
Income (loss) from continuing operations |
$ | (0.42 | ) | $ | (0.40 | ) | $ | 0.44 | $ | (3.89 | ) | |||||
Loss from discontinued operations, net of taxes |
(0.06 | ) | (0.24 | ) | (0.02 | ) | (0.46 | ) | ||||||||
Net income (loss) |
$ | (0.48 | ) | $ | (0.64 | ) | $ | 0.42 | $ | (4.35 | ) | |||||
Diluted earnings per share: |
||||||||||||||||
Income (loss) from continuing operations |
$ | (0.42 | ) | $ | (0.40 | ) | $ | 0.44 | $ | (3.89 | ) | |||||
Loss from discontinued operations, net of taxes |
(0.06 | ) | (0.24 | ) | (0.02 | ) | (0.46 | ) | ||||||||
Net income (loss) |
$ | (0.48 | ) | $ | (0.64 | ) | $ | 0.42 | $ | (4.35 | ) | |||||
53
Table of Contents
Item 9. Changes in and Disagreements with Accountants on Accounting and Financial
Disclosure.
See Item 7. Management’s Discussion and Analysis of Financial Condition and Results of Operations
— Change in Independent Accountants
Item 9A(T). Controls and Procedures.
(a) Controls and Procedures
The Company’s Chief Executive Officer, and Chief Financial Officer carried out an evaluation of the
effectiveness of the Company’s disclosure controls and procedures, as of the end of the period
covered by this Annual Report on Form 10-K. Based upon that evaluation, the Chief Executive Officer
and Chief Financial Officer concluded that, as of the end of the period covered by this report, the
Company’s disclosure controls and procedures were effective such that information relating to the
Company (including its combined subsidiaries) required to be disclosed in the Company’s SEC reports
(1) is recorded, processed, summarized and reported within the time periods specified in the SEC
rules and forms and (2) is accumulated and communicated to the Company’s management, including the
Chief Executive Officer and Chief Financial Officer, as appropriate, to allow timely decisions
regarding required disclosure.
(b) Management’s Report on Internal Control Over Financial Reporting
The management of the Company is responsible for establishing and maintaining adequate internal
control over financial reporting, as such term is defined in Rules 13a-15(f) and 15d-15(f) under
the Exchange Act. There are inherent limitations on the effectiveness of any system of internal
controls and procedures, including the possibility of human error and the circumvention or
overriding of the controls and procedures. Accordingly, even effective internal controls and
procedures provide only reasonable assurance of achieving their objectives.
In connection with filing this Annual Report, management assessed the effectiveness of its internal
control over financial reporting as of December 31, 2009.
In making its assessments, management used the criteria set forth by the Committee of Sponsoring
Organizations of the Treadway Commission in Internal Control—Integrated Framework. Management has
determined that no material weaknesses in its internal control over financial reporting existed as
of December 31, 2009, and based on the criteria noted above, concluded that its internal control
over financial reporting was effective as of December 31, 2009.
This annual report does not include an attestation report of the company’s registered public
accounting firm regarding internal control over financial reporting. Management’s report was not
subject to attestation by the Company’s registered public accounting firm pursuant to temporary
rules of the SEC that permit the Company to provide only management’s report in this annual report.
(c) Changes in Internal Control Over Financial Reporting
There were no changes in the Company’s internal control over financial reporting during the three
months ended December 31, 2009 that materially affected, or are reasonably likely to materially
affect, the Company’s internal control over financial reporting.
Item 9B. Other Information.
The Board’s Compensation Committee did not grant a long-term incentive bonus in 2009 or 2010. On
March 17, 2010, the Compensation Committee terminated the Long-Term Bonus Plan. Due to the separation from
employment of several award recipients, only $0.4 million will potentially be paid out of the $1.3
million in Long-Term Bonus Plan awards granted on February 28, 2008.
54
Table of Contents
PART III.
Item 10. Directors, Executive Officers and Corporate Governance.
The information required by this item is incorporated by reference from our definitive proxy
statement to be filed with the SEC within 120 days after the Company’s fiscal year end of December
31, 2009 pursuant to Regulation 14A of the Exchange Act.
Item 11. Executive Compensation.
The information required by this item is incorporated by reference from our definitive proxy
statement to be filed with the SEC within 120 days after the Company’s fiscal year end of December
31, 2009 pursuant to Regulation 14A of the Exchange Act.
Item 12. Security Ownership of Certain Beneficial Owners and Management and Related Stockholder
Matters.
Except as provided herein, the information required by this item is incorporated by reference from
our definitive proxy statement to be filed with the SEC within 120 days after the Company’s fiscal
year end of December 31, 2009 pursuant to Regulation 14A of the Exchange Act.
The following table provides information as of December 31, 2009 with respect to shares of the
Company’s common stock that may be issued under equity compensation plans:
EQUITY COMPENSATION PLAN INFORMATION
| (a) | (b) | (c) | ||||||||||
| Number of | Weighted | Number of Securities | ||||||||||
| Securities to be | Average Exercise | Remaining Available for | ||||||||||
| Issued Upon | Price of | Future Issuance Under | ||||||||||
| Exercise of | Outstanding | Equity | ||||||||||
| Outstanding | Options, | Compensation Plans | ||||||||||
| Options, Warrants, | Warrants, and | (Excluding Securities | ||||||||||
| Plan Category | and Rights | Rights | Reflected in Column (a) | |||||||||
Equity Compensation Plans Approved by Stockholders |
None | N/A | None | |||||||||
Equity Compensation Plans Not Approved by Stockholders |
847,500 | $ | 3.01 | 32,500 | ||||||||
Total |
847,500 | $ | 3.01 | 32,500 | ||||||||
On October 21, 2009, the Company adopted the Hampshire Group, Limited 2009 Stock Incentive
Plan. The total number of shares of the Company’s common stock available for issuance under the
Plan is 880,000. See Item 7. Management’s Discussion and Analysis of Financial Condition and
Results of Operations — Compensation Plans and Item 8. Financial Statements and Supplementary
Data, Note 12 — Stock Plans, Compensation Plans, and Retirement Savings Plan to the audited
consolidated financial statements for additional discussion of these events.
Item 13. Certain Relationships and Related Transactions and Director Independence.
The information required by this item is incorporated by reference from our definitive proxy
statement to be filed with the SEC within 120 days after the Company’s fiscal year end of December
31, 2009 pursuant to Regulation 14A of the Exchange Act.
Item 14. Principal Accountant Fees and Services.
The information required by this item is incorporated by reference from our definitive proxy
statement to be filed with the SEC within 120 days after the Company’s fiscal year end of December
31, 2009 pursuant to Regulation 14A of the Exchange Act.
55
Table of Contents
PART IV.
Item 15. Exhibits and Financial Statement Schedules.
| (a) | The following documents are filed as part of this Report: |
| 1. | Financial Statements: |
| The following consolidated financial statements of Hampshire Group, Limited for the three years ended December 31, 2009 are submitted in Part II, Item 8. Financial Statements and Supplementary Data of this report: |
| Description | Page | |||
| 29 | ||||
| 30 | ||||
| 31 | ||||
| 32 | ||||
| 33 | ||||
| 2. | Financial Statement Schedules: |
| The following consolidated financial statement schedule of Hampshire Group, Limited is included on page 62 of this report. |
| II — Valuation and Qualifying Accounts and Reserves |
| All schedules for which provision is made in the applicable accounting regulation of the SEC, but which are excluded from this report, are not required under the related instructions or are inapplicable, and therefore have been omitted. |
| 3. | Exhibits: |
| 2.1 | Agreement and Plan of Merger, dated as of February 23, 2009, by and among Hampshire
Group, Limited, NAF Holdings II, LLC and NAF Acquisition Corp. (incorporated by reference
to Exhibit 2.1 to the Company’s Current Report (File No. 000-20201) on Form 8-K on February
24, 2009). |
|||
| 2.2 | Amendment No. 1 to Agreement and Plan of Merger, by and among Hampshire Group, Limited,
NAF Holdings II, LLC and NAF Acquisition Corp. (incorporated by reference to Exhibit
(a)(13) to Amendment No. 6 to the Company’s Schedule 14D-9 on April 20, 2009). |
|||
| 3.1 | Restated Certificate of Incorporation of Hampshire Group, Limited (incorporated by
reference to the Company’s Annual Report on Form 10-K for the year ended December 31, 2004
(File No. 000-20201) on March 15, 2005). |
|||
| 3.2 | Certificate of Amendment and Restatement of the Certificate of Incorporation of
Hampshire Group, Limited (incorporated by reference to the Company’s Annual Report on Form
10-K for the year ended December 31, 2004 (File No. 000-20201) on March 15, 2005). |
|||
| 3.3 | Amended and Restated By-Laws of Hampshire Group, Limited (incorporated by reference to
Exhibit 3.2 to the Company’s Current Report (File No. 000-20201) on Form 8-K on August 15,
2008). |
|||
| 3.4 | Certificate of Designation of Series A Junior Participating Preferred Stock
(incorporated by reference to Exhibit 3.1 to the Company’s Current Report (File No.
000-20201) on Form 8-K filed on August 15, 2008). |
|||
| 4.1 | Registration statement on Form S-8 filed by Hampshire Group, Limited to register
880,000 shares of the Company’s common stock, par value $0.10 per share, which may be
issued under the Company’s 2009 Stock Incentive Plan (incorporated by reference to the Current Report (File No. 000-20201) on
Form S-8 on November 4, 2009). |
56
Table of Contents
| 4.2 | Rights Agreement, dated as of August 13, 2008, between Hampshire Group, Limited and
Mellon Investor Services LLC, as Rights Agent. (incorporated by reference to Exhibit 3.1 to
the Company’s Current Report (File No. 000-20201) on Form 8-K on August 15, 2008). |
|||
| 4.3 | First Amendment to Rights Agreement, dated as of February 23, 2009, by and between
Hampshire Group, Limited and Mellon Investor Services LLC, as Rights Agent (incorporated by
reference to Exhibit 3.3 to the Company’s Current Report on Form 8-K on February 24, 2009). |
|||
| 10.1 | * | Form of Hampshire Group, Limited and Subsidiaries 401(k) Retirement Savings Plan
(incorporated by reference to the Company’s Annual Report on Form 10-K for the year ended
December 31, 2004 (File No. 000-20201) on March 15, 2005). |
||
| 10.2 | * | Form of Hampshire Group, Limited Stock Option Plan Amended and Restated effective June
7, 1995 (incorporated by reference to the Company’s Annual Report on Form 10-K for the year
ended December 31, 2004 (File No. 000-20201) on March 15, 2005). |
||
| 10.3 | * | Form of Hampshire Group, Limited and Affiliates Common Stock Purchase Plan for
Directors and Executives Amended June 7, 1995 (incorporated by reference to the Company’s
Annual Report on Form 10-K for the year ended December 31, 2004 (File No. 000-20201) on
March 15, 2005). |
||
| 10.4 | * | Form of Hampshire Group, Limited Management Incentive Bonus Plan (incorporated by
reference to Appendix A to the Company’s Proxy Statement filed October 21, 2002). |
||
| 10.5 | * | Employment Agreement, dated as of July 1, 2005, by and between Hampshire Group,
Limited and Michael Culang (incorporated by reference to Exhibit 10.1 to the Company’s
Current Report (File No. 000-20201) on Form 8-K filed on June 29, 2006). |
||
| 10.6 | * | Employment Agreement, dated April 3, 2007, by and between Jonathan Norwood and
Hampshire Group, Limited (incorporated by reference to Exhibit 10.1 to the Company’s
Current Report (File No. 000-20201) on Form 8-K filed on April 3, 2007). |
||
| 10.7 | * | Employment Agreement, dated April 3, 2007, by and between Heath Golden and Hampshire
Group, Limited (incorporated by reference to Exhibit 10.2 to the Company’s Current Report
(File No. 000-20201) on Form 8-K filed on April 3, 2007). |
||
| 10.8 | * | Indemnification Agreement, dated as of August 21, 2006, by and between Jonathan
Norwood and Hampshire Group, Limited (incorporated by reference to Exhibit 10.1 to the
Company’s Current Report (File No. 000-20201) on Form 8-K filed on August 24, 2006). |
||
| 10.9 | * | Letter Agreement, dated August 21, 2006, by and between Jonathan Norwood and Hampshire
Group, Limited (incorporated by reference to Exhibit 10.2 to the Company’s Current Report
(File No. 000-20201) on Form 8-K filed on August 24, 2006). |
||
| 10.10 | * | Letter Agreement, dated October 8, 2007, by and between Michael Culang and Hampshire
Group, Limited (incorporated by reference to Exhibit 10.1 to the Company’s Current Report
(File No. 000-20201) on Form 8-K filed on October 8, 2007). |
||
| 10.11 | * | Indemnification Agreement, dated as of September 11, 2006, by and between Michael Culang
and Hampshire Group, Limited (incorporated by reference to Exhibit 10.1 to the Company’s
Current Report (File No. 000-20201) on Form 8-K filed on September 12, 2006). |
||
| 10.12 | * | Indemnification Agreement, dated as of September 11, 2006, by and between Heath L. Golden
and Hampshire Group, Limited (incorporated by reference to Exhibit 10.2 to the Company’s
Current Report (File No. 000-20201) on Form 8-K filed on September 12, 2006). |
||
| 10.13 | * | Indemnification Agreement, dated as of September 11, 2006, by and between Maura McNerney
and Hampshire Group, Limited (incorporated by reference to Exhibit 10.3 to the Company’s
Current Report (File No. 000-20201) on Form 8-K filed on September 12, 2006). |
57
Table of Contents
| 10.14 | * | Form of Hampshire Group, Limited Stock Option Plan amended and restated effective
February 8, 2000 (incorporated by reference to Exhibit 10.5 to the Registrant’s
Quarterly Report (File No. 000-20201) on Form 10-Q filed on August 8, 2005). |
||
| 10.15 | Credit Agreement among HSBC Bank USA as agent, the Banks named therein and Hampshire
Group, Limited, dated August 15, 2003 (incorporated by reference to the Company’s Annual
Report on Form 10-K for the year ended December 31, 2004 (File No. 000-20201) on March 15,
2005). |
|||
| 10.16 | Amendment No. 1 to Credit Agreement among HSBC Bank USA as agent, the Banks named
therein and Hampshire Group, Limited, dated December 29, 2004 (incorporated by reference to
the Company’s Annual Report on Form 10-K for the year ended December 31, 2004 (File No.
000-20201) on March 15, 2005). |
|||
| 10.17 | Amendment No. 2 to Credit Agreement among HSBC Bank USA as agent, the Banks named
therein and Hampshire Group, Limited, dated November 10, 2005 (incorporated by reference to
Exhibit 10.14 to the Registrant’s Annual Report (File No. 000-20201) on Form 10-K filed on
March 13, 2006). |
|||
| 10.18 | Amendment No. 3 and Waiver, dated as of August 8, 2006, to that certain Credit
Agreement and Guaranty, dated as of August 15, 2003 and amended December 29, 2004 and
November 10, 2005, by and among the Company, the Guarantors party thereto, HSBC Bank USA,
National Association, as Agent for the Banks, and the Banks named therein (incorporated by
reference to Exhibit 10.1 to the Company’s Current Report (File No. 000-20201) on Form 8-K
filed on August 9, 2006). |
|||
| 10.19 | Waiver to Credit Agreement, dated as of October 13, 2006, pursuant to that certain
Credit Agreement and Guaranty, dated as of August 15, 2003 and amended as of December 29,
2004, November 10, 2005 and August 8, 2006, by and among the Company, the Guarantors party
thereto, HSBC Bank USA, National Association, as Agent for the Banks, and the Banks named
therein (incorporated by reference to Exhibit 10.1 to the Company’s Current Report (File
No. 000-20201) on Form 8-K filed on October 16, 2006). |
|||
| 10.20 | Amendment No. 4 and Waiver, dated as of December 29, 2006, to that certain Credit
Agreement and Guaranty, dated as of August 15, 2003 and amended as of December 29, 2004,
November 10, 2005, August 8, 2006 and October 13, 2006, by and among the Company, the
Guarantors party thereto, HSBC Bank USA, National Association, as Agent for the Banks, and
the Banks named therein (incorporated by reference to Exhibit 10.1 to the Company’s Current
Report (File No. 000-20201) on Form 8-K filed on December 29, 2006). |
|||
| 10.21 | Amendment No. 5 and Waiver, dated as of March 30, 2007, to that certain Credit
Agreement and Guaranty, dated as of August 15, 2003 and amended as of December 29, 2004,
November 10, 2005, August 8, 2006, October 13, 2006, and December 29, 2006, by and among
the Company, the Guarantors party thereto, HSBC Bank USA, National Association, as Agent
for the Banks, and the Banks named therein (incorporated by reference to Exhibit 10.2 to
the Company’s Current Report (File No. 000-20201) on Form 8-K filed on April 2, 2007). |
|||
| 10.22 | Amendment No. 6 and Waiver, dated as of July 11, 2007, to that certain Credit
Agreement and Guaranty, dated as of August 15, 2003 and amended as of December 29, 2004,
November 10, 2005, August 8, 2006, October 13, 2006, December 29, 2006, and March 30, 2007
by and among the Company, the Guarantors party thereto, HSBC Bank USA, National
Association, as Agent for the Banks, and the Banks named therein (incorporated by reference
to Exhibit 10.2 to the Company’s Current Report (File No. 000-20201) on Form 8-K filed on
July 13, 2007). |
|||
| 10.23 | Waiver, dated as of July 25, 2007, to that certain Credit Agreement and Guaranty,
dated as of August 14, 2003 and amended as of December 29, 2004, November 10, 2005, August
8, 2006, October 13, 2006, December 29, 2006, March 30, 2007 and July 11, 2007 by and among
the Company, the Guarantors party thereto, HSBC Bank USA, National Association, as Agent
for the Banks, and the Banks named therein (incorporated by reference to Exhibit 10.1 to
the Company’s Current Report (File No. 000-20201) on Form 8-K filed on July 27, 2007). |
58
Table of Contents
| 10.24 | Waiver, dated as of August 31, 2007, to that certain Credit Agreement and Guaranty,
dated as of August 15, 2003 and amended as of December 29, 2004, November 10, 2005, August
8, 2006, October 13, 2006, December 29, 2006, March 30, 2007, July 11, 2007, and July 25,
2007 by and among the Company, the Guarantors party thereto, HSBC Bank USA, National
Association, as Agent for the Banks, and the Banks named therein (incorporated by reference
to Exhibit 10.2 to the Company’s Current Report (File No. 000-20201) on Form 8-K filed on
August 31, 2007). |
|||
| 10.25 | Amendment No.8 and Waiver, dated as of December 13, 2007, to that certain Credit
Agreement and Guaranty, dated as of August 15, 2003 and amended as of December 29, 2004,
November 10, 2005, August 8, 2006, October 13, 2006, December 29, 2006, March 30, 2007,
July 11, 2007, July 25, 2007 and August 31, 2007 by and among the Company, the Guarantors
party thereto, HSBC Bank USA, National Association, as Agent for the Banks and the Banks
named therein (incorporated by reference to Exhibit 10.1 to the Company’s Current Report
(File No. 000-20201) on Form 8-K filed on December 13, 2007). |
|||
| 10.26 | Lease Agreement between CHARNEY-FPG 114 41ST STREET, LLC and Hampshire Group, Limited,
dated as of July 11, 2007 (incorporated by reference to Exhibit 10.1 to the Company’s
Current Report (File No. 000-20201) on Form 8-K filed on July 13, 2007). |
|||
| 10.27 | Lease Agreement between CK Holdings LLC and Hampshire Designers, Inc., dated as of
March 20, 2006 (incorporated by reference to Exhibit 10.14 to the Registrant’s Annual
Report (File No. 000-20201) on Form 10-K filed on March 13, 2006).10.31 Asset Purchase
Agreement dated October 8, 2003 by and between Hampshire Investments, Limited and K
Holdings, LLC (incorporated by reference to the Company’s Annual Report on Form 10-K for
the year ended December 31, 2004 (File No. 000-20201) on March 15, 2005). |
|||
| 10.28 | * | Change in Control Agreement, dated as of March 28, 2007, by and between Michael Culang
and Hampshire Group, Limited (incorporated by reference to Exhibit 10.2 to the Company’s
Current Report (File No. 000-20201) on Form 8-K filed on April 2, 2007.) |
||
| 10.29 | * | Indemnification Agreement, dated as of January 4, 2007, by and between Joel Goldberg and
Hampshire Group, Limited (incorporated by reference to Exhibit 10.1 to the Company’s
Current Report (File No. 000-20201) on Form 8-K filed on January 5, 2007.) |
||
| 10.30 | * | Indemnification Agreement, dated as of January 4, 2007, by and between Michael C. Jackson
and Hampshire Group, Limited (incorporated by reference to Exhibit 10.1 to the Company’s
Current Report (File No. 000-20201) on Form 8-K filed on January 5, 2007). |
||
| 10.31 | * | Indemnification Agreement, dated as of January 4, 2007, by and between Harvey L. Sperry
and Hampshire Group, Limited (incorporated by reference to Exhibit 10.1 to the Company’s
Current Report (File No. 000-20201) on Form 8-K filed on January 5, 2007). |
||
| 10.32 | * | Indemnification Agreement, dated as of January 4, 2007, by and between Irwin W. Winter
and Hampshire Group, Limited (incorporated by reference to Exhibit 10.1 to the Company’s
Current Report (File No. 000-20201) on Form 8-K filed on January 5, 2007). |
||
| 10.33 | Credit Agreement among HSBC Bank USA as agent, the Banks named therein and Hampshire
Group, Limited, dated February 15, 2008 (incorporated by reference to Exhibit 10.1 to the
Company’s Current Report (File No. 000-20201) on Form 8-K filed on February 19, 2008). |
|||
| 10.34 | * | Hampshire Group, Limited Long-Term Bonus Plan, dated February 28, 2008 (incorporated by
reference to Exhibit 10.1 to the Company’s Current Report (File No. 000-20201) on Form 8-K
filed on March 4, 2008). |
||
| 10.35 | Amended and Restated Credit Agreement and Guaranty, dated as of February 15, 2008,
among Hampshire Group, Limited, Hampshire Designers, Inc., Item-Eyes, Inc., SB Corporation,
and Shane Hunter, Inc.; HSBC Bank USA, National Association (“HSBC”), JPMorgan Chase Bank,
N.A., Israel Discount Bank of New York, Wachovia Bank, National Association, Bank Leumi USA
and Sovereign Bank, as Banks; and HSBC, as Letter of Credit Issuing Bank and as Agent for
the Banks (incorporated by reference to Exhibit 10.1 to the Company’s Current Report (File
No. 000-20201) on Form 8-K filed on February 19, 2008). |
59
Table of Contents
| 10.36 | Amendment No. 1, dated as of April 15, 2008, to that certain Amended and Restated
Credit Agreement and Guaranty, dated as of February 15, 2008, by and among Hampshire Group,
Limited, Hampshire Designers, Inc., Item-Eyes, Inc., SB Corporation, and Shane Hunter,
Inc.; HSBC Bank USA, National Association (“HSBC”), JPMorgan Chase Bank, N.A., Israel
Discount Bank of New York, Wachovia Bank, National Association, Bank Leumi USA and
Sovereign Bank, as Banks; and HSBC, as Letter of Credit Issuing Bank and as Agent for the
Banks. (incorporated by reference to Exhibit 10.1 to the Company’s Current Report (File No.
000-20201) on Form 8-K filed on April 22, 2008). |
|||
| 10.37 | Amendment No. 2 to Amended and Restated Credit Agreement and Guaranty, dated as of
August 4, 2008, by and among Hampshire Group, Limited, Hampshire Designers, Inc.,
Item-Eyes, Inc., Shane Hunter, Inc. SB Corporation, the Banks party thereto and HSBC Bank
USA, National Association, as Agent for the Banks (incorporated by reference to Exhibit
10.2 to the Company’s Current Report (File No. 000-20201) on Form 8-K filed on August 5,
2008). |
|||
| 10.38 | Second Amended and Restated Credit Agreement and Guaranty, dated as of August 7, 2009,
by and among Hampshire Group, Limited, Hampshire Designers, Inc., and Item-Eyes, Inc.; HSBC
Bank USA, National Association (“HSBC”), JPMorgan Chase Bank, N.A., Wachovia Bank, National
Association, Bank Leumi USA and Sovereign Bank, as Banks; and HSBC, as Letter of Credit
Issuing Bank and as Agent for the Banks. (incorporated by reference to Exhibit 10.1 to the
Company’s Current Report (File No. 000-20201) on Form 10-Q filed on August 10, 2009). |
|||
| 10.39 | Asset Purchase Agreement, dated as of April 15, 2008, by and among Hampshire Group,
Limited “Company”), Shane Hunter, Inc., and Shane Hunter, LLC. (incorporated by reference
to Exhibit 2.1 to the Company’s Current Report (File No. 000-20201) on Form 8-K filed on
April 22, 2008). |
|||
| 10.40 | * | Indemnification Agreement, dated as of April 29, 2008, by and between Richard A. Mandell
and Hampshire Group, Limited (incorporated by reference to Exhibit 10.1 to the Company’s
Current Report (File No. 000-20201) on Form 8-K filed on May 5, 2008). |
||
| 10.41 | * | Indemnification Agreement, dated as of April 29, 2008, by and between Herbert Elish and
Hampshire Group, Limited (incorporated by reference to Exhibit 10.2 to the Company’s
Current Report (File No. 000-20201) on Form 8-K filed on May 5, 2008). |
||
| 10.42 | * | Employment Agreement by and between Hampshire Group, Limited and Michael S. Culang, dated
July 30, 2008 (incorporated by reference to Exhibit 10.1 to the Company’s Current Report
(File No. 000-20201) on Form 8-K filed on August 4, 2008). |
||
| 10.43 | Stock Purchase and Settlement Agreement and Mutual Releases, dated as of August 4,
2008, by and among Ludwig Kuttner, Beatrice Ost-Kuttner, Fabian Kuttner, K Holdings LLC and
Hampshire Group, Limited (incorporated by reference to Exhibit 10.1 to the Company’s
Current Report (File No. 000-20201) on Form 8-K filed on August 5, 2008). |
|||
| 10.44 | * | Letter Agreement with Richard A. Mandell dated as of April 15, 2009. (incorporated by
reference to Exhibit 99.1 to the Company’s Current Report (File No. 000-20201) on Form 8-K
filed on April 21, 2009). |
||
| 10.45 | * | Hampshire Group, Limited Hampshire Group, Limited 2009 Stock Incentive Plan, dated
October 21, 2009 (incorporated by reference to Exhibit 10.1 to the Company’s Current Report
(File No. 000-20201) on Form 8-K filed on October 27, 2009). |
||
| 10.46 | * | Hampshire Group, Limited Hampshire Group, Limited 2010 Cash Incentive Bonus Plan, dated
October 21, 2009 (incorporated by reference to Exhibit 10.1 to the Company’s Current Report
(File No. 000-20201) on Form 8-K filed on October 27, 2009). |
||
| 10.47 | Letter Agreement, dated December 2, 2009, among Hampshire Group, Limited, Peter H.
Woodward and MHW Capital Management (incorporated by reference to Exhibit 10.1 to the
Company’s Current Report (File No. 000-20201) on Form 8-K filed on December 7, 2009). |
60
Table of Contents
| 10.48 | Indemnification Agreement, dated December 2, 2009, between Hampshire Group, Limited
and Peter H. Woodward (incorporated by reference to Exhibit 10.2 to the Company’s Current
Report (File No. 000-20201) on Form 8-K filed on December 7, 2009). |
|||
| 11.0 | Hampshire Group, Limited Consolidated Earnings Per Share Computations (incorporated by
reference to Note 15 to the consolidated financial statements included in Part II, Item 8.
Financial Statements and Supplementary Data of this report). |
|||
| 14.1 | Code of Ethics and Business Conduct (incorporated by reference to the Company’s Annual
Report on Form 10-K for the year ended December 31, 2004 (File No. 000-20201) on March 15, 2005). |
|||
| 14.2 | Complaint Procedures for Accounting and Audit Matters (incorporated by reference to the
Company’s Annual Report on Form 10-K for the year ended December 31, 2004 (File No.
000-20201) on March 15, 2005). |
|||
| 21.1 | Subsidiaries of the Company |
|||
| 23.1 | Consent of BDO Seidman, LLP |
|||
| 23.2 | Consent of Deloitte & Touche LLP |
|||
| 31.1 | Certification of Interim Chief Executive Officer pursuant to Item 601(b) (31) of
Regulations S-K as adopted pursuant to Section 302 of the Sarbanes- Oxley Act of 2002 |
|||
| 31.2 | Certification of Chief Financial Officer pursuant to Item 601(b) (31) of Regulations
S-K as adopted pursuant to Section 302 of the Sarbanes- Oxley Act of 2002 |
|||
| 32.1 | Certification of Interim Chief Executive Officer pursuant to 18 U.S.C. Section 1350, as
adopted pursuant to Section 906 of the Sarbanes-Oxley Act of 2002 |
|||
| 32.2 | Certification of Chief Financial Officer pursuant to 18 U.S.C. Section 1350, as adopted
pursuant to Section 906 of the Sarbanes-Oxley Act of 2002 |
| * | Company compensatory plan or management contract. |
61
Table of Contents
Schedule II
Hampshire Group, Limited
Hampshire Group, Limited
(a) Allowance for Doubtful Accounts, Allowance for Returns, Discounts, and Adjustments,
Allowance for Inventory Reserves, and Deferred Tax Valuation Allowances.
| Balance at | Charged to | Charged to | Balance at | |||||||||||||||||
| Beginning of | Costs and | Other Accounts | End of | |||||||||||||||||
| (In thousands) | Year | Expenses | (Acquisitions) | Deductions | Year | |||||||||||||||
Allowance for doubtful accounts: |
||||||||||||||||||||
Year ended December 31, 2007 |
$ | 60 | $ | 5 | $ | — | $ | (6 | ) | $ | 59 | |||||||||
Year ended December 31, 2008 |
$ | 59 | $ | 977 | $ | — | $ | — | $ | 1,036 | ||||||||||
Year ended December 31, 2009 |
$ | 1,036 | $ | 178 | $ | — | $ | (60 | ) | $ | 1,154 | |||||||||
Allowance for returns, discounts,
and adjustments: |
||||||||||||||||||||
Year ended December 31, 2007 |
$ | 18,494 | $ | 43,118 | $ | — | $ | (39,243 | ) | $ | 22,369 | |||||||||
Year ended December 31, 2008 |
$ | 22,369 | $ | 42,410 | $ | — | $ | (42,754 | ) | $ | 22,025 | |||||||||
Year ended December 31, 2009 |
$ | 22,025 | $ | 38,566 | $ | (11 | ) | $ | (39,951 | ) | $ | 20,629 | ||||||||
Inventory reserves: |
||||||||||||||||||||
Year ended December 31, 2007 |
$ | 1,958 | $ | 4,679 | $ | — | $ | (4,211 | ) | $ | 2,426 | |||||||||
Year ended December 31, 2008 |
$ | 2,426 | $ | 2,118 | $ | — | $ | (2,283 | ) | $ | 2,261 | |||||||||
Year ended December 31, 2009 |
$ | 2,261 | $ | 927 | $ | — | $ | (2,948 | ) | $ | 240 | |||||||||
Deferred tax valuation allowances: |
||||||||||||||||||||
Year ended December 31, 2007 |
$ | 2,079 | $ | 368 | $ | — | $ | (762 | ) | $ | 1,685 | |||||||||
Year ended December 31, 2008 |
$ | 1,685 | $ | 19,044 | $ | — | $ | (134 | ) | $ | 20,595 | |||||||||
Year ended December 31, 2009 |
$ | 20,595 | $ | — | $ | — | $ | (1,748 | ) | $ | 18,847 | |||||||||
(b) None.
62
Table of Contents
SIGNATURES
Pursuant to the requirements of Section 13 or 15(d) of the Securities Exchange Act of 1934,
the Registrant has duly caused this Report to be signed on its behalf by the undersigned, thereunto
duly authorized.
| Hampshire Group, Limited |
||||
| Date: March 22, 2010 | By: | /s/ Heath L. Golden | ||
| Heath L. Golden | ||||
| President and Chief Executive Officer | ||||
POWER OF ATTORNEY
KNOW ALL MEN BY THESE PRESENTS, that each person whose signature appears on the signature page
to this Report constitutes and appoints Heath L. Golden and Jonathan W. Norwood and each of them,
his true and lawful attorneys-in-fact and agents, with full power of substitution and
resubstitution, for him and in his name, place and stead, in any and all capacities, to sign any
and all amendments (including post-effective amendments) to this Report, and to file the same, with
all exhibits hereto, and other documents in connection therewith, with the Securities and Exchange
Commission, and grants unto said attorneys-in-fact and agents, and each of them, full power and
authority to do and perform each and every act and thing requisite and necessary to be done in and
about the premises, as fully to all intents and purposes as he might or could do in person, hereby
ratifying and confirming all that said attorneys-in-fact and grants or any of them, or their or his
substitutes, may lawfully do or cause to be done by virtue hereof.
Pursuant to the requirements of the Securities Exchange Act of 1934, this Report has been
signed below by the following persons in the capacities indicated on March 22, 2010.
| Signature | Title | |
/s/ Richard A. Mandell
|
Chairman of the Board | |
Richard Mandell |
||
/s/ Heath L. Golden
|
President and Chief Executive Officer | |
| (principal executive officer) | ||
/s/ Jonathan W. Norwood
|
Vice President, Chief Financial Officer, and Treasurer (principal financial officer and principal accounting officer) | |
/s/ Irwin W. Winter
|
Director | |
Irwin W. Winter |
||
/s/ Harvey L. Sperry
|
Director | |
/s/ Herbert Elish
|
Director | |
Herbert Elish |
||
/s/ Peter H. Woodward
|
Director | |
Peter H. Woodward |
63
Table of Contents
EXHIBIT INDEX
| 21.1 | Subsidiaries of the Company |
|||
| 23.1 | Consent of BDO Seidman, LLP |
|||
| 23.2 | Consent of Deloitte & Touche LLP |
|||
| 31.1 | Certification of Interim Chief Executive Officer pursuant to Item 601(b) (31) of
Regulations S-K as adopted pursuant to Section 302 of the Sarbanes-Oxley Act of 2002 |
|||
| 31.2 | Certification of Chief Financial Officer pursuant to Item 601(b) (31) of
Regulations S-K as adopted pursuant to Section 302 of the Sarbanes-Oxley Act of 2002 |
|||
| 32.1 | Certification of Interim Chief Executive Officer pursuant to 18 U.S.C. Section
1350, as adopted pursuant to Section 906 of the Sarbanes-Oxley Act of 2002 |
|||
| 32.2 | Certification of Chief Financial Officer pursuant to 18 U.S.C. Section 1350, as
adopted pursuant to Section 906 of the Sarbanes-Oxley Act of 2002 |