Attached files
| file | filename |
|---|---|
| 8-K - FORM 8-K - Employers Holdings, Inc. | form8-k.htm |
Exhibit 99.1

Employers Holdings, Inc.
Investor Presentation
March, 2010

1
Safe Harbor Disclosure
This slide presentation is for informational purposes only. It should be read in conjunction with our Form 10-K for the year 2009, our Form 10-Qs and our
Form 8-Ks filed with the Securities and Exchange Commission (SEC), all of which are available on the “Investor Relations” section of our website at
www.employers.com.
Form 8-Ks filed with the Securities and Exchange Commission (SEC), all of which are available on the “Investor Relations” section of our website at
www.employers.com.
Non-GAAP Financial Measures
In presenting Employers Holdings, Inc.’s (EMPLOYERS) results, management has included and discussed certain non-GAAP financial measures, as
defined in Regulation G. Management believes these non-GAAP measures better explain EMPLOYERS results allowing for a more complete
understanding of underlying trends in our business. These measures should not be viewed as a substitute for those determined in accordance with GAAP.
The reconciliation of these measures to their most comparable GAAP financial measures is included in this presentation or in our Form 10-K for the year
2009, our Form 10-Qs and our Form 8-Ks filed with the Securities and Exchange Commission (SEC) and available in the “Investor Relations” section of our
website at www.employers.com.
Forward-looking Statements
This presentation may contain certain forward-looking statements within the meaning of the Private Securities Litigation Reform Act of 1995. Forward-
looking statements include statements regarding anticipated future results and can be identified by the fact that they do not relate strictly to historical or
current facts. They often include words like "believe”, "expect”, "anticipate”, "estimate" and "intend" or future or conditional verbs such as "will”, "would”,
"should”, "could" or "may”. All subsequent written and oral forward-looking statements attributable to us or individuals acting on our behalf are expressly
qualified in their entirety by these cautionary statements.
Any forward-looking statements made in this presentation reflect EMPLOYERS current views with respect to future events, business transactions and
business performance and are made pursuant to the safe harbor provisions of the Private Securities Litigation Reform Act of 1995. Such statements
involve risks and uncertainties, which may cause actual results to differ materially from those set forth in these statements.
business performance and are made pursuant to the safe harbor provisions of the Private Securities Litigation Reform Act of 1995. Such statements
involve risks and uncertainties, which may cause actual results to differ materially from those set forth in these statements.
We undertake no obligation to publicly update or revise any forward-looking statements, whether as a result of new information, future events or otherwise.
Copyright © 2010 EMPLOYERS. All rights reserved. EMPLOYERS® and America’s small business insurance specialist.® are registered trademarks of Employers Insurance
Company of Nevada. Employers Holdings, Inc. is a holding company with subsidiaries that are specialty providers of workers’ compensation insurance and services focused
on select, small businesses engaged in low to medium hazard industries. The company, through its subsidiaries, operates in 30 states. Insurance subsidiaries include
Employers Insurance Company of Nevada, Employers Compensation Insurance Company, Employers Preferred Insurance Company, and Employers Assurance Company, all
rated A- (Excellent) by A.M. Best Company. Additional information can be found at: http://www.employers.com.
2
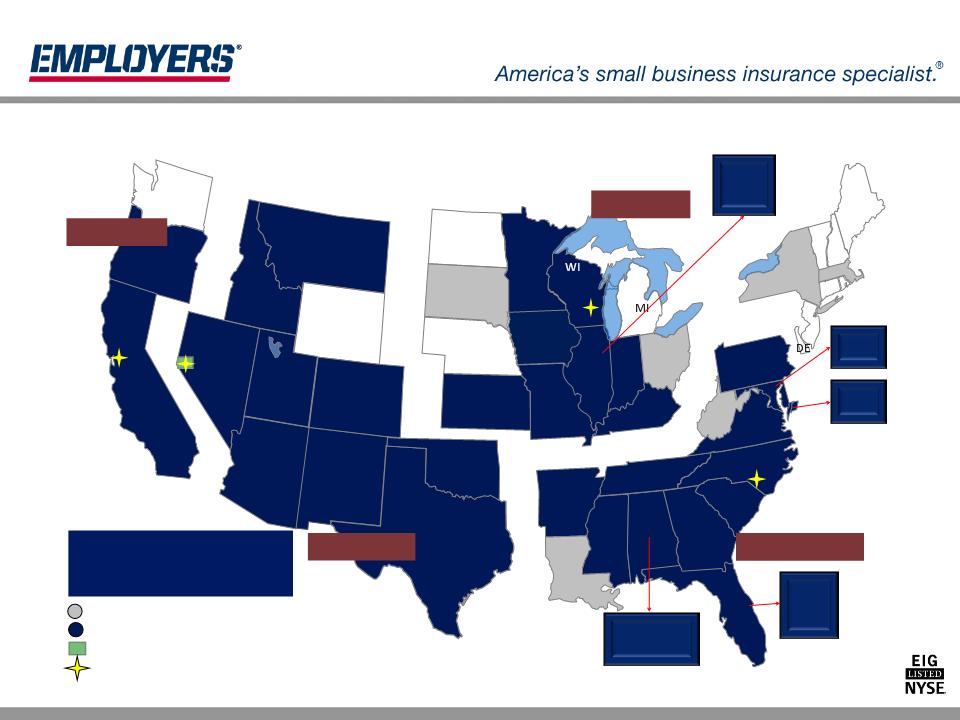
Overview
Business
· Specialty provider of workers’ compensation
insurance
insurance
· Coverage required by statute
Ø Medical, temporary/permanent indemnity, death
Geographic
· 30 states with concentrations in CA, FL, WI, IL and
NV
NV
Ø Unique markets by state and area
Customers
· Small “main street” businesses
· Low-to-medium hazard exposure industries
Ø Top classes include restaurants, physicians, dentists,
clerical, retail stores
clerical, retail stores
· Distribution through agents and strategic partners
$45 billion
per year
industry
(2008, A.M. Best)
per year
industry
(2008, A.M. Best)
Highly
focused
business
model
focused
business
model
Operate in
74% of total
market
(2008, A.M. Best)
74% of total
market
(2008, A.M. Best)
3
Key Strategies
FOCUS
GROWTH
CAPITAL
• Target attractive
small business
market
• Maintain
disciplined risk
selection,
underwriting,
pricing and
claims operations
• Focus on
underwriting
profitability
• Selectively
expand into
additional
markets
• Increase
penetration in
current markets
• Leverage
infrastructure,
technology and
systems
• Develop existing
and new
distribution
partners
• Invest in core
operations
• Invest in strategic
acquisitions
• Return capital to
shareholders

4
2000
2002
2006
2007
FL
NM
MD
TX
OK
KS
NE
SD
ND
MT
WY
CO
UT
ID
AZ
NV
WA
CA
OR
KY
PA
NH
MA
CT
VA
WV
OH
IN
IL
NC
TN
SC
AL
AR
LA
MO
IA
MN
MS
VT
NJ
DE
2008
1913 - 1999
State WC
fund in NV
State WC
fund in NV
2000
Privatization
Privatization
2007
Demutualization
and IPO - entry
into FL, IL and
OR
Demutualization
and IPO - entry
into FL, IL and
OR
2002
Acquisition,
book of
business in
CA, UT, ID,
MT, CO
Acquisition,
book of
business in
CA, UT, ID,
MT, CO
2005
Formation of
mutual hold co
Formation of
mutual hold co
2008
Acquisition of
AmCOMP
Incorporated,
entry into IA
Acquisition of
AmCOMP
Incorporated,
entry into IA
2006 Entry
into TX, AZ
into TX, AZ
5
$ million
# policies
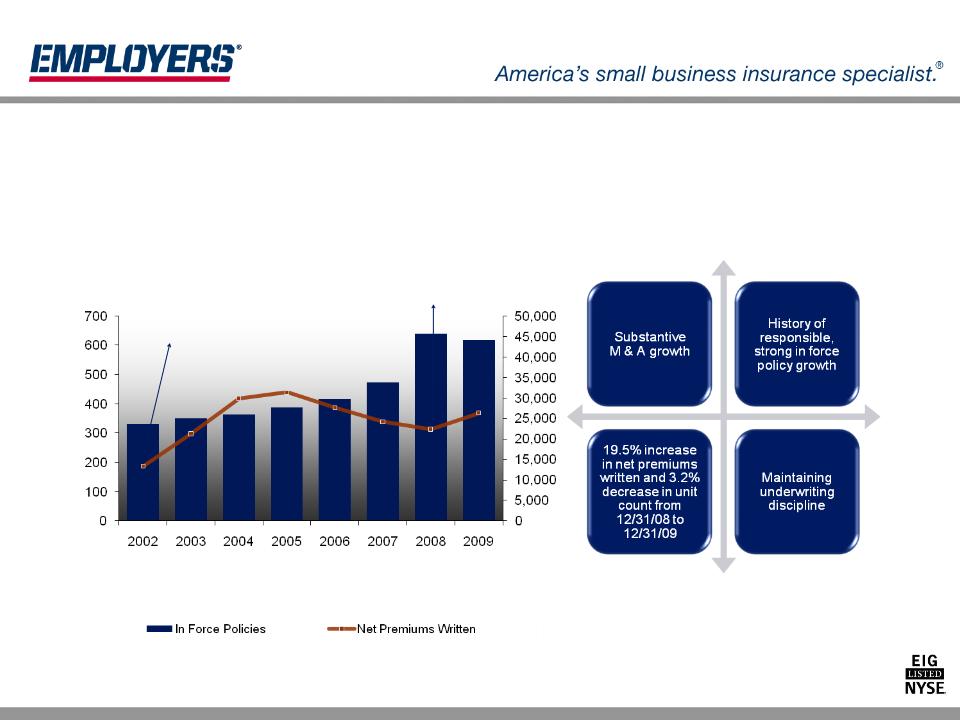
Increasing Market Penetration
Purchased
Fremont Book
of Business
Fremont Book
of Business
Purchased
AmCOMP
Incorporated
AmCOMP
Incorporated
Policy Count ‘02-’09
CAGR = 9.3%
NPW ‘02-’09 CAGR = 10.2%
6
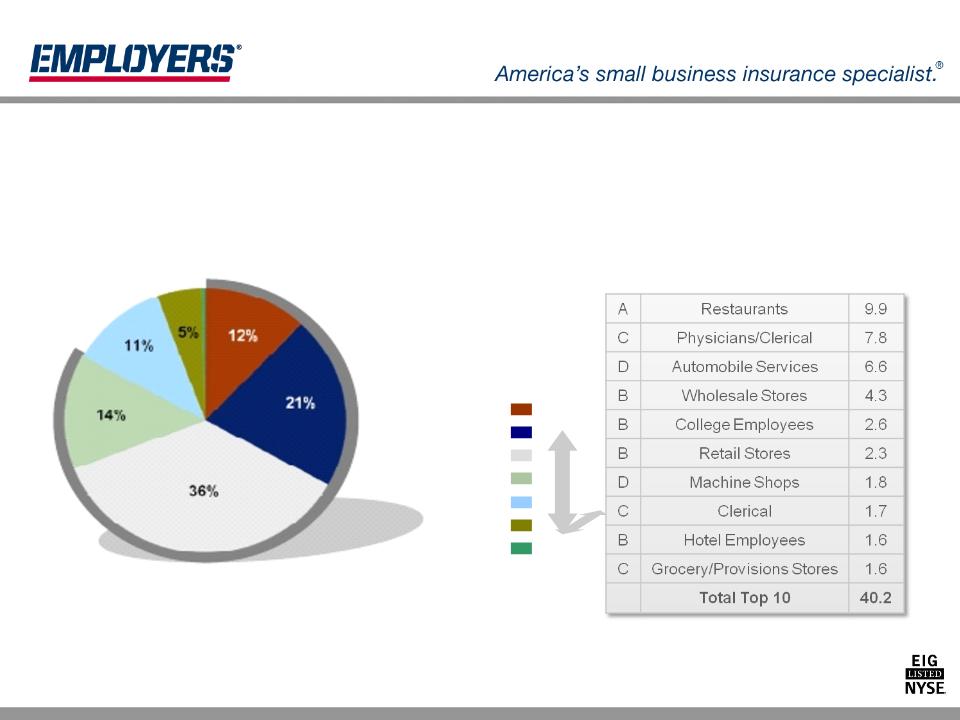
Disciplined Risk Selection
Hazard Group A
Hazard Group B
Hazard Group C
Hazard Group D
Hazard Group E
Hazard Group F
Hazard Group G
Lower
Risk
Risk
Higher
Risk
Risk
EMPLOYERS = 83% of
Total In Force Premium,
Hazard Groups A - D
Total In Force Premium,
Hazard Groups A - D
% In Force Premiums, 12/31/09
Top 10 Classes
Top 10 Classes
NCCI
Hazard
Group
Hazard
Group
%
In Force
Premium
In Force
Premium
Focused Guidelines and Selection within Industry-defined Classes
7
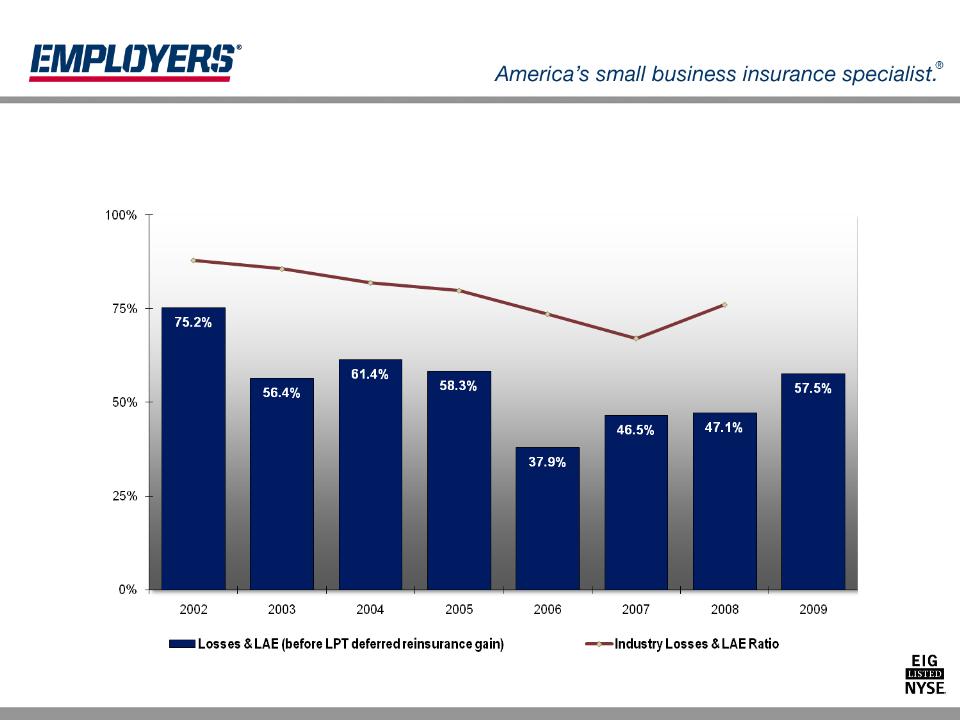
Delivering Superior Loss Ratios
Consistently Lower Loss and LAE Ratios than the Industry
A.M. Best, “Aggregates and Averages”
8
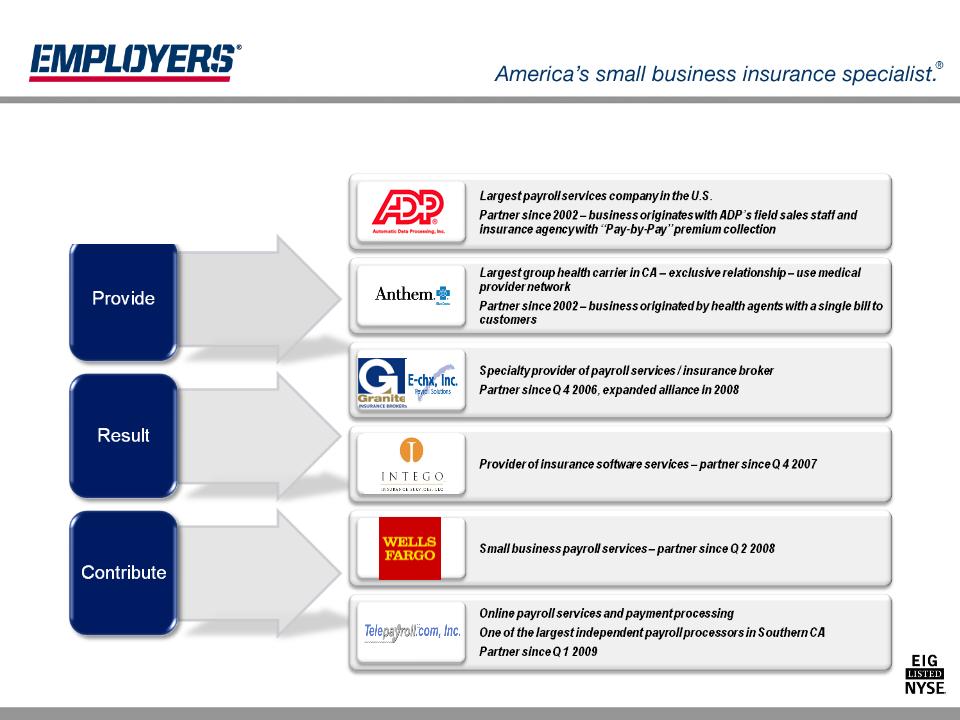
Strategic Partnerships
Unique Distribution Network
Industry Focused
• 1,600 in place
• Strong relationships
with agents
with agents
• Two key partners
Ø ADP
Ø Anthem Blue Cross
Restaurants and physicians
are our top two classes of
customers
are our top two classes of
customers
• California Restaurant Association
provider of choice
provider of choice
• California Medical Association
sponsorship
sponsorship
• NFIB (National Federation of
Independent Businesses)
Independent Businesses)
Independent Agents and Brokers
9
Increasing Points of Access
Partnerships
… a distribution
advantage by
expanding market
reach and providing
local knowledge
advantage by
expanding market
reach and providing
local knowledge
… in high persistency
… about 19% of in
force premiums in 2009
force premiums in 2009
10
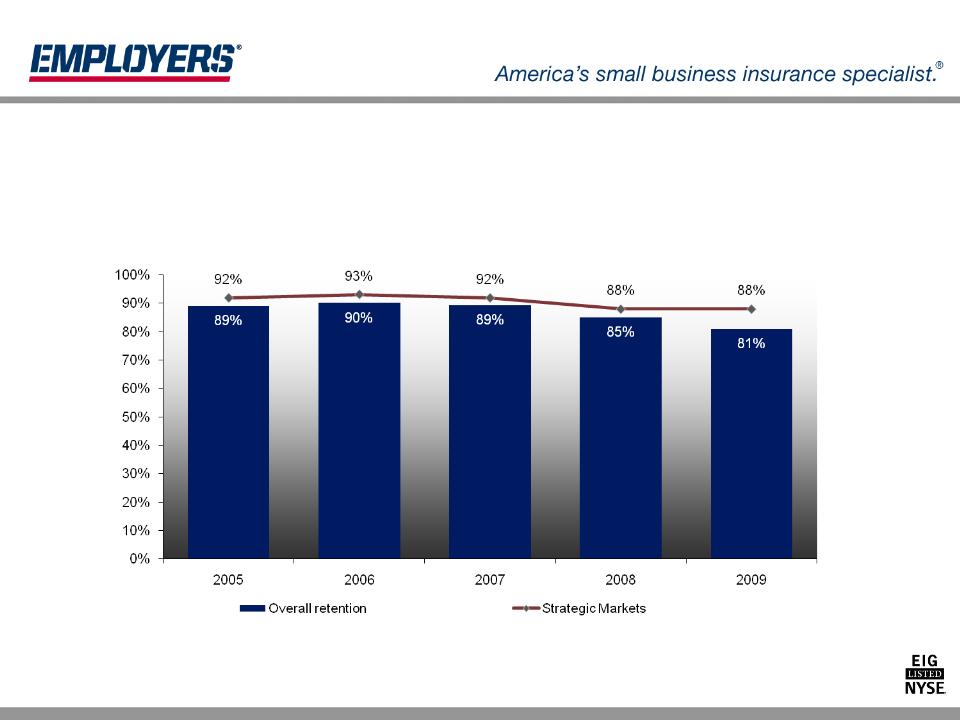
Strong Retention Rates
Strategic Partnerships Result in Consistently Higher Retention Rates
11
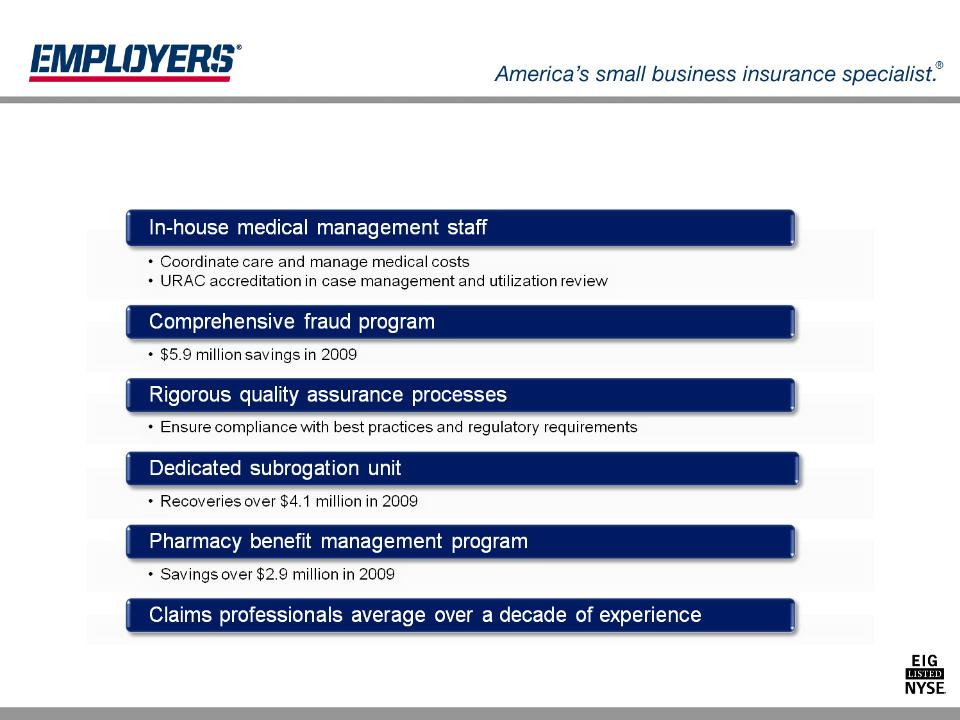
Superior Claims Management

12
Key Highlights
|
Income Statement
($ million except $ per share) |
Q 4 2009
|
Q 4 2008
|
2009
|
2008
|
|
Net Written Premium
|
72.2
|
89.0
|
368.3
|
308.3
|
|
Net Earned Premium
|
90.0
|
106.1
|
404.2
|
328.9
|
|
Net Investment Income
|
21.8
|
22.1
|
90.5
|
78.1
|
|
Net Income
|
11.3
|
15.9
|
83.0
|
101.8
|
|
Net Income Before LPT
|
6.6
|
11.3
|
65.0
|
83.4
|
|
Earnings Before LPT per Share
|
.15
|
.23
|
1.41
|
1.69
|
|
Balance Sheet ($ million)
|
12/31/2009
|
12/31/2008
|
||
|
Total Investments
|
2,029.6
|
2,042.9
|
||
|
Cash and Cash Equivalents
|
191.6
|
202.9
|
||
|
Total Assets
|
3,676.7
|
3,825.1
|
||
|
Reserves for Loss and LAE
|
2,425.7
|
2,506.5
|
||
|
Shareholders’ Equity
|
498.4
|
444.7
|
||
|
Equity Including LPT Deferred Gain
|
887.0
|
851.3
|
||
|
Underwriting Ratios
|
Q 4 2009
|
Q 4 2008
|
2009
|
2008
|
|
Loss Ratio Before LPT
|
58.2%
|
57.2%
|
57.5%
|
47.1
|
|
Combined Ratio Before LPT
|
111.7%
|
103.4%
|
102.5%
|
91.5
|
|
Financial Ratios
|
2009
|
2008
|
||
|
Book Value per Share
|
$20.67
|
$17.43
|
||
|
Return on Average Adjusted Equity
|
7.5%
|
10.1%
|
||
13
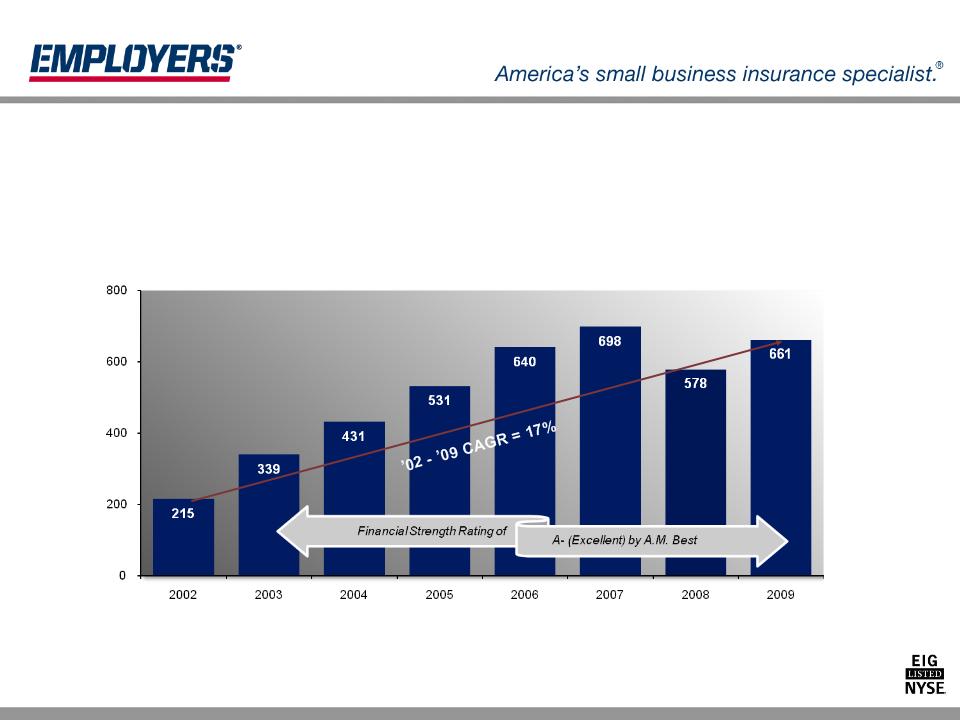
Strong Capital Position
($ million)
.6 to 1
NPW/Statutory
Surplus Ratio
NPW/Statutory
Surplus Ratio
$355 million
extraordinary
dividends to
parent in 2008
extraordinary
dividends to
parent in 2008
Strong Growth in Statutory Surplus Provides a Solid Basis for Underwriting

14
Loss Portfolio Transfer (LPT)
Claims 6/30/1995 and prior - Approximately 3,500 claims
open as of 12/31/09 with 5% closing each year
open as of 12/31/09 with 5% closing each year
Remaining liabilities at 12/31/09: $888.4 million
15
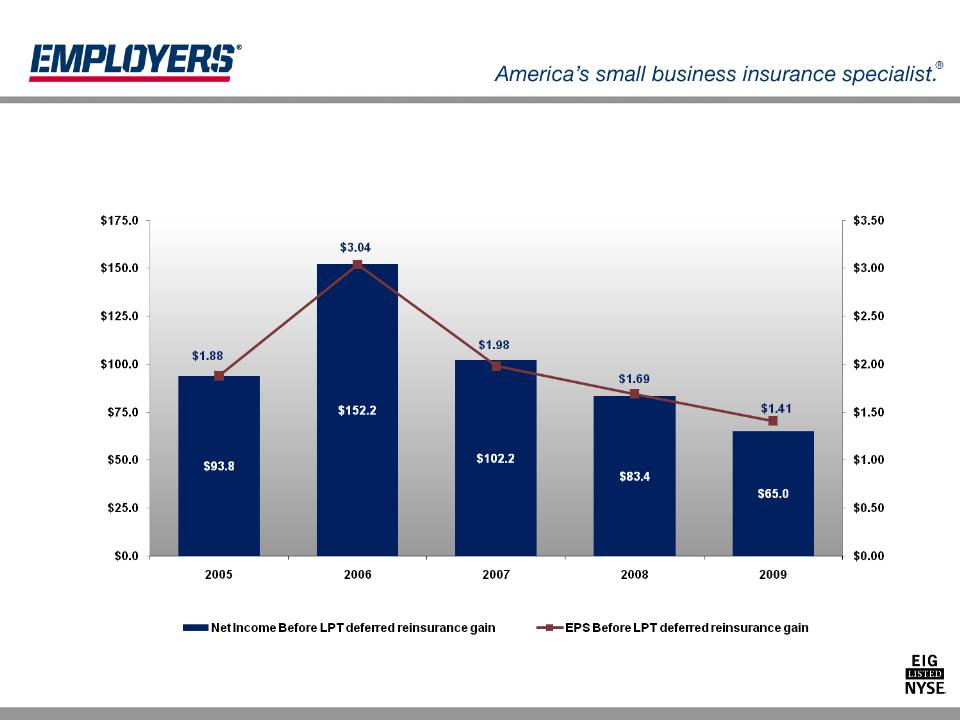
NOTE: 50,000,002 pro forma shares prior to February 5, 2007 (IPO date)
(millions)
Continuing Profits
16
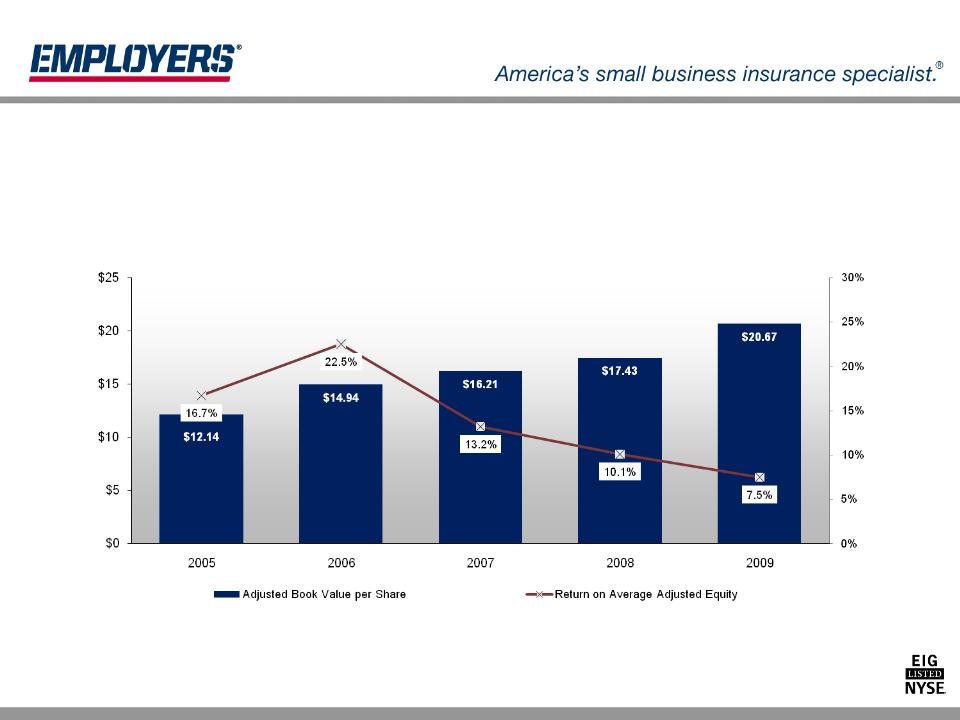
Return on Average Adjusted Equity, Increasing Book
Value per Share
Value per Share
NOTE: 50,000,002 pro forma shares prior to February 5, 2007 (IPO date)
Return on Average Equity includes deferred gain related to the LPT - equity in the ROE calculation is averaged for the period
(Pro forma)
(Pro forma)
(Pro forma)
17
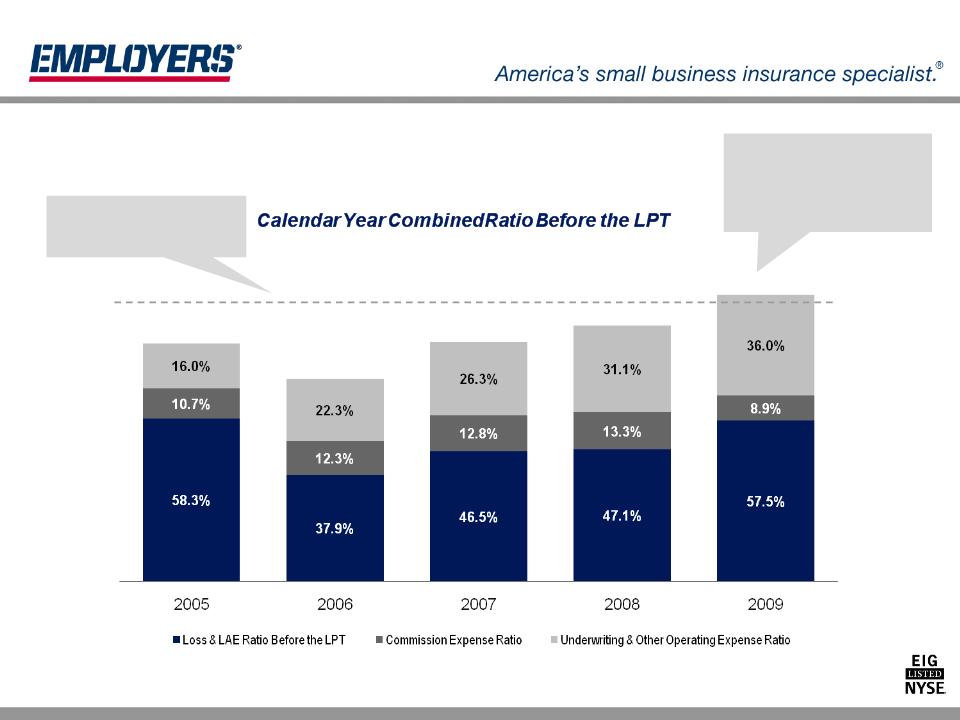
Consistently Profitable Underwriting
Underwriting model targets a
100% combined ratio and a 12-
13% return on a premium dollar
100% combined ratio and a 12-
13% return on a premium dollar
NOTE: LPT percentages include reserve adjustments
84.9%
72.6%
85.6%
(LPT is 10%)
(LPT is 4.9%)
91.5%
(LPT is 5.2%)
(LPT is 5.6%)
(LPT is 4.5%)
102.5%
Expense ratio includes 1.4 points of non-
recurring integration costs . The policyholder
dividend ratio was 1.7 points versus 0.4 last
year. LPT contingent profit commission of
$15 million lowered commission expense
ratio by 3.7 points.
recurring integration costs . The policyholder
dividend ratio was 1.7 points versus 0.4 last
year. LPT contingent profit commission of
$15 million lowered commission expense
ratio by 3.7 points.
18
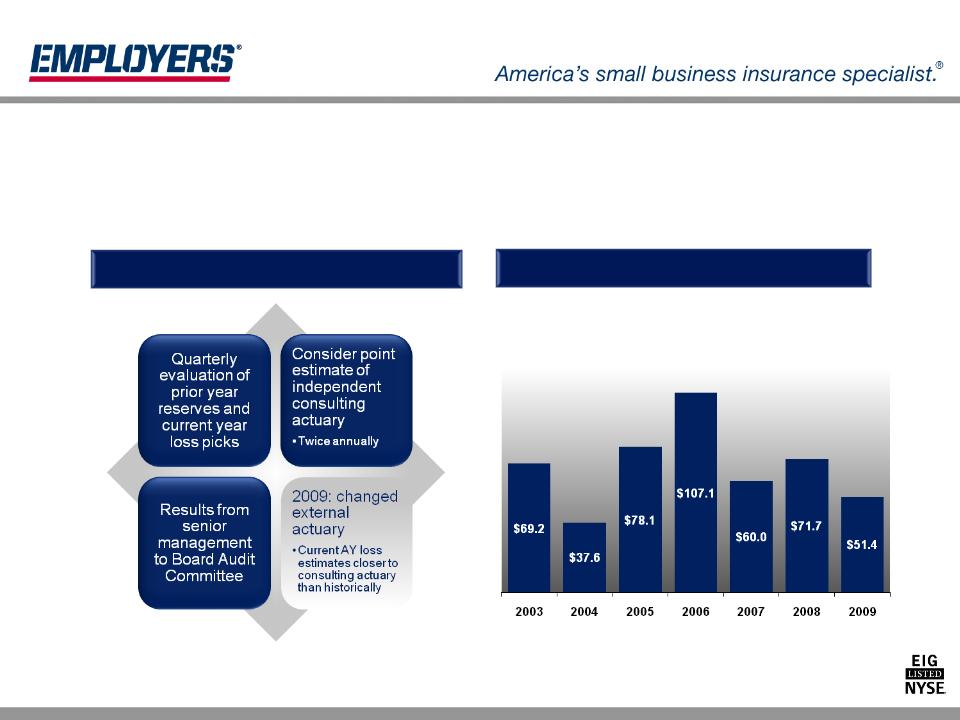
History of Reserve Strength
Reserve Review
Reserve Development
Net reserves for workers’ comp industry estimated to be deficient by $6 Billion at 12/31/08 (1)
(1) NCCI, “2009 State of the Line”
Net Calendar Year Reserve Releases for
Prior Accident Years ($ million)
Prior Accident Years ($ million)
19
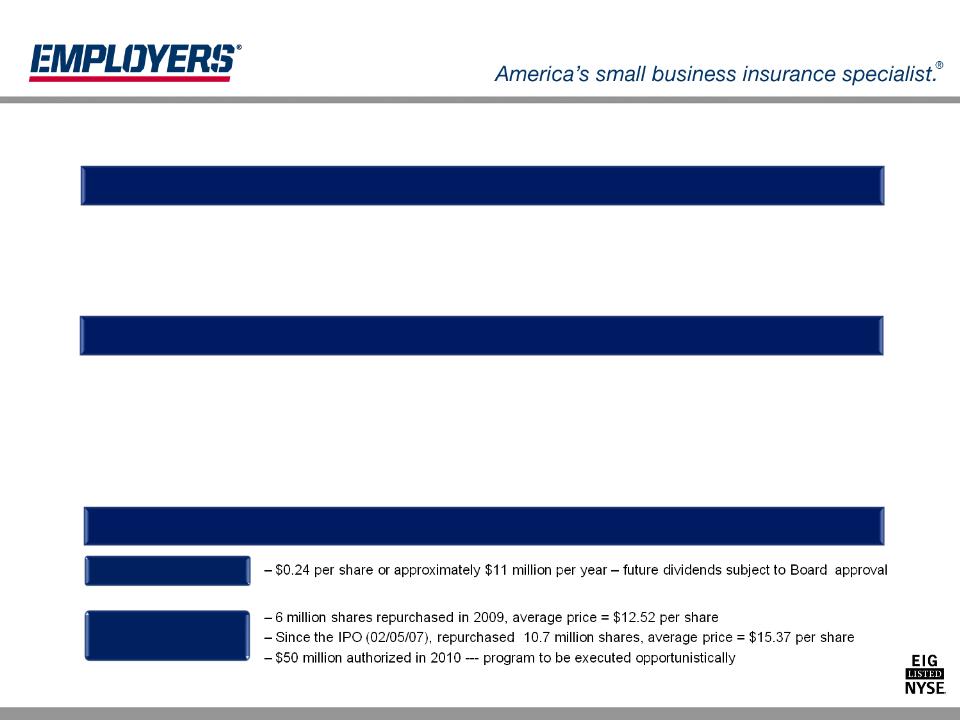
Prudent Capital Management
Share
Repurchases
Repurchases
Investing in the Future
Returning Capital to Shareholders
Holding Company Flexibility at 12/31/09
• Debt ratio - 15%
– Wells Fargo Secured Credit Facility - $100 million remaining
– $32 million of acquired surplus notes
• $197 million in cash and securities (two thirds tied to Wells Fargo Credit Facility)
• Ordinary dividend capacity from operating companies in 2010 - $114.5 million
• Generating capital to invest in operations/securities
• Deploying capital - opportunistic acquisitions
– Acquired AmCOMP (October, 2008) - equity value $189 million with expected savings of $20 - $22 million in 2010
• Controlling costs
– Generally flat Q 4 expenses excluding integration/restructuring
– Extensive budget review with staff reductions in 2009 and 2010 (acquisition savings, consolidation and recognized
efficiencies)
efficiencies)
Dividends
20
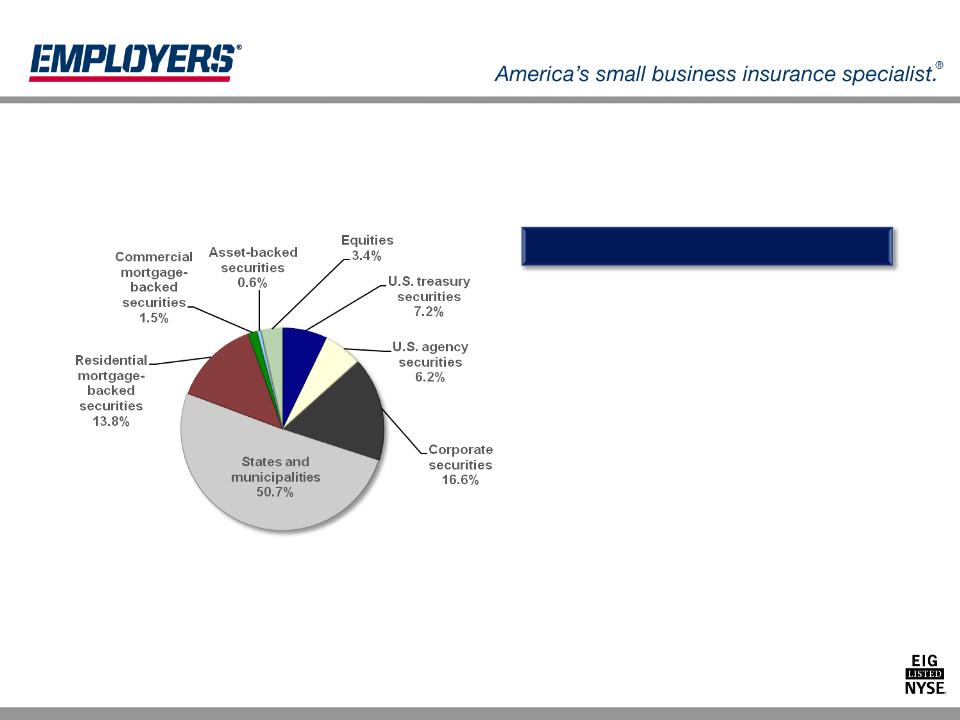
• 97% fixed maturities with an average
weighted AA+ rating
weighted AA+ rating
• Average book yield of 4.5%
• Tax equivalent book yield of 5.6%
• Effective duration of 5.02
• Managed by Conning Asset Management
• Minimal impacts during challenging
markets
markets
– 2009 OTTI of $1.9 million
– 2008 OTTI of $12.7 million
High Quality Investment Portfolio
Portfolio at 12/31/09
$2.0 billion fair market value

21
High Quality Reinsurance
Program Structure, Effective 7/1/09
Reinsurance Management
Reinsurers by Market

22
Summary of Financial Strength
Strong
Underwriting
Leverage
Conservative
Reserving
Reserving
High Quality
Investment
Portfolio
Investment
Portfolio
Catastrophe
Reinsurance
Program
Reinsurance
Program
.6 to 1 NPW to
Surplus at
12/31/09
Surplus at
12/31/09
$2 billion - 97%
invested in fixed
maturity with average
weighted rating of AA+
invested in fixed
maturity with average
weighted rating of AA+
Track record of
reserve strength:
since IPO, $183
million favorable
prior AY reserve
development as of
12/31/09
reserve strength:
since IPO, $183
million favorable
prior AY reserve
development as of
12/31/09
Coverage up to
$200 M loss
$200 M loss

23
Key Strengths
• Strong underwriting franchise with established presence in attractive
markets
markets
– 97 year operating history - attractive, underserved target market segment with growth
opportunities
opportunities
• Unique, long-standing strategic distribution relationships
• Conservative risk profile and prudent capital management
• Strong financial position and strong balance sheet
– rated A- by A.M. Best
• Experienced management team with deep knowledge of workers’
compensation
compensation
– average 27 years experience with the ability to manage through challenging operating
conditions
conditions

24
Douglas D. Dirks
President & Chief Executive Officer
Employers Holdings, Inc.
William E. (Ric) Yocke
Chief Financial Officer
Employers Holdings, Inc.
President & Chief Executive Officer
Employers Holdings, Inc.
William E. (Ric) Yocke
Chief Financial Officer
Employers Holdings, Inc.
Analyst Contact:
Vicki Erickson
Vice President, Investor Relations
Employers Holdings, Inc.
(775) 327-2794
verickson@employers.com
Vicki Erickson
Vice President, Investor Relations
Employers Holdings, Inc.
(775) 327-2794
verickson@employers.com
10375 Professional Circle
Reno, NV 89521
(775) 327-2700
Reno, NV 89521
(775) 327-2700
25
Stock Ownership Limitations
As a reminder to investors, Employers Holdings, Inc. (“EIG”) owns several insurance companies, domiciled in several
different states. These wholly-owned insurers are regulated by insurance commissioners and are subject to the statutes and
regulations of the various states where they are domiciled and authorized to transact insurance. As a result, EIG has the
following stock ownership limitations, which must be satisfied prior to certain stock transactions.
●For a period of five years following the effective date of the Plan of Conversion of EIG, which is February 5, 2007, no
person may directly or indirectly acquire or offer to acquire in any manner beneficial ownership of 5% or more of any class of
EIG’s voting securities without the prior approval by the Nevada Commissioner of Insurance of an application for acquisition
under Section 693A.500 of the Nevada Revised Statutes.
●Under Nevada insurance law, the Nevada Commissioner of Insurance may not approve an application for such acquisition
unless the Commissioner finds that (1) the acquisition will not frustrate the plan of conversion as approved by our members
and the Commissioner, (2) the board of directors of Employers Insurance Company of Nevada has approved the acquisition
or extraordinary circumstances not contemplated in the plan of conversion have arisen which would warrant approval of the
acquisition, and (3) the acquisition is consistent with the purpose of relevant Nevada insurance statutes to permit
conversions on terms and conditions that are fair and equitable to the members eligible to receive consideration.
●Furthermore, any person or entity who individually or together with an affiliate (as defined by applicable law) seeks to
directly or indirectly acquire in any manner, at any time, beneficial ownership of 5% or more of any class of EIG’s voting
securities, will be subject to certain requirements, including the prior approval of the proposed acquisition by certain state
insurance regulators, depending upon the circumstances involved. Any such acquisition without prior satisfaction of
applicable regulatory requirements may be deemed void under state law.
Appendix
26
Organization
Employers Holdings, Inc.
Employers
Insurance
Company
Company
of Nevada
Employers
Compensation
Insurance
Company
Employers
Preferred
Insurance
Company
Company
Employers
Occupational
Health, Inc.
Employers
Assurance
Company
Elite
Insurance
Services
EIG Services,
Inc.
Inc.
Pinnacle
Benefits, Inc.
AmSERV,
Inc.
Employers Group, Inc.
27
|
Income Statement ($ million)
|
2005
|
2006
|
2007
|
2008
|
2009
|
|
Gross Written Premium
|
$ 451.4
|
$ 386.8
|
$ 351.8
|
$ 318.4
|
$ 379.9
|
|
Net Written Premium
|
432.5
|
372.2
|
339.7
|
308.3
|
368.3
|
|
Net Earned Premium
|
438.3
|
393.0
|
346.9
|
328.9
|
404.2
|
|
Net Investment Income
|
54.4
|
68.2
|
78.6
|
78.1
|
90.5
|
|
Net Income
|
137.6
|
171.6
|
120.3
|
101.8
|
83.0
|
|
Net Income Before LPT
|
93.8
|
152.2
|
102.2
|
83.4
|
65.0
|
|
Balance Sheet ($ million)
|
2005
|
2006
|
2007
|
2008
|
2009
|
|
Total Investments
|
$ 1,595.8
|
$ 1,715.7
|
$ 1,726.3
|
$ 2,042.9
|
$ 2,029.6
|
|
Cash and Cash Equivalents
|
61.1
|
80.0
|
149.7
|
202.9
|
191.6
|
|
Total Assets
|
3,188.8
|
3,266.8
|
3,264.3
|
3,825.1
|
3,676.7
|
|
Reserves for Loss and LAE
|
2,350.0
|
2,307.8
|
2,269.7
|
2,506.5
|
2,425.7
|
|
Shareholders’ Equity
|
144.6
|
303.8
|
379.5
|
444.7
|
498.4
|
|
Equity Including LPT Deferred Gain
|
607.0
|
746.8
|
804.5
|
851.3
|
887.0
|
Selected Operating Results
28
Regional, Pricing Trends 09/30/09 thru 04/01/10
ME
NY
NH
MA
CT
VT
NJ
RI
KY
OH
IN
MO
IA
MN
IL
MIDWEST
KS
NE
SD
ND
NM
TX
OK
MT
WY
CO
UT
ID
AZ
NV
WESTERN
WA
CA
OR
PACIFIC
Corporate Headquarters
Regional Headquarters
MD
PA
VA
WV
NC
TN
AL
AR
LA
GA
MS
DC
SC
FL
SOUTHEAST
States Licensed, actively writing
States Licensed, not actively writing
% Employers Insurance Co of NV (EICN)
% Employers Comp Ins Company (ECIC)
% Employers Assurance Co (EAC)
% Employers Preferred Insurance Co (EPIC)
+3.0%
-7.4%
-4.2%
-9.7%
-2.6%
-18.8%
-0.1%
-24.5%
+7.0%
-6.8%
-6.8%
-6.8%
-6.7%
-37.4%
+2.3%
-28.7%
+22.0%
-6.1%
-27.0%
-29.8%
+3.7%
-14.3%
+14.2%
-28.1%
-19.1%
-28.3%
+4.4%
-37.8%
-13.7%
-1.1%
-1.3%
-34.7%
+2.2%
-42.1%
-9.6%
-9.6%
+5.8%
-32.6%
-21.2%
-10.0%
-2.8%
+0.4%
+0.4%
-4.2%
-7.6%
-7.5%
+6.2%
-28.1%
-5.8%
-5.8%
+8.7%
-24.1%
-0.1%
-0.1%