Attached files
Table of Contents
UNITED STATES
SECURITIES AND EXCHANGE COMMISSION
Washington, D.C. 20549
FORM 10-K
(Mark One)
| x | ANNUAL REPORT UNDER SECTION 13 OR 15(d) OF THE SECURITIES EXCHANGE ACT OF 1934 |
For the fiscal year ended December 31, 2009
or
| ¨ | TRANSITION REPORT UNDER SECTION 13 OR 15(d) of the SECURITIES EXCHANGE ACT OF 1934 |
For the Transition Period from to
Commission File No. 001-34052
DayStar Technologies, Inc.
(Exact name of registrant as specified in its charter)
| Delaware | 84-1390053 | |
| (State or other jurisdiction of Incorporation or organization) |
(I.R.S. Employer Identification No.) | |
| 2972 Stender Way Santa Clara, California |
95054 | |
| (Address of principal executive offices) | (Zip Code) | |
(408) 907-4600
(Registrant’s telephone number, including area code)
Securities registered under Section 12(b) of the Exchange Act:
| Title of each class |
Name of each exchange on which registered | |
| Common Stock, $.01 par value per share | The NASDAQ Capital Market |
Securities registered under Section 12(g) of the Exchange Act: None
Indicate by check mark if the registrant is a well-known seasoned issuer, as defined in Rule 405 of the Securities Act. Yes ¨ No x
Indicate by check mark if the registrant is not required to file reports pursuant to Section 13 or 15(d) of the Act. Yes ¨ No x
Indicate by check mark whether the registrant (1) has filed all reports required to be filed by Section 13 or 15(d) of the Securities Exchange Act of 1934 during the preceding 12 months (or for such shorter period that the registrant was required to file such reports), and (2) has been subject to such filing requirements for the past 90 days. Yes x No ¨
Indicate by check mark whether the registrant has submitted electronically and posted on its corporate Web site, if any, every Interactive Data File required to be submitted and posted pursuant to Rule 405 of Regulation S-T (§232.405 of this chapter) during the preceding 12 months (or for such shorter period that the registrant was required to submit and post such files). Yes ¨ No ¨
Indicate by check mark if disclosure of delinquent filers pursuant to Item 405 of Regulation S-K is not contained herein, and will not be contained, to the best of registrant’s knowledge, in definitive proxy or information statements incorporated by reference in Part III of this Form 10-K or any amendment to this Form 10-K. ¨
Indicate by check mark whether the registrant is a large accelerated filer, an accelerated filer, a non-accelerated filer or a smaller reporting company. See definitions of “large accelerated filer”, “accelerated filer” and “smaller reporting company” in Rule 12b-2 of the Exchange Act. (Check one):
| Large accelerated filer ¨ |
Accelerated filer ¨ | |
| Non-accelerated filer ¨ (Do not check if smaller reporting company) |
Smaller reporting company x |
Indicate by check mark whether the registrant is a shell company (as defined in Rule 12b-2 of the Exchange Act). Yes ¨ No x
As of June 30, 2009, the last business day of the registrant’s most recently completed second fiscal quarter, the aggregate market value of the registrant’s common stock held by non-affiliates was approximately $22,151,541, computed by reference to the last sale price of the common stock on that date as reported by The Nasdaq Capital Market and excludes an aggregate of 5,623,186 shares of the registrant’s common stock held by officers, directors and stockholders that the registrant has concluded are affiliates of the registrant. For purposes of determining whether a stockholder was an affiliate of the registrant at June 30, 2009, the registrant assumed that a stockholder was an affiliate of the registrant at June 30, 2009 if such stockholder (i) beneficially owned 5% or more of the registrant’s common stock, as determined based on public filings, and/or (ii) was an executive officer or director or was affiliated with an executive officer or director of the registrant at June 30, 2009. Exclusion of such shares should not be construed to indicate that any such person possesses the power, direct or indirect, to direct or cause the direction of the management or policies of the registrant or that such person is controlled by or under common control with the registrant.
As of March 15, 2010, there were 33,980,612 shares of the registrant’s common stock outstanding.
Table of Contents
Annual Report on Form 10-K
Year Ended December 31, 2009
Table of Contents
i
Table of Contents
CAUTIONARY NOTE REGARDING FORWARD-LOOKING STATEMENTS
This report contains forward-looking statements within the meaning of Section 21E of the Securities Exchange Act of 1934, as amended, and Section 27A of the Securities Act of 1933, as amended. Any statements contained in this report that are not statements of historical fact may be forward-looking statements. When we use the words “anticipates,” “plans,” “expects,” “believes,” “should,” “could,” “may,” “will” and similar expressions, we are identifying forward-looking statements. Forward-looking statements involve risks and uncertainties, which may cause our actual results, performance or achievements to be materially different from those expressed or implied by forward-looking statements. These factors include, among others, risks relating to our ability to raise additional funds in the near term to fund our expansion plan and continue our operations; risks related to the development of our copper indium gallium diselenide (“CIGS”) solar photovolatic (“PV”) products and manufacturing processes to produce such products; risks related to delivery of our products to customers, including product reliability, conversion efficiency, customer acceptance and product cost; market acceptance of CIGS; intense competition in the solar energy field; our history of losses; the historical volatility of our stock prices; general market conditions; and other factors referred to in Item 1A—“Risk Factors.”
Except as may be required by applicable law, we do not undertake or intend to update or revise our forward-looking statements, and we assume no obligation to update any forward-looking statements contained in this Annual Report as a result of new information or future events or developments. Thus, you should not assume that our silence over time means that actual events are bearing out as expressed or implied in such forward-looking statements that reflect our current expectations about our future results, performance, prospects and opportunities. You should carefully review and consider the various disclosures we make in this report and our other reports filed with the Securities and Exchange Commission that attempt to advise interested parties of the risks, uncertainties and other factors that may affect our business.
ii
Table of Contents
Overview
We have developed a proprietary thin film deposition technology for solar photovoltaic (“PV”) products. We utilize a proprietary one-step sputter deposition process and have manufactured a commercial scale deposition tool to apply high-efficiency copper indium gallium diselenide (“CIGS”) material over large area glass substrates in a continuous fashion. We intend to integrate this tool with commercially available thin film manufacturing equipment, which will provide us with a critically differentiated manufacturing process to produce low-cost monolithically integrated, CIGS-on-glass modules that address the grid-tied, ground-based PV market.
We believe this proprietary deposition process, when operated at an annual capacity of approximately 100 megawatts, will enable us to achieve a total module manufacturing cost of less than $1.00 per watt. This cost would be competitive with the lowest in the solar PV industry. Using this approach, we have achieved greater than 15% cell efficiencies over large areas on CIGS PV devices, and we believe that this approach will enable us to reach module efficiencies greater than 13%.
We have initiated construction of our initial module production line. To facilitate our entry into the addressable solar PV market, we have entered into a contract with Blitzstrom GmbH, one of the world’s leading thin film solar PV integrators, that commits Blitzstrom to purchase a minimum of 50% of our production through 2011, subject to these products meeting defined performance criteria. We have also signed a Letter of Intent with juwi Solar, who is interested in purchasing up to 25% of our production through 2011.
In October 2007, we completed a follow-on public offering in which we sold 17,250,000 shares of our common stock. Our net proceeds from the offering were approximately $68 million. We have used these proceeds to develop our proprietary deposition process, to build our prototype and commercial scale deposition tools, and to begin installation of our first production line. In the near term, we will require substantial funds beyond our current cash on hand in order to fully build-out our first production line, to commence and support commercial production as currently planned, to fund future operations, and to expand our capacity beyond our first production line.
Strategies
Our goal is to be a leading supplier of solar PV modules by becoming one of the lowest cost-per-watt commercial-scale solar manufacturers. We intend to pursue the following strategies to achieve this goal:
| • | Address the existing solar PV market using monolithic CIGS-on-glass. DayStar’s product strategy targets high-performance, low-cost CIGS-on-glass modules to meet the demands of the large and rapidly growing PV utility market. The CIGS module design is ‘plug-and-play’ compatible with the leading thin film PV module supplier. Utilizing approximately the same form factor, current-to-voltage ratio, weight and components used in existing panels will enable rapid market acceptance by providing compatibility with mounting, wire harnessing and logistics systems currently used in the market. We intend to address the significant unmet demand for solar PV modules by constructing module manufacturing lines using commercially available equipment in conjunction with our proprietary deposition tool to produce CIGS-on-glass modules. |
| • | Pursue strategic partnerships. The financial crisis has adversely affected the ability of companies such as DayStar to raise the capital required to develop its production capabilities. DayStar has embarked on a formal process to form strategic partnerships that will allow us to continue building our production line and assist in future expansions of production capacity. We have engaged a financial advisor to assist us in exploring select strategic transactions. |
1
Table of Contents
| • | Pursue customer relationships. We have a contract with Blitzstrom GmbH that commits Blitzstrom to purchase a minimum of 50% of our production through 2011, subject to these products meeting defined performance criteria. We will continue to work with other industry-leading strategic partners with similar needs and capabilities to generate future sales. We have also signed a Letter of Intent with juwi Solar, who is interested in purchasing up to 25% of our production through 2011. |
| • | Expand production capacity using replicable production facilities. Once we have demonstrated targeted operating metrics, we intend to add manufacturing equipment that would bring our first facility to a nameplate 100MW capacity. Further expansions would replicate the 100MW line in other locations. |
| • | Continue to reduce costs. We have identified specific steps in the manufacturing process that would allow us to reduce both the capital cost and operating cost of production. |
| • | Leverage management’s expertise in direct deposition manufacturing lines. Our management team has a proven track record of process development, production tool development and commercial-scale manufacturing. We plan to leverage their extensive experience in the semiconductor, solar and disk drive industries. We also have equipment engineering expertise in-house with experience in developing and building commercial-scale deposition tools. |
The Photovoltaic Industry
The worldwide demand for electricity is expected to almost double over the next two decades, from 18.0 trillion kilowatt hours in 2006 to 31.8 trillion kilowatt hours in 2030, according to the U.S. Energy Information Administration, or EIA. Additionally, the EIA expects that electricity demand in the United States will increase from 3.9 trillion kilowatt hours in 2006 to 4.8 trillion kilowatt hours in 2030. Historically, the electric power industry has relied on fossil fuels to generate electricity. However, continued reliance on fossil fuels to supply the expanding global demand for electricity creates a number of challenges, including the risks of escalating costs and uncertain supplies of fossil fuels, environmental ramifications of electricity generation from the burning of fossil fuels, escalating costs of new generation and transmission construction, aging generation plants and transmission infrastructure, regulatory impediments to electric infrastructure development and ongoing reliance on foreign sources for domestic energy. These challenges will likely result in escalating costs of wholesale and retail electricity rates.
To meet these challenges, governments, businesses and consumers increasingly support the development of alternative energy sources, such as solar power, to generate electricity. Various countries have enacted a wide variety of government incentives and mandates to encourage growth in renewable energy markets as providers of these alternative energy sources seek to match the price of traditional fossil fuel sources.
We project the global market for PV solar modules to have a 35% compound annual growth rate through 2012, increasing demand to approximately 12GW worldwide. We expect approximately 7.5GW of global demand in 2010. The high growth is largely driven by government policies, so the largest markets are located in Germany, Spain, Japan, the United States, and Italy where the incentives are most favorable. Although public support for solar subsidies appears to remain positive, the expectation of policy makers is that as the industry develops, costs decline so that solar electricity becomes competitive with conventional electricity sources. Achieving this ‘grid parity’ opens up a much larger market opportunity.
Photovoltaic Systems
The PV effect is the term used to describe the absorption of light and its conversion to electrical power by solar cells. Most commercial solar modules are made of the semiconductor material silicon and have a top and bottom electrical contact to move the electricity out of the solar cell. The functionality of solar cells is determined by its efficiency in converting sunlight into electricity. For every 1,000 watts of sunlight hitting a solar module, most are able to convert this into 60 to 180 watts of electricity.
2
Table of Contents
Solar modules usually consist of individual solar cells connected together, an encapsulant to protect against moisture and other environmental factors, and a sheet of glass for support. The individual solar cells do not require ongoing maintenance and have proven to last over 20 years. New and emerging thin film modules use very thin layers of semiconductor material, typically deposited on glass substrates, where the individual cells are connected through a monolithically integrated process during the deposition steps instead of assembled as individual cells. Solar PV systems are arrangements of solar PV modules connected to determine the total power output of the system. Energy is converted into direct-current, or DC, electricity when sunlight hits a solar PV module. The DC electricity may be routed directly to power a DC load or charge a battery bank. In grid-tied applications, an inverter is used to convert the DC electricity from the solar PV system into alternating current, or AC electricity, which can be interconnected directly to the electric utility grid to power AC appliances. In addition, solar PV systems usually have mounting structures, cable cords to route the power, and circuit protection.
The Cost and Operating Metrics of a PV System
Solar PV module manufacturers price and sell solar PV modules per watt of rated power. Rated power is the solar PV module’s capacity to produce electricity and is measured in watts. A solar PV system producing 2 kilowatts of power for 2 hours generates 4 kilowatt hours of electricity. According to the EIA, in 2001, the average U.S. household consumed approximately 10,656 kilowatt hours of electricity per year.
Cost of a PV System
To calculate the manufacturing cost per watt of a solar PV module, the cost to produce a solar module is divided by the number of sellable watts produced by the solar PV module. The efficiency of the solar PV module in converting sunlight into electricity determines the number of sellable watts. Efficiency is usually a function of the semiconductor material used in the conversion layer, the device structure and the manufacturing process. The semiconductor material generally used in the PV industry employs crystalline silicon technology or thin film technology. Crystalline silicon modules generally have higher conversion efficiencies than thin film solar modules but use approximately 100 times more semiconductor material and are more expensive than thin film production processes. Thin film solar modules manufactured at commercial scale can have a lower manufacturing cost per watt than crystalline silicon solar modules, even though crystalline silicon solar modules have higher conversion efficiencies.
Purchasers of solar PV modules consider not only the rated power but also the quantity of electricity that can be produced and the cost of that electricity. The cost per kilowatt hour of solar electricity is determined by dividing the solar electricity generated over the life of the solar PV system into the total cost of the system. Solar PV modules are usually 50% of the cost of a total solar PV system and have a general use life of approximately 25 years. The other 50% of the cost consists of the mounting structures, equipment and electrical components, known as the balance of system. In calculating the cost per kilowatt hour of solar electricity, many customers also consider the time value of the capital required to purchase and install the system. The price of conventional energy produced by fossil fuels varies considerably by geographic area based on several factors, including the cost of producing and importing energy. The 2009 average retail price of residential electricity in the United States was 11.5 cents per kWh (Source: DOE 2009 Data). To become competitive with traditional sources of electricity, the price per kilowatt hour of solar electricity must approach the retail price of traditional electricity displaced by solar electricity in a given area. Grid parity is therefore, a common objective among competing renewable technologies, with the goal for PV cost set by the United States Department of Energy’s Solar America Initiative to achieve 8-10 cents per kWh by 2015.
Operating Metrics of a PV System
The solar PV industry uses a widely accepted set of standard procedures and conditions known as Standard Test Conditions, to measure and compare the performance of solar modules. These conditions specify a standard temperature, solar irradiance level and angle of the sun, and are used to determine the rated power and conversion efficiency of a solar module.
3
Table of Contents
On a clear day, sunlight provides about 1 kilowatt of power per square meter of the Earth’s surface. Under these conditions, a solar PV module operating at a 10% conversion efficiency will produce 100 watts of power per square meter. If these sunlight conditions persist for one hour, the solar module will generate 100 watt hours, or 0.1 kilowatt hour, of solar electricity. Crystalline silicon solar PV modules had average conversion efficiencies of approximately 14% in 2006. Thin film solar modules in commercial production (2 GW per year in 2009) had average conversion efficiencies that ranged from approximately 6% to approximately 11%.
Solar PV systems generally operate outside of Standard Test Conditions. The location and design of a PV system, time of day and year, temperature and angle of the sun impact the performance of a solar PV system, including conversion efficiency. Therefore to determine the amount of solar electricity any one solar PV system will generate a user must consider not only the Standard Test Conditions power rating of a solar PV module, but also the real world conditions under which the solar PV system will be operating, the design of the solar PV system, and the performance of the solar PV modules and electrical components outside of Standard Test Conditions. Due to these variations, system sizing varies by design and location, but a system with a rated power of 8 to 11 kilowatts would typically be required to produce the 11,040 kWh (Source: DOE 2008 Data) consumed annually by the average U.S. household.
Solar module manufacturers compete with one another in several product performance attributes, including reliability, module cost per watt and levelized cost of electricity (LCOE), meaning the net present value of total life cycle costs of the solar power project divided by the quantity of energy which is expected to be produced over the system’s life.
Photovoltaic Technologies
There are several different semiconductor technologies used in the solar PV industry. Crystalline silicon, or c-Si, is the dominant technology with greater than 80% market share worldwide. PV modules made with thin films of semiconductors are being increasingly commercialized for use in all market segments.
Crystalline Silicon
Silicon based modules have defined the solar PV industry for the last 30 years, and their development has benefited from significant investment in the integrated circuit industry, which also primarily uses silicon wafers. Silicon PV modules are currently the most efficient solar PV semiconductor material, but require substantial electrical energy and bulk material to manufacture.
The various crystalline silicon solar panel manufacturing processes involve cutting refined, semiconductor-grade silicon ingots into solar wafers, connecting the wafers in series and packaging them into solar panels. From 2003 until 2009, growth in the market for crystalline silicon photovoltaic systems was negatively impacted by the limited availability of refined silicon, the basic feedstock used in their manufacture. High demand from the photovoltaic and microelectronics industries led to a global shortage of silicon, increasing the price of polysilicon, with the spot price of polysilicon climbing from $30 per kilogram, or kg, in 2003 to $463/kg in 2008, according to New Energy Finance. This price increase, combined with other technological factors, created challenges for crystalline silicon systems to produce electricity at a cost that is comparable to those of traditional fossil fuel sources. As manufacturers of silicon have increased factory capacity, prices for silicon have significantly decreased, though they are not back to previous lows. For example, in 2009 the weighted-average polysilicon long-term forward contract price was $78/kg, and the spot price for polysilicon was approximately $65/kg in October 2009, according to New Energy Finance.
4
Table of Contents
Thin Films
Solar cells and solar modules made from certain thin films of semiconductors require less raw material to produce than silicon based PV cells. Recent advances in manufacturing and product commercialization have increased worldwide production of thin film PV to approximately 17% of overall PV production in 2009. Thin film solar PV products typically exhibit the following attributes:
| • | Scalable, low cost manufacturing: Thin film solar PV cells and modules require a structural substrate to support them, such as glass, plastic or metal sheets or foils. Applying the films on these substrates creates a range of manufacturing options that enables continuous and scalable manufacturing. As much of the equipment to process these substrates is used in other industries, the relatively lower capital expenditure required to establish large-volume thin film PV product manufacturing plants enables rapid capacity expansion and lowers the cost per watt of products. |
| • | Lower overall material cost: Thin film PV production uses substantially less semiconductor materials than c-Si production. The result of less raw materials combined with inexpensive substrates and scalable manufacturing techniques have resulted in some thin film technologies achieving costs less than $1.00 per watt in 2008. |
| • | Configurable form factors: Based on the use of a variety of substrates, thin film PV modules can be configured into a number of different form factors to enable a variety of market applications. In particular, flexible thin film modules could enable a new range of products for unique building integrated photovoltaics (BIPV) applications. |
| • | Lower conversion efficiency: Thin film PV technologies are generally less efficient than modules made with c-Si. This attribute can potentially limit their use in area-constrained applications. However, thin film PV technologies do exhibit performance advantages in generating energy in low light level and increased temperature environments. This positions them particularly well for certain geographic applications. |
| • | Limited operating history: Limited operating history has inhibited market acceptance of several types of thin film products. Most thin film PV modules have not been fielded for the average warranty period of typical c-Si modules. |
There are three major thin film technologies in commercial production today:
| • | Amorphous Silicon, or a-Si, has been commercially produced for the longest period of time and has the lowest module conversion efficiency among the three major thin film technologies, but can be produced in a roll-to-roll flexible format, which is gaining popularity in emerging BIPV markets. Amorphous silicon modules were the first thin film module to demonstrate energy production advantages over conventional silicon modules in low or indirect light conditions. |
| • | Cadmium Telluride, or CdTe, has a higher conversion efficiency than a-Si and has demonstrated the lowest manufacturing costs to date, but is only produced in rigid and glass flat plate modules, which has made it most suitable for market segment applications to larger commercial and utility project market segments. |
| • | Copper Indium Gallium diSelenide, or CIGS, has achieved the highest conversion efficiency rates of thin film technologies, but is just now reaching commercial production. CIGS has the ability to be produced on rigid as well as flexible substrates, which enables CIGS products to be used in utility, commercial, residential and BIPV segments. |
Market Segments
The solar electricity industry currently supplies modules used in solar PV systems primarily for grid-connected systems. The off-grid application of PV for remote or developing nations is often cost effective, but the market is small. Grid-connected solar PV systems can supply electricity during daylight hours to offset peak
5
Table of Contents
load demand or displace consumers’ annual electricity consumption from traditional utility sources. Net-metering laws, which require utilities to purchase excess electricity produced by on-grid solar systems, and solar PV system capital and energy rebates are examples of government incentives aimed at grid-connected consumers in parts of the United States, Japan, Europe and elsewhere. Many consumers are seeking to reduce their future electricity costs by purchasing solar PV systems to hedge against future price increases. Government incentives are enabling adoption of PV in advance of the lower costs from new PV technologies, manufacturing economies of scale, and improved infrastructure.
Grid-Connected Markets
Markets for grid-connected PV include large centralized utility power plants (10-100 MW), commercial building roof tops (20kW-10MW), and smaller residential roof tops (1-20 kW).
| • | Centralized utility. PV modules are increasingly being used in large centralized installations with the solar generated electricity being sold directly to the local utility grid for distribution and resale, similar to other fossil fuel power plants. In these applications, the cost of the energy generated in dollars per kilowatt-hour (“$/ kW-hr”) is a more important market driver than other PV technology attributes, such as efficiency, shape, size and weight, or aesthetics. |
| • | Commercial rooftop. Solar PV systems are being installed on the roofs of commercial buildings to offset peak power requirements and lower electricity costs. By using otherwise vacant roof surfaces, businesses can sell their solar power during the day, coincident with typical high time-of-use utility rates. Both system economics ($/kW-hr) and system performance such as module efficiency are important solar PV product attributes in expanding this market. |
| • | Residential rooftop. Individual homeowners form one of the largest markets for grid-connected PV sales. In addition to system economics ($/kW-hr), the aesthetics of the products can play a role in a homeowner’s choice of product. |
Products
DayStar CIGS-on-glass module
We intend to commercialize a monolithically integrated CIGS-on-glass module to meet the demands of readily available solar PV markets. We are working with our customers and development partners to define the final product specifications consistent with their application requirements. Our current target is to produce monolithically integrated CIGS modules on 1.2 m by 0.6 m glass laminate substrates. They will be designed for high-voltage grid-connected utility and commercial market applications. They will be initially designed to meet industry International Electrotechnical Commission (IEC) certifications for distribution into European markets. We have achieved greater than 15% cell efficiencies over large areas on CIGS PV devices, and we believe that this approach will enable us to reach module efficiencies greater than 13% and associated peak power ratings. Other possible configurations may include UL Listing for U.S. sales and modules designed to meet the demands of large commercial rooftop applications in the U.S. market.
CIGS-on-foil for emerging market opportunities
We have suspended development of our CIGS-on-foil products. These discrete foil cells currently emulate 100 mm by 100 mm silicon wafer cells in form and function. They can be interconnected to build various module voltages depending on the needs of a particular market segment. However the packaging materials that would allow integration into flexible module form factors have not been developed so we have chosen to focus all our current efforts on the development of our CIGS-on-glass modules which we believe is the fastest path to commercialization of our products. If flexible encapsulants become available, we may re-start our development of flexible CIGS modules that could be suited to meet the needs of BIPV markets, where the module serves as a dual-use building material.
6
Table of Contents
Marketing and Distribution
We have an agreement with Blitzstrom GmbH through 2011, which requires Blitzstrom to purchase 50% of the solar PV modules we produce based upon our estimated production through 2011. Blitzstrom may also purchase up to 50% of any additional quantities of solar PV modules that exceed these production estimates. The price paid by Blitzstrom will be based on a five percent discount from the fair market wholesale value for comparable commercially available solar PV modules. We will negotiate further pricing with Blitzstrom for 2010 and 2011. We have also signed a Letter of Intent with juwi Solar, who is interested in purchasing up to 25% of our production through 2011.
The sale of commercial grid-connected solar PV systems, currently the largest market for thin film PV, is subject to direct and indirect regulation by state, federal and foreign governments. These regulations include rules governing energy transmission, safety, reliability, quality and incentives aimed at reducing carbon emissions or increasing renewable sources of energy. We are not directly impacted by these regulations at this point as we are focused on the sales of CIGS-on-glass modules through limited sales agreements with specific commercial system integrators, primarily in Europe.
Research, Development and Engineering
Our future success depends, in part, upon our ability to innovate processing methodologies that create enhanced product characteristics. In addition to optimization of CIGS deposition, we intend to develop processes for other layers in the cell stack that may lead to higher conversion efficiency and lower manufacturing costs.
Our manufacturing technology development roadmap focuses on reducing the cost per watt by reducing the number of steps in manufacturing the modules and by optimizing the materials and processes used in the non-CIGS layers. We have identified development programs for reducing the number of scribing steps needed in the module formation, and for an optimized buffer layer that requires lower capital and processing costs than our current methodology. Additionally, we intend to continue to scale up our proprietary deposition tool to enable production of larger modules with better material usage.
Research and development expenses were $14.7 million for the year ended December 31, 2009 and $17.7 million for the year ended December 31, 2008.
Manufacturing
Our strategy for developing the production line is to focus our development efforts on our proprietary direct deposition sputtering tool, which we believe is critical to making large quantities of CIGS at low costs. Our proprietary deposition tool is custom designed and built. We developed a process that we believe is scalable and allows for continuous processing of high volumes of modules. Most of the tools required in the manufacturing line are commercially available. We have ordered and placed down payments on the remaining equipment required to complete the manufacturing line. Most of this equipment is complete and ready to be shipped to our facility upon completion of final payment.
7
Table of Contents
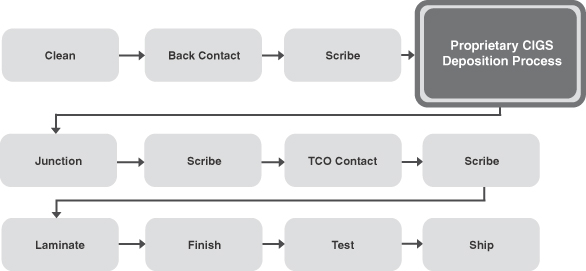
Our manufacturing process for making CIGS modules, which is depicted below, begins with a cleaning step for the glass substrate followed by a sputter deposition of the back contact material. The back contact is scribed to form the initial cell structure, and then the CIGS deposition is accomplished with our proprietary deposition process. The junction partner is deposited on top of the CIGS layer, and the second scribe is accomplished before the final transparent conductive oxide coating is deposited. The monolithic cell structure is completed with the third scribe, a polymer laminate is laid down and the encapsulating glass sheet is bonded to the substrate glass. Electrical leads and junction boxes are added at the finishing step. The completed module is tested and binned by performance.
Raw Materials and Equipment Suppliers
In our manufacturing process, we use several raw materials and components to build our solar PV modules on commercially available processing and automation equipment. We plan to have several suppliers of these materials, components and equipment. Each supplier will undergo a qualification process which may take several months depending on the particular raw material, component or equipment type.
Competition
We expect our primary competition will continue to be from conventional silicon-based solar PV products. Within the solar PV industry, conventional c-Si solar PV manufacturers dominate the market and ultimately create the most competition for our products. In addition, a variety of thin film solar PV technologies are being developed by a number of established and emerging companies. Thin film technologies include amorphous silicon, cadmium telluride and CIGS as well as advanced concepts for both bulk ingot-based and thin film crystalline silicon. These competing technologies may achieve manufacturing costs per watt lower than the cost per watt to manufacture our CIGS solar PV modules.
A number of companies are actively engaged in developing, manufacturing and marketing conventional silicon PV products on a commercial scale. The largest silicon PV suppliers include Suntech, Q-Cells, Sharp Corporation, and Kyocera Corporation, which together supplied one third of the 2009 solar PV market. We believe we will compete favorably with these suppliers on the basis of cost and module efficiencies.
The largest thin film solar PV manufacturer today is First Solar, Inc., which is producing a monolithic cadmium telluride module on a commercial scale and at the industry’s lowest reported costs. In addition, there are a number of smaller thin film manufacturers focusing on cadmium telluride. In amorphous silicon
8
Table of Contents
technologies, there are companies such as Uni-Solar and Sharp pursuing in-house developed technologies, and a number of companies are purchasing turn-key systems from equipment suppliers such as Applied Materials and Oerlikon. CIGS solar PV manufacturers can be subdivided into those that have achieved commercial-scale manufacturing, those that have recently entered the market with limited capacity, and those that are still in development stage. Among commercial-scale manufacturers are Avancis GmbH & Co. KG (a joint venture between the former Shell Solar and St. Gobain, a manufacturer of glass), Würth Solar of Germany, Honda Soltec (a subsidiary of Honda Motor Co., Ltd. ), and Showa-Shell who all manufacture monolithic CIGS modules. New entrants with limited capacity, which came on line at the end of 2008, include Solibro (a subsidiary of Q-Cells), Sulfurcell, Global Solar, and Solyndra. There are several small companies that have announced plans to produce CIGS modules including Ascent Solar, Miasolé, HelioVolt, Nanosolar, Johanna Solar, and SoloPower.
Intellectual Property
Our success depends, in part, on our ability to maintain and protect our proprietary technology and to conduct our business without infringing on the proprietary rights of others. We rely primarily on a combination of patents, trademarks, copyrights and trade secrets, as well as employee and third party confidentiality agreements to safeguard our intellectual property. Our intellectual property consists of our proprietary deposition process and our related tool set designs.
Employees
As of February 28, 2010, we had 41 employees, including 39 full-time and two part-time employees. From time to time we employ individuals, primarily manufacturing personnel, through employment agencies. None of our employees are covered by collective bargaining agreements with us. We believe our relations with employees are good.
Corporate Information
DayStar Technologies, Inc., a Delaware corporation, was incorporated in February 1997. We completed our initial public offering in February 2004. Our principal executive offices are located at 2972 Stender Way, Santa Clara, California 95054, and our telephone number is (408) 907-4600. Our website is located at www.daystartech.com. The information available on or that can be accessed through our website is not incorporated by reference into and is not a part of this Annual Report on Form 10-K and should not be considered to be part of this report.
Availability of Information
We make available through our website (http://www.daystartech.com), free of charge, our Annual Reports on Form 10-K, Quarterly Reports on Form 10-Q, Current Reports on Form 8-K, and amendments to those reports, filed or furnished pursuant to Section 13(a) or 15(d) of the Securities Exchange Act of 1934, as amended, as soon as reasonably practicable after such reports are electronically filed with, or furnished to, the Commission.
The public may read and copy any materials we file with the Commission at the Commission’s Public Reference Room at 450 Fifth Street, NW, Washington, DC 20549. The public may obtain information on the operation of the Public Reference Room by calling the Commission at 1-800-SEC-0330. DayStar files electronically with the Commission and the Commission maintains an Internet site (http://www.sec.gov) that contains reports, proxy and information statements, and other information regarding issuers that file electronically with the Commission.
9
Table of Contents
You should carefully consider the risks, uncertainties and other factors described below because they could materially and adversely affect our business, financial condition, operating results and prospects and could negatively affect the market price of our common stock. Also, you should be aware that the risks and uncertainties described below are not the only ones facing us. Additional risks and uncertainties that we do not yet know of, or that we currently believe are immaterial, may also impair our business operations and financial results. Our business, financial condition or results of operations could be harmed by any of these risks. The trading price of our common stock could decline due to any of these risks, and you may lose all or part of your investment.
In assessing these risks, you should also refer to the other information contained in or incorporated by reference to this Annual Report on Form 10-K, including our financial statements and the related footnotes.
In order to continue operations, we require immediate and substantial additional capital beyond our current cash on hand.
In order to continue operations, including development efforts utilizing our pre-production line, build-out our initial manufacturing line and commencement of commercial shipments of our product, we require immediate and substantial additional capital beyond our current cash on hand. To date, we have been unable to raise significant additional capital or complete an agreement with an investor or strategic partner. Although we continue to seek strategic investors or partners, in light of our current cash position, we have implemented a significant reduction in our workforce during 2009 and may in the near term be forced to cease or substantially curtail operations. An inability to raise additional funding in the very near term may cause us to file a voluntary petition for reorganization under the United States Bankruptcy Code, liquidate assets, and/or pursue other such actions that could adversely affect future operations.
Our independent auditor’s report expresses doubt about our ability to continue as a going concern, which may make it more difficult and expensive for us to raise additional capital.
The report of our independent registered public accounting firm relating to our financial statements as of December 31, 2009 and for the year then ended, stated that there is substantial doubt about our ability to continue as a going concern. Our ability to continue as a going concern is dependent upon our ability to take advantage of raising capital through securities offerings, debt financing, or partnerships. Management is focusing on raising capital through any one or more of these options. Such opinion from our outside auditors may make it more difficult and expensive to for us to raise additional capital. If we are unable to obtain such financing we may not be able to continue our operations, which would have an adverse effect on our stock price and significantly impair our prospects. There can be no assurance that any of management’s plans will be successfully implemented.
We have incurred net losses since our inception and anticipate continued net losses as we execute our commercialization plan.
Since our inception, we have incurred net losses, including net losses of $25.0 million and $26.3 million for the years ended December 31, 2009 and 2008, respectively, and have incurred negative cash flows from operations. As a result of ongoing losses, we had an accumulated deficit of approximately $122.0 million as of December 31, 2009. We expect to continue to incur significant losses as we enter commercialization and expand our manufacturing capacity and may never achieve or maintain profitability. We expect to continue to make significant capital expenditures and anticipate that our expenses will increase to the extent we continue to develop our manufacturing technologies, build manufacturing lines, establish our sales and distribution network, implement internal systems and infrastructure and hire additional personnel.
10
Table of Contents
As we do not expect to become profitable until after we expand capacity beyond our initial manufacturing line, if ever, we will be unable to satisfy our obligations solely from cash generated from operations. If, for any reason, we are unable to make required payments under our obligations, one or more of our creditors may take action to collect their debts. If we continue to incur substantial losses and are unable to secure additional financing, we could be forced to discontinue or curtail our business operations; sell assets at unfavorable prices; refinance existing debt obligations on terms unfavorable to us; or merge, consolidate or combine with a company with greater financial resources in a transaction that may be unfavorable to us.
Current and future litigation against us may be costly and time consuming to defend, and the outcome of current litigation could affect our ability to operate at our Newark, California location.
We are sometimes subject to legal proceedings and claims that arise in the course of our business. Litigation may result in substantial costs and may divert management’s attention and resources, which may seriously harm our business, overall financial condition, and operating results. In addition, legal claims that have not yet been asserted against us may be asserted in the future. See Item 3 “Legal Proceedings” of this Annual Report on Form 10-K for further information regarding pending litigation.
As described in Item 3 “Legal Proceedings” of this Annual Report on Form 10-K, on September 9, 2009, BMR-Gateway Blvd., LLC (the “Landlord”), filed an unlawful detainer action against us alleging damages in the amount of $838,078 and seeking to recover possession of the premises we occupy at our Newark, California location. In December 2009, we negotiated a settlement in that action. We have until June 1, 2010, to cure all alleged defaults under the lease (which the Landlord alleges include failure to pay rent and failure to remove various mechanic’s liens recorded against the property), provided the Landlord has not delivered us a 15-day notice of its intention to terminate the Lease (the “Termination Notice”). If the Landlord provides us with a Termination Notice, we must vacate the premises within 30 days from the date of the Termination Notice. If we are forced to vacate those premises, we could incur substantial costs to relocate to a new facility and lose valuable research and development time to facilitate starting up the new manufacturing line.
The lease for our Santa Clara facility ends on March 31, 2010. If we are unable to extend that lease, we will have to relocate our research and development activities which could cause delays in our current product development plans.
As previously reported, the lease for our Santa Clara research and development center and corporate headquarters ends on March 31, 2010. We are currently seeking either an extension of that lease or an alternative location for these activities. However, at this time we do not believe the landlord will grant us an extension. If we cannot successfully negotiate an extension of our current lease or timely find an alternate location, we may have to temporarily cease our development efforts until we find a new location for these activities.
Our common stock may be delisted from the Nasdaq Capital Market.
On September 15, 2009, we received notice from the Listing Qualifications Department of the Nasdaq Stock Market indicating that, for the last 30 consecutive business days, the bid price for our common stock had closed below the minimum $1.00 per share requirement for continued inclusion on the Nasdaq Capital Market under Nasdaq Listing Rule 5450(a)(1). The notification letter states that we will be afforded 180 calendar days, or until March 15, 2010, to regain compliance with the minimum bid price requirement. In order to regain compliance, shares of our common stock must maintain a minimum bid closing price of at least $1.00 per share for a minimum of ten consecutive business days. On March 16, 2010, Nasdaq provided written notification to us that our common stock failed to meet the continued listing requirements. We already had an appeal scheduled for a delisting notice related to our failure to hold an annual meeting in 2009 and in that hearing on March 11, 2010 addressed a plan of compliance for both the failure to hold an annual meeting and the anticipated receipt of the delisting notice related to the minimum bid price requirement. We expect to hear from the Nasdaq hearings panel regarding our proposed plan of compliance approximately 30 to 45 days after our hearing date. There can be no assurance that our plan will be deemed acceptable and that we will be able to maintain our Nasdaq listing.
11
Table of Contents
The delisting of our common stock would adversely affect the market liquidity for our common stock, the per share price of our common stock and impair our ability to raise capital that may be needed for future operations. Delisting from the Nasdaq Capital Market could also have other negative results, including, without limitation, the potential loss of confidence by customers and employees, the loss of institutional investor interest and fewer business development opportunities. If our common stock is not eligible for quotation on another market or exchange, trading of our common stock could be conducted in the over-the-counter market or on an electronic bulletin board established for unlisted securities such as the Pink Sheets or the OTC Bulletin Board. In such event, it could become more difficult to dispose of, or obtain accurate quotations for the price of our common stock, and there would likely also be a reduction in our coverage by security analysts and the news media, which could cause the price of our common stock to decline further.
Reduced growth in or the reduction, elimination or expiration of government subsidies, economic incentives and other support for on-grid solar electricity applications could reduce demand for our solar modules, and adversely impact our operating results.
We believe that the near-term growth of the market for on-grid applications, where solar energy is used to supplement the electricity a consumer purchases from the utility network, depends significantly on the availability and size of government subsidies and economic incentives. Federal, state and local governmental bodies in many countries, most notably Germany, Italy, Spain, France, the United States, Canada, China, India, Australia, Greece and Portugal have provided subsidies in the form of feed-in tariffs, rebates, tax incentives and other incentives to end-users, distributors, systems integrators and manufacturers of photovoltaic products. Many of these jurisdictions, including the majority of U.S. states and numerous European Union countries, have adopted renewable portfolio standards in which the government requires jurisdictions or regulated utilities to supply a portion of their total electricity from specified sources of renewable energy, such as solar, wind and hydroelectric power. Many of these government incentives expire, phase out over time, require renewal by the applicable authority or may be amended. A summary of recent developments in some of the major government subsidy programs follows. We expect the feed-in tariff in Germany and certain other core markets to be reduced earlier than previously expected, and such reductions could reduce demand and/or price levels for our solar modules.
German feed-in tariffs will be adjusted earlier than previously expected, and any downwards adjustment could reduce demand for our solar modules. Currently, our initial customers are in Germany and thus recently proposed changes to German feed-in tariffs could significantly impact the demand for our solar modules and the results of our future operations. A reduction in the PV feed-in tariff is currently under discussion and will most likely come into effect in the second or third quarter of 2010. The amount of the FiT reductions are expected to vary among roof-mounted applications, non-agricultural land free field applications and agricultural land free field applications. A significant reduction in the FiT for agricultural land free field applications in particular would likely cause a significant decline in demand for PV solar systems on agricultural land in Germany and contribute to a migration toward roof mounted applications and non-agricultural land free field applications. Overall, reductions in the German feed-in tariffs, including any potential further reductions, could result in a significant decline in demand and price levels for photovoltaic products in Germany, which could have a material adverse effect on our business, financial condition or results of operations.
In France, a new decree effective January 2010 provides for lower feed-in tariffs for all applications (including, as in Germany, varying reductions for rooftop applications and free field applications) while introducing, among other things, a departmental bonus which makes free field projects in the northern regions of France more attractive. The new decree does not have an expiry date, but can be amended at any time.
In Italy, the current legislation provides that the existing feed-in tariff will be in effect until the expiration of a 14 month transition period that will begin once 1.2GW of photovoltaic systems are installed under the existing feed-in tariff. It is expected that the Italian government will propose and enact a new feed-in tariff before the end of 2010. Current proposals reflect significant FiT reductions, particularly for ground mounted applications. We cannot be certain of the level of such new feed-in tariff.
12
Table of Contents
In Spain, the current legislation is scheduled to be reviewed by January 1, 2012; however, an earlier FiT adjustment is possible.
In the United States, California has been the state where the majority of solar installations and solar power module and system sales have taken place during the past five years. The state of California’s RPS goal of 33% of electricity from renewable sources by 2020, currently in the form of an executive order from the Governor’s office, is the most significant RPS program in the United States in magnitude and is contributing to the expansion of the utility-scale solar systems market in that state. However, the continued effectiveness of this RPS program could be negatively impacted if the RPS goal is not passed by the CA legislature and signed into law.
The American Recovery and Reinvestment Act of 2009 provides for certain measures intended to benefit on-grid solar electricity generation and other renewable energy initiatives, including (1) a cash grant in lieu of the 30% federal investment tax credit for solar installations that are placed into service during 2009 and 2010 or that begin construction prior to December 31, 2010 and are placed into service by January 1, 2017, and (2) a 50% bonus depreciation for installations placed in service during 2009. Various legislation has been proposed to extend or enhance the 30% grant in lieu of the tax credit as well as bonus depreciation. However, enactment of the extension or enhancement of such incentives is highly uncertain. The failure to extend or enhance these programs may reduce tax equity availability (in the case of the grant expiration) which may adversely affect our ability to arrange financing for utility-scale projects and may otherwise adversely affect the attractiveness of the U.S. solar market.
In China, governmental authorities have not adopted a feed-in tariff policy and currently award solar projects through either a project tendering process or bi-lateral negotiations. While the solar industry generally anticipates that China will adopt a solar feed-in tariff, there is no guarantee this will occur in a timely manner or at all or that any feed-in tariff will be economically viable. Without a feed-in tariff, the size and attractiveness of China’s solar market may be limited.
In Australia, the large-scale solar industry is in its infancy, and despite several encouraging government funded initiatives to promote large-scale solar generation, it is uncertain whether such programs can be successfully executed.
In 2009, India announced its National Solar Mission, which includes a goal of installing 20GW of solar by 2022. India is expected to announce a feed-in tariff for the first phase of the National Solar Mission in 2010. There is no guarantee that India will maintain its current 20GW by 2022 goal or adopt the required policies to meet that goal, without which, the size and attractiveness of India’s solar market may be limited.
Emerging subsidy programs may require an extended period of time to attain effectiveness because the applicable permitting and grid connection processes associated with these programs can be lengthy and administratively burdensome.
Electric utility companies or generators of electricity from fossil fuels or other renewable energy sources could also lobby for a change in the relevant legislation in their markets to protect their revenue streams.
Reduced growth in or the reduction, elimination or expiration of government subsidies and economic incentives for on-grid solar energy applications, especially those in our target markets, could materially and adversely affect our business, financial condition and results of operations.
Existing regulations and policies and changes to these regulations and policies may present technical, regulatory and economic barriers to the purchase and use of solar PV products, which may significantly reduce demand for our solar modules.
The market for electricity generation products is heavily influenced by foreign, federal, state and local government regulations and policies concerning the electric utility industry, as well as policies promulgated by electric utilities. These regulations and policies often relate to electricity pricing and technical interconnection of
13
Table of Contents
customer-owned electricity generation. In the United States and in a number of other countries, these regulations and policies have been modified in the past and may be modified again in the future. These regulations and policies could deter end-user purchases of photovoltaic products and investment in the research and development of photovoltaic technology. For example, without a mandated regulatory exception for photovoltaic systems, utility customers are often charged interconnection or standby fees for putting distributed power generation on the electric utility grid. If these interconnection standby fees were applicable to PV systems, it is likely that they would increase the cost to our end-users of using PV systems which could make them less desirable, thereby harming our business, prospects, results of operations and financial condition. In addition, electricity generated by PV systems mostly competes with expensive peak hour electricity, rather than the less expensive average price of electricity. Modifications to the peak hour pricing policies of utilities, such as to a flat rate for all times of the day, would require PV systems to achieve lower prices in order to compete with the price of electricity from other sources.
We anticipate that our solar modules and their installation will be subject to oversight and regulation in accordance with national and local ordinances relating to building codes, safety, environmental protection, utility interconnection and metering and related matters. It is difficult to track the requirements of individual states and design equipment to comply with the varying standards. Any new government regulations or utility policies pertaining to our solar modules may result in significant additional expenses to us, our resellers and their customers and, as a result, could cause a significant reduction in demand for our solar modules.
An increase in interest rates or lending rates or tightening of the supply of capital in the global financial markets could make it difficult for end-users to finance the cost of a PV system and could reduce the demand for our solar modules and/or lead to a reduction in the average selling price for photovoltaic modules.
Many potential end-users of our products depend on debt financing to fund the initial capital expenditure required to purchase and install a PV system. As a result, an increase in interest rates or lending rates could make it difficult for our end-users to secure the financing necessary to purchase and install a PV system on favorable terms, or at all and thus lower demand for our solar modules. Due to the overall economic outlook, our end-users may change their decision or change the timing of their decision to purchase and install a PV system. In addition, we believe that a significant percentage of our potential end-users install PV systems as an investment, funding the initial capital expenditure through a combination of equity and debt. An increase in interest rates and/or lending rates could lower an investor’s return on investment in a PV system, or make alternative investments more attractive relative to PV systems, and, in each case, could cause these end-users to seek alternative investments. A reduction in the supply of project debt financing or tax equity investments could reduce the number of solar projects that receive financing and thus lower demand for solar modules.
We are a development company, have not generated any revenue from operations and currently have no commercial products.
We have not generated any revenue from operations and currently have no commercial products. Commercializing our products depends on a number of factors, including the following:
| • | successfully scaling up and implementing our first commercial-scale CIGS sputter deposition tool; |
| • | completing the build-out of our initial production line; and |
| • | completing, refining and managing our supply chain and distribution channel. |
The completion of these tasks as necessary to commence commercialization will require significant additional funding. In addition, our technology uses our proprietary deposition process, and there may be technical barriers to the development of our products and processes. Development of tools and our manufacturing processes may not succeed or may be significantly delayed. Our products will be produced through a manufacturing process that we have not yet constructed or tested on a commercial scale. If we fail to successfully
14
Table of Contents
develop our thin film manufacturing process or incur significant delays in development, we will be unable to commercialize our products. This would materially and adversely affect our business and financial condition. If adequate funds are not available, we may have to delay development or commercialization of our products, license to third parties the rights to commercialize products or technologies that we would otherwise seek to commercialize or cease operations. Any of these factors could harm our business and financial condition.
Our products have never been sold on a commercial basis, and we do not know whether they will be accepted by the market.
Our products, if developed, may not achieve market acceptance. The development of a successful market for our proposed products and our ability to sell our products at a lower cost per watt than our competition may be adversely affected by a number of factors, many of which are beyond our control, including the following:
| • | our failure to produce solar PV modules that compete favorably against other solar modules on the basis of price, quality, performance and warranted lifetime; |
| • | competition from conventional energy sources and alternative distributed generation technologies, such as wind energy; |
| • | our failure to develop and maintain successful relationships with distributors, system integrators and other resellers, as well as strategic partners; |
| • | the failure of system integrators to build projects suited for the type of solar PV modules we intend to produce; |
| • | our products may experience problems with product quality or performance; and |
| • | our ability to achieve solar PV module certification requirements. |
The failure of our proposed products to gain market acceptance would materially and adversely affect our business and financial condition.
We have no experience manufacturing CIGS solar PV products on a commercial scale.
To date, we have focused primarily on research, development and small-scale manufacturing. As a company, we have no experience manufacturing any product on a commercial scale. In addition, all our pilot production has been limited to CIGS on foil, while our initial commercial production line will manufacture CIGS-on-glass modules. We have internally developed the necessary sputtering capabilities and built a prototype and commercial scale tool for the deposition of the CIGS material in our manufacturing process. Failure to integrate this tool into the manufacturing process and to scale up our proprietary deposition tool would materially and adversely affect our business and financial condition.
We may not reach profitability if PV technology is not suitable for widespread adoption or sufficient demand for solar PV modules does not develop or develops slower than we anticipate.
The solar energy market is at a relatively early stage of development and the extent to which solar PV modules will be widely adopted is uncertain. If our CIGS solar PV products prove unsuitable for widespread adoption or demand for our CIGS solar PV products fails to develop sufficiently, we may be unable to grow our business or generate sufficient revenue from operations to reach profitability. In addition, demand for solar modules in our targeted markets may not develop or may develop to a lesser extent than we anticipate. Many factors may affect the viability of widespread adoption of solar PV technology and demand for our CIGS solar PV products, including the following:
| • | performance and reliability of solar modules and thin film technology compared with conventional and other non-solar renewable energy sources and products; |
| • | cost-effectiveness of solar modules compared with conventional and other non-solar renewable energy sources and products; |
15
Table of Contents
| • | availability of government subsidies and incentives to support the development of the solar PV industry; |
| • | success of other renewable energy generation technologies, such as hydroelectric, wind, geothermal, solar thermal, concentrated PV and biomass; |
| • | fluctuations in economic and market conditions that affect the viability of conventional and non-solar renewable energy sources, such as increases or decreases in the price of oil and other fossil fuel; |
| • | fluctuations in capital expenditures by end-users of solar modules, which tend to decrease in slower economic environments, periods of rising interest rates, or a tightening of the supply of capital; and |
| • | deregulation of the electric power industry and the broader energy industry. |
Furthermore, many solar PV cell and module manufacturers are growing and the market could reach a point where supply exceeds demand. As a result, we may be unable to sell our products at attractive prices, or for a profit.
We will rely on third-party suppliers for most of our manufacturing equipment.
We will rely on third-party suppliers for most of our manufacturing equipment. The failure of our suppliers to supply manufacturing equipment in a timely manner or on commercially reasonable terms could delay our commercialization and expansion plans and otherwise disrupt our production schedule or increase our manufacturing costs. Further, our orders with certain of our suppliers may represent a very small portion of their total business. As a result, they may not give priority to our business, leading to potential delays in or cancellation of our orders. If any single-source supplier were to fail to supply our needs on a timely basis or cease providing us key components, we would be required to locate and contract with substitute suppliers. We may have difficulty identifying a substitute supplier in a timely manner and on commercially reasonable terms. If this were to occur, our business would be harmed.
If our manufacturing equipment, some of which will be customized and sole sourced, fails or our equipment suppliers fail to perform under their contracts, we could experience production disruptions and be unable to satisfy our contractual requirements.
Some of our manufacturing equipment will be customized to our production lines based on designs or specifications that we provide the equipment manufacturers, which then undertake specialized processes to manufacture the custom equipment. As a result, the equipment will not be readily available from multiple vendors and would be difficult to repair or replace if it were to become damaged or non-functional. If any piece of equipment fails, we would not be able to manufacture our products.
The failure to achieve target yields, product qualities or target costs of our CIGS solar PV products could materially and adversely affect our business and financial condition.
We may not be able to achieve our desired manufacturing yields, product qualities and cost targets for our CIGS solar PV products, which could prevent us from becoming profitable. If we cannot achieve our targeted production yields and unit costs or if we experience difficulties in our manufacturing process, such as capacity constraints, quality control problems or other disruptions, we may not be able to manufacture our products at acceptable costs, which would eliminate our ability effectively to enter the market. If we cannot reduce our costs through economies of scale, improvements in manufacturing processes and engineering design, or technology maturation, our business and financial condition could be materially and adversely harmed. In addition, we will need to ensure our solar PV module products will receive certain industry certifications. Failure to receive these certifications will harm our financial condition and limit our ability to market and sell our product.
16
Table of Contents
If we experience significant delays, cost overruns and technical difficulties in establishing commercial manufacturing capacity in California, our business and financial condition could be materially and adversely harmed.
If we are unable to complete the installation of equipment in our California manufacturing facility and build-out our initial production line, we will not be able to execute our commercialization plans and we may never achieve profitability. The build-out of our manufacturing facility and construction of our initial manufacturing line is subject to significant risks, including risks of delay, equipment problems, cost overruns and other start-up and operating difficulties. If we experience any of these or similar difficulties, we may be unable to complete our manufacturing line and our business and financial condition could be materially and adversely harmed.
We depend on one customer, Blitzstrom GmbH, for a substantial percentage of our anticipated future revenue.
We anticipate that a substantial percentage of our future revenue will be derived under a contract with one customer, Blitzstrom GmbH, or Blitzstrom. We will be vulnerable to a substantial decline in anticipated revenue if we lose Blitzstrom as a customer for any reason or if Blitzstrom were to reduce, delay or cancel its orders for any reason. Any such events could have a material adverse effect on our business and financial condition. Any loss of business with Blitzstrom will be particularly damaging unless we are able to diversify our customer base and substantially expand sales to other customers.
We will need to expand our manufacturing capacity beyond our initial production line in order to achieve industry competitive targets and to achieve profitability.
Even if we are successful in commencing commercial shipments from our initial production line, our current plan contemplates the expansion of our capacity to 100MW in order to commercialize at sufficient scale to achieve industry competitive cost per watt targets and profitability. The build out of this capacity will require substantial additional capital. A wide variety of factors relating to our company and external conditions could adversely affect our ability to secure funding to expand our manufacturing capacity and the terms of any funding that we secure. Particularly given the current market conditions, we cannot provide assurance that such financing will be available on terms favorable to us, or at all.
The failure to manage our anticipated growth effectively could materially and adversely affect our business and financial condition.
The commercialization of our technology would place a significant strain on our managerial, financial and personnel resources. To reach our goals, we must successfully recruit, train, and manage new employees; develop our manufacturing capabilities; integrate new management and employees into our overall operations; and establish improved financial and accounting systems, controls and reporting systems. We will be competing with other solar, semiconductor and display manufacturers for individuals with this expertise. If we fail to manage the expansion of our business effectively, it could materially and adversely affect our business and financial condition.
Our management team has limited experience working together and its failure to work together effectively could materially and adversely affect our business and financial condition.
Our executive officers and key employees have worked together for a limited period of time. If our management team cannot successfully work together or fails to develop a thorough understanding of our business on a timely basis, it could materially and adversely affect our business and financial condition. Further, we intend to transition from a development company to a revenue generating company by building a manufacturing line and commercializing our product. Our future success depends on our management team’s ability to establish a manufacturing line and commercialize our product. If we cannot do so, we will be unable to expand our business, decrease our cost per watt, maintain our competitive position, satisfy our contractual obligations or reach profitability.
17
Table of Contents
If we lose key personnel, or are unable to attract and retain necessary talent, we may be unable to develop or commercialize our products under development.
We are highly dependent on Mr. Magnus Ryde, our Chief Executive Officer, and Mr. Robert Weiss, our Chief Technology Officer. Mr. Ryde has over 25 years of experience in the semiconductor industry. Mr. Weiss has over 25 years of experience in thin film technology development and manufacturing. In the case of the loss of either of these key executives, we may be unable to find a suitable replacement with comparable knowledge or experience.
In addition, our future success will depend, in part, upon our ability to attract and retain highly skilled employees, including management, technical and sales personnel. Competition for such skilled personnel is intense, and the loss of services of a number of key individuals, or our inability to hire new personnel with the requisite skill sets, could materially harm our business and results of operations. These issues would be magnified if any of our key personnel went to work for competitors. In addition, we may not be able to successfully assimilate these employees or hire qualified personnel to replace them.
If we are unable to adequately protect our intellectual property, our competitors and other third parties could produce products based on our intellectual property, which would substantially impair our ability to compete.
Our success and ability to compete depends in part upon our ability to maintain the proprietary nature of our technologies. We rely on a combination of patent, trade secret, copyright and trademark law and license agreements, as well as employee and third party confidentiality agreements, to protect our intellectual property. These legal means, however, afford only limited protection and may not be adequate to protect our intellectual property rights. We cannot be certain that we were the first creator of inventions covered by pending patent applications or the first to file patent applications on these inventions. In addition, we cannot be certain that any of our pending patent applications will issue. The United States Patent and Trademark Office or other foreign patent and trademark offices may deny or significantly narrow claims made under our patent applications and, even if issued, these patents may be successfully challenged, designed around, or otherwise not provide us with commercial protection. In the future, we may need to assert claims of infringement against third parties to protect our intellectual property. Regardless of the final outcome, any litigation to enforce our intellectual property rights in patents, copyrights or trademarks could be highly unpredictable and result in substantial costs and diversion of resources, which could have a material adverse effect on our business and financial condition. In the event of an adverse judgment, a court could hold that some or all of our asserted intellectual property rights are not infringed or are invalid or unenforceable and could award attorneys’ fees to the other party.
We may become subject to claims of infringement or misappropriation of the intellectual property rights of others, which could prohibit us from selling our product offerings, require us to obtain licenses from third parties to develop non-infringing alternatives and subject us to substantial monetary damages and injunctive relief.
The solar PV industry is characterized by the existence of a large number of patents that could result in frequent litigation based on allegations of patent infringement. We are aware of numerous patents issued and patents pending to third parties that may relate to current and future generations of solar energy. The owners of these patents may assert that the manufacture, use, import, or sale of any product we develop infringes one or more claims of their patents. Moreover, because patent applications can take many years to issue, there may be currently pending applications, unknown to us, which may later result in issued patents that materially and adversely affect our business. Third parties could also assert infringement or misappropriation claims against us with respect to any of our future product offerings. Whether or not such claims are valid, we cannot be certain that we have not infringed the intellectual property rights of such third parties. Any infringement or misappropriation claim could result in significant costs, substantial damages and our inability to manufacture, market or sell any of our product offerings that are found to infringe. Even if we were to prevail in any such action, the litigation could result in substantial cost and diversion of resources that could materially and adversely
18
Table of Contents
affect our business. If a court determined, or if we independently discovered, that our product offerings violated third-party proprietary rights, there can be no assurance that we would be able to re-engineer our product offerings to avoid those rights or obtain a license under those rights on commercially reasonable terms, if at all. As a result, we could be prohibited from selling products that are found to infringe upon the rights of others. Even if obtaining a license were feasible, it may be costly and time-consuming. A court could also enter orders that temporarily, preliminarily or permanently enjoin us from making, using, selling, offering to sell or importing our CIGS solar PV products or other future products, if any, or could enter orders mandating that we undertake certain remedial activities. Further, a court could order us to pay compensatory damages for such infringement, plus prejudgment interest, and could in addition treble the compensatory damages and award attorneys’ fees. These damages could materially and adversely affect our business and financial condition.
The PV industry is highly competitive and subject to rapid technological change, and our success will depend on our ability to develop and market a lower cost, higher performance product.
The target markets for the products we are developing are highly competitive and subject to rapid technological change. Our success depends, in part, upon our ability to maintain a competitive position in the development of CIGS solar PV products and technologies. Our competition consists of major international energy and chemical companies, such as Q-Cells, specialized electronics firms, such as Sharp Corporation, and other thin film PV manufacturers, such as First Solar, Inc. Many of our competitors are more established, benefit from greater market recognition and have substantially greater financial, development, manufacturing and marketing resources than we do. There are competitors with thin film products, including those based on CIGS technology, that have already entered commercial production. If a commercial equipment manufacturer were to develop a sputtering tool that was competitive with our proprietary sputtering tool, it could offer this tool to our competitors which would harm our competitive position. In addition, there are a variety of competing technologies currently in the market and under development, any one of which could achieve manufacturing costs per watt lower than our manufacturing technology. Failure to get to market with the most cost-competitive product before our competitors could materially and adversely affect our business and financial condition.
Our facilities in California are located near an earthquake fault, and an earthquake or other types of natural disasters or resource shortages could disrupt our operations and adversely affect results.
Our facilities in Newark and Santa Clara, California are located near active earthquake zones. We currently do not have a formal business continuity or disaster recovery plan. In the event of a natural disaster, such as an earthquake, drought, flood, or localized extended outages of critical utilities or transportation systems, we could experience a significant business interruption. In addition, California from time to time has experienced shortages of water, electric power and natural gas. Any such future shortages or natural disaster, such as a fire or an earthquake, could cause substantial delays in our operations, damage or destroy our manufacturing equipment or inventory and cause us to incur additional expenses. A disaster could significantly harm our business and financial condition. The insurance we maintain against fires, earthquakes and other natural disasters may not be adequate to cover our losses in any particular case.
Environmental obligations and liabilities could have a substantial negative impact on our financial condition, cash flows and profitability.
Our operations involve the use, handling, generation, processing, storage, transportation and disposal of hazardous materials and are subject to extensive environmental laws and regulations at the national, state, local and international level. These environmental laws and regulations include those governing the discharge of pollutants into the air and water, the use, management and disposal of hazardous materials and wastes, the cleanup of contaminated sites and occupational health and safety. Compliance with current or future environmental and safety laws and regulations could restrict our ability to expand our facilities, impair our research, development or production efforts, or require us to incur significant costs and capital expenditures. In addition, violations of, or liabilities under, environmental laws or permits may result in restrictions being
19
Table of Contents
imposed on our operating activities or in our being subjected to substantial fines, penalties, civil and criminal sanctions, third party property damage or personal injury claims, investigation or remediation costs or other costs. Violations of environmental laws or regulations could occur in the future as a result of the inability to obtain permits, human error, accident, equipment failure or other causes. While we believe we are currently in substantial compliance with applicable environmental requirements, future developments such as more aggressive enforcement policies, the implementation of new, more stringent laws and regulations, or the discovery of presently unknown environmental conditions may require expenditures that could have a material adverse effect on our business, results of operations and financial condition.
We face risks associated with our anticipated international business.
We expect to establish, and to expand over time, international commercial operations and activities. Such international business operations will be subject to a variety of risks associated with conducting business internationally, including the following:
| • | changes in or interpretations of foreign regulations that may adversely affect our ability to sell our products, perform services or repatriate profits to the United States; |
| • | the imposition of tariffs; |
| • | economic or political instability in foreign countries; |
| • | imposition of limitations on or increase of withholding and other taxes on remittances and other payments by foreign subsidiaries or joint ventures; |
| • | conducting business in places where business practices and customs are unfamiliar and unknown; |
| • | the imposition of restrictive trade policies; |
| • | the existence of inconsistent laws or regulations; |
| • | the imposition or increase of investment requirements and other restrictions or requirements by foreign governments; |
| • | uncertainties relating to foreign laws and legal proceedings; |
| • | fluctuations in foreign currency and exchange rates; and |
| • | compliance with a variety of U.S. laws, including the Foreign Corrupt Practices Act. |
We do not know the impact that these regulatory, geopolitical and other factors may have on our international business in the future.
Anti-takeover defenses that we have in place could prevent or frustrate attempts by stockholders to change the direction or management of the company.
Provisions of our certificate of incorporation and bylaws and applicable provisions of Delaware law may make it more difficult for or prevent a third-party from acquiring control of us without the approval of our Board of Directors. These provisions:
| • | set limitations on the removal of directors; |
| • | limit who may call a special meeting of stockholders; |
| • | establish advance notice requirements for nominations for election to our board of directors or for proposing matters that can be acted upon at stockholder meetings; |
| • | prohibit stockholder action by written consent, thereby requiring all stockholder actions to be taken at a meeting of our stockholders; and |
| • | provide our Board of Directors the ability to designate the terms of and issue new series of preferred stock without stockholder approval. |
20
Table of Contents
These provisions may have the effect of entrenching our management team and may deprive stockholders of the opportunity to sell their shares to potential acquirers at a premium over prevailing prices. This potential inability to obtain a control premium could reduce the price of our common stock.
Our common stock could be subject to extreme volatility.
Our common stock is currently traded on the NASDAQ Capital Market. The trading volume of our common stock each day is relatively low. Because of this limited liquidity, stockholders may be unable to sell their shares. Moreover, this means that sales or purchases of relatively small blocks of our common stock can have a significant impact on the price at which our common stock is traded. The trading price of our common stock has, from time to time, fluctuated widely and may be subject to similar fluctuations in the future. The trading price of our common stock may be affected by a number of factors, including events described in the Risk Factors set forth in this Annual Report, as well as our operating results, financial condition, public announcements by us, general conditions in the solar cell industry, and other events or factors. In recent years, broad stock market indices, in general, and smaller capitalization companies, in particular, have experienced substantial price fluctuations. In a volatile market, we may experience wide fluctuations in the market price of our common stock. These fluctuations may have a negative effect on the market price of our common stock.
Our stockholders may be diluted, and the prices of our securities may decrease, by the exercise of outstanding stock options and warrants or by future issuances of securities.
We may issue additional common stock, preferred stock, restricted stock units, or securities convertible into or exchangeable for our common stock. Furthermore, substantially all shares of common stock for which our outstanding stock options or warrants are exercisable are, once they have been purchased, eligible for immediate sale in the public market. The issuance of additional common stock, preferred stock, restricted stock units, or securities convertible into or exchangeable for our common stock or the exercise of stock options or warrants would dilute existing investors and could adversely affect the price of our securities.
Item 1B: Unresolved Staff Comments
None.
We lease 50,000 square feet of factory and office space in Santa Clara, California under a lease which expires in March 2010. This facility is the location of our corporate headquarters as well as the development of our products and proprietary deposition equipment.
We also lease approximately 144,000 square feet of manufacturing and office space in Newark, California. The lease commenced on September 15, 2008 and the initial term of the lease expires on September 14, 2018. We have two options to extend the lease by five years each at the completion of the initial term. This facility is the primary location for our initial manufacturing line. See Item 3. Legal Proceedings for a description of the current leasing arrangement for the Newark facility.
In the ordinary conduct of our business, we are subject to periodic lawsuits, investigations and claims, including routine employment matters. The following is a summary of legal proceedings to which we are a party at this time.
On June 2, 2009, Valley Process Systems, Inc. (“VPS, Inc.”), a subcontractor utilized in the initial construction phase of the Company’s Newark location, filed suit against the general contractor for the project,
21
Table of Contents
Gordon Prill, Inc. (“Gordon Prill”), BMR-Gateway Blvd., LLC (the “Landlord”), and Does 1-25, inclusive in Superior Court of the State of California in Alameda County, CA, alleging monies due, breach of written contract, quantum meruit, and foreclosure on the mechanic’s lien. In the VPS, Inc. action, Landlord joined us by filing a cross-complaint on July 27, 2009, alleging breach of the lease agreement dated April 29, 2008, and seeking indemnification. Both actions allege damages in the amount of $343,562 and seek reasonable attorney’s fees and expenses.
On July 14, 2009, Sprig Electric Co., a subcontractor utilized in the initial construction phase of our Newark location, filed suit against Gordon Prill, the Landlord, and Does 1-100, inclusive in Superior Court of the State of California in Alameda County, CA, alleging monies due, breach of written contract, quantum meruit, and foreclosure on the mechanic’s lien. In the Sprig Electric Co. action, the Landlord joined us by filing a cross-complaint on September 29, 2009, alleging breach of the lease agreement dated April 29, 2008, and seeking indemnification. The Sprig Electric Co. action alleges damages in the amount of $584,068 and both actions seek reasonable attorney’s fees and expenses.
On August 4, 2009, Gordon Prill filed suit against us, the Landlord, and Does 1-250, inclusive in Superior Court of the State of California in Alameda County, CA, alleging breach of written contract, foreclosure on the mechanic’s lien, and statutory penalties under California Civil Code sections 3260 and 3260.1. This action alleges damages in the amount of $1,595,523 and seeks reasonable attorney’s fees and expenses. The damages in this action include the $343,562 in the VPS, Inc. action and the $584,068 in the Sprig Electric Co. action.
On September 9, 2009, the Landlord filed an unlawful detainer action in Superior Court of the State of California in Alameda County, CA against us alleging damages in the amount of $838,078 and to recover possession of the premises. On December 17, 2009, we executed a Settlement Agreement (the “Settlement”) with the Landlord in the above action. According to the terms of the Settlement, we will pay the amount of base rent proportionate to the amount of financing (the “Proceeds”) obtained in excess of Two Million Dollars ($2,000,000) gross up to and including Three Million Dollars ($3,000,000). For instance, if we obtain (a) less than or equal to Two Million Dollars ($2,000,000) in Proceeds, then we shall not be required to make payments of Base Rent under the Lease at that time, (b) more than Two Million Dollars ($2,000,000) in Proceeds, then we shall be required to make payments of Base Rent in the following amount: the quotient of (i) the product of (A) the amount of Base Rent otherwise payable pursuant to the Lease times (B) the difference between (1) the amount of aggregate Proceeds minus (2) Two Million Dollars ($2,000,000) divided by (ii) one million (1,000,000).
Additionally, we will use our best efforts to minimize any utility expenses incurred in operating the building. We have until June 1, 2010, to cure all alleged defaults under the lease (which the Landlord alleges include failure to pay rent and failure to remove various mechanic’s liens recorded against the property), provided the Landlord has not delivered us a 15-day notice of its intention to terminate the Lease (the “Termination Notice”). If the Landlord provides us with a Termination Notice, we must vacate the premises within 30 days from the date of the Termination Notice.
In lieu of a trial, the Parties have stipulated to a judgment of possession in the event that we breach the Settlement Agreement for 1) failure to pay rent as indicated in the Settlement, 2) failure to cure all alleged defaults under the lease, and/or 3) failure to vacate the premises after a proper notice of termination or if any alleged defaults have not been cured by June 1, 2010. If it is alleged that we have not used our best efforts to minimize utility expenses, we have five days to cure that default under the Settlement prior to the Landlord entering the stipulated judgment. If the Landlord seeks to have the judgment enforced, it must provide us with 24 hours notice prior to the court hearing.
The Landlord is reserving all rights to seek the remaining alleged amounts of rent due, as well as any claims related to various mechanic’s liens recorded against the property by contractors and material suppliers.
22
Table of Contents
On January 6, 2010, New York State Urban Development, d/b/a/ Empire State Development Corporation (“ESDC”), filed a breach of contract action against us. This action stems from the Grant Disbursement Award we entered into with ESDC when we relocated our headquarters to New York in 2004. ESDC is seeking $420,000 in damages in this action. The parties are currently negotiating a settlement agreement of the action, the terms of which are now indeterminate.
The damages sought in these cases were previously recorded as liabilities on our balance sheet at the time the original invoices were received for services performed at the Newark facility or in the case of the ESDC matter, at the time the grant funds were received.
None.
23
Table of Contents
| Item 5. | Market for Registrant’s Common Equity, Related Stockholder Matters, and Issuer Purchases of Equity Securities |
Market Information
Our common stock is traded on The NASDAQ Capital Market. We also had Class B public warrants that traded on the NASDAQ Capital Market through February 11, 2009, at which time they expired. The following table sets forth the high and low closing sale prices, per share, for our common stock as reported by the NASDAQ Capital Market for each quarter in the past two years:
| Common Stock “DSTI” | ||||||
| Fiscal Quarters |
High | Low | ||||
| 2009 |
||||||
| March 31, 2009 |
$ | 2.01 | $ | 0.97 | ||
| June 30, 2009 |
$ | 1.47 | $ | 0.63 | ||
| September 30, 2009 |
$ | 0.87 | $ | 0.56 | ||
| December 31, 2009 |
$ | 0.71 | $ | 0.31 | ||
| 2008 |
||||||
| March 31, 2008 |
$ | 6.98 | $ | 2.49 | ||
| June 30, 2008 |
$ | 4.69 | $ | 3.13 | ||
| September 30, 2008 |
$ | 4.29 | $ | 2.36 | ||
| December 31, 2008 |
$ | 2.97 | $ | 0.86 | ||
Holders
As of February 28, 2010, there were approximately 36 shareholders of record of our common stock, although the number of beneficial owners is believed to be substantially higher.
Dividends
We have never declared nor paid any dividends on our capital stock and do not anticipate paying any cash dividends on our capital stock in the foreseeable future. We currently expect to retain our future earnings, if any, for use in the operation and expansion of our business. Any future decision to pay cash dividends will be at the discretion of our board of directors and will be dependent upon our financial condition, results of operations, capital requirements and other factors our board of directors may deem relevant. There are currently no restrictions that limit our ability to pay dividends on our capital stock.
Item 6. Selected Financial Data
None.
24
Table of Contents
Item 7. Management’s Discussion and Analysis of Financial Condition and Results of Operations
The following discussion and analysis provides information that we believe is relevant to an assessment and understanding of our results of operation and financial condition. You should read this analysis in conjunction with our audited consolidated financial statements and related footnotes. This discussion and analysis contains statements of a forward-looking nature relating to future events or our future financial performance. These statements involve known and unknown risks, uncertainties and other factors that may cause our actual results, levels of activity, performance or achievements to be materially different from any future results, levels of activity, performance or achievements expressed or implied by these forward-looking statements, including those set forth in this Annual Report on Form 10-K.
Overview
We have developed a proprietary thin film deposition technology for solar photovoltaic (“PV”) products. We utilize a proprietary one-step sputter deposition process and have manufactured a commercial scale deposition tool to apply high-efficiency copper indium gallium diselenide (“CIGS”) material over large area glass substrates in a continuous fashion. We intend to integrate this tool with commercially available thin film manufacturing equipment, which will provide us with a critically differentiated manufacturing process to produce low-cost monolithically integrated, CIGS-on-glass modules that address the grid-tied, ground-based PV market.
We believe this proprietary deposition process, when operated at an annual capacity of approximately 100 megawatts, will enable us to achieve a total module manufacturing cost of less than $1.00 per watt. This cost would be competitive with the lowest in the solar PV industry. Using this approach, we have achieved greater than 15% cell efficiencies over large areas on CIGS PV devices, and we believe that this approach will enable us to reach module efficiencies greater than 13%.
We have initiated construction of our first module production line. To facilitate our entry into the addressable solar PV market, we have entered into a contract with Blitzstrom GmbH, one of the world’s leading thin film solar PV integrators, that commits Blitzstrom to purchase a minimum of 50% of our production through 2011, subject to these products meeting defined performance criteria. We have also signed a Letter of Intent with juwi Solar, who is interested in purchasing up to 25% of our production through 2011.
In October 2007, we completed a follow-on public offering in which we sold 17,250,000 shares of our common stock. Our net proceeds from the offering were approximately $68 million. We have used these proceeds to develop our proprietary deposition process, to build our prototype and commercial scale deposition tools, and to begin installation of our first production line. In the near term, we will require substantial funds beyond our current cash on hand in order to fully build-out our first production line, to commence and support commercial production as currently planned, to fund future operations, and to expand our capacity beyond our first production line.
In order to raise the capital required for our next phase of growth, we have engaged a financial advisor to explore a possible rights offering to existing shareholders. Additionally, we have engaged a financial advisor to assist us in exploring select strategic transactions.
Critical Accounting Policies and Estimates
The preparation of our financial statements requires us to make estimates and judgments that affect the reported amounts of assets, liabilities, revenue and expenses, and the related disclosures. A summary of those accounting policies can be found in the notes to our financial statements. Certain of our accounting policies are considered critical as they are both important to the portrayal of our financial condition and results of operations and require judgments on the part of management about matters that are uncertain. We have identified the following accounting policies that are important to the presentation of our financial condition and results of operations. Property and Equipment. Property and equipment is stated at cost. Depreciation is computed using
25
Table of Contents
straight-line and an accelerated method over estimated useful lives of three to ten years. Expenditures for maintenance and repairs, which do not materially extend the useful lives of property and equipment, are charged to operations as incurred. When property or equipment is retired or otherwise disposed of, the property accounts are relieved of costs and accumulated depreciation and any resulting gain or loss is recognized.
Share-Based Compensation. We follow the provisions of FASB ASC 718 Compensation—Stock Compensation, which requires the measurement and recognition of compensation expense for all share-based payment awards to employees and directors based on estimated fair values. Additionally, we follow the SEC’s SAB No. 107, “Share-Based Payment” (“SAB 107”), as amended by SAB No. 110, which provides supplemental application guidance based on the views of the SEC.
Derivative Stock Warrants. Certain terms in the convertible note and related documents issued and entered into on May 25, 2006, as well as subsequent agreements entered into on January 19, 2007, namely the potential for cash settlement require that the warrants issued in conjunction with these documents be treated as a derivative instrument and, therefore, classified as a liability on the balance sheet. As such, the liability must be adjusted to fair value at the end of each reporting period, and any changes in fair value reported as a gain or loss on derivative liabilities in our statement of operations. The Black-Scholes option-pricing model is used to estimate the warrant fair values. Upon a change in control of our company, warrant holders having the right to purchase 600,003 shares of common stock would have the right to require us to repurchase the warrants from them at a purchase price equal to the Black-Scholes value of the unexercised portion of the warrants. Generally, this accounting treatment will result in a reported loss during any accounting period in which there is a reported increase in the sales price of our common stock on the NASDAQ Capital Market. Conversely, this accounting treatment generally will result in a reported gain during any accounting period in which there is reported decrease in the sales price of our common stock on the NASDAQ Capital Market.
Results of Operations
Comparison of Years Ended December 31, 2009 and 2008
Certain reclassifications have been made to the 2008 financial information to conform to the 2009 presentation. Such reclassifications had no impact on net loss.
Research and development expenses. Research and development expenses were $14,741,983 for the year ended December 31, 2009 compared to $17,678,212 for the year ended December 31, 2008, a decrease of $2,936,229 or 17%. The decrease is primarily due to the cost savings measures implemented in 2009 including a reduction in our workforce as well as a reduction in expenditures for materials, supplies and consultants. During 2009, we prioritized our development efforts to focus on our core CIGS technology and related development in order continue to advance our product toward commercialization while we seek additional financing to complete the build-out of our initial production line. Also, in July 2009, we sold substantially all our tangible assets at our Halfmoon, NY facility to Veeco Compound Semiconductor, Inc. (“Veeco”) for $1.925 million and Veeco hired the 18 research and development employees located at the facility. This transaction further reduced our research and development expenses during the latter half of 2009.
Selling, general and administrative expenses. Selling, general and administrative expenses were $6,058,676 for the year ended December 31, 2009 compared to $8,864,142 for the year ended December 31, 2008, a decrease of $2,805,466 or 32%. The decrease in selling, general and administrative expenses was primarily due to the cost savings measures implemented during 2009 including a reduction in our workforce as well as a reduction in outside consultants and professional fees. Additionally, there was a decrease of $541,809 in share-based compensation for selling, general and administrative personnel during 2009 as compared to 2008.
Depreciation and amortization expense. Depreciation and amortization expense was $3,534,770 for the year ended December 31, 2009 compared to $3,242,504 for the year ended December 31, 2008, an increase of $292,266 or 9%. Depreciation and amortization expense increased primarily due to an increase in equipment
26
Table of Contents
utilized in the development of our CIGS PV products and manufacturing processes at the end of 2008 and beginning of 2009. This increase was offset by a reduction in expense due to the sale of the fixed assets at our Halfmoon, NY facility in July 2009. The overall increase in property and equipment on our balance sheet during the period was due primarily to the acquisition of and initial costs incurred for certain equipment required for the construction of our initial manufacturing line. These items are classified as construction in progress until they are placed in service and therefore have no current impact on depreciation expense.
Other (expense) / income. Other expense was $485,494 for the year ended December 31, 2009 compared to other income of $848,409 for the year ended December 31, 2008, a decrease of $1,333,903. Other loss in 2009 primarily represents the loss on the Company’s “Sale of Assets” to Veeco in July, 2009 and the other income in 2008 primarily represents interest on investments, which are classified as cash equivalents, generated from the net proceeds of our follow-on public offering in October 2007.
Interest expense. Interest expense was $189,628 for the year ended December 31, 2009 compared to $39,431 for the year ended December 31, 2008, an increase of $150,197. The increase in interest expense was primarily due to the recording of a full year of interest on tenant improvements financed by the landlord in our Newark, CA facility as well as interest on notes issued during the latter part of 2009.
Amortization of note discount and financing costs. Amortization of note discount and financing costs was $1,096,330 for the year ended December 31, 2009. There was no amortization of note discount and financing costs during the year ended December 31, 2008. The expense in 2009 primarily represents the amortization of the discount on a $2.0 million convertible note entered into in September 2009.
Gain on derivative liabilities. Gain on derivative liabilities was $1,066,853 for the year ended December 31, 2009 compared to a gain of $2,645,609 for the year ended December 31, 2008. The warrants issued in May 2006 and early 2007 in conjunction with a convertible note, as well as a conversion feature on a convertible note issued in September 2009 are considered derivative liabilities and are therefore required to be adjusted to fair value each quarter. A decrease in our stock price during the period results in a decrease in the liabilities and a gain on derivative liabilities. Conversely, an increase in our stock price during the period would result in an increase in the liabilities and a loss on derivative liabilities. During the year ended December 31, 2009, our common stock price decreased which caused a decrease in the fair value of the warrant liability and conversion feature, resulting in a gain on derivative liabilities.
Liquidity and Capital Resources
At December 31, 2009, our cash and cash equivalents totaled $17,000 compared to $17.1 million at December 31, 2008. The decrease in cash was primarily due to the payment of operating expenses, payment for certain equipment on order for our initial production line, as well as leasehold improvements completed in our initial manufacturing facility in Newark, California. Subsequent to December 31, 2009 and through March 17, 2010, we have received additional bridge financing of $1.2 million to fund our continued product development and operations.
We are in the development stage, and as such, have historically reported net losses, including a net loss of $25.0 million for the year ended December 31, 2009. We anticipate incurring losses in the future, as we complete the build-out of our initial production line and enter commercialization of our products, invest in research and development, and incur associated administrative and operating costs. Our financial statements for the year ended December 31, 2009 have been prepared on a going concern basis, which contemplates the realization of assets and the settlement of liabilities and commitments in the normal course of business. As noted herein, as a result of our current liquidity, there is substantial doubt as to our ability to continue as a going concern.
We have historically financed our operations primarily from proceeds of the sale of equity securities. We presently do not have any bank lines of credit that provide us with an additional source of debt financing. In order to fund the costs associated with our continued development and commercialization efforts, we completed a
27
Table of Contents
registered public offering during the fourth quarter of 2007 in which we sold 17,250,000 shares of our common stock at $4.25 per share and generated net proceeds of approximately $68 million after deducting underwriting discounts and the fees and expenses of the offering. Upon receipt of the proceeds from the offering, we re-paid in full $9.2 million of existing indebtedness. We have used these proceeds to develop our proprietary deposition process, to build our prototype and commercial scale deposition tools, and to begin installation of our first production line. Commercialization efforts, including the completion and ramp-up of our initial production line will require significant additional capital expenditures as well as associated continued development and administrative costs.
During 2008 and 2009, we achieved several key milestones as we completed the development of our proprietary one step sputter deposition process, built our prototype and commercial scale deposition tools, completed our first full size (2’ x 4’) monolithically integrated CIGS-on-glass modules and continued to enhance the performance of such modules, and began installation of our first production line. In order to continue operations and build-out our initial production line and commence commercial shipments of our product, we will require substantial funds in the near term beyond our current cash on hand. In light of our current cash position, we implemented a significant reduction in our workforce in 2009 and other cost savings measures in order to preserve cash.
On July 15, 2009, we sold substantially all of our tangible assets located at our Halfmoon, New York facilities to Veeco Compound Semiconductor, Inc. (“Veeco”) for $1.925 million. Upon completion of this transaction, Veeco employed all 18 of our employees located in Halfmoon which reduced our payroll and related costs, and assumed responsibility for the facilities and operating costs associated with the facilities which further reduced our overall operating expenses. We have retained ownership of the intellectual property developed in New York for future use in either glass or flexible substrate PV modules. The transaction also allows us to continue our efforts on our proprietary reactive sputter process currently in use to produce CIGS-on-glass photovoltaic modules without diminishing opportunities to re-enter flexible PV module markets when business, technology, and market conditions favor such a product.
On September 18, 2009, we entered into a letter of intent with EPOD Solar Inc. (“EPOD Canada”) (the “LOI”). The LOI contemplated a series of transactions resulting in the combination of DayStar and EPOD Canada. After initial discussions, on October 19, 2009, our Board of Directors accepted EPOD Canada’s notification to terminate the LOI.
On September 21, 2009, we entered into a series of agreements with Mr. Peter Alan Lacey in which Mr. Lacey provided us $2.0 million in bridge financing in exchange for a secured convertible promissory note and warrants to purchase shares of our common stock. In December 2009, Mr. Lacey provided us with additional bridge financing of $425,000. Subsequent to December 31, 2009 and through March 17, 2010, we have received additional bridge financing of $1.2 million to fund our operations.
In order to address our immediate financial needs, we intend to pursue a rights offering to existing shareholders, in which our shareholders would have the opportunity to purchase additional common shares based on their pro rata ownership percentage. A successful rights offering would raise the capital required to improve our current financial condition while giving existing shareholders the opportunity to limit ownership dilution, The exact size, timing, terms and conditions of the rights offering have not yet been determined by the Board of Directors and there is no guarantee that we will complete a rights offering.
Additionally, we have engaged a financial advisor to seek long-term strategic investments and partnerships. To date, we have been unable to raise substantial additional capital or complete an agreement with an investor or strategic partner. Although we continue to seek strategic investors or partners, in light of our current cash position, we may in the near term be forced to cease or substantially curtail operations.
An inability to raise additional funding in the very near term may cause us to file a voluntary petition for reorganization under the United States Bankruptcy Code, liquidate assets, and/or pursue other such actions that could adversely affect future operations. A wide variety of factors relating to the Company including those
28
Table of Contents
described in the section entitled “Risk Factors” in Part I Item 1A in our Annual Report on Form 10-K and section 1A of Part II of this report, as well as external conditions, could adversely affect our ability to secure additional funding necessary to continue operations and the terms of any funding that we secure.
Commitments. At December 31, 2009, we had outstanding approximately $2.9 million of purchase orders for equipment and improvements. Other material commitments include rental payments under operating leases for office space and equipment, and commitments under employment contracts with our executive officers. These commitments are discussed further in the Commitments and Contingencies footnote to our financial statements.
Off-Balance Sheet Arrangements. The only off-balance sheet obligations are for operating leases and certain other commitments entered into in the ordinary course of business.
We lease 50,000 square feet of factory and office space in Santa Clara, California under a lease which expires in March 2010. This facility is the location of our corporate headquarters as well as the development of our products and proprietary deposition equipment.
We also lease approximately 144,000 square feet of manufacturing and office space in Newark, California. The lease commenced on September 15, 2008 and the initial term of the lease expires on September 14, 2018. We have two options to extend the lease by five years each at the completion of the initial term. This facility is the primary location for our initial manufacturing line. See Item 3. Legal Proceedings for a description of the current leasing arrangement for the Newark facility.
As discussed under Commitments, at December 31, 2009, we had approximately $2.9 million in commitments under outstanding purchase orders for equipment and improvements. Such commitments are primarily related to manufacturing equipment which we expect to be delivered throughout 2010. Generally we are required to remit any balances due to the suppliers upon delivery and acceptance of the equipment.
Item 7A. Quantitative and Qualitative Disclosures About Market Risk
None.
Item 8. Financial Statements and Supplementary Data
The information required by this Item is incorporated herein by reference to the financial statements beginning on page F-1.
Item 9. Changes In and Disagreements With Accountants on Accounting and Financial Disclosure
There has been no change of accountants nor any disagreement with accountants on any matter of accounting principles or practices or financial statement disclosure or auditing scope or procedure required to be reported under this Item.
Item 9A. Controls and Procedures
Evaluation of Disclosure Controls and Procedures
We maintain disclosure controls and procedures that are designed to ensure that information required to be disclosed in our reports pursuant to the Securities Exchange Act of 1934, as amended (the “Exchange Act”) is recorded, processed, summarized and reported within the time periods specified in the Securities and Exchange Commission’s rules and forms, and that such information is accumulated and communicated to our management, including our Chief Executive Officer and Chief Accounting Officer, as appropriate, to allow timely decisions
29
Table of Contents
regarding required disclosure. In designing and evaluating the disclosure controls and procedures, management recognizes that any controls and procedures, no matter how well designed and utilized, can provide only reasonable assurance of achieving the desired control objectives, and management necessarily is required to apply its judgment in evaluating disclosure controls and procedures.
As required by Rule 13a-15(b) or Rule 15d-15(b) under the Exchange Act, we carried out an evaluation, under the supervision and with the participation of our management, including our Chief Executive Officer and Chief Accounting Officer, of the effectiveness of our disclosure controls and procedures, as defined in Rule 13a-15(e) or Rule 15d-15(e) under the Exchange Act, as of the end of the period covered by this report. Based on the foregoing, our Chief Executive Officer and Chief Accounting Officer concluded that our disclosure controls and procedures were effective as of December 31, 2009.
Changes in Internal Control Over Financial Reporting
There were no changes in our internal control over financial reporting during the quarter ended December 31, 2009 that have materially affected, or are reasonably likely to materially affect, our internal control over financial reporting.
MANAGEMENT’S REPORT ON INTERNAL CONTROL OVER FINANCIAL REPORTING
Our management is responsible for establishing and maintaining adequate internal control over financial reporting (as defined in Rule 13a-15(f) under the Exchange Act). Our internal control over financial reporting is designed to provide reasonable assurance regarding the reliability of financial reporting and the preparation of financial statements for external purposes in accordance with generally accepted accounting principles. Because of its inherent limitations, internal control over financial reporting may not prevent or detect misstatements. Also, projections of any evaluation of effectiveness to future periods are subject to the risk that controls may become inadequate because of changes in conditions, or that the degree of compliance with the policies or procedures may deteriorate.
To evaluate the effectiveness of internal control over financial reporting, as required by Section 404 of the Sarbanes-Oxley Act, management conducted an assessment, including testing, using the criteria in Internal Control—Integrated Framework, issued by the Committee of Sponsoring Organizations of the Treadway Commission (COSO). Based on their assessment, management concluded that we maintained effective internal control over financial reporting as of December 31, 2009.
This annual report does not include an attestation report of our registered public accounting firm regarding internal control over financial reporting. Management’s report was not subject to attestation by our registered public accounting firm pursuant to temporary rules of the Securities and Exchange Commission that permit us to provide only management’s report in this annual report.
None.
30
Table of Contents
| Item 10. | Directors, Executive Officers and Corporate Governance |
The following table sets forth certain information about each of the members of the Board of Directors and each executive officer.
| Name |
Age | Positions |
Director Since |
Expiration of Current Term | ||||
| Peter A. Lacey(2)(3) |
53 | Chairman | 2009 | 2010 | ||||
| Magnus Ryde |
54 | Chief Executive Officer | 2010 | 2010 | ||||
| Richard C. Green, Jr.(2)(3) |
55 | Director | 2009 | 2010 | ||||
| Jonathan Fitzgerald.(1)(2) |
48 | Director | 2009 | 2010 | ||||
| William S. Steckel |
52 | Director | 2009 | 2010 | ||||
| Kang Sun(1) |
54 | Director | 2009 | 2010 | ||||
| Robert Tonsoo(1) |
53 | Director | 2009 | 2010 |
| (1) | Member of the Audit Committee. |
| (2) | Member of the Compensation Committee. |
| (3) | Member of the Nominating and Governance Committee. |
Directors
Peter A. Lacey. Mr. Lacey joined us as a director in 2009, and he has been the President, Chief Executive Officer and a director of the Cervus Equipment Corporation since May 2003. Cervus Equipment Corporation, which is listed on the TSX-V operates 17 agricultural and turf John Deere stores in Alberta, Saskatchewan, British Columbia and Manitoba, as well as 5 Bobcat and JCB construction equipment stores in Alberta. Mr. Lacey has also been the President, Chief Executive Officer and a trustee of Proventure, a public income trust listed on the TSX-V which is in the commercial property development business and provides financing and leases real estate to Cervus since November 2005. Mr. Lacey has also been the Chairman of the Board and director of Eveready Energy Services, a public company listed on the Toronto Stock Exchange that provides industrial and oilfield maintenance and production services to the energy, resource, and industrial sectors, since September 2004. Eveready was recently sold to Clean Harbors Inc. Mr. Lacey was a director of the former River Valley Energy Services Ltd., a predecessor to Eveready, from August 1995 until September 2004. Mr. Lacey has been a member of the Red Deer College Board of Governors since October 1997, and was Chairman from May 2000 until February 2004 at which time the Chairman’s appointment term concluded. Mr. Lacey also served as a trustee on the Alberta Ingenuity Fund’s Board of Trustees, a $900 million fund established to attract research and researchers to Alberta.
The Board of Directors believes that Mr. Lacey’s experience, both as an entrepreneur and in financing companies, provides needed skills as the Company seeks additional financing to execute its product commercialization strategy.
Magnus Ryde. Mr. Ryde joined us as Chief Executive Officer in February 2010 and brings more than 25 years of experience in the semiconductor industry. He has had several key senior management positions, including as general partner of Quan Ventures from 2007 to 2009. Prior to Quan Ventures, he was interim CEO of Intematix Corporation from 2005 to 2007, a company specializing in phosphors for light emitting diodes for the solid state lighting market, where he successfully raised $16.5M in Series C financing and initiated establishment of a JV in Taiwan for LED packaging capability. From 2000 to 2004, Mr. Ryde served as Chairman and CEO of FlexICs, a flexible display spin-out from Lawrence Livermore National Laboratory in California. He also served as President of North America for Taiwan Semiconductor Manufacturing Co. (TSMC). He also held numerous senior executive positions during his 18 year tenure at KLA-Tencor, the world’s
31
Table of Contents
leading supplier of process control and yield management solutions for the semiconductor and related industries, including Vice President of Worldwide Field Operations, manufacturing manager, product marketing manager, KLA Europe Director, and VP of Corporate Sales. Mr. Ryde also has a breadth of board experience, currently serving on the board of directors of QuNano AB since 2007, QuNano AB, GLO AB, Sol Voltaics, AB, and Mars Capital Group LLC. He also served on the boards of NextTech Solutions from 2005 to 2007, Four Invest AB as Chairman from 2002 to 2006, and Effnet Holding AB of Sweden from 2000 to 2006. He graduated from Linköping University in 1979 and Stanford University in 1980 with a MS in Industrial Engineering and later completed an Executive MBA at Stanford University in 1995.
The Board of Directors believes that Mr. Ryde’s management experience with technology companies and his financing experience make him an excellent candidate as both the Chief Executive Officer and as a member of the Board.
Jonathan W. Fitzgerald. Mr. Fitzgerald joined us as a director in 2009. Mr. Fitzgerald is an independent investment banker providing advisory services to early and growth-stage businesses in a variety of technology industries. Previously, Mr. Fitzgerald was a Managing Director and senior investment banker with the firm of Morgan Joseph & Co. Inc. In addition to leading the Firm’s Cleantech investment banking practice, Mr. Fitzgerald served a variety of industrial clients across the western region. Mr. Fitzgerald also served as the Interim-CEO of Harvest Wind Limited, a development stage wind turbine manufacturer based in Oregon. Jonathan also served as an Adviser to iSense Corporation, Boston Poly Corporation and Trustwater LLC. Mr. Fitzgerald was Co- Head of Capital Markets origination for North America at Dresdner Kleinwort Wasserstein. In this capacity he oversaw the origination of loan, bond and equity products for the firm’s key corporate relationships across multiple industry sectors. In addition to traditional capital markets products, Jonathan has significant experience in acquisition finance, liability management, structured finance and securitization. Mr. Fitzgerald also held senior investment positions in New York and London at Credit Suisse First Boston and Lehman Brothers, leading international investment banks. Mr. Fitzgerald holds a B.A. with Distinction from Bowdoin College, an MSc.(Econ) from The London School of Economics and Political Science and an M.B.A. from the Wharton School of the University of Pennsylvania.
The Board of Directors believes that Mr. Fitzgerald’s wealth of experience in working with growth technology and cleantech companies and his current experience as an independent investment banker providing advisory services to early and growth-stage businesses in a variety of technology industries, provides the board and management team with valuable insights as the Company continues its financing efforts and seeks to commence its initial production.
Richard C. Green. Mr. Green has spent over 30 years in the energy industry, serving for 20 years as the Chairman and CEO of Aquila Corporation, formerly UtiliCorp United, an international gas and electric company. Mr. Green has been credited with leading a successful turnaround to successfully reposition Aquila during the energy market crisis of 2002. Additionally, he demonstrated leadership and perseverance in pioneering both the strategy and successful execution of a significant business expansion of UtiliCorp United to a Fortune 30 company. UtiliCorp United was a multi-national electric and gas utility business and national energy marketing and trading business with revenues of $36.3 billion. Mr. Green is also Chairman of Midwest Research Institute (MRI) which has a core focus that includes renewable energy, life sciences and national security and defense. He currently serves on the Board of Directors of the Alliance for Sustainable Energy that operates the National Renewable Energy Laboratory (NREL) for the U. S. Department of Energy. He serves on the General Partners’ Advisory Board of Directors of Hudson Clean Energy Partners. Hudson Clean Energy Partners is a leading global private equity firm, dedicated solely to investing in renewable power, alternative fuels, energy efficiency and storage. Mr. Green founded The Calvin Group LLC which is a firm that acts as a catalyst to management teams facing significant challenges or seeking to explore new opportunities. Mr. Green is a Graduate of Southern Methodist University and serves as a member of the Board of Directors of the Hall Family Foundation, a Trustee of the Nelson-Atkins Museum of Art and the Washington D.C. based Urban Institute.
32
Table of Contents
The Board of Directors believes that Mr. Green’s strategic planning experience will be of great value to DayStar as we move forward on pursuing commercial strategies and opportunities consistent with building significant, long-term value for our shareholders.
William S. Steckel. Mr. Steckel joined us in June 2008 and served as our President & Chief Executive Officer and Chief Financial Officer until February 2010. From April 2006 until June 2008, Mr. Steckel was Chief Financial Officer, Senior Vice President and Treasurer at Norwood Promotional Products, a leading supplier of imprinted promotional products. Before Norwood, Mr. Steckel was with Lambda Power (a division of Invensys plc), a global manufacturer of power supplies, power filtering and power protection equipment, where he was President from 2003 to 2005 and CFO from 2001 to 2002. Mr. Steckel earned his Bachelor of Science in industrial management at Iowa State University, and his M.B.A. from Western Illinois University. He is also a Certified Public Accountant.
The Board of Directors believes that Mr. Steckel’s recent experiences as a member of the Company’s management team provides key continuity and insight as the Company seeks additional financing to execute its product commercialization strategy. Additionally, Mr. Steckel’s experience in leading technology companies is useful as the Company assesses its options to commence its initial production line.
Kang Sun. Dr. Sun joined us as a director in 2009. Dr. Sun is currently Chairman of the Board of RayTracker Inc., an advanced photovoltaic tracking system manufacturer. Dr. Sun previously served as President, Chief Operating Officer and Director of China-based JA Solar Holdings Co., a world leader in photovoltaic products. At JA Solar, Dr. Sun was responsible for successfully securing $620 million in equity funding in 2007 and 2008 and led the business to profitability by growing revenue from $90 million in 2006 to approximately $800 million in 2008. Prior to joining JA Solar Holdings, Dr. Sun served as Managing Director, New Business Development & Chief Strategy Officer, New Business and New Products Group for Applied Materials where he was responsible for new business ventures and the company’s corporate strategic licensing business. From 1990 to 2005, Dr. Sun held executive positions in several large business enterprises and technology start-ups, including serving as Vice President of New Venture Business at Honeywell International Inc., General Manager of the optical devices business at Allied Signal, Vice President of New Business and Technology at Oce, and Vice President of Business Development at Microfabrica. Dr. Sun received his Ph.D. degree in material science from Brown University, master’s degree in chemistry from University of Georgia and bachelor’s degree in chemistry from Nanjing University, China.
The Board of Directors believes that his demonstrated success and leadership as President and Chief Operating Officer of JA Solar and his depth of experience in technology companies will be of great value to DayStar as we move forward to commercialize DayStar’s CIGS thin-film technology.
Robert Tonsoo. Mr. Tonsoo joined us as a director in 2009. Mr. Tonsoo is a partner in a private law firm and has been practicing law in Canada for 24 years. Mr. Tonsoo is a corporate solicitor and represents several hundred companies in various capacities including financing, reorganization and real estate matters. Mr. Tonsoo has served on the Board of Directors of numerous companies and charitable organizations. Mr. Tonsoo holds a Bachelor of Commerce Degree and a Bachelor of Laws Degree from the University of British Columbia.
Audit Committee
Our Audit Committee, established in accordance with Section 3(a)(58)(A) of the Securities Exchange Act of 1934, as amended, is responsible for reviewing the results and scope of audits and other services provided by our independent public accountants and reviewing our system of internal accounting and financial controls. The audit committee also reviews other matters with respect to our accounting, auditing, and financial reporting practices and procedures, as it deems necessary or desirable. The Audit Committee of our Board of Directors consists of three non-employee directors who meet the independence standards of NASDAQ and the securities laws. The members of the Audit Committee are Peter Lacey, Richard Green; and Jonathan Fitzgerald. Mr. Fitzgerald serves as the Chairman of the Audit Committee.
33
Table of Contents
Executive Officers
Biographical information for our Chief Executive Officer, Magnus Ryde, is contained in the section captioned “Directors” above.
Patrick J. Forkin III. Mr. Forkin was appointed as DayStar’s Senior Vice President of Corporate Development and Strategy in July 2009. He joined DayStar in September 2008. Mr. Forkin brings over 25 years of senior level experience in renewable energy equity research, corporate finance, mergers and acquisitions and strategic planning. He has extensive experience providing strategic and investment research to large institutional investors and private equity firms. Immediately prior to joining DayStar, Mr. Forkin was senior vice president, equity capital markets at Tejas Securities Group, Inc., where he specialized in solar photovoltaics, energy technology and other renewable sectors. Earlier in his career, Mr. Forkin was a Senior Manager with the public accounting firm of Deloitte & Touché for 9 years and managed the Corporate Finance Group of Deloitte’s St. Louis office for 5 years. While with Deloitte, Mr. Forkin participated on national, due diligence engagement teams representing two of the largest LBO firms in the country, Kohlberg, Kravis, Roberts & Co. (“KKR”) and Forstmann, Little & Co. Mr. Forkin earned his Bachelor of Science in Accountancy at the University of Illinois, Champaign. He is also a Certified Public Accountant.
Robert E. Weiss. Mr. Weiss has served as our Chief Technology Officer since May 2007. He initially joined us in January 2006 as Director of the Equipment Development Group and served as our Vice President of Advanced Technologies from March 2006 to May 2007. From September 2005 to January 2006, he served as a consultant to us. From 1992 to 2005, he was with Intevac, Inc., a supplier of thin film deposition manufacturing equipment, most recently serving as Chief Technology Officer, where he led hardware and process development teams in commercializing tools used in the production of plasma and polysilicon displays, hard disks, and low light cameras. Mr. Weiss has a B.A. in English and Psychology from Grinnell College, Iowa.
Code of Ethics
We have adopted a code of ethics that is applicable to our officers and directors, including our principal executive officer, principal financial officer, principal accounting officer or controller, or persons performing similar functions. The code of ethics can be found under the heading “Ethics Policy” on our website at www.daystartech.com.
Section 16(a) Beneficial Ownership Reporting Compliance
Section 16(a) of the Securities Exchange Act of 1934 requires officers and directors, and persons who own more than ten percent of a registered class of our equity securities, to file reports of ownership and changes in ownership with the Commission. Officers, directors and greater than ten percent beneficial owners are required by Commission regulations to furnish us with copies of all forms they file pursuant to Section 16(a). Based solely on our review of the copies of such forms received and written representations from reporting persons required to file reports under Section 16(a), to the Company’s knowledge all of the Section 16(a) filing requirements applicable to such persons with respect to fiscal 2008 were complied with, except for 1) a Form 3 for Mr. Robert Tonsoo which was not filed, 2) three Form 3s for Messrs. Fitzgerald, Greene, and Sun which were reported on December 18, 2009 and should have been reported on November 19, 2009 and November 27, 2009, respectively, and 3) a Warrant issued to Mr. Peter Lacey, reported on Form 5 on February 16, 2010 which should have been reported on Form 4 on October 8, 2009.
34
Table of Contents
Item 11. Executive Compensation
The following Summary Compensation Table sets forth certain information regarding the compensation of our named executive officers for services rendered in all capacities to DayStar during the year ended December 31, 2009.
Summary Compensation Table
| Name and Principal Position |
Year | Salary ($) | Stock Awards ($) |
Option Awards ($) |
Non-Stock Incentive Plan Comp. ($) |
All Other Comp. ($) |
Total ($) | ||||||||||||||||
| William S. Steckel |
2009 | $ | 236,123 | $ | 207,500 | (2) | $ | — | $ | — | $ | 50,838 | (4) | $ | 494,461 | ||||||||
| CEO & CFO |
2008 | $ | 124,615 | $ | 664,500 | (1) | $ | 846,082 | (3) | $ | — | $ | 32,453 | (5) | $ | 1,667,650 | |||||||
| Robert E. Weiss |
2009 | $ | 283,696 | $ | 207,500 | (2) | $ | — | $ | — | $ | 7,606 | (4) | $ | 498,802 | ||||||||
| Chief Technology Officer |
2008 | $ | 246,000 | $ | 871,000 | (1) | $ | 573,300 | (3) | $ | — | $ | 7,624 | (5) | $ | 1,697,924 | |||||||
| Patrick J. Forkin III |
2009 | $ | 225,346 | $ | 186,750 | (2) | $ | — | $ | — | $ | 18,987 | (4) | $ | 431,083 | ||||||||
| Sr. VP Corp Dev. & Strategy |
2008 | $ | 58,962 | $ | 210,000 | (1) | $ | 364,500 | (3) | $ | — | $ | 4,696 | (5) | $ | 638,158 | |||||||
| Stephan J. DeLuca |
2009 | $ | 216,049 | $ | — | $ | — | $ | — | $ | 22,822 | (4) | $ | 238,870 | |||||||||
| Chief Executive Officer |
2008 | $ | 251,923 | $ | 547,500 | (1) | $ | 423,000 | (3) | $ | — | $ | 43,674 | (5) | $ | 1,266,097 | |||||||
| Robert G. Aldrich |
2009 | $ | 183,000 | $ | 207,500 | (2) | $ | — | $ | — | $ | — | $ | 390,500 | |||||||||
| Chief Executive Officer |
|||||||||||||||||||||||
| (1) | Represents the total fair market value on the date of grant, of restricted stock granted during the year ended December 31, 2008. Fiscal year 2008 restricted stock awards vest one-third per year beginning on the vesting commencement date, with the exception of a restricted stock award granted to Mr. Weiss on July 22, 2008, with a fair market value of $340,000 that fully vested on December 29, 2008. Amounts listed do not represent the actual current fair value of the shares granted. |
| (2) | Represents the total fair market value on the date of grant, of restricted stock units granted during the year ended December 31, 2009. These restricted stock units vested on February 28, 2010 with the exception of Mr. Steckel and Mr. Aldrich. Mr. Steckel’s restricted stock units vested on February 15, 2010 and Mr. Aldrich’s restricted stock units vested on October 20, 2009. |
| (3) | Represents fair market value of options granted during the year ended December 31, 2008, calculated using the Black-Scholes option pricing model and related assumptions as disclosed in Note 4, Share Based Compensation, of our financial statements. |
| (4) | All other compensation for 2009 consists of medical premiums paid by us and relocation costs. |
| Medical Premiums | Relocation Costs | |||||
| William S. Steckel |
$ | 18,838 | $ | 32,000 | ||
| Robert E. Weiss |
7,606 | — | ||||
| Patrick J. Forkin III |
18,987 | — | ||||
| Stephan J. DeLuca |
16,822 | 6,000 | ||||
| (5) | All other compensation for 2008 consists of medical premiums paid by us and relocation costs. |
| Medical Premiums | Relocation Costs | |||||
| William S. Steckel |
$ | 13,088 | $ | 19,365 | ||
| Robert E. Weiss |
7,624 | — | ||||
| Patrick J. Forkin III |
4,696 | — | ||||
| Stephan J. DeLuca |
13,674 | 30,000 | ||||
35
Table of Contents
Employment Agreements
Each executive officer serves at the discretion of our board of directors. We have entered into employment contracts with all of our executive officers with initial terms of three-years. The agreements automatically extend for subsequent one-year periods on the anniversary date unless either party gives the other 90 days written notice prior to the anniversary date of the intent not to renew the agreement. Under the employment agreement, the executive officer is entitled to participate in an annual bonus and management incentive program and to benefits offered to other similarly situated employees as established by the Board from time to time.
Magnus Ryde
Mr. Ryde joined us as Chief Executive Officer on February 15, 2010. His base salary is $300,000. However, during the period through December 31, 2010, the Company may, at its sole option, defer up to one-half of the base salary payments with such deferred payments due and payable in full upon the earlier to occur of: (i) the consummation of a capital raising transaction or (ii) December 31, 2010. The agreement has an initial term of three years and automatically extends for subsequent one-year periods on the anniversary date unless either party gives the other 90 days written notice prior to the anniversary date of the intent not to renew the agreement.
Patrick J. Forkin III
We entered into an amended and restated employment agreement with Patrick Forkin as our Sr. Vice President, Corporate Development & Strategy on July 9, 2009. His base salary was $240,000. The agreement has an initial term of three years and automatically extends for subsequent one-year periods on the anniversary date unless either party gives the other 90 days written notice prior to the anniversary date of the intent not to renew the agreement.
Robert E. Weiss
On April 3, 2006, we entered into an employment agreement with Robert E. Weiss, as our Vice President, Equipment Division, effective on April 1, 2006. His base salary was $175,000. The agreement has an initial term of three years and automatically extends for subsequent one-year periods on the anniversary date unless either party gives the other 90 days written notice prior to the anniversary date of the intent not to renew the agreement. Mr. Weiss was appointed Chief Technology Officer in May 2007. On July 22, 2008, the Compensation Committee approved a change in compensation for Mr. Weiss. Effective August 1, 2008, Mr. Weiss’s annual base salary increased to $285,000.
The agreement with Mr. Weiss was amended in December 2008 to clarify the manner in which the agreement complies with recent changes to applicable tax laws, including Section 409A of the Internal Revenue Code of 1986, as amended (the “Code”). In particular, the Restated Employment Agreement (i) exempts the arrangements from the Code, and (ii) provides a “back stop” to implement a 6-month delay in payment if the revised arrangements are, in the future, deemed to be “deferred compensation” for purposes of the Code.
Under the agreement, the Non-Renewal severance consists of (i) a pro-rata portion of the Executive’s Regular Severance pay; (ii) payment of premiums for continued medical and any other applicable health insurance coverage under COBRA; and (iii) the vesting of a pro-rata portion of any unvested equity compensation awards that would have vested within twelve months of the termination date.
Payments Upon Termination or Change in Control
Each named executive officer may terminate his employment agreement for “good reason”. We may terminate each agreement at any time for “cause” or in the event of the named executive officer’s disability or death. If we terminate for “cause”, the named executive officer’s obligations cease after a specific termination procedure process. If we terminate “without cause” or the named executive officer terminates for “good reason”,
36
Table of Contents
the named executive officer is entitled to one year base salary, the amount of incentive compensation paid in the prior year under the applicable incentive program, and vesting of restricted stock, warrants, or options that would vest over the 12 months immediately following the cessation of employment. In the event that the agreement is terminated because of death, all obligations to the named executive officer immediately cease, except for benefits accrued to date. In the event of disability preventing the named executive officer from substantially performing his duties, we may terminate for “cause.”
If the named executive officer’s contract is terminated (or, in Mr. Ryde’s case, if he elects to terminate his contract) after a “change in control”, the named executive officer is entitled to a multiple of base salary, plus the target amount of incentive pay under the management incentive program. In addition, all unvested warrants, options or restricted stock then held by executive, if any, shall vest automatically on the termination of executive’s employment. Mr. Ryde’s multiple is 2.5, and Mr. Forkin and Mr. Weiss’s multiple is 2.0. A “change in control”, as defined, includes (a) a consolidation or merger in which the Company is not the continuing or surviving corporation, (b) a recapitalization in which any person becomes the 50% owner and 50% of the membership of the board of directors changes commensurate with the transaction, (c) any transaction in which substantially all the assets of the corporation are to be liquidated, and (d) any person becoming the beneficial owner of more than 50% of our voting power. Each Agreement contains an eighteen month non-solicitation provision that restricts each named executive officer from directly or indirectly soliciting our current employees or key suppliers to engage in a business relationship with any person or entity that engages in or plans to engage in the design, development, invention, implementation, application, manufacture, production, marketing, sale or license of any product or service in the direct competition with the Company’s products or services. For purposes of the agreement, our products or services are defined as CIGS-based PV products manufactured by a continuous process and/or on a flexible media. For purposes of the agreement, our products or services are defined as CIGS-based PV products manufactured by a continuous process and/or on a flexible media.
Under the agreement the parties are compelled to engage in Arbitration to resolve any disputes.
37
Table of Contents
The following table sets forth information concerning the outstanding equity awards granted to the named executive officers at December 31, 2009.
Outstanding Equity Awards at Fiscal Year End Table
| Option Awards | Stock Awards | |||||||||||||
| Name |
Number of Securities Underlying Unexercised Options (#) |
Option Exercise Price ($/Sh) |
Option Expiration Date |
Number of Shares or Units of Stock That Have Not Vested (#) |
Market Value of Shares or Units of Stock That Have Not Vested($)(1) | |||||||||
| Exercisable | Unexercisable | |||||||||||||
| William S. Steckel |
115,585 | 231,170 | (2) | 3.16 | 8-11-2018 | — | — | |||||||
| — | — | — | — | 100,000 | (3) | 41,000 | ||||||||
| — | — | — | — | 250,000 | (4) | 102,500 | ||||||||
| Robert E. Weiss |
70,000 | 140,000 | (5) | 3.54 | 4-7-2018 | — | — | |||||||
| 133,334 | 66,666 | (6) | 4.94 | 10-4-2017 | — | — | ||||||||
| 2,844 | 406 | (7) | 8.77 | 6-19-2016 | — | — | ||||||||
| — | — | — | — | 250,000 | (4) | 102,500 | ||||||||
| — | — | — | — | 100,000 | (8) | 41,000 | ||||||||
| — | — | — | — | 16,666 | (9) | 6,833 | ||||||||
| — | — | — | — | 3,531 | (10) | 1,448 | ||||||||
| — | — | — | — | 3,750 | (11) | 1,538 | ||||||||
| Patrick J. Forkin III |
125,000 | — | 0.88 | 11-21-2018 | — | — | ||||||||
| 50,000 | 100,000 | (12) | 2.80 | 9-22-2018 | — | — | ||||||||
| — | — | — | — | 225,000 | (4) | 92,250 | ||||||||
| — | — | — | — | 50,000 | (13) | 20,500 | ||||||||
| (1) | Based on closing price of DayStar’s common stock on December 31, 2009 of $0.41. |
| (2) | Stock options vest at a rate of one-third of the grant per year beginning on August 11, 2009. |
| (3) | Restricted stock award vests at a rate of one-third of the grant on each of June 25, 2009, June 25, 2010 and June 25, 2011. |
| (4) | Restricted stock unit award vests on February 28, 2010. |
| (5) | Stock options vest at a rate of one-third of the grant per year beginning on April 7, 2009. |
| (6) | Stock options vest at a rate of one-third of the grant on each of January 1, 2008, January 1, 2009, January 1, 2010. |
| (7) | One-fourth of the stock option grants vest on the one-year anniversary of the grant date, June 19, 2006, with monthly vesting thereafter. |
| (8) | Restricted stock award vests at a rate of one-third of the grant per year commencing on April 7, 2009. |
| (9) | Restricted stock award vests at a rate of one-third of the grant per year commencing on April 1, 2008. |
| (10) | Restricted stock award vests at a rate of one-fourth of the grant per year commencing on the one-year anniversary of the grant date, June 19, 2006. |
| (11) | Restricted stock award vests at a rate of one-fourth of the grant per year commencing on the one-year anniversary of the grant date, January 2, 2006. |
| (12) | Stock options vest at a rate of one-third of the grant per year beginning on September 22, 2009. |
| (13) | Restricted stock award vests at a rate of one-third of the grant per year commencing on September 22, 2009. |
38
Table of Contents
Director Compensation
Effective January 1, 2008, our director compensation policy was revised to be more reflective of the compensation practices of our peer companies. Under the revised policy, upon election to the board, non-employee directors receive an automatic grant of a fully vested option to purchase 10,000 shares of our common stock. Additionally, at the beginning of each fiscal year, each non-employee director receives a fully vested option to purchase 10,000 shares of our common stock and a grant of 10,000 fully vested shares of common stock. Both the stock options and unrestricted shares are subject to our Equity Incentive Plan rules and SEC Rule 144, where applicable.
Under the current policy, each non-employee director receives an annual retainer of $15,000 payable quarterly in advance, plus a $1,000 meeting fee for each meeting of the board of directors or a board committee meeting the director attends. In addition, the committee members receive retainers, payable quarterly in arrears, as follows: 1) audit committee chairman $6,000 and members $3,000; 2) compensation committee chairman $4,000 and members $2,000; and 3) nominating and governance committee chairman $2,000 and members $1,000. The audit committee also receives meeting fees of $2,000 for the chairman and $1,000 for each member. The compensation, nominating and governance, and executive committee chairmen and members each receive $1,000 per meeting, payable quarterly in arrears. Our chairman does not receive any additional compensation.
In order to preserve our cash resources, effective July 1, 2009, the Board of Directors agreed to accept restricted stock unit (“RSU”)’s in lieu of cash payments for board and committee meeting fees. Under this arrangement each board member received 50,000 RSUs in lieu of cash fees for the remainder of their current term. As of January 25, 2010, the compensation arrangements for the independent board members for 2010 is an option to purchase 100,000 of the Company’s common stock and 100,000 RSUs. As was the policy of the previous board, these equity grants are in lieu of cash fees for 2010.
The following Director Compensation Table summarizes the compensation of our non-employee directors for services rendered to DayStar during the year ended December 31, 2009:
Director Compensation Table
| Name |
Fees Earned or Paid in Cash |
Stock Awards(1) |
Stock Unit Awards(2) |
Option Awards(3) |
Total | ||||||||||
| Robert G. Aldrich(4) |
$ | 30,000 | $ | 10,000 | $ | — | $ | 7,300 | $ | 47,300 | |||||
| Kevin S. Flannery(5) |
21,500 | 10,000 | 41,000 | 7,300 | 79,800 | ||||||||||
| Randolph A. Graves, Jr.(6) |
24,000 | 10,000 | 36,000 | 7,300 | 77,300 | ||||||||||
| Richard Nevins(7) |
26,000 | 10,000 | 30,500 | 7,300 | 73,800 | ||||||||||
| Scott M. Schecter(7) |
30,000 | 10,000 | 30,500 | 7,300 | 77,800 | ||||||||||
| Robert Tonsoo(8) |
— | — | — | 7,300 | 7,300 | ||||||||||
| Francis J. Maher(8) |
— | — | — | 7,300 | 7,300 | ||||||||||
| Wen Hung Tsai(8)(9) |
— | — | — | 7,300 | 7,300 | ||||||||||
| (1) | Represents total fair market value of stock awards on grant date. |
| (2) | Represents total fair market value of stock unit awards on issuance date. |
| (3) | Represents fair market value of options granted during the year ended December 31, 2009, calculated using the Black-Scholes option pricing model and related assumptions as disclosed in Note 4, Share Based Compensation, of our financial statements. |
| (4) | Dr. Aldrich resigned on October 20, 2009. |
| (5) | Mr. Flannery resigned on September 21, 2009. |
| (6) | Dr. Graves resigned on September 27, 2009. |
| (7) | Messrs. Nevins and Schecter resigned on September 14, 2009. |
| (8) | Messrs. Tonsoo, Maher and Tsai joined the board on September 21, 2009. |
| (9) | Messrs. Tsai resigned on October 3, 2009. |
39
Table of Contents
There were additional board members who joined in 2009 who did not receive compensation n 2009. Mr. Peter A. Lacey joined the Board on September 21, 2009. Mr. Richard Green and Mr. Jonathan Fitzgerald joined the Board on November 9, 2009 and Dr. Kang Sun joined the Board on November 17, 2009.
In addition to the fees listed above, we reimburse the directors for their travel expenses incurred in attending meetings of the Board or its committees, as well as for fees and expenses incurred in attending director education seminars and conferences. The directors do not receive any other compensation or personal benefits.
| Item 12. | Security Ownership of Certain Beneficial Owners and Management and Related Stockholder Matters |
Equity Compensation Plan Information
On June 19, 2006, we adopted an Equity Incentive Plan (“the 2006 Plan”) to enable employees, outside directors and consultants to acquire an equity interest in DayStar. Issuances under the 2006 Plan may be in the form of incentive and non-qualified stock options, restricted stock, stock award units and stock appreciation rights. In September 2008, our stockholders approved the Amended and Restated 2006 Equity Incentive Plan (the “2006 Amended and Restated Plan”). The 2006 Amended and Restated Plan provides for the grant of incentive and non-qualified stock options, stock appreciation rights, restricted stock awards, restricted stock unit awards, performance stock awards, performance cash awards and other stock awards to employees, directors, and consultants. The 2006 Amended and Restated Plan reserves 10,950,000 of our authorized shares of common stock for issuance for these purposes. Under the 2006 Amended and Restated Plan, the term of stock options shall not exceed ten years and stock options shall not be granted with an exercise price of less than 100% of the fair market value of our common stock, measured at the time of grant.
Grants of incentive and non-qualified stock options, and restricted stock prior to June 19, 2006 were made from our original Equity Incentive Plan adopted in 2003 (the “2003 Plan”). The 2003 Plan reserves 1,050,000 of our authorized shares of common stock for issuance for these purposes.
The following table gives information about our common stock that may be issued upon the exercise of options, warrants or rights under our existing equity compensation plan, consisting of the 2003 and 2006 Equity Incentive Plans. The information in this table is as of December 31, 2009.
| Plan Category |
Number of securities to be issued upon exercise of outstanding options, warrants and rights |
Weighted average exercise price of outstanding options, warrants, and rights |
Number of securities remaining available | |||||
| Equity compensation plans approved by security holders |
2,576,032 | (1) | $ | 4.00 | 5,528,482 | |||
| Equity compensation plans not approved by security holders |
— | — | — | |||||
| Total |
2,576,032 | $ | 4.00 | 5,528,482 | ||||
| (1) | Does not include 1,558,626 outstanding shares of restricted stock and 1,584,500 outstanding restricted stock units granted to certain of our officers, directors, employees and consultants, under the 2003 and 2006 Plans or 59,360 options and 693,000 restricted stock units which have been exercised for common stock. |
40
Table of Contents
Security Ownership of Certain Beneficial Owners and Management and Related Stockholder Matters
The following table sets forth information, as of February 28, 2010, with respect to the beneficial ownership of the our common stock by each person who is known to us to be the beneficial owner of more than five percent of our outstanding common stock by each nominee for director, by the named executive officers, and by all directors and executive officers as a group. The information contained in this beneficial ownership table for five percent stockholders is based on Form 13D, 13G, or other filings with the Commission available through www.sec.gov/edgar as of close of business March 9, 2010. Each person has sole voting power and sole investment power. Ownership percentages are based on 33,980,612 shares outstanding on February 28, 2010, plus the assumed exercise of the applicable options vesting within 60 days thereof.
| Name of Beneficial Owner(1) |
Number of Shares Beneficially Owned(2) |
Percent | |||
| Directors and Executive Officers: |
|||||
| William S. Steckel(3) |
492,585 | 1.4 | % | ||
| Patrick J. Forkin III(4) |
600,000 | 1.7 | % | ||
| Robert E. Weiss(5) |
926,305 | 2.7 | % | ||
| Magnus Ryde(6) |
1,500,000 | 4.2 | % | ||
| Peter A. Lacey(7) |
6,640,000 | 16.4 | % | ||
| Jonathan Fitzgerald(8) |
100,000 | * | |||
| Richard C. Green(9) |
100,000 | * | |||
| Francis J. Maher III(10) |
110,000 | * | |||
| Kang Sun(11) |
100,000 | * | |||
| Robert Tonsoo(12) |
110,000 | * | |||
| All directors and executive officers as a group (10 persons) |
10,678,890 | 24.2 | % | ||
| 5% Stockholders: |
|||||
| N/A |
— | ||||
| * | Less than one percent. |
| (1) | Except as otherwise indicated, each officer and director can be reached at DayStar Technologies, Inc., 2972 Stender Way, Santa Clara CA 95054. |
| (2) | The inclusion herein of any share of common stock deemed beneficially owned does not constitute an admission of beneficial ownership of those shares. Each person listed above has sole voting and investment power with respect to the shares listed. Any reference in the footnotes below to stock options and restricted common stock subject to a right of repurchase by our company relates to stock options exercisable or that will become exercisable within 60 days of January 31, 2010 and restricted common stock that will vest within 60 days of January 31, 2010. |
| (3) | Includes vested options to purchase 115,585 shares of common stock, 250,000 vested restricted stock units and 100,000 shares of restricted common stock subject to a right of repurchase by our company. |
| (4) | Includes vested options to purchase 275,000 shares of common stock, 250,000 vested restricted stock units and 50,000 shares of restricted common stock subject to a right of repurchase by our company. |
| (5) | Includes vested options to purchase 339,645 shares of common stock, 250,000 vested restricted stock units and 103,531 shares of restricted common stock subject to a right of repurchase by our company. |
| (6) | Includes vested options to purchase 1,500,000 shares of common stock. |
| (7) | Includes 3,333,333 shares of common stock issuable upon conversion of a secured convertible promissory note between Mr. Lacey and our company, vested warrants to purchase 3,166,667 shares of common stock, vested options to purchase 50,000 shares of common stock and 50,000 vested restricted stock units. |
| (8) | Includes vested options to purchase 50,000 shares of common stock and 50,000 vested restricted stock units. |
| (9) | Includes vested options to purchase 50,000 shares of common stock and 50,000 vested restricted stock units. |
| (10) | Includes vested options to purchase 60,000 shares of common stock and 50,000 vested restricted stock units. |
| (11) | Includes vested options to purchase 50,000 shares of common stock and 50,000 vested restricted stock units. |
| (12) | Includes vested options to purchase 60,000 shares of common stock and 50,000 vested restricted stock units. |
41
Table of Contents
Item 13. Certain Relationships and Related Transactions, and Director Independence
The Board of Directors has determined that a majority of its directors presently meet the independence standards under the applicable Nasdaq rules. These directors are Messrs. Lacey, Fitzgerald, Green, Sun and Tonsoo.
Item 14. Principal Accounting Fees and Services
The following table shows the fees paid or accrued for the audit and other services provided by Hein & Associates LLP for 2009 and 2008.
| FY 2009 | FY 2008 | |||||
| Audit Fees |
$ | 107,589 | $ | 201,898 | ||
| Audit-Related Fees |
— | — | ||||
| Tax Fees |
— | — | ||||
| All Other Fees |
— | — | ||||
| Total |
$ | 107,589 | $ | 201,898 | ||
Audit services of Hein & Associates LLP for fiscal 2009 and 2008 consisted of the annual examination of our financial statements and quarterly reviews of the interim financial statements included in our reports on Form 10-Q.
The Audit Committee has adopted policies and procedures to pre-approve all services to be performed by Hein & Associates. Specifically the committee’s policy is to pre-approve the use of Hein & Associates for audit services as well as detailed, specific types of services within the categories of audit-related and non-audit services described above: and procedures required to meet certain regulatory requirements. The committee will not approve any service prohibited by regulation and does not anticipate approving any service in addition to the categories described above. In each case, the committee’s policy is to pre-approve a specific annual budget by category which the company anticipates obtaining from Hein & Associates, and has required management to report the actual fees (versus budgeted fees) to the committee on a periodic basis throughout the year. In addition, any new, unbudgeted engagement for audit services or within one of the other pre-approved categories described above must be pre-approved by the committee or its chair. All of the services described above were approved in advance by the Audit Committee.
42
Table of Contents
| Item 15. | Exhibits, Financial Statement Schedules |
a. The following financial statements are included herein:
| Report of Independent Registered Public Accounting Firm |
| Balance Sheets—December 31, 2009 and December 31, 2008 |
| Statements of Operations—For the Years Ended December 31, 2009 and 2008 and For the Period From July 1, 2005 (Inception of the Development Stage) to December 31, 2009 |
| Statements of Changes in Stockholders’ Equity—For the Period From July 1, 2005 (Inception of the Development Stage) to December 31, 2009 |
| Statements of Cash Flows—For the Years Ended December 31, 2009 and 2008 and For the Period From July 1, 2005 (Inception of the Development Stage) to December 31, 2009 |
| Notes to Financial Statements |
b. The following exhibits are filed as part of this report:
| Exhibit |
Exhibit Title | |
| 3.1(1) | Amended and Restated Certificate of Incorporation. | |
| 3.2(2) | Certificate of Amendment of Amended and Restated Certificate of Incorporation. | |
| 3.3(3) | Amended and Restated Bylaws. | |
| 3.4(4) | Certificate of Designations, Preferences and Rights of a Series of Preferred Stock classifying and designating the Series A Junior Participating Cumulative Preferred Stock. | |
| 4.1(4) | Stockholder Rights Agreement, dated as of May 6, 2008 between the Company and Computershare Trust Company, N.A., as Rights Agent. | |
| 4.2(5) | Form of Common Stock Certificate. | |
| 4.3(5) | Form of Class A Public Warrant. | |
| 4.4(5) | Form of Class B Public Warrant. | |
| 4.5(5) | Form of Unit Certificate. | |
| 4.6(5) | Form of Warrant Agent Agreement. | |
| 4.7(5) | Form of Representative’s Warrant. | |
| 10.1(6) | Registration Rights Agreement by and between the Company and Castlerigg Master Investments Ltd., dated January 19, 2007. | |
| 10.2(6) | Registration Rights Agreement by and between the Company and LC Capital Master Fund, Ltd., dated January 19, 2007. | |
| 10.3(6) | Registration Rights Agreement by and among the Company, Millennium Partners, L.P., Phoenix Partners, LP, Phoenix Partners II, LP, Phaeton International (BVI), Ltd. and PreX Capital Partners, LLC, dated January 19, 2007. | |
| 10.4(6) | Class A Warrant to purchase shares of common stock issued to Castlerigg Master Investments Ltd. on January 19, 2007. | |
43
Table of Contents
| Exhibit |
Exhibit Title | |
| 10.5(7) | Amended and Restated Agreement of Contract of Purchase and Supply by and between the Company and Blitzstrom GmbH, dated October 6, 2006. | |
| 10.6(5) | Form of Indemnification Agreement by and between the Company and its directors. | |
| 10.7(5) | Form of Indemnification Agreement by and between the Company and its officers. | |
| 10.8*(5) | Form of Employee Notice of Stock Option Grant related to 2003 Equity Incentive Plan. | |
| 10.9*(5) | Form of Employee Restricted Stock Issuance Agreement related to 2003 Equity Incentive Plan. | |
| 10.10(8) | Agreement by and between the Company and New York State Energy Research and Development Authority, dated December 2, 2004. | |
| 10.11(9) | Amended and Restated Agreement of Contract of Purchase and Supply by and between the Company and Blitzstrom GmbH, dated May 11, 2007. | |
| 10.12*(10) | Employment Agreement by and between the Company and Ratson Morad, dated February 19, 2008. | |
| 10.13*(11) | Employment Agreement by and between the Company and Robert Weiss dated April 3, 2006. | |
| 10.14*(5) | 2003 Equity Incentive Plan. | |
| 10.15(18) | First Amendment to the Registration Rights Agreement by and among the Company, Millenium Partners L.P., Phoenix Partners, LP, Phaeton International (BVI), Ltd. and PreX Capital Partners, LLC, dated May 29, 2007. | |
| 10.16(18) | First Amendment to the Registration Rights Agreement by and between the Company and LC Capital Master Fund, Ltd., dated May 29, 2007. | |
| 10.17(12) | Second Amendment to the Registration Rights Agreement by and among the Company, Millenium Partners L.P., Phoenix Partners, LP, Phaeton International (BVI), Ltd. and PreX Capital Partners, LLC, dated August 3, 2007. | |
| 10.18(12) | Second Amendment to the Registration Rights Agreement by and between the Company and LC Capital Master Fund, Ltd., dated August 3, 2007. | |
| 10.19*(13) | Amended and Restated 2006 Equity Incentive Plan. | |
| 10.20*(25) | Form of Employee Stock Option Agreement related to Amended and Restated 2006 Equity Incentive Plan. | |
| 10.21*(25) | Form of Employee Restricted Stock Issuance Agreement related to Amended and Restated 2006 Equity Incentive Plan. | |
| 10.22*(25) | Form of Employee Restricted Stock Unit Issuance Agreement related to Amended and Restated 2006 Equity Incentive Plan. | |
| 10.23(14) | Lease Agreement between the Company and Sitterly Associates, LLC dated May 25, 2004. | |
| 10.24(14) | Lease Agreement between the Company and Sitcon, LLC dated April 6, 2006. | |
| 10.25(14) | Lease Agreement between the Company and Coronado Stender Associates, LLC dated February 24, 2006. | |
| 10.26(15) | Lease Agreement between the Company and BMR-Gateway Boulevard LLC dated April 29, 2008. | |
| 10.27*(16) | Employment Agreement with William S. Steckel dated June 25, 2008. | |
| 10.28*(17) | Amended and Restated Employment Agreement by and between the Company and Stephan J. DeLuca, dated December 5, 2008. | |
44
Table of Contents
| Exhibit |
Exhibit Title | |
| 10.29*(17) | Amended and Restated Employment Agreement by and between the Company and Ratson Morad, dated December 4, 2008. | |
| 10.30*(17) | Amended and Restated Employment Agreement by and between the Company and Robert E. Weiss, dated December 4, 2008. | |
| 10.31*(19) | Separation Agreement dated May 12, 2009, by and between the Company and Stephan J. DeLuca. | |
| 10.32*(19) | Offer Letter with Robert G. Aldrich dated May 15, 2009. | |
| 10.33*(20) | Form of Restricted Stock Unit Agreement for Employees and Consultants. | |
| 10.34*(20) | Form of Restricted Stock Unit Agreement for Non-Employee Directors. | |
| 10.35(21) | Registration Rights Agreement by and between the Company and TD Waterhouse RRSP Account 240832S, in trust for Peter Alan Lacey, dated September 21, 2009. | |
| 10.36(22) | Registration Rights Agreement by and between the Company and Mike Moretti, dated January 6, 2010. | |
| 10.37(23) | Registration Rights Agreement by and between the Company and Tejas Securities Group, Inc. 401k Plan and Trust, FBO John J. Gorman, John J. Gorman TTEE, dated February 11, 2010. | |
| 10.38*(24) | Employment Agreement by and between the Company and Magnus Ryde, dated February 15, 2010. | |
| 23.1 | Consent of Hein & Associates LLP. | |
| 24.1 | Power of Attorney (included in the signature page hereto) | |
| 31.1 | Certification of the Chief Executive Officer Pursuant to Rule 13a-14(a) under the Securities Exchange Act of 1934. | |
| 31.2 | Certification of the Chief Accounting Officer Pursuant to Rule 13a-14(a) under the Securities Exchange Act of 1934. | |
| 32.1 | Certification of the Chief Executive Officer pursuant to 18 U.S.C. Section 1350, as adopted pursuant to Section 906 of the Sarbanes-Oxley Act of 2002. | |
| 32.2 | Certification of the Chief Accounting Officer pursuant to 18 U.S.C. Section 1350, as adopted pursuant to Section 906 of the Sarbanes-Oxley Act of 2002. | |
| * | Management contract or compensatory plan or arrangement |
| (1) | Incorporated by reference to our Quarterly Report on Form 10-QSB filed with the SEC on August 11, 2006. |
| (2) | Incorporated by reference to our Quarterly Report on Form 10-Q filed with the SEC on November 14, 2008. |
| (3) | Incorporated by reference to our Quarterly Report on Form 10-Q filed with the SEC on August 7, 2008. |
| (4) | Incorporated by reference to our Registration Statement on Form 8-A filed with the SEC on May 8, 2008. |
| (5) | Incorporated by reference to our Registration Statement on Form SB-2 filed with the SEC on November 7, 2003, as amended. |
| (6) | Incorporated by reference to our Current Report on Form 8-K filed with the SEC on January 25, 2007. |
| (7) | Incorporated by reference to our Registration Statement on Form SB-2 filed with the SEC on February 20, 2007. |
| (8) | Incorporated by reference to our Annual Report on Form 10-KSB filed with the SEC on March 18, 2005. |
| (9) | Incorporated by reference to our Quarterly Report on Form 10-QSB filed with the SEC on May 15, 2007. |
| (10) | Incorporated by reference to our Current Report on Form 8-K filed with the SEC on February 25, 2008. |
| (11) | Incorporated by reference to our Current Report on Form 8-K filed with the SEC on April 7, 2006. |
45
Table of Contents
| (12) | Incorporated by reference to our Quarterly Report on Form 10-QSB filed with the SEC on August 3, 2007. |
| (13) | Incorporated by reference to our Current Report on Form 8-K filed with the SEC on September 26, 2008. |
| (14) | Incorporated by reference to our Annual Report on Form 10-KSB filed with the SEC on March 1, 2007. |
| (15) | Incorporated by reference to our Quarterly Report on Form 10-Q filed with the SEC on May 5, 2008. |
| (16) | Incorporated by reference to our Current Report on Form 8-K filed with the SEC on June 27, 2008. |
| (17) | Incorporated by reference to our Current Report on Form 8-K filed with the SEC on December 10, 2008. |
| (18) | Incorporated by reference to our Current Report on Form 8-K filed with the SEC on June 4, 2007. |
| (19) | Incorporated by reference to our Current Report on Form 8-K filed with the SEC on May 18, 2009. |
| (20) | Incorporated by reference to our Current Report on Form 8-K filed with the SEC on July 2, 2009. |
| (21) | Incorporated by reference to our Current Report on Form 8-K filed with the SEC on September 24, 2009. |
| (22) | Incorporated by reference to our Current Report on Form 8-K filed with the SEC on January 12, 2010. |
| (23) | Incorporated by reference to our Current Report on Form 8-K filed with the SEC on February 18, 2010. |
| (24) | Incorporated by reference to our Current Report on Form 8-K filed with the SEC on February 17, 2010. |
| (25) | Incorporated by reference to our Annual Report on Form 10-K filed with the SEC on March 16, 2009. |
46
Table of Contents
In accordance with Section 13 or 15(d) of the Exchange Act, the registrant caused this report to be signed on its behalf by the undersigned, thereunto duly authorized on March 19, 2010.
| DAYSTAR TECHNOLOGIES, INC. | ||
| By: | /S/ MAGNUS RYDE | |
| Magnus Ryde Chief Executive Officer | ||
| By: | /S/ CHRISTOPHER T. LAIL | |
| Christopher T. Lail Vice President & Corporate Controller (Chief Accounting Officer) | ||
POWER OF ATTORNEY
KNOW ALL PERSONS BY THESE PRESENTS, that each person whose signature appears below constitutes and appoints Magnus Ryde as his true and lawful attorney-in-fact and agent, with the full power of substitution for him, and in his name and in any and all capacities, to sign any and all amendments to this Annual Report on Form 10-K, and to file the same, with exhibits thereto and other documents in connection therewith, with the Securities and Exchange Commission, granting unto said attorney-in-fact and agent full power and authority to do and perform each and every act and thing requisite and necessary to be done therewith, as fully to all intents and purposes as he might or could do in person, hereby ratifying and confirming that said attorney-in-fact and agent or his substitute or substitutes, may lawfully do or cause to be done by virtue hereof.
In accordance with the Exchange Act, this Report has been signed below by the following persons on behalf of the Registrant and in the capacities indicated, on March 19, 2010.
| Signature |
Capacities |
Date | ||
| /S/ PETER A. LACEY Peter A. Lacey |
Chairman | March 19, 2010 | ||
| /S/ MAGNUS RYDE Magnus Ryde |
Director and Chief Executive Officer (Principal Executive Officer) | March 19, 2010 | ||
| /S/ JONATHAN FITZGERALD Jonathan Fitzgerald |
Director | March 19, 2010 | ||
| /S/ WILLIAM S. STECKEL William S. Steckel |
Director | March 19, 2010 | ||
| /S/ KANG SUN Kang Sun |
Director | March 19, 2010 | ||
| /S/ ROBERT TONSOO Robert Tonsoo |
Director | March 19, 2010 | ||
47
Table of Contents
INDEX TO FINANCIAL STATEMENTS
| PAGE | ||
| F-2 | ||
| F-3 | ||
F-4 | ||
F-5 | ||
F-6 | ||
| F-7 | ||
F-1
Table of Contents
REPORT OF INDEPENDENT REGISTERED PUBLIC ACCOUNTING FIRM
To the Board of Directors
DayStar Technologies, Inc.
Santa Clara, California
We have audited the accompanying balance sheets of DayStar Technologies, Inc. as of December 31, 2009 and 2008, and the related statements of operations, changes in stockholders’ equity and cash flows for the years ended December 31, 2009 and 2008 and for the period from July 1, 2005 (inception of the development stage) to December 31, 2009. These financial statements are the responsibility of the Company’s management. Our responsibility is to express an opinion on these financial statements based on our audits.
We conducted our audits in accordance with the standards of the Public Company Accounting Oversight Board (United States). Those standards require that we plan and perform the audit to obtain reasonable assurance about whether the financial statements are free of material misstatement. An audit includes examining, on a test basis, evidence supporting the amounts and disclosures in the financial statements. An audit also includes assessing the accounting principles used and significant estimates made by management, as well as evaluating the overall financial statement presentation. We believe that our audits provide a reasonable basis for our opinion.
In our opinion, the financial statements referred to above present fairly, in all material respects, the financial position of DayStar Technologies, Inc. as of December 31, 2009 and 2008, and the results of its operations and its cash flows for the years ended December 31, 2009 and 2008 and for the period from July 1, 2005 (inception of the development stage) to December 31, 2009, in conformity with accounting principles generally accepted in the United States of America.
The accompanying financial statements have been prepared assuming that the Company will continue as a going concern. As discussed in Note 2 the Company will require substantial funds beyond its current cash on hand to fully continue its development efforts, build-out its initial manufacturing line and commence commercial shipments. This raises substantial doubt about the Company’s ability to continue as a going concern. Management’s plans in regard to these matters are also described in Note 2 to the financial statements. The financial statements do not include any adjustments that might result from the outcome of this uncertainty.
We were not engaged to examine management’s assessment of the effectiveness of DayStar Technologies, Inc.’s internal control over financial reporting as of December 31, 2009, included in the accompanying Management’s Report On Internal Control Over Financial Reporting and, accordingly, we do not express an opinion thereon.
/s/ HEIN & ASSOCIATES LLP
Irvine, California
March 19, 2010
F-2
Table of Contents
(A DEVELOPMENT STAGE ENTERPRISE)
BALANCE SHEETS
| December 31, 2009 |
December 31, 2008 |
|||||||
| ASSETS | ||||||||
| Current Assets: |
||||||||
| Cash and cash equivalents |
$ | 17,320 | $ | 17,120,401 | ||||
| Other current assets |
343,083 | 543,357 | ||||||
| Total current assets |
360,403 | 17,663,758 | ||||||
| Property and Equipment, at cost |
52,915,965 | 46,022,825 | ||||||
| Less accumulated depreciation and amortization |
(6,388,914 | ) | (8,942,105 | ) | ||||
| Net property and equipment |
46,527,051 | 37,080,720 | ||||||
| Other Assets: |
||||||||
| Other assets |
246,396 | 204,108 | ||||||
| Total Assets |
$ | 47,133,850 | $ | 54,948,586 | ||||
| LIABILITIES AND STOCKHOLDERS’ EQUITY | ||||||||
| Current Liabilities: |
||||||||
| Accounts payable and accrued expenses |
$ | 18,387,530 | $ | 7,554,814 | ||||
| Notes and capital leases payable, current portion |
1,629,587 | 171,983 | ||||||
| Deferred rent, current portion |
139,870 | 175,212 | ||||||
| Deferred revenue and gain |
— | 420,000 | ||||||
| Total current liabilities |
20,156,987 | 8,322,009 | ||||||
| Long-Term Liabilities: |
||||||||
| Deferred rent |
3,452,790 | 2,951,557 | ||||||
| Conversion feature |
251,618 | — | ||||||
| Stock warrants |
131,835 | 125,481 | ||||||
| Total long-term liabilities |
3,836,243 | 3,077,038 | ||||||
| Commitments and Contingencies (Note 7) |
— | — | ||||||
| Stockholders’ Equity: |
||||||||
| Preferred stock, $.01 par value; 3,000,000 shares authorized; 0 shares issued and outstanding |
— | — | ||||||
| Common stock, $.01 par value; 120,000,000 shares authorized; 33,905,612 and 33,438,862 shares issued and outstanding at December 31, 2009 and December 31, 2008, respectively |
339,056 | 334,389 | ||||||
| Additional paid-in capital |
144,805,467 | 140,179,025 | ||||||
| Accumulated deficit |
(10,145,391 | ) | (10,145,391 | ) | ||||
| Deficit accumulated during the development stage |
(111,858,512 | ) | (86,818,484 | ) | ||||
| Total stockholders’ equity |
23,140,620 | 43,549,539 | ||||||
| Total Liabilities and Stockholders’ Equity |
$ | 47,133,850 | $ | 54,948,586 | ||||
See accompanying notes to these financial statements.
F-3
Table of Contents
(A DEVELOPMENT STAGE ENTERPRISE)
STATEMENTS OF OPERATIONS
| For the Years Ended December 31, |
For the Period from July 1, 2005 (Inception of the Development Stage) to December 31, 2009 |
|||||||||||
| 2009 | 2008 | |||||||||||
| Revenue: |
||||||||||||
| Product revenue |
$ | — | $ | — | $ | 3,528 | ||||||
| Research and development contract revenue |
— | — | 615,000 | |||||||||
| Total revenue |
— | — | 618,528 | |||||||||
| Costs and Expenses: |
||||||||||||
| Research and development |
14,741,983 | 17,678,212 | 54,999,898 | |||||||||
| Selling, general and administrative |
6,058,676 | 8,864,142 | 29,477,066 | |||||||||
| Restructuring |
— | — | 3,280,051 | |||||||||
| Depreciation and amortization |
3,534,770 | 3,242,504 | 11,917,226 | |||||||||
| Total costs and expenses |
24,335,429 | 29,784,858 | 99,674,241 | |||||||||
| Other Income (Expense): |
||||||||||||
| Other (expense) income |
(485,494 | ) | 848,409 | 2,263,120 | ||||||||
| Interest expense |
(189,628 | ) | (39,431 | ) | (2,530,615 | ) | ||||||
| Amortization of note discount and financing costs |
(1,096,330 | ) | — | (10,020,275 | ) | |||||||
| Gain on derivative liabilities |
1,066,853 | 2,645,609 | 3,576,440 | |||||||||
| Loss on extinguishment of debt |
— | — | (6,091,469 | ) | ||||||||
| Total other (expense) income |
(704,599 | ) | 3,454,587 | (12,802,799 | ) | |||||||
| Net Loss |
$ | (25,040,028 | ) | $ | (26,330,271 | ) | $ | (111,858,512 | ) | |||
| Weighted Average Common Shares Outstanding (Basic And Diluted) |
33,511,598 | 33,164,993 | ||||||||||
| Net Loss Per Share (Basic and Diluted) |
$ | (0.75 | ) | $ | (0.79 | ) | ||||||
See accompanying notes to these financial statements.
F-4
Table of Contents
(A DEVELOPMENT STAGE ENTERPRISE)
STATEMENTS OF CHANGES IN STOCKHOLDERS’ EQUITY
FOR THE PERIOD FROM JULY 1, 2005 (INCEPTION OF THE DEVELOPMENT STAGE) TO DECEMBER 31, 2009
| Common Stock | Class B Common Stock |
Additional Paid-In Capital |
Deferred Equity Based Compensation |
Accumulated Deficit |
Deficit Accumulated During the Development Stage |
Total | ||||||||||||||||||||||||||
| Shares | Amount | Shares | Amount | |||||||||||||||||||||||||||||
| BALANCES, July 1, 2005 |
5,083,258 | $ | 50,833 | 29,000 | $ | 290 | $ | 22,443,181 | $ | (110,770 | ) | $ | (10,145,391 | ) | $ | — | $ | 12,238,143 | ||||||||||||||
| Exercise of warrants and stock options, 7/05 - 12/05 at $6.00 - $8.25 per share |
1,190,748 | 11,907 | — | — | 7,208,295 | — | — | — | 7,220,202 | |||||||||||||||||||||||
| Conversion of Class B common stock |
58,000 | 580 | (29,000 | ) | (290 | ) | (290 | ) | — | — | — | — | ||||||||||||||||||||
| Share-based compensation |
38,750 | 388 | — | — | 411,912 | (292,940 | ) | — | — | 119,360 | ||||||||||||||||||||||
| Net loss |
— | — | — | — | — | — | — | (3,904,151 | ) | (3,904,151 | ) | |||||||||||||||||||||
| BALANCES, December 31, 2005 |
6,370,756 | $ | 63,708 | — | $ | — | $ | 30,063,098 | $ | (403,710 | ) | $ | (10,145,391 | ) | $ | (3,904,151 | ) | $ | 15,673,554 | |||||||||||||
| Reclassification upon adoption of SFAS 123(R) |
— | — | — | — | (403,710 | ) | 403,710 | — | — | — | ||||||||||||||||||||||
| Exercise of warrants and stock options, 1/06, 3/06 & 9/06 at $2.06 - $7.50 per share |
132,815 | 1,328 | — | — | 670,544 | — | — | — | 671,872 | |||||||||||||||||||||||
| Share-based compensation |
177,062 | 1,771 | — | — | 1,320,949 | — | — | — | 1,322,720 | |||||||||||||||||||||||
| Beneficial conversion feature on convertible note |
— | — | — | — | 1,223,842 | — | — | — | 1,223,842 | |||||||||||||||||||||||
| Shares issued in payment of principal and interest on convertible note, 8/06 - 12/06 |
1,143,036 | 11,430 | — | — | 7,366,729 | — | — | — | 7,378,159 | |||||||||||||||||||||||
| Warrants issued for placement of convertible note at $5.38 per share |
— | — | — | — | 140,419 | — | — | — | 140,419 | |||||||||||||||||||||||
| Net loss |
— | — | — | — | — | — | — | (20,441,201 | ) | (20,441,201 | ) | |||||||||||||||||||||
| BALANCES, December 31, 2006 |
7,823,669 | $ | 78,237 | — | $ | — | $ | 40,381,871 | $ | — | $ | (10,145,391 | ) | $ | (24,345,352 | ) | $ | 5,969,365 | ||||||||||||||
| Exercise of warrants and stock options, 1/07, 3/07, 6/07, 9/07 & 11/07 at $2.00 - $3.45 per share |
518,200 | 5,182 | — | — | 3,169,135 | — | — | — | 3,174,317 | |||||||||||||||||||||||
| Share-based compensation |
196,438 | 1,965 | — | — | 4,088,080 | — | — | — | 4,090,045 | |||||||||||||||||||||||
| Issuance of shares pursuant to offering, 2/07 at $2.00 per share |
2,500,000 | 25,000 | — | — | 4,975,000 | — | — | — | 5,000,000 | |||||||||||||||||||||||
| Issuance of shares pursuant to secondary offering, 10/07 at $4.25 per share, net of offering costs |
17,250,000 | 172,500 | — | — | 67,722,418 | — | — | — | 67,894,918 | |||||||||||||||||||||||
| Shares issued in payment of principal and interest on convertible note, 1/07 at $1.49 per share and 2/07 at $2.00 per share |
3,875,384 | 38,754 | — | — | 7,288,171 | — | — | — | 7,326,925 | |||||||||||||||||||||||
| Loss on extinguishment due to excess of fair market value of shares issued over issuance price |
— | — | — | — | 5,369,278 | — | — | — | 5,369,278 | |||||||||||||||||||||||
| Shares issued for placement of note and offering 3/07 at $2.00 per share |
457,571 | 4,575 | — | — | 2,393,096 | — | — | — | 2,397,671 | |||||||||||||||||||||||
| Net loss |
— | — | — | — | — | — | — | (36,142,861 | ) | (36,142,861 | ) | |||||||||||||||||||||
| BALANCES, December 31, 2007 |
32,621,262 | $ | 326,213 | — | $ | — | $ | 135,387,049 | $ | — | $ | (10,145,391 | ) | $ | (60,488,213 | ) | $ | 65,079,658 | ||||||||||||||
| Exercise of stock options, 6/08 at $3.14 per share |
1,600 | 16 | — | — | 5,008 | — | — | — | 5,024 | |||||||||||||||||||||||
| Share-based compensation |
816,000 | 8,160 | — | — | 4,786,968 | — | — | — | 4,795,128 | |||||||||||||||||||||||
| Net loss |
— | — | — | — | — | — | — | (26,330,271 | ) | (26,330,271 | ) | |||||||||||||||||||||
| BALANCES, December 31, 2008 |
33,438,862 | $ | 334,389 | — | $ | — | $ | 140,179,025 | $ | — | $ | (10,145,391 | ) | $ | (86,818,484 | ) | $ | 43,549,539 | ||||||||||||||
| Share-based compensation |
466,750 | 4,667 | — | — | 4,128,864 | — | — | — | 4,133,531 | |||||||||||||||||||||||
| Warrants issued in connection with convertible note at $0.60 per share |
— | — | — | — | 497,578 | — | — | — | 497,578 | |||||||||||||||||||||||
| Net loss |
— | — | — | — | — | — | — | (25,040,028 | ) | (25,040,028 | ) | |||||||||||||||||||||
| BALANCES, December 31, 2009 |
33,905,612 | $ | 339,056 | — | $ | — | $ | 144,805,467 | $ | — | $ | (10,145,391 | ) | $ | (111,858,512 | ) | $ | 23,140,620 | ||||||||||||||
See accompanying notes to these financial statements.
F-5
Table of Contents
(A DEVELOPMENT STAGE ENTERPRISE)
STATEMENTS OF CASH FLOWS
| For the Years Ended December 31, |
For the Period from July 1, 2005 (Inception of the Development Stage) to December 31, 2009 |
|||||||||||
| 2009 | 2008 | |||||||||||
| Cash Flows from Operating Activities: |
||||||||||||
| Net loss |
$ | (25,040,028 | ) | $ | (26,330,271 | ) | $ | (111,858,512 | ) | |||
| Adjustments to reconcile net loss to cash used in operating activities: |
||||||||||||
| Depreciation and amortization |
3,534,770 | 3,242,504 | 11,917,226 | |||||||||
| Share-based compensation |
4,133,531 | 4,795,128 | 14,598,838 | |||||||||
| Non-cash interest |
165,133 | — | 1,770,217 | |||||||||
| Amortization of note discount and non-cash financing costs |
1,096,330 | — | 9,478,575 | |||||||||
| Gain on derivative liabilities |
(1,066,853 | ) | (2,645,609 | ) | (3,576,440 | ) | ||||||
| Non-cash restructuring |
— | — | 1,278,253 | |||||||||
| Loss on sale of fixed assets |
340,622 | — | 340,622 | |||||||||
| Loss on extinguishment of debt |
— | — | 6,091,469 | |||||||||
| Changes in operating assets and liabilities: |
||||||||||||
| Other assets |
69,680 | (10,560 | ) | (570,791 | ) | |||||||
| Accounts payable and accrued expenses |
(2,047,916 | ) | 3,308,206 | 3,590,513 | ||||||||
| Deferred rent |
465,891 | 1,129,348 | 1,595,239 | |||||||||
| Deferred revenue |
— | (2,333 | ) | 217,618 | ||||||||
| Net cash used in operating activities |
(18,348,840 | ) | (16,513,587 | ) | (65,127,173 | ) | ||||||
| Cash Flows from Investing Activities: |
||||||||||||
| Purchase of investments |
— | (54,300,000 | ) | (71,957,732 | ) | |||||||
| Proceeds from sale of investments |
— | 54,300,000 | 72,662,973 | |||||||||
| Purchase of equipment and improvements |
(2,932,258 | ) | (27,561,599 | ) | (42,570,127 | ) | ||||||
| Proceeds from sale of assets |
1,925,000 | — | 1,928,120 | |||||||||
| Net cash used in investing activities |
(1,007,258 | ) | (27,561,599 | ) | (39,936,766 | ) | ||||||
| Cash Flows from Financing Activities: |
||||||||||||
| Proceeds from sale of stock |
— | — | 78,312,500 | |||||||||
| Proceeds from issuance of notes |
2,425,000 | — | 26,425,000 | |||||||||
| Payments on notes and capital leases |
(171,983 | ) | (174,996 | ) | (11,495,310 | ) | ||||||
| Cost of financing |
— | — | (6,342,379 | ) | ||||||||
| Proceeds from exercise of warrants and stock options |
— | 5,024 | 8,810,120 | |||||||||
| Net cash provided (used) by financing activities |
2,253,017 | (169,972 | ) | 95,709,931 | ||||||||
| Decrease in cash and cash equivalents |
(17,103,081 | ) | (44,245,158 | ) | (9,354,008 | ) | ||||||
| Cash and cash equivalents, beginning of period |
17,120,401 | 61,365,559 | 9,371,328 | |||||||||
| Cash and cash equivalents, end of period |
$ | 17,320 | $ | 17,120,401 | $ | 17,320 | ||||||
| Supplemental Cash Flow Information: |
||||||||||||
| Cash paid for interest |
$ | 24,496 | $ | 39,431 | ||||||||
| Non-Cash Transactions: |
||||||||||||
| Accrued property and equipment |
$ | 12,398,721 | $ | — | ||||||||
| Financed leasehold improvements |
$ | 1,865,791 | $ | 3,623,395 | ||||||||
| Beneficial conversion feature on convertible note |
$ | 251,618 | $ | — | ||||||||
See accompanying notes to these financial statements.
F-6
Table of Contents
(A DEVELOPMENT STAGE ENTERPRISE)
NOTES TO FINANCIAL STATEMENTS
1. Organization and Nature of Operations
DayStar Technologies, Inc. (the “Company”) is a development stage enterprise that was formed in 1997 for the purpose of developing, manufacturing and marketing innovative products to the solar photovoltaic (“PV”) industry. From its inception, the Company has focused primarily on thin film copper indium gallium diselenide (“CIGS”) solar products. The Company has developed a proprietary one-step sputter deposition process and manufactured a commercial scale deposition tool to apply high efficiency CIGS material over large area glass substrates in a continuous fashion. The Company intends to integrate this tool with commercially available thin film manufacturing equipment which will provide a critically differentiated manufacturing process to produce low-cost monolithically integrated, CIGS-on-glass modules that address the grid-tied, ground-based PV market.
2. Liquidity and Future Operations
The Company’s financial statements for the year ended December 31, 2009 have been prepared on a going concern basis, which contemplates the realization of assets and the settlement of liabilities and commitments in the normal course of business. The Company is in the development stage, and as such, has historically reported net losses, including a net loss of $25.0 million for the year ended December 31, 2009. The Company anticipates it will continue to incur losses in the future as it commercializes its product. As noted herein, as a result of the Company’s current liquidity, there is substantial doubt as to its ability to continue as a going concern.
Commercialization efforts, including the completion and ramp-up of the Company’s initial module production line requires significant additional capital expenditures as well as associated continued development and administrative costs. In order to continue operations, fully build-out its initial production line and commence commercial shipments of its product, the Company requires immediate and substantial additional capital beyond its current cash on hand. To address its immediate financial needs, the Company intends to pursue a rights offering to existing shareholders, in which the Company’s shareholders would have the opportunity to purchase additional common shares based on their pro rata ownership percentage. A successful rights offering would raise the capital required to improve the Company’s current financial condition while giving existing shareholders the opportunity to limit ownership dilution, The exact size, timing, terms and conditions of the rights offering have not yet been determined by the Board of Directors and there is no guarantee that the Company will complete a rights offering.
The Company has engaged a financial advisor to seek long-term strategic investments and partnerships. To date, the Company has been unable to raise substantial additional capital or complete an agreement with an investor or strategic partner. Although the Company continues to seek strategic investors or partners, in light of its current cash position, the Company implemented a significant reduction in its workforce during 2009 and may in the near term be forced to cease or substantially curtail operations.
An inability to raise additional funding in the very near term may cause the Company to file a voluntary petition for reorganization under the United States Bankruptcy Code, liquidate assets, and/or pursue other such actions that could adversely affect future operations. Given current market conditions and available opportunities, there is substantial doubt as to the Company’s ability to complete a financing in the time frame required to remain in operation. A wide variety of factors relating to the Company and external conditions could adversely affect its ability to secure additional funding and the terms of any funding that it secures.
For additional information on cost savings and fundraising measures implemented during 2009, see Note 8 “Sale of Assets” regarding the sale by the Company of substantially all of its tangible assets located at its Halfmoon, New York facilities to Veeco Compound Semiconductor, Inc., and Note 9 “Secured Convertible Promissory Note and Warrants” for information regarding bridge loans received by the Company from Mr. Peter Alan Lacey.
For a discussion of bridge financing received subsequent to December 31, 2009, see Note 16 “Subsequent Events”.
F-7
Table of Contents
DAYSTAR TECHNOLOGIES, INC.
(A DEVELOPMENT STAGE ENTERPRISE)
3. Significant Accounting Policies
Cash Equivalents—The Company considers all highly liquid debt securities purchased with an original maturity of three months or less to be cash equivalents. The Company’s cash and cash equivalents are maintained with major financial institutions within the United States and at times the balances with these institutions exceed the amount of federal insurance coverage on such deposits.
Property and Equipment—Property and equipment is stated at cost. Depreciation is computed using straight-line and an accelerated method over estimated useful lives of 3 to 10 years. Expenditures for maintenance and repairs, which do not materially extend the useful lives of property and equipment, are charged to operations as incurred. When property or equipment is retired or otherwise disposed of, the property accounts are relieved of costs and accumulated depreciation and any resulting gain or loss is recognized.
Patent Costs—Costs for patents purchased from third parties, including legal fees, are capitalized and amortized over 15 years. The Company recorded patent-related amortization expense of $1,530 and $2,032 for the years ended December 31, 2009 and 2008, respectively.
Revenue Recognition—The Company recognizes revenue in accordance with the FASB ASC 605 Revenue Recognition and Securities and Exchange Commission (the “SEC”)’s Staff Accounting Bulletin No. 104, “Revenue Recognition” (“SAB 104”) which require that four basic criteria must be met before revenue can be recognized: (1) persuasive evidence of an arrangement exists; (2) delivery has occurred or services rendered; (3) the seller’s price to the buyer is fixed and determinable; and (4) collectability is reasonably assured. Since inception of the development stage on July 1, 2005, the Company has earned minimal amounts of product revenue.
Since inception of the development stage on July 1, 2005, the principal source of revenue for the Company has been from government funded research and development contracts and grants. Grant revenue is recognized when the Company fulfills obligations as set forth under the grant. Terms of the grant reflected in the accompanying financial statements require the Company to maintain specified employment criteria over a five year period. If the Company fails to meet the specified criteria, it must repay the unearned portion of the grant. As a result, the Company reported a liability of $420,000 at December 31, 2009 and 2008, respectively.
Research and development contract revenue is recognized as the Company meets milestones as set forth under the contract. The Company recognized no revenue for the year ended December 31, 2009 and December 31, 2008, respectively.
Research and Development Costs—Research and development costs are expensed as incurred. Funds obtained from government agencies that represent a cost reimbursement activity are reflected as reductions of Research and Development expenses.
Income Taxes—The Company follows FASB ASC 740 Income Taxes, which requires an asset and liability approach to financial accounting and reporting for income taxes. Deferred income tax assets and liabilities are computed annually for differences between the financial statement and tax bases of assets and liabilities that will result in taxable or deductible amounts in the future based on enacted tax laws and rates applicable to the period in which the differences are expected to affect taxable income. Valuation allowances are established when necessary to reduce deferred tax assets to the amount expected to be realized. Income tax expense (benefit) is the tax payable or refundable for the period plus or minus the change during the period in deferred tax assets and liabilities.
FASB ASC 740 also addresses the determination of whether tax benefits claimed or expected to be claimed on a tax return should be recorded in the financial statements. Under ASC 740, the Company may recognize the
F-8
Table of Contents
DAYSTAR TECHNOLOGIES, INC.
(A DEVELOPMENT STAGE ENTERPRISE)
tax benefit from an uncertain tax position only if it is more likely than not that the tax position will be sustained on examination by the taxing authorities, based on the technical merits of the position. The tax benefits recognized in the financial statements from such a position should be measured based on the largest benefit that has a greater than fifty percent likelihood of being realized upon ultimate settlement. ASC 740 also provides guidance on de-recognition, classification, interest and penalties on income taxes, accounting in interim periods and requires increased disclosures. During the years ended December 31, 2009 and 2008, the Company did not recognize any tax liabilities related to uncertain tax positions and does not have a balance for such liabilities as of December 31, 2009.
The Company recognizes accrued interest and penalties, if any, associated with uncertain tax positions as part of the income tax provision. There was no accrued interest or penalties recognized in the Company’s balance sheets as of December 31, 2009 and 2008.
Use of Estimates—The preparation of the Company’s financial statements in conformity with generally accepted accounting principles requires the Company’s management to make estimates and assumptions that affect the amounts reported in these financial statements and accompanying notes. Significant estimates include the useful lives of the Company’s property and equipment, the life and realization of the Company’s capitalized costs associated with its patents and the Company’s valuation allowance associated with its deferred tax asset. Actual results could differ from those estimates.
Share-Based Compensation—The Company follows the provisions of FASB ASC 718 Compensation—Stock Compensation, which requires the measurement and recognition of compensation expense for all share-based payment awards to employees and directors based on estimated fair values. Additionally, the Company follows the SEC’s Staff Accounting Bulletin No. 107 “Share-Based Payment” (“SAB 107”), as amended by Staff Accounting Bulletin No. 110 (“SAB 110”), which provides supplemental application guidance based on the views of the SEC. The Company estimates the expected term, which represents the period of time from the grant date that the Company expects its stock options to remain outstanding, using the simplified method as permitted by SAB 107 and SAB 110. Under this method, the expected term is estimated as the mid-point between the time the options vest and their contractual terms. The Company continues to apply the simplified method because it does not have sufficient historical exercise data to provide a reasonable basis upon which to estimate the expected terms due to the limited period of time its equity shares have been publicly traded and the limited number of its options which have so far vested and become eligible for exercise.
Share-based compensation expense for the years ended December 31, 2009 and 2008 was as follows:
| For the Year Ended December 31, | ||||||
| 2009 | 2008 | |||||
| Share-based compensation: |
||||||
| Selling, general and administrative |
$ | 1,874,754 | $ | 2,416,563 | ||
| Research and development |
2,258,777 | 2,378,565 | ||||
| Total share-based compensation |
$ | 4,133,531 | $ | 4,795,128 | ||
Loss Per Share—Loss per share is presented in accordance with the provisions of FASB ASC 260 Earnings Per Share. Basic Earnings Per Share (EPS) is calculated by dividing the income or loss available to common stockholders by the weighted average number of common shares outstanding for the period. Diluted EPS reflects the potential dilution that could occur if securities or other contracts to issue common stock were exercised or converted into common stock. Such common stock equivalents, including 2,576,032 options, 1,584,500 restricted stock units and 7,165,490 warrants have been omitted from loss per share because they are anti-dilutive. Basic and diluted loss per share was the same in each of the years ended December 31, 2009 and 2008.
F-9
Table of Contents
DAYSTAR TECHNOLOGIES, INC.
(A DEVELOPMENT STAGE ENTERPRISE)
Fair Value of Financial Instruments—The estimated fair values for financial instruments are determined at discrete points in time based on relevant market information. These estimates involve uncertainties and cannot be determined with precision. The carrying amounts of receivables, investments, accounts payable and accrued liabilities approximate fair value because of the short-term maturities of these instruments. The fair value of notes payable and capital lease obligations approximate fair value due to their proximity to the inception date.
Derivative Stock Warrants—Certain terms in a convertible note and related documents issued on May 25, 2006 as well as subsequent agreements entered into on January 19, 2007, namely the potential for cash settlement, require that the warrants issued in conjunction with these documents be treated as a derivative instrument and, therefore, classified as a liability on the balance sheet. As such, the liability must be adjusted to fair value at the end of each reporting period and any changes in fair value reported as a gain or loss on derivative liabilities in the statement of operations. In the event of a change in control of the Company, the warrant holders have the option of either exercising their warrants or requesting a cash settlement at the fair value of the warrants. The Black-Scholes option-pricing model is used to estimate the warrant fair values. The Company has recorded liabilities on the balance sheet of $131,835 and $125,481 at December 31, 2009 and December 31, 2008, respectively, which represent the amount of potential cash settlement due to the warrant holders in the event of a change in control.
Impairment of Long-Lived Assets—In the event that facts and circumstances indicate that the cost of assets may be impaired, an evaluation of recoverability would be performed. If an evaluation is required, the estimated future undiscounted cash flows associated with the asset would be compared to the asset’s carrying amount to determine if a write-down to market value or discounted cash flow value is required.
Reclassifications—Certain reclassifications have been made to the 2008 financial statements to conform to the 2009 presentation. Such reclassifications had no impact on net loss.
Impact of Recently Issued Accounting Pronouncements—
Effective July 1, 2009, the Company adopted the Financial Accounting Standards Board (“FASB”) Accounting Standards Codification (“ASC”) 105-10, “Generally Accepted Accounting Principles.” ASC 105-10 establishes the FASB Accounting Standards Codification™ (“Codification”) as the source of authoritative accounting principles recognized by the FASB to be applied by nongovernmental entities in the preparation of financial statements in conformity with GAAP for SEC registrants. All guidance contained in the Codification carries an equal level of authority. The Codification supersedes all existing non-SEC accounting and reporting standards. The FASB will now issue new standards in the form of Accounting Standards Updates (“ASUs”). The FASB will not consider ASUs as authoritative in their own right. ASUs will serve only to update the Codification, provide background information about the guidance and provide the bases for conclusions on the changes in the Codification. References made to FASB guidance have been updated for the Codification throughout this document.
FASB ASC 805 Business Combinations, On January 1, 2009, the Company adopted FASB ASC 805, Business Combinations, which replaces SFAS No. 141, Business Combinations, and requires an acquirer to recognize the assets acquired, the liabilities assumed, and any non-controlling interest in the acquiree at the acquisition date, measured at their fair values as of that date, with limited exceptions. ASC 805 also requires the acquirer in a business combination achieved in stages to recognize the identifiable assets and liabilities, as well as the noncontrolling interest in the acquiree, at the full amounts of their fair values. Additionally, ASC 805 requires acquisition related costs to be expensed in the period in which the costs were incurred and the services are received instead of including such costs as part of the acquisition price. ASC 805 makes various other amendments to authoritative literature intended to provide additional guidance or to confirm the guidance in that literature to that provided in ASC 805. The adoption of ASC 805 had no impact on the Company’s financial statements.
F-10
Table of Contents
DAYSTAR TECHNOLOGIES, INC.
(A DEVELOPMENT STAGE ENTERPRISE)
FASB ASC 820 Fair Value Measurements and Disclosures, Pre Codification SFAS No. 157, “Fair Value Measurements.” Effective January 1, 2008, the Company adopted the new standard. The new standard defines fair value, establishes a framework for measuring fair value under generally accepted accounting principles and enhances disclosures about fair value measurements. Fair value is defined as the exchange price that would be received for an asset or paid to transfer a liability (an exit price) in the principal or most advantageous market for the asset or liability in an orderly transaction between market participants on the measurement date. Valuation techniques used to measure fair value must maximize the use of observable inputs and minimize the use of unobservable inputs. The standard describes a fair value hierarchy based on three levels of inputs, of which the first two are considered observable and the last unobservable, that may be used to measure fair value as follows:
| • | Level 1—Quoted prices in active markets for identical assets or liabilities. |
| • | Level 2—Inputs other than Level 1 that are observable, either directly or indirectly, such as quoted prices for similar assets or liabilities; quoted prices in markets that are not active; or other inputs that are observable or can be corroborated by observable market data for substantially the full term of the assets or liabilities. |
| • | Level 3—Unobservable inputs that are supported by little or no market activity and that are significant to the fair value of the assets or liabilities. |
The adoption of this new standard for financial assets and liabilities, effective January 1, 2008, did not have a material impact on the Company’s financial statements. The Company adopted the new standard on January 1, 2009 for its nonfinancial assets and nonfinancial liabilities, which did not have a material impact on its financial statements. See Note 5 “Secured Convertible Promissory Note and Warrants” and Note 6, “Derivative Liabilities,” below.
In August 2009, the FASB issued Accounting Standards Update (ASU) 2009-05, Fair Value Measurements and Disclosures (Topic 820)—Measuring Liabilities at Fair Value. The fair value measurement of a liability assumes transfer to a market participant on the measurement date, not a settlement of the liability with the counterparty. ASU 2009-05 describes various valuation methods that can be applied to estimating the fair values of liabilities, requires the use of observable inputs and minimizes the use of unobservable valuation inputs. ASU 2009-05 is effective for the fourth quarter of 2009. The adoption of ASU 2009-05 had no impact on the Company’s financial statements.
In January 2010, the FASB issued ASU 2010-06, Fair Value Measurements and Disclosures (Topic 820)—Improving Disclosures about Fair Value Measurements. This ASU requires new disclosures and clarifies certain existing disclosure requirements about fair value measurements. ASU 2010-06 requires a reporting entity to disclose significant transfers in and out of Level 1 and Level 2 fair value measurements, to describe the reasons for the transfers and to present separately information about purchases, sales, issuances and settlements for fair value measurements using significant unobservable inputs. ASU 2010-06 is effective for interim and annual reporting periods beginning after December 15, 2009, except for the disclosures about purchases, sales, issuances and settlements in the roll forward of activity in Level 3 fair value measurements, which is effective for interim and annual reporting periods beginning after December 15, 2010; early adoption is permitted. The Company does not expect that the adoption of ASU 2010-06 will have a material impact on its financial statements.
FASB ASC 810 Consolidation, Pre Codification SFAS No. 160, “Noncontrolling Interests in Consolidated Financial Statements, an amendment of ARB No. 51”. On January 1, 2009, the Company adopted FASB ASC 810, “Noncontrolling Interests in Consolidated Financial Statements—an amendment of ARB No. 51,” (ASC 810). ASC 810 amends Accounting Research Bulletin No. 51, “Consolidated Financial Statements,” to establish accounting and reporting standards for the noncontrolling interest in a subsidiary and for the deconsolidation of a subsidiary. This standard defines a noncontrolling interest, previously called a minority interest, as the portion of
F-11
Table of Contents
DAYSTAR TECHNOLOGIES, INC.
(A DEVELOPMENT STAGE ENTERPRISE)
equity in a subsidiary not attributable, directly or indirectly, to a parent. ASC 810-10-65 requires, among other items, that a noncontrolling interest be included in the consolidated statement of financial position within equity separate from the parent’s equity; consolidated net income to be reported at amounts inclusive of both the parent’s and noncontrolling interest’s shares and, separately, the amounts of consolidated net income attributable to the parent and noncontrolling interest all on the consolidated income statement; and if a subsidiary is deconsolidated, any retained noncontrolling equity investment in the former subsidiary be measured at fair value and a gain or loss be recognized in net income based on such fair value. The adoption of ASC 810-10-65 had no impact on the Company’s financial statements.
In December 2009, the FASB issued ASU 2009-17, Consolidations (Topic 810)—Improvements to Financial Reporting by Enterprises Involved with Variable Interest Entities. ASU 2009-17 changes how a reporting entity determines when an entity that is insufficiently capitalized or is not controller through voting (or similar rights) should be consolidated. ASU 2009-17 also requires a reporting entity to provide additional disclosures about its involvement with variable interest entities and any significant changes in risk exposure due to that involvement. ASU 2009-17 is effective at the start of a reporting entity’s first fiscal year beginning after November 15, 2009, or January 1, 2010, for a calendar year entity. Early adoption is not permitted. The Company does not expect that the adoption of ASU 2009-17 will have a material impact on its financial statements.
In January 2010, the FASB issued ASU 2010-02, Consolidation (Topic 810)—Accounting and Reporting for Decreases in Ownership of a Subsidiary—A Scope Clarification. ASU 2010-02 clarifies the scope of the decrease in ownership provisions of Subtopic 810 and expands the disclosure requirements about deconsolidation of a subsidiary or de-recognition of a group of assets. ASU 2010-02 is effective beginning in the first interim of annual reporting period ending on or after December 15, 2009. The amendments in ASU 2010-02 must be applied retrospectively to the first period that an entity adopted SFAS 160. The adoption of ASU 2010-02 did not have any impact on the Company’s financial statements.
FASB ASC 855 Subsequent Events, Pre Codification SFAS No. 165, “Subsequent Events.” In May 2009, the FASB issued SFAS No. 165, “Subsequent Events” (“SFAS 165”). The objective of ASC 855 is to establish general standards of accounting for and disclosure of events that occur after the balance sheet date but before financial statements are issued or are available to be issued. ASC 855 discusses two types of subsequent events: (1) events that provide additional evidence about conditions that existed at the date of the balance sheet, and is recognized in the financial statements and (2) events that provide evidence about conditions that did not exist at the date of the balance sheet but arose after the balance sheet date but before financial statements are issued or are available to be issued, and not recognized at the balance sheet date. An entity shall also disclose the date through which subsequent events have been evaluated, as well as whether that date is the date the financial statements were issued or the date the financial statements were available to be issued. The requirements of ASC 855 are effective for interim and annual financial periods ending after June 15, 2009. The requirements do not have a material impact on the Company’s financial statements. The Company evaluated its December 31, 2009 financial statements for subsequent events through March 19, 2010, the date the financial statements were available to be issued.
In October 2009, the FASB issued ASU 2009-15, Accounting for Own-Share Lending Arrangements in Contemplation of Convertible Debt Issuance or Other Financing. ASU 2009-15 amends the accounting and reporting guidance for debt (and certain preferred stock) with specific conversion features or other options. ASU 2009-15 is effective for fiscal years beginning on or after December 15, 2009. The Company does not expect that the adoption of ASU 2009-15 will have a material impact on its financial statements.
In December 2009, the FASB issued ASU 2009-16, Transfers and Servicing (Topic 860)—Accounting for Transfers of Financial Assets. ASU 2009-16 amends the accounting for transfers of financials assets and will
F-12
Table of Contents
DAYSTAR TECHNOLOGIES, INC.
(A DEVELOPMENT STAGE ENTERPRISE)
require more information about transfers of financial assets, including securitizations, and where entities have continuing exposure to the risks related to transferred financial assets. ASU 2009-16 is effective at the start of a reporting entity’s first fiscal year beginning after November 15, 2009, with early adoption not permitted. The Company does not expect that the adoption of ASU 2009-16 will have a material impact on its financial statements.
In January 2010, the FASB issued ASU 2010-01, Equity (Topic 505)—Accounting for Distributions to Shareholders with Components of Stock and Cash. ASU 2010-01 clarifies that the stock portion of a distribution to shareholders that allows them to elect to receive cash or shares with a potential limitation on the amount of cash that all shareholders can elect to receive is considered a share issuance. ASU 2010-01 is effective for interim and annual periods ending on or after December 15, 2009 and should be applied on a retrospective basis. The adoption of ASU 2010-01 did not have any impact on the Company’s financial statements.
4. Share-Based Compensation
Equity Incentive Plan—On June 19, 2006, the Company adopted an Equity Incentive Plan (the “2006 Plan”) to enable employees, outside directors and consultants to acquire an equity interest in the Company. Issuances under the 2006 Plan may be in the form of incentive and non-qualified stock options, restricted stock awards, restricted stock unit awards and stock appreciation rights. In September 2008, stockholders approved the Amended and Restated 2006 Equity Incentive Plan (the “2006 Amended and Restated Plan”). The 2006 Amended and Restated Plan provides for the grant of incentive and non-qualified stock options, stock appreciation rights, restricted stock awards, restricted stock unit awards, performance stock awards, performance cash awards and other stock awards to employees, directors, and consultants. The 2006 Amended and Restated Plan reserves 10,950,000 of the Company’s authorized shares of common stock for issuance for these purposes. Under the 2006 Amended and Restated Plan, the term of stock options shall not exceed ten years and stock options shall not be granted with an exercise price of less than 100% of the fair market value of the common stock, measured at the time of grant.
Grants of incentive and non-qualified stock options, and restricted stock prior to June 19, 2006 were made from the Company’s original Equity Incentive Plan adopted in 2003 (the “2003 Plan”). The 2003 Plan reserves 1,050,000 of the Company’s authorized shares of common stock for issuance for these purposes.
Share-based compensation expense associated with options for the years ended December 31, 2009 and 2008 was as follows:
| For the Year Ended December 31, | ||||||
| 2009 | 2008 | |||||
| Share-based compensation associated with options: |
||||||
| Selling, general and administrative |
$ | 1,037,645 | $ | 1,043,445 | ||
| Research and development |
1,218,159 | 1,498,103 | ||||
| Total share-based compensation associated with options |
$ | 2,255,804 | $ | 2,541,548 | ||
These expenses increased basic and diluted loss per share by $0.07 and $0.08 for the years ended December 31, 2009 and 2008, respectively.
The Black-Scholes option-pricing model was used to estimate the option fair values. This option-pricing model requires a number of assumptions, of which the most significant are, expected stock price volatility, the expected pre-vesting forfeiture rate and the expected option term (the amount of time from the grant date until the options are exercised or expire). Expected volatility was calculated based upon actual historical stock price
F-13
Table of Contents
DAYSTAR TECHNOLOGIES, INC.
(A DEVELOPMENT STAGE ENTERPRISE)
movements over the period from the Company’s initial public offering through December 31, 2009, and further reviewed against industry comparables. Expected pre-vesting forfeitures were estimated based on actual historical pre-vesting forfeitures over the period from the Company’s initial public offering through December 31, 2009. The expected option term was calculated using the “simplified” method permitted by SAB 107, as amended by SAB 110.
The weighted average per share fair value of stock options granted during the years ended December 31, 2009 and 2008 was $0.94 and $2.81, respectively. The fair value was estimated as of the grant date using the Black-Scholes option pricing model with the following assumptions:
| December 31, | ||||||
| 2009 | 2008 | |||||
| Expected volatility |
95 – 103 | % | 91 – 95 | % | ||
| Risk-free interest rate |
2.2 – 3.0 | % | 3.5 – 4.2 | % | ||
| Expected dividends |
$— | $— | ||||
| Expected terms (in years) |
5 – 6 | 5 – 6 | ||||
The following table summarizes stock options outstanding and activity as of and for the years ended December 31, 2009 and 2008:
| Shares | Weighted Average Exercise Price |
Weighted Average Remaining Contractual Term (in years) |
Aggregate Intrinsic Value | ||||||||
| Outstanding at January 1, 2008 |
2,502,158 | $ | 5.36 | ||||||||
| Granted |
3,039,956 | $ | 3.27 | ||||||||
| Forfeited |
(1,511,104 | ) | $ | 4.58 | |||||||
| Exercised |
(1,600 | ) | $ | 3.14 | |||||||
| Outstanding at December 31, 2008 |
4,029,410 | $ | 4.08 | 9.02 | $ | 9,000 | |||||
| Exercisable at December 31, 2008 |
1,300,444 | $ | 5.32 | 8.38 | $ | 2,077 | |||||
| Outstanding at January 1, 2009 |
4,029,410 | $ | 4.08 | ||||||||
| Granted |
86,400 | $ | 0.94 | ||||||||
| Forfeited |
(1,539,778 | ) | $ | 4.16 | |||||||
| Exercised |
— | $ | — | ||||||||
| Outstanding at December 31, 2009 |
2,576,032 | $ | 4.00 | 5.91 | $ | — | |||||
| Exercisable at December 31, 2009 |
1,800,356 | $ | 4.20 | 4.85 | $ | — | |||||
The total intrinsic value, or the difference between the exercise price and the market price on the date of exercise of all options exercised during the year ended December 31, 2008 was $1,296. Cash received from stock options exercised during the years ended December 31, 2008 was $5,024. The Company did not have any stock option exercises in 2009 nor did it realize any tax deductions related to the exercise of stock options during the years ended December 31, 2009 and 2008, respectively. The Company will record such deductions to additional paid in capital when realized.
Total unrecognized share-based compensation expense from unvested stock options as of December 31, 2009 and 2008 was $2,117,011 and $4,911,398, respectively, which is expected to be recognized over a weighted average period of approximately 1.6 and 2.1 years for December 31, 2009 and 2008.
F-14
Table of Contents
DAYSTAR TECHNOLOGIES, INC.
(A DEVELOPMENT STAGE ENTERPRISE)
In addition to the stock options discussed above, the Company recognized share-based compensation expense related to restricted stock grants, of $278,461 and $2,253,580 for the years ended December 31, 2009 and 2008, respectively. Also, the Company recognized share-based compensation expense related to restricted stock unit grants of $1,599,266 for the year ended December 31, 2009. There was no restricted stock expense prior to 2009. The following table summarizes Non-vested Restricted Stock grants and Restricted Stock Unit grants and their related activity as of and for the years ended December 31, 2009 and 2008:
| Restricted Stock Awards |
Weighted Average Grant-Date Fair-Value |
Restricted Stock Units |
Weighted Average Grant-Date Fair-Value | |||||||||
| Non-vested at January 1, 2008 |
362,281 | $ | 6.99 | — | $ | — | ||||||
| Granted |
835,000 | $ | 3.85 | — | $ | — | ||||||
| Vested |
(426,010 | ) | $ | 5.76 | — | $ | — | |||||
| Forfeited |
(20,875 | ) | $ | 9.50 | — | $ | — | |||||
| Non-vested at December 31, 2008 |
750,396 | $ | 4.12 | — | $ | — | ||||||
| Granted |
50,000 | $ | 1.00 | 2,542,500 | $ | 0.83 | ||||||
| Vested |
(249,572 | ) | $ | 3.35 | (803,500 | ) | $ | 0.83 | ||||
| Forfeited |
(276,250 | ) | $ | 4.46 | (265,000 | ) | $ | 0.83 | ||||
| Non-vested at December 31, 2009 |
274,574 | $ | 3.93 | 1,474,000 | $ | 0.83 | ||||||
Total unrecognized share-based compensation expense from unvested restricted stock awards as of December 31, 2009, is $112,685 which is expected to be recognized over a weighted average period of approximately 1.3 years. Total unrecognized share-based compensation expense from unvested restricted stock units as of December 31, 2009, is $604,930 which is expected to be recognized over a weighted average period of approximately 2 months. Total unrecognized share-based compensation expense from unvested restricted stock awards as of December 31, 2008 was $2,292,478 which was expected to be recognized over a weighted average period of approximately 1.4 years. There were no restricted stock units as of December 31, 2008.
Subsequent to December 31, 2009 and through the date of this filing, the Company has issued to its employees and outside directors an aggregate of 5,605,400 options to purchase common stock and 3,457,500 shares of restricted stock. Also, 10,067 options and 20,000 restricted stock units were forfeited.
5. Sales Contracts
The Company maintains a contract with Blitzstrom GmbH, one of the world’s leading thin film solar PV integrators, that commits Blitzstrom to purchase a minimum of 50% of the Company’s production through 2011 of its PV module products utilizing it CIGS technology, subject to these products meeting defined performance criteria. The contract was originally executed on June 9, 2005 and subsequently modified on September 6, 2006 and May 11, 2007.
F-15
Table of Contents
DAYSTAR TECHNOLOGIES, INC.
(A DEVELOPMENT STAGE ENTERPRISE)
6. Property and Equipment
Property and equipment is summarized as follows:
| December 31, 2009 |
December 31, 2008 |
|||||||
| Leasehold improvements |
$ | 7,961,145 | $ | 2,715,246 | ||||
| Machinery and equipment |
10,640,712 | 15,293,971 | ||||||
| Office furniture, equipment and software |
1,101,187 | 1,676,119 | ||||||
| Construction in progress |
33,212,921 | 26,337,489 | ||||||
| 52,915,965 | 46,022,825 | |||||||
| Less accumulated depreciation and amortization |
(6,388,914 | ) | (8,942,105 | ) | ||||
| Property and equipment, net |
$ | 46,527,051 | $ | 37,080,720 | ||||
Depreciation and amortization expense of property and equipment for the years ended December 31, 2009 and 2008 was $3,533,240 and $3,240,472, respectively.
7. Commitments and Contingencies
Leases Payable
On April 29, 2008, the Company signed a 10-year lease for approximately 144,000 square feet of manufacturing and office space in Newark, California. The lease commenced on September 15, 2008 and the initial term of the lease expires on September 14, 2018. The Company has two options to extend the lease by five years each at the completion of the initial term.
This lease is being accounted for as an operating lease. Monthly base rental payments of $74,593 begin March 15, 2009. The monthly base rental payments increase at the beginning of each year during the initial term of the lease. The total minimum rental obligation over the initial term of the lease is approximately $17.5 million. As the Company took possession of the property in May 2008, it will record the straight-lined rent expense commencing May 2008 and throughout the initial lease term. The Company recorded rent expense related to this lease of $1,694,022 and $1,129,348 during the year ended December 31, 2009 and 2008, respectively. This resulted in a deferred rent liability of $1,961,840 and $1,129,348, in the long-term liabilities section of the Company’s balance sheet as of December 31, 2009 and 2008, respectively, excluding landlord provided tenant improvement financing described below.
Under the terms of the lease, the landlord will finance up to $2,156,115 of the cost of leasehold improvements incurred by the Company during the first thirty-six months of the initial lease term. In accordance with the terms of the lease, any amounts financed under this arrangement will be amortized over the remaining initial term of the lease, beginning in March 2009. The amount of tenant improvements financed plus interest at a rate of 9% will be repaid monthly, as additional rent, over the remaining initial lease term beginning March 15, 2009. As such, the Company has recorded leasehold improvements of $1,865,791 and $1,997,421 as of December 31, 2009 and 2008, respectively, representing the amount of tenant improvements financed by the landlord as of such date. The Company recorded corresponding deferred rent liabilities of $139,870 and $175,212 in the current liabilities section and $1,490,950 and $1,822,209 in the long-term liabilities section of the balance sheet as of December 31, 2009 and 2008, respectively.
See Litigation below for additional information on this leasing arrangement.
F-16
Table of Contents
DAYSTAR TECHNOLOGIES, INC.
(A DEVELOPMENT STAGE ENTERPRISE)
In addition, the Company has a long-term lease for approximately 50,000 square feet of factory and office space in Santa Clara, California. The lease expires in March 2010. The Company also leases certain office equipment with a term of three years.
Rent expense for all operating leases for the years ended December 31, 2009 and 2008 was $3,006,015 and $1,826,653, respectively. Future minimum lease payments under all non-cancelable operating leases, including repayments of tenant improvement financing provided by the landlord, as of December 31, 2009, are as follows:
| Year Ending December 31, |
Amount | ||
| 2010 |
$ | 1,590,186 | |
| 2011 |
1,697,175 | ||
| 2012 |
1,917,177 | ||
| 2013 |
2,172,921 | ||
| Thereafter |
11,217,166 | ||
| Total |
$ | 18,594,625 | |
Litigation
In the ordinary conduct of business, the Company is subject to periodic lawsuits, investigations and claims, including routine employment matters. The following is a summary of legal proceedings which the Company is a party to at this time.
On June 2, 2009, Valley Process Systems, Inc. (“VPS, Inc.”), a subcontractor utilized in the initial construction phase of the Company’s Newark location, filed suit against the general contractor for the project, Gordon Prill, Inc. (“Gordon Prill”), BMR-Gateway Blvd., LLC (the “Landlord”), and Does 1-25, inclusive in Superior Court of the State of California in Alameda County, CA, alleging monies due, breach of written contract, quantum meruit, and foreclosure on the mechanic’s lien. In the VPS, Inc. action, Landlord joined the Company by filing a cross-complaint on July 27, 2009, alleging breach of the lease agreement dated April 29, 2008, and seeking indemnification. Both actions allege damages in the amount of $343,562 and seek reasonable attorney’s fees and expenses.
On July 14, 2009, Sprig Electric Co., a subcontractor utilized in the initial construction phase of the Company’s Newark location, filed suit against Gordon Prill, the Landlord, and Does 1-100, inclusive in Superior Court of the State of California in Alameda County, CA, alleging monies due, breach of written contract, quantum meruit, and foreclosure on the mechanic’s lien. In the Sprig Electric Co. action, the Landlord joined the Company by filing a cross-complaint on September 29, 2009, alleging breach of the lease agreement dated April 29, 2008, and seeking indemnification. The Sprig Electric Co. action alleges damages in the amount of $584,068 and both actions seek reasonable attorney’s fees and expenses.
On August 4, 2009, Gordon Prill filed suit against the Company, the Landlord, and Does 1-250, inclusive in Superior Court of the State of California in Alameda County, CA, alleging breach of written contract, foreclosure on the mechanic’s lien, and statutory penalties under California Civil Code sections 3260 and 3260.1. This action alleges damages in the amount of $1,595,523 and seeks reasonable attorney’s fees and expenses. The damages in this action include the $343,562 in the VPS, Inc. action and the $584,068 in the Sprig Electric Co. action.
On September 9, 2009, the Landlord filed an unlawful detainer action in Superior Court of the State of California in Alameda County, CA against the Company alleging damages in the amount of $838,078 and to recover possession of the premises. On December 17, 2009, the Landlord and the Company executed a Settlement Agreement (the “Settlement”) in the above action. According to the terms of the Settlement, the
F-17
Table of Contents
DAYSTAR TECHNOLOGIES, INC.
(A DEVELOPMENT STAGE ENTERPRISE)
Company will pay the amount of base rent proportionate to the amount of financing (the “Proceeds”) obtained in excess of Two Million Dollars ($2,000,000) gross up to and including Three Million Dollars ($3,000,000). For instance, if the Company obtains (a) less than or equal to Two Million Dollars ($2,000,000) in Proceeds, then the Company shall not be required to make payments of Base Rent under the Lease at that time, (b) more than Two Million Dollars ($2,000,000) in Proceeds, then the Company shall be required to make payments of Base Rent in the following amount: the quotient of (i) the product of (A) the amount of Base Rent otherwise payable pursuant to the Lease times (B) the difference between (1) the amount of aggregate Proceeds minus (2) Two Million Dollars ($2,000,000) divided by (ii) one million (1,000,000).
Additionally, the Company will use its best efforts to minimize any utility expenses incurred in operating the building. The Company has until June 1, 2010, to cure all alleged defaults under the lease (which the Landlord alleges include failure to pay rent and failure to remove various mechanic’s liens recorded against the property), provided the Landlord has not delivered the Company a 15-day notice of its intention to terminate the Lease (the “Termination Notice”). If the Landlord provides the Company with a Termination Notice, the Company must vacate the premises within 30 days from the date of the Termination Notice.
In lieu of a trial, the Parties have stipulated to a judgment of possession in the event that the Company breaches the Settlement Agreement for 1) failure to pay rent as indicated in the Settlement, 2) failure to cure all alleged defaults under the lease, and/or 3) failure to vacate the premises after a proper notice of termination or if any alleged defaults have not been cured by June 1, 2010. If it is alleged that the Company has not used its best efforts to minimize utility expenses, the Company has five days to cure that default under the Settlement prior to the Landlord entering the stipulated judgment. If the Landlord seeks to have the judgment enforced, it must provide the Company with 24 hours notice prior to the court hearing.
The Landlord is reserving all rights to seek the remaining alleged amounts of rent due, as well as any claims related to various mechanic’s liens recorded against the property by contractors and material suppliers.
On January 6, 2010, New York State Urban Development, d/b/a/ Empire State Development Corporation (“ESDC”), filed a breach of contract action against the Company. This action stems from the Grant Disbursement Award the Company entered into with ESDC when it relocated its headquarters to New York in 2004. ESDC is seeking $420,000 in damages in this action. The parties are currently negotiating a settlement agreement of the action, the terms of which are now indeterminate.
The damages sought in these cases were previously recorded as liabilities on the Company’s balance sheet at the time the original invoices were received for services performed at the Newark facility or in the case of the ESDC matter, at the time the grant funds were received.
Capital Commitments
At December 31, 2009, commitments under outstanding purchase orders for equipment and improvements were approximately $2.9 million. Such commitments are primarily related to manufacturing equipment which is expected to be delivered throughout 2010 and 2011. Generally the Company is required to remit any balances due to the suppliers upon delivery and acceptance of the equipment.
8. Sale of Assets
On July 15, 2009, the Company and Veeco Compound Semiconductor, Inc. (“Veeco”) entered into an Asset Purchase Agreement, whereby the Company sold substantially all of its tangible assets located at its Halfmoon, New York facilities to Veeco for $2.0 million, of which $1.7 million was paid in cash at closing and $300,000
F-18
Table of Contents
DAYSTAR TECHNOLOGIES, INC.
(A DEVELOPMENT STAGE ENTERPRISE)
was to be held in escrow until December 31, 2009 for indemnification claims. The Company retained ownership of the intellectual property developed in New York for future use in either glass or flexible substrate PV modules. The transaction also allows the Company to continue its efforts on its proprietary reactive sputter process currently in use to produce CIGS-on-glass photovoltaic modules without diminishing opportunities to re-enter flexible PV module markets when business, technology, and market conditions favor such a product. Upon completion of the transaction, Veeco hired 18 employees of the Company who were located in Halfmoon.
On September 18, 2009, the Company and Veeco amended the Asset Purchase Agreement to reduce the purchase price of the assets to $1,925,000. Simultaneously, the Company and Veeco terminated the Escrow Agreement, and $225,000 of the escrowed funds were released to the Company with the remaining $75,000 of the escrowed funds released to Veeco. The Company recorded a loss on sale of assets related to this transaction of $340,622.
9. Secured Convertible Promissory Note and Warrants
On September 21, 2009, the Company entered into a series of agreements with Mr. Peter Alan Lacey (the “Holder”) pursuant to a bridge financing transaction providing for, among other things, the issuance of a secured convertible promissory note (the “Note”) in the aggregate principal amount of $2.0 million, a warrant to purchase 1,500,000 shares of the Company’s $.01 par value per share common stock (the “First Warrant”) and an additional warrant to purchase 1,666,667 shares of the Company’s common stock upon the completion of an amendment to the Company’s Shareholder Rights Plan (the “Second Warrant”).
The Note is secured by all assets of the Company. Interest on the outstanding principal amount shall accrue at the rate of 8% per annum, commencing September 21, 2009 and shall continue on the outstanding principal until paid in full. The Holder may, at its option at any time prior to payment in full of the Note, elect to convert all or any part of the entire outstanding principal amount of the Note plus the accrued interest on the then outstanding balance into shares of the Company’s common stock at a conversion price of $0.60 per share. If between the date of the Note and such conversion, the Company issues or sells any shares of capital stock, other than certain excluded securities (a “Future Issuance”), at a per share price below $0.60 (subject to adjustment in the event of any stock splits, stock dividends or other recapitalization of common stock subsequent to the date of such sale or issuance), then the conversion price of the Note will be reduced to the price of such Future Issuance; provided that the Holder will only be permitted to convert that portion of the outstanding principal amount of the Note plus the accrued interest on the then outstanding balance that will not result in the issuance of more than 3,333,333 shares of common stock (subject to adjustment in the event of any stock splits, stock dividends or other recapitalization of such class or series of capital stock subsequent to the date of such sale or issuance).
All principal and all unpaid accrued interest that has not been converted into common stock shall be due and payable on or before March 20, 2010, and may be extended at the option of the Holder. The Company may prepay the Note at any time after one month following the date of the Note; provided that the Company shall give the Holder at least 30 calendar days advance written notice of the Company’s intent so to prepay and the Holder shall have the right to convert all or any portion of the Note, as applicable, at any time during such 30 calendar day period.
The Note’s conversion feature was determined to be an embedded derivative liability and therefore was bifurcated from the Note and recorded at fair value at issuance and is required to be adjusted to fair value at the end of each reporting period. The fair value of the conversion feature on September 21, 2009 calculated using the Black Scholes model totaled $1.3 million. As of December 31, 2009, the fair value of the conversion feature decreased by $1.0 million to $0.3 million and the Company recorded this change in fair value as a gain on derivative liabilities. At the date of issuance of the Note, the Second Warrant was required to be issued. In the
F-19
Table of Contents
DAYSTAR TECHNOLOGIES, INC.
(A DEVELOPMENT STAGE ENTERPRISE)
event the Second Warrant was not issued, the Company would be liable to the Holder for liquidated damages in the amount of $416,667 and therefore this amount was recorded as a liability and an increase to the discount on the Note. The Shareholder Rights Plan was amended on October 2, 2009 and the Second Warrant was issued to the Holder and the Company reversed this liability to equity at that time.
The proceeds remaining after allocation to the conversion feature and warrant liability for the Second Warrant were allocated on a relative fair value basis between the Note and the First Warrant and the amount allocated to the First Warrant was recorded as additional debt discount. The discount attributable to the issuance date aggregate fair value of the conversion feature and warrants, totaling $1.8 million, is being amortized using the effective interest method over the term of the Note. During the year ended December 31, 2009, $1.0 million of this discount was amortized to expense.
The warrants issued on September 21, 2009 and October 2, 2009 are exercisable upon issuance and entitle the Holder to purchase up to 3,166,667 shares of common stock at an exercise price of $0.50 per share, as adjusted for standard anti-dilution provisions. The warrants are exercisable for a period of two years from their respective issuance dates.
As a result of a free-standing registration rights agreement, the Company has an obligation to register the shares underlying the Note and related warrants and has a continuing obligation to keep the registration statement effective. Failure to meet this obligation, as defined, will result in liquidated damages of $20,000 per month during the time in which this requirement is not met. Mr. Lacey has agreed to provide the Company with additional time required to register the shares underlying the note and warrants.
On October 19, 2009, Mr. Lacey was appointed Chairman of the Board of Directors for the Company.
10. Derivative Liabilities
As described in Note 9 “Secured Convertible Promissory Note and Warrants” the Company is accounting for the conversion feature in the Note as an embedded derivative liability. The Company currently does not use hedging contracts to manage the risk of its overall exposure to interest rate and foreign currency changes. Neither the conversion feature nor the stock warrant liability discussed below is considered a hedging instrument.
The Company is accounting for free-standing warrants issued in May 2006 and February 2007 in connection with a convertible note, as derivative liabilities in accordance with FASB ASC 815 Derivatives and Hedging, Pre Codification SFAS No. 133, “Accounting for Derivative Instruments and Hedging Activities” (“SFAS 133”), SFAS 157, SFAS 161, Emerging Issues Task Force (“EITF”) No. 00-19, “Accounting for Derivative Financial Instruments Indexed to and Potentially Settled in a Company’s Own Stock,” and EITF No. 05-2, “The Meaning of “Conventional Convertible Debt Instrument” in Issue No. 00-19”, due to the potential for cash settlement. In the event of a change in control of the Company, warrant holders having the right to purchase 600,003 shares of the Company’s common stock would have the option of either exercising their warrants or requesting a cash settlement at the fair value of the warrants. Therefore, in accordance with ASC 820, the warrant liabilities are adjusted to their fair value at the end of each reporting period. The Black-Scholes model is used to estimate the fair value of the warrants and the change in fair value each period is reported as gain or loss on derivative liabilities. Generally, this accounting treatment will result in a reported loss during any accounting period in which there is a reported increase in the value of the Company’s common stock on the NASDAQ Capital Market. Conversely, this accounting treatment generally will result in a reported gain during any accounting period in which there is reported decrease in the value of the Company’s common stock on the NASDAQ Capital Market.
F-20
Table of Contents
DAYSTAR TECHNOLOGIES, INC.
(A DEVELOPMENT STAGE ENTERPRISE)
The fair value of the warrants was estimated using the Black-Scholes option pricing model with the following assumptions:
| December 31, | ||||||
| 2009 | 2008 | |||||
| Expected volatility |
111 – 177 | % | 92 – 104 | % | ||
| Risk-free interest rate |
1.8 – 2.7 | % | 1.5 – 3.5 | % | ||
| Expected dividends |
$— | $— | ||||
| Expected terms (in years) |
1.0 – 1.5 | 1.0 – 1.75 | ||||
The liability on the balance sheet at December 31, 2009 represents the amount of potential cash settlement due to the warrant holders in the event of a change in control, and the change in the liability since December 31, 2007 is summarized as follows:
| Stock Warrant Liability |
||||
| Balance, December 31, 2007 |
$ | 2,771,090 | ||
| Change in fair value |
(2,645,609 | ) | ||
| Balance, December 31, 2008 |
$ | 125,481 | ||
| Change in fair value |
6,354 | |||
| Balance, December 31, 2009 |
$ | 131,835 | ||
In accordance with ASC 820, the following table represents the Company’s fair value hierarchy for its financial liabilities measured at fair value on a recurring basis as of December 31, 2009 and December 31, 2008. There were no financial assets subject to the provisions of ASC 820 as of December 31, 2009 and December 31, 2008:
| Level 1 | Level 2 | Level 3 | Total | |||||||||
| Financial liabilities at December 31, 2009: |
||||||||||||
| Derivative stock warrants |
$ | — | $ | — | $ | 131,835 | $ | 131,835 | ||||
| Conversion feature |
— | — | 251,618 | 251,618 | ||||||||
| $ | — | $ | — | $ | 383,453 | $ | 383,453 | |||||
| Financial liabilities at December 31, 2008: |
||||||||||||
| Derivative stock warrants |
$ | — | $ | — | $ | 125,481 | $ | 125,481 | ||||
11. Notes Payable
In January 2005, the Company finalized an equipment purchase agreement to complete the acquisition of several pieces of equipment from a vendor. The Company made a down payment of $120,000 in 2004 and the remaining amount due was subject to repayment through a note with a face amount of $500,000. The agreement required 30 monthly payments of $5,323 followed by another 30 monthly payments of $16,339. The Company recorded the note payable at $415,618, net of a discount of $84,382, based on the present value of the payments using an interest rate of 14.75%. In July 2009, the Company paid off this equipment agreement as part of the Asset Purchase Agreement made by the Company and Veeco Compound Semiconductor, Inc. whereby the Company sold substantially all of its tangible assets located at its Halfmoon, New York facilities to Veeco (See Note 8 “Sales of Assets”).
F-21
Table of Contents
DAYSTAR TECHNOLOGIES, INC.
(A DEVELOPMENT STAGE ENTERPRISE)
We entered into a series of Purchase Agreements with Mr. Peter A. Lacey in the aggregate principal amount of $425,000 as evidenced by those certain Secured Promissory Notes dated December 2, 2009, December 17, 2009 and December 31, 2009. Each Secured Promissory Note has a 180 day term and an interest rate of 20% per annum.
The principal amount of future maturities of notes payable as of December 31, 2009 are as follows:
| Year Ending December 31, |
Amount | ||
| 2010 |
$ | 425,000 | |
| Total |
$ | 425,000 | |
12. Stockholders’ Equity
Preferred Stock—The Company has authorized 3,000,000 shares of undesignated preferred stock. As of December 31, 2009 and 2008, no shares have been designated or issued. The preferred stock may be issued in series with such preferences as determined by the board of directors.
Common Stock—The Company has authorized 120,000,000 shares of common stock. As of December 31, 2009 and 2008, respectively, 33,905,612 and 33,438,862 shares have been issued and were outstanding.
Class B public warrants—As of December 31, 2009, there were no Class B public warrants outstanding. As of December 31, 2008 5,113,453 Class B public warrants for the purchase of common stock were outstanding. The exercise price of a Class B public warrant was $10.00. The Class B public warrants expired on February 11, 2009, the fifth anniversary of the completion of the initial public offering.
Representative warrants—As of December 31, 2009, there were no Representative warrants outstanding. As of December 31, 2008, 8,192 warrants issued to underwriters in connection with the initial public offering were outstanding. Each warrant gave the holder the right to purchase one unit for $6.00. A unit consists of one share of common stock, two Class B non-redeemable public warrants, and that number of shares of common stock that would have been issuable upon cashless exercise of the Class A public warrants. The representative warrants expired on February 5, 2009.
Bridge loan warrants—As of December 31, 2009, there were 3,166,667 bridge loan warrants outstanding. On September 21, 2009, the Company issued 1,500,000 warrants and on October 2, 2009 the Company issued an additional 1,666,667 warrants pursuant to a bridge financing transaction. Each warrant is exercisable upon issuance and entitles the Holder to purchase one share of the Company’s common stock at an exercise price of $0.50 per share, as adjusted for standard anti-dilution provisions. The warrants are exercisable for a period of two years from their respective issuance dates.
Class A warrants—As of December 31, 2009 and 2008, 600,003 Class A Warrants were outstanding. On May 25, 2006, the Company issued 782,609 Class A Warrants pursuant to a private placement offering, and each provides the holder the right to purchase one share of common stock. The Class A Warrants had an exercise price of $12.65 at the issuance date, subject to adjustment upon certain events such as the sale of equity securities by the Company at a price below the then current exercise price. On February 16, 2007, the Company issued 317,394 Class A Warrants pursuant to the restructuring and sale of a note. These Class A Warrants have an exercise price of $0.50 per share. The fair value of these Class A Warrants, calculated using the Black-Scholes pricing model, was recorded as a derivative liability on the issuance date. As such, the liability is adjusted to fair market value, using the Black-Scholes pricing model, at the end of each reporting period (See Note 9 “Derivative Liabilities”).
F-22
Table of Contents
DAYSTAR TECHNOLOGIES, INC.
(A DEVELOPMENT STAGE ENTERPRISE)
Consultant warrants—As of December 31, 2009 and 2008, 65,487 Consultant warrants were outstanding. There were no Consultant warrants granted during the years ended December 31, 2009 and 2008. Of the outstanding Consultant warrants, 39,400 were granted in prior years under contracts with certain consultants for services rendered to the Company of which 19,400 contain an exercise price of $3.00 and 20,000 contain an exercise price of $7.50.
On May 25, 2006, the Company issued 26,087 Consultant warrants to the placement agent in connection with the placement of the Note and Class A Warrants. Each warrant gives the holder the right to purchase one share of the Company’s common stock at a price of $11.89 per share.
13. Employee Benefit Plans
The Company offers a savings and retirement plan under section 401(k) of the Internal Revenue Code to eligible employees meeting certain age and service requirements. The plan permits employees to contribute up to 85% of their salary up to the maximum allowable under Internal Revenue Service regulations. Participants are immediately vested in their voluntary contributions and actual earnings thereon. The Company did not make matching contributions to the plan for the years ended December 31, 2009 and 2008.
14. Income Taxes
Deferred tax assets related to the Company’s operations are comprised of the following at December 31, 2009 and 2008:
| 2009 | 2008 | |||||||
| Deferred tax assets: |
||||||||
| Current— |
||||||||
| Salary related accruals |
$ | 75,000 | $ | 350,000 | ||||
| Non-Current— |
||||||||
| Equity-based compensation |
975,000 | 495,000 | ||||||
| Tax effect of net operating loss carryforward |
35,600,000 | 27,370,000 | ||||||
| Tax effect of federal and state tax credit carryforwards |
4,105,000 | 3,395,000 | ||||||
| Deferred Revenue |
— | 160,000 | ||||||
| Deferred Rent |
765,000 | 440,000 | ||||||
| Long-lived assets |
240,000 | 240,000 | ||||||
| Total deferred tax assets |
41,760,000 | 32,450,000 | ||||||
| Less valuation allowance |
(41,760,000 | ) | (32,450,000 | ) | ||||
| Net deferred tax assets |
$ | — | $ | — | ||||
The valuation allowance increased by $9,310,000 and $10,265,000 for the years ended December 31, 2009 and December 31, 2008, respectively.
At December 31, 2009, the Company had a net operating loss carryforward of approximately $96,500,000. The net operating loss carryforward, if not utilized to reduce taxable income in future periods, will begin to expire in 2013. At December 31, 2009, the Company had federal and state tax credit carryforwards of approximately $4,100,000. Federal tax credits of approximately $2,500,000, if not utilized, will begin to expire in 2024. Under the Internal Revenue Code, the future utilization of net operating losses may be limited in certain circumstances where there is a significant ownership change. As a result of the initial public offering and certain subsequent equity transactions, a significant ownership change may have occurred.
F-23
Table of Contents
DAYSTAR TECHNOLOGIES, INC.
(A DEVELOPMENT STAGE ENTERPRISE)
Total income tax expense for the years ended December 31, 2009 and 2008 differed from the amounts computed by applying the U.S. Federal statutory tax rates to pre-tax income as follows:
| 2009 | 2008 | |||||
| Statutory rate |
(34.0 | )% | (34.0 | )% | ||
| State income taxes, net of Federal income tax benefit |
(5.0 | ) | (5.0 | ) | ||
| Permanent tax differences |
4.0 | 6.0 | ||||
| Tax credits |
(3.0 | ) | (5.0 | ) | ||
| Increase in valuation allowance |
38.0 | 38.0 | ||||
| — | % | — | % | |||
15. Stockholder Rights Plan
On May 6, 2008, the Company’s Board of Directors adopted a Stockholder Rights Plan, declaring that each stockholder of record as of the close of business on May 7, 2008 receive a dividend of one right for each outstanding share of common stock held. The dividend entitles the registered holder to purchase one ten-thousandth (1/10,000) of a share (a “Unit”) of Series A Junior Participating Cumulative Preferred Stock, $0.01 per share par value, at a price of $27.00 per unit, subject to adjustment. The stockholder rights are not exercisable until the close of business on the tenth calendar day following (i) a public announcement that a person or group of affiliated or associated persons has acquired beneficial ownership of 15% or more of the outstanding shares of the Company’s common stock or (ii) the commencement of a tender offer or exchange offer that could result upon its consummation in a person or group becoming the beneficial owner of 15% or more of the Company’s common stock. The rights will expire on May 7, 2010, unless previously redeemed or exchanged by the Company or such date is extended by the Company’s Board of Directors.
On October 1, 2009, the Company filed an amendment to the Stockholder Rights Plan to clarify the term “Exempt Person” to include any person or group that is approved by resolution of the Company’s Board of Directors to become a 15% or more of the outstanding shares of the Company’s Common Stock, prior to such person or group becoming a beneficial owner of 15% or more of the outstanding shares of the Company’s Common Stock. As of December 31, 2009, the Company had one beneficial owner of greater than 15%.
16. Subsequent Events
Employment Agreement
On February 15, 2010, Magnus Ryde was appointed Chief Executive Officer of Daystar Technologies, Inc. He also joined the Board of Directors of the Company.
Mr. Ryde entered into an employment agreement with the Company for a period of three years, but such term is automatically renewed for additional one year periods unless Mr. Ryde or the Company determines to terminate the employment agreement. Under the employment agreement, Mr. Ryde will be paid a base salary at an annual rate of $300,000 and will be eligible to participate in the Company’s employment benefit program. The Company has the option of deferring up to one-half of Mr. Ryde’s base salary in 2010 until the earlier occurrence of the consummation of a capital raising transaction or December 31, 2010.
The Employment Agreement provides that in the event that Mr. Ryde’s employment is terminated on or after a Change of Control (as defined in the Employment Agreement) and prior to the date that is thirty (30) days immediately following the first anniversary of the Change of Control, either by Mr. Ryde or by the Company, other than a termination by the Company for Cause and other than a termination due to a timely notice of non-renewal, death or disability, the Company is required to pay Mr. Ryde 250% of the aggregate of (i) Mr. Ryde’s
F-24
Table of Contents
DAYSTAR TECHNOLOGIES, INC.
(A DEVELOPMENT STAGE ENTERPRISE)
base salary for the year in which the termination occurs and (ii) the target amount of any incentive payment to Mr. Ryde for the year in which the termination occurs. In addition, the Company will continue to maintain health and dental benefits for Mr. Ryde for the eighteen months after the date of termination, and all unvested compensatory equity awards shall become vested immediately prior to the effectiveness of the termination.
The Compensation Committee of the Company’s Board of Directors and the full Board of Directors also approved the issuance of an inducement option (the “Stock Option”) to purchase up to 5,000,000 shares of the Company’s common stock to Mr. Ryde. The exercise price of this Stock Option is $0.40 and was equal to the fair market value of the Company’s common stock on the date of grant, February 16, 2010. Options to purchase 1,500,000 shares are vested immediately upon grant, options to purchase an additional 2,000,000 shares of common stock will vest if the Company consummates a capital raise of at least $20 million and options to purchase an additional 1,500,000 shares of common stock will vest on December 31, 2010. These options must be vested prior to exercise, and expire after a term of ten years from the date of grant. These options were granted as an inducement material to Mr. Ryde’s employment in accordance NASDAQ listing Rule 5635(c)(4).
Bridge Loan
Subsequent to December 31, 2009 and through March 17, 2010, the Company received bridge financing in the amount of $1,200,000. The Company’s Chairman of the Board, Mr. Peter Lacey provided $400,000 of the bridge financing. Of the amounts provided by Mr. Lacey, $250,000 of the funds were provided in exchange for a secured convertible promissory note and warrants containing terms that are substantially the same as those described in Note 9 “Secured Convertible Promissory Note and Warrants”. The shares underlying the convertible promissory note and warrants are subject to approval by the Company’s shareholders at its upcoming shareholder meeting. The remaining $150,000 provided by Mr. Lacey was issued in exchange for a secured promissory note containing terms that are substantially the same as the terms of previous notes provided by Mr. Lacey as described in Note 11 “Notes Payable”.
The remaining $800,000 of the $1,200,000 in bridge financing received subsequent to the balance sheet date was provided by two individual investors in exchange for a secured convertible promissory note and warrants containing terms that are substantially the same as those described in Note 9 “Secured Convertible Promissory Note and Warrants”.
F-25
Table of Contents
| Item 27. | Exhibits |
The following exhibits are filed as part of this report:
| Exhibit |
Exhibit Title | |
| 3.1(1) | Amended and Restated Certificate of Incorporation. | |
| 3.2(2) | Certificate of Amendment of Amended and Restated Certificate of Incorporation. | |
| 3.3(3) | Amended and Restated Bylaws. | |
| 3.4(4) | Certificate of Designations, Preferences and Rights of a Series of Preferred Stock classifying and designating the Series A Junior Participating Cumulative Preferred Stock. | |
| 4.1(4) | Stockholder Rights Agreement, dated as of May 6, 2008 between the Company and Computershare Trust Company, N.A., as Rights Agent. | |
| 4.2(5) | Form of Common Stock Certificate. | |
| 4.3(5) | Form of Class A Public Warrant. | |
| 4.4(5) | Form of Class B Public Warrant. | |
| 4.5(5) | Form of Unit Certificate. | |
| 4.6(5) | Form of Warrant Agent Agreement. | |
| 4.7(5) | Form of Representative’s Warrant. | |
| 10.1(6) | Registration Rights Agreement by and between the Company and Castlerigg Master Investments Ltd., dated January 19, 2007. | |
| 10.2(6) | Registration Rights Agreement by and between the Company and LC Capital Master Fund, Ltd., dated January 19, 2007. | |
| 10.3(6) | Registration Rights Agreement by and among the Company, Millennium Partners, L.P., Phoenix Partners, LP, Phoenix Partners II, LP, Phaeton International (BVI), Ltd. and PreX Capital Partners, LLC, dated January 19, 2007. | |
| 10.4(6) | Class A Warrant to purchase shares of common stock issued to Castlerigg Master Investments Ltd. on January 19, 2007. | |
| 10.5(7) | Amended and Restated Agreement of Contract of Purchase and Supply by and between the Company and Blitzstrom GmbH, dated October 6, 2006. | |
| 10.6(5) | Form of Indemnification Agreement by and between the Company and its directors. | |
| 10.7(5) | Form of Indemnification Agreement by and between the Company and its officers. | |
| 10.8*(5) | Form of Employee Notice of Stock Option Grant related to 2003 Equity Incentive Plan. | |
| 10.9*(5) | Form of Employee Restricted Stock Issuance Agreement related to 2003 Equity Incentive Plan. | |
| 10.10(8) | Agreement by and between the Company and New York State Energy Research and Development Authority, dated December 2, 2004. | |
| 10.11(9) | Amended and Restated Agreement of Contract of Purchase and Supply by and between the Company and Blitzstrom GmbH, dated May 11, 2007. | |
| 10.12*(10) | Employment Agreement by and between the Company and Ratson Morad, dated February 19, 2008. | |
| 10.13*(11) | Employment Agreement by and between the Company and Robert Weiss dated April 3, 2006. | |
II-1
Table of Contents
| Exhibit |
Exhibit Title | |
| 10.14*(5) | 2003 Equity Incentive Plan. | |
| 10.15(18) | First Amendment to the Registration Rights Agreement by and among the Company, Millenium Partners L.P., Phoenix Partners, LP, Phaeton International (BVI), Ltd. and PreX Capital Partners, LLC, dated May 29, 2007. | |
| 10.16(18) | First Amendment to the Registration Rights Agreement by and between the Company and LC Capital Master Fund, Ltd., dated May 29, 2007. | |
| 10.17(12) | Second Amendment to the Registration Rights Agreement by and among the Company, Millenium Partners L.P., Phoenix Partners, LP, Phaeton International (BVI), Ltd. and PreX Capital Partners, LLC, dated August 3, 2007. | |
| 10.18(12) | Second Amendment to the Registration Rights Agreement by and between the Company and LC Capital Master Fund, Ltd., dated August 3, 2007. | |
| 10.19*(13) | Amended and Restated 2006 Equity Incentive Plan. | |
| 10.20*(25) | Form of Employee Stock Option Agreement related to Amended and Restated 2006 Equity Incentive Plan. | |
| 10.21*(25) | Form of Employee Restricted Stock Issuance Agreement related to Amended and Restated 2006 Equity Incentive Plan. | |
| 10.22*(25) | Form of Employee Restricted Stock Unit Issuance Agreement related to Amended and Restated 2006 Equity Incentive Plan. | |
| 10.23(14) | Lease Agreement between the Company and Sitterly Associates, LLC dated May 25, 2004. | |
| 10.24(14) | Lease Agreement between the Company and Sitcon, LLC dated April 6, 2006. | |
| 10.25(14) | Lease Agreement between the Company and Coronado Stender Associates, LLC dated February 24, 2006. | |
| 10.26(15) | Lease Agreement between the Company and BMR-Gateway Boulevard LLC dated April 29, 2008. | |
| 10.27*(16) | Employment Agreement with William S. Steckel dated June 25, 2008. | |
| 10.28*(17) | Amended and Restated Employment Agreement by and between the Company and Stephan J. DeLuca, dated December 5, 2008. | |
| 10.29*(17) | Amended and Restated Employment Agreement by and between the Company and Ratson Morad, dated December 4, 2008. | |
| 10.30*(17) | Amended and Restated Employment Agreement by and between the Company and Robert E. Weiss, dated December 4, 2008. | |
| 10.31*(19) | Separation Agreement dated May 12, 2009, by and between the Company and Stephan J. DeLuca. | |
| 10.32*(19) | Offer Letter with Robert G. Aldrich dated May 15, 2009. | |
| 10.33*(20) | Form of Restricted Stock Unit Agreement for Employees and Consultants. | |
| 10.34*(20) | Form of Restricted Stock Unit Agreement for Non-Employee Directors. | |
| 10.35(21) | Registration Rights Agreement by and between the Company and TD Waterhouse RRSP Account 240832S, in trust for Peter Alan Lacey, dated September 21, 2009. | |
II-2
Table of Contents
| Exhibit |
Exhibit Title | |
| 10.36(22) | Registration Rights Agreement by and between the Company and Mike Moretti, dated January 6, 2010. | |
| 10.37(23) | Registration Rights Agreement by and between the Company and Tejas Securities Group, Inc. 401k Plan and Trust, FBO John J. Gorman, John J. Gorman TTEE, dated February 11, 2010. | |
| 10.38*(24) | Employment Agreement by and between the Company and Magnus Ryde, dated February 15, 2010. | |
| 23.1 | Consent of Hein & Associates LLP. | |
| 24.1 | Power of Attorney (included in the signature page hereto) | |
| 31.1 | Certification of the Chief Executive Officer Pursuant to Rule 13a-14(a) under the Securities Exchange Act of 1934. | |
| 31.2 | Certification of the Chief Accounting Officer Pursuant to Rule 13a-14(a) under the Securities Exchange Act of 1934. | |
| 32.1 | Certification of the Chief Executive Officer pursuant to 18 U.S.C. Section 1350, as adopted pursuant to Section 906 of the Sarbanes-Oxley Act of 2002. | |
| 32.2 | Certification of the Chief Accounting Officer pursuant to 18 U.S.C. Section 1350, as adopted pursuant to Section 906 of the Sarbanes-Oxley Act of 2002. | |
| * | Management contract or compensatory plan or arrangement |
| (1) | Incorporated by reference to our Quarterly Report on Form 10-QSB filed with the SEC on August 11, 2006. |
| (2) | Incorporated by reference to our Quarterly Report on Form 10-Q filed with the SEC on November 14, 2008. |
| (3) | Incorporated by reference to our Quarterly Report on Form 10-Q filed with the SEC on August 7, 2008. |
| (4) | Incorporated by reference to our Registration Statement on Form 8-A filed with the SEC on May 8, 2008. |
| (5) | Incorporated by reference to our Registration Statement on Form SB-2 filed with the SEC on November 7, 2003, as amended. |
| (6) | Incorporated by reference to our Current Report on Form 8-K filed with the SEC on January 25, 2007. |
| (7) | Incorporated by reference to our Registration Statement on Form SB-2 filed with the SEC on February 20, 2007. |
| (8) | Incorporated by reference to our Annual Report on Form 10-KSB filed with the SEC on March 18, 2005. |
| (9) | Incorporated by reference to our Quarterly Report on Form 10-QSB filed with the SEC on May 15, 2007. |
| (10) | Incorporated by reference to our Current Report on Form 8-K filed with the SEC on February 25, 2008. |
| (11) | Incorporated by reference to our Current Report on Form 8-K filed with the SEC on April 7, 2006. |
| (12) | Incorporated by reference to our Quarterly Report on Form 10-QSB filed with the SEC on August 3, 2007. |
| (13) | Incorporated by reference to our Current Report on Form 8-K filed with the SEC on September 26, 2008. |
| (14) | Incorporated by reference to our Annual Report on Form 10-KSB filed with the SEC on March 1, 2007. |
| (15) | Incorporated by reference to our Quarterly Report on Form 10-Q filed with the SEC on May 5, 2008. |
| (16) | Incorporated by reference to our Current Report on Form 8-K filed with the SEC on June 27, 2008. |
| (17) | Incorporated by reference to our Current Report on Form 8-K filed with the SEC on December 10, 2008. |
| (18) | Incorporated by reference to our Current Report on Form 8-K filed with the SEC on June 4, 2007. |
| (19) | Incorporated by reference to our Current Report on Form 8-K filed with the SEC on May 18, 2009. |
| (20) | Incorporated by reference to our Current Report on Form 8-K filed with the SEC on July 2, 2009. |
| (21) | Incorporated by reference to our Current Report on Form 8-K filed with the SEC on September 24, 2009. |
| (22) | Incorporated by reference to our Current Report on Form 8-K filed with the SEC on January 12, 2010. |
| (23) | Incorporated by reference to our Current Report on Form 8-K filed with the SEC on February 18, 2010. |
| (24) | Incorporated by reference to our Current Report on Form 8-K filed with the SEC on February 17, 2010. |
| (25) | Incorporated by reference to our Annual Report on Form 10-K filed with the SEC on March 16, 2009. |
II-3