Attached files
UNITED STATES
SECURITIES AND EXCHANGE COMMISSION
Washington, D.C. 20549
FORM 10-K
| x | ANNUAL REPORT PURSUANT TO SECTION 13 OR 15(D) OF THE SECURITIES EXCHANGE ACT OF 1934 |
| For the fiscal year ended December 31, 2009 |
| ¨ | TRANSITION REPORT PURSUANT TO SECTION 13 OR 15(d) OF THE SECURITIES EXCHANGE ACT OF 1934 |
Commission file number: 000-28635
Virginia Commerce Bancorp, Inc.
(Exact name of registrant as specified in its charter)
| Virginia | 54-1964895 | |
| (State or other jurisdiction of incorporation or organization) |
(I.R.S. Employer Identification No.) | |
| 5350 Lee Highway, Arlington, Virginia | 22207 | |
| (Address of principal executive offices) | (Zip Code) | |
Registrant’s telephone number: 703.534.0700
Securities registered pursuant to Section 12(b) of the Act
| Title of Each Class |
Name of Each Exchange on which Registered | |
| Common Stock, $1.00 par value |
The Nasdaq Stock Market (Global Select) |
Securities registered pursuant to Section 12(g) of the Act: None
Indicate by check mark if the registrant is a well-known seasoned issuer, as defined in Rule 405 of the Securities Act. Yes ¨ No x
Indicate by check mark if the registrant is not required to file reports pursuant to Section 13 or Section 15(d) of the Act. Yes ¨ No x
Indicate by check mark whether the registrant; (1) has filed all reports required to be filed by Section 13 or 15(d) of the Securities Exchange Act of 1934 during the preceding 12 months (or for such shorter period that the registrant was required to file such reports); and (2) has been subject to such filing requirements for the past 90 days. Yes x No ¨
Indicate by check mark whether the registrant has submitted electronically and posted on its corporate Web site, if any, every Interactive Data File required to be submitted and posted pursuant to Rule 405 of Regulation S-T (§ 232.405 of this chapter) during the preceding 12 months (or for such shorter period that the registrant was required to submit and post such files). ¨ Yes ¨ No
Indicate by check mark if disclosure of delinquent filers pursuant to Item 405 of Regulation S-K (§229.405 of this chapter) is not contained herein, and will not be contained, to the best of registrant’s knowledge, in definitive proxy or information statements incorporated by reference in Part III of this Form 10-K or any amendment to this Form 10-K. ¨
Indicate by check mark whether the registrant is a large accelerated filer, an accelerated filer, a non-accelerated filer or a smaller reporting company. See the definitions of “large accelerated filer” “accelerated filer” and “smaller reporting company” in Rule 12b-2 of the Exchange Act.
| Large accelerated filer | ¨ | Accelerated filer | ¨ | |||
| Non-accelerated filer | ¨ | Smaller reporting company | x | |||
Indicate by check mark whether the registrant is a shell company (as defined in Rule 12b-2 of the Act). Yes ¨ No x
The registrant’s Common Stock is traded on the Nasdaq Global Select Market under the symbol VCBI. The aggregate market value of the approximately 26,693,074 shares of Common Stock of the registrant issued and outstanding held by non-affiliates on June 30, 2009 was approximately $45.0 million, based on the closing sales price of $2.30 per share on that date. For purposes of this calculation, the term “affiliate” refers to all directors, executive officers and 10% shareholders of the registrant.
As of the close of business on March 18, 2010, 26,933,923 shares of the registrant’s Common Stock were outstanding.
DOCUMENTS INCORPORATED BY REFERENCE
Portions of the registrant’s definitive Proxy Statement for the Annual Meeting of Shareholders, to be held on April 28, 2010, are incorporated by reference in Part III hereof.
Form 10-K Cross Reference Sheet
The following shows the location in this Annual Report on Form 10-K or the Company’s Proxy Statement for the Annual Meeting of Stockholders to be held on April 28, 2010, of the information required to be disclosed by the United States Securities and Exchange Commission Form 10-K. References to pages only are to pages in this report.
| PART I | Item 1. | Business. See “Business” at pages 63 through 72. | ||
| Item 1A. | Risk Factors. See “Risk Factors” at pages 23 through 27. | |||
| Item 1B. | Unresolved Staff Comments. Not required. | |||
| Item 2. | Properties. See “Properties” at page 72. | |||
| Item 3. | Legal Proceedings. From time to time the Company is a participant in various legal proceedings incidental to its business. In the opinion of management, the liabilities (if any) resulting from such legal proceedings will not have a material effect on the financial position of the Company. | |||
| Item 4. | Removed and Reserved. | |||
| PART II | Item 5. | Market for Registrant’s Common Equity, Related Stockholder Matters and Issuer Purchases of Equity Securities. See “Market Price of Stock” at page 73 through 74. | ||
| Item 6. | Selected Financial Data. See “Five Year Financial Summary” at page 3. | |||
| Item 7. | Management’s Discussion and Analysis of Financial Condition and Results of Operations. See “Management’s Discussion and Analysis of Financial Condition and Results of Operations” at pages 4 through 22. | |||
| Item 7A. | Quantitative and Qualitative Disclosures About Market Risk. See “Asset/Liability Management and Quantitative and Qualitative Disclosures About Market Risk” at page 9 through 10. | |||
| Item 8. | Financial Statements and Supplementary Data. See Consolidated Financial Statements at pages 32 through 62. | |||
| Item 9. | Changes in and Disagreements with Accountants on Accounting and Financial Disclosure. None. | |||
| Item 9A. | Controls and Procedures. See “Disclosure Controls and Procedures” at page 27 and “Management Report on Internal Control Over Financial Reporting” at page 28. | |||
| Item 9B. | Other Information. None | |||
| PART III | Item 10. | Directors, Executive Officers and Corporate Governance. The information required by Item 10 is incorporated by reference from the material under the captions “Election of Directors” and “Section 16(a) Beneficial Ownership Reporting Compliance” in the Proxy Statement. The Company has adopted a code of ethics that applies to its Chief Executive Officer and Chief Financial Officer. A copy of the code of ethics will be provided to any person, without charge, upon written request directed to Krista DiVenere, Assistant Controller, Virginia Commerce Bank, 14201 Sullyfield Circle, Suite 500, Chantilly, Virginia 20151. | ||
| There have been no material changes in the procedures previously disclosed by which stockholders may recommend nominees to the Company’s Board of Directors. | ||||
| Item 11. | Executive Compensation. The information required by Item 11 is incorporated by reference from the material under the captions “Executive Officer Compensation” and “Election of Directors – Director Compensation” and “- Compensation Committee Interlocks and Insider Participation” in the Proxy Statement. | |||
| Item 12. | Security Ownership of Certain Beneficial Owners and Management and Related Stockholder Matters. The information required by Item 12 is incorporated by reference from the material under the caption “Voting Securities and Principal Holders” and “Securities Authorized for Issuance Under Equity Compensation Plans” in the Proxy Statement. | |||
| Item 13. | Certain Relationships and Related Transactions, and Director Independence. The information required by Item 13 is incorporated by reference from the material under the captions “Election of Directors” and “Transactions with Management and Related Parties” in the Proxy Statement. | |||
| Item 14. | Principal Accountant Fees and Services. The information required by Item 14 is incorporated by reference from the material under the caption “Independent Registered Public Accounting Firm” in the Proxy Statement. | |||
| PART IV | Item 15. | Exhibits, Financial Statement Schedules. See “Financial Statements and Exhibits” at page 75 through 76. | ||
2
FIVE YEAR FINANCIAL SUMMARY
| Year Ended December 31, | ||||||||||||||||||||
| 2009 | 2008 | 2007 | 2006 | 2005 | ||||||||||||||||
| (Dollars in thousands, except per share amounts) | ||||||||||||||||||||
| Selected Year-End Balances |
||||||||||||||||||||
| Total assets |
$ | 2,725,297 | $ | 2,715,922 | $ | 2,339,697 | $ | 1,949,082 | $ | 1,518,425 | ||||||||||
| Total stockholders’ equity |
218,868 | 253,287 | 169,143 | 139,851 | 111,818 | |||||||||||||||
| Total loans (net) |
2,210,064 | 2,273,086 | 1,924,741 | 1,629,827 | 1,270,255 | |||||||||||||||
| Total deposits |
2,229,327 | 2,172,142 | 1,869,165 | 1,605,941 | 1,243,506 | |||||||||||||||
| Summary Results of Operations |
||||||||||||||||||||
| Interest income |
$ | 150,633 | $ | 160,468 | $ | 154,138 | $ | 125,292 | $ | 86,478 | ||||||||||
| Interest expense |
59,229 | 77,430 | 78,981 | 56,487 | 29,811 | |||||||||||||||
| Net interest income |
$ | 91,404 | $ | 83,038 | $ | 75,157 | $ | 68,805 | $ | 56,667 | ||||||||||
| Provision for loan losses |
81,913 | 25,378 | 4,340 | 4,406 | 3,772 | |||||||||||||||
| Net interest income after provision for loan losses |
$ | 9,491 | $ | 57,660 | $ | 70,817 | $ | 64,399 | $ | 52,895 | ||||||||||
| Non-interest income (charges) |
(4,352 | ) | 6,431 | 7,883 | 7,323 | 6,676 | ||||||||||||||
| Non-interest expense |
56,868 | 44,776 | 39,694 | 34,289 | 29,466 | |||||||||||||||
| (Loss) income before taxes |
$ | (51,729 | ) | $ | 19,315 | $ | 39,006 | $ | 37,433 | $ | 30,105 | |||||||||
| (Benefit) provision for income tax |
(18,404 | ) | 6,231 | 13,219 | 12,925 | 10,438 | ||||||||||||||
| Net (loss) income |
$ | (33,325 | ) | $ | 13,084 | $ | 25,787 | $ | 24,508 | $ | 19,667 | |||||||||
| Effective dividend on preferred stock |
4,539 | 258 | — | — | — | |||||||||||||||
| Net (loss) income available to common stockholders |
$ | (37,864 | ) | $ | 12,826 | $ | 25,787 | $ | 24,508 | $ | 19,667 | |||||||||
| Per Common Share Data (1) |
||||||||||||||||||||
| Net (loss) income per common share, basic |
$ | (1.42 | ) | $ | 0.48 | $ | 0.98 | $ | 0.95 | $ | 0.77 | |||||||||
| Net (loss) income per common share, diluted |
$ | (1.42 | ) | $ | 0.47 | $ | 0.95 | $ | 0.89 | $ | 0.72 | |||||||||
| Book value per common share |
$ | 5.53 | $ | 6.86 | $ | 6.40 | $ | 5.36 | $ | 4.39 | ||||||||||
| Average number of common shares outstanding: |
||||||||||||||||||||
| Basic |
26,692,570 | 26,555,484 | 26,323,242 | 25,960,838 | 25,429,399 | |||||||||||||||
| Diluted |
26,692,570 | 27,249,839 | 27,379,204 | 27,449,754 | 27,205,294 | |||||||||||||||
| Growth and Significant Ratios |
||||||||||||||||||||
| % Change in net income |
-354.70 | % | -49.26 | % | 5.22 | % | 24.61 | % | 38.22 | % | ||||||||||
| % Change in assets |
0.35 | % | 16.08 | % | 20.04 | % | 28.36 | % | 33.27 | % | ||||||||||
| % Change in loans (net) |
-2.77 | % | 18.10 | % | 18.09 | % | 28.31 | % | 37.21 | % | ||||||||||
| % Change in deposits |
2.63 | % | 16.21 | % | 16.39 | % | 29.15 | % | 28.07 | % | ||||||||||
| % Change in total stockholders’ equity |
-13.59 | % | 49.75 | % | 20.95 | % | 25.07 | % | 22.44 | % | ||||||||||
| Equity to asset ratio |
8.03 | % | 9.33 | % | 7.23 | % | 7.18 | % | 7.36 | % | ||||||||||
| Return on average assets |
-1.22 | % | 0.51 | % | 1.21 | % | 1.40 | % | 1.45 | % | ||||||||||
| Return on average equity |
-13.89 | % | 7.18 | % | 16.75 | % | 19.51 | % | 19.44 | % | ||||||||||
| Average equity to average assets |
8.77 | % | 7.06 | % | 7.22 | % | 7.19 | % | 7.47 | % | ||||||||||
| Efficiency ratio, as adjusted (2) |
55.57 | % | 50.05 | % | 47.80 | % | 45.04 | % | 46.52 | % | ||||||||||
| (1) | Adjusted for all years presented giving retroactive effect to a five-for-four stock split in the form of a 25% stock dividend in 2005, a three-for-two stock split in the form of a 50% stock dividend in 2006, and a 10% stock dividend in 2007 and 2008. |
| (2) | Computed by dividing non-interest expense by the sum of net interest income on a tax equivalent basis and non-interest income, net of losses on other real estate owned. This is a non-GAAP financial measure, which we believe provides investors with important information regarding our operational efficiency. Comparison of our efficiency ratio with those of other companies may not be possible, because other companies may calculate the efficiency ratio differently. |
3
MANAGEMENT’S DISCUSSION AND ANALYSIS OF FINANCIAL CONDITION AND RESULTS OF OPERATIONS
Forward-Looking Statements
This management’s discussion and analysis and other portions of this report, contain forward-looking statements within the meaning of the Securities and Exchange Act of 1934, as amended (the “Exchange Act”), including statements of goals, intentions, and expectations as to future trends, plans, events or results of Company operations and policies and regarding general economic conditions. In some cases, forward-looking statements can be identified by use of words such as “may,” “will,” “anticipates,” “believes,” “expects,” “plans,” “estimates,” “potential,” “continue,” “should,” and similar words or phrases. These statements are based upon current and anticipated economic conditions, nationally and in the Company’s market, interest rates and interest rate policy, competitive factors, and other conditions which by their nature, are not susceptible to accurate forecast, and are subject to significant uncertainty. Because of these uncertainties and the assumptions on which this discussion and the forward-looking statements are based, actual future operations and results may differ materially from those indicated herein. Readers are cautioned against placing undue reliance on any such forward-looking statements. The Company’s past results are not necessarily indicative of future performance.
Non-GAAP Presentations
This management’s discussion and analysis refers to the efficiency ratio, as adjusted, which is computed by dividing non-interest expense by the sum of net interest income on a tax equivalent basis and non-interest income before losses on other real estate owned (“OREO”). This is a non-GAAP financial measure that we believe provides investors with important information regarding our operational efficiency. Comparison of our efficiency ratio with those of other companies may not be possible because other companies may calculate the efficiency ratio, as adjusted, differently. The Company, in referring to its net income, is referring to income under accounting principles generally accepted in the United States, or “GAAP.”
General
The following presents management’s discussion and analysis of the consolidated financial condition and results of operations of Virginia Commerce Bancorp, Inc. and subsidiaries (the “Company”) as of the dates and for the periods indicated. This discussion should be read in conjunction with the Company’s Consolidated Financial Statements and the Notes thereto, and other financial data appearing elsewhere in this report. The Company is the parent bank holding company for Virginia Commerce Bank (the “Bank”), a Virginia state-chartered bank that commenced operations in May 1988. The Bank pursues a traditional community banking strategy, offering a full range of business and consumer banking services through twenty-eight branch offices, one residential mortgage office and one investment services office.
Headquartered in Arlington, Virginia, the Bank serves the Northern Virginia suburbs of Washington, D.C., including Arlington, Fairfax, Fauquier, Loudoun, Prince William, Spotsylvania and Stafford Counties and the cities of Alexandria, Fairfax, Falls Church, Fredericksburg, Manassas and Manassas Park. Its service area also covers, to a lesser extent, Washington, D.C. and the nearby Maryland counties of Montgomery and Prince Georges. The Bank’s customer base includes small-to-medium sized businesses including firms that have contracts with the U.S. government, associations, retailers and industrial businesses, professionals and their firms, business executives, investors and consumers.
Critical Accounting Policies
During the year ended December 31, 2009, there were no changes in the Company’s critical accounting policies as reflected in the Company’s most recent annual or quarterly report.
The Company’s financial statements are prepared in accordance with GAAP. The financial information contained within our statements is, to a significant extent, financial information that is based on measures of the financial effects of transactions and events that have already occurred. A variety of factors could affect the ultimate value that is obtained either when earning income, recognizing an expense, recovering an asset or relieving a liability. We use historical loss factors as one factor in determining the inherent loss that may be present in our loan portfolio. Actual losses could differ significantly from the historical factors that we use. In addition, GAAP itself may change from one previously acceptable method to another method. Although the economics of our transactions would be the same, the timing of events that would impact our transactions could change.
4
The allowance for loan losses is an estimate of the losses that are inherent in our loan portfolio. The allowance is based on two basic principles of accounting: (i) Accounting for Contingencies (ASC 450 Contingencies), which requires that losses be accrued when they are probable of occurring and estimable and (ii) Accounting by Creditors for Impairment of a Loan (ASC 310 Receivables), which requires that losses be accrued based on the differences between the value of collateral, present value of future cash flows or values that are observable in the secondary market and the loan balance.
Our allowance for loan losses has two basic components: the specific allowance and the general allowance. Each of these components is determined based upon estimates that can and do change when the actual events occur. The specific allowance is used to individually allocate an allowance for impaired loans. Impairment testing includes consideration of the borrower’s overall financial condition, resources and payment record, support available from financial guarantors and the fair market value of collateral. These factors are combined to estimate the probability and severity of inherent losses based on the Company’s calculation of the loss embedded in the individual loan. Large groups of smaller balance, homogeneous loans, representing 1-4 family residential first and second trusts, including home equity lines-of-credit, are collectively evaluated for impairment based upon factors such as levels and trends in delinquencies, trends in loss and problem loan identification, trends in volumes and concentrations, local and national economic trends and conditions including estimated levels of housing price depreciation/homeowners’ loss of equity, competitive factors and other considerations. These factors are converted into reserve percentages and applied against the homogenous loan pool balances. Impaired loans which meet the criteria for substandard, doubtful and loss are segregated from performing loans within the portfolio. Internally classified loans are then grouped by loan type (commercial, commercial real estate, commercial construction, residential real estate, residential construction or installment). The general formula is used to estimate the loss of non-classified loans. These un-criticized loans are also segregated by loan type and allowance factors are assigned by management based on delinquencies, loss history, trends in volume and terms of loans, effects of changes in lending policy, the experience and depth of management, national and local economic trends, concentrations of credit, quality of the loan review system and the effect of external factors (i.e. competition and regulatory requirements). The factors assigned differ by loan type. The general allowance recognizes potential losses whose impact on the portfolio has yet to be recognized by a specific allowance. Allowance factors and the overall size of the allowance may change from period to period based on management’s assessment of the above described factors and the relative weights given to each factor. For further information regarding the allowance for loan losses see Notes 1 and 4 to the Consolidated Financial Statements and the discussion under the caption “Asset Quality – Provision and Allowance for Loan Losses” at page 11.
The Company’s 1998 Stock Option Plan (the “Plan”), which is shareholder-approved, permits the grant of share options to its directors and officers for up to 2.3 million shares of common stock. Option awards are generally granted with an exercise price equal to the market price of the Company’s stock at the date of grant, generally vest based on 5 years of continuous service and have 10-year contractual terms. The fair value of each option award is estimated on the date of grant using a Black-Scholes option pricing model that currently uses historical volatility of the Company’s stock based on a 7.2 year expected term, before exercise, for the options granted, and a risk-free interest rate based on the U.S. Treasury Department (the “Treasury”) curve in effect at the time of the grant to estimate total stock-based compensation expense. This amount is then amortized on a straight-line basis over the requisite service period, currently 5 years, to salaries and benefits expense. See Notes 1 and 12 to the Consolidated Financial Statements for additional information regarding the Stock Option Plan and related expense.
On a quarterly basis the Company reviews any securities which are considered to be impaired as defined by accounting guidance, to determine if the impairment is deemed to be other-than-temporary. If it is determined that the impairment is other-than-temporary, i.e. impaired because of credit issues rather than interest rate, the investment is written down through the Statement of Operations in accordance with accounting guidance.
Financial Performance Overview
For the year ended December 31, 2009, the Company recorded a net operating loss of $33.3 million. After an effective dividend of $4.5 million to the Treasury on preferred stock, the Company recorded a net loss to common stockholders of $37.9 million, or $1.42 per diluted common share, with a return on average assets and return on average equity of a negative 1.22% and 13.89%, respectively. This loss in 2009, was primarily due to $81.9 million in loan loss provisions, taken in consideration of the level of non-performing loans and $53.2 million in net charge-offs. Earnings were also impacted by a $10.0 million loss on other real estate owned, a $1.8 million impairment loss
5
on securities, and a $3.0 million provision for a contingent liability related to an off-balance sheet letter-of-credit commitment. For the year ended December 31, 2008, operating earnings of $13.1 million, were down $12.7 million, or 49.3% compared to earnings of $25.8 million for the prior fiscal year as net interest income increased $7.8 million, or 10.5%, from $75.2 million in 2007, to $83.0 million in 2008, non-interest income decreased $1.5 million, or 18.4%, from $7.9 million in 2007, to $6.4 million, while provisions for loan losses were up $21.0 million, and non-interest expense rose 12.8%, from $39.7 million in 2007, to $44.8 million. In 2007, earnings of $25.8 million increased $1.3 million, or 5.2%, compared to earnings of $24.5 million in 2006, with net interest income increasing $6.4 million, or 9.2%, non-interest income rising $560 thousand, or 7.6%, while non-interest expense rose $5.4 million, or 15.8%. On a diluted per common share basis, earnings were $0.47 and $0.95 in 2008 and 2007, respectively, while the Company’s return on average assets was 0.51% for 2008, as compared to 1.21% in 2007, and its return on average equity was 7.18% in 2008 and 16.75% in 2007.
Total assets increased $9.4 million, or 0.35%, from $2.72 billion at December 31, 2008, to $2.73 billion at December 31, 2009, and increased $376.2 million, or 16.1%, from $2.34 billion at December 31, 2007, to $2.72 billion at December 31, 2008. Loans, net of the allowance for loan losses, decreased $63.0 million, or 2.8%, from $2.27 billion at December 31, 2008, to $2.21 billion at December 31, 2009, as non-farm, non-residential real estate loans increased $114.6 million, or 11.3%, and one-to-four family residential loans increased $49.5 million, or 13.9%, while real estate construction loans fell by $156.8 million, or 26.8%, and commercial and industrial loans were down 14.7%. Loan production in 2009 was negatively impacted by declining economic activity and demand in both the business and consumer sectors, a reallocation of lending personnel to problem loan identification and resolution and a strategic decision to moderate loan growth in the face of an uncertain economy and heightened risk factors. Loans are the Company’s principal asset class and primary contributor to interest income.
In 2008, the Company achieved significant growth in loans of $348.3 million, or 18.1%, from $1.92 billion at December 31, 2007, to $2.27 billion at December 31, 2008. The majority of loan growth occurred in non-farm, non-residential real estate loans, which rose $175.8 million, or 21.0%, from $835.5 million at December 31, 2007, to $1.01 billion at December 31, 2008. One-to-four family residential real estate loans represented the second largest increase rising $90.9 million, or 34.1%, from $266.4 million at December 31, 2007, to $357.3 million, while construction loans increased $40.8 million, or 7.5%, from $544.3 million at the end of 2007, to $585.1 million and commercial loans rose $40.8 million, or 17.1%, from $238.7 million at December 31, 2007, to $279.5 million.
While loans are the Company’s major asset, deposits are the Company’s major source of funding and as a result the major contributor to interest expense. Year-over-year, deposits increased $57.2 million, or 2.6%, to slightly over $2.2 billion, as demand deposits increased $44.8 million, or 23.0%, savings and interest-bearing demand deposits grew by $467.1 million, or 90.2%, and time deposits declined by $454.7 million, or 31.2%. The increases in savings and interest-bearing demand deposits were due primarily to success with the Company’s MEGA Savings and MEGA Checking accounts. The declines in time deposits are reflective of lower loan volume, requiring lower levels of funding, and a strategy to reduce the Bank’s historically heavy reliance on certificates of deposit as a funding source with deposit gathering efforts and cross-selling activities focused on demand deposits, and savings and interest-bearing demand accounts. The proportionate share of time deposits to total deposits has declined from 67.2% at year-end 2008 to 45.1% as of December 31, 2009. In 2008, deposits increased by $303.3 million, or 16.2%, with non-interest-bearing demand deposits decreasing by $19.0 million, or 8.9%, to $194.8 million, savings and interest-bearing demand deposits mostly unchanged and time deposits growing $321.1 million, or 28.2%, from $1.14 billion at December 31, 2007, to $1.46 billion.
The Company’s investment securities portfolio represents its second largest asset class and contributor to interest income, and is generally maintained as a primary source of liquidity. Investment securities increased $22.9 million, or 7.0%, from $325.7 million at December 31, 2008, to $348.6 million at December 31, 2009, and increased by $5.6 million, or 1.8%, from $320.1 million at December 31, 2007, to $325.7 million at December 31, 2008. The majority of the year-over-year increase in securities was concentrated in U.S. Government Agency debt obligations and mortgage-backed securities, and bank-qualified municipal bonds.
Stockholders’ equity decreased $34.4 million, or 13.6%, from $253.3 million at December 31, 2008, to $218.9 million at December 31, 2009, with a net loss to common stockholders of $37.9 million over the twelve-month period, a $1.1 million increase in other comprehensive income related to the investment securities portfolio, and $918 thousand in proceeds and tax benefits related to the exercise of options by company directors, officers and employees and stock option expense credits. As a result of these changes, the Company’s Tier 1 capital ratio decreased from 13.07% at December 31, 2008, to 11.48% at December 31, 2009, and its total qualifying capital ratio
6
declined from 14.44% to 12.73% for the same period. In 2008, stockholders’ equity increased by $84.1 million, or 49.8%, from $169.1 million at December 31, 2007, to $253.3 million, with earnings of $13.1 million, a $1.9 million decrease in other comprehensive income related to the investment securities portfolio, and $911 thousand in proceeds and tax benefits related to the exercise of options by Company directors, officers and employees and stock option expense credits. On September 24, 2008, the Company raised $25 million in qualifying capital through the sale of trust preferred securities to the Company’s directors and certain of its executive officers. In connection with the issuance of the trust preferred securities, the Company also issued warrants to purchase an aggregate of 1.5 million shares of common stock to the purchasers. On December 12, 2008, the Company issued $71 million in preferred stock to the Treasury under the Capital Purchase Program. In connection with the issuance of the preferred stock, the Company also issued to the Treasury warrants to purchase approximately 2.7 million shares of common stock. Please refer to “Capital Issuances” at page 21 for a discussion of the issuance of securities under the Capital Purchase Program.
Net Interest Income
Net interest income is the excess of interest earned on loans and investments over the interest paid on deposits and borrowings and is the Company’s primary revenue source. Net interest income is thereby affected by overall balance sheet growth, changes in interest rates and changes in the mix of investments, loans, deposits and borrowings. For the year ending December 31, 2009, net interest income of $91.4 million was up 10.1%, compared to $83.0 million in 2008, as the net interest margin rose from 3.30% in 2008, to 3.45%. This year-over-year increase in the net interest margin was driven by lower deposit costs due to significant reductions in the level of time deposits, increased levels of demand deposits and increased levels of lower rate interest-bearing transaction accounts. As a result, the average cost of interest-bearing deposits fell from 3.55% in 2008, to 2.50% in 2009, while yields on interest-earning assets fell to a lesser extent from an average of 6.35% in 2008, to 5.67% in 2009.
In 2008, net interest income increased $7.8 million, or 10.5%, from $75.2 million in 2007, to $83.0 million due to significant growth in loans as the net interest margin fell from 3.65% in 2007, to 3.30%, with the yield on interest-earning assets falling 111 basis points from 7.46% to 6.35%, while the cost of interest-bearing liabilities fell 94 basis points to 3.52%. In 2007, net interest income increased $6.4 million, or 9.2%, from $68.8 million in 2006, to $75.2 million due again to significant loan growth as the net interest margin fell from 4.07% in 2006, to 3.65%, with the cost of interest-bearing liabilities rising from 4.00% in 2006 to 4.46%, while the yield on interest-earning assets increased by only five basis points from 7.41% in 2006 to 7.46%. The declines in yields and the cost of funds in 2008 were highly affected by a Federal Open Market Committee campaign, beginning in September 2007, to lower the Federal funds target rate. That campaign ended in September 2008 with a target rate range of 0.25% and as a result the prime lending rate fell to 3.25%. These rates remained unchanged in 2009. Tables 1 and 2 provide further information with regard to yields, costs, the changes in net interest income and associated risk.
7
TABLE 1: AVERAGE BALANCES, INCOME AND EXPENSE, YIELDS AND RATES
The following table shows the average balance sheets for each of the years ended December 31, 2009, 2008, and 2007. In addition, the amounts of interest earned on interest-earning assets, with related yields, and interest expense on interest-bearing liabilities, with related rates, are shown. Loans placed on a non-accrual status are included in the average balances. Net loan fees and late charges included in interest income on loans totaled $3.3 million, $5.0 million and $5.5 million for 2009, 2008, and 2007, respectively.
| 2009 | 2008 | 2007 | |||||||||||||||||||||||||
| (Dollars in thousands) |
Average Balance |
Interest Income- Expense |
Average Yields/ Rates |
Average Balance |
Interest Income- Expense |
Average Yields/ Rates |
Average Balance |
Interest Income- Expense |
Average Yields/ Rates |
||||||||||||||||||
| Assets |
|||||||||||||||||||||||||||
| Securities (1) |
$ | 334,873 | $ | 15,641 | 4.82 | % | $ | 320,497 | $ | 16,265 | 5.19 | % | $ | 275,645 | $ | 13,640 | 5.03 | % | |||||||||
| Restricted stock |
11,589 | 355 | 3.06 | % | 7,695 | 320 | 4.15 | % | 5,207 | 308 | 5.92 | % | |||||||||||||||
| Loans, net of unearned income |
2,279,294 | 134,548 | 5.91 | % | 2,180,883 | 143,501 | 6.57 | % | 1,766,501 | 138,919 | 7.87 | % | |||||||||||||||
| Interest-bearing deposits in other banks |
91 | — | 0.09 | % | 4,831 | 145 | 2.99 | % | 2,802 | 140 | 5.01 | % | |||||||||||||||
| Federal funds sold |
42,718 | 89 | 0.20 | % | 14,067 | 237 | 1.66 | % | 22,372 | 1,131 | 4.98 | % | |||||||||||||||
| Total interest-earning assets |
$ | 2,668,565 | $ | 150,633 | 5.67 | % | $ | 2,527,973 | $ | 160,468 | 6.35 | % | $ | 2,072,527 | $ | 154,138 | 7.46 | % | |||||||||
| Other assets |
67,737 | 54,611 | 61,415 | ||||||||||||||||||||||||
| Total assets |
$ | 2,736,302 | $ | 2,582,584 | $ | 2,133,942 | |||||||||||||||||||||
| Liabilities & Stockholders’ Equity |
|||||||||||||||||||||||||||
| Interest-bearing deposits |
|||||||||||||||||||||||||||
| NOW accounts |
$ | 228,189 | $ | 2,825 | 1.24 | % | $ | 165,374 | $ | 2,655 | 1.60 | % | $ | 155,047 | $ | 2,499 | 1.61 | % | |||||||||
| Money market accounts |
157,216 | 2,302 | 1.46 | % | 198,429 | 5,389 | 2.71 | % | 224,524 | 8,806 | 3.92 | % | |||||||||||||||
| Savings accounts |
381,042 | 7,764 | 2.04 | % | 175,629 | 5,124 | 2.91 | % | 120,061 | 5,148 | 4.29 | % | |||||||||||||||
| Time deposits |
1,221,328 | 36,707 | 3.01 | % | 1,349,116 | 54,093 | 4.00 | % | 1,054,962 | 52,945 | 5.02 | % | |||||||||||||||
| Total interest-bearing deposits |
$ | 1,987,775 | $ | 49,598 | 2.50 | % | $ | 1,888,548 | $ | 67,261 | 3.55 | % | $ | 1,554,594 | $ | 69,398 | 4.46 | % | |||||||||
| Securities sold under agreement to repurchase and federal funds purchased |
186,106 | 3,475 | 1.87 | % | 223,114 | 5,534 | 2.47 | % | 165,499 | 6,259 | 3.78 | % | |||||||||||||||
| Other borrowed funds |
25,000 | 1,077 | 4.25 | % | 36,202 | 1,235 | 3.36 | % | 6,986 | 225 | 3.18 | % | |||||||||||||||
| Trust preferred capital notes |
65,930 | 5,079 | 7.60 | % | 46,373 | 3,400 | 7.21 | % | 42,614 | 3,099 | 7.17 | % | |||||||||||||||
| Total interest-bearing liabilities |
$ | 2,264,811 | $ | 59,229 | 2.62 | % | $ | 2,194,237 | $ | 77,430 | 3.52 | % | $ | 1,769,693 | $ | 78,981 | 4.46 | % | |||||||||
| Demand deposits and other liabilities |
231,554 | 206,117 | 210,262 | ||||||||||||||||||||||||
| Total liabilities |
$ | 2,496,365 | $ | 2,400,354 | $ | 1,979,955 | |||||||||||||||||||||
| Stockholders’ equity |
239,937 | 182,230 | 153,987 | ||||||||||||||||||||||||
| Total liabilities and stockholders’ equity |
$ | 2,736,302 | $ | 2,582,584 | $ | 2,133,942 | |||||||||||||||||||||
| Interest rate spread |
3.05 | % | 2.83 | % | 3.00 | % | |||||||||||||||||||||
| Net interest income and margin |
$ | 91,404 | 3.45 | % | $ | 83,038 | 3.30 | % | $ | 75,157 | 3.65 | % | |||||||||||||||
| (1) | Yields on securities available-for-sale have been calculated on the basis of historical cost and do not give effect to changes in the fair value of those securities, which are reflected as a component of stockholders’ equity. Average yields on tax-exempt securities are stated on a tax equivalent basis, using a 35% rate. |
8
TABLE 2: RATE-VOLUME VARIANCE ANALYSIS
Interest income and expense are affected by changes in interest rates, by changes in the volumes of earning assets and interest-bearing liabilities, and by changes in the mix of these assets and liabilities. Changes attributable to both volume and rate have been allocated proportionately. The following analysis shows the year-to-year changes in the components of net interest income.
| 2009 compared to 2008 | 2008 compared to 2007 | |||||||||||||||||||||||
| Increase/(Decrease) Due to |
Total Increase/ (Decrease) |
Increase/(Decrease) Due to |
Total Increase/ (Decrease) |
|||||||||||||||||||||
| (Dollars in thousands) |
Volume | Rate | Volume | Rate | ||||||||||||||||||||
| Interest Income |
||||||||||||||||||||||||
| Loans |
$ | 5,425 | $ | (14,378 | ) | $ | (8,953 | ) | $ | 27,628 | $ | (23,046 | ) | $ | 4,582 | |||||||||
| Securities |
566 | (1,190 | ) | (624 | ) | 2,170 | 456 | 2,626 | ||||||||||||||||
| Restricted Stock |
120 | (85 | ) | 35 | 103 | (92 | ) | 11 | ||||||||||||||||
| Interest bearing deposits in other banks |
(4 | ) | (141 | ) | (145 | ) | 61 | (56 | ) | 5 | ||||||||||||||
| Federal funds sold |
58 | (206 | ) | (148 | ) | (137 | ) | (757 | ) | (894 | ) | |||||||||||||
| Total interest income |
$ | 6,165 | $ | (16,000 | ) | $ | (9,835 | ) | $ | 29,825 | $ | (23,495 | ) | $ | 6,330 | |||||||||
| Interest Expense |
||||||||||||||||||||||||
| Interest-bearing deposits: |
||||||||||||||||||||||||
| NOW accounts |
$ | 770 | $ | (600 | ) | $ | 170 | $ | 173 | $ | (17 | ) | $ | 156 | ||||||||||
| Money market accounts |
(618 | ) | (2,469 | ) | (3,087 | ) | (684 | ) | (2,733 | ) | (3,417 | ) | ||||||||||||
| Savings accounts |
4,171 | (1,531 | ) | 2,640 | 1,635 | (1,659 | ) | (24 | ) | |||||||||||||||
| Time deposits |
(4,496 | ) | (12,890 | ) | (17,386 | ) | 11,406 | (10,258 | ) | 1,148 | ||||||||||||||
| Total interest-bearing deposits |
$ | (173 | ) | $ | (17,490 | ) | $ | (17,663 | ) | $ | 12,530 | $ | (14,667 | ) | $ | (2,137 | ) | |||||||
| Securities sold under agreement to repurchase and federal funds purchased |
(706 | ) | (1,353 | ) | (2,059 | ) | 1,446 | (2,171 | ) | (725 | ) | |||||||||||||
| Other borrowed funds |
(486 | ) | 328 | (158 | ) | 997 | 13 | 1,010 | ||||||||||||||||
| Trust preferred capital notes |
1,497 | 182 | 1,679 | 284 | 17 | 301 | ||||||||||||||||||
| Total interest expense |
$ | 132 | $ | (18,333 | ) | $ | (18,201 | ) | $ | 15,257 | $ | (16,808 | ) | $ | (1,551 | ) | ||||||||
| Change in Net Interest Income |
$ | 6,033 | $ | 2,333 | $ | 8,366 | $ | 14,568 | $ | (6,687 | ) | $ | 7,881 | |||||||||||
Asset/Liability Management and Quantitative and Qualitative Disclosures about Market Risk
In the normal course of business, the Company is exposed to market risk, or interest rate risk, as its net income is largely dependent on its net interest income. Market risk is managed by the Company’s Asset/Liability Management Committee that formulates and monitors the performance of the Company based on established levels of market risk as dictated by policy. In setting tolerance levels, or limits on market risk, the Committee considers the impact on earnings and capital, the level and general direction of interest rates, liquidity, local economic conditions and other factors. Interest rate risk, or interest sensitivity, can be defined as the amount of forecasted net interest income that may be gained or lost due to favorable or unfavorable movements in interest rates. Interest rate risk, or sensitivity, arises when the maturity or repricing of interest-earning assets differs from the maturing or repricing of interest-bearing liabilities and as a result of the difference between total interest-earning assets and interest-bearing liabilities. The Company seeks to manage interest rate sensitivity while enhancing net interest income by periodically adjusting this asset/liability position. In order to closely monitor and measure interest sensitivity, the Company uses earnings simulation models on a quarterly basis.
We use a duration gap of equity approach to manage our long term interest rate risk. This approach uses a model which generates estimates of the change in our market value of portfolio equity (“MVPE”) over a range of interest rate scenarios. MVPE is the present value of expected cash flows from assets and liabilities using various assumptions about estimated loan prepayment rates, reinvestment rates and deposit decay rates.
Our short term interest rate sensitivity is managed through the use of a model that generates estimates of the change in the net interest income over a range of interest rate scenarios. Net interest income depends upon the relative amounts of interest-earning assets and interest-bearing liabilities and the interest rates earned or paid on them. The model assumes that the composition of interest sensitive assets and liabilities existing at December 31, 2009, remains constant over a one year period (base case) and also assumes that a particular change in interest rates is reflected uniformly across the yield curve regardless of the duration to maturity or repricing of specific assets and liabilities.
9
The following table provides an analysis of our interest rate risk as measured by the estimated change in MVPE and net interest income from the base case, resulting from instantaneous and sustained parallel shifts in interest rates as of December 31, 2009 (in thousands):
| Sensitivity of Market Value of Portfolio Equity December 31, 2009 |
Sensitivity of Net Interest Income December 31, 2009 |
|||||||||||||||||||||||||
| Market Value of Portfolio Equity | Net Interest Income | Net Interest Margin | ||||||||||||||||||||||||
| Interest Rate Scenario |
Amount | $ Change from Base |
Percent | % of Total Assets |
Amount | $ Change from Base |
Percent | % Change from Base |
||||||||||||||||||
| Up 300 bps |
$ | 165,528 | $ | (66,065 | ) | -28.53 | % | 6.07 | % | $ | 92,622 | $ | (5,796 | ) | 3.48 | % | -5.82 | % | ||||||||
| Up 200 bps |
189,646 | (41,948 | ) | -18.11 | % | 6.96 | % | 94,464 | (3,954 | ) | 3.55 | % | -3.97 | % | ||||||||||||
| Base Case |
231,594 | — | 0.00 | % | 8.50 | % | 98,418 | — | 3.69 | % | 0.00 | % | ||||||||||||||
| Down 100 bps |
236,389 | 4,795 | 2.07 | % | 8.67 | % | 98,051 | (367 | ) | 3.68 | % | -0.39 | % | |||||||||||||
Management believes the modeled results are consistent with the short duration of its balance sheet and given the many variables that affect the actual timing of when assets and liabilities will reprice. Since the earnings model uses numerous assumptions regarding the effect of changes in interest rates on the timing and extent of repricing characteristics, future cash flows and customer behavior, the model cannot precisely estimate net income and the effect on net income from sudden changes in interest rates. Actual results will differ from the simulated results due to the timing, magnitude and frequency of interest rate changes and changes in market conditions and management strategies, among other factors.
Non-Interest Income (Charges)
The Company’s non-interest income sources include service charges and other fees on deposit accounts, fees and net gains from loans originated and sold through its mortgage lending division, commissions from non-deposit investment sales and increases in the cash surrender value of Bank owned life insurance policies. For the year ended December 31, 2009, non-interest income (charges) reflects a loss of $4.4 million compared to $6.4 million of income in 2008 due to $10.0 million in losses on other real estate owned and a $1.8 million impairment loss on securities. Excluding this total of $11.8 million in losses, non-interest income rose $1.0 million with slightly lower deposit account service charges offset by a $1.4 million increase in fees and net gains on mortgage loans originated and sold. The losses on OREO are consistent with management’s commitment to aggressive disposition of these assets, while the impairment loss on securities was due to deferrals and defaults by the underlying issuers of the Bank’s investment in pooled trust preferred securities. In 2008, non-interest income decreased $1.5 million or 18.4%, from $7.9 million in 2007 to $6.4 million, and increased $560 thousand, or 7.6%, from $7.3 million in 2006, to $7.9 million in 2007. Of the total decline in non-interest income in 2008, $1.2 million was due to lower fees and net gains on mortgage loans originated for sale as the level of mortgages originated declined from $158.0 million in 2007, to $80.6 million in 2008. This was due to the Bank holding more of its originations in portfolio rather than selling them, due to a reduction in demand and available loan products in the secondary market. In 2009, the Bank originated $188.7 million in mortgages for sale.
Service charges and other fees, which include monthly deposit account maintenance charges, overdraft fees, ATM fees and charges, debit card interchange income, safe deposit box rents, merchant discount fee income, and lock-box service fees, decreased $296 thousand, or 7.6%, from $3.9 million in 2008, to $3.6 million in 2009, and increased $514 thousand, or 15.2%, from $3.4 million in 2007, to $3.9 million in 2008. In 2007, service charges and other fees were up $162 thousand, or 5.0%, from $3.2 million to $3.4 million. The decline in 2009 was due to lower levels of overdraft fees, while the increase in 2008 was the result of a new debit card rewards program that increased debit card interchange income.
Non-deposit investment services commissions, which the Bank offers through a third party arrangement, were down $102 thousand in 2009, from $702 thousand to $600 thousand, were down $68 thousand in 2008 from $770 thousand in 2007, and were up $149 thousand in 2007 from $621 thousand in 2006. In 2007, non-interest income results also include a gain on the sale of OREO of $638 thousand and a loss of $387 thousand on the sale of securities related to a partial restructuring of the securities portfolio.
10
Non-Interest Expense
Non-interest expense increased $12.1 million, or 27.0%, from $44.8 million in 2008, to $56.9 million in 2009, increased $5.1 million, or 12.8%, from $39.7 million in 2007, to $44.8 million in 2008, and increased $5.4 million, or 15.8%, from $34.3 million in 2006, to $39.7 million in 2007. In 2009, non-interest expense includes a $3.0 million contingent liability provision related to an off-balance sheet letter-of-credit commitment. Excluding that expense item non-interest expense increased $9.1 million, or 20.4%.
In 2009, salaries and benefits were down $322 thousand, or 1.4%, while they accounted for $826 thousand, or 16.2%, of the total increase in non-interest expense in 2008, and $2.6 million, or 48.6%, of increases in non-interest expense in 2007. Commissions and incentive compensation associated with the significant increases in total loans and the hiring of additional loan officers, together with increased compensation and benefits expense associated with additional employees added due to overall growth and branch expansion were the reason for the increase in 2007 while the much lower increase in 2008 and the decline in 2009 were due to lower commissions and incentive compensation due to lower Company earnings.
Occupancy expenses, which include rents, depreciation, maintenance on buildings, leaseholds and equipment, increased $1.4 million, or 15.8%, from $8.9 million in 2008, to $10.3 million in 2009, increased $1.9 million, or 26.0%, from $7.0 million in 2007, to $8.9 million in 2008, and increased $1.6 million, or 29.1%, in 2007. These increases over the three year period were due to the opening of nine new branch locations and expanded office facilities for lending units and other back office support departments. The Bank opened its twenty-eighth branch in January 2010.
Other operating expenses, which include advertising and public relations expenses, legal and professional fees, insurance, OREO expense, telecommunications and supplies, increased $2.3 million, or 31.3%, from $7.4 million in 2008, to $9.7 million in 2009, increased $1.3 million, or 19.7%, from $6.2 million in 2007, to $7.4 million in 2008, and increased $384 thousand, or 6.7%, from $5.7 million in 2006, to $6.1 million in 2007. The increases over the years are generally due to branch expansion and overall growth, with year-over-year increases in advertising and public relations as well as higher legal and professional services expenses associated with the resolution of non-performing loans and $1.2 million in expenses on other real estate owned.
Income Taxes
The Company’s income tax provisions are adjusted for non-deductible expenses and non-taxable interest after applying the U.S. federal income tax rate of 35%. The provision for income taxes totaled $13.2 million and $6.2 million for the years ended December 31, 2007, and 2008, while the Company recorded a carry-back benefit of $18.4 million in 2009. The effects of non-deductible expenses and non-taxable interest on the Company’s income tax provisions are minimal. For further information regarding the provisions for income taxes see Note 8 to the Consolidated Financial Statements.
Asset Quality - Provision and Allowance For Loan Losses
For the year ended December 31, 2009, provisions for loan losses were $81.9 million compared to $25.4 million in 2008, with total net charge-offs in 2009 of $53.2 million versus $11.2 million for the year ended December 31, 2008. In 2007, provisions totaled $4.3 million with net charge-offs of $181 thousand. As a result of these provisions, the total allowance for loan losses increased $28.7 million, or 78.6%, from $36.5 million at December 31, 2008, to $65.2 million at December 31, 2009, increased from $22.3 million at December 31, 2007, to $36.5 million at December 31, 2008, increased $14.2 million, or 63.9%, in 2008, and increased $4.2 million, or 23.0%, in 2007.
The increase in the total allowance in 2007 was consistent with an 18.1% increase in loans as net-charge offs were minimal and the level of non-performing assets and loans 90 + days past due were very low. In 2008, while some of the increase in the allowance was associated with overall loan growth, the most significant factor was a $120.5 million increase in non-performing assets and loans 90 + days past due from $4.4 million at December 31, 2007, to $124.9 million at December 31, 2008. While non-performing assets and loans 90+ days past due declined in 2009, to $98.1 million, the allowance increased as other identified potential problem loans, which are classified as impaired loans, although well-secured and currently performing, but in some instances requiring higher reserve levels, rose from $49.3 million at December 31, 2008, to $171.8 million at December 31, 2009. As a percent of total loans, the allowance has increased from 1.58% as of December 31, 2008, to 2.86% as of December 31, 2009, and as a percent of non-performing loans it has increased from 31.1% as of December 31, 2008, to 93.6% at December 31, 2009. See “Risk Elements and Non-Performing Assets” later in this discussion for more information on non-performing assets and loans 90 + days past due and other impaired loans.
11
Management feels that the allowance for loan losses is adequate at December 31, 2009. However, there can be no assurance that additional provisions for loan losses will not be required in the future, including as a result of possible changes in the economic assumptions underlying management’s estimates and judgments, adverse developments in the economy, and the residential real estate market in particular, on a national basis or in the Company’s market area, or changes in the circumstances of particular borrowers.
The Company generates a quarterly analysis of the allowance for loan losses, with the objective of quantifying portfolio risk into a dollar figure of inherent losses, thereby translating the subjective risk value into an objective number. Emphasis is placed on semi-annual independent external loan reviews and monthly internal reviews. The determination of the allowance for loan losses is based on applying and summing the results of eight qualitative factors and a historical loss factor to each category of loans along with any specific allowance for impaired and adversely classified loans within the particular category. Each factor is assigned a percentage weight and that total weight is applied to each loan category. The resulting sum from each loan category is then combined to arrive at a total allowance for all categories. Factors are different for each loan category. Qualitative factors include: levels and trends in delinquencies and non-accruals, trends in volumes and terms of loans, effects of any changes in lending policies, the experience, ability and depth of management, national and local economic trends and conditions, concentrations of credit, quality of the Company’s loan review system, and regulatory requirements. The total allowance required thus changes as the percentage weight assigned to each factor is increased or decreased due to its particular circumstance, as historical loss factors are updated, as the various types and categories of loans change as a percentage of total loans and as specific allowances are required on impaired loans and charge-offs occur. The decision to specifically reserve for or to charge-off or partially charge-off an impaired loan balance is based upon an evaluation of that loan’s potential to improve, based upon near term change in financial or market conditions, which would enable collection of the portion of the loan determined to be impaired. If these conditions are determined to be favorable, a specific reserve would be established as opposed to a charge-off. For further information regarding the allowance for loan losses see Notes 1 and 4 to the Consolidated Financial Statements.
TABLE 3: PROVISION AND ALLOWANCE FOR LOAN LOSSES
| (Dollars in thousands) |
2009 | 2008 | 2007 | 2006 | 2005 | |||||||||||||||
| Allowance, beginning of period |
$ | 36,475 | $ | 22,260 | $ | 18,101 | $ | 13,821 | $ | 10,402 | ||||||||||
| Charge-Offs |
||||||||||||||||||||
| Real estate loans |
$ | 37,879 | $ | 7,493 | $ | — | $ | — | $ | — | ||||||||||
| Commercial loans |
16,317 | 3,436 | — | 112 | 341 | |||||||||||||||
| Consumer loans |
417 | 392 | 212 | 77 | 21 | |||||||||||||||
| Total charge-offs |
$ | 54,613 | $ | 11,321 | $ | 212 | $ | 189 | $ | 362 | ||||||||||
| Recoveries |
||||||||||||||||||||
| Real estate loans |
$ | 571 | $ | 77 | $ | — | $ | — | $ | — | ||||||||||
| Commercial loans |
739 | 16 | — | — | — | |||||||||||||||
| Consumer loans |
67 | 65 | 31 | 63 | 9 | |||||||||||||||
| Total recoveries |
$ | 1,377 | $ | 158 | $ | 31 | $ | 63 | $ | 9 | ||||||||||
| Net charge-offs |
$ | 53,236 | $ | 11,163 | $ | 181 | $ | 126 | $ | 353 | ||||||||||
| Provision for loan losses |
81,913 | 25,378 | 4,340 | 4,406 | 3,772 | |||||||||||||||
| Allowance, end of period |
$ | 65,152 | $ | 36,475 | $ | 22,260 | $ | 18,101 | $ | 13,821 | ||||||||||
| Ratio of net charges-offs to average total loans outstanding during period |
2.34 | % | 0.51 | % | 0.01 | % | 0.01 | % | 0.03 | % | ||||||||||
12
TABLE 4: ALLOCATION OF ALLOWANCE FOR LOAN LOSSES
The allowance for loan losses includes specific allowances for impaired loans and a general allowance applicable to all loan categories; however, management has allocated the allowance to provide an indication of the relative risk characteristics of the loan portfolio. The allocation is an estimate and should not be interpreted as an indication that charge-offs will occur in these amounts, or that the allocation indicates future trends. The allocation of the allowance at December 31 for the years indicated and the ratio of related outstanding loan balances to total loans are as follows:
| (Dollars in thousands) |
2009 | 2008 | 2007 | 2006 | 2005 | |||||||||||||||
| Allocation of allowance for loan losses: |
||||||||||||||||||||
| Real estate – mortgage |
$ | 26,514 | $ | 9,375 | $ | 9,226 | $ | 8,654 | $ | 7,298 | ||||||||||
| Real estate – construction |
26,957 | 18,485 | 6,612 | 4,939 | 3,599 | |||||||||||||||
| Commercial |
11,241 | 8,489 | 6,304 | 4,449 | 2,865 | |||||||||||||||
| Consumer |
440 | 126 | 118 | 59 | 59 | |||||||||||||||
| Balance, December 31, |
$ | 65,152 | $ | 36,475 | $ | 22,260 | $ | 18,101 | $ | 13,821 | ||||||||||
| Ratio of loans to total year-end loans: |
||||||||||||||||||||
| Real estate – mortgage |
70 | % | 62 | % | 59 | % | 57 | % | 60 | % | ||||||||||
| Real estate – construction |
19 | % | 25 | % | 28 | % | 31 | % | 30 | % | ||||||||||
| Commercial |
10 | % | 12 | % | 12 | % | 11 | % | 9 | % | ||||||||||
| Consumer |
1 | % | 1 | % | 1 | % | 1 | % | 1 | % | ||||||||||
| 100 | % | 100 | % | 100 | % | 100 | % | 100 | % | |||||||||||
See Notes 1 and 4 to the Consolidated Financial Statements for additional information regarding the provision and allowance for loan losses.
Risk Elements and Non-Performing Assets
Non-performing assets consist of non-accrual loans and other real estate owned (foreclosed properties). For the year ended December 31, 2009, the total non-performing assets and loans 90+ days past due and still accruing interest decreased by $26.8 million, or 21.4%, from $124.9 million at December 31, 2008, to $98.1 million at December 31, 2009, and increased $120.5 million from $4.4 million at year-end 2007, to $124.9 million at year-end 2008. As a result, the ratio of non-performing assets and loans 90+ days past due and still accruing to total assets decreased from 4.60% at December 31, 2008, to 3.60% at December 31, 2009. In addition, other impaired loans, which include loans well-secured and currently performing, but in some instances requiring higher reserve levels, and troubled debt restructurings, performing in accordance with their modified terms, increased from $49.3 million at December 31, 2008, to $171.8 million at December 31, 2009. Troubled debt restructuring represented $71.9 million of total impaired loans as of December 31, 2009. There were no trouble debt restructurings as of December 31, 2008.
Loans are placed in non-accrual status when in the opinion of management the collection of additional interest is unlikely or a specific loan meets the criteria for non-accrual status established by regulatory authorities. No interest is taken into income on non-accrual loans. A loan remains on non-accrual status until the loan is current as to both principal and interest or the borrower demonstrates the ability to pay and remain current, or both. Troubled debt restructurings continue to be individually tested for impairment for a period of one year from their modification date.
13
TABLE 5: NON-PERFORMING ASSETS
| December 31, | ||||||||||||||||||||
| (Dollars in thousands) |
2009 | 2008 | 2007 | 2006 | 2005 | |||||||||||||||
| Non-accrual loans |
$ | 65,809 | $ | 111,234 | $ | 3,826 | $ | 3,920 | $ | 1,994 | ||||||||||
| Other real estate owned |
28,499 | 7,569 | — | — | — | |||||||||||||||
| Total non-performing assets |
$ | 94,308 | $ | 118,803 | $ | 3,826 | $ | 3,920 | $ | 1,994 | ||||||||||
| Loans past due 90 days and still accruing |
3,826 | 6,118 | 579 | — | 7 | |||||||||||||||
| Total non-performing assets and past due loans |
$ | 98,134 | $ | 124,921 | $ | 4,405 | $ | 3,920 | $ | 2,001 | ||||||||||
| Allowance for loan losses to total loans |
2.86 | % | 1.58 | % | 1.14 | % | 1.10 | % | 1.07 | % | ||||||||||
| Allowance for loan losses to non-performing loans |
93.56 | % | 31.08 | % | 505.33 | % | 461.76 | % | 693.1 | % | ||||||||||
| Non-performing assets and past due loans to total loans |
4.31 | % | 5.40 | % | 0.23 | % | 0.24 | % | 0.15 | % | ||||||||||
| Non-performing assets and past due loans to total assets |
3.60 | % | 4.60 | % | 0.19 | % | 0.20 | % | 0.13 | % | ||||||||||
Non-performing loans continue to be concentrated in residential and commercial construction and land development loans in outer sub-markets hardest hit by the residential downturn and commercial and consumer credits experiencing the after shocks in sub-contracting businesses and workforce employment. Overall, as of December 31, 2009, $37.5 million, or 53.9%, of non-performing loans represented acquisition, development and construction loans, $15.1 million, or 21.7%, represented non-farm, non-residential loans, $10.7 million, or 15.4%, represented commercial and industrial loans and $6.2 million, or 8.9%, represented loans on one-to-four family residential properties. The Company would have recorded additional gross interest income of approximately $5.2 million for 2009, $3.8 million for 2008 and $305 thousand for 2007, if non-accrual loans had been current throughout these periods. Interest actually received on non-accrual loans was $979 thousand in 2009, $174 thousand in 2008 and $134 thousand in 2007. See Notes 1 and 4 to the Consolidated Financial Statements for additional information regarding the Company’s non-performing assets. Tables 6 and 7 provide a breakdown of the construction loan portfolio by location including loans on non-accrual status and percentage of net-charge offs in 2009. Table 8 provides a breakdown of the non-farm/non-residential portfolio by location including loans on non-accrual status and percentage of net charge-offs in 2009.
TABLE 6: RESIDENTIAL, ACQUISITION, DEVELOPMENT AND CONSTRUCTION LOANS
| As of December 31, 2009 | |||||||||||||||
| (Dollars in thousands) County/Jurisdiction of Origination: |
Total Outstandings |
Percentage of Total |
Non-accrual Loans |
Non-accruals as a % of Outstandings |
Net charge-offs as a % of Outstandings |
||||||||||
| District of Columbia |
$ | 16,480 | 6.9 | % | $ | — | — | -0.1 | % | ||||||
| Montgomery, MD |
9,621 | 4.0 | % | 2,972 | 1.2 | % | 0.9 | % | |||||||
| Prince Georges, MD |
23,437 | 9.8 | % | 1,000 | 0.4 | % | 2.2 | % | |||||||
| Other Counties in MD |
4,834 | 2.0 | % | — | — | 0.5 | % | ||||||||
| Arlington/Alexandria, VA |
47,756 | 19.9 | % | 4,159 | 1.7 | % | — | ||||||||
| Fairfax, VA |
56,679 | 23.6 | % | 7,524 | 3.1 | % | 1.3 | % | |||||||
| Culpeper/Fauquier, VA |
1,022 | 0.4 | % | 200 | 0.1 | % | 0.1 | % | |||||||
| Frederick, VA |
12,631 | 0.0 | % | 6,250 | 2.6 | % | 0.9 | % | |||||||
| Henrico, VA |
— | 0.0 | % | — | — | 0.1 | % | ||||||||
| Loudoun, VA |
28,551 | 11.9 | % | 770 | 0.3 | % | 0.3 | % | |||||||
| Prince William, VA |
11,659 | 4.9 | % | 2,854 | 1.2 | % | 0.9 | % | |||||||
| Spotsylvania, VA |
871 | 0.4 | % | — | — | — | |||||||||
| Stafford, VA |
22,514 | 9.4 | % | 4,898 | 2.0 | % | — | ||||||||
| Other Counties in VA |
3,851 | 6.9 | % | — | — | 0.3 | % | ||||||||
| Outside VA, MD & DC |
110 | 0.0 | % | — | — | 0.4 | % | ||||||||
| Totals |
$ | 240,016 | 100.0 | % | $ | 30,627 | 12.8 | % | 7.8 | % | |||||
14
TABLE 7: COMMERCIAL, ACQUISITION, DEVELOPMENT AND CONSTRUCTION LOANS
| As of December 31, 2009 | |||||||||||||||
| (Dollars in thousands) County/Jurisdiction of Origination: |
Total Outstandings |
Percentage of Total |
Non-accrual Loans |
Non-accruals as a % of Outstandings |
Net charge-offs as a % of Outstandings |
||||||||||
| District of Columbia |
$ | 14,709 | 7.8 | % | $ | — | — | — | |||||||
| Montgomery, MD |
1,407 | 0.7 | % | — | — | — | |||||||||
| Prince Georges, MD |
11,215 | 6.0 | % | — | — | — | |||||||||
| Other Counties in MD |
7,749 | 4.1 | % | — | — | — | |||||||||
| Arlington/Alexandria, VA |
9,312 | 4.9 | % | — | — | — | |||||||||
| Fairfax, VA |
18,060 | 9.6 | % | — | — | 5.8 | % | ||||||||
| Henrico, VA |
816 | 0.4 | % | — | — | — | |||||||||
| Loudoun, VA |
32,528 | 17.3 | % | 4,797 | 2.5 | % | 1.3 | % | |||||||
| Prince William, VA |
51,399 | 27.3 | % | 2,114 | 1.1 | % | 0.1 | % | |||||||
| Spotsylvania, VA |
2,679 | 1.4 | % | — | — | — | |||||||||
| Stafford, VA |
29,005 | 15.4 | % | — | — | — | |||||||||
| Other Counties in VA |
6,997 | 3.7 | % | — | — | — | |||||||||
| Outside VA, MD & DC |
2,400 | 1.3 | % | — | — | — | |||||||||
| Totals |
$ | 188,276 | 100.0 | % | $ | 6,911 | 3.6 | % | 7.2 | % | |||||
TABLE 8: NON-FARM/NON-RESIDENTIAL LOANS
| As of December 31, 2009 | |||||||||||||||
| (Dollars in thousands) County/Jurisdiction of Origination: |
Total Outstandings |
Percentage of Total |
Non-accrual Loans |
Non-accruals as a % of Outstandings |
Net charge-offs as a % of Outstandings |
||||||||||
| District of Columbia |
$ | 73,355 | 6.5 | % | $ | — | — | — | |||||||
| Montgomery, MD |
33,637 | 3.0 | % | — | — | — | |||||||||
| Prince Georges, MD |
60,130 | 5.3 | % | 1,156 | 0.1 | % | — | ||||||||
| Other Counties in MD |
48,411 | 4.3 | % | — | — | — | |||||||||
| Arlington/Alexandria, VA |
180,193 | 16.0 | % | 4,065 | 0.4 | % | 0.02 | % | |||||||
| Fairfax, VA |
277,116 | 24.6 | % | 1,242 | 0.1 | % | — | ||||||||
| Culpeper/Fauquier, VA |
1,289 | 0.1 | % | — | — | — | |||||||||
| Henrico, VA |
31,317 | 2.8 | % | 1,875 | 0.2 | % | — | ||||||||
| Loudoun, VA |
111,076 | 9.9 | % | 1,122 | 0.1 | % | 0.04 | % | |||||||
| Prince William, VA |
185,269 | 16.5 | % | 1,622 | 0.1 | % | 0.10 | % | |||||||
| Spotsylvania, VA |
20,305 | 1.8 | % | — | — | — | |||||||||
| Stafford, VA |
22,176 | 2.0 | % | — | — | — | |||||||||
| Other Counties in VA |
71,421 | 6.3 | % | 4,024 | 0.4 | % | — | ||||||||
| Outside VA, MD & DC |
10,250 | 0.9 | % | — | — | — | |||||||||
| Totals |
$ | 1,125,945 | 100.0 | % | $ | 15,106 | 1.3 | % | 0.16 | % | |||||
Foreclosed real properties include properties that have been substantively repossessed or acquired in complete or partial satisfaction of debt. Such properties, which are held for resale, are carried at the lower of book value or fair value, including a reduction for the estimated selling expenses, or principal balance of the related loan. Reviews and discussions with regard to value and disposition of each foreclosed property are conducted monthly by the Company’s Special Assets Committee. The carrying value of a foreclosed asset is immediately adjusted down when new information is obtained, including a potentially acceptable offer, the sale of a similar property in the vicinity of one of the Company’s assets, and/or a change in the price the property is being listed for. In 2007, the Company foreclosed on a $1.8 million non-performing loan and subsequently sold the collateral property for a pre-tax gain of $638 thousand. In 2009, the Company recorded $10.0 million in losses on foreclosed real properties. The following tables provide a breakdown of foreclosed real properties by type and a roll-forward of activity for the years ended December 31, 2008 and 2009:
TABLE 9: OTHER REAL ESTATE OWNED BY TYPE
| Year-end December 31, | ||||||
| (Dollars in thousands) |
2009 | 2008 | ||||
| Residential Land |
$ | 15, 081 | $ | 7,569 | ||
| Residential Building |
2,649 | — | ||||
| Commercial Land |
1,430 | — | ||||
| Commercial Building |
9,339 | — | ||||
| Total other real estate owned |
$ | 28,499 | $ | 7,569 | ||
15
TABLE 10: OTHER REAL ESTATE OWNED ACTIVITY
| Year-ended December 31, |
||||||||
| (Dollars in thousands) |
2009 | 2008 | ||||||
| Beginning Balance |
$ | 7,569 | $ | 0 | ||||
| Additions |
40,229 | 7,499 | ||||||
| Capital improvements |
372 | 395 | ||||||
| Valuation adjustments |
(9,067 | ) | — | |||||
| Dispositions |
(9,719 | ) | (331 | ) | ||||
| (Loss) gain on disposition |
(885 | ) | — | |||||
| Ending Balance |
$ | 28,499 | $ | 7,569 | ||||
Loan Portfolio
The Bank’s lending activities are its principal source of income. Real estate loans, including residential permanents and construction, and commercial permanents, represent the major portion of the Bank’s loan portfolio. Loans, net of unearned income and the allowance for loan losses, decreased $63.0 million, or 2.8%, from $2.27 billion at December 31, 2008, to $2.21 billion at December 31, 2009, as non-farm, non-residential real estate loans increased $114.6 million, or 11.3%, and one-to-four family residential loans increased $49.5 million, or 13.9%, while real estate construction loans fell by $156.8 million, or 26.8%, and commercial and industrial loans were down 14.7%. In 2008, net loans increased $348.3 million, or 18.1%, from $1.92 billion at December 31, 2007, to $2.27 billion at year-end 2008, and included an increase in real estate mortgage loans of $276.4 million, or 23.9%, an increase in commercial loans of $40.8 million, or 17.1%, and an increase in real estate construction loans of $40.8 million, or 7.5%. At December 31, 2009, $224.9 million of total real estate construction loans were to commercial builders of single-family housing, $15.2 million were to individuals on single-family properties and $188.3 million were related to commercial properties. At December 31, 2008, $296.3 million of real estate construction loans were to commercial builders of single-family housing, $20.7 million were to individuals on single-family properties and $268.1 million were related to commercial properties. The Bank expects that its real estate construction loan portfolio will continue to decline as that lending focus is significantly curtailed.
As noted above, the majority of the Bank’s loan portfolio consists of construction and commercial real estate loans. At December 31, 2009, the Bank had $224.9 million of construction loans to commercial builders of single family housing in the Northern Virginia market, representing 9.9% of total loans. These loans are made to a number of unrelated entities and generally have a term of twelve to eighteen months. Adverse developments in the Northern Virginia real estate market and economy have adversely impacted this portfolio of loans and the Company’s income and financial position. In addition, the Bank had $1.12 billion, or 49.4% of the loan portfolio at December 31, 2009, secured by non-farm non-residential properties with $452.8 million of these loans representing owner-occupied properties. These non-farm non-residential loans represent obligations of a diversified pool of borrowers across numerous businesses and industries in the Northern Virginia market and include some loans that, although secured by commercial real estate, are commercial purpose loans made based on the financial condition of the underlying business. At December 31, 2009, the Company had no other concentrations of loans in any one industry exceeding 10% of its total loan portfolio. An industry for this purpose is defined as a group of counterparties that are engaged in similar activities and have similar economic characteristics that would cause their ability to meet contractual obligations to be similarly affected by changes in economic or other conditions. For further information regarding concentrations of loans see Note 17 to the Consolidated Financial Statements.
16
Under guidance from the federal banking regulators, banks which have concentrations in construction, land development or commercial real estate loans would be expected to maintain higher levels of risk management and, potentially, higher levels of capital. It is possible that we may be required to maintain higher levels of capital than we would otherwise be expected to maintain as a result of our levels of construction, development and commercial real estate loans, which may require us to obtain additional capital. The Bank seeks to manage its concentrations of loans through the establishment of limits on the level of its various loan types to total loans and to total capital. Excluded from the scope of this guidance are loans secured by non-farm nonresidential properties where the primary source of repayment is the cash flow from the ongoing operations and activities conducted by the party, or affiliate of the party, who owns the property
Tables 11 and 12 present information pertaining to the composition of the loan portfolio including unearned income, the allowance for loan losses, and the maturity and repricing characteristics of selected loans.
TABLE 11: SUMMARY OF TOTAL LOANS
| December 31, | |||||||||||||||
| (Dollars in thousands) |
2009 | 2008 | 2007 | 2006 | 2005 | ||||||||||
| Real estate - mortgage |
$ | 1,599,478 | $ | 1,435,189 | $ | 1,158,820 | $ | 940,270 | $ | 778,788 | |||||
| Real estate - construction |
428,292 | 585,076 | 544,290 | 515,040 | 380,997 | ||||||||||
| Commercial |
238,327 | 279,470 | 238,670 | 190,527 | 122,243 | ||||||||||
| Consumer |
10,368 | 11,698 | 8,714 | 6,997 | 7,386 | ||||||||||
| Farmland |
2,675 | 2,498 | 1,468 | — | — | ||||||||||
| Total loans |
$ | 2,279,140 | $ | 2,313,931 | $ | 1,951,962 | $ | 1,652,834 | $ | 1,289,414 | |||||
| Less unearned income |
3,924 | 4,370 | 4,961 | 4,906 | 5,338 | ||||||||||
| Less allowance for loan losses |
65,152 | 36,475 | 22,260 | 18,101 | 13,821 | ||||||||||
| Loans, net |
$ | 2,210,064 | $ | 2,273,086 | $ | 1,924,741 | $ | 1,629,827 | $ | 1,270,255 | |||||
TABLE 12: MATURITY/REPRICING SCHEDULE OF TOTAL LOANS
| At December 31, 2009 (Dollars in thousands) |
Real estate- mortgage |
Real estate- construction |
Commercial | Consumer | Farmland | Total | ||||||||||||
| Variable: |
||||||||||||||||||
| Within 1 year |
$ | 207,857 | $ | 79,995 | $ | 12,671 | $ | 3,388 | $ | 2,499 | $ | 306,410 | ||||||
| 1-to-5 years |
418,160 | 12,895 | 3,206 | — | — | 434,261 | ||||||||||||
| After 5 years |
38,873 | 3,081 | 966 | — | — | 42,920 | ||||||||||||
| Total |
$ | 664,890 | $ | 95,971 | $ | 16,843 | $ | 3,388 | $ | 2,499 | $ | 783,591 | ||||||
| Fixed Rate: |
||||||||||||||||||
| Within 1 year |
$ | 93,556 | $ | 200,016 | $ | 98,375 | 4,286 | $ | — | $ | 396,233 | |||||||
| 1-to-5 years |
374,718 | 124,023 | 87,563 | 1,783 | 176 | 588,263 | ||||||||||||
| After 5 years |
466,314 | 8,282 | 35,546 | 911 | — | 511,053 | ||||||||||||
| Total |
$ | 934,588 | $ | 332,321 | $ | 221,484 | $ | 6,980 | $ | 176 | $ | 1,495,549 | ||||||
| Total Loans |
$ | 1,599,478 | $ | 428,292 | $ | 238,327 | $ | 10,368 | $ | 2,675 | $ | 2,279,140 | ||||||
Investment Securities
The securities portfolio serves as a primary source of liquidity, is used as needed to meet certain collateral requirements, helps in the management of interest rate risk, and provides additional interest income. The securities portfolio consists of two components, securities held-to-maturity and securities available-for-sale. Securities are classified as held-to-maturity based on management’s intent and the Company’s ability, at the time of purchase, to hold such securities to maturity. These securities are carried at amortized cost. Securities which may be sold in response to changes in market interest rates, changes in the securities’ prepayment risk, increased loan demand, general liquidity needs, and other similar factors are classified as available-for-sale and are carried at estimated fair value.
17
Total securities increased $22.9 million, or 7.0%, from $325.7 million at December 31, 2008, to $348.6 million at December 31, 2009, and increased $5.6 million, or 1.7%, from $320.1 million at December 31, 2007, to $325.7 million at December 31, 2008. Increases in both years were concentrated in obligations of states and political subdivisions as the level of U.S. Government Agencies declined. However, securities of U.S. Government Agencies still represent the majority of the portfolio. The portfolio also contains four pooled trust preferred securities with an amortized cost basis of $7.2 million and a book value of $2.0 million. The Bank performs a quarterly analysis of these securities for other than temporary impairment due to significantly depressed current market value indications. The analysis includes stress tests on the underlying collateral and cash flow estimates based on the current and projected future levels of deferrals and defaults within each pool. In 2009, the Bank recorded an impairment loss of an aggregate of $1.8 million on three of the four pools. Table 13 provides information regarding the composition of the securities portfolio and Table 14 details the maturities and weighted average yields (on a tax equivalent basis) at the dates indicated. U.S. Government Agency obligations include senior debt issuances, mortgage-backed pass-through securities and collateralized mortgage obligations issued by the Federal Home Loan Banks, Federal Home Loan Mortgage Corporation, and Federal National Mortgage Association. See Note 2 to the Consolidated Financial Statements for additional information regarding the securities portfolio.
TABLE 13: SECURITIES PORTFOLIO
| December 31, | ||||||||||||||||||
| 2009 | 2008 | 2007 | ||||||||||||||||
| (Dollars in thousands) |
Book Value | Percent of total |
Book Value | Percent of total |
Book Value | Percent of total |
||||||||||||
| Available-for-sale: |
||||||||||||||||||
| U.S. Government Agency obligations |
$ | 247,134 | 70.90 | % | $ | 235,434 | 72.28 | % | $ | 242,965 | 75.90 | % | ||||||
| Obligations of states/political subdivisions |
42,357 | 12.15 | % | 29,454 | 9.04 | % | 23,001 | 7.19 | % | |||||||||
| Pooled trust preferred securities |
2,030 | 0.58 | % | 3,948 | 1.21 | % | 8,544 | 2.67 | % | |||||||||
| $ | 291,521 | 83.63 | % | $ | 268,836 | 82.53 | % | $ | 274,510 | 85.76 | % | |||||||
| Held-to-maturity: |
||||||||||||||||||
| U.S. Government Agency obligations |
$ | 12,323 | 3.53 | % | $ | 18,764 | 5.76 | % | $ | 33,725 | 10.53 | % | ||||||
| Obligations of states/political subdivisions |
44,741 | 12.84 | % | 38,143 | 11.71 | % | 11,874 | 3.71 | % | |||||||||
| $ | 57,064 | 16.37 | % | $ | 56,907 | 17.47 | % | $ | 45,599 | 14.24 | % | |||||||
| $ | 348,585 | 100.00 | % | $ | 325,743 | 100.00 | % | $ | 320,109 | 100.00 | % | |||||||
| TABLE 14: MATURITY OF SECURITIES | ||||||||||||||||||
| 2009 | 2008 | 2007 | ||||||||||||||||
| At December 31, (Dollars in thousands) |
Book Value | Weighted Average Yield |
Book Value | Weighted Average Yield |
Book Value | Weighted Average Yield |
||||||||||||
| Maturing within one year |
$ | 4,541 | 4.57 | % | $ | 1,869 | 4.11 | % | $ | 8,269 | 5.02 | % | ||||||
| Maturing after one through five years |
28,013 | 4.19 | % | 73,457 | 4.78 | % | 165,110 | 5.26 | % | |||||||||
| Maturing after five through ten years |
110,745 | 4.16 | % | 65,058 | 5.06 | % | 49,555 | 5.19 | % | |||||||||
| Maturing after ten years |
205,286 | 5.07 | % | 185,359 | 5.39 | % | 97,175 | 5.67 | % | |||||||||
| $ | 348,585 | 4.71 | % | $ | 325,743 | 5.18 | % | $ | 320,109 | 5.37 | % | |||||||
Deposits
The Company’s principal source of funds is deposit accounts comprised of demand deposits, savings and money market accounts, and time deposits. The majority of the Bank’s deposits are attracted from individuals and businesses in the Northern Virginia and the metropolitan Washington D.C. area, and the interest rates the Bank pays are generally near the top of the local market.
18
Total deposits increased $57.2 million, or 2.6%, from $2.17 billion at December 31, 2008, to $2.23 billion at December 31, 2009, and increased $303.0 million, or 16.2%, from $1.87 billion at December 31, 2007, to $2.17 billion at December 31, 2008. In 2009, growth by deposit category included an increase in demand deposits of $44.8 million, or 23.0%, an increase in savings and interest-bearing demand deposits of $467.1 million, or 90.2%, and a decrease of $454.7 million, or 31.2%, in time deposits. The increases in savings and interest-bearing demand deposits were due primarily to success with the Company’s MEGA Savings and MEGA Checking accounts. The declines in time deposits are reflective of lower loan volume, requiring lower levels of funding, and a strategy to reduce the Bank’s historically heavy reliance on certificates of deposit as a funding source with deposit gathering efforts and cross-selling activities focused on demand deposits, savings and interest-bearing demand accounts.
In 2008, growth included an 8.9% decrease in demand deposits, only a slight change in savings and interest-bearing demand deposits and a $321.1 million, or 28.2% increase in time deposits. Time deposit growth was concentrated in CDARS, Certificate of Deposit Account Registry Service, as depositors sought to maximize FDIC insurance coverage. CDARS allows depositors to access up to $50 million in FDIC insurance coverage. Through the program, a customer’s deposit is divided into sub-$100,000 increments and placed at other banks that participate in the program. Those participating banks, in turn, place deposits in the same amount at the Bank. Growth was concentrated in time deposits due to very strong local competition, very high short-term interest rates for a significant part of the year and the aforementioned flight to safety of FDIC insurance coverage in our CDARS program.
Table 15 details maturities of time deposits with balances of $100,000 or more, which represent 29.7% of total time deposits as of December 31, 2009, compared to 37.5% at December 31, 2008. Total time deposits represent 45.1% of total deposits as of December 31, 2009, compared to 67.2% at December 31, 2008. Brokered time deposits represented $50.1 million, or 2.3%, of total deposits at December 31, 2009, and $168.3 million, or 7.6%, of total deposits as of December 31, 2008. See Note 6 to the Consolidated Financial Statements and Table 1 to this Management’s Discussion and Analysis for additional information regarding the maturities of time deposits and average rates paid on all interest-bearing deposits.
TABLE 15: MATURITIES OF TIME DEPOSITS WITH BALANCES OF $100,000 OR MORE
| December 31, | |||||||||
| (Dollars in thousands) |
2009 | 2008 | 2007 | ||||||
| 3 months or less |
$ | 88,680 | $ | 215,378 | $ | 209,165 | |||
| 3-6 months |
65,809 | 108,592 | 243,880 | ||||||
| 6-12 months |
77,956 | 132,668 | 99,465 | ||||||
| Over 12 months |
66,122 | 91,058 | 19,975 | ||||||
| Total |
$ | 298,567 | $ | 547,696 | $ | 572,485 | |||
Short-Term Borrowings
Short-term borrowings consist of securities sold under agreements to repurchase, of which, as of December 31, 2009, $101.7 million are secured transactions with customers that mature the business day following the date sold, and the other $75 million are secured transactions with other banks. The secured transactions with customers are provided to significant commercial demand deposit customers and are considered a core funding source of the Bank. Short-term borrowings also include Federal funds purchased, which are unsecured overnight borrowings from other banks and are generally used to accommodate short-term liquidity needs. Table 16 provides information on the balances and interest rates on short-term borrowings for the years ended December 31, 2009, 2008 and 2007 (dollars in thousands):
TABLE 16: SHORT-TERM BORROWINGS
| At December 31, |
2009 | 2008 | 2007 | |||||||||
| Securities sold under agreement to repurchase |
$ | 176,728 | $ | 175,959 | $ | 200,534 | ||||||
| Federal funds purchased |
— | 12,000 | 22,000 | |||||||||
| Total |
$ | 176,728 | $ | 187,959 | $ | 222,534 | ||||||
| Weighted interest rate at year end |
2.24 | % | 1.58 | % | 3.36 | % | ||||||
| Averages for the year ended December 31, |
||||||||||||
| Outstanding |
$ | 186,106 | $ | 223,114 | $ | 165,499 | ||||||
| Interest rate |
1.87 | % | 2.47 | % | 3.78 | % | ||||||
| Maximum month-end outstanding |
$ | 198,774 | $ | 187,959 | $ | 222,534 | ||||||
19
Liquidity
The Company’s principal source of liquidity and funding is its deposit base. The level of deposits necessary to support the Company’s lending and investment activities is determined through monitoring loan demand. Considerations in managing the Company’s liquidity position include, but are not limited to, scheduled cash flows from existing loans and investment securities, anticipated deposit activity including the maturity of time deposits, and projected needs from anticipated extensions of credit. The Company’s liquidity position is monitored daily by management to maintain a level of liquidity that can efficiently meet current needs and is evaluated for both current and longer term needs as part of the asset/liability management process.
The Company measures total liquidity through cash and cash equivalents, securities available-for-sale, mortgage loans held-for-sale, other loans and investment securities maturing within one year, less securities pledged as collateral for repurchase agreements, public deposits and other purposes, and less any outstanding Federal funds purchased. These liquidity sources decreased $22.5 million, or 3.5%, from $637.7 million at December 31, 2008, to $615.2 million at December 31, 2009, and increased $60.2 million, or 10.4%, from $577.5 million at December 31, 2007, to $637.7 million at December 31, 2008. Additional sources of liquidity available to the Bank include the capacity to borrow funds through established short-term lines of credit with various correspondent banks and the Federal Home Loan Bank of Atlanta. See Note 14 to the Consolidated Financial Statements for further information regarding these additional liquidity sources.
Capital
The assessment of capital adequacy depends on a number of factors such as asset quality, liquidity, earnings performance, changing competitive conditions and economic forces, and the overall level of growth. The adequacy of the Company’s current and future capital is monitored by management on an ongoing basis. Management seeks to maintain a capital structure that will assure an adequate level of capital to support anticipated asset growth and to absorb potential losses.
Both the Company’s and the Bank’s capital levels continue to meet regulatory requirements. The primary indicators relied on by bank regulators in measuring the capital position are the Tier 1 risk-based capital, total risk-based capital, and leverage ratios. Tier 1 capital consists of common and qualifying preferred stockholders’ equity, less goodwill, and for the Company includes certain minority interests relating to bank subsidiary issued shares, and a limited amount of restricted core capital elements. Restricted core capital elements include qualifying cumulative preferred stock interests, certain minority interests in subsidiaries and qualifying trust preferred securities. All of the $71 million in preferred stock interests issued to the Treasury under the Capital Purchase Program qualify as Tier 1 capital. Total risk-based capital consists of Tier 1 capital, qualifying subordinated debt, and a portion of the allowance for loan losses, and for the Company, a limited amount of excess restricted core capital elements. Risk-based capital ratios are calculated with reference to risk-weighted assets. The leverage ratio compares Tier 1 capital to total average assets. The Bank’s Tier 1 risk-based capital ratio was 11.41% at December 31, 2009, compared to 13.16% at December 31, 2008, and its total risk-based capital ratio was 12.66% at December 31, 2009, compared to 14.41% at December 31, 2008. These ratios are in excess of the mandated minimum requirement of 4.00% and 8.00%, respectively. The Bank’s leverage ratio was 10.23% at December 31, 2009, compared to 11.81% at December 31, 2008. The Company’s Tier 1 risk-based capital ratio, total risk-based capital ratio, and leverage ratio
20
was 11.48%, 12.73%, and 10.29%, respectively, at December 31, 2009, compared to 13.07%, 14.44%, and 11.76% at December 31, 2008. The declines in these capital ratios in 2009, are due to net operating losses and dividends paid on preferred stock to the Treasury. Both the Company’s and Bank’s capital positions reflect proceeds from the issuance of a total of $65 million in trust preferred securities.
The ability of the Company to continue to maintain its overall asset size, or to grow, is dependent on its earnings and the ability to obtain additional funds for contribution to the Bank’s capital, through earnings, borrowing, the sale of additional common stock, or through the issuance of additional trust preferred securities or other qualifying securities. In the event that the Company is unable to obtain additional capital for the Bank on a timely basis, the growth of the Company and the Bank may be curtailed, and the Company and the Bank may be required to reduce their level of assets in order to maintain compliance with regulatory capital requirements. Under those circumstances net income and the stockholders’ equity may be adversely affected.
Guidance by the federal banking regulators provides that banks which have concentrations in construction, land development or commercial real estate loans (other than loans for majority owner occupied properties) would be expected to maintain higher levels of risk management and, potentially, higher levels of capital. It is possible that we may be required to maintain higher levels of capital than we would otherwise be expected to maintain as a result of our levels of construction, development and commercial real estate loans, which may require us to obtain additional capital.
The Federal Reserve has revised the capital treatment of trust preferred securities. As a result, the capital treatment of trust preferred securities has been revised to provide that beginning in 2011, such securities can be counted as Tier 1 capital at the holding company level, together with other restricted core capital elements, up to 25% of total capital (net of goodwill), and any excess as Tier 2 capital, subject to limitation. At December 31, 2009, trust preferred securities represented 22.7% of the Company’s Tier 1 capital and 20.4% of its total risk-based capital. See Note 15 to the Consolidated Financial Statements for further information regarding trust preferred securities.
Capital Issuances. As noted above, during 2008, the Company accepted an investment by Treasury under the Capital Purchase Program. In connection with that investment, the Company entered into and consummated a Securities Purchase Agreement with the Treasury, pursuant to which the Company issued 71,000 shares of the Company’s Fixed Rate Cumulative Perpetual Preferred Stock, Series A (“Series A Preferred Stock”), having a liquidation amount per share equal to $1,000, for a total purchase price of $71 million. The Series A Preferred Stock pays cumulative dividends at a rate of 5% per year for the first five years and thereafter at a rate of 9% per year. Subject to consultation with the Company’s and Bank’s federal regulators, the Company may, at its option, redeem the Series A Preferred Stock at the liquidation amount plus accrued and unpaid dividends. The Series A Preferred Stock is non-voting, except in limited circumstances. Prior to the third anniversary of issuance, unless the Company has redeemed all of the Series A Preferred Stock or the Treasury has transferred all of the Series A Preferred Stock to a third party, the consent of the Treasury will be required for the Company to commence paying a cash common stock dividend or repurchase its common stock or other equity or capital securities, other than in connection with benefit plans consistent with past practice and certain other circumstances specified in the Purchase Agreement.
In connection with the purchase of the Series A Preferred Stock, the Treasury was issued a warrant (the “Warrant”) to purchase 2,696,203 shares of the Company’s common stock at an initial exercise price of $3.95 per share. The Warrant provides for the adjustment of the exercise price and the number of shares of the common stock issuable upon exercise pursuant to customary anti-dilution provisions, such as upon stock splits or distributions of securities or other assets to holders of the common stock, and upon certain issuances of the common stock (or securities exercisable or exchangeable for, or convertible into, common stock) at or below 90% of the market price of the common stock on the trading day prior to the date of the agreement on pricing such securities. The Warrants expire ten years from the date of issuance. If the Company redeems the Series A Preferred Stock in full prior to exercise of the Warrant, the Warrant will be liquidated based upon the then current fair market value of the common stock. The Treasury has agreed not to exercise voting power with respect to any shares of common stock issued upon exercise of the Warrant.
Please refer to Note 15 to the Consolidated Financial Statements for additional information regarding the issuance of $25 million of trust preferred securities and warrants to purchase 1.5 million shares to certain directors and executive officers of the Company.
21
Contractual Obligations
The Company has entered into certain contractual obligations including long term debt, operating leases and obligations under service contracts. The following table summarizes the Company’s contractual cash obligations as of December 31, 2009:
TABLE 17: CONTRACTUAL OBLIGATIONS
| Payments Due-By Period | |||||||||||||||
| (Dollars in thousands) |
Total | Within One Year |
One To Three Years |
Three To Five Years |
After Five Years | ||||||||||
| Securities sold under agreements to repurchase and Federal funds purchased |
$ | 176,728 | $ | 101,728 | $ | — | $ | 25,000 | $ | 50,000 | |||||
| Other borrowed funds |
25,000 | — | 25,000 | — | — | ||||||||||
| Trust preferred securities |
65,000 | — | — | — | 65,000 | ||||||||||
| Operating leases |
34,034 | 3,985 | 7,685 | 7,370 | 14,994 | ||||||||||
| Data processing services |
5,582 | 2,310 | 3,272 | — | — | ||||||||||
| Total contractual cash obligations |
$ | 306,344 | $ | 108,023 | $ | 35,957 | $ | 32,370 | $ | 129,994 | |||||
The obligation for data processing services represents estimates of early termination charges. Of the $65.0 million of trust preferred securities shown as due after 5 years, $15.0 million is subject to redemption, at par, at the Company’s option, on any semi-annual distribution payment date, the next one being June 30, 2010. The table does not reflect deposit liabilities entered into in the ordinary course of the Company’s banking business. At December 31, 2009, the Company had approximately $1.2 billion of demand and savings deposits, exclusive of interest, which have no stated maturity or payment date. The Company also had approximately $1.0 billion of time deposits, exclusive of interest, the maturity distribution of which is set forth in Note 6 to the Consolidated Financial Statements. For additional information about the Company’s deposit obligations, see “Net Interest Income” and “Deposits” above. The trust preferred securities exclude $2.0 million of capital notes held by the trusts that relate to the common securities of the issuing trusts, all of which are owned by the Company. See Note 15 to the Consolidated Financial Statements for additional information regarding the trust preferred capital notes.
Off-Balance Sheet Arrangements
The Company enters into certain off-balance sheet arrangements in the normal course of business to meet the financing needs of its customers. These off-balance sheet arrangements include commitments to extend credit, standby letters of credit and financial guarantees which would impact the Company’s liquidity and capital resources to the extent customers accept and or use these commitments. These instruments involve, to varying degrees, elements of credit and interest rate risk in excess of the amount recognized in the balance sheet. See Note 16 to the Consolidated Financial Statements for further discussion of the nature, business purpose and elements of risk involved with these off-balance sheet arrangements. With the exception of these off-balance sheet arrangements, and the Company’s obligations in connection with its trust preferred securities, the Company has no off-balance sheet arrangements that have or are reasonably likely to have a current or future effect on the Company’s financial condition, changes in financial condition, revenues or expenses, results of operations, liquidity, capital expenditures, or capital resources, that is material to investors. For further information, see Notes 15 and 16 to the Consolidated Financial Statements.
22
RISK FACTORS
An investment in our common stock involves various risks. The following is a summary of certain risks identified by us as affecting our business. You should carefully consider the risk factors listed below, as well as other cautionary statements made in this Annual Report, and risks and uncertainties which we may identify in our other reports and documents filed with the Securities and Exchange Commission or other public announcements. These risk factors may cause our future earnings to be lower or our financial condition to be less favorable than we expect. In addition, other risks of which we are not aware, which relate to the banking and financial services industries in general, or which we do not believe are material, may cause earnings to be lower, or hurt our future financial condition. You should read this section together with the other information in this Annual Report.
We may not be able to maintain our historical growth rate, which may adversely impact our results of operations and financial condition.
Over the years our asset level has increased rapidly. We may not be able to sustain our historical rate of growth, or grow at all. Various factors, such as economic conditions, regulatory considerations and competition, may impede our rate of growth and our branch expansion, or may make future growth or branching less profitable or more expensive. If we experience a significant decrease in our rate of growth as compared to our historic rate of growth, our income, or our rate of income growth, may decline, our capacity to absorb any additional losses resulting from, or loan loss provisions related to, declining loan quality may be diminished, and we may not be able to maintain or reduce our expense levels and efficiency ratio, which would adversely affect our results of operations and financial condition.
Our concentrations of loans could result in higher than normal risk of loan defaults and losses.
We have a substantial amount of loans secured by real estate in the Northern Virginia/Washington, D.C. metropolitan area, and substantially all of our loans are to borrowers in that area. We also have a significant amount of real estate construction loans and land related loans for residential and commercial developments. At December 31, 2009, 89.1% of our total loans were secured by real estate, primarily commercial real estate. Of these loans, $428 million, or 18.8% of total loans, were construction and land loans. An additional 10.4% of total loans were commercial and industrial loans which are not secured by real estate. These loans have a higher risk of default than other types of loans, such as well underwritten conforming single family residential mortgage loans. In addition, the repayments of these loans, often depends on the successful operation of a business or the sale or development of the underlying property, and as a result are more likely to be adversely affected by adverse conditions in the real estate market or the economy in general. These concentrations expose us to the risk that adverse developments in the real estate market, or in the general economic conditions in the Northern Virginia/Washington, D.C. metropolitan area, could increase the levels of non-performing loans and charge-offs, and reduce loan demand. In that event, we would likely experience lower earnings or losses. Additionally, if, for any reason, economic conditions in the area deteriorate, or there is significant volatility or weakness in the economy or any significant sector of the area’s economy, our ability to develop our business relationships may be diminished, the quality and collectibility of our loans may be adversely affected, the value of collateral may decline and loan demand may be reduced. Additionally, under guidance from the banking agencies, we may be required to maintain higher levels of capital than we would otherwise be expected to maintain, and to employ greater risk management efforts, as a result of our real estate concentrations.
Commercial, commercial real estate and construction loans also generally have larger balances than single family mortgages loans and other consumer loans. Because the loan portfolio contains a significant number of commercial and commercial real estate and construction loans with relatively large balances, the deterioration of one or a few of these loans may cause a significant increase in nonperforming assets. An increase in nonperforming loans could result in: a loss of earnings from these loans, an increase in the provision for loan losses, or an increase in loan charge-offs, which could have an adverse impact on our results of operations and financial condition.
Lack of seasoning of our loan portfolio could increase the risk of credit defaults in the future.
Due to the rapid growth of the Bank, a large portion of the loans in our loan portfolio and of our lending relationships is of relatively recent origin. In general, loans do not begin to show signs of credit deterioration or default until they have been outstanding for some period of time, a process referred to as “seasoning.” As a result, a portfolio of older loans will usually behave more predictably than a newer portfolio. Because a large portion of our loan portfolio is relatively new, the current level of delinquencies and defaults may not be representative of the level that will prevail when the portfolio becomes more seasoned, which may be higher than current levels. If delinquencies and defaults increase, we may be required to increase our provision for loan losses, which would adversely affect our results of operations and financial condition.
23
Our financial condition and results of operations would be adversely affected if our allowance for loan losses is not sufficient to absorb actual losses or if we are required to increase our allowance for loan losses.
Experience in the banking industry indicates that a portion of our loans will become delinquent, that some of our loans may only be partially repaid or may never be repaid and we may experience other losses for reasons beyond our control. Further, despite our underwriting criteria and historical experience, we may be particularly susceptible to losses due to: (1) the geographic concentration of our loans, (2) the concentration of higher risk loans, such as commercial real estate, construction and commercial and industrial loans, and (3) the relative lack of seasoning of certain of our loans. At December 31, 2009, we had elevated levels of non-performing assets and other impaired loans, $94.3 million and $171.8 million, respectively, aggregating 9.8% of assets. This level, which is significantly in excess of our historical level, is primarily a result of high levels of non-performing residential and commercial real estate construction and land loans. As a result, our provision and allowance for loan losses, as well as our level of charge-offs, have significantly increased over prior years. Although we believe that our allowance for loan losses is maintained at a level adequate to absorb any inherent losses in our loan portfolio, these estimates of loan losses are necessarily subjective and their accuracy depends on the outcome of future events. If we need to make significant and unanticipated increases in our loss allowance in the future, our results of operations and financial condition would be materially adversely affected at that time.
While we strive to carefully monitor credit quality and to identify loans that may become nonperforming, at any time there are loans included in the portfolio that will result in losses, but that have not been identified as nonperforming or potential problem loans. We cannot be sure that we will be able to identify deteriorating loans before they become nonperforming assets, or that we will be able to limit losses on those loans that are identified. As a result, future additions to the allowance may be necessary.
We may not be able to successfully manage continued growth.
We intend to seek further growth in the level of our assets and deposits and, to a limited extent, the number of our branches. In the future, we may seek further branch expansion, both within our existing footprint and to expand our footprint in Northern Virginia. We cannot be certain as to our ability to manage increased levels of assets and liabilities, and an expanded branch system, without increased expenses and higher levels of non-performing assets. We may be required to make additional investments in equipment and personnel to manage higher asset levels and loan balances and a larger branch network, which may adversely impact earnings, shareholder returns and our efficiency ratio. Increases in operating expenses or non-performing assets may have an adverse impact on the value of our common stock.
Our ability to pay cash dividends on the common stock and to repurchase any shares of common stock is highly restricted.
The Company has no recent history of paying cash dividends, and other than repurchases of fractional shares issued in connection with stock splits or stock dividends. Our ability to pay dividends on the common stock, or repurchase shares, is limited by state and federal law and regulation, and by the terms of the Series A Preferred Stock issued to the Treasury. Under the terms of the Series A Preferred Stock, the Company may not pay a dividend, or subject to limited exceptions, repurchase or acquire any common stock, without the prior approval of the Treasury, until December 12, 2011, or the earlier redemption or transfer of all securities issued to Treasury. Additionally, we may not pay any dividends on the common stock, or subject to limited exceptions, repurchase or acquire any common stock, without prior Treasury approval, when any dividend on the Series A Preferred Stock is in arrears. Further, we cannot pay any dividends on the common stock, or acquire any shares of common stock, if any distribution on our trust preferred securities are in arrears. In light of the foregoing restrictions, it is unlikely that the Company will pay any dividends on the common stock or repurchase any shares of common stock in the near future.
24
Our continued growth depends on our ability to meet minimum regulatory capital levels. Growth and shareholder returns may be adversely affected if sources of capital are not available to help us meet them.
Since we became the holding company for the Bank, we have sought to maximize shareholder returns by leveraging our capital. If earnings do not meet our current estimates, if we incur unanticipated losses or expenses, or if we grow faster than expected, we may need to obtain additional capital sooner than expected, through borrowing, additional issuances of debt or equity securities, or otherwise. If we do not have continued access to sufficient capital, we may be required to reduce our level of assets or reduce our rate of growth in order to maintain regulatory compliance. Under those circumstances net income and the rate of growth of net income may be adversely affected. Additional issuances of equity securities could have a dilutive effect on existing shareholders.
There is no assurance that we will be able to successfully compete with others for business.
The Northern Virginia/Washington, D.C. metropolitan area in which we operate is considered highly attractive from an economic and demographic viewpoint, and is a highly competitive banking market. We compete for loans, deposits, and investment dollars with numerous regional and national banks, online divisions of out-of-market banks, and other community banking institutions, as well as other kinds of financial institutions and enterprises, such as securities firms, insurance companies, savings associations, credit unions, mortgage brokers, and private lenders. Many competitors have substantially greater resources than us, and operate under less stringent regulatory environments. The differences in resources and regulations may make it harder for us to compete profitably, reduce the rates that we can earn on loans and investments, increase the rates we must offer on deposits and other funds, and adversely affect our overall financial condition and earnings.
Turmoil in the financial markets may make it more difficult for the Bank to meet its liquidity needs.
During 2008 and 2009, financial markets experienced unprecedented pressure associated with the declining value of residential real estate, and deleveraging by investors in mortgage related securities. This has resulted in a sharp decline in the value of home mortgage loans and securities that derive their value from such loans. Many commercial banks have faced large write-downs of their loan and investment portfolios, resulting in large losses, repeated over a number of quarters, declining stock prices, significant capital issuances, bank failures, and loss of confidence in the safety of the banking system. In several well-publicized cases, this loss of confidence has led to large rapid withdrawals and the failure, or federally assisted mergers, of prominent financial institutions.
The Bank positions itself in the marketplace as a business bank. It does not (and did not) originate low quality home loans for sale, and invests only in high quality mortgage-backed securities and as such has not experienced many of the issues facing other institutions. Nevertheless, the turmoil in the financial markets has caused many depositors to seek safety in government securities, resulting in liquidity challenges for all banks. The Bank has responded to these challenges by promoting participation in the CDARS program and by participating in the increased deposit insurance programs provided by the FDIC. However, should turmoil in the markets continue, the Bank may be forced to pay higher interest rates to obtain deposits and meet the needs of its depositors and borrowers, resulting in reduced net interest income. If conditions worsen significantly, it is possible that banks such as the Bank may be unable to meet the needs of their depositors and borrowers, which could, in the worst case, result in the Bank being placed into receivership.
Trading in our common stock has been relatively light. As a result, shareholders may not be able to quickly and easily sell their common stock.
Although our common stock is listed on the Nasdaq Global Select Market, and a number of brokers offer to make a market in the common stock on a regular basis, trading volume to date has been relatively light, averaging approximately 28,429 shares per day over the year ended December 31, 2009. There can be no assurance that an active and liquid market for the common stock can be maintained. Accordingly, shareholders may find it difficult to sell a significant number of shares at the prevailing market price.
The number of shares owned by our directors and executive officers could make it more difficult to obtain approval for some matters submitted to shareholder vote, including mergers and acquisitions.
Our directors and executive officers and their affiliates own approximately 25.5% of the outstanding common stock. By voting against a proposal submitted to shareholders, the directors and officers, as a group, may be able to make approval more difficult for proposals requiring the vote of shareholders, such as some mergers, share exchanges, asset sales, and amendments to the Articles of Incorporation. The results of the vote may be contrary to the desires or interests of the public shareholders.
25
Changes in interest rates and other factors beyond our control could have an adverse impact on our earnings.
Our operating income and net income depend to a great extent on our net interest margin, i.e., the difference between the interest yields we receive on loans, securities and other interest-earning assets and the interest rates we pay on interest-bearing deposits and other liabilities. The net interest margin is affected by changes in market interest rates, because different types of assets and liabilities may react differently, and at different times, to market interest rate changes. When interest-bearing liabilities mature or reprice more quickly than interest-earning assets in a period, an increase in market rates of interest could reduce net interest income. Similarly, when interest-earning assets mature or reprice more quickly than interest-bearing liabilities, falling interest rates could reduce net interest income. These rates are highly sensitive to many factors beyond our control, including competition, general economic conditions and monetary and fiscal policies of various governmental and regulatory authorities, including the Board of Governors of the Federal Reserve System.
We attempt to manage our risk from changes in market interest rates by adjusting the rates, maturity, repricing, and balances of the different types of interest-earning assets and interest-bearing liabilities, but interest rate risk management techniques are not exact. As a result, a rapid increase or decrease in interest rates could have an adverse effect on our net interest margin and results of operations. The results of our interest rate sensitivity simulation models depend upon a number of assumptions which may not prove to be accurate. There can be no assurance that we will be able to successfully manage our interest rate risk. Increases in market rates and adverse changes in the local residential real estate market, the general economy or consumer confidence would likely have a significant adverse impact on our non-interest income, as a result of reduced demand for residential mortgage loans, that we make on a pre-sold basis.
Adverse changes in the real estate market in our market area could also have an adverse affect on our cost of funds and net interest margin, as we have a large amount of non-interest bearing demand deposits related to real estate sales and development. While we expect that we would be able to replace the liquidity provided by these deposits, the replacement funds would likely be more costly, negatively impacting earnings. Additionally, changes in applicable law, if enacted, including those that would permit banks to pay interest on checking and demand deposit accounts established by businesses, could have a significant negative effect on net interest income, net income, the net interest margin, and our return on assets and return on equity.
Government regulation will significantly affect the Bank’s business and may result in higher costs and lower shareholder returns.
The banking industry is heavily regulated. Banking regulations are primarily intended to protect the federal deposit insurance funds and depositors, not shareholders. The Company and Bank are regulated and supervised by the Board of Governors of the Federal Reserve System, the Virginia Bureau of Financial Institutions and the Federal Deposit Insurance Corporation. The burden imposed by federal and state regulations puts banks at a competitive disadvantage compared to less regulated competitors such as finance companies, credit unions, mortgage banking companies and leasing companies. Changes in the laws, regulations and regulatory practices affecting the banking industry may increase our costs of doing business or otherwise adversely affect us and create competitive advantages for others. Regulations affecting banks and financial services companies undergo continuous change, and we cannot predict the ultimate effect of these changes, which could have a material adverse effect on our profitability or financial condition. Federal economic and monetary policy may also affect our ability to attract deposits and other funding sources, make loans and investments, and achieve satisfactory interest spreads.
The Company is subject to additional uncertainties, and potential additional regulatory or compliance burdens, as a result of its participation in the Capital Purchase Program.
The Company accepted an investment of $71 million from the Treasury under the Capital Purchase Program. The Securities Purchase Agreement executed by the Company (and all other participating institutions) and Treasury, provides that Treasury may unilaterally amend the agreement to the extent required to comply with any subsequent changes in applicable federal statutes. As a result of this provision, the Treasury and Congress may impose additional requirements or restrictions on the Company and the Bank in respect of reporting, compliance, corporate governance, executive or employee compensation, dividend payments, stock repurchases, lending or other business practices, capital requirements or other matters. As a result, the Company and Bank may be required to expend additional resources in order to comply with these requirements. Such additional requirements could impair the Company’s ability to compete with institutions that are not subject to the restrictions because they did not accept an investment
26
from the Treasury. To the extent that additional restrictions or limitations on employee compensation are imposed, such as those contained in the American Recovery and Reinvestment Act of 2009 (the “ARRA”), the Company and Bank may be less competitive in attracting successful incentive compensation based lenders and customer relations personnel. Additionally, the ability of Congress to utilize the amendment provisions to effect political or public relations goals, could result in the Company and Bank being subjected to additional burdens as a result of public perceptions of issues relating to the largest banks, and which are not applicable to community oriented institutions such as the Company. There can be no assurance that the Company could be disadvantaged as a result of these uncertainties.
Substantial regulatory limitations on changes of control and anti-takeover provisions of Virginia law may make it more difficult for you to receive a change in control premium.
With certain limited exceptions, federal regulations prohibit a person or company or a group of persons deemed to be “acting in concert” from, directly or indirectly, acquiring more than 10% (5% if the acquirer is a bank holding company) of any class of our voting stock or obtaining the ability to control in any manner the election of a majority of our directors or otherwise direct the management or policies of our company without prior notice or application to and the approval of the Federal Reserve. There are comparable prior approval requirements for changes in control under Virginia law. Also, Virginia corporate law contains several provisions that may make it more difficult for a third party to acquire control of us without the approval of our Board of Directors, and may make it more difficult or expensive for a third party to acquire a majority of our outstanding common stock.
DISCLOSURE CONTROLS AND PROCEDURES
The Company’s management, with the participation of the Company’s Chief Executive Officer and the Chief Financial Officer, has evaluated the effectiveness of the Company’s disclosure controls and procedures (as defined in Rule 13a-15(e) under the Securities Exchange Act of 1934, as amended (the “Exchange Act”)) as of the end of the period covered by this report. Based on that evaluation, the Chief Executive Officer and the Chief Financial Officer have concluded that the Company’s disclosure controls and procedures were effective as of December 31, 2009, to ensure that information required to be disclosed by the Company in reports that it files or submits under the Exchange Act is recorded, processed, summarized and reported within the time periods specified in SEC rules and forms and that such information is accumulated and communicated to the Company’s management, including the Company’s Chief Executive Officer and Chief Financial Officer, as appropriate to allow timely decisions regarding required disclosure. Because of the inherent limitations in all control systems, no evaluation of controls can provide absolute assurance that the Company’s disclosure controls and procedures will detect or uncover every situation involving the failure of persons within the Company or its subsidiary to disclose material information required to be set forth in the Company’s periodic reports.
27
MANAGEMENT REPORT ON INTERNAL CONTROL OVER FINANCIAL REPORTING
Management of the Company is also responsible for establishing and maintaining adequate internal control over financial reporting (as defined in Rule 13a-15(f) under the Exchange Act). Management believes that internal controls over financial reporting, which are subject to scrutiny by management and the Company’s internal auditors, support the integrity and reliability of the financial statements. Management recognizes that there are inherent limitations in the effectiveness of any internal control system, including the possibility of human error and the circumvention or overriding of internal controls. Accordingly, even effective internal control over financial reporting can provide only reasonable assurance with respect to financial statement preparation and presentation. In addition, because of changes in conditions and circumstances, the effectiveness of internal control over financial reporting may vary over time.
Management assessed the effectiveness of Company’s system of internal control over financial reporting as of December 31, 2009. This assessment was conducted based on the criteria set forth by the Committee of Sponsoring Organizations (“COSO”) of the Treadway Commission in “Internal Control - Integrated Framework”. Based on this assessment, management believes that the Company maintained effective internal control over financial reporting as of December 31, 2009. Management’s assessment concluded that there were no material weaknesses within the Company’s internal control structure.
The effectiveness of the Company’s internal control over financial reporting as of December 31, 2009, has been audited by Yount, Hyde & Barbour, P.C., the independent registered public accounting firm who also audited the Company’s consolidated financial statements included in this Annual Report on Form 10-K. Yount, Hyde & Barbour, P.C.’s attestation report on the Corporation’s internal control over financial reporting appears on pages 30 and 31 hereof.
There were no changes in the Company’s internal control over financial reporting during the quarter ended December 31, 2009, that has materially affected, or is reasonably likely to materially affect, the Company’s internal control over financial reporting.
28

REPORT OF INDEPENDENT REGISTERED PUBLIC ACCOUNTING FIRM
To the Stockholders and Board of Directors
Virginia Commerce Bancorp, Inc.
Arlington, Virginia
We have audited the accompanying consolidated balance sheets of Virginia Commerce Bancorp, Inc. and subsidiaries as of December 31, 2009 and 2008, and the related consolidated statements of operations, changes in stockholders’ equity, and cash flows for the years ended December 31, 2009, 2008 and 2007. These financial statements are the responsibility of the Company’s management. Our responsibility is to express an opinion on these financial statements based on our audits.
We conducted our audits in accordance with the standards of the Public Company Accounting Oversight Board (United States). Those standards require that we plan and perform the audit to obtain reasonable assurance about whether the financial statements are free of material misstatement. An audit includes examining, on a test basis, evidence supporting the amounts and disclosures in the financial statements. An audit also includes assessing the accounting principles used and significant estimates made by management, as well as evaluating the overall financial statement presentation. We believe that our audits provide a reasonable basis for our opinion.
In our opinion, the consolidated financial statements referred to above present fairly, in all material respects, the financial position of Virginia Commerce Bancorp, Inc. and subsidiaries as of December 31, 2009 and 2008, and the results of their operations and their cash flows for the years ended December 31, 2009, 2008 and 2007, in conformity with U.S. generally accepted accounting principles.
We have also audited, in accordance with the standards of the Public Company Accounting Oversight Board (United States), Virginia Commerce Bancorp, Inc. and subsidiaries’ internal control over financial reporting as of December 31, 2009, based on criteria established in Internal Control — Integrated Framework issued by the Committee of Sponsoring Organizations of the Treadway Commission, and our report dated March 19, 2010 expressed an unqualified opinion on the effectiveness of Virginia Commerce Bancorp, Inc. and subsidiaries’ internal control over financial reporting.

Winchester, Virginia
March 19, 2010
29
REPORT OF INDEPENDENT REGISTERED PUBLIC ACCOUNTING FIRM
To the Stockholders and Board of Directors
Virginia Commerce Bancorp, Inc.
Arlington, Virginia
We have audited Virginia Commerce Bancorp, Inc. and subsidiaries’ internal control over financial reporting as of December 31, 2009, based on criteria established in Internal Control — Integrated Framework issued by the Committee of Sponsoring Organizations of the Treadway Commission. Virginia Commerce Bancorp, Inc. and subsidiaries’ management is responsible for maintaining effective internal control over financial reporting and for its assessment of the effectiveness of internal control over financial reporting included in the accompanying Management’s Report on Internal Control over Financial Reporting. Our responsibility is to express an opinion on the Company’s internal control over financial reporting based on our audit.
We conducted our audit in accordance with the standards of the Public Company Accounting Oversight Board (United States). Those standards require that we plan and perform the audit to obtain reasonable assurance about whether effective internal control over financial reporting was maintained in all material respects. Our audit included obtaining an understanding of internal control over financial reporting, assessing the risk that a material weakness exists, and testing and evaluating the design and operating effectiveness of internal control based on the assessed risk. Our audit also included performing such other procedures as we considered necessary in the circumstances. We believe that our audit provides a reasonable basis for our opinion.
A company’s internal control over financial reporting is a process designed to provide reasonable assurance regarding the reliability of financial reporting and the preparation of financial statements for external purposes in accordance with generally accepted accounting principles. A company’s internal control over financial reporting includes those policies and procedures that (a) pertain to the maintenance of records that, in reasonable detail, accurately and fairly reflect the transactions and dispositions of the assets of the company; (b) provide reasonable assurance that transactions are recorded as necessary to permit preparation of financial statements in accordance with generally accepted accounting principles, and that receipts and expenditures of the company are being made only in accordance with authorizations of management and directors of the company; and (c) provide reasonable assurance regarding prevention or timely detection of unauthorized acquisition, use, or disposition of the company’s assets that could have a material effect on the financial statements.
Because of its inherent limitations, internal control over financial reporting may not prevent or detect misstatements. Also, projections of any evaluation of effectiveness to future periods are subject to the risk that controls may become inadequate because of changes in conditions, or that the degree of compliance with the policies or procedures may deteriorate.
In our opinion, Virginia Commerce Bancorp, Inc. and subsidiaries maintained, in all material respects, effective internal control over financial reporting as of December 31, 2009, based on criteria established in Internal Control — Integrated Framework issued by the Committee of Sponsoring Organizations of the Treadway Commission.
30
We have also audited, in accordance with the standards of the Public Company Accounting Oversight Board (United States), the consolidated balance sheets as of December 31, 2009 and 2008, and the related consolidated statements of operations, changes in stockholders’ equity and cash flows for the years ended December 31, 2009, 2008 and 2007 of Virginia Commerce Bancorp, Inc. and subsidiaries and our report dated March 19, 2010 expressed an unqualified opinion.
Winchester, Virginia
March 19, 2010
31
CONSOLIDATED BALANCE SHEETS
(Dollars in thousands except share data)
| December 31, | |||||||
| 2009 | 2008 | ||||||
| Assets |
|||||||
| Cash and due from banks |
$ | 25,211 | $ | 33,515 | |||
| Securities (fair value: 2009, $349,836; 2008, $326,695) |
348,585 | 325,743 | |||||
| Restricted stocks, at cost |
11,751 | 11,076 | |||||
| Loans held-for-sale |
6,492 | 6,221 | |||||
| Loans, net of allowance for loan losses of $65,152 in 2009 and $36,475 in 2008 |
2,210,064 | 2,273,086 | |||||
| Bank premises and equipment, net |
13,794 | 14,740 | |||||
| Accrued interest receivable |
10,537 | 10,593 | |||||
| Other real estate owned, net of valuation allowance of $9,067 in 2009 and $0 in 2008 |
28,499 | 7,569 | |||||
| Other assets |
70,364 | 33,379 | |||||
| Total assets |
$ | 2,725,297 | $ | 2,715,922 | |||
| Liabilities and Stockholders’ Equity |
|||||||
| Deposits |
|||||||
| Demand deposits |
$ | 239,604 | $ | 194,791 | |||
| Savings and interest-bearing demand deposits |
985,152 | 518,054 | |||||
| Time deposits |
1,004,571 | 1,459,297 | |||||
| Total deposits |
$ | 2,229,327 | $ | 2,172,142 | |||
| Securities sold under agreement to repurchase and federal funds purchased |
176,729 | 187,959 | |||||
| Other borrowed funds |
25,000 | 25,000 | |||||
| Trust preferred capital notes |
66,057 | 65,800 | |||||
| Accrued interest payable |
4,014 | 8,160 | |||||
| Other liabilities |
5,302 | 3,574 | |||||
| Commitments and contingent liabilities |
— | — | |||||
| Total liabilities |
$ | 2,506,429 | $ | 2,462,635 | |||
| Stockholders’ Equity |
|||||||
| Preferred stock, net of discount, $1.00 par, 1,000,000 shares authorized, Series A; $1,000.00 liquidation value; 71,000 issued and outstanding in 2009 and 2008 |
$ | 63,993 | $ | 62,541 | |||
| Common stock, $1.00 par, 50,000,000 shares authorized, issued and outstanding 2009, 26,744,545; 2008, 26,575,569 |
26,745 | 26,575 | |||||
| Surplus |
96,588 | 95,840 | |||||
| Warrants |
8,520 | 8,520 | |||||
| Retained earnings |
22,671 | 60,535 | |||||
| Accumulated other comprehensive income (loss), net |
351 | (724 | ) | ||||
| Total stockholders’ equity |
$ | 218,868 | $ | 253,287 | |||
| Total liabilities and stockholders’ equity |
$ | 2,725,297 | $ | 2,715,922 | |||
See Notes to Consolidated Financial Statements.
32
CONSOLIDATED STATEMENTS OF OPERATIONS
(Dollars in thousands except per share data)
| Year Ended December 31, | |||||||||||
| 2009 | 2008 | 2007 | |||||||||
| Interest and dividend income: |
|||||||||||
| Interest and fees on loans |
$ | 134,548 | $ | 143,501 | $ | 138,919 | |||||
| Interest and dividends on investment securities: |
|||||||||||
| Taxable |
14,050 | 15,017 | 12,888 | ||||||||
| Tax-exempt |
1,591 | 1,248 | 752 | ||||||||
| Dividends |
355 | 320 | 308 | ||||||||
| Interest on deposits with other banks |
— | 145 | 140 | ||||||||
| Interest on federal funds sold |
89 | 237 | 1,131 | ||||||||
| Total interest and dividend income |
$ | 150,633 | $ | 160,468 | $ | 154,138 | |||||
| Interest expense: |
|||||||||||
| Deposits |
$ | 49,598 | $ | 67,261 | $ | 69,398 | |||||
| Securities sold under agreement to repurchase and federal funds purchased |
3,475 | 5,534 | 6,259 | ||||||||
| Other borrowed funds |
1,077 | 1,235 | 225 | ||||||||
| Trust preferred capital notes |
5,079 | 3,400 | 3,099 | ||||||||
| Total interest expense |
$ | 59,229 | $ | 77,430 | $ | 78,981 | |||||
| Net interest income |
$ | 91,404 | $ | 83,038 | $ | 75,157 | |||||
| Provision for loan losses |
81,913 | 25,378 | 4,340 | ||||||||
| Net interest income after provision for loan losses |
$ | 9,491 | $ | 57,660 | $ | 70,817 | |||||
| Non-interest income (charges): |
|||||||||||
| Service charges and other fees |
$ | 3,606 | $ | 3,902 | $ | 3,388 | |||||
| Non-deposit investment services commissions |
600 | 702 | 770 | ||||||||
| Fees and net gains on loans held-for-sale |
2,912 | 1,498 | 2,706 | ||||||||
| (Loss) gain on other real estate owned |
(9,952 | ) | — | 638 | |||||||
| Loss on securities available-for-sale in 2009, consist of other-than-temporary impairment losses of $5.1 million of which $3.3 million is recognized in other comprehensive income and a net impairment loss of $1.8 million recognized in earnings |
(1,821 | ) | — | (387 | ) | ||||||
| Other |
303 | 329 | 768 | ||||||||
| Total non-interest income (charges) |
$ | (4,352 | ) | $ | 6,431 | $ | 7,883 | ||||
| Non-interest expense: |
|||||||||||
| Salaries and employee benefits |
$ | 23,040 | $ | 23,362 | $ | 22,536 | |||||
| Occupancy expense |
10,253 | 8,857 | 7,031 | ||||||||
| FDIC insurance expense |
5,411 | 1,500 | 758 | ||||||||
| Franchise tax |
3,100 | 1,528 | 1,279 | ||||||||
| Data processing |
2,436 | 2,166 | 1,940 | ||||||||
| Provision for unfunded commitments |
2,960 | — | — | ||||||||
| Other operating expense |
9,668 | 7,363 | 6,150 | ||||||||
| Total non-interest expense |
$ | 56,868 | $ | 44,776 | $ | 39,694 | |||||
| (Loss) income before taxes |
$ | (51,729 | ) | $ | 19,315 | $ | 39,006 | ||||
| (Benefit) provision for income taxes |
(18,404 | ) | 6,231 | 13,219 | |||||||
| Net (loss) income |
$ | (33,325 | ) | $ | 13,084 | $ | 25,787 | ||||
| Effective dividend on preferred stock |
4,539 | 258 | — | ||||||||
| Net (loss) income available to common stockholders |
$ | (37,864 | ) | $ | 12,826 | $ | 25,787 | ||||
| (Loss) earnings per common share, basic |
$ | (1.42 | ) | $ | 0.48 | $ | 0.98 | ||||
| (Loss) earnings per common share, diluted |
$ | (1.42 | ) | $ | 0.47 | $ | 0.95 | ||||
See Notes to Consolidated Financial Statements.
33
CONSOLIDATED STATEMENTS OF CHANGES IN STOCKHOLDERS’ EQUITY
(Dollars in thousands)
| Preferred Stock |
Common Stock |
Surplus | Warrants | Retained Earnings |
Accumulated Other Comprehensive Income (Loss) |
Comprehensive Income (Loss) |
Total Stockholders’ Equity |
||||||||||||||||||||||
| Balance, December 31, 2006 |
$ | — | $ | 21,560 | $ | 31,231 | $ | — | $ | 87,744 | $ | (684 | ) | $ | 139,851 | ||||||||||||||
| Comprehensive Income: |
|||||||||||||||||||||||||||||
| Net Income 2007 |
25,787 | $ | 25,787 | 25,787 | |||||||||||||||||||||||||
| Other comprehensive income, unrealized holding gains arising during the period (net of tax of $1,019) |
1,893 | 1,893 | 1,893 | ||||||||||||||||||||||||||
| Total comprehensive income |
$ | 27,680 | |||||||||||||||||||||||||||
| 10% stock dividend |
— | 2,172 | 41,108 | — | (43,280 | ) | — | — | |||||||||||||||||||||
| Cash paid in lieu of fractional shares |
— | — | — | — | (12 | ) | — | (12 | ) | ||||||||||||||||||||
| Stock options exercised |
— | 289 | 876 | — | — | — | 1,165 | ||||||||||||||||||||||
| Employee stock purchase plan |
— | 2 | 30 | — | — | — | 32 | ||||||||||||||||||||||
| Stock option expense |
— | — | 427 | — | — | — | 427 | ||||||||||||||||||||||
| Balance, December 31, 2007 |
$ | — | $ | 24,023 | $ | 73,672 | $ | — | $ | 70,239 | $ | 1,209 | $ | 169,143 | |||||||||||||||
| Comprehensive Income: |
|||||||||||||||||||||||||||||
| Net Income 2008 |
13,084 | $ | 13,084 | 13,084 | |||||||||||||||||||||||||
| Other comprehensive loss, unrealized holding losses arising during the period (net of tax of $1,043) |
(1,933 | ) | (1,933 | ) | (1,933 | ) | |||||||||||||||||||||||
| Total comprehensive income |
$ | 11,151 | |||||||||||||||||||||||||||
| 10% stock dividend |
— | 2,411 | 20,112 | — | (22,523 | ) | — | — | |||||||||||||||||||||
| Cash paid in lieu of fractional shares |
— | — | — | — | (7 | ) | — | (7 | ) | ||||||||||||||||||||
| Stock options exercised |
— | 141 | 173 | — | — | — | 314 | ||||||||||||||||||||||
| Stock option expense |
— | — | 597 | — | — | — | 597 | ||||||||||||||||||||||
| Warrant expense in regards to trust preferred securities |
— | — | 1,283 | — | — | — | 1,283 | ||||||||||||||||||||||
| Preferred stock issued |
71,000 | — | — | — | — | — | 71,000 | ||||||||||||||||||||||
| Discount on preferred stock |
(8,459 | ) | — | — | — | — | — | (8,459 | ) | ||||||||||||||||||||
| Warrants issued in regard to preferred stock |
— | — | — | 8,520 | — | — | 8,520 | ||||||||||||||||||||||
| Effective dividend on preferred stock |
— | — | — | — | (258 | ) | — | (258 | ) | ||||||||||||||||||||
| Employee stock purchase plan |
— | — | 3 | — | — | — | 3 | ||||||||||||||||||||||
| Balance, December 31, 2008 |
$ | 62,541 | $ | 26,575 | $ | 95,840 | $ | 8,520 | $ | 60,535 | $ | (724 | ) | $ | 253,287 | ||||||||||||||
| Comprehensive Loss: |
|||||||||||||||||||||||||||||
| Net loss 2009 |
(33,325 | ) | $ | (33,325 | ) | (33,325 | ) | ||||||||||||||||||||||
| Other comprehensive loss: |
|||||||||||||||||||||||||||||
| reclassification adjustment for impairment loss on securities (net of tax $637) |
1,184 | 1,184 | 1,184 | ||||||||||||||||||||||||||
| unrealized holding losses arising during the period (net of tax of $59) |
(109 | ) | (109 | ) | (109 | ) | |||||||||||||||||||||||
| Total comprehensive loss |
$ | (32,250 | ) | ||||||||||||||||||||||||||
| Stock options exercised |
— | 170 | 118 | — | — | — | 288 | ||||||||||||||||||||||
| Stock option expense |
— | — | 630 | — | — | — | 630 | ||||||||||||||||||||||
| Discount on preferred stock |
1,452 | — | — | — | (1,452 | ) | — | — | |||||||||||||||||||||
| Dividend on preferred stock |
— | — | — | — | (3,087 | ) | — | (3,087 | ) | ||||||||||||||||||||
| Balance, December 31, 2009 |
$ | 63,993 | $ | 26,745 | $ | 96,588 | $ | 8,520 | $ | 22,671 | $ | 351 | $ | 218,868 | |||||||||||||||
See Notes to Consolidated Financial Statements.
34
CONSOLIDATED STATEMENTS OF CASH FLOWS
(Dollars in thousands)
| Year Ended December 31, | ||||||||||||
| 2009 | 2008 | 2007 | ||||||||||
| Cash Flows from Operating Activities: |
||||||||||||
| Interest received |
$ | 151,173 | $ | 161,235 | $ | 151,608 | ||||||
| Other income received |
7,422 | 6,431 | 7,246 | |||||||||
| Net change in loans held-for-sale |
(271 | ) | (1,882 | ) | 3,456 | |||||||
| Interest paid |
(63,375 | ) | (78,211 | ) | (75,962 | ) | ||||||
| Cash paid to suppliers and employees |
(101,533 | ) | (50,903 | ) | (37,784 | ) | ||||||
| Income tax benefit of stock options/warrants exercised |
(44 | ) | (45 | ) | (440 | ) | ||||||
| Income taxes paid |
— | (12,150 | ) | (16,055 | ) | |||||||
| Net cash (used in) provided by operating activities |
$ | (6,628 | ) | $ | 24,475 | $ | 32,069 | |||||
| Cash Flows from Investing Activities: |
||||||||||||
| Proceeds from maturities and principal payments on securities held-to-maturity |
$ | 11,261 | $ | 15,516 | $ | 4,765 | ||||||
| Proceeds from maturities and principal payments on securities available-for-sale |
168,225 | 139,733 | 51,794 | |||||||||
| Purchases of securities held-to-maturity |
(11,350 | ) | (26,799 | ) | (4,441 | ) | ||||||
| Purchases of securities available-for-sale |
(192,301 | ) | (141,916 | ) | (175,844 | ) | ||||||
| Sales of securities available-for-sale |
— | — | 35,000 | |||||||||
| Net increase in loans |
(18,891 | ) | (373,723 | ) | (298,615 | ) | ||||||
| Purchase of bank premises and equipment |
(1,776 | ) | (4,599 | ) | (5,427 | ) | ||||||
| Net cash used in investing activities |
$ | (44,832 | ) | $ | (391,788 | ) | $ | (392,768 | ) | |||
| Cash Flows from Financing Activities: |
||||||||||||
| Net increase (decrease) in demand, NOW, money market and savings accounts |
$ | 511,911 | $ | (18,140 | ) | $ | 84,551 | |||||
| Net (decrease) increase in time deposits |
(454,726 | ) | 321,117 | 178,673 | ||||||||
| Net (decrease) increase in securities sold under agreement to repurchase and federal funds purchased |
(11,230 | ) | (34,575 | ) | 73,663 | |||||||
| Net increase in other borrowed funds |
— | — | 25,000 | |||||||||
| Increase (decrease) in trust preferred capital notes |
— | 25,775 | (3,100 | ) | ||||||||
| Proceeds from issuance of preferred stock |
— | 71,000 | — | |||||||||
| Proceeds from exercise of stock options and warrants |
288 | 317 | 1,197 | |||||||||
| Dividend paid on preferred stock |
(3,087 | ) | ||||||||||
| Cash paid in lieu of fractional shares |
— | (7 | ) | (12 | ) | |||||||
| Net cash provided by financing activities |
$ | 43,156 | $ | 365,487 | $ | 359,972 | ||||||
| Decrease in cash and cash equivalents |
$ | (8,304 | ) | $ | (1,826 | ) | $ | (727 | ) | |||
| Cash and Cash Equivalents: |
||||||||||||
| Beginning |
33,515 | 35,341 | 36,068 | |||||||||
| Ending |
$ | 25,211 | $ | 33,515 | $ | 35,341 | ||||||
See Notes to Consolidated Financial Statements.
35
CONSOLIDATED STATEMENTS OF CASH FLOWS (continued)
| Year Ended December 31, | ||||||||||||
| 2009 | 2008 | 2007 | ||||||||||
| Reconciliation of net income (loss) to net cash (used in) provided by operating activities: |
||||||||||||
| Net (loss) income |
$ | (33,325 | ) | $ | 13,084 | $ | 25,787 | |||||
| Adjustments to reconcile net (loss) income to net cash (used in) provided by operating activities: |
||||||||||||
| Depreciation and amortization |
2,722 | 2,565 | 1,995 | |||||||||
| Provision for loan losses |
81,913 | 25,378 | 4,340 | |||||||||
| Stock based compensation expense |
630 | 597 | 427 | |||||||||
| Deferred tax benefit |
(15,539 | ) | (5,353 | ) | (2,087 | ) | ||||||
| Amortization of trust preferred securities discount |
257 | 64 | — | |||||||||
| Amortization of security premiums and accretion of discounts, net |
482 | (90 | ) | (394 | ) | |||||||
| Origination of loans held-for-sale |
(188,677 | ) | (80,622 | ) | (158,026 | ) | ||||||
| Sale of loans |
187,334 | 77,920 | 160,246 | |||||||||
| Gain on sale of loans |
1,071 | 820 | 1,236 | |||||||||
| Loss (gain) on the sale/valuation of OREO |
9,952 | — | (638 | ) | ||||||||
| Impairment loss on securities |
1,821 | — | — | |||||||||
| Provision for unfunded commitments |
2,960 | — | — | |||||||||
| Increase in other assets |
(52,908 | ) | (9,655 | ) | (1,216 | ) | ||||||
| Decrease in other liabilities |
(1,232 | ) | (308 | ) | (483 | ) | ||||||
| Decrease (increase) in accrued interest receivable |
56 | 857 | (2,136 | ) | ||||||||
| (Decrease) increase in accrued interest payable |
(4,146 | ) | (782 | ) | 3,018 | |||||||
| Net cash (used in) provided by operating activities |
$ | (6,628 | ) | $ | 24,475 | $ | 32,069 | |||||
| Supplemental Schedule of Noncash Investing Activities: |
||||||||||||
| Unrealized gain (loss) on securities |
$ | 1,653 | $ | (2,974 | ) | $ | 2,912 | |||||
| OREO transferred from loans |
$ | 33,461 | $ | 7,569 | $ | 1,862 | ||||||
| Loans made on the disposition of OREO |
$ | 3,400 | $ | — | $ | 2,500 | ||||||
See Notes to Consolidated Financial Statements.
36
Notes to Consolidated Financial Statements
Note 1. Nature of Banking Activities and Significant Accounting Policies
Business
On December 22, 1999, Virginia Commerce Bancorp, Inc. (the “Company”) became the holding company for Virginia Commerce Bank (the “Bank”). The Company acquired the Bank through a share exchange in which the stockholders of the Bank received one share of common stock of the Company for each share of common stock of the Bank. The exchange was a tax-free transaction for federal income tax purposes. The merger was accounted for on the same basis as a pooling-of-interests.
The Company provides loan and deposit products to commercial and retail customers in the Washington Metropolitan Area, with the primary emphasis on Northern Virginia. The loan portfolio is generally collateralized by assets of the customers and is expected to be re-paid from cash flows or proceeds from the sale of selected assets of the borrowers.
Principles of Consolidation
The consolidated financial statements include the accounts of the Company and its wholly owned subsidiaries, the Bank, VCBI Capital Trust II, VCBI Capital Trust III, VCBI Capital Trust IV, Northeast Land and Investment Company, Tombstone Land Company and Virginia Commerce Insurance Agency L.L.C. In consolidation, all significant intercompany accounts and transactions have been eliminated. Financial Accounting Standards Board (“FASB”) Accounting Standards Codification (“ASC”) 810 requires that the Company no longer eliminate through consolidation the equity investments in VCBI Capital Trust II, III and IV, by the parent company, Virginia Commerce Bancorp, Inc, which approximated $2.0 million at December 31, 2009. The subordinated debt of the trusts is reflected as a liability of the Company, and the common securities of the trusts as an other asset.
Risks and Uncertainties
In its normal course of business, the Company encounters two significant types of risk: economic and regulatory. There are three main components of economic risk: interest rate risk, credit risk and market risk. The Company is subject to interest rate risk to the degree that its interest-bearing liabilities mature or reprice more rapidly or on a different basis than its interest-earning assets. Credit risk is the risk of default on the Company’s loan portfolio that results from the borrowers’ inability or unwillingness to make contractually required payments. Market risk reflects changes in the value of collateral underlying loans receivable and the valuation of real estate held by the Company.
The determination of the allowance for loan losses is based on estimates that are particularly susceptible to significant changes in the economic environment and market conditions. Management believes that, as of December 31, 2009, the allowance for loan losses is adequate based on information currently available. A worsening or protracted economic decline or substantial increase in interest rates, would increase the likelihood of losses due to credit and market risks and could create the need for substantial increases to the allowance for loan losses. The Company is subject to the regulations of various regulatory agencies, which can change significantly from year to year. In addition, the Company undergoes periodic examinations by regulatory agencies, which may subject it to further changes based on the regulators’ judgments about information available to them at the time of their examination.
Securities
Investments in debt securities with readily determinable fair values are classified as either held-to-maturity or available-for-sale (“AFS”) based on management’s intent. Equity investments in the FHLB, the Federal Reserve Bank of Richmond and Community Bankers Bank are separately classified as restricted securities and are carried at cost. AFS securities are carried at estimated fair value with the corresponding unrealized gains and losses excluded from earnings and reported in other comprehensive income. Purchase premiums and discounts are recognized in interest income using the interest method over the terms of the securities.
Impairment of securities occurs when the fair value of a security is less than its amortized cost. For debt securities, impairment is considered other-than-temporary and recognized in its entirety in net income if either (i) we intend to sell the security or (ii) it is more likely than not that we will be required to sell the security before recovery of its amortized cost basis. If, however, we do not intend to sell the security and it is not more-than-likely that we will be
37
required to sell the security before recovery, we must determine what portion of the impairment is attributable to a credit loss, which occurs when the amortized cost of the security exceeds the present value of the cash flows expected to be collected from the security. If there is no credit loss, there is no other-than-temporary impairment. If there is a credit loss, other-than-temporary impairment exists, and the credit loss must be recognized in net income and the remaining portion of impairment must be recognized in other comprehensive income.
For equity securities carried at cost as restricted securities, impairment is considered to be other-than-temporary based on our ability and intent to hold the investment until a recovery of fair value. Other-than-temporary impairment of an equity security results in a write-down that must be included in income. We regularly review each security for other-than-temporary impairment based on criteria that include the extent to which costs exceeds market price, the duration of the market decline, the financial health of and specific prospects for the issuer, our best estimate of the present value of cash flows expected to be collected from debt securities, our intention with regard to holding the security to maturity and the likelihood that we would be required to sell the security before recovery.
Loans Held-for-Sale
Loans held-for-sale are carried at the lower of cost or market, determined in the aggregate. Market value considers commitment agreements with investors and prevailing market prices. Loans originated by the Company’s mortgage banking unit and held-for-sale to outside investors, are made on a pre-sold basis with servicing rights released. Gains and losses on sales of mortgage loans are recognized based on the difference between the selling price and the carrying value of the related mortgage loans sold.
Loans
The Company grants mortgage, commercial and consumer loans to customers. A substantial portion of the loan portfolio is represented by real estate loans. The ability of the Company’s debtors to honor their contracts is dependent upon the general economic conditions and real estate climate of the Company’s market area.
Loans that management has the intent and ability to hold for the foreseeable future or until maturity or pay-off are reported at their outstanding unpaid principal balances adjusted for the allowance for loan losses and any deferred fees or costs on originated loans. Interest income is accrued on the unpaid principal balance. Loan origination fees, net of certain origination costs, are deferred and recognized as an adjustment of the related loan yield using the interest method.
The accrual of interest on real estate and commercial loans is discontinued at the time the loan is 90 days delinquent unless the credit is well-secured and in the process of collection. Installment loans are typically charged-off no later than 180 days past due. In all cases, loans are placed on nonaccrual or charged-off at an earlier date if collection of principal or interest is considered doubtful.
All interest accrued but not collected for loans that are placed on nonaccrual or charged-off is reversed against interest income. The interest on these loans is accounted for on the cash-basis or cost-recovery method, until qualifying for return to accrual. Loans are returned to accrual status when all principal and interest amounts contractually due are brought current and future payments are reasonably assured.
Allowance for Loan Losses
The allowance for loan losses is established to address potential losses that could occur through a provision for loan losses charged to earnings. Loan losses are charged against the allowance when management believes the uncollectibility of a loan balance is confirmed. Subsequent recoveries, if any, are credited to the allowance.
The allowance for loan losses is evaluated on a regular basis by management and is based upon management’s periodic review of the collectability of the loans in light of historical experience, the nature and volume of the loan portfolio, adverse situations that may affect the borrower’s ability to repay, estimated value of any underlying collateral and prevailing economic conditions. This evaluation is inherently subjective as it requires estimates that are susceptible to significant revision as more information becomes available.
Our allowance for loan losses has two basic components: the specific allowance and the general allowance. Each of these components is determined based upon estimates that can and do change when the actual events occur. The specific allowance is used to individually allocate an allowance for loans identified as impaired. Impairment testing includes consideration of the borrower’s overall financial condition, resources and payment record, support available from financial guarantors and the fair market value of collateral.
38
A loan is considered impaired when, based on current information and events, it is probable that the Company will be unable to collect the scheduled payments of principal or interest when due according to the contractual terms of the loan agreement. Factors considered by management in determining impairment include payment status, collateral value, and the probability of collecting scheduled principal and interest payments when due. Loans that experience insignificant payment delays and payment shortfalls generally are not classified as impaired. Management determines the significance of payment delays and payment shortfalls on a case-by-case basis, taking into consideration all of the circumstances surrounding the loan and the borrower, including the length of the delay, the reasons for the delay, the borrower’s prior payment record, and the amount of the shortfall in relation to the principal and interest owed. Impairment is measured on a loan-by-loan basis for commercial and construction loans by either the present value of expected future cash flows discounted at the loan’s effective interest rate, the loan’s obtainable market price, or the fair value of the collateral if the loan is collateral dependent. These factors are combined to estimate the probability and severity of inherent losses. When impairment is identified, then a specific reserve may be established based on the Company’s calculation of the loss embedded in the individual loan. Large groups of smaller balance, homogeneous loans are collectively evaluated for impairment. Impaired loans which meet the criteria for substandard, doubtful and loss are segregated from performing loans within the portfolio. Internally classified loans are then grouped by loan type (commercial, commercial real estate, commercial construction, residential real estate, residential construction or installment). The general formula is used to estimate the loss of non-classified loans. These un-criticized loans are also segregated by loan type and allowance factors are assigned by management based on delinquencies, loss history, trends in volume and terms of loans, effects of changes in lending policy, the experience and depth of management, national and local economic trends, concentrations of credit, quality of the loan review system and the effect of external factors (i.e. competition and regulatory requirements). The factors assigned differ by loan type. The general allowance recognizes potential losses whose impact on the portfolio has yet to be recognized by a specific allowance. Allowance factors and the overall size of the allowance may change from period to period based on management’s assessment of the above described factors and the relative weights given to each factor. See Note 4 for information regarding the allowance for loan losses.
Bank Premises and Equipment
Premises and equipment are stated at cost less accumulated depreciation and amortization. Land is carried at cost. Furniture, fixtures, equipment and computer software are depreciated over their estimated useful lives, generally from three to seven years; leasehold improvements are depreciated over the term of the respective leases or the estimated useful life of the leasehold improvement. Depreciation and amortization are recorded on the straight-line method. Costs of maintenance and repairs are charged to expense as incurred. The costs of replacing structural parts of major units are considered individually and are expensed or capitalized as the facts dictate.
Other Real Estate Owned
Other real estate owned, or foreclosed real properties, that have been substantively repossessed or acquired in complete or partial satisfaction of debt, are held for resale, and carried at the lower of book value or fair value, including a reduction for estimated selling expenses, or principal balance of the related loan. The carrying value of a foreclosed asset is immediately adjusted down when new information is obtained, including a potentially acceptable offer, the sale of a similar property in the vicinity of one of the Company’s assets, and/or a change in the price the property is being listed for.
Income Taxes
Deferred income tax assets and liabilities are determined using the liability (or balance sheet) method. Under this method, the net deferred tax asset or liability is determined based on the tax effects of the temporary differences between book and tax bases of the various balance sheet assets and liabilities and gives current recognition to changes in tax rates and laws.
When tax returns are filed, it is highly certain that some positions taken would be sustained upon examination by the taxing authorities, while others are subject to uncertainty about the merits of the position taken or the amount of the position that would be ultimately sustained. The benefit of a tax position is recognized in the financial statements in the period during which, based on all available evidence, management believes it is more likely than not that the
39
position will be sustained upon examination, including the resolution of appeals or litigation processes, if any. Tax positions taken are not offset or aggregated with other positions. Tax positions that meet the more-likely-than-not recognition threshold are measured as the largest amount of tax benefit that is more than 50 percent likely of being realized upon settlement with the applicable taxing authority. The portion of the benefits associated with tax positions taken that exceeds the amount measured as described above is reflected as a liability for unrecognized tax benefits in the accompanying balance sheet along with any associated interest and penalties that would be payable to the taxing authorities upon examination. Interest and penalties associated with unrecognized tax benefits are classified as additional income taxes in the statement of income.
Advertising Cost
The Company follows the policy of charging the production costs of advertising to expense as incurred. Total advertising expense was $503 thousand, $437 thousand and $500 thousand in 2009, 2008 and 2007, respectively.
Use of Estimates
In preparing consolidated financial statements in conformity with accounting principles generally accepted in the United States of America, management is required to make estimates and assumptions that affect the reported amounts of assets and liabilities as of the date of the balance sheet and the reported amounts of revenues and expenses during the reported period. Actual results could differ from those estimates. Material estimates that are particularly susceptible to significant change in the near term relate to the determination of the allowance for loan losses, the valuation of deferred tax assets, fair value, impairment on securities and other real estate owned.
Rate Lock Commitments
The Company enters into commitments to originate mortgage loans whereby the interest rate on the loans is determined prior to funding (rate lock commitments). Rate lock commitments on mortgage loans that are intended to be sold are considered to be derivatives. The period of time between issuance of a loan commitment and closing and the sale of the loan generally ranges from thirty to ninety days. The Company protects itself from changes in interest rates through the use of best efforts forward delivery commitments, whereby the Company commits to sell a loan at the time the borrower commits to an interest rate with the intent that the buyer has assumed interest rate risk on the loan. As a result, the Company is not exposed to losses nor will it realize significant gains related to its rate lock commitments due to changes in interest rates. The correlation between the rate lock commitments and the best efforts contracts is very high due to their similarity. Because of this high correlation, no gain or loss occurs on the rate lock commitments.
Cash and Cash Equivalents
For purposes of reporting cash flows, cash and cash equivalents include cash on hand, amounts due from banks, and Federal funds sold. Generally, Federal funds are sold and purchased for one-day periods.
Earnings Per Share
Basic earnings per share represent income available to common stockholders divided by the weighted-average number of common shares outstanding during the period. Diluted earnings per share reflect additional common shares that would have been outstanding if dilutive potential common shares had been issued, as well as any adjustment to income that would result from the assumed issuance. Potential common shares that may be issued by the Company relate solely to outstanding stock options and warrants and are determined using the treasury method.
Comprehensive Income
Accounting principles generally require that recognized revenue, expenses, gains and losses be included in net income. Although certain changes in assets and liabilities, such as unrealized gains and losses on available-for-sale securities, are reported as a separate component of the equity section of the balance sheet. Such items, along with net income, are components of comprehensive income.
40
Recent Accounting Pronouncements
In June 2009, FASB issued new accounting guidance related to U.S. GAAP (FASB ASC 105, Generally Accepted Accounting Principles). This guidance establishes FASB ASC as the source of authoritative U.S. GAAP recognized by FASB to be applied by nongovernmental entities. Rules and interpretive releases of the SEC under authority of federal securities laws are also sources of authoritative U.S. GAAP for SEC registrants. FASB ASC supersedes all existing non-SEC accounting and reporting standards. All other nongrandfathered, non-SEC accounting literature not included in FASB ASC has become nonauthoritative. FASB will no longer issue new standards in the form of Statements, FASB Staff Positions or Emerging Issues Task Force Abstracts. Instead, it will issue Accounting Standards Updates (“ASU”), which will serve to update FASB ASC, provide background information about the guidance and provide the basis for conclusions on the changes to FASB ASC. FASB ASC is not intended to change U.S. GAAP.
The Company adopted new guidance impacting FASB Topic 805: Business Combinations (“Topic 805”) on January 1, 2009. This guidance requires the acquiring entity in a business combination to recognize the full fair value of assets acquired and liabilities assumed in the transaction (whether a full or partial acquisition); establishes the acquisition-date fair value as the measurement objective for all assets acquired and liabilities assumed; requires expensing of most transaction and restructuring costs; and requires the acquirer to disclose to investors and other users all of the information needed to evaluate and understand the nature and financial effect of the business combination. The adoption of the new guidance did not have a material impact on the Company’s consolidated financial statements.
In April 2009, the FASB issued new guidance impacting Topic 805. This guidance addresses application issues raised by preparers, auditors, and members of the legal profession on initial recognition and measurement, subsequent measurement and accounting, and disclosure of assets and liabilities arising from contingencies in a business combination. This guidance was effective for business combinations entered into on or after January 1, 2009. This guidance did not have a material impact on the Company’s consolidated financial statements.
In April 2009, the FASB issued new guidance impacting FASB Topic 820: Fair Value Measurements and Disclosures (“Topic 820”). This interpretation provides additional guidance for estimating fair value when the volume and level of activity for the asset or liability have significantly decreased. This also includes guidance on identifying circumstances that indicate a transaction is not orderly and requires additional disclosures of valuation inputs and techniques in interim periods and defines the major security types that are required to be disclosed. This guidance was effective for interim and annual periods ending after June 15, 2009, and should be applied prospectively. The adoption of the standard did not have a material impact on the Company’s consolidated financial statements.
In April 2009, the FASB issued new guidance impacting FASB Topic 320-10: Investments – Debt and Equity Securities. This guidance amends GAAP for debt securities to make the guidance more operational and to improve the presentation and disclosure of other-than-temporary impairments on debt and equity securities in the financial statements. This guidance was effective for interim and annual periods ending after June 15, 2009, with earlier adoption permitted for periods ending after March 15, 2009. The Company did not have any cumulative effect adjustment related to the adoption of this guidance. The additional disclosures required are included in the consolidated Statements of Operations and in Note 2 to the consolidated financial statements.
In May 2009, the FASB issued new guidance impacting FASB Topic 855: Subsequent Events. This update provides guidance on management’s assessment of subsequent events that occur after the balance sheet date through the date that the financial statements are issued. This guidance is generally consistent with current accounting practice. In addition, it requires certain additional disclosures. This guidance was effective for periods ending after June 15, 2009 and had no impact on the Company’s consolidated financial statements.
In August 2009, the FASB issued new guidance impacting Topic 820. This guidance is intended to reduce ambiguity in financial reporting when measuring the fair value of liabilities. This guidance was effective for the first reporting period (including interim periods) after issuance and had no impact on the Company’s consolidated financial statements.
In September 2009, the FASB issued new guidance impacting Topic 820. This creates a practical expedient to measure the fair value of an alternative investment that does not have a readily determinable fair value. This guidance also requires certain additional disclosures. This guidance is effective for interim and annual periods ending after December 15, 2009. The adoption of the new guidance did not have a material impact on the consolidated financial statements.
41
In October 2009, the FASB issued ASU 2009-15, Accounting for Own-Share Lending Arrangements in Contemplation of Convertible Debt Issuance or Other Financing. ASU 2009-15 amends Subtopic 470-20 to expand accounting and reporting guidance for own-share lending arrangements issued in contemplation of convertible debt issuance. ASU 2009-15 is effective for fiscal years beginning on or after December 15, 2009 and interim periods within those fiscal years for arrangements outstanding as of the beginning of those fiscal years. The adoption of ASU 2009-15 did not have a material impact on the consolidated financial statements.
Accounting Standards Not Yet Effective
In June 2009, the FASB issued new guidance relating to the accounting for transfers of financial assets. The new guidance, which was issued as SFAS No. 166, Accounting for Transfers of Financial Assets, an amendment to SFAS No. 140, was adopted into Codification in December 2009 through the issuance of ASU 2009-16. The new standard provides guidance to improve the relevance, representational faithfulness, and comparability of the information that an entity provides in its financial statements about a transfer of financial assets; the effects of a transfer on its financial position, financial performance, and cash flows; and a transferor’s continuing involvement, if any, in transferred financial assets. The Company will adopt the new guidance in 2010 and is evaluating the impact, if any, it will have on its consolidated financial statements.
In June 2009, the FASB issued new guidance relating to variable interest entities. The new guidance, which was issued as SFAS No. 167, Amendments to FASB Interpretation No. 46(R), was adopted into the Codification in December 2009. The objective of the guidance is to improve financial reporting by enterprises involved with variable interest entities and to provide more relevant and reliable information to users of financial statements. SFAS No. 167 is effective as of January 1, 2010. The Company does not expect the adoption of the new guidance to have a material impact on its consolidated financial statements.
In January 2010, the FASB issued ASU 2010-01, Equity (Topic 505): Accounting for Distributions to Shareholders with Components of Stock and Cash – a consensus of the FASB Emerging Issues Task Force. ASU 2010-01 clarifies that the stock portion of a distribution to shareholders that allows them to elect to receive cash or stock with a potential limitation on the total amount of cash that all shareholders can elect to receive in the aggregate is considered a share issuance that is reflected in EPS prospectively and is not a stock dividend. ASU 2010-01 is effective for interim and annual periods ending on or after December 15, 2009 and should be applied on a retrospective basis. The Company does not expect the adoption of ASU 2010-01 to have a material impact on its consolidated financial statements.
In January 2010, the FASB issued ASU 2010-02, Consolidation (Topic 810): Accounting and reporting for Decreases in Ownership of a Subsidiary – a Scope Clarification. ASU 2010-02 amends Subtopic 810-10 to address implementation issues related to changes in ownership provisions including clarifying the scope of the decrease in ownership and additional disclosures. ASU 2010-02 is effective beginning in the period that an entity adopts Statement 160. If an entity has previously adopted Statement 160, ASU 2010-02 is effective beginning in the first interim or annual reporting period ending on or after December 15, 2009 and should be applied retrospectively to the first period Statement 160 was adopted. The Company does not expect the adoption of ASU 2010-02 to have a material impact on its consolidated financial statements.
In January 2010, the FASB issued ASU 2010-04, Accounting for Various Topics – Technical Corrections to SEC Paragraphs. ASU 2010-04 makes technical corrections to existing SEC guidance including the following topics: accounting for subsequent investments, termination of an interest rate swap, issuance of financial statements - subsequent events, use of residential method to value acquired assets other than goodwill, adjustments in assets and liabilities for holding gains and losses, and selections of discount rate used for measuring defined benefit obligation. The Company does not expect the adoption of ASU 2010-04 to have a material impact on its consolidated financial statements.
In January 2010, the FASB issued ASU 2010-05, Compensation – Stock Compensation (Topic 718): Escrowed Share Arrangements and the Presumption of Compensation. ASU 2010-05 updates existing guidance to address the SEC staff’s views on overcoming the presumption that for certain shareholders escrowed share arrangements represent compensation. The Company does not expect the adoption of ASU 2010-05 to have a material impact on its consolidated financial statements.
42
In January 2010, the FASB issued ASU No. 2010-06, Fair Value Measurements and Disclosures (Topic 820): Improving Disclosures about Fair Value Measurements. ASU 2010-06 amends Subtopic 820-10 to clarify existing disclosures, require new disclosures, and includes conforming amendments to guidance on employers’ disclosures about postretirement benefit plan assets. ASU 2010-06 is effective for interim and annual periods beginning after December 15, 2009, except for disclosures about purchases, sales, issuances, and settlements in the roll forward of activity in Level 3 fair value measurements. Those disclosures are effective for fiscal years beginning after December 15, 2010 and for interim periods within those fiscal years. The Company does not expect the adoption of ASU 2010-06 to have a material impact on its consolidated financial statements.
In February 2010, the FASB issued ASU 2010-08, Technical Corrections to Various Topics. ASU 2010-08 clarifies guidance on embedded derivatives and hedging. ASU 2010-08 is effective for interim and annual periods beginning after December 15, 2009. The Company does not expect the adoption of ASU 2010-08 to have a material impact on its consolidated financial statements.
Stockholders’ Equity
A 10% stock dividend was declared on March 26, 2008. This transaction was recorded by increasing common stock by $2.4 million, increasing surplus by $20.1 million and decreasing retained earnings by $22.5 million.
A 10% stock dividend was declared on March 28, 2007. This transaction was recorded by increasing common stock by $2.2 million, increasing surplus by $41.1 million and decreasing retained earnings by $43.3 million.
Note 2. Securities
Amortized cost and fair value of the securities available-for-sale and held-to-maturity as of December 31, 2009 and 2008, are as follows (dollars in thousands):
| December 31, 2009 |
Amortized Cost |
Gross Unrealized Gains |
Gross Unrealized (Losses) |
Fair Value | |||||||||
| Available-for-sale: |
|||||||||||||
| U.S. Government Agency obligations |
$ | 242,129 | $ | 6,004 | $ | (999 | ) | $ | 247,134 | ||||
| Pooled trust preferred securities |
7,241 | — | (5,211 | ) | 2,030 | ||||||||
| Obligations of states and political subdivisions |
41,610 | 873 | (126 | ) | 42,357 | ||||||||
| $ | 290,980 | $ | 6,877 | $ | (6,336 | ) | $ | 291,521 | |||||
| Held-to-maturity: |
|||||||||||||
| U.S. Government Agency obligations |
$ | 12,323 | $ | 430 | $ | — | $ | 12,753 | |||||
| Obligations of state and political subdivisions |
44,741 | 821 | — | 45,562 | |||||||||
| $ | 57,064 | $ | 1,251 | $ | — | $ | 58,315 | ||||||
| December 31, 2008 |
Amortized Cost |
Gross Unrealized Gains |
Gross Unrealized (Losses) |
Fair Value | |||||||||
| Available-for-sale: |
|||||||||||||
| U.S. Government Agency obligations |
$ | 230,497 | $ | 4,951 | $ | (14 | ) | $ | 235,434 | ||||
| Pooled trust preferred securities |
8,817 | — | (4,869 | ) | 3,948 | ||||||||
| Obligations of states and political subdivisions |
30,637 | 49 | (1,232 | ) | 29,454 | ||||||||
| $ | 269,951 | $ | 5,000 | $ | (6,115 | ) | $ | 268,836 | |||||
| Held-to-maturity: |
|||||||||||||
| U.S. Government Agency obligations |
$ | 18,764 | $ | 347 | $ | — | $ | 19,111 | |||||
| Obligations of state and political subdivisions |
38,143 | 614 | (9 | ) | 38,748 | ||||||||
| $ | 56,907 | $ | 961 | $ | (9 | ) | $ | 57,859 | |||||
43
The amortized cost and fair value of the securities, as of December 31, 2009, by contractual maturity, are shown below (dollars in thousands):
| December 31, 2009 |
Amortized Cost | Fair Value | ||||
| Available-for-sale: |
||||||
| Due within one year |
$ | 80 | $ | 82 | ||
| Due after one year through five years |
13,443 | 13,758 | ||||
| Due after five years through ten years |
98,437 | 99,676 | ||||
| Due after ten years |
179,020 | 178,005 | ||||
| $ | 290,980 | $ | 291,521 | |||
| Held-to-maturity: |
||||||
| Due within one year |
$ | 4,459 | $ | 4,510 | ||
| Due after one year through five years |
14,255 | 14,576 | ||||
| Due after five years through ten years |
11,069 | 11,366 | ||||
| Due after ten years |
27,281 | 27,863 | ||||
| $ | 57,064 | $ | 58,315 | |||
The amortized cost of securities pledged as collateral for repurchase agreements, certain public deposits, and other purposes were $252.7 million and $280.0 million at December 31, 2009 and 2008, respectively.
Management evaluates securities for other-than-temporary impairment at least on a quarterly basis, and more frequently when economic or market concerns warrant such evaluation. An impairment is considered to be other-than-temporary if the Company (1) intends to sell the security, (2) more likely than not will be required to sell the security before recovering its cost, or (3) does not expect to recover the security’s entire amortized cost basis.
Provided below is a summary of all securities which were in an unrealized loss position at December 31, 2009, that were evaluated for other-than-temporary impairment, and deemed to not have an other-than-temporary impairment. Presently, the Company does not intend to sell any of these securities, will not be required to sell these securities, and expects to recover the entire amortized cost of all the securities. For U.S. Government Agency and obligations of states/political subdivisions, the unrealized losses result from market or interest rate risk, while the unrealized losses pertaining to the pooled trust preferred securities are due to both performance and credit ratings.
| Less Than 12 Months | 12 Months or Longer | Total | |||||||||||||||||||
| At December 31, 2009 (Dollars in thousands) |
Fair Value |
Unrealized Losses |
Fair Value |
Unrealized Losses |
Fair Value |
Unrealized Losses |
|||||||||||||||
| Available-for-sale: |
|||||||||||||||||||||
| U.S. Government Agency obligations |
$ | 70,876 | $ | (999 | ) | $ | — | $ | — | $ | 70,876 | $ | (999 | ) | |||||||
| Pooled trust preferred securities |
— | — | 2,030 | (5,211 | ) | 2,030 | (5,211 | ) | |||||||||||||
| Obligations of states/political subdivisions |
8,182 | (57 | ) | 2,031 | (69 | ) | 10,213 | (126 | ) | ||||||||||||
| $ | 79,058 | $ | (1,056 | ) | $ | 4,061 | $ | (5,280 | ) | $ | 83,119 | $ | (6,336 | ) | |||||||
44
| Less Than 12 Months | 12 Months or Longer | Total | |||||||||||||||||||
| At December 31, 2008 (Dollars in thousands) |
Fair Value |
Unrealized Losses |
Fair Value |
Unrealized Losses |
Fair Value |
Unrealized Losses |
|||||||||||||||
| Available-for-sale: |
|||||||||||||||||||||
| U.S. Government Agency obligations |
$ | 5,947 | $ | (14 | ) | $ | — | $ | — | $ | 5,947 | $ | (14 | ) | |||||||
| Pooled trust preferred securities |
— | — | 3,948 | (4,869 | ) | 3,948 | (4,869 | ) | |||||||||||||
| Obligations of states/political subdivisions |
26,471 | (1,232 | ) | — | — | 26,471 | (1,232 | ) | |||||||||||||
| $ | 32,418 | $ | (1,246 | ) | $ | 3,948 | $ | (4,869 | ) | $ | 36,366 | $ | (6,115 | ) | |||||||
| Held-to-maturity: |
|||||||||||||||||||||
| Obligations of states/political subdivisions |
$ | 2,134 | $ | (9 | ) | $ | — | $ | — | $ | 2,134 | $ | (9 | ) | |||||||
As of December 31, 2009, the Company had three pooled trust preferred securities that were deemed to be other-than-temporarily impaired (“OTTI”) based on a present value analysis of expected future cash flows. These securities had a fair value of $1.1 million and an other-than-temporary impairment loss of $5.1 million, of which $3.3 million was recognized in other comprehensive loss, and $1.8 million was recognized in earnings. The following table provides further information on these three securities as of December 31, 2009 (in thousands):
| Security |
Class | Current Moody’s Ratings (Lowest Assigned Rating) |
Par Value |
Book Value/ Fair Value |
Unrealized Loss |
Current Defaults and Deferrals |
% of Current Defaults and Deferrals to Current Collateral |
Excess Sub (1) |
Estimated Incremental Defaults Required to Break Yield (2) |
Cumulative Other Comprehensive Loss (3) |
Amount of OTTI Related to Credit Loss (3) | |||||||||||||||||||
| PreTSL VI |
Mez | Caa1 | $ | 520 | $ | 301 | $ | 219 | $ | 25,000 | 61 | % | -24.09 | % | BROKEN | $ | 151 | $ | 68 | |||||||||||
| PreTSL X |
B-1 | Ca | 2,018 | 313 | 1,705 | 174,125 | 34 | % | -30.63 | % | BROKEN | 709 | 996 | |||||||||||||||||
| PreTSL XXVI |
C-2 | Ca | 3,677 | 465 | 3,212 | 221,500 | 23 | % | -10.85 | % | BROKEN | 2,455 | 757 | |||||||||||||||||
| Total |
$ | 6,215 | $ | 1,079 | $ | 5,136 | $ | 3,315 | $ | 1,821 | ||||||||||||||||||||
As of December 31, 2009, the Company had one pooled trust preferred security that was deemed to be temporarily impaired based on a present value analysis of expected future cash flows. The security had a fair value of $951 thousand. The following table provides further information on this security as of December 31, 2009 (in thousands):
| Security |
Class | Current Moody’s Ratings (Lowest Assigned Rating) |
Par Value |
Book Value/ Fair Value |
Unrealized Loss |
Current Defaults and Deferrals |
% of Current Defaults and Deferrals to Current Collateral |
Excess Sub (1) |
Estimated Incremental Defaults Required to Break Yield (2) |
Cumulative Other Comprehensive Loss (3) |
Amount of OTTI Related to Credit Loss (3) | |||||||||||||||||||
| PreTSL XXVII |
B | B3 | $ | 2,847 | $ | 51 | $ | 1,896 | $ | 65,300 | 20 | % | 5.35 | % | $ | 70,500 | $ | 1,896 | — | |||||||||||
| (1) | Excess subordination is the difference between the remaining performing collateral and the amount of bonds outstanding that are pari passu and senior to the class the Company owns. Negative excess subordination indicates there is not enough performing collateral in the pool to cover the outstanding balance of all classes senior to those the Company owns. |
| (2) | A break in yield for a given class means that defaults/deferrals have reached such a level that the class would not receive all of its contractual cash flows (principal and interest) by maturity (so that it is not just a temporary interest shortfall, but an actual loss in yield on the investment). This represents additional defaults beyond those assumed in our cash flow modeling. |
| (3) | Pre-tax. |
45
The following table presents a roll-forward of the credit loss component amount of OTTI recognized in earnings:
| (in thousands) |
Year-ended December 31, 2009 | ||
| Balance, beginning of period |
$ | — | |
| Additions: |
|||
| Initial credit impairments |
1,821 | ||
| Subsequent credit impairments |
— | ||
| Balance, end of period |
$ | 1,821 | |
Management has evaluated each of these securities for potential impairment under ASC 325 Investments-Other and the most recently issued guidance, and has reviewed each of the issues’ collateral participants most recent earnings, capital and loan loss reserve levels, and non-performing loan levels to estimate a future deferral and default rate in basis points for the remaining life of each security. For 2009, we used 75 basis points for all four securities in expected deferrals and defaults as a percentage of remaining collateral for future periods. In performing a detailed present value cash flow analysis for each security, the deferral and default rate was treated the same. If this analysis results in a present value of expected cash flows that is less than the amortized cost basis of a security (that is, a credit loss exists), an OTTI is considered to have occurred. If there is no credit loss, any impairment is considered temporary. The cash flow analysis we performed used discount rates equal to the credit spread at the time of purchase for each security and then added the current 3-month LIBOR spot rate. The analysis also assumed 15% recoveries on deferrals after two years and prepayments of 1% per year on each security. As of December 31, 2009, there were 4 out of 5 performing banks in PreTSL VI, 41 out of 57 in PreTSL X, 14 out of 64 in PreTSL XXVI, and 31 out of 42 in PreTSL XXVII.
Our investment in FHLB stock totaled $6.0 million at December 31, 2009. FHLB stock is generally viewed as a long-term investment and as a restricted security, which is carried at cost, because there is no market for the stock, other than FHLBs or member institutions. Therefore, when evaluating FHLB stock for impairment, its value is based on the ultimate recoverability of the par value rather than by recognizing temporary declines in value. Despite the FHLB’s temporary suspension of repurchases of excess stock in 2009, we do not consider this investment to be other-than-temporarily impaired at December 31, 2009, and no impairment has been recognized. FHLB stock is shown in restricted securities on the balance sheet and is not part of the AFS securities portfolio.
Note 3. Loans
Major classifications of loans, excluding loans held-for-sale, are summarized as follows (dollars in thousands):
| 2009 | 2008 | |||||
| Commercial |
$ | 238,327 | $ | 279,470 | ||
| Real estate - 1-4 family residential |
406,734 | 357,253 | ||||
| Real estate - multifamily residential |
66,799 | 66,611 | ||||
| Real estate - non-farm, nonresidential |
1,125,945 | 1,011,325 | ||||
| Real estate - construction |
428,292 | 585,076 | ||||
| Consumer |
10,368 | 11,698 | ||||
| Farmland |
2,675 | 2,498 | ||||
| Total Loans |
$ | 2,279,140 | $ | 2,313,931 | ||
| Less unearned income |
3,924 | 4,370 | ||||
| Less allowance for loan losses |
65,152 | 36,475 | ||||
| Loans, net |
$ | 2,210,064 | $ | 2,273,086 | ||
As of December 31, 2009 and 2008, there were $674 thousand and $2.4 million, respectively, in checking account overdrafts that were reclassified on the consolidated balance sheets as loans.
46
Note 4. Allowance for Loan Losses
An analysis of the allowance for loan losses for the years ended December 31, 2009, 2008 and 2007 is shown below (dollars in thousands):
| 2009 | 2008 | 2007 | ||||||||||
| Allowance, at beginning of period |
$ | 36,475 | $ | 22,260 | $ | 18,101 | ||||||
| Provision charged against income |
81,913 | 25,378 | 4,340 | |||||||||
| Recoveries added to reserve |
1,377 | 158 | 31 | |||||||||
| Losses charged to reserve |
(54,613 | ) | (11,321 | ) | (212 | ) | ||||||
| Allowance, at end of period |
$ | 65,152 | $ | 36,475 | $ | 22,260 | ||||||
Information about impaired loans as of and for the years ended December 31, 2009, 2008 and 2007, is as follows (dollars in thousands):
| 2009 | 2008 | 2007 | |||||||
| Non-accrual loans for which a specific allowance has been provided |
$ | 34,572 | $ | 74,843 | $ | 3,826 | |||
| Non-accrual loans for which no specific allowance has been provided |
31,237 | 36,391 | — | ||||||
| Other impaired loans for which a specific allowance has been provided |
117,384 | 14,515 | 15,232 | ||||||
| Other impaired loans for which no specific allowance has been provided |
54,438 | 34,794 | 212 | ||||||
| Total impaired loans |
$ | 237,631 | $ | 160,543 | $ | 19,270 | |||
| Allowance provided for impaired loans, included in the allowance for loan losses |
$ | 30,847 | $ | 17,614 | $ | 1,228 | |||
| Average balance in impaired loans |
$ | 214,421 | $ | 92,062 | $ | 17,404 | |||
| Interest income recognized |
$ | 6,238 | $ | 2,932 | $ | 934 | |||
In performing a specific reserve analysis on all impaired loans as of December 31, 2009, current third party appraisals were used with respect to approximately 65% of impaired loans to assist with the evaluation of collateral values for the purpose of establishing specific reserves. When a loan is identified as impaired and collateral dependent, a current evaluation of collateral value via third party appraisal or other valuation methodology is conducted within the calendar quarter of identification when possible but, not less than 90 days after identification. Charge-offs and specific reserves are established upon determination of collateral value. During the interim between identification of an impaired loan and receipt of a current appraisal of the related collateral, specific reserves are established based upon interim methodologies including discounted cash flow analysis, tax assessment values and review of market comparables. In general, variances between charge-offs and fair value of collateral is limited to estimates of projected costs of sale. Costs of sale are estimated at 10% of value. Partially charged-off loans remain non-performing until such time as a viable restructuring plan is developed. Upon execution of a forbearance agreement including modified terms, an impaired loan will be re-classified from non-performing to a troubled debt restructuring, but will continue to be identified as impaired until the loan performs under the modified terms for the remainder of the calendar year in which it was restructured, but not less than 90 days. As noted above, in the majority of cases, external appraisals are used to establish fair value of the related collateral. In the interim prior to receipt of a current appraisal or in those situations where a current appraisal is not deemed practical or necessary, discounted cash flow analysis, tax assessment values, review of market comparables and other methodologies are used to establish fair value. Impaired loans which do not have a specific reserve are those loans which have been identified to have sufficient collateral coverage, based upon the fair value of collateral, to repay the entire principal balance due from collateral liquidation.
There were $3.8 million, $6.1 million and $579 thousand in loans past due 90 days or more, and still accruing interest at December 31, 2009, 2008 and 2007, respectively, not classified as impaired loans.
47
Note 5. Bank Premises and Equipment, Net
Premises and equipment are stated at cost less accumulated depreciation at December 31, 2009 and 2008, as follows (dollars in thousands):
| 2009 | 2008 | |||||
| Land |
$ | 1,839 | $ | 1,839 | ||
| Buildings |
2,592 | 2,316 | ||||
| Furniture, fixtures and equipment |
15,899 | 14,814 | ||||
| Leasehold improvements |
10,349 | 7,985 | ||||
| Construction in progress |
67 | 2,110 | ||||
| Total cost |
$ | 30,746 | $ | 29,064 | ||
| Less accumulated depreciation and amortization |
16,952 | 14,324 | ||||
| Net premises and equipment |
$ | 13,794 | $ | 14,740 | ||
Depreciation and amortization expense on premises and equipment amounted to $2.7 million, $2.6 million and $2.0 million in 2009, 2008 and 2007, respectively.
Note 6. Time Deposits
The aggregate amount of time deposits with a minimum denomination of $100 thousand each was approximately $298.5 million and $547.7 million at December 31, 2009 and 2008, respectively. The Bank obtains certain deposits through the efforts of third-party brokers. At December 31, 2009 and 2008, brokered deposits totaled $50.1 million and $168.3 million, respectively and were included in time deposits on the Bank’s balance sheets. Scheduled maturities of all time deposits at December 31, 2009, are as follows (dollars in thousands):
| 2010 |
$ | 821,197 | |
| 2011 |
82,921 | ||
| 2012 |
46,691 | ||
| 2013 |
11,275 | ||
| 2014 |
42,487 | ||
| $ | 1,004,571 | ||
Note 7. Securities Sold Under Agreements To Repurchase and Federal Funds Purchased
Securities sold under agreements to repurchase, which are classified as secured borrowings, represent both funds of significant commercial demand deposit customers, which mature one day from the transaction date, and secured transactions with other banks. As of December 31, 2009, the Company had $101.7 million in funds from customers and $75 million in funds from other banks. Of this $75 million, $25 million matures on March 22, 2014, and $50 million matures on May 2, 2018. Both of these transactions are callable by the other bank on any quarterly interest payment date. At December 31, 2008, customers’ funds were $101 million and the same $75 million in funds from other banks were outstanding. Securities sold under agreements to repurchase are reflected at the amount of cash received and are collateralized by securities in the Company’s investment securities portfolio. As of December 31, 2009, there were no Federal funds purchased and there were $12 million outstanding at December 31, 2008.
Note 8. Income Taxes
The Company files income tax returns in the U.S. federal jurisdiction and the state of Virginia. With few exceptions, the Company is no longer subject to U.S. federal and state income tax examinations by tax authorities for years prior to 2006.
48
Net deferred tax assets consist of the following components at December 31, 2009 and 2008 (dollars in thousands):
| 2009 | 2008 | |||||
| Deferred tax assets: |
||||||
| Allowance for loan losses |
$ | 22,803 | $ | 12,766 | ||
| OREO fair value adjustment |
1,750 | — | ||||
| OREO taxable gain |
1,168 | — | ||||
| Provision for unfunded commitment |
1,036 | — | ||||
| Bank premises and equipment |
927 | 648 | ||||
| Impairment on securities |
637 | — | ||||
| Securities available-for-sale |
— | 390 | ||||
| Accrued rents |
335 | 283 | ||||
| Deferred compensation |
123 | 223 | ||||
| Non-accrual loans |
455 | 109 | ||||
| OREO expense |
373 | 65 | ||||
| Non-qualified incentive stock options |
81 | 55 | ||||
| $ | 29,688 | $ | 14,539 | |||
| Deferred tax liabilities: |
||||||
| Securities available-for-sale |
$ | 189 | $ | — | ||
| Federal Home Loan Bank stock |
2 | 2 | ||||
| $ | 191 | $ | 2 | |||
| Net deferred tax assets |
$ | 29,497 | $ | 14,537 | ||
The provision (benefit) for income tax and its components for the years ending December 31, 2009, 2008, and 2007 are as follows (dollars in thousands):
| December 31, |
2009 | 2008 | 2007 | |||||||||
| Current tax (benefit) expense |
$ | (2,865 | ) | $ | 11,584 | $ | 15,306 | |||||
| Deferred tax benefit |
(15,539 | ) | (5,353 | ) | (2,087 | ) | ||||||
| $ | (18,404 | ) | $ | 6,231 | $ | 13,219 | ||||||
The income tax (benefit) provision differs from the amount of income tax determined by applying the U.S. Federal income tax rate to pretax income from continuing operations for the years ended December 31, 2009, 2008 and 2007 due to the following (dollars in thousands):
| December 31, |
2009 | 2008 | 2007 | |||||||||
| Computed “expected” tax (benefit) expense at 35% |
$ | (18,105 | ) | $ | 6,760 | $ | 13,652 | |||||
| Increase (decrease) in income taxes resulting from: |
||||||||||||
| Nondeductible expense |
543 | 337 | 274 | |||||||||
| Nontaxable income |
(842 | ) | (866 | ) | (707 | ) | ||||||
| $ | (18,404 | ) | $ | 6,231 | $ | 13,219 | ||||||
Note 9. (Loss) Earnings Per Common Share
The following shows the weighted average number of shares used in computing (loss) earnings per share and the effect on the weighted average number of shares of diluted potential common stock. For the years reported, the weighted average number of shares have been adjusted to give effect to stock dividends and splits. Potential dilutive common stock had no effect on income available to common stockholders.
49
| 2009 | 2008 | 2007 | ||||||||||||||
| Shares | Per Common Share Amount |
Shares | Per Common Share Amount |
Shares | Per Common Share Amount | |||||||||||
| Basic (loss) earnings per common share |
26,692,570 | $ | (1.42 | ) | 26,555,484 | $ | 0.48 | 26,323,242 | $ | 0.98 | ||||||
| Effect of dilutive securities: |
||||||||||||||||
| Stock options and warrants |
— | 694,355 | 1,055,962 | |||||||||||||
| Diluted (loss) earnings per common share |
26,692,570 | $ | (1.42 | ) | 27,249,839 | $ | 0.47 | 27,379,204 | $ | 0.95 | ||||||
Stock options for 1,307,291, 1,034,458 and 588,049 shares of common stock were not included in computing diluted earnings per share in 2009, 2008 and 2007, respectively, because their effects were anti-dilutive. Warrants for 4,196,202 and 1,500,000 shares of common stock were not included in computing earnings per share in 2009 and 2008, because their effects were also anti-dilutive.
Note 10. Commitments and Contingencies
The Company leases office space for twenty-five of its branch locations, its operations, mortgage lending, and construction lending departments. These non-cancellable agreements, which expire through December 2032, in some instances require payment of certain operating charges. Generally, all leases contain renewal options of one to three additional five-year terms. The total minimum lease commitment, adjusted for the effect of annual fixed increases or the Consumer Price Index, at December 31, 2009, is $34.0 million, due as follows (dollars in thousands):
| Due in the year ending December 31, |
2010 | $ | 3,985 | ||
| 2011 | 3,800 | ||||
| 2012 | 3,885 | ||||
| 2013 | 3,862 | ||||
| 2014 | 3,508 | ||||
| Thereafter | 14,994 |
The total lease expense was $5.0 million, $4.2 million and $3.1 million in 2009, 2008 and 2007, respectively. In the normal course of business, the Company makes various commitments and incurs certain contingent liabilities that are not presented in the accompanying financial statements. The Company does not anticipate any material losses as a result of the commitments and contingent liabilities.
Note 11. Loans to Officers and Directors
Officers, directors and/or their related business interests are loan customers in the ordinary course of business. In management’s opinion, these loans are made on substantially the same terms as those prevailing at the time for comparable loans with other persons and do not involve more than normal risk of collectability or present other unfavorable features. The aggregate amount outstanding on such loans at December 31, 2009 and 2008, was $35.6 million and $22.8 million, respectively. During 2009, new loans and advances amounted to $13.6 million and repayments of $775 thousand were made.
Note 12. Stock Option Plan
The Company’s current plan, adopted May 29, 1998, and amended and restated in April 2007 (the “1998 Stock Option Plan”), is a qualified incentive stock option plan, that is shareholder approved, and provides for the granting of options to purchase up to 2,377,158 shares of common stock at a price to be determined by the Board of Directors at the date of grant, but in any event no less than 100% of the fair market value. Options outstanding prior to May 29, 1998 were granted under the Company’s plan adopted in 1988 which was replaced by the current plan. Options are awarded to employees and the Board of Directors of the Company at the discretion of the Board of Directors, and expire no more than ten years from the grant date. Options granted under the current plan, through December 31, 2002, vested over three years, while options granted since December 31, 2002, vested over five years.
50
Included in salaries and employee benefits expense for the year ended December 31, 2009, is $630 thousand of stock-based compensation expense which is based on the estimated fair value of 758,393 options granted between January 2006 and December 2009, amortized on a straight-line basis over a five year requisite service period. As of December 31, 2009, there was $1.3 million remaining of total unrecognized compensation expense related to these option awards which will be recognized over the remaining requisite service period. There was $597 thousand and $427 thousand in stock option expense in 2008 and 2007, respectively.
The fair value of each grant is estimated at the grant date using the Black-Scholes option-pricing model and using the assumptions noted in the following table. Expected volatility is based on the historical volatility of the Company’s stock and the risk-free rate is based on the U.S. Treasury yield curve in effect at the time of grant. During 2006, the Company took into consideration current accounting guidance when reviewing and updating assumptions. The weighted average expected option term for 2007 reflects the application of the simplified method, which defines the life as the average of the contractual term of the options and the weighted average vesting period for all option tranches. For 2009 and 2008, the Company used a 7.2 year expected term based on analysis of past exercise behaviors.
| 2009 |
2008 |
2007 | ||||
| Expected volatility |
30.59% | 23.14% | 23.59% | |||
| Expected dividends |
.00% | .00% | .00% | |||
| Expected term (in years) |
7.2 | 7.2 | 7.5 | |||
| Risk-free rate |
2.14% to 3.34% | 2.53% to 3.80% | 3.70% to 4.93% |
A summary of option activity under the plan as of December 31, 2009, and changes during the year then ended is presented below:
| Options |
Number of Shares |
Weighted- Average Exercise Price |
Weighted- Average Remaining Contractual Term |
Aggregate Intrinsic Value ($000) | |||||||
| Outstanding at December 31, 2008 |
2,035,458 | $ | 7.73 | ||||||||
| Granted |
148,709 | 4.25 | |||||||||
| Exercised |
(168,976 | ) | 1.44 | ||||||||
| Forfeited |
(98,332 | ) | 10.67 | ||||||||
| Outstanding at December 31, 2009 |
1,916,859 | 7.86 | 4.4 years | $ | — | ||||||
| Exercisable at December 31, 2009 |
1,470,924 | 7.08 | 3.3 years | $ | — | ||||||
The weighted-average grant date fair value of options granted during the years 2009, 2008 and 2007 was $1.53, $3.78 and $6.74, respectively. The total intrinsic value of options exercised during the years ended December 31, 2009, 2008 and 2007, was $568 thousand, $927 thousand, and $4.3 million, respectively.
A further summary about the options outstanding and exercisable at December 31, 2009, is provided in the following table:
| Options Outstanding | Options Exercisable | |||||||||||||
| Range of Exercise |
Number Outstanding |
Remaining Contractual Life |
Weighted Average Exercise Price |
Number Exercisable |
Remaining Contractual Life |
Weighted Average Exercise Price | ||||||||
| $1.00 to $2.31 | 384,711 | 0.6 years | $ | 1.50 | 384,711 | 0.6 years | $ | 1.50 | ||||||
| $2.80 to $5.46 | 582,606 | 4.2 years | 3.81 | 439,765 | 2.6 years | 3.66 | ||||||||
| $5.47 to $7.82 | 5,670 | 3.4 years | 6.83 | 5,670 | 3.4 years | 6.83 | ||||||||
| $7.83 to $21.59 | 943,872 | 6.0 years | 12.96 | 640,778 | 5.3 years | 12.78 | ||||||||
| $1.00 to $21.59 | 1,916,859 | 4.4 years | $ | 7.86 | 1,470,924 | 3.3 years | $ | 7.08 | ||||||
51
All options granted, available under the current plan, and exercisable have been adjusted to give retroactive effect to a 10% stock dividend in May 2008. In January 2010, a total of 52,150 options were granted to forty-seven officers of the Company at an exercise price of $5.61 per share and with a five year vesting period.
In September 2003, the Company adopted an Employee Stock Purchase Plan. Under the plan a total of 387,400 shares of common stock, as adjusted for stock dividends and splits, were reserved for issuance to eligible employees at a price equal to at least 85% of the fair market value of the shares of common stock on the date of grant. Grants each year expire at the end of that fiscal year if not exercised by the employee. On January 28, 2009, rights to purchase 339,881 shares of common stock were granted at a price of $3.45, which was equal to 85% of the fair market value of the shares at that time. None of the shares were purchased. On February 27, 2008, rights to purchase 115,498 shares of common stock were granted at a price of $8.70, as adjusted, which was equal to 85% of the fair market value of the shares at that time. Of the total grant, 399 shares were purchased. On January 16, 2007, rights to purchase 59,456 shares of common stock were granted at a price of $13.59, as adjusted, which was equal to 85% of the fair market value of the shares at that time. Of the total grant, 2,219 shares were purchased. On January 27, 2010, rights to purchase 254,292 shares of common stock were granted at a price of $4.77.
Note 13. Director Compensation
The outside Directors, have been awarded a total of 18,000 and 39,600 options under the 1998 Stock Option Plan in 2009 and 2008 respectively, as adjusted for all stock splits and or stock dividends through 2008. All director options are included in the tables under Note 12.
Note 14. Other Borrowed Funds and Lines of Credit
The Bank maintains a $409.5 million line of credit with the Federal Home Loan Bank of Atlanta. The interest rate and term of each advance from the line is dependent upon the advance and commitment type. Advances on the line are secured by all of the Bank’s qualifying first liens and home equity lines-of-credit on one-to-four unit single-family dwellings. As of December 31, 2009, the book value of these qualifying loans totaled approximately $206.3 million and the amount of available credit using this collateral was $102.9 million. Advances on the line of credit in excess of this amount require pledging of additional assets, including other types of loans and investment securities. As of December 31, 2009 and 2008, the Bank had $25 million in advances outstanding that mature on September 21, 2012, but are callable by the Federal Home Loan Bank on any quarterly interest payment date. The Bank has additional short-term lines of credit totaling $47 million with nonaffiliated banks at December 31, 2009, on which there were no amounts outstanding.
Note 15. Trust Preferred Capital Notes
On December 19, 2002, the Company completed a private placement issuance of $15.0 million of trust preferred securities through a newly formed, wholly-owned, subsidiary trust (VCBI Capital Trust II) which issued $470 thousand in common equity to the Company. These securities bear a floating rate of interest, adjusted semi-annually, of 330 basis points over six month Libor, currently 4.40%. These securities have been callable at par since December 30, 2007, on any semi-annual interest payment date, but have not been redeemed to date. On December 20, 2005, the Company completed a private placement of $25.0 million of trust preferred securities through a newly formed, wholly-owned, subsidiary trust (VCBI Capital Trust III) which issued $774 thousand in common equity to the Company. These securities bear a fixed rate of interest of 6.19% until February 23, 2011, at which time they convert to a floating rate, adjusted quarterly, of 142 basis points over three month Libor. These securities are callable at par beginning February 23, 2011.
On September 24, 2008, the Company completed a private placement, to its directors and certain executive officers, of $25.0 million of trust preferred securities through a newly formed, wholly-owned, subsidiary trust (VCBI Capital Trust IV) which issued $775 thousand in common equity to the Company. These securities bear a fixed rate of interest of 10.20% and are callable at par beginning September 24, 2013. In connection with the issuance of the trust preferred securities, the Company also issued warrants to purchase an aggregate of 1.5 million shares of common stock to the purchasers. The warrants have a five year term and an exercise price of $6.83 per share.
The principal asset of each trust is a similar amount of the Company’s junior subordinated debt securities with an approximately 30 year term from issuance and like interest rates to the trust preferred securities. The obligations of the Company with respect to the trust preferred securities constitute a full and unconditional guarantee by the Company of each Trust’s obligations with respect to the trust preferred securities to the extent set forth in the related
52
guarantees. Subject to certain exceptions and limitations, the Company may elect from time to time to defer interest payments on the junior subordinated debt securities, resulting in a deferral of distribution payments on the related trust preferred securities. If the Company defers interest payments on the junior subordinated debt securities, or otherwise is in default of the obligations in respect to the trust preferred securities, the Company would be prohibited from making dividend payments to its shareholders, and from most purchases, redemptions or acquisitions of the Company’s common stock.
The Trust Preferred Securities may be included in Tier 1 capital for regulatory capital adequacy purposes up to 25.0% of Tier 1 capital after its inclusion. The portion of the trust preferred securities not qualifying as Tier 1 capital may be included as part of total qualifying capital in Tier 2 capital, subject to limitation.
Note 16. Financial Instruments With Off-Balance-Sheet Risk
The Company is party to financial instruments with off-balance-sheet risk in the normal course of business to meet the financing needs of its customers. These financial instruments include commitments to extend credit, standby letters of credit and financial guarantees. These instruments involve, to varying degrees, elements of credit and interest rate risk in excess of the amount recognized in the balance sheet. The contract or notional amounts of those instruments reflect the extent of involvement the Company has in particular classes of financial instruments.
The Company’s exposure to credit loss in the event of nonperformance by the other party to the financial instrument for commitments to extend credit and standby letters of credit and financial guarantees written is represented by the contractual or notional amount of those instruments. The Company uses the same credit policies in making commitments and conditional obligations as it does for on-balance-sheet instruments.
A summary of the contract or notional amount of the Company’s exposure to off-balance-sheet risk as of December 31, 2009 and 2008, is as follows:
| (Dollars in thousands) |
2009 | 2008 | ||||
| Financial instruments whose contract amounts represent credit risk: |
||||||
| Commitments to extend credit |
$ | 31,598 | $ | 13,083 | ||
| Standby letters of credit and financial guarantees written |
$ | 48,103 | $ | 68,060 | ||
| Unfunded lines of credit |
$ | 421,725 | $ | 489,307 | ||
Commitments to extend credit are agreements to lend to a customer as long as there is no violation of any condition established in the contract. Commitments generally have fixed expiration dates or other termination clauses and may require payment of a fee. Since many of the commitments are expected to expire without being drawn upon, the total commitment amounts do not necessarily represent future cash requirements. The Company evaluates each customer’s creditworthiness on a case-by-case basis. The amount of collateral obtained, if deemed necessary by the Company upon extension of credit, is based on management’s credit evaluation of the customer. Collateral held varies but may include cash, marketable securities, accounts receivable, inventory, property and equipment, residential real estate, and income-producing commercial properties. In 2009, the Company reserved $3.0 million for an unfunded loan commitment in connection with an expected loss on a letter of credit. The reserve is included in other liabilities and recognized in non-interest expense.
Standby letters of credit and financial guarantees written are conditional commitments issued by the Company to guarantee the performance of a customer to a third party. Those guarantees are primarily issued to support public and private borrowing arrangements, including commercial paper, bond financing, and similar transactions. The credit risk involved in issuing letters of credit is essentially the same as that involved in extending loan facilities to customers. The Company holds certificates of deposit, marketable securities, and business assets as collateral supporting those commitments for which collateral is deemed necessary.
The Company originates mortgage loans for sale to secondary market investors subject to contractually specified and limited recourse provisions. In 2009, the Company originated $188.7 million and sold $188.4 million to investors, compared to $80.6 million originated and $79.6 million sold in 2008. Most contracts with investors contain certain recourse language that may vary from 90 days up to one year. In general, the Company may be required to repurchase a previously sold mortgage loan or indemnify the investor if there is major non-compliance with defined loan origination or documentation standards, including fraud, negligence or material misstatement in
53
the loan documents. Repurchase may also be required if necessary governmental loan guarantees are canceled or never issued, or if an investor is forced to buy back a loan after it has been re-sold as part of a loan pool. In addition, the Company may have an obligation to repurchase a loan if the mortgagor has defaulted early in the loan term. The potential default period is approximately twelve months after sale of the loan to the investor. Mortgages subject to recourse are collateralized by single-family residential properties, have loan-to-value ratios of 80% or less, or have private mortgage insurance or are insured or guaranteed by an agency of the United States government.
At December 31, 2009, the Bank had rate lock commitments to originate and sell mortgage loans amounting to $11.6 million. Risks arise from the possible inability of counterparties to meet the terms of their contracts. The Bank does not expect any counterparty to fail to meet its obligation.
Note 17. Concentrations of Credit Risk
The Bank does a general banking business, serving the commercial and personal banking needs of its customers. The Bank’s market area consists of the Northern Virginia suburbs of Washington, D.C., including Arlington, Fairfax, Fauquier, Loudoun, Prince William, Spotsylvania and Stafford Counties, the cities of Alexandria, Fairfax, Falls Church, Fredericksburg, Manassas and Manassas Park, and to some extent the nearby Maryland suburbs and the city of Washington D.C. Substantially all of the Company’s loans are made within its market area.
The ultimate collectability of the Bank’s loan portfolio and the ability to realize the value of any underlying collateral, if needed, are influenced by the economic conditions of the market area. The Company’s operating results are therefore closely related to the economic conditions and trends in the metropolitan Washington, D.C. area.
At December 31, 2009 and 2008, there were $1.62 billion and $1.66 billion, or 71.1% and 71.9%, respectively of total loans concentrated in commercial real estate. Commercial real estate for purposes of this note includes all construction loans, loans secured by 5+ family residential properties and loans secured by non-farm, non-residential properties. At December 31, 2009 and 2008, construction loans represented 18.8% and 25.3% of total loans, loans secured by 5+ family residential properties represented 2.9%, and loans secured by non-farm, non-residential properties represented 49.4% and 43.7%, respectively. Construction loans at December 31, 2009 and 2008 included $224.8 million and $296.3 million in loans to commercial builders of single family housing in the Northern Virginia market, representing 9.9% and 12.8% of total loans, respectively.
The Bank has established formal policies relating to the credit and collateral requirements in loan originations including policies that establish limits on various loan types as a percentage of total loans and total capital. Loans to purchase real property are generally collateralized by the related property with limitations based on the property’s appraised value. Credit approval is primarily a function of collateral and the evaluation of the creditworthiness of the individual borrower, guarantors and or the individual project. Management considers the concentration of credit risk to be minimal due to the diversification of borrowers over numerous businesses and industries.
Note 18. Fund Restrictions and Reserve Balance
The transfer of funds from the Bank to the Company in the form of loans, advances, and cash dividends are restricted by Federal and State regulatory authorities. As of December 31, 2009, the aggregate amount of unrestricted funds that could be transferred in the form of a cash dividend totaled approximately $4.3 million, or 1.9%, of the consolidated net assets of the Company.
As members of the Federal Reserve System, the Company is required to maintain certain average reserve balances. For the final weekly reporting period in the years ended December 31, 2009 and 2008, the aggregate amounts of daily average required balances were approximately $4.9 million and $4.0 million, respectively.
Note 19. Employee Benefits
The Company has a 401(k) defined contribution plan covering substantially all full-time employees and provides that an employee becomes eligible to participate at the date he or she has reached the age of 21 and has completed three months of service, whichever occurs last. Under the plan, a participant may contribute up to 15% of his or her covered compensation for the year, subject to certain limitations. The Company may also make, but is not required to make, a discretionary contribution for each participant out of its current or accumulated net profits. The amount of contribution, if any, is determined on an annual basis by the Board of Directors. Contributions made by the Company totaled $737 thousand and $526 thousand for the years ended December 31, 2008, and 2007. The Company made no contributions in 2009.
54
Note 20. Fair Value Measurements
The Company uses fair value measurements to record fair value adjustments to certain assets and liabilities and to determine fair value disclosures. In accordance with the Fair Value Measurements and Disclosures topic of FASB ASC, the fair value of a financial instrument is the price that would be received to sell an asset or paid to transfer a liability in an orderly transaction between market participants at the measurement date. Fair value is best determined based upon quoted market prices. However, in many instances, there are no quoted market prices for the Company’s various financial instruments. In cases where quoted market prices are not available, fair values are based on estimates using present value or other valuation techniques. Those techniques are significantly affected by the assumptions used, including the discount rate and estimates of future cash flows. Accordingly, the fair value estimates may not be realized in an immediate settlement of the instrument.
The recent fair value guidance provides a consistent definition of fair value, which focuses on exit price in an orderly transaction (that is, not a forced liquidation or distressed sale) between market participants at the measurement date under current market conditions. If there had been a significant decrease in the volume and level of activity for the asset or liability, a change in valuation technique or the use of multiple valuation techniques may be appropriate. In such instances, determining the price at which willing market participants would transact at the measurement date under current market conditions depends on the facts and circumstances and requires the use of significant judgment. The fair value is a reasonable point within the range that is most representative of fair value under current market conditions.
Fair Value Hierarchy
In accordance with this guidance, the Company groups its financial assets and financial liabilities generally measured at fair value in three levels, based on the markets in which the assets and liabilities are traded and the reliability of the assumptions used to determine fair value.
Level 1 – Valuation is based on quoted prices in active markets for identical assets or liabilities that the reporting entity has the ability to access at the measurement date. Level 1 assets and liabilities generally include debt and equity securities that are traded in an active exchange market. Valuations are obtained from readily available pricing sources for market transactions involving identical assets or liabilities.
Level 2 – Valuation is based on inputs other than quoted prices included within level 1 that are observable for the asset or liability, either directly or indirectly. The valuation may be based on quoted prices for similar assets or liabilities; quoted prices in markets that are not active; or other inputs that are observable or can be corroborated by observable market data for substantially the full term of the asset or liability.
Level 3 – Valuation is based on unobservable inputs that are supported by little or no market activity and that are significant to the fair value of the assets or liabilities. Level 3 assets and liabilities include financial instruments whose value is determined using pricing models, discounted cash flow methodologies, or similar techniques, as well as instruments for which determination of fair value requires significant management judgment or estimation.
A financial instrument’s categorization within the valuation hierarchy is based upon the lowest level of input that is significant to the fair value measurement.
The following describes the valuation techniques used by the Company to measure certain financial assets and liabilities recorded at fair value on a recurring basis in the financial statements:
Securities available for sale: Securities available for sale are recorded at fair value on a recurring basis. Fair value measurement is based upon quoted market prices, when available (Level 1). If quoted market prices are not available, fair values are measured utilizing independent valuation techniques of identical or similar securities for which significant assumptions are derived primarily from or corroborated by observable market data. Third party vendors compile prices from various sources and may determine the fair value of identical or similar securities by using pricing models that considers observable market data (Level 2).
55
The following describes the valuation techniques used by the Company to measure certain financial assets and liabilities recorded at fair value on a recurring basis in the financial statements for December 31, 2009 and 2008, respectively:
| Fair Value Measurements at December 31, 2009 Using | ||||||||||||
| Description |
Balance as of December 31, 2009 |
Quoted Prices in Active Markets for Identical Assets (Level 1) |
Significant Other Observable Inputs (Level 2) |
Significant Unobservable Inputs (Level 3) | ||||||||
| Assets: |
||||||||||||
| Available-for-sale securities |
$ | 291,521 | $ | — | $ | 291,521 | $ | — | ||||
| Fair Value Measurements at December 31, 2008 Using | ||||||||||||
| Description |
Balance as of December 31, 2008 |
Quoted Prices in Active Markets for Identical Assets (Level 1) |
Significant Other Observable Inputs (Level 2) |
Significant Unobservable Inputs (Level 3) | ||||||||
| Assets: |
||||||||||||
| Available-for-sale securities |
$ | 268,836 | $ | — | $ | 268,836 | $ | — | ||||
Certain financial assets are measured at fair value on a nonrecurring basis in accordance with GAAP. Adjustments to the fair value of these assets usually result from the application of lower-of-cost-or-market accounting or write-downs of individual assets. The following describes the valuation techniques used by the Company to measure certain financial assets recorded at fair value on a nonrecurring basis in the financial statements:
Loans held for sale: Loans held for sale are carried at the lower of cost or market value. These loans currently consist of one-to-four family residential loans originated for sale in the secondary market. Fair value is based on the price secondary markets are currently offering for similar loans using observable market data which is not materially different than cost due to the short duration between origination and sale (Level 2). As such, the Company records any fair value adjustments on a nonrecurring basis. No nonrecurring fair value adjustments were recorded on loans held for sale during the year ended December 31, 2009. Gains and losses on the sale of loans are recorded within income from mortgage banking on the Consolidated Statements of Operations.
Impaired Loans: Loans are designated as impaired when, in the judgment of management based on current information and events, it is probable that all amounts due according to the contractual terms of the loan agreement will not be collected. The measurement of loss associated with impaired loans can be based on either the observable market price of the loan or the fair value of the collateral. Fair value is measured based on the value of the collateral securing the loans. Collateral may be in the form of real estate or business assets including equipment, inventory, and accounts receivable. The vast majority of the collateral is real estate. The value of real estate collateral is determined utilizing an income or market valuation approach based on an appraisal conducted by an independent, licensed appraiser outside of the Company using observable market data (Level 2). However, if the collateral is a house or building in the process of construction or if an appraisal of the real estate property is over two years old, then the fair value is considered Level 3. The value of business equipment is based upon an outside appraisal if deemed significant, or the net book value on the applicable business’s financial statements if not considered significant using observable market data. Likewise, values for inventory and accounts receivables collateral are based on financial statement balances or aging reports (Level 3). Impaired loans are measured at fair value on a nonrecurring basis through the allowance for loan losses. Any fair value adjustments are recorded in the period incurred as provision for loan losses on the Consolidated Statements of Income.
Foreclosed Assets: Assets acquired through, or in lieu of, loan foreclosure are held-for-sale and are initially recorded at the lesser of book value or fair value less cost to sell at the date of foreclosure, establishing a new cost basis. Subsequent to foreclosure, valuations are periodically performed by Management and the assets are carried at the lower of carrying amount or fair value less cost to sell. Revenue and expenses from operations and changes in the valuation are included in net expenses from foreclosed assets.
56
The following table summarizes the Company’s financial assets that were measured at fair value on a nonrecurring basis for December 31, 2009 and 2008, respectively:
| Carrying value at December 31, 2009 | ||||||||||||
| Description |
Balance as of December 31, 2009 |
Quoted Prices in Active Markets for Identical Assets (Level 1) |
Significant Other Observable Inputs (Level 2) |
Significant Unobservable Inputs (Level 3) | ||||||||
| Assets: |
||||||||||||
| Impaired Loans |
$ | 121,109 | $ | — | $ | 96,798 | $ | 24,311 | ||||
| Foreclosed Assets |
$ | 28,499 | $ | — | $ | 28,499 | $ | — | ||||
| Carrying value at December 31, 2008 | ||||||||||||
| Description |
Balance as of December 31, 2008 |
Quoted Prices in Active Markets for Identical Assets (Level 1) |
Significant Other Observable Inputs (Level 2) |
Significant Unobservable Inputs (Level 3) | ||||||||
| Assets: |
||||||||||||
| Impaired Loans |
$ | 71,744 | $ | — | $ | 63,615 | $ | 8,129 | ||||
| Foreclosed Assets |
$ | 7,569 | $ | — | $ | 7,569 | $ | — | ||||
The following methods and assumptions were used to estimate the fair value of each class of financial instruments for which it is practicable to estimate that value:
Cash and Short-Term Investments
For those short-term instruments, the carrying amount is a reasonable estimate of fair value.
Securities
For securities held for investment purposes, fair values are based upon quoted market prices, when available. If quoted market prices are not available, fair values are measured utilizing independent valuation techniques of identical or similar securities for which significant assumptions are derived primarily from or corroborated by observable market data. Third party vendors compile prices from various sources and may determine the fair value of identical or similar securities by using pricing models that considers observable market data. The carrying value of restricted stock approximates fair value based on the redemption provisions of the issuers.
Loans Held-for-Sale
Fair value is based on the price secondary markets are currently offering for similar loans using observable market data which is not materially different than cost due to the short duration between origination and sale.
Loan Receivables
For certain homogeneous categories of loans, such as some residential mortgages, and other consumer loans, fair value is estimated using the quoted market prices for securities backed by similar loans, adjusted for differences in loan characteristics. The fair value of other types of loans is estimated by discounting the future cash flows using the current rates at which similar loans would be made to borrowers with similar credit ratings and for the same remaining maturities.
57
Deposits and Borrowings
The fair value of demand deposits, savings accounts, and certain money market deposits is the amount payable on demand at the reporting date. For all other deposits and borrowings, the fair value is determined using the discounted cash flow method. The discount rate was equal to the rate currently offered on similar products.
Accrued Interest
The carrying amounts of accrued interest approximate fair value.
Off-Balance Sheet Financial Instruments
The fair value of commitments to extend credit is estimated using the fees currently charged to enter similar agreements, taking into account the remaining terms of the agreements and the present creditworthiness of the counterparties. For fixed-rate loan commitments, fair value also considers the difference between current levels of interest rates and the committed rates. The fair value of stand-by letters of credit is based on fees currently charged for similar agreements or on the estimated cost to terminate them or otherwise settle the obligations with the counterparties at the reporting date.
At December 31, 2009 and 2008, the fair value of loan commitments and stand-by letters of credit were deemed immaterial, and therefore, are not included in the table below.
The carrying amounts and estimated fair values of the Company’s financial instruments are as follows:
| 2009 | 2008 | |||||||||||
| (Dollars in thousands) |
Carrying Amount |
Estimated Fair Value |
Carrying Amount |
Estimated Fair Value | ||||||||
| Financial assets: |
||||||||||||
| Cash and short-term investments |
$ | 25,211 | $ | 25,211 | $ | 33,515 | $ | 33,515 | ||||
| Securities |
348,585 | 349,836 | 325,743 | 326,695 | ||||||||
| Restricted Stock |
11,751 | 11,751 | 11,076 | 11,076 | ||||||||
| Loans held-for-sale |
6,492 | 6,492 | 6,221 | 6,221 | ||||||||
| Loans |
2,210,064 | 2,227,593 | 2,273,086 | 2,313,567 | ||||||||
| Accrued interest receivable |
10,537 | 10,537 | 10,593 | 10,593 | ||||||||
| 2009 | 2008 | |||||||||||
| (Dollars in thousands) |
Carrying Amount |
Estimated Fair Value |
Carrying Amount |
Estimated Fair Value | ||||||||
| Financial liabilities: |
||||||||||||
| Deposits |
$ | 2,229,327 | $ | 2,202,714 | $ | 2,172,142 | $ | 2,144,292 | ||||
| Securities sold under agreements to repurchase and federal funds purchased |
176,729 | 200,146 | 187,959 | 206,124 | ||||||||
| Other borrowed funds |
25,000 | 25,683 | 25,000 | 25,207 | ||||||||
| Trust preferred capital notes |
66,057 | 82,651 | 65,800 | 95,016 | ||||||||
| Accrued interest payable |
4,014 | 4,014 | 8,160 | 8,160 | ||||||||
In the normal course of business, the Company is subject to market risk which includes interest rate risk (the risk that general interest rate levels will change). As a result, the fair values of the Company’s financial instruments will change when interest rate levels change and that change may be either favorable or unfavorable to the Company. Management attempts to match maturities of assets and liabilities to the extent believed necessary to minimize this risk.
58
Note 21. Capital Requirements
The Company (on a consolidated basis) and the Bank are subject to various regulatory capital requirements administered by the Federal banking agencies. Failure to meet minimum capital requirements can initiate certain mandatory, and possibly additional discretionary, actions by regulators that, if undertaken, could have a direct material effect on the Company’s and Bank’s financial statements. Under capital adequacy guidelines and the regulatory framework for prompt corrective action, the Company and the Bank must meet specific capital guidelines that involve quantitative measures of their assets, liabilities, and certain off-balance-sheet items as calculated under regulatory accounting practices. The capital amounts and classification are also subject to qualitative judgments by the regulators about components, risk weightings, and other factors. Prompt corrective action provisions are not applicable to bank holding companies.
Quantitative measures established by regulation to ensure capital adequacy require the Company and the Bank to maintain minimum amounts and ratios (set forth in the table below) of Total capital, Tier 1 capital and Tier 1 Leverage capital. Total capital and Tier 1 capital ratios are in reference to risk-weighted assets (as defined), and the Tier 1 Leverage capital ratio is in reference to average assets. Management believes, as of December 31, 2009 and 2008, that the Company and Bank met all capital adequacy requirements to which they are subject.
As of December 31, 2009, the Bank is categorized as “well-capitalized” under the regulatory framework for prompt corrective action. To be categorized as “well-capitalized,” the Bank must maintain minimum total risk-based, Tier 1 risk-based, and Tier 1 leverage ratios as set forth in the table. There are no conditions or events since December 31, 2009, that management believes changed the Bank’s category. The Company’s and the Bank’s actual capital amounts and ratios are also presented in the table.
| (Dollars in thousands) As of December 31, 2009: |
Actual Capital | Minimum Capital Requirement* |
Minimum To Be Well-Capitalized Under Prompt Corrective Action Provisions |
|||||||||||||||
| Amount | Ratio | Amount | Ratio | Amount | Ratio | |||||||||||||
| Total Capital: |
||||||||||||||||||
| Company |
$ | 313,333 | 12.73 | % | $ | 196,981 | 8.00 | % | $ | N/A | N/A | |||||||
| Bank |
311,127 | 12.66 | % | 196,646 | 8.00 | % | 245,807 | 10.00 | % | |||||||||
| Tier 1 Capital: |
||||||||||||||||||
| Company |
$ | 282,554 | 11.48 | % | $ | 98,490 | 4.00 | % | $ | N/A | N/A | |||||||
| Bank |
280,401 | 11.41 | % | 98,323 | 4.00 | % | 147,484 | 6.00 | % | |||||||||
| Tier 1 Leverage Capital: |
||||||||||||||||||
| Company |
$ | 282,554 | 10.29 | % | $ | 109,797 | 4.00 | % | $ | N/A | N/A | |||||||
| Bank |
280,401 | 10.23 | % | 109,602 | 4.00 | % | 137,003 | 5.00 | % | |||||||||
| As of December 31, 2008: |
Amount | Ratio | Amount | Ratio | Amount | Ratio | ||||||||||||
| Total Capital: |
||||||||||||||||||
| Company |
$ | 347,910 | 14.44 | % | $ | 192,761 | 8.00 | % | $ | N/A | N/A | |||||||
| Bank |
346,983 | 14.41 | % | 192,583 | 8.00 | % | 240,728 | 10.00 | % | |||||||||
| Tier 1 Capital: |
||||||||||||||||||
| Company |
$ | 315,013 | 13.07 | % | $ | 96,380 | 4.00 | % | $ | N/A | N/A | |||||||
| Bank |
316,892 | 13.16 | % | 96,291 | 4.00 | % | 144,437 | 6.00 | % | |||||||||
| Tier 1 Leverage Capital |
||||||||||||||||||
| Company |
$ | 315,013 | 11.76 | % | $ | 107,127 | 4.00 | % | $ | N/A | N/A | |||||||
| Bank |
316,892 | 11.81 | % | 107,299 | 4.00 | % | 134,123 | 5.00 | % | |||||||||
| * | The minimum capital requirement for the Company is a guideline. |
Note 22. Preferred Stock and Warrant
On December 12, 2008, the Company entered into a Letter Agreement (“Agreement”) with the United States Department of the Treasury (“Treasury”) under the Troubled Asset Relief Program (“TARP”) Capital Purchase Program (“CPP”), whereby the Company issued and sold to the Treasury 71,000 shares of fixed rate cumulative
59
perpetual preferred stock with a par value of $1.00 and a liquidation amount of $1,000 per share, for a total price of $71.0 million. In addition, the Treasury received a warrant to purchase 2,696,203 shares of the Company’s common stock at an exercise price of $3.95 per share. Subject to certain restrictions, the preferred stock and the warrant are transferable by the Treasury. The allocated carrying values of the preferred stock and the warrant, based on their relative fair values, were $62.5 million and $8.5 million respectively.
The preferred stock pays dividends quarterly, beginning February 2009, at a rate of 5% per year for the first five years, then increases to 9% thereafter. The Company may redeem the preferred stock at any time, subject to consultation with the Federal Reserve, at the liquidation amount of $1,000 per share plus any accrued and unpaid dividends. Approval from the Treasury is required to pay common stock dividends or to repurchase shares of the Company’s common stock prior to December 12, 2011, unless the preferred stock has been fully redeemed.
The warrant has a ten year term and is immediately exercisable. Pursuant to the terms of the Agreement, the Treasury will not exercise voting rights with respect to any shares of common stock it acquires upon exercise of the warrant; voting rights may be exercised by any other holder.
Note 23. Condensed Financial Statements of Parent Company
| Balance Sheets (in thousands) |
December 31, 2009 | December 31, 2008 | ||||
| Assets: |
||||||
| Cash and due from banks |
$ | 169 | $ | 557 | ||
| Investment in subsidiaries |
282,771 | 318,187 | ||||
| Other assets |
2,172 | 726 | ||||
| Total Assets |
$ | 285,112 | $ | 319,470 | ||
| Liabilities and Stockholders’ Equity: |
||||||
| Trust preferred capital notes |
$ | 66,057 | $ | 65,800 | ||
| Other liabilities |
187 | 383 | ||||
| Total Liabilities |
$ | 66,244 | $ | 66,183 | ||
| Stockholders’ Equity |
$ | 218,868 | $ | 253,287 | ||
| Total Liabilities and Stockholders’ Equity |
$ | 285,112 | $ | 319,470 | ||
| Statements Of Operations (in thousands) |
Year Ended December 31, | |||||||||||
| 2009 | 2008 | 2007 | ||||||||||
| Income: |
||||||||||||
| Dividends from subsidiary |
$ | 7,600 | $ | — | $ | — | ||||||
| Interest on subordinated debt |
— | 1,441 | 3,165 | |||||||||
| Total Income |
$ | 7, 600 | $ | 1,441 | $ | 3,165 | ||||||
| Expenses: |
||||||||||||
| Interest on trust preferred capital notes |
$ | 5,079 | $ | 3,400 | $ | 3,099 | ||||||
| Other operating expense |
1,293 | 1,364 | 1,086 | |||||||||
| Total Expenses |
$ | 6,372 | $ | 4,764 | $ | 4,185 | ||||||
| Income (loss) before income tax (benefit) and equity in undistributed earnings of subsidiary |
$ | 1,228 | $ | (3,323 | ) | $ | (1,020 | ) | ||||
| Income tax (benefit) |
(1,939 | ) | (966 | ) | (186 | ) | ||||||
| $ | 3,167 | $ | (2,357 | ) | $ | (834 | ) | |||||
| Equity (deficit) in undistributed (loss) earnings of subsidiary |
(36,492 | ) | 15,441 | 26,621 | ||||||||
| Net (loss) income |
$ | (33,325 | ) | $ | 13,084 | $ | 25,787 | |||||
60
| Statements Of Cash Flows (in thousands) |
Year Ended December 31, | |||||||||||
| 2009 | 2008 | 2007 | ||||||||||
| Cash Flows from Operating Activities: |
||||||||||||
| Net (loss) income |
$ | (33,325 | ) | $ | 13,084 | $ | 25,787 | |||||
| Adjustments to reconcile net income (loss) to net cash provided by (used in) operating activities: |
||||||||||||
| Equity (deficit) in undistributed (loss) earnings of subsidiary |
36,492 | (15,441 | ) | (26,621 | ) | |||||||
| Stock option expense |
630 | 597 | 427 | |||||||||
| (Increase) in other assets |
(1,446 | ) | (390 | ) | (226 | ) | ||||||
| Increase (decrease) in other liabilities |
60 | 71 | (37 | ) | ||||||||
| Net cash provided by (used in) operating activities |
$ | 2,411 | $ | (2,079 | ) | $ | (670 | ) | ||||
| Cash Flows from Investing Activities: |
||||||||||||
| (Purchase) retirement of equity interest in subsidiary |
$ | — | $ | (74,275 | ) | 100 | ||||||
| (Purchase) retirement of debt securities |
— | (25,000 | ) | 3,000 | ||||||||
| Net cash (used in) provided by investing activities |
$ | — | $ | (99,275 | ) | $ | 3,100 | |||||
| Cash Flows from Financing Activities: |
||||||||||||
| Net increase (decrease) in junior subordinated capital notes |
$ | — | $ | 25,775 | $ | (3,100 | ) | |||||
| Preferred stock issued |
— | 71,000 | — | |||||||||
| Dividends paid |
(3,087 | ) | — | — | ||||||||
| Common stock issued |
288 | 317 | 1,197 | |||||||||
| Cash paid in lieu of fractional shares |
— | (7 | ) | (12 | ) | |||||||
| Net cash (used in) provided by financing activities |
$ | (2,799 | ) | $ | 97,085 | $ | (1,915 | ) | ||||
| Change in cash and cash equivalents |
$ | (388 | ) | $ | (4,269 | ) | $ | 515 | ||||
| Beginning |
557 | 4,826 | 4,311 | |||||||||
| Ending |
$ | 169 | $ | 557 | $ | 4,826 | ||||||
61
Note 24. Quarterly Financial Information (Unaudited)
Selected financial information for the quarterly periods of 2009 and 2008 is presented below (dollars in thousands except per share data):
| 2009 Quarters | ||||||||||||||||
| First | Second | Third | Fourth | |||||||||||||
| Interest income |
$ | 37,554 | $ | 37,183 | $ | 37,623 | $ | 38,273 | ||||||||
| Interest expense |
16,797 | 15,183 | 14,219 | 13,030 | ||||||||||||
| Net interest income |
$ | 20,757 | $ | 22,000 | $ | 23,404 | $ | 25,243 | ||||||||
| Provision for loan losses |
13,390 | 18,423 | 49,000 | 1,100 | ||||||||||||
| Net interest income (loss) after provision for loan losses |
7,367 | 3,577 | (25,596 | ) | 24,143 | |||||||||||
| Non-interest income (charges) |
1,820 | 1,949 | (7,573 | ) | (548 | ) | ||||||||||
| Non-interest expense |
13,023 | 13,586 | 12,922 | 17,337 | ||||||||||||
| (Loss) income before taxes |
$ | (3,836 | ) | $ | (8,060 | ) | $ | (46,091 | ) | $ | 6,258 | |||||
| Income tax (benefit) expense |
(1,427 | ) | (2,876 | ) | (16,204 | ) | 2,103 | |||||||||
| Net (loss) income |
$ | (2,409 | ) | $ | (5,184 | ) | $ | (29,887 | ) | $ | 4,155 | |||||
| Dividend on preferred stock |
786 | 1,251 | 1,251 | 1,251 | ||||||||||||
| Net (loss) income available to common stockholders |
$ | (3,195 | ) | $ | (6,435 | ) | $ | (31,138 | ) | $ | 2,904 | |||||
| Net (loss) income per common share: |
||||||||||||||||
| Basic |
$ | (0.12 | ) | $ | (0.24 | ) | $ | (1.17 | ) | $ | 0.11 | |||||
| Diluted |
$ | (0.12 | ) | $ | (0.24 | ) | $ | (1.17 | ) | $ | 0.11 | |||||
| 2008 Quarters | ||||||||||||||||
| First | Second | Third | Fourth | |||||||||||||
| Interest income |
$ | 40,063 | $ | 40,400 | $ | 40,567 | $ | 39,438 | ||||||||
| Interest expense |
20,598 | 19,686 | 18,658 | 18,488 | ||||||||||||
| Net interest income |
$ | 19,465 | $ | 20,714 | $ | 21,909 | $ | 20,950 | ||||||||
| Provision for loan losses |
4,112 | 3,656 | 8,300 | 9,310 | ||||||||||||
| Net interest income after provision for loan losses |
$ | 15,353 | $ | 17,058 | $ | 13,609 | $ | 11,640 | ||||||||
| Non-interest income |
1,631 | 1,729 | 1,597 | 1,474 | ||||||||||||
| Non-interest expense |
10,792 | 11,206 | 11,258 | 11,520 | ||||||||||||
| Income before taxes |
$ | 6,192 | $ | 7,581 | $ | 3,948 | $ | 1,594 | ||||||||
| Income tax expense |
2,044 | 2,660 | 1,275 | 252 | ||||||||||||
| Net income |
$ | 4,148 | $ | 4,921 | $ | 2,673 | $ | 1,342 | ||||||||
| Dividend on preferred stock |
— | — | — | 258 | ||||||||||||
| Net income available to common stockholders |
$ | 4,148 | $ | 4,921 | $ | 2,673 | $ | 1,084 | ||||||||
| Net income per common share: |
||||||||||||||||
| Basic |
$ | 0.16 | $ | 0.18 | $ | 0.10 | $ | 0.04 | ||||||||
| Diluted |
$ | 0.15 | $ | 0.18 | $ | 0.10 | $ | 0.04 | ||||||||
62
BUSINESS
General
Virginia Commerce Bancorp, Inc. (the “Company”) was organized under Virginia law on November 5, 1999 to become the holding company for Virginia Commerce Bank (the “Bank”). The Company acquired all of the outstanding shares of the Bank on December 22, 1999, upon the effectiveness of the Agreement and Plan of Share Exchange dated September 22, 1999 between the Company and the Bank. As a result of the Agreement and Plan of Share Exchange, each share of the Bank’s common stock was automatically exchanged for and converted into one share of the Company’s common stock.
The Bank was organized as a national banking association and commenced operations on May 16, 1988. On June 1, 1995, the Bank converted from a national banking association to a Virginia chartered bank which is a member of the Federal Reserve System. The Company’s and the Bank’s executive offices and main branch are located at 5350 Lee Highway, Arlington, Virginia. The Bank currently has twenty-seven additional full service branch offices throughout Northern Virginia, an investment services office in Vienna, Virginia, and a residential mortgage lending office in Chantilly, Virginia.
The Company engages in a general commercial banking business through the Bank, its sole direct operating subsidiary. The Bank’s customer base includes small-to-medium-sized businesses, including firms that have contracts with the U.S. government, associations, retailers and industrial businesses, professionals and business executives and consumers. The economic base of the Bank’s service area includes Arlington, Fairfax, Fauquier, Loudoun, Prince William, Spotsylvania and Stafford Counties and the City of Alexandria in Northern Virginia, and the metropolitan Washington, D.C. area generally. Northern Virginia has experienced significant population and economic growth during the past decade. The Bank participated in this growth through its commercial and retail banking activities.
The Bank’s primary service area consists of the Northern Virginia suburbs of Washington D.C., including Arlington Fairfax, Fauquier, Loudoun, Prince William, Spotsylvania and Stafford Counties and the cities of Alexandria, Fairfax, Falls Church, Fredericksburg, Manassas and Manassas Park. Its service area also covers, to a lesser extent, Washington, D.C. and the nearby Maryland counties of Montgomery and Prince Georges. This area’s banking business is dominated by a small number of large commercial banks with extensive branch networks. Most are branches of national, state-wide or regional banks. The Bank’s primary service area is also served by a large number of other financial institutions, including savings banks, credit unions and non-bank financial institutions such as securities brokerage firms, insurance companies and mutual funds. The Bank’s primary service area is oriented toward independently owned small-to-medium-sized businesses, light industry and firms specializing in government contracting. An increasing number of new community banking organizations have been opened in the Bank’s market area, potentially representing an increased competitive threat to the Bank.
The banking business in Virginia generally, and in the Bank’s primary service area specifically, is highly competitive with respect to both loans and deposits, and is dominated by a relatively small number of major banks with many offices operating over a wide geographic area. Among the advantages such major banks have over the Bank are their ability to finance wide-ranging advertising campaigns and to allocate their investment assets to regions of highest yield and demand. Such banks offer certain services such as international banking, which are not offered directly by the Bank (but are offered indirectly through correspondent institutions) and, by virtue of their greater total capitalization, such banks have substantially higher lending limits than the Bank. The Bank competes for deposits and lendable funds with other commercial banks, savings banks, credit unions and other governmental and corporate entities which raise operating capital through the issuance of debt and equity securities. The Bank also competes for available investment dollars with non-bank financial institutions, such as brokerage firms, insurance companies and mutual funds. With respect to loans, the Bank competes with other commercial banks, savings banks, consumer finance companies, mortgage companies, credit unions and other lending institutions. Additionally, as a result of enactment of federal and Virginia interstate banking legislation, additional competitors which are not currently operating in Virginia may enter the Bank’s markets and compete directly with the Bank. Recent legislation expanding the array of firms that can own banks may also result in increased competition for the Company and the Bank.
The majority of the Bank’s deposits are attracted from individuals and businesses in the metropolitan Washington D.C. area, and as such, no material portion of the Bank’s deposits have been obtained from any single person, single entity, or area outside the metropolitan Washington D.C. area. The loss of any one or more of the Bank’s depositors would not have a materially adverse effect on the business of the Bank. Although the Bank’s loans are concentrated in its Northern Virginia market area, and a significant portion are secured by real property in that market, the Bank’s loans are not concentrated within a single industry or group of related industries. See Note 17 to the Consolidated Financial Statements for more information on concentrations of credit risk.
63
The Bank provides businesses with a full range of deposit accounts, merchant bankcard services, electronic funds transfer services, lock-box services, remote deposit capture, on-line banking, lines of credit for working capital, term loans and commercial real estate loans, and provides consumers with a wide array of deposit products, home equity and revolving lines of credit, installment loans and internet banking services. The Bank also offers investment services and provides safe deposit boxes as well as other customary banking services. The Bank is not authorized to offer trust services nor does it offer international services but makes these services available to its customers through financial institutions with which the Bank has correspondent banking relationships.
The Bank also offers a wide variety of residential mortgage loans through its mortgage lending unit. Prior to mid-2007, substantially all of the Bank’s mortgage loans were originated on a pre-sold basis, servicing released, to numerous secondary market purchasers. Since mid-2007, and the disruptions in the secondary market for mortgage loans, the Company has been holding a greater portion of mortgage loans in portfolio. See “Lending Activities – Mortgage Lending” below. Offered types include conventional single family first trusts, FHA and VA mortgages for both purchase and refinance purposes. Recent changes in the local real estate market and interest rates have adversely impacted the level of loans originated for sale.
The Bank does not depend upon seasonal business. The Bank relies substantially on local promotional activity, personal contact by its officers, directors, employees and stockholders, personalized service and its reputation in the communities served to compete effectively.
The Bank has three wholly owned subsidiaries, Northeast Land and Investment Company and Tombstone Land Company, both Virginia corporations, organized to hold and market foreclosed real estate, and Virginia Commerce Insurance Agency, L.L.C., which has been inactive since its inception.
On December 31, 2009, the Company had 288 full-time equivalent employees, including six executive officers. None of the Company’s employees presently is represented by a union or covered under a collective bargaining agreement. Management of the Company believes that its employee relations are satisfactory. Other than its President, the Company does not have any employees that are not also employees of the Bank.
Banking is dependent upon interest rate differentials. In general, the difference between the interest rate paid by the Bank on its deposits and its other borrowings and the interest rate earned by the Bank on loans, securities and other interest-earning assets comprises the major source of the Bank’s earnings, while investment services commissions and fees and net gains on mortgage loans originated for sale have contributed to the Bank’s non-interest earnings. Thus, the earnings and growth of the Bank are subject to the influence of economic conditions generally, both domestic and foreign, and also of the monetary and fiscal policies of the United States and its agencies, particularly the Federal Reserve Board. The Federal Reserve Board implements national monetary policy, such as seeking to curb inflation and combat recession, by its open-market activities in United States government securities, by adjusting the required level of reserves for financial institutions subject to reserve requirements and through adjustments to the discount rate applicable to borrowings by banks which are members of the Federal Reserve System. The actions of the Federal Reserve Board in these areas influence the growth of bank loans, investments and deposits and also affect interest rates. The nature and timing of any future changes in such policies and their impact on the Bank cannot be predicted. In addition, adverse economic conditions could make a higher provision for loan losses a prudent course and could cause higher loan loss charge-offs, thus adversely affecting the Bank’s net income.
From time to time, new legislation or regulations are adopted which increase the cost of doing business, limit or expand permissible activities, or otherwise affect the competitive balance between banks and other financial institutions. Bills have been introduced in past Congresses which would permit banks to pay interest on checking and demand deposit accounts established by businesses, a practice which is currently prohibited by regulation. If the legislation effectively permitting the payment of interest on business demand deposits is enacted, of which there can be no assurance, it is likely that we may be required to pay interest on some portion of our demand deposits in order to compete against other banks. As a significant portion of our deposits are demand deposits established by businesses, payment of interest on these deposits could have a significant negative impact on our net income, net interest income, interest margin, return on assets and equity, and other indices of financial performance. We expect that other banks would be faced with similar negative impacts. We also expect that the primary focus of competition would continue to be based on other factors, such as quality of service.
64
Additionally, since the advent of the Capital Purchase Program and the Emergency Economic Stabilization Act of 2008, as amended (“EESA”), and the entry by many institutions, including the Company, into purchase agreements with Treasury, such institutions are subject to possible additional restrictions, obligations, requirements or burdens in respect to their operations, corporate governance, executive and employee compensation or other business practices, as a result of the Treasury’s right to unilaterally amend the Securities Purchase Agreement to conform to legislative changes.
Banks or bank holding companies which are undercapitalized and either have not timely approved a capital plan or have failed to implement the plan become subject to extraordinary powers pursuant to which the bank regulatory agencies may close the bank, restrict its growth, force its sale, restrict interest rates paid on deposits, and dismiss directors or senior executive officers. Each agency has prescribed standards relating to internal controls and systems, loan documentation, credit underwriting, interest rate exposure, asset growth, compensation, fees and benefits, and other operational and managerial standards. The agencies have also adopted standards relating to asset quality, earnings, valuation and compensation. Banks or bank holding companies which do not meet such standards may be subject to restrictions and consequences comparable to those which apply to undercapitalized banks and bank holding companies. Bank regulatory authority to appoint a conservator or receiver for a bank is broad, including grounds such as substantial dissipation of assets or earnings due to violations of law or regulation or due to any unsafe or unsound practices, an unsafe or unsound condition, and certain violations of law or regulation likely to weaken the institution’s condition.
Regulations promulgated by the Federal Reserve Board prohibit state member banks such as the Bank from paying any dividend on common stock out of capital. Dividends can be paid only to the extent of net profits then on hand, less losses and bad debts. Without the prior approval of the Federal Reserve Board, a state member bank cannot pay dividends in any calendar year in excess of the retained net profits for the prior two years and the profits of the current year, less any required transfers to surplus. As a result of the Company’s acceptance of an investment from the Treasury under the Capital Purchase Program, the Company’s ability to pay dividends on its common stock is highly restricted.
Lending Activities
The Bank offers a wide array of lending services to its customers, including commercial loans, commercial real estate loans, lines of credit, equipment financing, construction loans, letters of credit, residential mortgages, personal loans, auto loans and home equity loans and lines of credit. Loan terms, including interest rates, loan-to-value ratios, and maturities, are tailored as much as possible to meet the needs of the borrower within prudent lending guidelines in terms of interest rate risk and credit risk.
When considering loan requests, the primary factors taken into consideration are the purpose, the cash flow and financial condition of the borrower, primary and secondary repayment sources, the value of the underlying collateral, if applicable, and the character and integrity of the borrower. These factors are evaluated in a number of ways including an analysis of financial statements, credit history, trade references and visits to the borrower’s place of business. The Bank has adopted a comprehensive loan policy manual to provide its loan officers with underwriting, term, collateral, loan-to-value and pricing guidelines.
The Bank’s goal is to build and maintain a commercial loan portfolio consisting of term loans, lines of credit, commercial real estate and construction loans provided primarily to locally-based borrowers. Additionally, installment loans and personal lines of credit, as well as residential mortgages, are made available to consumer customers. Commercial loans are generally considered to have a higher degree of risk of default or loss than other types of loans, such as residential real estate loans, because repayment may be affected by general economic conditions, interest rates, the quality of management of the business, and other factors which may cause a borrower to be unable to repay its obligations. General economic conditions can directly or indirectly affect the quality of a small and mid-sized business loan portfolio. The Bank manages the loan portfolio to avoid high concentrations of similar industry loan types and/or property types in relation to total qualifying capital. Commercial construction loans will make up 50-75% of total qualifying capital, residential builder construction loans 50-75%, non-farm non-residential real estate loans 250-350%, residential mortgages and home equity loans 100-200%, commercial loans 125-200% and consumer installment and personal loans 25-50%. There can however, be no assurance that the Bank will be able to achieve or maintain this distribution of loans. At December 31, 2009, the loan portfolio’s actual composition compared to total qualifying capital consisted of approximately 60% commercial construction loans, 72% residential builder construction loans, 362% non-farm non-residential real estate loans, 131% residential mortgages and home equity loans, 77% commercial loans and 3% consumer installment and personal loans.
65
The lending activities in which we engage carry the risk that borrowers will be unable to perform on their obligations. As such, interest rate policies of the Federal Reserve Board and general economic conditions, nationally and in our primary market area will have a significant impact on our results of operations. To the extent that economic conditions deteriorate, business and individual borrowers may be less able to meet their obligations in a timely manner, resulting in decreased earnings or losses to the Bank. To the extent that loans are secured by real estate, adverse conditions in the real estate market may reduce the ability of the borrower to generate the necessary cash flow for repayment of the loan and reduce our ability to collect the full amount of the loan upon a default. These same external factors could also negatively impact collateral values. To the extent that the Bank makes fixed rate loans, general increases in interest rates will tend to reduce our spread as the interest rates we must pay for deposits increase. Interest rates may also adversely affect the value of property pledged as security for loans.
We constantly strive to mitigate risks in the event of unforeseen threats to the loan portfolio as a result of an economic downturn or other negative influences. Plans for mitigating inherent risks in managing loan assets include carefully enforcing loan policies and procedures, evaluating each borrower’s industry and business plan during the underwriting process, identifying and monitoring primary and alternative sources for repayment, obtaining collateral that is margined to minimize loss in the event of liquidation, ongoing tests of borrower credit worthiness and cash flow, ongoing collateral evaluations and site inspections and monitoring of economic and market trends.
Loan business is generated primarily through referrals and direct-calling efforts. Referrals of loan business comes from directors, shareholders, current customers and professionals such as lawyers, accountants and financial intermediaries.
At December 31, 2009, the Banks statutory lending limit to any single borrower was $46.7 million subject to certain exceptions provided under applicable law. As of December 31, 2009, the Bank’s maximum credit exposure to its largest borrower was $31.1 million.
Commercial Loans: Commercial loans are written for any legitimate business purpose including the financing of plant and equipment, interim working capital pending collection of accounts receivable, permanent working capital for growth and the acquisition and construction of real estate projects. There is a focus in the Bank’s loan portfolio on commercial real estate investment which represents a predominant activity in the Bank’s market area. The Bank’s commercial loan portfolio reflects a diverse group of borrowers with no significant concentration in any borrower, or group of borrowers.
Commercial construction loans, residential construction loans to builders and land acquisition and development loans are made to builders with established track records of quality construction. Land loans are discouraged unless underwritten in conjunction with a related construction loan or out-sale contract. Typical advance rates are not greater than 65% of the lesser of cost or appraisal for raw land, 75% of the value of finished lots for land acquisition, and 80% of land cost and 100% of construction costs for construction loans. In all cases, a minimum 10% equity contribution of total project costs is required. Financing terms generally do not exceed 24 months. Construction loans are subject to progress inspections and controlled advances. Speculative construction loans are maintained to a minimum with a majority of loans requiring pre-sale contracts or specified lease-up thresholds prior to construction commencement. Personal guarantees by principals of borrowing entities is a standard requirement and loans are typically priced to float at a factor at or above the prime lending rate.
Commercial real estate loans generally relate to borrower occupied properties with a principal reliance on the borrowing businesses’ ability to repay or investor transactions focused on tenant quality, occupancy and expense controls, as well as prudent guidelines for assessing real estate values. Risks inherent in managing a commercial real estate portfolio relate to either sudden or gradual drops in property values as a result of a general or local economic downturn. A decline in real estate values can cause loan to value margins to increase and diminish the Bank’s equity cushion on both an individual and portfolio basis. The Bank attempts to mitigate commercial real estate lending risks by carefully underwriting each loan of this type to address the perceived risks in the individual transaction. Generally, the Bank requires a loan-to-value ratio of 80% of the lesser of cost or appraisal for owner occupied transactions and 75% for investor transactions. A borrower’s ability to repay is carefully analyzed and policy calls for a minimum ongoing cash flow to debt service requirement of 1.15 to 1 although most loans exceed this minimum. An approved list of commercial real estate appraisers selected on the basis of a reputation for quality and accuracy has been established. Each appraisal is scrutinized in an effort to insure compliance with established appraisal guidelines and conformity with current comparable market values. The Bank generally requires personal guarantees on all loans to closely-held entities as a matter of policy. Borrowers are required to provide, at a
66
minimum, annual corporate, partnership and personal financial statements to comply with Bank policy. Interest rate risk to the Bank is mitigated by using either floating interest rates or by fixing rates for an intermediate period of time, generally less than five years. While loan amortizations may be approved for up to 360 months, loans generally have a call provision (maturity date) of 10 years or less.
Commercial term loans are used to provide funds for equipment and general corporate needs. This loan category is designed to support borrowers who have a proven ability to service debt over a term generally not to exceed 84 months. The Bank typically requires a first lien position on the collateral financed and other business assets and guarantees from owners having at least a 20% interest in the business. Interest rates on commercial term loans generally float or are fixed for a term not to exceed seven years. Management carefully monitors industry and collateral concentrations to avoid loan exposures to a large group of similar industries and/or similar collateral. Commercial loans are evaluated for historical and projected cash flow, balance sheet strength and primary and secondary repayment sources. Commercial term loan documents include certain financial and performance covenants and require borrowers to forward regular financial information on both the business and on personal guarantors at least annually. In certain cases, this information is required more frequently, depending on the degree to which lenders desire information to monitor a borrower’s financial condition and compliance with loan covenants. Key person life insurance is required as appropriate and as necessary to mitigate the risk associated with the loss of a primary owner or manager.
Commercial lines of credit are used to finance a business borrower’s short-term or seasonal credit needs and advances are often based on a percentage of eligible receivables and inventory. In addition to the risks inherent in term loan facilities, line of credit borrowers typically require additional monitoring to protect the lender against diminishing collateral values. Commercial lines of credit are generally revolving in nature and payable on demand. The Bank generally requires at least an annual rest period (for seasonal borrowers) and regular financial information (monthly or quarterly financial statements, monthly accounts receivable agings, borrowing base certificates, etc.) for borrowers with rapid growth and permanent working capital financing needs. Advances against collateral are generally margined, limiting advances on eligible receivables to 75-80% of current accounts. Lines of credit and term loans to the same borrowers are generally cross-defaulted and cross-collateralized. Industry and collateral concentration disciplines are the same as those used in managing the commercial term loan portfolio. Interest rate charges on this group of loans generally float at a factor at or above the prime lending rate. Generally, personal guarantees are also required on these loans.
Consumer Loans. Loans are considered for any worthwhile personal purpose on a case-by-case basis, such as financing of tuition, household expenditures, home and automobile financing. Consumer credit facilities are underwritten to focus on the borrower’s credit record, length and stability of employment, income to service debt and quality of collateral. Residential real estate loans held in portfolio are limited to advances of 90% of loan to appraised value. Maximum debt service to income ratio established by loan policy is 45% and maximum unsecured revolving debt will not exceed 10% of net worth. Installment loan terms range out to 72 months and are priced at fixed interest rates. Home equity loans amortize over 5-15 years and are fixed rate while home equity lines are revolving with 10-year maturities and have floating rates tied to the prime rate.
Mortgage Lending. The Company originates residential mortgage loans, on a pre-sold basis, for sale to secondary market purchasers, on a servicing released basis. This produces benefits primarily in the form of gains on the sale of the loans at a premium. Activity in the residential mortgage loan market is highly sensitive to changes in interest rates. The loans are sold on a limited recourse basis. Most contracts with investors contain recourse periods that may vary from 90 days up to one year. In general, the Company may be required to repurchase a previously sold mortgage loan or indemnify the investor if there is major non-compliance with defined loan origination or documentation standards, including fraud, negligence or material misstatement in the loan documents. Repurchase may also be required if necessary governmental loan guarantees are canceled or never issued, or if an investor is forced to buy back a loan after it has been re-sold as part of a loan pool. In addition, the Company may have an obligation to repurchase a loan if the mortgagor has defaulted early in the loan term. The potential default period is approximately twelve months after sale of the loan to the investor. Mortgages subject to recourse are collateralized by single-family residential properties, have loan-to-value ratios of 80% or less, or have private mortgage insurance or are insured or guaranteed by an agency of the United States government. On a limited basis, the Company holds some first trust residential mortgages in portfolio which have loan-to-value ratios of 80% or less. Maximum debt service to income ratio is 45%. Adjustable rate mortgage products amortize over a 30 year period; fixed rate products amortize over 15-30 years.
67
Credit and Loan Administration. As part of its internal credit and loan administration process, the Bank’s Directors Loan Committee, comprised of directors, reviews all loans 30-days delinquent, loans on the watch list, loans rated special mention, substandard, or doubtful and other loans of concern at least quarterly. The Committee also reviews new loan production, credit concentrations, loan loss reserves, declined loans, documentation exceptions, loan policy exceptions, new products and pricing. The Committee commissions periodic documentation and internal control reviews by outside vendors to complement internal audit and credit administration oversight.
Regulation, Supervision, and Governmental Policy
The Company. The Company is a bank holding company registered under Bank Holding Company Act of 1956, as amended, (the “BHCA”) and is subject to supervision by the Federal Reserve Board. As a bank holding company, the Company is required to file with the Federal Reserve Board an annual report and such other additional information as the Federal Reserve Board may require pursuant to the BHCA. The Federal Reserve Board may also make examinations of the Company and each of its subsidiaries.
BHCA - Activities and other Limitations. The BHCA requires approval of the Federal Reserve Board for, among other things, the acquisition by a proposed bank holding company of control of more than five percent (5%) of the voting shares, or substantially all the assets, of any bank or the merger or consolidation by a bank holding company with another bank holding company. The BHCA also generally permits the acquisition by a bank holding company of control or substantially all the assets of any bank located in a state other than the home state of the bank holding company, except where the bank has not been in existence for the minimum period of time required by state law, but if the bank is at least 5 years old, the Federal Reserve Board may approve the acquisition.
Under current law, with certain limited exceptions, a bank holding company is prohibited from acquiring control of any voting shares of any company which is not a bank or bank holding company and from engaging directly or indirectly in any activity other than banking or managing or controlling banks or furnishing services to or performing service for its authorized subsidiaries. A bank holding company may, however, engage in or acquire an interest in, a company that engages in activities which the Federal Reserve Board has determined by order or regulation to be so closely related to banking or managing or controlling banks as to be properly incident thereto. In making such a determination, the Federal Reserve Board is required to consider whether the performance of such activities can reasonably be expected to produce benefits to the public, such as convenience, increased competition or gains in efficiency, which outweigh possible adverse effects, such as undue concentration of resources, decreased or unfair competition, conflicts of interest or unsound banking practices. The Federal Reserve Board is also empowered to differentiate between activities commenced de novo and activities commenced by the acquisition, in whole or in part, of a going concern. Some of the activities that the Federal Reserve Board has determined by regulation to be closely related to banking include making or servicing loans, performing certain data processing services, acting as a fiduciary or investment or financial advisor, and making investments in corporations or projects designed primarily to promote community welfare.
Effective on March 11, 2000, the Gramm Leach Bliley Act of 1999 (the “GLB Act”) allows a bank holding company or other company to certify status as a financial holding company, which allows such company to engage in activities that are financial in nature, that are incidental to such activities, or are complementary to such activities. The GLB Act enumerates certain activities that are deemed financial in nature, such as underwriting insurance or acting as an insurance principal, agent or broker, underwriting, dealing in or making markets in securities, and engaging in merchant banking under certain restrictions. It also authorizes the Federal Reserve Board to determine by regulation what other activities are financial in nature, or incidental or complementary thereto.
Subsidiary banks of a bank holding company are subject to certain restrictions imposed by the Federal Reserve Act on any extensions of credit to the bank company or any of its subsidiaries, or investments in the stock or other securities thereof, and on the taking of such stock or securities as collateral for loans to any borrower. Further, a holding company and any subsidiary bank are prohibited from engaging in certain tie-in arrangements in connection with the extension of credit. A subsidiary bank may not extend credit, lease or sell property, or furnish any services, or fix or vary the consideration for any of the foregoing on the condition that: (i) the customer obtain or provide some additional credit, property or services from or to such bank other than a loan, discount, deposit or trust service; (ii) the customer obtain or provide some additional credit, property or service from or to company or any other subsidiary of the company; or (iii) the customer not obtain some other credit, property or service from competitors, except for reasonable requirements to assure the soundness of credit extended.
68
Commitments to Subsidiary Banks. Under Federal Reserve policy, the Company is expected to act as a source of financial strength to the Bank and to commit resources to support the Bank in circumstances when it might not do so absent such policy.
Limitations of Acquisitions of Common Stock. The federal Change in Bank Control Act prohibits a person or group from acquiring “control” of a bank holding company unless the Federal Reserve has been given 60 days’ prior written notice of such proposed acquisition and within that time period the Federal Reserve Board has not issued a notice disapproving the proposed acquisition or extending for up to another 30 days the period during which such a disapproval may be issued. An acquisition may be made prior to expiration of the disapproval period if the Federal Reserve issues written notice of its intent not to disapprove the action. Under a rebuttable presumption established by the Federal Reserve, the acquisition of 10% or more of a class of voting stock of a bank holding company with a class of securities registered under Section 12 of the Exchange Act or which would represent the single largest interest in the voting stock would, under the circumstances set forth in the presumption, constitute the acquisition of control.
In addition, with limited exceptions, any “company” would be required to obtain the approval of the Federal Reserve under the BHCA before acquiring 25% (5% in the case of an acquirer that is a bank holding company) or more of the outstanding common stock of, or such lesser number of shares as constitute control over, the Company. Such approval would be contingent upon, among other things, the acquirer registering as a bank holding company, divesting all impermissible holdings and ceasing any activities not permissible for a bank holding company.
The Federal Reserve has adopted capital adequacy guidelines pursuant to which it assesses the adequacy of an institution’s capital. These guidelines are substantially similar to those which are applicable to the Bank, discussed below.
The Bank. The Bank, as a Virginia chartered commercial bank which is a member of the Federal Reserve System (a “state member bank”) and whose accounts are insured by the Deposit Insurance Fund of the FDIC up to the maximum legal limits of the FDIC, is subject to regulation, supervision and regular examination by the State Corporation Commission/Bureau of Financial Institutions, the Federal Reserve Board and the FDIC. The regulations of these various agencies govern most aspects of the Bank’s business, including required reserves against deposits, loans, investments, mergers and acquisitions, borrowing, dividends and location and number of branch offices. The laws and regulations governing the Bank generally have been promulgated to protect depositors and the Deposit Insurance Fund, and not for the purpose of protecting stockholders.
Competition among commercial banks, savings banks, and credit unions has increased following enactment of legislation which greatly expanded the ability of banks and bank holding companies to engage in interstate banking or acquisition activities. As a result of federal and state legislation, banks in the Washington D.C./Maryland/Virginia area can, subject to limited restrictions, acquire or merge with a bank in another of the jurisdictions, and can branch de novo in any of the jurisdictions. The GLB Act allows a wider array of companies to own banks, which could result in companies with resources substantially in excess of the Company’s entering into competition with the Company and the Bank.
Branching and Interstate Banking. The federal banking agencies are authorized to approve interstate bank merger transactions without regard to whether such transaction is prohibited by the law of any state, unless the home state of one of the banks has opted out of the interstate bank merger provisions of the Riegle-Neal Interstate Banking and Branching Efficiency Act of 1994 (the “Riegle-Neal Act”) by adopting a law after the date of enactment of the Riegle-Neal Act and prior to June 1, 1997 which applies equally to all out-of-state banks and expressly prohibits merger transactions involving out-of-state banks. Interstate acquisitions of branches are permitted only if the law of the state in which the branch is located permits such acquisitions. Such interstate bank mergers and branch acquisitions are also subject to the nationwide and statewide insured deposit concentration limitations described in the Riegle-Neal Act.
The Riegle-Neal Act authorizes the federal banking agencies to approve interstate branching de novo by national and state banks in states which specifically allow for such branching. The District of Columbia, Maryland and Virginia have all enacted laws which permit interstate acquisitions of banks and bank branches and permit out-of-state banks to establish de novo branches.
USA Patriot Act. Under the Uniting and Strengthening America by Providing Appropriate Tools Required to Intercept and Obstruct Terrorism Act, commonly referred to as the “USA Patriot Act” or the “Patriot Act,” financial institutions are subject to prohibitions against specified financial transactions and account relationships, as well as enhanced due diligence standards intended to detect, and prevent, the use of the United States financial system for money laundering and terrorist financing activities. The Patriot Act requires financial institutions, including banks, to establish anti-
69
money laundering programs, including employee training and independent audit requirements, meet minimum standards specified by the act, follow minimum standards for customer identification and maintenance of customer identification records, and regularly compare customer lists against lists of suspected terrorists, terrorist organizations and money launderers. The costs or other effects of the compliance burdens imposed by the Patriot Act or future anti-terrorist, homeland security or anti-money laundering legislation or regulations cannot be predicted with certainty.
Capital Adequacy Guidelines. The Federal Reserve Board and the FDIC have adopted risk based capital adequacy guidelines pursuant to which they assess the adequacy of capital in examining and supervising banks and bank holding companies and in analyzing bank regulatory applications. Risk-based capital requirements determine the adequacy of capital based on the risk inherent in various classes of assets and off-balance sheet items.
State member banks are expected to meet a minimum ratio of total qualifying capital (the sum of core capital (Tier 1) and supplementary capital (Tier 2)) to risk weighted assets of 8%. At least half of this amount (4%) should be in the form of core capital. Tier 1 capital generally consists of the sum of common stockholders’ equity and perpetual preferred stock (subject in the case of the latter to limitations on the kind and amount of such stock which may be included as Tier 1 capital), less goodwill, without adjustment for changes in the market value of securities classified as “available-for-sale” in accordance with FAS 115. For the Company, the cumulative perpetual stock issued to the Treasury Department pursuant to the Capital Purchase Program established under the EESA is eligible for treatment as Tier 1 capital without limitation. Tier 2 Capital consists of the following: hybrid capital instruments; perpetual preferred stock which is not otherwise eligible to be included as Tier 1 Capital; term subordinated debt and intermediate-term preferred stock; and, subject to limitations, general allowances for loan losses. Assets are adjusted under the risk-based guidelines to take into account different risk characteristics, with the categories ranging from 0% (requiring no risk-based capital) for assets such as cash and certain U.S. Government and Agency securities, to 100% for the bulk of assets which are typically held by a bank holding company, including commercial real estate loans, commercial business loans and consumer loans. Residential first mortgage loans on one-to-four family residential real estate and certain seasoned multi-family residential real estate loans, which are not 90 days or more past-due or non-performing and which have been made in accordance with prudent underwriting standards are assigned a 50% level in the risk-weighting system, as are certain privately-issued mortgage-backed securities representing indirect ownership of such loans. Off-balance sheet items also are adjusted to take into account certain risk characteristics.
In addition to the risk-based capital requirements, the Federal Reserve Board has established a minimum 3.0% Leverage Capital Ratio (Tier 1 capital to total adjusted assets) requirement for the most highly-rated banks, with an additional cushion of at least 100 to 200 basis points for all other banks, which effectively increases the minimum Leverage Capital Ratio for such other banks to 4.0% - 5.0% or more. The highest-rated banks are those that are not anticipating or experiencing significant growth and have well diversified risk, including no undue interest rate risk exposure, excellent asset quality, high liquidity, good earnings and, in general, those which are considered a strong banking organization. A bank having less than the minimum Leverage Capital Ratio requirement shall, within 60 days of the date as of which it fails to comply with such requirement, submit a reasonable plan describing the means and timing by which the bank shall achieve its minimum Leverage Capital Ratio requirement. A bank which fails to file such plan is deemed to be operating in an unsafe and unsound manner, and could subject a bank to a cease-and-desist order. Any insured depository institution with a Leverage Capital Ratio that is less than 2.0% is deemed to be operating in an unsafe or unsound condition pursuant to Section 8(a) of the Federal Deposit Insurance Act (the “FDIA”) and is subject to potential termination of deposit insurance. However, such an institution will not be subject to an enforcement proceeding solely on account of its capital ratios, if it has entered into and is in compliance with a written agreement to increase its Leverage Capital Ratio and to take such other action as may be necessary for the institution to be operated in a safe and sound manner. The capital regulations also provide, among other things, for the issuance of a capital directive, which is a final order issued to a bank that fails to maintain minimum capital or to restore its capital to the minimum capital requirement within a specified time period. Such directive is enforceable in the same manner as a final cease-and-desist order. At December 31, 2009, the Bank’s Tier 1 risk based capital ratio was 11.41%, its Total risk based capital ratio was 12.66% and its Leverage Capital ratio was 10.23%. At December 31, 2009, the Company’s Tier 1 Capital was 11.48%, its Total Capital was 12.73% and its Leverage Capital ratio was 10.29%.
Prompt Corrective Action. Under Section 38 of the FDIA, each federal banking agency is required to implement a system of prompt corrective action for institutions which it regulates. The federal banking agencies have promulgated substantially similar regulations to implement the system of prompt corrective action established by Section 38 of the FDIA. Under the regulations, a bank shall be deemed to be: (i) “well capitalized” if it has a Total Risk Based Capital Ratio of 10.0% or more, a Tier 1 Risk Based Capital Ratio of 6.0% or more, a Leverage Capital Ratio of 5.0% or more and is not subject to any written capital order or directive; (ii) “adequately capitalized” if it has a Total Risk Based
70
Capital Ratio of 8.0% or more, a Tier 1 Risk Based Capital Ratio of 4.0% or more and a Tier 1 Leverage Capital Ratio of 4.0% or more (3.0% under certain circumstances) and does not meet the definition of “well capitalized;” (iii) “undercapitalized” if it has a Total Risk Based Capital Ratio that is less than 8.0%, a Tier 1 Risk based Capital Ratio that is less than 4.0% or a Leverage Capital Ratio that is less than 4.0% (3.0% under certain circumstances); (iv) “significantly undercapitalized” if it has a Total Risk Based Capital Ratio that is less than 6.0%, a Tier 1 Risk Based Capital Ratio that is less than 3.0% or a Leverage Capital Ratio that is less than 3.0%; and (v) “critically undercapitalized” if it has a ratio of tangible equity to total assets that is equal to or less than 2.0%.
An institution generally must file a written capital restoration plan which meets specified requirements with an appropriate federal banking agency within 45 days of the date the institution receives notice or is deemed to have notice that it is undercapitalized, significantly undercapitalized or critically undercapitalized. A federal banking agency must provide the institution with written notice of approval or disapproval within 60 days after receiving a capital restoration plan, subject to extensions by the applicable agency. An institution which is required to submit a capital restoration plan must concurrently submit a performance guaranty by each company that controls the institution. Such guaranty shall be limited to the lesser of (i) an amount equal to 5.0% of the institution’s total assets at the time the institution was notified or deemed to have notice that it was undercapitalized or (ii) the amount necessary at such time to restore the relevant capital measures of the institution to the levels required for the institution to be classified as adequately capitalized. Such a guaranty shall expire after the federal banking agency notifies the institution that it has remained adequately capitalized for each of four consecutive calendar quarters. An institution which fails to submit a written capital restoration plan within the requisite period, including any required performance guaranty, or fails in any material respect to implement a capital restoration plan, shall be subject to the restrictions in Section 38 of the FDIA which are applicable to significantly undercapitalized institutions. At December 31, 2009, the Company and Bank were each considered to be a “well capitalized” institution for purposes of Section 38 of the FDIA.
A “critically undercapitalized institution” is to be placed in conservatorship or receivership within 90 days unless the FDIC formally determines that forbearance from such action would better protect the deposit insurance fund. Unless the FDIC or other appropriate federal banking regulatory agency makes specific further findings and certifies that the institution is viable and is not expected to fail, an institution that remains critically undercapitalized on average during the fourth calendar quarter after the date it becomes critically undercapitalized must be placed in receivership. The general rule is that the FDIC will be appointed as receiver within 90 days after a bank becomes critically undercapitalized unless extremely good cause is shown and an extension is agreed to by the federal regulators. In general, good cause is defined as capital which has been raised and is imminently available for infusion into the bank except for certain technical requirements which may delay the infusion for a period of time beyond the 90 day time period.
Immediately upon becoming undercapitalized, an institution shall become subject to the provisions of Section 38 of the FDIA, which (i) restrict payment of capital distributions and management fees; (ii) require that the appropriate federal banking agency monitor the condition of the institution and its efforts to restore its capital; (iii) require submission of a capital restoration plan; (iv) restrict the growth of the institution’s assets; and (v) require prior approval of certain expansion proposals. The appropriate federal banking agency for an undercapitalized institution also may take any number of discretionary supervisory actions if the agency determines that any of these actions is necessary to resolve the problems of the institution at the least possible long-term cost to the deposit insurance fund, subject in certain cases to specified procedures. These discretionary supervisory actions include: requiring the institution to raise additional capital; restricting transactions with affiliates; requiring divestiture of the institution or the sale of the institution to a willing purchaser; and any other supervisory action that the agency deems appropriate. These and additional mandatory and permissive supervisory actions may be taken with respect to significantly undercapitalized and critically undercapitalized institutions.
Additionally, under Section 11(c)(5) of the FDIA, a conservator or receiver may be appointed for an institution where: (i) an institution’s obligations exceed its assets; (ii) there is substantial dissipation of the institution’s assets or earnings as a result of any violation of law or any unsafe or unsound practice; (iii) the institution is in an unsafe or unsound condition; (iv) there is a willful violation of a cease-and-desist order; (v) the institution is unable to pay its obligations in the ordinary course of business; (vi) losses or threatened losses deplete all or substantially all of an institution’s capital, and there is no reasonable prospect of becoming “adequately capitalized” without assistance; (vii) there is any violation of law or unsafe or unsound practice or condition that is likely to cause insolvency or substantial dissipation of assets or earnings, weaken the institution’s condition, or otherwise seriously prejudice the interests of depositors or the insurance fund; (viii) an institution ceases to be insured; (ix) the institution is undercapitalized and has no reasonable prospect that it will become adequately capitalized, fails to become adequately capitalized when required to do so, or fails to submit or materially implement a capital restoration plan; or (x) the institution is critically undercapitalized or otherwise has substantially insufficient capital.
71
Regulatory Enforcement Authority. Federal banking law grants substantial enforcement powers to federal banking regulators. This enforcement authority includes, among other things, the ability to assess civil money penalties, to issue cease-and-desist or removal orders and to initiate injunctive actions against banking organizations and institution-affiliated parties. In general, these enforcement actions may be initiated for violations of laws and regulations and unsafe or unsound practices. Other actions or inactions may provide the basis for enforcement action, including misleading or untimely reports filed with regulatory authorities.
As a result of the volatility and instability in the financial system during 2008, the Congress, the bank regulatory authorities and other government agencies have called for or proposed additional regulation and restrictions on the activities, practices and operations of banks and their holding companies. In addition to proposals that relate to institutions, such as the Company, that have accepted investments from, or sold troubled assets to, the Department of the Treasury or other government instrumentalities, or otherwise participate in government programs intended to promote financial stabilization, the Congress and the federal banking agencies have broad authority to require all banks and holding companies to adhere to more rigorous or costly operating procedures, corporate governance procedures, or to engage in activities or practices which they would not otherwise elect. Any such requirement could adversely affect the Company’s and Bank’s business and results of operations.
Deposit Insurance Premiums. The FDIC maintains a risk based assessment system for determining deposit insurance premiums. Four risk categories (I-IV), each subject to different premium rates, are established, based upon an institution’s status as well capitalized, adequately capitalized or undercapitalized, and the institution’s supervisory rating. During 2009, all insured depository institutions paid deposit insurance premiums, with initial base assessment rates ranging between 12 and 16 basis points on an institution’s assessment base for institutions in risk category I (well capitalized institutions perceived as posing the least risk to the insurance fund), and 22, 32 and 45 basis points for institutions in risk categories II, III, and IV. The levels of rates are subject to periodic adjustment by the FDIC.
There are three adjustments that could be made to an institution’s initial base assessment rate: (1) a potential decrease for long-term unsecured debt, including senior and subordinated debt and, for small institutions, a portion of Tier 1 capital; (2) a potential increase for secured liabilities above a threshold amount; and (3) for non-Risk Category I institutions, a potential increase for brokered deposits above a threshold amount, other than those received through a deposit placement network on a reciprocal basis. The schedule for base assessment rates and potential adjustment is set forth in the following table.
| Risk Category I |
Risk Category II |
Risk Category III |
Risk Category IV | |||||
| Initial Base Assessment Rate |
12 – 16 | 22 | 32 | 45 | ||||
| Unsecured Debt Adjustment |
(5) – 0 | (5) – 0 | (5) – 0 | (5) – 0 | ||||
| Secured Liability Adjustment |
0 to 8 | 0 to 11 | 0 to 16 | 0 to 22.5 | ||||
| Brokered Deposit Adjustment |
N/A | 0 to 10 | 0 to 10 | 0 to 10 | ||||
| Total Base Assessment Rate |
7 to 24 | 17 to 43 | 27 to 58 | 40 to 77.5 |
Additionally, the Bank has elected to participate in the FDIC program whereby non-interest bearing transaction account deposits will be insured without limitation through June 30, 2010. The bank is required to pay an additional premium to the FDIC of 15 basis points on the amount of balances in non-interest bearing transaction accounts that exceed the existing deposit insurance limit of $250,000.
PROPERTIES
The Bank offers its services from its main office, located at 5350 Lee Highway in Arlington, Virginia, and twenty-seven additional banking offices, one mortgage lending office, one investment services office and its bank operations center. The main office consists of two connected red brick buildings, contains an aggregate of approximately 18,000 square feet of space on three levels. The Bank utilizes one of the buildings, containing approximately 10,000 square feet, as the executive offices and a branch facility. In August 1995, the Bank sold the connected building which it had previously leased out. The Bank operates a branch located at 2930 Wilson
72
Boulevard, Arlington, Virginia. That property, which consists of a stand alone brick building containing approximately 2,400 square feet on a parcel of approximately 18,087 square feet, was purchased by the Bank in April 1997. The Bank also operates a branch location at 5140 Duke Street, Alexandria, Virginia. That property, which consists of a two story brick building containing approximately 4,800 square feet on a parcel of approximately 16,800 square feet, was also purchased by the Bank in April 1997.
The Bank leases twenty-eight office locations: the Alexandria Office, located at 1414 Prince Street, Alexandria, Virginia, consists of 2,500 square feet; the McLean Office, located at 1356 Chain Bridge Road, McLean, Virginia, consists of 1,625 square feet; the Williamsburg Boulevard Office, located at 6500 Williamsburg Road, Arlington, Virginia, consists of 1,781 square feet; the Annandale Office, located at 4230 John Marr Drive, Annandale, Virginia, consists of 2,400 square feet; the Fairfax Office, located at 4021 University Drive, Fairfax Virginia, consists of 3,000 square feet; the Vienna Office, located at 374 Maple Avenue, Vienna, Virginia, consists of 5,831 square feet; the King Street Office, located at 506 King Street, Alexandria Virginia, consists of 1,484 square feet; the Chantilly Office, located at 13881 G Metrotech Drive, Chantilly Virginia, consists of 1,950 square feet; the Lake Ridge office, located at 2030 Old Bridge Road, Lake Ridge, Virginia consists of 2,492 square feet; the Reston Office, located at 11820 Spectrum Center, Reston Virginia consists of 3,700 square feet; the Mount Vernon office, located at 7901 Richmond Highway, Alexandria, Virginia, consists of 2,831 square feet; the Walney Road office, located at 4221Walney Road, Chantilly, Virginia, consists of 2,661 square feet; the Del Ray office, located at 2401 Mount Vernon Avenue, Alexandria, Virginia, consists of 1,750 square feet; the Tysons Corner office, located at 8251 Greensboro Drive, McLean, Virginia, consists of 1,801 square feet; the Battlefield office, located at 10830 Balls Ford Road, Manassas, Virginia, consists of 7,409 square feet; the Newington office, located at 7830 Backlick Road, Springfield, Virginia, consists of 2,778 square feet; the Signal Hill office, located at 9161 Liberia Avenue, Manassas, Virginia, consists of 3,613 square feet; the Ryan Park office, located at 21885 Ryan Center Way, Ashburn, Virginia, consists of 2,656 square feet; the Courthouse Road office, located at 10800 A Courthouse Road, Fredericksburg, Virginia, consists of 3,000 square feet; the Centre Ridge office, located at 6335 Multiplex Drive, Centreville, Virginia, consists of 2,870 square feet; the Leesburg office, located at 341 East Market Street, Leesburg, Virginia, consists of 2,705 square feet; the Central Park office, located at 1304 Central Park Blvd., Fredericksburg, Virginia, consists of 3,000 square feet; the Dulles Trade Center office, located at 23510 Overland Drive, Sterling, Virginia, consists of 3,000 square feet; the Falls Church office, located at 7116 Leesburg Pike, Falls Church, Virginia, consists of 2,014 square feet; the Princeton Woods office, located at 17054 Jefferson Davis Highway, Dumfries, Virginia, consists of 3,000 square feet; the Fairfax Lending office, located at 4221 Walney Road, Chantilly, Virginia, consists of 17,273 square feet; the Leesburg Lending office, located at 50 Catoctin Circle, Leesburg, Virginia, consists of 1,638 square feet; and the Bank’s operations center, located at 14201 Sullyfield Circle, Chantilly, Virginia consists of 25,001 square feet. Generally the leases contain renewal option clauses for one or two additional five-year terms, and in some instances require payment of certain operating charges. The total rental expense under the leases was $5.0 million in 2009. The total minimum rental commitment under the leases as of December 31, 2009 is as follows: $4.0 million for 2010; $3.8 million for 2011, $3.9 million for 2012, $3.9 million for 2013, $3.5 million for 2014 and $15.0 million for 2015 and beyond.
MARKET PRICE OF STOCK AND DIVIDENDS
The Company’s stock is traded on the Nasdaq Global Select Market under the symbol “VCBI”. Set forth below is the range of high and low sales prices (adjusted for stock dividends and splits), as reported by Nasdaq, for each full quarterly period within the two most recent fiscal years.
MARKET PRICE OF STOCK
| 2009 | 2008 | |||||||||||
| Quarter |
High | Low | High | Low | ||||||||
| First |
$ | 5.70 | $ | 2.78 | $ | 11.22 | $ | 8.49 | ||||
| Second |
$ | 4.38 | $ | 2.27 | $ | 11.26 | $ | 4.84 | ||||
| Third |
$ | 3.99 | $ | 2.39 | $ | 6.25 | $ | 3.86 | ||||
| Fourth |
$ | 4.24 | $ | 3.51 | $ | 6.12 | $ | 3.42 | ||||
The Company has not paid cash dividends since 1995, electing to retain earnings for funding the growth of the Company and its business. The Company currently anticipates continuing the policy of retaining earnings to fund growth. The ability of the Company to pay dividends, should it elect to do so, depends largely upon the ability of the Bank to declare and pay dividends to the Company, as the principal source of the Company’s revenue is dividends
73
paid by the Bank. Future dividends will depend primarily upon the Bank’s earnings, financial condition, and need for funds, as well as governmental policies and regulations applicable to the Company and the Bank, which limit the amount that may be paid as dividends without prior approval. Under the terms of the Series A Preferred Stock issued to Treasury under the Capital Purchase Program, the Company may not commence paying cash dividends on the common stock during the first three years the Treasury owns the preferred stock, warrants or Warrant shares, without prior approval. Additionally, the Company may not pay cash dividends on the common stock while any dividend on the Series A Preferred Stock is in arrears.
At December 31, 2009, the Company had 507 stockholders of record, and an aggregate of approximately 2,500 beneficial owners. Information regarding stock dividends and splits in 2008 and 2007, is as follows:
| 1. | A 10% stock dividend was declared on March 26, 2008, for stockholders of record on April 14, 2008, and was paid on May 7, 2008. |
| 2. | A 10% stock dividend was declared on March 28, 2007, for stockholders of record on April 16, 2007, and was paid on May 1, 2007. |
Issuer Repurchases of Common Stock. No shares of the Company’s common stock were repurchased by or on behalf of the Company during the fourth quarter of 2009.
STOCK PERFORMANCE COMPARISON
The following table compares the cumulative total return on a hypothetical investment of $100 in Virginia Commerce Bancorp’s common stock at the closing price on December 31, 2004 through December 31, 2009, with the hypothetical cumulative total return on the Nasdaq Stock Market Index (Total U.S.) and the Nasdaq Bank Index for the comparable period.
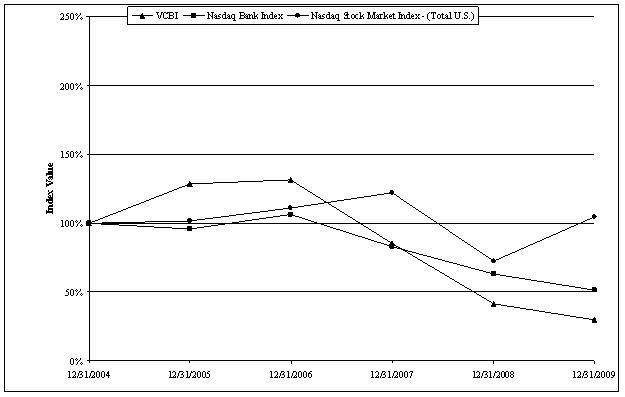
74
| December 31, | ||||||||||||||||||
| 2004 | 2005 | 2006 | 2007 | 2008 | 2009 | |||||||||||||
| Virginia Commerce Bancorp, Inc. |
$ | 100.00 | $ | 128.40 | $ | 131.62 | $ | 85.43 | $ | 41.42 | $ | 30.04 | ||||||
| Nasdaq Stock Market Index - (Total U.S.) |
$ | 100.00 | $ | 101.37 | $ | 111.03 | $ | 121.92 | $ | 72.49 | $ | 104.31 | ||||||
| Nasdaq Bank Index |
$ | 100.00 | $ | 95.67 | $ | 106.20 | $ | 82.76 | $ | 62.96 | $ | 51.31 | ||||||
Annual Meeting of Stockholders
The annual meeting of stockholders of Virginia Commerce Bancorp, Inc. will be held at 4:00 pm on Wednesday, April 28, 2010 at The Washington Golf and Country Club, 3017 North Glebe Road, Arlington, Virginia.
Annual Report on Form 10-K
A copy of Form 10-K as filed with the Securities and Exchange Commission is available without charge to stockholders upon written request to:
Krista DiVenere
Assistant Controller
Virginia Commerce Bancorp, Inc.
14201 Sullyfield Circle, Suite 500
Chantilly, Virginia 20151
Internet Access To Company Documents
The Company provides access to its SEC filings through the Bank’s web site at www.vcbonline.com. After accessing the web site, the filings are available upon selecting “About VCB/Investor Relations/SEC Filings.” Reports available include the annual report on Form 10-K, quarterly reports on Form 10-Q, current reports on Form 8-K, and all amendments to those reports as soon as reasonably practicable after the reports are electronically filed or furnished to the SEC.
FINANCIAL STATEMENTS AND EXHIBITS
The following financial statements are included in this report:
Consolidated Balance Sheets at December 31, 2008 and 2009
Consolidated Statements of Operations for the years ended December 31, 2007, 2008 and 2009
Consolidated Statements of Cash Flows for the years ended December 31, 2007, 2008 and 2009
Consolidated Statements of Changes in Stockholders’ Equity for the years ended December 31, 2007, 2008 and 2009
Notes to the Consolidated Financial Statements
Reports of Independent Registered Public Accounting Firm
All financial statement schedules have been omitted as the required information is either inapplicable or included in the consolidated financial statements or related notes.
Exhibits
| Exhibit No. |
Description | |
| 3.1 |
Articles of Incorporation of Virginia Commerce Bancorp, Inc., as amended (1) | |
| 3.2 |
Articles of Amendment to the Articles of Incorporation relating to the Series A Preferred Stock (2) | |
| 3.3 |
Amended and Restated Bylaws of Virginia Commerce Bancorp, Inc. (3) | |
| 4.1 |
Junior Subordinated Indenture, dated as of December 19, 2002 between Virginia Commerce Bancorp, Inc. and The Bank of New York, as Indenture Trustee (4) | |
| 4.2 |
Amended and Restated Declaration of Trust, dated as of December 19, 2002 among Virginia Commerce Bancorp, Inc., The Bank of New York, as Property Trustee, The Bank of New York (Delaware), as Delaware Trustee, and Peter A. Converse, William K. Beauchesne and Marcia J. Hopkins as Administrative Trustees (4) | |
| 4.3 |
Guarantee Agreement dated as of December 19, 2002, between Virginia Commerce Bancorp, Inc. and The Bank of New York, as Guarantee Trustee (4) | |
75
| Exhibit No. |
Description | |
| 4.4 |
Junior Subordinated Indenture, dated as of December 20, 2005 between Virginia Commerce Bancorp, Inc. and Wilmington Trust Company, as Trustee, (4) | |
| 4.5 |
Amended and Restated Declaration of Trust, dated as December 20, 2005, between Virginia Commerce Bancorp, Inc. and Wilmington Trust Company, as Delaware Trustee and Institutional Trustee, and Peter A. Converse, William K. Beauchesne and Marcia J. Hopkins as Administrative Trustees (4) | |
| 4.6 |
Guarantee Agreement dated as of December 20, 2005, between Virginia Commerce Bancorp, Inc. and Wilmington Trust Company, as Guarantee Trustee (4) | |
| 4.7 |
Junior Subordinated Indenture, dated as of September 24, 2008, between Virginia Commerce Bancorp, Inc. and Wilmington Trust Company, as Indenture Trustee (5) | |
| 4.8 |
Amended and Restated Declaration of Trust, dated as of September 24, 2008 among Virginia Commerce Bancorp, Inc., Wilmington Trust Company, as Property Trustee, Wilmington Trust Company (Delaware), as Delaware Trustee, and Peter A. Converse, William K. Beauchesne and Jennifer Manning as Administrative Trustees (5) | |
| 4.9 |
Guarantee Agreement dated as of September 24, 2008, between Virginia Commerce Bancorp, Inc. and Wilmington Trust Company, as Guarantee Trustee (5) | |
| 4.10 |
Warrant to Purchase Common Stock issued in connection with 2008 Trust Preferred Securities (5) | |
| 4.10 |
Warrant to Purchase Common Stock issued pursuant to Capital Purchase Program (6) | |
| 10.1* |
Amended and Restated 1998 Stock Option Plan (7) | |
| 10.2* |
Virginia Commerce Bancorp Employee Stock Purchase Plan (8) | |
| 10.3* |
2007 Virginia Commerce Bank Executive and Director Deferred Compensation Plan (9) | |
| 10.4* |
Description of Change in Control Arrangement with CEO | |
| 11 |
Statement Regarding Computation of Per Share Earnings See Note 9 to the Consolidated Financial Statements | |
| 21 |
Subsidiaries of the Registrant | |
| 23 |
Consent of Yount, Hyde & Barbour, P.C., Independent Registered Public Accounting Firm | |
| 31.1 |
Certification of Peter A. Converse, Chief Executive Officer pursuant to Rule 13a-14(a) | |
| 31.2 |
Certification of William K. Beauchesne, Treasurer and Chief Financial Officer pursuant to Rule 13a-14(a) | |
| 32.1 |
Certification of Peter A. Converse, Chief Executive Officer pursuant to 18 U.S.C. Section 1350 | |
| 32.2 |
Certification of William K. Beauchesne, Treasurer and Chief Financial Officer pursuant to 18 U.S.C. Section 1350 | |
| 99.1 |
Certification of Principal Financial Officer, Peter A. Converse, Chief Executive Officer pursuant to 31 C.F.R. Section 30.15 | |
| 99.2 |
Certification of Principal Financial Officer, William K. Beauchesne, Treasurer and Chief Financial Officer pursuant to 31 C.F.R. Section 30.15 | |
| * | Indicates management contract. |
| (1) | Incorporated by reference to the same numbered exhibit to the Company’s Quarterly Report on Form 10-Q for the quarter ended March 31, 2006. |
| (2) | Incorporated by reference to exhibit 3.1 to the Company’s Current Report on Form 8-K filed on December 15, 2008. |
| (3) | Incorporated by reference to exhibit 3.2 to the Company’s Current Report on Form 8-K filed July 27, 2007. |
| (4) | Not filed in accordance with the provisions of Item 601(b)(4)(iii) of Regulation S-K. Virginia Commerce Bancorp, Inc. agrees to provide a copy of these documents to the Commission upon request. |
| (5) | Incorporated by reference to the Company’s Current Report on Form 8-K filed on September 25, 2008. |
| (6) | Incorporated by reference to exhibit 4.1 to the Company’s Current Report on Form 8-K filed on December 15, 2008. |
| (7) | Incorporated by reference to exhibit 4 to the Company’s Registration Statement on Form S-8 filed on April 30, 2007 (No. 333-142447). |
| (8) | Incorporated by reference to exhibit 4 to the Company’s Registration Statement on Form S-8 filed on September 24, 2003 (No. 333-109079). |
| (9) | Incorporated by reference to the same numbered exhibit to the Company’s annual Report on Form 10-K for the year ended December 31, 2006. |
76
SIGNATURES
Pursuant to the requirements of Section 13 or 15(d) of the Securities Exchange Act of 1934, the registrant has duly caused this report to be signed on its behalf by the undersigned, thereunto duly authorized.
| VIRGINIA COMMERCE BANCORP, INC. | ||
| By: | /s/ Peter A. Converse | |
| Peter A. Converse, Chief Executive Officer | ||
Dated: March 19, 2010
Pursuant to the requirements of the Securities Exchange Act of 1934, this report has been signed below by the following persons on behalf of the registrant and in the capacities and on the dates indicated.
| Name |
Capacity |
Date | ||
| /s/ Leonard Adler Leonard Adler |
Director |
March 19, 2010 | ||
| /s/ Michael G. Anzilotti Michael G. Anzilotti |
Director, President |
March 19, 2010 | ||
| /s/ Peter A. Converse Peter A. Converse |
Director, Chief Executive Officer (Principal Executive Officer) |
March 19, 2010 | ||
| /s/ W. Douglas Fisher W. Douglas Fisher |
Chairman of the Board of Directors |
March 19, 2010 | ||
| /s/ David M. Guernsey David M. Guernsey |
Vice Chairman of the Board of Directors |
March 19, 2010 | ||
| /s/ Robert H. L’Hommedieu Robert H. L’Hommedieu |
Director |
March 19, 2010 | ||
| /s/ Kenneth R. Lehman Kenneth R. Lehman |
Director |
March 19, 2010 | ||
| /s/ Norris E. Mitchell Norris E. Mitchell |
Director |
March 19, 2010 | ||
| /s/ Todd A. Stottlemyer Todd A. Stottlemyer |
Director |
March 19, 2010 | ||
| /s/ Arthur L. Walters Arthur L. Walters |
Vice Chairman of the Board of Directors |
March 19, 2010 | ||
| /s/ William K. Beauchesne William K. Beauchesne |
Treasurer and Chief Financial Officer (Principal Financial and Accounting Officer) |
March 19, 2010 | ||
77