Attached files
| file | filename |
|---|---|
| EX-23.2 - CONSENT OF GRANT THORNTON LLP - DriveTime Automotive, Inc. | dex232.htm |
Table of Contents
As filed with the Securities and Exchange Commission on March 19, 2010
Registration No. 333-164652
UNITED STATES
SECURITIES AND EXCHANGE COMMISSION
WASHINGTON, DC 20549
Amendment No. 1
to
FORM S-1
REGISTRATION STATEMENT
UNDER
THE SECURITIES ACT OF 1933
DriveTime Automotive, Inc.
(Exact Name of Registrant as Specified in Its Charter)
| Delaware | 5500 | 27-1483732 | ||
| (State or Other Jurisdiction of Incorporation or Organization) |
(Primary Standard Industrial Classification Code Number) |
(I.R.S. Employer Identification Number) |
4020 East Indian School Road
Phoenix, Arizona 85018
(602) 852-6600
(Address, Including Zip Code, and Telephone Number, Including Area Code, of Registrant’s Principal Executive Offices)
Jon D. Ehlinger
General Counsel
DriveTime Automotive, Inc.
4020 East Indian School Road
Phoenix, Arizona 85018
(602) 852-6600
(Name, Address, Including Zip Code, and Telephone Number, Including Area Code, of Agent For Service)
Copies to:
| Steven D. Pidgeon, Esq. David P. Lewis, Esq. DLA Piper LLP (US) 2525 East Camelback Road, Suite 1000 Phoenix, Arizona 85016 (480) 606-5100 |
Deanna L. Kirkpatrick, Esq. Davis Polk & Wardwell LLP 450 Lexington Avenue New York, New York 10017 (212) 450-4000 |
Approximate date of commencement of proposed sale to the public: As soon as practicable after this registration statement becomes effective.
If any of the securities being registered on this form are to be offered on a delayed or continuous basis pursuant to Rule 415 under the Securities Act of 1933, check the following box. ¨
If this form is filed to register additional securities for an offering pursuant to Rule 462(b) under the Securities Act, check the following box and list the Securities Act registration statement number of the earlier effective registration statement for the same offering. ¨
If this form is a post-effective amendment filed pursuant to Rule 462(c) under the Securities Act, check the following box and list the Securities Act registration statement number of the earlier effective registration statement for the same offering. ¨
If this form is a post-effective amendment filed pursuant to Rule 462(d) under the Securities Act, check the following box and list the Securities Act registration statement number of the earlier effective registration statement for the same offering. ¨
Indicate by check mark whether the registrant is a large accelerated filer, an accelerated filer, a non-accelerated filer, or a smaller reporting company. See the definitions of “large accelerated filer,” “accelerated filer” and “smaller reporting company” in Rule 12b-2 of the Exchange Act. (Check one):
| Large accelerated filer ¨ |
Accelerated filer ¨ | |
| Non-accelerated filer x (Do not check if a smaller reporting company) |
Smaller reporting company ¨ |
The registrant hereby amends this registration statement on such date or dates as may be necessary to delay its effective date until the registrant shall file a further amendment which specifically states that this registration statement shall thereafter become effective in accordance with Section 8(a) of the Securities Act or until the registration statement shall become effective on such date as the Commission, acting pursuant to said Section 8(a), shall determine.
Table of Contents
The information in this preliminary prospectus is not complete and may be changed. We may not sell these securities until the registration statement filed with the Securities and Exchange Commission is effective. This preliminary prospectus is not an offer to sell these securities and it is not soliciting an offer to buy these securities in any jurisdiction where the offer or sale is not permitted.
Subject to Completion, dated March 19, 2010
Preliminary Prospectus
Shares

Common Stock
This is the initial public offering of common stock of DriveTime Automotive, Inc. We are offering shares of our common stock.
Prior to this offering, there has been no public market for our common stock. The initial public offering price of our common stock is expected to be between $ and $ per share. We have applied to list our common stock on the New York Stock Exchange under the symbol “DTA.”
Investing in our common stock involves risks. See “Risk Factors” beginning on page 13.
| Per Share | Total | |||||
| Public offering price |
$ | $ | ||||
| Underwriting discounts and commissions |
$ | $ | ||||
| Proceeds, before expenses, to us |
$ | $ | ||||
We have granted the underwriters a 30-day option to purchase up to a maximum of additional shares of common stock from us at the public offering price, less the underwriting discounts and commissions, to cover over-allotment of shares, if any.
Neither the Securities and Exchange Commission nor any state securities commission has approved or disapproved of these securities or determined if this prospectus is truthful or complete. Any representation to the contrary is a criminal offense.
Delivery of the shares of common stock will be made on or about , 2010.
Joint Book-Running Managers
| Jefferies & Company | Stephens Inc. | |
Prospectus dated , 2010
Table of Contents
| Page | ||
| 1 | ||
| 13 | ||
| 30 | ||
| 31 | ||
| 31 | ||
| 32 | ||
| 34 | ||
| 36 | ||
| Management’s Discussion and Analysis of Financial Condition and Results of Operations |
40 | |
| 73 | ||
| 89 | ||
| 94 | ||
| 103 | ||
| 108 | ||
| 110 | ||
| 115 | ||
| Certain Material U.S. Federal Tax Consequences for Non-U.S. Holders of Common Stock |
116 | |
| 119 | ||
| 124 | ||
| 124 | ||
| 124 | ||
| A-1 | ||
| F-1 |
About This Prospectus
You should rely only on the information contained in this prospectus. We have not authorized anyone to provide you with information different from that contained in this prospectus. We are offering to sell, and seeking offers to buy, shares of common stock only in jurisdictions where offers and sales are permitted. You should assume that the information contained in this prospectus is accurate only as of the date of this prospectus, regardless of the time of delivery of this prospectus or of any sale of common stock. Our business, financial condition, results of operations, and prospects may have changed since that date.
Until , 2010 (25 days after the date of this prospectus), all dealers, whether or not participating in this offering, that effect transactions in these securities may be required to deliver a prospectus. This is in addition to the dealer’s obligation to deliver a prospectus when acting as an underwriter in this offering and when selling previously unsold allotments or subscriptions.
Industry Data
We use industry and market data throughout this prospectus, which we have obtained from market research, independent industry publications or other publicly available information. These sources generally state that the information they provide has been obtained from sources believed to be reliable, but that the accuracy and completeness of the information are not guaranteed. Although we believe that each such source is reliable as of its respective date, the information contained in such sources has not been independently verified. While we are not aware of any misstatements regarding any industry and market data presented herein, such data is subject to change based on various factors, including those discussed under the heading “Risk Factors” in this prospectus.
Table of Contents
This summary highlights information contained elsewhere in this prospectus. This summary sets forth the material terms of the offering, but does not contain all of the information that you should consider before investing in our common stock. You should read the entire prospectus carefully before making an investment decision, especially the risks of investing in our common stock described under “Risk Factors.” For a glossary of terms used in this prospectus, see Appendix A.
Overview
We are the leading used vehicle retailer in the United States solely focused on the sale and financing of quality vehicles to the subprime market. Through our branded dealerships, we provide our customers with a comprehensive end-to-end solution for their automotive needs, including the sale, financing, and maintenance of their vehicle. As of December 31, 2009, we owned and operated 78 dealerships and 13 reconditioning facilities in 18 metropolitan areas in 11 states. For the year ended December 31, 2009, we sold 49,500 vehicles, generated $946.3 million of total revenue (which consisted of vehicle sales and interest income), and earned $55.0 million of pre-tax income, including gain on extinguishment of debt of $30.3 million. We provide our customers with financing for substantially all of the vehicles we sell. As of December 31, 2009, our loan portfolio had a total outstanding principal balance of $1.3 billion.
Over the past 17 years, we have developed an integrated business model that consists of vehicle acquisition, reconditioning, sales, underwriting and finance, loan servicing, and after sale support. We believe that our model enables us to operate successfully in the underserved subprime market segment. In addition, we believe that our model will allow us to systematically open new dealerships in existing and new markets throughout the United States.
We operate in the large and highly fragmented used vehicle sales and financing markets. According to CNW, for 2009, industry sales of used vehicles totaled $301.0 billion, which consisted of sales from approximately 53,500 franchise and independent dealers and private transactions. The five largest used vehicle retailers accounted for only 2.7% of the nationwide market share in 2009. At the end of 2009, total used vehicle loans outstanding approximated $806.9 billion and the subprime segment we focus on comprised 21.7% of total automobile loans outstanding. Within the subprime market, we cater to customers who have the income necessary to purchase a used vehicle, but because of their impaired credit histories, cannot qualify for financing from traditional third-party sources. Our average customer is 25 to 55 years of age, has an annual income of $24,000 to $56,000, and has a credit score, as determined by Fair Isaac & Co. (“FICO”), between 450 and 570. FICO scores range from 350 to 850, and a customer with a FICO score below 620 is typically considered to have subprime credit.
We believe the key competitive factors to effectively serve customers in this market are: (i) availability of financing, (ii) affordability of down payments and installment payments, (iii) breadth and desirability of vehicle selection, (iv) quality of the vehicles and the warranty provided, and (v) convenience of dealership locations and customer service. In general, the other primary buying options for customers in this segment are to purchase older, higher mileage vehicles from small, independent used vehicle dealers, or in private transactions with individuals.
We believe that our business model has several advantages over our competition and that we provide our customers with a unique buying experience featuring:
| (1) | branded, attractive dealership facilities, each of which maintains a large inventory of quality, reconditioned used vehicles; |
1
Table of Contents
| (2) | professional and courteous service with “no haggle” pricing and a three day “no questions asked” return policy; |
| (3) | vehicle financing with affordable down payments and installment payments; |
| (4) | our DriveCare® limited warranty program (included in the sales price of each vehicle) – a 36 month / 36,000 mile major mechanical warranty, including oil changes at Sears automotive locations nationwide and 24/7 roadside assistance; and |
| (5) | numerous payment options, which include cash payments at over 3,700 Wal-Mart stores and more than 10,400 other locations nationwide, as well as online, by phone, and through other traditional payment methods. |
To provide financing to our customers, we have traditionally relied upon portfolio warehouse facilities and securitization transactions.
Integrated business model
Our integrated business model is focused on giving our customers the ability to acquire quality used vehicles through six key activities:
| • | Vehicle acquisition. We acquire inventory primarily from used vehicle auctions. Our centralized vehicle selection strategy takes into account many factors, including the retail value, age, and costs of buying, reconditioning, and delivering the vehicle for resale, along with buyer affordability and desirability. At December 31, 2009, we employed 28 buyers who average six years of experience with us. For the year ended December 31, 2009, our buyers purchased 53,975 vehicles from 154 auctions nationwide. |
| • | Vehicle reconditioning and distribution. Subsequent to acquisition, vehicles are transported to one of our 13 regional reconditioning facilities, where we recondition the vehicles and perform a rigorous multi-point inspection for safety and operability. On average, we spend approximately $1,000 in reconditioning costs per vehicle sold, including parts and labor. Upon passing our quality assurance testing, we determine the distribution of vehicles to our dealerships based on current inventory mix and levels, along with sales patterns at each dealership. |
| • | Vehicle sales. We utilize targeted television, radio, and online advertising programs to promote our brand and encourage customers to complete an online credit application and visit our dealerships. Customers are guided through the buying process by our trained sales personnel who focus on financing terms, the quality and breadth of our vehicle selection, and after-sale support. |
| • | Underwriting and finance. Using information provided as part of the credit application process, our centralized proprietary credit scoring system determines a customer’s credit grade and the corresponding minimum down payment and maximum installment payment. We monitor the performance of our portfolio and close rates on a real-time basis, allowing us to centrally adjust pricing and financing terms to balance sales volumes and loan performance. |
| • | Loan servicing. We perform all servicing functions for our loan portfolio, from collections through the resale of repossessed vehicles. Our experienced collection staff utilizes our proprietary collection software, which we developed specifically for subprime auto loans. We use behavioral models designed to predict payment habits, as well as automated dialer and messaging systems to enhance collection efficiency. We utilize our buyers’ vehicle acquisition and sales expertise in representing our vehicles at auction in order to maximize the recovery value of repossessed vehicles. |
2
Table of Contents
| • | After sale support. As part of the sale price, we provide a warranty on each vehicle we sell, and we recently extended our warranty program to cover 36 months / 36,000 miles, including oil changes at Sears automotive locations nationwide and 24/7 roadside assistance. We self-administer our warranty program through our in-house team of customer service representatives, including warranty claim specialists who are certified mechanics, and our pre-approved vendor network of independent third-party repair facilities. |
Industry overview
Used vehicle sales. The market for used vehicles is among the largest retail markets in the United States. According to CNW, in 2009 there were 35.5 million used vehicle sale transactions totaling $301.0 billion, representing 77% and 52% of the overall vehicle market by unit sales and dollar volume, respectively. The used vehicle retail industry is highly fragmented, with sales typically occurring through one of three channels: (i) the used vehicle retail operations of the approximately 17,000 manufacturers’ franchised new car dealerships, which represented 36.0% of industry sales in 2009, (ii) approximately 36,500 independent used vehicle dealerships, which represented 32.9% of industry sales in 2009, and (iii) individuals who sell used vehicles in private transactions, which represented 31.1% of industry sales in 2009.
Vehicle financing. According to CNW, at the end of 2009 there was in excess of $1.8 trillion in auto loans outstanding in the United States, of which 44.5% related to used vehicle sales. The industry is generally segmented by credit characteristics of the borrower (prime versus subprime). Originations for customers within the subprime market averaged $78.4 billion per annum (including originations for new and used vehicles) over the last five years ended December 31, 2009. However, subprime automobile originations dropped to $15.7 billion in 2009.
Competitive strengths
We believe we have developed a flexible and adaptive business model that has enabled us to generate profits through the recent economic crisis and that also positions us for growth. Our competitive strengths consist of:
Industry leadership in the subprime auto sales and finance market. We are the leading used vehicle retailer in the United States focusing on the sale and financing of vehicles to the subprime market. We intend to continue to penetrate this highly fragmented market by expanding into new geographies and increasing sales in existing markets. We believe that with the processes we have developed we will be able to open dealerships with a relatively modest capital investment and achieve store profitability in most markets within six to 12 months of store opening.
End-to-end solution for our customers. We provide our customers with a comprehensive end-to-end solution for their automotive needs, including the sale, financing, and maintenance of their vehicle. To serve our customers, we sell quality used vehicles with affordable down payments and installment payments, and provide after sale support with our DriveCare® limited warranty program. To facilitate customer payments we have expanded our customer payment programs to enable our customers to make cash payments at over 3,700 Wal-Mart stores and more than 10,400 other locations nationwide, along with traditional payment methods. We believe that we are the only dealership network operating in our market that provides such a comprehensive solution.
Integrated, centralized business model. We have developed a business model that integrates our vehicle acquisition, reconditioning, sales, underwriting and finance, loan servicing, and after sale support activities, which enables us to control and generate value from each aspect of our business. In addition, we have centralized the key components of
3
Table of Contents
each of these functions. We believe that our integrated business model and centralized operations enable us to carefully manage our business and provide consistent customer service, while providing us with a stable platform for growth.
Sophisticated and proprietary information-based systems and strategies. We have more than 17 years of experience in the subprime market and have developed sophisticated, proprietary systems and databases that help us manage each aspect of our business. We use our credit scoring system to classify customers into various credit grades defined by us based on historical loan performance. The credit grades are used to determine minimum down payments, maximum payment terms, and interest rates. We believe our ability to quantify each customer’s risk profile allows us to better predict loan performance, maintain the quality of our loan portfolio, and enhance our servicing and collections activities. We also believe that these models and databases enable us to rapidly adjust our business model to address changing market demands and customer trends.
Targeted marketing and branding. We have developed uniform television, radio, and online advertising campaigns focused on our ability to provide financing to our target market. Centered around the theme “Approved, Approved, Approved®,” we believe our ad campaigns resonate with our credit-challenged customers by encouraging them to complete a credit application online to obtain pre-approval of their financing needs. Approximately 51% of our customers completed an online credit application before visiting a dealership in the three-month period ended December 31, 2009, up from approximately 35% for the three-month period ended December 31, 2008. We believe our dealership network fosters our brand, featuring attractive facilities that showcase our DriveTime logos and color schemes. In addition, most of our dealerships are located in high traffic commercial districts and we believe they are generally newer and cleaner in appearance than competing, independent dealerships. In many markets, we maintain multiple dealerships and/or a sizeable dealership in a highly visible, high traffic, central location within the market, which we believe has assisted us in developing a leading market position and brand name recognition.
Highly experienced management team with strong operating track record. Our executive management team has centralized our operations, created our data-driven and adaptive business model, and implemented the highly leverageable dealership model we operate today. Our Chairman and sole shareholder, Ernest C. Garcia II, founded the Company 17 years ago. Raymond C. Fidel, our Chief Executive Officer and President; Mark G. Sauder, our Chief Financial Officer; Jon Ehlinger, our Secretary and General Counsel; and Al Appelman, our Chief Credit Officer, have each been with the Company or one of its affiliates for more than nine years. Our eight member senior management team has an average of over 11 years of relevant industry experience.
Business strategies
We intend to leverage our competitive strengths by implementing the following business strategies to expand our dealership base and market share and further distinguish ourselves as the leading used vehicle retailer to the subprime market:
Pursue growth by expanding our dealership network. We believe we are well positioned to expand our dealership network throughout the United States, primarily through organic growth. We believe our centralized and integrated business model enables us to efficiently open new dealerships. Our typical times from site selection to lease execution is one to six months and from lease execution to store opening is two to four months, and we generally achieve profitability within six to 12 months of opening. We seek to locate new stores in existing commercial facilities, typically lease each facility for five years (with options to extend for another five to 15 years), and spend
4
Table of Contents
approximately $350,000 to $450,000 in leasehold improvements and equipment to establish each of our branded dealerships. We generally seek to expand into metropolitan areas in the United States with populations ranging from 500,000 to three million people that have customer demographic concentrations consistent with our target market and that have favorable operating environments. As of December 31, 2009, we had dealerships in 14 of 81 metropolitan areas between 500,000 and three million people, and we had dealerships in four of 16 metropolitan areas with populations in excess of three million people.
Implement business model enhancements. We are implementing enhancements to our business model in order to further distinguish our operations from traditional “buy-here, pay-here” dealerships. Unlike traditional stores serving our market, which require customers to physically make periodic payments at the dealership, we have created programs that allow our customers to make cash payments at over 3,700 Wal-Mart stores and more than 10,400 other locations nationwide, as well as online, by phone, and through other traditional payment methods. Since December 2009, all of our new stores have opened with no collectors and no payments in stores, along with a sales compensation structure weighted more toward salaries than commissions. In addition, we are in the process of consolidating collections for accounts less than 45 days past due at our facility in Dallas, Texas, which will result in the consolidation of all collections at two central facilities, and anticipate that this process will be complete by the end of 2010. These business model enhancements are intended to provide our customers the best experience available in our market, along with further expanding our market leadership position.
Continue to enhance our credit scoring models, business analytics, and technology platforms. We believe continuous enhancement of our industry-leading analytics, processes, and systems is a key driver to our future growth and profitability. We are developing our seventh generation proprietary credit scoring model, which expands and refines the variables utilized by prior generations of scoring models. We intend to continue our efforts to enhance and expand our analytics platform, improve our management information systems and databases, enhance our website and call center systems, and improve our customer lead tracking software and sales systems. We believe that these improvements will serve to expand our competitive edge.
Maintain a strong balance sheet to support the growth of our business. Historically, we have been able to access credit markets that we believe are not typically available to auto dealerships and finance companies serving our customers in the subprime market. We believe that this success is attributable to our size, centralized operations, track record, and strong balance sheet. At December 31, 2009, giving effect to this offering, on a pro forma basis, we will have total equity of approximately $ million and a ratio of total assets to total equity of . We intend to continue to maintain our strong capital and liquidity position to support our growth plans and to provide us with the necessary resources to protect against disruptions in the capital markets.
Recent developments
Our recent financial performance and liquidity were impacted by the turmoil in the credit markets, the deterioration of the securitization market, and the effects of the recession on our customers. Beginning in 2008, we tightened our loan underwriting standards and closed selected dealerships to improve loan performance, reduce origination volume, and reduce operating expenses, and continued to improve operational efficiencies through centralization of certain key functions. We also secured alternative sources of financing, albeit at a substantially higher cost of funds.
In December 2009, we completed our first securitization transaction since June 2007 by issuing $192.6 million of asset-backed securities, which are collateralized by approximately $300.0 million of finance receivables. The asset- backed securities are structured in four tranches with credit ratings ranging from AAA to A, without external credit
5
Table of Contents
enhancement from a monoline insurer. The weighted average coupon of these four tranches was 5.3%. A securities rating is not a recommendation to buy, sell, or hold securities and may be subject to revision or withdrawal at any time. See “Management’s Discussion and Analysis of Financial Condition and Results of Operations – Liquidity and capital resources – Financing sources – Portfolio term financings” for additional information regarding securities ratings.
We believe that with greater access to capital and stabilizing credit markets, we are poised to resume growth of our dealership network.
Recapitalization and other related party transactions
Prior to this offering, Ernest C. Garcia II was our sole beneficial shareholder. As described elsewhere in this prospectus, at December 31, 2009, Verde Investments, Inc., which is wholly-owned by Mr. Garcia, is the holder of all of our outstanding $75.0 million 12% subordinated notes and the holder of $60.1 million of our junior secured notes ($36.1 million of which bear interest at 22% per annum and $24.0 million of which bear interest at 27% per annum). For further information regarding Verde, Mr. Garcia’s role at Verde, and the relationship between us and Verde, see “Certain Relationships and Related Party Transactions.”
In connection with this offering, Verde has agreed to exchange an aggregate of $100.0 million of subordinated notes and junior secured notes for shares of our newly-designated 6.5% convertible preferred stock. These shares of preferred stock, which will vote on an as-converted-to-common-stock basis, will be convertible into shares of our common stock at 115% of the initial public offering price of shares of our common stock sold in this offering, and the shares may be redeemed, at our option, if the closing price of our common stock is 150% or higher than the initial public offering price for 30 consecutive trading days. See “Description of Capital Stock.” The remaining $35.1 million in indebtedness payable to Verde and $2.0 million of junior secured debt payable to Raymond C. Fidel, our President and Chief Executive Officer, will be repaid with a portion of the proceeds of this offering. See “Use of Proceeds.”
In addition, at December 31, 2009, we leased 16 of our dealerships, three of our reconditioning centers, and two additional properties from Verde, and one dealership and one reconditioning facility from Mr. Garcia’s brother-in-law, Steven Johnson. Of these properties, we remain obligated on leases relating to seven locations that we have vacated due to closures in 2008 and 2009. Prior to this offering, Verde and Mr. Johnson will sell the real estate that we currently lease from them to us (including the vacated properties) and the related lease obligations will be terminated. The property that is the subject of these leases will be sold to us for a price equal to their aggregate carrying value at the time of sale. The aggregate carrying value of these properties as of December 31, 2009 was $29.6 million. The aggregate fair market value of these properties (based on 2008 appraisals) was approximately $50.4 million. We are currently in the process of having these properties appraised to assess current market value. In the event that the aggregate market value of the properties is less than cost, the purchase price will be adjusted to the aggregate market value. The properties owned by Mr. Garcia’s brother-in-law will be sold to us for $2.0 million, replacing a total lease obligation of $3.2 million. We will incur or assume indebtedness associated with these properties.
We also have various other relationships with affiliates of Mr. Garcia that are being terminated in connection with this offering. See “Capitalization,” “Management’s Discussion and Analysis of Financial Condition and Results of Operations – Factors affecting comparability,” and “Certain Relationships and Related Party Transactions.”
6
Table of Contents
About DriveTime
DriveTime Automotive, Inc. (DTA) is a newly formed Delaware corporation that was incorporated in December 2009. Pursuant to a reorganization transaction that will be consummated immediately prior to the effectiveness of the Registration Statement on Form S-1 of which this prospectus forms a part, DTA will become the holding company under which we will conduct our operations through two primary operating subsidiaries, DriveTime Automotive Group, Inc. (DTAG), which was incorporated in Arizona in 1992 and reincorporated in Delaware in Delaware in 1996 and focuses on vehicle sales activities, and DT Acceptance Corporation (DTAC), which was incorporated in Arizona in 2003 as a sister company to DTAG and focuses on financing activities. This reorganization transaction will serve to consolidate our businesses under a single holding company to facilitate this public offering of the common stock of DTA. Upon the consummation of the reorganization transaction, the sole shareholder of DTAG and DTAC, Ernest C. Garcia II, will become the sole shareholder of DTA, pending the completion of the offering contemplated hereby. While Mr. Garcia and his affiliates will continue to own a majority of our outstanding common stock upon completion of the offering, we do not expect to seek to be treated as a “controlled company” under the rules of the New York Stock Exchange. The transaction will be accounted for as a reorganization of entities under common control.
Our principal executive offices are located at 4020 East Indian School Road, Phoenix, Arizona 85018, and our telephone number is (602) 852-6600. Our website is located at www.drivetime.com. We also maintain marketing websites, including www.goforapproval.com (for television campaigns), www.militarymerit.com (for military campaigns), and www.go4approval.com (for yellow page campaigns). The information on, or accessible through, our websites does not constitute a part of, and is not incorporated into, this prospectus.
7
Table of Contents
Offering Summary
| Common stock offered by us |
shares (or shares if the underwriters exercise their over-allotment option in full) |
| Over-allotment option |
We have granted the underwriters a 30-day option to purchase up to a maximum of additional shares of common stock from us at the public offering price, less the underwriting discounts and commissions, to cover over-allotment of shares, if any. |
| Common stock outstanding after this offering |
shares (or shares if the underwriters exercise their over-allotment option in full) |
| Use of proceeds |
We estimate that the net proceeds to us from this offering will be approximately $ million, or approximately $ million if the underwriters exercise their over-allotment option in full, based on the midpoint of the price range set forth on the cover page of this prospectus. |
As described in “Use of Proceeds” we intend to use $35.1 million of the proceeds of this offering to retire subordinated notes and junior secured notes payable to Verde, an affiliate of Ernest C. Garcia II, our Chairman and sole shareholder, that are not exchanged for shares of preferred stock, as described elsewhere in this prospectus, $2.0 million to retire junior secured notes that are held by Raymond C. Fidel, our President and Chief Executive Officer, and $ million to repay amounts outstanding under our portfolio warehouse facility. Repaying amounts outstanding under our portfolio warehouse facility will increase our availability under this facility. We intend to use the remaining proceeds, including any proceeds we receive from the underwriters’ exercise of their over-allotment option, to pay the expenses of this offering and for general corporate purposes.
| Dividend policy |
We do not anticipate declaring or paying any cash dividends on our common stock following our initial public offering. |
| Risk factors |
You should carefully read and consider the information set forth under the heading titled “Risk Factors” and all other information set forth in this prospectus before deciding to invest in shares of our common stock. |
| Proposed New York Stock Exchange symbol |
DTA |
The number of shares of our common stock to be outstanding following this offering is based on shares of our common stock outstanding as of , 2010, and excludes shares of common stock reserved for future issuance under our stock-based compensation plans.
Unless otherwise indicated, this prospectus reflects and assumes the following:
| • | no exercise by the underwriters of their option to purchase up to additional shares from us; and |
| • | the rounding of all fractional share amounts to the nearest whole number. |
8
Table of Contents
Summary Financial and Other Data
The following table sets forth summary financial and other data as of the dates and for the periods indicated. The summary combined statements of operations for the years ended December 31, 2007, 2008, and 2009, and the summary combined balance sheet data as of December 31, 2008 and 2009, have been derived from our audited financial statements, which are included elsewhere in this prospectus. The summary combined balance sheet data as of December 31, 2007 has been derived from our audited financial statements which are not included in this prospectus. Our historical results are not necessarily indicative of our results for any future period.
You should read the following financial and other data in conjunction with “Selected Financial and Other Data,” “Management’s Discussion and Analysis of Financial Condition and Results of Operations,” and our combined financial statements and related notes included elsewhere in this prospectus.
| Years Ended December 31, | |||||||||||
| 2007 | 2008 | 2009 | |||||||||
| ($ in thousands) | |||||||||||
| Combined Statements of Operations: |
|||||||||||
| Revenue: |
|||||||||||
| Sales of used vehicles |
$ | 963,621 | $ | 796,750 | $ | 694,460 | |||||
| Interest income |
250,628 | 261,875 | 251,822 | ||||||||
| Total revenue |
1,214,249 | 1,058,625 | 946,282 | ||||||||
| Costs and expenses: |
|||||||||||
| Cost of used vehicles sold |
575,234 | 477,255 | 394,362 | ||||||||
| Provision for credit losses |
283,407 | 300,884 | 223,686 | ||||||||
| Secured debt interest expense |
63,719 | 74,749 | 95,037 | ||||||||
| Unsecured debt interest expense |
12,982 | 22,333 | 15,629 | ||||||||
| Selling and marketing |
36,210 | 28,644 | 31,491 | ||||||||
| General and administrative |
154,018 | 157,311 | 148,350 | ||||||||
| Depreciation expense |
15,784 | 14,088 | 13,061 | ||||||||
| Gain on extinguishment of debt, net (1) |
— | (19,699 | ) | (30,311 | ) | ||||||
| Total costs and expenses |
1,141,354 | 1,055,565 | 891,305 | ||||||||
| Income before income taxes |
72,895 | 3,060 | 54,977 | ||||||||
| Income tax expense (benefit) (2) |
1,000 | 1,090 | 730 | ||||||||
| Net income |
$ | 71,895 | $ | 1,970 | $ | 54,247 | |||||
| Earnings per share: |
|||||||||||
| Basic |
$ | 718.95 | $ | 19.70 | $ | 542.47 | |||||
| Diluted |
$ | 718.95 | $ | 19.70 | $ | 542.47 | |||||
| Dividends per share: |
|||||||||||
| Basic |
$ | 511.94 | $ | 127.33 | $ | 271.10 | |||||
| Diluted |
$ | 511.94 | $ | 127.33 | $ | 271.10 | |||||
| Weighted average number of shares outstanding: |
|||||||||||
| Basic |
100 | 100 | 100 | ||||||||
| Diluted |
100 | 100 | 100 | ||||||||
9
Table of Contents
| Years Ended December 31, | ||||||||||||
| 2007 | 2008 | 2009 | ||||||||||
| ($ in thousands) | ||||||||||||
| (Unaudited) | ||||||||||||
| Pro Forma Income Information: |
||||||||||||
| Historical income before income tax expense |
$ | 72,895 | $ | 3,060 | $ | 54,977 | ||||||
| Pro forma initial public offering adjustments (3) |
— | — | 42,663 | |||||||||
| Pro forma income before pro forma income tax expense |
72,895 | 3,060 | 97,640 | |||||||||
| Pro forma provision for income taxes (4) |
29,092 | 1,701 | 38,470 | |||||||||
| Pro forma net income |
$ | 43,803 | $ | 1,359 | $ | 59,170 | ||||||
| Pro forma net income margin (5) |
3.6 | % | 0.1 | % | 6.3 | % | ||||||
| Other Data: |
||||||||||||
| Adjusted EBITDA (6) |
$ | 104,783 | $ | 33,978 | $ | 78,011 | ||||||
| Adjusted EBITDA margin (7) |
8.6 | % | 3.2 | % | 8.2 | % | ||||||
| Pro forma adjusted EBITDA (6) |
$ | 91,903 | ||||||||||
| Pro forma adjusted EBITDA margin (7) |
9.7 | % | ||||||||||
| As of and for the Years Ended December 31, |
||||||||||||
| 2007 | 2008 | 2009 | ||||||||||
| ($ in thousands, except per vehicle sold data) |
||||||||||||
| (Unaudited) | ||||||||||||
| Dealerships: |
||||||||||||
| Dealerships in operation at end of period |
103 | 86 | 78 | |||||||||
| Average number of vehicles sold per dealership per month |
55 | 49 | 52 | |||||||||
| Retail Sales: |
||||||||||||
| Number of used vehicles sold |
66,922 | 55,415 | 49,500 | |||||||||
| Average age of vehicles sold (in years) |
3.9 | 4.1 | 4.1 | |||||||||
| Average mileage of vehicles sold |
64,898 | 67,428 | 68,076 | |||||||||
| Per vehicle sold data: |
||||||||||||
| Average sales price |
$ | 14,399 | $ | 14,378 | $ | 14,029 | ||||||
| Average cost of vehicle sold |
$ | 8,596 | $ | 8,612 | $ | 7,967 | ||||||
| Average gross margin |
$ | 5,803 | $ | 5,766 | $ | 6,062 | ||||||
| Loan Portfolio: |
||||||||||||
| Principal balances originated |
$ | 959,517 | $ | 789,360 | $ | 686,214 | ||||||
| Average amount financed per origination |
$ | 14,341 | $ | 14,250 | $ | 13,867 | ||||||
| Number of loans outstanding – end of period |
124,228 | 125,070 | 127,737 | |||||||||
| Principal outstanding – end of period |
$ | 1,343,085 | $ | 1,342,855 | $ | 1,312,216 | ||||||
| Average principal outstanding during the period |
$ | 1,271,678 | $ | 1,410,292 | $ | 1,364,782 | ||||||
| Average effective yield on portfolio (8) |
20.0 | % | 19.3 | % | 19.3 | % | ||||||
| Portfolio performance data: |
||||||||||||
| Portfolio delinquencies over 30 days (9) |
8.6 | % | 9.4 | % | 7.4 | % | ||||||
| Net charge-offs as a percentage of average principal outstanding |
18.2 | % | 21.4 | % | 18.2 | % | ||||||
| Financing and Liquidity: |
||||||||||||
| Unrestricted cash and availability (10) |
$ | 126,309 | $ | 50,232 | $ | 40,407 | ||||||
| Net debt to equity (11) |
3.5 | 3.6 | 3.2 | |||||||||
| Weighted average effective borrowing rate on total debt (12) |
7.2 | % | 8.4 | % | 10.6 | % | ||||||
10
Table of Contents
| December 31, | ||||||||||||
| 2007 | 2008 | 2009 | ||||||||||
| ($ in thousands) | ||||||||||||
| Combined Balance Sheet Data: |
||||||||||||
| Cash and cash equivalents |
$ | 42,241 | $ | 25,533 | $ | 21,526 | ||||||
| Restricted cash and investments held in trust (13) |
$ | 107,271 | $ | 71,223 | $ | 84,064 | ||||||
| Finance receivables (14) |
$ | 1,375,961 | $ | 1,375,019 | $ | 1,340,591 | ||||||
| Allowance for credit losses |
$ | (244,034 | ) | $ | (242,600 | ) | $ | (218,259 | ) | |||
| Inventory |
$ | 136,642 | $ | 100,211 | $ | 115,257 | ||||||
| Total assets |
$ | 1,532,060 | $ | 1,447,152 | $ | 1,448,494 | ||||||
| Secured debt |
$ | 1,038,191 | $ | 912,201 | $ | 1,010,728 | ||||||
| Unsecured debt |
$ | 131,823 | $ | 194,866 | $ | 76,487 | ||||||
| Total debt (15) |
$ | 1,170,014 | $ | 1,107,067 | $ | 1,087,215 | ||||||
| Shareholder’s equity |
$ | 293,185 | $ | 282,422 | $ | 309,559 | ||||||
| (1) | During the years ended December 31, 2008 and 2009, we repurchased outstanding indebtedness in the amounts of $96.0 million and $135.2 million, respectively, at a discount to par, resulting in net gains on extinguishment of debt. |
| (2) | We elected to be treated as an S-corporation for federal and state income tax purposes. There is no provision for income taxes in the years ended December 31, 2007, 2008, and 2009, except for a reduced amount of entity level state tax in certain jurisdictions, and for one of our subsidiaries which is a C-corporation. Income and losses flow through to our sole shareholder, who reports such income and losses on individual income tax returns. |
| (3) | Pro forma initial public offering adjustments represent adjustments to income before income taxes as if the offering set forth herein was consummated on January 1, 2009. Included in this adjustment are the following assumptions: (i) net savings of $11.0 million from the termination of related party leases (which includes cancellation of lease payments and $5.9 million of one-time write-offs of lease liabilities and deferred rent), net of depreciation expense on properties acquired; (ii) net savings of $31.6 million in interest expense from repayment of subordinated notes payable, junior secured notes, and senior unsecured notes payable, and reduction in average outstanding balances under portfolio warehouse facilities as a result of the paydown of these debt instruments from net proceeds from the offering. |
| (4) | Pro forma income tax expense has been determined as if we elected to be treated as a C-corporation as of January 1, 2007 for federal and state income tax purposes for the years and periods presented. |
| (5) | Pro forma net income margin represents pro forma net income divided by total revenue. |
| (6) | We define Adjusted EBITDA as net income plus income tax expense; plus non-portfolio interest expense (which includes interest expense associated with our senior unsecured notes, subordinated notes, junior secured notes, and former residual facility); plus depreciation expense; plus store closing costs related to downsizing (and not those closed in the ordinary course of business); plus legal settlement; less gain on extinguishment of debt, net. |
We present Adjusted EBITDA because we consider it to be an important supplemental measure of our operating performance. All of the adjustments made in our calculation of Adjusted EBITDA are adjustments to items that management does not consider to be reflective of our core operating performance. Management considers our core operating performance to be that which can be affected by our managers in any particular period through their management of the resources that affect our underlying revenue and profit generating operations during that period.
However, Adjusted EBITDA is not a recognized measurement under GAAP and when analyzing our operating performance, investors should use Adjusted EBITDA in addition to, and not as an alternative for, net income, operating income, or any other performance measure presented in accordance with GAAP, or as an alternative to cash flow from operating activities or as a measure of our liquidity. Because not all companies use identical calculations, our presentation of Adjusted EBITDA may not be comparable to similarly titled measures of other companies. Adjusted EBITDA has limitations as an analytical tool, as discussed under “Management’s Discussion and Analysis of Financial Condition and Results of Operations – Non-GAAP discussion.”
Pro forma adjusted EBITDA represents adjusted EBITDA on a pro forma basis to give effect to the offering as if the offering were consummated on January 1, 2009.
11
Table of Contents
The following table presents data relating to Adjusted EBITDA, which is a non-GAAP measure, for the periods indicated:
| Years Ended December 31, | ||||||||||
| 2007 | 2008 | 2009 | ||||||||
| ($ in thousands) | ||||||||||
| (Unaudited) | ||||||||||
| Net income |
$ | 71,895 | $ | 1,970 | 54,247 | |||||
| Plus EBITDA adjustments: |
||||||||||
| Income tax expense (benefit) |
1,000 | 1,090 | 730 | |||||||
| Non-portfolio interest expense |
16,104 | 26,545 | 29,199 | |||||||
| Depreciation expense |
15,784 | 14,088 | 13,061 | |||||||
| Store closing costs |
— | 9,984 | 3,485 | |||||||
| Legal settlement |
— | — | 7,600 | |||||||
| Less: gain on extinguishment of debt, net |
— | (19,699 | ) | (30,311 | ) | |||||
| Adjusted EBITDA |
$ | 104,783 | $ | 33,978 | 78,011 | |||||
The following table presents data relating to pro forma adjusted EBITDA, which is a non-GAAP measure, for the period indicated:
| Year Ended December 31, 2009 |
||||
| ($ in thousands) | ||||
| (Unaudited) | ||||
| Pro forma net income |
$ | 59,170 | ||
| Plus: Pro forma EBITDA adjustments: |
||||
| Pro forma income tax expense |
38,470 | |||
| Pro forma depreciation expense |
13,489 | |||
| Pro forma store closing costs |
3,485 | |||
| Pro forma legal settlement |
7,600 | |||
| Less: gain on extinguishment of debt |
(30,311 | ) | ||
| Pro forma adjusted EBITDA |
$ | 91,903 | ||
| (7) | Adjusted EBITDA margin and pro forma adjusted EBITDA margin represents Adjusted EBITDA and pro forma adjusted EBITDA, respectively, divided by total revenue. |
| (8) | Average effective yield represents the interest income earned at the contractual rate (stated APR) less the write-off of accrued interest on charged-off loans and amortization of loan origination costs (which includes the write-off of unamortized loan origination costs on charged-off loans), plus interest earned on investments held in trust and late fees earned. |
| (9) | Delinquencies are presented on a Sunday-to-Sunday basis, which reflects delinquencies as of the nearest Sunday to period end. Sunday is used to eliminate any impact of the day of the week on delinquencies, since delinquencies tend to be higher mid-week. |
| (10) | Unrestricted cash and availability consists of cash and cash equivalents plus available borrowings under the portfolio warehouse, residual, and inventory facilities, based on assets pledged or available to be pledged to the facilities. |
| (11) | Net debt to equity equals total debt less cash, restricted cash, and investments held in trust, divided by shareholder’s equity. |
| (12) | Weighted average effective borrowing rate includes the effect of amortization of discounts, debt issuance costs, and unused line fees. |
| (13) | Restricted cash and investments held in trust consist of cash and cash equivalents pledged as collateral under securitization transactions and the portfolio warehouse facilities. |
| (14) | Finance receivables include principal balances, accrued interest, and capitalized loan origination costs. |
| (15) | Total debt excludes accounts payable, accrued expenses, and other liabilities. |
12
Table of Contents
Investing in our common stock involves a high degree of risk. Before making an investment in our common stock, you should carefully consider the following risks and the other information contained in this prospectus, including our combined financial statements and related notes and “Management’s Discussion and Analysis of Financial Condition and Results of Operations.” The risks described below are those that we believe are the material risks we face. Any of the risks described below, and others that we did not anticipate, could significantly and adversely affect our business, prospects, financial condition, results of operations, and liquidity. As a result, the trading price of our common stock could decline and you may lose all or part of your investment.
Risks related to our business
We require substantial capital to finance our business. In 2010, a substantial portion of the borrowing we use to originate loans will expire and we will need to obtain loan extensions, refinancings, or new financings to fund our operations and growth plans.
We have borrowed, and will continue to borrow, substantial amounts of capital to fund our operations, and a substantial portion of this debt will need to be extended or refinanced in 2010. If we cannot obtain the financing we need, or cannot do so on a timely basis and on favorable terms, our liquidity could be materially adversely affected.
At December 31, 2009, we had approximately $1.1 billion in aggregate principal amount of indebtedness outstanding, which included $50.0 million under our $60.0 million inventory facility that matures in August 2010 and $77.5 million under our $250.0 million portfolio warehouse facility that is due to expire in December 2010 (but contains a term-out feature preventing the balance at expiration from being due and payable immediately). Subject to certain conditions, amounts outstanding at termination are not due and payable immediately, and the collections on contracts collateralizing the facility are used to pay down the facility.
We historically have restored capacity under our portfolio warehouse facilities from time to time by securitizing portfolios of finance receivables. However, the securitization market has experienced significant disruptions in recent periods, and our ability to successfully and efficiently complete securitizations has recently been and may be affected by several factors, including the:
| • | condition of financial markets generally; |
| • | conditions in the asset-backed securities markets specifically; |
| • | financial condition and ratings of monoline insurers; and |
| • | the performance of our portfolio. |
Due to the disruption in the securitization market, we launched our PALP program to serve as the primary source of fixed-rate financing for our finance receivable portfolio. Under PALP, we pool loans originated at our dealerships and sell them to either (i) a special purpose entity that transfers the loans to a separate trust that, in turn, issues a note collateralized by the loans; or (ii) directly to a third-party financial institution to yield a specified return. If we are unable to continue financing our portfolio through securitizing our receivables or selling our finance receivables in secured financing arrangements, this would have a material adverse effect on our results of operations and financial condition.
Our funding strategy and liquidity position were significantly adversely affected by the ongoing stress in the credit markets that began in the middle of 2007. These adverse conditions reached unprecedented levels during 2008
13
Table of Contents
and continued through third quarter 2009. The credit markets remain highly volatile and access to liquidity has been significantly reduced. Although, based on our completion of a securitization of $300.0 million in receivables in December 2009, we believe that there are indications that access to credit markets has begun to revive, we may not be able to access the securitization markets in the future. Beginning in 2007, we secured alternative sources of financing, albeit at a substantially higher cost of funds. We also sold $75.0 million in subordinated debt and $24.0 million in junior secured debt to Verde, an affiliate of Ernest C. Garcia II, our Chairman and sole shareholder. As a public company, we may not be able to secure similar alternative financing, and it could become more difficult to renew loans and facilities as many lenders and counterparties are also facing liquidity and capital challenges as a result of the current stress in the financial markets. In addition, a single lender is a party to our revolving inventory facility and a participant in the PALP transactions pursuant to which we finance a significant amount of our receivables. If this lender were to cease its lending activities with respect to us and we are not able to find a replacement lender on favorable terms or at all, this would have a material adverse effect on our results of operations and financial condition.
We are subject to extensive governmental regulation, and if we are found to be in violation of any of the federal, state, or local laws or regulations applicable to us, our business could suffer. We are also subject to numerous legal and administrative proceedings which, if the outcomes are adverse to us, could adversely affect our business, operating results, and prospects.
The automotive retailing and finance industries are subject to a wide range of federal, state, and local laws and regulations, such as local licensing requirements, and retail financing, debt collection, consumer protection, environmental, health and safety, creditor, wage-hour, anti-discrimination, and other employment practices laws and regulations. The violation of these or future requirements or laws and regulations can result in administrative, civil, or criminal sanctions against us, which may include a cease and desist order against the subject operations or even revocation or suspension of our license to operate the subject business. As a result, we have incurred and will continue to incur capital and operating expenditures and other costs to comply with these requirements and laws and regulations. Further, over the past several years, private plaintiffs and federal, state, and local regulatory and law enforcement authorities have increased their scrutiny of advertising, sales, financing, and insurance activities in the sale and leasing of motor vehicles. In addition, many state attorneys general have been increasingly active in the area of consumer protection. We are also subject, and may be subject in the future, to inquiries and audits from state and federal regulators. There can be no assurance that such activities will not continue in the future or have a material adverse effect on our business.
From time to time to time, we may be involved in various legal and administrative proceedings. We are also currently the subject of investigative inquiries from the Consumer Protection Division of the Office of Texas Attorney General. See “Business – Legal proceedings.” It is not feasible to predict the outcome of these proceedings or any claims made against us, and the outcome of any such proceedings or claims could adversely affect our reputation, results of operations, or financial condition.
Changes in laws, regulations, or policies may adversely affect our business.
The laws and regulations governing our lending, servicing, debt collection, and insurance activities or the regulatory or enforcement environment at the federal level or in any of the states in which we operate may change at any time and may have an adverse effect on our business. New legislation, including proposals to substantially reform the financial institution regulatory system, is being considered by the current Congress and new legislative proposals will from time to time continue to be introduced in Congress in the future. It is possible that, in response to the recent economic conditions and the financial crisis, laws and regulations will be changed in ways that will require us to modify our business models or objectives.
14
Table of Contents
For instance, last year the U.S. House of Representatives passed the Wall Street Reform and Consumer Protection Act of 2009, which would create a federal Consumer Financial Protection Agency with broad powers to regulate consumer financial products or services. Similar legislation is currently under consideration in the U.S. Senate as part of the Restoring American Financial Stability Act of 2010 proposed by the Senate Banking Committee Chairman Christopher Dodd. The creation of a federal Consumer Financial Protection Agency has been the centerpiece of the Obama administration’s financial regulatory reform initiatives before Congress. We believe it is likely that if the legislation creating the federal Consumer Financial Protection Agency is enacted into law, it will apply to us and may increase our cost of doing business, impose new restrictions on the way in which we conduct our business, or add significant operational constraints that might impair our profitability.
Furthermore, Congress has previously considered and may in the future adopt various forms of legislation designed to spur automobile sales. Depending on the legislation that is adopted, if any, these incentives may only be available to consumers who purchase new vehicles or vehicles achieving high fuel-efficiency standards. If these incentives are limited solely to purchasers of new vehicles, or if we are unable to maintain an inventory of vehicles achieving the mandated fuel-efficiency standards, this legislation could have a material adverse effect on our results of operations and financial condition.
We are unable to predict how these or any other future legislative proposals or programs will be administered or implemented or in what form, or whether any additional or similar changes to statutes or regulations, including the interpretation or implementation thereof, will occur in the future. Any such action could affect us in substantial and unpredictable ways and could have an adverse effect on our results of operations and financial condition.
Our inability to remain in compliance with regulatory requirements in a particular jurisdiction could have a material adverse effect on our operations in that market and on our reputation generally. No assurance can be given that applicable laws or regulations will not be amended or construed differently or that new laws and regulations will not be adopted, either of which could materially adversely affect our business, financial condition, or results of operations.
There is a high degree of risk associated with borrowers with subprime credit. The allowance for credit losses that we have established to cover losses inherent in our loan portfolio may not be sufficient or may need to be substantially increased, which could have a material adverse effect on our results of operations.
Substantially all of the sales financing we extend and the loans that we service are with borrowers with subprime credit. Loans to borrowers with subprime credit have lower collection rates and are subject to higher loss rates than loans to borrowers with prime credit. Although we began tightening our loan underwriting standards in the second quarter of 2008, there can be no assurance that we will continue to apply such tightened loan underwriting standards in the future in light of changing economic or market conditions or any other factors.
We maintain an allowance for credit losses to cover losses on an aggregate basis at a level we consider sufficient to cover estimated losses inherent in our portfolio of receivables. On a quarterly basis we review and may make upward or downward adjustments to the allowance. However, our allowance may not be sufficient to cover losses inherent in our portfolio, and we may need to increase our allowance for reasons related to, among other things, the continued weak economic environment and deterioration of the housing market, or significant increases in delinquencies or charge-offs. A significant variation in the timing of or increase in credit losses in our portfolio or a substantial increase in our allowance or provision for credit losses would have a material adverse effect on our results of operations.
15
Table of Contents
Our focus on customers with subprime credit may raise concerns on the part of future business partners, lenders, counterparties, and regulators and may adversely affect our business.
We focus on the subprime segment of the used vehicle sales and financing market and provide loans to borrowers with subprime credit who, as a class, have lower collection rates and are subject to higher loss rates than prime and near prime borrowers. In addition, the subprime industry has been the subject of extensive media attention, enhanced regulatory scrutiny, and Congressional hearings as a result of what has been characterized as inappropriate consumer practices by subprime lenders in the mortgage industry.
These issues may raise concerns on the part of future business partners, lenders, counterparties, and regulators. As a result, we are unable to assess whether, and to what extent, they may have an adverse effect on our business in the future, including on our reputation, revenues and profitability. In particular, we cannot predict whether these issues may negatively affect our ability to obtain new financing to support our operations or any necessary regulatory approvals in connection with our plans to expand our business, either of which could have a material adverse effect on our business.
We have recently made, and we continue to make, changes to our business plan, and there can be no assurance that these changes will be successful. These changes could have an adverse effect on our results of operations or financial condition.
We have recently made, and we continue to make, changes to our business plan, including, among others, the following:
| • | we began tightening our loan underwriting standards in the second quarter of 2008; |
| • | we began consolidating collections for accounts between 1-45 days past due at our new Dallas collection center, which, when completed, will result in the removal of all collection activities from our dealerships and the consolidation of such activities at our two central collection facilities; |
| • | we have recently expanded our warranty program by offering a new 36 month / 36,000 mile warranty, including oil changes at any Sears automotive location and 24/7 roadside assistance; |
| • | we have expanded our customer payment programs to enable our customers to make cash payments at over 3,700 Wal-Mart stores and more than 10,400 other locations nationwide; and |
| • | we are opening new dealerships without payment windows and intend to remove payment windows from existing dealerships during 2010. |
There can be no assurance that any of these or other changes will be successful, and these and other changes could have unintended consequences and could have an adverse effect on our results of operations or financial condition. These changes also involve numerous other risks, including the diversion of management’s attention from other business concerns.
We may not be able to generate sufficient cash flow to meet our debt service obligations.
Our ability to generate sufficient cash flow from operations to make scheduled payments on our debt obligations will depend on our future financial performance, which will be affected by a range of economic, competitive, and business factors, many of which are outside of our control. If we do not generate sufficient cash flow from operations, we may have to undertake alternative financing plans, such as refinancing or restructuring our debt, selling assets, reducing or delaying capital investments, or seeking to raise additional capital. The terms of the agreements that govern our
16
Table of Contents
indebtedness contain limitations on our ability to incur additional indebtedness. We cannot assure you that any refinancing would be possible, that any assets could be sold, or, if sold, of the timing of the sales and the amount of proceeds realized from those sales, or that additional financing could be obtained on acceptable terms, if at all, or would be permitted under the terms of the agreements governing our indebtedness then outstanding. Our inability to generate sufficient cash flow to satisfy our debt obligations, or to refinance our obligations on commercially reasonable terms or at all, would have a material adverse effect on our business, financial condition, and results of operations, as well as on our ability to satisfy our debt obligations.
Our substantial debt could have adverse effects on our business and we may incur additional indebtedness in the future.
As of December 31, 2009, we had approximately $1.1 billion in aggregate principal amount of indebtedness outstanding, and for the year ended December 31, 2009 we incurred $110.7 million in interest expense. See “Management’s Discussion and Analysis of Financial Condition and Results of Operations – Liquidity and capital resources.” In addition, we may incur additional debt in the future, subject to certain limitations contained in the agreements that govern our indebtedness. For example, we will incur or assume any indebtedness associated with the acquisition of properties from related parties that we intend to complete in connection with this offering. See “Certain Relationships and Related Party Transactions.” The degree to which we are leveraged could have adverse effects on our business, including:
| • | our ability to obtain additional financing in the future may be impaired; |
| • | a significant portion of our cash flow from operations must be dedicated to the payment of interest and principal on our debt, and related expenses, which reduces the funds available to us for our operations; |
| • | some of our debt is and will continue to be at variable rates of interest, which may result in higher interest expense in the event of increases in market interest rates; |
| • | the agreements that govern our indebtedness contain, and any agreements to refinance our indebtedness likely will contain, financial and restrictive covenants, and our failure to comply with such covenants may result in an event of default which, if not cured or waived, could result in the acceleration of that indebtedness and trigger an event of default under other indebtedness; |
| • | our level of indebtedness will increase our vulnerability to general economic downturns and adverse industry conditions; |
| • | our debt service obligations could limit our flexibility in planning for, or reacting to, changes in our industry; and |
| • | our substantial leverage could place us at a competitive disadvantage vis-à-vis our competitors who have less leverage relative to their overall capital structures. |
Our failure to comply with the agreements relating to our outstanding indebtedness, including as a result of events beyond our control, could result in an event of default.
The agreements that govern our indebtedness contain, and any agreements that govern future indebtedness may contain, covenants that impose significant operating and financial restrictions on, among other things, our ability to:
| • | incur additional debt; |
| • | incur liens; |
| • | sell or otherwise dispose of assets; |
17
Table of Contents
| • | make investments, loans, or advances; |
| • | engage in merger and acquisition activity; |
| • | pay dividends, redeem capital stock, or make certain other restricted payments or investments; |
| • | engage in certain sale and leaseback transactions; |
| • | enter into new lines of business; and |
| • | enter into transactions with our affiliates. |
The agreements that govern our indebtedness also contain certain covenants relating to the performance of our portfolio, which ultimately impacts the manner in which we operate our business. For example, the advance rate on our portfolio warehouse facility may be reduced if our portfolio does not perform as expected. The agreements governing any future indebtedness could contain financial and other covenants more restrictive than those that are currently applicable to us.
Failure to comply with the agreements governing our indebtedness could result in an event of default under one or more such agreements, could cause cross-defaults on other agreements governing our indebtedness, and could prevent us from securing alternate sources of funds necessary to operate our business. Any of these events would have a material adverse effect on our results of operations and financial condition. From time to time, we have breached technical or other covenants under the agreements governing our indebtedness, and we have obtained waivers from the applicable lenders. In a future event of default, there can be no assurance we will be able to receive waivers, and our inability to obtain these waivers may have a material adverse impact on our business.
Interest rates affect our profitability and cash flows and an increase in interest rates will increase our interest expense and lower our profitability and liquidity.
Much of our financing income results from the difference between the rate of interest that we pay on the funds we borrow and the rate of interest that we earn on the finance receivables in our portfolio. While we earn interest on our finance receivables at a fixed rate, we pay interest on certain of our borrowings at floating rates. When interest rates increase, our interest expense increases. Increases in our interest expense that we cannot offset by increases in interest income could have a material adverse impact on our profitability and liquidity. Correspondingly, a significant reduction in our average APR could have a material adverse impact on our profitability, if not offset by a corresponding reduction in our loan losses or borrowing costs.
Our proprietary credit scoring system may not perform as expected and fail to properly quantify the credit risks associated with our customers, which could have a material adverse effect on our financial condition and results of operations.
We have developed, and revise from time to time, complex proprietary credit scoring models that use traditional and non-traditional variables to classify our customers into various risk grades that are tied to loan parameters. There is no guarantee that our credit scoring models will perform as intended or that they will perform in future market conditions. Failure of our credit scoring models to properly quantify the credit risks associated with our customers could have a material adverse effect on our results of operations and financial condition.
18
Table of Contents
We depend on the accuracy and completeness of information furnished to us by or on behalf of our customers. If we and our systems are unable to detect any misrepresentations in this information, this could have a material adverse effect on our results of operations and financial condition.
Our typical customers have limited or no credit histories. In deciding whether to extend credit to customers, we rely heavily on information furnished to us by or on behalf of our customers, including employment and personal financial information. If a significant percentage of our customers intentionally or negligently misrepresented any of this information, and we and our systems did not detect such misrepresentations, this could have a material adverse effect on our ability to effectively manage our credit risk, which could have a material adverse effect on our results of operations and financial condition.
General economic conditions and their effect on automobile sales may adversely affect our business.
Vehicle sales in the United States have declined significantly in recent periods. Many factors affect the industry, including general economic conditions, consumer confidence, the level of personal discretionary income, interest rates, and credit availability. The deteriorating economic and market conditions that have driven the decline in vehicle sales may not improve for the foreseeable future, and if such conditions improve, we cannot assure you that the industry will not experience sustained periods of decline in vehicle sales in the future. Any further or future decline could have a material adverse effect on our business.
We may be required to further reduce the scope of our operations, which could have a material adverse effect on our results of operations and financial condition.
We have recently contracted our operations as a result of the economic crisis. If we are required to further reduce the scope of our operations, we face certain additional risks, including risks related to:
| • | an inability to obtain anticipated cost reductions; |
| • | increased portfolio losses related to closed stores; |
| • | legal and regulatory risks related to closed stores and lay-offs, including the risk of lawsuits; |
| • | vandalism, theft, or other damages to vacant stores; |
| • | diversion of management’s attention from normal business operations; and |
| • | failure to generate sufficient cash flows to help fund our operations. |
If we were to lose the right to service our portfolio of receivables, this could result in decreased collections, which could have a material adverse effect on our results of operations and financial condition.
We retain the right to service all receivables that we finance, including those pledged as collateral to our portfolio warehouse facility and those sold to a securitization trust or in connection with our PALP transactions. We are entitled to a fee for our servicing activities, typically equal to 4% of the value of receivables being serviced. As of December 31, 2009, our serviced loan portfolio consisted of approximately 128,000 active accounts, with a total outstanding principal balance of $1.3 billion. Subject to certain conditions, if we experience an event of default under the agreements governing our financing arrangements, we may lose the right to service our receivables. Loss of this right could have a material adverse effect on our revenues. In addition, if we lose our servicing rights, transitioning servicing activities to a third party could result in interruptions in collections, which could decrease the likelihood that
19
Table of Contents
the receivables will be repaid. Moreover, a replacement servicer might lack the requisite experience in servicing such receivables. As a result, we may experience decreased collections, which could have a material adverse effect on our results of operations and financial condition.
Our operations and the finance receivables we generate are concentrated geographically, and a downturn in the economies or markets in which we operate could adversely affect vehicle sales and collections.
As of December 31, 2009, we operated our dealerships in 11 states. Adverse economic conditions, natural disasters, or other factors affecting any state or region where high concentrations of our customers reside could adversely affect vehicle sales and collections. If adverse economic conditions, natural disasters, or other factors occur that affect the regions in which we do business, or if borrowers in these regions experience financial difficulties, a significant number of borrowers may not be able to make timely loan payments, if at all, or may be more prone to filing for bankruptcy protection, which could have a material adverse effect on our results of operations and financial condition.
We may experience seasonal and other fluctuations in our results of operations.
Sales of motor vehicles historically have been subject to substantial cyclical variation characterized by periods of oversupply and weak demand. We believe that many factors affect the industry, including consumer confidence in the economy, the level of personal discretionary spending, interest rates, fuel prices, credit availability, and unemployment rates. A recession or an industry or general economic slowdown could materially adversely impact our business.
Historically, we have experienced higher revenues in the first quarter of the calendar year than in the last three quarters of the calendar year. We believe these results are due to seasonal buying patterns resulting in part because many of our customers receive income tax refunds during the first quarter of the year, which are a primary source of down payments on used vehicle purchases. Our loan performance also has historically followed a seasonal pattern with delinquencies and charge-offs being the highest in the second half of the year. Accordingly, our results in any quarter may not indicate the results we may achieve in any subsequent quarter or for the full year. A significant portion of our general and administrative expenses do not vary proportionately with fluctuations in revenues. We expect quarterly fluctuations in operating results to continue as a result of seasonal patterns. Such patterns may change, however, due to factors affecting the automotive industry or otherwise.
Our failure to effectively manage our growth could harm our business, we may not be able to access the additional financing required to fund our growth, and our plans to expand our operations will expose us to increased legal and regulatory risks that may adversely affect our business.
We intend to grow our operations by opening new dealerships, many of which are expected to be located in markets in which we currently do not operate. This growth may result in the incurrence of additional debt and amortization of expenses, all of which could adversely affect our profitability and liquidity. Moreover, growth and expansion of our operations may place a significant strain on our resources and increase demands on our executive management team, management information and reporting systems, financial management controls and personnel, and regulatory compliance systems and personnel. Although we grew from 74 dealerships at the start of 2004 to 103 dealerships at the end of 2007, we experienced a contraction in our dealership base due to reduced access to funding, and operated 78 dealerships at December 31, 2009. We may not be able to expand our operations or effectively manage or integrate our expanding operations, or achieve planned growth on a timely or profitable basis. If we are unable to achieve our planned growth or manage our growth effectively, we may experience operating inefficiencies and our results of operations may be materially adversely affected.
20
Table of Contents
In addition, expansion into new states will increase our legal and regulatory risk. Our failure or alleged failure to comply with applicable laws and regulations in any new jurisdiction, and ensuing inquiries or investigations by regulatory and enforcement authorities, may result in regulatory action, including suspension or revocation of one or more of our licenses, civil or criminal penalties, or other disciplinary actions, and restrictions on or suspension of some or all of our business operations. As a result, our business could suffer, our reputation could be harmed, and we could be subject to additional legal risk. This could, in turn, increase the size and number of claims and damages asserted against us, subject us to regulatory investigations, enforcement actions, or other proceedings, or lead to increased regulatory or supervisory concerns. We may also be required to spend additional time and resources on any remedial measures, which could have an adverse effect on our business. We cannot predict the timing or form of any current or future regulatory or law enforcement initiatives, and any such initiatives could have a material adverse effect on our results of operations and financial condition.
We operate in a highly competitive environment, and if we are unable to compete with our competitors, our results of operations and financial condition could be materially adversely affected.
Our primary competitors are the numerous small “buy-here, pay-here” dealerships, independent used vehicle dealers, and used vehicle departments of franchise dealers that operate in the subprime segment of the used vehicle sales industry, and the banks and finance companies that purchase their loans. There is no assurance that we can successfully distinguish ourselves from our competitors or compete in this industry in a cost-effective manner or at all. In addition, periodically larger companies with significant financial and other resources have entered or announced plans to enter the used vehicle sales and/or finance industry, or relax their credit standards and compete with us, at least at the upper end of our customer segment. These dealerships also compete with us in areas such as the purchase of inventory, which can result in increased wholesale costs for used vehicles and lower margins, and the dealerships and finance companies could also enter into direct competition with us at any time at the lower end of the subprime market.
Increased competition may cause downward pressure on the interest rates that we charge on finance receivables originated by our dealerships, or lower margins, or may cause an increase in our operating costs, all of which could have a material adverse effect on our results of operations and financial condition.
If we are unable to obtain sufficient numbers of used vehicles for our inventory in a cost-effective manner, our operations and financial results will be adversely impacted.
We require a large number of quality used vehicles for our dealerships. We acquire a significant proportion of our used-vehicle inventory primarily through two auctions companies. During the year ended December 31, 2009, we acquired approximately 95.0% of our vehicles at auction, and approximately 81.0% of our vehicles from these two auction companies. To a lesser extent, we also acquire used vehicles from wholesalers, franchised and independent dealers, and fleet owners, such as leasing companies and rental companies. The sources from which we can purchase vehicles of a quality and in a quantity acceptable to us are limited, and there is substantial competition to acquire the vehicles we purchase. We may not be able to obtain sufficient inventory in a cost-effective manner or at all. In this regard, recent declines in new vehicle sales and a reduced number of vehicles that are eligible for daily rental will adversely impact the availability and quality of future inventory. A reduction in the availability of sufficient quantities of quality vehicles or an increase in inventory costs that cannot be reflected in retail market prices would adversely affect our business.
21
Table of Contents
If our inventory or other costs of operations increase and we are unable to pass along these costs to our customers, we may be unable to maintain or grow margins.
Our inventory and other costs are variable and dependent upon various factors, many of which are outside of our control. If we incur cost increases, we may seek to pass those increases along to our customers. However, the income of our average customer limits the maximum monthly payment such customer can afford, and we may be unable to pass these costs along to our customers in the form of higher sales prices, which would adversely affect our ability to maintain or grow margins.
Our business is exposed to various operational risks. A failure of or interruption in our communications and information systems could adversely affect our revenues and profitability.
Our business is highly dependent on communications and information systems and is exposed to many types of operational risk, including the risk of fraud by employees or other parties, record-keeping error, errors resulting from faulty computer or telecommunication systems, computer failures or interruption, and damage to computer and telecommunication systems caused by internal or external events. We periodically update or change the integrated computer systems and other components of our operating systems. Any significant failure of such systems, whether as a result of third-party actions or in connection with planned upgrades and conversions, could disrupt our operations and adversely affect our ability to collect on contracts and comply with legal and regulatory requirements. Additionally, our systems are vulnerable to interruption or malfunction due to events beyond our control, including natural disasters and network and telecommunications failures. Our systems may also be vulnerable to unauthorized access, computer hackers, computer viruses, and other security problems. A user who circumvents security measures could misappropriate proprietary information or cause interruptions to or malfunctions in operations. As a result, we may be required to expend significant resources to protect against the threat of these security breaches or to alleviate problems caused by these incidents. We have a backup system and we periodically test disaster recovery scenarios, however, this may not prevent a systems failure or allow us to timely resolve any systems failures. Any interruption to our systems could have a material adverse effect on our results of operations and financial condition.
The personal information that we collect may be vulnerable to breach, theft, or loss, the occurrence of any of which could adversely affect our reputation and operations.
Possession and use of personal information in our operations subjects us to risks and costs that could harm our business. We collect, use, and retain large amounts of personal information regarding our customers, employees, and their families, including social security numbers, tax return information, personal and family financial data, and credit card numbers. Our computer networks and the networks of certain of our vendors that hold and manage confidential information on our behalf may be vulnerable to unauthorized access, employee theft or misuse, computer hackers, computer viruses, and other security threats. Confidential information may also inadvertently become available to third parties when we integrate systems or migrate data to our servers following an acquisition or in connection with periodic hardware or software upgrades.
Due to the sensitive nature of the personal information stored on our servers, our networks may be targeted by hackers seeking to access this data. A user who circumvents security measures could misappropriate sensitive information or cause interruptions or malfunctions in our operations. Although we use security and business controls to limit access and use of personal information, a third party may be able to circumvent those security and business controls, which could result in a breach of privacy. In addition, errors in the storage, use, or transmission of personal information could result in a breach of privacy. Possession and use of personal information in our operations also subjects us to legislative and regulatory burdens that could require us to implement certain policies and procedures,
22
Table of Contents
such as the procedures we adopted to comply with the Red Flags Rule that was promulgated by the Federal Trade Commission under the federal Fair Credit Reporting Act and that requires the establishment of guidelines and policies regarding identity theft, and could require us to make certain notifications of data breaches and restrict our use of personal information. A violation of any laws or regulations relating to the collection or use of personal information could result in the imposition of fines against us. As a result, we may be required to expend significant resources to protect against the threat of these security breaches or to alleviate problems caused by these breaches. A major breach, theft, or loss of personal information that is held by us or our vendors, or a violation of laws or regulations relating to the same, could have a material adverse effect on our reputation and result in further regulation and oversight by federal and state authorities and increased costs of compliance.
We are dependent on the services of certain key personnel and the loss of their services could harm our business.
We believe that our success depends on the continued employment of our senior management team, including Ernest C. Garcia II, our Chairman and sole shareholder, and Raymond C. Fidel, our Chief Executive Officer and President. The unexpected loss of the services of any of our key management personnel or our inability to attract new management when necessary could have a material adverse effect on our operations. We do not currently maintain key person life insurance on any member of our executive management team other than Mr. Garcia and Mr. Fidel.
Additionally, our success depends on the key management personnel at our corporate offices and the dealerships in our local markets. The market for qualified employees in the automotive and finance industries and in the markets in which we operate, particularly for qualified general managers, loan managers, and collections personnel, is highly competitive and may subject us to increased labor costs during periods of low unemployment. We also believe that our competitors pursue many of our managerial and collections and sales and service personnel from time to time. The loss of a group of key employees in any of our markets could have a material adverse effect on our business and results of operations in that market or across many or all markets in which we operate.
If all or some portion of our employees elect to collectively bargain or join a union, these actions could adversely affect our operations.
As of December 31, 2009, none of our employees was represented by a labor union. The automotive industry is historically an industry in which there is a high degree of labor union participation. If all or some portion of our employees elect to join a labor union, we could experience increased operational costs, work stoppages or strikes, and/or barriers to communication between management and employees. These factors could lead to inefficiencies in the operation of the affected facilities or groups and could cause us to experience a material adverse effect.
We are subject to environmental laws, regulations, and permits that could impose significant liabilities, costs, and obligations.
We are subject to a complex variety of federal, state, and local laws, regulations, and permits relating to the environment and human health and safety. If we violate or fail to comply with these laws, regulations, or permits, we could be fined or otherwise sanctioned by regulators. These environmental requirements, and the enforcement thereof, change frequently, have tended to become more stringent over time, and may necessitate substantial capital expenditures or operating costs. Under certain environmental laws, we could be responsible for the costs relating to any contamination at our or our predecessors’ current or former owned or operated properties or third-party waste disposal sites. We cannot assure you that our costs and liabilities relating to environmental matters will not adversely affect our results of operations, business, financial condition, reputation, or liquidity.
23
Table of Contents
States impose limits on the interest rates we can charge on the installment sales contracts we provide to our customers, and new or lower limits may harm our ability to offset increased interest expenses and can adversely affect our profitability and liquidity.
We operate in states that impose limits on the contract interest rate that a lender may charge, and laws or regulations that limit the interest rates that we can charge can adversely affect our profitability and liquidity. When a state limits the amount of interest that we can charge on our installment sales contracts, we may not be able to offset an increase in interest expense caused by rising interest rates or greater levels of borrowings under our credit facilities. In addition, no assurance can be given that we will not be prohibited by new state laws from charging the interest rates we are currently able to charge on our installment sales contracts or from raising interest rates above certain desired levels. Therefore, these interest rate limitations can adversely affect our profitability and liquidity.
A change in state laws, or the application thereof, relating to the extent to which we can obtain a refund of sales tax for customer defaults could have a material adverse effect on our business.
In general, we are required to pay state sales tax on each vehicle we sell. Subject to certain requirements, certain states allow us to collect a refund of prior sales taxes paid to the extent that the receivable becomes uncollectible. We are allowed such a refund despite the fact that the initial remitter of the tax (DTAG) is not the same entity claiming the refund (DTAC) because DTAG and DTAC are entities under common control. Generally, when a payor of sales tax sells or transfers to a party that they do not control a receivable that was generated in connection with a transaction that gives rise to a sales tax, the payor is not entitled to a subsequent refund of sales tax if and when the receivable becomes impaired or uncollectible.
For the years ended December 31, 2007, 2008, and 2009, we claimed $12.5 million, $14.7 million, and $12.3 million, respectively, in sales tax refunds relating to receivables that have become uncollectible. If state laws change with respect to the extent to which we can claim a refund for sales tax in such situations, or state taxing authorities change their position with respect thereto, we could experience a material adverse effect. In this regard, we are currently appealing to the Nevada Supreme Court an adverse administrative ruling on the efficacy of certain sales tax refunds we have requested for the 2002 and 2003 tax years. While only applicable to 2002 and 2003, an adverse ruling could affect subsequent tax years as well. See “Business – Legal proceedings.”
We may be adversely affected by product liability exposure claims.
DriveTime, and the automotive industry generally, is exposed to product liability claims in the event that the failure of our products to perform to specifications results, or is alleged to result, in property damage, bodily injury, and/or death. In connection with such product liability claims, we may incur significant costs to defend such claims and we may experience material product liability losses in the future. We cannot assure you that we will have sufficient resources, including insurance to the extent it is available, to cover such product liability claims, and the outcome of various legal actions and claims could have a material adverse effect on our results of operations and financial condition.
24
Table of Contents
We are piloting programs designed to ensure our customers have and maintain insurance covering our collateral in the event of theft or an accident. If we are unsuccessful in doing so, it could negatively impact our operations and/or profitability.
Certain of our customers have difficulty obtaining and maintaining affordable insurance for their vehicles. We have introduced in all of the states in which we operate a collateral protection insurance program. Under this program, we offer customers dual interest collateral protection insurance administered through a third party with whom we have a contractual relationship. We are also exploring liability insurance meeting state requirements and considering other possible solutions to achieve affordable insurance for our customers, including longer term coverage, and/or making property and casualty and liability insurance available through insurance agents, or establishing our own insurance agency to do so.
This initiative will result in an additional payment the customers may not be making today, thereby increasing the risk of higher loan delinquencies and earlier loan defaults, either of which could adversely affect our loan losses and profitability. These transactions also involve numerous other risks, including the diversion of management attention from other business concerns, and entry into a new and highly regulated business in which we have had no or only limited experience. Occurrence of any of these risks or other risks that we have not anticipated could have a material adverse effect on us.
We used to be taxed as an S-corporation under Subchapter S of the Code, and claims of taxing authorities related to our prior status as an S-corporation could harm us.
Prior to completion of this offering, we intend to effect a reorganization pursuant to which all of the equity interests of DTAG and DTAC will be transferred to DriveTime Automotive, Inc. as the holding company under which we will conduct substantially all of our operations. DTAG and DTAC have been taxed as “pass-through” entities under Subchapter S of the Code. Following this offering, we will be taxed as a C-corporation under Subchapter C of the Code, which is applicable to most corporations and treats the corporation as an entity that is separate and distinct from its shareholders. If the unaudited, open tax years in which DTAG and DTAC were S-corporations were to be audited by the IRS, and such entities were determined to not have qualified for, or to have violated, their S-corporation status, we would be obligated to pay back taxes, interest, and penalties. These amounts could include taxes on all of the taxable income while the two entities were S-corporations (that is, additional taxes of $51.6 million from the beginning of 2006 through the end of December 2009, and could also include any additional taxes on earnings through the termination of such entities’ S-corporation status in connection with this offering). Any such claims could result in additional costs to us and could have a material adverse effect on our results of operations and financial condition.
In addition, as a result of the revocation of S-corporation status in connection with this offering, we will record a net deferred tax liability and a corresponding income tax expense on the revocation date in the amount of approximately $51.4 million. See “Management’s Discussion and Analysis of Financial Condition and Results of Operations – Factors affecting comparability.”
Conflicts of interest may arise as a result of affiliations that our directors or executive officers have with Verde Investments, Inc.
Ernest C. Garcia II, our Chairman and controlling stockholder, is also the owner of Verde Investments, Inc. Verde is a company with which we have historically had material leasing and financing relationships. See “Certain Relationships and Related Party Transactions.” Although our historical relationships with Verde will terminate in connection with the offering, except for the lease of a small amount of office space by Verde, Mr. Garcia will continue to devote time, which may be substantial, to Verde’s business activities. In addition, there may occur future
25
Table of Contents
transactions between us and Verde which cause conflicts of interest on the part of Mr. Garcia. While transactions that we enter into in which a director or officer has a conflict of interest are generally permissible so long as the material facts relating to the director’s or officer’s relationship or interest as to the transaction are disclosed to our Board of Directors and a majority of our disinterested directors, or a committee consisting solely of disinterested directors, approves the transaction, any such conflict of interest could have a material adverse effect on our business, results of operations or financial condition.
We could suffer a material adverse effect if the IRS challenged our position on intercompany sales of receivables.
We generally recognize losses for U.S. federal income tax purposes on the intercompany sales of receivables from DTAG to DTAC. This practice is standard within our industry and our interpretation is not meaningfully different from other companies in our industry. However, the IRS may challenge our position and seek to defer our recognition of such losses. If the IRS were able to successfully challenge our position, there could be a material adverse effect on our results of operations and financial condition.
Acts of war may seriously harm our business.
Acts of war or any outbreak or escalation of hostilities between the United States and any foreign power may cause a disruption to the economy, our company, our employees, and our customers, which could impact our results of operations, costs and expenses, and financial condition. In addition, the Servicemembers Civil Relief Act, and similar state legislation may limit the interest payable on an auto loan during a borrower’s active duty in the military.
Risks related to the offering
Our Chairman and sole shareholder will continue to own a large percentage of our voting stock after this offering, which may allow him to control substantially all matters requiring shareholder approval and afford him access to our management.
Based upon the issuance and sale of shares of our common stock by us in this offering at an assumed initial offering price of $ per share, the midpoint of the range set forth on the cover page of this prospectus, Mr. Ernest C. Garcia II, our Chairman and sole shareholder, will beneficially own approximately shares of our common stock and shares of our convertible preferred stock, or % of our common stock on a fully diluted basis, upon completion of this offering. Accordingly, Mr. Garcia could control us through his ability to determine the outcome of the election of our directors, to amend our certificate of incorporation and bylaws, to take other actions requiring the vote or consent of shareholders, including mergers, going private transactions, and other extraordinary transactions, and to make decisions concerning the terms of any of these transactions. Mr. Garcia may also take actions to address his own interests, which may be different from those of our other shareholders, including investors in this offering. While Mr. Garcia and his affiliates will continue to own a majority of our outstanding common stock upon completion of the offering, we do not expect to seek to be treated as a “controlled company” under the rules of the New York Stock Exchange.
There is no existing market for our common stock, and we do not know if one will develop to provide you with adequate liquidity.
Immediately prior to this offering, there has been no public market for our common stock. An active and liquid public market for our common stock may not develop or be sustained after this offering. The price of our common stock in any such market may be higher or lower than the price you pay. If you purchase shares of common stock in
26
Table of Contents
this offering, you will pay a price that was not established in a competitive market. Rather, you will pay the price that we negotiated with the representatives of the underwriters and such price may not be indicative of prices that will prevail in the open market following this offering.
The price of our common stock may fluctuate significantly, and you could lose all or part of your investment.
Volatility in the market price of our common stock may prevent you from being able to sell your shares at or above the price you paid for your shares. The market price of our common stock could fluctuate significantly for various reasons, which include:
| • | our quarterly or annual earnings or earnings of other companies in our industry; |
| • | our operating performance, including the number of vehicles we sell and the results of our collection efforts and portfolio performance; |
| • | the public’s reaction to our press releases, our other public announcements, and our filings with the SEC; |
| • | changes in earnings estimates or recommendations by research analysts who track our common stock or the stocks of other companies in our industry; |
| • | new laws or regulations or new interpretations of laws or regulations applicable to our business; |
| • | changes in accounting standards, policies, guidance, interpretations, or principles; |
| • | changes in general conditions in the U.S. and global economies or financial markets, including those resulting from war, incidents of terrorism, or responses to such events; |
| • | litigation involving our company or investigations or audits by regulators into the operations of our company or our competitors; and |
| • | sales of common stock by our directors, executive officers, and significant shareholders. |
In addition, the stock market can at times, and for extended periods of time, experience extreme price and volume fluctuations. This volatility has a significant impact on the market price of securities issued by many companies, including companies in our industry. The changes frequently appear to occur without regard to the operating performance of these companies. The price of our common stock could fluctuate based upon factors that have little or nothing to do with our company, and these fluctuations could materially reduce our stock price.
Your percentage ownership in us may be diluted by future issuances of capital stock, which could reduce your influence over matters on which shareholders vote.
Following the completion of this offering, our board of directors will have the authority, without action or vote of our shareholders, to issue all or any part of our authorized but unissued shares of common stock, including shares issuable upon the exercise of options, shares that may be issued to satisfy our payment obligations under our incentive plans, or shares of our authorized but unissued preferred stock. Issuances of common stock or voting preferred stock would reduce your influence over matters on which our shareholders vote, and, in the case of issuances of preferred stock, likely would result in your interest in us being subject to the prior rights of holders of that preferred stock.
27
Table of Contents
The sale of a substantial number of shares of our common stock after this offering may cause the market price of shares of our common stock to decline.
Sales of a substantial number of shares of our common stock in the public market following this offering, or the perception that these sales could occur, could cause the market price of our common stock to decline. The shares of our common stock outstanding prior to this offering will be eligible for sale in the public market at various times in the future. Ernest C. Garcia II, our Chairman and sole shareholder, and all of our directors and executive officers, have agreed with the underwriters, subject to certain exceptions, not to dispose of or hedge any of their common stock or securities convertible into or exchangeable for shares of common stock during the period from the date of this prospectus continuing through the date 180 days after the date of this prospectus, except with the prior written consent of the representatives of the underwriters. Upon expiration of this lock-up period, up to approximately shares of common stock held by affiliates may become eligible for sale, subject to the restrictions under Rule 144 of the Securities Act.
You will incur immediate and substantial dilution in the net tangible book value of your shares.
If you purchase shares in this offering, the value of your shares based on our actual book value will immediately be less than the price you paid. This reduction in the value of your equity is known as dilution. This dilution occurs in large part because our Chairman and sole shareholder paid substantially less than the initial public offering price when he purchased his shares of our common stock. Based upon the issuance and sale of shares of our common stock by us in this offering at an assumed initial public offering price of $ per share, the midpoint of the price range set forth on the cover page of this prospectus, you will incur immediate dilution of $ in the net tangible book value per share. A $1.00 increase or decrease in the assumed initial public offering price of $ per share would increase or decrease, as applicable, our as adjusted net tangible book value per share of common stock by $ , and increase or decrease, as applicable, the dilution per share of common stock to new investors by $ , assuming the number of shares offered by us, as set forth on the cover page of this prospectus, remains the same, after deducting the estimated underwriting discounts and commissions and estimated offering expenses payable by us. If the underwriters exercise their over-allotment option, or if outstanding options to purchase our common stock are exercised, investors will experience additional dilution. For more information, see “Dilution.”
We will incur increased costs as a result of being a public company, and the requirements of being a public company may divert management attention from our business.
As a public company, we will be subject to a number of additional requirements, including the reporting requirements of the Exchange Act, the Sarbanes-Oxley Act, and the listing standards of the exchange on which our common stock is listed. These requirements will cause us to incur increased costs and might place a strain on our systems and resources. The Exchange Act requires, among other things, that we file annual, quarterly, and current reports with respect to our business and financial condition. The Sarbanes-Oxley Act requires, among other things, that we maintain effective disclosure controls and procedures and internal control over financial reporting, and also requires that our internal controls be assessed by management beginning with our fiscal year ending December 31, 2010, and attested to by our auditors beginning with our fiscal year ending December 31, 2011. In order to maintain and improve the effectiveness of our disclosure controls and procedures and internal control over financial reporting, significant resources and management oversight will be required. As a result, our management’s attention might be diverted from other business concerns, which could have a material adverse effect on our business, prospects, financial condition, and results of operations. Furthermore, we might not be able to retain our independent directors or attract new independent directors for our committees.
28
Table of Contents
Provisions that will be in our charter documents and the Delaware General Corporation Law could make it more difficult for a third party to acquire us and could discourage a takeover and adversely affect existing shareholders.
Anti-takeover provisions that will be in our amended and restated certificate of incorporation and amended and restated bylaws, and in the DGCL, could diminish the opportunity for shareholders to participate in acquisition proposals at a price above the then-current market price of our common stock. For example, while we have no present plans to issue any preferred stock, except with respect to the preferred stock being issued in exchange for indebtedness in connection with this offering, as described elsewhere in this prospectus, our board of directors, without further shareholder approval, will be able to issue shares of undesignated preferred stock and fix the powers, preferences, rights, and limitations of such class or series, which could adversely affect the voting power of your shares. In addition, our amended and restated bylaws will provide for an advance notice procedure for nomination of candidates to our board of directors that could have the effect of delaying, deterring, or preventing a change in control. Further, as a Delaware corporation, we are subject to provisions of the DGCL regarding “business combinations,” which can deter attempted takeovers in certain situations. We may, in the future, consider adopting additional anti-takeover measures. The authority of our board to issue undesignated preferred or other capital stock and the anti-takeover provisions of the DGCL, as well as other current and any future anti-takeover measures adopted by us, may, in certain circumstances, delay, deter, or prevent takeover attempts and other changes in control of the company not approved by our board of directors. See “Description of Capital Stock” for further information.
We currently do not intend to pay dividends on our common stock and, consequently, your only opportunity to achieve a return on your investment is if the price of our common stock appreciates.
We do not expect to pay dividends on shares of our common stock in the foreseeable future and intend to use cash to grow our business. The payment of cash dividends in the future, if any, will be at the discretion of our board of directors and will depend upon such factors as the extent to which our financing arrangements permit the payment of dividends, earnings levels, capital requirements, our overall financial condition, and any other factors deemed relevant by our board of directors. Consequently, your only opportunity to achieve a return on your investment in us will be if the market price of our common stock appreciates.
We will have broad discretion in applying the net proceeds of this offering and may not use those proceeds in ways that will enhance the market value of our common stock.
We have significant flexibility in applying the net proceeds we will receive in this offering. We intend to use $35.1 million of the proceeds of this offering to retire subordinated notes and junior secured notes held by Verde that are not exchanged for shares of preferred stock, as described elsewhere in this prospectus, and $2.0 million to retire junior secured notes that are held by Raymond C. Fidel, our President and Chief Executive Officer. We also intend to us $ million to repay amounts outstanding under our portfolio warehouse facility. We will use the remainder of the proceeds of this offering to pay the expenses of this offering and for general corporate purposes.
As part of your investment decision, you will not be able to assess or direct how we apply these net proceeds. If we do not apply these funds effectively, we may lose significant business opportunities. Furthermore, our stock price could decline if the market does not view our use of the net proceeds from this offering favorably.
29
Table of Contents
This prospectus contains “forward-looking statements,” which include information relating to future events, future financial performance, strategies, expectations, competitive environment, regulation, and availability of resources. These forward-looking statements include, without limitation, statements concerning projections, predictions, expectations, estimates, or forecasts as to our business, financial and operational results, and future economic performance; and statements of management’s goals and objectives and other similar expressions concerning matters that are not historical facts. Words such as “may,” “should,” “could,” “would,” “predicts,” “potential,” “continue,” “expects,” “anticipates,” “future,” “intends,” “plans,” “believes,” “estimates,” and similar expressions, as well as statements in future tense, identify forward-looking statements.
Forward-looking statements should not be read as a guarantee of future performance or results, and will not necessarily be accurate indications of the times at, or by, which such performance or results will be achieved. Forward-looking statements are based on information available at the time those statements are made or management’s good faith belief as of that time with respect to future events, and are subject to risks and uncertainties that could cause actual performance or results to differ materially from those expressed in or suggested by the forward-looking statements. Important factors that could cause such differences include, but are not limited to:
| • | we require substantial capital to finance our business, and, in 2010, we will need new financings to fund our operations and growth plans; |
| • | we are subject to extensive governmental regulations, and if we are found to be in violation of any federal, state, or local laws or regulations applicable to us, our business could suffer; |
| • | changes in laws, regulations, or policies; |
| • | risks associated with our customers, whom have subprime credit; |
| • | our focus on customers with subprime credit; |
| • | changes to our business plan that are currently being implemented, and those that may be implemented in the future, may not be successful and may cause unintended consequences; |
| • | we may not be able to generate sufficient cash flow to meet our debt service obligations; |
| • | interest rates affect our profitability and cash flows and an increase in interest rates will increase our interest expense and lower our profitability and liquidity; |
| • | general and economic conditions and their effect on automobile sales; |
| • | the need to further reduce the scope of our operations; |
| • | seasonal and other fluctuations in our results of operations; |
| • | our failure to effectively manage our growth, access the additional required financing to fund our growth, and increased exposure to legal and regulatory risks as a result of our plans to expand; |
| • | we operate in a highly competitive environment, and if we are unable to compete with our competitors, our results of operations and financial condition could be materially adversely affected; and |
| • | other factors discussed under the headings “Risk Factors,” “Management’s Discussion and Analysis of Financial Condition and Results of Operations,” and “Business.” |
Forward-looking statements speak only as of the date the statements are made. You should not put undue reliance on any forward-looking statements. We assume no obligation to update forward-looking statements to reflect actual results, changes in assumptions, or changes in other factors affecting forward-looking information, except to the extent required by applicable securities laws. If we do update one or more forward-looking statements, no inference should be drawn that we will make additional updates with respect to those or other forward-looking statements.
30
Table of Contents
The net proceeds from the sale of shares of our common stock offered by us in this offering will be approximately $ million (or approximately $ million if the underwriters exercise their over-allotment option in full), assuming an initial public offering price of $ per share, which is the midpoint of the range set forth on the cover page of this prospectus, and after deducting the underwriting discounts and commissions and estimated offering expenses payable by us.
We intend to use $35.1 million of the proceeds of this offering to retire subordinated notes and junior secured notes held by Verde, an affiliate of Ernest C. Garcia II, our Chairman and sole shareholder, that are not exchanged for shares of preferred stock, as described elsewhere in this prospectus, $2.0 million to retire junior secured notes that are held by Raymond C. Fidel, our President and Chief Executive Officer, and $ million to repay amounts outstanding under our portfolio warehouse facility. We intend to use the remaining proceeds, including any proceeds we receive from the underwriters’ exercise of their over-allotment option, to pay the expenses of this offering and for general corporate purposes.
Our subordinated notes, all of which are owned by Verde, bear interest at 12% per annum and mature in August 2013. Our junior secured notes are comprised of two tranches and are due December 2012. The Tranche A component, of which there is $38.1 million in aggregate principal amount outstanding at December 31, 2009, bears interest at 22.0% per annum, increasing by 2.0% each year until maturity. The subordinate Tranche B component, of which there is $24.0 million in aggregate principal amount outstanding at December 31, 2009, bears interest at 27.0% per annum, increasing 2.0% each year until maturity. Verde owns $36.1 million and $24.0 million in aggregate principal amount of the Tranche A and Tranche B junior secured notes, respectively, and Mr. Fidel owns $2.0 million of the Tranche A junior secured notes. Our portfolio warehouse facility expires in December 2010, and amounts outstanding under the facility bear interest based on the cost of the lender’s funds thereunder plus 4.25% (4.49% at December 31, 2009).
In connection with this offering, Verde has agreed to exchange an aggregate of $100.0 million of subordinated notes and junior secured notes for shares of our newly-designated 6.5% convertible preferred stock, based on the midpoint of the range set forth on the cover page of this prospectus. See “Certain Relationships and Related Party Transactions.”
Each $1.00 increase or decrease in the assumed public offering price of $ per share would increase or decrease, as applicable, the aggregate amount of the net proceeds to us by approximately $ million, assuming the number of shares offered by us, as set forth on the cover page of this prospectus, remains the same and, with respect to the net proceeds to us, after deducting estimated underwriting discounts and commissions and estimated offering expenses payable by us. Similarly, any increase or decrease in the number of shares that we sell in the offering will increase or decrease our net proceeds in proportion to such increase or decrease, as applicable, multiplied by the offering price per share, with respect to our net proceeds, less underwriting discounts and commissions and offering expenses.
We do not anticipate declaring or paying any cash dividends on our common stock following our initial public offering. The payment of any dividends in the future will be at the discretion of our board of directors and will depend upon our financial condition, results of operations, earnings, capital requirements, contractual restrictions, outstanding indebtedness, and other factors deemed relevant by our board. As a result, you will need to sell your shares of common stock to realize a return on your investment, and you may not be able to sell your shares at or above the price you paid for them.
31
Table of Contents
The following table sets forth our capitalization as of December 31, 2009:
| • | on an actual basis; |
| • | on an as adjusted basis, giving effect to (i) the payment of S-corporation distributions subsequent to December 31, 2009, (ii) the exchange by Verde of an aggregate of $100.0 million of our subordinated notes and junior secured notes for convertible preferred stock, and (iii) the incurrence or assumption of indebtedness related to the purchase of real estate from affiliates of Ernest C. Garcia II, our Chairman and sole shareholder, and the brother-in-law of Mr. Garcia and; and |
| • | on a pro forma, as adjusted, basis, giving effect to (i) the transactions set forth above, (ii) our sale of shares of our common stock in this offering (at an assumed initial public offering price of $ per share, which is the midpoint of the range set forth on the cover page of this prospectus, and after deducting underwriting discounts and commissions and estimated offering expenses payable by us), (iii) the repayment of debt as described above under “Use of Proceeds,” and (iv) the amendment and restatement of our certificate of incorporation in connection with the closing of this offering, which will increase our authorized capital stock. |
You should read this table together with “Use of Proceeds,” “Management’s Discussion and Analysis of Financial Condition and Results of Operations,” “Description of Capital Stock,” and our combined financial statements and related notes included elsewhere in this prospectus.
| As of December 31, 2009 | |||||||||
| Actual | As Adjusted | Pro Forma, as Adjusted (1) | |||||||
| (In thousands, except share and per share | |||||||||
| Cash, cash equivalents, and short-term marketable securities |
$ | 21,526 | $ | $ | |||||
| Total debt (2) |
|||||||||
| Portfolio revolving facilities |
77,506 | ||||||||
| Portfolio term financings |
795,857 | ||||||||
| Other secured notes payable |
137,365 | ||||||||
| Senior unsecured notes payable |
1,487 | ||||||||
| Subordinated notes payable |
75,000 | ||||||||
| Total debt |
1,087,215 | ||||||||
| Shareholder’s equity: |
|||||||||
| Undesignated preferred stock: $0.001 par value; shares authorized, issued, and outstanding, pro forma, as adjusted |
— | ||||||||
| 6.5% convertible preferred stock: $0.001 par value; shares authorized, issued, and outstanding, pro forma, as adjusted |
— | ||||||||
| Common stock: |
|||||||||
| Actual: DTAG – par value $0.001 per share, 1,000 shares authorized, 100 shares issued and outstanding; DTAC – no par value, 1,000,000 shares authorized, 100 shares issued and outstanding |
— | ||||||||
| Pro forma, as adjusted: $0.001 par value; shares authorized, shares issued and outstanding, pro forma, as adjusted |
— | ||||||||
| Additional paid-in capital |
138,418 | ||||||||
| Retained earnings |
171,141 | ||||||||
| Total shareholder’s equity |
309,559 | ||||||||
| Total capitalization |
$ | 1,396,774 | $ | $ | |||||
32
Table of Contents
| (1) | A $1.00 increase or decrease in the assumed initial public offering price per share would increase or decrease cash, cash equivalents, and short-term marketable securities by $ million, would increase or decrease additional paid-in capital by $ million, and would increase or decrease total shareholders’ equity and total capitalization by $ million, after deducting underwriting discounts and commissions and the estimated offering expenses payable by us. Similarly, any increase or decrease in the number of shares that we sell in the offering will increase or decrease our net proceeds by such increase or decrease, as applicable, multiplied by the offering price per share, less underwriting discounts and commissions and offering expenses. |
| (2) | Total debt excludes accounts payable, accrued expenses, and other liabilities. |
33
Table of Contents
Purchasers of our common stock in this offering will suffer an immediate and substantial dilution in net tangible book value per share. Dilution is the amount by which the initial public offering price paid by purchasers of shares of our common stock exceeds the net tangible book value per share of our common stock after the offering.
As adjusted net tangible book value per share represents the amount of total tangible assets reduced by our total liabilities, divided by the number of shares of common stock outstanding after giving effect to the sale of shares of common stock in the offering at an initial public offering price of $ , the midpoint of the price range set forth on the cover page of this prospectus. Our as adjusted net tangible book value as of December 31, 2009 would have been $ million, or $ per share. This represents an immediate increase in net tangible book value of $ per share to existing shareholders and an immediate dilution of $ per share to new investors purchasing shares in the offering. The following table illustrates this per share dilution:
| Assumed initial public offering price per share of common stock |
$ | |||||
| Net tangible book value per share of common stock as of December 31, 2009 |
$ | |||||
| Increase in net tangible book value per share of common stock attributable to new investors |
||||||
| Decrease in net tangible book value per share of common stock after payment of underwriting discounts and commission and estimated offering expenses by us |
||||||
| As adjusted net tangible book value per share of common stock after this offering |
||||||
| Dilution per share of common stock to new investors |
$ | |||||
Our as adjusted net tangible book value will be $ , or $ per share, and the dilution per share of common stock to new investors will be $ , if the underwriters’ over-allotment option is exercised in full.
A $1.00 increase or decrease in the assumed initial public offering price of $ per share would increase or decrease, as applicable, our as adjusted net tangible book value per share of common stock by $ , and increase or decrease, as applicable, the dilution per share of common stock to new investors by $ , assuming the number of shares offered by us, as set forth on the cover page of this prospectus, remains the same, after deducting the estimated underwriting discounts and commissions and estimated offering expenses payable by us. Similarly, any increase or decrease in the number of shares that we sell in the offering will increase or decrease our net proceeds in proportion to such increase or decrease, as applicable, multiplied by the offering price per share, less underwriting discounts and commissions and offering expenses.
The following table sets forth, as of December 31, 2009, on the as-adjusted basis described above, the differences between our shareholder and new investors with respect to the total number of shares of common stock purchased from us, the total consideration paid and the average price per share paid before deducting underwriting discounts and commissions, and estimated offering expenses payable by us, at an assumed initial public offering price of $ per share of common stock, which is the midpoint of the range set forth on the cover page of this prospectus:
| Shares Purchased | Total Consideration |
Average Price Per Share | ||||||||
| Number | Percent | Amount | Percent | |||||||
| Existing shareholder |
||||||||||
| New investors |
||||||||||
34
Table of Contents
A $1.00 increase or decrease in the assumed initial public offering price of $ per share would increase or decrease, as applicable, total consideration paid by new investors, total consideration paid by all shareholders, and average price per share paid by all shareholders by $ , $ , and $ , respectively, assuming the number of shares offered by us, as set forth on the cover page of this prospectus, remains the same. Similarly, any increase or decrease in the number of shares that we sell in the offering will increase or decrease our net proceeds in proportion to such increase or decrease, as applicable, multiplied by the offering price per share, less underwriting discounts and commissions.
If the underwriters’ over-allotment option is exercised in full, the number of shares held by our existing shareholder after this offering would be , or %, and the number of shares held by new investors would increase to , or %, of the total number of shares of our common stock outstanding after this offering.
35
Table of Contents
Selected Financial and Other Data
The following table sets forth our selected financial and operating data as of the dates and for the periods indicated. The combined statements of operations for the years ended December 31, 2007, 2008, and 2009, and the combined balance sheet data as of December 31, 2008 and 2009, have been derived from our audited financial statements, which are included elsewhere in this prospectus. The combined statements of operations for the years ended December 31, 2005 and 2006, and the combined balance sheet data as of December 31, 2005, 2006, and 2007, have been derived from our audited financial statements, which are not included in this prospectus.
You should read the following selected financial and other data in conjunction with “Management’s Discussion and Analysis of Financial Condition and Results of Operations” and our combined financial statements and related notes included elsewhere in this prospectus.
| Years Ended December 31, | ||||||||||||||||||||
| 2005 | 2006 | 2007 | 2008 | 2009 | ||||||||||||||||
| ($ in thousands) | ||||||||||||||||||||
| Combined Statements of Operations: |
||||||||||||||||||||
| Revenue: |
||||||||||||||||||||
| Sales of used vehicles |
$ | 693,133 | $ | 808,131 | $ | 963,621 | $ | 796,750 | $ | 694,460 | ||||||||||
| Interest income |
196,426 | 220,683 | 250,628 | 261,875 | 251,822 | |||||||||||||||
| Total revenue |
889,559 | 1,028,814 | 1,214,249 | 1,058,625 | 946,282 | |||||||||||||||
| Costs and expenses: |
||||||||||||||||||||
| Cost of used vehicles sold |
423,413 | 498,365 | 575,234 | 477,255 | 394,362 | |||||||||||||||
| Provision for credit losses |
173,320 | 192,010 | 283,407 | 300,884 | 223,686 | |||||||||||||||
| Secured debt interest expense |
35,137 | 47,748 | 63,719 | 74,749 | 95,037 | |||||||||||||||
| Unsecured debt interest expense |
2,514 | 10,076 | 12,982 | 22,333 | 15,629 | |||||||||||||||
| Selling and marketing |
36,245 | 35,330 | 36,210 | 28,644 | 31,491 | |||||||||||||||
| General and administrative |
128,156 | 151,999 | 154,018 | 157,311 | 148,350 | |||||||||||||||
| Depreciation expense |
10,425 | 11,600 | 15,784 | 14,088 | 13,061 | |||||||||||||||
| Gain on extinguishment of debt, net (1) |
— | — | — | (19,699 | ) | (30,311 | ) | |||||||||||||
| Total costs and expenses |
809,210 | 947,128 | 1,141,354 | 1,055,565 | 891,305 | |||||||||||||||
| Income before income taxes |
80,349 | 81,686 | 72,895 | 3,060 | 54,977 | |||||||||||||||
| Income tax expense (benefit) (2) |
1,134 | (1,426 | ) | 1,000 | 1,090 | 730 | ||||||||||||||
| Net income |
$ | 79,215 | $ | 83,112 | $ | 71,895 | $ | 1,970 | $ | 54,247 | ||||||||||
| Earnings per share: |
||||||||||||||||||||
| Basic |
$ | 792.15 | $ | 831.12 | $ | 718.95 | $ | 19.70 | $ | 542.47 | ||||||||||
| Diluted |
$ | 792.15 | $ | 831.12 | $ | 718.95 | $ | 19.70 | $ | 542.47 | ||||||||||
| Dividends per share: |
||||||||||||||||||||
| Basic |
$ | 581.84 | $ | 472.37 | $ | 511.94 | $ | 127.33 | $ | 271.10 | ||||||||||
| Diluted |
$ | 581.84 | $ | 472.37 | $ | 511.94 | $ | 127.33 | $ | 271.10 | ||||||||||
| (Unaudited) | ||||||||||||||||||||
| Weighted average number of shares outstanding: |
||||||||||||||||||||
| Basic |
100 | 100 | 100 | 100 | 100 | |||||||||||||||
| Diluted |
100 | 100 | 100 | 100 | 100 | |||||||||||||||
| Pro Forma Income Information: |
||||||||||||||||||||
| Historical income before income tax expense |
$ | 72,895 | $ | 3,060 | 54,977 | |||||||||||||||
| Pro forma initial public offering adjustments (3) |
— | — | 42,663 | |||||||||||||||||
| Pro forma income before pro forma income tax expense |
72,895 | 3,060 | $ | 97,640 | ||||||||||||||||
| Pro forma provision for income taxes (4) |
29,092 | 1,701 | 38,470 | |||||||||||||||||
| Pro forma net income |
$ | 43,803 | $ | 1,359 | $ | 59,170 | ||||||||||||||
| Pro forma net income margin (5) |
3.6 | % | 0.1 | % | 6.3 | % | ||||||||||||||
| Other Data: |
||||||||||||||||||||
| Adjusted EBITDA (6) |
$ | 96,679 | $ | 105,218 | $ | 104,783 | $ | 33,978 | $ | 78,011 | ||||||||||
| Adjusted EBITDA margin (7) |
10.9 | % | 10.2 | % | 8.6 | % | 3.2 | % | 8.2 | % | ||||||||||
| Pro forma adjusted EBITDA (6) |
$ | 91,903 | ||||||||||||||||||
| Pro forma adjusted EBITDA margin (7) |
9.7 | % | ||||||||||||||||||
36
Table of Contents
| As of and for the Years Ended December 31, | ||||||||||||||||||||
| 2005 | 2006 | 2007 | 2008 | 2009 | ||||||||||||||||
| ($ in thousands, except per vehicle sold data) | ||||||||||||||||||||
| (unaudited) | ||||||||||||||||||||
| Dealerships: |
||||||||||||||||||||
| Dealerships in operation at end of period |
86 | 97 | 103 | 86 | 78 | |||||||||||||||
| Average number of vehicles sold per dealership per month |
56 | 54 | 55 | 49 | 52 | |||||||||||||||
| Retail Sales: |
||||||||||||||||||||
| Number of used vehicles sold |
54,778 | 60,324 | 66,922 | 55,415 | 49,500 | |||||||||||||||
| Average age of vehicles sold (in years) |
3.8 | 4.1 | 3.9 | 4.1 | 4.1 | |||||||||||||||
| Average mileage of vehicles sold |
61,791 | 66,236 | 64,898 | 67,428 | 68,076 | |||||||||||||||
| Per vehicle sold data: |
||||||||||||||||||||
| Average sales price |
$ | 12,653 | $ | 13,397 | $ | 14,399 | $ | 14,378 | $ | 14,029 | ||||||||||
| Average cost of used vehicle sold |
$ | 7,730 | $ | 8,261 | $ | 8,596 | $ | 8,612 | $ | 7,967 | ||||||||||
| Average gross margin |
$ | 4,923 | $ | 5,136 | $ | 5,803 | $ | 5,766 | $ | 6,062 | ||||||||||
| Gross margin percentage |
38.9 | % | 38.3 | % | 40.3 | % | 40.1 | % | 43.2 | % | ||||||||||
| Loan Portfolio: |
||||||||||||||||||||
| Number of applications |
157,672 | 168,560 | 195,684 | 187,486 | 179,508 | |||||||||||||||
| Close rate percentage (8) |
34.7 | % | 35.8 | % | 34.2 | % | 29.6 | % | 27.6 | % | ||||||||||
| Principal balances originated |
$ | 684,834 | $ | 799,363 | $ | 959,517 | $ | 789,360 | $ | 686,214 | ||||||||||
| Average amount financed per origination |
$ | 12,507 | $ | 13,254 | $ | 14,341 | $ | 14,250 | $ | 13,867 | ||||||||||
| Number of loans outstanding – end of period |
102,474 | 112,040 | 124,228 | 125,070 | 127,737 | |||||||||||||||
| Principal outstanding – end of period |
$ | 935,182 | $ | 1,104,325 | $ | 1,343,085 | $ | 1,342,855 | $ | 1,312,216 | ||||||||||
| Average principal outstanding during the period |
$ | 904,657 | $ | 1,032,408 | $ | 1,271,678 | $ | 1,410,292 | $ | 1,364,782 | ||||||||||
| Average effective yield on portfolio (9) |
21.7 | % | 21.5 | % | 20.0 | % | 19.3 | % | 19.3 | % | ||||||||||
| Allowance for credit losses as a percentage of portfolio principal |
17.4 | % | 17.4 | % | 18.2 | % | 18.1 | % | 16.6 | % | ||||||||||
| Portfolio performance data: |
||||||||||||||||||||
| Portfolio delinquencies over 30 days (10) |
9.3 | % | 7.2 | % | 8.6 | % | 9.4 | % | 7.4 | % | ||||||||||
| Principal charged-off as a percentage of average principal outstanding |
26.3 | % | 25.9 | % | 27.2 | % | 30.3 | % | 26.6 | % | ||||||||||
| Recoveries as a percentage of principal charged-off |
34.7 | % | 39.2 | % | 32.9 | % | 29.4 | % | 31.7 | % | ||||||||||
| Net charge-offs as a percentage of average principal outstanding |
17.2 | % | 15.8 | % | 18.2 | % | 21.4 | % | 18.2 | % | ||||||||||
| Financing and Liquidity: |
||||||||||||||||||||
| Unrestricted cash and availability (11) |
$ | 101,041 | $ | 121,664 | $ | 126,309 | $ | 50,232 | $ | 40,407 | ||||||||||
| Net debt to equity (12) |
2.9 | 3.0 | 3.5 | 3.6 | 3.2 | |||||||||||||||
| Total assets to total equity |
5.0 | 4.9 | 5.2 | 5.1 | 4.7 | |||||||||||||||
| Total average secured and unsecured debt |
$ | 754,657 | $ | 878,417 | $ | 1,063,806 | $ | 1,153,122 | $ | 1,047,522 | ||||||||||
| Secured debt weighted average effective borrowing rate (13) |
4.8 | % | 6.0 | % | 6.6 | % | 7.7 | % | 10.3 | % | ||||||||||
| Unsecured debt weighted average effective borrowing rate (13) |
10.2 | % | 12.6 | % | 12.7 | % | 12.2 | % | 12.2 | % | ||||||||||
| Weighted average effective borrowing rate on total debt (13) |
5.0 | % | 6.6 | % | 7.2 | % | 8.4 | % | 10.6 | % | ||||||||||
37
Table of Contents
| December 31, | |||||||||||||||||||
| 2005 | 2006 | 2007 | 2008 | 2009 | |||||||||||||||
| ($ in thousands) | |||||||||||||||||||
| Combined Balance Sheet Data: |
|||||||||||||||||||
| Cash and cash equivalents |
$ | 41,306 | $ | 41,483 | $ | 42,241 | $ | 25,533 | 21,526 | ||||||||||
| Restricted cash and investments held in |
$ | 134,929 | $ | 131,221 | $ | 107,271 | $ | 71,223 | 84,064 | ||||||||||
| Finance receivables (15) |
$ | 954,370 | $ | 1,129,509 | $ | 1,375,961 | $ | 1,375,019 | 1,340,591 | ||||||||||
| Allowance for credit losses |
$ | (162,900 | ) | $ | (192,150 | ) | $ | (244,034 | ) | $ | (242,600 | ) | (218,259 | ) | |||||
| Inventory |
$ | 121,805 | $ | 122,460 | $ | 136,642 | $ | 100,211 | 115,257 | ||||||||||
| Total assets |
$ | 1,177,802 | $ | 1,349,649 | $ | 1,532,060 | $ | 1,447,152 | 1,448,494 | ||||||||||
| Secured debt |
$ | 787,696 | $ | 912,879 | $ | 1,038,191 | $ | 912,201 | 1,010,728 | ||||||||||
| Unsecured debt |
$ | 76,495 | $ | 77,064 | $ | 131,823 | $ | 194,866 | 76,487 | ||||||||||
| Total debt (17) |
$ | 864,191 | $ | 989,938 | $ | 1,170,014 | $ | 1,107,067 | 1,087,215 | ||||||||||
| Shareholder’s equity |
$ | 236,609 | $ | 272,484 | $ | 293,185 | $ | 282,422 | 309,559 | ||||||||||
| (1) | During the years ended December 31, 2008 and 2009, we repurchased outstanding indebtedness in the amounts of $96.0 million and $135.2 million, respectively, at a discount to par, resulting in net gains on extinguishment of debt. |
| (2) | We elected to be treated as an S-corporation for federal and state income tax purposes. There is no provision for income taxes in the years ended December 31, 2005, 2006, 2007, 2008, and 2009, except for a reduced amount of entity level state tax in certain jurisdictions, and for one of our subsidiaries which is a C-corporation. Income and losses flow through to our sole shareholder, who reports such income and losses on individual income tax returns. |
| (3) | Pro forma initial public offering adjustments represent adjustments to income before income taxes as if the offering set forth herein was consummated on January 1, 2009. Included in this adjustment are the following assumptions: (i) net savings of $11.0 million from the termination of related party leases (which includes cancellation of lease payments and $5.9 million of one-time write-offs of lease liabilities and deferred rent), net of depreciation expense on properties acquired; (ii) net savings of $31.6 million in interest expense from repayment of subordinated notes payable, junior secured notes, and senior unsecured notes payable, and reduction in average outstanding balances under portfolio warehouse facilities as a result of the paydown of these debt instruments from net proceeds from the offering. |
| (4) | Pro forma income tax expense has been determined as if we elected to be treated as a C-corporation as of January 1, 2007 for federal and state income tax purposes for the years and periods presented. |
| (5) | Pro forma net income margin represents pro forma net income divided by total revenue. |
| (6) | We define Adjusted EBITDA as net income plus income tax expense; plus non-portfolio interest expense (which includes interest expense associated with our senior unsecured notes, subordinated notes, junior secured notes, and former residual facility); plus depreciation expense; plus store closing costs related to downsizing (and not those closed in the ordinary course of business); plus legal settlement; less gain on extinguishment of debt, net. |
| We present Adjusted EBITDA because we consider it to be an important supplemental measure of our operating performance. All of the adjustments made in our calculation of Adjusted EBITDA are adjustments to items that management does not consider to be reflective of our core operating performance. Management considers our core operating performance to be that which can be affected by our managers in any particular period through their management of the resources that affect our underlying revenue and profit generating operations during that period. |
| However, Adjusted EBITDA is not a recognized measurement under GAAP and when analyzing our operating performance, investors should use Adjusted EBITDA in addition to, and not as an alternative for, net income, operating income, or any other performance measure presented in accordance with GAAP, or as an alternative to cash flow from operating activities or as a measure of our liquidity. Because not all companies use identical calculations, our presentation of Adjusted EBITDA may not be comparable to similarly titled measures of other companies. Adjusted EBITDA has limitations as an analytical tool, as discussed under “Management’s Discussion and Analysis of Financial Condition and Results of Operations – Non-GAAP discussion.” |
| Pro forma adjusted EBITDA represents adjusted EBITDA on a pro forma basis to give effect to the offering as if the offering were consummated on January 1, 2009. |
38
Table of Contents
| The following table presents data relating to Adjusted EBITDA, which is a non-GAAP measure, for the periods indicated: |
| Years Ended December 31, | |||||||||||||||||
| 2005 | 2006 | 2007 | 2008 | 2009 | |||||||||||||
| ($ in thousands) | |||||||||||||||||
| (Unaudited) | |||||||||||||||||
| Net income |
$ | 79,215 | $ | 83,112 | $ | 71,895 | $ | 1,970 | 54,247 | ||||||||
| Plus EBITDA adjustments: |
|||||||||||||||||
| Income tax expense (benefit) |
1,134 | (1,426 | ) | 1,000 | 1,090 | 730 | |||||||||||
| Non-portfolio interest expense |
5,905 | 11,932 | 16,104 | 26,545 | 29,199 | ||||||||||||
| Depreciation expense |
10,425 | 11,600 | 15,784 | 14,088 | 13,061 | ||||||||||||
| Store closing costs |
— | — | — | 9,984 | 3,485 | ||||||||||||
| Legal settlement |
— | — | — | — | 7,600 | ||||||||||||
| Less: gain on extinguishment of debt, net |
— | — | — | (19,699 | ) | (30,311 | ) | ||||||||||
| Adjusted EBITDA |
$ | 96,679 | $ | 105,218 | $ | 104,783 | $ | 33,978 | 78,011 | ||||||||
| The following table presents data relating to pro forma adjusted EBITDA, which is a non-GAAP measure, for the period indicated: |
| Year ended December 31, 2009 |
||||
| ($ in thousands) | ||||
| (Unaudited) | ||||
| Pro forma net income |
$ | 59,170 | ||
| Plus: Pro forma EBITDA adjustments |
||||
| Pro forma income tax expense |
38,470 | |||
| Pro forma depreciation expense |
13,489 | |||
| Pro forma store closing costs |
3,485 | |||
| Pro forma legal settlement |
7,600 | |||
| Less: gain on extinguishment of debt |
(30,311 | ) | ||
| Pro forma adjusted EBITDA |
$ | 91,903 | ||
| (7) | Adjusted EBITDA margin and pro forma adjusted EBITDA margin represents Adjusted EBITDA and pro forma adjusted EBITDA, respectively divided by total revenue. |
| (8) | Close rate percentage represents the percentage of customer applications for credit that result in sales of used vehicles. |
| (9) | Average effective yield represents the interest income earned at the contractual rate (stated APR) less the write-off of accrued interest on charged-off loans and amortization of loan origination costs (which includes the write-off of unamortized loan origination costs on charged-off loans), plus interest earned on investments held in trust and late fees earned. |
| (10) | Delinquencies are presented on a Sunday-to-Sunday basis, which reflects delinquencies as of the nearest Sunday to period end. Sunday is used to eliminate any impact of the day of the week on delinquencies since delinquencies tend to be higher mid-week. |
| (11) | Unrestricted cash and availability consists of cash and cash equivalents plus available borrowings under the portfolio warehouse, residual, and inventory facilities, based on assets pledged or available to be pledged to the facilities. |
| (12) | Net debt to equity equals total debt less cash, restricted cash, and investments held in trust, divided by shareholder’s equity. |
| (13) | Average effective borrowing rate includes the effect of amortization of discounts, debt issuance costs, and unused line fees. |
| (14) | Restricted cash and investments held in trust consist of cash and cash equivalents pledged as collateral under securitization transactions and the portfolio warehouse facilities. |
| (15) | Finance receivables include principal balances, accrued interest, and capitalized loan origination costs. |
| (16) | Total debt excludes accounts payable, accrued expenses, and other liabilities. |
39
Table of Contents
Management’s Discussion and Analysis
of Financial Condition and Results of Operations
The following discussion and analysis of our financial condition and results of operations should be read in conjunction with our combined financial statements and related notes that appear elsewhere in this prospectus. In addition to historical financial information, the following discussion contains forward-looking statements that reflect our plans, estimates, and beliefs. Our actual results could differ materially from those discussed in the forward-looking statements. Factors that could cause or contribute to these differences include those discussed below and elsewhere in this prospectus, particularly in “Risk Factors” and “Forward-Looking Statements.”
Overview
We are the leading used vehicle retailer in the United States focusing on the sale and financing of quality vehicles to the subprime market. Through our branded dealerships, we provide our customers with a comprehensive end-to-end solution for their automotive needs, including the sale, financing, and maintenance of their vehicles. As of December 31, 2009, we owned and operated 78 dealerships and 13 reconditioning facilities in 18 metropolitan areas in 11 states. For the year ended December 31, 2009, we sold 49,500 vehicles, generated $946.3 million of total revenue (which consisted of vehicle sales and interest income), and earned $55.0 million of pre-tax income, including gain on extinguishment of debt of $30.3 million. We provide our customers with financing for substantially all of the vehicles we sell. As of December 31, 2009, our loan portfolio had a total outstanding principal balance of $1.3 billion.
Over the past 17 years, we have developed an integrated business model that consists of vehicle acquisition, reconditioning, sales, underwriting and finance, loan servicing, and after sale support. We believe that our model enables us to operate successfully in the underserved subprime market segment. In addition, we believe that our model will allow us to systematically open new dealerships in existing and new markets throughout the United States.
We operate in the large and highly fragmented used vehicle sales and financing markets. According to CNW, for 2009, industry sales of used vehicles totaled $301.0 billion, which consisted of sales from approximately 53,500 franchise and independent dealers and private transactions. The five largest used vehicle retailers accounted for only 2.7% of the nationwide market share in 2009. At the end of 2009, total used vehicle loans outstanding approximated $806.9 billion and the subprime segment we focus on comprised 21.7% of total automobile loans outstanding. Within the subprime market, we cater to customers who have the income necessary to purchase a used vehicle, but because of their impaired credit histories, cannot qualify for financing from traditional third-party sources. Our average customer is 25 to 55 years of age, has an annual income of $24,000 to $56,000, and has a FICO score between 450 and 570. FICO scores range from 350 to 850, and a customer with a FICO score below 620 is typically considered to have subprime credit.
We believe the key competitive factors to effectively serve customers in this market are: (i) availability of financing, (ii) affordability of down payments and installment payments, (iii) breadth and desirability of vehicle selection, (iv) quality of the vehicles and the warranty provided, and (v) convenience of dealership locations and customer service. In general, the other primary buying options for customers in this segment are to purchase older, higher mileage vehicles from small, independent used vehicle dealers, or in private transactions with individuals.
40
Table of Contents
We believe that our business model has several advantages over our competition and that we provide our customers with a unique buying experience featuring:
| • | branded, attractive dealership facilities, each of which maintains a large inventory of quality, reconditioned used vehicles; |
| • | professional and courteous service with “no haggle” pricing and a three day “no questions asked” return policy; |
| • | vehicle financing with affordable down payments and installment payments; |
| • | our DriveCare® limited warranty program (included in the sales price of each vehicle) – a 36 month / 36,000 mile major mechanical warranty, including oil changes at Sears automotive locations nationwide and 24/7 roadside assistance; and |
| • | numerous payment options, which include cash payments at over 3,700 Wal-Mart stores and more than 10,400 other locations nationwide, as well as online, by phone, and through other traditional payment methods. |
Access to funding
We provide financing to our customers to facilitate the purchase of used vehicles from us. In addition to borrowing funds to meet these requirements, we require capital to maintain our inventory of vehicles, and to provide working capital for our operations. Historically, we have relied upon portfolio warehouse facilities and securitization transactions. When the securitization market deteriorated beginning in 2007, we were able to secure financing from a large consumer lender with expertise in the automobile receivables space, as well as subordinated debt provided by Verde, an affiliate of Ernest C. Garcia II, our Chairman and sole shareholder, and other sources, albeit at a higher cost of funds.
In December 2009, we completed our first securitization transaction since June 2007 by issuing $192.6 million of asset-backed securities, which are collateralized by approximately $300.0 million of finance receivables. The asset-backed securities are structured in four tranches with credit ratings ranging from AAA to A, without external credit enhancement from a monoline insurer. The weighted average coupon of these four tranches was 5.3%. See “– Liquidity and capital resources – Financing sources – Portfolio term financings” below for additional information regarding securities ratings.
Planned dealership openings
We believe we are well positioned to expand our dealership network throughout the United States, primarily through organic growth. We believe our centralized and integrated business model enables us to efficiently open new and dealerships. Our typical times from site selection to lease execution and from lease execution to store opening are one to six months and two to four months, respectively, and we generally achieve profitability within six to 12 months of opening. We seek to locate new stores in existing commercial facilities, typically lease each facility for five years (with options to extend for another five to 15 years), and spend approximately $350,000 to $450,000 in leasehold improvements and equipment to establish each of our branded dealerships. We generally seek to expand into metropolitan areas in the United States with populations ranging from 500,000 to three million people that have customer demographic concentrations consistent with our target market and that have favorable operating environments. As of December 31, 2009, we had dealerships in 14 of 81 metropolitan areas between 500,000 and three million people, and we had dealerships in four of 16 metropolitan areas with populations in excess of three million people.
41
Table of Contents
Income statement line item descriptions
Revenue
Sales of used vehicles
We derive a significant portion of our revenue from the sale of used vehicles. Sales of used vehicles includes revenue from the sale of vehicles, net of a reserve for returns. Factors affecting revenue from sales of used vehicles include the number of used vehicles we sell and the price at which we sell our vehicles.
The number of used vehicles we sell depends on the volume of customer applications received and the conversion rate from customer application to sale. Application volume is a function of the number of dealerships, advertising, customer referrals, repeat customer volume, other marketing efforts, competition from other used car dealerships, availability of credit from other subprime finance companies, and general economic conditions. The conversion rate from customer application to sale is a function of our underwriting standards, customer sales experience, customer affordability, vehicle inventory, and warranty provided. The price at which we sell our vehicles is dependent on our pricing strategy, which balances margins, sales volume, and loan performance.
Interest income
Interest income consists of interest earned on installment sales contracts net of amortization of loan origination costs, plus late payment fees and interest earned on investments held in trust. We write-off accrued interest on charged-off loans as a reduction to interest income. Interest income is affected by (i) the principal balance of our loan portfolio, (ii) the average APR of our loan portfolio, and (iii) the payment performance by our borrowers on their loans.
Costs and expenses
Cost of used vehicles sold
Cost of used vehicles sold includes the cost to acquire vehicles, reconditioning and transportation costs associated with preparing the vehicles for resale, vehicle warranty, and other related costs. The cost to acquire vehicles includes the vehicle purchase price, auction fees, wages, and other buyer costs. A liability for the estimated cost of vehicle repairs under our DriveCare® limited vehicle warranty program is established at the time a used vehicle is sold by charging cost of used vehicles sold. The liability is evaluated for adequacy through an analysis based on the program’s historical performance of warranty cost incurred per unit sold over the term of the warranty.
The cost of used vehicles sold is affected by a variety of factors including: (i) the cost of vehicles purchased at auction, (ii) the quality, make, model, and age of vehicles acquired, (iii) transportation costs, (iv) labor costs and costs to operate our reconditioning facilities, and (v) warranty costs.
Provision for credit losses
Provision for credit losses is the charge recorded to operations to maintain an allowance adequate to cover losses inherent in the portfolio. We charge off the entire principal balance of receivables that are contractually 91 or more days past due at the end of a month, net of estimated recoveries. The allowance for credit losses varies based on size of the loan portfolio and the expected performance of the loans. Loan performance is a function of the underlying credit quality of the portfolio, the effectiveness of collection activities, auction values for repossessed vehicles, other ancillary collections, and overall economic conditions.
42
Table of Contents
We anticipate the allowance for credit losses to grow as we increase origination volume and grow our portfolio. However, the allowance as a percentage of portfolio principal may decline based on performance of loans originated since we tightened our loan underwriting standards beginning in the second quarter of 2008. Loans originated since we tightened our underwriting standards represent 67.6% of our loan portfolio as of December 31, 2009.
Secured debt interest expense and unsecured debt interest expense
Secured debt interest expense consists of interest and related amortization of debt issuance costs on our portfolio warehouse facilities, securitizations, PALP financings, inventory and other revolving facilities, real estate mortgage financing, and junior secured notes payable. Our junior secured notes payable at December 31, 2009 consist of a $38.1 million Tranche A component and a $24.0 million subordinate Tranche B component. Raymond C. Fidel, our President and Chief Executive Officer, holds $2.0 million of Tranche A notes and Verde, an affiliate of Ernest C. Garcia II, our Chairman and sole shareholder, holds an aggregate of $60.1 million of Tranche A and Tranche B notes at December 31, 2009. At December 31, 2009, the Tranche A notes bear interest at 22% per annum and the Tranche B notes bear interest at 27% per annum. Secured debt interest expense is dependent on the amount of secured indebtedness and the interest expense associated therewith, both of which are dependent in part on the financial markets and economy as a whole.
Unsecured debt interest expense consists of interest expense and related amortization of discounts and debt issuance costs on our senior unsecured notes payable and our subordinated notes. Our subordinated notes consist of $75.0 million to Verde, an affiliate of Ernest C. Garcia II, our Chairman and sole shareholder, with interest at 12.0% per annum. Unsecured debt interest expense is dependent on the amount of unsecured indebtedness and the interest expense associated therewith, both of which are dependent on the financial markets and economy as a whole.
In connection with this offering, Verde has agreed to exchange an aggregate of $100.0 million of subordinated notes and junior secured notes for shares of our newly-designated 6.5% convertible preferred stock. In addition, we intend to use $35.1 million of the proceeds from this offering to retire subordinated notes and junior secured notes payable to Verde that are not exchanged for shares of preferred stock, and $2.0 million to retire junior secured notes that are held by Raymond C. Fidel, our President and Chief Executive Officer.
Selling and marketing
Selling and marketing expenses include salaries and commissions of sales personnel, as well as advertising and marketing-related costs. Our selling and marketing expenses are generally affected by the salaries and commissions we pay to our sales personnel, which are dependent in part on the volume of vehicles sold. Selling and marketing expenses are also generally affected by the cost of advertising media and our marketing strategy.
General and administrative
General and administrative expenses include compensation and benefits, property-related expenses, collection expenses on our portfolio, store closing costs, and other ancillary expenses, such as professional fees and services.
We anticipate that general and administrative expenses will increase related to costs associated with being a public company, and costs associated with expansion of our dealership base. We anticipate that collection-related expenses will decrease as we centralize our collections for early delinquencies at our new collection facility in Dallas, Texas.
43
Table of Contents
Gain on extinguishment of debt, net
Gain on extinguishment of debt, net represents the difference between the carrying value of the debt we repurchased and the purchase price at which we repurchased the debt, net of the write-off of unamortized debt issuance costs and discounts.
Critical accounting policies
The discussion and analysis of our financial condition and results of operations are based upon our combined financial statements, which have been prepared in accordance with United States generally accepted accounting principles. The preparation of these financial statements requires management to make estimates and judgments that affect the reported amounts of assets and liabilities, revenue and expenses, and related disclosures of contingent assets and liabilities at the date of our financial statements. Actual results may differ from these estimates under different assumptions or conditions, impacting our reported results of operations and financial condition.
Certain accounting policies involve significant judgments and assumptions by management, which have a material impact on the carrying value of assets and liabilities and the recognition of income and expenses. Management considers these accounting policies to be critical accounting policies. The estimates and assumptions used by management are based on historical experience and other factors, which are believed to be reasonable under the circumstances. The significant accounting policies which we believe are the most critical to aid in fully understanding and evaluating our reported financial results are described below.
Revenue recognition
Revenue from the sale of used vehicles is recognized upon delivery, when the sales contract is signed, and the agreed-upon down payment or purchase price has been received. Sales of used vehicles include revenue from the sale of used vehicles, net of a reserve for returns. The reserve for returns is estimated using historical experience and trends and could be affected if future vehicle returns differ from historical averages. A 10.0% increase in our rate of returns would result in a $0.6 million decrease in sales revenue and a $0.2 million decrease in net income (based on 2009 results). Revenue is recognized at time of sale since persuasive evidence of an arrangement in the form of an installment sales contract exists, we have delivered the vehicle to the customer, transferred title, our sales have a fixed and determinable price, and collectability is reasonably assured.
Allowance for credit losses
We maintain an allowance for credit losses on an aggregate basis at a level we consider sufficient to cover probable credit losses inherent in our portfolio of receivables as of each reporting date utilizing a loss emergence period to cover 12 months of estimated losses. The allowance takes into account historical credit loss experience, including timing, frequency and severity of losses. This estimate of existing probable credit losses inherent in the portfolio is primarily based on static pool analyses by month of origination based on origination principal, credit grade mix and deal structure, including down payment and term. The evaluation of the adequacy of the allowance also considers factors and assumptions regarding the overall portfolio quality, delinquency status, the value of the underlying collateral, current economic conditions that may affect the borrowers’ ability to pay, and the overall effectiveness of collection efforts.
The static pool loss curves by grade are adjusted for actual performance to date, and historical seasonality patterns. The forecasted periodic loss rates, which drive the forecast for estimated gross losses (before recoveries) are calculated by factoring amortization speed, and origination terms. Charge offs have a natural seasonality pattern such that they
44
Table of Contents
are typically lower during the first and second quarters because customers tend to have additional money from tax refunds to apply to their loans, compared to the third and fourth quarters when charge offs tend to increase. Recoveries are estimated using historical unit and dollar static pool recovery activity to forecast recoveries for estimated charge offs at the balance sheet date. The forecasted recovery rates (on a per unit basis) are based on the historical unit recovery trend by recovery type as adjusted for estimated impact of economic and market conditions.
The allowance model is sensitive to changes in assumptions such that an increase or decrease in our forecasted net charge-offs would increase or decrease the allowance as a percentage of principal outstanding required to be maintained. The amount of our allowance is sensitive to losses within credit grade, recovery values, deal structure, the loss emergence period and overall credit grade mix of the portfolio. In the event loss assumptions used in the calculation of the allowance for credit losses were to increase, there would be a corresponding increase in the amount of the allowance for credit losses, which would decrease the net carrying value of finance receivables and increase the amount of provision for credit losses, thereby decreasing net income. As of December 31, 2009, a 5% increase in our frequency loss assumption would increase the allowance for credit losses and our provision for credit losses by $9.2 million. Also, a 5% decrease in our assumed recoveries per loan charged off, would result in an increase to the allowance for credit losses and provision for credit losses by $3.9 million. Our ability to forecast net charge-offs and track static pool net losses by month of origination are a critical aspect of this analysis.
Although it is reasonably possible that events or circumstances could occur in the future that are not presently foreseen, which could cause actual credit losses to be materially different from the recorded allowance for credit losses, we believe that we have given appropriate consideration to the relevant factors and have made reasonable assumptions in determining the level of the allowance. Our credit and underwriting policies and adherence to such policies and the execution of collections processes have a significant impact on collection results, as well as the economy as a whole. Changes to the economy, unemployment, auction prices for repossessed vehicles, and collections and recovery processes could materially affect our reported results.
Recovery Receivables
All loans over 90 days past due at month end are charged off. Recovery receivables consist of estimated recoveries to be received on charged off receivables, including proceeds from selling repossessed vehicles at auction, along with insurance, bankruptcy and deficiency collections. Recoveries for charged off loans are estimated using historical per unit recoveries. In order to estimate auction recoveries we utilize historical static pool unit recovery rates as adjusted for recent market trends to arrive at the forecasted recovery dollars by static pool month of charge-offs. The result is then adjusted for seasonality which takes into account the average amount of value lost in a vehicle for each month that it ages from the period of charge off to the period of recovery. Insurance, bankruptcy and deficiency collections are estimated using historical trends adjusted for changes to recovery practices.
45
Table of Contents
Valuation of inventory
Inventory consists of used vehicles held-for-sale or currently undergoing reconditioning and is stated at the lower of cost or market value. Vehicle inventory cost is determined by specific identification. Direct and indirect vehicle reconditioning costs including parts and labor, costs to transport the vehicles to our dealership locations, buyer costs, and other incremental costs are capitalized as a component of inventory cost. Determination of the market value of inventory involves assumptions regarding wholesale loss rates derived from historical trends and could be affected by changes in supply and demand at our retail locations and at the auctions. A 1% decrease in the valuation of our inventory at December 31, 2009 would result in a decrease in net income of approximately $1.2 million.
Secured financings
Securitizations
We sell loans originated at our dealerships to our bankruptcy-remote securitization subsidiaries, which, in turn, transfer the loans to separate trusts that issue notes and certificates collateralized by these loans. The senior class notes, or Class A notes, are sold to investors, and we retain the subordinate classes. We continue to service all securitized loans. Due to certain restrictions placed on the trusts (i.e., the trusts do not have the right to pledge the assets), securitization transactions have been accounted for as secured financings, in accordance with ASC 860 – Transfers and Servicing. Loans included in the securitization transactions are recorded as finance receivables and the asset-backed securities that are issued by the trusts are recorded as a component of portfolio term financings in the accompanying combined balance sheets.
Pooled auto loan program transactions
When the securitization market deteriorated beginning in 2007, we launched our PALP program to serve as a source of fixed-rate financing for our finance receivable portfolio. Under PALP, we pool contracts originated at our dealerships and sell them to either (i) a special purpose entity which transfers the loans to a separate trust which, in turn, issues a note collateralized by the loans; or (ii) we sell the pooled loans, in a secured financing transaction, directly to a third-party financial institution. We retain all servicing. Both types of PALP transactions are accounted for as secured financings either due to our right to repurchase the loans sold at a specified date or due to restrictions placed on the trust. Therefore, the loan contracts included in the transactions remain in finance receivables and the debt is reflected as portfolio term financings on the combined balance sheets.
Limited warranty
A liability for the estimated cost of vehicle repairs under our DriveCare® limited vehicle warranty program is established at the time a used vehicle is sold by charging costs of used vehicles sold. Starting with sales in December 2009, the DriveCare® limited warranty plan was extended to 36 months / 36,000 miles, and includes oil changes at Sears automotive locations nationwide and 24/7 roadside assistance. The liability is evaluated for adequacy through an analysis based on the program’s historical performance of warranty cost incurred per unit sold over the term of the warranty, as adjusted for the increased warranty coverage. Our liability is affected by the number of vehicles that come back for repair under warranty, the number of oil changes utilized, and our estimated cost per repair. These assumptions are further affected by mix and age of vehicles sold and our ability to recondition vehicles prior to sale. A 10.0% increase in our warranty accrual, would result in a reduction in net income of approximately $0.1 million for the year ended December 31, 2009.
46
Table of Contents
Factors affecting comparability
We have set forth below selected factors that we believe have had, or can be expected to have, a significant effect on the comparability of recent or future results of operations:
Income tax status
Historically, our two principal operating companies, DTAG and DTAC, were structured as pass through tax entities, and accordingly did not record any provision for income taxes except for an entity level state tax in certain states and C-corporation taxes for one of our subsidiaries. In connection with our initial public offering, we will undergo a reorganization that will, among other things, result in us being treated as a C-corporation subject to corporate income taxation. Consequently, we will record a net deferred tax liability and corresponding income tax expense. The amount of the deferred tax liability would have been approximately $51.4 million had the revocation date been December 31, 2009. The deferred tax liability is principally made up of $42.5 million from the intercompany loss on sale of receivables from DTAG to DTAC and $11.0 million from gain on debt extinguishment, offset by a $2.9 million deferred tax asset from net operating loss carryforwards. In addition, we would have had $8.3 million of net operating losses available to offset future income, for which there would have been an annual limitation of approximately $2.9 million.
As an S-corporation, DTAG sold receivables to DTAC at a discount and was able to report a related tax loss, which was eliminated in consolidation. To the extent these losses have been previously deducted for tax purposes by DTAG prior to our becoming a C-corporation, the losses will not be deductible again as we record a provision for credit losses for loans that existed at the date we convert to a C-corporation. Therefore, a deferred liability will be established upon conversion and that deferred liability will increase or decrease as a result of future loan originations and charge offs. The actual amounts of our deferred tax liability, net operating loss, and annual limitation thereon, will be determined and reflected in our results for the quarter during which our S-corporation status is terminated. The revocation of our S-corporation election will have an impact on our results of operations, financial condition, and cash flows. Our effective income tax rate will increase and our net income will decrease since we will be subject to both federal and state taxes on our earnings.
Public company expenses
Following this offering, we will be a public company, with our shares listed for trading on a national exchange. As a result, we expect that our general and administrative expenses will increase as we pay our employees, legal counsel, and accountants to assist us in, among other things, establishing and maintaining a more comprehensive compliance and board governance function, establishing and maintaining internal control over financial reporting in accordance with Section 404 of the Sarbanes-Oxley Act, and preparing and distributing periodic public reports under the federal securities laws. In addition, we expect that as a public company the cost of director and officer liability insurance will increase. We estimate that incremental public company costs will be between $5.0 million and $8.0 million annually.
Stock-based and other executive compensation
Prior to this offering, we have not granted or issued any stock-based compensation. Accordingly, we have not recognized any stock-based compensation expense. In connection with this offering, we intend to make awards to our directors, officers, and employees. As a result, we expect to incur non-cash, stock-based compensation expenses in future periods, and these amounts could be substantial.
47
Table of Contents
Related party transactions
At December 31, 2009, we leased 16 dealerships, three reconditioning facilities, our former loan servicing center, and our corporate office from affiliates of Ernest C. Garcia II, our Chairman and sole shareholder. Prior to this offering, the property that is the subject of these leases will be sold to us for a price equal to their aggregate carrying value at the time of sale, and the leases will be cancelled. The aggregate carrying value of these properties as of December 31, 2009 was $29.6 million. The aggregate fair market value of these properties (based on 2008 appraisals) was approximately $50.4 million. We are currently in the process of having these properties appraised to assess current market value. We incurred approximately $5.0 million, $5.1 million, and $5.5 million in total lease expenses (including store closing costs) for these leases in the years ended December 31, 2007, 2008, and 2009, respectively. The properties acquired from Verde will be recorded by us at Verde’s cost basis.
In addition, at December 31, 2009, we leased one dealership and one inspection center from a director and officer of DTAC and Mr. Garcia’s brother-in-law, Steven Johnson. Prior to this offering, the property that is the subject of these leases will be transferred to us for $2.0 million, and the leases will be cancelled. Our total lease obligation under these leases would otherwise have been approximately $3.2 million. We incurred approximately $0.3 million, $0.4 million, and $1.5 million (including store closure costs) in total lease expenses for these leases in the years ended December 31, 2007, 2008 and 2009, respectively. The properties acquired from Mr. Johnson will be recorded by us at the lower of market value or purchase price paid (our cost).
As a result of the transfers, lease expense will be lower in future periods, and depreciation and interest expense associated with anticipated financing will increase. We expect operating cost savings associated with the related party properties being acquired by us, net of depreciation and interest expense we will incur, to be approximately $9.7 million for 2010 (including $5.9 million benefit from the write-off of lease obligation accruals and deferred rent), assuming this offering closes in the first quarter of 2010. Our savings for 2011 and thereafter is estimated to be approximately $5.1 million.
In September 2005, we entered into a lease with Verde for an aircraft. Under the terms of the lease agreement, we agreed to pay monthly lease payments of $150,000 plus taxes to Verde, and are responsible for paying all costs and expenses related to the aircraft and its operations. The lease term is five years. We incurred $3.7 million, $3.7 million, and $3.6 million for the years ended December 31, 2007, 2008, and, 2009, respectively, of aircraft lease and operating expenses. In connection with this offering, this lease will be terminated and we will no longer incur related party aircraft lease or operating expenses.
In addition, in the years ended December 31, 2007, 2008, and 2009, we incurred $0.7 million, $0.3 million, and $0.4 million, respectively, in net related party general and administrative expenses in connection with our relationship with Verde. These arrangements will be terminated in connection with this offering.
Limited Warranty
Starting with sales in December 2009, we extended our DriveCare® limited warranty plan from six months / 6,000 miles to 36 months / 36,000 miles, and it now includes oil changes at Sears automotive locations nationwide and 24/7 roadside assistance. As a result, we expect that our warranty costs will be higher in future periods, however, we believe that the warranty will have a positive impact on vehicle sales and loan performance.
48
Table of Contents
Convertible preferred stock
Verde, an affiliate of Ernest C. Garcia II, our Chairman and sole shareholder, is the holder of all of our outstanding $75.0 million in 12% subordinated notes and the holder of $60.1 million of our junior secured notes ($36.1 million of which bear interest at 22% per annum and $24.0 million of which bear interest at 27% per annum at December 31, 2009). We incurred $6.4 million and $17.7 million in interest expense with respect to this debt for the years ended December 31, 2008 and 2009, respectively. In connection with this offering, Verde has agreed to exchange an aggregate of $100.0 million of subordinated notes and junior secured notes for shares of our newly-designated 6.5% convertible preferred stock, based on the midpoint of the range set forth on the cover page of this prospectus. See “Description of Capital Stock.” The remaining $35.1 million in indebtedness payable to Verde will be repaid with a portion of the proceeds of this offering. See “Use of Proceeds.”
The convertible preferred stock to be issued by us will be exchanged for the outstanding debt held by Verde. We believe that the features of the convertible preferred stock are most closely associated with an equity host and, although the convertible preferred stock includes a conversion feature, we do not believe such conversion feature results in a beneficial conversion feature. Accordingly, we expect that the issuance of the convertible preferred stock and cash in exchange for the debt held by Verde will result in an increase to our equity by $100.0 million, assuming the fair value of the debt is at least equal to par.
Reorganization Accounting
DriveTime Automotive, Inc. (DTA) is a newly formed Delaware corporation that was incorporated in December 2009. Pursuant to a reorganization transaction that will be consummated immediately prior to the effectiveness of the Registration Statement on Form S-1 of which this prospectus forms a part, DTA will become the holding company under which we will conduct our operations through two primary operating subsidiaries, DriveTime Automotive Group, Inc. (DTAG), which was incorporated in Arizona in 1992 and reincorporated in Delaware in 1996 and focuses on vehicle sales activities, and DT Acceptance Corporation (DTAC), which was incorporated in Arizona in 2003 as a sister company to DTAG and focuses on financing activities. This reorganization transaction will serve to consolidate our businesses under a single holding company to facilitate this public offering of the common stock of DTA. Upon the consummation of the reorganization transaction, the sole shareholder of DTAG and DTAC, Ernest C. Garcia II, will become the sole stockholder of DTA, pending the completion of the offering contemplated hereby and the historical financial results of DTA, DTAG and DTAC will be presented on a combined basis. The transaction will be accounted for as a reorganization of entities under common control and not as a merger or acquisition. DTAG and DTAC will be co-predecessors of DTA.
49
Table of Contents
Results of operations
Year ended December 31, 2009 compared to year ended December 31, 2008
The following table sets forth our results of operations for the periods indicated.
| Year Ended December 31, |
Percent Change |
||||||||||
| 2008 | 2009 | ||||||||||
| ($ in thousands) | |||||||||||
| Revenue: |
|||||||||||
| Sales of used vehicles |
$ | 796,750 | $ | 694,460 | (12.8 | )% | |||||
| Interest income |
261,875 | 251,822 | (3.8 | )% | |||||||
| Total revenue |
1,058,625 | 946,282 | (10.6 | )% | |||||||
| Costs and expenses: |
|||||||||||
| Cost of used vehicles sold |
477,255 | 394,362 | (17.4 | )% | |||||||
| Provision for credit losses |
300,884 | 223,686 | (25.7 | )% | |||||||
| Secured debt interest expense |
74,749 | 95,037 | 27.1 | % | |||||||
| Unsecured debt interest expense |
22,333 | 15,629 | (30.0 | )% | |||||||
| Selling and marketing |
28,644 | 31,491 | 9.9 | % | |||||||
| General and administrative |
157,311 | 148,350 | (5.7 | )% | |||||||
| Depreciation expense |
14,088 | 13,061 | (7.3 | )% | |||||||
| Gain on extinguishment of debt, net |
(19,699 | ) | (30,311 | ) | 53.9 | % | |||||
| Total costs and expenses |
1,055,565 | 891,305 | (15.6 | )% | |||||||
| Income before income taxes |
3,060 | 54,977 | 1,696.6 | % | |||||||
| Income tax expense |
1,090 | 730 | (33.0 | )% | |||||||
| Net income |
$ | 1,970 | $ | 54,247 | 2,653.7 | % | |||||
Sales of used vehicles
Revenue from sales of used vehicles decreased $102.3 million, or 12.8%, from 2008 to 2009. The decrease in revenue was driven by a 10.7% decrease in sales volume, coupled with a decrease in average sales price per vehicle sold of $349 per unit from 2008 to 2009. The decrease in sales volume is attributable to a decrease in the average number of stores open, and a decrease in our close rates as a result of our efforts to further tighten our loan underwriting standards beginning in the second quarter of 2008. We tightened our loan underwriting standards to improve credit quality of new originations and closed stores in order to reduce origination volume to address reduced liquidity as a result of turmoil in the credit markets, as well as the effects of the recession on our customers. The decrease in average sales price per vehicle is attributable to a decrease in the average cost of used vehicles sold and our overall pricing strategy.
Internet-related sales increased from $227.1 million for the year ended December 31, 2008 to $316.5 million for the year ended December 31, 2009. As a percent of total sales revenue, internet-related sales comprised 28.5% and 45.6% of our total sales revenue for the years ended December 31, 2008 and 2009, respectively. Our internet applications increased 51.4% in the year ended December 31, 2009 compared to the year ended December 31, 2008 as a result of our increased marketing and advertising effort, which is directed at driving more customers to our websites to complete an application to obtain pre-approval for financing to purchase one of our vehicles.
50
Table of Contents
On a same store basis, customer applications increased 7.1% and close rates decreased to 27.5% from 29.3% due to tightening of our loan underwriting standards. These factors resulted in an increase in same store unit sales of 0.3% and a decrease in same store vehicle revenues of 2.3% for 2009 compared to 2008.
Interest income
Interest income for the year ended December 31, 2009 was $251.8 million, a decrease of 3.8% from 2008 to 2009. This decrease is attributable to a $45.5 million decrease in the average principal balance on our receivable portfolio from December 31, 2008 to 2009 which was a direct result of a lower level of originations due to the factors described above.
Cost of used vehicles sold
Total cost of used vehicles sold decreased $82.9 million, or 17.4%, from 2008 to 2009, respectively, due to decreases in the number of vehicles sold and the average cost of vehicles sold. Our cost of vehicles sold per unit decreased as a result of lower acquisition costs, as well as lower reconditioning costs, buying efficiencies, and reduced costs associated with our warranty as a result of bringing certain administrative functions in-house. Acquisition costs are a function of the vehicle make, model, and year mix that we acquire, along with vehicle wholesale auction price trends for the segment of vehicles that we target for acquisition. We lowered our reconditioning costs with the implementation of an inventory management system and were able to improve our buying efficiencies by renegotiating contracts with national transport companies.
Gross margin
Gross margin as a percentage of sales revenue increased to 43.2% for the year ended December 31, 2009 from 40.1% for the year ended December 31, 2008. Average gross margin per vehicle sold increased 5.1% for the year ended December 31, 2009 compared to 2008. Although our price per vehicle sold has decreased, we were able to increase our margin over cost of vehicles sold as described above. Our gross margins were also lower in 2008 due, in part, to overstocked vehicle inventory associated with dealership closings that occurred in the second quarter 2008.
Provision for credit losses
Provision for credit losses decreased $77.2 million for the year ended December 31, 2009 compared to 2008. This decrease was primarily attributed to a decrease in net charge-offs due to tightening our loan underwriting standards, starting with originations in the second quarter of 2008. Provision for credit losses also decreased due to reduced loan origination volume compared to the prior year, coupled with a decrease in the allowance as a percentage of outstanding principal due to the improved quality of the loan portfolio.
Net charge-offs as a percent of average outstanding principal decreased to 18.2% for the year ended December 31, 2009 compared to 21.4% in 2008. This improvement is the result of tightening of our loan underwriting standards beginning in the second quarter of 2008, which reduced gross principal charged-off to 26.6% for the year ended December 31, 2009 from 30.3% for the year ended December 31, 2008, coupled with increased recoveries as a percentage of principal charged off. Recoveries as a percentage of principal charged-off positively increased from 29.4% for the year ended December 31, 2008 to 31.7% for 2009. The improvement in recoveries is due in part to improved effectiveness of our repossession efforts, and the increased seasoning of our loan portfolio.
51
Table of Contents
The allowance for credit losses decreased $24.3 million from December 31, 2008 to December 31, 2009, which, as a percentage of principal outstanding balance, represented a decrease from 18.1% at December 31, 2008 to 16.6% at December 31, 2009. The decrease in the allowance as a percent of outstanding principal balance is based primarily on the improved credit quality of our portfolio due to the tightening of our loan underwriting standards . At December 31, 2009, approximately 67.6% of our portfolio represents loans that were originated since March 31, 2008, under our tightened loan underwriting standards.
Secured debt interest expense
Secured debt interest expense increased $20.3 million, or 27.1%, from 2008 to 2009. Our weighted average effective borrowing rate on secured debt for the year ended December 31, 2009 was 10.3%, as compared to 7.7% for the year ended December 31, 2008. This increase is attributable to higher effective interest rates on our current and former portfolio warehouse facilities, an increase in amortization of loan fees due to facility renewals, an increase in the average amount borrowed pursuant to portfolio term financings, an increase in the effective rate on our portfolio term financings and inventory facility, and the issuance of our junior secured notes to related parties and others in December 2008, offset, in part, by the elimination of interest expense associated with our residual facility, which was terminated in December 2008.
Unsecured debt interest expense
Unsecured debt interest expense decreased $6.7 million, or 30.0%, from 2008 to 2009. The decrease is primarily related to a decrease in interest expense on our senior unsecured notes, as a result of the repurchase of $122.0 million in aggregate principal amount of these notes in the year ended December 31, 2009, partially offset by an increase in interest expense on subordinated notes payable, which were issued in April and May 2008.
Selling and marketing expense
Selling and marketing expenses increased $2.8 million, or 9.9%, from 2008 to 2009. This increase was due to an increase in our advertising expenses, primarily related to our television and internet marketing strategy.
General and administrative expense
General and administrative expenses decreased $9.0 million, or 5.7%, from 2008 to 2009. General and administrative expenses decreased due to fewer stores in operation during 2009 as a result of the closure of 19 stores and four reconditioning facilities during the year ended December 31, 2008 as well as the closure of nine stores and two reconditioning facilities in the year ended December 31, 2009. These were partially offset by store closing costs of $12.4 million and $5.9 million expensed in the years ended December 31, 2008 and 2009, respectively, and a $7.6 million expense incurred in the first quarter of 2009 relating to a legal settlement. The settlement related to a lawsuit by a competitor that essentially alleged that we unlawfully paid the competitor’s employees for customer referrals, diverting business from the competitor to us. We disputed the allegations and believe that, in general, the prospects referred did not meet the typical customer profile of the competitor. Nonetheless, we discontinued the practice complained of, and settled the lawsuit without admitting any impropriety or illegality.
Gain on extinguishment of debt, net
During the years ended December 31, 2008 and 2009, we repurchased outstanding indebtedness in aggregate principal amounts of $96.0 million and $135.2 million, respectively, resulting in net gains on the extinguishment of debt of $19.7 million and $30.3 million in the same periods, respectively.
52
Table of Contents
Net income
Net income increased $52.3 million from 2008 to 2009, primarily due to a lower provision for credit losses due to improved loan portfolio performance, gains on the extinguishment of debt, increased gross margin per unit sold, and a decrease in general and administrative costs and operating expenses due to fewer stores in operation, offset by a reduction in the number of vehicles sold due to tightening of our loan underwriting standards, store closures and an increase in interest expense.
Originations
The following table sets forth information regarding our originations for the periods indicated.
| Years Ended December 31, |
Change | |||||||||||
| 2008 | 2009 | |||||||||||
| ($ in thousands, except average data) |
||||||||||||
| Amount originated |
$ | 789,360 | $ | 686,214 | (13.1 | )% | ||||||
| Number of loans originated |
55,393 | 49,487 | (10.7 | )% | ||||||||
| Average amount financed |
$ | 14,250 | $ | 13,867 | $ | (383 | ) | |||||
| Average APR originated |
21.1 | % | 21.1 | % | — | |||||||
| Average term (in months) |
53.0 | 51.5 | (1.5 | ) | ||||||||
| Average down payment |
$ | 1,090 | $ | 1,109 | $ | 19 | ||||||
| Down payment as a percent of amount financed |
7.6 | % | 8.0 | % | 0.4 | % | ||||||
| Percentage of sales revenue financed (1) |
99.1 | % | 98.8 | % | (0.3 | )% | ||||||
| (1) | Represents the dollar amount originated divided by the dollar amount of revenue from sales of used vehicles. |
We originate loans when a customer finances the purchase of one of our vehicles, and the balance on these loans, together with accrued interest and unamortized loan origination costs, comprises our portfolio of finance receivables. Receivables are financed to generate liquidity for our business. See “ – Liquidity and capital resources” for further information.
The principal amount of loans we originated decreased 13.1% and the number of loans originated decreased 10.7% for the year ended December 31, 2009 compared to 2008. These decreases were due to a decrease in the number of vehicles sold year over year as a result of tightening our loan underwriting standards and store closures, combined with a decrease in the average amount financed due to a decrease in the average sales price per vehicle and an increase in the average down payment. We tightened our loan underwriting standards and closed stores in order to reduce origination volume and improve credit quality of new originations to address reduced liquidity as a result of turmoil in the credit markets, and the effects of the recession on our customers.
Receivables portfolio
The following table shows the characteristics of our finance receivables portfolio for the periods indicated.
| As of and for the Years Ended December 31, |
Change | |||||||||||
| 2008 | 2009 | |||||||||||
| ($ in thousands, except per loan data) |
||||||||||||
| Principal balance receivables, end of period |
$ | 1,342,855 | $ | 1,312,216 | (2.3 | )% | ||||||
| Average principal balance during period |
$ | 1,410,292 | $ | 1,364,782 | (3.2 | )% | ||||||
| Number of loans outstanding, end of period |
125,070 | 127,737 | 2,667 | |||||||||
| Average remaining principal per loan, end of period |
$ | 10,737 | $ | 10,273 | $ | (464 | ) | |||||
| Weighted average APR of contracts outstanding |
20.6 | % | 20.6 | % | — | % | ||||||
| Average age per loan (in months) |
12.5 | 14.5 | 2.0 | |||||||||
53
Table of Contents
Finance receivables principal balance decreased $30.6 million from December 31, 2008 to December 31, 2009 due to an excess of portfolio run-off (regular principal payments, payoffs, and charge-offs) over origination volume. This decrease was due, in large part, to a decrease in sales volume and originations as a result of the tightening of our loan underwriting standards beginning in the second quarter of 2008 along with the closure of stores.
Delinquencies
As a percentage of total outstanding loan principal balances, delinquencies over 30 days were 9.4% and 7.4% at December 31, 2008 and 2009, respectively. The decrease was due to the tightening of our loan underwriting standards beginning in the second quarter of 2008. At December 31, 2009, approximately 67.6% of our portfolio represents loans that were originated since March 31, 2008 under our tightened loan underwriting standards.
Year ended December 31, 2008 compared to year ended December 31, 2007
The following table sets forth our results of operations for the periods indicated.
| Years Ended December 31, | Percent Change |
|||||||||
| 2007 | 2008 | |||||||||
| ($ in thousands) | ||||||||||
| Revenue: |
||||||||||
| Sales of used vehicles |
$ | 963,621 | $ | 796,750 | (17.3 | )% | ||||
| Interest income |
250,628 | 261,875 | 4.5 | % | ||||||
| Total revenue |
1,214,249 | 1,058,625 | (12.8 | )% | ||||||
| Costs and expenses: |
||||||||||
| Cost of used vehicles sold |
575,234 | 477,255 | (17.0 | )% | ||||||
| Provision for credit losses |
283,407 | 300,884 | 6.2 | % | ||||||
| Secured debt interest expense |
63,719 | 74,749 | 17.3 | % | ||||||
| Unsecured debt interest expense |
12,982 | 22,333 | 72.0 | % | ||||||
| Selling and marketing |
36,210 | 28,644 | (20.9 | )% | ||||||
| General and administrative |
154,018 | 157,311 | 2.1 | % | ||||||
| Depreciation expense |
15,784 | 14,088 | (10.7 | )% | ||||||
| Gain on extinguishment of debt, net |
— | (19,699 | ) | 100.0 | % | |||||
| Total costs and expenses |
1,141,354 | 1,055,565 | (7.5 | )% | ||||||
| Income before income taxes |
72,895 | 3,060 | (95.8 | )% | ||||||
| Income tax expense |
1,000 | 1,090 | 9.0 | % | ||||||
| Net income |
$ | 71,895 | $ | 1,970 | (97.3 | )% | ||||
Sales of used vehicles
Revenue from sales of used vehicles decreased $166.9 million, or 17.3%, from $963.6 million to $796.8 million for the years ended December 31, 2007 and 2008, respectively. The decrease in revenue was driven by a decrease in the average number of stores open coupled with a decrease in our close rates as a result of our efforts to tighten our loan underwriting standards beginning in the second quarter of 2008. We tightened underwriting standards in order to reduce origination volume and improve credit quality of new originations. Sales were negatively affected by the soft retail economy and lack of consumer confidence, both in the used car market and the retail segment as a whole.
54
Table of Contents
Internet-related sales decreased from $254.2 million for the year ended December 31, 2007 to $227.1 million for the year ended December 31, 2008. As a percent of total sales revenue, internet-related sales comprised 26.4% and 28.5% of our total sales revenue for the twelve months ended December 31, 2007 and 2008, respectively.
On a same store basis, customer applications increased 0.7% and close rates decreased from 34.2% to 29.5% due to tightening of our loan underwriting standards, resulting in a decrease in same store unit sales of 13.2% and a decrease in same store revenues from the sale of used vehicles of 13.4% for the year ended December 31, 2008.
Interest income
Interest income for the year ended December 31, 2008 was $261.9 million, an increase of 4.5% from $250.6 million for the year ended December 31, 2007.
The increase was primarily due to the increase in average portfolio principal of $138.6 million in 2008 compared to 2007, offset by decreases in the average effective yield on our receivables portfolio, as discussed below, and a decrease in interest earned on investments in our securitization trusts.
Cost of used vehicles sold
Our total cost of used vehicles sold decreased $98.0 million, or 17.0%, for the year ended December 31, 2008 compared to 2007 due to the decrease in the number of units sold, partially offset by a slight increase in the average cost of vehicles sold year over year. In 2008, we increased our age and mileage limits for inventory purchases in an effort to maintain affordability; however, we spent more on acquisition and reconditioning costs per unit sold, causing the average cost of vehicles sold to increase slightly.
Gross margin
Gross margin as a percentage of sales revenue decreased slightly to 40.1% for the year ended December 31, 2008 from 40.3% for the year ended December 31, 2007. Average gross margin per vehicle sold decreased 0.6% for the year ended December 31, 2008 compared to 2007. The decrease in gross margin percentage and average gross margin per vehicle sold for the year ended December 31, 2008 is the result of a slight increase in the average cost of vehicles sold as described above.
Provision for credit losses
Provision for credit losses increased $17.5 million, or 6.2%, from $283.4 million for the year ended December 31, 2007 to $300.9 million for the year ended December 31, 2008. This increase was primarily due to an increase in net charge-offs, partially offset by a slight decrease in the allowance for credit losses.
Net charge-offs as a percentage of average portfolio principal outstanding increased from 18.2% for the year ended December 31, 2007 to 21.4% for the year ended December 31, 2008 due to higher gross charge-offs and lower recoveries. Gross charge-offs increased due to general economic conditions, including the increase in unemployment during the latter part of 2007 and continuing into 2008. Recoveries decreased as a percentage of principal charged-off due to a higher loan to vehicle cost ratio for more recent originations along with longer terms which slowed principal amortization for these loans.
Our allowance decreased $1.4 million from December 31, 2007 to 2008. The allowance as a percentage of portfolio principal decreased slightly from 18.2% at December 31, 2007 to 18.1% at December 31, 2008. The decrease in allowance percentage was due to tightening of our loan underwriting standards in 2008, partially offset by the negative effects of the economy.
55
Table of Contents
Secured debt interest expense
Secured debt interest expense increased $11.0 million, or 17.3%, from $63.7 million to $74.7 million for the twelve months ended December 31, 2007 and 2008, respectively. The increase in secured debt interest expense was due primarily to (i) higher borrowing costs on both of our portfolio warehouse facilities and portfolio term financings, coupled with allocating a greater portion of our borrowings to our portfolio warehouse facilities, (ii) an increase in the average amount outstanding on our inventory facility, and (iii) the issuance of our junior secured notes to certain related parties and others in December 2008. Offsetting these increases was a decrease in the average balance of the residual facility, which was reduced during the course of the year and terminated in December 2008.
The increase in our average outstanding balances under the portfolio warehouse facilities was due to the expansion of the capacity of our portfolio warehouse facilities to mitigate the effects of the collapse of the subprime auto securitization market.
Unsecured debt interest expense
Unsecured debt interest expense increased $9.4 million, or 72.0%, from $13.0 million to $22.3 million for the twelve months ended December 31, 2007 and 2008, respectively, primarily due to an increase in the aggregate principal balance of senior unsecured notes outstanding and an increase in interest expense on subordinated notes. In July 2007, we exchanged $78.5 million of our then-existing $80.0 million senior unsecured notes due 2010, which had an effective interest rate of 12.65%, for notes on similar terms due 2013, and we issued an additional $56.5 million in senior unsecured notes due 2013 with an effective rate of 12.4%. In April and May 2008, we issued a total of $75.0 million in subordinated notes to Verde, an affiliate of Ernest C. Garcia II, our Chairman and sole shareholder, which notes bear interest at 12.0%.
Selling and marketing expense
Selling and marketing expenses decreased $7.6 million, or 20.9%, from $36.2 million to $28.6 million for the years ended December 31, 2007 and 2008, respectively. This decrease was due to a reduction in the number of stores combined with lower sales volumes.
General and administrative expense
General and administrative expenses increased $3.3 million, or 2.1%, from $154.0 million to $157.3 million for the twelve months ended December 31, 2007 and 2008, respectively, due to the closure of 19 dealerships and four reconditioning facilities during the year ended December 31, 2008.
Gain on extinguishment of debt, net
During the year ended December 31, 2008, we repurchased outstanding indebtedness in aggregate principal amount of $96.0 million, resulting in net gains on the extinguishment of debt of $19.7 million. We did not repurchase any indebtedness for the year ended December 31, 2007.
Net income
Net income decreased $70.0 million to $2.0 million for the year ended December 31, 2008 from $71.9 million for the year ended December 31, 2007. This decrease in net income was primarily due to an increase in our provision for credit losses caused by an increase in charge-offs and a decrease in recovery rates, a reduction in the number of
56
Table of Contents
vehicles sold, the closure of 19 stores and four reconditioning facilities, and an increase in interest expense primarily related to increased amounts borrowed due to the growth in our average outstanding loan portfolio and higher cost of funds. These were partially offset by gains on extinguishment of debt and an increase in interest income related to a larger average portfolio.
Originations
The following table sets forth information regarding our originations for the periods indicated.
| Years Ended December 31, | Change | |||||||||||
| 2007 | 2008 | |||||||||||
| ($ in thousands, except average data) |
||||||||||||
| Amount originated |
$ | 959,517 | $ | 789,360 | (17.7 | )% | ||||||
| Number of loans originated |
66,908 | 55,393 | (17.2 | )% | ||||||||
| Average amount financed |
$ | 14,341 | $ | 14,250 | $ | (91 | ) | |||||
| Average APR originated |
20.8 | % | 21.1 | % | 0.3 | % | ||||||
| Average term (in months) |
52.1 | 53.0 | 0.9 | |||||||||
| Average down payment |
$ | 1,110 | $ | 1,090 | $ | (20 | ) | |||||
| Down payment as a percent of amount financed |
7.7 | % | 7.6 | % | (0.1 | )% | ||||||
| Percentage of sales revenue financed (1) |
99.6 | % | 99.1 | % | (0.5 | )% | ||||||
| (1) | Represents the dollar amount originated divided by the dollar amount of revenue from sales of used vehicles. |
We originated $789.4 million in principal amount of loans in the year ended December 31, 2008, a decrease of $170.2 million, or 17.7%, compared to $959.5 million in the year ended December 31, 2007, due primarily to the decrease in the number of vehicles sold, coupled with a decrease in the average amount financed.
Average APR for loans originated for the year ended December 31, 2008 increased to 21.1% from 20.8% in 2007. In 2008 we raised interest rates for certain model year vehicles. Partially offsetting this was the better credit grade mix of loans originated in the latter part of year, which have lower APRs.
Receivables portfolio
The following table shows the characteristics of our finance receivable portfolio for the periods indicated.
| As of and for the Years Ended December 31, |
Change | |||||||||||
| 2007 | 2008 | |||||||||||
| ($ in thousands, except per loan data) |
||||||||||||
| Principal balance receivables, end of period |
$ | 1,343,085 | $ | 1,342,855 | — | % | ||||||
| Average principal balance during period |
$ | 1,271,678 | $ | 1,410,292 | 10.9 | % | ||||||
| Number of loans outstanding, end of period |
124,228 | 125,070 | 842 | |||||||||
| Average remaining principal per loan, end of period |
$ | 10,811 | $ | 10,737 | $ | (74 | ) | |||||
| Weighted average APR of contracts outstanding |
21.0 | % | 20.6 | % | (0.4 | )% | ||||||
| Average age per loan (in months) |
11.0 | 12.5 | 1.5 | |||||||||
57
Table of Contents
Finance receivable principal balance remained relatively flat at December 31, 2007 compared to December 31, 2008 due primarily to portfolio runoff (regular principal payments, payoffs, and charge-offs) approximating origination volume. Average principal outstanding was higher in 2008 due to strong origination volumes in the first quarter of 2008, before we tightened our loan underwriting standards, which resulted in higher mid-year principal balances outstanding. The reduced origination volumes related to the tightening of our loan underwriting standards and store closures in the middle of 2008, along with higher charge-offs, resulted in a reduction in principal outstanding in the second half of the year. The age of our portfolio increased due to reduced origination volume in 2008, creating a more seasoned portfolio.
Delinquencies
Delinquencies over 30 days increased to 9.4% of total outstanding loan principal balances at December 31, 2008 compared to 8.6% at December 31, 2007 due to a general decline in the economy and the increased seasoning of the loan portfolio.
Seasonality
Historically, we have experienced higher revenues in the first quarter of the calendar year than in the last three quarters of the calendar year. We believe these results are due to seasonal buying patterns resulting, in part, because many of our customers receive income tax refunds during the first quarter of the year, which are a primary source of down payments on used vehicle purchases. Our portfolio of finance receivables also has historically followed a seasonal pattern, with delinquencies and charge-offs being the highest in the second half of the year.
Quarterly financial data
To illustrate the seasonality in total revenue, costs and expenses, and income before taxes, a summary of the quarterly financial data follows:
| First Quarter |
Second Quarter |
Third Quarter |
Fourth Quarter |
Total | |||||||||||||
| ($ in thousands) | |||||||||||||||||
| 2009: |
|||||||||||||||||
| Total revenue |
$ | 286,745 | $ | 233,025 | $ | 233,165 | $ | 193,347 | $ | 946,282 | |||||||
| Costs and expenses (1) |
$ | 274,675 | $ | 194,636 | $ | 223,676 | $ | 198,318 | $ | 891,305 | |||||||
| Income before income taxes |
$ | 12,070 | $ | 38,389 | $ | 9,489 | $ | (4,971 | ) | $ | 54,977 | ||||||
| Net income |
$ | 11,700 | $ | 38,099 | $ | 9,379 | $ | (4,931 | ) | $ | 54,247 | ||||||
| 2008: |
|||||||||||||||||
| Total revenue |
$ | 364,998 | $ | 249,976 | $ | 241,207 | $ | 202,444 | $ | 1,058,625 | |||||||
| Costs and expenses (1) |
$ | 342,363 | $ | 255,945 | $ | 235,774 | $ | 221,483 | $ | 1,055,565 | |||||||
| Income before income taxes |
$ | 22,635 | $ | (5,969 | ) | $ | 5,433 | $ | (19,039 | ) | $ | 3,060 | |||||
| Net income / (loss) |
$ | 22,215 | $ | (6,419 | ) | $ | 5,363 | $ | (19,189 | ) | $ | 1,970 | |||||
| 2007: |
|||||||||||||||||
| Total revenue |
$ | 374,276 | $ | 288,619 | $ | 289,683 | $ | 261,671 | $ | 1,214,249 | |||||||
| Costs and expenses |
$ | 328,965 | $ | 259,251 | $ | 285,592 | $ | 267,546 | $ | 1,141,354 | |||||||
| Income before income taxes |
$ | 45,311 | $ | 29,368 | $ | 4,091 | $ | (5,875 | ) | $ | 72,895 | ||||||
| Net income / (loss) |
$ | 44,811 | $ | 28,779 | $ | 3,841 | $ | (5,536 | ) | $ | 71,895 | ||||||
| (1) | Includes net gains on extinguishment of debt. |
58
Table of Contents
Non-GAAP discussion
In addition to our GAAP results, we use Adjusted EBITDA as a supplemental measure of our operating performance. Adjusted EBITDA is not required by or presented in accordance with GAAP and should not be considered as an alternative to net income, operating income, or any other performance measure derived in accordance with GAAP, or as an alternative to cash flow from operating activities or as a measure of our liquidity.
We define Adjusted EBITDA as net income plus income tax expense; plus non-portfolio interest expense (which includes interest expense associated with our senior unsecured notes, subordinated notes, junior secured notes, and former residual facility); plus depreciation expense; plus store closing costs related to downsizing (and not those closed in the ordinary course of business); plus legal settlement; less gain on extinguishment of debt, net.
We present Adjusted EBITDA because we consider it to be an important supplemental measure of our operating performance. All of the adjustments made in our calculation of Adjusted EBITDA are adjustments to items that management does not consider to be reflective of our core operating performance. Management considers our core operating performance to be that which can be affected by our managers in any particular period through their management of the resources that affect our underlying revenue and profit generating operations during that period. Income taxes, non-portfolio interest expense, depreciation expense, store closing costs, legal settlement costs, and gains (losses) on extinguishment of debt are not considered reflective of our core operating performance. We believe Adjusted EBITDA allows us to compare our current operating results with corresponding historical periods and with the operational performance of other companies in our industry because it does not give effect to potential differences caused by variations in capital structures (affecting relative interest expense), tax positions (such as the impact on periods or companies of changes in effective tax rates or net operating losses), and other items that we do not consider reflective of underlying operating performance. We also present Adjusted EBITDA because we believe it is frequently used by securities analysts, investors, and other interested parties as a measure of performance.
In evaluating Adjusted EBITDA, you should be aware that in the future we may incur expenses similar to the adjustments described above. Our presentation of Adjusted EBITDA should not be construed as an inference that our future results will be unaffected by expenses that are unusual, non-routine, or non-recurring. Adjusted EBITDA has limitations as an analytical tool, and you should not consider it in isolation, or as a substitute for analysis of our results as reported under GAAP. Some of these limitations are that it does reflect:
| • | cash expenditures for capital expenditures or contractual commitments; |
| • | changes in, or cash requirements for, our working capital requirements; |
| • | interest expense, or the cash requirements necessary to service interest or principal payments on our non-portfolio indebtedness; |
| • | the cost or cash required to replace assets that are being depreciated or amortized; and |
| • | the impact on our reported results of earnings or charges resulting from items accounted for in the GAAP measure from which Adjusted EBITDA is derived. |
In addition, other companies, including other companies in our industry, may calculate these measures differently than we do, limiting the usefulness of Adjusted EBITDA as a comparative measure. Because of these limitations, Adjusted EBITDA should not be considered as a substitute for net income, operating income, or any other performance measure derived in accordance with GAAP, or as an alternative to cash flow from operating activities or as a measure of our liquidity. We compensate for these limitations by relying primarily on our GAAP results and using Adjusted EBITDA only supplementally. For more information, see our financial statements and the notes to those statements included elsewhere in this prospectus.
59
Table of Contents
Pro forma adjusted EBITDA represents adjusted EBITDA on a pro forma basis to give effect to the offering as if the offering were consummated on January 1, 2009.
The following table presents data relating to Adjusted EBITDA, which is a non-GAAP measure, for the periods indicated:
| Years Ended December 31, | |||||||||||
| 2007 | 2008 | 2009 | |||||||||
| ($ in thousands) | |||||||||||
| Net income |
$ | 71,895 | $ | 1,970 | $ | 54,247 | |||||
| Plus EBITDA adjustments: |
|||||||||||
| Income tax expense (benefit) |
1,000 | 1,090 | 730 | ||||||||
| Non-portfolio interest expense |
16,104 | 26,545 | 29,199 | ||||||||
| Depreciation expense |
15,784 | 14,088 | 13,061 | ||||||||
| Store closing costs |
— | 9,984 | 3,485 | ||||||||
| Legal settlement |
— | — | 7,600 | ||||||||
| Less: gain on extinguishment of debt, net |
— | (19,699 | ) | (30,311 | ) | ||||||
| Adjusted EBITDA |
$ | 104,783 | $ | 33,978 | $ | 78,011 | |||||
The following table presents data relating to pro forma adjusted EBITDA, which is a non-GAAP measure, for the period indicated:
| Year Ended December 31, 2009 |
||||
| ($ in thousands) | ||||
| (Unaudited) | ||||
| Pro forma net income |
$ | 59,170 | ||
| Plus Pro forma EBITDA adjustments: |
||||
| Pro forma income tax expense |
38,470 | |||
| Pro forma depreciation expense |
13,489 | |||
| Pro forma store closing costs |
3,485 | |||
| Pro forma legal settlement |
7,600 | |||
| Less: gain on extinguishment of debt |
(30,311 | ) | ||
| Pro forma adjusted EBITDA |
$ | 91,903 | ||
Liquidity and capital resources
General
We require capital for the purchase of inventory, to provide financing to our customers, for working capital and for general corporate purposes, including the purchase of property and equipment, and to open new dealerships and reconditioning facilities.
We have historically funded our capital requirements primarily through operating cash flow, portfolio warehouse facilities, securitizations, PALP financings, inventory and other revolving facilities, real estate mortgage financing, and other notes payable (including junior secured notes, senior unsecured notes, and subordinated notes).
60
Table of Contents
Response to recession and credit crisis
With the worldwide recession and tightening of credit starting in late 2007, including the deterioration of the securitization market, our access to funding was significantly curtailed. We were unable to issue securitization debt beginning in the second half of 2007 through the third quarter of 2009. In addition, the advance rates on our portfolio warehouse facilities were reduced, while our cost of funds increased substantially.
In response, beginning in 2008, we tightened our loan underwriting standards and closed selected dealerships to reduce origination volume, reduced operating expenses, and continued to improve operational efficiencies through centralization of certain key functions. We were able to increase capacity with our portfolio warehouse lenders and obtain alternative funding sources. Below is a summary of significant actions we took to navigate through the credit crisis:
| • | In the first quarter of 2008, we amended our portfolio warehouse facilities to increase capacity by $235.0 million from $500.0 million to $735.0 million; |
| • | In the second quarter of 2008, (i) Verde, an affiliate of Ernest C. Garcia II, our Chairman and sole shareholder, funded $75.0 million in subordinated debt, (ii) we tightened our loan underwriting standards to reduce origination volume and improve credit quality, and (iii) we closed 16 dealerships and three reconditioning facilities, resulting in a reduction in force of 300 employees for the year-ended December 31, 2008; |
| • | In the third quarter of 2008, we repurchased $62.1 million of securitization debt, resulting in a gain of $10.3 million; |
| • | In the fourth quarter of 2008, we (i) issued $55.1 million of junior secured debt ($26.0 million to related parties), (ii) amended our portfolio warehouse facilities, extending the maturity dates to December 2009, reducing the capacity by $100.8 million, lowering the advance rates, and increasing the interest rates, (iii) issued $157.0 million of PALP debt at a blended advance rate of 74.8%, and (iv) repurchased $20.9 million of securitization debt and $13.0 million of senior unsecured debt, resulting in a gain of $9.4 million; |
| • | In the first quarter of 2009, we (i) closed seven dealerships and two reconditioning facilities, (ii) issued $166.5 million of PALP debt at a 75% advance rate, and (iii) repurchased $15.0 million of senior unsecured debt and $13.2 million of securitization debt, resulting in gains of $6.8 million; |
| • | In the second quarter of 2009, we (i) issued $125.0 million of PALP debt at a 75% advance rate, (ii) issued $10.0 million of additional junior secured debt, and repurchased $2.0 million of junior secured debt from a third party, and (iii) repurchased $75.0 million of senior unsecured debt, resulting in gain of $24.8 million; |
| • | In the third quarter of 2009, we (i) entered into a 12-month, $518.0 million PALP facility commitment at a 70% advance rate and incorporated $242.1 million of the previously outstanding PALP debt into this new facility, (ii) extended our remaining portfolio warehouse facility to December 2010, reducing the facility size to $250.0 million, increasing the advance rate, and reducing the interest rate, (iii) terminated our other portfolio warehouse facility, due to excess capacity, (iv) increased our inventory facility to $60.0 million with a maturity date of August 2010, and (v) repurchased $32.0 million of senior unsecured debt from an affiliate of Ernest C. Garcia II, our Chairman and sole shareholder, at par (resulting in a net loss of $1.2 million), and repurchased $1.0 million of junior secured debt from a third party; and |
| • | In the fourth quarter of 2009, we completed our first securitization transaction since June 2007 by issuing $192.6 million of asset-backed securities, which are collateralized by approximately $300.0 million of finance receivables. The asset-backed securities are structured in four tranches with credit ratings ranging from AAA to A, without external credit enhancement from a monoline insurer. The weighted average coupon of these four tranches was 5.3%. See “– Financing sources – Portfolio term financings” below for additional information regarding securities ratings. |
61
Table of Contents
The steps we took to tighten our loan underwriting standards, close stores, reduce expenses, and secure alternative financing enabled us to continue to sell vehicles and originate loans during the credit crisis, provided necessary liquidity to repurchase debt, and increased our liquidity (unrestricted cash plus borrowing capacity). Our liquidity increased from $50.2 million at December 31, 2008 to $109.9 million at September 30, 2009 (currently $82.4 million at February 28, 2010). However, the weighted average annualized interest rate applicable to our total debt increased ratably from 7.2% for the twelve months ended December 31, 2007 to 8.4% for the twelve months ended December 31, 2008, and to 10.6% for the year ended December 31, 2009.
We plan to continue accessing the securitization market and utilizing warehouse facilities as our primary funding sources to fund our operations and do not foresee access to liquidity as a factor which would result in future store closures or limitations on our expansion or growth opportunities.
Financing sources
We currently fund our capital requirements primarily through the following debt facilities – a portfolio warehouse facility, securitizations, PALP financings, a revolving inventory facility, junior secured notes, real estate financing, senior unsecured notes and subordinated debt – and through operating leases.
We actively manage utilization of our various funding sources as we seek to minimize borrowing costs through drawing on our lower cost facilities and minimizing unused line fees, while at the same time balancing the effective advance rates and liquidity generated by each of the credit facilities in order to meet our funding needs. The advance rates on our portfolio warehouse and term financings are based on the outstanding principal balance of the loans we originate. However, our initial investment in the loans we originate is lower than the original principal balance of the loans. A description of our current financing facilities follows:
Portfolio warehouse facility
We use portfolio warehouse facilities that are collateralized by our finance receivables to fund our originations. As of December 31, 2009, we have one portfolio warehouse facility. This facility, which expires in December 2010, has total capacity of $250.0 million, carries an advance rate on the receivables pledged to the facility of 58%, and amounts outstanding under the facility bear interest based on the cost of the lenders’ funds thereunder plus 4.25% (4.49% at December 31, 2009). As of December 31, 2009, the balance drawn on this facility is $77.5 million.
DT Warehouse, LLC (a wholly-owned subsidiary of DTAC) is the sole borrower under our existing portfolio warehouse facility. DT Warehouse, LLC is a special purpose entity established specifically for the purpose of this lending relationship, with assets and liabilities distinct from the remainder of the DriveTime group. This facility does not contain a mark-to-market clause that would otherwise enable the lender to reduce advance rates based on market conditions, and limits the lender’s ability to sell or otherwise dispose of the underlying collateral in the event of default. In addition, on the termination date of the facility, (i) amounts outstanding at termination are not due and payable immediately, (ii) all collections on the contracts collateralizing these facilities would be used to pay down the facility until they are paid in full, and (iii) we would continue to service the contracts that are pledged under this facility, for which we would receive a 7.0% annualized servicing fee. All amounts outstanding under the facility will be due and payable on the third anniversary of the termination date of the facility.
DT Warehouse, LLC, has also entered into a $25.0 million demand note with DTAC, which has been assigned to the lender. The demand note is guaranteed by DTAG, Ernest C. Garcia II, our Chairman and sole stockholder, and his affiliate Verde. At its sole discretion, the lender can require DTAC to fund the demand note, and apply the proceeds to pay down the facility with DT Warehouse, LLC.
62
Table of Contents
Securitizations
We historically have restored capacity under our portfolio warehouse facilities by securitizing portfolios of finance receivables. However, the securitization market experienced significant disruptions from the latter part of 2007 through mid 2009. In December 2009, we completed our first securitization transaction since June 2007 by issuing $192.6 million of asset-backed securities, which are collateralized by approximately $300.0 million of finance receivables. The asset-backed securities are structured in four tranches with credit ratings ranging from AAA to A, without external credit enhancement from a monoline insurer. The weighted average coupon of these four tranches was 5.3%.
The credit ratings for this securitization were issued by DBRS following an evaluation of a variety of factors. Under DBRS definitions, long-term debt rated “AAA” is of the highest credit quality, with exceptionally strong protection for the timely repayment of principal and interest. Long-term debt rated “AA” is of superior credit quality, and protection of interest and principal is considered high. In many cases they differ from long-term debt rated “AAA” only to a small degree. Long-term debt rated “A” is of satisfactory credit quality. Protection of interest and principal is still substantial, but the degree of strength is less than that of “AA” rated entities. A securities rating is not a recommendation to buy, sell, or hold securities and may be subject to revision or withdrawal at any time.
In our securitizations, we sell loans originated at our dealerships to bankruptcy-remote securitization subsidiaries that transfer the loans to separate trusts that issue notes and certificates collateralized by the loans. Prior to our 2009-D securitization, the senior class or “Class A” notes were sold to investors, and the subordinate classes of notes and certificates were retained by us. Our 2009-D securitization contained Class A, B and C notes, primarily all of which were sold to investors and a portion ($17.5 million) were retained by us. We continue to service all securitized loans. Securitization transactions are accounted for on balance sheet as collateralized borrowings. The loan contracts included in the transaction remain in finance receivables and the notes are reflected in securitization debt.
From 1996 through December 31, 2009, we have entered into 37 securitization transactions, issuing over $4.2 billion in debt. The following table is a summary of the securitization transactions outstanding as of December 31, 2009, with outstanding balances for each period presented:
| Securitization Transactions |
Original Note Amount |
Balance as of December 31, 2009 | ||||
| ($ in thousands) | ||||||
| 2006-B |
$ | 305,000 | $ | 31,867 | ||
| 2007-A |
320,000 | 61,530 | ||||
| 2009-D |
192,600 | 175,136 | ||||
| $ | 817,600 | $ | 268,533 | |||
Pooled Auto Loan Program Financings
When the securitization market deteriorated beginning in 2007, we launched our PALP program to serve as an additional source of fixed-rate financing for our finance receivable portfolio, until we could access the securitization market again. As with our traditional securitization program, under PALP, we pool loans originated at our dealerships, and sell them to either (i) a special purpose entity which transfers the loans to a separate trust, which, in turn, issues a note collateralized by the loans; or (ii) we sell the pooled loans directly to a third-party financial
63
Table of Contents
institution to yield a specified return with the right to repurchase these loans at specified dates. Both of these types of transactions are treated as secured financings for accounting purposes. Therefore, the contracts included in the transactions remain in finance receivables and the debt is reflected as portfolio term financings on our balance sheet. We retain all servicing and are paid a servicing fee from the monthly cash flow generated by the pooled receivables.
Pursuant to the agreement whereby we sell pooled loans directly to a third-party financial institution, we are required to maintain an aggregate amount of finance receivable principal balance of $740.0 million. On a monthly basis we replenish the portfolio run-off with sales of finance receivables in order to maintain the $740.0 million contract principal outstanding (at a 70% advance rate, or $518 million in debt). This agreement to sell loans is effective until August 2010. The agreement continues until August 2011, but either the lender or we can terminate the facility, upon 90 days notice, after August 2010.
Since inception of this program, we have issued a total of $718.5 million in term financings through December 31, 2009. The following table is a summary of the PALP transactions outstanding at December 31, 2009:
| PALP Transactions |
Original Amount |
Balance as of December 31, 2009 | ||||
| ($ in thousands) | ||||||
| 2008-A |
$ | 7,000 | $ | 4,398 | ||
| 2008-B |
165,000 | 92,594 | ||||
| 2009-A |
201,465 | 143,984 | ||||
| 2009-B |
22,004 | 16,226 | ||||
| 2009-C |
244,451 | 195,958 | ||||
| 2009-E (1) |
59,346 | 55,359 | ||||
| 2009-F |
19,255 | 18,805 | ||||
| $ | 718,521 | $ | 527,324 | |||
| (1) | The designation of “2009-D” was not used for PALP Debt. |
Revolving inventory facility
Our revolving inventory facility is collateralized by our used vehicle inventory held for resale. Our inventory facility, which matures in August 2010, has a maximum capacity of $60.0 million and bears interest at LIBOR plus 6.0% (6.23% at December 31, 2009). At December 31, 2009, the outstanding balance of the inventory facility was $50.0 million.
Junior secured notes
As of December 31, 2009, we have an aggregate of $62.1 million in principal amount of junior secured notes due December 2012 outstanding, which notes are secured by our finance receivables. These notes consist of a $38.1 million Tranche A component ($36.1 million of which is held by Verde, an affiliate of Ernest C. Garcia II, our Chairman and sole shareholder, and $2.0 million of which is held by Ray Fidel, our President and Chief Executive Officer) and a $24.0 million subordinate Tranche B component that is held by Verde. At December 31, 2009, the Tranche A notes bear interest at 22.0% per annum, increasing by 2.0% each year until maturity. At December 31, 2009, the Tranche B note bears interest at 27.0% per annum, increasing 2.0% each year until maturity. In connection with this offering, Verde has agreed to exchange an aggregate of $100.0 million of subordinated notes
64
Table of Contents
(described below) and junior secured notes for shares of our newly-designated 6.5% convertible preferred stock. See “Certain Relationships and Related Party Transactions” and “Description of Capital Stock.” To the extent not exchanged, any outstanding junior secured notes will be repaid with a portion of the proceeds of this offering. See “Use of Proceeds.”
Real estate mortgage loan
In February 2007, we entered into a $13.5 million mortgage loan, bearing interest at a fixed rate of 5.87%, secured by our operations call center building in Mesa, Arizona. Terms of the loan agreement provide for monthly principal and interest payments. At December 31, 2009, the balance of this loan was $13.0 million.
Senior unsecured notes
In September 2005 we issued senior unsecured debt. All of this debt has been repurchased except for $1.5 million which matures in October 2010 and has an effective interest rate of 13.6%.
Subordinated notes
In April and May 2008, we issued an aggregate of $75.0 million in subordinated notes to Verde, an affiliate of Ernest C. Garcia II, our Chairman and sole shareholder, which notes bear interest at 12.0% per annum and mature August 2013. In connection with this offering, Verde has agreed to exchange an aggregate of $100.0 million of subordinated notes and junior secured notes (described above) for shares of our newly-designated 6.5% convertible preferred stock. See “Certain Relationships and Related Party Transactions” and “Description of Capital Stock.” To the extent not exchanged, any outstanding subordinated notes will be repaid with a portion of the proceeds of this offering. See “Use of Proceeds.”
Operating leases
At December 31, 2009, we lease the majority of our dealership locations. As each lease matures, we evaluate the existing location to determine whether the dealership should be relocated to another site in the region closer in proximity to new car franchises and/or higher traffic areas. Due to reduced access to funding in 2008 and 2009 we reduced origination volume and closed selected dealerships. During 2008 we closed 19 dealerships and four reconditioning facilities, and in the year ended December 31, 2009 we closed nine dealerships and two reconditioning facilities, and opened one new dealership, which reduced our total number to 78 dealerships and 13 reconditioning facilities at December 31, 2009. At December 31, 2009, we are still obligated for leases on nine properties which we have vacated. To date, we have subleased four of these nine properties. Seven of the nine properties are owned by Verde and Mr. Garcia’s brother-in-law, Steven Johnson. In order to keep our capital expenditures for new stores to a minimum and in order to provide flexibility in our selection of new regions, we generally choose to lease our facilities in order to maximize our cash flow.
We also lease our corporate office in Phoenix, Arizona, an operations collections facility in Dallas, Texas, and our former operations call center in Gilbert, Arizona (which is currently 100% subleased).
Other financing activities
In December 2008, we terminated a $75.0 million facility that was secured by our residual interests in our securitization trusts. In July 2009, we terminated a portfolio warehouse facility that provided $250.0 million in
65
Table of Contents
funding capacity. In addition, in August 2009, we terminated a 30-day rolling repurchase facility that was utilized to repurchase an aggregate of $96.2 million of our securitized debt on the open market from August 2008 to March 2009.
We had issued an aggregate of $136.5 million in senior unsecured notes payable in separate transactions in 2005 and 2007. We repurchased $13.0 million of these notes in December 2008, and we repurchased an additional $122.0 million of these notes during the year ended December 31, 2009. The remaining $1.5 million matures in October 2010 and has an effective interest rate of 13.6%.
In December 2008 and August 2008, we repurchased $20.9 million and $62.1 million, respectively, of our 2007-A securitization bonds on the open market. Also, in March 2009, we repurchased an additional $13.2 million of our 2007-A securitization bonds on the open market. In September 2009 we reissued the then outstanding balance ($65.6 million) of the 2007-A securitization bonds we previously repurchased. These bonds were resold at a premium to par of 100.5% resulting in a $0.3 million premium.
In December 2009, we issued $192.6 million of securitization bonds in conjunction with our 2009-D securitization. We purchased $17.5 million of the initial issuance. This purchase was funded with cash and $12.2 million in borrowings under a 30-day rolling repurchase facility with interest at LIBOR plus 1.5% (1.73% at December 31, 2009). As of December 31, 2009, we were in compliance with all required covenants of this facility.
In addition, we will incur or assume indebtedness associated with the acquisition of properties from related parties that we intend to complete in connection with this offering. See “Certain Relationships and Related Party Transactions.”
Shareholder distributions
We have made significant distributions to shareholders since the formation of DTAC as an S-corporation in 2003 and the conversion of DTAG to an S-corporation in 2004. Income from S-corporations flows through to the individual shareholders, who report income/losses on their individual income tax returns. We have made distributions to shareholders to fund the tax paid by the shareholders related to income of DTAG and DTAC, in addition to general distributions to the shareholders. The following table summarizes distributions to shareholders since January 1, 2003.
| January 1, 2003 to December 31, 2005 |
2006 | 2007 | 2008 | 2009 | Totals | |||||||||||||
| ($ in thousands) | ||||||||||||||||||
| Distributions to shareholders |
$ | 135,033 | $ | 47,237 | $ | 51,194 | $ | 12,733 | $ | 27,110 | $ | 273,307 | ||||||
| Less: S-corporation shareholder tax liability based on highest tax rates |
54,630 | 19,810 | 24,010 | 5,300 | 1,190 | 104,940 | ||||||||||||
| Distributions in excess of amounts to pay taxes |
$ | 80,403 | $ | 27,427 | $ | 27,184 | $ | 7,433 | $ | 25,920 | $ | 168,367 | ||||||
66
Table of Contents
Liquidity
The following is a summary of total available liquidity, consisting of unrestricted cash and current availability under the portfolio warehouse, residual, and inventory facilities for the periods indicated:
| December 31, | February 28, 2010 | |||||||||||
| 2007 | 2008 | 2009 | ||||||||||
| ($ in thousands) |
||||||||||||
| Unrestricted cash |
$ | 42,241 | $ | 25,533 | $ | 21,526 | $ | 21,442 | ||||
| Portfolio warehouse facilities |
4,068 | 23,889 | 8,881 | 53,416 | ||||||||
| Inventory facility |
5,000 | 810 | 10,000 | 7,545 | ||||||||
| Residual facility (1) |
75,000 | — | — | — | ||||||||
| Total liquidity |
$ | 126,309 | $ | 50,232 | $ | 40,407 | $ | 82,403 | ||||
| (1) | This facility was terminated in December 2008. |
The following table presents a summary of our access to liquidity under our portfolio warehouse facility and our inventory facility based on collateral pledged as of December 31, 2009 and February 28, 2010:
| As of December 31, 2009 |
Facility Amount |
Amount Drawn |
Unused Facility Amount (1) |
Borrowing Base (2)(3) |
Amount Drawn |
Total Availability | ||||||||||||
| ($ in thousands) | ||||||||||||||||||
| Portfolio warehouse facility |
$ | 250,000 | $ | 77,506 | $ | 172,494 | $ | 86,387 | $ | 77,506 | $ | 8,881 | ||||||
| Inventory facility |
60,000 | 50,000 | 10,000 | 60,000 | 50,000 | 10,000 | ||||||||||||
| $ | 310,000 | $ | 127,506 | $ | 182,494 | $ | 146,387 | $ | 127,506 | $ | 18,881 | |||||||
| Unrestricted cash |
21,526 | |||||||||||||||||
| Total cash and availability |
$ | 40,407 | ||||||||||||||||
| As of February 28, 2010 |
Facility Amount |
Amount Drawn |
Unused Facility Amount (1) |
Borrowing Base (2)(4) |
Amount Drawn |
Total Availability | ||||||||||||
| ($ in thousands) | ||||||||||||||||||
| Portfolio warehouse facility |
$ | 250,000 | $ | 87,765 | $ | 162,235 | $ | 141,181 | $ | 87,765 | $ | 53,416 | ||||||
| Inventory facility |
60,000 | 50,000 | 10,000 | 57,545 | 50,000 | 7,545 | ||||||||||||
| $ | 310,000 | $ | 137,765 | $ | 172,235 | $ | 198,726 | $ | 137,765 | $ | 60,961 | |||||||
| Unrestricted cash |
21,442 | |||||||||||||||||
| Total cash and availability |
$ | 82,403 | ||||||||||||||||
| (1) | Represents amounts that can be drawn upon as long as the amount drawn does not exceed the borrowing base for the credit facility. |
| (2) | Borrowing base is determined by the collateral currently pledged to the respective facilities. The borrowing base calculation for the portfolio warehouse facility uses a 58% advance rate. |
| (3) | Includes $7.2 million of unpledged loan contracts that can be pledged immediately and bring total borrowings to our maximum capacity. The borrowing base is the lesser of total eligible collateral multiplied by the applicable advance rate and the facility amount. |
| (4) | Includes $51.5 million of unpledged loan contracts that can be pledged immediately and bring total borrowing to our maximum capacity. The borrowing base is the lesser of total eligible collateral multiplied by the applicable advance rate and the facility amount. |
67
Table of Contents
Changes in liquidity
Changes in liquidity are affected by increases and decreases to our operating cash flow, changes in advance rates on our portfolio warehouse facilities, capacity of our portfolio warehouse and inventory facilities, portfolio term financings, and changes in other notes payable. The following is a summary of changes in liquidity for each period presented:
| December 31, | ||||||||||||
| 2007 | 2008 | 2009 | ||||||||||
| ($ in thousands) |
||||||||||||
| Liquidity – beginning of period |
$ | 121,664 | $ | 126,309 | $ | 50,232 | ||||||
| Net increase (decrease) in cash and cash equivalents (1) |
758 | (16,708 | ) | (4,007 | ) | |||||||
| Increase (decrease) in portfolio warehouse and residual availability |
64,475 | (55,179 | ) | (15,008 | ) | |||||||
| Increase (decrease) in inventory facility availability |
(60,588 | ) | (4,190 | ) | 9,190 | |||||||
| Liquidity – end of period |
$ | 126,309 | $ | 50,232 | 40,407 | |||||||
| (1) | Subsequent to distributions paid to our shareholders. See “– Shareholder distributions.” |
Change in liquidity during the year ended December 31, 2009
Our liquidity for the year ended December 31, 2009 decreased $9.8 million. The decrease in 2009 was primarily the result of the repurchase of $122.0 million of senior unsecured notes, the repurchase of $13.2 million in securitization debt, payment of $27.1 million in dividends and an increase in vehicle inventory, partially offset by an increase in borrowings under PALP financings and securitizations which have higher advance rates than our portfolio warehouse facilities, and an increase in advance rate in our remaining portfolio warehouse facility.
Change in liquidity during the twelve months ended December 31, 2008
Our liquidity for the year ended December 31, 2008 decreased $76.1 million, primarily as a result of our inability to issue securitization debt during 2008 due to the demise of the subprime securitization market, lower advance rates on our portfolio warehouse facilities, the termination of our residual facility in December 2008, and the repurchase of $83.0 million in securitization debt and $13.0 million in senior unsecured debt and cash dividends to our shareholder. These decreases were partially offset by lower origination volume due to the tightening of our loan underwriting standards, maintaining lower inventory levels due to a decrease in the number of stores, an increase in borrowings under portfolio warehouse facilities, and funding from subordinated notes payable, PALP, and junior secured notes payable.
Change in liquidity during the twelve months ended December 31, 2007
Our liquidity for the year ended December 31, 2007 increased $4.6 million. This increase resulted from the issuance of additional senior unsecured notes payable, an increase in borrowings and availability under our portfolio warehouse and residual facilities, and proceeds from disposal of property and equipment. These increases were offset by an increase in our finance receivable portfolio, an increase in inventory, purchases of property and equipment associated with newly opened and relocated stores, a decrease in accounts payable and accrued expenses and other liabilities, a decrease in borrowing under securitizations, and cash dividends paid to our shareholder.
68
Table of Contents
Cash flows
Operating activities
For the year ended December 31, 2009, net cash provided by operating activities was $85.3 million, as compared to $60.0 million for the year ended December 31, 2008. The increase in cash provided by operating activities was primarily due to lower origination volume tied to fewer open stores and tightening of our loan underwriting standards, an increase in net income, and a decrease in other assets. This increase was partially offset by an increase in inventory levels, and a decrease in accounts payable and accrued expenses.
For the year ended December 31, 2008, net cash provided by operating activities was approximately $60.0 million, as compared to net cash used in operating activities for the year ended December 31, 2007 of approximately $136.0 million. The increase in cash provided by operating activities was due to lower origination volume tied to tightening our loan underwriting standards, a decrease in vehicle inventory tied to lower number of stores, and lower anticipated sales in the first quarter of 2009 versus first quarter of 2008. These increases were partially offset by a decrease in accounts payable and accrued expenses and a decrease in net income.
Investing activities
For the year ended December 31, 2009, net cash used in investing activities increased to $12.8 million from $6.3 million used in investing activities for the year ended December 31, 2008. This increase was related to the purchase of an aircraft, an increase in purchases of information technology infrastructure, and an increase in improvements related to new store openings.
Net cash used in investing activities decreased $5.2 million to $6.3 million used in the year ended December 31, 2008 from $11.5 million used in the year ended 2007. This decrease was primarily the result of a reduction in the purchase of property and equipment since we did not open any new stores or reconditioning facilities during the year.
Financing activities
Net cash used in financing activities increased to $76.5 million for the year ended December 31, 2009 from $70.4 million used in financing activities for the year ended December 31, 2008. The additional cash used in financing activities in 2009 was primarily attributable to a net decrease in amounts outstanding under portfolio warehouse facilities which included fully repaying one of our portfolio warehouse facilities in July 2009, a decrease in amounts outstanding under other notes payable, the repurchase of an aggregate amount of $135.2 million in senior unsecured notes securitization debt, whereas we only repurchased $96.0 million in 2008. This decrease in cash used is also attributed to an affiliate of Ernest C. Garcia II, our Chairman and sole shareholder, providing $75.0 million to us in the form of subordinated notes payable in 2008, as compared to no additions to this debt in 2009 as well as an increase in dividend distributions in 2009. Partially offsetting these decreases in cash used were a reduction in payment of debt issuance costs, and an overall increase in portfolio term financings in 2009.
Net cash from financing activities decreased to $70.4 million used in financing activities for the year ended December 31, 2008 from $148.2 million provided for the year ended December 31, 2007. The decrease was primarily attributable to the fact that we could not securitize our receivables during 2008 and a reduction in our pre-fund accounts, which consist of amounts borrowed and held in trust based on receivables not yet originated and sold to the securitization trust. In addition, we incurred higher debt issuance costs, tied to renewal and upsizing of facilities. We also issued $56.5 million of senior unsecured debt in 2007. Partially offsetting this decrease was a net increase in borrowings under portfolio warehouse facilities, as a result of the renewal of our two facilities in April
69
Table of Contents
2008, the infusion of $75.0 million in the form of subordinated notes from Verde, an affiliate of Ernest C. Garcia II, our Chairman and sole shareholder, in the second quarter of 2008, the issuance of $55.1 million in junior secured notes payable, the issuance of $157.0 million of PALP debt, the addition of $46.7 million in our repurchase facility, and a reduction in dividends paid to our shareholder.
Contractual obligations
The following tables set forth the aggregate amounts of our significant contractual obligations and commitments with definitive payment terms:
| As of December 31, 2009 | |||||||||||||||
| Payments by Period | |||||||||||||||
| Total | Less than 1 Year |
Years 2-3 | Years 4-5 | More than 5 Years | |||||||||||
| ($ in thousands) | |||||||||||||||
| Debt obligations |
|||||||||||||||
| Inventory facility |
$ | 50,000 | $ | 50,000 | $ | — | $ | — | $ | — | |||||
| Portfolio warehouse facility (1) |
77,506 | 63,203 | 14,303 | — | — | ||||||||||
| Repurchase facility |
12,231 | 12,231 | — | — | — | ||||||||||
| Senior unsecured notes |
1,487 | 1,487 | — | — | — | ||||||||||
| Junior secured notes |
62,088 | — | 62,088 | — | — | ||||||||||
| Subordinated notes |
75,000 | — | — | 75,000 | — | ||||||||||
| Real estate mortgage loan |
13,046 | 186 | 406 | 459 | 11,995 | ||||||||||
| Capital lease obligations |
559 | 173 | 292 | 94 | — | ||||||||||
| Operating lease obligations |
74,962 | 15,366 | 22,068 | 17,125 | 20,403 | ||||||||||
| Securitizations & PALP financing (2) |
795,857 | 404,632 | 379,186 | 12,039 | — | ||||||||||
| Total contractual obligations |
$ | 1,162,736 | $ | 547,278 | $ | 478,343 | $ | 104,717 | $ | 32,398 | |||||
| (1) | On the termination date of the facility, amounts outstanding at termination are not due and payable immediately. All collections on the contracts collateralizing this facility are used to pay down the facility until it is paid in full. All amounts outstanding under the facility will be due and payable on the third anniversary of the termination date of the facility. |
| (2) | Securitization obligations do not have a contractual termination date. Therefore, all collections on the contracts collateralizing the securities are used to repay the asset-backed security holders based on an expected duration of the securities. On the termination date of the PALP obligations, amounts outstanding at termination are not due and payable immediately. Collections on the contracts collateralizing the facility are used to repay the facility until it is paid in full. |
Impact of new accounting pronouncements
For a discussion of recent accounting pronouncements applicable to us, see “Recent Accounting Pronouncements” in Note 2 to the combined financial statements included elsewhere in this prospectus.
Off-balance sheet arrangements
We do not have any off-balance sheet arrangements that have or are reasonably likely to have a material effect on our financial condition, changes in financial condition, revenues or expenses, results of operations, liquidity, capital expenditures, or capital resources.
70
Table of Contents
Impact of inflation
Inflation generally results in higher interest rates on our borrowings, which could decrease the profitability of our existing portfolio to the extent we have variable rate debt and could decrease profitability of our future originations if we are not able to pass the increase on to our customers. We seek to limit the risk of increasing borrowing costs:
| • | through our portfolio term financings, which allowed us to fix a portion of our borrowing costs and generally match the term of the underlying finance receivables, and |
| • | by increasing the interest rate charged for loans originated at our dealerships (if allowed under applicable law) while maintaining affordability of the customers’ payment. |
We believe that inflation has not had a material impact on our results of operations for the years ended December 31, 2007, 2008, or 2009.
Quantitative and qualitative disclosures about market risk
Our financial instruments are exposed to market risk from changes in interest rates. We do not use financial instruments for trading purposes. We use fixed rate securities to manage risk. Our earnings are substantially affected by our net interest income, which is the difference between the income earned on interest-bearing assets and the interest paid on interest-bearing notes payable. Increases in market interest rates could have an adverse effect on profitability.
Our financial instruments consist primarily of fixed rate finance receivables and fixed and variable rate notes payable. Our finance receivables are classified as subprime loans and generally bear interest ranging from 4.9% to 29.9% or the maximum interest rate allowed in states that impose interest rate limits. At December 31, 2009, the remaining scheduled maturities on our finance receivables ranged from one to 59 months, with a weighted average remaining maturity of 39.2 months. The interest rates we charge our customers on finance receivables have not changed significantly as a result of fluctuations in market interest rates. We may increase the interest rates we charge in the future if market interest rates continue to rise. The affordability of our customer’s payment is an important component of the structure of our transactions. Because of these affordability concerns for our customers and interest rate limits imposed by some states, we likely will not pass on the entire portion of future rate increases to our customers.
Approximately $947.5 million of our total debt of $1.1 billion at December 31, 2009, is fixed-rate collateralized asset-backed securities issued under our securitization program, PALP financings, senior unsecured notes payable, and other notes with a fixed interest rate. Our securitization program has historically allowed us to mitigate our interest rate risk by periodically replacing variable rate borrowings under our portfolio warehouse facility with fixed rate borrowings during the year.
71
Table of Contents
The table below illustrates the impact that hypothetical changes in interest rates could have on our interest expense for the year ended December 31, 2009. We compute the impact on interest expense for the period by first computing the baseline interest expense on our debt with interest rate risk, which includes the variable rate revolving credit lines and the variable rate notes payable. We then determine interest expense based on each of the interest rate changes listed below and compare the results to the baseline interest expense. The table does not give effect to our fixed rate receivables and borrowings.
| Increase (Decrease) in Interest Expense |
||||
| Change in Rates |
Year Ended December 31, 2009 | |||
| +200 basis points |
$ | 6,498 | ||
| +100 basis points |
3,249 | |||
| -100 basis points |
(3,249 | ) | ||
| -200 basis points |
$ | (6,498 | ) | |
In computing the effect of hypothetical changes in interest expense, we have assumed that:
| • | interest rates used for the baseline and hypothetical net interest expense amounts are on a monthly basis and in effect for the entire month; |
| • | interest for the period is calculated on monthly average debt balances during the applicable periods; and |
| • | there is no change in average balance outstanding as a result of the interest rate changes. |
Our sensitivity to interest rate changes could be significantly different if actual experience differs from the assumptions used to compute the estimates.
72
Table of Contents
General
We are the leading used vehicle retailer in the United States focusing on the sale and financing of quality vehicles to the subprime market. Through our branded dealerships, we provide our customers with a comprehensive end-to-end solution for their automotive needs, including the sale, financing, and maintenance of their vehicle. As of December 31, 2009, we owned and operated 78 dealerships and 13 reconditioning facilities in 18 metropolitan areas in 11 states. For the year ended December 31, 2009, we sold 49,500 vehicles, generated $946.3 million of total revenue (which consisted of vehicle sales and interest income), and earned $55.0 million of pre-tax income, including gain on extinguishment of debt of $30.3 million. We provide our customers with financing for substantially all of the vehicles we sell. As of December 31, 2009, our loan portfolio had a total outstanding principal balance of $1.3 billion.
Over the past 17 years, we have developed an integrated business model that consists of vehicle acquisition, reconditioning, sales, underwriting and finance, loan servicing, and after sale support. We believe that our model enables us to operate successfully in the underserved subprime market segment. In addition, we believe that our model will allow us to systematically open new dealerships in existing and new markets throughout the United States.
We operate in the large and highly fragmented used vehicle sales and financing markets. According to CNW, for 2009, industry sales of used vehicles totaled $301.0 billion, which consisted of sales from approximately 53,500 franchise and independent dealers and private transactions. The five largest used vehicle retailers accounted for only 2.7% of the nationwide market share in 2009. At the end of 2009, total used vehicle loans outstanding approximated $806.9 billion and the subprime segment we focus on comprised 21.7% of total automobile loans outstanding. Within the subprime market, we cater to customers who have the income necessary to purchase a used vehicle, but because of their impaired credit histories, cannot qualify for financing from traditional third-party sources. Our average customer is 25 to 55 years of age, has an annual income of $24,000 to $56,000, and has a FICO score between 450 and 570. FICO scores range from 350 to 850, and a customer with a FICO score below 620 is typically considered to have subprime credit.
We believe the key competitive factors to effectively serve customers in this market are: (i) availability of financing, (ii) affordability of down payments and installment payments, (iii) breadth and desirability of vehicle selection, (iv) quality of the vehicles and the warranty provided, and (v) convenience of dealership locations and customer service. In general, the other primary buying options for customers in this segment are to purchase older, higher mileage vehicles from small, independent used vehicle dealers, or in private transactions with individuals.
We believe that our business model has several advantages over our competition and that we provide our customers with a unique buying experience featuring:
| (1) | branded, attractive dealership facilities, each of which maintains a large inventory of quality, reconditioned used vehicles; |
| (2) | professional and courteous service with “no haggle” pricing and a three day “no questions asked” return policy; |
| (3) | vehicle financing with affordable down payments and installment payments; |
| (4) | our DriveCare® limited warranty program (included in the sales price of each vehicle) – a 36 month / 36,000 mile major mechanical warranty, including oil changes at Sears automotive locations nationwide and 24/7 roadside assistance; and |
| (5) | numerous payment options, which include cash payments at over 3,700 Wal-Mart stores and more than 10,400 other locations nationwide, as well as online, by phone, and through other traditional payment methods. |
73
Table of Contents
To provide financing to our customers, we have traditionally relied upon portfolio warehouse facilities and securitization transactions.
Integrated business model
Our integrated business model is focused on giving our customers the ability to acquire quality used vehicles through six key activities:
| • | Vehicle acquisition. We acquire inventory primarily from used vehicle auctions. Our centralized vehicle selection strategy takes into account many factors, including the retail value, age, and costs of buying, reconditioning, and delivering the vehicle for resale, along with buyer affordability and desirability. At December 31, 2009, we employed 28 buyers who average six years of experience with us. For the year ended December 31, 2009, our buyers purchased 53,975 vehicles from 154 auctions nationwide. |
| • | Vehicle reconditioning and distribution. Subsequent to acquisition, vehicles are transported to one of our 13 regional reconditioning facilities, where we recondition the vehicles and perform a rigorous multi-point inspection for safety and operability. On average, we spend approximately $1,000 in reconditioning costs per vehicle sold, including parts and labor. Upon passing our quality assurance testing, we determine the distribution of vehicles to our dealerships based on current inventory mix and levels, along with sales patterns at each dealership. |
| • | Vehicle sales. We utilize targeted television, radio, and online advertising programs to promote our brand and encourage customers to complete an online credit application and visit our dealerships. Customers are guided through the buying process by our trained sales personnel who focus on financing terms, the quality and breadth of our vehicle selection, and after-sale support. |
| • | Underwriting and finance. Using information provided as part of the credit application process, our centralized proprietary credit scoring system determines a customer’s credit grade and the corresponding minimum down payment and maximum installment payment. We monitor the performance of our portfolio and close rates on a real-time basis, allowing us to centrally adjust pricing and financing terms to balance sales volumes and loan performance. |
| • | Loan servicing. We perform all servicing functions for our loan portfolio, from collections through the resale of repossessed vehicles. Our experienced collection staff utilizes our proprietary collection software, which we developed specifically for subprime auto loans. We use behavioral models designed to predict payment habits, as well as automated dialer and messaging systems to enhance collection efficiency. We utilize our buyers’ vehicle acquisition and sales expertise in representing our vehicles at auction in order to maximize the recovery value of repossessed vehicles. |
| • | After sale support. As part of the sale price, we provide a warranty on each vehicle we sell, and we recently extended our warranty program to cover 36 months / 36,000 miles, including oil changes at Sears automotive locations nationwide and 24/7 roadside assistance. We self-administer our warranty program through our in-house team of customer service representatives, including warranty claim specialists who are certified mechanics, and our pre-approved vendor network of independent third-party repair facilities. |
Industry overview
Used vehicle sales. The market for used vehicles is among the largest retail markets in the United States. According to CNW, in 2009 there were 35.5 million used vehicle sale transactions totaling $301.0 billion, representing 77% and 52% of the overall vehicle market by unit sales and dollar volume, respectively. The used vehicle retail industry is highly fragmented, with sales typically occurring through one of three channels: (i) the used vehicle retail operations of the approximately 17,000 manufacturers’ franchised new car dealerships, which represented 36.0% of industry sales in 2009,
74
Table of Contents
(ii) approximately 36,500 independent used vehicle dealerships, which represented 32.9% of industry sales in 2009, and (iii) individuals who sell used vehicles in private transactions, which represented 31.1% of industry sales in 2009.
“Buy-here, pay-here” dealerships sell and finance used vehicles to individuals with limited credit histories or past credit problems. These subprime customers typically do not qualify to purchase a vehicle from used car megastores or the used car divisions of franchised new car dealers. “Buy-here, pay-here” dealerships are characterized by their sale of older, higher mileage cars; relatively small inventories of vehicles; and the requirement that customers make installment payments weekly or bi-weekly in person at the dealership.
Vehicle financing. According to CNW, at the end of 2009 there was in excess of $1.8 trillion in auto loans outstanding in the United States, of which 44.5% related to used vehicle sales. The industry is generally segmented by credit characteristics of the borrower (prime versus subprime). Originations for customers within the subprime market averaged $78.4 billion per annum (including originations for new and used vehicles) over the last five years. However, subprime automobile originations dropped to $15.7 billion in 2009.
The used vehicle financing segment is highly fragmented and is served by a variety of financing sources that include independent finance companies, “buy-here, pay-here dealers” and select traditional lending sources such as banks, savings and loans, credit unions, and captive finance subsidiaries of vehicle manufacturers. Many traditional lending sources have historically avoided the subprime market due to its relatively high credit risk and the associated collection efforts and costs. In addition, over the past one and one-half years, numerous subprime lenders have significantly curtailed their originations or exited the market. As a result, subprime loan approval rates have dropped from approximately 69% in early 2007 to approximately 10% at the end of 2009. The following graph depicts the decline in loan approval rates to subprime customers.
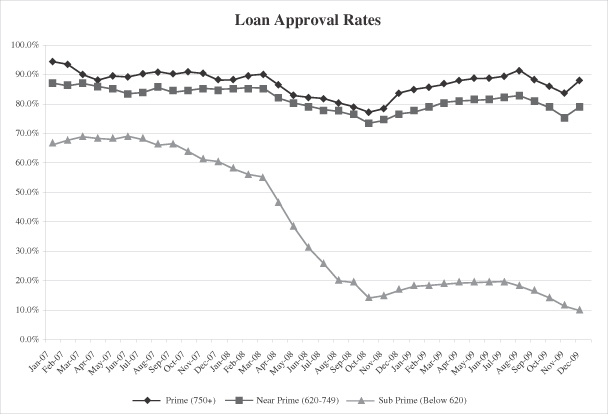
(Source: CNW)
75
Table of Contents
Consistent with the decline in loan approval rates, according to CNW, the total number of independent used vehicle dealerships has declined in recent periods, from approximately 42,800 at the end of 2007 to approximately 36,500 at the end of 2009, reflecting the downturn in the economy and tightening of the credit markets, especially the subprime markets.
Conversely, these economic factors have pushed more consumers into the subprime category. For example, according to FICO, the percentage of the U.S. population that had FICO scores under 600 rose from approximately 22% in October 2005 to approximately 25% in April 2009.
We believe this confluence of factors – the increase of customers in our target market, combined with the decline in independent used vehicle dealerships and loan availability to the subprime market – provides us with the opportunity to grow and increase market share.
Competitive strengths
We believe we have developed a flexible and adaptive business model that has enabled us to generate profits through the recent economic crisis and that also positions us for growth. Our competitive strengths consist of:
Industry leadership in the subprime auto sales and finance market. We are the leading used vehicle retailer in the United States focusing on the sale and financing of vehicles to the subprime market. We intend to continue to penetrate this highly fragmented market by expanding into new geographies and increasing sales in existing markets. We believe that with the processes we have developed we will be able to open dealerships with a relatively modest capital investment and achieve store profitability in most markets within six to 12 months of store opening.
End-to-end solution for our customers. We provide our customers with a comprehensive end-to-end solution for their automotive needs, including the sale, financing, and maintenance of their vehicles. To serve our customers, we sell quality used vehicles with affordable down payments and installment payments, and provide after sale support with our DriveCare® limited warranty program. To facilitate customer payments we have expanded our customer payment programs to enable our customers to make cash payments at over 3,700 Wal-Mart stores and more than 10,400 other locations nationwide, along with traditional payment methods. We believe that we are the only dealership network operating in our target market that provides such a comprehensive solution.
Integrated, centralized business model. We have developed a business model that integrates our vehicle acquisition, reconditioning, sales, underwriting and finance, loan servicing, and after sale support activities, which enables us to control and generate value from each aspect of our business. In addition, we have centralized the key components of each of these functions. We believe that our integrated business model and centralized operations enable us to carefully manage our business and provide consistent customer service, while providing us with a stable platform for growth.
Sophisticated and proprietary information-based systems and strategies. We have more than 17 years of experience in the subprime market and have developed sophisticated, proprietary systems and databases that help us manage each aspect of our business. We use our credit scoring system to classify customers into various credit grades defined by us based on historical loan performance. The credit grades are used to determine minimum down payments, maximum payment terms, and interest rates. We believe our ability to quantify each customer’s risk profile allows us to better predict loan performance, maintain the quality of our loan portfolio, and enhance our servicing and collections activities. We also believe that these models and databases enable us to rapidly adjust our business model to address changing market demands and customer trends.
76
Table of Contents
Targeted marketing and branding. We have developed uniform television, radio, and online advertising campaigns focused on our ability to provide financing to our target market. Centered around the theme “Approved, Approved, Approved®,” we believe our ad campaigns resonate with our credit-challenged customers by encouraging them to complete a credit application online to obtain pre-approval of their financing needs. Approximately 51% of our customers completed an online credit application before visiting a dealership in the three-month period ended December 31, 2009, up from approximately 35% for the three-month period ended December 31, 2008. We believe our dealership network fosters our brand, featuring attractive facilities that showcase our DriveTime logos and color schemes. In addition, most of our dealerships are located in high traffic commercial districts and we believe they are generally newer and cleaner in appearance than competing, independent dealerships. In many markets, we maintain multiple dealerships and/or a sizeable dealership in a highly visible, high traffic, central location within the market, which we believe has assisted us in developing a leading market position and brand name recognition.
Highly experienced management team with strong operating track record. Our executive management team has centralized our operations, created our data-driven and adaptive business model, and implemented the highly leverageable dealership model we operate today. Our Chairman and sole shareholder, Ernest C. Garcia II, founded the Company 17 years ago. Raymond C. Fidel, our Chief Executive Officer and President; Mark G. Sauder, our Chief Financial Officer; Jon Ehlinger, our Secretary and General Counsel; and Al Appelman, our Chief Credit Officer, have each been with the Company or one of its affiliates for more than nine years. Our eight member senior management team has an average of over 11 years of relevant industry experience.
Business strategies
We intend to leverage our competitive strengths by implementing the following business strategies to expand our dealership base and market share and further distinguish ourselves as the leading used vehicle retailer to the subprime market:
Pursue growth by expanding our dealership network. We believe we are well positioned to expand our dealership network throughout the United States, primarily through organic growth. We believe our centralized and integrated business model enables us to efficiently open new dealerships. Our typical times from site selection to lease execution is one to six months and from lease execution to store opening is two to four months, and we generally achieve profitability within six to 12 months of opening. We seek to locate new stores in existing commercial facilities, typically lease each facility for five years (with options to extend for another five to 15 years), and spend approximately $350,000 to $450,000 in leasehold improvements and equipment to establish each of our branded dealerships. We generally seek to expand into metropolitan areas in the United States with populations ranging from 500,000 to three million people that have customer demographic concentrations consistent with our target market and that have favorable operating environments. As of December 31, 2009, we had dealerships in 14 of 81 metropolitan areas between 500,000 and three million people, and we had dealerships in four of 16 metropolitan areas with populations in excess of three million people.
Implement business model enhancements. We are implementing enhancements to our business model in order to further distinguish our operations from traditional “buy-here, pay-here” dealerships. Unlike traditional stores serving our market, which require customers to physically make periodic payments at the dealership, we have created programs that allow our customers to make cash payments at over 3,700 Wal-Mart stores and more than 10,400 other locations nationwide, as well as online, by phone, and through other traditional payment methods. Since December 2009, all of our new stores have opened with no collectors and no payments in stores, along with a sales compensation structure weighted more toward salaries than commissions. In addition, we are in the process of consolidating collections for accounts less than 45 days past due at our facility in Dallas, Texas, which will result in the consolidation of all
77
Table of Contents
collections at two central facilities. We anticipate payments to be removed from all stores and collections to be centralized by the end of 2010. These business model enhancements are intended to provide our customers the best experience available in our market, along with further expanding our market leadership position.
Continue to enhance our credit scoring models, business analytics, and technology platforms. We believe continuous enhancement of our industry-leading analytics, processes, and systems is a key driver to our future growth and profitability. We are developing our seventh generation proprietary credit scoring model, which expands and refines the variables utilized by prior generations of scoring models. We intend to continue our efforts to enhance and expand our analytics platform, improve our management information systems and databases, enhance our website and call center systems, and improve our customer lead tracking software and sales systems. We believe that these improvements will serve to expand our competitive edge.
Maintain a strong balance sheet to support the growth of our business. Historically, we have been able to access credit markets that we believe are not typically available to auto dealerships and finance companies serving our customers in the subprime market. We believe that this success is attributable to our centralized operations, track record, and strong balance sheet. At December 31, 2009, giving effect to this offering, on a pro forma basis, we will have total equity of approximately $ million and a ratio of total assets to total equity of . We intend to continue to maintain our strong capital and liquidity position to support our growth plans and to provide us with the necessary resources to protect against disruptions in the capital markets.
About DriveTime
DriveTime Automotive, Inc. (DTA) is a newly formed Delaware corporation that was incorporated in December 2009. Pursuant to a reorganization transaction that will be consummated immediately prior to the effectiveness of the Registration Statement on Form S-1 of which this prospectus forms a part, DriveTime Automotive will become the holding company under which we will conduct our operations through two primary operating subsidiaries, DriveTime Automotive Group, Inc. (DTAG), which was incorporated in Arizona in 1992 and reincorporated in Delaware in Delaware in 1996 and focuses on vehicle sales activities, and DT Acceptance Corporation (DTAC), which was incorporated in Arizona in 2003 as a sister company to DTAG and focuses on financing activities. This reorganization transaction will serve to consolidate our businesses under a single holding company to facilitate a public offering of the common stock of DTA. Upon the consummation of the reorganization transaction, the sole shareholder of DTAG and DTAC, Ernest C. Garcia II, will become the sole shareholder of DriveTime Automotive, pending the completion of the offering contemplated hereby. The transaction will be accounted for as a reorganization of entities under common control.
DTAG, formerly known as Ugly Duckling Corporation (“Ugly Duckling”), completed an initial public offering of its common stock in June 1996. Ugly Duckling operated used car dealerships focused exclusively on the subprime market, and underwrote, financed and serviced subprime contracts generated at its dealerships. In December 2001, UDC Acquisition Corp. (the “Purchaser”), an affiliate of Ernest C. Garcia, II, Ugly Duckling’s Chairman of the Board of Directors and principal stockholder, and Gregory B. Sullivan, the President, Chief Executive Officer and a Director of Ugly Duckling, made a tender offer to purchase all of the outstanding common stock not owned by Mr. Garcia, Mr. Sullivan, the Purchaser or their affiliates. A special transaction committee appointed by the Board of Directors of Ugly Duckling recommended that stockholders approve the tender offer for numerous reasons, including, but not limited to, various uncertainties surrounding Ugly Duckling’s future prospects arising from the economic slowdown in effect at the time and the continued effect on the economy of national and international developments, including the U.S. war on terrorism. This transaction was completed in March 2002 and, upon
78
Table of Contents
closing, Ugly Duckling ceased to trade as a public company. Ugly Duckling changed its name to DriveTime Automotive, Group, Inc. in September 2002. The name change was intended to reflect the company’s new direction and its focus as the auto dealership and finance company of choice for people with subprime credit. Since going private in 2002, the company has continued to develop and implement this strategic focus. At this time, we are seeking to go public in order to gain access to the public debt and equity markets in order to raise necessary financing for our business in the future, pursue a growth strategy, raise long-term capital and pay off indebtedness, as described above under “Use of Proceeds.”
Dealerships and facilities
As of December 31, 2009, we operated 78 dealerships and 13 reconditioning facilities in 18 metropolitan areas in 11 states. Select information regarding these dealerships is as follows:
| Regions |
Twelve Months Ended December 31, 2009 |
Percent of Unit Sales Volume |
As of December 31, 2009 | ||||||||||||
| # of Units Sold | Number of Stores |
Number of Inspection Centers |
# of Active Loans |
Loan Principal | % of Portfolio | ||||||||||
| ($ in thousands) | |||||||||||||||
| Dallas |
6,959 | 14.0% | 9 | 2 | 17,510 | $ | 189,727 | 14.4% | |||||||
| San Antonio |
3,856 | 7.8% | 6 | 1 | 12,034 | 121,838 | 9.3% | ||||||||
| Atlanta |
3,898 | 7.9% | 6 | 1 | 10,919 | 110,322 | 8.4% | ||||||||
| Tampa |
3,594 | 7.3% | 6 | 1 | 10,165 | 100,656 | 7.7% | ||||||||
| Orlando |
3,753 | 7.6% | 7 | 1 | 9,482 | 96,208 | 7.3% | ||||||||
| Los Angeles |
2,558 | 5.2% | 4 | 1 | 9,117 | 85,613 | 6.5% | ||||||||
| Phoenix |
3,173 | 6.4% | 5 | 1 | 8,926 | 84,566 | 6.4% | ||||||||
| Austin |
2,947 | 6.0% | 4 | 0 | 7,246 | 78,759 | 6.0% | ||||||||
| Charlotte |
2,720 | 5.5% | 5 | 1 | 6,062 | 67,655 | 5.2% | ||||||||
| Richmond |
2,362 | 4.8% | 5 | 1 | 7,000 | 66,381 | 5.1% | ||||||||
| Las Vegas |
2,526 | 5.1% | 2 | 1 | 5,603 | 56,997 | 4.3% | ||||||||
| Albuquerque |
2,340 | 4.7% | 4 | 1 | 5,620 | 56,240 | 4.3% | ||||||||
| Greensboro |
2,596 | 5.2% | 4 | 0 | 4,118 | 49,808 | 3.8% | ||||||||
| Jacksonville |
1,870 | 3.8% | 3 | 0 | 4,158 | 44,249 | 3.4% | ||||||||
| Norfolk |
1,793 | 3.6% | 3 | 0 | 4,269 | 41,606 | 3.2% | ||||||||
| Denver |
1,650 | 3.3% | 3 | 1 | 2,905 | 36,208 | 2.8% | ||||||||
| Tucson |
888 | 1.8% | 1 | 0 | 2,586 | 25,148 | 1.9% | ||||||||
| Nashville |
17 | 0.0% | 1 | 0 | 17 | 235 | 0.0% | ||||||||
| 49,500 | 100% | 78 | 13 | 127,737 | $ | 1,312,216 | 100.0% | ||||||||
In general, our dealerships are located in high visibility, high traffic commercial areas, and we believe that they are generally newer and cleaner in appearance than competing “buy-here, pay-here” dealerships. All of our dealerships are branded with consistent signage, flooring, furniture, paint, wallpaper, and awnings. We believe our branded dealership facilities are key to customer acquisition and help promote our image as a professional business.
At December 31, 2009, we owned eight properties and all other facilities were leased. Seven of the eight properties are dealerships and one is an operations/collections call center located in Mesa, Arizona.
79
Table of Contents
At December 31, 2009, we leased 16 dealerships, three reconditioning facilities, our former loan servicing center, and our corporate office from Verde, and one dealership and one reconditioning center from Mr. Garcia’s brother-in-law, Steven Johnson. Prior to this offering, the property that is the subject of these leases will be purchased by us, and the leases will be cancelled. See “Certain Relationships and Related Party Transactions.”
Due to reduced access to funding and reduced origination volume as a result of tightening our loan underwriting standards, and also as a result of normal course of operations, we have closed 28 dealerships and six reconditioning facilities since January 1, 2008. At December 31, 2009, we are still obligated for leases on nine properties which we have vacated. To date, we have subleased four of these nine properties. Seven of the nine properties are owned by Verde and Mr. Johnson, and will be purchased by us prior to this offering. See “Management’s Discussion and Analysis of Financial Condition and Results of Operations – Factors affecting comparability.”
Dealership operations
Each of our dealerships features a wide selection of makes and models to satisfy the preferences and budgets of our potential customers. Our dealerships generally maintain an inventory in excess of 50 vehicles. We offer “no haggle” pricing, with prices displayed on each vehicle. Vehicle prices averaged $14,029 for the year ended December 31, 2009.
Each dealership is run by a general manager, who has responsibility for the operations of the dealership facility and is compensated based on overall dealership profitability, including sales and portfolio loan performance. Our dealerships also typically employ between one to three sales managers, several sales personnel, and administrative support personnel. Currently, most of our dealerships include some collections personnel.
We are implementing enhancements to our business model that seek to further distinguish our dealership operations and improve our customer experience. In this regard, we are in the process of converting our stores to “sales only” operations, and moving all collection activities to two central facilities. At the same time, we are providing new and convenient ways for customers to make installment payments, including cash payments at over 3,700 Wal-Mart stores and more than 10,400 other locations nationwide. We are also in the process of modifying our sales compensation structure, which will be weighted toward salaries rather than commissions. Beginning with vehicle sales in December 2009, we are also providing our customers with a three-day, no questions asked return policy and a 36 month / 36,000 mile extended warranty including oil changes at Sears automotive locations nationwide and 24/7 roadside assistance. Together with our clean, branded dealership facilities and “no haggle” pricing, we believe these changes will result in an industry leading customer sales experience.
Inventory
Our centralized inventory management allows us to monitor inventory mix and maintain adequate levels of inventory at each dealership. It also enables us to quickly adjust vehicle acquisition and pricing in light of market conditions and to ensure affordability at all of our stores.
Using our proprietary models and real-time data, we deliver weekly buy targets to our 28 buyers based on current inventory levels, projected sales volumes, inventory turn times, and targeted vehicle pricing. We acquire inventory from used vehicle auctions, daily rental agencies, and commercial fleets. Approximately 95% of our inventory is acquired at auction.
80
Table of Contents
After purchase, vehicles are transported to one of our 13 regional reconditioning facilities, where we perform a rigorous multi-point inspection for safety and operability, and assess the cost of reconditioning. Vehicles that fail inspection due to significant structural or mechanical defects are returned or resold at auction. We utilize our proprietary inventory management system to determine and monitor labor, parts, and other costs associated with reconditioning each vehicle. Reconditioned vehicles are distributed to our dealerships based on real-time projected inventory turn times and levels at each dealership. For the year ended December 31, 2009, the average cost per vehicle, including auction fees, reconditioning costs, parts and labor, transportation costs, and other incremental costs such as warranty costs, was $7,967, the average vehicle age was 4.1 years, and the average mileage was approximately 68,000 miles.
Marketing, sales, and branding
We have developed centrally-administered television, radio, and online advertising campaigns with uniform messaging focused on our ability to provide financing to our target market. Centered around the theme “Approved, Approved, Approved®,” we believe our ad campaigns resonate with our customers and encourage them to complete a credit application online to obtain pre-approval of their financing needs. Our branding also includes the “We turn No to Go®” green stop sign trademark and the service marks “Al the Approval Guy®” and the “Go-to-Guys for Cars and Credit®.” We believe our core marketing message portrays a fun and friendly team of helpful people who treat all customers (even those with impaired credit) with respect. Our dealership network fosters our brand, featuring consistent merchandising of DriveTime logos and color schemes. We believe this continued emphasis on our brand, customer service, and availability of financing helps our credit-challenged customers feel comfortable coming to DriveTime to purchase and finance a vehicle.
A vital component of our sales leads and volume generation is our website and the continued emphasis on our online credit approval process. Approximately 51% of our sales during the three months ended December 31, 2009 were sales generated from customers who completed an online credit application with DriveTime prior to visiting one of our dealerships, as compared to approximately 35% for the same period in 2008. We accept credit applications from potential customers through www.drivetime.com and through marketing websites such as www.goforapproval.com (for television campaigns), www.militarymerit.com (for military campaigns), and www.go4approval.com (for yellow page campaigns).
Once an application is completed, a customer can set their own appointment online or a customer service representative from our centralized call center will call them to set up an appointment at a local dealership of their choice. This centralized approach has created efficiencies and streamlined the time from application to close.
Underwriting and credit scoring models
We have dedicated, and will continue to dedicate substantial resources to developing, maintaining, and updating our proprietary credit scoring models that are focused on predicting the credit risk of our customers. We use highly trained and experienced analysts to develop our credit scoring models and various predictive models used in different aspects of our business. Many companies use FICO scores as a standard metric to assess the credit risk of customers. In contrast, we have over seven years of credit scoring modeling experience in developing scoring models that are more finely tuned to the nuances within the subprime auto segment. Our scoring models provide a substantial improvement over traditional FICO scores in rank-ordering the likelihood of credit risk default within the subprime auto segment. Our scoring models also include the use of alternative data sources along with traditional credit bureau data which enhance the ability to separate the credit risk levels of the subprime auto segment into different categories. Our centralized proprietary credit scoring models are currently used to classify customers into various risk grades that are linked to financing parameters. We believe our ability to quantify a customer’s risk profile based upon historical
81
Table of Contents
data, breadth of data, and sophisticated modeling techniques, allows us to better predict loan performance, manage the blended quality of our portfolio of loans, and obtain appropriate risk adjusted returns.
The scoring models are periodically updated to account for changes in loan performance, data sources, geographic presence, economic cycles, and business processes. The first credit scoring model was deployed in July 2001. Since then, five subsequent generations of credit scoring models have been implemented, the most recent in May 2009. The credit scoring models have evolved over time and leverage data collected from prior models allowing them to become more sophisticated in identifying the credit risk of our customers.
We perform a segmentation analysis to identify homogeneous sub-populations within our customer base, and we build separate models for each such population. Prior to each sale, we require our customers to complete a credit application. Upon entering the customer information into our origination system, our proprietary credit scoring system determines the customer’s credit grade, which is used by the dealership manager to help select vehicles that fit the required deal terms and the customer’s needs. The customer’s credit grade and type of vehicle determine the term, maximum installment payment, and minimum payment amounts. The annual percentage rate (APR) charged is a function of the customer’s credit grade, down payment, and model year of the vehicle. Our centralized risk management and pricing departments set these terms. Managers are also required to verify the pertinent information on the customers’ credit application before approving the loan, including employment, residence, insurance, and identity.
The static-pool tracking of portfolio loss performance is also monitored by credit grade. Over the past seven years, the unit loss rate results by credit grade have been relatively consistent through economic cycles and across different generations of scoring models. For example, with eighteen months of aging, the unit loss volatility within a credit grade across the seven year period from 2002 to 2008 originations has been within +/- 15% of the average for a specific credit grade. Moreover, the separation in unit loss rates by grades (rank-ordering between the grades) has averaged around 25%. For example, with eighteen months of aging, the unit loss rate for a ‘B’ grade customer has been about 25% lower than a ‘C’ grade customer, and the loss rates of our highest risk credit grade (D) are approximately three times the loss rates of our lowest risk credit grade (A+).
Our centralized risk management group manages the credit mix of our portfolio of finance receivables on a company-wide basis. This group is also responsible for monitoring the origination and underwriting processes, providing underwriting training to the dealerships, monitoring loan servicing, and static-pool tracking of portfolio loss performance and profitability.
We provide financing for substantially all of the used vehicles we sell at our dealerships through retail installment sales contracts. The foundation for underwriting these loans is our proprietary credit scoring models described above.
Loan portfolio
We actively monitor our portfolio performance and the credit grade mix of originations. Our proprietary credit grading system segments our customers into eight distinct credit grades. We control the grade mix of originations through the deal terms provided to our customers, which are established centrally by our risk management team, and applied consistently throughout our dealership network. We have higher minimum down payments and lower maximum installment payments for our lower credit grade customers, resulting in lower close rates for our lower credit grade customers. Our loans have an average original term of approximately 52 months and an average duration of only 23 months, due to amortization and charge-offs. Due to the fact that our loans have a relatively short average duration, we are able to closely monitor credit trends and make appropriate adjustments to the both the grade mix and pricing of our originations.
82
Table of Contents
Due to the deteriorating economic environment, combined with reduced access to funding, we decided to tighten our credit standards starting in the second quarter of 2008. Our goal was to both reduce overall origination volume to match our access to funding and originate loans in higher credit grades to improve the loan performance. As a result, our close rates dropped from 34.2% in 2007, to 29.6% in 2008, and 27.6% in 2009. During the same time period the monthly volume of applications per store increased from 161 in 2007, to 170 in 2008, and 191 in 2009, which enabled us to meet origination volume targets, while also achieving an improved origination credit grade mix.
More specifically, our top three credit grades increased from 52.4% of total originations in 2007 to 56.5% of total originations in 2008 and to 61.2% of total originations in 2009. The loss rates for our originations after tightening our underwriting standards in the second quarter of 2008 are currently at historical lows. For example, our gross loss rates (before recoveries) for loans originated in the first quarter of 2009 with ten months of aging are 10.2%, which is 41.6% lower than 2008 originations, 40.1% lower than 2007 originations, 38.4% lower than 2006 originations, and 35.1% lower than 2005 originations, all at the same amount of aging. The improved loan performance is primarily a function of our decision to originate better overall grade mix, combined with lower losses within the various credit grades due to improvements in deal structure, changes in underwriting policies, and implementation of new scoring models.
Due to the fact that our loans have a relatively short average duration, our portfolio turns over rapidly. As shown in the following table, loans originated since we tightened our underwriting standards in the second quarter of 2008 comprise a majority of our portfolio as of December 31, 2009.
Percentage of Portfolio Originated since March 31, 2008:
| First Quarter |
Second Quarter |
Third Quarter |
Fourth Quarter |
|||||||||
| 2008 |
0.0 | % | 12.6 | % | 24.4 | % | 33.8 | % | ||||
| 2009 |
45.9 | % | 54.1 | % | 61.8 | % | 67.6 | % |
The impact of the tightening of our underwriting standards on our loan portfolio is shown in the following trended net charge-off table, as originations after tightening increasingly became a larger percentage of our outstanding loan portfolio. This table represents the performance of our entire loan portfolio outstanding for each period shown, and does not represent static pools based on origination year. As is evident from the table below, the seasonality in our business results in net charge-offs typically being the highest in the third and fourth quarter of each year and the lowest in the first and second quarter of each year.
Net Charge-Offs as a Percent of Average Portfolio Principal Balance:
| First Quarter |
Second Quarter |
Third Quarter |
Fourth Quarter |
Full Year |
|||||||||||
| 2005 |
4.2 | % | 2.7 | % | 4.5 | % | 5.7 | % | 17.2 | % | |||||
| 2006 (1) |
3.8 | % | 2.9 | % | 4.8 | % | 4.9 | % | 16.4 | % | |||||
| 2007 |
3.8 | % | 3.2 | % | 5.5 | % | 5.4 | % | 18.2 | % | |||||
| 2008 |
4.9 | % | 4.4 | % | 5.7 | % | 6.5 | % | 21.4 | % | |||||
| 2009 |
4.9 | % | 3.9 | % | 4.8 | % | 4.6 | % | 18.2 | % |
| (1) | Net charge-offs in 2006 are adjusted to remove the positive benefit of a non recurring adjustment related to recoveries. The unadjusted total net charge offs were 15.8% for 2006. |
83
Table of Contents
Monitoring and collections
We seek to minimize credit losses by carefully monitoring our portfolio of finance receivables. After completing a sale, each loan is automatically added to our comprehensive loan servicing and collection system. Our proprietary collection system was developed specifically for subprime auto loans and provides us the transparency and tools necessary to effectively and efficiently service our loan portfolio. We set daily queues of delinquent accounts for each collector to manage based on the customer’s delinquency status and an internally generated behavioral score for the customer. In addition to behavioral models designed to predict payment habits, we utilize an automated dialer and messaging system to enhance collection efficiency.
Accounts greater than 45 days past due (i.e., “back-end” collections) are assigned to a central loan servicing facility located in Mesa, Arizona. We are in the process of centralizing “front-end” (i.e., current accounts and those between 1-45 days past due) collections, a portion of which are currently located at each of our dealerships, at a second facility located in Dallas, Texas. We have centralized collections for all accounts 1-45 days past due for all of our Texas and Arizona regions in our Dallas facility. We anticipate that the transition to centralized collections for all regions will be completed by the end of 2010. Recovery, bankruptcy, insurance, payment processing, cash balancing, customer service, re-marketing, quality assurance, contract verification, as well as our call center, and warranty administration functions are also performed at our facility in Mesa, Arizona. We utilize our buyers’ vehicle acquisition and sales expertise in representing our vehicles at auction in order to maximize the recovery value of repossessed vehicles.
Integrated information systems
We manage the operations of our reconditioning facilities, dealerships, loan servicing centers, and our accounting and reporting functions with a single, integrated information system. When we purchase a used vehicle, our staff records the purchase in our system, and the system adds the vehicle to inventory and makes the appropriate accounting entries. Reconditioning costs are also tracked for each vehicle. When a sale occurs and a loan is generated, the system adds the loan to our loan servicing and collection systems. We use both local and wide-area data and voice communication networks that allow us to account for all purchase and sale activity centrally and to service large volumes of contracts from our centralized collections facilities. We also have internally developed comprehensive databases and management tools, including credit scoring models, static pool analyses, behavioral scoring, and predictive modeling to set inventory acquisition and underwriting guidelines, structure contract terms, establish collection strategies, and monitor underwriting effectiveness.
Our systems and databases are maintained in secured data centers. Our data centers are configured with redundant power, cooling, and network access. Fire protection systems, including passive and active design elements, are installed. We utilize multiple backup systems in an effort to ensure uninterruptible power. Our network features multiple wide area network connections using a redundant routing architecture and multiple access points to public networks.
Systems and databases are configured for high availability and disaster recovery. High availability is achieved through the use of server and database clustering and redundancy at multiple hardware layers. We back-up all of our databases and systems on a regular basis. We leverage a blended data deduplication disk backup and traditional tape backup strategy that supports rapid data recovery. Tape backups are stored in a secure offsite location. Critical systems are attached to a storage area network and data replication is in place across data centers. Server virtualization technology is utilized to improve the efficiency and availability of resources and applications. We have a comprehensive disaster recovery plan in place to cover intermittent or extended periods of interruption in one or more of our critical systems. We periodically test our disaster recovery procedures.
84
Table of Contents
Customer insurance coverage
Certain of our customers have difficulty obtaining and maintaining affordable insurance for their vehicles. We have introduced in all of the states in which we operate a collateral protection insurance program. Under this program, we offer customers dual interest collateral protection insurance through a third party with whom we have a contractual relationship. The insurance coverage is limited to vehicle damage. The insurance is offered by an “A” rated insurer, and is 100% reinsured by one of our subsidiaries. Although we are not the insurer, we bear the entire risk of loss resulting from amounts claimed and paid in excess of amounts we collect related to operating this program. At December 31, 2009, our reserve for open claims was $0.1 million. We are also exploring liability insurance meeting state requirements and considering other possible solutions to provide affordable insurance for our customers, including longer term coverage, and/or making property and casualty and liability insurance available through insurance agents, or establishing our own insurance agency.
Intellectual property
We have an ongoing program under which we evaluate our intellectual property and consider appropriate federal and state intellectual property related filings. We believe that there is significant value in our trademarks, but that our business as a whole is not materially dependent on our trademarks. We believe we have taken appropriate measures to protect our proprietary rights.
Employees
At December 31, 2009 we employed 2,206 people, consisting of 1,307 people in our retail operations, 716 people in our portfolio operations, and 183 people in our corporate operations. None of our employees are covered by a collective bargaining agreement and we generally believe that relations with our employees are good.
Competition
Our primary competitors are the numerous small “buy-here, pay-here” dealerships, independent used vehicle dealers, and used vehicle departments of franchise dealers that operate in the subprime segment of the used vehicle sales industry, and the banks and finance companies that purchase their loans. There is no assurance that we can successfully distinguish ourselves from our competitors or compete in this industry in a cost-effective manner or at all. In addition, periodically larger companies with significant financial and other resources have entered or announced plans to enter the used vehicle sales and/or finance industry, or relax their credit standards and compete with us, at least at the upper end of our customer segment. These dealerships also compete with us in areas such as the purchase of inventory, which can result in increased wholesale costs for used vehicles and lower margins, and the dealerships and finance companies could also enter into direct competition with us at any time at the lower end of the subprime market.
The used vehicle financing segment is highly fragmented and is served by a variety of traditional financial institutions, including banks, savings and loans, credit unions, and captive finance subsidiaries of vehicle manufacturers, as well as by independent finance companies and “buy-here, pay-here” dealerships. While traditional financial institutions have not consistently serviced subprime borrowers, the high interest rates and margins of companies involved in subprime financing have at times encouraged certain of these traditional institutions to enter, or contemplate entering, this market. Due to the economic downturn, many finance companies have reduced or eliminated subprime auto financing. According to CNW, the subprime loan approval rates have dropped from approximately 69.0% in the first half of 2007 to approximately 10% at the end of 2009. We believe traditional lenders are currently avoiding this market due to its relatively high credit risk and the associated collection efforts, as well as the current regulatory environment impacting financial institutions. Competition may increase in the future as the economy improves and the credit markets ease.
85
Table of Contents
Regulation
Our sales, finance, and collections operations are subject to ongoing regulation, supervision, and licensing under various federal, state, and local statutes, ordinances, and regulations. Among other things, these laws require that we obtain and maintain certain licenses and qualifications, limit or prescribe terms of the contracts that we originate, provide specified disclosures to customers, limit our right to repossess and sell collateral, and prohibit us from discriminating against certain customers. We are also subject to state insurance laws, and our insurance agency subsidiary is regulated by state insurance authorities.
Our financing activities with customers are subject to federal truth-in-lending, fair credit reporting, and equal credit opportunity laws and regulations, as well as state and local motor vehicle finance laws, installment finance laws, usury laws, and other installment sales laws. Our debt collection activities with customers are subject to federal fair debt collection practices and fair credit reporting laws and regulations. We are also subject to federal and state consumer protection, privacy, and related laws and regulations. We charge fixed interest rates significantly in excess of traditional prime and non-prime finance companies on the contracts originated at our dealerships. Some states regulate finance fees and charges that may be paid as a result of vehicle sales.
We believe that we are currently in substantial compliance with all material federal, state, and local laws and regulations applicable to our business. We may not, however, be able to remain in compliance with such laws.
Environmental
We are subject to a complex variety of federal, state, and local laws, regulations, and permits relating to the environment and human health and safety. These requirements change frequently and tend to become more stringent over time, and are a significant consideration for us as our operations involve the use of storage tanks, the disposal of wastewater, and the emission of hazardous substances to the air, as well as the use, storage, recycling, and disposal of hazardous materials, such as motor oil and filters, transmission fluids, antifreeze, refrigerants, paints, thinners, batteries, cleaning products, lubricants, degreasing agents, tires, and fuel. If we violate or fail to comply with these laws, regulations, or permits, we could be fined or otherwise sanctioned by regulators. Pursuant to such requirements, we also have made and will continue to make capital and other expenditures.
We can also be responsible for costs relating to any contamination at our current or former owned or operated properties or third party waste disposal sites. This liability may be imposed even if we were not at fault. In addition to potentially significant expenses to investigate and remediate contamination, such matters can give rise to claims from governmental authorities and other third parties for fines or penalties, natural resource damages, or personal injury or property damage.
Company insurance coverage
Our business exposes us to the risk of liabilities arising out of our operations. Liabilities involve, for example, claims of employees, customers, or third parties for personal injury or property damage occurring in the course of our operations. We could also be subject to fines and civil and criminal penalties in connection with alleged violations of regulatory requirements.
The automotive retailing business is also subject to substantial risk of property loss due to the concentration of property values at dealership locations. Accordingly, we have purchased liability and property insurance, subject to certain deductibles or loss retentions. We also purchase umbrella liability insurance to provide insurance in excess of
86
Table of Contents
our primary insurance policies. We have elected to self-insure our inventory of vehicles. The level of risk we retain may change in the future as insurance market conditions or other factors affecting the economics of our insurance purchasing change. Although we have, subject to certain limitations and exclusions, substantial insurance, we cannot assure you that we will not be exposed to uninsured or underinsured losses that could have a material adverse effect on our business, financial condition, results of operations, or cash flows.
Legal proceedings
We are involved in various claims and actions arising in the ordinary course of business. In the opinion of management, based on consultation with legal counsel, the ultimate disposition of these matters will not have a material adverse effect on us. We believe appropriate accruals have been made for the disposition of these matters. We establish an accrual for a liability when it is both probable that the liability has been incurred and the amount of the loss can be reasonably estimated. These accruals are reviewed monthly and adjusted to reflect the impact of negotiations, settlements and payments, rulings, advice of legal counsel, and other information and events pertaining to a particular case. Legal expenses related to defense, negotiations, settlements, rulings, and advice of outside legal counsel are expensed as incurred.
In July 2002, we began offering our DriveCare® limited warranty for major mechanical and air-conditioning coverage. Our DriveCare® warranty was historically a 6 month / 6,000 mile limited warranty. We offer no warranties or service contracts outside of this limited warranty, although we have extended the terms of our standard warranty to 36 months / 36,000 miles. We have historically sold our vehicles on an “as is” basis. We require all customers to acknowledge in writing on the date of sale that we disclaim any obligation for vehicle-related problems that subsequently occur other than as provided under our limited warranties. Although management believes that the limited warranty program agreement and these disclaimers are enforceable under applicable laws, there can be no assurance that they will be upheld in every instance. Further, certain state implied warranties may arise in connection with offering any limited warranty. Despite these documents and disclaimers, in the ordinary course of business, we receive complaints from customers relating to vehicle condition problems, as well as alleged violations of federal and state consumer lending or other similar laws and regulations. Most of these complaints are made directly to us or to various consumer protection organizations and are subsequently resolved. However, customers occasionally name us as a defendant in civil suits filed in state, local, or small claims courts.
On June 9, 2009, a former customer filed a complaint in Los Angeles County Superior Court, alleging the post repossession notice sent to the former customer was materially defective and incomplete. The plaintiff brought the case as a purported class action in a representative capacity under California’s Unfair Competition Law. We mediated the dispute and, although a settlement has not yet been finalized, we believe we have an agreement to resolve the dispute, subject to court approval. As of December 31, 2009, we have accrued for estimated awards and attorney fees, although we do not believe such awards and fees are material to our financial position or results of operations.
In August 2008, we received a Civil Investigative Demand from the Texas Office of Attorney General, Consumer Protection Division, asking for the production of certain materials. The demand indicates it is the subject of an investigation of possible violations of the Deceptive Trade Practices Act, Sections 17.46(a) and (b) in the marketing, advertising, financing, and selling of used vehicles. We provided the Texas Office of Attorney General with all requested information in August 2008. At that time, we met with the state’s Attorney General’s Office to provide them with an overview of us and discuss the requested materials. At the meeting, we agreed on some minor changes in the requested materials. In addition, the Attorney General’s Office indicated that they would review the materials we provided to them and if there were any concerns they would contact us to meet, discuss, and resolve the concerns.
87
Table of Contents
The Texas Attorney General has requested additional information and documentation from time to time, most recently in February 2010 when it requested clarifying information limited to vehicle inspections, after sale repairs, warranty, loan servicing, and consumer concerns. We believe the request is routine in nature and we have responded accordingly. We believe we are in compliance with all applicable state laws and regulations and we intend to continue to cooperate with state officials. We believe we do not have any qualitative or quantitative loss contingencies related to this matter.
We are currently appealing to the Nevada Supreme Court an adverse administrative ruling on the efficacy of certain sales tax refunds we requested for the 2002 and 2003 tax years. While only applicable to 2002 and 2003, an adverse ruling could affect subsequent tax years as well. In several of the states in which we operate, we file for and receive sales tax refunds for sales taxes paid on retail installment sales of the amount related to that portion of the sales price ultimately not collected from our customers. Prior to this adverse ruling, the Department of Taxation of the State of Nevada had, in an audit of tax years 1998-2001, allowed such refunds. The Department is now taking the position that because the contracts are assigned to our related finance company (which they were in certain of our prior periods as well) we are not entitled to the refund. We are vigorously pursuing our rights to the refunds and believe we have a positive position and will prevail in this proceeding. Total sales tax refunds from 2002 through 2009 were $4.6 million. We have not accrued any amounts with respect to this matter.
88
Table of Contents
Executive officers, directors, and director-nominees
The following table sets forth information regarding our executive officers, directors, and director-nominees.
| Name |
Age |
Position(s) | ||
| Ernest C. Garcia II |
52 | Chairman | ||
| Raymond C. Fidel |
52 | Director, Chief Executive Officer, and President | ||
| Mark G. Sauder |
49 | Executive Vice President and Chief Financial Officer | ||
| Alan J. Appelman |
52 | Executive Vice President and Chief Credit Officer | ||
| Jon D. Ehlinger |
52 | Executive Vice President, Secretary, and General Counsel | ||
| Colin Bachinsky |
41 | Vice President - Inventory | ||
| Edward W. Barry |
45 | Vice President - Planning and Financial Analysis | ||
| Ernest Garcia III |
27 | Vice President and Treasurer | ||
| Keith W. Hughes |
63 | Director-Nominee | ||
| James K. Hunt |
58 | Director-Nominee | ||
| MaryAnn N. Keller |
66 | Director-Nominee | ||
| Donald J. Sanders |
65 | Director-Nominee | ||
| James D. Wallace |
63 | Director-Nominee |
Ernest C. Garcia II. Mr. Garcia has served as our Chairman of the Board since 1992. Mr. Garcia served as our Chief Executive Officer from 1992 to 1999, and served as our President from 1992 to 1996. Mr. Garcia has been the President of Verde Investments, Inc. since 1992. Mr. Garcia is also the father of Ernest Garcia III, our Vice President and Treasurer. As our founder, long-time Chairman and former Chief Executive Officer, Mr. Garcia brings an extensive understanding of both us, in particular, and the automobile sales and finance industry, in general, to the Board and serves as an invaluable resource for assessing and managing risks and planning for corporate strategy within the context of our overall corporate culture.
Raymond C. Fidel. Mr. Fidel has served as a Director, our Chief Executive Officer and President since 2004. Prior to that, Mr. Fidel served as our Chief Operating Officer from 2001 to 2004. Mr. Fidel graduated with a Bachelor of Science degree in finance and a Master of Business Administration degree from the University of New Mexico. Mr. Fidel’s long tenure as a senior executive of the company, as well as his day to day leadership and intimate knowledge of our business and operations, provide the Board with company-specific experience and expertise.
Mark G. Sauder. Mr. Sauder has served as our Chief Financial Officer since 2002 and as Executive Vice President since 2004. Mr. Sauder is a Certified Public Accountant and graduated with a Bachelor of Science degree in accounting from Ball State University.
Alan J. Appelman. Mr. Appelman has served as our Executive Vice President and Chief Credit Officer since 2009. From 2007 until 2009, Mr. Appelman served as our Chief Credit Officer, and from 2000 until 2007 Mr. Appelman served as our Vice President of Risk Management. Mr. Appelman graduated with a Bachelor of Arts degree in psychology from the University of Missouri and received a Masters of Business Administration degree from the University of Texas at Austin.
Jon D. Ehlinger. Mr. Ehlinger has served as our General Counsel and Secretary since 1998, and was appointed Executive Vice President in 2009. Mr. Ehlinger graduated with a Bachelors of Arts degree in history from Drake University and received his Juris Doctorate degree from the University of Notre Dame Law School.
89
Table of Contents
Colin Bachinsky. Mr. Bachinsky has served as our Vice President – Inventory since 2009. From 2001 to 2005, Mr. Bachinsky served as our Director of Underwriting, and from 2005 to 2009 he served as our Director of Inventory. Mr. Bachinsky graduated with a Bachelor of Science degree in economics from Bradley University and a Master of Business Administration degree from Loyola University.
Edward W. Barry. Mr. Barry has served as our Vice President – Planning and Financial Analysis since 2009. From 1997 to 2009, Mr. Barry served as our Director of Planning and Financial Analysis for our servicing operations. Mr. Barry is a Certified Public Accountant in Arizona and graduated with a Bachelor of Science degree in accounting and a Master in Business Administration degree from Arizona State University.
Ernest Garcia III. Mr. Garcia has served as our Vice President and Treasurer since 2009. From 2008 to 2009 Mr. Garcia served as our Managing Director of Corporate Finance after having joined DriveTime in 2007 as a financial strategist. Prior to joining us, Mr. Garcia worked at RBS Greenwich Capital from 2005 to 2006 in the principal transactions group where he worked in a team that specialized in consumer finance. Mr. Garcia graduated with a Bachelor of Science degree in Management Science and Engineering from Stanford University in 2005. He is the son of Ernest C. Garcia II, our Chairman.
Keith W. Hughes. Mr. Hughes retired as Vice Chairman and director of Citigroup in 2001. Mr. Hughes was Chairman and Chief Executive Officer of Associates First Capital from 1996 to 2000 when the company was acquired by Citigroup. Mr. Hughes’ experience in banking and finance covers 32 years with Continental Bank Chicago; Northwestern National Minneapolis; Crocker National San Francisco; and Associates First Capital. Mr. Hughes owns and operates Hughes Family Vineyards LLC, an artisan winery in Sonoma California. Mr. Hughes has served on the board of Fidelity National Information Services, a privately-held company that provides technology services to financial institutions, since 2003. Mr. Hughes served on the board of directors and audit committee of Pilgrim’s Pride Corporation (NYSE: PPC) from 2004 to 2009, and on the board of directors and audit committee of Texas Industries, Inc. (NYSE: TXI) from 2003 to 2009. Mr. Hughes graduated with a Bachelor of Science degree in marketing and a Masters in Business Administration degree from Miami University in Oxford, Ohio. Mr. Hughes’ extensive career in the subprime finance industry, his experience as a chief executive of major organizations, and his significant role on numerous boards of directors, give him the leadership and industry knowledge to guide our Board on a variety of matters, including operating strategy, corporate governance, and other matters.
James K. Hunt. Mr. Hunt has served as Chief Executive Officer and Chief Investment Officer of THL Credit Group, L.P., the credit affiliate of Thomas H. Lee Partners, L.P., since 2007. Previously, Mr. Hunt served as the Chief Executive Officer and co-founder of Bison Capital from 2001 to 2007, a multi-fund private equity firm. Until the end of 2000, Mr. Hunt was President of SunAmerica Corporate Finance and Executive Vice President of SunAmerica Investments, Inc., Chief Executive Officer of the SunAmerica variable annuity funds, and SunAmerica’s finance subsidiaries. Prior to this time, Mr. Hunt worked at Citicorp for over 14 years, culminating in the role of Senior Credit Officer and Vice President/ Area Head for the Far West U.S. leveraged lending group. Mr. Hunt is currently on the board of directors of Lender Processing Services, Inc. (NYSE: LPS), where he chairs the audit committee and also serves on the compensation committee. Mr. Hunt earned his Bachelor of Business Administration degree in economics from the University of Texas at El Paso and a Master in Business Administration degree in finance and accounting from the University of Pennsylvania’s Wharton Graduate School of Business. Mr. Hunt’s extensive career in the finance industry, including his significant focus on credit operations, provides industry insight and expertise to our Board.
MaryAnn N. Keller. Ms. Keller currently serves as the principal of Maryann Keller and Associates, a firm providing consulting services to automotive clients. From July 1999 to November 2000, Ms. Keller served as the President of
90
Table of Contents
the Automotive Services unit of Priceline.com. She joined Priceline.com from Furman Selz, an investment banking firm, where she served as a managing director of the firm from 1986 to 1999. Prior to joining Furman Selz, Ms. Keller was a portfolio manager with Vilas-Fischer Associates from 1983 to 1986, and served as automotive industry analyst with Kidder Peabody & Co. Inc. and Paine Webber from 1972 to 1983. Ms. Keller also served as Chairman of the Society of Automotive Analysts from 1994 to 1999. She is currently a director of Dollar Thrifty Automotive Group, Inc. (NYSE: DTG), a publicly-traded rental car company, where she serves on the audit committee and the human resources and compensation committee. She has previously served as a director of Lithia Motors, Inc. (NYSE: LAD), a new and used vehicle retailer. Ms. Keller earned her Bachelor of Science degree in chemistry from Rutgers and a Master in Business Administration degree from City University of New York. Ms. Keller’s extensive experience as an analyst of, consultant to, and director of organizations in the automotive industry brings valuable expertise and experience to our Board.
Donald J. Sanders. Mr. Sanders has worked in the consumer finance industry for 40 years and has held management positions with Korvettes Department Stores (private label credit business), Citicorp, and Commercial Credit Corporation. In 1990, Mr. Sanders co-founded and served as Chief Executive Officer of Credit and Risk Management Associates, Inc., a risk management and marketing consulting, data warehousing, and systems integration firm that was acquired by Fair, Isaac Companies in 1996. Mr. Sanders retired from Fair, Isaac in 2001, but continues to provide private consulting services as Deer Creek Consulting, LLC. Mr. Sanders also serves as a Senior Industry Advisor to Bridgeforce, Inc., a Delaware consulting firm, and serves on the board of directors of Collections Marketing Center, Inc., a private company. Mr. Sanders also served on the board of directors and the nominating/corporate governance committee of the board of directors, and formed and chaired the risk management committees of the board of directors, of Metris Companies, Inc., a then publicly-traded company that offered unsecured credit cards, from 2004 until it was acquired by HSBC Finance Corporation in 2005. Mr. Sanders has a Bachelor of Science degree from Loyola College (Baltimore) and a Master of Science degree in administration with a concentration in Business Financial Management from George Washington University. Mr. Sanders’ extensive career focusing on credit scoring and risk modeling for the consumer finance industry, including as a chief executive and later as a consultant, gives him the industry knowledge to guide our Board on a variety of matters.
James D. Wallace. Mr. Wallace has served as the Chairman of Alexander Centre Industries Ltd. since 1997, Chairman of Ethier Sand & Gravel Limited since 1997, and President and owner of Pioneer Construction Inc. since 1996. From 1972 through 1986, Mr. Wallace held the positions of President of each of Waters Holding Corporation Limited and Alexander Centre Industries Limited. Mr. Wallace is currently serving on the Boards of Brookfield Infrastructure Partners, L.P. (NYSE: BAM) and Northstar Aerospace (Canada) Inc. (TSX: NAS), in addition to several private companies. Mr. Wallace graduated with a Bachelor of Science degrees in mathematics and biology from Laurentian University and a Masters of Business Administration degree from the University of Windsor. Mr. Wallace is a Certified Management Accountant and holds a CFA designation. Mr. Wallace’s extensive career in real estate and construction, as both a senior operating executive and director, provides a broad wealth of knowledge in business operations and management.
Prior proceedings
Prior to founding the predecessor to DriveTime, Ernest C. Garcia II, our Chairman and sole shareholder, was involved in various real estate, securities, and banking ventures. Arising out of two transactions in 1987 between Lincoln Savings & Loan Association (“Lincoln”) and entities controlled by Mr. Garcia, the Resolution Trust Corporation (the “RTC”), which ultimately took over Lincoln, asserted that Lincoln improperly accounted for the transactions and that Mr. Garcia’s participation in the transactions facilitated the improper accounting. Facing severe
91
Table of Contents
financial pressures, Mr. Garcia agreed to plead guilty to one count of bank fraud, but, in light of his cooperation with authorities both before and after he was charged, he was sentenced to three years probation (which expired in 1996), was fined $50 (the minimum fine the court could assess), and, during the period of his probation, was banned from becoming an officer, director, or employee of any federally-insured financial institution or a securities firm without governmental approval. In connection with this matter, in 1992 Mr. Garcia consented to a censure and permanent bar from membership or employment or association with any New York Stock Exchange member or member organization. In separate actions arising out of this matter, Mr. Garcia consented to the entry of a permanent injunction against further violations of the securities laws, and filed for bankruptcy both personally and with respect to certain entities he controlled. The bankruptcies were discharged by 1993. On August 21, 2003, all of Mr. Garcia’s civil rights were restored by the Superior Court of Arizona upon application submitted to the court on June 23, 2003.
Raymond C. Fidel, our President and Chief Executive Officer, was employed by Lincoln from February 1982 to April 1989. Between 1988 and 1989, Mr. Fidel was the President of Lincoln. Following the takeover of Lincoln by the RTC in 1989, Mr. Fidel and others were charged with fraud (the “Complaint”) arising out of the sale of bonds at Lincoln of its parent company, American Continental Corporation (“ACC”). At the same time the Complaint was filed, Mr. Fidel, without admitting or denying any of the allegations in the Complaint, consented to the entry of a permanent injunction against further violations of the securities laws. Mr. Fidel pled guilty in 1991 to two counts of federal securities fraud, and to six counts in California State court (five relating to fraud and one relating to the sale of securities without qualification) arising out of this matter. In light of Mr. Fidel’s cooperation with authorities in their prosecution of executives of ACC, including Charles H. Keating, Jr., and Mr. Fidel’s efforts in stopping bond sales at Lincoln, Mr. Fidel was given three years of probation without supervision, which expired in 1996, and was ordered to make a nominal Victim’s Restitution Fund payment of $250. On September 3, 2004, all of Mr. Fidel’s civil rights were restored by the Superior Court of Arizona and, on November 18, 2004, all of Mr. Fidel’s state convictions were reduced to misdemeanors and all of the misdemeanor charges were then dismissed.
Board composition
Effective upon consummation of this offering, our board will consist of seven directors, five of whom will be independent. Currently, our directors are elected annually to serve until the next annual meeting of stockholders, until their successors are duly elected and qualified, or until their earlier death, resignation, disqualification, or removal. Directors may be removed at any time for cause by the affirmative vote of the holders of a majority of the voting power then entitled to vote.
Board committees
Our board of directors directs the management of our business and affairs, as provided by Delaware law, and conducts its business through meetings of the board of directors. Effective upon the closing of this offering, our board of directors will establish three standing committees: an audit committee; a compensation committee; and a nominating and governance committee. In addition, from time to time, special committees may be established under the direction of the board of directors when necessary to address specific issues. The composition of the board committees will comply, when required, with the applicable rules of the exchange on which our common stock is listed and applicable law. Our board of directors will adopt a written charter for each of the standing committees. These charters will be available on our website following the completion of the offering.
Audit committee. Our audit committee will be chaired by Mr. Sanders and will consist solely of “independent” directors as defined and required under Rule 10A-3 of the Exchange Act and the rules of the exchange on which our
92
Table of Contents
common stock will be listed. Our audit committee will be directly responsible for, among other things, the appointment, compensation, retention, and oversight of our independent registered public accounting firm. The oversight includes reviewing the plans and results of the audit engagement with the firm, approving any additional professional services provided by the firm and reviewing the independence of the firm. Commencing with our first report on internal controls over financial reporting, the committee will be responsible for discussing the effectiveness of the internal controls over financial reporting with the firm and relevant financial management. The members of this committee will be Mr. Sanders, , and . Our board of directors has determined that Donald J. Sanders qualifies as an “audit committee financial expert” as such term is defined under the federal securities laws.
Compensation committee. Our compensation committee will be chaired by Ms. Keller and will consist solely of directors who are “independent” as defined under and required by the exchange on which our common stock will be listed, “non-employee directors” under Section 16 of the Exchange Act, and “outside directors” for purposes of Section 162(m) of the Code. The compensation committee will be responsible for, among other things, supervising and reviewing our affairs as they relate to the compensation and benefits of our executive officers. In carrying out these responsibilities, the compensation committee will review all components of executive compensation for consistency with our compensation philosophy and with the interests of our shareholders. The members of this committee will be Ms. Keller, , and .
Nominating and governance committee. Our nominating and governance committee will be chaired by Mr. Hughes and will consist solely of “independent” directors, as defined under and required by the exchange on which our common stock will be listed. The nominating and governance committee will be responsible for, among other things, identifying individuals qualified to become board members; selecting, or recommending to the board, director nominees for each election of directors; developing and recommending to the board criteria for selecting qualified director candidates; considering committee member qualifications, appointment and removal; recommending corporate governance principles, codes of conduct and compliance mechanisms; and providing oversight in the evaluation of the board and each committee. The members of this committee will be Mr. Hughes, , and .
Compensation committee interlocks and insider participation
There are no interlocking relationships requiring disclosure under the applicable rules promulgated under the U.S. federal securities laws.
Limitation of liability and indemnification
For information concerning limitation of liability and indemnification applicable to our directors, executive officers and, in certain cases, employees, please see “Description of Capital Stock” located elsewhere in this prospectus.
Code of business conduct and ethics
We intend to adopt a code of business conduct and ethics that applies to all of our employees, officers, and directors, including those officers responsible for financial reporting. Upon completion of this offering, the code of business conduct and ethics will be available on our website at www.drivetime.com. Information on, or accessible through, our website is not part of this prospectus. We expect that any amendments to the code, or any waivers of its requirements, will be disclosed on our website.
93
Table of Contents
Compensation Discussion and Analysis
The following discussion and analysis should be read in conjunction with the related tables that are presented immediately below.
Overview
The purpose of this compensation discussion and analysis is to provide information about each material element of compensation that we pay or award to, or that is earned by, our named executive officers, who consist of our principal executive officer, principal financial officer, and our three other most highly compensated executive officers. For our 2008 fiscal year, our named executive officers were:
| • | Ernest C. Garcia II, our Chairman; |
| • | Raymond C. Fidel, our President and Chief Executive Officer; |
| • | Mark G. Sauder, our Executive Vice President and Chief Financial Officer; |
| • | Jon D. Ehlinger, our Executive Vice President, Secretary, and General Counsel; and |
| • | Alan J. Appelman, our Executive Vice President and Chief Credit Officer. |
This compensation discussion and analysis addresses and explains the compensation practices that we followed in 2009, the numerical and related information contained in the summary compensation and related tables presented below, and actions we have taken regarding executive compensation since the end of our 2009 fiscal year.
Compensation determinations
Prior to this offering, we have been a private company with a relatively small number of shareholders, and we have not been subject to exchange listing requirements regarding board independence or to exchange or SEC rules relating to board committees, including audit, nominating, and compensation committees. As such, most, if not all, of our compensation policies and determinations applicable to our named executive officers have been the product of research by and discussion among our management team. For additional information regarding the compensation committee of our board of directors that will oversee our compensation program following the completion of this offering, please see “Management – Board committees.”
Objectives of compensation programs
We pay our named executive officers based on business performance and individual performance, and, in setting compensation levels, we take into consideration our past practices and our current and anticipated future needs, the relative skills and experience of each individual executive, and the competitive market. To date, we have not utilized the services of a compensation consultant and have not engaged in any benchmarking when making policy-level or individual compensation determinations.
Compensation philosophy. A named executive officer’s total compensation will vary based on our overall performance and with the particular named executive officer’s personal performance and contribution to overall results. This philosophy generally applies to all of our employees, with a more significant level of variability and compensation at risk depending upon an employee’s function and level of responsibility. Implementing this philosophy allows us to attract, motivate, and retain highly qualified individuals responsible for guiding us and creating value for our investors.
94
Table of Contents
Overriding objectives. The overriding goal of our executive compensation program is the same as our goal – to create long-term shareholder value. Additional objectives of the executive compensation program are:
| • | to motivate our named executive officers to achieve and exceed our financial performance goals and drive shareholder value by rewarding such success; |
| • | to ensure that executive compensation programs are effective in attracting, retaining, and motivating top quality executives who have the ability to significantly influence our long-term financial success and are responsible for effectively managing our operations in a way that maximizes shareholder value; |
| • | to achieve a balance between compensation levels and our annual and long-term budgets, strategic plans, business objectives, and shareholder expectations; |
| • | to motivate executive officers to achieve our business objectives, and to align the incentives of our officers with, on a prospective basis, long-term incentive awards; |
| • | to provide named executive officers with appropriately leveraged total compensation opportunities that are competitive in form and in value with comparable companies taking into account: industry sector, market capitalization, revenues, profitability, and regional operational focus; and |
| • | to have programs that are simple, well understood, which reward accountability and are closely tied to our key financial goals and strategic objectives. |
Company compensation policies. A named executive officer’s total in-service compensation consists of base salary, a cash bonus, a deferred bonus, a long-term incentive program, and limited perquisites. With regard to these components, we have in the past adhered to the following compensation policies:
| • | Base salaries should be competitive and should encourage retention. Our compensation programs should reflect base salaries as being competitive compensation for the named executive officers to perform the essential elements of their respective jobs. |
| • | Bonuses should be structured to reward superior company performance and encourage retention. Each of our executive officers may be entitled to an annual cash bonus based on our prior year performance. To encourage continuity of management, an amount equal to each annual cash bonus is awarded on a deferred basis and such amounts are paid, subject to continued employment, three years following the year in which the deferred bonus was awarded. |
| • | Short- and long-term incentives. Our compensation programs are structured to assure that those key executives who are involved in critical decisions that impact our success have a meaningful, competitively supportable portion of their total compensation linked to their success in helping meet performance objectives. |
| • | Compensation should be paid in cash. As a private company whose equity securities were not publicly-traded prior to completion of this offering, we believed that the true compensatory value to be accorded to equity-based incentives would be difficult for both us and a recipient to determine. Accordingly, we have not in the past utilized equity-based incentives and have instead focused entirely on providing the opportunity for our named executive officers to earn total cash compensation at levels that enable us to achieve the motivation and retention goals described above. |
| • | Benefits. Benefits are offered that are competitive within the defined talent market, generally on par with our employee population, and offered on the basis of business need and adequate individual protection. Our benefit plans provide participants with reasonable flexibility to meet individual means. |
95
Table of Contents
We believe our policies have helped us achieve our compensation objectives of motivation and retention, as evidenced by the limited turnover in our executive officer ranks over the past several years.
Compensation programs design and elements of compensation
We choose to pay each element of compensation to further the objectives of our compensation program, which, as noted, includes the need to attract, retain, and reward key leaders critical to our success by providing competitive total compensation.
Elements of in-service compensation. For our 2009 fiscal year, our executive compensation mix included base salary, discretionary cash bonuses, and other benefits generally available to all employees. We generally determine the nature and amount of each element of compensation as follows:
| • | Base salary. We typically agree upon a base salary with a named executive officer at the time of initial employment. The amount of base salary agreed upon, which is not at risk, reflects our views as to the individual executive’s past experience, future potential, knowledge, scope of anticipated responsibilities, skills, expertise, and potential to add value through performance. We review executive salaries annually and may adjust them based on an evaluation of our performance for the year and the performance of the functional area(s) under an executive’s scope of responsibility. We also consider qualitative criteria, such as education and experience requirements, complexity, and scope or impact of the position compared to other executive positions internally. |
| • | Non-Equity Incentive Plan Compensation. We provide cash bonuses to recognize and reward our named executive officers with cash payments above base salary based on our success in a given year. The cash bonuses are paid annually and the bonus program includes a deferred bonus in the amount of the annual bonus that is payable three years after the payment of the annual bonus, subject to the executive officer still being employed by us at the time of payment. Amounts deferred accrue interest at the Prime rate. For 2009, the bonuses received by Messrs. Fidel, Sauder, Ehlinger and Appelman reflected, in part, bonuses for 2009 performance and, in part, the deferred portion of bonuses earned in 2006. See “– Impact of performance on compensation – bonus plan.” |
| • | Retention plan bonus. We provide cash bonuses under our retention bonus plan to Messrs. Sauder, Ehlinger and Appelman. Under the terms of the plan, we are committed to make six annual contributions beginning May 1, 2006 through May 2011 to fund the plan. An executive must remain employed by us to receive annual benefits paid out under the plan beginning in May 2011 through May 2015. The difference in the bonus paid to Mr. Sauder, in comparison to Mr. Ehlinger and Mr. Appelman, reflects the terms of the bonus plan and the value it places on Mr. Sauder’s performance in his position as chief financial officer of the company, which is a critically important role in our company given the complexity of our business model and the importance of financing to our business. |
| • | Perquisites. We seek to compensate our named executive officers at levels that eliminate the need for material perquisites and enable each individual officer to provide for his or her own needs. Accordingly, in 2009, we provided limited perquisites to our named executive officers. |
| • | Other. We offer other employee benefits to key executives for the purpose of meeting current and future health and security needs for the executives and their families. These benefits, which we generally offer to all eligible employees, include medical, dental, vision and life insurance benefits; short-term disability pay; long-term disability insurance; flexible spending accounts for medical expense reimbursements; tuition reimbursement; and a 401(k) retirement savings plan. |
96
Table of Contents
Elements of post-termination or change of control compensation and benefits. None of our named executive officers is a party to an employment agreement with us, although certain of our executives are parties to special retention agreements that provide for benefits to be accelerated upon certain events involving termination of employment or a change of control. See“– Severance and change of control arrangements” below.
Impact of performance on compensation – bonus plan
We have an annual cash bonus program that is based primarily on pretax earnings. When evaluating whether earnings targets have been satisfied, we typically disregard certain non-operating gains and/or losses over which management has no control, and certain performance measures may be adjusted in extraordinary circumstances. We determine target earnings at the start of each year, and bonuses can be paid anywhere from 50% to 150% of the target for each executive officer, depending on our performance against the targets. We determine the targets by analyzing our budget and forecasted earnings, and economic and other competitive factors.
The cash bonuses are paid annually, and the bonus program includes a deferred bonus in the amount of the annual bonus that is payable three years after the payment of the annual bonus, subject to the executive officer still being with us at the time of payment. Amounts deferred accrue interest at the Prime rate.
For 2009, the threshold level of earnings that would entitle our executive officers to a bonus was $1.0 million (which would entitle them to a 38% payout of their base bonus), and our actual performance, using a predetermined formula, was $33.0 million, which resulted in a 145% payout of their base bonus. The dollar amounts provided are not equivalent to our net income since certain items are included and/or excluded when calculating our bonus earnings.
Retention plan
Prior to July 2005, Raymond C. Fidel, Mark G. Sauder, Jon E. Ehlinger, and Alan J. Appelman were parties to change in control and equity participation agreements with DTAG and DTAC. These agreements were designed to encourage continuous improvement in performance, attract and retain key executives, motivate successful execution of business strategies, and provide for executive participation in the companies’ financial success.
In July 2005, we replaced the change of control and equity participation agreements with a retention plan in which Mark G. Sauder, Jon D. Ehlinger, and Alan J. Appelman participate. Raymond C. Fidel was not included in this plan because it was determined that, as a shareholder at that time, his 5% ownership interest in us encouraged Mr. Fidel to remain with us, and that he would be financially rewarded in his capacity as one of our shareholders. Subsequently, in 2008, Mr. Fidel entered into an agreement with Mr. Garcia for the purchase of Mr. Fidel’s ownership interest.
Under the current terms of the plan, we are committed to make six annual contributions beginning May 1, 2006 and for each year thereafter through May 1, 2011 to fund this program. An executive must remain employed by us to receive these benefits. If the executive terminates his employment without cause or is terminated with cause, any unpaid amounts are forfeited and revert to the company. If the executive is terminated without cause (including on account of disability), the executive terminates for good reason, or upon certain change of control events, the executive will receive all amounts that have been contributed to date. The total potential contributions to be paid under this plan is $14.0 million, funded by us over the first six years and paid out to the executive in five installments beginning May 1, 2011. We recognize compensation expense under this plan based upon the service period required to receive payments of ten years (exclusive of acceleration and forfeiture clauses).
97
Table of Contents
We contributed $2.8 million in each of May 2006, 2007, and 2008 in accordance with the plan. In May 2009, the executives that participate in the plan agreed to amend the scheduled plan contributions to be $1.4 million in May 2009 and May 2010 and $2.8 million in May 2011, in lieu of the originally scheduled $2.8 million in May 2009 and May 2010. At December 31, 2009, we had $4.2 million remaining to be funded over the remaining term of the retention plan.
Contributions are made into secular trusts that were set up on behalf of each participant. We fund contributions into the trusts to provide participants a level of certainty regarding payment of their retention benefits. Contributions to the secular trusts are taxable to the named executive officers and the funds are not subject to claims from creditors in the event of bankruptcy. The named executive officers also have investment discretion with respect to the contributions.
Effect of Accounting and Tax Treatment on Compensation Decisions
Internal Revenue Code Section 162(m) Policy
Section 162(m) of the Code generally imposes a $1 million limit on the amount that a public company may deduct for compensation paid to a company’s chief executive officer or, based upon recent guidance from the IRS, any of the company’s three other most highly compensated executive officers (other than the chief financial officer) who are employed as of the end of the year. This limitation does not apply to compensation that meets the requirements under Section 162(m) for “qualifying performance-based” compensation (i.e., compensation paid only if the individual’s performance meets pre-established objective goals based on performance criteria approved by shareholders) that is established by a committee that consists only of “outside directors” as defined for purposes of Section 162(m).
Prior to consummation of this offering, we have not been subject to Section 162(m) because we were privately held. However, each member of our compensation committee will qualify as an “outside director,” and we intend to consider the potential long-term impact of Section 162(m) when establishing compensation. We currently expect to qualify our compensation programs as performance-based compensation within the meaning of the Code to the extent that doing so remains consistent with our compensation philosophy and objectives. However, we reserve the right, as do most public companies, to make non-deductible payments where we determine it is in the best interests of the Company.
Internal Revenue Code Section 409A
Section 409A of the Code requires that “nonqualified deferred compensation” be deferred and paid under plans or arrangements that satisfy the requirements of the statute with respect to the timing of deferral elections, timing of payments and certain other matters. Failure to satisfy these requirements can expose employees and other service providers to accelerated income tax liabilities and penalty taxes and interest on their vested compensation under such plans. Accordingly, as a general matter, it is our intention to design and administer our compensation and benefits plans and arrangements for all of our employees and other service providers, including our named executive officers, so that they are either exempt from, or satisfy the requirements of, Section 409A. With respect to our compensation and benefit plans that are subject to Section 409A, in accordance with Section 409A and regulatory guidance issued by the IRS, we are currently operating such plans in compliance with Section 409A.
Conclusion
We believe that the compensation amounts paid to our named executive officers for their service in 2009 were reasonable and appropriate and in our best interests.
98
Table of Contents
Actions taken in current fiscal year
Chairman salary
In anticipation of becoming a publicly-traded company, our appointment of a full board of directors effective upon the closing of the offering, and the anticipated reduction in his day-to-day operating responsibilities, our Chairman, Ernest C. Garcia II, determined to reduce his salary to $500,000 per year effective January 1, 2010.
Incentive plans
As discussed above, we have historically relied upon base salaries and cash bonuses to attract, motivate and retain our named executive officers. Effective upon the completion of this offering, we intend to adopt a 2010 Equity Incentive Plan to provide our directors, executive officers, and other employees with additional incentives by allowing them to acquire an ownership interest in our business and, as a result, encouraging them to contribute to our success. These plans, the intended terms of which are described below, and copies of which will be on file with the SEC, will be effective upon the approval of our shareholders, which will occur immediately prior to the closing of the offering.
2010 equity incentive plan. We will initially authorize and reserve a total of shares of our common stock for issuance under the Incentive Plan. This reserve will automatically increase on a cumulative basis on January 1, 2011 and each subsequent anniversary through 2019, by an amount equal to the smaller of (a) % of the number of shares of common stock issued and outstanding on the immediately preceding December 31, or (b) a lesser amount determined by our board of directors. We will make appropriate adjustments in the number of authorized shares and other numerical limits in the Incentive Plan and in outstanding awards to prevent dilution or enlargement of participants’ rights in the event of a stock split or other change in our capital structure. Shares subject to awards that expire or are cancelled or forfeited will again become available for issuance under the Incentive Plan. The shares available will not be reduced by awards settled in cash or by shares withheld to satisfy tax withholding obligations. Only the net number of shares issued upon the exercise of stock appreciation rights or options exercised by means of a net exercise or by tender of previously owned shares will be deducted from the shares available under the Incentive Plan.
We may grant awards under the Incentive Plan to our employees, officers, directors, or consultants, or those of any future parent or subsidiary corporation or other affiliated entity. While we may grant incentive stock options only to employees, we may grant nonstatutory stock options, stock appreciation rights, restricted stock purchase rights or bonuses, restricted stock units, performance shares, performance units, and cash-based awards or other stock-based awards to any eligible participant.
Only members of the board of directors who are not employees at the time of grant will be eligible to participate in the non-employee director awards component of the Incentive Plan. The board of directors or the compensation committee will set the amount and type of non-employee director awards to be awarded on a periodic, non-discriminatory basis. Non-employee director awards may be granted in the form of nonstatutory stock options, stock appreciation rights, restricted stock awards, and restricted stock unit awards.
In the event of a change in control, as described in the Incentive Plan, the acquiring or successor entity may assume or continue all or any awards outstanding under the Incentive Plan or substitute substantially equivalent awards. Any awards that are not assumed or continued in connection with a change in control or are not exercised or settled prior to the change in control will terminate effective as of the time of the change in control. The compensation committee may provide for the acceleration of vesting of any or all outstanding awards upon such terms and to such extent as it determines, except that the vesting of all non-employee director awards will automatically be accelerated in full. The
99
Table of Contents
Incentive Plan also authorizes the compensation committee, in its discretion and without the consent of any participant, to cancel each or any outstanding award denominated in shares upon a change in control in exchange for a payment to the participant with respect to each share subject to the cancelled award of an amount equal to the excess of the consideration to be paid per share of common stock in the change in control transaction over the exercise price per share, if any, under the award.
In conjunction with adoption of the Incentive Plan, our board of directors intends to approve a comprehensive policy relating to the granting of stock options and other equity-based awards.
Executive employment agreements
None of our named executive officers is a party to an employment agreement with us, although certain of our executives are parties to special retention agreements and non-equity incentive plan compensation that provide for benefits to be accelerated upon certain events involving termination of employment or a change of control. See “– Severance and change of control arrangements” below.
Other than as described above, there have been no other material changes to items of compensation applicable to our named executive officers or directors for fiscal 2009.
Summary compensation table
The following table sets forth the total compensation earned for services rendered by our principal executive officer, our principal financial officer, and our three other most highly compensated executive officers whose total compensation for the fiscal year ended December 31, 2009 was in excess of $100,000 and who were serving as executive officers at the end of that fiscal year. The listed individuals are referred to herein as the “named executive officers.”
| Name and Principal Position |
Year | Salary ($) |
Bonus ($) (1) |
Non-Equity Incentive Plan Compensation ($) (2) |
All Other Compensation ($) (3) |
Total ($) | ||||||
| Ernest C. Garcia II |
2009 | 763,776 | — | — | 333,202 | 1,096,978 | ||||||
| Chairman |
||||||||||||
| Raymond C. Fidel |
2009 | 650,000 | — | 871,549 | 21,660 | 1,543,209 | ||||||
| President and Chief Executive Officer |
||||||||||||
| Mark G. Sauder |
2009 | 295,000 | 1,000,000 | 435,774 | 14,526 | 1,745,300 | ||||||
| Executive Vice President and Chief Financial Officer |
||||||||||||
| Jon D. Ehlinger |
2009 | 240,000 | 200,000 | 319,620 | 10,400 | 770,020 | ||||||
| Executive Vice President, Secretary, and General Counsel |
||||||||||||
| Alan J. Appelman |
2009 | 240,000 | 200,000 | 319,620 | 14,454 | 774,074 | ||||||
| Executive Vice President and Chief Credit Officer |
||||||||||||
100
Table of Contents
| (1) | As discussed in “– Retention plan” above, reflects amounts awarded to the applicable named executive officers in 2008 under the retention plan. Amounts awarded under this plan will be paid to participants in five installments starting May 1, 2011, subject to forfeiture as provided above. |
| (2) | As discussed in “– Impact of performance on compensation – bonus plan,” reflects amounts earned through 2009 and paid in 2010 relating to bonuses based on 2006 performance, the payment of which was subject to continued employment through 2009. These amounts also include amount paid in 2010 for the annual cash bonus program. |
| (3) | All other compensation consists of the following: |
| Name |
Year | Automobile Allowance ($) |
Personal Use of Company Aircraft ($) (a) |
Life Insurance Policy Premium ($) |
Total ($) | |||||
| Ernest C. Garcia II |
2009 | — | 333,202 | — | 333,202 | |||||
| Raymond C. Fidel |
2009 | 10,139 | 11,521 | — | 21,660 | |||||
| Mark G. Sauder |
2009 | 11,706 | — | 2,820 | 14,526 | |||||
| Jon D. Ehlinger |
2009 | 8,771 | — | 1,629 | 10,400 | |||||
| Alan J. Appelman |
2009 | 12,558 | — | 1,896 | 14,454 |
| (a) | Relates to an aircraft that we lease from Verde. In connection with this offering, this lease will be terminated. See “Certain Relationships and Related Party Transactions – Related person transactions – Aircraft lease and operating expenses.” The incremental cost to us of personal use of the aircraft is calculated based on the variable operating costs to us, including fuel costs, trip-related maintenance, universal weather-monitoring costs, on-board catering, landing/ramp fees, crew travel expenses, and other miscellaneous variable costs. Fixed costs that do not change based on usage, such as pilot salaries, our lease costs, and the cost of maintenance not related to trips, are excluded. |
Severance and change of control arrangements
The annual cash bonus program in which our executive officers participate and the deferred bonus arrangements with Mr. Sauder, Mr. Ehlinger, and Mr. Appelman entitle them to certain severance payments and other benefits in the event of certain types of terminations and changes of control, which are summarized below. The table below reflects the amount of compensation to be paid to each of them in the event of termination of such executive’s employment. The amounts shown assume that such termination was effective as of December 31, 2009, and thus includes amounts earned through such time and are estimates of the amounts that would be paid out to the executives upon their termination. The actual amounts to be paid out can only be determined at the time of such executive’s separation from us.
| Named Executive Officer |
Resignation without Good Reason / Termination for Cause |
Resignation with Good Reason / Termination without Cause / Upon Change of Control |
Termination Upon Change of Control | ||||||
| Raymond C. Fidel |
$ | — | $ | — | $ | 1,392,861 | |||
| Mark G. Sauder |
$ | — | $ | 3,855,694 | $ | 4,552,125 | |||
| Jon D. Ehlinger |
$ | — | $ | 837,589 | $ | 1,394,733 | |||
| Alan J. Appelman |
$ | — | $ | 883,552 | $ | 1,440,696 | |||
The initial public offering contemplated hereby will not constitute a change of control for purposes of the payments described above.
101
Table of Contents
Director compensation
Beginning upon the completion of this offering, we intend to pay our non-employee directors an annual retainer of $100,000 for their board service, $50,000 of which will be paid in shares of restricted stock granted under our Incentive Plan, and $50,000 of which will be paid in cash or, at each non-employee director’s election, in shares of restricted stock granted under our Incentive Plan. The restricted stock grants to our non-employee directors will be made upon the completion of this offering and, thereafter, following our annual meeting of stockholders each year and will vest on the earlier of the one year anniversary of the date of grant or immediately prior to the following year’s annual meeting of stockholders, as applicable, subject to acceleration in the event of a change in control. In addition, we also intend to pay the members of our audit, compensation, and nominating and corporate governance committees an annual cash retainer of $5,000, with the chair of each committee receiving an annual cash retainer of $10,000. We will reimburse all directors for reasonable expenses incurred to attend our board and board committee meetings.
102
Table of Contents
Certain Relationships and Related Party Transactions
Policies and procedures for related person transactions
In connection with this offering, we intend to adopt a written code of business conduct and ethics, or code of conduct, effective as of the date of and applicable to transactions on or after the offering, pursuant to which our executive officers, directors, and principal shareholders, including their immediate family members and affiliates, will not be permitted to enter into a related person transaction described below with us without the prior consent of our audit committee, or other independent committee of our board of directors in the event it is inappropriate for our audit committee to review such transaction due to a conflict of interest. Any request for us to enter into a transaction with an executive officer, director, principal shareholder or any of such persons’ immediate family members or affiliates, in which the amount involved exceeds $120,000, will first be presented to our audit committee for review, consideration, and approval. All of our directors, executive officers, and employees will be required to report to our audit committee any such related person transaction. In approving or rejecting the proposed agreement, our audit committee shall consider the facts and circumstances available and deemed relevant to the audit committee, including, but not limited to, the risks, costs and benefits to us, the terms of the transaction, the availability of other sources for comparable services or products, and, if applicable, the impact on a director’s independence. Our audit committee shall approve only those agreements that, in light of known circumstances, are in, or are not inconsistent with, our best interests, as our audit committee determines in the good faith exercise of its discretion. Under the policy, if we should discover related person transactions that have not been approved, the audit committee will be notified and will determine the appropriate action, including ratification, rescission, or amendment of the transaction. This policy has not been and will not be applied to the transactions described below.
Relationship with Verde Investments, Inc.
Verde Investments, Inc. is an Arizona corporation that is wholly-owned by Ernest C. Garcia II, our Chairman and sole shareholder. Verde engages in the acquisition, development, and long-term investment in real estate and other commercial assets. Mr. Garcia is the sole stockholder, president and director of Verde. Another affiliate of Mr. Garcia is the Garcia Family Limited Liability Partnership, LLP, of which Mr. Garcia and his wife own 7.32% and Verde owns 66.18%. The other interests are owned by his sons and two related trusts. Subsequent to this offering, the only related party transaction which will continue between us and Verde will be our lease to Verde of approximately 1,000 square feet of office space within our corporate office. Verde will lease this space from us at a market rate of rent for a period of five years, with options to extend.
As of December 31, 2007, Raymond C. Fidel, the Company’s President and Chief Executive Officer, was obligated to Verde for a $5.0 million note payable at a fixed rate of interest of 4.0% per annum. Mr. Fidel satisfied this obligation in January 2008, in connection with Mr. Garcia’s purchase of Mr. Fidel’s 5% ownership interest in each of DTAG and DTAC.
103
Table of Contents
Related person transactions
During the year ended December 31, 2007, 2008, and 2009, we recorded related party operating expenses as follows:
| Years Ended December 31, | ||||||||||||
| 2007 | 2008 | 2009 | ||||||||||
| ($ in thousands) | ||||||||||||
| General and administrative expenses—related party |
||||||||||||
| Property lease expense |
$ | 5,977 | $ | 5,383 | $ | 4,741 | ||||||
| Store closing costs on related party leases |
— | 2,484 | 1,969 | |||||||||
| Aircraft lease expense |
1,946 | 1,949 | 1,950 | |||||||||
| Aircraft operating expense |
1,737 | 1,774 | 1,676 | |||||||||
| Reimbursement of certain general and administrative expenses |
(200 | ) | (210 | ) | (210 | ) | ||||||
| Salaries and wages, general & administrative, and other expenses |
866 | 484 | 567 | |||||||||
| Total general and administrative expenses – related party |
$ | 10,326 | $ | 11,864 | $ | 10,693 | ||||||
Property leases
At December 31, 2008 and 2009, we leased 18 and 16 vehicle sales facilities, respectively, three reconditioning facilities, our former loan servicing center (which is currently being subleased to two third-party tenants), and our corporate office from Verde. At December 31, 2007 and 2008, we also leased two vehicle sales facilities and, at December 31, 2009, we also leased one used vehicle sales facility, and a reconditioning center from a director and former officer of DTAC and Mr. Garcia’s brother-in-law, Steven Johnson. At December 31, 2009, the maturity of these leases range from 2013 to 2023.
Store closing costs on related-party leases
We closed 19 stores and four reconditioning facilities during the year ended December 31, 2008, six of which were facilities we leased from Verde and Steven Johnson. In accordance with ASC 420 – Exit or Disposal Activities (ASC 420), we recorded lease obligations, asset disposal costs, and other closing costs associated with these closures for the year ended December 31, 2008. As of December 31, 2008, $2.1 million remained in accrued expenses and other liabilities–related party on the accompanying combined balance sheet for lease obligations pertaining to these closed facilities. The expiration of these leases at December 31, 2008 range from 2013 to 2018.
We closed an additional nine stores and two reconditioning centers in the year ended December 31, 2009, four of which were facilities we lease from Verde and Steven Johnson. In accordance with ASC 420, we recorded lease obligations, asset disposal costs, and other closing costs associated with these closures. During 2009 we terminated the leases on two of the closed related party facilities and paid $0.4 million in lease termination fees. We remain obligated for related-party leases on four closed used car sales facilities, two closed reconditioning centers, and one closed operations facility as of December 31, 2009. We ceased use of the former loan servicing center in 2007 and this facility is currently being subleased. We did not incur a lease obligation on this facility since our sublease income is equal to our rent obligation. Approximately $2.3 million remains in accrued expenses and other liabilities–related party on the accompanying combined balance sheets for these lease obligations as of December 31, 2009. The expiration of these leases range from 2013 to 2018.
104
Table of Contents
We incurred $5.0 million, $5.1 million, and $5.5 million (including store closing costs) in total lease expenses for these leases in years ended December 31, 2007, 2008, and 2009, respectively. Prior to this offering, Verde and Mr. Johnson will sell the real estate that we currently lease from them to us (including the vacated properties), and the related lease obligations will be terminated. The properties owned by Verde and the other affiliate of Mr. Garcia will be sold to us for an amount equal to their aggregate carrying value at time of purchase ($29.6 million as of December 31, 2009). The properties owned by Mr. Johnson will be sold to us for an aggregate amount of $2.0 million. As a result of the transfers, lease expense will be lower in future periods and our property, plant and equipment will be higher, and depreciation and interest expense associated with financing the properties will increase.
Aircraft lease and operating expenses
In September 2005, we entered into a lease with Verde for an aircraft. Under the terms of the lease agreement, we agreed to pay monthly lease payments of $150,000 plus taxes to Verde, and are responsible for paying all costs and expenses related to the aircraft and its operations. The lease term is five years. In connection with this offering, this lease will be terminated and we will no longer incur related party aircraft lease or operating expenses.
Reimbursement of general and administrative expenses
For the years ended December 31, 2006 and 2007, we received $50,000 each quarter from Verde, as reimbursement of certain general and administrative expenses incurred by us on Verde’s behalf. This amount was $52,500 for each of the quarters in 2008 and 2009. In connection with this offering, this reimbursement arrangement will be terminated.
Salaries and wages, general and administrative, and other expenses
Certain general and administrative expenses and salaries and wages of Verde and Verde employees who are enrolled in our health plan are reflected in our general and administrative expenses–related party. In connection with this offering, this arrangement will be terminated.
105
Table of Contents
Related party indebtedness
Our recent financial performance was impacted by the turmoil in the credit markets, the deterioration of the securitization market, and the effects of the recession on our customers. In response, among other items, we secured alternative sources of financing, including from related parties. See “Management’s Discussion and Analysis of Financial Condition – Liquidity and capital resources” for further information. During the year ended December 31, 2007, 2008, and 2009, we recorded related party interest expense and loss on extinguishment of debt as follows:
| Years Ended December 31, | |||||||||
| 2007 | 2008 | 2009 | |||||||
| ($ in thousands) | |||||||||
| Secured debt interest expense – related party |
|||||||||
| Junior secured notes: |
|||||||||
| Tranche A – related party: CEO |
$ | — | $ | 30 | $ | 400 | |||
| Tranche A – related party: Verde |
— | — | 2,460 | ||||||
| Tranche B – related party: Verde |
— | 450 | 6,035 | ||||||
| $5.0 million shareholder note payable |
— | 140 | — | ||||||
| Total secured debt interest expense – related party |
$ | — | $ | 620 | $ | 8,895 | |||
| Unsecured debt interest expense – related party |
|||||||||
| $32.0 million senior unsecured notes payable |
$ | — | $ | 3,224 | $ | 2,690 | |||
| $75.0 million subordinated notes payable |
— | 5,939 | 9,158 | ||||||
| Total unsecured debt interest expense – related party |
$ | — | $ | 9,163 | $ | 11,848 | |||
| Loss on extinguishment of debt, net – related party |
|||||||||
| $32.0 million senior unsecured notes payable |
$ | — | $ | — | $ | 1,248 | |||
Secured debt interest expense
In December 2008, we issued junior secured notes. These notes consist of a Tranche A component and a subordinate Tranche B component. The Tranche A component is comprised of four notes (one of which is a $2.0 million note to Ray Fidel, our Chief Executive Officer) and the Tranche B component is comprised of one subordinate note to Verde. At December 31, 2009, the Tranche A notes bear interest at 22.0% per annum, increasing by 2.0% each year until maturity and the Tranche B note bears interest at 27.0% per annum, increasing 2.0% each year until maturity.
During the twelve months ended December 31, 2009, Verde purchased an aggregate amount of $36.1 million in junior secured notes from Tranche A note holders and, at December 31, 2009, Verde holds $36.1 million in Tranche A junior secured notes and $24.0 million of Tranche B junior secured notes. Raymond C. Fidel holds the remaining $2.0 million in Tranche A notes.
In September 2008, our sole shareholder provided $5.0 million in cash to us in return for a short term subordinated note bearing interest at 12.0% per annum, due December 2008. The note was collateralized by certain real estate owned by us. As of December 31, 2008 this note was paid in full.
In connection with this offering, Verde has agreed to exchange an aggregate of $100.0 million of junior secured notes and subordinated notes (described below) for shares of our newly-designated 6.5% convertible preferred stock, based on the midpoint of the range set forth on the cover page of this prospectus. Any junior secured notes or subordinated notes that remain outstanding will be repaid with a portion of the proceeds of this offering, including the $2.0 million of Tranche A junior secured notes held by Ray Fidel, our Chief Executive Officer.
106
Table of Contents
Unsecured debt interest expense
In January 2008, Verde purchased $29.0 million face value of our 11.25% senior unsecured notes due 2013. This purchase was made on the open market between Verde and a third-party broker. The purchase price was 70.0% of face value. In May, 2008, Verde subordinated principal and interest on the $29.0 million in notes.
In September 2008, Verde purchased an additional $3.0 million face value of our 11.25% senior unsecured notes due 2013. This purchase was made on the open market between Verde and a third-party broker. The purchase price was 52.0% of face value.
In the second quarter of 2008, Verde provided a total of $75.0 million in cash to us in return for subordinated notes, bearing interest at 12.0% per annum, and with a maturity date of August 2013. In connection with the offering, Verde has agreed to exchange an aggregate of $100.0 million of subordinated notes and junior secured notes (described above) for shares of our newly-designated 6.5% convertible preferred stock, based on the mid point of the range set forth on the cover page of the prospectus. Any subordinated notes or junior secured notes that remain outstanding will be repaid with a portion of the proceeds of this offering.
Loss on extinguishment of debt
In September 2009, we repurchased the $32.0 million face value of our 11.25% senior unsecured notes due 2013 which were held by Verde. This repurchase was made at par and resulted in a net loss on extinguishment of debt of $1.2 million as a result of the write-off of unamortized debt discount and unamortized capitalized loan fees.
107
Table of Contents
Beneficial Ownership of Common Stock
The following table sets forth information regarding the beneficial ownership of our common stock as of December 31, 2009, and as adjusted to reflect the sale of common stock being offered in this offering, for:
| • | each person, or group of affiliated persons, known to us to own beneficially 5% or more of our outstanding common stock; |
| • | each of our directors and director-nominees; |
| • | each of our named executive officers; and |
| • | all of our directors, director-nominees, and executive officers as a group. |
The information in the following table has been presented in accordance with the rules of the SEC. Under SEC rules, beneficial ownership of a class of capital stock includes any shares of such class as to which a person, directly or indirectly, has or shares voting power or investment power and also any shares as to which a person has the right to acquire such voting or investment power within 60 days through the exercise of any stock option, warrant or other right. If two or more persons share voting power or investment power with respect to specific securities, each such person is deemed to be the beneficial owner of such securities. Except as we otherwise indicate below and under applicable community property laws, we believe that the beneficial owners of the common stock listed below, based on information they have furnished to us, have sole voting and investment power with respect to the shares shown. Unless otherwise noted below, the address for each holder listed below is 4020 East Indian School Road, Phoenix, Arizona 85018.
For purposes of calculating beneficial ownership, we have assumed that we will issue shares of common stock in the offering.
| Beneficially Owned Prior to the Offering (1) |
Beneficially Owned After Offering |
Beneficially Owned After Over- Allotment (2) | |||||||||||
| Shares | Percent | Shares | Percent | Shares | Percent | ||||||||
| Sole Shareholder: |
|||||||||||||
| Ernest C. Garcia II and affiliates (3) |
100 | 100 | % | ||||||||||
| Directors, Director-Nominees, and Named Executive Officers: |
|||||||||||||
| Ernest C. Garcia II |
100 | 100 | % | ||||||||||
| Raymond C. Fidel |
— | — | |||||||||||
| Mark G. Sauder |
— | — | |||||||||||
| Alan J. Appelman |
— | — | |||||||||||
| Jon D. Ehlinger |
— | — | |||||||||||
| Keith W. Hughes |
— | — | |||||||||||
| James K. Hunt |
— | — | |||||||||||
| MaryAnn N. Keller |
— | — | |||||||||||
| Donald J. Sanders |
— | — | |||||||||||
| James D. Wallace |
— | — | |||||||||||
| All directors, director-nominees, and executive officers as a group (13 persons) |
100 | 100 | % | ||||||||||
| * | Represents beneficial ownership of less than 1% |
108
Table of Contents
| (1) | The percentage of beneficial ownership as to any person as of a particular date is calculated by dividing the number of shares beneficially owned by such person, which includes the number of shares as to which such person has the right to acquire voting or investment power within 60 days after such date, by the sum of the number of shares outstanding as of such date plus the number of shares as to which such person has the right to acquire voting or investment power within 60 days after such date. Consequently, the denominator for calculating beneficial ownership percentages may be different for each beneficial owner. |
| (2) | Amounts presented assume that the over-allotment option is exercised in full. |
| (3) | Consists of (i) five shares held of record by the Ernest C. Garcia III Multi-Generational Trust and the Brian Garcia Multi-Generational Trust, (ii) 90 shares held of record by Ernest C. Garcia II and Elizabeth Joanne Garcia, and (iii) five shares held of record by the Ernest Irrevocable 2004 Trust and Brian Irrevocable 2004 Trust. Mr. Garcia is deemed to be the beneficial owner of shares held by these trusts. |
109
Table of Contents
General
The following description of our capital stock summarizes provisions of our certificate of incorporation and bylaws as they will be in effect upon completion of the offering. As of the date of this prospectus, our authorized capital stock consists of 1,000 shares of common stock, $0.001 par value per share. Immediately after completion of this offering, our authorized capital stock will consist of shares of common stock, $0.001 par value per share, shares of convertible preferred stock, $0.001 par value, and shares of undesignated preferred stock, $0.001 par value per share.
The following description of the material provisions of our capital stock and our charter and bylaws is only a summary, does not purport to be complete and is qualified by applicable law and the full provisions of our charter and bylaws. You should refer to our charter and bylaws as in effect upon the closing of this offering, which are included as exhibits to the registration statement of which this prospectus is a part.
Common stock
As of December 31, 2009, there were 100 shares of our common stock outstanding and held of record by approximately three shareholders, all of which were affiliated with Ernest C. Garcia II.
Voting rights. Holders of common stock are entitled to one vote per share on any matter to be voted upon by shareholders. All shares of common stock rank equally as to voting and all other matters. The shares of common stock have no preemptive or conversion rights, no redemption or sinking fund provisions, are not liable for further call or assessment and are not entitled to cumulative voting rights.
Dividend rights. For as long as such stock is outstanding, the holders of common stock are entitled to receive ratably any dividends when and as declared from time to time by the board of directors out of funds legally available for dividends. We currently intend to retain all future earnings for the operation and expansion of our business and do not anticipate paying cash dividends on the common stock in the foreseeable future.
Liquidation rights. Upon a liquidation or dissolution of our company, whether voluntary or involuntary, creditors will be paid before any distribution to holders of our common stock. After such distribution, holders of common stock are entitled to receive a pro rata distribution per share of any excess amount.
6.5% convertible preferred stock
In connection with this offering, Verde has agreed to exchange an aggregate of $100.0 million of subordinated notes and junior secured notes for shares of our newly-designated 6.5% convertible preferred stock, based on the midpoint of the range set forth on the cover page of this prospectus. A description of the intended rights and preferences of shares of preferred stock follows. The following summary is qualified in its entirety by the certificate of designations that will be filed with the Delaware Secretary of State with respect to these shares.
Ranking. Shares of our convertible preferred stock will rank senior to shares of our common stock.
Voting rights. On all matters presented for a vote of the holders of common stock, the holders of our convertible preferred stock will vote together with the holders of common stock as a single class on an as-converted basis, except as otherwise required by law.
110
Table of Contents
Dividend rights. The convertible preferred stock will carry an annual 6.5% cumulative dividend, compounded quarterly, which will be payable quarterly at the discretion of the board of directors, and if not so paid, accrued.
Liquidation rights. Upon our liquidation, dissolution, or winding up, the holders of the convertible preferred stock will be entitled to receive a liquidation preference per share of convertible preferred stock equal to the greater of (a) the stated value plus all accrued and unpaid dividends, and (b) the aggregate amount per share that would be paid to the holders of the convertible preferred stock in connection with such liquidation, dissolution, or winding up if all shares of convertible preferred stock held by such holders had been converted into common stock immediately prior to such liquidation event and any unpaid dividends.
Conversion. Each share of convertible preferred stock will be convertible at any time at the option of the holder thereof into the number of shares of common stock equal to (a) the stated value, divided by (b) the 115% of the initial public offering price of shares of our common stock, as set forth on the cover page of this prospectus, as the same may be adjusted from time to time. Upon any such conversion, all accrued and unpaid dividends will be paid in full.
Redemption. If the closing price of our common stock is 150% or higher than the initial public offering price, as set forth on the cover page of this prospectus as the same may be adjusted from time to time, for 30 consecutive trading days, we will be able to demand (i) redemption of all or any part of the convertible preferred stock then held by any holder at a price per share equal to the stated value plus all accrued and unpaid dividends thereon or (ii) conversion into shares of common stock plus payment in cash of any accrued and unpaid dividends on such shares.
Undesignated preferred stock
Under our charter, which will be effective upon the completion of this offering, the board of directors has authority to issue undesignated preferred stock without shareholder approval. The board of directors may also determine or alter for each class of preferred stock the voting powers, designations, preferences, and special rights, qualifications, limitations, or restrictions as permitted by law. The board of directors may authorize the issuance of preferred stock with voting or conversion rights that could adversely affect the voting power or other rights of the holders of the common stock. Issuing preferred stock provides flexibility in connection with possible acquisitions and other corporate purposes, but could also, among other things, have the effect of delaying, deferring or preventing a change in control of our company and may adversely affect the market price of our common stock and the voting and other rights of the holders of common stock.
Anti-takeover matters
Charter and bylaw provisions
Our charter and bylaws will, upon completion of this offering, include a number of provisions that may have the effect of encouraging persons considering unsolicited tender offers or other unilateral takeover proposals to negotiate with our board of directors rather than pursue non-negotiated takeover attempts. These provisions include the items described below.
Board composition and filling vacancies. Currently, our directors are elected annually to serve until the next annual meeting of stockholders, until their successors are duly elected and qualified, or until their earlier death, resignation, disqualification or removal. Upon the completion of this offering, the board of directors will be divided into three classes, each serving staggered, three-year terms. Our bylaws will provide that directors may be removed only for cause by the affirmative vote of the holders of a majority of the voting power of all the outstanding shares of capital stock
111
Table of Contents
entitled to vote generally in the election of directors voting together as a single class. Furthermore, any vacancy on our board of directors, however occurring, including a vacancy resulting from an increase in the size of our board, may only be filled by the affirmative vote of a majority of our directors then in office even if less than a quorum.
Meetings of shareholders. Our bylaws will provide that only a majority of the members of our board of directors then in office may call special meetings of shareholders and only those matters set forth in the notice of the special meeting may be considered or acted upon at a special meeting of shareholders. Our bylaws will limit the business that may be conducted at an annual meeting of shareholders to those matters properly brought before the meeting.
Advance notice requirements. Our bylaws will establish advance notice procedures with regard to shareholder proposals relating to the nomination of candidates for election as directors or new business to be brought before meetings of our shareholders. These procedures provide that notice of shareholder proposals must be timely given in writing to our corporate secretary prior to the meeting at which the action is to be taken. Generally, to be timely, notice must be received at our principal executive offices not less than 120 days prior to the first anniversary date of the annual meeting for the preceding year. The notice must contain certain information specified in the bylaws.
Amendment to bylaws and charter. As required by the DGCL, any amendment of our charter must first be approved by a majority of our board of directors and, if required by law or our charter, thereafter be approved by a majority of the outstanding shares entitled to vote on the amendment, and a majority of the outstanding shares of each class entitled to vote thereon as a class, except that the amendment of the provisions relating to shareholder action, directors, limitation of liability and the amendment of our bylaws and certificate of incorporation must be approved by no less than 66 2/3 percent of the voting power of all of the shares of capital stock issued and outstanding and entitled to vote generally in any election of directors, voting together as a single class. Our bylaws may be amended by the affirmative vote of a majority vote of the directors then in office, subject to any limitations set forth in the bylaws; and may also be amended by the affirmative vote of at least 66 2/3 percent of the voting power of all of the shares of capital stock issued and outstanding and entitled to vote generally in any election of directors, voting together as a single class.
Blank check preferred stock. Our charter will provide for authorized shares of preferred stock. The existence of authorized but unissued shares of preferred stock may enable our board of directors to render more difficult or to discourage an attempt to obtain control of us by means of a merger, tender offer, proxy contest, or otherwise. For example, if in the due exercise of its fiduciary obligations, our board of directors were to determine that a takeover proposal is not in the best interests of us or our shareholders, our board of directors could cause shares of preferred stock to be issued without shareholder approval in one or more private offerings or other transactions that might dilute the voting or other rights of the proposed acquirer or insurgent shareholder or shareholder group. In this regard, our certificate of incorporation grants our board of directors broad power to establish the rights and preferences of authorized and unissued shares of preferred stock. The issuance of shares of preferred stock could decrease the amount of earnings and assets available for distribution to holders of shares of common stock. The issuance may also adversely affect the rights and powers, including voting rights, of these holders and may have the effect of delaying, deterring, or preventing a change in control of us.
Delaware general corporate law
Upon completion of this offering, we will be subject to the provisions of Section 203 of the DGCL. In general, Section 203 prohibits a publicly held Delaware corporation from engaging in a “business combination” with an “interested stockholder” for a three-year period following the time that this stockholder becomes an interested stockholder, unless the business combination is approved in a prescribed manner. A “business combination” includes, among other things, a merger, asset or stock sale, or other transaction resulting in a financial benefit to the interested
112
Table of Contents
stockholder. An “interested stockholder” is a person who, together with affiliates and associates, owns, or did own within three years prior to the determination of interested stockholder status, 15% or more of the corporation’s voting stock. Under Section 203, a business combination between a corporation and an interested stockholder is prohibited unless it satisfies one of the following conditions:
| • | before the stockholder became interested, the board of directors approved either the business combination or the transaction which resulted in the stockholder becoming an interested stockholder; |
| • | upon consummation of the transaction which resulted in the stockholder becoming an interested stockholder, the interested stockholder owned at least 85% of the voting stock of the corporation outstanding at the time the transaction commenced, excluding for purposes of determining the voting stock outstanding, shares owned by persons who are directors and also officers, and employee stock plans, in some instances; or |
| • | at or after the time the stockholder became interested, the business combination was approved by the board of directors of the corporation and authorized at an annual or special meeting of the stockholders by the affirmative vote of at least two-thirds of the outstanding voting stock which is not owned by the interested stockholder. |
Limitations of director liability and indemnification directors, officers, and employees
As permitted by the DGCL, provisions in our charter and bylaws that will be in effect at the closing of this offering will limit or eliminate the personal liability of our directors. Consequently, directors will not be personally liable to us or our shareholders for monetary damages or breach of fiduciary duty as a director, except for liability for:
| • | any breach of the director’s duty of loyalty to us or our shareholders; |
| • | any act or omission not in good faith or that involves intentional misconduct or a knowing violation of law; |
| • | any unlawful payments related to dividends or unlawful stock repurchases, redemptions or other distributions; or |
| • | any transaction from which the director derived an improper personal benefit. |
These limitations of liability do not alter director liability under the federal securities laws and do not affect the availability of equitable remedies, such as an injunction or rescission.
In addition, our bylaws provide that:
| • | we will indemnify our directors, officers and, in the discretion of our board of directors, certain employees, to the fullest extent permitted by the DGCL, subject to limited exceptions, including an exception for indemnification in connection with a proceeding (or counterclaim) initiated by such persons; and |
| • | we will advance expenses, including attorneys’ fees, to our directors and, in the discretion of our board of directors, certain officers and employees, in connection with legal proceedings, subject to limited exceptions. |
Contemporaneous with the completion of this offering, we intend to enter into indemnification agreements with each of our executive officers and directors. These agreements provide that, subject to limited exceptions and among other things, we will indemnify each of our executive officers and directors to the fullest extent permitted by law and advance expenses to each indemnity in connection with any proceeding in which a right to indemnification is available.
We also intend to maintain general liability insurance that covers certain liabilities of our directors and officers arising out of claims based on acts or omissions in their capacities as directors or officers, including liabilities under the
113
Table of Contents
Securities Act. Insofar as indemnification for liabilities arising under the Securities Act may be permitted to directors, officers, or persons who control the Company, we have been informed that in the opinion of the SEC such indemnification is against public policy as expressed in the Securities Act and is therefore unenforceable.
These provisions may discourage shareholders from bringing a lawsuit against our directors for breach of their fiduciary duty. These provisions may also have the effect of reducing the likelihood of derivative litigation against directors and officers, even though such an action, if successful, might otherwise benefit us and our shareholders. Furthermore, a shareholder’s investment may be adversely affected to the extent we pay the costs of settlement and damage awards against directors and officers pursuant to these indemnification provisions. We believe that these provisions, the indemnification agreements and the insurance are necessary to attract and retain talented and experienced directors and officers.
At present, there is no pending litigation or proceeding involving any of our directors or officers where indemnification will be required or permitted. We are not aware of any threatened litigation or proceeding that might result in a claim for such indemnification.
Exchange listing
Before the date of this prospectus, there has been no public market for the common stock. We have applied to have our common stock approved for listing on the New York Stock Exchange, subject to notice of issuance, under the symbol “DTA.”
Transfer agent and registrar
The transfer agent and registrar for our common stock is .
114
Table of Contents
Shares Eligible for Future Sale
Upon the closing of this offering, we will have outstanding an aggregate of approximately shares of common stock. Of these shares, shares of common stock to be sold in this offering, or shares if the underwriters exercise their over-allotment option in full, will be freely tradable without restriction or further registration under the Securities Act, unless the shares are held by any of our affiliates, as that term is defined in Rule 144 of the Securities Act.
The holders of all of our currently outstanding stock are subject to lock-up agreements under which they have agreed not to transfer or dispose of, directly or indirectly, any shares of common stock or any securities convertible into or exercisable or exchangeable for shares of common stock, for a period of 180 days after the date of this prospectus, which is subject to extension in some circumstances, as discussed below.
In general, under Rule 144, an affiliate or a person who has been our affiliate within the previous 90 days, and who has beneficially owned shares of our common stock for at least six months, may sell within any three-month period a number of shares that does not exceed the greater of:
| • | one percent of the number of shares of common stock then outstanding, which will equal approximately shares immediately after this offering; and |
| • | the average weekly trading volume of our common stock during the four calendar weeks preceding the filing of a notice on Form 144 with respect to the sale. |
All sales under Rule 144 are subject to the availability of current public information about us. Sales under Rule 144 by affiliates or persons who have been affiliates within the previous 90 days are also subject to manner of sale provisions and notice requirements. Upon expiration of the 180-day lock-up period, subject to any extension of the lock-up period under circumstances described below, approximately shares of our outstanding restricted securities will be eligible for sale under Rule 144.
Registration statement on Form S-8
We intend to file a registration statement on Form S-8 under the Securities Act covering up to shares of common stock reserved for issuance under our Incentive Plan. This registration statement is expected to be filed soon after the date of this prospectus and will automatically become effective upon filing. Accordingly, shares registered under such registration statement will be available for sale in the open market, unless such shares are subject to vesting restrictions with us or are otherwise subject to the lock-up agreements and manner of sale and notice requirements that apply to affiliates under Rule 144 described above.
Lock-up agreements
For a description of the lock-up agreements with the underwriters that restrict sales of shares by us, or directors and executive officers and certain of our other employees and our sole shareholder, see the information under the heading “Underwriting.”
115
Table of Contents
Certain Material U.S. Federal Tax Consequences for Non-U.S. Holders of
Common Stock
The following is a general discussion of the material U.S. federal income and estate tax consequences to non-U.S. holders with respect to the acquisition, ownership and disposition of our common stock. In general, a “non-U.S. holder” is any holder of our common stock other than the following:
| • | a citizen or resident of the United States, including an alien individual who is a lawful permanent resident of the United States or meets the “substantial presence” test under section 7701(b)(3) of the Code; |
| • | a corporation (or an entity treated as a corporation) created or organized in the United States or under the laws of the United States, any state thereof, or the District of Columbia; |
| • | an estate, the income of which is subject to U.S. federal income tax regardless of its source; or |
| • | a trust, if (i) a U.S. court can exercise primary supervision over the administration of the trust and one or more U.S. persons can control all substantial decisions of the trust, or (ii) it has a valid election to be treated as a U.S. person in effect. |
This discussion is based on current provisions of the Code, Treasury Regulations promulgated under the Code, judicial opinions, published positions of the IRS and all other applicable authorities, all of which are subject to change, possibly with retroactive effect. This discussion does not address all aspects of U.S. federal income and estate taxation or any aspects of state, local, or non-U.S. taxation, nor does it consider any specific facts or circumstances that may apply to particular non-U.S. holders that may be subject to special treatment under the U.S. federal income tax laws, such as insurance companies, tax-exempt organizations, financial institutions, brokers, dealers in securities, and U.S. expatriates. If a partnership is a beneficial owner of our common stock, the treatment of a partner in the partnership will generally depend upon the status of the partner and the activities of the partnership. This discussion assumes that the non-U.S. holder will hold our common stock as a capital asset (generally property held for investment).
PROSPECTIVE INVESTORS ARE URGED TO CONSULT THEIR TAX ADVISORS REGARDING THE U.S. FEDERAL, STATE, LOCAL, AND NON-U.S. INCOME AND OTHER TAX CONSIDERATIONS OF ACQUIRING, HOLDING, AND DISPOSING OF SHARES OF COMMON STOCK.
Dividends
As described above under “Dividend Policy,” we do not anticipate declaring or paying any cash dividends on our common stock in the foreseeable future. However, if we do make distributions on our common stock, those payments will constitute dividends for U.S. tax purposes to the extent paid from our current or accumulated earnings and profits, as determined under U.S. federal income tax principles. To the extent those distributions exceed our current and accumulated earnings and profits, they will constitute a return of capital and will first reduce the recipient’s basis in our common stock, but not below zero, and then will be treated as gain from the sale of stock as described below under “– Gain on sale or other disposition of common stock.”
In general, dividends paid to a non-U.S. holder will be subject to U.S. withholding tax at a rate equal to 30% of the gross amount of the dividend, or a lower rate prescribed by an applicable income tax treaty, unless the dividends are effectively connected with a trade or business carried on by the non-U.S. holder within the United States (and, if required by an applicable tax treaty, are attributable to a U.S. permanent establishment maintained by the non-U.S.
116
Table of Contents
holder). Under applicable Treasury Regulations, a non-U.S. holder will be required to satisfy certain certification requirements, generally on IRS Form W-8BEN, directly or through an intermediary, in order to claim a reduced rate of withholding under an applicable income tax treaty. If tax is withheld in an amount in excess of the amount prescribed by an applicable income tax treaty, a refund of the excess amount may generally be obtained by timely filing an appropriate claim for refund with the IRS.
Dividends that are effectively connected with such a U.S. trade or business (and, if required by an applicable tax treaty, are attributable to a U.S. permanent establishment maintained by the recipient) generally will not be subject to U.S. withholding tax if the non-U.S. holder files the required forms, generally an IRS Form W-8ECI, or any successor form, with the payor of the dividend, but instead generally will be subject to U.S. federal income tax on a net income basis in the same manner as if the non-U.S. holder were a resident of the United States. A corporate non-U.S. holder that receives effectively connected dividends may be subject to an additional branch profits tax at a rate of 30%, or a lower rate prescribed by an applicable income tax treaty, with respect to effectively connected dividends (subject to adjustment).
Gain on sale or other disposition of common stock
In general, a non-U.S. holder will not be subject to U.S. federal income tax on any gain realized upon the sale or other taxable disposition of the non-U.S. holder’s shares of common stock unless:
| • | the gain is effectively connected with a trade or business carried on by the non-U.S. holder within the United States (and, if required by an applicable tax treaty, is attributable to a U.S. permanent establishment maintained by the non-U.S. holder); |
| • | the non-U.S. holder is an individual who holds shares of common stock as capital assets and is present in the United States for 183 days or more in the taxable year of disposition and various other conditions are met; or |
| • | our common stock constitutes a U.S. real property interest by reason of our status as a “United States real property holding corporation,” or USRPHC, for U.S. federal income tax purposes at any time within the shorter of the five-year period preceding the disposition or the non-U.S. holder’s holding period for our common stock. |
If the recipient is a non-U.S. holder described in the first bullet above, the recipient will be required to pay tax on the net gain derived from the sale under regular graduated U.S. federal income tax rates, and corporate non-U.S. holders described in the first bullet above may be subject to the branch profits tax at a 30% rate or such lower rate as may be specified by an applicable income tax treaty. If the recipient is an individual non-U.S. holder described in the second bullet above, the recipient will be required to pay a flat 30% tax on the gain derived from the sale, which tax may be offset by United States source capital losses.
We believe that we are not currently and will not become a USRPHC. However, because the determination of whether we are a USRPHC depends on the fair market value of our U.S. real property relative to the fair market value of our other business assets, there can be no assurance that we will not become a USRPHC in the future. Even if we become a USRPHC, however, as long as our common stock is regularly traded on an established securities market, such common stock will be treated as U.S. real property interests only if the non-U.S. holder actually or constructively held more than 5% of our common stock at any time during the shorter of the five-year period preceding the disposition or the non-U.S. holder’s holding period for our common stock.
117
Table of Contents
Information reporting and backup withholding
Generally, we must report annually to the IRS the amount of dividends paid, the name and address of the recipient, and the amount, if any, of tax withheld. A similar report is sent to the recipient. These information reporting requirements apply even if withholding was not required because the dividends were effectively connected dividends or withholding was reduced by an applicable income tax treaty. Under tax treaties or other agreements, the IRS may make its reports available to tax authorities in the recipient’s country of residence.
Dividend payments made to a non-U.S. holder that is not an exempt recipient generally will be subject to backup withholding, currently at a rate of 28%, unless a non-U.S. holder certifies as to its foreign status, which certification may be made on IRS Form W-8BEN.
Proceeds from the disposition of common stock by a non-U.S. holder effected by or through a United States office of a broker will be subject to information reporting and backup withholding, currently at a rate of 28% of the gross proceeds, unless the non-U.S. holder certifies to the payor under penalties of perjury as to, among other things, its address and status as a non-U.S. holder or otherwise establishes an exemption. Generally, United States information reporting and backup withholding will not apply to a payment of disposition proceeds if the transaction is effected outside the United States by or through a non-U.S. office of a broker. However, if the broker is, for U.S. federal income tax purposes, a U.S. person, a controlled foreign corporation, a foreign person who derives 50% or more of its gross income for specified periods from the conduct of a U.S. trade or business, specified U.S. branches of foreign banks or insurance companies or a foreign partnership with certain connections to the United States, information reporting but not backup withholding will apply unless:
| • | the broker has documentary evidence in its files that the holder is a non-U.S. holder and other conditions are met; or |
| • | the holder otherwise establishes an exemption. |
Backup withholding is not an additional tax. Rather, the amount of tax withheld is applied to the U.S. federal income tax liability of persons subject to backup withholding. If backup withholding results in an overpayment of U.S. federal income taxes, a refund may be obtained, provided the required documents are timely filed with the IRS.
Estate tax
Our common stock owned or treated as owned by an individual who is not a citizen or resident of the United States (as specifically defined for U.S. federal estate tax purposes) at the time of death will be includible in the individual’s gross estate for U.S. federal estate tax purposes, unless an applicable estate tax treaty provides otherwise.
118
Table of Contents
Jefferies & Company, Inc. and Stephens Inc. are acting as representatives of each of the underwriters named below. Subject to the terms and conditions set forth in an underwriting agreement among us and the underwriters, we have agreed to sell to the underwriters, and each of the underwriters has agreed, severally and not jointly, to purchase from us, the number of shares of common stock set forth opposite its name below.
| Underwriter | Number of Shares | |||
| Jefferies & Company, Inc. |
||||
| Stephens Inc. |
||||
| Total |
||||
Subject to the terms and conditions set forth in the underwriting agreement, the underwriters have agreed, severally and not jointly, to purchase all of the shares sold under the underwriting agreement if any of these shares are purchased. If an underwriter defaults, the underwriting agreement provides that the purchase commitments of the nondefaulting underwriters may be increased or the underwriting agreement may be terminated.
We have agreed to indemnify the underwriters against certain liabilities, including liabilities under the Securities Act, or to contribute to payments the underwriters may be required to make in respect of those liabilities.
The underwriters are offering the shares, subject to prior sale, when, as and if issued to and accepted by them, subject to approval of legal matters by their counsel, including the validity of the shares, and other conditions contained in the underwriting agreement, such as the receipt by the underwriters of officer’s certificates and legal opinions. The underwriters reserve the right to withdraw, cancel, or modify offers to the public and to reject orders in whole or in part.
Commissions and discounts
The representatives have advised us that the underwriters propose initially to offer the shares to the public at the public offering price set forth on the cover page of this prospectus and to dealers at that price less a concession not in excess of $ per share. The underwriters may allow, and the dealers may reallow, a discount not in excess of $ per share to other dealers. After the initial offering, the public offering price, concession or any other term of the offering may be changed.
The following table shows the public offering price, underwriting discount, and proceeds before expenses to us. The information assumes either no exercise or full exercise by the underwriters of their over-allotment option.
| Per Share | Without Option | With Option | ||||
| Public offering price |
||||||
| Underwriting discount |
||||||
| Proceeds, before expenses, to DriveTime |
The expenses of the offering, not including the underwriting discount, are estimated at $ and are payable by us.
119
Table of Contents
Over-allotment option
We have granted an option to the underwriters to purchase up to additional shares at the public offering price, less underwriting discounts and commissions. The underwriters may exercise this option for 30 days from the date of this prospectus solely to cover any over-allotments. If the underwriters exercise this option, each will be obligated, subject to conditions contained in the underwriting agreement, to purchase a number of additional shares proportionate to that underwriter’s initial amount reflected in the above table.
No sales of similar securities
We, our executive officers, and directors and our sole shareholder have agreed not to sell or transfer any common stock or securities convertible into, exchangeable for, exercisable for, or repayable with common stock, for 180 days after the date of this prospectus without first obtaining the written consent of Jefferies & Company, Inc. and Stephens Inc. Specifically, we and these other persons have agreed, with certain limited exceptions, not to directly or indirectly:
| • | offer, pledge, sell, or contract to sell any common stock, |
| • | sell any option or contract to purchase any common stock, |
| • | purchase any option or contract to sell any common stock, |
| • | grant any option, right, or warrant for the sale of any common stock, |
| • | lend or otherwise dispose of or transfer any common stock, |
| • | request or demand that we file a registration statement related to the common stock, or |
| • | enter into any swap or other agreement that transfers, in whole or in part, the economic consequence of ownership of any common stock whether any such swap or transaction is to be settled by delivery of shares or other securities, in cash or otherwise. |
This lock-up provision applies to common stock and to securities convertible into or exchangeable or exercisable for or repayable with common stock. It also applies to common stock owned now or acquired later by the person executing the agreement or for which the person executing the agreement later acquires the power of disposition. In the event that either (x) during the last 17 days of lock-up period referred to above, we issue an earnings release or material news or a material event relating to us occurs or (y) prior to the expiration of the lock-up period, we announce that we will release earnings results or become aware that material news or a material event will occur during the 16-day period beginning on the last day of the lock-up period, the restrictions described above shall continue to apply until the expiration of the 18-day period beginning on the issuance of the earnings release or the occurrence of the material news or material event.
Exchange
We have applied to list our common stock on the New York Stock Exchange under the symbol “DTA.”
Price stabilization, short positions
Until the distribution of the shares is completed, SEC rules may limit underwriters and selling group members from bidding for and purchasing our common stock. However, the representatives may engage in transactions that stabilize the price of the common stock, such as bids or purchases to peg, fix, or maintain that price.
120
Table of Contents
In connection with the offering, the underwriters may purchase and sell our common stock in the open market. These transactions may include short sales, purchases on the open market to cover positions created by short sales and stabilizing transactions. Short sales involve the sale by the underwriters of a greater number of shares than they are required to purchase in the offering. “Covered” short sales are sales made in an amount not greater than the underwriters’ option to purchase additional shares in the offering. The underwriters may close out any covered short position by either exercising their over-allotment option or purchasing shares in the open market. In determining the source of shares to close out the covered short position, the underwriters will consider, among other things, the price of shares available for purchase in the open market as compared to the price at which they may purchase shares through the over-allotment option. “Naked” short sales are sales in excess of the over-allotment option. The underwriters must close out any naked short position by purchasing shares in the open market. A naked short position is more likely to be created if the underwriters are concerned that there may be downward pressure on the price of our common stock in the open market after pricing that could adversely affect investors who purchase in the offering. Stabilizing transactions consist of various bids for or purchases of shares of common stock made by the underwriters in the open market prior to the completion of the offering.
Similar to other purchase transactions, the underwriters’ purchases to cover the syndicate short sales may have the effect of raising or maintaining the market price of our common stock or preventing or delaying a decline in the market price of our common stock. As a result, the price of our common stock may be higher than the price that might otherwise exist in the open market.
Neither we nor any of the underwriters make any representation or prediction as to the direction or magnitude of any effect that the transactions described above may have on the price of our common stock. In addition, neither we nor any of the underwriters make any representation that the representatives will engage in these transactions or that these transactions, once commenced, will not be discontinued without notice.
Electronic offer, sale, and distribution of shares
In connection with the offering, certain of the underwriters or securities dealers may distribute prospectuses by electronic means, such as e-mail. In addition, certain of the underwriters may facilitate internet distribution for this offering to certain of its internet subscription customers and may allocate a limited number of shares for sale to its online brokerage customers. An electronic prospectus may be available on the respective internet website maintained by certain of the underwriters. Other than the prospectus in electronic format, the information on these websites is not part of this prospectus.
Other relationships
Some of the underwriters and their affiliates have engaged in, and may in the future engage in, investment banking and other commercial dealings in the ordinary course of business with us or our affiliates. They have received, or may in the future receive, customary fees and commissions for these transactions.
Notice to prospective investors in the EEA
In relation to each Member State of the European Economic Area which has implemented the Prospectus Directive (each, a “Relevant Member State”) an offer to the public of any shares which are the subject of the offering contemplated by this prospectus may not be made in that Relevant Member State, except that an offer to the public
121
Table of Contents
in that Relevant Member State of any shares may be made at any time under the following exemptions under the Prospectus Directive, if they have been implemented in that Relevant Member State:
| (a) | to legal entities which are authorized or regulated to operate in the financial markets or, if not so authorized or regulated, whose corporate purpose is solely to invest in securities; |
| (b) | to any legal entity which has two or more of (1) an average of at least 250 employees during the last financial year; (2) a total balance sheet of more than €43,000,000 and (3) an annual net turnover of more than €50,000,000, as shown in its last annual or consolidated accounts; |
| (c) | by the underwriters to fewer than 100 natural or legal persons (other than “qualified investors” as defined in the Prospectus Directive) subject to obtaining the prior consent of the representatives for any such offer; or |
| (d) | in any other circumstances falling within Article 3(2) of the Prospectus Directive; |
provided that no such offer of shares shall result in a requirement for the publication by us or any representative of a prospectus pursuant to Article 3 of the Prospectus Directive.
Any person making or intending to make any offer of shares within the EEA should only do so in circumstances in which no obligation arises for us or any of the underwriters to produce a prospectus for such offer. Neither we nor the underwriters have authorized, nor do they authorize, the making of any offer of shares through any financial intermediary, other than offers made by the underwriters which constitute the final offering of shares contemplated in this prospectus.
For the purposes of this provision, and your representation below, the expression an “offer to the public” in relation to any shares in any Relevant Member State means the communication in any form and by any means of sufficient information on the terms of the offer and any shares to be offered so as to enable an investor to decide to purchase any shares, as the same may be varied in that Relevant Member State by any measure implementing the Prospectus Directive in that Relevant Member State and the expression “Prospectus Directive” means Directive 2003/71/EC and includes any relevant implementing measure in each Relevant Member State.
Each person in a Relevant Member State who receives any communication in respect of, or who acquires any shares under, the offer of shares contemplated by this prospectus will be deemed to have represented, warranted and agreed to and with us and each underwriter that:
| (a) | it is a “qualified investor” within the meaning of the law in that Relevant Member State implementing Article 2(1)(e) of the Prospectus Directive; and |
| (b) | in the case of any shares acquired by it as a financial intermediary, as that term is used in Article 3(2) of the Prospectus Directive, (i) the shares acquired by it in the offering have not been acquired on behalf of, nor have they been acquired with a view to their offer or resale to, persons in any Relevant Member State other than “qualified investors” (as defined in the Prospectus Directive), or in circumstances in which the prior consent of the representatives has been given to the offer or resale; or (ii) where shares have been acquired by it on behalf of persons in any Relevant Member State other than qualified investors, the offer of those shares to it is not treated under the Prospectus Directive as having been made to such persons. |
122
Table of Contents
Notice to prospective investors in Switzerland
This document, as well as any other material relating to the shares which are the subject of the offering contemplated by this prospectus, do not constitute an issue prospectus pursuant to Article 652a of the Swiss Code of Obligations. The shares will not be listed on the SWX Swiss Exchange and, therefore, the documents relating to the shares, including, but not limited to, this document, do not claim to comply with the disclosure standards of the listing rules of SWX Swiss Exchange and corresponding prospectus schemes annexed to the listing rules of the SWX Swiss Exchange. The shares are being offered in Switzerland by way of a private placement, i.e. to a small number of selected investors only, without any public offer and only to investors who do not purchase the shares with the intention to distribute them to the public. The investors will be individually approached by us from time to time. This document, as well as any other material relating to the shares, is personal and confidential and do not constitute an offer to any other person. This document may only be used by those investors to whom it has been handed out in connection with the offering described herein and may neither directly nor indirectly be distributed or made available to other persons without our express consent. It may not be used in connection with any other offer and shall in particular not be copied and/or distributed to the public in (or from) Switzerland.
Notice to prospective investors in the Dubai International Financial Centre
This document relates to an exempt offer in accordance with the Offered Securities Rules of the Dubai Financial Services Authority. This document is intended for distribution only to persons of a type specified in those rules. It must not be delivered to, or relied on by, any other person. The Dubai Financial Services Authority has no responsibility for reviewing or verifying any documents in connection with exempt offers. The Dubai Financial Services Authority has not approved this document nor taken steps to verify the information set out in it, and has no responsibility for it. The shares which are the subject of the offering contemplated by this prospectus may be illiquid and/or subject to restrictions on their resale. Prospective purchasers of the shares offered should conduct their own due diligence on the shares. If you do not understand the contents of this document you should consult an authorised financial adviser.
123
Table of Contents
The validity of the shares of common stock offered by this prospectus and other legal matters will be passed upon for us by DLA Piper LLP (US), Phoenix, Arizona. The underwriters have been represented by Davis Polk & Wardwell LLP, New York, New York.
The financial statements included in this prospectus and elsewhere in the registration statement have been so included in reliance upon the reports of Grant Thornton LLP, independent registered public accountants, upon the authority of said firm as experts in giving said reports.
Where You Can Find More Information
We have filed with the SEC a registration statement on Form S-1, which includes amendments and exhibits, under the Securities Act and the rules and regulations under the Securities Act for the registration of common stock being offered by this prospectus. This prospectus, which constitutes a part of the registration statement, does not contain all the information that is in the registration statement and its exhibits and schedules. Certain portions of the registration statement have been omitted as allowed by the rules and regulations of the SEC. Statements in this prospectus that summarize documents are not necessarily complete, and in each case you should refer to the copy of the document filed as an exhibit to the registration statement. You may read and copy the registration statement, including exhibits and schedules filed with it, and reports or other information we may file with the SEC at the public reference facilities of the SEC at 100 F Street, N.E., Room 1580, Washington, D.C. 20549. You may call the SEC at 1-800-SEC-0330 for further information on the operation of the public reference rooms. In addition, the registration statement and other public filings can be obtained from the SEC’s internet site at http://www.sec.gov.
Upon completion of this offering, we will become subject to information and periodic reporting requirements of the Exchange Act and we will file annual, quarterly and current reports, proxy statements, and other information with the SEC.
124
Table of Contents
Unless the context otherwise requires, the terms “we,” “us,” “our,” and “DriveTime” refer to DriveTime Automotive, Inc. and its wholly-owned subsidiaries, DriveTime Automotive Group Inc. and DT Acceptance Corporation and their respective wholly-owned subsidiaries. In addition, in this prospectus, each of the following terms have the meanings set forth after such term:
| Advance rate |
A percentage of collateral that determines the loan amount that a lender will issue to a company. For example, if a company has an asset worth $1,000 and an advance rate of 70%, the lender would issue a loan of up to $700. |
| APR |
Annual percentage rate, which, for DriveTime, is the annual interest rate payable on the loans we originate. |
| ASC |
Accounting Standard Codification. |
| Close rate |
Close rate percentage represents the percentage of customer applications for credit that result in sales of used vehicles. |
| CNW |
CNW Marketing/Research, Inc., which is a third-party research firm focused on the automotive, home electronics, housing, investment, and computer industries. |
| Code |
Internal Revenue Code of 1986, as amended. |
| DGCL |
Delaware General Corporation Law. |
| DTAC |
DT Acceptance Corporation, an Arizona corporation, which is the entity under which we have historically conducted our financing activities. |
| DTAG |
DriveTime Automotive Group, Inc., a Delaware corporation, which is the entity under which we have historically conducted our vehicle sale activities. |
| Exchange Act |
Securities Exchange Act of 1934, as amended. |
| FICO score |
A metric developed by Fair Isaac & Co. to measure the creditworthiness of a person or the likelihood that person will repay his or her debts. |
| GAAP |
Accounting principles generally accepted in the United States. |
| Incentive Plan |
2010 Equity Incentive Plan. |
| Installment payments |
Refers to the periodic payments customers make on the loans we finance. |
| Internet-related sales |
We define internet-related sales as those sales where a credit application was completed over the internet within three months of the sale. Internet-related sales are a component of revenue from the sale of used vehicles. |
A-1
Table of Contents
| IRS |
Internal Revenue Service. |
| LIBOR |
The London Interbank Offered Rate, which is a daily reference rate based on the interest rates at which banks borrow unsecured funds from other banks in the London wholesale money market. |
| Loan |
The retail installment sales contracts through which we provide financing for our vehicle sales. |
| Monoline insurer |
An insurer that guarantees the timely repayment of bond principal and interest when an issuer defaults. |
| PALP |
Our “pooled auto loan program,” which has become a primary source of fixed-rate financing for our finance receivable portfolio, supplementing and/or replacing securitizations. PALP refers generally to one of several ways in which we finance our receivables. |
| Portfolio term financing |
Term financing arrangements based on our portfolio of receivables, including PALP and securitization transactions. |
| Portfolio warehouse facility |
A revolving credit facility that is secured by contracts underlying the receivables we generate when we finance the sale of a vehicle. |
| Repurchase facility |
A credit facility that is utilized to finance the repurchase or holding of notes that had been issued in our securitizations. |
| Residual facility |
Refers to a revolving credit facility that we cancelled in December 2008 that was secured by the residual interests in our securitization trusts. |
| Revolving inventory facility |
A revolving credit facility that is secured by our inventory of vehicles. |
| Same store sales |
A store is included in same store sales in the store’s fifteenth full month of operation. Stores closed in a comparative period are removed from same store comparisons. |
| Sarbanes-Oxley Act |
Sarbanes-Oxley Act of 2002. |
A-2
Table of Contents
| SEC |
Securities and Exchange Commission. |
| Securities Act |
Securities Act of 1933, as amended. |
| Sole shareholder |
Prior to completion of this offering, all of our outstanding shares of common stock were owned by the Ernest C. Garcia III Multi-Generational Trust and the Brian Garcia Multi-Generational Trust, Ernest C. Garcia II and Elizabeth Joanne Garcia, and the Ernest Irrevocable 2004 Trust and Brian Irrevocable 2004 Trust. Although Ernest C. Garcia II is not the trustee of the Ernest C. Garcia III and Brian Garcia 2000 Trust or the Ernest Irrevocable 2004 Trust and Brian Irrevocable 2004 Trust, his children are the beneficiaries of such trusts and Mr. Garcia has the ability to direct the vote with respect to the trusts. As such, Mr. Garcia is deemed to have beneficial ownership over such shares. When we refer to our sole shareholder, we are referring to Ernest C. Garcia II. |
| Subprime market |
The market for loan originations to customers with FICO scores of 620 or 630 or below, depending on the source. |
| Verde |
Verde Investments, Inc., an Arizona corporation that is wholly-owned by Ernest C. Garcia II. References to Verde also include the Garcia Family Limited Liability Partnership, LLP, as more fully described in Certain Relationships and Related Party Transactions. |
A-3
Table of Contents
Index to Combined Financial Statements
| Page | ||
| F-2 | ||
| F-3 | ||
| F-4 | ||
| F-5 | ||
| F-6 | ||
| F-8 |
F-1
Table of Contents
Report of Independent Registered Public Accounting Firm
Board of Directors and Shareholder
DriveTime Automotive, Inc
We have audited the accompanying combined balance sheets of DriveTime Automotive, Inc., DriveTime Automotive Group, Inc. and DT Acceptance Corporation and their subsidiaries (collectively the “Company”) as of December 31, 2009 and 2008, and the related combined statements of income, shareholder’s equity, and cash flows for each of the three years in the period ended December 31, 2009. These combined financial statements are the responsibility of the Company’s management. Our responsibility is to express an opinion on these combined financial statements based on our audits.
We conducted our audits in accordance with the standards of the Public Company Accounting Oversight Board (United States). Those standards require that we plan and perform the audit to obtain reasonable assurance about whether the combined financial statements are free of material misstatement. The Company is not required to have, nor were we engaged to perform an audit of its internal control over financial reporting. Our audit included consideration of internal control over financial reporting as a basis for designing audit procedures that are appropriate in the circumstances, but not for the purpose of expressing an opinion on the effectiveness of the Company’s internal control over financial reporting. Accordingly, we express no such opinion. An audit also includes examining, on a test basis, evidence supporting the amounts and disclosures in the combined financial statements, assessing the accounting principles used and significant estimates made by management, as well as evaluating the overall financial statement presentation. We believe that our audits provide a reasonable basis for our opinion.
In our opinion, the combined financial statements referred to above present fairly, in all material respects, the combined financial position of DriveTime Automotive, Inc., DriveTime Automotive Group, Inc. and DT Acceptance Corporation and their subsidiaries as of December 31, 2009 and 2008, and the results of their operations and their cash flows for each of the three years in the period ended December 31, 2009, in conformity with accounting principles generally accepted in the United States of America.
/s/ GRANT THORNTON LLP
Phoenix, Arizona
March 19, 2010
F-2
Table of Contents
Combined Balance Sheets
As of the Years Ended December 31, 2008 and 2009
| December 31, | ||||||||
| 2008 | 2009 | |||||||
| ($ in thousands) | ||||||||
| ASSETS |
||||||||
| Cash and Cash Equivalents |
$ | 25,533 | $ | 21,526 | ||||
| Restricted Cash and Investments Held in Trust |
71,223 | 84,064 | ||||||
| Finance Receivables |
1,375,019 | 1,340,591 | ||||||
| Allowance for Credit Losses |
(242,600 | ) | (218,259 | ) | ||||
| Finance Receivables, Net |
1,132,419 | 1,122,332 | ||||||
| Inventory |
100,211 | 115,257 | ||||||
| Property and Equipment, Net |
56,324 | 56,219 | ||||||
| Goodwill |
11,569 | 11,569 | ||||||
| Other Assets |
49,873 | 37,527 | ||||||
| Total Assets |
$ | 1,447,152 | $ | 1,448,494 | ||||
| LIABILITIES & SHAREHOLDER’S EQUITY |
||||||||
| Liabilities: |
||||||||
| Accounts Payable |
$ | 4,712 | $ | 5,060 | ||||
| Accrued Expenses and Other Liabilities |
46,330 | 42,327 | ||||||
| Accrued Expenses – Related Party |
6,621 | 4,333 | ||||||
| Portfolio Warehouse Facilities |
398,093 | 77,506 | ||||||
| Portfolio Term Financings |
334,529 | 795,857 | ||||||
| Other Secured Notes Payable |
153,579 | 75,277 | ||||||
| Other Secured Notes Payable – Related Party |
26,000 | 62,088 | ||||||
| Senior Unsecured Notes Payable |
88,964 | 1,487 | ||||||
| Senior Unsecured Notes Payable – Related Party |
30,902 | — | ||||||
| Subordinated Notes Payable – Related Party |
75,000 | 75,000 | ||||||
| Total Liabilities |
1,164,730 | 1,138,935 | ||||||
| Shareholder’s Equity: |
||||||||
| Common Stock: DTA – par value $0.001, 1,000 shares authorized, 100 shares issued and outstanding; DTAG – par value $0.001 per share, 1,000 shares authorized, 100 shares issued and outstanding; DTAC – no par value, 1,000,000 shares authorized, 100 shares issued and outstanding. |
— | — | ||||||
| Paid-in Capital |
138,418 | 138,418 | ||||||
| Retained Earnings |
144,004 | 171,141 | ||||||
| Total Shareholder’s Equity |
282,422 | 309,559 | ||||||
| Total Liabilities & Shareholder’s Equity |
$ | 1,447,152 | $ | 1,448,494 | ||||
See accompanying notes to Combined Financial Statements.
F-3
Table of Contents
Combined Statements of Income
For the Years Ended December 31, 2007, 2008, and 2009
| Years Ended December 31, | |||||||||||
| 2007 | 2008 | 2009 | |||||||||
| ($ in thousands, except for earnings per share) |
|||||||||||
| Revenue: |
|||||||||||
| Sales of Used Vehicles |
$ | 963,621 | $ | 796,750 | $ | 694,460 | |||||
| Interest Income |
250,628 | 261,875 | 251,822 | ||||||||
| Total Revenue |
1,214,249 | 1,058,625 | 946,282 | ||||||||
| Costs and Expenses: |
|||||||||||
| Cost of Used Vehicles Sold |
575,234 | 477,255 | 394,362 | ||||||||
| Provision for Credit Losses |
283,407 | 300,884 | 223,686 | ||||||||
| Secured Debt Interest Expense |
63,719 | 74,129 | 86,142 | ||||||||
| Secured Debt Interest Expense – Related Party |
— | 620 | 8,895 | ||||||||
| Unsecured Debt Interest Expense |
12,982 | 13,170 | 3,781 | ||||||||
| Unsecured Debt Interest Expense – Related Party |
— | 9,163 | 11,848 | ||||||||
| Selling and Marketing |
36,210 | 28,644 | 31,491 | ||||||||
| General and Administrative |
143,692 | 145,447 | 137,657 | ||||||||
| General and Administrative – Related Party |
10,326 | 11,864 | 10,693 | ||||||||
| Depreciation Expense |
15,784 | 14,088 | 13,061 | ||||||||
| Gain on Extinguishment of Debt, net |
— | (19,699 | ) | (31,559 | ) | ||||||
| Loss on Extinguishment of Debt, net – Related Party |
— | — | 1,248 | ||||||||
| Total Costs and Expenses |
1,141,354 | 1,055,565 | 891,305 | ||||||||
| Income before Income Taxes |
72,895 | 3,060 | 54,977 | ||||||||
| Income Tax Expense |
1,000 | 1,090 | 730 | ||||||||
| Net Income |
$ | 71,895 | $ | 1,970 | $ | 54,247 | |||||
| Earnings Per Share: |
|||||||||||
| Basic |
$ | 718.95 | $ | 19.70 | $ | 542.47 | |||||
| Diluted |
$ | 718.95 | $ | 19.70 | $ | 542.47 | |||||
| Dividends Per Share: |
|||||||||||
| Basic |
$ | 511.94 | $ | 127.33 | $ | 271.10 | |||||
| Diluted |
$ | 511.94 | $ | 127.33 | $ | 271.10 | |||||
| Weighted average number of shares outstanding: |
|||||||||||
| Basic |
100 | 100 | 100 | ||||||||
| Diluted |
100 | 100 | 100 | ||||||||
| Pro Forma Information (unaudited): |
|||||||||||
| Historical Income before Income Tax Expense (Benefit) |
72,895 | 3,060 | 54,977 | ||||||||
| Pro forma provision for income taxes |
29,092 | 1,701 | 21,852 | ||||||||
| Net Income Adjusted for income tax expense |
$ | 43,803 | $ | 1,359 | $ | 33,125 | |||||
See accompanying notes to Combined Financial Statements.
F-4
Table of Contents
Combined Statements of Shareholder’s Equity
Years Ended December 31, 2007, 2008, and 2009
| Common Stock | Paid In Capital | Retained Earnings |
Total Shareholder’s Equity |
||||||||||
| ($ in thousands) |
|||||||||||||
| Balances, December 31, 2006 |
$ — | $ | 138,418 | $ | 134,066 | $ | 272,484 | ||||||
| Net Income for the Year |
— | — | 71,895 | 71,895 | |||||||||
| Dividends paid |
— | — | (51,194 | ) | (51,194 | ) | |||||||
| Balances, December 31, 2007 |
$ — | $ | 138,418 | $ | 154,767 | $ | 293,185 | ||||||
| Net Income for the Year |
— | — | 1,970 | 1,970 | |||||||||
| Dividends |
— | — | (12,733 | ) | (12,733 | ) | |||||||
| Balances, December 31, 2008 |
$ — | $ | 138,418 | $ | 144,004 | $ | 282,422 | ||||||
| Net Income for the Year |
— | — | 54,247 | 54,247 | |||||||||
| Dividends |
— | — | (27,110 | ) | (27,110 | ) | |||||||
| Balances, December 31, 2009 |
$ — | $ | 138,418 | $ | 171,141 | $ | 309,559 | ||||||
See accompanying notes to Combined Financial Statements.
F-5
Table of Contents
Combined Statements of Cash Flows
For the Years Ended December 31, 2007, 2008, and 2009
| Years Ended December 31, | ||||||||||||
| 2007 | 2008 | 2009 | ||||||||||
| ($ in thousands) | ||||||||||||
| Cash Flows from Operating Activities: |
||||||||||||
| Net Income |
$ | 71,895 | $ | 1,970 | $ | 54,247 | ||||||
| Adjustments to Reconcile Net Income to Net Cash Provided by Operating Activities: |
||||||||||||
| Provision for Credit Losses |
283,407 | 300,884 | 223,686 | |||||||||
| Depreciation Expense |
15,784 | 14,088 | 13,061 | |||||||||
| Amortization of Debt Issuance Costs and Debt Premium and Discount |
5,438 | 16,822 | 14,701 | |||||||||
| (Gain) Loss from Disposal of Property and Equipment |
(924 | ) | 3,557 | (121 | ) | |||||||
| Abandonment loss on Capitalized Real Estate and IT Projects |
1,326 | 64 | — | |||||||||
| Increase in Finance Receivables |
(959,517 | ) | (789,360 | ) | (686,214 | ) | ||||||
| Collections and recoveries on Finance Receivables Principal |
489,235 | 487,272 | 468,826 | |||||||||
| Changes in Accrued Interest Receivable and Loan Origination Costs |
(7,691 | ) | 712 | 3,789 | ||||||||
| (Increase) Decrease in Inventory |
(14,182 | ) | 36,431 | (15,046 | ) | |||||||
| (Increase) Decrease in Other Assets |
(2,377 | ) | (1,254 | ) | 14,325 | |||||||
| Decrease in Accounts Payable, Accrued Expenses and Other Liabilities |
(17,903 | ) | (17,711 | ) | (3,479 | ) | ||||||
| Increase (Decrease) in Accrued Expenses – Related Party |
— | 6,621 | (2,288 | ) | ||||||||
| Increase in Income Taxes Payable |
(463 | ) | (108 | ) | (176 | ) | ||||||
| Net Cash (Used In) Provided By Operating Activities |
(135,972 | ) | 59,988 | 85,311 | ||||||||
| Cash Flows from Investing Activities: |
||||||||||||
| Proceeds from Disposal of Property and Equipment |
10,130 | 913 | 469 | |||||||||
| Purchase of Property and Equipment |
(21,604 | ) | (7,229 | ) | (13,304 | ) | ||||||
| Net Cash Used in Investing Activities |
(11,474 | ) | (6,316 | ) | (12,835 | ) | ||||||
| Cash Flows from Financing Activities: |
||||||||||||
| Decrease (Increase) in Restricted Cash |
640 | (3,701 | ) | (11,846 | ) | |||||||
| Deposits into Investments Held in Trust |
(25,166 | ) | (28,834 | ) | (4,467 | ) | ||||||
| Collections, Buybacks and Change in Investments Held in Trust |
33,862 | 68,583 | 3,472 | |||||||||
| Decrease in Investments Held in Trust pre-fund balance |
14,614 | — | — | |||||||||
| Additions to Portfolio Warehouse Facilities |
940,480 | 1,083,126 | 968,112 | |||||||||
| Repayment of Portfolio Warehouse Facilities |
(694,442 | ) | (993,447 | ) | (1,288,699 | ) | ||||||
| Additions to Portfolio Term Financings |
320,000 | 157,007 | 811,617 | |||||||||
| Repayment of Portfolio Term Financings |
(465,795 | ) | (437,541 | ) | (350,181 | ) | ||||||
| Additions to Other Secured Notes Payable |
256,820 | 266,721 | 80,701 | |||||||||
| Additions to Other Secured Notes Payable – Related Party |
— | 31,000 | — | |||||||||
| Repayment of Other Secured Notes Payable |
(231,746 | ) | (227,856 | ) | (122,915 | ) | ||||||
| Repayment of Other Secured Notes Payable – Related Party |
— | (5,000 | ) | — | ||||||||
| Additions to Senior Unsecured Notes Payable |
54,149 | — | — | |||||||||
| Repayment of Senior Unsecured Notes Payable |
— | (13,000 | ) | (90,000 | ) | |||||||
| Repayment of Senior Unsecured Notes Payable – Related Party |
— | — | (32,000 | ) | ||||||||
| Additions to Subordinated Notes Payable – Related Party |
— | 75,000 | — | |||||||||
F-6
Table of Contents
| Years Ended December 31, | ||||||||||||
| 2007 | 2008 | 2009 | ||||||||||
| ($ in thousands) | ||||||||||||
| Payment of Debt Issuance Costs |
(4,018 | ) | (29,705 | ) | (13,167 | ) | ||||||
| Dividend Distributions |
(51,194 | ) | (12,733 | ) | (27,110 | ) | ||||||
| Net Cash Provided By (Used In) Financing Activities |
148,204 | (70,380 | ) | (76,483 | ) | |||||||
| Net Increase (Decrease) in Cash and Cash Equivalents |
758 | (16,708 | ) | (4,007 | ) | |||||||
| Cash and Cash Equivalents at Beginning of Period |
41,483 | 42,241 | 25,533 | |||||||||
| Cash and Cash Equivalents at End of Period |
$ | 42,241 | $ | 25,533 | $ | 21,526 | ||||||
| Supplemental Statement of Cash Flow Information: |
||||||||||||
| Interest Paid |
$ | 72,089 | $ | 89,374 | $ | 96,401 | ||||||
| Interest Paid – Related Party |
$ | — | $ | 5,282 | $ | 23,125 | ||||||
| Income Taxes Paid |
$ | 1,463 | $ | 1,198 | $ | 906 | ||||||
| Supplemental Statement of Non-Cash Investing and Financing Activities: |
||||||||||||
| Purchase of Property and Equipment Under Capital Lease |
$ | — | $ | 48 | $ | 625 | ||||||
| Disposal of Fully Depreciated Property & Equipment |
$ | 5,745 | $ | 13,676 | $ | 5,241 | ||||||
| Gain on Extinguishment of Debt, Net |
$ | — | $ | 19,699 | $ | 31,559 | ||||||
| Loss on Extinguishment of Debt, Net – Related Party |
$ | — | $ | — | $ | (1,248 | ) | |||||
See accompanying notes to Combined Financial Statements.
F-7
Table of Contents
Notes to Combined Financial Statements
(1) Description of Business, Ownership Formation, Basis of Presentation, and Principles of Consolidation
Description of Business. DriveTime Automotive, Inc. (DTA), DriveTime Automotive Group, Inc., (DTAG) and DT Acceptance Corporation (DTAC) (collectively “we,” “our,” and “us”), through wholly-owned subsidiaries, own and operate used automobile dealerships in the United States focusing on the sale and financing of used vehicles to the subprime market. The subprime market is comprised of customers with modest incomes who have experienced credit difficulties or have very limited credit histories. We finance substantially all the vehicles we sell through installment sales contracts (“loans”). We do not sell our loans to third party lenders or finance companies on a servicing released basis and, unlike pure finance companies, we do not purchase finance receivables from other sources. We have historically funded this portfolio primarily through portfolio warehouse facilities and portfolio term financings.
Ownership Formation.
DTA is a newly formed Delaware corporation that was incorporated in December 2009. Pursuant to a reorganization transaction that will be consummated immediately prior to the effectiveness of the Registration Statement on Form S-1 of which this prospectus forms a part, DTA will become the holding company under which we will conduct our operations through two primary operating subsidiaries, DTAG, which was incorporated in Arizona in 1992 and reincorporated in Delaware in 1996 and focuses on vehicle sales activities, and DTAC, which was incorporated in Arizona in 2003 as a sister company to DTAG and focuses on financing activities. This reorganization transaction will serve to consolidate our businesses under a single holding company to facilitate an initial public offering of the common stock of DTA. Upon the consummation of the reorganization transaction, the sole shareholder of DTAG and DTAC, Ernest C. Garcia II, will become the sole stockholder of DriveTime Automotive, pending the completion of the offering contemplated hereby. The transaction will be accounted for as a reorganization of entities under common control and not as a merger or acquisition. DTAG and DTAC will be co-predecessors of DTA.
In January 2004, DTAG elected S-corporation status for income tax purposes. DTAC is also an S-corporation for income tax purposes. Prior to January 4, 2008, the direct shareholders of DTAG and DTAC were Ernest C. Garcia II (Chairman) and the Garcia Family Trusts collectively owning 95%, and Raymond C. Fidel (President and CEO) owning 5%. Effective January 4, 2008, Mr. Garcia purchased Mr. Fidel’s 5% interest in DTAG and DTAC. With this purchase, Mr. Garcia and the Garcia Family Trusts (Principal Shareholder) now own 100% of DTAG and DTAC.
Basis of Presentation. The accompanying combined financial statements include the accounts of DTA, DTAG and DTAC and their wholly-owned subsidiaries. Also included in the combined financial statements are wholly-owned special purpose subsidiaries, which are all “bankruptcy remote subsidiaries” formed in conjunction with our securitizations and other secured financing transactions. The assets of these special purpose subsidiaries secure the asset-backed securities or notes issued in conjunction with these transactions and generally would not be available to satisfy claims of our other creditors. Also included in the combined financial statements is a special purpose entity formed specifically for the purpose of our lending relationship on one of our portfolio warehouse facilities. See Note 7 – Debt Obligations for further information regarding assets and liabilities of these subsidiaries.
F-8
Table of Contents
Principles of Combination. The accompanying combined financial statements represent the combined financial information for DTA and its subsidiaries DTAG and DTAC. The financial position and results of operations of these two entities are combined since these entities are wholly-owned by a principal shareholder and engage in significant intercompany transactions. All intercompany accounts and transactions have been eliminated in combination for all periods presented and, although not material, certain prior period amounts have been reclassified to be consistent with current period financial statement presentation.
(2) Significant Accounting Policies
Cash & Cash Equivalents
We consider all highly liquid investments with original maturities at the date of purchase of three months or less to be cash equivalents. Periodically during the year, we maintain cash in excess of the amounts insured by the federal government.
Finance Receivables
Finance receivables consist of the aggregate principal balances of all loans in our active portfolio, which are collateralized by used vehicles sold, plus accrued interest receivable and direct loan origination costs. Finance receivables are comprised solely of loans related to used vehicles sold by us, all of which are simple interest loans which may be prepaid without penalty. We do not place loans on nonaccrual status since accounts are charged-off when the loan becomes contractually 91 days past due.
Charge-off Policy
The accrual of interest along with any unamortized loan origination costs, is discontinued and any accrued but unpaid interest is reversed and written-off when the loans are charged-off at 91 days contractually past due. Accounts which have been charged-off have been removed from finance receivables. Net charge-offs consist of finance receivable principal balances charged-off, net of any amounts received from vehicles recovered and sold at auction, sales tax refunds, and any subsequent collections on the charged-off accounts as well as an estimate of recoveries on loans previously charged-off (recovery receivables).
Allowance for Credit Losses
We maintain an allowance for credit losses on an aggregated basis. We accrue for estimated losses since it is probable that the amount will not be fully collectible and the amount of the loss can be reasonably estimated. The evaluation of the adequacy of the allowance for credit losses considers such factors as performance of the loan portfolio by month of origination (“static pool analysis”), the portfolio credit grade mix, our historical credit losses, the overall portfolio quality, delinquency status, the value of the underlying collateral, current economic conditions that may affect the borrowers’ ability to pay, and the overall effectiveness of collection efforts. This estimate of existing probable and estimable losses is primarily based on static pool analyses prepared for various segments of the portfolio utilizing historic loss experience, adjusted for the estimated impact of current economic factors. In management’s judgment, the allowance is maintained at a level that is adequate to provide for the estimate of probable credit losses inherent in our finance receivable portfolio. Charge-offs are recorded as a reduction to the allowance for credit losses. For previously charged-off accounts that are subsequently recovered, or portions thereof, the amount of such recovery is credited to the allowance for credit losses. On a quarterly basis management reviews the allowance for credit losses for reasonableness and adequacy. Adjustments to the allowance for credit losses as a result of our allowance analyses are recorded through the provision for credit losses.
F-9
Table of Contents
Inventory
Inventory consists of used vehicles held-for-sale, or currently undergoing reconditioning, and is stated at the lower of cost or market value. Vehicle inventory cost is determined by specific identification. Direct and indirect vehicle reconditioning costs including parts and labor, costs to transport the vehicles to our dealership locations, and other incremental costs are capitalized as a component of inventory cost.
Property and Equipment
Repairs and maintenance costs that extend the life of an asset are capitalized. Property and equipment is stated at cost and is shown net of accumulated depreciation. Depreciation is computed using the straight-line method over the estimated useful life of the assets, which range from three to 15 years for equipment, three to five years for furniture, three years for software, five to ten years for building improvements, and thirty years for buildings. Leasehold improvements are depreciated using the straight-line method over the lesser of the lease term or the estimated useful lives of the related improvements.
Capitalized Internally Developed Software
We capitalize direct costs of materials and services consumed in developing or obtaining internal use software and payroll and payroll-related costs for employees who are directly associated with and who devote time to the development of software products for internal use, to the extent of the time spent directly on the project. Capitalization of costs begins during the development stage and ends when the software is available for general use. Amortization is computed using the straight-line method over the estimated economic life of the software.
Goodwill
We review goodwill for impairment annually or when circumstances indicate the carrying amount may not be recoverable. In evaluating impairment, we base our estimates of fair value using a combination of earnings valuations, cash flow valuation, and asset valuations. Management selected January 1st as the date of our annual goodwill impairment test. As of January 1, 2009, 2008, and 2007, our analysis of potential impairment of goodwill carried on our balance sheet at December 31, 2008, 2007, and 2006 was completed, and we determined that no impairment existed.
Recovery Receivables
Recovery receivables represent estimated recoveries to be received on charged-off finance receivables, including proceeds from selling repossessed vehicles at auction, along with insurance, bankruptcy and deficiency collections. Changes in recovery receivables are treated as increases or decreases to net charge-offs and ultimately the allowance for credit losses. At December 31, 2008 and 2009 recovery receivables amounted to $17.8 million and $13.9 million, respectively, and are included in other assets on the accompanying combined balance sheets.
Deferred Financing Costs
Costs relating to obtaining debt financing are capitalized and amortized over the term of the related debt using the effective interest method. Unamortized deferred financing costs at December 31, 2008 and 2009 were $20.3 million and $13.4 million. Net deferred financing costs are recorded as a component of other assets on the accompanying combined balance sheets. Amortization of deferred financing costs are recorded as component interest expense, and were $4.9 million, $15.0 million, and $14.5 million for the years ended December 31, 2007, 2008, and 2009. When debt is paid in full prior to maturity, any unamortized deferred financing costs are removed from the balance sheet and either treated as a reduction of gain on extinguishment of debt, in the case of a repurchase of debt, or treated as interest expense if debt is paid in full prior to maturity.
F-10
Table of Contents
Limited Warranty
We provide our DriveCare® limited warranty covering major mechanical and air-conditioning coverage, on every vehicle we sell. The warranty is included in the sales price of the vehicle and is not sold as a separate product. A liability for the estimated cost of vehicle repairs under our DriveCare® limited vehicle warranty program is established at the time a used vehicle is sold by charging costs of used vehicles sold. We currently offer no warranty outside of our DriveCare® limited warranty. The liability is evaluated for adequacy through an analysis based on the program’s historical performance of warranty cost incurred per unit sold over the term of the warranty. Vehicles sold prior to December 1, 2009 are covered for six months / 6,000 miles on major mechanical items. Starting with sales in December 2009, we extended our DriveCare® limited warranty plan from six months / 6,000 miles to 36 months / 36,000 miles, including oil changes at Sears automotive locations nationwide and 24/7 roadside assistance.
Revenue Recognition
Revenue from the sale of used vehicles is recognized upon delivery, when the sales contract is signed and the agreed-upon down payment or purchase price has been received. Sales of used vehicles include revenue from the sale of used vehicles, net of a reserve for returns. The reserve for returns is estimated using historical experience and trends. Revenue is recognized at time of sale since persuasive evidence of an arrangement in the form of an installment sales contract exists, we have delivered the vehicle to the customer, transferred title, our sales have a fixed and determinable price, and collectability is reasonably assured.
Interest income consists of interest earned on installment sales contracts, net of amortization of loan origination costs, plus late payment fees and interest earned on investments held in trust. Interest income is recognized using the effective interest method and the loans provided to customers are simple interest loans that may be prepaid without penalty. Direct loan origination costs related to loans originated at our dealerships are deferred and charged against interest income over the life of the related loans using the effective interest method.
Cost of Used Vehicles Sold
Cost of used vehicles sold includes the cost to acquire vehicles and the reconditioning and transportation costs associated with preparing the vehicles for resale. Direct and indirect vehicle reconditioning costs, including parts and labor, costs to transport the vehicles to our dealership locations, warranty costs, and other incremental costs, are included in cost of used vehicles sold. The cost of used vehicles sold is determined on a specific identification basis.
Accounting for Transfers of Financial Assets
Securitizations. We periodically sell loans originated at our dealerships to bankruptcy remote securitization subsidiaries, which in turn, transfer the loans to separate trusts that issue notes and certificates collateralized by the loans. The senior class or Class A notes (Asset-Backed Securities) are sold to investors, and we retain the subordinate classes of notes and certificates. We continue to service all loans securitized. Due to certain restrictions placed on the trusts (i.e. the trusts do not have the right to pledge the assets), securitization transactions are accounted for as secured financings, in accordance with ASC 860 – Transfers and Servicing (ASC 860). Loans included in the securitization transactions are recorded as finance receivables and the Asset-Backed Securities are recorded as a component of portfolio term financings in the accompanying combined balance sheets. The bankruptcy remote securitization subsidiaries are owned and controlled by DTAC.
F-11
Table of Contents
Additional credit enhancement is achieved via over collateralization and a cash reserve account is established for the benefit of the Asset-Backed Security note holders. The reserve accounts are classified as restricted cash and investments held in trust in the combined balance sheets.
Other Portfolio Term Financings. In November 2008, we began our Pooled Auto Loan Program (PALP). As with our traditional securitization program, under PALP, we pool loans originated at our dealerships and sell them to either (i) a special purpose entity which transfers the loans to a separate trust which, in turn, issues a note collateralized by the loans; or (ii) we sell the pooled loans, in a secured financing transaction, directly to a third-party financial institution to yield a specified return with the right to repurchase these loans at a specified date. We retain all servicing. Both types of PALP transactions are accounted for as secured financings, either due to our right to repurchase the loans sold at a specified date or due to certain restrictions placed on the trusts. Therefore, the loans included in these transactions remain in finance receivables and the debt is reflected as a component of portfolio term financings on the combined balance sheets.
Provision for Credit Losses
Provision for credit losses is the charge recorded to operations in order to maintain an allowance for credit losses adequate to cover losses inherent in the portfolio.
Advertising
All costs related to advertising and marketing are expensed in the period incurred. Advertising costs related to production are capitalized and expensed once the media is aired. We had no capitalized advertising costs as of December 31, 2008 and 2009. Total advertising costs for the years ended December 31, 2007, 2008, and 2009 were $12.3 million, $11.2 million, and $13.7 million, respectively.
Income Taxes
DTAG and DTAC are both S-corporations for federal and state income tax purposes. There is no provision for income taxes, except for any amount of entity level state tax in certain jurisdictions, and federal and state income taxes related to a wholly-owned subsidiary of DTAG, which is a C-corporation. Income or losses of an S-corporation flow through to the individual shareholders, who report such income or loss on their individual income tax returns.
Earnings Per Share
Basic earnings per share are computed by dividing net income by the average number of common shares outstanding during the period. Diluted earnings per share takes into consideration the potentially dilutive effect of common stock equivalents, which if exercised or converted into common stock would then share in the earnings of the company. For all periods presented, we did not have any potentially dilutive securities in the form of options, warrants or the like, therefore, we have not provided a reconciliation of basic weighted average shares to diluted weighted average shares.
Pro forma Information (unaudited)
Income Taxes. We have filed a registration statement in connection with a proposed initial public offering of our common stock (IPO). Assuming the completion of the IPO, we will elect to be treated as a C-corporation under the Internal Revenue Code and will be subject to corporate income taxes. Accordingly, a pro forma income tax provision for corporate income taxes has been calculated as if we had been taxable as a C-corporation for all periods presented.
F-12
Table of Contents
The effective tax rates used in the unaudited pro forma income tax calculations are based on the statutory federal income tax rate plus applicable state income taxes (net of federal benefit) plus the non-deductibility of certain expenses.
Historically, our two principal operating companies, DTAG and DTAC, were structured as pass through tax entities, and accordingly did not record any provision for income taxes except for an entity level state tax in certain states and C-corporation taxes for one of our subsidiaries. In connection with our initial public offering, we will undergo a reorganization that will, among other things, result in us being treated as a C-corporation subject to corporate income taxation. Consequently, we will record a net deferred tax liability and corresponding income tax expense. The amount of the net deferred tax liability would have been approximately $51.4 million had the revocation date been December 31, 2009. The net deferred tax liability is principally made up of $42.5 million from the intercompany loss on sale of receivables from DTAG to DTAC and $11.0 million from gain on debt extinguishment, offset by a $2.9 million deferred tax asset from net operating loss carryforwards. In addition, we would have had $8.3 million of net operating losses available to offset future income, for which there would have been an annual limitation of approximately $2.9 million.
As an S-corporation, DTAG sold receivables to DTAC at a discount and was able to report a related tax loss, which was eliminated in consolidation. To the extent these losses have been previously deducted for tax purposes by DTAG prior to our becoming a C-corporation, the losses will not be deductible again as we record a provision for credit losses for loans that existed at the date we convert to a C-corporation. Therefore, a deferred liability will be established upon conversion and that deferred liability will increase or decrease as a result of future loan originations and charge offs. The actual amounts of our deferred tax liability, net operating loss, and annual limitation thereon, will be determined and reflected in our results for the quarter during which our S-corporation status is terminated. The revocation of our S-corporation election will have an impact on our results of operations, financial condition, and cash flows. Our effective income tax rate will increase and our net income will decrease since we will be subject to both federal and state taxes on our earnings.
Impairment of Long-Lived Assets
We own a small number of used vehicle sales facilities and an operations call center building. These long-lived assets are reviewed for impairment whenever events or changes in circumstances indicate the carrying amount of an asset may not be recoverable. Recoverability of assets to be held and used is measured by a comparison of the carrying amount of an asset to future undiscounted net cash flows expected to be generated by the asset. If such assets are considered to be impaired, the impairment to be recognized is measured by the amount by which the carrying amount of the assets exceeds the fair value of the assets. Assets to be disposed would be reported at the lower of the carrying amount or fair value less costs to sell, and would no longer depreciated. At December 31, 2008 and 2009, there were no indications of impairment pertaining to these assets.
Business Segment
Operating segments are defined as components of an enterprise about which separate financial information is available that is evaluated regularly by the chief operating decision maker, in deciding how to allocate resources and in assessing operating performance. The vertical integration of our business provides for one interdependent platform which enables us to both sell and finance vehicles to customers with subprime credit. We finance approximately 100% of all vehicles sold at our dealerships in a single sales/finance transaction and each of our individual stores are similar in nature and only engage in the selling and financing of used vehicles for the subprime segment of the market. In addition, decisions regarding allocation of resources and assessing operating performance are reviewed on a consolidated basis by our chief operating decision maker; therefore, we have one operating and reporting segment.
F-13
Table of Contents
Use of Estimates
The preparation of the combined financial statements in conformity with U.S. generally accepted accounting principles requires management to make estimates and assumptions that affect the reported amount of assets and liabilities. Certain accounting estimates involve significant judgments, assumptions, and estimates by management that have a material impact on the carrying value of certain assets and liabilities, disclosures of contingent assets and liabilities, and the reported amounts of income and expenses during the reporting period which management considers to be critical accounting estimates. The judgments, assumptions, and estimates used by management are based on historical experience, managements’ experience, and other factors, which are believed to be reasonable under the circumstances. Because of the nature of the judgments and assumptions made by management, actual results could differ materially from these judgments and estimates, which could have a material impact on the carrying values of our assets and liabilities and our results of operations.
Significant items subject to estimates and assumptions include the allowance for credit losses, inventory valuation, fair value measurements, certain legal reserves, our reserve for sales returns and allowances, and our warranty accrual. Estimates used in deriving these amounts are described in the footnotes herein. Actual results could differ from these estimates.
Recent Accounting Pronouncements
From time to time, new accounting pronouncements are issued by the Financial Accounting Standards Board (FASB) or other accounting standards setting bodies, which we may adopt as of the specified date required by each standard. Unless otherwise discussed, we believe the impact of recently issued standards that are not yet effective will not have a material impact on its combined financial statements upon adoption. The below information is not a comprehensive list of all new pronouncements. We have only included those pronouncements we believe the reader of the financial statements would find meaningful. We have excluded certain pronouncements that we believe do not apply to us or the industry in which we operate.
In April 2009, the FASB established guidance for determining fair value when the volume and level of activity for the asset or liability have significantly decreased and identifying circumstances that indicate transactions which are not orderly. This guidance is now contained in ASC 820 – Fair Value Measurements and Disclosures (ASC 820). This guidance was effective for interim and annual reporting periods ending after June 15, 2009, and shall be applied prospectively. Since we have not elected the fair value measurement option for our assets and liabilities, this pronouncement does not have an impact on our fair value disclosures or reporting.
In May 2009, the FASB issued guidance with respect to subsequent events. This guidance, which is now contained in ASC 855 – Subsequent Events, establishes general standards of accounting for and disclosure of events that occur after the balance sheet date but before the date the financial statements are issued or available to be issued. The guidance requires companies to reflect in their financial statements the effects of subsequent events that provide additional evidence about conditions at the balance-sheet date. Subsequent events that provide evidence about conditions that arose after the balance-sheet date should be disclosed if the financial statements would otherwise be misleading. Disclosures should include the nature of the event and either an estimate of its financial effect or a statement that an estimate cannot be made. This guidance is effective for interim and annual financial periods ending after June 15, 2009, and should be applied prospectively. Since these requirements are consistent with our current practice, the implementation of this standard has not had a significant impact on our combined financial statements.
F-14
Table of Contents
In June 2009, the FASB issued additional guidance on accounting for transfers of financial assets that removes the concept of a qualifying special-purpose entity (QSPE) from the previously issued Statement No. 140, and removes the exception from applying the previously issued FASB Interpretation No. 46 (revised December 2003), “Consolidation of Variable Interest Entities” (FIN 46R). This statement also clarifies the requirements for isolation and limitations on portions of financial assets that are eligible for sale accounting. This statement is effective for fiscal years beginning after November 15, 2009. Accordingly, we will adopt this guidance in fiscal 2010. We are currently evaluating the impact of adopting this standard on the combined financial statements, but believe the implementation of this standard will not have a significant impact on our combined financial statements.
In June 2009, the FASB issued guidance amending the previously issued FIN 46R to require an analysis to determine whether a variable interest gives a company a controlling financial interest in a variable interest entity. This statement requires an ongoing reassessment of and eliminates the quantitative approach previously required for determining whether a company is the primary beneficiary. This statement is effective for fiscal years beginning after November 15, 2009. Accordingly, we will adopt this guidance in fiscal 2010. We are currently evaluating the impact of adopting this standard, but believe the implementation of this standard will not have a significant impact on our combined financial statements.
In August 2009, the FASB issued ASU No. 2009-05, “Fair Value Measurements and Disclosures (Topic 820) – Measuring Liabilities at Fair Value.” ASU No. 2009-05 provides clarification in measuring the fair value of liabilities in circumstances in which a quoted price in an active market for the identical liability is not available and in circumstances in which a liability is restricted from being transferred. This ASU also clarifies that both a quoted price in an active market for the identical liability at the measurement date and the quoted price for the identical liability when traded as an asset in an active market when no adjustments to the quoted price of the asset are required are Level 1 fair value measurements. As we did not elect the fair value option for our financial asset and liabilities we do not plan to implement this ASU, except to the extent it modifies our fair value disclosures in our current combined financial statements.
(3) Restricted Cash and Investments Held in Trust
We maintain various cash accounts, which are pledged as collateral under our debt agreements. We are permitted to invest funds in these accounts in short-term, high quality liquid investments. The following is a summary of restricted cash and investments held in trust:
| December 31, | ||||||
| 2008 | 2009 | |||||
| ($ in thousands) | ||||||
| Restricted Cash |
$ | 15,282 | $ | 27,128 | ||
| Investments Held in Trust |
55,941 | 56,936 | ||||
| $ | 71,223 | $ | 84,064 | |||
Restricted Cash. Restricted cash consists of collections related to loans held in securitization trusts, loans pledged to our portfolio warehouse facilities, and loans included in PALP transactions, which have been collected from customers, but have not yet been submitted either to the lenders or the securitization trustee, as appropriate.
F-15
Table of Contents
Investments Held in Trust. We maintain cash reserve accounts on behalf of Asset-Backed Security investors in our securitizations and certain PALP transactions as a form of credit enhancement. At the time loans are transferred to a trust, a portion of the proceeds from sales of Class A notes are deposited into a reserve account that is pledged to the trusts. We may be required to make additional deposits to reserve accounts from collections on the loans to fund the reserve account to the required target percentage. Investments held in trust also include collections related to loans held in securitization trusts and loans included in PALP financing transactions, which have been collected from customers, and submitted to the trustee, but have not yet been paid to the lenders, as appropriate. Balances in the reserve accounts totaled $37.4 million at December 31, 2008, and $26.1 million at December 31, 2009.
(4) Finance Receivables
The following is a summary of finance receivables:
| December 31, | ||||||
| 2008 | 2009 | |||||
| ($ in thousands) | ||||||
| Principal Balances |
$ | 1,342,855 | $ | 1,312,216 | ||
| Accrued Interest |
11,890 | 10,806 | ||||
| Loan Origination Costs |
20,274 | 17,569 | ||||
| Finance Receivables |
$ | 1,375,019 | $ | 1,340,591 | ||
Concentration of Credit Risk
We operated 103, 86, and 78 used vehicle dealerships at December 31, 2007, 2008, and 2009, respectively. At December 31, 2009, our dealerships are located in 18 metropolitan regions throughout the country.
At December 31, 2008 and December 31, 2009, our portfolio concentration by state was as follows:
| December 31, 2008 |
December 31, 2009 | |||||||||||||
| State |
Percent of Portfolio |
Loan Principal | State |
Percent of Portfolio |
Loan Principal | |||||||||
| ($ in thousands) | ($ in thousands) | |||||||||||||
| Texas |
30.1 | % | $ | 404,007 | Texas |
29.7 | % | $ | 390,324 | |||||
| Florida |
18.8 | % | 251,731 | Florida |
18.4 | % | 241,112 | |||||||
| Arizona |
9.1 | % | 122,444 | North Carolina |
9.0 | % | 117,463 | |||||||
| Georgia |
8.9 | % | 119,319 | Georgia |
8.4 | % | 110,322 | |||||||
| California |
8.3 | % | 111,533 | Arizona |
8.4 | % | 109,714 | |||||||
| Virginia |
8.0 | % | 108,025 | Virginia |
8.2 | % | 107,987 | |||||||
| North Carolina |
6.8 | % | 91,821 | California |
6.5 | % | 85,613 | |||||||
| Nevada |
4.0 | % | 53,961 | Nevada |
4.3 | % | 56,998 | |||||||
| New Mexico |
4.0 | % | 53,678 | New Mexico |
4.3 | % | 56,240 | |||||||
| Colorado |
2.0 | % | 26,336 | Colorado |
2.8 | % | 36,208 | |||||||
| Tennessee |
— | — | Tennessee |
0.0 | % | 235 | ||||||||
| 100.0 | % | $ | 1,342,855 | 100.0 | % | $ | 1,312,216 | |||||||
F-16
Table of Contents
(5) Allowance for Credit Losses
The following table sets forth the rollforward of the allowance for credit losses for the periods indicated:
| Years Ended December 31, | ||||||||||||
| 2007 | 2008 | 2009 | ||||||||||
| ($ in thousands) | ||||||||||||
| Allowance Activity: |
||||||||||||
| Balance, Beginning of Period |
$ | 192,150 | $ | 244,034 | $ | 242,600 | ||||||
| Provision for Credit Losses |
283,407 | 300,884 | 223,686 | |||||||||
| Net Charge-offs |
(231,523 | ) | (302,318 | ) | (248,027 | ) | ||||||
| Balance, End of Period |
$ | 244,034 | $ | 242,600 | $ | 218,259 | ||||||
| Allowance as a Percent of Ending Principal |
18.2 | % | 18.1 | % | 16.6 | % | ||||||
| Charge-off Activity: |
||||||||||||
| Principal Balances |
$ | (345,287 | ) | $ | (428,023 | ) | $ | (363,177 | ) | |||
| Recoveries, Net |
113,764 | 125,705 | 115,150 | |||||||||
| Net Charge-offs |
$ | (231,523 | ) | $ | (302,318 | ) | $ | (248,027 | ) | |||
(6) Property and Equipment, Net
A summary of property and equipment follows:
| December 31, | ||||||||
| 2008 | 2009 | |||||||
| ($ in thousands) | ||||||||
| Land |
$ | 7,693 | $ | 8,144 | ||||
| Buildings and Improvements |
67,841 | 68,737 | ||||||
| Equipment |
22,147 | 27,165 | ||||||
| Furniture |
12,637 | 12,051 | ||||||
| Software |
23,820 | 26,104 | ||||||
| 134,138 | 142,201 | |||||||
| Less Accumulated Depreciation and Amortization |
(77,814 | ) | (85,982 | ) | ||||
| Property and Equipment, Net |
$ | 56,324 | $ | 56,219 | ||||
We have commitments under capital leases, consisting primarily of software, computer equipment, and reconditioning center equipment classified in Equipment and Software included in the above table. As of December 31, 2008, these assets were fully depreciated. As December 31, 2009, assets under capital leases had a cost of $0.7 million and accumulated depreciation of $0.1 million.
For the years ended December 31, 2007, 2008, and 2009, we capitalized $1.7 million and $1.6 million and $1.3 million, respectively, of direct costs of materials and services consumed in developing or obtaining internal use software and payroll and payroll-related costs for employees who are directly associated with and who devote time to the development of software products for internal use, to the extent of the time spent directly on the project.
F-17
Table of Contents
(7) Debt Obligations
The following is a summary of portfolio warehouse facilities:
| December 31, | ||||||
| 2008 | 2009 | |||||
| ($ in thousands) | ||||||
| Portfolio Warehouse Facilities: |
||||||
| Warehouse Facility A – secured by certain finance receivables of the Company |
$ | 193,500 | $ | 77,506 | ||
| Warehouse Facility B – secured by certain finance receivables of the Company not otherwise included in a securitization trust or PALP transaction; terminated July 2009 |
204,593 | — | ||||
| Total Portfolio Warehouse Facilities |
$ | 398,093 | $ | 77,506 | ||
Warehouse Facility A. At December 31, 2008 Warehouse Facility A facility had, (i) a maximum capacity of $300.0 million, (ii) interest payable at the lender’s cost of funds plus 5.0% (7.31% at December 31, 2008), (iii) a maturity of December 2009, and (iv) an advance rate of 52%. At December 31, 2008, we were in compliance with all required covenants of this facility.
In July 2009, we amended and extended this credit facility. Among other things, this amendment, (i) decreased its capacity from $300.0 million to $250.0 million; (ii) extended the maturity date from December 2009 to December 2010; (iii) increased the advance rate to 58%; and (iv) lowered the interest rate to the lender’s cost of funds plus 4.25% (4.49% at December 31, 2009). These were the effective terms at December 31, 2009. At December 31, 2009, we were in compliance with all required covenants of this facility.
DT Warehouse, LLC (a wholly-owned subsidiary of DTAC) is the sole borrower under Warehouse Facility A. DT Warehouse, LLC is a special purpose entity established specifically for the purpose of this lending relationship with assets and liabilities distinct from those of our other entities and each other affiliate thereof. DT Warehouse, LLC operates in such a manner so that it would not be substantively consolidated in the bankruptcy trust estate of any of our entities. DT Warehouse, LLC has also entered into a $25.0 million demand note with DTAC, which has been assigned to the lender. The demand note is guaranteed by DTAG, Ernest C. Garcia II (Chairman), and his affiliate Verde Investments, Inc. (Verde). At its sole discretion, the lender can require DTAC to fund the demand note, and apply the proceeds to pay down the facility with DT Warehouse, LLC.
Warehouse Facility A is secured by finance receivables totaling $401.5 million and $139.5 million at December 31, 2008 and December 31, 2009, respectively.
Warehouse Facility B. At December 31, 2008, Warehouse Facility B had a maximum capacity of $334.2 million and consisted of two parts, Tranche A and Tranche B. The Tranche A component had (i) a capacity of $284.2 million (ii) a maturity of December 2009, (iii) an advance rate of 52%, and (iv) an interest rate at LIBOR plus 5.0% (5.96% at December 31, 2008), The Tranche B component had (i) a capacity of $50.0 million, (ii) a maturity of December 2009, (iii) an advance rate equal to 61%, and (iv) an interest rate at LIBOR plus 7.0% (7.96% at December 31, 2008). DTAC was the sole borrower under this facility. The facility was guaranteed by DTAG and its subsidiaries. At December 31, 2008, we were in compliance with all required covenants of this facility.
F-18
Table of Contents
In May 2009, we renewed this facility, extending the maturity date from December 2009 to December 2010 and decreasing the facility size from $334.2 million to $250.0 million. The facility was guaranteed by DTAG and its subsidiaries. In July 2009, we satisfied the amount then outstanding on this credit facility and executed a termination of this facility.
Warehouse Facility B was secured by finance receivables totaling $389.3 million at December 31, 2008.
Portfolio Term Financings
The following is a summary of portfolio term financings:
| December 31, | |||||||
| 2008 | 2009 | ||||||
| ($ in thousands) | |||||||
| Securitization Debt: |
|||||||
| Asset Backed Security obligations issued pursuant to the Company’s securitizations |
264,949 | 268,533 | |||||
| Asset Backed Security obligations repurchased by the Company and not retired |
(83,011 | ) | — | ||||
| Pooled Auto Loan Program Financings: |
|||||||
| Fixed rate secured financing transactions for our finance receivable portfolio |
$ | 152,591 | $ | 527,324 | |||
| Total Portfolio Term Financings |
$ | 334,529 | $ | 795,857 | |||
Securitization Debt
The following table is a summary of securitization transactions with outstanding balances for each period presented:
| Original Note/Debt Amount |
As of December 31, 2008 | As of December 31, 2009 | |||||||||||||||||||||
| Note/Debt Balance |
Receivables Balance |
Cash Reserve (1) |
Note/Debt Balance |
Receivables Balance |
Cash Reserve (1) | ||||||||||||||||||
| ($ in thousands) | |||||||||||||||||||||||
| Securitization Transactions |
|||||||||||||||||||||||
| 2005-A |
$ | 230,000 | $ | — | $ | — | $ | — | $ | — | $ | — | $ | — | |||||||||
| 2005-B |
150,000 | — | — | — | — | — | — | ||||||||||||||||
| 2005-C |
150,000 | 14,499 | 17,874 | 5,137 | — | — | — | ||||||||||||||||
| 2006-A |
240,000 | 37,581 | 47,193 | 8,219 | — | — | — | ||||||||||||||||
| 2006-B |
305,000 | 79,874 | 108,741 | 10,606 | 31,867 | 42,132 | 10,592 | ||||||||||||||||
| 2007-A |
320,000 | 132,995 | 173,112 | 12,920 | 61,530 | 78,089 | 11,112 | ||||||||||||||||
| 2009-D |
— | — | — | 175,136 | 286,955 | 3,000 | |||||||||||||||||
| Repurchased |
(83,011 | )(2) | — | — | — | (3) | — | — | |||||||||||||||
| $ | 181,938 | $ | 346,920 | $ | 36,882 | $ | 268,533 | $ | 407,176 | $ | 24,704 | ||||||||||||
| (1) | Cash reserve consists of investments held in trust and cash collection accounts held by the trustee, which have not yet been applied to the monthly cash flow waterfall for the securitization bond holders. The cash reserve does not include restricted cash, which is cash collected and held in trust from loan payments, which have not been applied to pay down securitization debt. |
F-19
Table of Contents
| (2) | Represents the portion of 2007-A securitization debt we repurchased in August and December 2008, and March 2009. |
| (3) | Reflects reissuance of 2007-A securitization debt in August 2009. |
Asset-backed securities outstanding are secured by underlying pools of finance receivables and investments held in trust. Asset-backed securities outstanding have interest payable monthly at fixed rates ranging from 5.2% to 5.6% at December 31, 2008, and 5.2% to 5.6% at December 31, 2009. Credit enhancement for the asset-backed securities consists of subordination of the certificate to the Class A Notes, over collateralization (finance receivable principal balance in excess of the face value of asset-backed securities issued) and cash reserves, which are funded with proceeds from the sale of asset-backed securities and through cash collections. Over collateralization ranged from 27.0% to 31.5% for securitizations outstanding at December 31, 2008 and from 28.0% to 35.8% for securitizations outstanding at December 31, 2009. Except for 2009-D, as of December 31, 2009 the outstanding asset-backed securities are wrapped with financial guaranty insurance policies from monoline insurers.
For the year ended December 31, 2008, we repurchased $83.0 million of our 2007-A securitization bonds on the open market, resulting in net gains of $15.2 million. These amounts are classified as Gain on Extinguishment of Debt on the combined statements of income for the year ended December 31, 2008.
In March 2009, we repurchased an additional $13.2 million of our 2007-A securitization bonds on the open market, resulting in a net gain of $1.8 million. This gain on repurchase is classified as Gain on Extinguishment of Debt on the combined statements of income for the year-ended December 31, 2009.
In August 2009, we reissued the then-outstanding balance of the 2007-A securitization bonds we previously repurchased ($65.6 million). These bonds were reissued at a premium to par of 100.5% resulting in a $0.3 million premium, which is being amortized using the effective interest method over the term of the debt.
In December 2009, we completed our first securitization transaction since June 2007 by issuing $192.6 million of asset-backed securities, which are collateralized by approximately $300.0 million of finance receivables. The asset- backed securities are structured in four tranches with credit ratings ranging from AAA to A, without external credit enhancement from a monoline insurer. The weighted average coupon of these four tranches was 5.3%.
Performance Triggers. Our securitization trusts contain certain covenants, including limitations on delinquencies, periodic net charge-offs, and cumulative net charge-offs (“performance triggers”). If a trust exceeds a performance trigger the required cash reserve increases and cash flow from the loans in the trust is “trapped” until the reserve account reaches the specified level, or until the holders are paid in full or the insurer waives the event. If the trust performance goes below the performance trigger the trapped cash is returned to us. At December, 31 2008 and 2009, all trusts were in compliance with their performance triggers and there have been no requirements to trap cash or any termination events.
Individual securitization trusts are not cross-collateralized or cross-defaulted. Additionally, we have the option to purchase the remaining loans in a trust when the remaining principal balances of the loans reach a specified percentage (generally 10%) of their original principal balance.
Pooled Auto Loan Program Financings (PALP). PALP financings are secured by underlying pools of finance receivables and in certain cases a cash reserve account. The net advance rate on the receivables ranges from 67.6% to 73.4% of the principal balance for transactions outstanding at December 31, 2009. The net advance rate on receivables ranged from 65.0% to 73.9% of the principal balance for transactions outstanding at December 31, 2008. In certain cases there may be a cash reserve/holdback which is netted against the debt amount to arrive at the net advance rate.
F-20
Table of Contents
Since inception of this program, we have issued a total of $718.5 million in PALP financings through December 31, 2009. The following table is a summary of the PALP transactions outstanding:
| PALP |
Finance Principal Sold |
Initial Cash Reserve |
Interest Rate |
Original Amount |
As of December 31, 2008 | ||||||||||||||||
| Current Balance |
Receivables Balance |
Cash Reserve(3) | |||||||||||||||||||
| ($ in thousands) | |||||||||||||||||||||
| 2008-A (1) |
$ | 10,000 | 5.0 | % | 8.00 | % | $ | 7,000 | $ | 6,887 | $ | 9,670 | $ | 492 | |||||||
| 2008-B (2) |
200,010 | — | 11.00 | % | 150,000 | 145,704 | 196,643 | — | |||||||||||||
| $ | 157,000 | $ | 152,591 | $ | 206,313 | $ | 492 | ||||||||||||||
| PALP |
Finance Principal Sold |
Initial Cash Reserve |
Interest Rate |
Original Amount |
As of December 31, 2009 | ||||||||||||||||
| Current Balance |
Receivables Balance |
Cash Reserve(3) | |||||||||||||||||||
| ($ in thousands) |
|||||||||||||||||||||
| ($ in thousands) | |||||||||||||||||||||
| 2008-A (1) |
$ | 10,000 | 5.0 | % | 8.00 | % | $ | 7,000 | $ | 4,398 | $ | 6,035 | $ | 315 | |||||||
| 2008-B (2) |
220,011 | — | 11.00 | % | 165,000 | 92,594 | 127,918 | — | |||||||||||||
| 2009-A (2) |
268,620 | — | 10.34 | % | 201,465 | 143,984 | 202,769 | — | |||||||||||||
| 2009-B (1) |
29,338 | 5.0 | % | 8.00 | % | 22,004 | 16,226 | 20,653 | 1,063 | ||||||||||||
| 2009-C (2) |
342,070 | — | 8.71 | % | 244,451 | 195,958 | 275,205 | — | |||||||||||||
| 2009-E (2) |
84,779 | — | 8.00 | % | 59,346 | 55,359 | 78,662 | — | |||||||||||||
| 2009-F (2) |
27,508 | — | 8.00 | % | 19,255 | 18,805 | 26,703 | — | |||||||||||||
| $ | 718,521 | $ | 527,324 | $ | 737,945 | $ | 1,378 | ||||||||||||||
| (1) | Represents pools of loans that were sold to a special purpose entity in a secured financing transaction, which transferred the loans to a separate trust which, in turn, issued a note collateralized by the loans. The initial deposit into the reserve account was 5.0% of the note principal balance, and the on-going reserve account requirement is the greater of 5.0% of the outstanding contract balance or 2.0% of the original contract balance. If at any point there are insufficient funds to pay principal and interest on the loan, the trustee will draw cash from the reserve account to make payments. |
| (2) | Represents pools of loans that were sold, in a secured financing transaction, directly to a third-party financial institution. Under this arrangement, we are required to maintain an aggregate amount of finance receivable principal balance of $740.0 million. On a monthly basis we replenish the portfolio run-off with sales of finance receivables in order to maintain the $740.0 million contract principal outstanding. Subject to certain exceptions, as cash is collected, it is applied through a waterfall to pay an annualized yield to the purchaser on the outstanding advance amount and our servicing fee. Any excess cash flows are distributed to us at a level to maintain a 70% advance rate on the outstanding contract principal. |
| (3) | Cash reserve consists of investments held in trust and cash collection accounts which have not yet been applied to the monthly cash flow waterfall for the note holders. The cash reserve does not include restricted cash, which is cash collected and held in trust from loan payments, which have not been applied to pay down PALP debt. |
F-21
Table of Contents
Other Secured Notes Payable
A summary of other secured notes payable follows:
| December 31, | ||||||
| 2008 | 2009 | |||||
| ($ in thousands) | ||||||
| Revolving Inventory Facility, Secured by the Company’s Vehicle Inventory |
$ | 64,564 | $ | 50,000 | ||
| Junior Secured Notes due December 2012, Secured by Finance Receivables |
29,100 | — | ||||
| Junior Secured Notes due December 2012, Secured by Finance Receivables-Related Party |
26,000 | 62,088 | ||||
| Repurchase Facility A – Secured by 2007-A Securitization Bonds Repurchased; Terminated July 2009 |
46,694 | — | ||||
| Repurchase Facility B – Secured by 2009-D Securitization Bonds purchased by the Company |
— | 12,231 | ||||
| Mortgage Note Payable Bearing Interest at 5.87% due March 2017, Secured by Real Property |
13,221 | 13,046 | ||||
| Total Other Secured Notes Payable |
$ | 179,579 | $ | 137,365 | ||
Revolving Inventory Facility
At December 31, 2008, the revolving inventory facility had a maximum capacity of $80.0 million with a weighted average interest rate of LIBOR plus 5.0% (5.44% at December 31, 2008). The inventory facility had a maturity of August 2009. At December 31, 2008 we were in compliance with all required covenants of this facility.
In August 2009, we renewed our revolving inventory facility, with a new maturity date of August 2010. At December 31, 2009, the new facility had a maximum capacity of $60.0 million. At December 31, 2009, the interest rate under the new facility is LIBOR plus 6.0% (6.23% at December 31, 2009). At December 31, 2009, we were in compliance with all required covenants of this facility.
Junior Secured Notes
The junior secured notes mature in December 2012. These notes consisted of a $31.1 million Tranche A component and a $24.0 million subordinate Tranche B component at December 31, 2008, and a $38.1 million Tranche A component and a $24.0 million subordinate Tranche B component at December 31, 2009. During the year ended December 31, 2009, we issued an additional $10.0 million in Tranche A notes and repurchased a total of $3.0 million of the outstanding Tranche A notes at par value. These notes are secured by a junior interest in our finance receivables. The Tranche A component is comprised of four notes (one of which is a $2.0 million note to Ray Fidel, our Chief Executive Officer) and the Tranche B component is comprised of one subordinate note to Verde, an affiliate of Mr. Garcia. At December 31, 2009, the Tranche A notes bear interest at 22.0% per annum, increasing by 2.0% each year until maturity and the Tranche B note bears interest at 27.0% per annum, increasing 2.0% each year until maturity. At December 31, 2008 and December 31, 2009, we were in compliance with all required covenants of these notes.
F-22
Table of Contents
See Note 9 – Related Party Transactions for more information regarding transactions involving the Junior Secured Notes and Verde.
Repurchase Facility A
In August and December 2008, we repurchased $62.1 million and $20.9 million face value of our 2007-A securitization debt on the open market. We also purchased $13.2 million face value of our 2007-A securitization debt on the open market in March 2009. These purchases were funded with cash and borrowings under a 30-day rolling repurchase facility with interest at LIBOR plus 5.0% (5.96% at December 31, 2008. At December 31, 2008, the amount borrowed on the repurchase facility reduced the capacity size of Warehouse Facility A. In July 2009, subsequent to the termination of Warehouse Facility B, we satisfied the amount then outstanding and terminated this facility.
Repurchase Facility B
In December 2009, we issued $192.6 million of securitization bonds in conjunction with our 2009-D securitization. We purchased $17.5 million of the initial issuance. This purchase was funded with cash and $12.2 million in borrowings under a 30-day rolling repurchase facility with interest at LIBOR plus 1.5% (1.73.% at December 31, 2009). As of December 31, 2009, we were in compliance with all required covenants of this facility.
Mortgage Note Payable
At December 31, 2008, and December 31, 2009, the mortgage note payable was secured by our operations call center building in Mesa, Arizona. Terms of the note agreement provide for monthly principal and interest payments with a balloon payment due in March 2017. At December 31, 2008 and December 31, 2009, we were in compliance with all required covenants of this loan.
Unsecured Notes Payable
A summary of senior unsecured notes payable follows:
| December 31, | ||||||
| 2008 | 2009 | |||||
| ($ in thousands) | ||||||
| Senior Unsecured Notes Payable |
||||||
| Senior Unsecured Notes Payable, Net – Interest at 11.25% per Annum (Priced to Yield 12.5%) Payable Semi-Annually, Principal Balance Due July 1, 2013, Paid in Full September 2009 |
$ | 87,493 | $ | — | ||
| Senior Unsecured Notes Payable, Net – Interest at 11.25% per Annum (Priced to Yield 12.5%) Payable Semi-Annually, Principal Balance Due July 1, 2013, Paid in Full September 2009-Related Party |
30,902 | — | ||||
| Senior Unsecured Notes Payable, Net – Interest at 11.25% per Annum (Priced to Yield 12.5%) Payable Semi-Annually, Principal Balance Due, October 1, 2010 |
1,471 | 1,487 | ||||
| Total Senior Unsecured Notes Payable |
119,866 | 1,487 | ||||
| Subordinated Notes – Related Party |
75,000 | 75,000 | ||||
| Total Unsecured Notes Payable |
$ | 194,866 | $ | 76,487 | ||
F-23
Table of Contents
The senior unsecured notes due 2013 are shown net of unamortized discount of $3.6 million at December 31, 2008. The senior unsecured notes due 2010 are shown net of unamortized discount of $29,000 and $13,000 at December 31, 2008 and 2009, respectively. At December 31, 2008, and 2009, we were in compliance with all required covenants of these notes.
In December 2008, we repurchased $13.0 million of senior unsecured notes payable resulting in a net gain of $4.6 million. The gain is classified as Gain on Extinguishment of Debt on the combined statement of income for the year ended December 31, 2008.
During the year ended December 31, 2009, we repurchased the remaining $122.0 million of our senior unsecured notes due 2013 resulting in net gains of $28.5 million. The gains are classified as Gain on Extinguishment of Debt on the combined statements of income for the year ended December 31, 2009.
In April and May 2008, Mr. Garcia, through an affiliate, Verde, provided a total of $75.0 million in cash to us in return for subordinated notes payable. These notes bear interest at 12.0% and mature August 2013.
Future Minimum Principal Payments
The following table represents the future minimum principal payments required under notes payable and capital leases as of December 31, 2009:
| As of December 31, 2009 | |||||||||||||||||||||
| Payments by Period | |||||||||||||||||||||
| Total | Less than 1 Year |
Years 2 | Years 3 | Years 4 | Years 5 | More than 5 Years | |||||||||||||||
| Long-term debt obligations |
|||||||||||||||||||||
| Inventory facility |
$ | 50,000 | $ | 50,000 | $ | — | $ | — | $ | — | $ | — | $ | — | |||||||
| Portfolio warehouse facility (1) |
77,506 | 63,203 | 14,303 | — | — | — | — | ||||||||||||||
| Repurchase Facility |
12,231 | 12,231 | — | — | — | — | — | ||||||||||||||
| Senior unsecured notes |
1,487 | 1,487 | — | — | — | — | — | ||||||||||||||
| Junior secured notes |
62,088 | — | — | 62,088 | — | — | — | ||||||||||||||
| Subordinated notes |
75,000 | — | — | — | 75,000 | — | — | ||||||||||||||
| Real estate mortgage loan |
13,046 | 186 | 198 | 208 | 223 | 236 | 11,995 | ||||||||||||||
| Capital lease obligations |
559 | 173 | 186 | 106 | 78 | 16 | — | ||||||||||||||
| Securitization & PALP (2) |
795,857 | 404,632 | 292,514 | 86,672 | 12,039 | — | — | ||||||||||||||
| Total |
$ | 1,087,774 | $ | 531,912 | $ | 307,201 | $ | 149,074 | $ | 87,340 | $ | 252 | $ | 11,995 | |||||||
| (1) | On the termination date of the facility, amounts outstanding at termination are not due and payable immediately. All collections on the contracts collateralizing this facility are used to pay down the facility until it is paid in full. All amounts outstanding under the facility will be due and payable on the third anniversary of the termination date of the facility. |
| (2) | Securitization obligations do not have a contractual termination date. Therefore, all collections on the contracts collateralizing the securities are used to repay the asset-backed security holders based on an expected duration of the securities. On the termination date of the PALP obligations, amounts outstanding at termination are not due and payable immediately. Collections on the contracts collateralizing the facility are used to repay the facility until it is paid in full. |
F-24
Table of Contents
Concentration of Risk. As of December 31, 2008, $145.7 million of our total debt of $1.1 billion resides with one third-party lender in the form of PALP debt. In addition, at December 31, 2008, $204.6 million and $193.5 million of our total debt resides with another two third-party lenders in the form of portfolio warehouse facilities. At December 31, 2008, $129.9 million of our total debt consists of debt owed to our Principal Shareholder, in the form of subordinated notes payable, senior unsecured notes, and junior secured notes. As of December 31, 2009, $546.7 million of our total debt of $1.1 billion resides with one third-party lender in the form of PALP and inventory facility debt. In addition, at December 31, 2009, $77.5 million of our total debt resides with a third-party lender in the form of a portfolio warehouse facility. At December 31, 2009, $135.1 million of our total debt consists of debt owed to our Principal Shareholder, in the form of subordinated notes payable and junior secured notes payable.
(8) Gain on Extinguishment of Debt
During the year ended December 31, 2008 and 2009, we repurchased outstanding indebtedness, resulting in net gains on extinguishment of debt as follows:
| Year Ended, December 31, 2009 |
|||||||||
| Month |
Type |
Principal Repurchased |
Net Gain (Loss) |
||||||
| ($ in thousands) | |||||||||
| January |
Senior Unsecured Notes | $ | 15,000 | $ | 4,908 | ||||
| March |
2007-A Securitization Debt | 13,200 | 1,846 | ||||||
| April |
Senior Unsecured Notes | 30,000 | 9,911 | ||||||
| May |
Senior Unsecured Notes | 25,000 | 8,246 | ||||||
| June |
Senior Unsecured Notes | 20,000 | 6,648 | ||||||
| September |
Senior Unsecured Notes-Related Party | 32,000 | (1,248 | ) | |||||
| $ | 30,311 | ||||||||
| Year Ended December 31, 2008 |
|||||||||
| Month |
Type |
Principal Repurchased |
Net Gain | ||||||
| ($ in thousands) | |||||||||
| August |
2007-A Securitization Debt | $ | 62,100 | $ | 10,254 | ||||
| December |
2007-A Securitization Debt | 20,865 | 4,854 | ||||||
| December |
Senior Unsecured Notes | 13,000 | 4,591 | ||||||
| $ | 19,699 | ||||||||
F-25
Table of Contents
(9) Related Party Transactions
During the years ended December 31, 2007, 2008, and 2009, we recorded related party operating expenses as follows:
| Years Ended December 31, | ||||||||||||
| 2007 | 2008 | 2009 | ||||||||||
| ($ in thousands) | ||||||||||||
| General and Administrative Expenses – Related Party |
||||||||||||
| Property Lease Expense |
$ | 5,977 | $ | 5,383 | $ | 4,741 | ||||||
| Store Closing Costs on Related Party Leases |
— | 2,484 | 1,969 | |||||||||
| Aircraft Lease Expense |
1,946 | 1,949 | 1,950 | |||||||||
| Aircraft Operating Expense |
1,737 | 1,774 | 1,676 | |||||||||
| Reimbursement of General and Administrative Expenses |
(200 | ) | (210 | ) | (210 | ) | ||||||
| Salaries & Wages, General and Administrative, and Other Expenses |
866 | 484 | 567 | |||||||||
| Total General and Administrative Expenses – Related Party |
$ | 10,326 | $ | 11,864 | $ | 10,693 | ||||||
Property Lease Expense – Related Party
At December 31, 2008 and 2009, we leased 18 and 16, respectively, vehicle sales facilities, three reconditioning centers, our former loan servicing center (which is currently being subleased to two third-party tenants), and our corporate office from Verde and another affiliate of Mr. Garcia (the Garcia Family Limited Liability Partnership, LLP). At December 31, 2008 and 2009, we also leased two and one, respectively, used vehicle sales facilities and a reconditioning center from a director and officer of DTAC, who is also Mr. Garcia’s brother-in-law, Steven Johnson. At December 31, 2009, the maturity of these leases ranges from 2013 to 2023.
Store Closing Costs on Related Party Leases
We closed 19 stores and four reconditioning facilities during the year ended December 31, 2008, six of which were facilities we lease from Verde and Steven Johnson. In accordance with ASC 420 – Exit or Disposal Activities (ASC 420), we recorded lease obligations, asset disposal costs, and other closing costs associated with these closures for the year ended December 31, 2008. As of December 31, 2008, $2.1 million remained in accrued expenses and other liabilities – related party on the accompanying combined balance sheet for lease obligations pertaining to these closed facilities. The expiration of these leases at December 31, 2008 range from 2013 to 2018.
We closed an additional nine stores and two reconditioning centers in the year ended December 31, 2009, four of which were facilities we lease from Verde and Steven Johnson. In accordance with ASC 420, we recorded lease obligations, asset disposal costs, and other closing costs associated with these closures. During 2009 we terminated the leases on two of the closed related party facilities and paid $0.4 million in lease termination fees. We remain obligated for related party leases on four closed used car sales facilities, two closed reconditioning centers, and one closed operations facility as of December 31, 2009. We ceased use of former loan servicing center in 2007 and this facility is currently being subleased. We did not incur a lease obligation on this facility since our sublease income is equal to our rent obligation. Approximately $2.3 million remains in accrued expenses and other liabilities – related party on the accompanying combined balance sheets for these lease obligations as of December 31, 2009. The expiration of these leases range from 2013 to 2018.
F-26
Table of Contents
Aircraft Lease and Operating Expenses
In September, 2005, we entered into a lease with Verde for an aircraft. Under the terms of the lease agreement, we agreed to pay monthly lease payments of $150,000 plus taxes to Verde, and are responsible for paying all costs and expenses related to the aircraft and its operations. The lease term is five years.
Reimbursement of General and Administrative Expenses
For the year ended December 31, 2007, we received $50,000 each quarter from Verde as reimbursement of certain general and administrative expenses (discussed below) incurred by us on Verde’s behalf. This amount was $52,500 for each of the quarters in 2008 and 2009.
Salaries and Wages, General and Administrative and Other Expenses
Certain general and administrative expenses and salaries and wages of Verde and Verde employees who are enrolled in our health plan are reflected in our general and administrative expenses – related party.
See Note 11 for further information on future minimum payments on related party leases.
During the years ended December 31, 2007, 2008, and 2009, we recorded related party interest expense and loss on extinguishment of debt as follows:
| Years Ended December 31, | |||||||||
| 2007 | 2008 | 2009 | |||||||
| ($ in thousands) | |||||||||
| Secured Debt Interest Expense – Related Party |
|||||||||
| Junior Secured Notes: |
|||||||||
| Tranche A – Related Party: CEO |
$ | — | $ | 30 | $ | 400 | |||
| Tranche A – Related Party: Verde |
— | — | 2,460 | ||||||
| Tranche B – Related Party: Verde |
— | 450 | 6,035 | ||||||
| $5.0 million Shareholder Note Payable |
— | 140 | — | ||||||
| Total Secured Debt Interest Expense – Related Party |
$ | — | $ | 620 | $ | 8,895 | |||
| Unsecured Debt Interest Expense – Related Party |
|||||||||
| $32.0 million Senior Unsecured Notes Payable |
$ | — | $ | 3,224 | $ | 2,690 | |||
| $75.0 million Subordinated Notes Payable |
— | 5,939 | 9,158 | ||||||
| Total Unsecured Debt Interest Expense – Related Party |
$ | — | $ | 9,163 | $ | 11,848 | |||
| Loss on Extinguishment of Debt, Net – Related Party |
|||||||||
| $32.0 million Senior Unsecured Notes Payable |
$ | — | $ | — | $ | 1,248 | |||
Secured Debt Interest Expense – Related Party
In December 2008, we issued junior secured notes. These notes consist of a Tranche A component and a subordinate Tranche B component. The Tranche A component is comprised of four notes (one of which is a $2.0 million note to Ray Fidel, our Chief Executive Officer) and the Tranche B component is comprised of one subordinate note to Verde. At December 31, 2009, the Tranche A notes bear interest at 22.0% per annum, increasing by 2.0% each year until maturity and the Tranche B notes bears interest at 27.0% per annum, increasing 2.0% each year until maturity.
F-27
Table of Contents
During the year ended December 31, 2009, Verde purchased an aggregate amount of $36.1 million in notes from third-party Tranche A note holders. After these transactions at December 31, 2009, Verde holds $36.1 million of Tranche A junior secured notes and the $24.0 million Tranche B junior secured notes.
In September 2008, our Principal Shareholder provided $5.0 million in cash to us in return for a short term subordinated note bearing interest at 12.0% per annum, due December 2008. The note was collateralized by certain real estate owned by us. As of December 31, 2008 this note was paid in full.
Unsecured Debt Interest Expense – Related Party
In January 2008, Verde purchased $29.0 million face value of our 11.25% senior unsecured notes due 2013. This purchase was made on the open market between Verde and a third-party broker. The purchase price was 70.0% of face value. In May, 2008, Verde subordinated principal and interest on the $29.0 million in notes.
In September 2008, Verde purchased an additional $3.0 million face value of our 11.25% senior unsecured notes due 2013. This purchase was made on the open market between Verde and a third-party broker. The purchase price was 52.0% of face value.
In the second quarter of 2008, Verde provided a total of $75.0 million in cash to us in return for subordinated notes, bearing interest at 12.0% per annum, and with a maturity date of August 2013.
Loss on Extinguishment of Debt – Related Party
In September 2009, we repurchased the $32.0 million face value of our 11.25% senior unsecured notes due 2013, which were held by Verde. This repurchase was made at par and resulted in a net loss on extinguishment of debt of $1.2 million as a result of the write-off of unamortized debt discount and unamortized capitalized loan fees.
Other Related Party Transactions
As of December 31, 2007, Raymond C. Fidel, the Company’s President and Chief Executive Officer, was obligated to Verde for a $5.0 million note payable at a fixed rate of interest of 4.0% per annum. Mr. Fidel satisfied this obligation in January 2008, in connection with Mr. Garcia’s purchase of Mr. Fidel’s 5% ownership interest in each of DTAG and DTAC.
(10) Income Taxes
The combined financial statements consist of DTAG (S-corporation status elected in 2004) and DTAC (an S-corporation since inception). Since DTAC and DTAG are flow through entities for Federal income tax purposes, there is no Federal income tax expense related to the income of DTAC and DTAG, other than for one of DTAG’s wholly-owned subsidiaries, which is a C-corporation. The taxable income flows through to the shareholders who are responsible for paying the associated taxes. Although most states follow the Federal recognition of S-corporation status, some states do impose an entity level tax on that income; therefore, the tax expense is adjusted accordingly. Income tax liability was $1.3 million and $1.1 million as of December 31, 2008 and 2009, respectively.
F-28
Table of Contents
A reconciliation between expected taxes computed at the federal statutory rate of 35% and the effective tax rate on income before income taxes follows:
| December 31, | ||||||||||||
| 2007 | 2008 | 2009 | ||||||||||
| ($ in thousands) | ||||||||||||
| Computed “Expected” Income Taxes |
$ | 25,513 | $ | 1,071 | $ | 19,242 | ||||||
| Non C-Corporation Income |
(24,549 | ) | (252 | ) | (18,576 | ) | ||||||
| State Income Taxes, Net of Federal Benefit |
(625 | ) | — | — | ||||||||
| Entity Level State Income Tax on S Corp. Income |
705 | 450 | 100 | |||||||||
| Other, Net |
(44 | ) | (179 | ) | (36 | ) | ||||||
| $ | 1,000 | $ | 1,090 | $ | 730 | |||||||
|
Components of income tax (benefit) expense are as follows ($ in thousands):
|
|
|||||||||||
| December 31, | ||||||||||||
| 2007 | 2008 | 2009 | ||||||||||
| ($ in thousands) | ||||||||||||
| Current Expense: |
||||||||||||
| Federal |
$ | 920 | $ | 640 | $ | 630 | ||||||
| State |
80 | 450 | 100 | |||||||||
| Deferred |
— | — | — | |||||||||
| Total |
$ | 1,000 | $ | 1,090 | $ | 730 | ||||||
Tax years that remain subject to examination by major tax jurisdictions include tax years 2006, 2007, 2008, and 2009 at the Federal level for DTAC and DTAG. Only Texas and California have S-corporation level tax and generally those returns are open for audit for 2005 and subsequent years.
(11) Lease Commitments
We lease used car sales facilities, reconditioning centers, our former loan servicing center, our corporate office, an aircraft, and certain other office/computer equipment from unrelated and related entities under various operating leases that expire through January 2025. The leases provide for periodic rent increases and many contain escalation clauses and various renewal options from one to ten years. In certain instances, we are also responsible for occupancy and maintenance costs, including real estate taxes, insurance, and utility costs. We recognize rent expense on a straight-line basis over the length of the lease term. Rent expense, including store closing costs, totaled $19.2 million, $21.7 million, and $18.3 million for the years ended December 31, 2007, 2008, and 2009, respectively.
F-29
Table of Contents
A summary of future minimum lease payments required under non-cancelable operating leases with remaining lease terms in excess of one year as of December 31, 2009 follows:
| Related Party |
Non-Related Party |
Total | |||||||
| ($ in thousands) | |||||||||
| Year 1 |
$ | 6,992 | $ | 8,374 | $ | 15,366 | |||
| Year 2 |
5,756 | 5,995 | 11,751 | ||||||
| Year 3 |
5,873 | 4,444 | 10,317 | ||||||
| Year 4 |
5,952 | 3,471 | 9,423 | ||||||
| Year 5 |
5,639 | 2,063 | 7,702 | ||||||
| Thereafter |
17,612 | 2,791 | 20,403 | ||||||
| Total |
$ | 47,824 | $ | 27,138 | $ | 74,962 | |||
A summary of future minimum sub-lease income required under non-cancelable operating leases with remaining lease terms in excess of one year as of December 31, 2009 follows:
| Total | ||
| Year 1 |
1,264 | |
| Year 2 |
1,217 | |
| Year 3 |
1,286 | |
| Year 4 |
565 | |
| Year 5 |
— | |
| Thereafter |
— | |
| Total |
4,332 | |
We closed 19 stores and four reconditioning facilities during the year ended December 31, 2008. In accordance with ASC 420, we recorded an accrual for lease obligations, severance, and asset disposal costs associated with these closures for the year ended December 31, 2008. These amounts were recorded as a component of general and administrative expenses on the accompanying statement of income for the year ended December 31, 2008. As of December 31, 2008, $2.9 million remained in accrued expenses and other liabilities on the accompanying combined balance sheet for lease obligations. The expiration of these leases at December 31, 2008 range from 2010 to 2019.
We closed an additional nine stores and two reconditioning centers in the year ended December 31, 2009. In accordance with ASC 420, we recorded an aggregate amount of $5.2 million in lease obligations, severance, and asset disposal costs associated with these closures for the year ended December 31, 2009. These amounts were recorded as a component of general and administrative expenses on the accompanying combined statement of income. Approximately $4.1 million remains in accrued expenses and other liabilities on the accompanying combined balance sheet for these lease obligations as of December 31, 2009, respectively. At December 31, 2009, the expiration of these leases range from 2010 to 2018.
F-30
Table of Contents
(12) Shareholder’s Equity & Dividends
Prior to December 2009, certain loan covenants limited the amount of cash dividends we may pay to an amount not greater than the percentage of S-corporation taxable income for such quarterly period equal to the highest combined federal, state, and/or local tax rate for individuals. In December 2009, as a result of an amendment of our junior secured notes, we are now permitted to pay cash dividends limited to an amount not greater than the percentage of S-corporation taxable income for such quarterly period equal to the highest combined federal, state, and/or local tax rate for individuals, plus 50% of the difference between taxable earnings less amounts paid for tax.
During the year ended December 31, 2007, we paid $8.1 million in dividends related to 2006 income and $43.1 million in dividends related to 2007 income. We did not have any approved but unpaid dividends at December 31, 2007.
During the year ended December 31, 2008, we paid $12.7 million in dividends related to 2008 income. We did not have any approved but unpaid dividends at December 31, 2008.
During the year ended December 31, 2009, we paid $27.1 million in dividends related to 2009 income. We did not have any approved but unpaid dividends at December 31, 2009.
(13) Commitments and Contingencies
Executive Bonus. In July 2005, we executed an executive bonus plan with certain of our executives. Under the current terms of the plan, we are committed to make six annual contributions beginning May 1, 2006 and for each year thereafter through May 1, 2011 to fund this program. An executive must remain employed by us to receive these benefits. If the executive terminates his employment without cause or is terminated with cause, any unpaid amounts are forfeited. If the executive is terminated without cause (including on account of disability), the executive will receive all amounts that have been contributed to date. The total potential contributions to be paid under this plan are $14.0 million, funded by us over the first six years and paid out to the executive in five equal annual installments beginning May 1, 2011. We are recognizing compensation expense under this plan based upon the service period required to receive payments of ten years (exclusive of acceleration and forfeiture clauses).
For the years ended December 31, 2007, 2008, and 2009, we recognized compensation expense of $1.8 million for each of the three years under this bonus plan. As of December 31, 2008 and 2009, we had $1.8 million and $1.4 million, respectively, recorded as a prepaid asset in the accompanying combined balance sheets, which represents the amount paid in excess of expense recognized. In accordance with the terms of the bonus plan, in May 2006, 2007, and 2008, we made our annual contributions in the amount of $2.8 million for each year. In May 2009, the executives that participate in the plan agreed to amend the scheduled plan contributions to be $1.4 million in May 2009 and May 2010 and $2.8 million in May 2011, in lieu of the originally scheduled $2.8 million in May 2009 and May 2010. At December 31, 2008 and 2009, we had $5.6 million and $4.2 million, respectively, remaining to be funded over the remaining term of the bonus plan.
F-31
Table of Contents
DT Rewards™. Our DT Rewards™ program awarded points to customers for each dollar paid, regardless of whether the payment was paid on time. Points were accumulated and redeemed for a wide array of gifts. The liability for the estimated cost of the program, based on the number of active accounts and the number of eligible points accumulated and historical redemption activity, was adjusted monthly and was charged to selling and marketing expenses. During the third quarter of 2007, we terminated the DT RewardsTM program. The following table reflects activity in the DT RewardsTM accrual:
| Years Ended December 31, | ||||||||||||
| 2007 | 2008 | 2009 | ||||||||||
| ($ in thousands) | ||||||||||||
| Balance, Beginning of Period |
$ | 3,486 | $ | 3,061 | $ | 25 | ||||||
| DT RewardsTM Expense |
732 | — | 7 | |||||||||
| DT RewardsTM Claimed |
— | (2,128 | ) | (11 | ) | |||||||
| DT RewardsTM Forfeitures/Plan Termination |
(1,157 | ) | (908 | ) | (21 | ) | ||||||
| Balance, End of Period |
$ | 3,061 | $ | 25 | $ | — | ||||||
Limited Warranty. The limited warranty accrual is recorded as a component of accrued expenses and other liabilities on the accompanying balance sheets for each year presented. The following table reflects activity in the warranty accrual for the periods indicated:
| Years Ended December 31, | ||||||||||||
| 2007 | 2008 | 2009 | ||||||||||
| ($ in thousands) | ||||||||||||
| Balance, Beginning of Period |
$ | 1,275 | $ | 1,007 | $ | 777 | ||||||
| Warranty Expense |
5,663 | 5,393 | 3,028 | |||||||||
| Warranty Claims Paid |
(5,931 | ) | (5,623 | ) | (2,885 | ) | ||||||
| Balance, End of Period |
$ | 1,007 | $ | 777 | $ | 920 | ||||||
(14) Legal Matters
We are involved in various claims and actions arising in the ordinary course of business. In the opinion of management, based on consultation with legal counsel, the ultimate disposition of these matters will not have a material adverse effect on us. We believe appropriate accruals have been made for the disposition of these matters. In accordance with Statement of Financial Accounting Standards No. 5, Accounting for Contingencies, we established an accrual for a liability when it is both probable that the liability has been incurred and the amount of the loss can be reasonably estimated. These accruals are reviewed monthly and adjusted to reflect the impact of negotiations, settlements and payments, rulings, advice of legal counsel, and other information and events pertaining to a particular case. Legal expenses related to defense, negotiations, settlements, rulings, and advice of outside legal counsel are expensed as incurred.
On June 9, 2009, a former customer filed a complaint in Los Angeles County Superior Court, alleging the post repossession notice sent to plaintiff was materially defective and incomplete. The plaintiff brought the case as a
F-32
Table of Contents
purported class action in a representative capacity under California’s Unfair Competition Law. We mediated the dispute and, although a settlement has not yet been finalized, we believe we have an agreement to resolve the dispute, subject to court approval. As of December 31, 2009, we have accrued for estimated awards and attorney fees, although we do not believe such awards and fees are material to our financial position or results of operations.
On May 12, 2009, we agreed to the resolution of a litigation matter filed against us in federal court (but not served) in April 2009. The settlement related to a lawsuit by a competitor that essentially alleged that we unlawfully paid the competitor’s employees for customer referrals, diverting business from the competitor to us. We disputed the allegations and believe that, in general, the prospects referred did not meet the typical customer profile of the competitor. Nonetheless, we discontinued the practice complained of, and settled the lawsuit without admitting any impropriety or illegality. The resolution also included the payment of $7.6 million to the other party in May 2009. We have no further obligations related to this matter.
In August 2008, we received a Civil Investigative Demand from the Office of Attorney General, Consumer Protection Division, asking for the production of certain materials. The demand indicates it is the subject of an investigation of possible violations of the Deceptive Trade Practices Act, Sections 17.46(a) and (b) in the marketing, advertising, financing, and selling of used cars. We provided the Texas Office of Attorney General with all requested information in August 2008. At that time, we met with the state’s Attorney General’s Office to provide them with an overview of us and discuss the requested materials. At the meeting, we agreed on some minor changes in the requested materials. In addition, the Attorney General’s Office indicated that they would review the materials we provided to them and if there were any concerns they would contact us to meet, discuss and resolve the concerns. We will continue to fully cooperate with the state’s Attorney General’s Office in responding to the demand and any follow up discussions with them. The Texas Attorney General has requested additional information and documentation from time to time, most recently in February 2010 when it requested clarifying information limited to vehicle inspections, after sale repairs, warranty, loan servicing, and consumer concerns. We believe the request is routine in nature and we have responded accordingly. We believe we are in compliance with all applicable state laws and regulations and we intend to continue to cooperate with state officials. We believe we do not have any qualitative or quantitative loss contingencies related to this matter.
We are currently appealing to the Nevada Supreme Court an adverse administrative ruling on the efficacy of certain sales tax refunds we have requested for the 2002 and 2003 tax years. While only applicable to 2002 and 2003, an adverse ruling could affect subsequent tax years as well. In several of our states, we file for and receive sales tax refunds for sales taxes paid on retail installment sales of the amount related to that portion of the sales price ultimately not collected from our customers. Prior to this adverse ruling, the Department of Taxation of the State of Nevada had, in an audit of tax years 1998-2001, allowed such refunds. The Department is now taking the position that because the contracts are assigned to our related finance company (which they were in certain of our prior periods as well) we are not entitled to the refund. We are vigorously pursuing our rights to the refunds and believe we have a positive position and will prevail in this proceeding. Total sales tax refunds from 2002 through 2009 were $4.6 million. We have not accrued any amounts with respect to this matter.
Additionally, in the ordinary course of business, we are a defendant in various other types of legal proceedings. Although we cannot determine at this time the amount of the ultimate exposure from these lawsuits, if any, based on the advice of counsel management does not expect the final outcome to have a material adverse effect on us.
F-33
Table of Contents
(15) Retirement Plan
We established a qualified 401(k) retirement plan (defined contribution plan), which became effective on October 1, 1995. The plan, as amended, covers substantially all employees having no less than 60 days of service, who have attained the age of 18, and work at least 1,000 hours per year. Participants may voluntarily contribute to the plan up to the maximum limits established by Internal Revenue Service regulations. In 2007, 2008, and 2009, we provided a matching contribution of cash in the amount of 40%, up to the first 6% of each employee’s deferrals. Compensation expense related to this plan totaled $0.9 million, $0.8 million, and $0.7 million for the years ended December 31, 2007, 2008, and 2009, respectively.
(16) Fair Value of Financial Instruments
Generally Accepted Accounting Principles require that we disclose estimated fair values for our financial instruments. Fair values are based on estimates using quoted market prices, discounted cash flows, or other valuation techniques. Those techniques are significantly affected by the assumptions used, including the discount rate and the estimated timing and amount of future cash flows. Therefore, the estimates of fair value may differ substantially from amounts that ultimately may be realized or paid at settlement or maturity of the financial instruments and those differences may be material. Accordingly, the aggregate fair value amounts presented do not represent our underlying value. The following summary presents a description of the methodologies and assumptions used to determine such amounts.
Limitations – Fair value estimates are made at a specific point in time and are based on relevant market information and information about the financial instrument; they are subjective in nature and involve uncertainties, matters of judgment and, therefore, cannot be determined with ultimate precision. These estimates do not reflect any premium or discount that could result from offering for sale at one time our entire holdings of a particular instrument. Changes in assumptions could significantly affect these estimates.
Since the fair value is estimated as of each balance sheet date presented, the amounts that will actually be realized or paid in settlement of the instruments could be significantly different.
The following is a summary of carrying value and fair value of our financial instruments for each period presented:
| December 31, 2008 | December 31, 2009 | |||||||||||
| Carrying Value |
Fair Value |
Carrying Value |
Fair Value | |||||||||
| ($ in thousands) | ||||||||||||
| Finance Receivables, Net (1) |
$ | 1,112,145 | $ | 1,063,308 | $ | 1,104,763 | $ | 1,133,936 | ||||
| Portfolio Warehouse Facilities |
398,093 | 398,093 | 77,506 | 77,506 | ||||||||
| Repurchase Facility |
46,694 | 46,694 | 12,231 | 12,231 | ||||||||
| Pooled Auto Loan Program Financings |
152,591 | 152,591 | 527,324 | 545,400 | ||||||||
| Securitization Debt |
181,938 | 145,966 | 268,533 | 269,461 | ||||||||
| Revolving Inventory Facility |
64,564 | 64,564 | 50,000 | 50,000 | ||||||||
| Junior Secured Notes Payable |
55,100 | 55,100 | 62,088 | 62,088 | ||||||||
| Mortgage Note Payable |
13,221 | 13,221 | |
13,046 |
9,400 | |||||||
| Senior Unsecured Notes Payable |
119,866 | 73,700 | 1,487 | 1,487 | ||||||||
| Subordinated Notes Payable |
75,000 | 48,000 | 75,000 | 69,000 | ||||||||
| (1) | Represents finance receivable principal balances, plus accrued interest, less the allowance for credit losses. |
F-34
Table of Contents
Valuation Methodologies
Finance Receivables. The fair value of finance receivables was estimated by discounting future cash flows expected to be collected using current rates at which similar loans would be made to borrowers with similar credit ratings and the same remaining maturities. This discounted cash flow is estimated utilizing internal valuation models, which use a combination of market inputs (i.e. discount rates for similar and like transactions) and our own assumptions regarding credit losses, recoveries, and prepayment rates in our portfolio. We estimate the cash flow of the portfolio and the cash flow of our retained interest in securitization and PALP transactions in measuring total cash flow. These cash flows are developed on a leveraged basis since our receivable portfolio is financed by these debt instruments and are not separable transactions.
Portfolio Warehouse Facilities. The portfolio warehouse facilities are short term in nature and the interest rates adjust in conjunction with the lender’s cost of funds or 30-day LIBOR. In November 2007, we entered into a second warehouse facility with the same terms and rates as our then-existing facility. Since this facility was executed in close proximity to December 31, 2007, and contains a floating market rate of interest, the fair value of these facilities approximates carrying value at December 31, 2007. In December 2008, our warehouse facilities were amended, with changes to interest rates, term, and advance rates; therefore, fair value at December 31, 2008 approximates carrying value. On July 31, 2009, we terminated one of our warehouse facilities and amended and extended the other facility, with amendments to term, rate, and advance rates. Since this facility was amended to market in close proximity to December 31, 2009, fair value at December 31, 2009 approximates carrying value.
Repurchase Facility. This facility was a 30-day rolling instrument with interest based on LIBOR. Since the lender had the ability to change or call the debt due each 30 days, the fair value of this facility approximated carrying value at December 31, 2008. The fair value of the repurchase facility debt at December 31, 2009 approximates carrying value since this debt instrument was executed in December 2009 and is a rolling facility which can be renewed or terminated at the lender’s option, every 30 days.
Pooled Auto Loan Program Financings. In November and December 2008, we entered into two PALP agreements. Since these instruments were executed within close proximity of December 31, 2008, the fair value of this debt approximates carrying value at December 31, 2008. In July 2009, we entered into a new PALP financing agreement which provides for the monthly sale of finance receivables through July 2010. This agreement also conformed the terms, except for interest rates which remained unchanged for prior transactions, of any previous PALP transactions to this lender to be one and the same. Therefore, the fair value of PALP debt at December 31, 2009 is based on third party discounted cash flow using market interest rates for this debt.
Securitization Debt. The fair value of securitization debt was estimated using third party quoted market prices.
Revolving Inventory Facility. The revolving inventory facility was renewed in August 2007, August 2008, and August 2009, with each renewal for a 12 month term. Since the term and interest rate of this facility did not materially change from period to period, fair value approximates carrying value at December 31, 2007 and 2008. At December 31, 2009 fair value of the inventory facility was determined third party discounted cash flow using market interest rates for this debt.
Junior Secured Notes Payable. At December 31, 2008, the terms of our junior secured notes payable approximate the terms in the market place at which they could be replaced. These notes were executed in December 2008 under then current market conditions. Therefore, the fair value approximates the carrying value of these financial instruments. At December 31, 2009, the fair value of these notes was determined using a third-party valuation based on similar types of debt instruments. The valuation resulted in fair value equal to carrying value due to a pre-payment option on these notes.
F-35
Table of Contents
Mortgage Note Payable. This note was executed in February 2007 and bears a fixed rate of interest. Since mortgage interest rates on commercial properties did not change significantly from February 2007 to December 2007 and 2008, fair value approximates market value at December 31, 2007 and 2008. At December 31, 2009, the fair value of this note was determined using third-party market prices for similar commercial real estate mortgages.
Senior Unsecured Notes Payable. The fair value at December 31, 2007 and 2008 was determined using the prices that were paid for purchases of portions of this debt by us or our shareholder from third-party holders. At December 31, 2009, the fair value of the senior unsecured notes was determined by using our repurchase of $32.0 million of senior notes in September 2009 at a price of par.
Subordinated Notes Payable. At December 31, 2008 and 2009, fair value of these notes was determined using a third-party valuation based on similar types of debt instruments.
F-36
Table of Contents
(17) Subsequent Events – Unaudited
We have evaluated subsequent events for potential recognition and/or disclosure through March 19, 2010. There are no subsequent events to recognize or disclose.
(20) Quarterly Financial Data – Unaudited
A summary of the quarterly financial data follows:
| First Quarter |
Second Quarter |
Third Quarter |
Fourth Quarter |
Total | |||||||||||||
| ($ in thousands) | |||||||||||||||||
| 2009: |
|||||||||||||||||
| Total Revenue |
$ | 286,745 | $ | 233,025 | $ | 233,165 | $ | 193,347 | $ | 946,282 | |||||||
| Costs and Expenses (1) |
$ | 274,675 | $ | 194,636 | $ | 223,676 | $ | 198,318 | $ | 891,305 | |||||||
| Income / (loss) before Income Taxes |
$ | 12,070 | $ | 38,389 | $ | 9,489 | $ | (4,971 | ) | $ | 54,977 | ||||||
| Net Income |
$ | 11,700 | $ | 38,099 | $ | 9,379 | $ | (4,931 | ) | $ | 54,247 | ||||||
| First Quarter |
Second Quarter |
Third Quarter |
Fourth Quarter |
Total | |||||||||||||
| ($ in thousands) | |||||||||||||||||
| 2008: |
|||||||||||||||||
| Total Revenue |
$ | 364,998 | $ | 249,976 | $ | 241,207 | $ | 202,444 | $ | 1,058,625 | |||||||
| Costs and Expenses (1) |
$ | 342,363 | $ | 255,945 | $ | 235,774 | $ | 221,483 | $ | 1,055,565 | |||||||
| Income / (loss) before Income Taxes |
$ | 22,635 | $ | (5,969 | ) | $ | 5,433 | $ | (19,039 | ) | $ | 3,060 | |||||
| Net Income / (Loss) |
$ | 22,215 | $ | (6,419 | ) | $ | 5,363 | $ | (19,189 | ) | $ | 1,970 | |||||
| First Quarter |
Second Quarter |
Third Quarter |
Fourth Quarter |
Total | |||||||||||||
| ($ in thousands) | |||||||||||||||||
| 2007: |
|||||||||||||||||
| Total Revenue |
$ | 374,276 | $ | 288,619 | $ | 289,683 | $ | 261,671 | $ | 1,214,249 | |||||||
| Costs and Expenses |
$ | 328,965 | $ | 259,251 | $ | 285,592 | $ | 267,546 | $ | 1,141,354 | |||||||
| Income / (loss) before Income Taxes |
$ | 45,311 | $ | 29,368 | $ | 4,091 | $ | (5,875 | ) | $ | 72,895 | ||||||
| Net Income / (Loss) |
$ | 44,811 | $ | 28,779 | $ | 3,841 | $ | (5,536 | ) | $ | 71,895 | ||||||
| First Quarter |
Second Quarter |
Third Quarter |
Fourth Quarter |
Total | |||||||||||||
| ($ in thousands) | |||||||||||||||||
| 2006: |
|||||||||||||||||
| Total Revenue |
$ | 280,771 | $ | 239,303 | $ | 266,016 | $ | 242,724 | $ | 1,028,814 | |||||||
| Costs and Expenses |
$ | 249,627 | $ | 212,708 | $ | 251,770 | $ | 233,023 | $ | 947,128 | |||||||
| Income before Income Taxes |
$ | 31,144 | $ | 26,595 | $ | 14,246 | $ | 9,701 | $ | 81,686 | |||||||
| Net Income |
$ | 32,073 | $ | 26,395 | $ | 14,203 | $ | 10,441 | $ | 83,112 | |||||||
| (1) | Includes net gains on extinguishment of debt. |
F-37
Table of Contents

| Jefferies & Company | Stephens Inc. |
,2010
Table of Contents
Part II
Information Not Required in Prospectus
| Item 13. | Other expenses of issuance and distribution. |
The following are the estimated expenses to be incurred in connection with the issuance and distribution of the securities registered under this registration statement, other than underwriting discounts and commissions. All amounts shown are estimates except the SEC registration fee and the Financial Industry Regulatory Authority, Inc. filing fee. The following expenses will be borne solely by the registrant.
| SEC registration fee |
$ | 14,260 | |
| FINRA filing fee |
$ | 20,500 | |
| Exchange listing fee |
* | ||
| Legal fees and expenses |
* | ||
| Accounting fees and expenses |
* | ||
| Printing expenses |
* | ||
| Transfer agent fees and expenses |
* | ||
| Miscellaneous expenses |
* | ||
| Total |
$ | * | |
| * | To be filed by amendment |
| Item 14. | Indemnification of directors and officers. |
Section 145(a) of the DGCL provides, in general, that a corporation may indemnify any person who was or is a party or is threatened to be made a party to any threatened, pending, or completed action, suit, or proceeding, whether civil, criminal, administrative, or investigative (other than an action by or in the right of the corporation), because he or she is or was a director, officer, employee, or agent of the corporation, or is or was serving at the request of the corporation as a director, officer, employee, or agent of another corporation, partnership, joint venture, trust, or other enterprise, against expenses (including attorneys’ fees), judgments, fines, and amounts paid in settlement actually and reasonably incurred by the person in connection with such action, suit, or proceeding, if he or she acted in good faith and in a manner he or she reasonably believed to be in or not opposed to the best interests of the corporation and, with respect to any criminal action or proceeding, had no reasonable cause to believe his or her conduct was unlawful.
Section 145(b) of the DGCL provides, in general, that a corporation may indemnify any person who was or is a party or is threatened to be made a party to any threatened, pending, or completed action or suit by or in the right of the corporation to procure a judgment in its favor because the person is or was a director, officer, employee, or agent of the corporation, or is or was serving at the request of the corporation as a director, officer, employee, or agent of another corporation, partnership, joint venture, trust, or other enterprise, against expenses (including attorneys’ fees) actually and reasonably incurred by the person in connection with the defense or settlement of such action or suit if he or she acted in good faith and in a manner he or she reasonably believed to be in or not opposed to the best interests of the corporation, except that no indemnification shall be made with respect to any claim, issue, or matter as to which he or she shall have been adjudged to be liable to the corporation unless and only to the extent that the Court of Chancery or other adjudicating court determines that, despite the adjudication of liability but in view of all of the circumstances of the case, he or she is fairly and reasonably entitled to indemnity for such expenses which the Court of Chancery or other adjudicating court shall deem proper.
II-1
Table of Contents
Section 145(g) of the DGCL provides, in general, that a corporation may purchase and maintain insurance on behalf of any person who is or was a director, officer, employee, or agent of the corporation, or is or was serving at the request of the corporation as a director, officer, employee, or agent of another corporation, partnership, joint venture, trust or other enterprise against any liability asserted against such person and incurred by such person in any such capacity, or arising out of his or her status as such, whether or not the corporation would have the power to indemnify the person against such liability under Section 145 of the DGCL.
Our amended and restated bylaws that will be in effect upon completion of this offering will provide that we will indemnify, to the fullest extend permitted by the DGCL, any person who was or is made or is threatened to be made a party or is otherwise involved in any action, suit, or proceeding, whether civil, criminal, administrative, or investigative, by reason of the fact that he, or a person for whom he is the legal representative, is or was one of our directors or officers or, while serving as one of our directors or officers, is or was serving at our request as a director, officer, employee, or agent of another corporation or of another entity, against all liability and loss suffered and expenses (including attorneys’ fees) reasonably incurred by such person, subject to limited exceptions relating to indemnity in connection with a proceeding (or part thereof) initiated by such person. Our amended and restated bylaws that will be in effect upon completion of this offering will further provide for the advancement of expenses to each of our officers and directors.
Our amended and restated charter that will be in effect upon completion of this offering will provide that, to the fullest extent permitted by the DGCL, as the same exists or may be amended from time to time, our directors shall not be personally liable to us or our shareholders for monetary damages for breach of fiduciary duty as a director. Under Section 102(b)(7) of the DGCL, the personal liability of a director to the corporation or its shareholders for monetary damages for breach of fiduciary duty can be limited or eliminated except (i) for any breach of the director’s duty of loyalty to the corporation or its shareholders; (ii) for acts or omissions not in good faith or which involve intentional misconduct or a knowing violation of law; (iii) under Section 174 of the DGCL (relating to unlawful payment of dividend or unlawful stock purchase or redemption); or (iv) for any transaction from which the director derived an improper personal benefit.
We also intend to maintain a general liability insurance policy which covers certain liabilities of our directors and officers arising out of claims based on acts or omissions in their capacities as directors or officers, whether or not we would have the power to indemnify such person against such liability under the DGCL or the provisions of charter or bylaws.
In connection with the sale of common stock being registered hereby, we intend to enter into indemnification agreements with each of our directors and our executive officers. These agreements will provide that we will indemnify each of our directors and such officers to the fullest extent permitted by law and by our amended and restated charter and amended and restated bylaws.
In any underwriting agreement we enter into in connection with the sale of common stock being registered hereby, the underwriters will agree to indemnify, under certain conditions, us, our directors, our officers and persons who control us, within the meaning of the Securities Act, against certain liabilities.
II-2
Table of Contents
| Item 15. | Recent sales of unregistered securities. |
In the three years preceding the filing of this registration statement, we have issued the following securities that were not registered under the Securities Act:
Junior secured notes
In December 2008, we issued $55.1 million in aggregate principal amount of our junior secured notes outstanding due 2012. At the time of issuance, these notes consisted of a $31.1 million Tranche A component and a $24.0 million subordinate Tranche B component. The Tranche A component is comprised of four notes (one of which is a $2.0 million note to Ray Fidel, our Chief Executive Officer) and the Tranche B component is comprised of one subordinate note to Verde, an affiliate of Ernest C. Garcia II, our Chairman and sole shareholder. The Tranche A notes bear interest at 20.0% per annum, increasing by 2.0% each year until maturity. The Tranche B note bears interest at 25.0% per annum, increasing 2.0% each year until maturity. Effective June 2009, we issued an additional $10.0 million principal amount of Tranche A notes. Purchasers in the offerings were accredited investors. The sales were made by us in reliance on Section 4(2) of the Securities Act.
Subordinated notes
In April and May 2008, we issued an aggregate of $75.0 million in subordinated notes to Verde, an affiliate of Ernest C. Garcia II, our Chairman and sole shareholder, which notes bear interest at 12% per annum and mature August 2013. The sales were made by us in reliance on Section 4(2) of the Securities Act.
Senior unsecured notes
In September 2005, we issued an aggregate of $80.0 million in senior unsecured notes due 2010, which notes had an effective interest rate of 12.65%. The sales were made to accredited investors in reliance on Section 4(2) of the Securities Act. In July 2007, we exchanged $78.5 million of the $80.0 million senior unsecured notes due 2010, for notes on similar terms due 2013, and we issued an additional $56.5 million in senior unsecured notes due 2013 with an effective rate of 12.4%. The sales were made by us in reliance on Section 4(2) of the Securities Act.
Securitizations
Historically, from time to time, we securitized portfolios of finance receivables. In such situations, we would sell loans originated at our dealerships to our bankruptcy-remote securitization subsidiaries that transferred the loans to separate trusts that issued notes and certificates collateralized by the loans. The senior class or “Class A” notes were sold to investors, and the subordinate classes of notes and certificates were retained by us and used as collateral for borrowings under our residual credit facility. Each securitization was set up for an initial sale, and subsequent sales could be made subject to certain conditions. All such sales were made by us in reliance on Section 4(2) of the Securities Act. The following table is a summary of the securitization transactions we completed within the last four years.
| Securitization |
Date of Issuance |
Original Note Amount | ||
| 2006-A |
May 2006 | $240.0 million | ||
| 2006-B |
November 2006 | $305.0 million | ||
| 2007-A |
June 2007 | $320.0 million | ||
| 2009-D |
December 2009 | $192.6 million |
II-3
Table of Contents
| Item 16. | Exhibits. |
(a) Exhibits.
| Number |
Description | |
| 1.1 | Form of Underwriting Agreement* | |
| 3.1 | Amended and Restated Certificate of Incorporation* | |
| 3.2 | Amended and Restated Bylaws* | |
| 4.1 | Specimen of Stock Certificate* | |
| 5.1 | Opinion of DLA Piper LLP (US)* | |
| 10.1 | 2010 Equity Incentive Plan*† | |
| 10.2 | DriveTime Executive Long Term Incentive Plan**† | |
| 10.3 | Executive Bonus Agreement, dated as of July 13, 2005, by and among DriveTime Automotive Group, Inc., DT Acceptance Corporation, and Mark Sauder**† | |
| 10.4 | First Amendment to Executive Bonus Agreement, dated as of January 1, 2009, by and among DriveTime Automotive Group, Inc., DT Acceptance Corporation, and Mark Sauder**† | |
| 10.5 | Executive Bonus Agreement, dated as of July 13, 2005, by and among DriveTime Automotive Group, Inc., DT Acceptance Corporation, and Al Appelman**† | |
| 10.6 | First Amendment to Executive Bonus Agreement, dated as of January 1, 2009, by and among DriveTime Automotive Group, Inc., DT Acceptance Corporation, and Al Appelman**† | |
| 10.7 | Executive Bonus Agreement, dated as of July 13, 2005, by and among DriveTime Automotive Group, Inc., DT Acceptance Corporation, and Jon Ehlinger**† | |
| 10.8 | First Amendment to Executive Bonus Agreement, dated as of January 1, 2009, by and among DriveTime Automotive Group, Inc., DT Acceptance Corporation, and Jon Ehlinger**† | |
| 10.9 | Form of Director and Officer Indemnity Agreement* | |
| 10.10 | Third Amended and Restated Loan and Security Agreement, dated as of August 10, 2009, by and among DriveTime Automotive Group, Inc., DriveTime Sales and Finance Corporation, DriveTime Car Sales, Inc., Manheim Automotive Financial Services, Inc., and Santander Consumer USA, Inc.*** | |
| 10.11 | Amended and Restated Loan and Servicing Agreement, dated as of July 31, 2009, by and among DT Warehouse, LLC, DT Credit Corporation, Wells Fargo Bank, National Association, Deutsche Bank AG, New York Branch, and the other parties named therein*** | |
| 10.12 | Amended and Restated Sale and Servicing Agreement, dated July 31, 2009, by and among DT Acceptance Corporation, DT Credit Corporation, Santander Consumer USA, Inc., and Wells Fargo Bank, National Association** | |
| 21.1 | Subsidiaries of the registrant** | |
| 23.1 | Consent of DLA Piper LLP (US) (included in Exhibit 5.1)* | |
II-4
Table of Contents
| Number |
Description | |
| 23.2 | Consent of Grant Thornton LLP | |
| 24.1 | Power of Attorney** | |
| 99.1 | Consent of Keith W. Hughes** | |
| 99.2 | Consent of James K. Hunt** | |
| 99.3 | Consent of MaryAnn N. Keller** | |
| 99.4 | Consent of James D. Wallace** | |
| 99.5 | Consent of Donald J. Sanders** | |
Certain instruments with respect to long-term debt of the registrant and it’s consolidated subsidiaries are not filed herewith pursuant to Item 601(b)(4)(iii) of Regulation S-K since the total amount of securities authorized under each such instrument does not exceed 10% of the total assets of the registrant and its subsidiaries on a consolidated basis. The registrant agrees to furnish a copy of any such instrument to the SEC upon request.
| * | To be filed by amendment. |
| ** | Previously filed |
| *** | Previously filed. Certain confidential information contained in this exhibit was omitted by means of redacting a portion of the text and replacing it with an asterisk. This exhibit has been filed separately with the Secretary of the SEC without the redaction pursuant to a Confidential Treatment Request under Rule 406 of the Securities Act. |
| † | Indicates a management contract or any compensatory plan, contract, or arrangement. |
II-5
Table of Contents
| Item 17. | Undertakings. |
Insofar as indemnification for liabilities arising under the Securities Act may be permitted to our directors, officers, and controlling persons pursuant to the foregoing provisions, or otherwise, we have been advised that in the opinion of the SEC such indemnification is against public policy as expressed in the Securities Act and is, therefore, unenforceable. In the event that a claim for indemnification against such liabilities (other than the payment by us of expenses incurred or paid by a director, officer, or controlling person of us in the successful defense of any action, suit, or proceeding) is asserted by such director, officer, or controlling person in connection with the securities being registered, we will, unless in the opinion of counsel the matter has been settled by controlling precedent, submit to a court of appropriate jurisdiction the question whether such indemnification by us is against public policy as expressed in the Securities Act and will be governed by the final adjudication of such issue.
The undersigned registrant hereby undertakes to provide to the underwriters at the closing specified in the underwriting agreement, certificates in such denominations and registered in such names as required by the underwriters to permit prompt delivery to each purchaser.
We hereby undertake that:
| (i) | for purposes of determining any liability under the Securities Act, the information omitted from the form of prospectus filed as part of this registration statement in reliance upon Rule 430A and contained in a form of prospectus filed by the registrant pursuant to Rule 424(b)(1) or (4) or 497(h) under the Securities Act shall be deemed to be part of this registration statement as of the time it was declared effective. |
| (ii) | for purposes of determining any liability under the Securities Act, each post-effective amendment that contains a form of prospectus shall be deemed to be a new registration statement relating to the securities offered therein, and the offering of such securities at that time shall be deemed to be the initial bona fide offering thereof. |
| (iii) | for the purpose of determining liability under the Securities Act to any purchaser, each prospectus filed pursuant to Rule 424(b) as part of a registration statement relating to an offering, other than registration statements relying on Rule 430B or other than prospectuses filed in reliance on Rule 430A, shall be deemed to be part of and included in the registration statement as of the date it is first used after effectiveness. Provided, however, that no statement made in a registration statement or prospectus that is part of the registration statement or made in a document incorporated or deemed incorporated by reference into the registration statement or prospectus that is part of the registration statement will, as to a purchaser with a time of contract of sale prior to such first use, supersede or modify any statement that was made in the registration statement or prospectus that was part of the registration statement or made in any such document immediately prior to such date of first use; and |
| (iv) | for the purpose of determining liability of the registrant under the Securities Act to any purchaser in the initial distribution of the securities: The undersigned registrant undertakes that in a primary offering of securities of the undersigned registrant pursuant to this registration statement, regardless of the underwriting method used to sell the securities to the purchaser, if the securities are offered or sold to such purchaser by means of any of the following communications, the undersigned registrant will be a seller to the purchaser and will be considered to offer or sell such securities to such purchaser: |
| (a) | Any preliminary prospectus or prospectus of the undersigned registrant relating to the offering required to be filed pursuant to Rule 424; |
II-6
Table of Contents
| (b) | Any free writing prospectus relating to the offering prepared by or on behalf of the undersigned registrant or used or referred to by the undersigned registrant; |
| (c) | The portion of any other free writing prospectus relating to the offering containing material information about the undersigned registrant or its securities provided by or on behalf of the undersigned registrant; and |
| (d) | Any other communication that is an offer in the offering made by the undersigned registrant to the purchaser. |
II-7
Table of Contents
Signatures
Pursuant to the requirements of the Securities Act of 1933, the registrant has duly caused this registration statement to be signed on its behalf by the undersigned, thereunto duly authorized, in the City of Phoenix, State of Arizona on March 19, 2010.
| DRIVETIME AUTOMOTIVE, INC. | ||
| By: |
/s/ RAYMOND C. FIDEL | |
| Raymond C. Fidel | ||
| President and Chief Executive Officer | ||
Pursuant to the requirements of the Securities Act, this registration statement and the Power of Attorney has been signed by the following persons in the capacities and on the dates indicated.
| Signature |
Title |
Date | ||
| * Ernest C. Garcia II |
Chairman | March 19, 2010 | ||
| * Raymond C. Fidel |
Director, President, and Chief Executive Officer (Principal Executive Officer) |
March 19, 2010 | ||
| * Mark G. Sauder |
Chief Financial Officer and Executive Vice President (Principal Financial and Principal Accounting Officer) | March 19, 2010 | ||
| * By: | /S/ RAYMOND C. FIDEL | |
| Raymond C. Fidel | ||
| Attorney in Fact |
II-8
Table of Contents
Exhibit Index
| Number |
Description | |
| 1.1 | Form of Underwriting Agreement* | |
| 3.1 | Amended and Restated Certificate of Incorporation* | |
| 3.2 | Amended and Restated Bylaws* | |
| 4.1 | Specimen of Stock Certificate* | |
| 5.1 | Opinion of DLA Piper LLP (US)* | |
| 10.1 | 2010 Equity Incentive Plan*† | |
| 10.2 | DriveTime Executive Long Term Incentive Plan**† | |
| 10.3 | Executive Bonus Agreement, dated as of July 13, 2005, by and among DriveTime Automotive Group, Inc., DT Acceptance Corporation, and Mark Sauder**† | |
| 10.4 | First Amendment to Executive Bonus Agreement, dated as of January 1, 2009, by and among DriveTime Automotive Group, Inc., DT Acceptance Corporation, and Mark Sauder**† | |
| 10.5 | Executive Bonus Agreement, dated as of July 13, 2005, by and among DriveTime Automotive Group, Inc., DT Acceptance Corporation, and Al Appelman**† | |
| 10.6 | First Amendment to Executive Bonus Agreement, dated as of January 1, 2009, by and among DriveTime Automotive Group, Inc., DT Acceptance Corporation, and Al Appelman**† | |
| 10.7 | Executive Bonus Agreement, dated as of July 13, 2005, by and among DriveTime Automotive Group, Inc., DT Acceptance Corporation, and Jon Ehlinger**† | |
| 10.8 | First Amendment to Executive Bonus Agreement, dated as of January 1, 2009, by and among DriveTime Automotive Group, Inc., DT Acceptance Corporation, and Jon Ehlinger**† | |
| 10.9 | Form of Director and Officer Indemnity Agreement* | |
| 10.10 | Third Amended and Restated Loan and Security Agreement, dated as of August 10, 2009, by and among DriveTime Automotive Group, Inc., DriveTime Sales and Finance Corporation, DriveTime Car Sales, Inc., Manheim Automotive Financial Services, Inc., and Santander Consumer USA, Inc.*** | |
| 10.11 | Amended and Restated Loan and Servicing Agreement, dated as of July 31, 2009, by and among DT Warehouse, LLC, DT Credit Corporation, Wells Fargo Bank, National Association, Deutsche Bank AG, New York Branch, and the other parties named therein*** | |
| 10.12 | Amended and Restated Sale and Servicing Agreement, dated July 31, 2009, by and among DT Acceptance Corporation, DT Credit Corporation, Santander Consumer USA, Inc., and Wells Fargo Bank, National Association** | |
| 21.1 | Subsidiaries of the registrant** | |
| 23.1 | Consent of DLA Piper LLP (US) (included in Exhibit 5.1)* | |
| 23.2 | Consent of Grant Thornton LLP | |
| 24.1 | Power of Attorney** | |
| 99.1 | Consent of Keith W. Hughes** | |
Table of Contents
| Number |
Description | |
| 99.2 | Consent of James K. Hunt** | |
| 99.3 | Consent of MaryAnn N. Keller** | |
| 99.4 | Consent of James D. Wallace** | |
| 99.5 | Consent of Donald J. Sanders** | |
Certain instruments with respect to long-term debt of the registrant and it’s consolidated subsidiaries are not filed herewith pursuant to Item 601(b)(4)(iii) of Regulation S-K since the total amount of securities authorized under each such instrument does not exceed 10% of the total assets of the registrant and its subsidiaries on a consolidated basis. The registrant agrees to furnish a copy of any such instrument to the SEC upon request.
| * | To be filed by amendment. |
| ** | Previously filed. |
| *** | Previously filed. Certain confidential information contained in this exhibit was omitted by means of redacting a portion of the text and replacing it with an asterisk. This exhibit has been filed separately with the Secretary of the SEC without the redaction pursuant to a Confidential Treatment Request under Rule 406 of the Securities Act. |
| † | Indicates a management contract or any compensatory plan, contract, or arrangement. |