Attached files
Table of Contents
UNITED STATES
SECURITIES AND EXCHANGE COMMISSION
Washington, D.C. 20549
FORM 10-K
(MARK ONE)
| x | ANNUAL REPORT PURSUANT TO SECTION 13 OR 15(d) OF THE SECURITIES EXCHANGE ACT OF 1934 |
For the fiscal year ended December 31, 2009
OR
| ¨ | TRANSITION REPORT PURSUANT TO SECTION 13 OR 15(d) OF THE SECURITIES EXCHANGE ACT OF 1934 |
FOR THE TRANSITION PERIOD FROM TO
Commission file number 0-26944
SILICON STORAGE TECHNOLOGY, INC.
(Exact name of Registrant as Specified in its Charter)

| California | 77-0225590 | |
| (State or Other Jurisdiction of Incorporation or Organization) |
(I.R.S. Employer Identification Number) |
1020 Kifer Road
Sunnyvale, California 94086
(Address of Principal Executive Offices including Zip Code)
(408) 735-9110
(Registrant’s Telephone Number, Including Area Code)
Securities registered pursuant to Section 12(b) of the Act:
| Title of each class |
Name of each exchange on which registered | |
| Common Stock, no par value | The NASDAQ Stock Market LLC (NASDAQ Global Market) |
Securities registered pursuant to Section 12(g) of the Act: None
Indicate by check mark if the registrant is a well-known seasoned issuer, as defined in Rule 405 of the Securities Act. Yes ¨ No x
Indicate by check mark if the registrant is not required to file reports pursuant to Section 13 or Section 15(d) of the Act. Yes ¨ No x
Indicate by check mark whether the registrant (1) has filed all reports required to be filed by Section 13 or 15(d) of the Securities Exchange Act of 1934 during the preceding 12 months, (or for such shorter period that the registrant was required to file such reports), and (2) has been subject to such filing requirements for the past 90 days. Yes x No ¨
Indicate by check mark whether the registrant has submitted electronically and posted on its corporate Web site, if any, every Interactive Data File required to be submitted and posted pursuant to Rule 405 of Regulation S-T (§ 232.405 of this chapter) during the preceding 12 months (or for such shorter period that the registrant was required to submit and post such files). Yes ¨ No ¨
Indicate by check mark if disclosure of delinquent filers pursuant to Item 405 of Regulation S-K is not contained herein, and will not be contained, to the best of registrant’s knowledge, in definitive proxy or information statements incorporated by reference in Part III of this Form 10-K, or any amendment to this Form 10-K. ¨
Indicate by check mark whether the registrant is a large accelerated filer, an accelerated filer, a non-accelerated filer or smaller reporting company. See definitions of “large accelerated filer,” “accelerated filer” and “smaller reporting company” in Rule 12b-2 of the Exchange Act. (Check one):
| Large accelerated filer ¨ | Accelerated filer x | Non-accelerated filer ¨ | Smaller reporting company ¨ | |||
| (Do not check if a smaller reporting company) |
Indicate by check mark whether the registrant is a shell company (as defined in Rule 12b-2 of the Exchange Act). Yes ¨ No x
The aggregate market value of the voting stock held by non-affiliates of the registrant as of June 30, 2009 was $147,122,772 based on the adjusted closing price of the registrant’s common stock as reported on the NASDAQ Global Market. Shares of the registrant’s common stock held by each officer and director and affiliated entities who own 5% or more of the outstanding common stock of the registrant have been excluded in that such persons and entities may be deemed to be affiliates. This determination of affiliate status is not necessarily a conclusive determination for other purposes. This calculation does not exclude shares held by persons or entities whose ownership exceeds 5% of the registrant’s common stock that have represented to the registrant that they are registered investment advisers or investment companies registered under Section 8 of the Investment Company Act of 1940.
Number of shares outstanding of SST’s Common Stock, no par value, as of the latest practicable date, March 8, 2010: 115,395,609
Table of Contents
Silicon Storage Technology, Inc.
Form 10-K
For the Year Ended December 31, 2009
2
Table of Contents
PART I
| Item 1. | Business |
Forward Looking Statements
This Annual Report on Form 10-K contains forward-looking statements within the meaning of Section 27A of the Securities Act of 1933, as amended, and Section 21E of the Securities Exchange Act of 1934, as amended, which are subject to the “safe harbor” created by those sections. Forward-looking statements are based on our management’s beliefs and assumptions and on information currently available to our management. In some cases, you can identify forward-looking statements by terms such as “may,” “will,” “should,” “could,” “goal,” “would,” “expect,” “plan,” “anticipate,” “believe,” “estimate,” “project,” “predict,” “potential” and similar expressions intended to identify forward-looking statements. These statements involve known and unknown risks, uncertainties and other factors, which may cause our actual results, performance, time frames or achievements to be materially different from any future results, performance, time frames or achievements expressed or implied by the forward-looking statements. We discuss many of these risks, uncertainties and other factors in this Annual Report on Form 10-K in greater detail in Part I, Section 1A “Risk Factors.” Given these risks, uncertainties and other factors, you should not place undue reliance on these forward-looking statements. Also, these forward-looking statements represent our estimates and assumptions only as of the date of this filing. You should read this Annual Report on Form 10-K completely and with the understanding that our actual future results may be materially different from what we expect. We hereby qualify our forward-looking statements by these cautionary statements. Except as required by law, we assume no obligation to update these forward-looking statements publicly, or to update the reasons actual results could differ materially from those anticipated in these forward-looking statements, even if new information becomes available in the future.
Recent Developments
On February 2, 2010, we entered into a definitive agreement, or Merger Agreement, to be acquired by Microchip Technology Incorporated, or Microchip, for $2.85 per share. On February 22, 2010, we entered into an amendment to the Merger Agreement, or Amendment No. 1, to be acquired by Microchip, for $3.00 per share. On March 8, 2010, we entered into an amendment to the Merger Agreement, or Amendment No. 2, to be acquired by Microchip, for $3.05 per share. In connection with Amendment No. 2, on March 8, 2010, we issued to Microchip 19,148,149 newly issued shares of our common stock, or 19.9 percent of our outstanding shares, for a price of $3.05 per share in cash. Amendment No. 1 and Amendment No. 2 are referred to together as the Amendments. Pursuant to the Merger Agreement and Amendments, SST will merge with Sun Acquisition Corporation, a California corporation and a wholly owned subsidiary of Microchip, a Delaware corporation, or the Merger. Each outstanding share of our common stock, other than shares as to which dissenters’ rights have been properly exercised, will be converted into the right to receive $3.05, without interest.
The Strategic Committee of our Board of Directors, or the Strategic Committee, consisting of all three of the independent members of the Board of Directors, approved the Merger Agreement and Amendments, and determined that the Merger Agreement, Amendments and Merger are advisable and both fair to and in the best interest of our shareholders. The Merger Agreement contains representations, warranties and covenants including among others, covenants by us concerning the conduct of our business in the ordinary course during the interim period between the execution of the Merger Agreement and the consummation of the Merger. The closing of the Merger is subject to closing conditions, including approval of the Merger by the holders of a majority of our outstanding common stock represented and voting at a special meeting to be held to approve the principal terms of the Merger and adoption of the Merger Agreement and Amendments. The Merger Agreement and Amendments contain certain termination rights and further provide that upon termination of the Merger Agreement under specified circumstances we may be required to pay Microchip a termination fee of $10.3 million. Under specified circumstances, we may also be required to reimburse certain of Microchip’s expenses incurred in connection with the Merger, up to $2.0 million.
3
Table of Contents
For a description of our proposed transaction with Microchip, please refer to our definitive proxy statement for our Special Meeting of Shareholders to be held on April 8, 2010, which is on file with the Securities and Exchange Commission, or the SEC, and is available through the SEC’s website at www.sec.gov.
On November 13, 2009, we entered into a definitive agreement, or the TRH Merger Agreement, to be acquired by Prophet Equity LP and members of our management team for $2.10 per share. Pursuant to the definitive agreement SST would be merged with and into Technology Resources Merger Sub, Inc., a California corporation and a wholly owned subsidiary of Technology Resources Holdings, Inc., a Delaware corporation. On February 2, 2010, we terminated the TRH Merger Agreement in order to enter into the Merger Agreement, as described above. In connection with the termination of the TRH Merger Agreement, we paid Technology Resources Holdings, Inc. a termination fee of $4,025,875.
For additional information regarding potential risks and uncertainties associated with the proposed transactions described above, please see Item 1A “Risk Factors.”
Overview
Silicon Storage Technology, Inc. (SST, us or we) is a leading supplier of NOR flash memory semiconductor devices for the digital consumer, networking, wireless communications and Internet computing markets. We also produce and sell other semiconductor products including NAND flash controllers and NAND Controller-based modules; flash microcontrollers; and radio frequency ICs and modules.
NOR flash memory is a form of nonvolatile memory that allows electronic systems to retain information when the system is turned off. NOR flash memory is used in billions of consumer electronics and computing products annually.
We produce and sell many products based on our SuperFlash design and manufacturing process technology. Our products are incorporated into products sold by many well-known companies including Apple, Asustek, BenQ, Cisco, Dell, First International Computer, or FIC, Gigabyte, Haier, Huawei, Infineon, Intel, IBM, Inventec, Legend, Lenovo, LG Electronics, Freescale Semiconductor, NEC, Nintendo, Panasonic, Philips, Quanta, Samsung, Sanyo, Seagate, Sony, Sony Ericsson, Toshiba, Texas Instruments, VTech and ZTE.
We license our SuperFlash technology for applications in semiconductor devices that integrate flash memory with other functions on a monolithic chip to leading semiconductor companies including X-Fab, Analog Devices, IBM, Freescale Semiconductor, Inc., National Semiconductor Corporation, NEC Corporation, Samsung Electronics Co. Ltd., or Samsung, Sanyo Electric Co., Ltd., or Sanyo, Omron Corporation, Shanghai Grace Semiconductor Manufacturing Corporation, or Grace, Shanghai Hua Hong NEC Electronics Co., Ltd., or HHNEC, Taiwan Semiconductor Manufacturing Co., Ltd., or TSMC, Toshiba Corporation, Vanguard International Semiconductor Corporation, Powerchip Semiconductor Corporation and Winbond Electronics Corporation.
We have installed our semiconductor manufacturing processes at several leading wafer foundries and semiconductor manufacturers including Advanced Wireless Semiconductor, Grace, Samsung, Omron Corporation, HHNEC and TSMC. These companies produce semiconductor wafers for us that contain our intellectual property and technology. These wafers are electrically tested and then subdivided into many small rectangular chips, or die. We work with leading semiconductor assembly and test companies to finish our products by encapsulating them in a package and testing them. We are working with Grace, TSMC, Powerchip Semiconductor Corporation and Semiconductor Manufacturing International Corporation, or SMIC, among others, to develop new technology for manufacturing our products.
The semiconductor industry has historically been cyclical, characterized by periodic changes in business conditions caused by product supply and demand imbalance. When the industry experiences downturns, they often occur in connection with, or in anticipation of, maturing product cycles and declines in general economic
4
Table of Contents
conditions. These downturns are characterized by weak product demand, excessive inventory and accelerated decline of selling prices. The average selling price of our products remained relatively stable in 2007 and the first half of 2008. However, in the fourth quarter of 2008, in conjunction with the rapid slowdown in the global economy, we experienced a significant weakening in demand for our products and corresponding significant decline in sales and gross profit. Although prices stabilized again in 2009, our business could be further harmed by industry-wide prolonged downturns in the future.
The consumer electronics manufacturing industry is concentrated in Asia. We manufacture virtually all of our products in Asia and we sell most of our products in Asia. We derived 88.8%, 87.3% and 91.7% of our net product revenues during 2007, 2008 and 2009, respectively, from product shipments to Asia.
Flash Memory Industry Background
Semiconductor integrated circuits are critical components used in an increasingly wide variety of applications, such as computers and computer systems, communications equipment, consumer products and industrial automation and control systems. As integrated circuit performance has improved and physical size and costs have decreased, the use of semiconductors in many applications has grown significantly.
Historically, the demand for semiconductors has been driven by the personal computer, or PC, market. In recent years, growth in demand for semiconductors relating to PCs has been outpaced by growth in demand for semiconductors that are used in digital electronic devices for communication and consumer applications. Communications applications include digital subscriber line modems, cable modems, networking equipment, wireless local area network, or WLAN, devices, cellular phones and Global Positioning Systems, or GPS. Consumer oriented digital electronic devices include digital cameras and camcorders, DVD and Blu-Ray players, MP3 players, personal media players, or PMPs, set-top boxes, digital TVs and video games.
In order to function correctly, PCs and other digital electronic devices require program code. The program code defines how devices function and affects how they are configured. Nonvolatile memory devices were originally used by the PC industry to provide the BIOS (basic input/output system) to give the PC sufficient information to start up (boot) and to facilitate its access to its high volume nonvolatile memory stored in magnetic media including hard disk drives. In PCs, the code stored in the nonvolatile memory or BIOS, initiates the loading of the PC’s operating system, which is then read from the disk drive. In the case of other digital electronic devices, the program code is stored in its entirety in nonvolatile memory, generally flash memory. As a result, virtually every digital electronic system that uses a processor or controller for computing, consumer electronics, communications and industrial applications requires nonvolatile memory. The predominant forms of nonvolatile memory include Read-Only Memory (ROM), Programmable Read-Only Memory (PROM) and flash memory.
System manufacturers generally prefer nonvolatile memory devices that can be reprogrammed efficiently in the system in order to achieve several important advantages. With reprogrammable memory, manufacturers can cost effectively change program codes in response to faster product cycles and changing market specifications. This in turn greatly simplifies inventory management and manufacturing processes. Reprogrammable memory also allows the manufacturer to reconfigure or update a system either locally or through a network connection. In addition, in-system reprogrammable devices can be used for data storage functions, such as storage of phone numbers for speed dialing in a cellular phone or captured images in a digital camera. Flash memory provides these features better than other forms of nonvolatile memory.
Flash memory is the predominant reprogrammable nonvolatile memory device used to store program code and data. Flash memory can electrically erase select blocks of data on the device much faster and more simply than alternative solutions, such as Erasable Programmable Read-Only Memory, or EPROM. Moreover, flash memory is significantly less expensive than other reprogrammable solutions, such as Electrically Erasable Programmable Read-Only Memory, or EEPROMs. There are two types of flash memories; NOR and NAND, in
5
Table of Contents
terms of memory cell array architecture. NOR flash memories are typically used for storing program code and NAND flash memories are typically used for data storage. The rapid growth of flash memory has been fueled by the explosive growth of digital electronic devices that adopted flash memory as the main storage medium for code and data.
Our Flash Memory Solution
We are a leading supplier of NOR flash memory semiconductor devices. We believe our proprietary flash memory technology, SuperFlash, offers superior performance, high reliability and a fast, fixed erase time. We further believe that our SuperFlash technology can be scaled to use the semiconductor industry’s most advanced technology nodes and can employ the industry’s lowest cost manufacturing processes.
Our NOR flash devices have densities ranging from 256,000 bits (256 Kb) to 64 million bits (64 Mb). These products are generally used to store the instruction set used by the microprocessor or controller in the electronic system product to direct its function. NOR memory can also be used to store mass data in a system, but it is generally less expensive to use NAND memory for this purpose. While NOR memory can be used to store data, NAND memory is generally not useful for the storage of execute-in-place instruction code due to its block data access and existence of defective memory cells that require special error detection and correction management. As a result, electronic systems often use NOR alone or NOR (with RAM, or controller) and NAND together, but usually not NAND memory alone.
Our Corporate Strategy
Product Strategy
Our product strategy is two fold: to continue to develop and grow our core NOR flash memory and embedded flash technology licensing business, while diversifying our business by expanding into new markets and pursuing growth opportunities through the development of new NAND Controller-based module and radio frequency IC and module products. In the NOR flash market, our goals are to be a leading worldwide supplier of low-density NOR flash memory devices and to maintain our position as the world’s number one embedded flash licensor by growing both upfront fees and per unit royalties. In our new business markets, our objectives are to leverage our core competencies in NAND Controller design into system solutions as the adoption of solid state memory technology grows, and to leverage our radio frequency wireless technology and systems expertise as development continues on a multitude of electronic devices that are enabled for wireless communication. We intend to carry out our strategy by:
Maintaining a leading position in the program code storage market. We believe that program code storage is an attractive segment of the flash memory market. The number, variety and performance of digital electronic applications continue to increase. Virtually all of these devices need some sort of nonvolatile memory to direct the function of the product’s microprocessor or controller. We believe that our proprietary SuperFlash technology is superior because it offers higher reliability and better performance at a lower cost than competing solutions and is the foundation of our strong licensing business. In addition, our core competencies in advanced packaging and low-power design enable us to develop products with non-commodity features such as the smallest and thinnest packages for flash memory in the industry. These ultra-thin packages support the trend of manufacturers developing smaller, more compact electronic devices. Developing state of the art small and thin package technology is very expensive and thus we have partnered with other companies who are not direct competitors through strategic investments. We also offer a full portfolio of low-voltage serial flash products, which are particularly desirable for portable battery powered electronic systems.
Continuing to enhance our leading flash memory technology. We believe that our proprietary SuperFlash technology is less complicated, more reliable, more scalable and more cost-effective than competing NOR flash memory technologies. Our ongoing research and development efforts are focused on enhancing our leading flash
6
Table of Contents
memory technology by working closely with technology partners who operate wafer fabrication facilities with advanced lithographic and other manufacturing equipment. We are a fabless semiconductor manufacturer, while many of our competitors own and operate fabrication facilities, or fabs. Being fabless can provide advantages during economic downturns, as it has allowed us to downsize more rapidly and we do not have the debt which is often associated with constructing large fabs. However, there are competitive disadvantages in terms of capacity constraints, as we saw in 2007, and development time for new technology, as our fab partners do not necessarily share our priorities. In response to these factors, we have pursued a strategy of making financial investments in fab and assembly partners, the largest of which is Grace, a subsidiary of Grace Semiconductor Manufacturing Corporation, or GSMC. Through this strategy we hope to retain involvement in the timing of new fab and assembly development, while avoiding the considerable cost of ownership borne by our competitors. As consumer electronics companies produce more complex and more compact products, we intend to meet their needs through what we believe is the lowest cost business model, with the goal of producing the lowest cost, smallest and most energy efficient semiconductor products in the world.
Emphasizing the development of non-commodity memory products to enhance growth. We offer a selection of our products in wafer and die form. This allows our customers to develop multi-chip module products for extremely small form factor products such as Bluetooth modules for headsets and GPS modules for cell phone applications. We also provide multi-chip module products that incorporate die from other semiconductor manufacturers. We intend to continue to develop new products and leverage our supply chain to take advantage of the significant growth opportunities in the wireless applications market with specific focus on cellular phone, GPS, WLAN and Bluetooth applications.
Continuing to expand our embedded flash licensing business. We believe that our proprietary SuperFlash technology is well-suited for both embedded memory applications and the licensing business model. Many electronic system manufacturers have incorporated our technology into the semiconductor devices that are at the heart of their products. To date, more than fourteen billion devices incorporating SuperFlash technology have been shipped accumulatively by us and our licensees. We plan to expand our licensing of SuperFlash technology to additional and existing licensees at ever finer technology nodes for embedded flash applications to enhance the value of our technology to electronic system manufacturers. We also plan to add other product applications, thereby expanding our licensing business by first developing an application for our direct product sales model and then offering it to our licensees under our licensing model.
Leveraging our technology, sales channel and supply chain to become a premier provider of NAND Controller-based modules and radio frequency IC products. Many electronic products in the digital consumer, networking, wireless communications and Internet computing markets incorporate our flash memory products. We are expanding our product line beyond NOR flash to include additional devices that these manufacturers need for their products. We provide radio frequency power amplifier and front-end module products for wireless applications such as cellular phones, WLAN, WiMAX, and notebook and netbook PCs.
We are expanding our product offerings to include NAND Controllers and highly integrated NAND Controller-based modules that we believe give electronic systems manufacturers superior flexibility in the design and manufacture of their products. Many digital electronic devices currently being introduced, such as smartphones, personal media players, and digital cameras and camcorders, require high-density NAND flash memory for storing music, pictures and other data that require large data storage capacities in addition to the NOR memory required to operate the system’s controller. We believe that the application market for high-density NAND flash memory is attractive based on its potential size and growth. Because of the inherent defects in NAND flash, the NAND Controller component plays a critical role in managing the NAND flash defects and ensuring product reliability and performance. We have more than nineteen years of experience in NAND Controller design, which will enable us to create innovative NAND Controller-based modules that meet manufacturers’ demands for quality, reliability and performance. We believe demand for high-density code storage applications may be better addressed by an integrated system solution than by pure high-density NOR memory.
7
Table of Contents
Operating Strategy
In 2004 we began a diversification strategy to invest in the development of smaller and thinner package technology for portable applications, smaller manufacturing geometries to reduce costs, lower voltage technology for battery applications, new fab relationships to provide additional capacity, and non-memory products to expand our revenue base. As part of this strategy, we incurred higher operating costs for several years with the goal of increasing revenues and gross profit. During 2008, we began to re-evaluate our level of investment in these objectives and to focus our efforts toward making our diversification program more effective. To that end, and in response to the developing worldwide economic recession, we decided to restructure our operations in the fourth quarter of 2008, including a significant reduction in headcount and operating expenses as well as the realignment of our development priorities. This refined strategy continues the essential elements of diversification by focusing on a reduced number of projects in the areas of non-commodity NOR products, NAND Controllers and modules and radio frequency IC products which are synergistic with our memory business. We believe this focus on a smaller set of projects, along with the reduction in operating expenses, will ultimately make our company more profitable.
Most of our competitors are larger in size, and have greater financial resources available for development of fabrication and assembly facilities. While this model can allow quicker time-to-market and lower variable costs, it can reduce flexibility and ability to adapt to changes in market conditions. While our fabless model does not require us to assume debt, in order to remain competitive we have to continue to innovate. Our strategic investment program focuses on partners who are making large capital investments across a range of markets, in addition to the flash memory market. In this way we attempt to effectively share costs with other investors in the strategic partner, often receiving exclusive use of their technology for the flash memory market. Although we cannot directly control our partners’ development processes and the allocation of their facilities’ capacity, we can adapt more easily to economic downturns in order to minimize adverse impact to our business. We have utilized this investment strategy in other areas such as software and systems development, logistic facilities, distributors and marketing representatives. We continually review both the strategic and financial returns on these investments and we may decide to sell any investment at any time. In addition, certain factors may require us to review the value of these investments and we may be required to record impairments to the carrying value of these investments.
Our Products
Currently, we offer low- to medium-density NOR flash devices (256 Kbit to 64 Mbit) and other products that target a broad range of existing and emerging applications in the digital consumer, networking, wireless communications and Internet computing markets. Our products are segmented largely based upon attributes such as density, voltage, access speed, package and target application. We divide our products into two reportable segments: Memory Products and Non-Memory Products.
Our Memory Product segment, which is comprised of NOR flash memory products, includes the Multi-Purpose Flash or MPF family, the Multi-Purpose Flash Plus or MPF+ family, the Advanced Multi-Purpose Flash Plus or Advanced MPF+ family, the Concurrent SuperFlash or CSF family, the Firmware Hub or FWH family, the SPI serial flash family, the Serial Quad I/O or SQI flash family, the ComboMemory family, the Many-Time Programmable or MTP family, and the Small Sector Flash or SSF family.
Our Non-Memory Product segment is comprised of all other semiconductor products including flash microcontrollers, smart card ICs and modules, radio frequency ICs and modules, NAND Controllers and NAND Controller-based modules.
Technology Licensing
We license our SuperFlash technology to semiconductor manufacturers for use in embedded flash applications. We intend to increase our market share by entering into additional license agreements for our SuperFlash process and memory cell technology with leading wafer foundries and semiconductor manufacturers.
8
Table of Contents
We expect to continue to receive licensing fees and royalties from these agreements. We design our products using our patented memory cell technology and fabricate them using our patented process technology. As of December 31, 2009, we held 278 patents in the United States relating to certain aspects of our products and processes, with expiration dates ranging from 2010 to 2029 and have filed for several more. In addition, we hold several patents in Europe, Japan, Korea, Taiwan and China.
Customers
We provide high-performance flash memory solutions and other products to customers in four major markets: digital consumer, networking, wireless communications and Internet computing. Our customers benefit by obtaining products that we believe are highly reliable, technologically advanced and have attractive cost structures. As a result of these highly desirable benefits, we have developed relationships with many of the industry’s leading companies.
In digital consumer products, we provide products for consumer electronics companies including LG, Hon Hai, Micronas, Apple, Samsung, Lite-On, NEC, Funai, Sony, Orion, BenQ, Sigma Design, ALCO, Inventec, Pioneer, Nintendo, BBK, Toshiba, JVC, Mattel, Panasonic (Matsushita), Sanyo, Konka, Canon, Hisense, Creative, Daewoo, Thomson, Sharp, Reigncom, Olympus, TiVO and Haier.
In networking, we provide products for Broadcom, Atheros, Conexant, Alpha Networks, Gemtek, Gongjin, Hon Hai, Edimax, Avocent, TP-Link, ZTE, Senao, Cameo Communications, Sagem Orga, Adtran, Askey, Intel, Asustek, Global Sun, Thomson, Huawei, TCL, Comtrend, Buffalo, Tecom, Mitsumi, Arris, Cybertan and Samsung.
In wireless communications, we provide products for companies including Syscom, Samsung, Crestfounder, USI, GN Netcom, Sagem Orga, Alps, Gemalto, ZTE, Hon Hai, Cambridge Silicon Radio, Watchdata System, Pansun Infotech, Haier, CCT, Wuhan Tienyu Information Industry, Magnificent Mile, Taiyo Yuden, Mitsumi, Ningbo Bird, Logitech, VTech and Garmin.
In Internet computing, we provide a wide array of products for companies including Asustek, Seagate, Western Digital, TPV Technology, Hon Hai, Quanta, Intel, Giga-Byte, Quanta, ECS, Inventec, Titanic, Lenovo, Matsushita, Sharp, Fujitsu-Siemens, Wistron, Mitac, Microstar, Fujitsu, Epson, Buffalo, Samsung, Brother, USI, Canon, Lite-On, NEC, IBM and Toshiba.
The following tables illustrate revenue by geographic region. Revenue by geographic region is determined based on where product is shipped to by us or our logistics center or where license revenue is generated. Our net revenues are all denominated in U.S. dollars and are summarized as follows (in thousands):
| Year Ended December 31, | |||||||||
| 2007 | 2008 | 2009 | |||||||
| United States |
$ | 23,349 | $ | 22,463 | $ | 14,214 | |||
| Europe |
26,802 | 19,742 | 8,936 | ||||||
| Japan |
40,303 | 33,722 | 34,634 | ||||||
| Korea |
37,487 | 25,804 | 21,225 | ||||||
| Taiwan |
45,350 | 48,789 | 38,397 | ||||||
| China (including Hong Kong) |
212,417 | 143,621 | 114,974 | ||||||
| Other Asian Countries |
26,040 | 21,394 | 20,045 | ||||||
| $ | 411,748 | $ | 315,535 | $ | 252,425 | ||||
See Note 13 “Segment and Geographic Reporting” to our consolidated financial statements for further information regarding our revenue by geographic region and location of our long-lived assets.
9
Table of Contents
Sales and Distribution
We sell a majority of our products to customers in Asia through our representatives and we distribute a majority of our products through our logistics center. We also sell and distribute our products in North America and Europe through manufacturers’ representatives and distributors. Our manufacturer representative and distributor relationships are generally cancelable, with reasonable notice, by either party.
Backlog
Our product sales are made primarily using short-term cancelable purchase orders. The quantities actually purchased by the customer, as well as shipment schedules, are frequently revised to reflect changes in the customer’s needs and in our supply of products. Accordingly, the dollar amount associated with our backlog of open purchase orders at any given time is not a meaningful indicator of future sales. Changes in the amount of our backlog do not necessarily reflect a corresponding change in the level of actual or potential sales.
Applications
As the digital consumer, networking, wireless communications and Internet computing industries continue to expand and diversify, new applications are likely to be developed. We believe our products are designed to address this expanding set of applications:
| Digital Consumer |
Networking |
Wireless Communications |
Internet Computing | |||||
| Digital Video Recorder (DVR) |
Set-top Box | VoIP | Cellular Phone | Information Appliance | ||||
| Digital TV |
CD-ROM Drive | DSL Modem | Cordless Telephone | Notebook PC | ||||
| Digital Camera |
CD-RW Drive | Cable Modem | GPS on Cellular Phone | Desktop PC | ||||
| Digital Camcorder |
DVD-ROM Drive | Wireless LAN | Bluetooth Applications | Hard Disk Drive | ||||
| DVD Player |
DVD-RAM Drive | Network Interface Card | Wireless Modems | LCD Monitor | ||||
| DVD Recorder |
DVD-RW Drive | Router/Switch | Server | |||||
| Blu-Ray DVD Player |
Web Browser | Graphics Card | ||||||
| MP3 Player |
Hand-held GPS | Printer | ||||||
| Video Game Systems |
Electronic Toys | Copier/Scanner | ||||||
| PDA |
Portable Media Player | Bar Code Scanner | ||||||
| Electronic Book |
Memory Cards | Thin Client System | ||||||
| Remote Controller |
Electronic Organizer | Mobile Internet Device (MID) | ||||||
| Netbook PC | ||||||||
Manufacturing
We purchase wafers and sorted die from semiconductor manufacturing foundries, have these products shipped directly to subcontractors for packaging, testing, and finishing, and then ship the final product to our customers. Virtually all of our subcontractors are located in Asia.
Wafer and Sorted Die. During 2009, our major wafer fabrication foundries were Grace, TSMC and Maxchip Electronics Corporation, or Maxchip. In 2009, wafer sort, which is the process of testing individual die on silicon wafer, was performed at King Yuan Electronics Company, Limited, or KYE, Lingsen, HHNEC, Sanyo, Omron Corporation and TSMC. In order to obtain, on an ongoing basis, an adequate supply of wafers, we have considered and will continue to consider various possible options, including equity investments in foundries in exchange for secure production volumes, the formation of joint ventures to own and operate foundries and the licensing of our proprietary technology. We hold an equity investment in GSMC, a Cayman Islands company. Grace is GSMC’s wafer foundry subsidiary and is located in Shanghai, China.
Packaging, Testing and Finishing. In the assembly process, the individual dies are separated and assembled into packages. Following assembly, the packaged devices require testing and finishing to segregate conforming from nonconforming devices and to identify devices by performance levels. Currently, all devices are tested and inspected pursuant to our quality assurance program at our international subcontracted test facilities before
10
Table of Contents
shipment to customers. Certain facilities currently perform consolidated assembly, packaging, test and finishing operations all at the same location. During 2009, most subcontracted facilities performing the substantial majority of our operations were in Taiwan. The subcontractors with the largest amount of our activity were KYE, Lingsen and Powertech Technology, Incorporated, or PTI. We hold equity investments in four subcontractors, including Apacer Technology, Inc., or Apacer, KYE, PTI and Aptos Design Lab, Inc., or ADL, which is the parent company of ACET.
Research and Development
We believe that our future success will depend in part on the development of next generation technologies with reduced feature size. During 2007, 2008 and 2009 we spent $56.7 million, $59.0 million and $43.2 million, respectively, on research and development. Our research efforts are focused on process development and product development. Our research strategy is to collaborate with our partners to advance our technologies. We work simultaneously with several partners on the development of multiple generations of technologies. In addition, we allocate our resources and personnel into category-specific teams to focus on new product development. From time to time we invest in, jointly develop technology with, and license or acquire technology from other companies in the course of developing products.
Competition
The semiconductor industry is intensely competitive and has been characterized by price erosion, rapid technological change and product obsolescence. We compete with major domestic and international semiconductor companies, many of whom have substantially greater financial, technical, marketing, distribution, manufacturing and other resources than us. Our low-density memory products, sales of which presently account for the majority of our product revenues, compete against products offered by Macronix, PMC, EON and Winbond. Our medium-density memory products compete with products offered by Spansion, Macronix, Winbond, Samsung and Numonyx. If we are successful in developing our high-density products, these products will compete principally with products offered by Spansion, Numonyx and Samsung, as well as any new companies who may enter the market. In addition, competition may come from alternative technologies such as phase change memory technology.
The competition in the existing markets for some of our other product families, such as the FlashFlex microcontroller product family, is extremely intense. We compete principally with major companies such as Atmel, Microchip Technology, Freescale Semiconductor, Inc., Philips and Winbond in the microcontroller market. We may, in the future, also experience direct competition from our foundry partners. We have licensed to our foundry partners the rights to fabricate certain products based on our proprietary technology and circuit design, and to sell such products worldwide, subject to royalty payments back to us. For radio frequency IC products, the competition in the existing markets is also extremely intense. Our radio frequency IC products compete primarily with Microsemi, RF Micro Devices, Richwave and ANADIGICS, especially in the WLAN markets. For our NAND Controller and NAND Controller-based module products, we compete primarily with Intel, Phison, Samsung, SanDisk, STEC and Toshiba.
We compete principally on price, reliability, functionality and the ability to offer timely delivery to customers. While we believe that our low-density memory products currently compete favorably on the basis of cost, reliability and functionality, it is important to note that some of our principal competitors have a significant advantage over us in terms of greater financial, technical and marketing resources. Our long-term ability to compete successfully in the evolving flash memory market will depend on factors both within and beyond our control, including access to advanced process technologies at competitive prices, successful and timely product development, wafer supply, product pricing, actions of our competitors and general economic conditions.
Employees
As of December 31, 2009, we employed 571 individuals on a full-time basis, 249 of whom reside in the United States. Of these 571 employees, 89 were employed in manufacturing support, 265 in engineering, 101 in
11
Table of Contents
sales and marketing and 116 in administration, finance and information technology. Our employees are not represented by a collective bargaining agreement, nor have we ever experienced any work stoppage related to strike activity. We believe that our relationship with our employees is good.
Executive Officers
The following table lists the names, ages and positions of our executive officers as of January 1, 2010. There are no family relationships between any executive officer. Executive officers serve at the discretion of our Board of Directors.
| Name |
Age | Position | ||
| Bing Yeh |
59 | Chief Executive Officer and Chairman of the Board | ||
| Bertrand F. Cambou |
54 | President | ||
| Yaw Wen Hu |
60 | Executive Vice President, Chief Operating Officer and Director | ||
| Derek J. Best |
58 | Senior Vice President, Sales and Marketing | ||
| Chen Tsai |
57 | Senior Vice President, Worldwide Backend Operations | ||
| Paul S. Lui |
59 | Senior Vice President, NSP Business Unit | ||
| James B. Boyd |
57 | Senior Vice President, Finance and Chief Financial Officer |
Bing Yeh co-founded SST in 1989 and is our Executive Chairman and CEO. Prior to co-founding SST, Mr. Yeh served as a senior research and development manager at Xicor, Inc., a nonvolatile memory semiconductor company. From 1981 to 1984, Mr. Yeh held program manager and other positions at Honeywell Inc. From 1979 to 1981, Mr. Yeh was a senior development engineer of EEPROM technology at Intel Corporation. He was a Ph.D. candidate in Applied Physics and earned an Engineer degree in Electrical Engineering at Stanford University. Mr. Yeh also holds M.S. and B.S. degrees in Physics from National Taiwan University.
Bertrand Cambou, Ph.D., joined us as President in June 2009. Before joining SST, Dr. Cambou spent three years as President & CEO of Spansion Inc., a joint venture of AMD and Fujitsu. Prior to leading the joint venture, he was EVP, Memory Group for AMD. Dr. Cambou held leadership positions with Ingenico, a company developing terminals for secure e-transactions and with Gemplus, a company in the smart card industry. Dr. Cambou spent fifteen years with Motorola in various management positions, including SVP and GM, Networking & Computing Systems Group and CTO, Semiconductor Sector. Dr. Cambou holds an engineering degree from Supelec, Paris, a Master’s in Physics from Toulouse University and a Doctorate Degree in Electrical Engineering from Paris XI University.
Yaw Wen Hu, Ph.D., joined us in July 1993 as Vice President, Technology Development. In 1997, he was given the additional responsibility of wafer manufacturing and, in August 1999, he became Vice President, Operations and Process Development. In January 2000, he was promoted to Senior Vice President, Operations and Process Development. In April 2004, he was promoted to Executive Vice President and Chief Operating Officer. Dr. Hu has been a member of our Board of Directors since September 1995. From 1990 to 1993, Dr. Hu served as deputy general manager of technology development of Vitelic Taiwan Corporation. From 1988 to 1990, he served as FAB engineering manager of Integrated Device Technology, Inc. From 1985 to 1988, he was the director of technology development at Vitelic Corporation. From 1978 to 1985, he worked as a senior development engineer in Intel Corporation’s Technology Development Group. Dr. Hu holds a B.S. in Physics from National Taiwan University and a M.S. in Computer Engineering and a Ph.D. in Applied Physics from Stanford University.
Derek J. Best joined us in June 1997 as Vice President of Sales and Marketing. In June 2000 he was promoted to Senior Vice President, Sales & Marketing. Prior to joining SST he worked for Micromodule Systems, a manufacturer of high-density interconnect technology, as vice president marketing and sales world wide from 1992 to 1996. From 1987 to 1992 he was a co-founder and owner of Mosaic Semiconductor, a SRAM and module semiconductor company. Mr. Best holds an Electrical Engineering degree from Portsmouth University in England.
12
Table of Contents
Chen Tsai joined us in August 1996 as Senior Manager, Yield Enhancement and became Director, Product and Test Engineering the same year. In 1999, he became Director of Worldwide Backend Operations and in 2000 he was promoted to Vice President of Worldwide Backend Operations. In October 2004, Mr. Tsai was appointed Senior Vice President of Worldwide Backend Operations. From 1992 to 1996, Mr. Tsai was Manager of Process Development at Atmel Corporation, a manufacturer of semiconductors, where he was also a staff engineer of E2PROM from 1989 to 1992. From 1988 to 1989, he was vice president of technology at Tristar Technology, Inc., a wireless systems company. From 1980 to 1988 he held various positions at Xicor, Inc. and Teledyne Semiconductor. Mr. Tsai holds a B.S. in Physics from Show Chu University and a M.S. in both Physics and Electrical Engineering from Florida Institute of Technology.
Paul S. Lui joined us as Vice President and General Manager of the Linvex Product Line in June 1999 and became Vice President, Special Product Group in June 2001. In May 2006, he was promoted to Senior Vice President, Standard and Special Product Group. From 1994 to 1999, he was the president and founder of Linvex Technology Corporation. From 1987 to 1994, he was the president and chief executive officer of Macronix, Inc. From 1981 to 1985, he served as group general manager at VLSI Technology, Inc. where he was responsible for transferring that company’s technology to Korea. In addition, Mr. Lui has held senior engineering positions at the Synertek Division of Honeywell and McDonnell Douglas. Mr. Lui holds an M.S.E.E. degree from University of California, Berkeley and a B.S. in Electrical Engineering and Mathematics from California Polytechnic State University, San Luis Obispo.
James B. Boyd joined us as Chief Financial Officer and Senior Vice President, Finance in June 2007. From 2000 to 2007, Mr. Boyd served as chief financial officer for ESS Technology, a manufacturer of DVD and image sensor chips, where he was responsible for all financial and legal functions. Prior to that, he was chief financial officer for Gatefield Corp., a manufacturer of nonvolatile reprogrammable FPGAs. Mr. Boyd has also held finance positions at companies ranging in size from Fortune 100 firms to start-ups. Mr. Boyd holds a B.S. and an M.B.A from the University of Wisconsin and a J.D. from Golden Gate University School of Law.
Available Information
We were incorporated in California in 1989. Additional information is available free of charge electronically through our Internet website, www.sst.com. This information includes our annual report on Form 10-K, quarterly reports on Form 10-Q, current reports on Form 8-K and, if applicable, amendments to those reports filed or furnished pursuant to Section 13(a) of the Exchange Act as soon as reasonably practicable after we electronically file such material with, or furnish it to, the SEC. Additionally, these filings may be obtained by visiting the Public Reference Room of the SEC at 100 F Street, NE, Washington, DC 20549 or by calling the SEC at 1-800-SEC-0330, by sending an electronic message to the SEC at publicinfo@sec.gov or by sending a fax to the SEC at 1-202-777-1027. In addition, the SEC maintains a website (www.sec.gov) that contains reports, proxy and information statements, and other information regarding issuers that file electronically.
13
Table of Contents
| Item 1A. | Risk Factors |
Risks Related to Our Business and Industry
If the Merger is not completed, our business could be harmed and our stock price could decline.
On February 2, 2010, we entered into a definitive agreement, or Merger Agreement, to be acquired by Microchip Technology Incorporated, or Microchip, for $2.85 per share. On February 22, 2010, we entered into an amendment to the Merger Agreement, or Amendment No. 1, to be acquired by Microchip, for $3.00 per share. On March 8, 2010, we entered into an amendment to the Merger Agreement, or Amendment No. 2, to be acquired by Microchip, for $3.05 per share. In connection with Amendment No. 2, on March 8, 2010, we issued to Microchip 19,148,149 newly issued shares of our common stock, or 19.9 percent of our outstanding shares, for a price of $3.05 per share in cash. Amendment No. 1 and Amendment No. 2 are referred to together as the Amendments. Pursuant to the Merger Agreement and Amendments, SST will merge with Sun Acquisition Corporation, a California corporation and a wholly owned subsidiary of Microchip, a Delaware corporation, or the Merger. Each outstanding share of our common stock, other than shares as to which dissenters’ rights have been properly exercised, will be converted into the right to receive $3.05, without interest. The closing of the Merger is subject to closing conditions, including approval of the Merger by the holders of a majority of our outstanding common stock represented and voting at a special meeting to be held to approve the principal terms of the Merger and adoption of the Merger Agreement and Amendments, as well as other customary closing conditions. Therefore, the Merger may not be completed in a timely manner, if at all. We have incurred and may continue to incur significant expenses related to the Merger that will not be recovered if the Merger is not completed. The Merger Agreement and Amendments contain certain termination rights and further provide that upon termination of the Merger Agreement under specified circumstances we may be required to pay Microchip a termination fee of $10.3 million. Under specified circumstances, we may also be required to reimburse certain of Microchip’s expenses incurred in connection with the Merger, up to $2.0 million. If the Merger Agreement is terminated, our Board of Directors may not be able to find another party willing to pay an equivalent or better price than the price to be paid under the Merger Agreement and Amendments, and the market price of our stock may decline.
The fact that there is a merger pending could harm our business, revenue and results of operations.
While the Merger is pending, it creates uncertainty about our future. As a result of this uncertainty, customers may decide to delay, defer, or cancel purchases of our products pending completion of the Merger or termination of the Merger Agreement. If these decisions represent a significant portion of our anticipated revenue, our results of operations and quarterly revenues could be substantially below the expectations of investors. In addition, while the Merger is pending, we are subject to a number of risks that may harm our business, revenue and results of operations, including:
| • | the diversion of management and employee attention and the unavoidable disruption to our relationships with customers and vendors may detract from our ability to grow revenues and minimize costs; |
| • | we have and will continue to incur significant expenses related to the Merger prior to its closing; |
| • | the diversion of management and employee attention may make it difficult for us to respond effectively to competitive pressures, industry developments and future opportunities; and |
| • | our current and prospective employees may be uncertain about their future roles and relationships with SST following completion of the Merger. This uncertainty may adversely affect our ability to attract and retain key management, sales, marketing and operational personnel. |
We have been named as a party in several lawsuits arising from our proposed transactions with Technology Resources Holdings.
We have been named as a party in several lawsuits arising from our prior proposed merger with Technology Resources Holdings, Inc., which are filed against SST, our officers, and current directors. The complaints are
14
Table of Contents
substantially similar and allege, among other things, that such proposed merger was the product of a flawed process and that the consideration to be paid to our shareholders in connection with such proposed merger was unfair and inadequate. The complaints further allege, among other things, that our officers and directors breached their fiduciary duties by, among other things, taking actions designed to deter higher offers from other potential acquirers and failing to maximize the value of SST to our shareholders. The complaints further allege that Prophet Equity LP and SST aided and abetted the actions of our officers and directors in breaching their fiduciary duties. The complaints seek, among other relief, an injunction preventing consummation of the proposed merger, an order rescinding the proposed merger or any of its terms to the extent already implemented, costs and disbursements of the lawsuits, including attorneys’ and experts’ fees, and such other relief as the court might find just and proper. On February 9, 2010, the court entered an order consolidating the six actions and ordering plaintiffs to inform the court no later than March 2, 2010 which of the complaints filed to date should be deemed the operative pleading in the consolidated action. Plaintiffs have informed the court that they intend to file a consolidated, amended complaint, but have not yet done so. We believe these lawsuits are without merit and plan to defend against them vigorously.
The expenses associated with such litigation and other related litigation may be significant and may harm our operating results. The amount of time to resolve these lawsuits is unpredictable and defending SST, our officers and our current directors may divert management’s attention from the day-to-day operations of our business, which could adversely affect our business. We also have certain indemnification obligations to officers and current directors arising out of such litigation.
Global economic conditions have reduced demand for our products, adversely impacted our customers and suppliers and harmed our business.
Our operations and performance depend significantly on worldwide economic conditions. Uncertainty about current global economic conditions poses a continuing risk to our business as consumers and businesses have postponed spending in response to tighter credit, negative financial news and/or declines in income or asset values, which have reduced the demand for our products. Other factors that could depress demand for our products in the future include conditions in the residential real estate and mortgage markets, labor and healthcare costs, access to credit, consumer confidence, and other macroeconomic factors affecting consumer spending behavior. These and other economic factors have reduced demand for our products and could further harm our business, financial condition and operating results.
The current financial turmoil affecting the banking system and financial markets and the possibility that financial institutions may consolidate or go out of business have resulted in a tightening in the credit markets, a low level of liquidity in many financial markets, and extreme volatility in fixed income, credit, currency and equity markets. There could be a number of follow-on effects from the credit crisis on our business, including insolvency of key suppliers resulting in product delays; inability of customers, including stocking representatives, distributors and other channel partners, to obtain credit to finance the operations of their businesses and/or customer, including channel partner, insolvencies; and failure of financial institutions, which may negatively impact our treasury operations. Other income and expense could also vary materially from expectations depending on gains or losses realized on the sale or exchange of financial instruments; impairment charges related to debt securities as well as equity and other investments; interest rates; and cash, cash equivalent and marketable securities balances.
Our operating results fluctuate materially, and an unanticipated decline in revenues may disappoint securities analysts or investors and result in a decline in our stock price.
We have incurred net losses in each year since 2005. Our operating results have fluctuated significantly and our past financial performance should not be used to predict future operating results. Our recent quarterly and annual operating results have fluctuated, and may continue to fluctuate, due to the following factors, all of which are difficult to forecast and many of which are out of our control:
| • | the availability, timely delivery and cost of wafers or other manufacturing and assembly services from our suppliers; |
15
Table of Contents
| • | competitive pricing pressures and related changes in selling prices; |
| • | fluctuations in manufacturing yields and significant yield losses; |
| • | new product announcements and introductions of competing products by us or our competitors; |
| • | product obsolescence; |
| • | lower of cost or market, obsolescence or other inventory adjustments; |
| • | changes in demand for, or in the mix of, our products; |
| • | changes in demand for, or in the mix of, our licensees’ business as well as the mix between upfront fees and per unit royalties; |
| • | the gain or loss of significant customers; |
| • | market acceptance of products utilizing our SuperFlash® technology; |
| • | changes in the channels through which our products are distributed and the timeliness of receipt of distributor resale information; |
| • | exchange rate fluctuations; |
| • | general economic, political and environmental-related conditions, such as natural disasters; |
| • | changes in our allowance for doubtful accounts; |
| • | valuation allowances on deferred tax assets based on changes in estimated future taxable income; |
| • | difficulties in forecasting, planning and management of inventory levels; |
| • | unanticipated research and development expenses associated with new product introductions; |
| • | the timing of significant orders and of license and royalty revenue; |
| • | valuation of investments and long-term assets; and |
| • | the impact of the sub-prime mortgage crisis on our cash and other investments. |
If our reorganization and expense reduction efforts are not successful, our business will be harmed.
We have incurred net losses in each year since 2005. As a result of negative global economic conditions and market instability, we are continuing to undertake actions to reduce our expenses. In December 2008, as a result of weakening demand caused by the rapid slowdown in the global economy, we announced the implementation of a global reorganization designed to reflect changes in anticipated levels of business. This action was taken to reduce costs of operations, to streamline the organization going forward, and to improve our focus on accelerating time-to-market of select new products. These efforts to reduce expenses and accelerate time-to-market may not be successful in returning our company to profitability or sustaining profitability over time. If our expense reduction efforts are unsuccessful, our operating results and business will be harmed.
The selling prices for our products are extremely volatile and have historically declined during periods of over capacity or industry downturns.
The semiconductor industry has historically been cyclical, characterized by periodic changes in business conditions caused by product supply and demand imbalance. When the industry experiences downturns, they often occur in connection with, or in anticipation of, maturing product cycles and declines in general economic conditions. These downturns are characterized by weak product demand, excessive inventory and accelerated decline of selling prices. Continued downward price pressure in the industry may reduce our operating results and harm our financial and competitive position.
16
Table of Contents
Our operating expenses are relatively fixed, and we order materials in advance of anticipated customer demand. Therefore, we have limited ability to reduce expenses quickly in response to any revenue shortfalls.
Our operating expenses are relatively fixed, and we therefore have limited ability to reduce expenses quickly in response to any revenue shortfalls. We have experienced such periods of revenue shortfalls in the past, including in the fourth quarter of 2008, and we were not able to reduce our operating expenses sufficiently to offset the revenue declines we experienced. Our future operating results will be harmed if our revenues do not meet our projections. We may experience revenue shortfalls for the following reasons:
| • | sudden drops in consumer demand, such as we experienced in the fourth quarter of 2008 and first quarter of 2009, may cause customers to cancel backlog, push out shipment schedules, or reduce new orders, possibly due to a slowing economy or inventory corrections among our customers; |
| • | significant declines in selling prices that occur because of competitive price pressure during an over-supply market environment; |
| • | sudden shortages of raw materials for fabrication, test or assembly capacity constraints that lead our suppliers to allocate available supplies or capacity to other customers which, in turn, harm our ability to meet our sales obligations; and |
| • | the reduction, rescheduling or cancellation of customer orders. |
In addition, political or economic events beyond our control can suddenly result in increased operating costs. In addition, we are required to record compensation expense on stock option grants and purchases under our employee stock purchase plan which substantially increases our operating costs and impacts our earnings (loss) per share.
We incurred significant inventory valuation and adverse purchase commitment adjustments in 2007, 2008 and 2009, and we may incur additional significant inventory valuation adjustments in the future.
We typically plan our production and inventory levels based on internal forecasts of customer demand, which are highly unpredictable and can fluctuate materially. The current negative worldwide economic conditions and market instability make it increasingly difficult for us to accurately forecast future product demand trends. The value of our inventory is dependent on our estimate of future average selling prices, and, if our projected average selling prices are over estimated, we may be required to adjust our inventory value to reflect the lower of cost or market. As of December 31, 2009, we had $36.9 million of inventory on hand, a decrease of $17.3 million, or 31.9%, from December 31, 2008. Total valuation adjustments to inventory and adverse purchase commitments were $8.5 million in 2007, $14.2 million in 2008 and $11.4 million in 2009. Due to the large number of units in our inventory, even a small change in average selling prices could result in a significant adjustment, to the extent that the carrying value of the inventory exceeds the average selling price, and could harm our financial results. For excess inventory analysis, we compare the inventory on hand with the forecasted demand. Demand is based on one year for packaged products and two years for products in die form. For the obsolete inventory analysis, we review inventory items in detail and consider date code, customer base requirements, planned or recent product revisions, end of life plans, diminished market demand and other factors that may be appropriate during a particular period. In the event that customer requirements cause us to change this methodology, it may be necessary for us to provide for an additional allowance, which could result in a significant adjustment and could harm our financial results.
Cancellations or rescheduling of backlog may result in lower future revenue and harm our business.
Due to possible customer changes in delivery schedules and cancellations of orders, our backlog at any particular date is not necessarily indicative of actual sales for any succeeding period. We have experienced a significant push out of customer delivery schedules and significant order cancellations in the past, including in
17
Table of Contents
the fourth quarter of 2008. A reduction of backlog during any particular period, or the failure of our backlog to result in future revenue, could harm our business in the future. We have historically experienced a decrease in the average selling prices of our products during periods of industry-wide oversupply and excessive inventory. We have experienced price erosion in selected areas in 2008 and 2009 and our business could be further harmed by a continued industry-wide prolonged downturn.
There is seasonality in our business, and its pattern may be difficult to predict in any year or from quarter to quarter.
Sales of our products in the consumer electronics applications market are subject to seasonality. As a result, sales of these products are impacted by seasonal purchasing patterns with higher sales generally occurring in the second half of each year. However, due to negative global economic conditions and market instability, we did not experience this historical increase in sales in the second half of 2008, and experienced only a limited increase in the second half of 2009. Seasonal patterns may not materialize in any year and the decline or increase in any one quarter may be greater or less than historical patterns may indicate. In addition, changes in the competitiveness of our product offerings or changes in demand for our products in any particular market segment may completely negate seasonal revenue swings. In some years we have been able to mitigate such seasonality with the introduction of new products. If we fail to continue to introduce new products, our business may suffer and the seasonality of a portion of our sales may become more pronounced.
Our business may suffer due to risks associated with international sales and operations.
During 2007, 2008, and 2009 our international product and licensing revenues accounted for 94.3%, 92.9% and 94.4% of our net revenues, respectively. Our international business activities are subject to a number of risks, each of which could impose unexpected costs on us that would harm our operating results. These risks include:
| • | difficulties in complying with regulatory requirements and standards; |
| • | tariffs and other trade barriers; |
| • | costs and risks of localizing products for foreign countries; |
| • | reliance on third parties to distribute our products; |
| • | extended accounts receivable payment cycles; |
| • | potentially adverse tax consequences; |
| • | limits on repatriation of earnings; and |
| • | burdens of complying with a wide variety of foreign laws. |
In addition, we have made equity investments in companies with operations in several Asian countries. The value of our investments is subject to the economic and political conditions particular to their industries and their countries, foreign exchange rates, and the global economy. If we determine that a change in the recorded value of an investment is other than temporary, we will adjust the value of the investment. Such an expense could have a negative impact on our operating results.
We derived 88.8%, 87.3% and 91.7% of our net product revenues from Asia during 2007, 2008 and 2009, respectively. Additionally, substantially all of our wafer suppliers and packaging and testing subcontractors are located in Asia. Any kind of economic, political or environmental instability in this region of the world can have a severe negative impact on our operating results due to the large concentration of our production and sales activities in this region. If countries where we do business experience severe currency fluctuation and economic deflation, it can negatively impact our revenues and also negatively impact our ability to collect payments from customers. In this event, the lack of capital in the financial sectors of these countries may make it difficult for our customers to open letters of credit or other financial instruments that are guaranteed by foreign banks. Finally, the economic situation can exacerbate a decline in selling prices for our products as our competitors reduce product prices to generate needed cash.
18
Table of Contents
It should also be noted that we are greatly impacted by the political, economic and military conditions in Taiwan. Taiwan and China are continuously engaged in political disputes and both countries have continued to conduct military exercises in or near the other’s territorial waters and airspace. Such disputes may continue and even escalate, resulting in an economic embargo, a disruption in shipping or even military hostilities. Any of these events can delay production or shipment of our products. Any kind of activity of this nature or even rumors of such activity can harm our operations, revenues, operating results and stock price.
We invest in companies for strategic reasons and may not realize a return on our investments.
We make investments in companies around the world to further our strategic objectives and support our key business initiatives. Such investments include investments in equity securities of public companies and investments in non-marketable equity and debt securities of private companies, which range from early-stage companies that are often still defining their strategic direction to more mature companies whose products or technologies may directly support our products or initiatives. The success of these companies is dependent on product development, market acceptance, operational efficiency and other key business success factors. The private companies in which we invest may fail because they may not be able to secure additional funding, obtain favorable investment terms for future financings, or take advantage of liquidity events such as initial public offerings, mergers, and private sales. If any of these private companies fail, we could lose all or part of our investment in that company. If we determine that an other-than-temporary decline in the fair value exists for the equity securities of the public and private companies in which we invest, we write down the investment to its fair value and recognize the related write-down as an investment loss. For 2007, 2008 and 2009, we recorded impairments on our investments of $22.4 million, $21.8 million and $0.5 million, respectively. Furthermore, when the strategic objectives of an investment have been achieved, or if the investment or business diverges from our strategic objectives, we may decide to dispose of the investment. Our investments in non-marketable equity securities of private companies are not liquid, and we may not be able to dispose of these investments on favorable terms or at all. The occurrence of any of these events could negatively affect our results of operations.
Our investment portfolio may be impaired by further deterioration of the capital markets.
Our cash and cash equivalents and short-term and long-term investment portfolio as of December 31, 2009 consists of money market funds, domestic government and foreign corporate debt securities, and foreign listed equity securities. We follow an established investment policy and set of guidelines to monitor, manage and limit our exposure to interest rate fluctuations and credit risk. The policy sets forth credit quality standards and limits our exposure to any one issuer. As a result of current adverse financial market conditions, some financial instruments, such as structured investment vehicles, sub-prime mortgage-backed securities and collateralized debt obligations, may pose risks arising from liquidity and credit concerns. As of December 31, 2009, we had no direct holdings in these categories of investments and our exposure to these financial instruments through our indirect holdings in money market mutual funds was not material to total cash, cash equivalents and short-term investments. As a result of market conditions, the value of our investments in publicly held companies in Taiwan, a component of our long-term investment portfolio, may fluctuate significantly from quarter to quarter. The value of these investments declined significantly in the fourth quarter of 2008 and we recorded an impairment charge of $231,000 associated with our investment in KYE. Please see Note 15, “Investments” to our consolidated financial statements for more information on our investment in KYE. We did not record any impairments associated with our investments in publicly held companies during 2009. However, we cannot predict future market conditions or market liquidity and our investment portfolio may be impaired by future events.
We do not typically enter into long-term contracts with our customers, and the loss of a major customer could harm our business.
We do not typically enter into long-term contracts with our customers. In addition, we cannot be certain as to future order levels from our customers. In the past, when we have entered into a long-term contract, the contract has generally been terminable at the convenience of the customer. However, we do lose and obtain major customer accounts from time to time and the loss of a major customer could harm our business.
19
Table of Contents
We depend on stocking representatives and distributors to generate a majority of our revenues.
We rely on stocking representatives and distributors to establish and maintain customer relationships and to sell our products. These stocking representatives and distributors could discontinue their relationship with us or discontinue selling our products at any time. The majority of our stocking representatives are located in Asia. The loss of our relationship with any stocking representative or distributor could harm our operating results by impairing our ability to sell our products to our end customers.
We depend on Silicon Professional Technology Ltd., or SPT, our logistics center, to support many of our customers in Asia.
We out-source our end customer service logistics in Asia to Silicon Professional Technology Ltd., or SPT, which supports our customers in Taiwan, China and other Southeast Asia countries. SPT provides forecasting, planning, warehousing, delivery, billing, collection and other logistic functions for us in these regions. SPT is a wholly-owned subsidiary of one of our stocking representatives in Taiwan, Professional Computer Technology Limited, or PCT. Products shipped to SPT are accounted for as our inventory held at our logistics center, and revenue is recognized when the products have been delivered and are considered as a sale to our end customers by SPT. During 2007, 2008 and 2009, SPT serviced end customer sales accounting for 60.1%, 56.2% and 59.5%, respectively, of our net product revenues recognized. As of December 31, 2007, 2008 and 2009, SPT represented 65.3%, 50.9% and 66.1%, respectively, of our net accounts receivable. For further description of our relationships with PCT and SPT, please refer to Item 7. “Management’s Discussion and Analysis of Financial Condition and Results of Operation—Related Party Reporting.”
We do not have any long-term contracts with SPT, PCT or Silicon Professional Alliance Corporation, or SPAC, another subsidiary of PCT. SPT, PCT or SPAC may cease providing services to us at any time. If SPT, PCT or SPAC were to terminate their relationship with us we would experience a delay in reestablishing warehousing, logistics and distribution functions, and it could impair our ability to collect accounts receivable from SPT and may harm our business. In addition if SPT were to experience financial difficulty, our collection of our accounts receivable could be adversely affected and our business could be harmed.
We depend on a limited number of foreign foundries to manufacture our products, and these foundries may not be able to satisfy our manufacturing requirements, which could cause our revenues to decline.
We outsource substantially all of our manufacturing and testing activities. We currently buy all of our wafers and sorted die from a limited number of suppliers. The majority of our products are manufactured by four foundries, Grace and HHNEC in China, TSMC in Taiwan, and SMIC. We have an equity investment in GSMC, a Cayman Islands company, which owns a wafer foundry subsidiary, Grace, in Shanghai, China. We anticipate that these foundries, together with Samsung Corporation in Korea and Maxchip in Taiwan will continue to manufacture substantially all of our products in the foreseeable future. If these suppliers fail to satisfy our requirements on a timely basis at competitive prices we could suffer manufacturing delays, a possible loss of revenues or higher than anticipated costs of revenues, any of which could harm our operating results. Purchases from our top three suppliers accounted for 52.1% and 36.3% of our costs of revenues in 2008 and 2009, respectively.
Our revenues may be impacted by our ability to obtain adequate wafer supplies from our foundries and NAND memory chips from our suppliers. The foundries with which we currently have arrangements, together with any additional foundry at which capacity might be obtained, may not be willing or able to satisfy all of our manufacturing requirements on a timely basis at favorable prices. In addition, we have encountered delays in qualifying new products and in ramping-up new product production and we could experience these delays in the future. We are also subject to the risks of service disruptions, raw material shortages and price increases by our foundries. Such disruptions, shortages and price increases could harm our operating results.
20
Table of Contents
Manufacturing capacity has in the past been difficult to secure and if capacity constraints arise in the future our revenues may decline.
In order to grow, we need to increase our present manufacturing capacity. The existing available capacity from Grace, HHNEC and TSMC was insufficient during 2007. We subsequently contracted for additional manufacturing capacity and do not expect capacity constraints in the near future. However, events that we have not foreseen could arise which would further limit our capacity. Similar to our investment in GSMC, we may determine that it is necessary to invest substantial capital in order to secure appropriate production capacity commitments. If we cannot secure additional manufacturing capacity on acceptable terms, our ability to grow will be impaired and our operating results will be harmed.
Our cost of revenues may increase if we are required to purchase manufacturing capacity in the future.
To obtain additional manufacturing capacity, we may be required to make prepayments, deposits, equipment purchases, loans, joint ventures, equity investments or technology licenses in or with wafer fabrication companies. These transactions could involve a commitment of substantial amounts of our capital and technology licenses in return for production capacity. We may be required to seek additional debt or equity financing if we need substantial capital in order to secure this capacity and we cannot assure you that we will be able to obtain such financing.
If our foundries fail to achieve acceptable wafer manufacturing yields, we will experience higher costs of revenues and reduced product availability.
The fabrication of our products requires wafers to be produced in a highly controlled and ultra-clean environment. Semiconductor companies that supply our wafers have, from time to time, experienced problems achieving acceptable wafer manufacturing yields. Semiconductor manufacturing yields are a function of both our design technology and the foundry’s manufacturing process technology. Low yields may result from marginal design or manufacturing process drift. Yield problems may not be identified until the wafers are well into the production process, which often makes them difficult, time consuming and costly to correct. Furthermore, we rely on independent foundries for our wafers which increases the effort and time required to identify, communicate and resolve manufacturing yield problems. If our foundries fail to achieve acceptable manufacturing yields, we will experience higher costs of revenues and reduced product availability, which could harm our operating results.
If our foundries discontinue the manufacturing processes needed to meet our demands, or fail to upgrade the technologies needed to manufacture our products, we may face production delays and lower revenues.
Our wafer and product requirements typically represent a small portion of the total production of the foundries that manufacture our products. As a result, we are subject to the risk that a foundry will cease production on an older or lower-volume manufacturing process that it uses to manufacture our products. Additionally, we cannot be certain our foundries will continue to devote resources to advance the process technologies on which the manufacturing of our products is based. We are currently transitioning to lower geometries, and if our foundries are unable to successfully make this transition our business will be harmed. Either one of these events could increase our costs and harm our ability to deliver our products on time.
Our dependence on third-party subcontractors to manufacture, assemble and test our products subjects us to a number of risks, including disruption and an inadequate supply of products and higher costs of materials.
We depend on independent subcontractors to manufacture, assemble and test our products. Our reliance on these subcontractors involves the following significant risks:
| • | disruption or complete shut down of supply to customers due to fire, earthquake, flood or other natural disaster; |
| • | reduced control over delivery schedules and quality; |
21
Table of Contents
| • | the potential lack of adequate capacity during periods of strong demand; |
| • | difficulties selecting and integrating new subcontractors; |
| • | limited warranties on the service they provide to us; |
| • | potential increases in prices due to capacity shortages and other factors; and |
| • | potential misappropriation of our intellectual property. |
These risks may lead to increased costs, delayed product delivery or loss of competitive advantage, which would harm our profitability and customer relationships.
Because our flash memory, radio frequency IC and NANDrive products typically have lengthy sales cycles, we may experience substantial delays between incurring expenses related to research and development and the generation of revenues.
Due to the flash memory product cycle we usually require more than nine months to realize volume shipments after we first contact a customer. We first work with customers to achieve a design-in, which may take three months or longer. Our customers then complete the design, testing and evaluation process and begin to ramp up production, a period which typically lasts an additional nine months or longer. As a result, a significant period of time may elapse between our research and development efforts and our realization of revenue, if any, from volume purchasing of our products by our customers. We expect that the current negative global economic conditions will continue to lengthen our sales cycles.
Our success is dependent on the growth and strength of the flash memory market.
Substantially all of our products, as well as all new products currently under design, are stand-alone flash memory devices or devices embedded with flash memory. A memory technology other than SuperFlash may be adopted as an industry standard. Our competitors are generally in a better financial and marketing position than we are from which to influence industry acceptance of a particular memory technology. In particular, a primary source of competition may come from alternative technologies such as FRAM or MRAM devices if such technology is commercialized for higher density applications. To the extent our competitors are able to promote a technology other than SuperFlash as an industry standard, our business will be harmed.
We face intense competition from companies with significantly greater financial, technical and marketing resources that could harm sales of our products.
We compete with major domestic and international semiconductor companies, many of which have substantially greater financial, technical, marketing, distribution, and other resources than we do. Many of our competitors have their own facilities for the production of semiconductor memory or non-memory components and have recently added significant capacity for such production. Our low-density memory products, medium-density memory products, and high-density memory products, as well as our radio frequency IC and NANDrive products, if we are successful in developing these products, face substantial competition. In addition, we may in the future experience direct competition from our foundry partners.
We have licensed to our foundry partners the right to fabricate products based on our technology and circuit design, and to sell such products worldwide, subject to our receipt of royalty payments. Competition may also come from alternative technologies such as ferroelectric random access memory devices, or FRAM, magneto-resistive random access memory, or MRAM, phase change memory, or PCM, or other developing technologies.
Our markets are subject to rapid technological change and, therefore, our success depends on our ability to develop and introduce new products.
The markets for our products are characterized by:
| • | rapidly changing technologies; |
22
Table of Contents
| • | evolving and competing industry standards; |
| • | changing customer needs; |
| • | frequent new product introductions and enhancements; |
| • | increased integration with other functions; and |
| • | rapid product obsolescence. |
To develop new products for our target markets, we must develop, gain access to and use leading technologies in a cost-effective and timely manner and continue to expand our technical and design expertise. In addition, we must have our products designed into our customers’ future products and maintain close working relationships with key customers in order to develop new products that meet their changing needs. In addition, products for communications applications are based on continually evolving industry standards. Our ability to compete will depend on our ability to identify and ensure compliance with these industry standards. As a result, we could be required to invest significant time and effort and incur significant expense to redesign our products and ensure compliance with relevant standards. We believe that products for these applications will encounter intense competition and be highly price sensitive. While we are currently developing and introducing new products for these applications, we cannot assure you that these products will reach the market on time, will satisfactorily address customer needs, will be sold in high volume, or will be sold at profitable margins.
We cannot assure you that we will be able to identify new product opportunities successfully, develop and bring to market new products, achieve design wins or respond effectively to new technological changes or product announcements by our competitors. In addition, we may not be successful in developing or using new technologies or in developing new products or product enhancements that achieve market acceptance. Our pursuit of necessary technological advances may require substantial time and expense. Failure in any of these areas could harm our operating results.
The high level of complexity and integration of our products increases the risk of latent defects, which could damage customer relationships and increase our costs.
Our products are based upon evolving technology and are highly complex. The integration of additional functions into already complex products could result in a greater risk that customers or end users could discover latent defects or subtle faults after we have already shipped significant quantities of a product. Although we test our products, we may in the future encounter defects or errors. Delivery of products with defects or reliability, quality or compatibility problems may damage our reputation and ability to retain existing customers and attract new customers. In addition, product defects and errors could result in additional development costs, diversion of technical resources, delayed product shipments, increased product returns, product warranty costs for recall and replacement and product liability claims against us which may not be fully covered by insurance.
Our future success depends in part on the continued service of our key design engineering, sales, marketing and executive personnel and our ability to identify, recruit and retain additional personnel.
We are dependent on Bing Yeh, our Chief Executive Officer, as well as the other principal members of our management team and engineering staff. There is intense competition for qualified personnel in the semiconductor industry, in particular the highly skilled design, applications and test engineers involved in the development of flash memory technology. Competition is especially intense in Silicon Valley, where our corporate headquarters are located. We may not be able to continue to attract and retain engineers or other qualified personnel necessary for the development of our business or to replace engineers or other qualified personnel who may leave our employ in the future. Our anticipated growth is expected to place increased demands on our resources and will likely require the addition of new management and engineering personnel and the development of additional expertise by existing management personnel. The failure to recruit and retain key design engineers or other technical and management personnel could harm our business.
23
Table of Contents
Our ability to compete successfully depends, in part, on our ability to protect our intellectual property rights.
We rely on a combination of patent, trade secrets, copyrights, mask work rights, nondisclosure agreements and other contractual provisions and technical measures to protect our intellectual property rights. Policing unauthorized use of our products, however, is difficult, especially in foreign countries. Litigation may continue to be necessary in the future to enforce our intellectual property rights, to protect our trade secrets, to determine the validity and scope of the proprietary rights of others, or to defend against claims of infringement or invalidity. Litigation could result in substantial costs and diversion of resources and could harm our business, operating results and financial condition regardless of the outcome of the litigation. As of December 31, 2009, we held 278 patents in the United States relating to certain aspects of our products and processes, with expiration dates ranging from 2010 to 2029 and have filed for several more. In addition, we hold several patents in Europe, Japan, Korea, Taiwan and China. We cannot assure you that any pending patent application will be granted. Our operating results could be harmed by the failure to protect our intellectual property.
The matters relating to the review of our historical stock option granting practices and the restatement of our consolidated financial statements has resulted in litigation, which could harm our financial results.
In March 2007, our Board of Directors determined to conduct a voluntary review of our historical stock option grant practices covering the time since our initial public offering in 1995. The review was led by the Chairman of the Audit Committee of the Board of Directors with the assistance of outside independent legal counsel, and began on or about March 15, 2007. As described further in Item 7. “Management’s Discussion and Analysis of Financial Condition and Results of Operations” and Note 2 to our consolidated financial statements in our Annual Report on Form 10-K for the year ended December 31, 2006, the Chairman of the Audit Committee reached the conclusion that incorrect measurement dates were used for financial accounting purposes for stock option grants made in certain prior periods. As a result, we recorded additional non-cash share-based compensation expense, and related tax effects, related to stock option grants and restated our historical financial statements. The review of our historical stock option granting practices required us to incur substantial expenses for legal, accounting, tax and other professional services, totaling $12.0 million for 2007. In addition, the review diverted management’s attention from our business, and could in the future harm our business, financial condition, results of operations and cash flows.
We are engaged in derivative suits, which may become time consuming, costly and divert management resources and could impact our stock price.
Securities class action law suits are often brought against companies, particularly technology companies, following periods of volatility in the market price of their securities. Irrespective of the validity or the successful assertion of such claims, we could incur significant costs and management resources in defending against such claims. Our historical stock option granting practices and the restatement of our prior financial statements have exposed us to greater risks associated with litigation. As described in Item 3. “Legal Proceedings,” several derivative complaints have been filed against our directors and certain of our executive officers pertaining to allegations relating to stock option grants.
The complaints were brought purportedly on behalf of SST against certain of our current and former officers and directors and allege, among other things, that the named officers and directors: (a) breached their fiduciary duties as they colluded with each other to backdate stock options, (b) violated Rule 10b-5 of the Securities Exchange Act of 1934, and (c) were unjustly enriched by their receipt and retention of such stock options. These or future similar complaints, or any future litigation may not result in the same conclusions reached by the Chairman of the Audit Committee. The conduct and resolution of these matters or other litigation will be time consuming, expensive and may distract management from the conduct of our business.
Former employees may also bring lawsuits against us or engage us in arbitration relating to their stock options and other matters. These lawsuits may be time consuming and expensive, and cause further distraction from the operation of our business. The adverse resolution of any specific lawsuit could harm our business, financial condition and results of operations.
24
Table of Contents
From time to time, we are also involved in other legal actions arising in the ordinary course of business. There can be no assurance that the shareholder class action complaints, the shareholder derivative complaints or other third party assertions will be resolved without costly litigation, in a manner that is not adverse to our financial position, results of operations or cash flows or without requiring payments in the future which may adversely impact gross margins.
During the course of these lawsuits there may be public announcements of the results of hearings, motions, and other interim proceedings or developments in the litigation. If securities analysts or investors perceive these results to be negative, it could harm the market price of our stock. We have incurred certain costs associated with defending these matters, and at any time, additional claims may be filed against us, which could increase the risk, expense and duration of the litigation. Further, because of the amount of discovery required in connection with this type of litigation, there is a risk that some of our confidential information could be compromised by disclosure. For more information with respect to our litigation, please also see Item 3. “Legal Proceedings.”
On February 25, 2010, we announced that we had reached a proposed settlement of federal and state derivative litigation originally filed in 2005 and 2006 relating to certain prior option grant practices. The proposed settlement has been preliminarily approved by the United States District Court for the Northern District of California, or the Federal Court, subject to final approval at a hearing scheduled for April 9, 2010. Under the terms of the settlement, if the settlement is approved by the Federal Court, the state cases will be voluntarily dismissed. The settlement agreement does not contain any admission of wrongdoing or fault on the part of SST, our Board of Directors or executive officers. While we expect the Federal Court to approve the settlement agreement, there can be no assurance that it will approved. If the settlement agreement is not approved, we may be required to continue litigating the cases or pay damages or penalties, and we may have other remedies imposed on us that could harm our business. We have accrued what we believe to be probable costs in connection with the potential settlement of the shareholder class action complaints and the shareholder derivative complaints. As a result, approximately $0.7 million is included in Accrued expenses and other liabilities in our financial statements as of December 31, 2009.
If we are accused of infringing the intellectual property rights of other parties we may become subject to time consuming and costly litigation. If we lose, we could suffer a significant impact on our business and be forced to pay damages.
Third parties may assert that our products infringe their proprietary rights, or may assert claims for indemnification resulting from infringement claims against us. Any such claims may cause us to delay or cancel shipment of our products or pay damages that could harm our business, financial condition and results of operations. In addition, irrespective of the validity or the successful assertion of such claims, we could incur significant costs in defending against such claims.
We receive from time to time, letters or communications from other companies stating that such companies have patent rights that involve our products. Since the design of most of our products is based on SuperFlash technology, any legal finding that the use of our SuperFlash technology infringes the patent of another company would have a significantly negative effect on our entire product line and operating results. Furthermore, if such a finding were made, there can be no assurance that we could license the other company’s technology on commercially reasonable terms or that we could successfully operate without such technology. Moreover, if we are found to infringe, we could be required to pay damages to the owner of the protected technology and could be prohibited from making, using, selling, offering to sell or importing into the United States any products that infringe the protected technology.
In addition, the management attention consumed by and legal cost associated with any litigation could harm our operating results. During the course of these lawsuits there may be public announcements of the results of hearings, motions, and other interim proceedings or developments in the litigation. If securities analysts or investors perceive these results to be negative, it could harm the market price of our stock.
25
Table of Contents
If an earthquake or other natural disaster strikes our manufacturing facility or those of our suppliers, we would be unable to manufacture our products for a substantial amount of time and we would experience lost revenues.
Our corporate headquarters are located in California near major earthquake faults. In addition, some of our suppliers are located near fault lines. In the event of a major earthquake or other natural disaster near our headquarters, our operations could be harmed. Similarly, a major earthquake or other natural disaster such as typhoon near one or more of our major suppliers, like the earthquakes in April 2006 and December 2006 or the typhoons in September 2001 and July 2005 that occurred in Taiwan, could potentially disrupt the operations of those suppliers, which could then limit the supply of our products and harm our business.
Terrorist attacks and threats, and government responses thereto, could harm our business.
Terrorist attacks in the United States or abroad against American interests or citizens, U.S. retaliation for these attacks, threats of additional terrorist activity and the war in Iraq have caused our customer base to become more cautious. Any escalation in these events or similar future events may disrupt our operations or those of our customers, distributors and suppliers, affect the availability of materials needed to manufacture our products, or affect the means to transport those materials to manufacturing facilities and finished products to customers. In addition, these events have had and may continue to have an adverse impact on the U.S. and world economy in general and consumer spending in particular, which could harm our business.
A virus or viral outbreak in Asia or elsewhere could harm our business.
We derive substantially all of our revenues from Asia and our logistics center is located in Taiwan. A virus or viral outbreak in Asia, such as the SARS outbreak in early 2003 or threat of the Avian or Swine flu, could harm the operations of our suppliers, distributors, logistics center and those of our end customers, which could harm our business.
Prolonged electrical power outages, energy shortages, or increased costs of energy could harm our business.
Our design and process research and development facilities and our corporate offices are located in California, which is susceptible to power outages and shortages as well as increased energy costs. To limit this exposure, all corporate computer systems at our main California facilities are on battery back-up. In addition, all of our engineering and back-up servers and selected corporate servers are on generator back-up. While the majority of our production facilities are not located in California, more extensive power shortages in the state could delay our design and process research and development as well as increase our operating costs.
Our growth has in the past placed a significant strain on our management systems and resources and if we fail to manage our growth, our ability to market or sell our products or develop new products may be harmed.
Our business has in the past experienced rapid growth which strained our internal systems and future growth will require us to continuously develop sophisticated information management systems in order to manage our business effectively. We have implemented a supply-chain management system and a vendor electronic data interface system. There is no guarantee that these measures, in themselves, will be adequate to address any growth, or that we will be able to foresee in a timely manner other infrastructure needs before they arise. Our success depends on the ability of our executive officers to effectively manage our growth. If we are unable to manage our growth effectively, our results of operations will be harmed. If we fail to successfully implement new management information systems, our business may suffer severe inefficiencies that may harm the results of our operations.
26
Table of Contents
If we determine that we have a material weakness in our internal control over financial reporting, current and potential shareholders could lose confidence in our financial reporting, which would harm our business and the trading price of our stock.
Under Section 404 of the Sarbanes-Oxley Act of 2002, we are required to evaluate and determine the effectiveness of our internal control over financial reporting. We have dedicated a significant amount of time and resources to ensure compliance with this legislation for the year ended December 31, 2009 and will continue to do so for future fiscal periods. We may encounter problems or delays in completing the review, evaluation, and the implementation of improvements. Additionally, management’s assessment of our internal control over financial reporting may identify deficiencies that need to be addressed in our internal control over financial reporting or other matters that may raise concerns for investors.
During the second quarter of 2009, we identified an error related to the recording of the income tax provision. Despite having engaged third party tax experts to assist us, in calculating our tax provision for the quarter ended March 31, 2009, we incorrectly calculated our reserve for foreign tax withholding on license revenue. We concluded that our disclosure controls and procedures were not effective as of June 30 and September 30, 2009, as a result of a material weakness in our internal control over financial reporting, specifically the controls which ensure the accuracy of the provision for income taxes. Management implemented a remediation plan and remediated the material weaknesses as of December 31, 2009.
Should we determine in future fiscal periods that we have additional material weaknesses in our internal controls over financial reporting, the reliability of our financial reports may be impacted, and our results of operations or financial condition may be harmed and the price of our common stock may decline.
Future changes in financial accounting standards or practices or existing taxation rules or practices may cause adverse unexpected revenue fluctuations and affect our reported results of operations.
A change in accounting standards or practices or a change in existing taxation rules or practices can have a significant effect on our reported results and may even affect reporting of transactions completed before the change is effective. New accounting pronouncements and taxation rules and varying interpretations of accounting pronouncements and taxation practice have occurred and may occur in the future. Changes to existing rules or the questioning of current practices may adversely affect our reported financial results or the way we conduct our business.
Evolving regulation of corporate governance and public disclosure may result in additional expenses and continuing uncertainty.
Changing laws, regulations and standards relating to corporate governance and public disclosure, including the Sarbanes-Oxley Act of 2002, SEC regulations and NASDAQ Marketplace rules are creating uncertainty for public companies. We continually evaluate and monitor developments with respect to new and proposed rules and cannot predict or estimate the amount of the additional costs we may incur or the timing of such costs. These new or changed laws, regulations and standards are subject to varying interpretations, in many cases due to their lack of specificity, and as a result, their application in practice may evolve over time as new guidance is provided by regulatory and governing bodies. This could result in continuing uncertainty regarding compliance matters and higher costs necessitated by ongoing revisions to disclosure and governance practices. We are committed to maintaining high standards of corporate governance and public disclosure. As a result, we have invested resources to comply with evolving laws, regulations and standards, and this investment has resulted in increased general and administrative expenses and a diversion of management time and attention from revenue-generating activities to compliance activities. If our efforts to comply with new or changed laws, regulations and standards differ from the activities intended by regulatory or governing bodies due to ambiguities related to practice, regulatory authorities may initiate legal proceedings against us and we may be harmed.
27
Table of Contents
Acquisitions could result in operating difficulties, dilution and other harmful consequences.
In 2005 we acquired Actrans Systems Inc., a fabless semiconductor company that designs flash memory and EEPROMs and completed our acquisition of Emosyn, LLC, a fabless semiconductor manufacturer specializing in the design and marketing of smart card ICs for SIM applications. We expect to continue to evaluate and consider a wide array of potential strategic transactions, including business combinations, acquisitions and dispositions of businesses, technologies, services, products and other assets, including interests in our existing subsidiaries and joint ventures. At any given time we may be engaged in discussions or negotiations with respect to one or more of such transactions. Any such transactions could be material to our financial condition and results of operations. There is no assurance that any such discussions or negotiations will result in the consummation of any transaction. The process of integrating any acquired business may create unforeseen operating difficulties and expenditures and is itself risky. The areas where we may face difficulties include:
| • | diversion of management time, as well as a shift of focus from operating the businesses to issues of integration and future products; |
| • | declining employee morale and retention issues resulting from changes in compensation, reporting relationships, future prospects, or the direction of the business; |
| • | the need to integrate each company’s accounting, management information, human resource and other administrative systems to permit effective management, and the lack of control if such integration is delayed or not implemented; |
| • | the need to implement controls, procedures and policies appropriate for a public company at companies that prior to acquisition had lacked such controls, procedures and policies; and |
| • | in some cases, the need to transition operations onto our technology platforms. |
International acquisitions involve additional risks, including those related to integration of operations across different cultures and languages, currency risks, and the particular economic, political, and regulatory risks associated with specific countries. Moreover, we may not realize the anticipated benefits of any or all of our acquisitions. As a result of future acquisitions or mergers, we might need to issue additional equity securities, spend our cash, or incur debt, contingent liabilities, or amortization expenses related to intangible assets, any of which could reduce our profitability and harm our business.
| Item 1B. | Unresolved Staff Comments |
None.
| Item 2. | Properties |
As of December 31, 2009, our executive offices, research and development and principal manufacturing engineering facilities are located in an approximately 92,000 square foot leased facility in Sunnyvale, California. In addition, we lease an approximately 20,000 square foot facility and own an approximately 20,000 square feet facility in Sunnyvale, both of which are currently unoccupied. The leases on the two facilities in Sunnyvale expire in 2010 and 2011, and as part of our restructuring plan to reduce expenses, we vacated the owned facility in January 2009. We also have approximately 109,000 square feet of office space in various domestic and international sites with expiration ranging from 2010 to 2027. We believe these facilities and any others we may lease in the future are adequate to meet our needs for at least the next twelve months.
| Item 3. | Legal Proceedings |
On July 13, 2006, a shareholder derivative complaint was filed in the United States District Court for the Northern District of California (the “Federal Court”) by Mike Brien under the caption Brien v. Yeh, et al., Case No. C06-04310 JF. On July 18, 2006, a second shareholder derivative complaint was filed in the Federal Court by Behrad Bazargani under the caption Bazargani v. Yeh, et al., Case No. C06-04388 HRL. Both complaints were brought purportedly on behalf of SST against certain of our current and former officers and directors and
28
Table of Contents
allege among other things, that the named officers and directors breached their fiduciary duties as they colluded with each other to backdate stock options; violated Rule 10b-5 of the Securities Exchange Act of 1934; and were unjustly enriched by their receipt and retention of such stock options. The Brien and Bazargani cases were consolidated into one case: In re Silicon Storage Technology, Inc. Derivative Litigation, Case No. C06-04310 JF (“Federal Derivative Litigation”) and plaintiffs filed a consolidated amended shareholder derivative complaint on October 30, 2006. The parties initiated settlement discussions and filed several stipulations to extend the defendants’ deadline to respond to the consolidated amended shareholder derivative complaint, which the Federal Court granted. On March 15, 2007, we announced that the Chair of our Audit Committee, with the assistance of independent outside counsel and outside accounting experts, would be conducting a voluntary review of our historical stock option grant practices covering the time from our initial public offering in 1995 through the current fiscal year. On April 27, 2007, the Federal Court granted the parties’ stipulation staying this action until after SST publicly announced the results of the investigation into the historical stock option grant practices. On January 16, 2008, SST filed our Annual Report on Form 10-K for the year ended December 31, 2006, containing the results of such investigation. Plaintiffs in the Federal Derivative Litigation filed an amended complaint on May 9, 2008. Defendants filed a motion to dismiss on October 17, 2008, and the motion was heard on April 24, 2009. On July 7, 2009, the Federal Court granted defendants’ motion and dismissed the federal securities claims with leave to amend. Federal plaintiffs filed a third amended complaint on August 21, 2009. The newest complaint asserted state-law fiduciary duty claims based on diversity jurisdiction; no federal securities claims were alleged. On September 24, 2009, defendants moved to dismiss the third amended complaint with prejudice. Following the filing of this motion, the parties in the Federal Derivative Litigation, together with the parties in the related state court derivative litigation discussed below, reached a tentative agreement to settle all of these matters. On or about February 1, 2010, the parties in all of these matters entered into a stipulation and agreement of settlement and submitted the same to the Federal Court. Among other things, the settlement provides for the dismissal with prejudice and release of all claims alleged in the Federal Derivative Litigation and related state court derivative litigation (discussed below), implementation of certain corporate governance reforms by SST, and the payment of attorneys fees and costs to plaintiffs’ counsel in an amount not to exceed $2,810,000, subject to Federal Court approval, of which SST has agreed to pay $680,000 and SST’s insurers have agreed to pay $2,130,000. Our estimated liability of $680,000, which was accrued during the quarter ended September 30, 2009, is included in Accrued expenses and other liabilities on our consolidated Balance Sheets at December 31, 2009. On February 5, 2010, the Federal Court held a hearing at which it granted preliminary approval of the settlement, ordered that notice of the settlement be provided to SST’s shareholders, and set a final approval hearing for April 9, 2010.
On October 31, 2006, a similar shareholder derivative complaint was filed in the Superior Court of the State of California for the County of Santa Clara by Alex Chuzhoy under the caption Chuzhoy v. Yeh, et al., Case No. 1-06-CV-074026. This complaint was brought purportedly on behalf of SST against certain current and former officers and directors and alleges among other things, that the named officers and directors breached their fiduciary duties as they colluded with each other to backdate stock options and were allegedly unjustly enriched by their actions. The Chuzhoy complaint also alleges that certain defendants violated section 25402 of the California Corporations Code by selling shares of our common stock while in possession of material non-public adverse information. The parties initiated settlement discussions and filed several stipulations to extend defendants’ deadline to respond to the shareholder derivative complaint, which the court granted. On April 13, 2007, the court granted the parties’ stipulation staying this action until after we publicly announced the results of the investigation into the historical stock option grant practices. On January 16, 2008, we filed our Annual Report on Form 10-K for the year ended December 31, 2006, containing the results of such investigation. On January 25, 2008, the court and parties in the Chuzhoy matter agreed to postpone the filing of the amended complaint pending settlement discussions. As discussed above, the stipulation of settlement in the Federal Derivative Litigation, if approved, would result in the dismissal with prejudice and release of all claims asserted in this action on the terms described above.
In January and February 2005, multiple shareholder derivative complaints were filed in California Superior Court for the County of Santa Clara, purportedly on behalf of SST against certain current and former officers and directors. The derivative complaints asserted claims for, among other things, breach of fiduciary duty and violations of the California Corporations Code. These derivative actions were consolidated under the caption In Re Silicon
29
Table of Contents
Storage Technology, Inc. Derivative Litigation, Lead Case No. 1:05CV034387. On April 28, 2005, the derivative action was stayed by court order. On October 19, 2007, following the dismissal with prejudice of certain federal putative class actions, the court lifted this stay. On December 6, 2007, plaintiffs filed a consolidated amended complaint reiterating some of the previous claims and asserting claims substantially identical to those contained in the Chuzhoy v. Yeh, et al., Case No. 1-06-CV-074026 and the Federal Derivative Litigation. Defendants filed a demurrer on May 12, 2008. On October 31, 2008, the court sustained the demurrer and gave plaintiffs leave to amend. As discussed above, the stipulation of settlement in the Federal Derivative Litigation, if approved, would result in the dismissal with prejudice and release of all claims asserted in this action on the terms described above.
Beginning on November 16, 2009, six purported class action lawsuits were filed in the California Superior Court for the County of Santa Clara against SST, certain of our current and former officers and directors, Technology Resources Holdings, Inc. and Prophet Equity LP, in connection with a proposed merger between Technology Resources Holdings, Inc. and SST. The lawsuits were subsequently consolidated into a single action entitled In re Silicon Storage Technology, Inc. Shareholder Litigation, No. 109CV157437, The complaints in the six lawsuits, or the original complaints, were substantially similar and alleged, among other things, that such proposed merger was the product of a flawed process; that the consideration to be paid to SST’s shareholders in connection with such proposed merger was unfair and inadequate; that our officers and directors breached their fiduciary duties by, among other things, taking actions designed to deter higher offers from other potential acquirers and failing to maximize the value of SST to our shareholders; and that Prophet Equity LP and SST aided and abetted the actions of our officers and directors in breaching their fiduciary duties. The complaints sought, among other relief, an injunction preventing consummation of the proposed merger, an order rescinding the proposed merger or any of its terms to the extent already implemented, costs and disbursements of the lawsuits, including attorneys’ and experts’ fees, and such other relief as the court might find just and proper. On February 9, 2010, the court entered an order consolidating the six actions and directing plaintiffs to inform the court which of the complaints filed to date should be deemed the operative complaint. On March 16, 2010, plaintiffs filed a consolidated amended complaint, or the CAC. The CAC contains similar allegations as those contained in the original complaints, now concerning alleged breaches of fiduciary duties by certain of our current officers and directors in connection with the proposed acquisition of SST by Microchip Technology Incorporated, or Microchip, and the process leading up to our Board’s decision to recommend the Microchip acquisition, and requests similar relief as the relief requested in the original complaints. The CAC no longer asserts claims against Technology Resources Holding, Inc. and Prophet Equity LP, but now asserts similar claims against Microchip and Sun Acquisition Corporation. We believe the consolidated lawsuit is without merit and plan to defend against it vigorously. Additional lawsuits pertaining to a strategic transaction involving SST could be filed in the future and if so, will likely be consolidated with the consolidated lawsuit.
From time to time, we are also involved in other legal actions arising in the ordinary course of business. We have accrued certain costs associated with defending these matters. There can be no assurance that the shareholder class action complaints, the shareholder derivative complaints or other third party assertions will be resolved without costly litigation, in a manner that is not adverse to our financial position, results of operations or cash flows or without requiring payments in the future which may adversely impact net income. We have accrued what we believe to be probable costs in connection with the potential settlement of the shareholder class action complaints and the shareholder derivative complaints.
| Item 4. | (Removed and Reserved) |
30
Table of Contents
PART II
| Item 5. | Market for Registrant’s Common Stock, Related Stockholder Matters and Issuer Purchases of Equity Securities |
Price Range of Common Stock
The principal U.S. market for our common stock is the NASDAQ Global Market. The only class of our securities that is traded is our common stock. Our common stock has traded on the NASDAQ Global Market since November 21, 1995, under the symbol SSTI. The following table sets forth the quarterly high and low sales prices of our common stock for the period indicated, as reported by the NASDAQ Global Market. These prices do not include retail mark-ups, markdowns or commissions. The adjusted closing sales price of our common stock on December 31, 2009, the last trading day in 2009, was $2.56.
| 2008 |
High | Low | ||||||
| First Quarter: | January 1 - March 31, 2008 | $ | 3.01 | $ | 2.58 | |||
| Second Quarter: | April 1 - June 30, 2008 | $ | 3.30 | $ | 2.74 | |||
| Third Quarter: | July 1 - September 30, 2008 | $ | 3.50 | $ | 2.72 | |||
| Fourth Quarter: | October 1 - December 31, 2008 | $ | 3.25 | $ | 2.05 | |||
| 2009 |
High | Low | ||||||
| First Quarter: | January 1 - March 31, 2009 | $ | 2.54 | $ | 1.30 | |||
| Second Quarter: | April 1 - June 30, 2009 | $ | 2.13 | $ | 1.60 | |||
| Third Quarter: | July 1 - September 30, 2009 | $ | 2.50 | $ | 1.67 | |||
| Fourth Quarter: | October 1 - December 31, 2009 | $ | 2.56 | $ | 1.86 | |||
31
Table of Contents
Comparison of Five Year Cumulative Total Return(1)
The following graph compares the total cumulative stockholder return on our common stock with the total cumulative return of the NASDAQ Composite Index and the RDG Semiconductor Composite Index for the five year period from December 31, 2004 through December 31, 2009.
COMPARISON OF 5 YEAR CUMULATIVE TOTAL RETURN*
Among Silicon Storage Technology, Inc., The NASDAQ Composite Index
And The RDG Semiconductor Composite Index
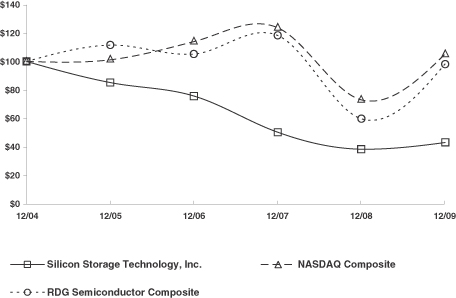
| * | $100 invested on 12/31/04 in stock or index, including reinvestment of dividends. Fiscal year ending December 31. |
Approximate Number of Equity Security Holders
As of December 31, 2009, there were approximately 411 record holders of our common stock.
Dividends
We have never paid a cash dividend on our common stock and we may continue to retain earnings, if any, to finance future growth. We continuously evaluate our ability to pay dividends.
Equity Compensation Plan Information
The information required by this item will be included in Form 10-K/A, to be filed no later than 120 days after the end of the reporting period, in the event that we are subject to such requirements at that time.
| (1) | This stock performance chart shall not be deemed to be “soliciting material” or be deemed “filed” with the SEC, nor shall such information be incorporated by reference into any future filing under the Securities Act of 1933 or Securities Exchange Act of 1934, each as amended, except to the extent that we specifically incorporate it by reference into such filing. |
32
Table of Contents
Issuer Purchases of Equity Securities
In January 2008, our Board of Directors approved a stock repurchase program of up to $30.0 million of our common stock at any time commencing February 11, 2008. We repurchased an aggregate of 9,518,000 shares at an average price per share of $3.04 in 2008. At December 31, 2008, the program was suspended. We made no repurchases under the program in 2009. As of December 31, 2009, $1.1 million remained available for repurchase under the existing repurchase authorization.
| Item 6. | Selected Consolidated Financial Data |
The information set forth below is not necessarily indicative of results of future operations, and should be read in conjunction with Item 7. “Management’s Discussion and Analysis of Financial Condition and Results of Operations” in this Annual Report on Form 10-K.
| Year ended December 31, | ||||||||||||||||||||
| 2005(1) | 2006(2) | 2007(3) | 2008(4) | 2009 | ||||||||||||||||
| (in thousands, except per share data) | ||||||||||||||||||||
| Consolidated Statements of Operations Data: |
||||||||||||||||||||
| Net revenues |
$ | 430,899 | $ | 452,509 | $ | 411,748 | $ | 315,535 | $ | 252,327 | ||||||||||
| Cost of revenues |
352,417 | 333,643 | 291,332 | 218,304 | 177,087 | |||||||||||||||
| Gross profit |
78,482 | 118,866 | 120,416 | 97,231 | 75,240 | |||||||||||||||
| Total operating expenses |
102,615 | 102,745 | 144,475 | 114,405 | 84,539 | |||||||||||||||
| Income (loss) from operations |
(24,133 | ) | 16,121 | (24,059 | ) | (17,174 | ) | (9,299 | ) | |||||||||||
| Net loss |
$ | (26,624 | ) | $ | (20,777 | ) | $ | (48,957 | ) | $ | (39,815 | ) | $ | (10,237 | ) | |||||
| Net loss per share—basic and diluted |
$ | (0.26 | ) | $ | (0.20 | ) | $ | (0.47 | ) | $ | (0.40 | ) | $ | (0.11 | ) | |||||
| Consolidated Balance Sheet Data: |
||||||||||||||||||||
| Total assets |
$ | 478,212 | $ | 465,978 | $ | 403,465 | $ | 288,483 | $ | 324,607 | ||||||||||
| Long-term obligations |
$ | 2,627 | $ | 2,030 | $ | 7,548 | $ | 8,082 | $ | 10,057 | ||||||||||
| Shareholders’ equity |
$ | 375,944 | $ | 365,715 | $ | 322,553 | $ | 243,214 | $ | 260,127 | ||||||||||
| (1) | Results of operations include the effects of the acquisition of Actrans Systems Inc. in 2005. |
| (2) | Results for 2006 include an aggregate $44.0 million impairment of equity investments and a $12.2 million gain on the sale of a portion of an equity investment. |
| (3) | Results for 2007 include the impairment of our equity investments in GSMC of $19.4 million and EoNex Technologies, Inc. of $3.0 million. Loss from operations includes $19.0 million of impairment of goodwill and long-lived assets and $12.0 million of expenses related to our voluntary independent review of our historical stock option granting practices and financial restatement. |
| (4) | Results for 2008 include the impairment of our equity investments in GSMC of $11.6 million and Advanced Chip Engineering Technology, Inc. of $9.7 million. Loss from operations includes a $2.5 million restructuring charge. |
33
Table of Contents
| Item 7. | Management’s Discussion and Analysis of Financial Condition and Results of Operations |
Overview
We are a leading supplier of NOR flash memory semiconductor devices for the digital consumer, networking, wireless communications and Internet computing markets. NOR flash memory is a form of nonvolatile memory that allows electronic systems to retain information when the system is turned off. NOR flash memory is now used in billions of consumer electronics and computing products annually.
We produce and sell many products based on our SuperFlash design and manufacturing process technology. Our products are incorporated into products sold by many well-known companies including Apple, Asustek, BenQ, Cisco, Dell, First International Computer, Gigabyte, Haier, Huawei, Infineon, Intel, IBM, Inventec, Legend, Lenovo, LG Electronics, Freescale Semiconductor, NEC, Nintendo, Panasonic, Philips, Quanta, Samsung, Sanyo, Seagate, Sony, Sony Ericsson, Toshiba, Texas Instruments, VTech and ZTE.
We also produce and sell other semiconductor products including flash microcontrollers, radio frequency ICs and modules, NAND Controllers and NAND Controller-based modules.
One of our goals is diversification through the active development of our non-memory business. Our objective is to transform SST from a pure play in flash memory to a multi-product line semiconductor company and a leading licensor of embedded flash technology. We continue to execute on our plan to derive a significant portion of our revenue from non-memory products, which includes flash microcontrollers, NAND Controller-based modules, and radio frequency ICs and modules. We believe non-memory products represent an area in which we have significant competitive advantages and also an area that, in the long run, can yield profitable revenue with higher and more stable gross margins than our memory products.
Our business strategy is two fold: to continue to develop and grow our core NOR flash memory and embedded flash technology licensing business, while diversifying our business by expanding into new markets and pursuing growth opportunities through the development of new NAND Controller-based module and radio frequency IC products. In the NOR flash market, our goals are to be a leading worldwide supplier of low-density NOR flash memory devices and to maintain our position as the world’s number one embedded flash licensor by growing both upfront fees and per unit royalties. In our non-memory business markets, our objectives are to leverage our core competencies in NAND Controller design into systems solutions as adoption of solid state memory technology grows, and to leverage our radio frequency wireless technology and systems expertise as development continues on a multitude of electronic devices that are enabled for wireless communication.
The semiconductor industry has historically been cyclical, characterized by periodic changes in business conditions caused by product supply and demand imbalance. When the industry experiences downturns, they often occur in connection with, or in anticipation of, maturing product cycles and declines in general economic conditions. These downturns are characterized by weak product demand, excessive inventory and accelerated decline of selling prices.
Recent Developments
The Board of Directors appointed a Strategic Committee to review our investments and to investigate strategic alternatives, including acquisitions and divestitures, in order to drive value for our shareholders and position SST for future growth. The Strategic Committee has worked closely with management and an outside consultant to evaluate our operations and products, and identify potential new business opportunities.
On February 2, 2010, we entered into a definitive agreement, or Merger Agreement, to be acquired by Microchip Technology Incorporated, or Microchip, for $2.85 per share. On February 22, 2010, we entered into an amendment to the Merger Agreement, or Amendment No. 1, to be acquired by Microchip, for $3.00 per share. On March 8, 2010, we entered into an amendment to the Merger Agreement, or Amendment No. 2, to be acquired by Microchip, for $3.05 per share. In connection with Amendment No. 2, on March 8, 2010, we issued
34
Table of Contents
to Microchip 19,148,149 newly issued shares of our common stock, or 19.9 percent of our outstanding shares, for a price of $3.05 per share in cash. Amendment No. 1 and Amendment No. 2 are referred to together as the Amendments. Pursuant to the Merger Agreement and Amendments, SST will merge with Sun Acquisition Corporation, a California corporation and a wholly owned subsidiary of Microchip, a Delaware corporation, or the Merger. Each outstanding share of our common stock, other than shares as to which dissenters’ rights have been properly exercised, will be converted into the right to receive $3.05, without interest.
For a description of our proposed transaction with Microchip, please refer to our definitive proxy statement for our Special Meeting of Shareholders to be held on April 8, 2010, which is on file with the SEC and is available through the SEC’s website at www.sec.gov.
On November 13, 2009, we entered into a definitive agreement, or the TRH Merger Agreement, to be acquired by Prophet Equity LP and members of our management team for $2.10 per share. Pursuant to the definitive agreement SST would be merged with and into Technology Resources Merger Sub, Inc., a California corporation and a wholly owned subsidiary of Technology Resources Holdings, Inc., a Delaware corporation. On February 2, 2010, we terminated the TRH Merger Agreement in order to enter into the Merger Agreement, as described above. In connection with the termination of the TRH Merger Agreement, we paid Technology Resources Holdings, Inc. a termination fee of $4,025,875.
2009 in Review
In response to the challenging market conditions of the past couple years, we began taking a fresh look at every aspect of our business; focusing our resources on areas that we believe will yield the most impact over time, while creating additional opportunities without incurring significant additional research and development expense in the near term. These efforts include a targeted approach to product development that emphasizes non-commodity applications through differentiated features, as well as new programs to enhance our licensing business. We have made progress, and execution of these objectives, combined with an improved demand environment, resulted in solid financial performance in the second half of 2009, as well as yielding several key achievements in product development and technology licensing which we believe will help drive future growth.
After reaching a low point during the month of January, our product shipments rebounded in the first quarter of 2009. The end-market demand recovery that began in the second quarter continued through the third and fourth quarters, with total unit shipments for 2009 down only 4% from 2008. Unit shipments to the Internet computing segment increased 25% in 2009 from 2008, showing strength in notebook and desktop PC, hard disk drive and PC monitor applications. Unit shipments to the networking segment increased 50% year over year, driven primarily by shipment increases in DSL modem and wireless LAN applications. Unit shipments to the digital consumer and wireless communications segments were down 30% and 24%, respectively, in 2009, primarily as a result of the weakness in demand in the early part of the year.
We have begun to see stabilization in the pricing environment, as the rate of price decline for like products has slowed significantly from earlier in the year. Coupled with strong unit shipments, this stabilization contributed to a healthy growth in revenue across all application segments during the second half of 2009. Our blended average selling price decreased approximately 18% in 2009 from 2008, partly due to changes in our product mix, with strong revenue growth in serial flash and radio frequency power amplifier products, which have relatively lower average selling prices.
Non-Memory Products
Over the past 20 years, we have established ourselves as an industry leader with our superior SuperFlash technology, deep customer relationships and a talented team of employees dedicated to a common goal of excellence. Several years ago, with the recognition that our core memory business will continue to experience average selling price pressure that would limit our revenue growth potential, we began a diversification plan of investing in products and technologies that are expected to yield higher average selling prices and gross margins
35
Table of Contents
than our current memory products. We believe that a strategy of diversification will allow for better growth opportunities and higher return for our shareholders. It has taken more time than we anticipated to establish this new business, as we faced difficulties in penetrating new markets and in an environment where customers are scaling back new product development. In 2009, our non-memory business contributed 20% of product revenue and 46% of product gross profit, up from 14% of product revenue and 20% of gross profit in 2008.
We continue to experience good traction with our NAND Controllers and modules, including NANDrive, our embedded flash solid-state drive product family, and our customer base for the NANDrive product line includes more than 90 customers. Our engineering teams are designing new controllers with new interfaces to expand our addressable market into applications such as mobile Internet devices, automotive and industrial equipment, camcorders and IP set-top boxes. We believe our growing portfolio of design wins is indicative of an emerging business and that we are in front of a positive revenue cycle for this product family. However, significant and sustained development effort will be required to realize meaningful revenue growth from this business.
Our radio frequency power amplifier products targeting the embedded Wi-Fi market showed strong growth in 2009, with shipments in excess of 50 million units. Using advanced technologies, these devices feature a highly-efficient, low-power, small-footprint design that supports 802.11 wireless standard. We recently announced the availability of our newest radio frequency power amplifier, which supports an operating voltage up to 5V, resulting in ultra-high linear output power capability. This new device helps increase the transmission range and data rate of wireless access points and routers to better support broadband applications, such as streaming video and other multimedia-rich content. These products are winning designs with major chipset manufacturers for use in smart phone applications, and we expect the ramp up of these chipsets to drive volume shipments of our power amplifier products in 2010. In addition, design wins with our radio frequency power amplifier chipset partners expand opportunities for our NOR memory and NANDrive products.
Due to the complexity of these new product families, the design-in and qualification cycle is long, and we expect our near term results to be impacted by the current overall economic environment.
Memory Products and Technology Licensing
Despite the economic and competitive challenges of the past year, we continue to develop our core flash memory business and we believe we are well positioned in our memory product and complementary technology licensing businesses. As an increasing number of electronic products have been designed around microprocessors and microcontrollers, virtually all of these products incorporate some low-density NOR flash memory for code storage. In many cases, the code size for each product is also increasing as consumers demand more features and functionality. Further, as the definition of low-density continues to expand into 16, 32 and 64 Mbit densities, we believe this creates an opportunity for us and gives strong evidence that our core business will benefit from market growth in the future. We address this market with feature-rich, cost-effective products which allow us to support a very broad range of applications. For applications requiring smaller memory, we offer embedded SuperFlash technology through licensing agreements.
Our focus on product innovation and technology advancement is essential to sustaining growth in challenging market conditions. As we refine our roadmap, we are putting special emphasis on development of innovative products with differentiated features that expand our addressable market. In November, 2009, we announced a new family of high-speed quad-bit serial flash memory with our proprietary execute-in-place feature, which builds upon the success of our innovative and award-winning SQI flash products. In order to take advantage of significant cost savings, over the past several years, electronics device manufacturers have been transitioning from parallel flash to serial flash for use in certain applications. However, serial flash has historically not offered the performance level required for use in applications requiring very high speed memory access, such as mobile handsets, Bluetooth headsets and GPS devices. Our high speed SQI serial flash achieves a breakthrough combination of the high performance level typically associated with parallel flash memory and the low pin count and space savings of serial flash memory, as well as extremely low power consumption, which is
36
Table of Contents
critical for the design of next-generation devices. We continue work on next generation designs which offer significant performance, power efficiency and footprint advantages over previous generations, in addition to cost advantages. Although the ramp of our 120nm technology products at Grace and Maxchip has been slower than anticipated, we are also making progress on 90nm and 70nm technology nodes and recently taped out our first 70nm product vehicle on a 12” fab. We believe these innovative products will provide the features and cost structure to support our targeted application segments in upcoming years.
Our licensing revenue improved notably in the second half of 2009, reflecting the general improvement in the semiconductor industry. Our licensing business represents considerable opportunity for us and we are placing enhanced emphasis in several areas we believe will foster growth. In addition to growing our licensee base with new accounts in wafer foundries, integrated device manufacturers and design houses, we are also working with current licensees to expand to more advanced technology nodes.
Global Reorganization
In December 2008, we announced the implementation of a global reorganization designed to reflect changes in anticipated demand for our products. This action was taken to reduce costs of operations, realign our development priorities, and improve our focus on accelerating time-to-market of select new products. This refined strategy continues the essential elements of diversification by focusing on a reduced number of projects in the areas of non-commodity NOR products, NAND Controllers and modules and radio frequency IC products which are synergistic with our memory markets. We believe this focus on a smaller set of projects, along with the reduction in operating expenses, will ultimately make our company more profitable and enhance shareholder value.
As a result of our global reorganization, our operating expenses decreased substantially in 2009, as compared to 2008. Our restructuring efforts have been conducted in a manner that we believe will best enable us to support the current and future requirements of our customer base and invest appropriately in our technology roadmap in order to enhance both our shorter and longer term competitive position.
Outlook
Beginning in September 2008, we experienced a sharp decline in booking activity, as our customers delayed their purchase orders in response to the sudden slowdown in consumer demand, and booking activities remained weak into 2009. Although we saw a recovery in end-market demand throughout the year, our product revenues for 2009 remained at low levels, as compared with 2007 and 2008. Although product revenues have been historically lower in the first half of the year due to seasonal trends in demand, we expect product revenues may increase somewhat throughout 2010, due in part to a continuation of the recent relative price stability as well as increased demand. In addition, the continued growth of our non-memory business, as well as our efforts to expand our presence to targeted strategic accounts in North America and Europe, are expected to contribute to improved product gross margins in 2010. We expect our product revenues and gross profit in 2010 to recover from 2009. However, we do not expect our 2010 product revenues to return to the level of 2008 or prior periods, as a result of the prolonged worldwide economic downturn.
During the past few quarters we have signed several new licensing agreements, which we expect to contribute upfront fees beginning with the first quarter of 2010. In addition, we anticipate solid growth in our royalty revenue in 2010, as compared to 2009, if market conditions for our licensees’ products remain positive. Our licensing business remains a tremendous asset to our financial model and our continued investment in our core memory products and technology roadmap helps to ensure this business will grow as market demand continues to improve.
We expect our operating expenses to be at slightly higher levels in 2010, as compared to 2009, excluding any non-recurring charges, which represents a significant reduction from periods prior to our 2008 global reorganization. As a result of the anticipated improvement in product gross margins and significant contribution from our licensing business, we expect good operating income growth in 2010, as compared to 2009.
37
Table of Contents
Concentrations
We derived 88.8%, 87.3% and 91.7% of our net product revenues during 2007, 2008 and 2009, respectively, from product shipments to Asia. In addition, substantially all of our wafer suppliers and packaging and testing subcontractors are located in Asia.
Shipments to our top ten end customers, which exclude transactions through stocking representatives and distributors, accounted for 17.8%, 21.4% and 18.6% of our net product revenues in 2007, 2008 and 2009, respectively.
No single end customer, which we define as original equipment manufacturers, or OEMs, original design manufacturers, or ODMs, contract electronic manufacturers, or CEMs, or end users, represented 10.0% or more of our net product revenues during 2007, 2008 and 2009.
We ship products to, and have accounts receivable from, OEMs, ODMs, CEMs, stocking representatives, distributors and our logistics center. Our stocking representatives, distributors and logistics center reship our products to our end customers, including OEMs, ODMs, CEMs and end users. Shipments, by us or our logistics center, to our top three stocking representatives for reshipment accounted for 60.0%, 54.6% and 58.9% of our product shipments in 2007, 2008 and 2009, respectively. In addition, the same three stocking representatives solicited sales, for which they received a commission, for 9.1%, 7.0% and 1.2% of our product shipments to end users in 2007, 2008 and 2009, respectively.
We out-source our end customer service logistics in Asia to Silicon Professional Technology Ltd., or SPT, which supports our customers in Taiwan, China and other Southeast Asia countries. SPT provides forecasting, planning, warehousing, delivery, billing, collection and other logistic functions for us in these regions. SPT is a wholly-owned subsidiary of one of our stocking representatives in Taiwan, Professional Computer Technology Limited, or PCT. Please see a description of our relationship with PCT under “Related Party Transactions.” Products shipped to SPT are accounted for as our inventory held at our logistics center, and revenue is recognized when the products have been delivered and are considered as sold to our end customers by SPT. For the years ended December 31, 2007, 2008 and 2009, SPT serviced end customer sales accounting for 60.1%, 56.2% and 59.5% of our net product revenues recognized. As of December 31, 2008 and 2009, SPT represented 50.9% and 66.1% of our net accounts receivable, respectively.
Our product sales are made primarily using short-term cancelable purchase orders. The quantities actually purchased by the customer, as well as shipment schedules, are frequently revised to reflect changes in the customer’s needs and in our supply of product. Accordingly, our backlog of open purchase orders at any given time is not a meaningful indicator of future sales. Changes in the amount of our backlog do not necessarily reflect a corresponding change in the level of actual or potential sales.
Results of Operations
Net Revenues (in thousands, except percentages)
| Year Ended | Increase (Decrease) 2007 vs. 2008 |
Increase (Decrease) 2008 vs. 2009 |
|||||||||||||||||||||
| December 31, 2007 |
December 31, 2008 |
December 31, 2009 |
|||||||||||||||||||||
| Memory revenue |
$ | 333,451 | $ | 228,237 | $ | 170,160 | $ | (105,214 | ) | (31.6 | )% | $ | (58,077 | ) | (25.4 | )% | |||||||
| Non-memory revenue |
38,465 | 38,628 | 42,502 | 163 | 0.4 | % | 3,874 | 10.0 | % | ||||||||||||||
| Product revenues |
371,916 | 266,865 | 212,662 | (105,051 | ) | (28.2 | )% | (54,203 | ) | (20.3 | )% | ||||||||||||
| Technology licensing |
39,832 | 48,670 | 39,665 | 8,838 | 22.2 | % | (9,005 | ) | (18.5 | )% | |||||||||||||
| Total net revenues |
$ | 411,748 | $ | 315,535 | $ | 252,327 | $ | (96,213 | ) | (23.4 | )% | $ | (63,208 | ) | (20.0 | )% | |||||||
38
Table of Contents
The following discussions are based on our reportable segments described in Note 13 “Segment and Geographic Reporting” to our consolidated financial statements.
Memory Products
Memory product revenue for 2009 was down significantly from 2008, largely as a result of the unprecedented sudden decrease in worldwide demand for semiconductor products which began in September, 2008. This decline was more pronounced in the first half of the year, with a year over year decrease of 41.7% through the second quarter of 2009. After a modest recovery in the second half, memory product revenue for 2009 was still down 25.4% from 2008. Although total unit shipments in 2009 were comparable with 2008, down only 2%, average selling prices decreased 24%, with declines across nearly all memory product families, as a result of reduced end customer demand in the early part of 2009.
Memory product revenue decreased 31.6% in 2008 from 2007, primarily due to the overall reduction in demand for semiconductor products in the later part of 2008 caused by the global economic downturn. In 2008, as compared with 2007, both unit shipments and average selling prices decreased across all memory product families, and were down 23.6% and 10.4%, respectively.
We anticipate that memory product revenues will increase in 2010, as compared to 2009, due to improvement in the global economy and our efforts in expanding our presence to targeted strategic accounts in North America and Europe. However, due to the nature of our memory business, we anticipate memory product revenues may continue to fluctuate in the future.
Non-Memory Products
Non-memory product revenue increased 10.0% in 2009 from 2008, with increases in unit shipments and average selling prices, from product mix, of 13% and 22%, respectively. The favorable product mix primarily reflects the continued increase in demand for NANDrive.
Non-memory product revenue was essentially flat in 2008, as compared to 2007, with a decrease in unit shipments of 22% offset by an increase in average selling prices of 33%, due to product mix. The decrease in unit shipments was due in part to our decision to focus on sales of higher margin products and the favorable product mix primarily reflects the introduction of our NANDrive family of products.
We expect non-memory product revenue to fluctuate significantly throughout 2010 due to the start-up nature of our new product lines and diversification in our customer base.
Technology Licensing Revenue
Technology licensing revenue includes a combination of up-front fees and royalties. Technology licensing revenue decreased 18.5% in 2009 from 2008, as a result the generally adverse economic conditions in late 2008 and early 2009. Our royalty revenues are recorded when reported to us by our licensees, which is the quarter following our licensees’ sales. Thus our royalty revenues were down significantly from the prior year in the second quarter of 2009, reflecting lower demand for our licensee’s products in the first quarter of 2009.
Technology licensing revenue increased 22.2% in 2008 from 2007, with the increase coming from royalties, primarily due to an ongoing trend toward flash technology within microcontroller markets.
We anticipate revenues from technology licensing will increase substantially in 2010, as compared to 2009, and may fluctuate in the future, depending on general economic conditions.
39
Table of Contents
Gross Profit (in thousands, except percentages)
| Year Ended | Increase (Decrease) 2007 vs. 2008 |
Increase (Decrease) 2008 vs. 2009 |
||||||||||||||||||||||||
| December 31, 2007 |
December 31, 2008 |
December 31, 2009 |
||||||||||||||||||||||||
| Memory gross profit |
$ | 72,802 | $ | 39,026 | $ | 19,285 | $ | (33,776 | ) | (46.4 | )% | $ | (19,741 | ) | (50.6 | )% | ||||||||||
| Memory gross margin |
21.8 | % | 17.1 | % | 11.3 | % | ||||||||||||||||||||
| Non-memory gross profit |
7,782 | 9,535 | 16,290 | 1,753 | 22.5 | % | 6,755 | 70.8 | % | |||||||||||||||||
| Non-memory gross margin |
20.2 | % | 24.7 | % | 38.3 | % | ||||||||||||||||||||
| Product gross profit |
80,584 | 48,561 | 35,575 | (32,023 | ) | (39.7 | )% | (12,986 | ) | (26.7 | )% | |||||||||||||||
| Product gross margin |
21.7 | % | 18.2 | % | 16.7 | % | ||||||||||||||||||||
| Technology licensing gross profit |
39,832 | 48,670 | 39,665 | 8,838 | 22.2 | % | (9,005 | ) | (18.5 | )% | ||||||||||||||||
| Technology licensing gross margin |
100.0 | % | 100.0 | % | 100.0 | % | ||||||||||||||||||||
| Total gross profit |
$ | 120,416 | $ | 97,231 | $ | 75,240 | $ | (23,185 | ) | (19.3 | )% | $ | (21,991 | ) | (22.6 | )% | ||||||||||
| Total gross margin |
29.2 | % | 30.8 | % | 29.8 | % | ||||||||||||||||||||
Product Gross Profit
Memory products
Gross profit for memory products decreased 50.6% in 2009 from 2008, primarily due to the decrease in revenue resulting from lower average selling prices. Although demand for semiconductor products improved in the second half of 2009, with average selling prices remaining relatively stable from the first half, prices were down sharply as compared with 2008. Gross profit for 2009 was negatively impacted by inventory write-downs of $9.1 million. Gross profit benefited by $6.2 million and $5.3 million for 2008 and 2009, respectively, from the sale of inventory which had previously been written down.
Gross profit for memory products decreased 46.4% in 2008 from 2007, primarily due to the decrease in revenue resulting from the overall reduction in demand for semiconductor products. Average selling prices declined somewhat, as a result of the generally competitive industry environment. Gross profit for 2008 was also negatively impacted by inventory write-downs of $11.7 million, due to quantities in excess of forecasted demand and declining average selling prices. Comparatively, in 2007, high demand coupled with capacity constraints resulted in low inventory levels and favorable cost variances from the sale of products for which we had previously taken write-downs.
We expect memory product gross profit to improve in 2010, due to improvement in the global economy and higher gross margins on targeted strategic accounts in North America and Europe. Memory product gross profit may fluctuate in the future due to changes in sales volume, product mix, average selling prices and inventory write-downs.
Non-memory products
Gross profit for non-memory products increased 70.8% in 2009 from 2008, despite a 13% reduction in overall unit shipments and persistent weak economic environment in the early part of 2009. The increase in gross profit was due to stable prices across key product lines and higher overall average selling prices, due to product mix. The benefit to non-memory gross profit from the sale of inventory which had previously been written down was not significant for 2008 or 2009.
Gross profit for non-memory products increased 22.5% in 2008 from 2007, despite a reduction in overall unit shipments and the generally weak economic environment. The increase in gross profit was due to higher unit shipments and stable average selling prices for NANDrive and microcontroller products, which was partially offset by a decrease in unit shipments for other non-memory products and inventory write-downs of $1.5 million.
40
Table of Contents
We expect non-memory product margins to fluctuate in the future due to changes in sales volume, product mix, average selling prices and inventory write-downs.
For other factors that could affect our gross profit, please also see Item 1A. “Risk Factors—We incurred significant inventory valuation and adverse purchase commitment adjustments in 2007, 2008 and 2009 and we may incur additional significant inventory valuation adjustments in the future.”
Operating Expenses (in thousands)
In December 2008, we announced the implementation of a global reorganization designed to reflect changes in anticipated demand for our products. The reorganization included a reduction in overall headcount of approximately 120, or 17% of our global workforce, most of which was completed by the end of 2008. The workforce reduction and other restructuring actions took place worldwide and in all functional areas of the company. Largely as a result of this restructuring, we reduced our expenses related to compensation and benefits by over $15 million in 2009 from 2008. In addition, we have taken steps to reduce overall operating expenses, which is evident in our results for 2009, as compared with 2008.
Research and development
| Year Ended | Increase (Decrease) 2007 vs. 2008 |
Increase (Decrease) 2008 vs. 2009 |
|||||||||||||||||||||||
| December 31, 2007 |
December 31, 2008 |
December 31, 2009 |
|||||||||||||||||||||||
| Research and development |
$ | 56,712 | $ | 58,955 | $ | 43,160 | $ | 2,243 | 4.0 | % | $ | (15,795 | ) | (26.8 | )% | ||||||||||
| Percent of revenue |
13.8 | % | 18.7 | % | 17.1 | % | |||||||||||||||||||
Research and development expenses include costs associated with the development of new products, enhancements to existing products, quality assurance activities and occupancy costs. These costs consist primarily of employee salaries, share-based compensation and other benefit-related expenses, software and intellectual property licenses, the cost of materials such as wafers and masks and the cost of design and development tools.
Research and development expenses for 2009 decreased $15.8 million, or 26.8%, from 2008, due primarily to decreases of $9.5 million for expenses related to compensation and benefits, $2.4 million for product development related expenses including wafers, masks and evaluation parts, $2.1 million for software and intellectual property licenses and $1.3 million for outside services. The reduction in product development related expenses primarily reflects our response to the significant decrease in demand for our customers’ products, which occurred in connection with the worldwide economic downturn. The decrease in expenses for outside services in 2009 reflects our ongoing efforts to manage expenditures. Research and development expenses for 2008 included a $1.1 million charge to write off various intellectual property licenses, as we refined our focus toward our most strategic initiatives.
Research and development expenses for 2008 increased $2.2 million, or 4.0%, from 2007, due primarily to increases of $2.2 million for product development related expenses including wafers, masks and evaluation parts and $2.3 million for software and intellectual property licenses. These increases were partially offset by decreases of $0.8 million for salaries, bonuses and employee benefits, and $0.4 million for share-based compensation. Total expense related to compensation and benefits decreased in 2008, as compared to 2007, largely as a result of our emphasis on research and development activities in Asia. The decrease in expense for share-based compensation is due primarily to the accelerated expense recognition in 2007 of options granted in prior years, coupled with a reduction in the number of options granted to research and development personnel in 2008.
Although measures taken in the fourth quarter of 2008 in connection with our global reorganization resulted in a reduction to research and development expenses for 2009, as compared to 2008, no significant additional
41
Table of Contents
reductions are planned at this time. Further, we expect certain product-related expenses to fluctuate throughout 2010, based on the timing of engineering projects for new product introductions and the development of new technologies to support future growth.
Sales and marketing
| Year Ended | Increase (Decrease) 2007 vs. 2008 |
Increase (Decrease) 2008 vs. 2009 |
||||||||||||||||||||||||
| December 31, 2007 |
December 31, 2008 |
December 31, 2009 |
||||||||||||||||||||||||
| Sales and marketing |
$ | 29,229 | $ | 26,605 | $ | 20,344 | $ | (2,624 | ) | (9.0 | )% | $ | (6,261 | ) | (23.5 | )% | ||||||||||
| Percent of revenue |
7.1 | % | 8.4 | % | 8.1 | % | ||||||||||||||||||||
Sales and marketing expenses consist primarily of commissions, employee salaries, share-based compensation expense and other benefit-related expenses, as well as travel and entertainment expenses.
Sales and marketing expenses for 2009 decreased $6.3 million, or 23.5%, from 2008, due primarily to decreases of $3.4 million for expenses related to compensation and benefits, $1.3 million for commissions and logistics center fees and $1.0 million for travel and marketing programs. Sales and marketing expenses for 2008 decreased $2.6 million, or 9.0%, from 2007, due primarily to decreases of $1.7 million for commissions and logistics center fees and $0.7 million for expenses related to compensation and benefits. These decreases in commissions and logistics center fees, in 2008 and again in 2009, are consistent with the year over year declines in product revenues. The decrease in expenses for travel and marketing programs in 2009 reflects our ongoing efforts to manage expenditures.
We expect that sales and marketing expenses will remain flat or increase somewhat in 2010. Further, sales and marketing expenses may fluctuate throughout 2010 to support new product introductions and any anticipated future growth.
General and administrative
| Year Ended | Increase (Decrease) 2007 vs. 2008 |
Increase (Decrease) 2008 vs. 2009 |
||||||||||||||||||||||||
| December 31, 2007 |
December 31, 2008 |
December 31, 2009 |
||||||||||||||||||||||||
| General and administrative |
$ | 27,603 | $ | 26,331 | $ | 20,706 | $ | (1,272 | ) | (4.6 | )% | $ | (5,625 | ) | (21.4 | )% | ||||||||||
| Percent of revenue |
6.7 | % | 8.3 | % | 8.2 | % | ||||||||||||||||||||
General and administrative expenses consist primarily of employee salaries, share-based compensation, and other benefit-related expenses for administrative, executive and finance personnel, services and legal fees and allowances for doubtful accounts.
General and administrative expenses for 2009 decreased $5.6 million, or 21.4%, from 2008, due primarily to decreases of $2.8 million for expenses related to compensation and benefits, $1.5 million for outside services and $0.7 million for amortization. General and administrative expenses in 2009 decreased nearly across the board, as a result of our efforts to manage expenditures. However, these decreases were partially offset by a charge of $0.7 million for estimated expenses related to the potential settlement of litigation. See also Note 5 “Contingencies” to our consolidated financial statements.
General and administrative expenses for 2008 decreased $1.3 million, or 4.6%, from 2007, due primarily to decreases of $1.2 million for salaries, bonuses and employee benefits and $1.4 million for outside services. These decreases were partially offset by increases of $0.7 million for share-based compensation and $0.4 million for property and business taxes, which was largely due to property tax refunds received in 2007. The decrease in salaries, bonuses and employee benefits is largely due to the elimination of executive bonuses in 2008 and the
42
Table of Contents
decrease in outside services expense reflects the completion of various finance and accounting and information technology projects. The increase in share-based compensation in 2008, as compared to 2007, includes charges of $0.5 million for fully-vested restricted stock awards granted to employees and stock options granted to directors. There were no restricted stock awards granted in 2007, and no annual stock option grants to directors in 2007 because we did not hold an annual shareholder meeting.
Due to declines in revenue for 2008 and 2009, we have implemented measures to manage expenditures, and the impact of these measures is evident in our operating expenses for 2009. As the nature of certain general and administrative expenses are relatively fixed, these expenses have not decreased in proportion to revenue. Further, certain expenses may increase somewhat to support long-term strategic initiatives.
Other operating expenses
| Year Ended | Increase (Decrease) 2007 vs. 2008 |
Increase (Decrease) 2008 vs. 2009 |
||||||||||||||||||||||||
| December 31, 2007 |
December 31, 2008 |
December 31, 2009 |
||||||||||||||||||||||||
| Other operating expenses |
$ | 30,931 | $ | 2,514 | $ | 329 | $ | (28,417 | ) | (92 | )% | $ | (2,185 | ) | (87 | )% | ||||||||||
| Percent of revenue |
7.5 | % | 0.8 | % | 0.1 | % | ||||||||||||||||||||
In connection with our global reorganization announced in December 2008, we incurred restructuring charges of $2.5 million and $0.3 million in 2008 and 2009, respectively. These charges were related to estimated severance costs associated with the workforce reduction. We do not expect to incur additional expense related to this specific reorganization.
During 2007 we conducted a voluntary independent review of our historical stock option granting practices. We incurred $12.0 million of expenses in 2007 related to this review, which included legal, tax, accounting and other professional services. Our review of our historical option granting practices was substantially completed in 2007 and we did not incur any expenses related to this review in 2008 or 2009. Also in 2007, the market price of our common stock declined to the point where our net assets exceeded our total market capitalization and we concluded that the carrying amount of our goodwill exceeded its implied fair value. Accordingly, we recorded an $18.0 million impairment charge during the fourth quarter of 2007. In addition, we reviewed the carrying value of our long-lived assets and determined that the estimated future cash flows were insufficient to recover the carrying value of certain long-lived assets. As a result, we recorded impairment charges of $1.0 million to intangible assets, property and equipment in order to write down these assets to their estimated fair market value.
There were similar declines in the market price of our common stock in 2008 and 2009, and the carrying value of our net assets exceeded our total market capitalization at December 31, 2008 and 2009. We reviewed the carrying value of our long-lived assets and concluded that the estimated future cash flows were sufficient for recovery, or that the fair market value of the underlying assets exceeded the carrying value. Therefore, we did not record any impairment to long-lived assets in 2008 or 2009. Based on our annual review of goodwill performed during 2008 and 2009, we concluded that the carrying value of goodwill did not exceed its implied fair value and we did not record any impairment.
Interest, Dividend and Other income and expense, net
| Year Ended | Increase (Decrease) 2007 vs. 2008 |
Increase (Decrease) 2008 vs. 2009 |
||||||||||||||||||||||||
| December 31, 2007 |
December 31, 2008 |
December 31, 2009 |
||||||||||||||||||||||||
| Interest income |
$ | 7,329 | $ | 4,057 | $ | 1,966 | $ | (3,272 | ) | (44.6 | )% | $ | (2,091 | ) | (51.5 | )% | ||||||||||
| Percent of revenue |
1.8 | % | 1.3 | % | 0.8 | % | ||||||||||||||||||||
Interest income includes interest from cash and short-term cash equivalents, as well as long-term available-for-sale debt securities.
43
Table of Contents
Interest income for 2009 decreased $2.1 million, or 51.5%, from 2008, primarily as a result of declining interest rates. Interest income for 2008 decreased $3.3 million, or 44.6%, from 2007, primarily as a result of declining interest rates, as well as declining cash balances, due in part to our stock repurchase program. We expect that interest income will fluctuate due to changing economic conditions, as well as fluctuating short-term and long-term interest rates in the United States.
| Year Ended | Increase (Decrease) 2007 vs. 2008 |
Increase (Decrease) 2008 vs. 2009 |
||||||||||||||||||||||||
| December 31, 2007 |
December 31, 2008 |
December 31, 2009 |
||||||||||||||||||||||||
| Dividend income |
$ | 1,666 | $ | 1,578 | $ | 1,406 | $ | (88 | ) | (5.3 | )% | $ | (172 | ) | (10.9 | )% | ||||||||||
| Percent of revenue |
0.4 | % | 0.5 | % | 0.6 | % | ||||||||||||||||||||
Dividend income includes dividends from equity investments in publicly held companies.
Dividend income declined somewhat in 2009, as compared with 2008 and 2007, reflecting the generally adverse global economic conditions. Dividend income was relatively flat from 2007 to 2008, as our investee’s earnings varied slightly year to year. Dividend income may decline further in 2010, based on the sale in late 2009 of a portion of our investments in publicly held companies. We expect that dividend income may fluctuate significantly in the future due to the timing and nature of our investments, as well as changing economic conditions in Taiwan.
| Year Ended | Increase (Decrease) 2007 vs. 2008 |
Increase (Decrease) 2008 vs. 2009 |
|||||||||||||||||||||||
| December 31, 2007 |
December 31, 2008 |
December 31, 2009 |
|||||||||||||||||||||||
| Other income (expense), net |
$ | 115 | $ | (517 | ) | $ | 354 | $ | (632 | ) | (549.6 | )% | $ | 871 | (168.5 | )% | |||||||||
| Percent of revenue |
0.0 | % | (0.2 | )% | 0.1 | % | |||||||||||||||||||
Other income (expense), net includes foreign currency translation gains and losses and other miscellaneous transactions.
In 2009, other income (expense) consists primarily of miscellaneous income of $0.2 million as remuneration received for the participation of certain of our officers on the Boards of Directors of companies in which we hold equity investments. In 2008, other income (expense) consists primarily of translation loss of $0.8 million, partially offset by miscellaneous income of $0.3 million as remuneration for Board participation. Other income (expense) may fluctuate significantly year to year but we do not expect it to have material impact on our consolidated statements of operations.
Interest expense
| Year Ended | Increase (Decrease) 2007 vs. 2008 |
Increase (Decrease) 2008 vs. 2009 |
||||||||||||||||||||||||
| December 31, 2007 |
December 31, 2008 |
December 31, 2009 |
||||||||||||||||||||||||
| Interest expense |
$ | 495 | $ | 140 | $ | 19 | $ | (355 | ) | (71.7 | )% | $ | (121 | ) | (86.4 | )% | ||||||||||
| Percent of revenue |
0.1 | % | 0.0 | % | 0.0 | % | ||||||||||||||||||||
Interest expense declined in 2009, as compared to 2008 and 2007, as we paid our line of credit in full during the first quarter of 2008 and do not have any significant outstanding debt. The line of credit expired on August 31, 2008 with no outstanding balance.
Gain on sale of investments
In 2009, we exchanged our equity interest in ACET for an equity interest in Aptos Design Lab, Inc., or ADL, a privately held Taiwanese company, recognizing a gain of $0.8 million. See Note 16 “Pro Rata Share of Loss from Equity Investments” to our consolidated financial statements for further discussion of the exchange of
44
Table of Contents
ACET stock. Also in 2009, we recorded a $1.0 million gain from the sale of a portion of our investments in publicly held companies in Taiwan. In 2007, we realized a pre-tax gain of $0.1 million on the conversion of bonds to common stock in PCT. We did not recognize any gain on sale of equity investments in 2008.
Impairment of investments
In 2001 and 2004, we invested an aggregate of $83.2 million in GSMC, which was carried at cost with an average price per share of $1.0375 for the preferred equity and $0.01 for the common equity. We recorded impairment charges in 2006, 2007, 2008 and 2009, of $40.6 million, $19.4 million, $11.6 million and $0.5 million, respectively. For each impairment recorded, the primary triggering event was an expected round of financing at a lower price per share than the carrying value of our preferred equity. To determine if there is an indication of impairment during each reporting period, we consider the price per share of the most recent round of financing of new equity investments, the expected timing of the next round of financing, the history of operating losses and negative cash flow, earnings and cash flow outlook, expected cash burn rate and the technological feasibility of GSMC’s products.
We used the following three generally accepted valuation methods discussed below in determining the fair value of our investment in GSMC 2008 and 2009:
| • | The Income Approach which indicates the fair value of a business based on the discounted value of the cash flows the business is expected to generate. In evaluating this approach we discounted the expected cash flows by using a weighted average cost of capital of 14%. |
| • | The Market Comparable Method which indicates the fair value of a business by comparing it to other publicly traded companies in similar lines of business. |
| • | The Market Transaction Method which estimates the fair value of a business based on the market price of actual merger and acquisition transactions. |
To arrive at the fair value of our investment in GSMC as of June 30, 2009, we weighted the indication from the Income Approach at 50% and the indication from the Market Comparable Method at 50%. In doing so we considered the following:
| • | Since some comparable companies are not projecting the magnitude of growth that is expected for GSMC due to its planned capacity expansion, we believe that the indicated value by the Income Approach reasonably reflects the long-term growth potential of GSMC. |
| • | We believe the Market Comparable Method also results in an equally reasonable value since GSMC’s most recent results and projections are similar to those of a select group of publicly traded companies in their industry. |
| • | The Market Transaction Method tends to produce less reliable indications for a private early-stage company with significant growth over the projection period because their value indications are based upon current operating results and therefore are better suited to value companies that are already in a steady state of profitability and growth. |
Similar factors were considered in evaluating the fair value of our investment in GSMC in connection with impairments recorded in prior years. When evaluating the fair value of GSMC in 2008, the Income Approach was weighted more heavily, at 80%, based on our assessment of the facts and circumstances of GSMC’s business and operating environment at the time. In particular, the growth projections for GSMC in earlier years were significantly greater than most otherwise comparable companies.
We then used the Option Pricing Approach to allocate the aggregate fair value of our investment in GSMC across the individual classes of GSMC equity we hold, based on the concept that equity securities can be viewed as call options on the underlying assets of the company. We determined the strike prices of the options based on
45
Table of Contents
the characteristics of the capital structure of the company, such as the number of shares of each class of equity, seniority levels, liquidation preferences and conversion values for preferred equity, and the strike prices of warrants and options. The time to the expiration of these options is equal to the expected time to a liquidity event (initial public offering, sale, merger, etc.).
During 2008, the management of ACET determined that additional funding would be required to continue operations. Discussions were held with various parties, and a preliminary offer was made to purchase substantially all outstanding shares of ACET, which was accepted by ACET’s Board of Directors. As this offer was made at a lower per share price than our carrying value at the time, and based on all other available information, we determined that the value of our investment in ACET had suffered an other-than-temporary decline in value. We recorded an impairment of $9.7 million to write down the carrying value of the investment to its estimated fair value of $2.6 million as of December 31, 2008, based on the per share price of the approved offer. In September, 2009, the shareholders of ACET completed a reorganization of its capital structure through the partial sale of ACET to ADL. In the reorganization, our entire investment in ACET was exchanged for preferred shares in ADL, representing a 17.2% equity ownership position with a carrying value of $2.3 million.
At December 31, 2008, the quoted market price on the Taiwan Stock Exchange for the common stock of KYE was lower than our per share carrying value. The quoted market price for KYE decreased more than 40% during 2008 and we did not find any indication that the value of the stock would recover in the near term. We concluded that the decline was other than temporary and recorded an impairment charge of $0.2 million. We did not record impairment charges on our investment in KYE in 2007 or 2009.
In 2006, we invested $3.0 million in EoNex Technologies, Inc., or EoNex, a privately held Korean company. During 2007 we noted that EoNex had suffered significant declines in net revenue, lacked operating funds and had no immediate source for additional financing. We concluded that our investment in EoNex was impaired and recorded an impairment charge equal to the $3.0 million carrying value.
In 2008, we fully reserved a note receivable from an unrelated third party in the amount of $0.2 million due to our expected inability to collect it.
Pro Rata Share of Loss from Equity Investments
| Year Ended | Increase (Decrease) 2007 vs. 2008 |
Increase (Decrease) 2008 vs. 2009 |
||||||||||||||||||||
| December 31, 2007 |
December 31, 2008 |
December 31, 2009 |
||||||||||||||||||||
| Pro rata share of loss from equity investments |
$ | 7,035 | $ | 9,145 | $ | 1,280 | $ | 2,110 | 30.0 | % | $ | (7,865 | ) | (86.0 | )% | |||||||
Our pro rata share of loss from equity investments primarily represents our share of loss in ACET. Our pro rata share of ACET’s loss for 2007, 2008 and 2009 was $7.0 million, $9.1 million and $0.8 million, respectively. Our share of ACET’s loss for 2009 decreased significantly, as compared to 2008, primarily due to an impairment of $9.7 million recorded in 2008, as well as a reduction in ACET’s operating expenses. The impairment resulted in a subsequent reduction to our pro rata share of the carrying value of long lived assets and associated depreciation expense.
In the third quarter of 2009, as part of a reorganization of the capital structure of ACET, we exchanged our equity interest in ACET for an equity interest in ADL. Our investment in ADL is accounted for using the cost method. Accordingly, we do not expect to record any additional pro rata share of loss related to our investment in ACET or ADL. See also Note 16 “Pro Rata Share of Loss from Equity Investments” to our consolidated financial statements.
46
Table of Contents
Provision for (Benefit from) Income Taxes
We recorded a tax provision of $4.2 million, a tax benefit of $3.4 million, and a tax provision of $4.7 million in 2007, 2008 and 2009, respectively. Our recorded tax provision in both 2007 and 2009 consists primarily of foreign withholding taxes, liabilities for uncertain tax positions related to foreign withholding tax and currency re-measurement on those liabilities. The net benefit in 2008 consists primarily of a refund from an Internal Revenue Service settlement from an amended return, partially offset by foreign income and withholding taxes, including liabilities for uncertain tax positions.
We maintained a full valuation allowance on our net deferred tax assets as of December 31, 2009. Determination of the valuation allowance requires an assessment of both positive and negative evidence when determining whether it is more likely than not that deferred tax assets are recoverable and such assessment is required on a jurisdiction by jurisdiction basis. Based upon the weight of available evidence, which includes our historical operating performance, reported cumulative net losses since inception and difficulty in accurately forecasting our results, we provided a full valuation allowance against our net deferred tax assets. We intend to maintain a full valuation allowance on the U.S. deferred tax assets until sufficient positive evidence exists to support reversal of the valuation allowance.
In July 2006, the Financial Accounting Standards Board, or FASB, issued guidance which clarifies the accounting for income taxes by prescribing a minimum probability threshold that a tax position must meet before a financial statement benefit is recognized. The minimum threshold is defined as a tax position that is more likely than not to be sustained upon examination by the applicable taxing authority, including resolution of any related appeals or litigation processes, based on the technical merits of the position. The tax benefit to be recognized is measured as the largest amount of benefit that is greater than fifty percent likely to be realized upon ultimate settlement. We adopted this guidance in 2007, which resulted in a $3.2 million increase to our reserve for uncertain tax positions with a corresponding adjustment to the opening balance of accumulated deficit. The amount of interest and penalties accrued upon the adoption of this guidance was not material.
Segments
Our Memory Product segment, which is comprised of NOR flash memory products, includes the Multi-Purpose Flash or MPF family, the Multi-Purpose Flash Plus or MPF+ family, the Advanced Multi-Purpose Flash Plus or Advanced MPF+ family, the Concurrent SuperFlash or CSF family, the Firmware Hub or FWH family, the SPI serial flash family, the Serial Quad I/O or SQI flash family, the ComboMemory family, the Many-Time Programmable or MTP family, and the Small Sector Flash or SSF family.
Our Non-Memory Product segment is comprised of all other semiconductor products including flash microcontrollers, smart card ICs and modules, radio frequency ICs and modules, NAND Controllers and NAND Controller-based modules.
Our Technology Licensing segment includes both up-front fees and royalties generated from the licensing of our SuperFlash technology to semiconductor manufacturers for use in embedded flash applications.
We do not allocate operating expenses, interest and other income/expense, interest expense, impairment of investments or provision for or benefit from income taxes to any of these segments for internal reporting purposes, as we do not believe that allocating these expenses is beneficial in evaluating segment performance. Additionally, we do not allocate assets to segments for internal reporting purposes as we do not manage our segments by such metrics.
47
Table of Contents
The following table shows our revenues and gross profit for each segment (in thousands):
| Year Ended December 31, | ||||||||||||||||||
| 2007 | 2008 | 2009 | ||||||||||||||||
| Revenues | Gross Profit | Revenues | Gross Profit | Revenues | Gross Profit | |||||||||||||
| Memory |
$ | 333,451 | $ | 72,802 | $ | 228,237 | $ | 39,026 | $ | 170,160 | $ | 19,285 | ||||||
| Non-Memory |
38,465 | 7,782 | 38,628 | 9,535 | 42,502 | 16,290 | ||||||||||||
| Technology Licensing |
39,832 | 39,832 | 48,670 | 48,670 | 39,665 | 39,665 | ||||||||||||
| $ | 411,748 | $ | 120,416 | $ | 315,535 | $ | 97,231 | $ | 252,327 | $ | 75,240 | |||||||
Related Party Reporting
Related Party Transactions and Balances
The following table is a summary of our related party revenues and purchases (in thousands):
| Revenues | |||||||||
| Year Ended December 31, | |||||||||
| 2007 | 2008 | 2009 | |||||||
| Apacer Technology, Inc. & related entities |
$ | 2,879 | $ | 3,485 | $ | 3,865 | |||
| Grace Semiconductor Manufacturing Corp. |
176 | 391 | 503 | ||||||
| Silicon Professional Technology Ltd. |
223,490 | 149,647 | 126,191 | ||||||
| Silicon Technology Co., Ltd. |
280 | — | — | ||||||
| $ | 226,825 | $ | 153,523 | $ | 130,559 | ||||
| Purchases | |||||||||
| Year Ended December 31, | |||||||||
| 2007 | 2008 | 2009 | |||||||
| Aptos Design Lab, Inc. & related entities |
$ | 108 | $ | 1,104 | $ | 2,427 | |||
| Grace Semiconductor Manufacturing Corp. |
72,110 | 70,216 | 38,700 | ||||||
| Powertech Technology, Incorporated |
20,145 | 18,232 | 9,307 | ||||||
| $ | 92,363 | $ | 89,552 | $ | 50,434 | ||||
The following table is a summary of our related party accounts receivable and accounts payable and accruals (in thousands):
| Accounts Receivable | ||||||
| Year Ended December 31, | ||||||
| 2008 | 2009 | |||||
| Apacer Technology, Inc. & related entities |
$ | 330 | $ | 491 | ||
| Grace Semiconductor Manufacturing Corp. |
185 | 765 | ||||
| Silicon Professional Technology Ltd. |
10,246 | 24,884 | ||||
| $ | 10,761 | $ | 26,140 | |||
48
Table of Contents
| Accounts Payable and Accruals | ||||||
| Year Ended December 31, | ||||||
| 2008 | 2009 | |||||
| Aptos Design Lab, Inc. & related entities |
$ | 83 | $ | — | ||
| Grace Semiconductor Manufacturing Corp. |
1,700 | 6,667 | ||||
| Powertech Technology, Incorporated |
1,466 | 1,125 | ||||
| Professional Computer Technology Ltd. |
20 | — | ||||
| Silicon Professional Technology Ltd. |
175 | 394 | ||||
| $ | 3,444 | $ | 8,186 | |||
Deferred revenue at December 31, 2009 includes $9.7 million from Grace Semiconductor Manufacturing Corporation, or GSMC, for up-front licensing fees.
Professional Computer Technology Limited, or PCT, and its subsidiary, Silicon Professional Alliance Corporation, or SPAC, earn commissions for point-of-sales transactions to customers. Commissions to PCT and SPAC are paid at the same rate as all of our other stocking representatives in Asia. In 2007, 2008 and 2009 we incurred sales commissions of $1.5 million, $0.2 million, and $0.1 million, respectively, to PCT and SPAC. Shipments, by us or by our logistics center, to PCT and SPAC for reshipment accounted for 46.2%, 43.0% and 45.2% of our product shipments in 2007, 2008 and 2009. In addition, PCT and SPAC solicited sales for 1.6%, 1.8% and 1.2% of our shipments to end users in 2007, 2008 and 2009, respectively, for which they also earned a commission.
PCT, a Taiwanese company, has established a separate company and wholly-owned subsidiary, Silicon Professional Technology Ltd., or SPT, to provide forecasting, planning, warehousing, delivery, billing, collection and other logistic functions for us in Taiwan. SPT now services substantially all of our end customers based in Taiwan, China and other Southeast Asia countries. Products shipped to SPT are accounted for as our inventory held at our logistics center, and revenue is recognized when the products have been delivered and are considered as a sale to our end customers by SPT. We pay SPT a fee based on a percentage of revenue for each product shipped through SPT to our end customers. For 2007, 2008 and 2009, we incurred $3.4 million, $2.3 million and $2.0 million, respectively, of fees related to SPT. The fee paid to SPT covers the cost of warehousing and insuring inventory and accounts receivable, the personnel costs required to maintain logistics and information technology functions and the costs to perform demand forecasting, billing and collection of accounts receivable. SPT receives extended payment terms and is obligated to pay us whether or not they have collected the accounts receivable.
Description of Related Parties
In 1996, we invested $0.9 million in Silicon Technology Co., Ltd., or Silicon Technology, a privately held Japanese company. We acquired the interest in Silicon Technology in order to provide a presence for our products in Japan, and have since established an office in Japan. We are not obligated to provide Silicon Technology with any additional financing. Our investment is carried at cost and represents 8.7% of the outstanding equity of Silicon Technology at December 31, 2009.
In 2000, 2001 and 2002, we invested an aggregate of $12.2 million in Apacer Technology, Inc., or Apacer. Apacer, a privately held Taiwanese company, is a memory module manufacturer and customer. SST is a Board member of Apacer, represented by Bing Yeh, our CEO and Chairman of our Board of Directors. In 2002, the investment was written down to $4.4. We are not obligated to provide Apacer with any additional financing. Our investment is carried at cost and represents 9.3% of the outstanding equity of Apacer at December 31, 2009.
In 2000 and 2002, we invested an aggregate $1.7 million in PCT. SST is a Board member of PCT, represented by Bing Yeh, our CEO and Chairman of our Board of Directors. During 2003, PCT completed an initial public offering on the Taiwan Stock Exchange and we sold a portion of our holdings. As of December 31,
49
Table of Contents
2009, our entire investment is included in Long-term available-for-sale equity investments, carried at the quoted market price of $7.2 million, and represents 10.1% of PCT’s outstanding equity. We do not have any long-term contracts with SPT, PCT or SPAC, and we are not obligated to provide SPT, PCT or SPAC with any additional financing. SPT, PCT or SPAC may cease providing services to us at any time. If SPT, PCT or SPAC were to terminate their relationship with us we would experience a delay in reestablishing warehousing, logistics and distribution functions which would harm our business.
In 2000 and 2004, we invested an aggregate $3.2 million in Powertech Technology, Incorporated, or PTI, a Taiwanese company and production subcontractor in order to strengthen our relationship with PTI. SST is a Board member of PTI, represented by Bing Yeh, our CEO and Chairman of our Board of Directors. During 2003, PTI completed an initial public offering on the Taiwan Stock Exchange and we sold a portion of our holdings. In 2006 we sold 4.0 million common shares of PTI for a net gain of $12.2 million. In 2009 we sold 330,000 shares for a net gain of $0.9 million. We do not have a long-term contract with PTI to supply us with services and we are not obligated to provide PTI with any additional financing. Our investment in PTI is included in Long-term available-for-sale investments, carried at the quoted market price of $27.2 million, and represents 1.2% of the outstanding equity of PTI at December 31, 2009.
In 2001 and 2004, we invested an aggregate of $83.2 million cash in GSMC, a privately held Cayman Islands company. GSMC has a wholly owned subsidiary, Grace, which is a wafer foundry company with operations in Shanghai, China. Grace began to manufacture our products in late 2003. Bing Yeh, our CEO and Chairman of our Board of Directors, is also a member of GSMC’s Board of Directors. In 2006, 2007, 2008 and 2009 we recorded impairment charges of $40.6 million, $19.4 million, $11.6 million and $0.5 million, respectively, to write down the carrying value of our investment in GSMC to its estimated fair value, as these impairments were considered to be other than temporary in nature. In 2009, we granted a technology license to GSMC in exchange for preferred shares in GSMC, valued at $9.7 million. The fair value of the shares issued was determined based on an assessment made in connection with the impairment of our investment in GSMC in 2009. See Note 17 “Impairment of Investments” to our consolidated financial statements for additional information on the methodology used to determine the fair value of our equity investment in GSMC. We do not have any long-term obligations to purchase products from GSMC and we are not obligated to provide GSMC with any additional financing. Our investment is carried at cost and represents an 11.1% voting interest in GSMC at December 31, 2009.
In 2002 we invested $1.0 million in the common stock of Insyde Software Corporation, or Insyde, a Taiwanese company. SST is a Board member of Insyde, represented by Bing Yeh, our CEO and Chairman of our Board of Directors. Under Taiwan security regulations, investors with representation on the Board of Directors of certain companies must retain a certain number of shares in central custody, which are restricted from sale. As of December 31, 2009, our investment in convertible bonds and a portion of our equity investment are included in Long-term available-for-sale equity investments and carried at $8.0 million, based on the quoted market price of Insyde’s common stock. The remaining portion of the investment, which is restricted from sale, is carried at a cost of $0.3 million and included in Equity investments, others. We are not obligated to provide Insyde with any additional financing. Our equity investment represents 6.0% of Insyde’s outstanding equity at December 31, 2009.
In 2009, our entire investment in Advanced Chip Engineering Technology, Inc., or ACET, was exchanged for preferred shares in ADL, representing a 17.2% equity ownership position with a carrying value of $2.3 million. ADL is a privately held Taiwanese company and the parent company of ACET, a production subcontractor. SST is a Board member of ADL, represented by Yaw-Wen Hu, our Executive Vice president, Chief Operating Officer and a member of our Board of Directors. We are not obligated to provide ADL with any additional financing and our investment is carried at cost. See Note 16 “Pro Rata Share of Loss from Equity Investments” to our consolidated financial statements for further discussion of the reorganization of ACET’s capital structure.
50
Table of Contents
Critical Accounting Policies and Estimates
Management’s discussion and analysis of financial condition and results of operations are based upon our consolidated financial statements, which have been prepared in accordance with U.S generally accepted accounting principles. The preparation of these financial statements requires us to make estimates and judgments that affect the reported amounts of assets, liabilities, revenue, cost of revenue, expenses and related disclosure of contingencies. We base our estimates on historical experience and on various other assumptions that are believed to be reasonable under the circumstances, the results of which form the basis for making judgments about the carrying values of assets and liabilities.
We believe the following critical accounting policies affect our significant judgments and estimates used in the preparation of our consolidated financial statements. Our management has discussed the development and selection of these critical accounting policies with the Audit Committee of our Board. The Audit Committee has reviewed our disclosures relating to our critical accounting policies and estimates in this Annual Report on Form 10-K.
Our critical accounting estimates are as follows:
| • | Revenue recognition; |
| • | Allowance for sales returns; |
| • | Allowance for doubtful accounts; |
| • | Allowance for excess and obsolete inventory and lower of cost or market; |
| • | Provision for adverse purchase commitments; |
| • | Warranty accrual; |
| • | Litigation losses; |
| • | Valuation of equity investments; |
| • | Goodwill; |
| • | Long-lived assets; |
| • | Share-based compensation; |
| • | Accounting for income taxes; and |
| • | Fair value measurements. |
Revenue recognition. Sales to direct customers and foreign stocking representatives are recognized net of an allowance for estimated returns. When product is shipped to direct customers or stocking representatives or by our distributors or SPT to end users, prior to recognizing revenue, we also require that evidence of the arrangement exists, the price is fixed or determinable and collection is reasonably assured. Legal title generally passes to our customers at the time our products are shipped. Payment terms typically range from 30 to 65 days. Sales to distributors are made primarily under arrangements allowing price protection and the right of stock rotation on unsold merchandise. Because of the uncertainty associated with pricing concessions and future returns, we defer recognition of such revenues, related costs of revenues and related gross profit until the merchandise is sold by the distributor. Products shipped to SPT are accounted for as our inventory held at our logistics center, and revenue is recognized when the products have been delivered and are considered as a sale to our end customers by SPT.
Most of our technology licenses provide for the payment of up-front fees and continuing royalties based on product sales. For license and other arrangements for technology that we are continuing to enhance and refine, and under which we are obligated to provide unspecified enhancements, revenue is recognized over the lesser of
51
Table of Contents
the estimated period that we have historically enhanced and developed refinements to the technology, approximately two to three years (the upgrade period), or the remaining portion of the upgrade period from the date of delivery, provided all specified technology and documentation has been delivered, the fee is fixed or determinable and collection of the fee is reasonably assured. From time to time, we reexamine the estimated upgrade period relating to licensed technology to determine if a change in the estimated upgrade period is needed. Revenue from license or other technology arrangements where we are not continuing to enhance and refine technology or are not obligated to provide unspecified enhancements is recognized upon delivery, if the fee is fixed or determinable and collection of the fee is reasonably assured.
Royalties received under these arrangements during the upgrade period are recognized as revenue based on the ratio of the elapsed portion of the upgrade period to the estimated upgrade period. The remaining portions of the royalties are recognized ratably over the remaining portion of the upgrade period. Royalties received after the upgrade period has elapsed are recognized when reported to us, which generally occurs one quarter in arrears and concurrently with the receipt of payment.
If we make different judgments or utilize different estimates in relation to the estimated period of technology enhancement and development, the amount and timing of our revenues from up-front license fees and royalties could be materially affected.
Allowance for sales returns. We maintain an allowance for estimated product returns by our customers. We estimate our allowance for sales returns based on our historical return experience, current economic trends, changes in customer demand, known returns we have not received and other estimates. The allowance for sales returns was $1.0 million, $0.5 million and $0.3 million as of December 31, 2007, 2008 and 2009, respectively. If we make different judgments or utilize different estimates, the amount and timing of our revenue could be materially different.
Allowance for doubtful accounts. We maintain an allowance for doubtful accounts for estimated losses due to the inability of our customers to make their required payments. We evaluate our allowance for doubtful accounts based on the aging of our accounts receivable, the financial condition of our customers and their payment history, our historical write-off experience and other estimates. If we were to make different judgments of the financial condition of our customers or the financial condition of our customers were to deteriorate, additional allowances may be required, which could materially impact our results of operations. The allowance for doubtful accounts was $20,000, $79,000 and $12,000 as of December 31, 2007, 2008 and 2009, respectively. As of December 31, 2009, SPT accounted for 66.1% of our net accounts receivable balance. If SPT were to experience financial difficulty, our collection of accounts receivable could be adversely affected and our business could be harmed.
Allowance for excess and obsolete inventory and lower of cost or market. Our inventories are stated at the lower of cost (determined on a first-in, first-out basis) or market value. We typically plan our production and inventory levels based on internal forecasts of customer demand, which are highly unpredictable and fluctuate substantially. The value of our inventory is dependent on our estimate of average future selling prices, and, if average selling prices are lower than our estimate, we may be required to reduce our inventory value to reflect the lower of cost or market. Our inventories include high technology parts and components that are specialized in nature or subject to rapid technological obsolescence. We maintain allowance for inventory for potentially excess and obsolete inventories and those inventories carried at costs that are higher than their market values. We review on-hand inventory including inventory held at the logistic center for potential excess, obsolete and lower of cost or market exposure and adjust the level of inventory reserve accordingly. For excess inventory analysis, we compare the inventory on hand with the forecasted demand. Demand is based on one year for packaged products and two years for products in die form. For the obsolete inventory analysis, we review inventory items in detail and consider date code, customer base requirements, planned or recent product revisions, end of life plans and diminished market demand. Inventories, once written down to their new basis, are not subsequently written back up. If we determine that market conditions are less favorable than those currently projected by management, such
52
Table of Contents
as an unanticipated decline in average selling prices or demand not meeting our expectations, additional inventory write-downs may be required. The allowance for excess and obsolete inventories and lower of cost or market reserves was $19.7 million, $14.6 million and $9.4 million as of December 31, 2007, 2008 and 2009, respectively.
Provision for adverse purchase commitments. We maintain a provision for adverse purchase commitments for in-process orders at our vendors when we have recorded lower of cost or market valuation provision against our on-hand inventory. Once production has begun against our purchase orders, we are committed to purchasing the inventory or, if we cancel the order, we are liable for all costs incurred up to the time of cancellation. If we have written down our on-hand inventory of the ordered product for lower of cost or market valuations, we must consider the impact to in-process inventory at our vendor. We evaluate our in purchase orders to determine the impact of canceling the order and the impact of purchasing the inventory at a cost higher than the estimated current market value. If we determine that market conditions become less favorable than those currently projected by management, such as an unanticipated decline in average selling prices or demand not meeting our expectations, additional inventory write-downs may be required when the inventory is purchased. The recorded provision for adverse purchase commitments was $0.1 million, $1.1 million and $2.6 million as of December 31, 2007, 2008 and 2009, respectively.
Warranty accrual. Our products are generally subject to warranty and we provide for the estimated future costs of repair, replacement or customer accommodation upon shipment of the product in the accompanying statements of operations. Our warranty accrual is estimated based on historical claims compared to historical revenues and assumes that we will replace products subject to a claim. For new products, we use our historical percentage for the appropriate class of product. Should actual product failure rates differ from our estimates, revisions to the estimated warranty liability would be required. The recorded value of our warranty accrual was $358,000, $176,000 and $43,000 as of December 31, 2007, 2008 and 2009, respectively.
Litigation losses. From time to time, we are involved in legal actions arising in the ordinary course of business. We have incurred certain costs associated with defending these matters. There can be no assurance that shareholder class action complaints, shareholder derivative complaints or other third party assertions will be resolved without costly litigation, in a manner that is not adverse to our financial position, results of operations or cash flows or without requiring royalty payments in the future, all of which may adversely impact net income. We have accrued what we believe to be probable costs in connection with the potential settlement of the shareholder class action complaints and the shareholder derivative complaints. As a result, approximately $0.7 million is included in Accrued expenses and other liabilities in our financial statements as of December 31, 2009.
Valuation of equity investments. We hold minority interests in companies having operations in the semiconductor industry. We record an impairment charge when we believe an investment has experienced a decline in value that is other than temporary. Future adverse changes in market conditions or poor operating results for these companies could result in an inability to recover the carrying value of the investments, and a corresponding impairment charge in the future, which could be material to our results of operations.
We review our investments quarterly for indicators of impairment. For non-marketable equity securities, the impairment analysis requires significant judgment to identify events or circumstances that would likely have a significant adverse effect on the fair value of the investment. The indicators that we use to identify those events or circumstances include (a) the investee’s revenue and earnings trends; (b) the technological feasibility of the investee’s products and technologies; (c) the general market conditions in the investee’s industry or geographic area, including adverse regulatory or economic changes; (d) factors related to the investee’s ability to remain in business, such as the investee’s liquidity, debt ratios, and the rate at which the investee is using its cash; (e) the investee’s receipt of additional funding at a lower valuation; and (f) whether it is more likely-than-not that we will be required to sell the security prior to any anticipated recovery in fair value. Investments identified as having an indicator of impairment are subject to further analysis to determine if the investment is other than temporarily impaired, in which case the investment is written down to its impaired value and a new cost basis is
53
Table of Contents
established. When an investee is not considered viable from a financial or technological point of view, we write off the investment, since we consider the estimated fair value to be nominal. If an investee obtains additional funding at a valuation lower than our carrying amount or requires a new round of equity funding to stay in operation and the new funding does not appear imminent, we presume that the investment is other than temporarily impaired, unless specific facts and circumstances indicate otherwise.
Quoted market prices are not available for Level 3 assets. Therefore, when a fair value determination is required for Level 3 assets, we use other valuation techniques, including the Income Approach and the Market Comparable Method. The results under both approaches are evaluated and weighted across the individual classes of equity using the Option Pricing Approach, under which equity securities were viewed as call options on the underlying assets of the company. Significant inputs used under the Income Approach include forecasted future free cash flows based on the investee’s management representation, estimated expenses based on historical financial data and a present value discount rate. Significant inputs under the Market Comparable Method include historical and projected financial data of publicly traded companies in similar lines of business and historical transaction analysis of corporate acquisitions in the related industries, based on weighted average cost of capital. Significant inputs used under the Option Pricing Approach include the strike prices of the options, the number of shares of each class of equity, seniority levels, liquidation preferences and conversion values for preferred equity, the time to the expiration of these options and the expected time to a liquidity event.
Goodwill. We are required to test goodwill annually for impairment and between annual tests in certain circumstances. We write down goodwill when it is impaired. Our impairment review process compares the fair value of the reporting unit in which the goodwill resides to its carrying value, and we have determined that our reporting units are equivalent to our operating segments for the purpose of this analysis. We utilize a two-step approach to testing goodwill for impairment. The first step tests for possible impairment by applying a fair value-based test. In computing fair value of our reporting units, we use estimates of future revenues, costs and cash flows from such units. The second step, if necessary, measures the amount of such an impairment by applying fair value-based tests to individual assets and liabilities. We perform this analysis during the fourth quarter of each fiscal year. During 2007, we determined the goodwill acquired from our acquisition of G-Plus and Actrans had become impaired in the amounts of $14.8 million and $3.2 million, respectively. We did not record any impairment charge related to goodwill in 2008 and 2009. As of December 31, 2009, our recorded goodwill of $11.2 million relates to our technology licensing segment and was not at risk of failing the first step in the test for possible impairment.
Long-lived assets. Long-lived assets include property and equipment, equity investments and intangible assets. We are required to amortize purchased intangible assets other than goodwill over their useful lives, unless these lives are determined to be indefinite. Purchased intangible assets are carried at cost less accumulated amortization. Amortization is computed using the straight-line method over the estimated useful lives of one to five years. Whenever events or changes in circumstances indicate that the carrying amounts of long-lived assets may not be recoverable, we estimate the future cash flows, undiscounted and without interest charges, expected to result from the use of those assets and their eventual disposition. If the sum of the expected future cash flows is less than the carrying amount of those assets, we recognize an impairment loss based on the excess of the carrying amount over the fair value of the assets. As part of our 2007 analysis, we determined $1.0 million of long-lived assets had been impaired. In 2008, we recorded a $1.1 million charge to research and development to write off various intellectual property licenses, as we refined our focus toward our most strategic initiatives. We did not record any significant impairment charges related to long-lived assets in 2009.
Share-based compensation. We measure compensation expense based on estimated fair values of all share-based awards to our employees and directors. We estimate the fair value of stock options on the date of grant using the Black-Scholes option valuation model. The fair value of equity-based awards is amortized over the requisite service period, generally the vesting period of the award, and we have elected to attribute the value of share-based compensation to expense using the graded vesting method. Share-based compensation expense is recognized based on the value of the portion of share-based payment awards that is ultimately expected to vest.
54
Table of Contents
We make quarterly assessments of the adequacy of the additional paid-in capital pool, or APIC pool, to determine if there are any tax shortfalls which require recognition in the consolidated statements of operations.
The Black-Scholes option valuation model requires additional estimates and assumptions, including expected stock price volatility and expected term. We estimate expected volatility based on our historical stock volatility. If we determined that another method used to estimate expected volatility was more reasonable than our current methods, or if another method for calculating these input assumptions was prescribed by authoritative guidance, the fair value calculated for share-based awards could change significantly. Higher volatility and longer expected lives result in an increase to share-based compensation determined at the date of grant. For the purpose of estimating expected term, we believe that our historical stock option exercise data is not an accurate predictor of future exercise transactions. We utilize data from selected semiconductor companies, which we have concluded are similar with regard to market capitalization, stock option contractual term, and vesting schedules. We intend to continue to use a similar methodology until we determine that our historical stock option exercise data is expected to more accurately predict future exercise transactions.
Accounting for income taxes. We currently maintain a full valuation allowance on our net deferred tax assets. Determination of the valuation allowance requires an assessment of both positive and negative evidence when determining whether it is more likely than not that deferred tax assets are recoverable and such assessment is required on a jurisdiction by jurisdiction basis. Based upon the weight of available evidence, which includes our historical operating performance, reported cumulative net losses since inception and difficulty in accurately forecasting our results, we provided a full valuation allowance against our net deferred tax assets. We intend to maintain a full valuation allowance on the U.S. deferred tax assets until sufficient positive evidence exists to support reversal of the valuation allowance. During 2007, 2008 and 2009, we maintained a full valuation allowance on our deferred tax assets. At December 31, 2007, 2008 and 2009 the valuation allowance against our deferred tax assets was $27.0 million, $45.2 million and $33.5 million, respectively.
In July 2006, the FASB issued guidance which clarifies the accounting for income taxes by prescribing a recognition threshold and measurement attribute for the financial statement recognition and measurement of uncertain tax positions taken or expected to be taken in a company’s income tax return. The new guidance utilizes a two-step approach for evaluating uncertain tax positions: step one, recognition, requires a company to determine if the weight of available evidence indicates that a tax position is more likely than not to be sustained upon audit, including resolution of related appeals or litigation processes, if any; and step two, measurement, is based on the largest amount of benefit, which is more likely than not to be realized on ultimate settlement.
Our provision for income taxes is subject to volatility and could be adversely impacted by changes in earnings or tax laws and regulations in various jurisdictions. We are subject to the continuous examination of our income tax returns by the Internal Revenue Service and other tax authorities. We regularly assess the likelihood of adverse outcomes resulting from these examinations to determine the adequacy of our provision for income taxes. There can be no assurance that the outcomes from these continuous examinations will not have an adverse effect on our operating results and financial condition. To the extent that the final tax outcome of these matters is different than the amounts recorded, such differences will impact the provision for income taxes in the period in which such determination is made. The provision for income taxes includes the impact of changes to reserves, as well as the related net interest and penalties.
Fair value measurements. In September 2006, the FASB issued guidance that defines fair value, establishes a framework for the measurement of fair value under generally accepted accounting principles, and enhances disclosures about fair value measurements. We adopted the guidance in 2008 for fair value measurements of financial assets and liabilities and fair value measurements of non-financial assets and liabilities made on a recurring basis. Fair value is defined as the exchange price that would be received for an asset or paid to transfer a liability (an exit price) in the principal or most advantageous market for the asset or liability in an orderly transaction between market participants on the measurement date. Valuation techniques used to measure fair value must maximize the use of observable inputs and minimize the use of unobservable inputs. The standard
55
Table of Contents
describes a fair value hierarchy based on three levels of inputs, of which the first two are considered observable and the last unobservable, that may be used to measure fair value which are the following:
| • | Level 1—Quoted prices in active markets for identical assets or liabilities. |
| • | Level 2—Inputs other than Level 1 that are observable, either directly or indirectly, such as quoted prices for similar assets or liabilities; quoted prices in markets that are not active; or other inputs that are observable or can be corroborated by observable market data for substantially the full term of the assets or liabilities. |
| • | Level 3—Unobservable inputs that are supported by little or no market activity and that are significant to the fair value of the assets or liabilities. |
Liquidity and Capital Resources
| Year Ended December 31, | ||||||||||||
| 2007 | 2008 | 2009 | ||||||||||
| Cash provided by (used in): |
||||||||||||
| Operating activities |
$ | 31,163 | $ | 13,783 | $ | 9,486 | ||||||
| Investing activities |
$ | (17,595 | ) | $ | (45,262 | ) | $ | 32,359 | ||||
| Financing activities |
$ | 3,399 | $ | (35,951 | ) | $ | (417 | ) | ||||
Principal sources of liquidity at December 31, 2009 consist of $122.9 million of cash, cash equivalents, and short-term available-for-sale investments. Additional sources of liquidity may include certain marketable debt securities classified as long-term available-for-sale investments.
Our cash and cash equivalents and short-term and long-term investment portfolio as of December 31, 2009 consists of money market funds, federal, state and municipal government obligations, foreign and public corporate debt securities and listed equity securities. We follow an established investment policy and set of guidelines to monitor, manage and limit our exposure to interest rate fluctuations and credit risk. The policy sets forth credit quality standards and limits our exposure to any one issuer. As a result of current adverse financial market conditions, some financial instruments, such as structured investment vehicles, sub-prime mortgage-backed securities and collateralized debt obligations, may pose risks arising from liquidity and credit concerns. As of December 31, 2009, we had no direct holdings in these categories of investments and our exposure to these financial instruments through our indirect holdings in money market mutual funds was not material to total cash, cash equivalents and short-term investments. As a result of market conditions, the value of our investments in publicly held companies in Taiwan, a component of our long-term investment portfolio, may fluctuate significantly from quarter to quarter. The value of these investments declined significantly in the fourth quarter of 2008 and we recorded an impairment charge of $0.2 million associated with our investment in KYE. See Note 15 “Investments” to our consolidated financial statements for more information on our investment in KYE. We did not record any impairments associated with our investments in publicly held companies during 2009. While we cannot predict future market conditions or market liquidity, we have taken steps, including regularly reviewing our investments and associated risk profiles, which we believe will allow us to effectively manage the risks of our investment portfolio. We cannot predict long-term liquidity or capital resource requirements on material capital expenditures and other demands and commitments to be incurred beyond the next twelve months.
Operating activities. Operating activities provided $9.5 million of cash for 2009. The primary sources of cash from operating activities in 2009 were a $9.0 million increase in accounts payable and a $7.3 million decrease in inventories, along with non-cash expenses of $11.4 million for inventory write-downs and provision for adverse purchase commitments, $8.6 million for depreciation and amortization and $2.5 million for share-based compensation. Offsetting these sources of cash were our net loss of $10.2 million a $17.5 million increase in trade accounts receivable. The changes to accounts receivable and inventory balances primarily reflect the
56
Table of Contents
sharp drop in product sales during the fourth quarter of 2008 and inventory replenishment by our customers throughout 2009. Similarly, the increase in accounts payable in 2009 is primarily due to the reduction of production activities and corresponding accounts payable balance at the end of 2008. Share-based compensation expense for 2009 declined, as compared to previous years, due in part to charges in 2008 related to the grant of restricted stock options and tender offer, as well as a reduction in the number of options granted in 2008 and 2009. The decrease in depreciation and amortization expenses for 2009 is largely due to the significant reduction in capital expenditures in 2009, coupled with the run-out of amortization on intangible assets from acquisitions in 2004 and 2005. Our share of ACET’s loss for 2009 decreased significantly, as compared to 2008, primarily due to an impairment of $9.7 million recorded in the fourth quarter of 2008. The impairment resulted in a subsequent reduction to our pro rata share of the carrying value of long lived assets and associated depreciation expense. In the third quarter of 2009, we exchanged our equity interest in ACET for an equity interest in ADL and, accordingly, discontinued recording any pro rata share of loss related to our investment in ACET.
Operating activities provided $13.8 million of cash for 2008. The primary source of cash from operating activities in 2008 was a $35.4 million decrease in trade accounts receivable, due to the sharp decline in revenue in the fourth quarter. Offsetting this source of cash flow was a $22.9 million decrease in accounts payable, due to the reduction in overall production activities. Although we reported a net loss of $39.8 million for 2008, this loss was offset by non-cash operating expenses including $14.2 million in inventory write-downs and provision for adverse purchase commitments, $10.6 million in depreciation and amortization and $4.7 million in share-based compensation, in addition to $9.1 million in non-cash losses related to our equity interest in ACET and $21.6 million in impairments to equity investments.
The major contributing factors to our sources and uses of operating cash during 2007 were our net loss of $49.0 million, offset by a $15.2 million reduction of inventories due to supply constraints and a focus by management to reduce average levels of inventory on hand, and a decrease in receivables of $9.4 million as a result of the timing of payments from our customers and lower sales. Net loss was also affected by non-cash items in 2007, including $22.4 million of impairment charges from our investments in GSMC and EoNex, a $19.0 million charge for the impairment of goodwill and long lived assets, share-based compensation expense of $5.3 million, depreciation and amortization expense of $11.3 million, and a $8.5 million charge to our inventory and adverse purchase commitments provision.
Investing activities. Investing activities provided $32.4 million during 2009, with $108.3 million in maturities of available-for-sale debt securities partially offset by $74.8 million in purchases of available-for-sale debt securities. Purchases of property and equipment were not significant in 2009, reflecting efforts to carefully manage cash in response to adverse market conditions.
We used $45.3 million for investing activities during 2008, consisting primarily of $120.4 million used for purchases of available-for-sale debt securities and $8.3 million for property and equipment. This use of cash was partially offset by $84.1 million in sales and maturities of available-for-sale investments. We purchased long-term available-for-sale debt securities in order to obtain a higher interest rate yield.
For 2007, the primary uses of cash from investing activities were $95.7 million used for the purchase of available-for-sale investments, $13.0 million for the purchase of equity securities, and $6.4 million for fixed assets. These uses of cash were partially offset by the receipt of $99.5 million in cash from the sales and maturities of available-for-sale investments.
Financing activities. There were no significant sources or uses of cash from financing activities during 2009. Net cash used by financing activities was $0.4 million, with $1.0 million for payments of capital leases largely offset by $0.6 million in proceeds from issuance of common stock.
Net cash used by financing activities totaled $36.0 million for 2008, including $28.9 million for repurchase of common stock and $6.9 million for repayment of our line of credit. For further information on the repurchase of common stock, see Note 19 “Stock Repurchase Program” to our consolidated financial statements.
57
Table of Contents
Cash from financing activities in 2007 related primarily to the borrowing of $3.5 million from our line of credit, which was denominated in Chinese RMB.
Contractual Obligations and Commitments
Purchase Commitments. As of December 31, 2009, we had outstanding purchase commitments with our foundry vendors of $22.7 million for delivery in 2010. We have recorded a liability of $2.6 million for related adverse purchase commitments.
Lease Commitments. We have long-term, non-cancelable building lease commitments. Future payments due under building lease, purchase commitments and other contractual obligations as of December 31, 2009 are as follows (in thousands):
| Total | Less than 1 year |
1 - 3 years | 3 - 5 years | More than 5 years | |||||||||||
| Capital leases |
$ | 1,962 | $ | 831 | $ | 1,131 | $ | — | $ | — | |||||
| Operating leases |
3,686 | 2,057 | 875 | 156 | 598 | ||||||||||
| Purchase commitments |
22,670 | 22,670 | — | — | — | ||||||||||
| Total |
$ | 28,318 | $ | 25,558 | $ | 2,006 | $ | 156 | $ | 598 | |||||
Due to the uncertainty with respect to the timing of future cash flows associated with our unrecognized tax benefits at December 31, 2009, we are unable to make reasonably reliable estimates of the period of cash settlement with respective taxing authorities. Therefore, $15.6 million of unrecognized tax benefits that may result in a cash payment have been excluded from the contractual obligations table above. See Note 12 “Income Taxes” to our consolidated financial statements for further discussion of income taxes. We have no material long-term debt obligations as of December 31, 2009.
Off-Balance Sheet Arrangements
During 2008 and 2009, and as of December 31, 2008 and 2009, we did not have any off-balance sheet arrangements or relationships with unconsolidated entities or financial partnerships, such as entities often referred to as structured finance or special purposes entities, which are typically established for the purpose of facilitating off-balance sheet arrangements or other contractually narrow or limited purposes.
Stock Repurchase Program
In 2008, our Board of Directors authorized a stock repurchase program to repurchase shares of our common stock, subject to certain specifications, up to an aggregate maximum amount of $30.0 million. The program authorized repurchases to be made from time to time in the open market or in privately negotiated transactions, in compliance with the Securities Exchange Act of 1934 Rule 10b-18, subject to market conditions, applicable legal requirements, and other factors. The program, which commenced February 11, 2008, did not obligate us to acquire shares at any particular price per share and could be suspended at any time and at our discretion. During 2008, we repurchased 9.5 million shares for $28.9 million through open market repurchases. We suspended the program at December 31, 2008. We made no repurchases of our common stock in 2009.
Operating Capital Requirements
We believe that our cash balances, together with funds we expect to generate from operations, will be sufficient to meet our projected working capital and other cash requirements through at least the next twelve months.
58
Table of Contents
However, there can be no assurance that future events will not require us to seek additional borrowings or capital and, if so required, that such borrowing or capital will be available on acceptable terms. Factors that could affect our short-term and long-term cash used or generated from operations and as a result, our need to seek additional borrowings or capital include:
| • | the average selling prices of our products; |
| • | customer demand for our products; |
| • | the need to secure future wafer production capacity from our suppliers; |
| • | the timing of significant orders and of license and royalty revenue; |
| • | merger, acquisition or joint venture projects; |
| • | investments in strategic business partners; |
| • | unanticipated research and development expenses associated with new product introductions; and |
| • | the outcome of ongoing litigation. |
Please also see Item 1A. “Risk Factors—Risks Related to Our Business and Industry—Our operating results fluctuate materially, and an unanticipated decline in revenues may disappoint securities analysts or investors and result in a decline in our stock price.”
Recent Accounting Pronouncements
In October 2009, the FASB issued guidance addressing the accounting for multiple-deliverable arrangements to enable vendors to account for products or services separately rather than as a combined unit. The guidance amends the criteria for separating consideration in multiple-deliverable arrangements. This guidance replaces all references to fair value as a measurement criteria with the a selling price hierarchy for determining the selling price of a deliverable, which is based on: (a) vendor-specific objective evidence; (b) third-party evidence; or (c) estimates. This guidance eliminates the residual method of allocation and requires that arrangement consideration be allocated at the inception of the arrangement to all deliverables using the relative selling price method. In addition, this guidance significantly expands required disclosures. The guidance is effective prospectively for revenue arrangements entered into or materially modified in fiscal years beginning on or after June 15, 2010. Early adoption is permitted. We are currently evaluating this guidance to determine its impact, if any, on our consolidated financial statements.
In December 2009, the FASB issued guidance changes how a reporting entity determines when an entity that is insufficiently capitalized, or is not controlled through voting, or similar rights, should be consolidated. The determination of whether a reporting entity is required to consolidate another entity is based on, among other things, the (1) other entity’s purpose and design; and (2) the reporting entity’s ability to direct the activities of the other entity that most significantly impact the other entity’s economic performance. The guidance also requires a reporting entity to provide additional disclosures, including how its involvement with a variable interest entity affects the reporting entity’s financial statements. This guidance is effective at the start of the first fiscal year beginning after November 15, 2009 and early application is not permitted. We are currently evaluating the impact of this guidance on our consolidated financial statements.
In January 2010, the FASB issued guidance amending and clarifying requirements for fair value measurements and disclosures. The new guidance requires disclosure of transfers in and out of Level 1 and Level 2 and a reconciliation of all activity in Level 3 The guidance also requires detailed disaggregation disclosure for each class of assets and liabilities in all levels, and disclosures about inputs and valuation techniques for Level 2 and Level 3. The guidance is effective at the start of interim or annual reporting periods beginning after December 15, 2009 and the disclosure reconciliation of all activity in Level 3 is effective at the start of annual reporting periods beginning after December 15, 2010. We do not currently anticipate that this guidance will have a material impact on our consolidated financial statements upon adoption.
59
Table of Contents
| Item 7A. | Quantitative and Qualitative Disclosures About Market Risk |
We are exposed to risks associated with foreign exchange rate fluctuations due to our international manufacturing and sales activities, including currency exchange rates for China, Taiwan, Japan, Korea, Singapore, Malaysia and the United Kingdom. These exposures may change over time as business practices evolve and could negatively impact our operating results and financial condition. Currently, we do not hedge these foreign exchange rate exposures. Substantially all of our sales are denominated in U.S. dollars. An increase in the value of the U.S. dollar relative to foreign currencies could make our products more expensive and therefore reduce the demand for our products. Such a decline in the demand could reduce revenues and/or result in operating losses. We have liabilities for uncertain tax positions related to foreign withholding tax on license revenue, and fluctuations in foreign exchange rates could affect the measurement of these liabilities. As of December 31, 2009, a 10% move in these rates could result in an increase to our tax provision expense of approximately $0.9 million. In addition, a downturn in the economies of China, Japan or Taiwan could impair the value of our investments in companies with operations in these countries. If we consider the value of these companies to be impaired, we will write off, or expense, some or all of our investments. In 2007, 2008 and 2009 we recorded investment impairments of $22.4 million, $21.8 million and $0.5 million, respectively. We do not currently hold any investments sensitive to market risk which were entered into for trading purposes.
At any time, fluctuations in interest rates could affect interest earnings on our cash, cash equivalents and short-term investments, or the fair value of our investment portfolio. A 10% move in interest rates as of December 31, 2009 would have an immaterial effect on our financial position, results of operations and cash flows. Currently, we do not hedge these interest rate exposures.
The table below presents the carrying value and related weighted average interest rates for our unrestricted and restricted cash, cash equivalents, short-term available-for-sale investments and long-term available-for-sale debt securities as of December 31, 2009 (in thousands, except percentages):
| Carrying Value |
Interest Rate |
|||||
| Cash and cash equivalents—variable rate |
$ | 92,299 | 0.4 | % | ||
| Short-term available-for-sale investments—fixed rate |
30,613 | 0.6 | % | |||
| Long-term available-for-sale debt securities—fixed rate |
19,609 | 0.7 | % | |||
| $ | 142,521 | |||||
| Item 8. | Financial Statements and Supplementary Data |
The consolidated financial statements are included in a separate section of this Annual Report.
60
Table of Contents
Supplementary Data: Selected Consolidated Quarterly Data
The following tables present our unaudited consolidated statements of operations data for each of the eight quarters in the period ended December 31, 2009. The operating results for any quarter should not be relied upon as necessarily indicative of results for any future period. We expect our quarterly operating results to fluctuate in future periods due to a variety of reasons, including those discussed in Item 1A. “Risk Factors.”
| Quarter Ended | |||||||||||||||
| March 31, 2008 |
June 30, 2008 |
September 30, 2008 |
December 31, 2008 |
||||||||||||
| (in thousands, except per share data) | |||||||||||||||
| Net revenues: |
|||||||||||||||
| Product revenues |
$ | 69,698 | $ | 71,073 | $ | 79,800 | $ | 46,294 | |||||||
| License revenues |
11,387 | 12,627 | 12,597 | 12,059 | |||||||||||
| Total net revenues |
$ | 81,085 | $ | 83,700 | $ | 92,398 | $ | 58,352 | |||||||
| Gross profit |
$ | 25,709 | $ | 23,949 | $ | 30,977 | $ | 16,596 | |||||||
| Income (loss) from operations |
$ | (4,569 | ) | $ | (5,913 | ) | $ | 4,072 | $ | (10,764 | ) | ||||
| Net income (loss) |
$ | 1,459 | $ | (9,569 | ) | $ | 4,921 | $ | (36,626 | ) | |||||
| Net income (loss) per share—basic |
$ | 0.01 | $ | (0.09 | ) | $ | 0.05 | $ | (0.38 | ) | |||||
| Net income (loss) per share—diluted |
$ | 0.01 | $ | (0.09 | ) | $ | 0.05 | $ | (0.38 | ) | |||||
In the fourth quarter of 2008, we recorded impairment charges of $9.7 million and $11.6 million related to our investments in ACET and GSMC, respectively, as well as a restructuring charge of $2.5 million. During the first quarter of 2008, we recorded a tax benefit of $7.9 million for a refund received from the Internal Revenue Service.
| March 31, 2009 |
June 30, 2009 |
September 30, 2009 |
December 31, 2009 | |||||||||||
| (in thousands, except per share data) | ||||||||||||||
| Net revenues: |
||||||||||||||
| Product revenues |
$ | 38,787 | $ | 51,766 | $ | 61,766 | $ | 60,343 | ||||||
| License revenues |
11,342 | 6,317 | 9,487 | 12,519 | ||||||||||
| Total net revenues |
$ | 50,129 | $ | 58,083 | $ | 71,253 | $ | 72,862 | ||||||
| Gross profit |
$ | 15,594 | $ | 13,509 | $ | 22,463 | $ | 23,674 | ||||||
| Income (loss) from operations |
$ | (6,269 | ) | $ | (7,543 | ) | $ | 1,480 | $ | 3,032 | ||||
| Net Income (loss) |
$ | (9,241 | ) | $ | (6,448 | ) | $ | 3,092 | $ | 2,360 | ||||
| Net loss per share—basic |
$ | (0.10 | ) | $ | (0.07 | ) | $ | 0.03 | $ | 0.02 | ||||
| Net loss per share—diluted |
$ | (0.10 | ) | $ | (0.07 | ) | $ | 0.03 | $ | 0.02 | ||||
| Item 9. | Changes in and Disagreements with Accountants on Accounting and Financial Disclosure |
Not applicable.
| Item 9A. | Controls and Procedures |
Disclosure Controls and Procedures
We maintain disclosure controls and procedures that are designed to ensure that information required to be disclosed in our reports filed or submitted pursuant to the Securities Exchange Act of 1934, as amended, or the Exchange Act, is recorded, processed, summarized and reported within the time periods specified in the Securities and Exchange Commission’s rules and forms. Disclosure controls and procedures also are designed to ensure that such information is accumulated and communicated to our management, including our Chief Executive Officer and Chief Financial Officer, as appropriate, to allow timely decisions regarding required disclosure.
61
Table of Contents
Our management, with the participation of our Chief Executive Officer and Chief Financial Officer, conducted an evaluation of the effectiveness of our disclosure controls and procedures (as defined in the Exchange Act Rules 13a 15(e) and 15d 15(e)) as of December 31, 2009. Based on their evaluation, the Chief Executive Officer and the Chief Financial Officer have concluded that, as of December 31, 2009, our disclosure controls and procedures are effective.
Management’s Report on Internal Control Over Financial Reporting
Management is responsible for establishing and maintaining adequate internal control over financial reporting, as such term is defined in Exchange Act Rule 13a 15(f). Our internal control over financial reporting is a process designed to provide reasonable assurance regarding the reliability of financial reporting and the preparation of financial statements for external purposes in accordance with generally accepted accounting principles. Our internal control over financial reporting includes those policies and procedures that: (i) pertain to the maintenance of records that, in reasonable detail, accurately and fairly reflect the transactions and dispositions of our assets; (ii) provide reasonable assurance that transactions are recorded as necessary to permit preparation of financial statements in accordance with U.S. generally accepted accounting principles, and that our receipts and expenditures are being made only in accordance with authorizations of our management and directors; and (iii) provide reasonable assurance regarding prevention or timely detection of unauthorized acquisition, use or disposition of our assets that could have a material effect on the financial statements.
Because of its inherent limitations, internal control over financial reporting may not prevent or detect misstatements. Also, projections of any evaluation of effectiveness to future periods are subject to the risk that controls may become inadequate because of changes in conditions, or that the degree of compliance with the policies or procedures may deteriorate.
Our management assessed the effectiveness of our internal control over financial reporting as of December 31, 2009. In making its assessment of internal control over financial reporting, our management used the criteria established in Internal Control—Integrated Framework issued by the Committee of Sponsoring Organizations of the Treadway Commission (COSO). Management’s assessment was reviewed with the Audit Committee of the Board of Directors. Based on its assessment of internal control over financial reporting, management has concluded that, as of December 31, 2009, our internal control over financial reporting was effective.
The effectiveness of our internal control over financial reporting as of December 31, 2009 has been audited by PricewaterhouseCoopers LLP, an independent registered public accounting firm, as stated in their report which appears herein.
Remediation of Material Weakness
In the Disclosure Controls and Procedures included in our quarterly report on Form 10-Q for the quarter ended June 30 and September 30, 2009, our management concluded that, as of June 30, 2009 and September 30, 2009, our internal control over financial reporting was not effective to provide reasonable assurance regarding the reliability of financial reporting and the preparation of financial statements for external reporting purposes in accordance with generally accepted accounting principals.
As of June 30, 2009, we did not maintain effective controls to ensure the accuracy of the provision for income taxes. Specifically, we did not maintain a sufficient complement of tax resources with the required proficiency to identify, evaluate, review and report complex tax accounting matters. This deficiency resulted in adjustments to the unaudited condensed consolidated financial statements for the quarter ended June 30, 2009. Specifically, during the second quarter of 2009, we identified certain prior period errors totaling $2.2 million, related to the provision for (benefit from) income taxes. In calculating our tax provision for the quarter ended March 31, 2009, we incorrectly calculated the balance of the foreign withholding tax liability for uncertain tax
62
Table of Contents
positions on which re-measurement was required due to changes in foreign currency exchange rates. As a result, our income tax provision was overstated by $2.1 million in the quarter ended March 31, 2009. In addition, we overstated by $0.1 million the liability for uncertain tax positions for foreign tax withholding on license revenue at December 31, 2008. This control deficiency could result in a material misstatement of our annual or interim consolidated financial statements that would not be prevented or detected. Accordingly, management determined that this control deficiency constituted a material weakness.
Subsequent to the identification of the material weakness described above, we have taken the following remediation measures related to the calculation of the provision for income taxes and determination of the liability for uncertain tax positions:
| • | Updated withholding rates on a quarterly basis upon which the tax liability is calculated and established additional procedures to evaluate the accuracy of the tax liability including a roll forward schedule and checklist of procedures to be performed each quarter. |
| • | Established a database on all transactions subject to foreign withholding tax for purposes of accurately calculating the withholding tax liability. |
| • | Reallocated management resources to the review of the foreign withholding tax liability and the re-measurement required due to changes in foreign currency exchange rates. |
During the quarters ended September 30, 2009 and December 31, 2009, management tested the design and operating effectiveness of the controls and concluded that the material weakness described above has been remediated as of December 31, 2009.
Changes in Internal Control Over Financial Reporting
As described above, we have completed our corrective actions in response to the aforementioned material weakness during the quarter ended December 31, 2009 that have materially affected, or are reasonably likely to materially affect, our internal control over financial reporting as defined in Rules 13a 15(f) and 15d 15(f) of the Exchange Act.
| Item 9B. | Other Information |
None
63
Table of Contents
PART III
| Item 10. | Directors, Executive Officers and Corporate Governance |
The information required by this item will be included in Form 10-K/A, to be filed no later than 120 days after the end of the reporting period, in the event that we are subject to such requirements at that time.
| Item 11. | Executive Compensation |
The information required by this item will be included in Form 10-K/A, to be filed no later than 120 days after the end of the reporting period, in the event that we are subject to such requirements at that time.
| Item 12. | Security Ownership of Certain Beneficial Owners and Management and Related Shareholder Matters |
The information required by this item will be included in Form 10-K/A, to be filed no later than 120 days after the end of the reporting period, in the event that we are subject to such requirements at that time.
| Item 13. | Certain Relationships and Related Transactions, and Director Independence |
The information required by this item will be included in Form 10-K/A, to be filed no later than 120 days after the end of the reporting period, in the event that we are subject to such requirements at that time.
| Item 14. | Principal Accountant Fees and Services |
The information required by this item will be included in Form 10-K/A, to be filed no later than 120 days after the end of the reporting period, in the event that we are subject to such requirements at that time.
64
Table of Contents
PART IV
| Item 15. | Exhibits and Financial Statement Schedules |
(a)(1) Consolidated Financial Statements. The index to the consolidated financial statements is below.
| Item |
Page | |
| 69 | ||
| 70 | ||
| 71 | ||
| Consolidated Statements of Shareholders’ Equity and Comprehensive Income (Loss) |
72 | |
| 73 | ||
| 74 | ||
| (2) Financial Statement Schedule. |
||
| 109 | ||
Exhibits. See Exhibit Index in part (b), below.
| Exhibit |
Exhibit Description |
Incorporated By Reference | Filed Herewith | |||||||||
| Form | File No. | Exhibit | Filing Date | |||||||||
| 2.1 | Agreement and Plan of Merger, dated February 2, 2010, by and among Microchip Technology Incorporated, Sun Acquisition Corporation and SST. | 8-K | 000-26944 | 2.1 | 2/3/2010 | |||||||
| 2.2 | Amendment No. 1 to Agreement and Plan of Merger, dated February 22, 2010, by and among Microchip Technology Incorporated, Sun Acquisition Corporation and SST. | 8-K | 000-26944 | 2.2 | 2/23/2010 | |||||||
| 2.3 | Amendment No. 2 to Agreement and Plan of Merger, dated March 8, 2010, by and among Microchip Technology Incorporated, Sun Acquisition Corporation and SST. | 8-K | 000-26944 | 2.3 | 3/8/2010 | |||||||
| 3.1 | Bylaws of Silicon Storage Technology, Inc., as amended. | 8-K | 000-26944 | 3.1 | 1/7/2008 | |||||||
| 3.2 | Restated Articles of Incorporation of SST, dated November 3, 1995. | S-1 | 33-97802 | 3.4 | 10/5/1995 | |||||||
| 3.3 | Certificate of Amendment of the Restated Articles of Incorporation of SST, dated June 30, 2000. | 10-Q | 000-26944 | 3.5 | 8/7/2000 | |||||||
| 3.4 | Certificate of Designation of Series A Junior Participating Preferred Stock | 8-K | 000-26944 | 99.3 | 5/18/1999 | |||||||
| 4.1 | Reference is made to Exhibits 3.1 to 3.4. | |||||||||||
| 4.2 | Specimen Stock Certificate of SST. | S-1 | 33-97802 | 4.2 | 11/3/1995 | |||||||
| 4.3 | Rights Agreement between SST and American Stock Transfer and Trust Co., dated May 4, 1999. | 8-K | 000-26944 | 99.2 | 5/18/1999 | |||||||
65
Table of Contents
| Exhibit |
Exhibit Description |
Incorporated By Reference | Filed Herewith | |||||||||
| Form | File No. | Exhibit | Filing Date | |||||||||
| 4.4 | Amendment No. 1 to Rights Agreement between SST and American Stock Transfer and Trust Co., dated October 28, 2000. | 10-K | 000-26944 | 3.6 | 3/30/2001 | |||||||
| 10.1+ | 1995 Equity Incentive Plan and related agreements. | S-8 | 333-108345 | 99.1 | 8/29/2003 | |||||||
| 10.2+ | 2009 Employee Stock Purchases Plan. | DEF 14 | 000-26944 | Annex A | 4/30/2009 | |||||||
| 10.3+ | 1995 Non-Employee Director’s Stock Option Plan, as amended, and related form of stock option agreement. | 10-Q | 000-26944 | 10.3 | 8/11/2008 | |||||||
| 10.4+ | Employee Profit Sharing Plan. | 10-Q | 000-26944 | 10.4 | 5/10/2006 | |||||||
| 10.5+ | Non-Employee Director Cash Retainer Program. | 8-K | 000-26944 | 10.15 | 4/21/2005 | |||||||
| 10.6+ | Form of Indemnity Agreement by and between SST and each executive officer and director. | 10-K | 000-26944 | 10.18 | 1/16/2008 | |||||||
| 10.7+ | 2007 Executive Bonus Plan. | 10-Q | 000-26944 | 10.19 | 1/18/2008 | |||||||
| 10.8+ | 2008 Equity Incentive Plan. | 8-K | 000-26944 | 10.18 | 7/1/2008 | |||||||
| 10.9+ | Form of Stock Option Grant Notice and Agreement. | 8-K | 000-26944 | 10.19 | 7/1/2008 | |||||||
| 10.10+ | Form of Non-Employee Director Stock Option Grant Notice and Agreement. | 8-K | 000-26944 | 10.2 | 7/1/2008 | |||||||
| 10.11+ | Form of Restricted Stock Unit Grant Notice and Agreement. | 8-K | 000-26944 | 10.21 | 7/1/2008 | |||||||
| 10.12+ | Form of Restricted Stock Bonus Grant Notice and Agreement. | 8-K | 000-26944 | 10.22 | 7/1/2008 | |||||||
| 10.13+ | Letter Agreement by and between SST and Michael Briner, dated June 25, 2008. | 8-K | 000-26944 | 10.23 | 7/1/2008 | |||||||
| 10.14 | Settlement Agreement, dated May 21, 2008, between SST and the Riley Group. | 8-K | 000-26944 | 10.16 | 5/23/2008 | |||||||
| 10.15+ | Form of Stock Bonus Agreement. | 8-K | 000-26944 | 10.17 | 6/4/2008 | |||||||
| 10.16 | Voting Agreement by and among SST, Bing Yeh, Deborah Yeon-May Yeh, Golden Eagle Capital L.P. and Yeh Family Trust U/T/D dated August 14, 1995. | 8-K | 000-26944 | 10.1 | 3/16/2010 | |||||||
| 21.1 | Subsidiaries of SST. | X | ||||||||||
| 23.1 | Consent of PricewaterhouseCoopers LLP, Independent Registered Public Accounting Firm. | X | ||||||||||
66
Table of Contents
| Exhibit |
Exhibit Description |
Incorporated By Reference | Filed Herewith | |||||||||
| Form | File No. |
Exhibit | Filing Date |
|||||||||
| 23.2 | Consent of PricewaterhouseCoopers, Independent Registered Public Accounting Firm |
X | ||||||||||
| 24.1 | Power of Attorney is contained on the signature page. | X | ||||||||||
| 31.1 | Certification of Chief Executive Officer as required by Rule 13a-14(a) of the Securities Exchange Act of 1934, as amended. | X | ||||||||||
| 31.2 | Certification of Chief Financial Officer and Senior Vice President of Finance as required by Rule 13a-14(a) of the Securities Exchange Act of 1934, as amended. | X | ||||||||||
| 32.1* | Certification of Chief Executive Officer, as required by Rule 13a-14(b) and Section 1350 of Chapter 63 of Title 18 of the United States Code (18 U.S.C. 1350). | X | ||||||||||
| 32.2* | Certification of Chief Financial Officer and Senior Vice President of Finance, as required by Rule 13a-14(b) and Section 1350 of Chapter 63 of Title 18 of the United States Code (18 U.S.C. 1350). | X | ||||||||||
| 99.1 | Audited Financial Statements of Advanced Chip Engineering Technology Inc. | X | ||||||||||
| 99.2 | Financial Statements of Advanced Chip Engineering Technology Inc. | X | ||||||||||
| * | The certifications attached as Exhibit 32.1 and Exhibit 32.2 accompany the Annual Report on Form 10-K, are not deemed filed with the Securities and Exchange Commission and are not to be incorporated by reference into any filing of the Company under the Securities Act of 1933, as amended, or the Securities Exchange Act of 1934, as amended (whether made before or after the date of the Form 10-K), irrespective of any general incorporation language contained in such filing. |
| + | Management contract, compensatory plan or arrangement. |
67
Table of Contents
Pursuant to the requirements of Section 13 or 15(d) of the Securities Exchange Act of 1934, the Registrant has duly caused this report to be signed on its behalf by the undersigned, thereunto duly authorized, in the City of Sunnyvale, County of Santa Clara, State of California, on the 17th day of March, 2010.
| SILICON STORAGE TECHNOLOGY, INC. | ||
| By: |
/s/ BING YEH | |
| Bing Yeh | ||
| Chief Executive Officer | ||
| (Principal Executive Officer) | ||
POWER OF ATTORNEY
KNOW ALL PERSONS BY THESE PRESENTS, that each person whose signature appears below constitutes and appoints Bing Yeh and James B. Boyd, and each or any one of them, his true and lawful attorney-in-fact and agent, with full power of substitution and re-substitution, for him and in his name, place and stead, in any and all capacities, to sign any and all amendments to this report, and to file the same, with all exhibits thereto, and other documents in connection therewith, with the Securities and Exchange Commission, granting unto said attorneys-in-fact and agents, and each of them, full power and authority to do and perform each and every act and thing requisite and necessary to be done in connection therewith, as fully to all intents and purposes as he might or could do in person, hereby ratifying and confirming all that said attorneys-in-fact and agents, or any of them, or their or his substitutes or substitute, may lawfully do or cause to be done by virtue hereof.
Pursuant to the requirements of the Securities Exchange Act of 1934, this report has been signed below by the following persons on behalf of the Registrant and in the capacities and on the dates indicated.
| Signature |
Title |
Date | ||
| /s/ BING YEH Bing Yeh |
Chief Executive Officer and Chairman of the Board (Principal Executive Officer) | March 17, 2010 | ||
| /s/ JAMES B. BOYD James B. Boyd |
Chief Financial Officer and Senior Vice President, Finance (Principal Financial and Accounting Officer) | March 17, 2010 | ||
| /s/ YAW WEN HU Yaw Wen Hu |
Director | March 17, 2010 | ||
| /s/ RONALD CHWANG Ronald Chwang |
Director | March 17, 2010 | ||
| /s/ TERRY NICKERSON Terry Nickerson |
Director | March 17, 2010 | ||
| /s/ EDWARD YAO-WU YANG Edward Yao-Wu Yang |
Director | March 17, 2010 | ||
68
Table of Contents
Report of Independent Registered Public Accounting Firm
To the Board of Directors and Shareholders of Silicon Storage Technology, Inc.:
In our opinion, the consolidated financial statements listed in the index appearing under Item 15(a)(1) present fairly, in all material respects, the financial position of Silicon Storage Technology, Inc. and its subsidiaries at December 31, 2009 and 2008, and the results of their operations and their cash flows for each of the three years in the period ended December 31, 2009 in conformity with accounting principles generally accepted in the United States of America. In addition, in our opinion, the financial statement schedule listed in the index appearing under Item 15(a)(2) presents fairly, in all material respects, the information set forth therein when read in conjunction with the related consolidated financial statements. Also in our opinion, the Company maintained, in all material respects, effective internal control over financial reporting as of December 31, 2009, based on criteria established in Internal Control—Integrated Framework issued by the Committee of Sponsoring Organizations of the Treadway Commission (COSO). The Company’s management is responsible for these financial statements and the financial statement schedule, for maintaining effective internal control over financial reporting and for its assessment of the effectiveness of internal control over financial reporting included in Management’s Report on Internal Control Over Financial Reporting appearing under Item 9A. Our responsibility is to express opinions on these financial statements, on the financial statement schedule and on the Company’s internal control over financial reporting based on our integrated audits. We conducted our audits in accordance with the standards of the Public Company Accounting Oversight Board (United States). Those standards require that we plan and perform the audits to obtain reasonable assurance about whether the financial statements are free of material misstatement and whether effective internal control over financial reporting was maintained in all material respects. Our audits of the financial statements included examining, on a test basis, evidence supporting the amounts and disclosures in the financial statements, assessing the accounting principles used and significant estimates made by management, and evaluating the overall financial statement presentation. Our audit of internal control over financial reporting included obtaining an understanding of internal control over financial reporting, assessing the risk that a material weakness exists, and testing and evaluating the design and operating effectiveness of internal control based on the assessed risk. Our audits also included performing such other procedures as we considered necessary in the circumstances. We believe that our audits provide a reasonable basis for our opinions.
A company’s internal control over financial reporting is a process designed to provide reasonable assurance regarding the reliability of financial reporting and the preparation of financial statements for external purposes in accordance with generally accepted accounting principles. A company’s internal control over financial reporting includes those policies and procedures that (i) pertain to the maintenance of records that, in reasonable detail, accurately and fairly reflect the transactions and dispositions of the assets of the company; (ii) provide reasonable assurance that transactions are recorded as necessary to permit preparation of financial statements in accordance with generally accepted accounting principles, and that receipts and expenditures of the company are being made only in accordance with authorizations of management and directors of the company; and (iii) provide reasonable assurance regarding prevention or timely detection of unauthorized acquisition, use, or disposition of the company’s assets that could have a material effect on the financial statements.
Because of its inherent limitations, internal control over financial reporting may not prevent or detect misstatements. Also, projections of any evaluation of effectiveness to future periods are subject to the risk that controls may become inadequate because of changes in conditions, or that the degree of compliance with the policies or procedures may deteriorate.
/s/ PricewaterhouseCoopers LLP
San Jose, California
March 17, 2010
69
Table of Contents
SILICON STORAGE TECHNOLOGY, INC. AND SUBSIDIARIES
CONSOLIDATED BALANCE SHEETS
(in thousands)
| December 31, | ||||||||
| 2008 | 2009 | |||||||
| ASSETS | ||||||||
| Current assets: |
||||||||
| Cash and cash equivalents |
$ | 50,880 | $ | 92,299 | ||||
| Short-term available-for-sale investments |
48,997 | 30,613 | ||||||
| Trade accounts receivable-unrelated parties, net of allowance for doubtful accounts of $79 at December 31, 2008 and $12 at December 31, 2009 |
9,356 | 11,520 | ||||||
| Trade accounts receivable-related parties |
10,761 | 26,140 | ||||||
| Inventories |
54,159 | 36,881 | ||||||
| Other current assets |
4,153 | 5,317 | ||||||
| Total current assets |
178,306 | 202,770 | ||||||
| Long-term available-for-sale debt securities |
31,848 | 19,609 | ||||||
| Long-term available-for-sale equity investments |
18,196 | 40,619 | ||||||
| Equity investments, GSMC |
11,506 | 20,720 | ||||||
| Equity investments, others |
13,113 | 11,436 | ||||||
| Property and equipment, net |
18,913 | 12,051 | ||||||
| Goodwill |
11,221 | 11,221 | ||||||
| Intangible assets, net |
3,573 | 1,661 | ||||||
| Other assets |
1,807 | 4,520 | ||||||
| Total assets |
$ | 288,483 | $ | 324,607 | ||||
| LIABILITIES | ||||||||
| Current liabilities: |
||||||||
| Trade accounts payable-unrelated parties |
$ | 15,702 | $ | 20,052 | ||||
| Trade accounts payable-related parties |
3,444 | 8,186 | ||||||
| Accrued expenses and other liabilities |
14,200 | 12,215 | ||||||
| Deferred revenue |
3,841 | 13,970 | ||||||
| Total current liabilities |
37,187 | 54,423 | ||||||
| Taxes payable |
7,760 | 8,947 | ||||||
| Other liabilities |
322 | 1,110 | ||||||
| Total liabilities |
45,269 | 64,480 | ||||||
| Commitments (Note 4) and Contingencies (Note 5) |
||||||||
| SHAREHOLDERS’ EQUITY | ||||||||
| Preferred stock, no par value: |
||||||||
| Authorized: 7,000 shares. Series A Junior Participating Preferred Stock, no par value Designated: 450 shares. Issued and outstanding: none at December 31, 2008 and 2009 |
||||||||
| Common stock, no par value: |
||||||||
| Authorized: 250,000 shares. Issued and outstanding: 95,498 shares at December 31, 2008 and 95,854 shares at December 31, 2009 |
412,312 | 415,267 | ||||||
| Accumulated other comprehensive income |
14,308 | 38,503 | ||||||
| Accumulated deficit |
(183,406 | ) | (193,643 | ) | ||||
| Total shareholders’ equity |
243,214 | 260,127 | ||||||
| Total liabilities and shareholders’ equity |
$ | 288,483 | $ | 324,607 | ||||
The accompanying notes are an integral part of these consolidated financial statements.
70
Table of Contents
SILICON STORAGE TECHNOLOGY, INC. AND SUBSIDIARIES
CONSOLIDATED STATEMENTS OF OPERATIONS
(in thousands, except per share data)
| Year Ended December 31, | ||||||||||||
| 2007 | 2008 | 2009 | ||||||||||
| Net revenues: |
||||||||||||
| Product revenues—unrelated parties |
$ | 145,267 | $ | 113,733 | $ | 82,606 | ||||||
| Product revenues—related parties |
226,649 | 153,132 | 130,056 | |||||||||
| Technology licensing—unrelated parties |
39,656 | 48,279 | 39,162 | |||||||||
| Technology licensing—related parties |
176 | 391 | 503 | |||||||||
| Total net revenues |
411,748 | 315,535 | 252,327 | |||||||||
| Cost of revenues: |
||||||||||||
| Cost of revenues—unrelated parties |
102,227 | 81,998 | 57,453 | |||||||||
| Cost of revenues—related parties |
189,105 | 136,306 | 119,634 | |||||||||
| Total cost of revenues |
291,332 | 218,304 | 177,087 | |||||||||
| Gross profit |
120,416 | 97,231 | 75,240 | |||||||||
| Operating expenses: |
||||||||||||
| Research and development |
56,712 | 58,955 | 43,160 | |||||||||
| Sales and marketing |
29,229 | 26,605 | 20,344 | |||||||||
| General and administrative |
27,603 | 26,331 | 20,706 | |||||||||
| Other (Note 10) |
30,931 | 2,514 | 329 | |||||||||
| Total operating expenses |
144,475 | 114,405 | 84,539 | |||||||||
| Loss from operations |
(24,059 | ) | (17,174 | ) | (9,299 | ) | ||||||
| Interest income |
7,329 | 4,057 | 1,966 | |||||||||
| Dividend income |
1,666 | 1,578 | 1,406 | |||||||||
| Interest expense |
(495 | ) | (140 | ) | (19 | ) | ||||||
| Gain on sale of investments |
159 | — | 1,811 | |||||||||
| Impairment of investments |
(22,400 | ) | (21,832 | ) | (485 | ) | ||||||
| Other income (expense), net |
115 | (517 | ) | 355 | ||||||||
| Loss before provision for (benefit from) income taxes and pro rata share of loss from equity investments |
(37,685 | ) | (34,028 | ) | (4,265 | ) | ||||||
| Provision for (benefit from) income taxes |
4,237 | (3,358 | ) | 4,692 | ||||||||
| Loss before pro rata share of loss from equity investments |
(41,922 | ) | (30,670 | ) | (8,957 | ) | ||||||
| Pro rata share of loss from equity investments |
7,035 | 9,145 | 1,280 | |||||||||
| Net loss |
$ | (48,957 | ) | $ | (39,815 | ) | $ | (10,237 | ) | |||
| Net loss per share—basic and diluted |
$ | (0.47 | ) | $ | (0.40 | ) | $ | (0.11 | ) | |||
| Shares used in per share calculation—basic and diluted |
104,134 | 100,019 | 95,790 | |||||||||
The accompanying notes are an integral part of these consolidated financial statements.
71
Table of Contents
SILICON STORAGE TECHNOLOGY, INC. AND SUBSIDIARIES
CONSOLIDATED STATEMENTS OF SHAREHOLDERS’ EQUITY AND
COMPREHENSIVE INCOME (LOSS)
(in thousands)
| Common Stock | Accumulated Other Comprehensive Income |
Accumulated Deficit |
Total | ||||||||||||||||
| Shares | Amount | ||||||||||||||||||
| Balances, December 31, 2006 |
103,629 | $ | 425,863 | $ | 31,281 | $ | (91,429 | ) | $ | 365,715 | |||||||||
| Issuance of shares of common stock under employee stock purchase and option plans |
569 | 1,236 | — | — | 1,236 | ||||||||||||||
| Share-based compensation |
— | 5,291 | — | — | 5,291 | ||||||||||||||
| Equity affiliate share-based compensation |
— | 689 | — | — | 689 | ||||||||||||||
| Impact of change in accounting for uncertain tax positions |
— | — | — | (3,205 | ) | (3,205 | ) | ||||||||||||
| Gain on change in equity interest in ACET |
— | 1,826 | — | — | 1,826 | ||||||||||||||
| Net loss |
— | — | — | (48,957 | ) | ||||||||||||||
| Unrealized gain on available-for-sale investments |
— | — | 106 | — | |||||||||||||||
| Cumulative translation adjustment |
— | — | (148 | ) | — | ||||||||||||||
| Comprehensive loss |
— | — | — | — | (48,999 | ) | |||||||||||||
| Balances, December 31, 2007 |
104,198 | 434,905 | 31,239 | (143,591 | ) | 322,553 | |||||||||||||
| Issuance of shares of common stock under employee stock purchase and option plans |
818 | 1,107 | — | — | 1,107 | ||||||||||||||
| Repurchase of common stock |
(9,518 | ) | (28,922 | ) | — | — | (28,922 | ) | |||||||||||
| Share-based compensation |
— | 4,643 | — | — | 4,643 | ||||||||||||||
| Equity affiliate share-based compensation |
— | 609 | — | — | 609 | ||||||||||||||
| Other |
— | (30 | ) | — | — | (30 | ) | ||||||||||||
| Net loss |
— | — | — | (39,815 | ) | ||||||||||||||
| Unrealized loss on available-for-sale investments |
— | — | (17,180 | ) | — | ||||||||||||||
| Cumulative translation adjustment |
— | — | 249 | — | |||||||||||||||
| Comprehensive loss |
— | — | — | — | (56,746 | ) | |||||||||||||
| Balances, December 31, 2008 |
95,498 | 412,312 | 14,308 | (183,406 | ) | 243,214 | |||||||||||||
| Issuance of shares of common stock under employee stock purchase and option plans |
356 | 583 | — | — | 583 | ||||||||||||||
| Share-based compensation |
— | 2,403 | — | — | 2,403 | ||||||||||||||
| Other |
— | (31 | ) | — | — | (31 | ) | ||||||||||||
| Net loss |
— | — | — | (10,237 | ) | ||||||||||||||
| Unrealized gain on available-for-sale investments |
— | — | 24,399 | — | |||||||||||||||
| Cumulative translation adjustment |
— | — | (204 | ) | — | ||||||||||||||
| Comprehensive income |
— | — | — | — | 13,958 | ||||||||||||||
| Balances, December 31, 2009 |
95,854 | $ | 415,267 | $ | 38,503 | $ | (193,643 | ) | $ | 260,127 | |||||||||
The accompanying notes are an integral part of these consolidated financial statements.
72
Table of Contents
SILICON STORAGE TECHNOLOGY, INC. AND SUBSIDIARIES
CONSOLIDATED STATEMENTS OF CASH FLOWS
(in thousands)
| Twelve Months Ended December 31, |
||||||||||||
| 2007 | 2008 | 2009 | ||||||||||
| Cash flows from operating activities: |
||||||||||||
| Net loss |
$ | (48,957 | ) | $ | (39,815 | ) | $ | (10,237 | ) | |||
| Adjustments to reconcile net loss to net cash provided by operating activities: |
||||||||||||
| Depreciation and amortization |
11,302 | 10,595 | 8,648 | |||||||||
| Share-based compensation expense |
5,291 | 4,654 | 2,541 | |||||||||
| Write-down of inventories and provision for adverse purchase commitments |
8,473 | 14,181 | 11,427 | |||||||||
| Pro rata share of loss from equity investments |
7,035 | 9,145 | 1,280 | |||||||||
| Impairment loss on equity investment |
22,400 | 21,598 | 485 | |||||||||
| Impairment loss on goodwill, intangible assets, property and equipment |
18,961 | 1,096 | — | |||||||||
| Gain on sale or exchange of equity investments |
(159 | ) | — | (1,811 | ) | |||||||
| Other |
(509 | ) | 789 | 147 | ||||||||
| Changes in operating assets and liabilities: |
||||||||||||
| Trade accounts receivable—unrelated parties |
804 | 9,401 | (2,087 | ) | ||||||||
| Trade accounts receivable—related parties |
8,572 | 26,255 | (15,371 | ) | ||||||||
| Inventories |
15,222 | (17,065 | ) | 7,269 | ||||||||
| Other current and non-current assets |
3,595 | 1,811 | 125 | |||||||||
| Trade accounts payable—unrelated parties |
(7,690 | ) | (10,504 | ) | 4,350 | |||||||
| Trade accounts payable—related parties |
(17,900 | ) | (12,418 | ) | 4,742 | |||||||
| Accrued expenses and other liabilities |
5,109 | (6,777 | ) | (2,453 | ) | |||||||
| Deferred revenue |
(386 | ) | 837 | 431 | ||||||||
| Net cash provided by operating activities |
31,163 | 13,783 | 9,486 | |||||||||
| Cash flows from investing activities: |
||||||||||||
| Investments in equity securities |
(12,950 | ) | — | (439 | ) | |||||||
| Purchase of property and equipment |
(6,360 | ) | (8,320 | ) | (1,110 | ) | ||||||
| Purchases of available-for-sale investments |
(95,660 | ) | (120,438 | ) | (74,808 | ) | ||||||
| Investments in notes receivable |
(500 | ) | (533 | ) | (1,500 | ) | ||||||
| Purchase of intellectual property license |
(1,585 | ) | (139 | ) | — | |||||||
| Maturities of available-for-sale investments |
99,460 | 84,080 | 108,251 | |||||||||
| Sales of available-for-sale and equity investments |
— | — | 1,586 | |||||||||
| Other |
— | 88 | 379 | |||||||||
| Net cash provided by (used in) investing activities |
(17,595 | ) | (45,262 | ) | 32,359 | |||||||
| Cash flows from financing activities: |
||||||||||||
| Borrowing against line of credit |
3,549 | — | — | |||||||||
| Payments on line of credit |
— | (6,943 | ) | — | ||||||||
| Issuance of shares of common stock |
1,237 | 1,107 | 583 | |||||||||
| Repurchases of shares of common stock |
— | (28,922 | ) | — | ||||||||
| Principal payments of capital leases |
(1,387 | ) | (1,193 | ) | (1,000 | ) | ||||||
| Net cash provided by (used in) financing activities |
3,399 | (35,951 | ) | (417 | ) | |||||||
| Effect of changes in foreign currency exchange rates on cash |
217 | 153 | (9 | ) | ||||||||
| Net increase (decrease) in cash and cash equivalents |
17,184 | (67,277 | ) | 41,419 | ||||||||
| Cash and cash equivalents at beginning of period |
100,973 | 118,157 | 50,880 | |||||||||
| Cash and cash equivalents at end of period |
$ | 118,157 | $ | 50,880 | $ | 92,299 | ||||||
| Supplemental disclosure of cash flow information: |
||||||||||||
| Cash received for interest |
$ | 5,924 | $ | 3,453 | $ | 2,207 | ||||||
| Cash paid for interest |
$ | 161 | $ | 140 | $ | 19 | ||||||
| Net cash paid for (received from) income taxes |
$ | 365 | $ | (8,281 | ) | $ | (7 | ) | ||||
| Fixed assets acquired under capital leases |
$ | 684 | $ | 140 | $ | 1,888 | ||||||
| Non-cash transactions: |
||||||||||||
| Acquisition of equity securities by granting technology license |
$ | — | $ | — | $ | 9,699 | ||||||
The accompanying notes are an integral part of these consolidated financial statements.
73
Table of Contents
SILICON STORAGE TECHNOLOGY, INC. AND SUBSIDIARIES
NOTES TO THE CONSOLIDATED FINANCIAL STATEMENTS
1. Nature of Operations and Summary of Significant Accounting Policies
Nature of Operations
Silicon Storage Technology, Inc. (SST, us or we) is a supplier of flash memory semiconductor devices for the digital consumer, networking, wireless communications and Internet computing markets. Flash memory is a form of nonvolatile memory that allows electronic systems to retain information when the system is turned off. We also produce and sell other semiconductor products including NAND Controller and NAND Controller-based modules, flash microcontrollers and radio frequency ICs and modules. We license our SuperFlash technology to other companies for non-competing applications. Our products are used in personal computers, personal computer peripheral devices, consumer electronics and communications devices. Our products are sold to manufacturers located primarily in Asia.
Use of Estimates in Preparation of the Financial Statements
The preparation of financial statements in conformity with accounting principles generally accepted in the United States of America requires us to make estimates and assumptions that affect the reported amounts of assets and liabilities and the disclosure of contingent assets and liabilities at the date of the financial statements and the reported amounts of revenues and expenses during the reporting period. Actual results could differ from those estimates.
Risks, Uncertainties and Concentrations
Our sales are concentrated in the nonvolatile memory class of the semiconductor memory industry, which is highly competitive and rapidly changing. Significant technological changes in the industry, changes in customer requirements, changes in product costs and selling prices, and the emergence of competitor products with new features, capabilities, or technologies could adversely affect our operating results. We currently buy all semiconductor wafers and die from outside suppliers and we are dependent on third party subcontractors to assemble and test our products. Failure by these suppliers to satisfy our requirements on a timely basis, at competitive prices and in sufficient quantities could cause us to suffer manufacturing delays, possible loss of revenues, or higher than anticipated costs of revenues, any of which could have a severe adverse affect on our operating results.
We out-source our customer service logistics function in Asia to Silicon Professional Technology Ltd., or SPT, which supports our customers in Taiwan, China and other Southeast Asian countries. We ship our products to SPT who in turn ships our products on to end customers and sales representatives. SPT provides forecasting, planning, warehousing, delivery, billing, collection and other logistic functions for us in these regions. SPT is a wholly-owned subsidiary of one of our stocking representatives in Taiwan, Professional Computer Technology Limited, or PCT. Products shipped to SPT are accounted for as our inventory held at our logistics center, and revenue is recognized when the products have been delivered and are considered sold to our end customers by SPT. For the years ended December 31, 2007, 2008 and 2009, SPT serviced end customer sales accounting for 60.1%, 56.2% and 59.5%, respectively, of our recognized net product revenues. As of December 31, 2008 and 2009 SPT represented 50.9% and 66.1% of our net accounts receivable, respectively. See Note 14 “Related Party Reporting” and Note 15 “Investments” for a description of our relationships with PCT and SPT.
We ship products to, and have accounts receivable from, original equipment manufacturers or OEMs; original design manufacturers or ODMs; and contract electronic manufacturers or CEMs. In addition, we ship products to, and have accounts receivable from, our stocking representatives, distributors and our logistics center. Our stocking representatives, distributors and our logistics center in turn reship our products to our end customers, including OEMs, ODMs, CEMs and end users. Shipments, by us or our logistic center, to our top
74
Table of Contents
three stocking representatives for reshipment accounted for 60.0%, 54.6% and 58.9% of our product shipments in 2007, 2008 and 2009, respectively. In addition, the same three stocking representatives solicited sales, for which they received a commission, for 9.1%, 7.0% and 1.2% of our product revenue to end users in 2007, 2008 and 2009, respectively. Our stocking representatives and distributors could discontinue their relationship with us or discontinue selling our products at any time. The loss of our relationship with any of our stocking representatives or distributors could adversely affect our operating results by impairing our ability to sell our products to our end customers. Our logistics center, SPT, may cease providing services to us at any time. If SPT were to terminate their logistics relationship with us we would experience a delay in re-establishing warehousing, logistics and distribution functions, which could adversely affect our operating results. If SPT or PCT were to terminate their sales representative relationship with us it could impair our revenue significantly and affect our ability to collect accounts receivable from SPT or PCT and may adversely affect our operating results as would the termination of any of our top three stocking representatives.
We derived 88.8%, 87.3% and 91.7% of our net product revenues from Asia during 2007, 2008 and 2009, respectively. In addition, substantially all of our wafer suppliers and packaging and testing subcontractors are located in Asia. Any kind of economic, political or environmental instability in this region of the world can have a severe negative impact on our operating results due to the large concentration of our production and sales activities in this region.
Our revenues may be impacted by our ability to obtain adequate wafer supplies from our foundries. We outsource substantially all of our manufacturing and testing activities. We currently buy all of our wafers and sorted die from a limited number of suppliers. The majority of our products are manufactured by four foundries, Shanghai Grace Semiconductor Manufacturing Corporation, or Grace, and Shanghai Hua Hong NEC Electronic Company Limited, or HHNEC, in China, Taiwan Semiconductor Manufacturing Company, Limited, or TSMC, in Taiwan, and Maxchip Electronics Corporation, or Maxchip, in Taiwan. We have an equity investment in Grace Semiconductor Manufacturing Corporation, or GSMC, a Cayman Islands company, which owns the wafer foundry subsidiary, Grace in Shanghai, China. We anticipate that these foundries, together with Samsung Corporation in Korea and Powerchip Semiconductor Corporation, or PSC, in Taiwan will continue to manufacture substantially all of our products in the foreseeable future. The foundries with which we currently have arrangements, together with any additional foundry at which capacity might be obtained, may not be willing or able to satisfy all of our manufacturing requirements on a timely basis and/or at favorable prices. In addition, we have encountered delays in qualifying new products and in ramping-up new product production and we could experience these delays in the future. We are also subject to the risks of service disruptions, raw material shortages and price increases by our foundries. Such disruptions, shortages and price increases could harm our operating results. Purchases from our top three suppliers accounted for 52.1% and 36.3% of our costs of revenues in 2008 and 2009, respectively.
We depend on independent subcontractors to assemble and test our products. Our reliance on these subcontractors involves the following significant risks:
| • | reduced control over delivery schedules and quality; |
| • | the potential lack of adequate capacity during periods of strong demand; |
| • | difficulties selecting and integrating new subcontractors; |
| • | limited warranties on products supplied to us; |
| • | potential increases in prices due to capacity shortages and other factors; and |
| • | potential misappropriation of our intellectual property. |
These risks may lead to increased costs, delayed product delivery or loss of competitive advantage, which would harm our profitability and damage customer relationships.
75
Table of Contents
It should be noted that we may be greatly impacted by the political, economic and military conditions in Taiwan and/or China. Both are continuously engaged in political disputes. Such disputes may continue and even escalate, resulting in an economic embargo, a disruption in shipping or even military hostilities. This could severely harm our business by interrupting or delaying production or shipment of our product. Any kind of activity of this nature or even rumors of such activity could severely and negatively impact our operations, revenues, operating results, and stock price.
Our corporate headquarters are located in California near major earthquake faults. In addition, some of our major suppliers and their fabs in Asia are located near fault lines. In the event of a major earthquake or other natural disaster near our headquarters, our operations could be harmed. Similarly, a major earthquake or other natural disaster, such as a typhoon, near one or more of our major suppliers could potentially disrupt the operations of those suppliers, which could then limit the supply of our products and harm our business.
Basis of Consolidation
The consolidated financial statements include the accounts of SST and our wholly-owned subsidiaries after elimination of inter-company balances and transactions.
Reclassifications
Certain amounts in prior period financial statements have been reclassified to conform to the current period presentation. These reclassifications did not change previously reported net loss, total assets or shareholders’ equity.
Foreign Currency Transactions
Monetary accounts maintained in currencies other than the United States dollar are remeasured using the foreign exchange rate at the balance sheet dates. Operational accounts and non-monetary balance sheet accounts are remeasured and recorded at the rate in effect at the date of the transactions. The effects of foreign currency remeasurement are reported in current operations. The functional currency of SST and all its subsidiaries, except SST China, is the United States dollar. The functional currency of SST China is the Chinese Yuan. The effect of foreign currency remeasurement was $0.8 million for 2008. The effect of foreign currency remeasurement was not material to our consolidated financial statements in 2007 or 2009.
Financial Instruments
Cash equivalents are highly liquid investments with stated maturities of three months or less as of the dates of purchase. Highly liquid investments included in cash equivalents are classified as available-for-sale and are carried at cost, which approximates fair value. We maintain substantially all of our cash balances with two major financial and/or brokerage institutions domiciled in the United States and we have not experienced any material losses relating to these investment instruments.
Short and long-term investments are comprised of domestic government and foreign corporate debt securities, and foreign listed equity securities. These investments are classified as available-for-sale, and carried at fair value with the unrealized gains or losses, net of tax, reported in Shareholders’ Equity as a component of accumulated other comprehensive income (loss). The cost of debt securities is adjusted for amortization of premiums and accretion of discounts to maturity, both of which are included in interest income. Realized gains and losses are recorded on the specific identification method.
The carrying amounts reported for cash and cash equivalents, accounts receivable, accounts payable and accrued expenses are considered to approximate fair values based upon the short maturities of those financial instruments. The fair value of available-for-sale investments is set forth in Note 15 “Investments.” Financial
76
Table of Contents
instruments that potentially subject us to concentrations of credit risks comprise, principally, cash, cash equivalents, investments and trade accounts receivable. We perform credit evaluations of new customers and require those without positive, established credit histories to pay in advance, upon delivery or through letters of credit. Otherwise, for customers which we do not require collateral we maintain an allowance for potential credit losses.
We have acquired interests in Japanese and Taiwanese companies and a Cayman Islands company operating in China. See Note 15 “Investments.” Some of the Taiwanese investments are held in public companies whose stock is traded on the Taiwan Stock Exchange. Under Taiwan security regulations, investors with representation on the Board of Directors of certain companies must retain a certain number of shares in central custody, which are restricted from sale. Shares to be held in central custody for greater than a one year period are carried at cost and recorded as equity investments. Shares that are unrestricted and available for sale within one year from the balance sheet date are carried at quoted market price and included in “long-term available-for-sale equity investments,” with unrealized gains and losses reported as a separate component of shareholders’ equity.
We review our investments quarterly for indicators of impairment. Investments identified as having an indicator of impairment are subject to further analysis to determine if the investment is other than temporarily impaired, in which case the investment is written down to its estimated fair market value and a new cost basis is established. If an investee obtains additional funding at a valuation lower than our carrying amount or requires a new round of equity funding to stay in operation and the new funding does not appear imminent, we presume that the investment is other than temporarily impaired, unless specific facts and circumstances indicate otherwise.
Cash dividends and other distributions of earnings from the investees, if any, are included in other income at the date of record.
Accounts Receivable
The allowance for doubtful accounts is based on an assessment of the collectibility of customer accounts receivable. We review the allowance by considering factors such as historical collection experience, credit quality, age of the accounts receivable balances, and current economic conditions that may affect a customer’s ability to pay. We maintain an allowance for estimated product returns by our customers. We estimate our allowance for sales returns based on our historical return experience, current economic trends, changes in customer demand, known returns we have not received and other estimates.
Inventories
Inventories are stated at the lower of cost (determined on a first-in, first-out basis) or market value. We typically plan our production and inventory levels based on internal forecasts of customer demand, which are highly unpredictable and can fluctuate substantially. The carrying value of our inventory is dependent on our estimate of future average selling prices, and, if our estimate of future selling prices is lower than our cost, we are required to adjust our inventory value further to reflect the lower of cost or market. Due to the large number of units in our inventory, even a small change in average selling prices could result in a significant adjustment and have a significant impact on our financial position and results of operations.
Our inventories include high technology parts and components that are specialized in nature or subject to rapid technological obsolescence. We review on-hand inventory, including inventory held at our logistic center, for potential excess and obsolete items and adjust the level of inventory reserve accordingly. For excess inventory analysis, we compare the inventory on hand with the forecasted demand. Demand is based on one year for packaged products and two years for products in die form. For the obsolete inventory analysis, we review inventory items in detail and consider date code, customer base requirements, planned or recent product revisions, end of life plans and diminished market demand. In the event that customer requirements cause us to change this methodology, it may be necessary for us to provide for an additional allowance, which could result in a significant adjustment and could harm our financial results.
77
Table of Contents
Inventories, once written down to their new basis, are not subsequently written back up. While we have programs to minimize the required inventories on hand and we consider technological obsolescence when estimating allowances for potentially excess and obsolete inventories and consider average selling price, or ASP, forecasts when estimating allowances for lower of cost or market reserves, it is reasonably possible that such estimates could change in the near term and such changes could have a significant impact on our financial position and results of operations.
Non-Marketable and Other Equity Investments
We account for non-marketable and other equity investments under either the cost or equity method and include them in long-term assets. Our non-marketable and other equity investments include:
Equity method investments. When we have the ability to exercise significant influence, but not control, over the investee, we record equity method adjustments in “Pro rata share of loss from equity investments.” Equity method adjustments include: our proportionate share of investee income or loss, gains or losses resulting from investee capital transactions, amortization of certain differences between our carrying value and our equity in the net assets of the investee at the date of investment and other adjustments required by the equity method. Equity method investments include marketable and non-marketable investments.
Non-marketable cost method investments. When we do not have the ability to exercise significant influence over the investee we record such investments at cost.
Investments in non-marketable equity securities are inherently risky, and a number of these companies may fail. Their success is dependent on product development, market acceptance, operational efficiency, and other key business success factors. In addition, depending on their future prospects and market conditions, they may not be able to raise additional funds when needed or they may receive lower valuations, with less favorable investment terms than in previous financings, and thus our investments in them may become impaired.
We review our investments quarterly for indicators of impairment. For non-marketable equity securities, the impairment analysis requires significant judgment to identify events or circumstances that would likely have a significant adverse effect on the fair value of the investment. The indicators that we use to identify those events or circumstances include (a) the investee’s revenue and earnings trends; (b) the technological feasibility of the investee’s products and technologies; (c) the general market conditions in the investee’s industry or geographic area, including adverse regulatory or economic changes; (d) factors related to the investee’s ability to remain in business, such as the investee’s liquidity, debt ratios, and the rate at which the investee is using its cash; and (e) the investee’s receipt of additional funding at a lower valuation. Investments identified as having an indicator of impairment are subject to further analysis to determine if the investment is other than temporarily impaired, in which case the investment is written down to its estimated fair market value and a new cost basis is established. If an investee obtains additional funding at a valuation lower than our carrying amount or requires a new round of equity funding to stay in operation and the new funding does not appear imminent, we presume that the investment is other than temporarily impaired, unless specific facts and circumstances indicate otherwise.
For the years ended December 31, 2007, 2008 and 2009, we recorded impairments of our investments totaling $22.4 million, $21.8 million and $0.5 million, respectively. See Note 17 “Impairment of Investments.”
Investments in Variable Interest Entities
We are required to evaluate all transactions and relationships with potential variable interest entities (VIEs) to determine whether we are the primary beneficiary of the entities. Our overall methodology for evaluating transactions and relationships under the VIE requirements includes the following two steps:
| • | determine whether the entity meets the criteria to qualify as a VIE; and |
| • | determine whether we are the primary beneficiary of the VIE. |
78
Table of Contents
In performing the first step, the significant factors and judgments that we consider in making the determination as to whether an entity is a VIE include:
| • | the design of the entity, including the nature of is risks and the purpose for which the entity was created, to determine the variability that the entity was designed to create and distribute to its interest holders; |
| • | the nature of our involvement with the entity; |
| • | whether control of the entity may be achieved through arrangements that do not involve voting equity; |
| • | whether there is sufficient equity investment at risk to finance the activities of the entity; and |
| • | whether parties other than the equity holders have the obligation to absorb expected losses or the right to receive residual returns. |
For each VIE identified, we then perform the second step and evaluate whether we are the primary beneficiary of the VIE by considering the following significant factors and judgments:
| • | whether our variable interest absorbs the majority of the VIE’s expected losses; |
| • | whether our variable interest receives the majority of the VIE’s expected returns; and |
| • | whether we have the ability to make decisions that significantly affect the VIE’s results and activities. |
Based on our evaluation of the above factors and judgments, as of December 31, 2009, GSMC is a VIE, of which we are not the primary beneficiary. During 2009, we disposed of an investment in ACET, which had been identified as a VIE, of which we were not the primary beneficiary. There have been no other material changes in the status of our VIE or primary beneficiary designations during 2009. For additional information on our related parties and equity investments, see Note 14 “Related Party Reporting,” Note 15 “Investments” and Note 16 “Pro Rata Share of Loss from Equity Investments.”
Property and Equipment
Property and equipment are stated at cost and depreciated using the straight-line method over their estimated useful lives of three to seven years, except for buildings for which the useful life is forty years. Leasehold improvements are depreciated over seven years or the term of the lease, whichever is shorter. See also Note 3 “Balance Sheet Detail.” Upon sale or retirement of assets, the costs and related accumulated depreciation and amortization are removed from the Balance Sheet and the resulting gain or loss is recorded in operations. Maintenance and repairs are charged to operations as incurred.
Goodwill
We review goodwill annually for impairment or when changes in circumstances indicate that the carrying amount of these assets many not be recoverable. We write down goodwill when we deem it is impaired. We perform an impairment analysis during the fourth quarter of each fiscal year.
We evaluate whether goodwill has been impaired at the reporting unit level by first determining whether the estimated fair value of the reporting unit is less than its carrying value and, if so, by determining whether the implied fair value of goodwill within the reporting unit is less than the carrying value. We determine fair values using discounted future cash flow analyses. As a result of our impairment analysis in the fourth quarter of 2007, we recorded an impairment charge related to the goodwill initially recognized as a result of the acquisitions of G-Plus and Actrans. We did not record any impairment charge related to goodwill in 2008 and 2009. See also Note 7 “Goodwill and Intangible Assets.”
79
Table of Contents
Long-Lived Assets
Long-lived assets consist primarily of property and equipment and intangible assets. Purchased intangible assets, other than goodwill, are carried at cost less accumulated amortization. Amortization is computed using the straight-line method over the estimated useful lives of one to five years. Whenever events or changes in circumstances indicate that the carrying amounts of long-lived assets may not be recoverable, we estimate the future cash flows, undiscounted and without interest charges, expected to result from the use of those assets and their eventual disposition. If the sum of the undiscounted expected future cash flows is less than the carrying amount of those assets, we recognize an impairment loss based on the excess of the carrying amount over the fair value of the assets. We perform an impairment analysis during the fourth quarter of each fiscal year. In 2007, we recorded an impairment loss of $0.4 million on intangible assets acquired from our acquisition of G-Plus. In 2008, we recorded a $1.1 million charge to research and development to write off various intellectual property licenses.
Product Revenue Recognition
Sales to direct customers and foreign stocking representatives are recognized net of an allowance for estimated returns. When product is shipped to direct customers or stocking representatives or by our distributors or SPT to end users, prior to recognizing revenue, we require that evidence of the arrangement exists, the price is fixed or determinable and collection of the resulting receivable is reasonably assured. Sales to distributors are made primarily under arrangements allowing price protection and the right of stock rotation on unsold merchandise. Because of the uncertainty associated with pricing concessions and future returns, we defer recognition of such revenues, related costs of revenues and related gross profit until the merchandise is sold by the distributor. Products shipped to SPT are accounted for as our inventory held at our logistics center and revenue is recognized when the products have been delivered and are considered sold to our end customers by SPT. Deferred cost of revenue is in included in Other current assets on our consolidated balance sheets.
License and Royalty Revenue Recognition
For license and other arrangements for technology that we are continuing to enhance and refine and under which we are obligated to provide unspecified enhancements, revenue is recognized over the lesser of the estimated period that we have historically enhanced and developed refinements to the technology, approximately two to three years (the upgrade period), or the remaining portion of the upgrade period from the date of delivery, provided all specified technology and documentation has been delivered, the price is fixed or determinable and collection is reasonably assured. From time to time, we re-examine the estimated upgrade period relating to licensed technology to determine if a change in the estimated upgrade period is needed. Revenue from license or other technology arrangements where we are not continuing to enhance and refine technology or are not obligated to provide unspecified enhancements is recognized upon delivery, if the price is fixed or determinable and collection is reasonably assured.
Royalties received under these arrangements during the upgrade period are recognized as revenue based on the ratio of the elapsed portion of the upgrade period to the estimated upgrade period. The remaining portions of the royalties are recognized ratably over the remaining portion of the upgrade period. Royalties received after the upgrade period has elapsed are recognized when reported to us, which generally occurs one quarter in arrears and coincides with the receipt of payment.
Research and Development
We charge research and development expenses to operations as incurred.
Advertising Costs
We expense all advertising costs as incurred. Advertising costs were not material for the years ended December 31, 2007, 2008 and 2009.
80
Table of Contents
Provision for Income Taxes
We maintained a full valuation allowance on our net deferred tax assets as of December 31, 2009. Determination of the valuation allowance requires an assessment of both positive and negative evidence when determining whether it is more likely than not that deferred tax assets are recoverable and such assessment is required on a jurisdiction by jurisdiction basis. Based upon the weight of available evidence, which includes our historical operating performance, reported cumulative net losses since inception and difficulty in accurately forecasting our results, we provided a full valuation allowance against our net deferred tax assets. We intend to maintain a full valuation allowance on the U.S. deferred tax assets until sufficient positive evidence exists to support reversal of the valuation allowance.
We periodically receive dividend payments from our investments in foreign companies, which are subject to withholding of income tax. We record these taxes, as well as any refunds of these taxes, on a cash basis. The adjustment resulting from re-measurement of foreign currency tax liabilities is included in income tax provision or benefit. We recognize interest and penalties related to uncertain tax positions in income tax provision or benefit. To the extent accrued interest and penalties do not ultimately become payable, amounts accrued will be reduced and reflected as a reduction of the overall income tax provision in the period that such determination is made.
In July 2006, the Financial Accounting Standards Board, or FASB, issued guidance which clarifies the accounting for income taxes by prescribing a recognition threshold and measurement attribute for the financial statement recognition and measurement of uncertain tax positions taken or expected to be taken in a company’s income tax return. This guidance utilizes a two-step approach for evaluating uncertain tax positions: step one, recognition, requires a company to determine if the weight of available evidence indicates that a tax position is more likely than not to be sustained upon audit, including resolution of related appeals or litigation processes, if any; and step two, measurement, is based on the largest amount of benefit, which is more likely than not to be realized on ultimate settlement.
Share-based Compensation
We measure compensation expense based on estimated fair values of all share-based awards to our employees and directors. We estimate the fair value of stock options on the date of grant using the Black-Scholes option valuation model and elected to attribute the value of share-based compensation to expense using the graded vesting method. Share-based compensation expense is recognized based on the value of the portion of share-based payment awards that is ultimately expected to vest. Compensation cost recognized includes the applicable amounts of compensation cost of all share-based awards granted prior to January 1, 2006 and compensation cost for all share-based awards granted or modified subsequent to January 1, 2006, based on the grant-date fair value. We estimate expected volatility based on the historical volatility of our common stock. We believe that our historical stock option exercise data is not an accurate predictor of future exercise transactions. For periods ending on or before June 30, 2009, we used the simplified method of calculating expected term for new grants. Beginning with the third quarter of 2009, in estimating the expected term, we utilize data from selected semiconductor companies, which we have concluded are similar with regard to market capitalization, stock option contractual term and vesting schedules. We intend to continue to use a similar methodology until we determine that our historical stock option exercise data is expected to more accurately predict future exercise transactions.
Comprehensive Income (Loss)
Comprehensive income (loss) is defined as the change in equity of a business enterprise during a period from transactions and other events and circumstances from non-owner sources. Other comprehensive income (loss) includes unrealized gains and losses on available-for-sale investments, net of tax, and cumulative translation adjustments. Total comprehensive income (loss) is presented in the consolidated statements of shareholders’ equity and comprehensive loss.
81
Table of Contents
Recent Accounting Pronouncements
In October 2009, the FASB issued guidance addressing the accounting for multiple-deliverable arrangements to enable vendors to account for products or services separately rather than as a combined unit. The guidance amends the criteria for separating consideration in multiple-deliverable arrangements. This guidance replaces all references to fair value as a measurement criteria with the a selling price hierarchy for determining the selling price of a deliverable, which is based on: (a) vendor-specific objective evidence; (b) third-party evidence; or (c) estimates. This guidance eliminates the residual method of allocation and requires that arrangement consideration be allocated at the inception of the arrangement to all deliverables using the relative selling price method. In addition, this guidance significantly expands required disclosures. The guidance is effective prospectively for revenue arrangements entered into or materially modified in fiscal years beginning on or after June 15, 2010. Early adoption is permitted. We are currently evaluating this guidance to determine its impact, if any, on our consolidated financial statements.
In December 2009, the FASB issued guidance that changes how a reporting entity determines when an entity that is insufficiently capitalized, or is not controlled through voting or similar rights, should be consolidated. The determination of whether a reporting entity is required to consolidate another entity is based on, among other things, (1) the other entity’s purpose and design and (2) the reporting entity’s ability to direct the activities of the other entity that most significantly impact the other entity’s economic performance. The guidance also requires a reporting entity to provide additional disclosures, including how its involvement with a variable interest entity affects the reporting entity’s financial statements. This guidance is effective at the start of the first fiscal year beginning after November 15, 2009 and early application is not permitted. We are currently evaluating the impact of this guidance on our consolidated financial statements.
In January 2010, the FASB issued guidance amending and clarifying requirements for fair value measurements and disclosures. The new guidance requires disclosure of transfers in and out of Level 1 and Level 2 and a reconciliation of all activity in Level 3. The guidance also requires detailed disaggregation disclosure for each class of assets and liabilities in all levels, and disclosures about inputs and valuation techniques for Level 2 and Level 3. The guidance is effective at the start of interim or annual reporting periods beginning after December 15, 2009 and the disclosure reconciliation of all activity in Level 3 is effective at the start of annual reporting periods beginning after December 15, 2010. We do not currently anticipate that this guidance will have a material impact on our consolidated financial statements upon adoption.
2. Fair Value
Fair value is defined as the exchange price that would be received for an asset or paid to transfer a liability (an exit price) in the principal or most advantageous market for the asset or liability in an orderly transaction between market participants on the measurement date. Valuation techniques used to measure fair value must maximize the use of observable inputs and minimize the use of unobservable inputs. The fair value hierarchy is based on three levels of inputs, of which the first two are considered observable and the last unobservable, that may be used to measure fair value, which are the following:
| • | Level 1—Quoted prices in active markets for identical assets or liabilities. |
| • | Level 2—Inputs other than Level 1 that are observable, either directly or indirectly, such as quoted prices for similar assets or liabilities; quoted prices in markets that are not active; or other inputs that are observable or can be corroborated by observable market data for substantially the full term of the assets or liabilities. |
| • | Level 3—Unobservable inputs that are supported by little or no market activity and that are significant to the fair value of the assets or liabilities. |
82
Table of Contents
Recurring Fair Value Measurements
Cash Equivalents. The fair values of cash equivalents are based on observable market prices and have been categorized in Level 1 in the fair value hierarchy. Cash equivalents consist primarily of money market funds.
Available-for-sale investments
| • | Bonds and notes—The fair values of debt securities, such as municipal, United States government and foreign obligations are categorized in Level 2 of the fair value hierarchy. The fair values are based on the quoted market prices in less active markets and are based on evaluated prices that reflect observable market information, such as actual trade information of similar securities, broker or dealer quotations or alternative pricing sources with reasonable levels of price transparency. |
| • | Marketable equity securities—The fair values of marketable equity securities are categorized in Level 1 of the fair value hierarchy. The fair values are based on quoted prices in active markets which are primarily traded on the New York Stock Exchange, NASDAQ, and the Taiwan Stock Exchange. |
The following table represents the fair value hierarchy for our assets (cash equivalents and available-for-sale investments) measured at fair value on a recurring basis (in thousands):
| December 31, 2009 | ||||||||||||
| Description |
Level 1 | Level 2 | Level 3 | Total | ||||||||
| Money market funds |
$ | 41,639 | $ | — | $ | — | $ | 41,639 | ||||
| Government agency obligations |
— | 50,674 | — | 50,674 | ||||||||
| Foreign corporate obligations |
— | 3,700 | — | 3,700 | ||||||||
| Foreign listed equity securities |
40,619 | — | — | 40,619 | ||||||||
| Total |
$ | 82,258 | $ | 54,374 | $ | — | $ | 136,632 | ||||
| December 31, 2008 | ||||||||||||
| Description |
Level 1 | Level 2 | Level 3 | Total | ||||||||
| Money market funds |
$ | 10,721 | $ | — | $ | — | $ | 10,721 | ||||
| Corporate bonds and notes |
— | 5,939 | — | 5,939 | ||||||||
| Government agency obligations |
— | 74,906 | — | 74,906 | ||||||||
| Foreign listed equity securities |
18,196 | — | — | 18,196 | ||||||||
| Total |
$ | 28,917 | $ | 80,845 | $ | — | $ | 109,762 | ||||
We have no liabilities or non-financial assets measured at fair value on a recurring basis as of December 31, 2008 and 2009.
Non-recurring Fair Value Measurements
Non-marketable equity securities. The fair values of non-marketable equity securities are categorized in Level 3 in the fair value hierarchy. The fair values of these securities are based on a quarterly review using impairment indicators including (a) the investee’s revenue and earnings trends, (b) the technological feasibility of the investee’s products and technologies, (c) the general market conditions in the investee’s industry or geographic area including adverse regulatory or economic changes, (d) factors related to the investee’s ability to remain in business, such as the investee’s liquidity, debt ratios, and the rate at which the investee is using its cash, and (e) the investee’s receipt of additional funding at a lower valuation. If a review indicates the security is other than temporarily impaired, the non-marketable equity security investment is written down to its impaired value.
83
Table of Contents
The following table represents the fair value hierarchy for our assets measured at fair value on a non-recurring basis during 2009 (in thousands):
| Description |
Level 1 | Level 2 | Level 3 | Total | ||||||||
| Equity investment in GSMC |
$ | — | $ | — | $ | 11,021 | $ | 11,021 | ||||
We measured our equity investment in GSMC at fair value in connection with an impairment we recorded in the second quarter of 2009. For further discussion of the reasons for the fair value measurement and the methodologies used to determine the fair value of our investment in GSMC, see Note 17 “Impairment of Investments.”
3. Balance Sheet Detail
Trade accounts receivable (in thousands):
| December 31, | ||||||||
| 2008 | 2009 | |||||||
| Trade accounts receivable, including related parties |
$ | 20,699 | $ | 37,975 | ||||
| Allowance for sales returns |
(503 | ) | (303 | ) | ||||
| Allowance for doubtful accounts |
(79 | ) | (12 | ) | ||||
| $ | 20,117 | $ | 37,660 | |||||
Inventories (in thousands):
| December 31, | ||||||
| 2008 | 2009 | |||||
| Raw materials |
$ | 35,688 | $ | 16,400 | ||
| Work in-process |
2,869 | 9,014 | ||||
| Finished goods |
13,499 | 8,088 | ||||
| Finished goods inventories held at logistics center |
2,103 | 3,379 | ||||
| $ | 54,159 | $ | 36,881 | |||
During 2009, inventory which was written down in a prior year was sold for an amount that recovered $5.7 million of the prior period write-downs. Further, during the year we provided new or increased inventory reserves of approximately $9.9 million on other unsold products in inventory. As of December 31, 2009, we had accrued approximately $2.6 million as non-cancelable, adverse purchase order commitments.
During 2008, inventory which was written down in a prior year was sold for an amount that recovered $7.2 million of the prior period write-downs. Further, during the year we provided new or increased inventory reserves of approximately $13.2 million on other unsold products in inventory. As of December 31, 2008, we had accrued approximately $1.1 million as non-cancelable, adverse purchase order commitments.
84
Table of Contents
Property and equipment (in thousands):
| December 31, | Estimated Useful Lives | |||||||||
| 2008 | 2009 | |||||||||
| Land |
$ | 959 | $ | — | ||||||
| Buildings |
5,154 | 3,622 | Forty years | |||||||
| Equipment |
20,448 | 18,370 | Four years | |||||||
| Computer and design hardware |
22,481 | 22,095 | Three years | |||||||
| Software |
18,672 | 17,131 | Three years | |||||||
| Vehicles |
47 | 47 | Five years | |||||||
| Furniture and fixtures |
2,176 | 2,162 | Seven years | |||||||
| Leasehold improvements |
9,180 | 8,578 | (1) | |||||||
| 79,117 | 72,005 | (2) | ||||||||
| Less accumulated depreciation |
(60,340 | ) | (59,968 | ) | (3) | |||||
| 18,777 | 12,037 | |||||||||
| Construction in progress |
136 | 14 | ||||||||
| $ | 18,913 | $ | 12,051 | |||||||
| (1) | Seven years or remaining lease term, whichever is less. |
| (2) | Includes assets financed through capital lease of $3,217 and $3,061 at December 31, 2008 and December 31, 2009, respectively. As of December 31, 2008 and 2009 nearly all capitalized leases are for software. |
| (3) | Includes accumulated depreciation on assets financed through capital lease of $2,112 and $1,146 at December 31, 2008 and December 31, 2009, respectively. |
Depreciation expense was $7.8 million, $7.8 million and $6.9 million including depreciation on capitalized leases of $1.3 million, $1.0 million and $1.0 million for 2007, 2008 and 2009, respectively.
During 2007, the market price of our common stock declined to the point where our net assets exceeded our total market capitalization. Accordingly, we reviewed the carrying value of our long-lived assets and determined that estimated future cash flows were insufficient to recover the carrying value of certain long-lived assets. As a result, we recorded impairment charges of $0.6 million to property and equipment and $0.4 million to intangible assets in order to write down these assets to their estimated fair market value. There were similar declines in the market price of our common stock in 2008 and 2009, and the carrying value of our net assets exceeded our total market capitalization at December 31, 2008 and 2009. We reviewed the carrying value of our long-lived assets and concluded that either the estimated future cash flows were sufficient for recovery, or that the fair market value of the underlying assets exceeded the carrying value. Therefore, we did not record any impairment to long-lived assets in 2008 or 2009 based on this review. In 2008 we recorded a $1.1 million charge to research and development to write off various intellectual property licenses.
Assets held for sale:
We own an approximately 20,000 square foot facility in Sunnyvale, California, which we vacated in January 2009 as part of our restructuring plan to reduce expenses. This facility is currently held for sale, carried at $2.4 million, and included in Other assets on our consolidated Balance Sheets at December 31, 2009.
85
Table of Contents
Accrued liabilities (in thousands):
| December 31, | ||||||
| 2008 | 2009 | |||||
| Accrued compensation and related items |
$ | 5,253 | $ | 4,390 | ||
| Accrued adverse purchase commitments |
1,092 | 2,647 | ||||
| Accrued commission |
1,021 | 1,153 | ||||
| Accrued taxes payable |
540 | 540 | ||||
| Accrued warranty |
176 | 43 | ||||
| Accrued restructuring charge |
2,338 | — | ||||
| Other accrued liabilities |
3,780 | 3,442 | ||||
| $ | 14,200 | $ | 12,215 | |||
Accrued warranty (in thousands):
| December 31, | ||||||||
| 2008 | 2009 | |||||||
| Beginning balance |
$ | 358 | $ | 176 | ||||
| Provisions for warranty |
526 | — | ||||||
| Warranty returns |
(389 | ) | (89 | ) | ||||
| Re-screening, re-testing and other settlements |
(319 | ) | (44 | ) | ||||
| Ending balance |
$ | 176 | $ | 43 | ||||
Our products are generally subject to warranty and we provide for the estimated future costs of repair, replacement or customer accommodation upon shipment of the product in the accompanying statements of operations. Our warranty accrual is estimated based on historical claims compared to historical revenues and assumes that we have to replace products subject to a claim.
4. Commitments
As of December 31, 2009, we had outstanding purchase commitments with our foundry vendors of $22.7 million for delivery in 2010. We have recorded a liability of $2.6 million for related adverse purchase commitments.
We lease our corporate facilities under non-cancelable operating leases that expire in 2010 through 2027. The leases require escalating monthly payments over their terms, however, periodic rent expense is being recognized on a straight-line basis. Under the terms of the leases, we are responsible for certain operating costs, including real estate property taxes, utilities and other costs. Rent expense was $3.9 million, $4.2 million and $4.1 million in 2007, 2008 and 2009, respectively. Capital leases generally consist of software and are recorded in property and equipment.
86
Table of Contents
Future minimum lease payments at December 31, 2009 are as follows (in thousands):
| Year ending December 31, |
Capital Lease |
Operating Lease | |||||
| 2010 |
$ | 831 | $ | 2,057 | |||
| 2011 |
664 | 545 | |||||
| 2012 |
467 | 330 | |||||
| 2013 |
— | 110 | |||||
| 2014 |
— | 46 | |||||
| Thereafter |
— | 598 | |||||
| $ | 1,962 | $ | 3,686 | ||||
| Less: Imputed interest |
(56 | ) | |||||
| Present value of minimum lease payments |
1,906 | ||||||
| Less: current portion, included in Accrued expenses and other liabilities |
(796 | ) | |||||
| Noncurrent portion, included in Other liabilities |
$ | 1,110 | |||||
5. Contingencies
Litigation
On July 13, 2006, a shareholder derivative complaint was filed in the United States District Court for the Northern District of California (the “Federal Court”) by Mike Brien under the caption Brien v. Yeh, et al., Case No. C06-04310 JF. On July 18, 2006, a second shareholder derivative complaint was filed in the Federal Court by Behrad Bazargani under the caption Bazargani v. Yeh, et al., Case No. C06-04388 HRL. Both complaints were brought purportedly on behalf of SST against certain of our current and former officers and directors and allege among other things, that the named officers and directors breached their fiduciary duties as they colluded with each other to backdate stock options; violated Rule 10b-5 of the Securities Exchange Act of 1934; and were unjustly enriched by their receipt and retention of such stock options. The Brien and Bazargani cases were consolidated into one case: In re Silicon Storage Technology, Inc. Derivative Litigation, Case No. C06-04310 JF (“Federal Derivative Litigation”) and plaintiffs filed a consolidated amended shareholder derivative complaint on October 30, 2006. The parties initiated settlement discussions and filed several stipulations to extend the defendants’ deadline to respond to the consolidated amended shareholder derivative complaint, which the Federal Court granted. On March 15, 2007, we announced that the Chair of our Audit Committee, with the assistance of independent outside counsel and outside accounting experts, would be conducting a voluntary review of our historical stock option grant practices covering the time from our initial public offering in 1995 through the current fiscal year. On April 27, 2007, the Federal Court granted the parties’ stipulation staying this action until after SST publicly announced the results of the investigation into the historical stock option grant practices. On January 16, 2008, SST filed our Annual Report on Form 10-K for the year ended December 31, 2006, containing the results of such investigation. Plaintiffs in the Federal Derivative Litigation filed an amended complaint on May 9, 2008. Defendants filed a motion to dismiss on October 17, 2008, and the motion was heard on April 24, 2009. On July 7, 2009, the Federal Court granted defendants’ motion and dismissed the federal securities claims with leave to amend. Federal plaintiffs filed a third amended complaint on August 21, 2009. The newest complaint asserted state-law fiduciary duty claims based on diversity jurisdiction; no federal securities claims were alleged. On September 24, 2009, defendants moved to dismiss the third amended complaint with prejudice. Following the filing of this motion, the parties in the Federal Derivative Litigation, together with the parties in the related state court derivative litigation discussed below, reached a tentative agreement to settle all of these matters. On or about February 1, 2010, the parties in all of these matters entered into a stipulation and agreement of settlement and submitted the same to the Federal Court. Among other things, the settlement provides for the dismissal with prejudice and release of all claims alleged in the Federal Derivative Litigation and related state court derivative litigation (discussed below), implementation of certain corporate governance reforms by SST,
87
Table of Contents
and the payment of attorneys fees and costs to plaintiffs’ counsel in an amount not to exceed $2,810,000, subject to Federal Court approval, of which SST has agreed to pay $680,000 and SST’s insurers have agreed to pay $2,130,000. Our estimated liability of $680,000, which was accrued during the quarter ended September 30, 2009, is included in Accrued expenses and other liabilities on our consolidated Balance Sheets at December 31, 2009. On February 5, 2010, the Federal Court held a hearing at which it granted preliminary approval of the settlement, ordered that notice of the settlement be provided to SST’s shareholders, and set a final approval hearing for April 9, 2010.
On October 31, 2006, a similar shareholder derivative complaint was filed in the Superior Court of the State of California for the County of Santa Clara by Alex Chuzhoy under the caption Chuzhoy v. Yeh, et al., Case No. 1-06-CV-074026. This complaint was brought purportedly on behalf of SST against certain current and former officers and directors and alleges among other things, that the named officers and directors breached their fiduciary duties as they colluded with each other to backdate stock options and were allegedly unjustly enriched by their actions. The Chuzhoy complaint also alleges that certain defendants violated section 25402 of the California Corporations Code by selling shares of our common stock while in possession of material non-public adverse information. The parties initiated settlement discussions and filed several stipulations to extend defendants’ deadline to respond to the shareholder derivative complaint, which the court granted. On April 13, 2007, the court granted the parties’ stipulation staying this action until after we publicly announced the results of the investigation into the historical stock option grant practices. On January 16, 2008, we filed our Annual Report on Form 10-K for the year ended December 31, 2006, containing the results of such investigation. On January 25, 2008, the court and parties in the Chuzhoy matter agreed to postpone the filing of the amended complaint pending settlement discussions. As discussed above, the stipulation of settlement in the Federal Derivative Litigation, if approved, would result in the dismissal with prejudice and release of all claims asserted in this action on the terms described above.
In January and February 2005, multiple shareholder derivative complaints were filed in California Superior Court for the County of Santa Clara, purportedly on behalf of SST against certain current and former officers and directors. The derivative complaints asserted claims for, among other things, breach of fiduciary duty and violations of the California Corporations Code. These derivative actions were consolidated under the caption In Re Silicon Storage Technology, Inc. Derivative Litigation, Lead Case No. 1:05CV034387. On April 28, 2005, the derivative action was stayed by court order. On October 19, 2007, following the dismissal with prejudice of certain federal putative class actions, the court lifted this stay. On December 6, 2007, plaintiffs filed a consolidated amended complaint reiterating some of the previous claims and asserting claims substantially identical to those contained in the Chuzhoy v. Yeh, et al., Case No. 1-06-CV-074026 and the Federal Derivative Litigation. Defendants filed a demurrer on May 12, 2008. On October 31, 2008, the court sustained the demurrer and gave plaintiffs leave to amend. As discussed above, the stipulation of settlement in the Federal Derivative Litigation, if approved, would result in the dismissal with prejudice and release of all claims asserted in this action on the terms described above.
Beginning on November 16, 2009, six purported class action lawsuits were filed in the California Superior Court for the County of Santa Clara against SST, certain of our current and former officers and directors, Technology Resources Holdings, Inc. and Prophet Equity LP, in connection with a proposed merger between Technology Resources Holdings, Inc. and SST. The lawsuits were subsequently consolidated into a single action entitled In re Silicon Storage Technology, Inc. Shareholder Litigation, No. 109CV157437, The complaints in the six lawsuits, or the original complaints, were substantially similar and alleged, among other things, that such proposed merger was the product of a flawed process; that the consideration to be paid to SST’s shareholders in connection with such proposed merger was unfair and inadequate; that our officers and directors breached their fiduciary duties by, among other things, taking actions designed to deter higher offers from other potential acquirers and failing to maximize the value of SST to our shareholders; and that Prophet Equity LP and SST aided and abetted the actions of our officers and directors in breaching their fiduciary duties. The complaints sought, among other relief, an injunction preventing consummation of the proposed merger, an order rescinding the proposed merger or any of its terms to the extent already implemented, costs and disbursements of the
88
Table of Contents
lawsuits, including attorneys’ and experts’ fees, and such other relief as the court might find just and proper. On February 9, 2010, the court entered an order consolidating the six actions and directing plaintiffs to inform the court which of the complaints filed to date should be deemed the operative complaint. On March 16, 2010, plaintiffs filed a consolidated amended complaint, or the CAC. The CAC contains similar allegations as those contained in the original complaints, now concerning alleged breaches of fiduciary duties by certain of our current officers and directors in connection with the proposed acquisition of SST by Microchip Technology Incorporated, or Microchip, and the process leading up to our Board’s decision to recommend the Microchip acquisition, and requests similar relief as the relief requested in the original complaints. The CAC no longer asserts claims against Technology Resources Holding, Inc. and Prophet Equity LP, but now asserts similar claims against Microchip and Sun Acquisition Corporation. We believe the consolidated lawsuit is without merit and plan to defend against it vigorously. Additional lawsuits pertaining to a strategic transaction involving SST could be filed in the future and if so, will likely be consolidated with the consolidated lawsuit.
From time to time, we are also involved in other legal actions arising in the ordinary course of business. We have accrued certain costs associated with defending these matters. There can be no assurance that the shareholder class action complaints, the shareholder derivative complaints or other third party assertions will be resolved without costly litigation, in a manner that is not adverse to our financial position, results of operations or cash flows or without requiring payments in the future which may adversely impact net income. We have accrued what we believe to be probable costs in connection with the potential settlement of the shareholder class action complaints and the shareholder derivative complaints.
Indemnifications
Our technology license agreements generally include an indemnification clause that indemnifies the licensee against liability and damages (including legal defense costs) arising from any claims of patent, copyright, trademark or trade secret infringement by our proprietary technology. The terms of these guarantees approximate the terms of the technology license agreements, which typically range from five to ten years. Our current license agreements expire from 2010 through 2016. The maximum possible amount of future payments we could be required to make, if such indemnifications were required on all of these agreements, is $63.6 million. We have not recorded any liabilities as of December 31, 2009.
During our normal course of business, we have made certain indemnities, commitments and guarantees under which we may be required to make payments in relation to certain transactions. These include indemnities to various lessors in connection with facility leases for certain claims arising from such facility or lease and indemnities to our directors and officers to the maximum extent permitted under the laws of California. In addition, we have contractual commitments to some customers, which could require us to incur costs to repair an epidemic defect with respect to our products outside the normal warranty period if such defect were to occur. The duration of these indemnities, commitments and guarantees varies. The majority of these indemnities, commitments and guarantees do not provide for any limitation of the maximum potential future payments that we could be obligated to make. We have not recorded any liability for these indemnities, commitments and guarantees in the accompanying consolidated balance sheets. We do, however, accrue for losses for any known contingent liability, including those that may arise from indemnification provisions, when future payment is probable and the amount can be reasonably estimated.
6. Lines of Credit
In 2007, SST China Limited, a wholly-owned subsidiary of SST, entered into a one year facility agreement with Bank of America, N.A. Shanghai Branch, a U.S. bank, for RMB 58.4 million revolving line of credit, or approximately $8 million U.S. dollars. The interest rate for the line of credit was 90% of People’s Bank of China’s base rate. There were no restrictions in the agreement as to how the funds may be used and the facility line was guaranteed by the parent company, Silicon Storage Technology, Inc. The balance on the line of credit was repaid in full and subsequently expired with no outstanding balance in 2008.
89
Table of Contents
7. Goodwill and Intangible Assets
Goodwill and intangible assets include $11.2 million of goodwill, $0.1 million of net identifiable intangible assets from acquisitions made in 2004 and 2005 and $1.6 million of net purchased intellectual property. The goodwill is not being amortized but is tested annually for impairment. We review intangible assets for adjustments when an event or circumstance occurs indicating a possible impairment in value. In 2007, we determined the goodwill acquired from our acquisitions of G-Plus and Actrans had become impaired in the amounts of $14.8 million and $3.2 million, respectively and we recorded a $384,000 impairment of intangible assets related to our acquisition of G-Plus. These impairments are recorded in Other operating expenses on our consolidated statements of operations. In 2008, we recorded a $1.1 million charge to research and development to write off various intellectual property licenses.
Our intangible assets consist of the following (in thousands):
| December 31, 2009 | ||||||||||||||
| Cost | Accumulated Amortization |
Accumulated Impairment |
Net | |||||||||||
| Existing technology |
$ | 11,791 | $ | (11,369 | ) | $ | (384 | ) | $ | 38 | ||||
| Intellectual property |
3,244 | (350 | ) | (1,322 | ) | 1,572 | ||||||||
| Trade name |
1,198 | (1,198 | ) | — | — | |||||||||
| Customer relationships |
1,857 | (1,806 | ) | — | 51 | |||||||||
| $ | 18,090 | $ | (14,723 | ) | $ | (1,706 | ) | $ | 1,661 | |||||
| December 31, 2008 | ||||||||||||||
| Cost | Accumulated Amortization |
Accumulated Impairment |
Net | |||||||||||
| Existing technology |
$ | 11,791 | $ | (10,127 | ) | $ | (384 | ) | $ | 1,280 | ||||
| Intellectual property |
3,394 | (222 | ) | (1,322 | ) | 1,850 | ||||||||
| Trade name |
1,198 | (1,032 | ) | — | 166 | |||||||||
| Customer relationships |
1,857 | (1,626 | ) | — | 231 | |||||||||
| Non-compete agreements |
810 | (764 | ) | — | 46 | |||||||||
| $ | 19,050 | $ | (13,771 | ) | $ | (1,706 | ) | $ | 3,573 | |||||
All intangible assets are being amortized on a straight-line basis over their estimated useful lives. Existing technologies have been assigned useful lives of between four and five years, with a weighted average life of approximately 4.6 years. Non-compete agreements have been assigned useful lives between two and four years, with a weighted average of 3.6 years. Intellectual property has been assigned an estimated life between three and five years. Trade names have been assigned a useful life of five years. Customer relationships have been assigned useful lives between three and five years with a weighted average of 4.0 years. Amortization expense was $3.5 million, $2.8 million and $1.8 million, in 2007, 2008 and 2009, respectively.
Estimated future intangible asset amortization expense for the next five years is as follows (in thousands):
| Fiscal Year |
Amortization of Intangible Assets | ||
| 2010 |
$ | 681 | |
| 2011 |
504 | ||
| 2012 |
472 | ||
| 2013 |
4 | ||
| 2014 |
— | ||
| Total expected amortization expense |
$ | 1,661 | |
90
Table of Contents
During 2007, the market price of our common stock declined to the point where our net assets exceeded our total market capitalization and we determined that the carrying value of our memory and non-memory reporting units exceed their fair value. Accordingly, we concluded that the carrying amount of our goodwill may have exceeded its implied fair value. In 2007, pursuant to our accounting policy, we conducted our annual impairment test of goodwill and concluded that the carrying amounts of goodwill assigned to our Memory and Non-Memory segments exceeded their implied fair values. We recorded an impairment charge of approximately $18.0 million, which is included in operating expense, under the caption “Other”, in our 2007 consolidated statements of operations. As a result, all remaining goodwill of $11.2 million is related to our technology licensing segment. The impairment charge was determined by comparing the carrying value of goodwill assigned to these segments as of November 30, 2007, with the implied fair value of their goodwill. We considered both the income and market approaches in determining the implied fair value of the goodwill, which require estimates of future operating results and cash flows of each of the reporting units discounted using estimated discount rates. The estimates of future operating results and cash flows were principally derived from an updated long-term financial forecast, which is developed as part of our strategic planning cycle conducted annually during the latter part of the fourth quarter. The decline in the implied fair value of the goodwill and resulting impairment charge was primarily driven by the updated long-term financial forecasts, which showed lower estimated near-term and longer-term profitability compared to estimates developed at the time of the completion of the acquisition. This updated long-term financial forecast represented the best estimate that we had at the time and we believe that its underlying assumptions were reasonable. In addition, we reviewed the carrying value of our long-lived assets and determined that estimated future cash flows were insufficient to recover the carrying value of certain long-lived assets. As a result, we recorded impairment charges of $585,000 to property and equipment and $0.4 million to intangible assets in order to write these assets down to their estimated fair market value.
There were similar declines in the market price of our common stock in 2008 and 2009, and the carrying value of our net assets exceeded our total market capitalization at December 31, 2008 and 2009. We reviewed the carrying value of our long-lived assets and concluded that either the estimated future cash flows were sufficient for recovery, or that the fair market value of the underlying assets exceeded the carrying value. Therefore, we did not record any impairment to intangible assets in 2008 or 2009. Based on our annual reviews of goodwill performed during 2008 and 2009, we concluded that the carrying value of goodwill of $11.2 million, which relates to our technology licensing segment, did not exceed its implied fair value and we did not record any impairment. Gross profit for our licensing segment was $39.9 million, $48.7 million and $40.0 million for 2007, 2008 and 2009, respectively. Actual performance in the near-term and longer-term could be materially different from our forecasts, which could impact future estimates of fair value of our reporting segments and may result in further impairment of goodwill or other long-lived assets.
8. Share-based Compensation
Equity Incentive Plan
In 2008, our shareholders approved our 2008 Equity Incentive Plan, or the 2008 Plan. The 2008 Plan authorizes the issuance or grant of incentive stock options, non-statutory stock options, restricted stock awards, restricted stock unit awards, stock appreciation rights, performance awards, performance cash awards and other stock awards to our employees, officers, directors and consultants and is intended as the successor to and continuation of our 1995 Equity Incentive Plan, or the 1995 Plan. Following the approval of the 2008 Plan by our shareholders, no additional stock awards may be granted under the 1995 Plan. All outstanding stock awards granted under the 1995 Plan will remain subject to the terms of the 1995 Plan. The total number of shares of our common stock reserved for issuance under the 2008 Plan consists of 5.0 million shares plus up to 9.3 million shares subject to outstanding stock awards under the 1995 Plan that may become available for grant under the 2008 Plan if they were to expire or terminate for any reason prior to exercise or settlement under the 1995 Plan. Unless sooner terminated by the Board of Directors, the 2008 Plan shall automatically terminate on April 24, 2018, the day before the tenth anniversary of the date the 2008 Plan was adopted by the Board. The Board of Directors may also amend the 2008 Plan at any time subject to applicable laws and regulations, including the rules and regulations of The NASDAQ Stock Market LLC. In general, no amendment or termination of the 2008
91
Table of Contents
Plan may adversely affect any rights under awards already granted to a participant unless agreed to by the affected participant. As of December 31, 2009, the 2008 Plan had 6.1 million shares available for grant.
Under the 1995 Plan and the 2008 Plan, the Board of Directors has the authority to determine to whom options will be granted, the number of shares under option, the option term and the exercise price. The options generally are exercisable beginning one year from date of grant and generally thereafter over periods ranging from four to five years from the date of grant. The term of any options issued may not exceed ten years from the date of grant. Pursuant to the 2008 Plan, upon each non-employee director’s initial election or appointment to the Board, such new non-employee director receives an initial stock option grant for 45,000 shares of common stock. Each initial stock option grant vests as to 25% of the shares subject to the grant on the anniversary of the grant date. In addition, each non-employee director will receive a fully vested annual stock option grant for 12,000 shares of common stock. The options expire ten years after the date of grant.
Employee Stock Purchase Plan
In 2009, the shareholders approved our 2009 Employee Stock Purchase Plan, or the 2009 Purchase Plan, which replaces our 1995 Employee Stock Purchase Plan, or the 1995 Purchase Plan. The 2009 Purchase Plan is intended to provide an opportunity for our employees to purchase common stock, to assist us in retaining the services of our employees, and to secure and retain the services of new employees. The 2009 Purchase Plan has 2,000,000 shares of common stock reserved for issuance and approximately 425 employees of SST and our subsidiaries are eligible to participate.
The 2009 Purchase Plan provides for eligible employees to purchase shares of common stock at a price equal to 85% of the lower of the fair market value of a share of common stock on (i) the first day or (ii) the last day of the offering period, by withholding up to 10% of their annual base earnings. Each offering period will be six months, and the first offering period commenced in August 2009. Eligible employees must enroll prior to the beginning of the offering and may not purchase more than $25,000 of common stock in any calendar year. In addition, our Board of Directors has currently limited the maximum number of shares that may be purchased under the 2009 Purchase Plan on any single purchase date to 300,000 shares. Our executive officers are not eligible to participate in the 2009 to 2010 offering periods under the 2009 Purchase Plan.
Shares issued under the 1995 Purchase Plan for 2007, 2008 and 2009 were 155,000 for $694,000, 221,000 for $579,000 and 265,000 for $472,000, respectively. We do not intend to issue any further shares pursuant to the 1995 Purchase Plan.
1995 Non-Employee Directors Stock Option Plan
In 2008, our Board of Directors terminated the 1995 Non-Employee Directors’ Stock Option Plan, or the Directors’ Plan, such that no further stock awards will be made pursuant the Directors’ Plan. As of the termination date, 498,498 shares were subject to outstanding stock awards and will remain subject to the terms of the Directors’ Plan until their exercise or expiration. As of December 31, 2009, 238,000 of these shares remained outstanding.
Tender Offer
In 2008, we completed an offer to amend eligible 409A options and to replace underwater stock options, or the Offer, outstanding under our 1995 Plan. Executive officers and members of the Board of Directors were not eligible to participate. The Offer consisted of two parts, an Offer to Amend and an Offer to Replace. The Offer to Amend consisted of an amendment of the price of certain stock options with exercise prices that may have been lower than the fair market value of our common stock on the applicable grant date, as determined for tax purposes. These options, or the Eligible 409A Options, if not amended may therefore have been subject to adverse tax consequences under Section 409A of the Internal Revenue Code of 1986, as amended. These options were amended to reflect the fair market value per share of our common stock on the revised measurement date determined for that option for financial accounting purposes.
92
Table of Contents
The Offer to Replace consisted of an exchange of certain stock options, or Eligible Underwater Options, with new vesting terms. If the Eligible Underwater Option was 100% vested on May 1, 2008, the new option is subject to a one-year cliff vest, with 100% of the new option vesting on May 1, 2009, subject to continued employment. If the Eligible Underwater Option was not fully vested on May 1, 2008, the new option is subject to a four-year vest, with 25% of the new option vesting on May 1, 2009, and 1/48th of the new option vesting monthly thereafter, subject to continued employment through and on each such date.
Pursuant to the Offer to Amend, we accepted for amendment Eligible 409A Options to purchase 1,534,668 shares of common stock. Pursuant to the Offer to Replace, we accepted for replacement Eligible Underwater Options to purchase 4,854,673 shares of common stock and we issued new options to purchase 1,980,937 shares of common stock. The new options have an exercise price of $3.19 per share, the closing price of our common stock as reported on the NASDAQ Global Market on May 1, 2008.
As a result of the Offer, we compared the fair value of the modified awards to the fair value of the original awards immediately before the modification. We are required to recognize as compensation expense any incremental fair value resulting from the modification over the awards’ remaining vesting period, or immediately if the award is fully vested. The total number of options modified under the Offer was 5,186,208 shares. We expect to incur an additional charge of approximately $0.6 million related to the total incremental compensation cost resulting from the modifications of unvested options over their remaining vesting periods of up to approximately 4 years. Further, to the extent the forfeiture rate is different from what we have anticipated, the modification charge related to the unvested awards will be different from our expectations.
Stock Option Expense Calculation
The following table shows total share-based compensation expense included in the consolidated statements of operations (in thousands):
| Year Ended December 31, | ||||||||||
| 2007 | 2008 | 2009 | ||||||||
| Cost of revenues |
$ | 450 | $ | 361 | $ | 371 | ||||
| Research and development |
2,718 | 2,284 | 911 | |||||||
| Sales and marketing |
941 | 667 | 243 | |||||||
| General and administrative |
1,182 | 1,927 | 994 | |||||||
| Other—forfeited as part of restructuring plan |
— | (585 | ) | 22 | ||||||
| Share-based compensation expense included in net loss |
5,291 | 4,654 | 2,541 | |||||||
| Tax effect of share-based compensation expense |
— | — | — | |||||||
| $ | 5,291 | $ | 4,654 | $ | 2,541 | |||||
Share-based compensation of $54,000, $170,000 and $32,000 was capitalized in inventory as of December 31, 2007, 2008 and 2009, respectively. The tax benefit from the exercise of options was $0 for years ended December 31, 2007, 2008 and 2009. Included in share-based compensation for 2008 is a charge of $0.7 million for fully vested restricted stock awards, at a weighted average grant date per share fair value of $3.17. No restricted stock awards were granted during 2007 or 2009.
Pursuant to our 2008 Plan, as well as the 1995 Plan and Directors’ Plan, stock options are granted with an exercise price equal to the market price of our common stock at the date of grant. Substantially all of the options granted to employees are exercisable pursuant to a four-year vesting schedule with a maximum contractual term of ten years. The fair value of each option grant is estimated on the date of grant using the Black-Scholes option pricing model and assumptions noted in the following table. We estimate expected volatility based on our historical stock volatility. The risk-free interest rate for the expected term of the option is based on the yield of zero-coupon U.S. Treasury notes, with a term approximating the expected term of the option, in effect at the
93
Table of Contents
beginning of the quarter in which the option is granted. We believe that our historical stock option exercise data is not an accurate predictor of future exercise transactions. For periods ending on or before June 30, 2009, we used the simplified method of calculating expected term for new grants. Beginning with the third quarter of 2009, in estimating the expected term, we utilize data from selected semiconductor companies, which we have concluded are similar with regard to market capitalization, stock option contractual term and vesting schedules. We intend to continue to use a similar methodology until we determine that our historical stock option exercise data is expected to more accurately predict future exercise transactions.
Compensation expense under the Plans is recognized as follows: we amortize share-based compensation on the graded vesting method over the vesting periods of the stock options, which are generally four years. The graded vesting method provides for vesting of portions of the overall awards at interim dates and results in accelerated expense recognition as compared to the straight-line method. The Purchase Plan provides for eligible employees to purchase shares of common stock at a price equal to 90% of the fair value of our common stock on the last day of each six-month offering period. We adjust the amount of recognized compensation expense based upon an estimated forfeiture rate derived from historical data.
Assumptions used in the fair value of each option made under our equity award plans are reflected in the table below:
| Year Ended December 31, | ||||||
| 2007 | 2008 | 2009 | ||||
| Risk-free interest rate |
4.4% - 5.0% | 3.0% - 3.9% | 2.2% - 2.8% | |||
| Expected term of option |
6.0 years | 4.8 - 6.1 years | 4.8 - 6.1 years | |||
| Expected volatility |
67.2% - 73.4% | 53.1% - 63.8% | 63.4% - 65.2% | |||
| Expected dividend yield |
0.0% | 0.0% | 0.0% | |||
Stock Option Grant History
The following is a summary of all option activity for the year ended December 31, 2009 (in thousands, except term and per share data):
| Shares Available for Grant |
Number of Shares Outstanding |
Weighted Average Price |
Weighted Average Remaining Term (in years) |
Aggregate Intrinsic Value | ||||||||||
| December 31, 2008 |
4,877 | 9,737 | $ | 4.61 | 6.55 | $ | 147 | |||||||
| Stock options granted |
(911 | ) | 911 | $ | 1.86 | |||||||||
| Exercised |
— | (91 | ) | $ | 1.22 | |||||||||
| Forfeited |
1,561 | (1,561 | ) | $ | 4.09 | |||||||||
| Forfeited under Directors’ Plan |
— | (258 | ) | $ | 9.16 | |||||||||
| Expired |
543 | (543 | ) | $ | 3.49 | |||||||||
| December 31, 2009 |
6,070 | 8,195 | $ | 4.37 | 6.44 | $ | 642 | |||||||
| Vested and expected to vest at December 31, 2009 |
8,047 | $ | 4.40 | 6.39 | $ | 601 | ||||||||
| Options exercisable at December 31, 2009 |
5,273 | $ | 5.26 | 5.50 | $ | 53 | ||||||||
94
Table of Contents
| Options Outstanding | Options Exercisable | |||||||||||
| Range of Exercise Prices |
Number Outstanding |
Weighted-Average Remaining Life |
Weighted-Average Exercise Price |
Number Outstanding |
Weighted-Average Exercise Price | |||||||
| 1.65 - 1.65 |
2 | 9.25 | 1.65 | — | — | |||||||
| 1.82 - 1.83 |
850 | 9.63 | 1.83 | 68 | 1.82 | |||||||
| 1.84 - 2.58 |
1,034 | 8.17 | 2.56 | 376 | 2.57 | |||||||
| 2.62 - 3.15 |
758 | 7.21 | 2.82 | 521 | 2.80 | |||||||
| 3.19 - 3.19 |
1,536 | 6.38 | 3.19 | 1,057 | 3.19 | |||||||
| 3.22 - 3.60 |
1,035 | 7.62 | 3.42 | 520 | 3.45 | |||||||
| 3.62 - 4.42 |
978 | 5.77 | 3.99 | 757 | 4.01 | |||||||
| 4.46 - 5.51 |
833 | 5.04 | 4.92 | 805 | 4.92 | |||||||
| 5.77 - 11.17 |
835 | 3.00 | 8.33 | 835 | 8.33 | |||||||
| 11.25 - 28.35 |
334 | 1.96 | 18.16 | 334 | 18.16 | |||||||
| 8,195 | 6.44 | $ | 4.37 | 5,273 | $ | 5.26 | ||||||
| Year Ended December 31, | |||||||||
| 2007 | 2008 | 2009 | |||||||
| Weighted average grant date fair value of options granted |
$ | 2.75 | $ | 1.64 | $ | 1.01 | |||
| Total intrinsic value of options exercised |
$ | 1,531 | $ | 798 | $ | 61 | |||
| Total cash received as a result of stock option exercises and employee stock plan purchases |
$ | 1,236 | $ | 1,107 | $ | 584 | |||
We settle stock option exercises with newly issued common shares. We do not have any equity instruments outstanding other than those described above as of December 31, 2009.
Total unrecognized compensation expense from stock options as of December 31, 2009 was $1.7 million including estimated forfeitures, which is expected to be recognized over a weighted-average period of 1.2 years.
9. Computation of Net Loss Per Share
We have computed and presented net loss per share under two methods, basic and diluted. Basic net loss per share is computed by dividing net loss by the weighted average number of common shares outstanding for the period. Diluted net loss per share is computed adjusting the net loss by the potential minority interests and dividing by the sum of the weighted average number of common shares outstanding and potential common shares. The calculation of diluted net loss per share excludes potential common stock if the effect is anti-dilutive. Potential common stock shares consist of common stock options, computed using the treasury stock method based on the average stock price for the period.
A reconciliation of the numerator and the denominator of basic and diluted net loss per share are as follows (in thousands except for per share data):
| Year Ended December 31, | ||||||||||||
| 2007 | 2008 | 2009 | ||||||||||
| Numerator for basic and diluted net loss per share: |
||||||||||||
| Net loss, as reported |
$ | (48,957 | ) | $ | (39,815 | ) | $ | (10,237 | ) | |||
| Denominator for basic and diluted net loss per share: |
||||||||||||
| Weighted average common shares outstanding |
104,134 | 100,019 | 95,790 | |||||||||
| Basic and diluted net loss per share |
$ | (0.47 | ) | $ | (0.40 | ) | $ | (0.11 | ) | |||
Stock options to purchase 11.5 million, 9.7 million and 8.2 million shares of common stock with weighted average prices of $6.86, $4.61 and $4.37, respectively, were outstanding at December 31, 2007, 2008 and 2009 but were not included in the computation of diluted net loss per share because we incurred net losses in these years.
95
Table of Contents
10. Other Operating Expenses
Other operating expenses comprised (in thousands):
| Year Ended December 31, | |||||||||
| 2007 | 2008 | 2009 | |||||||
| Expenses related to financial restatement |
$ | 11,970 | $ | — | $ | — | |||
| Restructuring charge |
— | 2,514 | 329 | ||||||
| Impairment of goodwill, intangible assets and property and equipment |
18,961 | — | — | ||||||
| $ | 30,931 | $ | 2,514 | $ | 329 | ||||
Restructuring Charge. In 2008 we announced the implementation of a global reorganization to reflect changes in anticipated levels of business. The plan includes a reduction in overall headcount of approximately 120, or 17 percent of our global workforce, most of which was completed by the end of 2008. We incurred restructuring charges of $2.5 million and $0.3 million in 2008 and 2009, respectively, all of which is related to estimated severance costs associated with the workforce reduction. We do not expect to incur additional expense related to this specific reorganization.
Restatement Expense. In 2007 we announced a voluntary independent review of our historical stock option granting practices. In connection with the investigation and resulting restatement, we incurred approximately $12.0 million in expenses during the year ended December 31, 2007, which included legal, tax, accounting and other professional services.
Impairment of Goodwill and Long-Lived Assets. During 2007, the market price of our common stock declined to the point where our net assets exceeded our total market capitalization and concluded that the carrying amount of our goodwill exceeded its implied fair value. Accordingly, we recorded an $18.0 million impairment charge. In addition, we reviewed the carrying value of our long-lived assets and determined that the estimated future cash flows were insufficient to recover the carrying value of certain long-lived assets. As a result, we recorded impairment charges of $0.6 million to property and equipment and $0.4 million to intangible assets in order to write down these assets to their estimated fair market value.
11. Accumulated Other Comprehensive Income
The components of accumulated other comprehensive income are as follows (in thousands):
| December 31, | ||||||||||
| 2007 | 2008 | 2009 | ||||||||
| Net unrealized gains on investments, net of tax of $0 |
$ | 31,272 | $ | 14,092 | $ | 38,491 | ||||
| Cumulative translation adjustment |
(33 | ) | 216 | 12 | ||||||
| $ | 31,239 | $ | 14,308 | $ | 38,503 | |||||
12. Income Taxes
The provision for income taxes reflected in the consolidated statements of operations for the years ended December 31, 2007, 2008 and 2009 are as follows (in thousands):
| Year Ended December 31, | ||||||||||||
| 2007 | 2008 | 2009 | ||||||||||
| Income (loss) before income taxes: |
||||||||||||
| U.S. |
$ | (43,174 | ) | $ | (20,241 | ) | $ | 2,600 | ||||
| Foreign |
5,489 | (13,787 | ) | (6,865 | ) | |||||||
| $ | (37,685 | ) | $ | (34,028 | ) | $ | (4,265 | ) | ||||
96
Table of Contents
The reconciliation of the federal statutory income tax rate to our effective income tax rate is as follows (in percent):
| Year Ended December 31, | |||||||||
| 2007 | 2008 | 2009 | |||||||
| United States statutory rate |
35.0 | % | 35.0 | % | 35.0 | % | |||
| State taxes, net of federal benefit |
— | — | — | ||||||
| Foreign taxes, net |
(13.4 | ) | (23.5 | ) | (134.6 | ) | |||
| Research and development credit |
3.2 | 4.0 | 18.2 | ||||||
| Change in estimated tax contingency |
(6.2 | ) | (4.5 | ) | (25.4 | ) | |||
| Change in valuation allowance |
(26.8 | ) | (21.2 | ) | 13.1 | ||||
| SFAS No. 123(R) Expense |
(3.8 | ) | (3.7 | ) | (13.4 | ) | |||
| Tax refund |
— | 23.6 | — | ||||||
| Gain on distribution |
— | — | (2.6 | ) | |||||
| Other |
0.7 | 0.2 | (0.3 | ) | |||||
| (11.3 | )% | 9.9 | % | (110.0 | )% | ||||
Deferred income taxes reflect the net tax effects of temporary differences between the carrying amounts of assets and liabilities for financial reporting purposes and the amounts used for income tax purposes. Significant components of our deferred tax assets and liabilities are as follows (in thousands):
| December 31, | ||||||||
| 2008 | 2009 | |||||||
| Excess and obsolete inventory |
$ | 364 | $ | 302 | ||||
| Stock option expenses |
7,294 | 5,840 | ||||||
| Net unrealized losses on investments |
17,095 | 7,097 | ||||||
| Capitalized research and development |
619 | 440 | ||||||
| Net operating loss carry-forwards |
4,599 | 3,799 | ||||||
| Depreciation |
1,241 | 1,781 | ||||||
| Tax credits |
11,670 | 12,066 | ||||||
| Capital loss carryover |
— | 864 | ||||||
| Other |
2,311 | 1,267 | ||||||
| Total deferred tax asset |
45,193 | 33,456 | ||||||
| Valuation allowance |
(45,193 | ) | (33,456 | ) | ||||
| $ | — | $ | — | |||||
We maintained a full valuation allowance on our net deferred tax assets as of December 31, 2009. Determination of the valuation allowance requires an assessment of both positive and negative evidence when determining whether it is more likely than not that deferred tax assets are recoverable and such assessment is required on a jurisdiction by jurisdiction basis. Based upon the weight of available evidence, which includes our historical operating performance, reported cumulative net losses since inception and difficulty in accurately forecasting our results, we provided a full valuation allowance against our net deferred tax assets. We reassess the need for a valuation allowance on a quarterly basis and intend to maintain a full valuation allowance on the U.S. deferred tax assets until sufficient positive evidence exists to support reversal of the valuation allowance.
As of December 31, 2009, we have utilized substantially all our federal net operating loss carryforward and have remaining state and foreign net operating loss carryforwards of approximately $30.1 million and $8.4 million, respectively. At December 31, 2009, we had federal and state research and development credit carryforwards of approximately $5.3 million and $13.0 million, respectively. The federal research and development credit carryforward amount includes $2.9 million related to stock options that when utilized the benefit will be credited to common stock. The federal net operating loss and credit carry forwards will expire at
97
Table of Contents
various dates beginning in 2020 through 2029, if not utilized. The state net operating loss, or NOL, carry forwards will expire at various dates beginning in 2011 through 2029, if not utilized. The state research and development credit carry forwards do not have an expiration date. The foreign NOL’s will expire at various dates beginning in 2010 through 2012, if not utilized.
Utilization of the net operating loss carryforwards and credits may be subject to substantial annual limitation due to the ownership change limitations provided by the Internal Revenue Code of 1986, as amended and similar state provisions. The annual limitation may result in the expiration of net operating losses and credits before utilization.
We have not provided U.S. income taxes on the undistributed earnings of foreign subsidiaries as of December 31, 2009 because we intend to permanently reinvest such earnings outside the U.S. The cumulative amount of undistributed earnings for certain foreign subsidiaries is approximately $1.2 million. If these earnings were to be repatriated, we would be subject to additional U.S. income taxes, adjusted for foreign tax credits. Determination of the amount of unrecognized deferred income tax liability related to these earnings is not practicable.
At December 31, 2009, we had approximately $24.5 million in total unrecognized tax benefits. A reconciliation of the beginning and ending amount of unrecognized tax benefits is as follows (in thousands):
| Balance at January 1, 2007 (at adoption) |
$ | 22,431 | ||
| Additions based on tax positions related to the current year |
3,210 | |||
| Reductions based on tax positions related to prior years |
(647 | ) | ||
| Settlements |
— | |||
| Balance at December 31, 2007 |
24,994 | |||
| Additions based on tax positions related to the current year |
2,482 | |||
| Reductions based on tax positions related to prior years |
— | |||
| Settlements |
(6,724 | ) | ||
| Balance at December 31, 2008 |
20,752 | |||
| Additions based on tax positions related to the current year |
2,199 | |||
| Additions based on tax positions related to prior years |
1,847 | |||
| Reductions based on tax positions related to prior years |
(94 | ) | ||
| Settlements |
(242 | ) | ||
| Balance at December 31, 2009 |
$ | 24,462 | ||
At December 31, 2009, the total unrecognized tax benefits of $24.5 million including approximately $15.6 million of unrecognized tax benefits that have been netted against the related deferred tax assets. The remaining $8.9 million is recorded within long-term other liabilities on our consolidated balance sheet as of December 31, 2009.
The total unrecognized tax benefits of $24.5 million at December 31, 2009 included $8.9 million that, if recognized, would reduce the effective income tax rate in future periods. We do not anticipate any material changes to our uncertain tax positions during the next twelve months.
We recognize interest and/or penalties related to uncertain tax positions in income tax expense. To the extent accrued interest and penalties do not ultimately become payable, amounts accrued will be reduced and reflected as a reduction of the overall income tax provision in the period that such determination is made. The amount of interest and penalties accrued at December 31, 2009 was not material. We file income tax returns in the United States on a federal basis, in California and various foreign jurisdictions. The tax years 1995 to 2009 remain open to examination in the U.S. and California which are the major taxing jurisdictions in which we are subject to tax.
98
Table of Contents
13. Segment and Geographic Reporting
Our Memory Product segment, which is comprised of NOR flash memory products, includes the Multi-Purpose Flash or MPF family, the Multi-Purpose Flash Plus or MPF+ family, the Advanced Multi-Purpose Flash Plus or Advanced MPF+ family, the Concurrent SuperFlash or CSF family, the Firmware Hub or FWH family, the SPI serial flash family, the Serial Quad I/O or SQI flash family, the ComboMemory family, the Many-Time Programmable or MTP family, and the Small Sector Flash or SSF family.
Our Non-Memory Product segment is comprised of all other semiconductor products including flash microcontrollers, smart card ICs and modules, radio frequency ICs and modules, NAND Controllers and NAND Controller-based modules.
Our Technology Licensing segment includes both up-front fees and royalties generated from the licensing of our SuperFlash technology to semiconductor manufacturers for use in embedded flash applications.
We do not allocate operating expenses, interest and other income/expense, interest expense, impairment of investments or provision for or benefit from income taxes to any of these segments for internal reporting purposes, as we do not believe that allocating these expenses is beneficial in evaluating segment performance. Additionally, we do not allocate assets to segments for internal reporting purposes as we do not manage our segments by such metrics.
The following table shows our revenues and gross profit for each segment (in thousands):
| Year Ended December 31, | ||||||||||||||||||
| 2007 | 2008 | 2009 | ||||||||||||||||
| Revenues | Gross Profit |
Revenues | Gross Profit |
Revenues | Gross Profit | |||||||||||||
| Memory |
$ | 333,451 | $ | 72,802 | $ | 228,237 | $ | 39,026 | $ | 170,160 | $ | 19,285 | ||||||
| Non-Memory |
38,465 | 7,782 | 38,628 | 9,535 | 42,502 | 16,290 | ||||||||||||
| Technology Licensing |
39,832 | 39,832 | 48,670 | 48,670 | 39,665 | 39,665 | ||||||||||||
| $ | 411,748 | $ | 120,416 | $ | 315,535 | $ | 97,231 | $ | 252,327 | $ | 75,240 | |||||||
Foreign revenue is determined based on the country to which the product is shipped by us or our logistics center, or where licensing revenue is generated. Our net revenues are all denominated in U.S. dollars and are summarized as follows (in thousands):
| Year Ended December 31, | |||||||||
| 2007 | 2008 | 2009 | |||||||
| United States |
$ | 23,349 | $ | 22,463 | $ | 14,214 | |||
| Europe |
26,802 | 19,742 | 8,936 | ||||||
| Japan |
40,303 | 33,722 | 34,634 | ||||||
| Korea |
37,487 | 25,804 | 21,225 | ||||||
| Taiwan |
45,350 | 48,789 | 38,397 | ||||||
| China (including Hong Kong) |
212,417 | 143,621 | 114,974 | ||||||
| Other Asian Countries |
26,040 | 21,394 | 20,045 | ||||||
| $ | 411,748 | $ | 315,535 | $ | 252,425 | ||||
99
Table of Contents
The location and net book value of our property and equipment are as follows (in thousands):
| December 31, | |||||||||
| 2007 | 2008 | 2009 | |||||||
| United States |
$ | 11,398 | $ | 8,661 | $ | 3,955 | |||
| China |
2,365 | 2,594 | 2,023 | ||||||
| Taiwan |
4,232 | 7,483 | 5,998 | ||||||
| Other |
252 | 175 | 75 | ||||||
| $ | 18,247 | $ | 18,913 | $ | 12,051 | ||||
14. Related Party Reporting
The following table is a summary of our related party revenues and purchases (in thousands):
| Revenues | |||||||||
| Year Ended December 31, | |||||||||
| 2007 | 2008 | 2009 | |||||||
| Apacer Technology, Inc. & related entities |
$ | 2,879 | $ | 3,485 | $ | 3,865 | |||
| Grace Semiconductor Manufacturing Corp. |
176 | 391 | 503 | ||||||
| Silicon Professional Technology Ltd. |
223,490 | 149,647 | 126,191 | ||||||
| Silicon Technology Co., Ltd. |
280 | — | — | ||||||
| $ | 226,825 | $ | 153,523 | $ | 130,559 | ||||
| Purchases | |||||||||
| Year Ended December 31, | |||||||||
| 2007 | 2008 | 2009 | |||||||
| Aptos Design Lab, Inc. & related entities |
$ | 108 | $ | 1,104 | $ | 2,427 | |||
| Grace Semiconductor Manufacturing Corp. |
72,110 | 70,216 | 38,700 | ||||||
| Powertech Technology, Incorporated |
20,145 | 18,232 | 9,307 | ||||||
| $ | 92,363 | $ | 89,552 | $ | 50,434 | ||||
The following table is a summary of our related party accounts receivable and accounts payable and accruals (in thousands):
| Accounts Receivable | ||||||
| Year Ended December 31, | ||||||
| 2008 | 2009 | |||||
| Apacer Technology, Inc. & related entities |
$ | 330 | $ | 491 | ||
| Grace Semiconductor Manufacturing Corp. |
185 | 765 | ||||
| Silicon Professional Technology Ltd. |
10,246 | 24,884 | ||||
| $ | 10,761 | $ | 26,140 | |||
| Accounts Payable and Accruals | ||||||
| Year Ended December 31, | ||||||
| 2008 | 2009 | |||||
| Aptos Design Lab, Inc. & related entities |
$ | 83 | $ | — | ||
| Grace Semiconductor Manufacturing Corp. |
1,700 | 6,667 | ||||
| Powertech Technology, Incorporated |
1,466 | 1,125 | ||||
| Professional Computer Technology Ltd. |
20 | — | ||||
| Silicon Professional Technology Ltd. |
175 | 394 | ||||
| $ | 3,444 | $ | 8,186 | |||
100
Table of Contents
Deferred revenue at December 31, 2009 includes $9.7 million from Grace Semiconductor Manufacturing Corporation, or GSMC, for up-front licensing fees.
Professional Computer Technology Limited, or PCT, and its subsidiary, Silicon Professional Alliance Corporation, or SPAC, earn commissions for point-of-sales transactions to customers. Commissions to PCT and SPAC are paid at the same rate as all of our other stocking representatives in Asia. In 2007, 2008 and 2009 we incurred sales commissions of $1.5 million, $0.2 million and $0.1 million, respectively, to PCT and SPAC. Shipments, by us or by our logistics center, to PCT and SPAC for reshipment accounted for 46.2%, 43.0% and 45.2% of our product shipments in 2007, 2008 and 2009. In addition, PCT and SPAC solicited sales for 1.6%, 1.8% and 1.2% of our shipments to end users in 2007, 2008 and 2009, respectively, for which they also earned a commission.
PCT has established a separate company and wholly-owned subsidiary, Silicon Professional Technology Ltd., or SPT, to provide forecasting, planning, warehousing, delivery, billing, collection and other logistic functions for us in Taiwan. SPT now services substantially all of our end customers based in Taiwan, China and other Southeast Asia countries. Products shipped to SPT are accounted for as our inventory held at our logistics center, and revenue is recognized when the products have been delivered and are considered as a sale to our end customers by SPT. We pay SPT a fee based on a percentage of revenue for each product shipped through SPT to our end customers. For 2007, 2008 and 2009, we incurred $3.4 million, $2.3 million and $2.0 million, respectively, of fees related to SPT. The fee paid to SPT covers the cost of warehousing and insuring inventory and accounts receivable, the personnel costs required to maintain logistics and information technology functions and the costs to perform demand forecasting, billing and collection of accounts receivable. SPT receives extended payment terms and is obligated to pay us whether or not they have collected the accounts receivable.
See Note 15 “Investments” for further discussion of our related parties.
15. Investments
Available-for-sale investments at their estimated fair value and contractual maturities are as follows (in thousands):
| December 31, 2009 | |||||||||||||
| Amortized Cost |
Unrealized Gains |
Unrealized Losses |
Estimated Fair Value | ||||||||||
| Government bonds and notes |
$ | 46,542 | $ | — | $ | (20 | ) | $ | 46,522 | ||||
| Foreign corporate bonds and notes |
910 | 2,790 | — | 3,700 | |||||||||
| Foreign listed equity securities |
4,895 | 35,724 | — | 40,619 | |||||||||
| Total bonds, notes and equity securities |
$ | 52,347 | $ | 38,514 | $ | (20 | ) | $ | 90,841 | ||||
| Contractual maturity dates for investments in bonds and notes: |
|||||||||||||
| Less than one year |
$ | 30,613 | |||||||||||
| One to five years |
19,609 | ||||||||||||
| $ | 50,222 | ||||||||||||
| December 31, 2008 | |||||||||||||
| Amortized Cost |
Unrealized Gains |
Unrealized Losses |
Estimated Fair Value | ||||||||||
| Corporate bonds and notes |
$ | 5,924 | $ | 15 | $ | — | $ | 5,939 | |||||
| Government bonds and notes |
74,264 | 642 | — | 74,906 | |||||||||
| Foreign listed equity securities |
4,761 | 13,435 | — | 18,196 | |||||||||
| Total bonds, notes and equity securities |
$ | 84,949 | $ | 14,092 | $ | — | $ | 99,041 | |||||
| Contractual maturity dates for investments in bonds and notes: |
|||||||||||||
| Less than one year |
$ | 48,997 | |||||||||||
| One to five years |
31,848 | ||||||||||||
| $ | 80,845 | ||||||||||||
101
Table of Contents
Our investments in privately held enterprises and restricted stocks are accounted for using the cost and the equity method of accounting, as appropriate. Each period, we evaluate whether an event or change in circumstances has occurred that may indicate an investment has been impaired. If upon further investigation of such events we determine the investment has suffered a decline in value that is other than temporary, we write down the investment to its estimated fair value. If not separately stated, these investments are included in Equity investments, others on our consolidated balance sheets. As of December 31, 2008 and 2009, the carrying value of these investments was $24.6 million and $32.2 million, respectively.
A summary of equity investments is as follows (in thousands):
| December 31, 2009 | ||||||
| Foreign Listed Equity Securities | ||||||
| At Amortized Cost |
At Estimated Fair Value | |||||
| Apacer Technology, Inc. |
$ | 4,357 | $ | — | ||
| Aptos Design Lab, Inc. |
2,310 | — | ||||
| Aptos Technology Inc. |
2,349 | — | ||||
| Grace Semiconductor Manufacturing Corp. |
20,720 | — | ||||
| Insyde Software Corporation(1) |
315 | 7,997 | ||||
| King Yuan Electronics Company, Limited |
— | 2,047 | ||||
| Powertech Technology, Incorporated |
— | 27,075 | ||||
| Professional Computer Technology Ltd. |
— | 7,200 | ||||
| Silicon Technology Co., Ltd. |
939 | — | ||||
| Others(2) |
1,166 | — | ||||
| $ | 32,156 | $ | 44,319 | |||
| December 31, 2008 | ||||||
| Foreign Listed Equity Securities | ||||||
| At Amortized Cost |
At Estimated Fair Value | |||||
| Advanced Chip Engineering Technology, Inc.(3) |
$ | 2,627 | $ | — | ||
| Apacer Technology, Inc. |
4,357 | — | ||||
| Aptos Technology Inc. |
2,349 | — | ||||
| Grace Semiconductor Manufacturing Corp. |
11,506 | — | ||||
| Insyde Software Corporation(4) |
1,225 | 1,616 | ||||
| King Yuan Electronics Company, Limited |
— | 1,068 | ||||
| Powertech Technology, Incorporated |
— | 13,269 | ||||
| Professional Computer Technology Ltd. |
671 | 2,243 | ||||
| Silicon Technology Co., Ltd. |
939 | — | ||||
| Others(2) |
945 | — | ||||
| $ | 24,619 | $ | 18,196 | |||
| (1) | Includes $3,700 in convertible bonds, carried at estimated fair value. |
| (2) | Certain investments accounted for under the equity method of accounting for investments. |
| (3) | Accounted for under the equity method of accounting for investments. |
| (4) | Includes $910 in convertible bonds, carried at cost. |
In 1996, we invested $0.9 million in Silicon Technology Co., Ltd., or Silicon Technology, a privately held Japanese company. We acquired the interest in Silicon Technology in order to provide a presence for our
102
Table of Contents
products in Japan, and have since established an office in Japan. We are not obligated to provide Silicon Technology with any additional financing. Our investment is carried at cost and represents 8.7% of the outstanding equity of Silicon Technology at December 31, 2009.
In 2000, 2001 and 2002, we invested an aggregate of $12.2 million in Apacer Technology, Inc., or Apacer. Apacer, a privately held Taiwanese company, is a memory module manufacturer and customer. SST is a Board member of Apacer, represented by Bing Yeh, our CEO and Chairman of our Board of Directors. In 2002, the investment was written down to $4.4. We are not obligated to provide Apacer with any additional financing. Our investment is carried at cost and represents 9.3% of the outstanding equity of Apacer at December 31, 2009.
In 2000 and 2002, we invested an aggregate $1.7 million in PCT, a Taiwanese company and one of our stocking representatives. SST is a Board member of PCT, represented by Bing Yeh, our CEO and Chairman of our Board of Directors. During 2003, PCT completed an initial public offering on the Taiwan Stock Exchange and we sold a portion of our holdings. In the fourth quarter of 2009, PCT completed a capital reduction by repurchasing, at par value, a portion of outstanding shares of common stock from each shareholder. Our holdings of PCT stock were reduced by 1.3 million shares and we realized a gain of $0.1 million, all of which was reclassified out of other comprehensive income. Under Taiwan security regulations, investors with representation on the Board of Directors of certain companies must retain a certain number of shares in central custody, which are restricted from sale. Shares that are unrestricted and available for sale are carried at quoted market price and included in Long-term available-for-sale equity investments. Shares to be held in custody for greater than a one year period are carried at cost and included in Equity investments, others. As of December 31, 2008, approximately 2.5 million shares were held in central custody and carried at a cost of $0.7 million. During the fourth quarter of 2009 these shares, with an estimated fair value of $2.4 million at December 31, 2009, were released from custody. As of December 31, 2009, our entire investment is included in Long-term available-for-sale equity investments, carried at the quoted market price of $7.2 million, and represents 10.1% of PCT’s outstanding equity.
We do not have any long-term contracts with SPT, PCT or SPAC, and we are not obligated to provide SPT, PCT or SPAC with any additional financing. SPT, PCT or SPAC may cease providing services to us at any time. If SPT, PCT or SPAC were to terminate their relationship with us we would experience a delay in reestablishing warehousing, logistics and distribution functions which would harm our business. See Note 14 “Related Party Reporting” for further discussion of our relationship with PCT and related entities.
In 2000, we invested $4.6 million in King Yuan Electronics Company, Limited, or KYE, a Taiwanese company and production subcontractor, in order to strengthen our relationship with KYE. During 2001, KYE completed an initial public offering on the Taiwan Stock Exchange. The investment was written down to $1.3 million during 2001. As of December 31, 2008, the quoted market price on the Taiwan Stock Exchange was lower than our per share carrying value. We concluded that the decline was other than temporary and recorded an impairment charge of $231,000 to bring the carrying value to its fair market value as of December 31, 2008. In 2009 we sold 540,000 shares of KYE stock for a net gain of $0.1 million, substantially all of which was reclassified out of accumulated other comprehensive income. We do not have a long-term contract with KYE to supply us with services and we are not obligated to provide KYE with any additional financing. Our investment in KYE is included in Long-term available-for-sale equity investments, carried at the quoted market price of $2.0 million, and represents 0.4% of the outstanding equity of KYE at December 31, 2009.
In 2000 and 2004, we invested an aggregate $3.2 million in Powertech Technology, Incorporated, or PTI, a Taiwanese company and production subcontractor in order to strengthen our relationship with PTI. SST is a Board member of PTI, represented by Bing Yeh, our CEO and Chairman of our Board of Directors. During 2003, PTI completed an initial public offering on the Taiwan Stock Exchange and we sold a portion of our holdings. In 2006 we sold 4.0 million common shares of PTI for a net gain of $12.2 million. In 2009 we sold 330,000 shares for a net gain of $0.9 million, $0.8 million of which was reclassified out of other comprehensive income. We do not have a long-term contract with PTI to supply us with services and we are not obligated to provide PTI with any additional financing. Our investment in PTI is included in Long-term available-for-sale equity investments, carried at the quoted market price of $27.2 million, and represents 1.2% of the outstanding equity of PTI at December 31, 2009.
103
Table of Contents
In 2001 and 2004, we invested an aggregate of $83.2 million cash in GSMC, a privately held Cayman Islands company. GSMC has a wholly owned subsidiary, Grace, which is a wafer foundry company with operations in Shanghai, China. Grace began to manufacture our products in late 2003. Bing Yeh, our CEO and Chairman of our Board of Directors, is also a member of GSMC’s Board of Directors. In 2006, 2007, 2008 and 2009 we recorded impairment charges of $40.6 million, $19.4 million, $11.6 million and $0.5 million, respectively, to write down the carrying value of our investment in GSMC to its estimated fair value, as these impairments were considered to be other than temporary in nature. In 2009, we granted a technology license to GSMC in exchange for preferred shares in GSMC, valued at $9.7 million. The fair value of the shares issued was determined based on an assessment made in connection with the impairment of our investment in GSMC in 2009. See Note 17 “Impairment of Investments” for additional information on the methodology used to determine the fair value of our equity investment in GSMC. The $9.7 million in up-front fees from GSMC for the technology license is included in Deferred revenue at December 31, 2009. We do not have any long-term obligations to purchase products from GSMC and we are not obligated to provide GSMC with any additional financing. GSMC is a variable interest entity, of which we are not the primary beneficiary. Our maximum exposure to loss as a result of our involvement with GSMC is $21.5 million as of December 31, 2009, including the $20.7 million carrying value of our equity investment and a trade accounts receivable balance of $0.8 million. Our investment is carried at cost and represents an 11.1% voting interest in GSMC at December 31, 2009.
In 2002 we invested $1.0 million in the common stock of Insyde Software Corporation, or Insyde, a Taiwanese company. SST is a Board member of Insyde, represented by Bing Yeh, our CEO and Chairman of our Board of Directors. In 2004, we recorded an impairment charge of $0.5 million to our equity investment in Insyde and invested $0.1 million cash in Insyde’s convertible bonds, which were converted to common stock in 2007. In 2007, we invested an additional $0.9 million cash in Insyde’s convertible bonds. Under Taiwan security regulations, investors with representation on the Board of Directors of certain companies must retain a certain number of shares in central custody, which are restricted from sale. Shares that are unrestricted and available for sale are carried at quoted market price and included in Long-term available-for-sale equity investments. Shares to be held in custody for greater than a one year period are carried at cost and included in Equity investments, others. As of December 31, 2009, our investment in convertible bonds and a portion of our equity investment are included in Long-term available-for-sale equity investments and carried at $8.0 million, based on the quoted market price of Insyde’s common stock. The remaining portion of the investment, which is restricted from sale, is carried at a cost of $0.3 million and included in Equity investments, others. We are not obligated to provide Insyde with any additional financing. Our equity investment represents 6.0% of Insyde’s outstanding equity at December 31, 2009.
In 2007, we invested $2.4 million in Aptos Technology Inc., a privately held Taiwanese company. We are not obligated to provide Aptos with any additional financing. Our investment is carried at cost and represents 5.1% of the outstanding equity of Aptos at December 31, 2009.
In 2009, our entire investment in Advanced Chip Engineering Technology, Inc., or ACET, was exchanged for preferred shares in Aptos Design Lab, Inc., or ADL, representing a 17.2% equity ownership position with a carrying value of $2.3 million. ADL is a privately held Taiwanese company, a related party to Aptos Technology Inc., and the parent company of ACET, a production subcontractor for SST. SST is a Board member of ADL, represented by Yaw-Wen Hu, our Executive Vice president, Chief Operating Officer and a member of our Board of Directors. We are not obligated to provide ADL with any additional financing and our investment is carried at cost. See Note 16 “Pro Rata Share of Loss from Equity Investments” for further discussion of the reorganization of ACET’s capital structure.
16. Pro Rata Share of Loss from Equity Investments
In 2004, we invested $4.0 million in ACET, a privately held Taiwanese company. We made subsequent investments of $15.9 million and $10.3 million in 2006 and 2007, respectively, bringing our equity ownership position to approximately 38.5%. In 2008, we concluded that our investment in ACET was impaired and
104
Table of Contents
recorded a charge of $9.7 million. See also Note 17 “Impairment of Investments.” For the years 2007 and 2008, and the nine months ended September 30, 2009, we accounted for our investment in ACET under the equity method of accounting by including our pro rata share of ACET’s reported net loss in our consolidated statement of operations in Pro rata share of loss from equity investments. We recorded $7.0 million, $9.1 million and $0.8 million as our pro rata share of ACET’s loss for 2007, 2008 and 2009, respectively.
In September, 2009, the shareholders of ACET completed a reorganization of its capital structure through the partial sale of ACET to ADL. In the reorganization, approximately 87% of ACET shareholders’ equity ownership was exchanged for equity in ADL. Our entire investment in ACET was exchanged for preferred shares in ADL, representing a 17.2% equity ownership position with a carrying value of $2.3 million. As a result of the exchange, we recognized a gain of $0.8 million. As of December 31, 2009, we no longer hold an equity interest in ACET.
Pro rata share of loss from equity investments other than ACET was not material in 2007, 2008 or 2009.
17. Impairment of Investments
In 2001 and 2004, we invested an aggregate of $83.2 million in GSMC, which was carried at cost with an average price per share of $1.0375 for the preferred equity and $0.01 for the common equity. We recorded impairment charges in 2006, 2007, 2008 and 2009, of $40.6 million, $19.4 million, $11.6 million and $0.5 million, respectively. For each impairment recorded, the primary triggering event was an expected round of financing at a lower price per share than the carrying value of our preferred equity. To determine if there is an indication of impairment during each reporting period, we consider the price per share of the most recent round of financing of new equity investments, the expected timing of the next round of financing, the history of operating losses and negative cash flow, earnings and cash flow outlook, expected cash burn rate and the technological feasibility of GSMC’s products.
We used the following three generally accepted valuation methods discussed below in determining the fair value of our investment in GSMC in 2008 and 2009:
| • | The Income Approach which indicates the fair value of a business based on the discounted value of the cash flows the business is expected to generate. In evaluating this approach we discounted the expected cash flows by using a weighted average cost of capital of 14%. |
| • | The Market Comparable Method which indicates the fair value of a business by comparing it to other publicly traded companies in similar lines of business. |
| • | The Market Transaction Method which estimates the fair value of a business based on the market price of actual merger and acquisition transactions. |
To arrive at the fair value of our investment in GSMC as of June 30, 2009, we weighted the indication from the Income Approach at 50% and the indication from the Market Comparable Method at 50%. In doing so we considered the following:
| • | Since some comparable companies are not projecting the magnitude of growth that is expected for GSMC due to its planned capacity expansion, we believe that the indicated value by the Income Approach reasonably reflects the long-term growth potential of GSMC. |
| • | We believe the Market Comparable Method also results in an equally reasonable value since GSMC’s most recent results and projections are similar to those of a select group of publicly traded companies in their industry. |
| • | The Market Transaction Method tends to produce less reliable indications for a private early-stage company with significant growth over the projection period because their value indications are based upon current operating results and therefore are better suited to value companies that are already in a steady state of profitability and growth. |
105
Table of Contents
Similar factors were considered in evaluating the fair value of our investment in GSMC in connection with impairments recorded in prior years. When evaluating the fair value of GSMC in 2008, the Income Approach was weighted more heavily, at 80%, based on our assessment of the facts and circumstances of GSMC’s business and operating environment at the time. In particular, the growth projections for GSMC in earlier years were significantly greater than most otherwise comparable companies.
We then used the Option Pricing Approach to allocate the aggregate fair value of our investment in GSMC across the individual classes of GSMC equity we hold, based on the concept that equity securities can be viewed as call options on the underlying assets of the company. We determined the strike prices of the options based on the characteristics of the capital structure of the company, such as the number of shares of each class of equity, seniority levels, liquidation preferences and conversion values for preferred equity, and the strike prices of warrants and options. The time to the expiration of these options is equal to the expected time to a liquidity event (initial public offering, sale, merger, etc.).
During 2008, the management of ACET determined that additional funding would be required to continue operations. Discussions were held with various parties, and a preliminary offer was made to purchase substantially all outstanding shares of ACET, which was accepted by ACET’s Board of Directors. As this offer was made at a lower per share price than our carrying value at the time, and based on all other available information, we determined that the value of our investment in ACET had suffered an other-than-temporary decline in value. We recorded an impairment of $9.7 million to write down the carrying value of the investment to its estimated fair value of $2.6 million as of December 31, 2008, based on the per share price of the approved offer. In September, 2009, the shareholders of ACET completed a reorganization of its capital structure through the partial sale of ACET to ADL.
At December 31, 2008, the quoted market price on the Taiwan Stock Exchange for the common stock of KYE was lower than our per share carrying value. The quoted market price for KYE decreased more than 40% during 2008 and we did not find any indication that the value of the stock would recover in the near term. We concluded that the decline was other than temporary and recorded an impairment charge of $0.2 million. We did not record impairment charges on our investment in KYE for 2007 or 2009.
In 2008, we fully reserved a note receivable from an unrelated third party in the amount of $0.2 million due to our expected inability to collect it.
In 2006, we invested $3.0 million in EoNex Technologies, Inc., or EoNex, a privately held Korean company. During 2007 we noted that EoNex had suffered significant declines in net revenue, lacked operating funds and had no immediate source for additional financing. We concluded that our investment in EoNex was impaired and recorded an impairment charge equal to the $3.0 million carrying value.
18. Employee Benefit Plans
Profit Sharing Plan
We have a Profit Sharing Plan under which employees may collectively earn up to 10% of our operating profit, provided that both: (1) net earnings before interest income (expense) and income tax expense (benefit) and (2) operating profit are greater than 5% of sales. For purposes of the Profit Sharing Plan, “operating profit” is defined as net revenues less cost of revenues and less operating expenses, adding back expense from equity-based compensation plans and certain other operating expenses, at the discretion of management. The sum paid to any particular employee as profit sharing is a function of the employee’s length of service, performance and salary. We plan to pay profit sharing sums, when available, to employees twice a year. Profit sharing expenses of $0.5 million and $0.1 million were recorded in 2007 and 2008, respectively. We did not record profit sharing expense in 2009.
106
Table of Contents
401(k) Plan
We have adopted the SST 401(k) Tax Sheltered Savings Plan and Trust, or the 401(k) Plan, as amended, which is intended to qualify under Section 401 of the Internal Revenue Code of 1986. The 401(k) Plan covers essentially all of our U.S. employees. Each eligible employee may elect to contribute to the 401(k) Plan, through payroll deductions, up to 25% of their compensation, subject to certain limitations. At our discretion, we may make additional contributions on behalf of employees. Employer contributions vest over four years. All employee contributions are 100% vested. During 2007 and 2008 we matched employees’ contributions for a total of $1.0 million and $0.9 million, respectively. We did not make additional contributions on behalf of employees in 2009.
19. Stock Repurchase Program
In 2008, our Board of Directors authorized a stock repurchase program to repurchase shares of our common stock, subject to certain specifications, up to an aggregate maximum amount of $30.0 million. The program authorized repurchases to be made from time to time in the open market or in privately negotiated transactions, in compliance with the Securities Exchange Act of 1934 Rule 10b-18, subject to market conditions, applicable legal requirements, and other factors. The program, which commenced February 11, 2008, did not obligate us to acquire shares at any particular price per share and could be suspended at any time and at our discretion. During 2008, we repurchased 9.5 million shares for $28.9 million through open market repurchases. We suspended the program at December 31, 2008. We made no repurchases of our common stock in 2009.
20. Restructuring Charges
In 2008, as a result of weakening demand caused by the rapid slowdown in the global economy, we announced the implementation of a global reorganization designed to reflect changes in anticipated levels of business. This action was taken to reduce costs of operations, to streamline the organization going forward, and to improve focus on accelerating time-to-market of select new products. The plan included a reduction in overall headcount of approximately 120, or 17 percent of our global workforce, most of which was completed by the end of 2008. In 2008 and 2009, we incurred restructuring charges of $2.5 million and $0.3 million, respectively, all of which is related to estimated severance costs associated with the workforce reduction, and is recorded in Other operating expenses. The workforce reduction and other restructuring actions have taken place worldwide and in all functional areas of the company. We do not expect to incur additional expense related to this specific reorganization.
The following is a summary of the restructuring charges and related liabilities recorded (in thousands):
| December 31, 2009 |
||||
| Balance at January 1, 2008 |
$ | — | ||
| Net charges |
2,514 | |||
| Non-cash reduction of charge from forfeiture of stock options |
585 | |||
| Cash payments |
(761 | ) | ||
| Balance at December 31, 2008 |
2,338 | |||
| Net charges |
329 | |||
| Cash payments |
(2,645 | ) | ||
| Other |
(22 | ) | ||
| Balance at December 31, 2009 |
$ | — | ||
107
Table of Contents
21. Subsequent Events
On February 2, 2010, we entered into a definitive agreement, or Merger Agreement, to be acquired by Microchip Technology Incorporated, or Microchip, for $2.85 per share. On February 22, 2010, we entered into an amendment to the Merger Agreement, or Amendment No. 1, to be acquired by Microchip, for $3.00 per share. On March 8, 2010, we entered into an amendment to the Merger Agreement, or Amendment No. 2, to be acquired by Microchip, for $3.05 per share. In connection with Amendment No. 2, on March 8, 2010, we issued to Microchip 19,148,149 newly issued shares of our common stock, or 19.9 percent of our outstanding shares, for a price of $3.05 per share in cash. Amendment No. 1 and Amendment No. 2 are referred to together as the Amendments. Pursuant to the Merger Agreement and Amendments, SST will merge with Sun Acquisition Corporation, a California corporation and a wholly owned subsidiary of Microchip, a Delaware corporation, or the Merger. Each outstanding share of our common stock, other than shares as to which dissenters’ rights have been properly exercised, will be converted into the right to receive $3.05, without interest. The Merger Agreement and Amendments contain certain termination rights and further provide that upon termination of the Merger Agreement under specified circumstances we may be required to pay Microchip a termination fee of $10.3 million. Under specified circumstances, we may also be required to reimburse certain of Microchip’s expenses incurred in connection with the Merger, up to $2.0 million. Pursuant to the terms of Amendment No. 2, in the event that the Merger Agreement is terminated in accordance with its terms, at any time, until the eighteenth month anniversary of the share issuance, Microchip shall have the right (but not the obligation) to force SST to purchase from Microchip the newly issued shares of common stock at a price of $3.05 per share.
On November 13, 2009, we entered into a definitive agreement, or the TRH Merger Agreement, to be acquired by Prophet Equity LP and members of our management team for $2.10 per share. Pursuant to the definitive agreement SST would be merged with and into Technology Resources Merger Sub, Inc., a California corporation and a wholly owned subsidiary of Technology Resources Holdings, Inc., a Delaware corporation. On February 2, 2010, we terminated the TRH Merger Agreement in order to enter into the Merger Agreement, as described above. In connection with the termination of the TRH Merger Agreement, we paid Technology Resources Holdings, Inc. a termination fee of $4,025,875.
108
Table of Contents
SILICON STORAGE TECHNOLOGY, INC.
VALUATION AND QUALIFYING ACCOUNTS
(in thousands)
| Description |
Balance at Beginning of Period |
Charged to Costs and Expenses |
Write-off of Accounts / Other |
Balance at End of Period | ||||||||||
| Year ended December 31, 2007 |
||||||||||||||
| Allowance for doubtful accounts |
$ | 112 | $ | (92 | ) | $ | — | $ | 20 | |||||
| Allowance for sales returns |
$ | 1,458 | $ | (653 | ) | $ | 195 | $ | 1,000 | |||||
| Excess and obsolete inventories and adverse purchase commitments |
$ | 27,846 | $ | 8,473 | $ | (16,508 | ) | $ | 19,811 | |||||
| Valuation allowance on deferred tax assets |
$ | 34,670 | $ | — | $ | (7,660 | ) | $ | 27,010 | |||||
| Year ended December 31, 2008 |
||||||||||||||
| Allowance for doubtful accounts |
$ | 20 | $ | 59 | $ | — | $ | 79 | ||||||
| Allowance for sales returns |
$ | 1,000 | $ | 481 | $ | (978 | ) | $ | 503 | |||||
| Excess and obsolete inventories and adverse purchase commitments |
$ | 19,811 | $ | 14,181 | $ | (18,268 | ) | $ | 15,724 | |||||
| Valuation allowance on deferred tax assets |
$ | 27,010 | $ | 18,183 | $ | — | $ | 45,193 | ||||||
| Year ended December 31, 2009 |
||||||||||||||
| Allowance for doubtful accounts |
$ | 79 | $ | (67 | ) | $ | — | $ | 12 | |||||
| Allowance for sales returns |
$ | 503 | $ | (19 | ) | $ | (181 | ) | $ | 303 | ||||
| Excess and obsolete inventories and adverse purchase commitments |
$ | 15,724 | $ | 11,427 | $ | (15,094 | ) | $ | 12,057 | |||||
| Valuation allowance on deferred tax assets |
$ | 45,193 | $ | — | $ | (11,478 | ) | $ | 33,715 | |||||
109