Attached files
| file | filename |
|---|---|
| EX-23.1 - CONSENT OF INDEPENDENT REGISTERED PUBLIC ACCOUNTING FIRM - MIDAS INC | dex231.htm |
| EX-32.1 - CERTIFICATIONS OF CEO & CFO - MIDAS INC | dex321.htm |
| EX-21.1 - SUBSIDIARIES - MIDAS INC | dex211.htm |
| EX-31.1 - CERTIFICATION OF CEO - MIDAS INC | dex311.htm |
| EX-31.2 - CERTIFICATION OF CFO - MIDAS INC | dex312.htm |
Table of Contents
SECURITIES AND EXCHANGE COMMISSION
Washington, D.C. 20549
FORM 10-K
(Mark One)
| x |
ANNUAL REPORT PURSUANT TO SECTION 13 OR 15(d) OF THE SECURITIES EXCHANGE ACT OF 1934 | |
| For the fiscal year ended January 2, 2010 | ||
| OR | ||
| ¨ |
TRANSITION REPORT PURSUANT TO SECTION 13 OR 15(d) OF THE SECURITIES EXCHANGE ACT OF 1934 | |
| For the transition period from to | ||
| Commission File Number: 01-13409 | ||
Midas, Inc.
(Exact Name of Registrant as Specified in its Charter)
| Delaware | 36-4180556 | |
| (State or Other Jurisdiction of Incorporation or Organization) |
(Employer Identification No.) | |
| 1300 Arlington Heights Road, Itasca, Illinois |
60143 | |
| (Address of Principal Executive Offices) | (Zip Code) | |
(630) 438-3000
(Registrant’s telephone number, including area code)
Securities registered pursuant to Section 12(b) of the Act:
| Title of Each Class |
Name of Each Exchange on Which Registered | |
| Common Stock, par value $.001 Preferred Stock Purchase Rights |
New York Stock Exchange New York Stock Exchange |
Securities registered pursuant to Section 12(g) of the Act: None
Indicate by check mark if the Registrant is a well-known seasoned issuer, as defined in Rule 405 of the Securities Act YES ¨ NO x
Indicate by check mark if the Registrant is not required to file reports pursuant to section 13 or section 15(d) of the Act YES ¨ NO x
Indicate by check mark whether the Registrant (1) has filed all reports required to be filed by Section 13 or 15(d) of the Securities Exchange Act of 1934 during the preceding 12 months (or for such shorter period that the Registrant was required to file such reports), and (2) has been subject to such filing requirements for the past 90 days. YES x NO ¨
Indicate by check mark whether the registrant has submitted electronically and posted on its corporate web site, if any, every Interactive Data File required to be submitted and posted pursuant to Rule 405 of Regulation S-T (§ 232.405 of this chapter) during the preceding 12 months (or for such shorter period that the registrant was required to submit and post such files) YES ¨ NO ¨
Indicate by check mark if disclosure of delinquent filers pursuant to Item 405 of Regulation S-K (§ 229.405 of this chapter) is not contained herein, and will not be contained, to the best of the Registrant’s knowledge, in definitive proxy or information statements incorporated by reference in Part III of this Form 10-K or any amendment to this Form 10-K. x
Indicate by check mark whether the Registrant is a large accelerated filer, an accelerated filer or a non-accelerated filer, as defined in Rule 12b-2 of the Exchange Act. Large Accelerated Filer ¨ Accelerated Filer x Non-Accelerated Filer ¨ Smaller Reporting Company ¨
Indicate by check mark whether the Registrant is a shell company (as defined by Rule 12b-2 of the Exchange Act) YES ¨ NO x
The aggregate market value of the outstanding common stock, other than shares held by persons who may be deemed affiliates of the Registrant, as of the last business day of the Registrant’s most recently completed second fiscal quarter was approximately $149.6 million.
The number of shares of the Registrant’s Common Stock, $.001 par value per share, outstanding as of February 17, 2010 was 14,246,552.
Documents incorporated by reference: Portions of the definitive Proxy Statement for the 2010 Annual Meeting of Shareholders of the Registrant (the “2010 Proxy Statement”) are incorporated by reference into Part III.
Table of Contents
| PART I |
Page | |||
| 1. |
1 | |||
| 1A. |
14 | |||
| 1B. |
20 | |||
| 2. |
20 | |||
| 3. |
21 | |||
| 4. |
22 | |||
| PART II |
||||
| 5. |
22 | |||
| 6. |
24 | |||
| 7. |
Management’s Discussion and Analysis of Financial Condition and Results of Operations |
25 | ||
| 7A. |
42 | |||
| 8. |
43 | |||
| 9. |
Changes in and Disagreements with Accountants on Accounting and Financial Disclosure |
43 | ||
| 9A. |
43 | |||
| 9B. |
46 | |||
| PART III |
||||
| 10. |
Directors, Executive Officers and Corporate Governance of the Registrant |
46 | ||
| 11. |
48 | |||
| 12. |
Security Ownership of Certain Beneficial Owners and Management and Related Stockholder Matters |
48 | ||
| 13. |
Certain Relationships and Related Transactions and Director Independence |
49 | ||
| 14. |
49 | |||
| PART IV |
||||
| 15. |
49 | |||
| 54 | ||||
Table of Contents
PART I
| Item 1. | Business |
As used herein, and except where the context otherwise requires, the terms “MDS” and the “Company” refer to Midas, Inc. and its consolidated subsidiaries. The term “Midas” refers to the Midas retail system only. The term “SpeeDee” refers to the SpeeDee retail system. References to fiscal years are to years ended January 2, 2010 (“fiscal 2009”), January 3, 2009 (“fiscal 2008”), and December 29, 2007 (“fiscal 2007”).
Background
MDS has been in the business of selling automotive repair franchises since 1956. Through March of 2008, the Company’s sole franchise concept was Midas auto repair centers. In April of 2008, MDS acquired the SpeeDee Oil Change and Tune-up franchise system and now sells Midas, SpeeDee and Midas-SpeeDee co-branded franchises.
The Midas network of franchised and company-operated shops is one of the largest and most recognized providers of automotive repair and maintenance services in North America with 1,602 shops located in all 50 U.S. states and nine Canadian provinces as of January 2, 2010. The SpeeDee network of franchised and company-operated shops consists of 112 shops in the U.S. located in 12 states. In addition, both Midas and SpeeDee license their brands outside of North America. There are 776 Midas shops licensed in 14 other countries, and 57 licensed SpeeDee shops in Mexico. On a worldwide basis, there were 2,547 Midas and SpeeDee shops as of January 2, 2010.
From 1972 to 1998, the MDS business was owned by Whitman Corporation (“Whitman”). MDS became an independent public company on January 30, 1998 in a spin-off transaction whereby Whitman distributed all issued and outstanding shares of MDS to shareholders of record of Whitman stock.
MDS’s principal executive offices are located at 1300 Arlington Heights Road, Itasca, Illinois 60143, and its telephone number is (630) 438-3000. The Company’s Internet address is www.Midas.com. MDS makes available, free of charge on or through its website, its annual report on Form 10-K, quarterly reports on Form 10-Q, current reports on Form 8-K, and amendments to those reports filed or furnished pursuant to Section 13(a) or 15(d) of the Securities Exchange Act of 1934 as soon as reasonably practicable after the Company electronically files such material with, or furnishes it to, the Securities and Exchange Commission.
Franchise Industry Overview
According to a recent national study, franchised businesses in the U.S. produced goods and services worth approximately $880 billion across more than 900,000 franchised establishments in 2005. There are two main types of franchises: product distribution franchises and business format franchises. In product distribution franchising, the franchisor licenses its trademark and logo to its franchisee, and allows the franchisee to sell its products; however, the product distribution franchisor typically does not provide the franchisee with a system for running the business. Examples of such franchises are automotive dealerships, soft drink bottlers, and gas stations. A business format franchise not only allows the franchisee to use the franchisor’s trademark, but also provides the franchisee with a system to conduct operations. Business format franchises are the most common type of franchise, encompassing businesses such as fast food, retail, lodging, personal services, and automotive repair. Besides Midas, some of the larger automotive service franchisors include Jiffy Lube, AAMCO, Meineke, and MAACO.
Business format franchising is a synergistic way of doing business. The franchisor provides the franchisee with an established and proven business system. For the new franchisee, the franchisor provides initial training, an operations manual, and an established brand name. Thus, the franchisee is more likely to be initially successful than if he tried to start a new business on his own. The franchisee owns his own business, but has
1
Table of Contents
access to support from the franchisor and his fellow franchisees. On an ongoing basis, the franchisor develops various programs to support the franchisee and the brand. Such programs include advertising, marketing, training, and development of supply chain relationships.
For the franchisor, the benefits of the relationship go well beyond the royalties and fees. Franchisees have invested their own capital in their businesses, and thus have greater motivation to succeed than the average company employee. Strong motivation is especially important in a service business such as auto repair. The Company believes that franchisees can also deliver superior results due to their knowledge of local markets, their involvement in local communities, and their potential for innovation.
The Company believes Midas and SpeeDee franchises are an attractive proposition for a wide variety of people. Some franchisees have prior experience in the automotive aftermarket. They want to be their own boss, but find comfort in being associated with a larger organization and a leading brand. Some franchisees were successful businesspersons in other fields, but are looking for a new career for themselves and/or their families. The training and support available from MDS is attractive to them, as are the relative prospects for the automotive service business.
Economists forecast that the unemployment rate will continue to remain high in North America in 2010. Many people are searching for new ways to earn money. For those who are employed, the fear of future layoffs may also motivate them to search for alternatives in which they can be their own boss, and have greater control over their own financial well being. While this economic environment will likely stimulate increased interest in becoming a franchisee, most candidates rely at least in part on financing in order to buy a franchise. Because the credit markets remain tight, MDS anticipates availability of financing will constrain the growth in the number of people who can become franchisees in the near term.
Automotive Aftermarket Industry Overview
Midas and SpeeDee compete in the approximately $168 billion U.S. automotive aftermarket industry, which includes replacement parts (excluding collision parts and parts for heavy duty trucks), accessories, maintenance items, batteries and automotive fluids for cars and light trucks. Approximately 87% of this amount is from the sale of installed parts and labor (the Do-It-For-Me or “DIFM” segment of the market) and 13% is from the Do-It-Yourself or “DIY” market. Midas and SpeeDee participate in the DIFM segment of the market, but do not participate in the DIY market.
Historically, the DIFM market has been growing because of the increasing size and age of the country’s automotive fleet, the increased technological complexity of vehicles leading to higher cost repairs and maintenance, and the generally increasing number of miles driven annually. In addition, recent industry statistics indicate that there is more than $50 billion in neglected vehicle maintenance every year.
According to published industry information, the number of vehicles in use in the U.S. has grown every year since 1992, primarily as a result of steady annual increases in new light truck sales. In addition, the median age of vehicles in use continues to increase. From 1990 to 2008, the median age of cars in use grew from 6.5 years to 9.4 years. While the number of vehicles in use may fall in the near term, the slowdown in new car sales should cause a further aging of the vehicle population. This trend should continue to benefit the DIFM industry because older vehicles tend to require more maintenance and repair services.
The increased technological sophistication of modern automobiles has also had a positive effect on the DIFM industry. Although vehicle parts have become more durable, many parts are now more technologically advanced. As a result, the cost to diagnose and repair today’s high-technology vehicles has increased. Most automotive service providers have attempted to offset the decline in revenue resulting from the improved durability of automotive parts by expanding their service menus and adding higher cost services.
2
Table of Contents
Vehicle usage influences the demand for automotive repair and maintenance. Vehicle usage causes wear and tear, leading to the need for vehicle repair. Vehicle usage also influences vehicle maintenance, as maintenance schedules are generally based upon odometer readings. Miles driven is a key indicator of vehicle usage. Historically, since the end of World War II, total miles driven in the United States have increased nearly every year. However, in the 12 months ended December 2008, total miles driven declined 3.4%, by far the largest annual decline since World War II. The dramatic increase in gasoline prices in 2007 and 2008 and the very weak economic climate appear to have influenced driving habits in an unprecedented fashion. In 2009 miles driven were up 0.2%, but remain below the level recorded in 2004.
One additional industry trend of note has been the steady decline in the number of service outlets in the U.S. over the past 10 years. The decrease is largely attributable to a reduction in the number of local service stations offering automotive repair. More recently, however, automobile dealerships have been closing in record numbers, causing consumers to seek out alternatives. Offsetting this decline has been an increase in the number of independent maintenance and repair shops and large automotive repair chains. It is expected that the current economic environment will lead to an accelerated level of closures across all automotive service providers, resulting in opportunities for the remaining outlets.
Company Overview
MDS operates in a single business segment with retail, real estate, supply chain and point-of-sale technology operations in support of the franchising of Midas and SpeeDee automotive service shops in North America. Retail operations consist of company-operated Midas and SpeeDee shops. Real estate activities include the development, ownership and leasing of Midas and SpeeDee shops in the U.S. and Canada. Supply chain activities include providing value-added merchandising services to franchisees in which the Company establishes relationships with vendors who distribute products and equipment directly to Midas and SpeeDee shops. Point-of-sale technology operations consist of the ownership, development, sale and leasing of automotive shop management software to Midas franchisees and other third-party automotive service providers. Outside of North America the Company operates on a master-franchise basis whereby the Midas and SpeeDee trademarks are licensed to master franchisees that sub-franchise Midas and SpeeDee shops in their respective territories.
The following table sets forth the number of North American franchised shops, company-operated shops, and shops outside of North America for each of the Midas and SpeeDee brands, as of the end of each of the fiscal periods indicated (note that the SpeeDee brand was acquired by MDS in fiscal 2008):
| Fiscal Year End |
2009 | 2008 | 2007 | 2006 | 2005 | |||||
| Midas |
||||||||||
| North American franchised |
1,502 | 1,576 | 1,620 | 1,685 | 1,730 | |||||
| North American company-operated |
100 | 98 | 91 | 66 | 69 | |||||
| International franchised and licensed |
776 | 835 | 844 | 819 | 811 | |||||
| Total |
2,378 | 2,509 | 2,555 | 2,570 | 2,610 | |||||
| SpeeDee |
||||||||||
| North American franchised |
105 | 114 | ||||||||
| North American company-operated |
7 | 2 | ||||||||
| International franchised and licensed |
57 | 57 | ||||||||
| Total |
169 | 173 | ||||||||
| Total All Brands |
2,547 | 2,682 | ||||||||
As of January 2, 2010, there were 23 shops within the Midas and SpeeDee systems operating as Co-Brand locations.
3
Table of Contents
A further discussion of the Company’s business activities follows.
Franchises and the North American Midas and SpeeDee Systems
MDS is the franchisor of the Midas franchise system throughout North America and the SpeeDee franchise system in the U.S. Both Midas and SpeeDee have developed methodologies and systems for the establishment and operation of franchised auto service shops. These systems include site selection, shop construction and layout, equipment selection and installation, purchasing and inventory control methods, accounting methods, merchandising, advertising, sales and promotional techniques, installation techniques, personnel training and other matters relating to the efficient and successful operation of auto service shops and the maintenance of high standards of quality.
Midas and SpeeDee identify and qualify franchisees through a well-organized recruitment program. Franchisees are qualified based primarily upon a candidate’s financial suitability and operational experience, among other criteria. MDS also considers a franchisee’s ability to work within the franchise system. Each franchisee enters into a standard franchise and trademark agreement with the Company. The franchise and trademark agreements vary by country, but these variances do not substantially alter the franchise arrangement. The franchise agreements cover all aspects of the contractual relationship between the franchisor and franchisee, including: terms and fees of the franchise agreement, royalty payments, advertising, real estate control, site selection, training, equipment and inventory requirements for the proper operation of a shop, warranty programs and shop management software requirements. All franchise agreements prevent ownership of a competing auto service business.
Summarized below are key aspects of the various franchise agreements offered by MDS as franchisor for both the Midas and SpeeDee franchise systems:
Midas Franchise Agreement: The initial term of the franchise agreement is 20 years. The initial franchise fee is $30,000 for the first shop, and is due at the time the franchise and trademark agreement is signed. This agreement is generally not signed until the franchisee has a shop that is ready to open. Prior to opening a Midas shop, franchisees are required to complete a training program. In opening a Midas shop, a franchisee typically makes additional expenditures relating to fixtures, machinery and equipment and initial product inventory. The Midas franchise agreement may be terminated by the franchisee upon thirty days’ written notice.
Midas franchisees pay the Company monthly royalties based on a percentage of sales. Monthly payments must be made via automated clearing house (“ACH”) debit. The royalty on most service categories is 10% of sales. The Company is obligated to spend an amount equal to one-half of the royalty payments it receives from Midas franchisees for advertising placed during the calendar year the royalties are received or during the following calendar year. The Company, as franchisor, administers the use of franchise advertising funds. MDS incurs additional advertising costs that are included in its selling, general and administrative expenses.
An important feature of the Midas system is the requirement that the retail customer be provided a written warranty from the Company on certain Midas products that will be honored at all Midas shops. Each Midas shop is required to honor such warranties in accordance with their terms and with policies issued from time to time by the Company.
In most instances, MDS retains, through real estate agreements between franchisees and Midas Realty (described below), the ability to occupy a site in the event of a termination of the applicable franchise agreement in order to ensure that the site may continue to be operated as a Midas shop.
SpeeDee Franchise Agreement: The initial term of the SpeeDee franchise agreement is 15 years. The initial franchise fee is $30,000 for the first shop, and is due at the time the franchise and trademark agreement is signed. Unlike the Midas system, the SpeeDee franchise and trademark agreement is signed when the franchisee is approved and before a site is located. Prior to opening a SpeeDee shop, franchisees are required to complete a
4
Table of Contents
training program. In opening a SpeeDee shop, a franchisee typically makes additional expenditures relating to fixtures, machinery and equipment and initial product inventory. The SpeeDee franchise and trademark agreement cannot be terminated by the franchisee.
SpeeDee franchisees pay the Company weekly royalties based on a percentage of sales. Weekly payments must be made via ACH debit. The royalty on most service categories is 6% of sales (5% for brakes). In addition, franchisees pay 6% of sales each week to support advertising and promotions, primarily within a shop’s Designated Marketing Area (DMA). The Company, as franchisor, administers the use of franchise advertising funds.
The SpeeDee franchise agreement provides for real estate control of the location by the franchisor. However, SpeeDee had not historically mandated compliance with this aspect of the franchise agreement, but is doing so on a go-forward basis.
The Midas-SpeeDee Co-Brand Franchise Agreement: The Midas-SpeeDee Co-Brand concept is in the final stages of testing. As of January 2, 2010, there were 23 Co-Brand locations in operation. Of these, 14 were company-operated units and 9 were franchised units. Two locations had been opened de novo as Co-Brand shops with the remaining converted from the existing Midas or SpeeDee shop formats. The Company has developed a Co-Brand franchise agreement that is being used with the franchised Co-Brand locations. The initial term is 15 years. The initial fee is $40,000 for single shop owners. Existing Midas and SpeeDee franchisees who convert to the Co-Brand concept will be charged an initial fee of $10,000.
Co-Brand franchisees must pay the Company weekly royalties based on a percentage of sales. Weekly payments must be made via ACH debit. The royalty is either 5% or 6% of sales depending on the service category. An equal amount is collected for advertising and promotions. The Company, as franchisor, administers the use of franchise advertising funds.
Real estate control is required of all Co-Brand shops. The Midas lifetime warranty program is honored at all Co-Brand locations and, as with the Midas franchise agreement, the franchisee is required to maintain inventory of Midas approved parts sufficient to satisfy the needs of warranty customers. Use of the R.O. Writer shop management software system is required for all Co-Brand locations.
The North American Midas System
The North American Midas system consists of 1,602 shops operated by the Company and its franchisees under the Midas brand. Midas shops provide a comprehensive array of automotive repair and maintenance services and are located in all 50 states and nine Canadian provinces. The Company’s geographic breadth results in substantial market coverage throughout North America and strong credibility for Midas’ North American lifetime warranty program.
Midas benefits from leading market positions in core retail service offerings and strong brand equity. Midas believes it is among the leaders in terms of market share in the North American automotive service industry (excluding tires, collision parts and parts for heavy duty trucks). In 2009, approximately 55% of North American retail system sales were in categories where the Company believes Midas has either the number one or number two market position as shown by its internal estimates of market share.
The Midas retail system enjoys very strong brand recognition, demonstrated by a consumer awareness rate of over 90%, and high levels of customer loyalty through its lifetime warranty program. According to MDS tracking studies, Midas is among the leading brands mentioned by consumers when considering an automotive repair provider.
Midas shops historically operated as under car specialists. From its inception in 1956 through 1959, the Midas retail system focused exclusively on replacement of exhaust systems. On a national basis, Midas added
5
Table of Contents
shock replacement in 1960, brake repair in 1979 and alignment in 1988. MDS estimates that the potential market for these core offerings is only 12% of the approximately $168 billion U.S. automotive aftermarket parts and services industry.
Despite the addition of other under car services, exhaust replacement remained a vital part of the Midas service mix. As recently as 1997, exhaust replacement services constituted 35% of Midas’ retail shop revenues in the North American market. But as automobile manufacturers began to employ non-corrosive stainless steel exhaust systems in the mid 1980’s, the average life of an original equipment exhaust system began to increase from three years to over 10 years. As a result, beginning in the mid 1990’s, the core exhaust replacement business of Midas shops began to experience sustained revenue declines. This trend, combined with the increased technological complexity and durability of newer vehicles, put significant pressure on the historical Midas shop business model.
In response to these trends, the Midas retail system began to broaden its service menu in 1999, with the purpose of transforming itself from an under car specialist to a full-service automotive repair and maintenance provider, leveraging the strong brand name and nationwide presence of the Midas system. Beginning in 2000, Midas implemented a New Midas strategy, which included the rollout of new service categories and a renewed focus on customer service. Under the New Midas program, the Midas system expanded its retail offerings to include general repair, heat exchange products and climate control services. These New Midas categories more than doubled the size of Midas’ addressable market. Today, most Midas shops offer exhaust, brake, suspension, air conditioning, tires, batteries and a wide variety of other routine maintenance services. Since 1997, U.S. exhaust sales at Midas retail shops have declined at an annual rate of 9.5% on a same-store basis, but this deterioration has been offset by the expansion of Midas’ service offerings into the New Midas categories. Currently, New Midas services account for approximately 45% of system-wide retail sales. The Company continues to expand Midas shop service offerings as it repositions the Midas brand as a source for total car care.
The following table compares the current U.S. Midas retail service mix with last year, five years ago and 20 years ago.
Trend in U.S. Midas Retail Service Mix
| 2009 | 2008 | 2004 | 1989 | |||||||||
| Exhaust |
11 | % | 12 | % | 17 | % | 46 | % | ||||
| Brakes |
34 | % | 36 | % | 44 | % | 38 | % | ||||
| Suspension, shocks and struts |
10 | % | 9 | % | 8 | % | 14 | % | ||||
| New Midas categories |
45 | % | 43 | % | 31 | % | 2 | % |
The broadening of Midas system retail service offerings has approximately offset the continuing deterioration in the exhaust replacement market. As a result, the average sales of a Midas shop have remained relatively unchanged over the past five years. The average U.S shop sales were approximately $620,500 in 2009 and $619,400 in 2004. The Company believes that the Midas system has the potential for substantial growth in retail sales.
Midas shops are generally located in free-standing buildings in high traffic areas with good visibility and easy access to major roadways. The Company believes that its portfolio of Midas real estate locations built over the past 50 years could not be easily replicated. Given the limited number of desirable repair shop locations and impediments to opening repair shops resulting from zoning and building code restrictions, as well as landlord and developer requirements, entry into the automobile repair market on a large-scale basis is difficult.
The Company supports the Midas retail network with an annual advertising program that is one of the largest in the automotive aftermarket repair business. North American franchisees pay the Company monthly royalties of approximately 10% of retail sales. MDS is obligated to spend an amount equal to one-half of the royalty payments received from Midas franchisees for advertising placed during the calendar year in which the
6
Table of Contents
royalties are received or during the following calendar year. In addition, the Company incurs supplemental advertising costs, primarily related to its company-operated shops, which are included in selling, general and administrative expenses. In fiscal 2009, total Midas advertising spending in North America was approximately $51.4 million.
An important feature of the Midas system is the requirement that the retail customer be provided a written lifetime warranty from Midas on certain products (namely brake friction, mufflers, shocks and struts) that will be honored at any Midas shop throughout North America. Each Midas shop is required to honor such warranties in accordance with their terms and with policies as issued from time to time by the Company, which ensures consistency throughout the Midas system.
The Company believes that its Midas lifetime warranty program provides a competitive advantage over other automotive repair companies and independent service shops, and the breadth of its geographic coverage makes it difficult to duplicate the Midas program. This program generates recurring business from existing customers and promotes customer loyalty. The Company believes that many of its first-time customers choose Midas based upon the lifetime warranty program. In addition, significant portions of exhaust, brake, shock and strut jobs performed at retail involve customers returning for warranty service. Importantly, most warranty replacement work is profitable at the shop level as, in accordance with the terms of the warranty, customers are charged for labor plus other non-warranted parts necessary for the warranty replacement. Additionally, many Midas customers returning for warranty service choose to spend substantial incremental dollars on additional services. The Company believes that its presence in all 50 states and nine Canadian provinces, coupled with the repeat business generated by its North American lifetime warranty program, can be leveraged to capture a larger percentage of automotive repair and maintenance services in segments other than exhaust, brakes and suspension/steering.
Franchised Midas Shops
As of January 2, 2010, there were 1,502 North American franchised shops, which were located in all 50 U.S. states and nine Canadian provinces. Approximately 640 franchisees operate these shops, with only one franchisee having more than 33 shops. Over 65% of the franchised shops are owned and operated by franchisees with five or fewer shop locations. Approximately 28% of Midas franchised locations are owned by single shop operators.
Midas franchisees are all subject to the Midas Franchise and Trademark Agreement and are obligated to operate their shops in accordance with Midas’ standards and policies. In North America, franchisees are required to maintain a sufficient quantity of approved Midas warranted products—principally mufflers, shock absorbers, struts and brake pads and shoes—adequate to meet the public demand for these products and to promptly fill customers’ requests for replacement under the terms of various Midas warranties. The Company makes Midas warranted products and other automotive parts available to its Midas franchisees through distribution agreements with certain automotive parts suppliers in the U.S. and Canada.
Midas supports the U.S. franchise network with four regional managers, 14 franchise business managers and 19 store operations managers. Franchise business managers each manage approximately 40 franchisees and focus on business consulting, compliance and franchise matters. Shop operations managers assist franchisees and shop managers with operations execution and support Midas’ on-site training efforts for both new and existing franchisees.
In Canada, Midas supports the Canadian franchisee network with a general manager and five district managers.
A typical franchised Midas shop is approximately 4,000 square feet and has six service bays. In 2009, the average U.S. franchised shop had sales of $618,000 while the average Canadian franchised shop had sales of C$833,500.
7
Table of Contents
The International Midas Dealers Association (the “IMDA”) is an independent association of Midas franchisees. Approximately 50% of the Midas franchised locations in North America have membership in the IMDA. Midas’ management communicates on a regular basis with IMDA representatives and various IMDA committees to solicit franchisee input on various matters affecting the Midas system.
Company-Operated Midas Shops
The Company believes that owning and operating some Midas shops is an important element of a successful franchise system. Such ownership allows for the orderly transition of franchises, provides a valuable test-marketing platform for the rollout of new products and services, enables the Company to upgrade underperforming locations and helps to accelerate the successful transition of the entire Midas system to the new business model. Upon acquisition of a shop, the Company typically upgrades shop equipment, expands the services offered, installs new point-of-sale software, updates the shop to the new Midas image, upgrades the quality of technicians, and enhances local marketing efforts.
During fiscal 2009, the Company acquired or opened 10 Midas company-operated shops, re-franchised four shops and closed four shops. As of January 2, 2010, the Company owned and operated 100 Midas shops in 11 U.S. states and Canada, with the largest concentrations in Florida (21 shops), Colorado (12 shops), California (10 shops), Illinois (10 shops) and Pennsylvania (10 shops). In addition, the Company acquired 22 Midas shops from an existing franchisee in Northern California during the first quarter of 2010. The Company sold two of these shops and closed one of these shops on the date of acquisition.
Going forward, the Company intends to reduce the number of company-operated Midas shop locations through re-franchising. However, from time-to-time, to protect its market position, Midas may acquire additional North American Midas shops.
The typical company-operated Midas shop is staffed with a manager, an assistant manager or shop foreman, and three to four automotive service technicians. The Midas company-operated shop business is managed by a vice president/general manager, four regional operations managers and 13 district managers.
The typical U.S. company-operated shop is approximately 4,000 square feet, has six service bays and generated annual revenues of approximately $652,000 in 2009.
Midas International Operations
As of January 2, 2010, there were approximately 776 Midas shops located in Europe, Australia, the Middle East, Latin America and the Caribbean. In each of these areas of the world, a master-franchisee licenses the Midas trademark from the Company (each a “licensee”), and sub-franchises the Midas brand to local franchisees. These licensees may also operate Midas shops on a company-operated basis.
In exchange for the use of the Midas trademarks, licensees are required to pay a license fee to the Company. This license fee varies by region, but is generally calculated as a percentage of Midas system-wide sales in the region. During fiscal 2009, the Company collected approximately $4.4 million from international Midas licensees.
The Company meets periodically with its international licensees to ensure compliance with licensing agreements, communicate operating and marketing best practices and share the Company’s vision for future growth and development.
In February 2008, the Company added a new Midas licensee in Costa Rica, which was the first new international license agreement for the Midas system since 2000. The first shop in Costa Rica opened during fiscal 2009. Under this arrangement the Company receives a percentage royalty from the licensee based on sales. The Company continues to seek ways to leverage the value of the global Midas brand through development of additional licensee relationships throughout the world.
8
Table of Contents
For financial information about the principal geographic areas in which the Company operates, see Note 14 of Notes to Financial Statements included elsewhere in this Annual Report.
The SpeeDee System
On March 30, 2008 Midas acquired the assets of G.C. & K.B. Investments, Inc. and its affiliated entities that franchised and sub-franchised SpeeDee quick-lube and automotive maintenance shops. The purchase price was $21.0 million. As of January 2, 2010, SpeeDee had 112 shop locations in the U.S. in 12 states, and 57 shops in Mexico. Of the U.S. shop locations, seven were company-operated and 17 shops were sub-franchised to a licensee who controls the franchise rights to SpeeDee locations in the New England region. Most SpeeDee shops are owned by single location franchisees that both own and operate their shops.
This strategic acquisition expanded the Company’s retail network in North America, leveraged the Company’s supply chain relationships and enhanced the Company’s operational capabilities within the quick-lube and maintenance categories.
The typical SpeeDee shop derives more than 50% of its sales from quick lube and fluid exchange services compared to less than 9% at Midas shops in the U.S. This service mix results in a much higher car count at the typical SpeeDee shop when compared to the typical Midas shop. An average SpeeDee shop services nearly 30 cars per day as opposed to Midas shops, which serve an average of 12 cars per day. In addition, SpeeDee services cars much earlier in their lifecycle as approximately 34% of the vehicles serviced by SpeeDee are less than four years old compared to only 7% of the vehicles serviced at the typical Midas shop.
A typical SpeeDee shop is approximately 3,000 square feet, has eight service bays and generated annual revenues of approximately $730,000 in 2009.
The SpeeDee business is currently operated on a stand-alone basis with respect to store operations and marketing. The SpeeDee system is managed by a Vice President of Operations, a Vice President of Finance, a Manager of Marketing, two regional managers and four district managers. In addition, Speedee maintains regional offices with a small administrative staff in Louisiana and California. Most accounting, administrative and legal functions were consolidated into the MDS corporate office upon acquisition. The SpeeDee company-operated shops are managed by the district managers who also manage the franchise businesses in the region.
The Midas-SpeeDee Co-Brand Opportunity
The Company believes the acquisition of SpeeDee provides both the Midas and SpeeDee franchise systems with a unique opportunity for growth in the future. By combining into one location Midas’ expertise in general repairs and strong brand awareness with SpeeDee’s strength in executing quick-lube and fluid exchanges, the Company believes it can create a powerful new format focused on satisfying the needs of time-pressed consumers seeking value, excellence and a long-term auto service relationship. The Company expects that a Midas-SpeeDee Co-Brand format shop will see customers much earlier in the lifecycle of their vehicle (relative to the typical Midas shop) and will be more able to convert these vehicles into general repair customers (relative to the typical SpeeDee shop) as the vehicles age. The resulting higher unit sales volume may produce a higher return on investment for the franchisee by better leveraging shop overhead expenses.
The Company launched its first test of the Midas-SpeeDee Co-Brand concept with three shops during the third quarter of fiscal 2008. All three were existing SpeeDee locations in California that added the Midas brand to their shop. A fourth Co-Branded unit, also in California, opened on a de novo basis in October 2008. The initial results have been encouraging. The three SpeeDee shops that converted to Co-Brand units in California have generated significant comparable shop sales increases since launch, and the shops have far outperformed the SpeeDee-only units in the same region. In the fourth quarter of fiscal 2009, these shops, along with the de novo Co-Brand, generated an 8% sales comparable shop sales increase, which was on top of the 13% increase achieved in the same quarter one year ago when the new format was launched. During the full year of fiscal
9
Table of Contents
2009, the original Co-Brand units increased comparable shop sales by 13% compared to a flat sales performance in the SpeeDee shops in California, and a nearly 4% decline in sales for Midas shops in California. Based on the success of these shops, the Company has begun to offer the Co-Brand opportunity to other SpeeDee franchisees and expects to Co-Brand at least 10 additional SpeeDee locations in 2010.
During December of 2008, the Company began a test of the Co-Brand concept within existing Midas shops. Four Midas company-operated shops in suburban Chicago were remodeled to accommodate the operating requirements of the SpeeDee concept. In the third quarter of fiscal 2009, the Company remodeled and launched the Co-Brand concept in its company-operated shops in San Diego, CA. In the fourth quarter of fiscal 2009, the shops combined to generate a comparable shop sales increase of 11%, and they more than doubled their average daily car counts.
The ongoing testing of the Midas-SpeeDee Co-Brand concept encompasses numerous shop formats, and the Company expects that such testing will continue into 2010. The results of these tests will be critical in determining the issues involved with integrating the SpeeDee model into selected Midas locations across the U.S. and Canada. The Company expects to convert at least 10 additional Midas shops to the Co-Brand format in 2010.
As of January 2, 2010, there were 23 shops in North America operating as Co-Brand shops.
Real Estate
Midas Realty Corporation (“Midas Realty”), a wholly-owned subsidiary of MDS, leases real estate that is subleased to Midas franchisees and owns real estate in the U.S. and Canada that is leased to Midas franchisees. In circumstances where the Company does not own or lease real estate for Midas shops, Midas Realty enters into contingent operating lease agreements or other forms of real estate control in order to ensure its ability to take possession of the real estate used by Midas shops in the event of a franchisee termination. This approach allows the Company to maintain control of a Midas shop location in the event of a franchisee termination and prevents re-branding of a location to a competitive branded repair facility or an independent repair facility
The agreements with Midas Realty remain in effect throughout the term of the related Franchise Agreement. In the instance when Midas Realty owns the real estate or has the primary lease on a Midas shop, the franchisee is required to lease or sublease the Midas shop from Midas Realty. If the franchisee owns the real estate, the franchisee is required to provide Midas Realty with real estate control through one of two alternative means. The first alternative provides for the lease of the premises from the franchisee to Midas Realty, and Midas Realty in turn leases the premises back to the franchisee. So long as the franchisee continues to be both the landowner and the franchisee of that shop, no rent is exchanged between the franchisee and Midas Realty. If the real estate is sold to a third party or if the franchised Midas shop is sold to a new franchisee to whom the sublease is assigned, Midas Realty will then collect rent from the franchisee and pay rent to the landowner. Under the second alternative, the franchisee enters into a conditional option to lease with Midas Realty that grants Midas Realty the option to lease the premises in the event that the related Franchise Agreement is terminated. If the franchisee leases the real estate upon which the Midas shop is located from a third party, MDS requires that the franchisee grant to Midas Realty a conditional assignment of the lease to take effect upon the termination of the related Franchise Agreement.
As of January 2, 2010, Midas Realty owned 210 retail Midas locations, leased 491 Midas locations and used other forms of real estate control over an additional 674 Midas locations. This approach provides effective control over 1,375 of the 1,602 Midas shops in North America, or approximately 86%. See Note 8 of Notes to Financial Statements.
SpeeDee Worldwide Realty Corporation (“SpeeDee Realty”), also a wholly-owned subsidiary of MDS, leases real estate that is subleased to SpeeDee franchisees. SpeeDee Realty does not own any real estate. SpeeDee Realty uses the same forms of real estate control documents as are used by Midas Realty in order to ensure its ability to take possession of the real estate used by SpeeDee shops in the event of a franchisee termination. As of January 2, 2010, SpeeDee Realty leased eight SpeeDee locations.
10
Table of Contents
The Company believes that its portfolio of real estate locations built over the past 50 years could not be easily replicated. Given the limited number of desirable repair shop locations and impediments to opening repair shops resulting from zoning and building code restrictions, as well as landlord and developer requirements, entry into the automobile repair market on a large-scale basis is difficult.
Supply Chain Activities
The Midas and SpeeDee systems in North America are supported by the Company’s supply chain activities. MDS provides value-added merchandising services to franchisees by establishing relationships with vendors who distribute products and equipment directly to Midas and SpeeDee shops. The Company establishes and actively manages these relationships with parts vendors on behalf of Midas and SpeeDee franchisees in order to provide them with ready access to high quality parts at favorable pricing.
Historically, the Company was more directly involved in the supplying of automotive parts and equipment to Midas franchisees. For most of its history through late 2003, the Company supplied a broad range of automotive parts to Midas franchisees in North America through its network of regional parts distribution centers and Parts Warehouse Inc. (“PWI”) quick delivery sites. In addition, the Company manufactured exhaust products and equipment, which were distributed to Midas franchisees and other non-Midas customers. During 2003, the Company outsourced the wholesale distribution of Midas brand products and other replacement parts, closed all but one of the Company’s regional distribution centers and disposed of its PWI quick-delivery distribution locations. Subsequently, in fiscal 2005, the Company entered into new exhaust supply arrangements with its vendors, which allowed the Company to exit its unprofitable exhaust manufacturing and distribution business. As a result of these agreements, MDS ceased production at its Hartford, Wisconsin exhaust manufacturing plant during the third quarter of fiscal 2005. The Company continued to operate its exhaust distribution warehouse in Chicago, Illinois during the first quarter of 2006 in order to provide Midas brand exhaust products to certain Midas franchisees prior to their final conversion to the new exhaust supply program. During the first quarter of fiscal 2006, all remaining exhaust inventory and equipment was sold and liquidated and the Chicago exhaust distribution warehouse was closed. As a result of the above transformation of the Company’s supply chain activities, the Company is no longer engaged in the manufacturing or distribution of parts to Midas franchisees.
Under the current supply chain business model, the Company establishes relationships with large vendors of automotive replacement parts and arranges for the distribution of these products directly to Midas and SpeeDee shops. Most franchisees’ parts sourcing needs are addressed through the Company’s relationships with major full-line automotive replacement parts suppliers such as the National Automotive Parts Association (“NAPA”), Uni-Select Inc., and CarQuest Corporation. These vendors provide franchisees with weekly delivery of replacement parts to retail shops, as well as access to just-in-time parts delivery through a broad network of quick-delivery parts distribution sites across North America. The Company believes its supply agreements with these suppliers enable Midas and SpeeDee franchisees to purchase high quality replacement auto parts at favorable pricing.
For most supply chain relationships, the vendor bills the Midas or SpeeDee franchisee directly for his purchases. The Company’s involvement is limited to negotiating preferred pricing and terms on behalf of franchisees by leveraging the buying power of the Company’s nationwide retail network.
From 2003 through 2007, MDS received product royalties from these vendors based on Midas shop purchases. These product royalties were recorded as revenue and were used to offset the future cost of redemptions under the Midas lifetime warranty program. Effective as of the beginning of 2008, the Company significantly expanded the number of approved U.S. suppliers and modified its contracts with existing U.S. suppliers. Under the new arrangement, MDS no longer receives product royalties from U.S. vendors. These royalties are instead paid to franchisee shops in the form of rebates, which lower the shop’s cost of goods. At the same time, the Company instituted a new fee to its Midas shops that will cover the future cost of warranty redemptions. This fee is adjusted annually so that the Company has no net cost or profit from the U.S. Midas
11
Table of Contents
lifetime warranty program. In Canada, in July 2009, the Company adopted the U.S. program for both managing supply chain relationships and administering the Midas lifetime warranty program. See Note 1 of Notes to Financial Statements.
In addition to the above described full-line parts supply arrangements, MDS has established relationships with certain suppliers to support the more specialized sourcing needs of franchisees. Currently, these include the Company’s agreements with Bridgestone-Firestone and Interstate Battery for the distribution of tires and batteries, respectively. The Company also maintains relationships with key equipment vendors to provide franchisees with cost-competitive access to shop equipment. Under most of these arrangements, the Company bills the franchisee for the product purchased from the vendor, and then the Company, in turn, pays the vendor for the product. The Company records the sale of the product and holds the related accounts receivable. The Company’s gross margins on these purchasing arrangements are very low, and the gross profit is primarily intended to cover administrative costs and potential bad debts that might arise from the sale of these products. MDS also receives royalties on the ultimate sale of these products to consumers at retail in the Midas and SpeeDee systems.
Progressive Automotive Systems and the R.O. Writer Software System
In January 2001, the Company acquired the assets of Progressive Automotive Systems, a provider of automotive industry shop management software sold under the name R.O. Writer. The software is specifically designed to meet the needs of the auto repair industry, and MDS continues to develop and enhance the system. The Company believes this software helps to promote operational consistency and excellence throughout the Midas system. As of January 2, 2010, the R.O. Writer system was installed in nearly 1,000 Midas shops, comprising approximately 62% of Midas system locations throughout North America. Additionally, the system has been installed in several thousand non-Midas auto service shops in the United States.
Proprietary Information
MDS holds various patents, trademarks, trade names and copyrights, none of which, other than the Midas and SpeeDee names, is considered by MDS to be material to its financial condition and results of operations. MDS vigorously defends the Midas name throughout the world, and the name is registered as a trademark in approximately 100 countries in addition to the U.S. The SpeeDee name is registered in the U.S. and Mexico. The Company also owns certain trade secrets including product catalogs, price lists, training manuals and inventory systems.
Competition
The franchising industry is highly competitive and fragmented, and the number, size and strength of competitors varies from format to format. Both Midas’ and SpeeDee’s competitors include franchisors of restaurants, services and lodging as well as direct competitors within the franchised auto service industry (such as Jiffy Lube, MAACO, Meineke and AAMCO). Certain of these competitors are well-capitalized. MDS believes that competition in the franchising industry is primarily based on the brand name, historical success of franchisees, strength of franchisor support for franchisees, size of initial investment, franchise fee and royalty rate. MDS believes that Midas and SpeeDee generally have a favorable competitive position with respect to each of these variables.
The automotive repair industry is highly competitive and fragmented, and the number, size and strength of competitors vary from region to region. Both Midas’ and SpeeDee’s primary competitors include national, regional and local specialty chains, both franchised and company-operated, car dealerships, independent repair shops and service bays operated by mass merchandisers. Certain of these competitors are well-capitalized, and a number of them have instituted expansion plans. MDS believes that competition in the automotive repair industry is primarily based on customer service and reputation, shop location, name awareness and price. MDS believes that Midas and SpeeDee generally have a favorable competitive position with respect to each of these variables.
12
Table of Contents
Customers
No customer accounted for more than 10% of the Company’s total sales and revenues in fiscal 2009 or 2008.
Seasonality
As a result of changes in the Company’s business model over the past five years, including the exit from exhaust manufacturing and distribution, the outsourcing of parts distribution and the expansion into a broader retail service menu, the seasonality of the Company’s sales has been reduced. In fiscal 2009, fiscal 2008 and fiscal 2007, revenues by quarter were not significantly different.
Regulatory Compliance
Franchising Matters. The Company is subject to a variety of federal and state laws governing franchise sales and marketing and franchise trade practices. Applicable laws and regulations generally require disclosure of business information in connection with the sale of franchises. Certain state regulations also affect the ability of the franchisor to revoke or refuse to renew a franchise. The Company deals with franchisees in good faith and strives to comply with regulatory requirements. From time to time the Company and one or more franchisees may become involved in a dispute regarding certain aspects of the franchise relationship, including, among other things, payment of royalties, location of shops, advertising, purchase of certain products by franchisees, compliance with franchise system standards and franchise renewal criteria. There can be no assurance that compliance problems will not be encountered from time to time, or that material disputes with one or more franchisees will not arise.
Consumer Protection Matters. National automotive repair chains have been the subject of investigations and reports by consumer protection agencies and the Attorneys General of various states. Publicity in connection with such investigations can have an adverse effect on the financial condition and results of operations of a company. In addition to such investigations, state and local governments have enacted numerous consumer protection laws. MDS has instituted procedures, including uniform standards of service to be followed by all Midas and SpeeDee shops, to improve customer satisfaction, which also aids in regulatory compliance.
Environmental and Occupational Safety Matters. The Company’s shops handle used automotive oils and certain solvents that are disposed of by licensed third-party contractors. As a result, the Company is subject to a number of federal, state and local laws designed to protect the environment. MDS, through its company-operated shops, is also subject to regulation regarding the installation of catalytic converters and certain other emissions-related parts. In addition to environmental laws, the Company is subject to the Federal Occupational Safety and Health Act and other laws regulating safety and health. The Company maintains programs to facilitate compliance with these laws, the costs of which are not material to its financial condition and results of operations.
Employees
As of January 2, 2010, MDS had approximately 890 employees. None of the employees is covered by collective bargaining agreements. MDS considers its relationships with employees to be good. Midas and SpeeDee franchisees hire and are responsible for their own employees.
13
Table of Contents
Cautionary Statements under the Private Securities Litigation Reform Act of 1995
Forward-Looking Statements
This report contains (and oral communications made by MDS may contain) forward-looking statements that may be identified by their use of words like “plans,” “expects,” “anticipates,” “intends,” “estimates,” “forecasts,” “will,” “outlook” “should” or other words of similar meaning. All statements that address the Company’s expectations or projections about the future, including statements about MDS’s strategy for growth, cost reduction goals, expenditures and financial results, are forward-looking statements. Forward-looking statements are based on the Company’s estimates, assumptions and expectations of future events and are subject to a number of risks and uncertainties. MDS cannot guarantee that these estimates, assumptions and expectations are accurate or will be realized. MDS disclaims any intention or obligation (other than as required by law) to update or revise any forward-looking statements.
| Item 1A. | Risk Factors |
In addition to the factors discussed elsewhere in this annual report, the following are some of the important factors that could cause the Company’s actual results to differ materially from those projected in any forward-looking statements:
We are engaged in litigation that if determined adversely to us could have a material adverse effect on our business.
As described under “Item 3. Legal Proceedings,” we are currently party to two purported class action lawsuits. The purported class action suit brought by certain California brake customers has sought unspecified damages. A purported class action suit brought by Canadian franchisees has sought approximately $168 million in damages. Midas is also engaged in binding arbitration proceedings in Geneva, Switzerland with MESA S.p.A (“MESA”), the European licensee that operates the Midas system in Europe, and its parent company Norauto Groupe S.A. (“Norauto”), in which MESA and Norauto have sought, among other things, damages of approximately 102 million Euros as well as requiring Midas to indemnify MESA and Norauto (for an amount estimated to be between 57-154 million Euros) for any losses arising from the termination of agreements between MESA and Midas. While we believe that these claims are without merit and are vigorously defending against these claims, an adverse determination in any of these proceedings could have a material adverse effect on our business.
Virtually all of our revenues outside of North America are derived from the license fees of one licensee. The loss or reduction of these fees due to an adverse change in our relationship with this licensee, with whom we are currently engaged in arbitration proceedings, or in this licensee’s business would have a material adverse effect on our net income.
Virtually all of our revenues outside of North America are derived from our master licensee in Europe and South America with MESA. MESA is an Italian company that operates the Midas system in Europe under a License Agreement and an Agreement of Strategic Alliance, as amended (the “ASA”). Norauto, a French company, acquired MESA (previously known as Magneti Marelli Services S.p.A.) from the Fiat Group in October 2004.
We are currently engaged in binding arbitration proceedings in Geneva, Switzerland with MESA and Norauto. In demanding arbitration, MESA and Norauto claim that the Company has breached, and continues to breach, its obligations to cooperate and execute the ASA in good faith by failing to develop the Midas System in Europe and South America. As a result, MESA is asking the arbitrators to require the Company to pay for damages and losses incurred by MESA and Norauto, including a portion of the royalties previously paid to the Company, and the alleged decrease in the value of the MESA business and lost profits because of MESA’s inability to successfully open Midas shops in new countries, in an estimated amount of 102 million Euros. MESA and Norauto are also asking the arbitrators to require the Company to renegotiate the terms of the ASA and the
14
Table of Contents
License Agreement currently in effect or to cancel these agreements due to the alleged breach by the Company and require the Company to indemnify MESA and Norauto for any losses resulting from the termination of these agreements. These alleged losses are estimated to be between 57 to 154 million Euros. The Company believes that the claims by MESA and Norauto are without merit and is vigorously defending against these claims.
The loss of the European licensing fees due to an adverse change in our relationship with MESA and/or Norauto or in MESA and/or Norauto’s business would have a material adverse effect on our net income. In fiscal 2009, MDS realized $4.1 million in international license fee revenue under the License Agreement. This amount represented 2.3% of consolidated revenue and 29.8% of operating income. This license fee is paid in Euros and varies based upon a percentage of retail sales. In January 2010, the arbitration panel issued an interim order permitting MESA to pay into escrow half the amounts MESA will owe Midas in royalties (beginning with the payment paid by MESA for royalties due in February 2010), which the arbitration panel estimated will be approximately 1.5 million Euros in total through the duration of the arbitration proceedings. The arbitration panel has taken the position that MESA would suffer harm that could not be easily remedied if damages were awarded and Midas was unable to pay them. The Company had not yet filed its first substantive written submission at the time the interim order was issued. On February 10, 2010, Midas made its first substantive written submission to the arbitration panel and is currently conducting discovery. At present, Midas anticipates that the arbitration proceedings will conclude in the second half of 2010.
We rely on franchising for a substantial portion of our operating revenues. The failure of our franchisees to successfully operate stores consistent with our standards would have a material adverse effect on our profitability.
We rely on franchising for a substantial portion of our operating revenues. Therefore, our business is dependent on the ability of our franchisees to deliver high quality services. Our franchisees are independent contractors and are not our employees. We provide training and support to franchisees, but the quality of franchised store operations may be diminished by any number of factors beyond our control. We have been modifying the business models of our franchise systems. These changes generally require franchisees to perform more technologically complex repairs and maintenance than historically has been the case, and which requires greater investment in personnel and equipment. Consequently, not all franchisees may successfully operate stores in a manner consistent with our standards and requirements or hire and train qualified managers, technicians and other store personnel. If they do not, our image and reputation may suffer, and system-wide sales and profitability could decline. A reduction in system-wide sales and profitability could negatively impact the collectibility of receivables owed by franchisees to the Company.
The failure to successfully implement our new business models could have a material adverse effect on our financial condition and results of operations.
We are in the process of repositioning the Midas retail system in North America from a business model focused on the servicing and replacement of mufflers, brakes, shock absorbers and struts to a model that encompasses a complete line of services. While we have made substantial progress in broadening our services, we have not yet been widely successful in developing such ongoing relationships with our customers. As a result of the change in business model, our Midas company-operated and franchised shops have had to make, and will have to continue to make, investments in training, new personnel and equipment. As a result of the inability of certain Midas franchisees to adapt to the changing environment and successfully adopt the new business model, we have in some cases reacquired franchises to prevent the closing of these shops. While we believe that the selective acquisition of certain franchises is consistent with the implementation of our business model, our long term success depends upon the ability of our franchisees to profitably implement the new business model. While comparable shop sales have been maintained or improved at Midas shops that have made the transition to the new business model, we cannot assure shareholders that the change in the long run will be successfully marketed, that consumers will accept the new model or that the remaining shops will be willing to or can successfully make the transition to the new format.
15
Table of Contents
In addition, we are in the process of testing a new Midas-SpeeDee Co-Brand business model. The new venture combines the Midas and SpeeDee franchise operations into one location. We believe that, if successful, this business model could provide us with a platform for growth of sales at existing Midas and SpeeDee locations as well as future unit growth in North America. While the initial results have been encouraging, this venture remains a test at this time. We cannot assure shareholders that the Co-Brand business model will succeed at driving sales or profitability for the Company or its franchisees. Furthermore, we cannot assure shareholders, even if the testing of the concept proves successful, that franchisees would be willing or able to make a transition to the new concept on a broad scale. Finally, due to issues related to location overlap, certain SpeeDee and Midas shop locations would not be allowed to make the transition even if the franchisees wanted and were able to do so.
A reduction in the availability of consumer credit may reduce consumer purchases of our products and services which would adversely affect our revenues.
Credit card purchases account for a significant portion of the revenue of the Midas and SpeeDee systems in North America. A reduction in credit available to customers in general, and Midas credit card holders in particular, would have an adverse impact on MDS revenues.
A reduction in the availability of business credit could adversely affect our ability to sell franchises, lower our revenues or lead to slower payment of franchisee obligations due to MDS as franchisor.
Most new franchisees finance a substantial portion of their shop investment with debt. A reduction in the availability of business credit may hinder our ability to sell new franchises, as well the ability of our selling franchisees to find capable buyers. In addition, our franchise systems are comprised of franchisees who are small business operators that rely upon credit to fund their operations. When the availability of credit is reduced, it can harm the ability of our franchisees to fund their operations. As a consequence, franchisees can fail and go out of business or become delinquent in making payments, including payments due to the franchisor.
We are a leveraged company that utilizes debt to fund our business.
We currently have substantial debt on our balance sheet. The financing provided to us is subject to covenants that require us to maintain a certain net worth and maintain compliance with certain leverage ratios. If we do not perform in accordance with these covenants, the financial institutions providing the funds have the option to withdraw their funding support. We cannot assure shareholders that we will remain in compliance with our debt covenants in the future. In addition, our current financing agreement expires on October 27, 2013. While we believe we have excellent relations with our banks, we cannot assure shareholders that we will be able to refinance our existing credit facility when it expires in fiscal 2013, nor can we give any assurances to shareholders that the terms of any new financing arrangement will be favorable to the Company.
A continuing downturn in the economy may delay or reduce consumer purchases of our products and services, which would adversely affect our revenues.
Many factors affect the level of consumer spending on automotive services, including, among others, general business conditions, interest rates, gasoline prices, the availability of consumer credit and consumer confidence in future economic conditions. Consumer purchases of regular service interval maintenance generally are reduced during recessionary periods, when gasoline prices are high, or when disposable income is lower.
A decline in the usage of automobiles would adversely affect demand for our products and services.
While the number of automobiles registered in the U.S. has historically increased over time, a sustained reduction in the number of miles driven by automobile owners would adversely affect the demand for our products and services. For example, when the retail cost of gasoline increases or the economy enters a severe recession, the number of miles driven by automobile owners typically decreases, which historically has resulted
16
Table of Contents
in less frequent service intervals and fewer repairs. In the U.S., in 2008 we experienced the largest one-year drop in miles driven since World War II and we believe that this trend negatively impacted the Company’s overall financial performance in the past two years.
We operate in a highly competitive market and the failure of our franchisees to effectively compete would have a material adverse effect on our financial condition and results of operations.
The automotive services industry is highly fragmented and highly competitive. There are numerous direct competitors for our retail auto service shops. Our shops compete with national, regional and local specialty chains, both franchised and company-owned, car dealerships, independent repair shops and service bays of mass merchandisers. We believe the principal competitive factors in the markets served by our shops are, in no particular order, customer service and reputation, shop location, name awareness and price. We also compete with businesses of the types noted above and with other parties in the sale of franchises. Competitive factors include startup costs, royalty rates, franchisee support and the financial performance of existing franchises. Many of our competitors are large and have a substantially longer operating history. Many competitors have greater financial resources than we possess. Our failure to compete effectively or the failure of individual shops to compete effectively would have a material adverse effect on our financial condition and results of operations.
Our inability to respond to consumer demands would adversely affect our results of operations.
If we were unable to respond to changes in consumer demands in a timely manner, it would adversely affect our revenues. Furthermore, if we fail to make continuous and successful new product and service introductions, this could adversely affect our financial performance. Our success in general, and at franchised system shops in particular, depends on our ability to identify, originate and define automotive product and service trends as well as to anticipate, gauge and react to changing consumer demands in a timely manner. Our automotive products and services must appeal to a broad range of consumers whose preferences cannot be predicted with certainty and are subject to rapid change. We may not be able to continue to develop appealing automotive products and services or meet changing consumer demands in the future. If we or our franchisees misjudge the market for automotive products and services, we or our franchisees may be faced with excess inventories and sunk training and equipment costs for certain automotive products and services and missed opportunities for other products and services.
Advances in automotive technology could adversely affect demand for our maintenance and repair services.
The demand for the services offered by our shops could be adversely affected by continuing developments in automotive technology. Automotive manufacturers are producing cars that last longer and require service and maintenance at less frequent intervals. For example, some manufacturers now recommend that consumers change oil at 10,000 mile intervals and replace spark plugs and other engine components at 100,000 miles, a significant increase from the mileage intervals recommended for earlier models and those currently recommended by most manufacturers. In addition, the improvement in original equipment manufacturers’ parts quality has in the past reduced, and may in the future reduce, demand for the products and services offered by our shops, thereby adversely affecting our franchise system revenues. Improvement in the quality of parts manufactured may extend the useful lives and warranties of those parts and may reduce demand for our products and services by decreasing the frequency of replacement or refurbishment of those parts. In turn, longer and more comprehensive warranty programs offered by automobile manufacturers and other third parties also could adversely affect the demand for services offered by our shops. We believe that a majority of new automobile owners have their cars serviced by their new car dealer during the period the car is under warranty. Major automobile manufacturers are experimenting with various advanced engine technologies, some of which could impact demand for services currently performed within our franchise systems. Finally, advances in automotive technology could require that we and our franchisees incur additional costs to update our technical training programs and upgrade the diagnostic capabilities of Midas and SpeeDee shops.
17
Table of Contents
The failure to attract and maintain an adequate supply of skilled labor would have a material adverse effect on our financial performance.
The provision of high quality services by our shops requires an adequate supply of skilled labor. In addition, the operating costs and operating revenues of auto service shops may be adversely affected by high turnover in skilled technicians. Trained and experienced automotive technicians are in high demand. The expansion of our business model from muffler and brake service to more complicated automotive repairs has required many franchised and company-operated shops to hire highly skilled full-service automobile technicians. Accordingly, our ability to increase productivity and revenues could be affected by our inability to attract and maintain the employment of skilled technicians necessary to provide key shop services. If we or our franchisees are unable to attract and maintain the adequate skilled labor force necessary to operate these shops efficiently, or if labor expenses increase as a result of a shortage in the supply of skilled technicians, our financial performance would be adversely affected.
The failure to comply with applicable franchise laws could have a material adverse effect on our financial condition and results of operations.
We are subject to federal and state laws and regulations, including the regulations of the Federal Trade Commission as well as similar authorities in individual states, in connection with the offer, sale and termination of franchises and the regulation of the franchisor—franchisee relationship. Our failure to comply with these laws could subject us to liability to franchisees and to fines or other penalties imposed by governmental authorities. In addition, we may become subject to litigation with, or other claims filed with state or federal authorities by, franchisees based on alleged unfair trade practices, implied covenants of good faith and fair dealing, payment of royalties, location of shops, advertising expenditures, franchise renewal criteria or express violations of agreements. There can be no assurance that compliance problems will not be encountered from time to time, or that material disputes will not arise with one or more franchisees. Accordingly, our failure to comply with applicable franchise laws and regulations could have a material adverse effect on our financial condition and results of operations.
We must commit resources to maintain and develop our key brands. The failure to maintain the Midas and SpeeDee brands would have a material adverse effect on our financial condition and results of operations.
If we fail to continue maintaining and developing the Midas and SpeeDee brand names, future revenues would be adversely affected. We believe that maintaining and developing our brand names is critical to our success and that the importance of brand recognition may increase as competitors offer products and services similar to our products and services. We incur substantial marketing expenditures to create and maintain brand loyalty as well as increase awareness of our brands. If our brand-building strategies are unsuccessful, these expenses may never be recovered, as we may be unable to increase future revenues or successfully implement certain business strategies.
Failure to protect our intellectual property would reduce our competitiveness.
We rely on trademark, trade secret, patent and copyright law to protect our intellectual property, including the Midas and SpeeDee brand names. We cannot be sure that these intellectual property rights can be successfully asserted or will not be invalidated, circumvented or challenged in the future. In addition, the laws of some of the foreign countries in which our products and services are or may be sold do not protect our intellectual property rights to the same extent as the laws of the United States. Our failure to protect our proprietary information, and any successful intellectual property challenges or infringement proceedings against us, could make us less competitive and could have a material adverse effect on our business, financial condition and results of operations.
18
Table of Contents
The failure to comply with consumer protection regulations would have a material adverse effect on our financial condition and results of operations.
National automotive repair chains have been the subject of investigations and reports by consumer protection agencies and the Attorneys General of various states. Negative publicity in connection with such investigations could have an adverse effect on the financial condition and results of operations of our company. In addition, state and local governments have enacted numerous consumer protection laws and the failure to comply with these laws would have a material adverse effect on our financial condition and results of operations.
The failure to comply with extensive environmental regulation applicable to our business would have a material adverse effect on our financial condition and results of operations.
Environmental compliance costs and liabilities could have a material adverse effect on our financial condition. Our operations and properties are subject to increasingly stringent laws and regulations relating to environmental protection, including laws and regulations governing air emissions, water discharges and waste management. Such laws and regulations can impose fines and criminal sanctions for violations and require the installation of costly pollution control equipment or operational changes to limit pollution emissions and decrease the likelihood of accidental hazardous substance releases. Some of our current and former properties have been used as gas stations and dry cleaners. Accordingly, we could become subject to potentially material liabilities relating to the investigation and cleanup of contaminated properties, and to claims alleging personal injury or property damage as the result of exposures to, or releases of, hazardous substances. In addition, stricter interpretation of existing laws and regulations, new laws and regulations, the discovery of previously unknown contamination or the imposition of new or increased requirements could require us to incur costs or become the basis of new or increased liabilities that could reduce earnings and cash available for our operations.
Significant changes in the market value of our defined benefit plan assets could have a material adverse effect on our financial condition and results of operations.
We have a defined benefit plan that we offer to individuals employed by MDS. The assets in the plan are invested in a combination of equities, bonds and cash in order to fund ongoing plan obligations and ensure the future funded status of the plan. Historically, our defined benefit plan has been well-funded and we have not had to make any material contributions to fund the plan. However, the significant downturn in the U.S. stock market in 2008 caused the plan to be significantly underfunded at the end of fiscal 2008 and resulted in higher pension expense and contributions in 2009. While the U.S. stock market had a significant recovery in 2009, the plan remains underfunded and the Company will be required to make significant contributions in future years. Further significant changes in the value of plan assets could result in incremental income statement expense for the Company and could result in our having to fund plan assets with incremental cash contributions to the plan in current and future years. The U.S. Government establishes rules that govern the funding requirements of such plans and we comply with these rules. We cannot project the future funded status of our plan nor can we project the future funding requirements of the plan that would result from changes in the funded status or changes in government rules regarding required funding.
The failure to maintain adequate levels of taxable income within our U.S. and Canadian subsidiaries would have a material adverse effect on our corporate income tax expense and the valuation of our net deferred tax assets.
Our balance sheet contains significant deferred tax assets for net operating loss carry forwards and other reserves and liabilities that are deductible for tax purposes in future years. We must maintain adequate levels of taxable income in key subsidiaries in all future years to preserve the utilization of these deferred tax assets prior to their expiration. If we determine that it is more likely than not that these assets will not be fully utilized in future years, we will have to record an incremental charge to income tax expense and record an incremental valuation allowance against the corresponding deferred tax assets.
19
Table of Contents
If our stock price remains at its current level, it will have a material adverse effect on our future corporate income tax expense.
As prior MDS stock awards vest, the estimated fair value of the award is amortized as an expense charged to our book income statement. For tax purposes, stock awards are not deductible until they vest (for restricted stock) or until they are exercised (for options). As the expense is amortized on our book income statement, we recognize a deferred tax asset on our balance sheet. The deferred tax asset is then reversed when the corresponding restricted stock vests or when the corresponding options are exercised. If our tax deduction is less than our book income statement deduction, the full deferred tax asset will not be realized. The tax effected difference between our book deduction and our tax deduction is charged to income tax expense. This happens if and when restricted stock vests at a stock price below its grant price, or if stock options are exercised at a stock price which results in a tax deduction that is less than the Black-Scholes valuation of the option at grant date.
The lowering of U.S. corporate income tax rates would have a material adverse effect on our corporate income tax expense.
Our balance sheet contains a significant U.S. deferred tax asset, which is valued at a combined (federal plus state) income tax rate of 39.2%. If the U.S. corporate income tax rates were reduced in the next several years, the deferred tax assets would have to be written-down to their net realizable value. This would result in incremental U.S. income tax expense for the Company.
Our results of operations may be adversely affected by acts of war or terrorism
War or terrorist activities or the threat of them may increase our cost of doing business or otherwise impact our financial performance.
| Item 1B. | Unresolved Staff Comments |
The Company has no unresolved Staff Comments.
| Item 2. | Properties |
MDS owns and leases real estate in various communities throughout North America that it uses for company-operated shops or leases and sub-leases to Midas and SpeeDee franchisees. As of January 2, 2010, MDS owned 210 retail Midas locations, leased 491 Midas locations and used other forms of real estate control over an additional 674 Midas locations. This approach provides effective control over 1,375 of the 1,602 Midas shops in North America, or approximately 86%.
As of January 2, 2010, SpeeDee Realty leased eight SpeeDee locations.
MDS leases approximately 62,000 square feet of office space in Itasca, Illinois, where its corporate headquarters is located. This lease runs through January 2019. In addition, the Company leases two small office facilities, one in Louisiana and one in California, in connection with the management of the SpeeDee franchise system.
MDS no longer owns or leases any facilities in connection with its former exhaust manufacturing and distribution operation or its traditional wholesale distribution operations.
20
Table of Contents
| Item 3. | Legal Proceedings |
California Class Action
The Company is currently involved in a class action lawsuit filed in California in June 2006 that alleges that certain franchised California Midas shops intentionally issued invoices to certain brake customers that incorrectly indicated that the customers had received Midas-branded brake products when, in fact, they had received inferior non-Midas brake products. MDS denies the plaintiffs’ allegations and is vigorously defending this lawsuit. MDS has thus far been successful in challenging the legal sufficiency of the plaintiffs’ claims. The plaintiffs’ third amended complaint has been dismissed. The plaintiffs filed a fourth amended complaint in March of 2009. The Company continues to believe that the allegations are without merit.
Canadian Franchise Purported Class Action
A purported class action lawsuit was filed against the Company in Canada by two Canadian Midas franchisees. The plaintiffs alleged various violations of the Midas Franchise and Trademark Agreement and applicable law and sought class certification and monetary damages of approximately $168 million. The class certification hearing took place in February 2009 and the court released its certification ruling on March 26, 2009. Of the many claims asserted by the plaintiff, the only claim for which class certification was granted was the issue of whether Midas Canada breached its common law and statutory duties of good faith and fair dealing when it implemented its new supply chain program in 2003. All other causes of action were rejected by the court. The Company is currently in the process of compiling historical documents as a result of the plaintiffs’ discovery request. The Company continues to believe this lawsuit is without merit.
Norauto Arbitration
On June 12, 2009, the Company received a Notice of Arbitration from MESA S.p.A. (“MESA”) and Norauto Groupe SA (“Norauto”). MESA is an Italian company that operates the Midas system in Europe under a License Agreement and an Agreement of Strategic Alliance, as amended (the “ASA”) with the Company. Norauto is a French company that acquired MESA (previously known as Magneti Marelli Services S.p.A) from the Fiat Group in October 2004.
Background
Until 1998, the Company directly owned and managed its network of franchised and company-operated Midas shops throughout the world. In 1998, the Company reached an agreement with Magneti Marelli S.p.A. (“Marelli”), a member of the Fiat Group (the ASA). The Midas management concluded that Marelli had the financial and human resources to accelerate the development of the Midas business in Europe and South America at a much faster pace than the Company. Accordingly, under the ASA the Company sold its interests in Europe and South America (“Midas Europe”) to Marelli for $100 million in October 1998 (of which $84 million was paid under the ASA, and an upfront payment of $16 million was paid under a separate License Agreement). The License Agreement was entered into for the use of the Midas trademarks as part of the transaction.
In October 2004, Norauto acquired Magneti Marelli Services S.p.A. (“Marelli Services”) from the Fiat Group. Marelli Services was a newly-formed subsidiary of Fiat that was created to own the Midas Europe business that was purchased from the Company in 1998. Upon acquisition by Norauto in October 2004, Marelli Services was renamed MESA S.p.A. by Norauto.
The License Agreement with Marelli (and now with MESA) provided for fixed U.S. dollar denominated royalty payments of approximately $9 million per year until 2007. Effective January 1, 2008, the royalty converted to 1% of Midas Europe’s system-wide retail sales. As a result, the royalty paid to the Company by MESA decreased from approximately $8.9 million in 2007 to approximately $4.4 million in 2008.
Arbitration
Under the terms of the ASA, all disputes are to be settled by binding arbitration in Geneva, Switzerland under the UNCITRAL Arbitration Rules by a panel of three arbitrators. In demanding arbitration, MESA and
21
Table of Contents
Norauto claim that the Company has breached, and continues to breach, its obligations to cooperate and execute the agreement in good faith by failing to develop the Midas System in Europe and South America. As a result, MESA is asking the arbitrators to require the Company to pay for damages and losses incurred by MESA and Norauto, including a portion of royalties previously paid to the Company, and the alleged decrease in the value of the MESA business and lost profits because of MESA’s inability to successfully open Midas shops in new countries, in an estimated amount of Euros 102 million.
MESA and Norauto are also asking the arbitrator to require the Company to renegotiate the terms of the ASA and the License Agreement currently in effect or to cancel these agreements due to the alleged breach by the Company and require the Company to indemnify MESA and Norauto for any losses resulting from the termination of these agreements. These alleged losses are estimated to be between 57 to 154 million Euros.
In January 2010, the arbitration panel issued an interim order permitting MESA to pay into escrow half the amounts MESA will owe Midas in royalties (beginning with the payment paid by MESA for royalties due in February 2010), which the arbitration panel estimated to be approximately 1.5 million Euros in total through the duration of the arbitration proceedings. The arbitration panel has taken the position that MESA would suffer harm that could not be easily remedied if damages were awarded and Midas was unable to pay them. The Company had not yet filed its first substantive written submission at the time the interim order was issued.
On February 10, 2010, Midas made its first substantive written submission to the arbitration panel and is currently conducting discovery. At present, Midas currently anticipates that the arbitration proceedings will conclude in the second half of 2010.
The Company believes that the claims by MESA and Norauto are without merit and is vigorously defending against these claims.
| Item 4. | Reserved |
PART II
| Item 5. | Market for Registrant’s Common Equity, Related Stockholder Matters and Issuer Purchases of Equity Securities |
The Company’s Common Stock is listed on the New York Stock Exchange under the symbol “MDS”. As of December 31, 2009, there were 4,253 holders of record of the Common Stock. Information about the high and low prices of MDS Common Stock is shown below.
| High | Low | |||||
| Fiscal 2009 |
||||||
| 1st Quarter |
$ | 11.99 | $ | 6.03 | ||
| 2nd Quarter |
11.73 | 8.84 | ||||
| 3rd Quarter |
10.55 | 8.40 | ||||
| 4th Quarter |
9.35 | 6.75 | ||||
| Fiscal 2008 |
||||||
| 1st Quarter |
$ | 19.12 | $ | 12.71 | ||
| 2nd Quarter |
18.40 | 12.60 | ||||
| 3rd Quarter |
17.63 | 12.69 | ||||
| 4th Quarter |
14.17 | 6.57 | ||||
MDS has not paid a dividend during the last three fiscal years and has no current plans to pay a dividend in the future.
22
Table of Contents
The following table includes all issuer repurchases, including those made pursuant to publicly announced plans or programs and those not made pursuant to publicly announced plans or programs.
| Period |
Total Number of Shares Purchased (1) |
Average Price Paid per Share |
Total Number of Shares Purchased as Part of Publicly Announced Plans or Programs (2) |
Approximate Dollar Value of Shares That May Yet Be Purchased Under the Plans or Programs | |||||
| October 2009: |
— | — | — | $ | 34,347,399 | ||||
| November 2009: |
— | — | — | $ | 34,347,399 | ||||
| December 2009: |
— | — | — | $ | 34,347,399 | ||||
| Total |
— | — | — | ||||||
| (1) | Includes shares surrendered to cover the withholding taxes upon the vesting of restricted stock. In the fourth fiscal quarter of 2009, no shares were surrendered in lieu of taxes and, for the full year 2009, a total of 64,900 shares were surrendered. |
| (2) | On November 9, 2004, the Company announced that the Board of Directors had authorized a share repurchase of up to $25 million in MDS stock. On May 9, 2006, the MDS Board of Directors authorized a $25 million increase in the share repurchase program, and on May 8, 2007, the Board authorized an additional $50 million increase. As of January 2, 2010, a total of approximately 3,248,100 shares had been repurchased under this plan since its inception. The average price of shares repurchased under the plan was approximately $20.21. This program has been temporarily suspended. |
Performance Graph
The following performance graph compares the Company’s cumulative total shareholder return on Common Stock from January 1, 2005 to January 2, 2010 with the cumulative total return during the same periods of S&P 500 Index and Standard & Poor’s 600 Specialty Stores (the “peer group”), neither of which includes MDS. These comparisons assume an initial investment of $100 and the reinvestment of dividends.
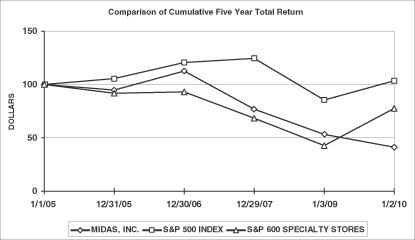
| Company/Index | 1/1/05 | 12/31/05 | 12/30/06 | 12/29/07 | 1/3/09 | 1/2/10 | ||||||
| Midas, Inc. |
100 | 92 | 115 | 74 | 53 | 42 | ||||||
| S&P 500 Index |
100 | 105 | 121 | 129 | 83 | 102 | ||||||
| S&P 600 Specialty Stores |
100 | 90 | 91 | 63 | 42 | 73 |
23
Table of Contents
| Item 6. | Selected Financial Data |
The following table presents selected historical financial information of MDS. The information set forth below should be read in conjunction with Item 7, “Management’s Discussion and Analysis of Financial Condition and Results of Operations” and the financial statements of MDS and the notes thereto. The operating results data set forth below for fiscal years 2009, 2008 and 2007 and the balance sheet data as of the end of fiscal 2009 and 2008 are derived from, and are qualified by reference to, the audited financial statements of MDS included herein, and should be read in conjunction with those financial statements and the notes thereto. The operating results data for fiscal years 2006 and 2005 and the balance sheet data as of the end of fiscal 2007, 2006 and 2005 are derived from audited financial statements of MDS not included herein.
| Fiscal Year |
2009 | 2008 | 2007 | 2006 | 2005 | ||||||||||
| (In millions, except share data) | |||||||||||||||
| Operating results data: |
|||||||||||||||
| Sales and revenues (a) |
$ | 182.8 | $ | 187.4 | $ | 178.2 | $ | 174.9 | $ | 192.5 | |||||
| Business transformation charges (b) |
3.2 | 1.6 | 3.7 | 3.3 | 12.3 | ||||||||||
| Operating income (c) |
14.2 | 21.3 | 32.1 | 26.8 | 12.6 | ||||||||||
| Income before income taxes |
6.3 | 13.0 | 23.4 | 19.0 | 3.2 | ||||||||||
| Net income |
2.6 | 7.8 | 13.0 | 10.3 | 2.2 | ||||||||||
| Earnings per share—diluted |
$ | 0.19 | $ | 0.56 | $ | 0.89 | $ | 0.66 | $ | 0.13 | |||||
| Balance sheet data: |
|||||||||||||||
| Total assets |
$ | 228.6 | $ | 235.4 | $ | 215.6 | $ | 215.7 | $ | 239.2 | |||||
| Obligations under capital leases and long-term debt |
73.8 | 85.8 | 79.1 | 65.2 | 70.1 | ||||||||||
| Finance lease obligations |
31.7 | 32.8 | 34.0 | 34.8 | 36.8 | ||||||||||
| Total shareholders’ equity |
29.3 | 19.6 | 25.1 | 33.2 | 49.5 | ||||||||||
| (a) | On March 30, 2008 Midas acquired the assets of G.C. & K.B. Investments, Inc. and its affiliated entities that franchise or sub-franchise SpeeDee quick-lube and automotive maintenance shops. During fiscal 2009 and 2008, SpeeDee generated revenue of approximately $5.1 million and $3.5 million, respectively. |
| (b) | In late 2002, MDS began a process to exit wholesale parts distribution and to redirect the Company’s strategic focus towards the core franchising business. This included outsourcing the Company’s traditional wholesale business, closing 77 PWI locations, rationalizing the company-operated shops operation and closing the Company’s exhaust manufacturing and distribution operations. These and other actions led to business transformation charges for 2005 through 2009. Business transformation costs for fiscal years 2007 through 2009 are described in Note 2 of Notes to Financial Statements. |
| (c) | In 2009, 2008 and 2007, the Company recorded favorable pre-tax adjustments to its estimated warranty liability of $0.6 million, $3.4 million and $8.3 million, respectively. |
24
Table of Contents
| Item 7. | Management’s Discussion and Analysis of Financial Condition and Results of Operations |
The following table presents, for the fiscal periods indicated, selected financial information as a percentage of total sales and revenues.
| Percentage of Sales and Revenues | |||||||||
| Fiscal Year |
2009 | 2008 | 2007 | ||||||
| Franchise royalties and license fees |
29.3 | % | 30.5 | % | 33.8 | % | |||
| Real estate revenues from franchised shops |
17.8 | 18.4 | 20.2 | ||||||
| Company-operated shop retail sales |
35.8 | 32.8 | 25.7 | ||||||
| Replacement part sales and product royalties |
14.1 | 15.6 | 17.8 | ||||||
| Software sales and maintenance revenue |
3.0 | 2.7 | 2.5 | ||||||
| Sales and revenues |
100.0 | 100.0 | 100.0 | ||||||
| Franchised shops—occupancy expenses |
12.4 | 12.2 | 12.4 | ||||||
| Company-operated shop parts cost of sales |
10.0 | 8.6 | 6.3 | ||||||
| Company-operated shop payroll and employee benefits |
15.4 | 13.9 | 10.7 | ||||||
| Company-operated shop occupancy and other operating expenses |
12.0 | 11.1 | 8.6 | ||||||
| Replacement part cost of sales |
12.5 | 14.1 | 14.6 | ||||||
| Warranty expense (benefit) |
0.1 | (1.4 | ) | (2.4 | ) | ||||
| Selling, general, and administrative expenses |
28.0 | 28.8 | 29.8 | ||||||
| Loss (gain) on sale of assets, net |
0.1 | 0.5 | (0.1 | ) | |||||
| Business transformation charges |
1.8 | 0.8 | 2.1 | ||||||
| Total operating costs and expenses |
92.3 | 88.6 | 82.0 | ||||||
| Operating income |
7.7 | 11.4 | 18.0 | ||||||
| Interest expense |
(4.5 | ) | (4.9 | ) | (5.1 | ) | |||
| Other income, net |
0.2 | 0.4 | 0.2 | ||||||
| Income before income taxes |
3.4 | 6.9 | 13.1 | ||||||
| Income taxes |
2.0 | 2.7 | 5.8 | ||||||
| Net income |
1.4 | % | 4.2 | % | 7.3 | % | |||
Company Overview
MDS operates in a single business segment with retail, real estate, supply chain and point-of-sale technology operations in support of the franchising of Midas and SpeeDee automotive service shops in North America. Retail operations consist of company-operated Midas and SpeeDee shops. Real estate activities include the development, ownership and leasing of Midas and SpeeDee shops in the U.S. and Canada. Supply chain activities include providing value-added merchandising services to franchisees in which the Company establishes relationships with vendors who distribute products and equipment directly to Midas and SpeeDee shops. Point-of-sale technology operations consist of the ownership, development, sale and leasing of automotive shop management software to Midas franchisees and other third-party automotive service providers. Outside of North America the Company operates on a master-franchise basis where the Midas and SpeeDee trademarks are licensed to master franchisees that sub-franchise Midas and SpeeDee shops in their respective territories.
MDS management is focused on building shareholder value through the profitable growth of the Company. The three main drivers of profit growth for MDS are the refranchising of company-operated shops, increasing the shop count through the opening of additional franchised units and increasing comparable shop sales. These drivers are closely integrated, as the opening of franchises is much easier in an environment where franchised shop sales and profits are growing.
25
Table of Contents
Refranchising Company-Operated Shops
As of fiscal year-end 2009, MDS operated 107 company-operated Midas, SpeeDee and Midas-SpeeDee Co-Branded shops. While the Company believes that owning and operating some shops is an important element of a successful franchise system, the Company has significantly more company-operated shops than it needs, and many of these shops were under-performing and unprofitable at the time they were acquired. During fiscal 2009, the company-operated shop business generated $65.4 million in revenues, and generated a $2.9 million operating loss. If all of these shops had instead been run by franchisees during 2009, the Company would have recorded approximately $3.3 million of additional royalty income, and the $2.9 million company-operated shop operating loss would have been avoided. In addition, the Company would have received real estate rental income on the locations that are owned by the Company, wholesale profit from the sales of products to these shops, and would have been able to reduce corporate overhead.
The Company refranchised four shops in fiscal 2009 and has increased its efforts to refranchise company-operated shops. The Company expects to refranchise a significant number of shops in 2010.
Growing Shop Count
Since fiscal 1998, annual Midas shop closings have exceeded annual new shop openings. The annual shop closing rate during this period of approximately 3.1% is consistent with other mature retail companies; however, the opening rate has lagged. This reduced opening rate is due to a variety of factors including the increased complexity of the Midas shop operating model, a lack of focus on new shop development by the MDS management team during many of those years, an over-supply of automotive repair centers in general, and a re-deployment of capital by MDS away from real estate investments.
During this time the Company has also diverted many new franchisees that may have opened new shops away from new shop development and instead have helped them buy existing Midas shops from existing Midas franchisees. Midas is an older franchise system and thus numerous long-term franchisees have struggled with the ongoing changes required to adapt to the current automotive aftermarket. The Company has been working diligently to identify those franchisees that are not capable or not willing to adapt to the new environment and has been assisting them in transitioning out of the Midas system. This environment has led many new franchisees to purchase existing Midas shops rather than to develop new ones. This transformation has been underway for some time and Midas has averaged approximately 100 shop transitions per year in the past several fiscal years, with most shops transitioned to new franchisees.
The benefits of transitioning Midas shops to new franchisees can be seen in the performance of these shops. Sales at shops within the first year after transition have historically far outperformed the sales performance of the broader Midas system. In some cases, the improvement is dramatic with sales rising by more than 100%. In the next several years the Company hopes to accelerate the number of transitions each year and thereby increase the capacity of the Midas system as a whole to adapt and thrive in this new business environment. Additionally, the Company hopes to significantly increase the number of single-shop, owner-operator franchisees. Currently, about 28% of Midas system shops are owned by single-shop franchisees, whereas most SpeeDee system shops are owned and operated by a single franchisee. MDS management strongly believes the automotive service business is often best managed by single-shop owners who work the business on a daily basis.
In addition to transitions, the Company believes that the re-opening of previously operated Midas shops and the acquisition/conversion of competing automotive repair centers both provide a significant opportunity to grow the North American franchise system.
Refranchising of Available Shop Inventory: Because of its position as both a property owner and lessee of Midas and SpeeDee shops, the Company regularly has a portfolio of shops that have been previously operated by franchisees and on which the Company is not receiving rents or royalties. In the case of properties that are owned by MDS, the Company must pay ongoing real estate taxes, utilities, security and upkeep costs until the shops are refranchised. In the case of shops that are leased from third parties, the Company must also pay the third party lease costs.
26
Table of Contents
As of fiscal year-end 2009, the Company’s available shop inventory consisted of 67 shops, 13 of which were owned by the Company and 54 of which were leased from third parties. During 2009, the Company collected an average annual rent amount of $59,000 from the locations it leased to franchisees and collected an average of $29,000 in royalties from each Midas shop in North America. Therefore, the reopening of these available shops has the potential of adding significant revenues and operating profits in the future. The annual base rent obligation on the 54 shops that are leased from third parties is approximately $2.7 million.
Acquisitions and Conversions: The U.S. automotive repair industry is highly fragmented. This is demonstrated by the fact that Midas, as one of the largest automotive maintenance and repair providers in the U.S., has less than 1% of the automotive repair shops in the U.S. Despite the increase in the number of vehicles on the road in the U.S. over the last 15 years, the number of automotive service outlets in the U.S. has been in decline. Vehicle complexity and the resulting need for highly skilled technicians, training programs and technologically advanced diagnostic equipment, along with the increased cost of real estate, has caused a net decrease of almost 7% of all automotive repair outlets in the past 10 years. More recently, automobile dealerships have been closing in record numbers, causing consumers to seek out alternatives.
The Company believes that the acquisition of existing automotive repair shops, as well as the conversion of independent repair facilities to the Midas, SpeeDee or Co-Brand formats, is the most efficient way to grow the MDS system. Furthermore, the Company believes that the current economic environment will result in an increase in acquisition and conversion opportunities, as competitors struggle to remain viable during this economic downturn.
Growing Comparable Shop Sales
MDS management believes the key to growing sales in the Midas system in North America is to focus on those services that are most critical to the regular maintenance of vehicles: brake replacement, fluid replacement and tire replacement. These services are required of all vehicles at periodic intervals and management believes future success in automotive service requires that a service provider possess expertise, credibility and top-of-mind awareness in all three categories. These periodic services will serve as the gateway to forming broader, long-term relationships with customers, including factory scheduled maintenance and major repairs.
Brakes: The Midas system has long been a leader in the brake category throughout North America. The Company’s strength in brake services dates back nearly 30 years and is backed by the well-known Midas lifetime guarantee. Brakes are the largest and most profitable service category for the Midas system. Brake sales at retail have declined over the past several years, producing a significant drag on overall system sales performance. The Company’s efforts to drive retail brake sales starts with ensuring brake product quality across the Midas system. During 2008, the Company introduced new mandatory minimum performance standards for Midas brake friction to be used by franchisees. In connection with the improved product quality standards, the Company launched its SecureStop branded brake service, which helps Midas differentiate the service provided by Midas shops amongst numerous competitors who rely almost exclusively on price. In 2009, the Company changed its promotional brake strategy from national single-price-point television advertising to a more locally-focused advertising approach. Brake service is very competitive on a local level and management believes the move to local advertising provides Midas franchisees with greater flexibility in addressing local market conditions. Furthermore, it allows for a more consistent share of voice in brake promotions. Finally, the Company is in the process of redefining its selling and operating process for customers in need of brake services. The new process will focus on establishing greater operating uniformity throughout the Midas system, including phone handling, customer interaction, product stocking and the brake inspection process as well as the customer follow-up process.
Tires: In the last five years, Midas successfully launched a major retail initiative to significantly expand Midas shop sales of tires and related tire services. In support of this objective, the Company formed an alliance with Bridgestone-Firestone to distribute tires directly to Midas system shops throughout North America. As a result, comparable shop sales of tires and related tire services in North America increased significantly in each of the past four years. Despite this multi-year success in driving tire sales, tires remain a relatively small component
27
Table of Contents
of the Midas system’s overall sales mix: less than 7% in the U.S. and 10% in Canada for 2009. Management believes that achieving a 20% sales mix in tires is both attainable and important to the future growth of the Midas system in North America.
The Company continues to test a significantly expanded tire program in certain company-operated and franchised Midas shops. If this program succeeds, it will serve as a model for shops throughout the Midas system. Going forward, the Company believes that sales of tires and related tire services will be a significant component of future revenue growth for the Midas system.
Fluid Exchanges: In fiscal 2005, the Company began the roll out of a series of initiatives designed to build sales in maintenance services as a means to increase repeat customer business. The program most importantly included the standardization of the Midas oil change service and vehicle inspection process, providing all customers with suggested factory maintenance schedules and increasing the Midas shop’s focus and capabilities in fluid exchange services, which are an increasingly important component of factory scheduled maintenance.
In response to the Company’s efforts to build maintenance revenues and increase shop visit frequency, comparable shop sales of oil changes in North America have increased in each of the past three years, including a 27% increase in 2009 in the U.S. However, revenues from this category still represent less than 9% of U.S. Midas system sales, and the typical Midas shop performs only about seven oil changes per day. While oil change revenue and car count have been growing over the past several years, management believes the Midas system has the capacity to significantly increase that number by leveraging the operating knowledge of the SpeeDee system and enhancing local marketing efforts. Growth in car count is important to driving sales growth in the Midas system.
In support of the above initiatives, the Company recently reorganized its field operations staff in order to improve operating execution and increase consistency in the way Midas franchisees approach customers. This new approach, which is being referred to internally as The Midas Way, will be rolled-out to all Midas shops in North America during 2010.
The Midas-SpeeDee Co-Brand Opportunity: The Company believes the acquisition of SpeeDee provides both the Midas and SpeeDee franchise systems with a unique opportunity for growth in the future. By combining into one location Midas’ expertise in general repairs and strong brand awareness with SpeeDee’s strength in executing quick-lube and fluid exchanges, the Company believes it can create a powerful new format focused on satisfying the needs of time-pressed consumers seeking value, excellence and a long-term auto service relationship. The Company expects that a Midas-SpeeDee Co-Brand format shop will see customers much earlier in the lifecycle of their vehicle (relative to the typical Midas shop) and will be more able to convert these vehicles into general repair customers (relative to the typical SpeeDee shop) as the vehicles age. The resulting higher unit sales volume may produce a higher return on investment for the franchisee by better leveraging shop overhead expenses.
The Company launched its first test of the Midas-SpeeDee Co-Brand concept with three shops during the third quarter of fiscal 2008. All three were existing SpeeDee locations in California that added the Midas brand to their shop. A fourth Co-Branded unit, also in California, opened on a de novo basis in October 2008. The initial results have been encouraging. The three SpeeDee shops that converted to Co-Brand units in California have generated significant comparable shop sales increases since launch, and the shops have far outperformed the SpeeDee-only units in the same region. In the fourth quarter of fiscal 2009, these shops, along with the de novo Co-Brand, generated an 8% sales increase, which was on top of the 13% increase achieved in the same quarter one year ago when the new format was launched. During the full year of fiscal 2009, the original Co-Brand units increased comparable shop sales by 10% compared to a flat sales performance in the SpeeDee shops in California, and a nearly 4% decline in sales for Midas shops in California. Based on the success of these shops, the Company has begun to offer the Co-Brand opportunity to other SpeeDee franchisees and expects to Co-Brand at least 10 additional SpeeDee locations in 2010.
28
Table of Contents
During December of 2008, the Company began a test of the Co-Brand concept within existing Midas shops. Four Midas company-operated shops in suburban Chicago were remodeled to accommodate the operating requirements of the SpeeDee concept. In the third quarter of fiscal 2009, the Company remodeled and launched the Co-Brand concept in its company-operated shops in San Diego, CA. In the fourth quarter of fiscal 2009, the shops combined to generate a comparable shop sales increase of 11%, and they more than doubled their average daily car counts.
The ongoing testing of the Midas-SpeeDee Co-Brand concept encompasses numerous shop formats, and the Company expects that such testing will continue into 2010. The results of these tests will be critical in determining the issues involved with integrating the SpeeDee model into selected Midas locations across the U.S. and Canada. The Company expects to Co-Brand at least 10 additional Midas locations in 2010.
As of January 2, 2010, there were 23 shops in North America operating as Co-Brand shops.
MDS management believes that while the current economic environment, and the need to develop stronger customer relationships and improve operations execution, pose significant challenges for automotive aftermarket service providers, the potential to succeed has never been greater for those existing franchisees that are willing and able to adapt.
Fiscal Reporting Periods
Fiscal 2009 and fiscal 2007 were each comprised of 52 weeks, while fiscal 2008 was comprised of 53 weeks. The extra week in fiscal year 2008 did not have a material impact on results of operations because the approximately $2 million in additional revenues were completely offset by a similar amount of additional costs and expenses.
Results of Operations—Fiscal 2009 Compared to Fiscal 2008
Total sales and revenues for fiscal 2009 declined $4.6 million, or 2.5%, from fiscal 2008. Within the retail auto service business, royalty revenues and license fees decreased $3.6 million, or 6.3%, from fiscal 2008. This decrease reflects fewer selling days, weakness in Midas retail sales as total North American comparable shop sales declined 1.6%, a reduction in the number of Midas shops in operation due to shop closures, a stronger U.S. dollar reducing the value of Canadian and European royalties and lower franchise fees. While royalty revenue in the Midas system was down in fiscal 2009, U.S. car count rose by 14% and U.S. oil change revenues increased by 27% on a comparable shop basis as the Company used value-priced oil changes to acquire new customers in 2009.
Revenues from real estate leases declined $2.0 million to $32.6 million driven by a net reduction in the number of shops paying rent to Midas due to shop closures, lower revenue from sales-based rental agreements and a weaker Canadian dollar.
Sales from company-operated shops were $65.4 million in fiscal 2009 compared to $61.4 million in fiscal 2008. The increased revenues reflect an increase in comparable shop sales of 2.4% during fiscal 2009, as well as an increase in the company-operated shop count due to net shop acquisitions in the past 12 months.
Replacement part sales and product royalties decreased 11.6% from $29.2 million to $25.8 million in fiscal 2009 as equipment revenue and sales of tires to U.S. franchisees declined. The Company recorded lower sales of tires to U.S. Midas franchisees despite the fact that tire revenues grew 7.9% at retail. U.S. Franchisees are purchasing more tires from local distributors approved by Bridgestone-Firestone in order to diversify their tire offering. These local purchases are direct between the Midas franchisee and the local tire distributor and are therefore not included in sales and revenues. Software sales and maintenance revenue increased $0.4 million to $5.4 million reflecting continued growth in the Company’s R.O. Writer point-of-sale software business, especially with customers outside of the Midas system.
29
Table of Contents
Total operating costs and expenses increased $2.5 million, or 1.5%, in fiscal 2009 to $168.6 million. Occupancy expenses for franchised shops declined $0.1 million to $22.7 million in fiscal 2009 due to fewer shops under lease. Company-operated shop costs and expenses rose to $68.3 million in fiscal 2009 from $63.0 million in fiscal 2008. The increase in operating expenses was driven by higher sales, additional shops and incremental overhead required to support the higher shop count, and one-time costs associated with launching the Co-Brand test concept in Chicago and San Diego. Payroll and employee benefit costs increased to 43.0% of company-operated shop sales in fiscal 2009 compared to 42.5% in the same period of the prior year, primarily due to increased headcount to launch the Chicago and San Diego Co-Brand units. Company-operated shop occupancy and other expenses as a percentage of company-operated shop sales were 33.6% for fiscal 2009 compared to 33.9% for the prior year. Company-operated shop cost of sales increased from 26.2% of company-operated shop sales in fiscal 2008 to 27.8% in fiscal 2009, primarily as a result of an increase in the proportion of sales of oil and tires and higher discounts that helped to drive customer traffic.
Replacement part cost of sales decreased to 88.8% of replacement part sales and product royalties, from 90.4% in fiscal 2008. The decreased cost of replacement part sales relative to revenue was due to a more favorable mix of the products sold to franchisees. Warranty expense in fiscal 2009 was $0.1 million compared to a benefit of $2.7 million in fiscal 2008. U.S. warranty expense increased each quarter during fiscal 2009 and no warranty expense was recorded in Canada in the second half of 2009. Both trends reflect changes in the warranty programs in both countries whereby Midas franchisees are now responsible for funding the warranty program and the Company’s future warranty expense will be exactly offset by warranty revenue. In fiscal 2009, the Company recorded favorable adjustments totaling $0.6 million to its U.S. and Canadian warranty reserves due to a change in estimate for the expected redemption rates for warranted product sold by Midas franchisees. In fiscal 2008, the Company recorded favorable adjustments totaling $3.4 million to its U.S. and Canadian warranty reserves due to a change in estimate for the expected redemption rates for warranted product sold by Midas franchisees.
Selling, general and administrative expenses in fiscal 2009 declined $2.9 million, or 5.4%, from fiscal 2008 to $51.2 million. The decrease was achieved despite incremental operating expenses related to the vesting of certain restricted stock, as well as ongoing legal costs for two purported class action lawsuits and the Norauto arbitration.
During fiscal 2009, MDS recorded business transformation charges of $3.2 million. The charges include $0.4 million for severance in connection with a reduction in force, $0.8 million of lease and other costs related to the closure of four unprofitable company-operated shops, and $1.5 million in third party consulting costs related to development of the Co-Brand building image, the re-design of the customer sales and follow-up process (and subsequent restructuring of the field organization) and a study of the Midas France business and marketplace. In addition, approximately $0.1 million is related to the changeover of the Canadian warranty program and $0.4 million is part of the Company’s final funding of the rollout of a new shop image for Canadian Midas franchisees. During fiscal 2008, the Company recorded business transformation charges of $1.6 million. The 2008 charges reflected $1.3 million for the Company’s partial funding of the rollout of a new shop image for Midas franchisees and $0.3 million for the closure of an unprofitable company operated shop.
During fiscal 2009, the Company recorded a loss on sale of $0.2 million in connection with the sale of certain company-operated shop assets. During fiscal 2008, the Company recorded a loss on sale of $0.9 million in connection with the sale of certain shop assets.
As a result of the above changes, operating income decreased $7.1 million to $14.2 million in fiscal 2009 from $21.3 million in fiscal 2008 and operating income margin decreased to 7.8% of sales from 11.4% of sales.
Interest expense was $8.3 million in fiscal 2009 compared to $9.1 million in fiscal 2008. Interest expense declined in the current year due to lower average bank debt compared to the prior year and a reduction in the Company’s average borrowing rate.
30
Table of Contents
Other income was $0.4 million in fiscal 2009 compared to $0.8 million in fiscal 2008. Other income consists primarily of interest income on overdue customer accounts and foreign currency exchange gains or losses.
The Company’s effective tax rate was 58.7% in fiscal 2009 compared to 40.3% in fiscal 2008 and the 2009 statutory tax rate of 39.2%. The fiscal 2009 variance from the statutory rate was primarily due to the revaluation of the remaining U.S. deferred tax asset associated with restricted stock that vested in May 2009 at a stock price that was lower than the stock price on the day these awards were initially granted, as well as a write-down of the Canadian deferred tax asset due to a reduction in corporate income tax rates for both Ontario and British Columbia enacted during fiscal 2009.
As a result of the above items, net income decreased $5.2 million from net income of $7.8 million in fiscal 2008 to net income of $2.6 million in fiscal 2009.
Results of Operations—Fiscal 2008 Compared to Fiscal 2007
Total sales and revenues for fiscal 2008 increased $9.2 million, or 5.2%, from fiscal 2007 to $187.4 million. Within the retail auto service business, royalty revenues and license fees decreased $3.1 million, or 5.1%, from fiscal 2007. This decrease primarily reflects a scheduled reduction in the international royalties paid by Midas Europe to MDS of approximately $4.5 million, weakness in retail sales as total North American comparable shop sales declined 2.0% and an increase in the number of company-operated shops whose royalties are eliminated. These impacts were partially offset by a $3.1 million increase in royalties due to the March 2008 acquisition of the SpeeDee business and additional selling days in 2008 due to the 53 week fiscal year.
Revenues from real estate leases declined $1.3 million to $34.6 million as higher revenues from scheduled rent increases were offset by a net reduction in the number of shops paying rent to Midas due to shop closures and the acquisition of company-operated shops, as well as lower revenue from sales-based rental agreements.
Sales from company-operated shops were $61.4 million in fiscal 2008 compared to $45.8 million in fiscal 2007. The increased revenues reflect a higher company-operated shop count due to shop acquisitions in the past 12 months. Comparable shop sales for the Midas company-operated shops were flat during fiscal 2008.
Replacement part sales and product royalties decreased 7.9% from $31.7 million to $29.2 million in fiscal 2008. During fiscal 2007, replacement part sales and product royalties included revenue of $1.9 million in connection with the sale of certain products that the Company purchased from AutoZone and simultaneously sold to NAPA, at cost, to facilitate the Company’s transition from AutoZone to NAPA as the key stocking product supplier to Midas franchisees in the U.S. Excluding these one-time sales to NAPA, replacement part sales and product royalties fell $0.6 million in fiscal 2008. A $2.5 million increase in replacement part sales due to growth in sales of tires, batteries, oil and equipment to Midas franchisees was offset by a $3.3 million decline in product royalties, primarily as a result of the change in the Midas warranty program in the U.S. Software sales and maintenance revenue increased $0.5 million to $5.0 million reflecting continued growth in the Company’s RO Writer point-of-sale software business.
Total operating costs and expenses increased $20.0 million, or 13.7%, in fiscal 2008 to $166.1 million primarily driven by the higher number of company-operated shops. Occupancy expenses for franchised shops increased $0.7 million, or 3.2%, reflecting scheduled increases in rent expense for shops leased by the Company, as well as a net increase in the number of leased shops. Company-operated shop costs and expenses rose to $63.0 million from $45.6 million in the prior year, mostly as a result of additional shops and the incremental overhead required to support them compared to the same period one year ago. Payroll and employee benefit costs increased to 42.5% of company-operated shop sales in fiscal 2008 compared to 41.7% in the prior year. Company-operated shop occupancy and other expenses increased as a percentage of sales from 33.4% in fiscal 2007 to 33.9% in fiscal 2008 as a result of changes in the composition of the company-operated shop portfolio. Company-operated shop cost of sales increased from 24.4% in fiscal 2007 to 26.2% in fiscal 2008, primarily as a result of an increase in sales of tires and higher discounts to drive customer traffic.
31
Table of Contents
Replacement part cost of sales increased to 90.4% of replacement part sales and product royalties from 82.0% in fiscal 2007. The increased cost of replacement part sales relative to revenue was due to the change in the U.S. warranty program beginning in fiscal 2008 in which Midas no longer collects product royalty revenue from U.S supply chain partners (such product royalties had no offsetting cost of sales). Warranty benefit in fiscal 2008 was $2.7 million compared to a benefit of $4.3 million in fiscal 2007. In fiscal 2008, the Company recorded favorable adjustments totaling $3.4 million to its U.S. and Canadian warranty reserves due to a change in estimate for the expected redemption rates for warranted product sold by Midas franchisees. In fiscal 2007, an $8.3 million favorable adjustment was recorded to the U.S. warranty reserve as a result of a change in estimate for the expected redemption rate on warranted brakes and exhaust.
Selling, general and administrative expenses in fiscal 2008 increased $0.9 million, or 1.7%, from fiscal 2007 to $54.1 million. The increase reflects an incremental $1.4 million in operating expense for the SpeeDee business, a $1.1 million increase in outside legal costs, primarily due to two potential class action lawsuits and a $0.8 million increase in costs incurred to accelerate the transition of shops to new owners. These areas of increased spending were partially offset by the Company’s ongoing expense reduction program, which included lower costs for rent in the Midas corporate office as a result of a new lease arrangement, as well as lower costs for management bonus compensation due to lower than expected operating results.
During fiscal 2008, the Company recorded business transformation charges of $1.6 million. The 2008 charges reflected $1.3 million for the Company’s partial funding of the rollout of a new shop image for Midas franchisees and $0.3 million for the closure of an unprofitable company operated shop. During fiscal 2007, the Company recorded business transformation charges of $3.7 million. The charges reflect $2.5 million in connection with the Company’s partial funding of the rollout of a new shop image for Midas franchisees, $1.0 million related to the early termination of the Company’s supply agreement with AutoZone, and $0.6 million for severance and other charges. Offsetting these charges in fiscal 2007 were credits of $0.4 million to reflect adjustments to the Company’s reserve for non-recoverable lease costs pertaining to the closure of six company-operated shops in 2006.
During fiscal 2008, the Company recorded a loss on sale of $0.9 million in connection with the sale of certain shop assets. During fiscal 2007, the Company sold its vacant manufacturing facility in Hartford, WI for approximately $1.1 million. As a result of this asset sale, the Company recorded a gain of approximately $0.2 million.
As a result of the above changes, operating income decreased $10.8 million to $21.3 million in fiscal 2008 from $32.1 million in fiscal 2007 and operating income margin decreased to 11.4% of sales from 18.0% of sales.
Interest expense was $9.1 million in fiscal 2008 compared to $9.1 million in fiscal 2007. Interest expense was flat compared to the prior year despite higher average bank debt compared to the prior year (due to the SpeeDee acquisition in March 2008) primarily due to a reduction in the Company’s borrowing rate.
Other income was $0.8 million in fiscal 2008 compared to $0.4 million in fiscal 2007. Other income consists primarily of interest income on overdue customer accounts and foreign currency exchange gains or losses.
The Company’s effective tax rate was 40.3% in 2008 compared to 44.0% in fiscal 2007 and compared to the 2008 statutory tax rate of 39.2%. The fiscal 2008 variance from the statutory rate was primarily due to the impact of non-deductible executive compensation and other non-deductible expenses.
As a result of the above items, net income decreased $5.2 million from net income of $13.0 million in fiscal 2007 to net income of $7.8 million in fiscal 2008.
32
Table of Contents
Liquidity, Financial Condition and Capital Resources
Following is a summary of the Company’s cash flows from operating, investing and financing activities for fiscal 2009 and 2008, respectively (in millions):
| 2009 | 2008 | |||||||
| Cash provided by operating activities before cash outlays for business transformation costs and net changes in assets and liabilities |
$ | 21.5 | $ | 26.9 | ||||
| Cash outlays for business transformation costs |
(2.0 | ) | (1.5 | ) | ||||
| Net changes in assets and liabilities, exclusive of the effects of business transformation charges, acquisitions and dispositions |
(0.1 | ) | 1.0 | |||||
| Net cash provided by operating activities |
19.4 | 26.4 | ||||||
| Net cash used in investing activities |
(4.1 | ) | (29.9 | ) | ||||
| Net cash provided by (used in) financing activities |
(15.5 | ) | 3.3 | |||||
| Net change in cash and cash equivalents |
$ | (0.2 | ) | $ | (0.2 | ) | ||
The Company’s cash management system permits the Company to make daily borrowings and repayments on its revolving line of credit, allowing MDS to minimize interest expense and to maintain a low cash balance. The Company’s cash and cash equivalents decreased $0.2 million in fiscal 2009.
The Company’s operating activities provided net cash of $19.4 million during fiscal 2009 compared to $26.4 million of cash provided by operations in fiscal 2008. Excluding cash outlays for business transformation costs and changes in assets and liabilities, cash provided by operating activities decreased from $26.9 million in fiscal 2008 to $21.5 million in fiscal 2009, due to the decrease in net income, a lower warranty liability adjustment, lower utilization of deferred tax assets, a decrease in the loss on sale of assets and lower depreciation and amortization, all of which was partially offset by higher business transformation charges. Cash outlays for business transformation costs increased from $1.5 million in fiscal 2008 to $2.0 million in fiscal 2009. Cash outlays for business transformation costs in fiscal 2009 primarily consisted of severance and outplacement costs related to a reduction-in-force, the Company’s update of its retail shop image, and consulting costs related to the development of the Co-Brand image, a re-design of the customer sales and follow-up process in Midas shops and a study of the Midas France business and marketplace. Cash outlays for business transformation costs in fiscal 2008 were primarily related to the Company’s update of its retail shop image.
Changes in assets and liabilities went from a $1.0 million source of cash in fiscal 2008 to a $0.1 million use of cash in fiscal 2009. The $0.1 million use of cash in fiscal 2009 was driven by a decline in accrued advertising due to the timing of payments as a result of changes in the Company’s marketing strategy and an increase in company-operated shop tire inventories offset by increased accounts payable. The $1.0 million source of cash in 2008 resulted primarily from an increase in accounts payable due to higher tire sales in the fourth quarter of fiscal 2008 and the timing of payments partially offset by a decline in accrued expenses and an increase in inventories.
Investing activities used $4.1 million of cash in fiscal 2009 compared to $29.9 million of cash used in fiscal 2008. Fiscal 2009 investing activities consisted of $3.1 million in capital expenditures, $1.3 million paid in conjunction with the acquisition of 10 shops and other assets from Midas franchisees and $0.3 million in cash generated as a result of the sale of four company-operated shops. The $3.1 million in capital expenditures included $1.6 million in Co-Brand related investments in Midas company-operated shops, $0.6 million for systems development projects, $0.5 million for company-operated shop equipment additions, $0.3 million of real estate and $0.1 million of other capital expenditures. Fiscal 2008 investing activities consisted of $24.5 million paid in conjunction with the acquisition of SpeeDee and the acquisition of shops and other assets from certain Midas franchisees, $6.4 million in capital expenditures and $1.0 million in cash generated as the result of the sale of ten company-operated shops. The $6.4 million in capital expenditures included $0.6 million in office renovation costs,
33
Table of Contents
$2.5 million for real estate purchases, $0.9 million for systems development projects, $1.8 million for company-operated shop equipment additions, $0.6 million in Co-Branding spending and other capital expenditures.
Net cash used in financing activities was $15.5 million in fiscal 2009, compared to net cash provided of $3.3 million in fiscal 2008. During fiscal 2009, MDS decreased total debt by $13.1 million, decreased outstanding checks by $0.2 million, paid $1.5 million for financing fees in association with the amendment and extension of the Company’s revolving credit facility and paid $0.7 million to repurchase shares of the Company’s common stock from employees to satisfy tax obligations upon vesting of restricted stock awards. During fiscal 2008, MDS increased total debt by $5.5 million, decreased outstanding checks by $2.0 million, paid $0.4 million to repurchase shares of the Company’s common stock and received $0.2 million in cash from the exercise of outstanding stock options.
On October 27, 2005, MDS entered into a five-year, unsecured $110 million revolving credit facility. On February 4, 2008, the Company amended the loan by increasing the revolving credit facility to $130 million. On December 4, 2009, MDS entered into a three-year extension of its existing unsecured revolving credit facility. The credit agreement was extended through October 27, 2013 with no material changes in existing covenants. The extended facility is for $125 million and is further expandable to $175 million by the Company with lender approval. The interest rate floats based on the underlying rate of LIBOR and the Company’s leverage and was priced at LIBOR plus 3.50% at January 2, 2010. This facility requires maintenance of certain financial covenants including maximum allowable leverage and minimum net worth. As of January 2, 2010, the Company was in compliance with all debt covenants.
As of January 2, 2010, a total of $71.9 million was outstanding under the revolving credit facility. As of January 3, 2009, a total of $83.6 million was outstanding under the revolving credit facility.
In November 2005, $20 million in revolving bank debt was converted from floating rate to fixed rate by locking-in LIBOR at 4.89% for a five-year period. In addition, in March 2007, MDS entered into an interest rate swap arrangement to convert an additional $25 million in revolving bank debt from floating rate to a fixed rate by locking-in LIBOR at 4.91% through October 2010. As a consequence, currently $45 million of the Company’s $71.9 million in revolving bank debt is at fixed rates.
The November 2005 and March 2007 swap arrangements have been designated as cash flow hedges and have been evaluated to be highly effective. As a result, the after-tax change in the fair value of these swaps is recorded in accumulated other comprehensive loss as a gain or loss on derivative financial instruments.
In January 2010, the Company entered into a $40 million forward starting swap to coincide with the end dates of its existing swaps. As a result of this forward swap transaction, in the period from November 2010 through October 2013 (end of the recently extended bank agreement) the Company has locked-in LIBOR at 2.71% for $40 million of revolving bank debt.
The fair values of the Company’s interest rate swaps are estimated using Level 2 inputs, which are based on model-derived valuations in which all significant inputs and significant value drivers are observable in active markets. The Company also considers counterparty credit-risk and bilateral or "own" credit risk adjustments in estimating fair value, in accordance with the requirements of generally accepted accounting principles.
On November 9, 2004, the MDS Board of Directors authorized a share repurchase program to begin in fiscal 2005 for up to $25 million of the Company’s outstanding common stock. On May 9, 2006, the MDS Board of Directors authorized a $25 million increase in the share repurchase program and on May 8, 2007 the Board authorized an additional $50 million increase. The Company has paid approximately $65.7 million for shares acquired under this current program since the buyback program was first authorized in 2004. At this time, the Company has temporarily suspended its share repurchases and is focused on reducing outstanding bank debt.
34
Table of Contents
In January 2010, the Company acquired 22 Midas shops from an existing franchisee in Northern California for total consideration of approximately $5.8 million. Simultaneous to the shop purchase, two shops were sold to a new Midas franchisee. The total cash outlay for the purchase, net of proceeds received in the shop sale was approximately $3.4 million.
Market conditions over the past year have positively affected the value of assets held by the Company’s pension plans as of January 2, 2010 after negatively affecting the value of the plans in 2008. Market fluctuations will impact the value of these assets in the future. The most recently reported pension values, as of January 2, 2010, reflected plan assets at fair market value of $49.2 million and an actuarial present value of projected benefit obligations of $67.1 million.
The Company’s policy is to fund the pension plans in accordance with applicable U.S. and Canadian government regulations and to make additional contributions as required. As of January 2, 2010, the Company had met all regulatory minimum funding requirements. In fiscal year 2008, MDS made no contributions to the Company’s pension plans as per the regulatory minimum funding requirements. As a result of the significant reduction in the fair value of the U.S. plan assets during fiscal 2008, MDS made a cash contribution of approximately $0.6 million in September 2009 to the plans. This contribution brought the plans in compliance with statutorily required funding levels based on the most recently released regulations from the U.S. Government. Based on the 2008 year-end minimum funding calculation, MDS will be required to make additional cash contributions of approximately $1.4 million to its plans during fiscal 2010. However, this funding amount will change based on the fiscal year 2009 year-end minimum funding calculation. The impact of this change is not known at this time.
The Company believes that cash generated from operations and availability under the current debt agreement provides sufficient liquidity to finance operations and execute strategic initiatives for at least the next 12 months.
Contractual Obligations
The following table reflects the Company’s contractual obligations under long-term debt and lease agreements as of January 2, 2010:
| Payments Due by Period (In millions) | |||||||||||||||
| Total | Less Than 1 Year |
1-3 Years |
4-5 Years |
After 5 Years | |||||||||||
| Short and long-term debt |
$ | 71.9 | $ | — | $ | — | $ | 71.9 | $ | — | |||||
| Capital lease obligations |
1.9 | 0.3 | 0.5 | 0.6 | 0.5 | ||||||||||
| Finance lease obligations |
31.7 | 1.2 | 3.0 | 3.7 | 23.8 | ||||||||||
| Operating leases |
141.9 | 26.8 | 45.5 | 29.1 | 40.5 | ||||||||||
| Other long-term obligations |
— | — | — | — | — | ||||||||||
| Total contractual obligations |
$ | 247.4 | $ | 28.3 | $ | 49.0 | $ | 105.3 | $ | 64.8 | |||||
The debt, capital lease obligations and finance lease obligation payments shown above represent principal payments required under those agreements. Additionally, MDS is required to make certain interest payments in connection with those obligations.
In addition to the amounts shown above, the Company currently has $0.8 million outstanding on standby letters of credit that expire in 2010.
35
Table of Contents
Additionally, MDS is due rental revenue in the amounts shown below under sublease agreements on leased properties and rental agreements on owned properties:
| Rental Revenue Due to Midas by Period (In millions) | |||||||||||||||
| Total | Less Than 1 Year |
1-3 Years |
4-5 Years |
After 5 Years | |||||||||||
| Rental revenue commitments on leased properties |
$ | 109.0 | $ | 21.4 | $ | 36.7 | $ | 22.2 | $ | 28.7 | |||||
| Rental revenue commitments on owned properties |
92.2 | 8.3 | 14.7 | 13.8 | 55.4 | ||||||||||
| Total rental revenue commitments |
$ | 201.2 | $ | 29.7 | $ | 51.4 | $ | 36.0 | $ | 84.1 | |||||
Critical Accounting Policies and Estimates
In preparing the consolidated financial statements in conformity with accounting principles generally accepted in the United States of America, management must make a variety of decisions which impact the reported amounts and related disclosures. Such decisions include the selection of the appropriate accounting principles to be applied, the assumptions on which to base accounting estimates, and the consistent application of those accounting principles. Due to the type of industry in which the Company operates and the nature of its business, and the Company’s recent business transformation process, the following accounting policies are those that management believes are most important to the portrayal of the Company’s financial condition and results and that require management’s most difficult, subjective or complex judgments, often as a result of the need to make estimates about the effect of matters that are inherently uncertain.
Valuation of Warranty Liabilities
Customers are provided a written warranty from MDS on certain Midas products purchased from Midas shops in North America, namely brake friction, mufflers, shocks and struts. The warranty will be honored at any Midas shop in North America and is valid for the lifetime of the vehicle, but is voided if the vehicle is sold. The Company maintains a warranty accrual to cover the estimated future liability associated with outstanding warranties. The Company determines the estimated value of outstanding warranty claims based on: 1) an estimate of the percentage of all warranted products sold and registered in prior periods at retail that are likely to be redeemed; and 2) an estimate of the cost of redemption of each future warranty claim on a current cost basis. These estimates are computed using actual historical registration and redemption data as well as actual cost information on current redemptions.
The determination of the number of products sold that are likely to be redeemed requires MDS to make significant estimates and assumptions regarding the relationship of historical warranty claim behavior; warranty claim behavior across product lines and geographical areas; and the impact of changes in consumer behavior on future warranty claims. A decrease of one percentage point in the estimated percentage of warranted products likely to be redeemed in the U.S. would have the effect of changing the Company’s January 2, 2010 outstanding U.S. warranty liability by approximately $1.6 million. A change in the estimated current cost of warranty redemptions of one dollar would have the effect of changing the outstanding U.S. warranty liability by $0.6 million.
As of January 1, 2008, the Company changed how the Midas warranty obligations are funded in the United States. From June 2003 through December 2007, product royalties received from the Company’s preferred supply chain vendors were recorded as revenue and substantially offset the cost of warranty claims. Beginning in fiscal 2008, the Midas warranty program in the United States is funded directly by Midas franchisees. The franchisees are charged a fee for each warranted product sold to customers. The fee is charged when the warranty is registered with the Company. The fee billed to franchisees is deferred and is recognized as revenue when the actual warranty is redeemed and included in warranty expense. This fee is intended to cover the Company’s cost of the new warranty program, thus revenues under this program will match expenses and the new warranty program will have no impact on the results of operations. In connection with this change, beginning in 2008 Midas system franchisees in the United States started receiving rebates on their purchases from the Company’s preferred supply chain vendors and
36
Table of Contents
MDS no longer receives product royalties on Midas franchisee purchases in the United States. Because the Company’s U.S. supply chain partners are responsible for the warranty of parts during the first 12 months, MDS did not begin to record revenues or expenses under the new program until fiscal 2009.
As of July 1, 2009, the Company changed how the Midas warranty obligations are funded in Canada to match the U.S. program. As a result, beginning in July 2009 Midas system franchisees in Canada started receiving rebates on their purchases from the Company’s preferred supply chain vendors and MDS no longer receives product royalties on Midas franchisee purchases in Canada. Because the Company’s Canadian supply chain partners are responsible for the warranty of parts during the first 12 months, MDS will not begin to record revenues or expenses under the new Canadian program until the third quarter of fiscal 2010.
As of January 2, 2010, deferred warranty obligations under these new U.S. and Canadian programs were $5.3 million and the warranty liability under the former program was $13.3 million.
Valuation of Receivables
The Company records receivables due from its franchisees and other customers at the time the sale is recorded in accordance with its revenue recognition policies. These receivables consist of amounts due from the sale of products, royalties due from franchisees and suppliers, rents and other amounts. The future collectability of these amounts can be impacted by the Company’s collection efforts, the financial stability of its customers, and the general economic climate in which it operates. Recent market conditions have increased the uncertainty in making these estimates. Any adverse change in these factors could have a significant impact on the collectability of these assets and could have a material impact on the Company’s consolidated financial statements.
The Company applies a consistent practice of establishing an allowance for accounts that it feels may become uncollectible through reviewing the historical aging of its receivables and by monitoring the financial strength of its franchisees and other customers. Where MDS becomes aware of a customer’s inability to meet its financial obligations (e.g., where it is in financial distress or has filed for bankruptcy), the Company specifically reserves for the potential bad debt to reduce the net recognized receivable to the amount it reasonably believes will be collected. The valuation of receivables is performed on a quarterly basis.
In addition, the Company records receivables from third parties at the time a transaction is completed. These third party receivables are recorded at their estimated net realizable value. On a quarterly basis, the Company assesses the collectibility of these receivables.
Pensions
The Company has non-contributory defined benefit pension plans covering certain of its employees. The Company’s funding policy for the U.S. plan is to contribute amounts sufficient to meet the minimum funding requirement of the Employee Retirement Income Act of 1974, plus any additional amounts the Company may deem to be appropriate. The Company accounts for its defined benefit pension plans in accordance with ASC 715 Compensation—Retirement Benefits, which requires that amounts recognized in the financial statements be determined on an actuarial basis. The amount recorded as pension assets or liabilities is determined by comparing the projected benefit obligation (PBO) to the fair value of the plan assets. Amounts recognized in accumulated other comprehensive loss consist of unrecognized actuarial gains, losses, and prior service costs, net of tax.
As of January 2, 2010, the Company has recorded accrued pension costs as follows (in millions):
| Fiscal Year |
2009 | |||
| Prepaid pension asset |
$ | 2.3 | ||
| Canadian prepaid reserve |
(2.3 | ) | ||
| Accrued pension liability |
(20.1 | ) | ||
| Accrued pension costs |
$ | (20.1 | ) | |
37
Table of Contents
The $2.3 million valuation reserve pertains to the partial wind-up of the Canadian Salaried Defined Benefit Pension Plan. As per provincial laws, the asset balance in excess of the Projected Benefit Obligation is not an asset of the Company.
To account for its defined benefit pension plans in accordance with ASC 715, the Company must make three main determinations at the end of each fiscal year: First, it must determine the actuarial assumption for the discount rate used to reflect the time value of money in the calculation of the projected benefit obligation for the end of the current fiscal year and to determine the net periodic pension cost for the subsequent year. To determine this rate, the Company prepares a detailed analysis of projected future cash flows using the Citigroup Pension Discount Curve. See Note 9 of Notes to Financial Statements for a listing of the discount rates used by year.
Second, the Company must determine the actuarial assumption for rates of increase in compensation levels used in the calculation of the accumulated and projected benefit obligations for the end of the current fiscal year and to determine the net periodic pension cost for the subsequent year. In determining these rates the Company looks at its historical and expected rates of annual salary increases. See Note 9 of Notes to Financial Statements for a listing of the rates of increase in compensation levels used by year.
Third, the Company must determine the expected long-term rate of return on assets assumption that is used to determine the expected return on plan assets component of the net periodic pension cost for the subsequent year. The difference between the actual return on plan assets and the expected return is deferred and is recognized in net periodic pension cost over a five-year period. See Note 9 of Notes to Financial Statements for a listing of the expected long-term rates used by year. The Company assumed a long-term rate of return on pension assets of 8.25% in fiscal 2009 and 2008, and experienced a gain on plan assets of $6.2 million in fiscal 2009 and a loss on plan assets of $14.6 million in fiscal 2008.
Recent market conditions have resulted in an unusually high degree of volatility and increased risks associated with certain investments held by MDS pension plans, which could impact the value of investments, net periodic pension costs and future funding requirements after the date of this filing. The Company’s pension plan investments are comprised of bond and equity mutual funds and cash reserves. The pension plans have no investments in alternative investment vehicles such as private equity funds or hedge funds, nor have the plans ever held such investments.
Carrying Values of Goodwill and Long-Lived Assets
Goodwill: The Company tests the recorded amount of goodwill for recovery on an annual basis in the fourth quarter of each fiscal year. Goodwill is tested more frequently if indicators of impairment exist. The Company continually assesses whether any indicators of impairment exist, which requires a significant amount of judgment. Such indicators may include: a sustained significant decline in our share price and market capitalization; a decline in our expected future cash flows; a significant adverse change in legal factors or in the business climate; unanticipated competition; the testing for recoverability of a significant asset group within a reporting unit; or slower growth rates, among others. Any adverse change in these factors could have a significant impact on the recoverability of these assets and could have a material impact on our consolidated financial statements.
The goodwill impairment test is a two step analysis. In Step One, the fair value of each reporting unit is compared to its book value. Management must apply judgment in determining the estimated fair value of these reporting units. Fair value is determined using a combination of present value techniques and quoted market prices of comparable businesses. If the fair value of the reporting unit exceeds its carrying value, goodwill is not deemed to be impaired for that reporting unit, and no further testing would be necessary. If the fair value of the reporting unit is less than the carrying value, the Company performs Step Two. Step Two uses the calculated fair value of the reporting unit to perform a hypothetical purchase price allocation to the fair value of the assets and liabilities of the reporting unit. The difference between the fair value of the reporting unit calculated in Step One
38
Table of Contents
and the fair value of the underlying assets and liabilities of the reporting unit is the implied fair value of the reporting unit’s goodwill. A charge is recorded in the financial statements if the carrying value of the reporting unit’s goodwill is greater than its implied fair value.
The determination of fair value of the reporting units and assets and liabilities within the reporting units requires management to make significant estimates and assumptions. These estimates and assumptions primarily include, but are not limited to, the discount rate, terminal growth rates, earnings before depreciation and amortization, and capital expenditures forecasts. Due to the inherent uncertainty involved in making these estimates, actual results could differ from those estimates. In both the U.S. and Canada, the reporting unit is defined as retail operations, which consists of both franchised and Company-operated locations.
Long-lived Assets: Long-lived assets include property and equipment, intangible assets, long-term prepaid assets and other non-current assets. The Company reviews long-lived assets held for use for impairment whenever events or changes in circumstances indicate that the carrying amount may not be recoverable. Events that may indicate long-lived assets may not be recoverable include, but are not limited to, a significant decrease in the market price of long-lived assets, a significant adverse change in the manner in which the Company utilizes a long-lived asset, a significant adverse change in the business climate, a recent history of operating or cash flow losses, or a current expectation that it is more likely than not likely that a long-lived asset will be sold or disposed of in the future. For impairment testing purposes, the Company groups its long-lived assets at the lowest level for which identifiable cash flows are largely independent of the cash flows of other groups of assets and liabilities (the asset group).
If the Company determines that a long-lived asset or asset group may not be recoverable, it compares the sum of the expected undiscounted future cash flows that the asset or asset group is expected to generate to the asset or asset group’s carrying value. If the sum of the undiscounted future cash flows exceed the carrying amount of the asset or asset group, the asset or asset group is not considered impaired. However, if the sum of the undiscounted future cash flows is less than the carrying amount of the assets or asset group, a loss is recognized for the difference between the fair value of the asset or asset group and the carrying value of the asset or asset group. The fair value of the asset or asset group is generally determined by discounting the expected future cash flows using a discount rate that is commensurate with the risk associated with the amount and timing of the expected future cash flows. Due to the inherent uncertainty involved in making these estimates, actual results could differ from those estimates.
Deferred Income Taxes
In assessing the valuation of deferred tax assets, management considers whether it is more likely than not that some portion or all of the deferred tax assets will not be realized. The ultimate realization of deferred tax assets is dependent upon the generation of future taxable income during the periods in which those temporary differences become deductible. Management considers the scheduled reversal of deferred tax liabilities, projected future taxable income, and tax planning strategies in making this assessment. Any adverse change in these factors could have a significant impact on the realizability of the Company’s deferred tax assets and could have a material impact on the Company’s consolidated financial statements.
Based upon the level of historical taxable income and projections for future taxable income over the periods in which the deferred tax assets are deductible, management believes it is more likely than not that the Company will realize the benefits of these deductible differences at January 2, 2010. In the event that management determines the Company would not be able to realize all or part of the net deferred tax assets in the future, an adjustment to the deferred tax assets would be charged to income in the period such determination was made. As of January 2, 2010, the Company had recorded a valuation allowance of $0.4 million against certain state income tax net operating loss carry forwards because the Company has determined that it is more likely than not that this portion of these deferred tax assets will not be realized. However, due to the inherent uncertainty involved in determining the realizability of the company’s deferred tax assets, the future realizability could differ from management estimates at January 2, 2010.
39
Table of Contents
Impact of New Accounting Standards
New Accounting Pronouncements—Adopted
On October 3, 2009, MDS adopted changes issued by the Financial Accounting Standards Board (“FASB”) to the authoritative hierarchy of Generally Accepted Accounting Principles (“GAAP”). These changes establish the FASB Accounting Standards Codification (Codification) as the source of authoritative accounting principles recognized by the FASB to be applied by nongovernmental entities in the preparation of financial statements in conformity with GAAP. Rules and interpretive releases of the Securities and Exchange Commission (“SEC”) under authority of federal securities laws are also sources of authoritative GAAP for SEC registrants. The FASB will no longer issue new standards in the form of Statements, FASB Staff Positions, or Emerging Issues Task Force Abstracts; instead the FASB will issue Accounting Standards Updates. Accounting Standards Updates (“ASUs”) will not be authoritative in their own right as they will only serve to update the Codification. These changes and the Codification itself do not change GAAP. Other than the manner in which new accounting guidance is referenced, the adoption of these changes had no impact on the Financial Statements.
On July 4, 2009, MDS adopted changes issued by the FASB to accounting for and disclosure of events that occur after the balance sheet date but before financial statements are issued or are available to be issued, otherwise known as “subsequent events.” Specifically, these changes set forth the period after the balance sheet date during which management of a reporting entity should evaluate events or transactions that may occur for potential recognition or disclosure in the financial statements, the circumstances under which an entity should recognize events or transactions occurring after the balance sheet date in its financial statements, and the disclosures that an entity should make about events or transactions that occurred after the balance sheet date. The adoption of these changes had no impact on the Financial Statements as management already followed a similar approach prior to the adoption of this new guidance.
On July 4, 2009, MDS adopted changes issued by the FASB to fair value disclosures of financial instruments. These changes require a publicly traded company to include disclosures about the fair value of its financial instruments whenever it issues summarized financial information for interim reporting periods. Such disclosures include the fair value of all financial instruments, for which it is practicable to estimate that value, whether recognized or not recognized in the statement of financial position; the related carrying amount of these financial instruments; and the method(s) and significant assumptions used to estimate the fair value. Other than the required disclosures, the adoption of these changes had no impact on the Financial Statements.
On January 4, 2009, MDS adopted changes issued by the FASB to the calculation of earnings per share. These changes state that unvested share-based payment awards that contain nonforfeitable rights to dividends or dividend equivalents (whether paid or unpaid) are participating securities and shall be included in the computation of earnings per share pursuant to the two-class method for all periods presented. The adoption of these changes requires all prior-period earnings per share data that is presented to be adjusted retrospectively. Specifically, MDS included 361,000 incremental shares in weighted-average common shares outstanding calculations for fiscal 2009, with a corresponding decrease in the effect of dilutive stock awards. MDS also was required to include 240,000 and 155,000 incremental shares in the weighted-average common shares outstanding calculations for 2008 and fiscal 2007 respectively. These incremental shares had no impact on fiscal 2008 Basic Earnings Per Share but caused a $0.01 decrease in Basic Earnings Per Share in fiscal 2009 and 2007.
In August 2009, the FASB issued changes to fair value accounting for liabilities. These changes clarify existing guidance that in circumstances in which a quoted price in an active market for the identical liability is not available, an entity is required to measure fair value using a valuation technique that uses a quoted price of either a similar liability or a quoted price of an identical or similar liability when traded as an asset, or another valuation technique that is consistent with the principles of fair value measurements, such as an income approach (e.g., present value technique). This guidance also states that both a quoted price in an active market for the identical liability and a quoted price for the identical liability when traded as an asset in an active market when
40
Table of Contents
no adjustments to the quoted price of the asset are required are Level 1 fair value measurements. These changes became effective for MDS on October 4, 2009. The adoption of these changes did not have an impact on the Financial Statements.
In December 2008, the FASB issued changes to employers’ disclosures about postretirement benefit plan assets. These changes provide guidance on an employer’s disclosures about plan assets of a defined benefit pension or other postretirement plan. This guidance is intended to ensure that an employer meets the objectives of the disclosures about plan assets in an employer’s defined benefit pension or other postretirement plan to provide users of financial statements with an understanding of the following: how investment allocation decisions are made; the major categories of plan assets; the inputs and valuation techniques used to measure the fair value of plan assets; the effect of fair value measurements using significant unobservable inputs on changes in plan assets; and significant concentrations of risk within plan assets. These changes became effective for MDS on January 2, 2010. As these changes only require enhanced disclosures, management has determined that the adoption of these changes will not have an impact on the Financial Statements.
New Accounting Pronouncements—Issued
In January 2010, the FASB issued new guidance and clarifications for improving disclosures about fair value measurements. This guidance requires enhanced disclosures regarding transfers in and out of the levels within the fair value hierarchy. Separate disclosures are required for transfers in and out of Level 1 and 2 fair value measurements, and the reasons for the transfers must be disclosed. In the reconciliation for Level 3 fair value measurements, separate disclosures are required for purchases, sales, issuances, and settlements on a gross basis. MDS does not anticipate the adoption of this guidance to materially impact the Company. The new disclosures and clarifications of existing disclosures are effective for interim and annual reporting periods beginning after December 15, 2009, except for the disclosures about purchases, sales, issuances, and settlements in the roll forward of activity in Level 3 fair value measurements, which are effective for interim and annual reporting periods beginning after December 15, 2010.
In October 2009, the FASB issued new accounting guidance related to the recognition of revenue for multiple deliverable arrangements. Under the new guidance, revenue will be allocated to the different elements in an arrangement based on relative sales price. The new guidance will be effective prospectively for revenue arrangements entered into or materially modified for the Company’s 2011 fiscal year which begins on January 2, 2011. In October 2009, the FASB issued new accounting guidance which alters the scope of revenue recognition for software deliverables to exclude items sold that include hardware with software that is essential to its functionality. The new guidance will be effective prospectively for revenue arrangements entered into or materially modified for the Company’s 2011 fiscal year which begins on January 2, 2011. Early adoption of this new guidance is permitted. The Company has determined that the adoption of this guidance will have no impact on the on the Company’s Financial Statements.
In June 2009, the FASB issued changes to the accounting for variable interest entities. These changes require an enterprise to perform an analysis to determine whether the enterprise’s variable interest or interests give it a controlling financial interest in a variable interest entity; to require ongoing reassessments of whether an enterprise is the primary beneficiary of a variable interest entity; to eliminate the quantitative approach previously required for determining the primary beneficiary of a variable interest entity; to add an additional reconsideration event for determining whether an entity is a variable interest entity when any changes in facts and circumstances occur such that holders of the equity investment at risk, as a group, lose the power from voting rights or similar rights of those investments to direct the activities of the entity that most significantly impact the entity’s economic performance; and to require enhanced disclosures that will provide users of financial statements with more transparent information about an enterprise’s involvement in a variable interest entity. These changes become effective for MDS on January 3, 2010. The adoption of these changes will not have an impact on the Company’s Financial Statements.
41
Table of Contents
In June 2009, the FASB issued a new accounting standard relating to the accounting for transfers of financial assets. The new standard eliminates the concept of a qualifying special-purpose entity and clarifies existing GAAP as it relates to determining whether a transferor has surrendered control over transferred financial assets. The standard limits the circumstances in which a financial asset, or portion of a financial asset, should be derecognized when the transferor has not transferred the entire original financial asset to an entity that is not consolidated with the transferor in the financial statements presented and/or when the transferor has continuing involvement with the transferred financial asset. The standard also requires enhanced disclosures about transfers of financial assets and a transferor’s continuing involvement with transferred financial assets. It is effective for fiscal years, and interim periods within those fiscal years, beginning after November 15, 2009, with early adoption prohibited. The new standard will be applied prospectively, except for the disclosure requirements, which will be applied retrospectively for all periods presented. The new standard, which is effective for the company as of January 3, 2010, is not expected to have a material impact on the Company’s consolidated financial statements.
Forward Looking Statements
This report contains (and oral communications made by MDS may contain) forward-looking statements that may be identified by their use of words like “plans,” “expects,” “anticipates,” “intends,” “estimates,” “forecasts,” “will,” “outlook” “should” or other words of similar meaning. All statements that address the Company’s expectations or projections about the future, including statements about MDS’s strategy for growth, cost reduction goals, expenditures and financial results, are forward-looking statements. Forward-looking statements are based on the Company’s estimates, assumptions and expectations of future events and are subject to a number of risks and uncertainties. MDS cannot guarantee that these estimates, assumptions and expectations are accurate or will be realized. MDS disclaims any intention or obligation (other than as required by law) to update or revise any forward-looking statements.
The Company’s results of operations and the forward-looking statements could be affected by, among others things: general economic conditions in the markets in which the Company operates; economic developments that have a particularly adverse effect on one or more of the markets served by the Company; the ability to execute management’s internal operating plans; the timing and magnitude of capital expenditures; the Company’s ability to access debt and equity markets; economic and market conditions in the U.S. and worldwide; currency exchange rates; changes in consumer spending levels and demand for new products and services; and overall competitive activities. Certain of these risks are more fully described in Item 1 of Part I of this annual report. The Company disclaims any intention or obligation to update or revise any forward-looking statements, whether as a result of new information, future events, or otherwise.
| Item 7A. | Quantitative and Qualitative Disclosures About Market Risk |
The Company is subject to certain market risks, including foreign currency and interest rates. MDS uses a variety of practices to manage these market risks, including, when considered appropriate, derivative financial instruments. The Company uses derivative financial instruments only for risk management and does not use them for trading or speculative purposes. MDS is exposed to potential gains or losses from foreign currency fluctuations affecting net investments and earnings denominated in foreign currencies. Historically, the Company’s primary exposure is to changes in exchange rates for the U.S. dollar versus the Canadian dollar. Beginning in fiscal 2008, the Company became exposed to changes in exchange rates between the U.S. dollar and the Euro for international license fees from Europe that were previously fixed and denominated in U.S. dollars.
Interest rate risk is managed through variable rate borrowings in combination with swaps to fixed interest rates on a portion of those borrowings. The Company is exposed to credit risk on certain assets, primarily accounts receivable. The Company provides credit to customers in the ordinary course of business and performs ongoing credit evaluations. Concentrations of credit risk with respect to trade receivables are limited due to the large number of customers comprising the Company’s customer base. The Company believes its allowance for doubtful accounts is sufficient to cover customer credit risk.
42
Table of Contents
The table below provides information about the Company's financial instruments that are sensitive to changes in interest rates. The table presents principal cash flows and related weighted-average interest rates by the expected maturity dates. The actual cash flows for each instrument are denominated and presented in U.S. dollar equivalents (in millions), which is the Company's reporting currency.
| Expected Maturity Date |
2010 | 2011 | 2012 | There- after |
Total | Fair Value | ||||||||||||||
| Long-term debt: |
||||||||||||||||||||
| Revolving credit facility (variable rate) |
$ | — | $ | — | $ | — | $ | 71.9 | $ | 71.9 | $ | 71.9 | ||||||||
| Average interest rate |
3.73 | % | 3.73 | % | ||||||||||||||||
The fair value of the Company’s revolving credit facility is determined as the present value of expected future cash flows discounted at the current interest rate for loans of similar terms and comparable credit risk. The debt was refinanced on December 4, 2009 and as a consequence the fair value of the debt approximates the notional value of the debt.
In November 2005, $20 million in revolving bank debt was converted from floating rate to fixed rate by locking-in LIBOR at 4.89% for a five-year period. In addition, in March 2007, MDS entered into an interest rate swap arrangement to convert an additional $25 million in revolving bank debt from floating rate to a fixed rate by locking-in LIBOR at 4.91% through October 2010. As a consequence, currently $45 million of the Company’s $71.9 million in revolving bank debt is at fixed rates.
The November 2005 and March 2007 swap arrangements have been designated as cash flow hedges and have been evaluated to be highly effective. As a result, the after-tax change in the fair value of these swaps is recorded in accumulated other comprehensive loss as a gain or loss on derivative financial instruments. As of January 2, 2010, the fair value of these instruments was a pre-tax loss of approximately $1.8 million.
In January 2010, the Company entered into a $40 million forward starting swap to coincide with the end dates of its existing swaps. As a result of this forward swap transaction, in the period from November 2010 through October 2013 (end of the recently extended bank agreement) the Company has locked-in LIBOR at 2.71% for $40 million of revolving bank debt.
The Company has no firmly committed sales transactions denominated in foreign currencies.
| Item 8. | Financial Statements and Supplementary Data |
See Index to Financial Statements on page F-1
| Item 9. | Changes in and Disagreements with Accountants on Accounting and Financial Disclosure |
Not applicable.
| Item 9A. | Controls and Procedures |
(a) Evaluation of disclosure controls and procedures.
The Company’s management, with the participation of the Company’s Chief Executive Officer and Chief Financial Officer, has evaluated the effectiveness of the Company’s disclosure controls and procedures (as such term is defined in Rules 13a-15(e) and 15d-15(e) under the Securities Exchange Act of 1934, as amended (the “Exchange Act”)) as of the end of the period covered by this report. Based on such evaluation, the Company’s Chief Executive Officer and Chief Financial Officer have concluded that, as of the end of such period, the Company’s disclosure controls and procedures were effective in recording, processing, summarizing and reporting, on a timely basis, information required to be disclosed by the Company in the reports that it files or submits under the Exchange Act.
43
Table of Contents
The Company's management, including the Chief Executive Officer and Chief Financial Officer, does not expect that its disclosure controls and procedures and its internal controls over financial reporting will prevent all errors and all fraud. A control system, no matter how well conceived and operated, can provide only reasonable, not absolute, assurance that the objectives of the control system are met.
(b) Changes in internal controls over financial reporting.
There were no changes in internal controls during the most recent fiscal quarter that have materially affected, or are reasonably likely to materially affect, internal controls over financial reporting.
Management’s Report on Internal Control Over Financial Reporting
Our management is responsible for establishing and maintaining adequate internal control over financial reporting. The Company’s internal control over financial reporting is designed to provide reasonable assurance regarding the reliability of financial reporting and the preparation of financial statements for external purposes in accordance with generally accepted accounting principles.
Our internal control over financial reporting includes those policies and procedures that:
| • | Pertain to the maintenance of records that, in reasonable detail, accurately and fairly reflect the transactions and dispositions of the assets of MDS; |
| • | Provide reasonable assurance that transactions are recorded as necessary to permit preparation of financial statements in accordance with generally accepted accounting principles, and that our receipts and expenditures are being made only in accordance with authorizations of the Company’s management and directors; and |
| • | Provide reasonable assurance regarding prevention or timely detection of unauthorized acquisition, use or disposition of our assets that could have a material effect on the financial statements. |
Because of its inherent limitations, internal control over financial reporting may not prevent or detect misstatements. Also, projections of any evaluation of effectiveness to future periods are subject to the risk that controls may become inadequate because of changes in conditions, or that the degree or compliance with the policies or procedures may deteriorate.
Management assessed the effectiveness of the Company’s internal control over financial reporting as of January 2, 2010. In making this assessment, management used the criteria set forth by the Committee of Sponsoring Organizations of the Treadway Commission (COSO) in Internal Control—Integrated Framework. Based on our assessment and those criteria, management believes that MDS maintained effective internal control over financial reporting as of January 2, 2010.
44
Table of Contents
Report of Independent Registered Public Accounting Firm on Internal Control Over Financial Reporting
The Board of Directors and Shareholders
Midas, Inc.:
We have audited Midas, Inc.’s internal control over financial reporting as of January 2, 2010, based on criteria established in Internal Control—Integrated Framework issued by the Committee of Sponsoring Organizations of the Treadway Commission (COSO). Midas, Inc’s management is responsible for maintaining effective internal control over financial reporting and for its assessment of the effectiveness of internal control over financial reporting, included in the accompanying Management’s Report on Internal Control over Financial Reporting. Our responsibility is to express an opinion on the Company’s internal control over financial reporting based on our audit.
We conducted our audit in accordance with the standards of the Public Company Accounting Oversight Board (United States). Those standards require that we plan and perform the audit to obtain reasonable assurance about whether effective internal control over financial reporting was maintained in all material respects. Our audit included obtaining an understanding of internal control over financial reporting, assessing the risk that a material weakness exists, and testing and evaluating the design and operating effectiveness of internal control based on the assessed risk. Our audit also included performing such other procedures as we considered necessary in the circumstances. We believe that our audit provides a reasonable basis for our opinion.
A company's internal control over financial reporting is a process designed to provide reasonable assurance regarding the reliability of financial reporting and the preparation of financial statements for external purposes in accordance with generally accepted accounting principles. A company's internal control over financial reporting includes those policies and procedures that (1) pertain to the maintenance of records that, in reasonable detail, accurately and fairly reflect the transactions and dispositions of the assets of the company; (2) provide reasonable assurance that transactions are recorded as necessary to permit preparation of financial statements in accordance with generally accepted accounting principles, and that receipts and expenditures of the company are being made only in accordance with authorizations of management and directors of the company; and (3) provide reasonable assurance regarding prevention or timely detection of unauthorized acquisition, use, or disposition of the company’s assets that could have a material effect on the financial statements.
Because of its inherent limitations, internal control over financial reporting may not prevent or detect misstatements. Also, projections of any evaluation of effectiveness to future periods are subject to the risk that controls may become inadequate because of changes in conditions, or that the degree of compliance with the policies or procedures may deteriorate.
In our opinion, Midas, Inc. maintained, in all material respects, effective internal control over financial reporting as of January 2, 2010, based on criteria established in Internal Control—Integrated Framework issued by the Committee of Sponsoring Organizations of the Treadway Commission (COSO).
We also have audited, in accordance with the standards of the Public Company Accounting Oversight Board (United States), the consolidated balance sheets of Midas, Inc. as of fiscal year end 2009 and 2008, and the related consolidated statements of operations, cash flows, and changes in shareholders’ equity for each of the fiscal years 2009, 2008 and 2007, and our report dated March 18, 2010 expressed an unqualified opinion on those consolidated financial statements.

KPMG LLP
Chicago, Illinois
March 18, 2010
45
Table of Contents
| Item 9B. | Other Information |
None
PART III
| Item 10. | Directors, Executive Officers and Corporate Governance of the Registrant |
Executive Officers of the Registrant
Information with respect to those individuals who serve as executive officers of the Company is set forth below.
| Name, Age and Position |
Background and Experience | |
| Alan D. Feldman (58) Chairman, President and Chief Executive Officer |
Mr. Feldman joined MDS as President and Chief Executive Officer in January 2003 and was named Chairman of the Board of Directors in May 2006. From 1994 through 2002, Mr. Feldman held senior management posts at McDonald’s Corporation. His most recent positions were President and Chief Operating Officer of McDonald’s Americas and President of McDonald’s USA. From 1983 to 1994, Mr. Feldman held financial and operational posts with the Pizza Hut and Frito-Lay units of Pepsico. In 1993 he was named Senior Vice President, Business Strategy, and Chief Financial Officer of Pizza Hut, and he served as Senior Vice President of Operations for Pizza Hut from 1990 to 1993. Mr. Feldman is also a director of Foot Locker, Inc. and John Bean Technologies Corporation. | |
| William M. Guzik (50) Executive Vice President and Chief Financial Officer |
Mr. Guzik joined MDS in December 1999 and was named Senior Vice President and Chief Financial Officer in May 2001. He was named Executive Vice President of the Company in November 2006. From 1995 to 1999, Mr. Guzik served as Chief Financial Officer of Delray Farms, LLC, a start-up grocery retailer located in Chicago, Illinois. From 1993 to 1995, Mr. Guzik served as Vice President and Chief Financial Officer of JG Industries, Inc., a publicly-traded, diversified retailer. Prior to that, Mr. Guzik spent 11 years with Coopers & Lybrand, LLP. | |
| Frederick W. Dow, Jr. (59) Senior Vice President and Chief Marketing Officer |
Mr. Dow joined MDS in June 2003. From October 2001 to March 2003, Mr. Dow was Senior Vice President, Marketing Programs and Sales, for Burger King Corporation. From December 2000 to October 2001, Mr. Dow served as Senior Vice President, Brand Management and Marketing Programs, for West Group, a provider of e-information solutions to the legal market. From September 1995 to December 2000, Mr. Dow served as Vice President, Marketing Programs and Worldwide Advertising, for Northwest Airlines. | |
46
Table of Contents
| Name, Age and Position |
Background and Experience | |
| Michael J. Gould (53) Senior Vice President—Franchise Operations |
Mr. Gould joined Midas in April 1980. In March 2009, Mr. Gould was named Senior Vice President, Franchise Operations. From August 2007 to March 2009, Mr. Gould served as Vice President Retail Operations and from January 2005 to August 2007, as Vice President of Midas’ company-operated shops business. Prior to January 2005, he held various positions in the Company’s franchise and company-operated shops operations. | |
| Alvin K. Marr (44) Senior Vice President, General Counsel & Secretary |
Mr. Marr was named Senior Vice President, General Counsel and Secretary in March 2005. From 2001 to 2005, Mr. Marr served as Vice President, General Counsel and Secretary of MDS. Mr. Marr joined MDS in 1997 as Assistant General Counsel and Assistant Secretary. From 1990 to 1997, Mr. Marr practiced law with the firm of Holleb & Coff in Chicago, IL. | |
| John A. Warzecha (61) Senior Vice President—Franchise Development |
Mr. Warzecha served as Vice President and General Manager of MDS’s company-operated shops from 1989 to 1993 and as Senior Vice President—U.S. Franchise Operations from 1993 to 1997. He joined Midas in 1973. | |
| John E. Brisson, Jr. (45) Vice President—Finance and Planning |
Mr. Brisson joined MDS in August 2001. He was named Vice President of Finance and Planning in February 2006. From 2004 to 2006, he served as Vice President of Financial Planning and Analysis and, from 2001 to 2004, he served as Director of Financial Planning and Analysis for the Company. From 1997 to 2001, Mr. Brisson served as Director of Planning for the automotive and major appliance divisions of Montgomery Ward & Co. | |
| James M. Haeger, Jr. (45) Vice President—Controller |
Mr. Haeger joined MDS in April 2001. He was named Vice President—Controller in February 2002. From 2000 to 2001, Mr. Haeger served in various financial positions for Valent Biosciences, a biotechnology subsidiary of Sumitomo Chemical. From 1991 to 2000, Mr. Haeger held various financial, operating and accounting positions with Abbott Laboratories. Prior to that, Mr. Haeger spent five years with KPMG LLP. | |
Additional information required by this item, which is set forth under the headings “Proposal 1: Election Of Directors,” “Meetings and Committees of the Board” and “Beneficial Ownership of Common Stock—Section 16 (a) Beneficial Ownership Reporting Compliance” in the Company’s proxy statement (the “2010 Proxy Statement”) for the Annual Meeting of Shareholders to be held on May 11, 2010, is incorporated herein by reference.
There are no family relationships among any of our directors, executive officers or persons nominated to become a director or executive officer.
47
Table of Contents
The Company has adopted a code of ethics that applies to all of its employees, officers, and directors, including its principal executive officer, principal financial officer, and principal accounting officer (controller). The text of the Company's code of ethics is posted on its website at www.midas.com. The Company intends to disclose future amendments to, or waivers from, certain provisions of the code of ethics for executive officers and directors on the Company's website within five business days following the date of such amendment or waiver. Stockholders may request a free copy of the code of ethics from:
Alvin K. Marr
Corporate Secretary
Midas, Inc.
1300 Arlington Heights Road
Itasca, IL 60143
Telephone: (630) 438-3000
MDS has also adopted written charters for its Audit and Finance, Compensation, and Nominating and Corporate Governance Committees, and Corporate Governance Guidelines, all of which are posted on the Company's website at www.midas.com. Stockholders may request a free copy of the charters and guidelines from the address or telephone number set forth above.
On May 22, 2009, MDS submitted its Section 303A Annual Written Affirmation to the New York Stock Exchange (“NYSE”), including the CEO certification regarding the Company’s compliance with the NYSE corporate governance listing standards, in accordance with the NYSE rules.
Information required by this item is set forth in the 2010 Proxy Statement and is incorporated herein by reference.
| Item 11. | Executive Compensation |
Information required by this item is set forth in the 2010 Proxy Statement and is incorporated herein by reference.
| Item 12. | Security Ownership of Certain Beneficial Owners and Management and Related Stockholder Matters |
The following table gives information about the Company’s common stock that may be issued under the Company’s equity compensation plans as of January 2, 2010.
| Plan Category |
Number of securities to be issued upon exercise of outstanding options, warrants and rights |
Weighted-average exercise price of outstanding options, warrants and rights |
Number of securities remaining available for future issuance under equity compensation plans (excluding securities reflected in column (a)) | ||||
| (a) | (b) | (c) | |||||
| Equity compensation plans approved by security holders 1,2 |
1,280,527 | $ | 14.97 | 215,579 | |||
| Equity compensation plans not approved by security holders 3,4 |
646,526 | 9.44 | 501 | ||||
| Total |
1,927,053 | $ | 13.12 | 216,080 | |||
| 1 | Includes the MDS Stock Incentive Plan and the MDS Directors’ Deferred Compensation Plan. |
| 2 | The MDS Directors’ Deferred Compensation Plan was adopted in 2002. This plan provides non-officer directors the option of using their Board and Board Committee annual retainer and meeting attendance fees |
48
Table of Contents
| from the Company to purchase shares of the Company’s Common Stock, or of deferring receipt of such fees in the form of cash units and units representing shares of the Company’s Common Stock. The Plan provides for a 100,000 maximum aggregate number of shares. The Company’s intention is to use treasury shares for such purposes. No shares have been issued under this plan. All current fees and other compensation for directors are outlined in the 2010 Proxy Statement. |
| 3 | The MDS Treasury Stock Plan, adopted in 2002, authorizes the issuance of up to 400,000 shares of MDS common stock held in Treasury pursuant to the exercise of incentive stock options, non-qualified stock options and stock appreciation rights and the grant of restricted stock and performance awards. As of January 2, 2010, only 501 shares under this plan remain available for issuance. |
| 4 | The Company issues non-qualified stock options to certain individuals in order to induce them to accept employment with the Company. Pursuant to the rules of the New York Stock Exchange, options issued under this program are not considered part of the MDS Stock Incentive Plan and are not deducted from the number of securities remaining available for future issuance. As of January 2, 2010, inducement options for a total of 552,526 shares were outstanding. These options have a ten-year term and vest over a period of five years commencing from the date of grant. |
Information required by Item 403 of Regulation S-K, which is set forth under the heading “Beneficial Ownership of Common Stock” in the 2010 Proxy Statement, is incorporated herein by reference.
| Item 13. | Certain Relationships and Related Transactions, and Director Independence |
Information required by this item is set forth in the 2010 Proxy Statement and is incorporated herein by reference.
| Item 14. | Principal Accounting Fees and Services |
Information required by this item, which is set forth under the heading “Principal Accounting Firm Fees” in the 2010 Proxy Statement, is incorporated herein by reference.
PART IV
| Item 15. | Exhibits and Financial Statement Schedules |
| (a) | 1. Financial Statements |
See Index to Financial Statements on Page F-1.
| 2. Financial Statement Schedules |
See Index to Financial Statements on Page F-1.
| (b) | Exhibits |
| Exhibit No. |
Description | |
| 3.1 | Certificate of Incorporation (incorporated by reference to Exhibit 3(i).1 to Midas, Inc. Registration Statement on Form 10/A No. 3 (Post-Effective Amendment No. 1) (Commission File No. 1-13409) (the “Form 10”)). | |
| 3.2 | Certificate of Amendment of the Certificate of Incorporation, dated December 30, 1997 (incorporated by reference to Exhibit 3(i).2 to the Form 10). | |
| 3.3 | By-Laws (as amended December 31, 1997) (incorporated by reference to Exhibit 4.4 to Midas, Inc. Registration Statement on Form S-8 relating to its Retirement Savings Plans (Registration No. 333-44625) (the “RSP Form S-8”)). | |
49
Table of Contents
| Exhibit No. |
Description | |
| 4.1 | Certificate of Designation of Series A Junior Participating Preferred Stock (incorporated by reference to Exhibit 4.3 to the RSP Form S-8). | |
| 4.2 | Amended Certificate of Designation of Series A Junior Participating Preferred Stock (incorporated by reference to Form 10/A dated as of January 10, 2008). | |
| 4.3 | Warrant Agreement, dated as of March 27, 2003, by and among Midas, Inc. and the Warrant Holders named therein (incorporated by reference to Exhibit 4.21 to the Midas, Inc. Annual Report on Form 10-K for the annual period ended December 28, 2002). | |
| 4.4 | Rights Agreement, dated as of December 7, 2007, effective December 31, 2007, between Midas, Inc. and National City Bank, as rights agent. (incorporated by reference to Exhibit to 99.1 to the Midas, Inc. Current Report on Form 8-K dated as of December 7, 2007). | |
| 4.5 | Amendment No. 1 to Rights Agreement, dated as of December 14, 2009, between Midas Inc. and Computershare Trust Company, N.A. (incorporated by reference to Exhibit 4.1 to the Midas, Inc. Current Report on Form 8-K dated December 14, 2009). | |
| 10.1 | Distribution and Indemnity Agreement dated as of December 31, 1997 among Midas, Inc., Midas International Corporation and Whitman Corporation (incorporated by reference to Exhibit 2.1 to Midas, Inc. Current Report on Form 8-K dated January 30, 1998 (the “Form 8-K”)). | |
| 10.2 | Tax Sharing Agreement dated as of December 31, 1997 among Midas, Inc., Midas International Corporation and Whitman Corporation (incorporated by reference to Exhibit 2.2 to the Form 8-K). | |
| 10.7 | Amendment to Agreement for Strategic Alliance and License Agreement dated as of March 14, 2003, by and between Midas International Corporation and Magneti Marelli Services S.p.A., which amends the Agreement for Strategic Alliance and License Agreement dated as of October 1, 1998, between Midas International Corporation and Magneti Marelli S.p.A. (incorporated by reference to Exhibit 10.25 to the Midas, Inc. Quarterly Report on Form 10-Q for the quarterly period ended September 27, 2003). | |
| 10.8 | Second Amendment to Agreement for Strategic Alliance and License Agreement, dated as of July 28, 2004, by and between Midas International Corporation and Magneti Marelli Services S.p.A. (incorporated by reference to Exhibit to 10.26 to the Midas, Inc. Quarterly Report on Form 10-Q for the quarterly period ended October 2, 2004). | |
| 10.9 | Third Amendment to Agreement for Strategic Alliance and License Agreement, dated as of September 29, 2004, by and between Midas International Corporation and Magneti Marelli Services S.p.A. (incorporated by reference to Exhibit to 10.27 to the Midas, Inc. Quarterly Report on Form 10-Q for the quarterly period ended October 2, 2004). | |
| 10.10 | Agreement, dated as of September 29, 2004, by and between Midas International Corporation and Norauto S.A. relating to Agreement for Strategic Alliance between Midas International Corporation and Magneti Marelli Services S.p.A., as amended (incorporated by reference to Exhibit to 10.28 to the Midas, Inc. Quarterly Report on Form 10-Q for the quarterly period ended October 2, 2004). | |
| 10.11* | Amended and Restated Directors’ Deferred Compensation Plan (incorporated by reference to Exhibit 10.11 to the Midas, Inc. Annual Report on Form 10-K for the annual period ended January 3, 2009). | |
| 10.12* | Severance Plan for Full-Time Salaried (Exempt) and Hourly (Non-Exempt) Employees (incorporated by reference to Exhibit 10.12 to the Midas, Inc. Annual Report on Form 10-K for the annual period ended January 3, 2009). | |
| 10.13* | Executive Retirement Plan – Account Balance Component (incorporated by reference to Exhibit 10.13 to the Midas, Inc. Annual Report on Form 10-K for the annual period ended January 3, 2009). | |
50
Table of Contents
| Exhibit No. |
Description | |
| 10.14* | Executive Retirement Plan – Defined Benefit Retirement Component (incorporated by reference to Exhibit 10.14 to the Midas, Inc. Annual Report on Form 10-K for the annual period ended January 3, 2009). | |
| 10.15* | Form of Amended and Restated Change in Control Agreement (incorporated by reference to Exhibit 10.15 to the Midas, Inc. Annual Report on Form 10-K for the annual period ended January 3, 2009). | |
| 10.16* | Form of Retention Agreement with certain executive officers (Messrs. Guzik, Warzecha and Marr) (incorporated by reference to Exhibit 10.16 to the Midas, Inc. Quarterly Report on Form 10-Q for the quarterly period ended September 28, 2002). | |
| 10.17* | Form of Amendment to Retention Agreement with certain executive officers (Messrs. Guzik, Warzecha and Marr) dated as of November 11, 2008 (incorporated by reference to Exhibit 10.17 to the Midas, Inc. Annual Report on Form 10-K for the annual period ended January 3, 2009). | |
| 10.18* | Employment Confirmation Letter with President and Chief Executive Officer (incorporated by reference to Exhibit 10.19 to the Midas, Inc. Annual Report on Form 10-K for the annual period ended December 28, 2002). | |
| 10.19* | Amendment to Employment Confirmation Letter with President and Chief Executive Officer dated as of November 11, 2008 (incorporated by reference to Exhibit 10.19 to the Midas, Inc. Annual Report on Form 10-K for the annual period ended January 3, 2009). | |
| 10.20* | Employment Confirmation Letter with Senior Vice President and Chief Marketing Officer (incorporated by reference to Exhibit 10.32 to the Midas, Inc. Annual Report on Form 10-K for the annual period ended January 1, 2005). | |
| 10.21* | Amendment to Employment Confirmation Letter with Senior Vice President and Chief Marketing Officer dated as of November 11, 2008 (incorporated by reference to Exhibit 10.21 to the Midas, Inc. Annual Report on Form 10-K for the annual period ended January 3, 2009). | |
| 10.22* | Amended and Restated Midas, Inc. Stock Incentive Plan, as amended on May 8, 2007 (incorporated by reference to Exhibit 10.10 to the Midas, Inc. Annual Report on Form 10-K for the annual period ended December 29, 2007). | |
| 10.23* | Treasury Stock Plan (incorporated by reference to Exhibit 4.6 to Midas, Inc. Registration Statement on Form S-8 relating to its Treasury Stock Plan (Registration No. 333-89226). | |
| 10.24* | Stock Option Agreement with Non-Executive Chairman of the Board of Directors (incorporated by reference to Exhibit 10.17 to the Midas, Inc. Annual Report on Form 10-K for the annual period ended December 28, 2002). | |
| 10.25* | Stock Option Agreement with President and Chief Executive Officer (incorporated by reference to Exhibit 10.20 to the Midas, Inc. Annual Report on Form 10-K for the annual period ended December 28, 2002). | |
| 10.26* | Form of Stock Option Agreement for Supplemental Stock Options issued to certain executive officers (Mr. Feldman) under the Stock Incentive Plan in fiscal 2004 (incorporated by reference to Exhibit 10.30 to the Midas, Inc. Annual Report on Form 10-K for the annual period ended January 1, 2005). | |
| 10.27* | Form of Stock Option Agreement for Stock Options issued under either the Stock Incentive Plan, the Treasury Stock Plan, or outside of the Stock Incentive Plan and Treasury Stock Plan in fiscal 2005 and 2006 (incorporated by reference to Exhibit 10.11 to Midas, Inc. Annual Report on Form 10-K for the annual period ended December 31, 2005). | |
51
Table of Contents
| Exhibit No. |
Description | |
| 10.28* | Form of Stock Option Agreement for Stock Options issued under the Stock Incentive Plan in fiscal 2007 (incorporated by reference to Exhibit 10.28 to the Midas, Inc. Annual Report on Form 10-K for the annual period ended January 3, 2009). | |
| 10.29* | Form of Stock Option Agreement for Stock Options issued under the Stock Incentive Plan in fiscal 2008 (incorporated by reference to Exhibit 10.29 to the Midas, Inc. Annual Report on Form 10-K for the annual period ended January 3, 2009). | |
| 10.30* | Restricted Stock Award Agreement with Non-Executive Chairman of the Board of Directors (incorporated by reference to Exhibit 10.18 to the Midas, Inc. Annual Report on Form 10-K for the annual period ended December 28, 2002). | |
| 10.31* | Restricted Stock Award Agreement with President and Chief Executive Officer (incorporated by reference to Exhibit 10.21 to the Midas, Inc. Annual Report on Form 10-K for the annual period ended December 28, 2002). | |
| 10.32* | Form of Restricted Stock Award Agreement for Restricted Stock Awards issued under the Stock Incentive Plan in fiscal 2004 (incorporated by reference to Exhibit 10.29 to the Midas, Inc. Annual Report on Form 10-K for the annual period ended January 1, 2005). | |
| 10.33* | Form of Restricted Stock Award Agreement for Supplemental Restricted Stock Awards issued to certain executive officers (Messrs. Dow, Guzik and Warzecha) under the Stock Incentive Plan in fiscal 2004 (incorporated by reference to Exhibit 10.31 to the Midas, Inc. Annual Report on Form 10-K for the annual period ended January 1, 2005). | |
| 10.34* | Form of Restricted Stock Award Agreement for Restricted Stock Awards issued under the Stock Incentive Plan or the Treasury Stock Plan in fiscal 2005 and 2006 (incorporated by reference to Exhibit to 10.39 to the Midas, Inc. Quarterly Report on Form 10-Q for the quarterly period ended July 2, 2005). | |
| 10.35* | Form of Restricted Stock Award Agreement for Restricted Stock Awards (time-based vesting) issued under the Stock Incentive Plan in fiscal 2007. (incorporated by reference to Exhibit 10.35 to the Midas, Inc. Annual Report on Form 10-K for the annual period ended January 3, 2009). | |
| 10.36* | Form of Restricted Stock Award Agreement for Restricted Stock Awards (performance-based vesting) issued under the Stock Incentive Plan in fiscal 2007 (incorporated by reference to Exhibit 10.36 to the Midas, Inc. Annual Report on Form 10-K for the annual period ended January 3, 2009). | |
| 10.37* | Form of Restricted Stock Award Agreement for Restricted Stock Awards (time-based vesting) issued under the Stock Incentive Plan in fiscal 2008 (incorporated by reference to Exhibit 10.37 to the Midas, Inc. Annual Report on Form 10-K for the annual period ended January 3, 2009). | |
| 10.38* | Form of Restricted Stock Award Agreement for Restricted Stock Awards (performance-based vesting) issued under the Stock Incentive Plan in fiscal 2008 (incorporated by reference to Exhibit 10.38 to the Midas, Inc. Annual Report on Form 10-K for the annual period ended January 3, 2009). | |
| 10.39* | Description of 2008 Incentive Compensation Plan (incorporated by reference to the Midas, Inc. Current Report on Form 8-K dated March 13, 2008). | |
| 10.40* | Description of 2009 Incentive Compensation Plan (incorporated by reference to the Midas, Inc. Current Report on Form 8-K dated March 18, 2009). | |
| 10.41* | Summary of Employment Arrangements with Named Executive Officers (Messrs. Feldman, Guzik, Warzecha, and Dow) (incorporated by reference to Exhibit 10.34 to the Midas, Inc. Annual Report on Form 10-K for the annual period ended January 1, 2005). | |
52
Table of Contents
| Exhibit No. |
Description | |
| 10.42* | Summary of Directors Compensation (incorporated by reference to Exhibit 10.35 to the Midas, Inc. Annual Report on Form 10-K for the annual period ended January 1, 2005). | |
| 10.43* | First Amendment to Midas Executive Retirement Plan Account Balance Component (incorporated by reference to Exhibit 10.2 to the Midas, Inc. Quarterly Report on Form 10-Q for the quarterly period ended April 4, 2009. | |
| 10.44 | Agreement for Strategic Alliance dated October 1, 1998 between Midas International Corporation and Magneti Marelli S.p.A. (incorporated by reference to Exhibit 10.43 to the Midas, Inc. Quarterly Report on Form 10-Q for the quarterly period ended October 3, 2009). | |
| 10.45 | Amended and Restated Credit Agreement, dated December 4, 2009, among Midas International Corporation and JP Morgan Chase Bank, N.A. as Administrative Agent, PNC, National Association as Syndication Agent, and Bank of America, N.A. as Documentation Agent (incorporated by reference to Exhibit 10.48 to the Midas, Inc. Current Report on Form 8-K dated December 8, 2009). | |
| 21.1# | Subsidiaries of Midas, Inc. | |
| 23.1# | Consent of Independent Registered Public Accounting Firm. | |
| 31.1# | Certification of Chief Executive Officer pursuant to Rule 13a – 14(a) / 15d – 14(a). | |
| 31.2# | Certification of Chief Financial Officer pursuant to Rule 13a – 14(a) / 15d – 14(a). | |
| 32.1# | Section 1350 Certifications. | |
| * | Management Compensatory Plan or Contract |
| # | Filed herewith |
53
Table of Contents
Pursuant to the requirements of Section 13 or 15(d) of the Securities Exchange Act of 1934, the Registrant has duly caused this report to be signed on its behalf by the undersigned, thereunto duly authorized, this 18th day of March, 2010.
| MIDAS, INC. | ||
| By: | /s/ WILLIAM M. GUZIK | |
| William M. Guzik Executive Vice President and Chief Financial Officer | ||
Pursuant to the requirements of the Securities Exchange Act of 1934, this report has been signed below by the following persons in the capacities indicated on behalf of the Registrant, this 18th day of March, 2010.
| Signature |
Title | |
| /s/ ALAN D. FELDMAN Alan D. Feldman |
Chairman, President, Chief Executive Officer and Director | |
| /s/ WILLIAM M. GUZIK William M. Guzik |
Executive Vice President and Chief Financial Officer | |
| /s/ JAMES M. HAEGER, JR. James M. Haeger, Jr. |
Vice President and Controller | |
| /s/ ROBERT R. SCHOEBERL Robert R. Schoeberl |
Lead Director | |
| /s/ THOMAS L. BINDLEY Thomas L. Bindley |
Director | |
| /s/ ARCHIE R. DYKES Archie R. Dykes |
Director | |
| /s/ JAROBIN GILBERT, JR. Jarobin Gilbert, Jr. |
Director | |
| /s/ DIANE L. ROUTSON Diane L. Routson |
Director | |
54
Table of Contents
MIDAS
INDEX TO CONSOLIDATED FINANCIAL STATEMENTS
Financial statement schedules are omitted because they are not applicable or the required information is presented in the financial statements or related notes.
F-1
Table of Contents
REPORT OF INDEPENDENT REGISTERED PUBLIC ACCOUNTING FIRM
The Board of Directors and Shareholders
Midas, Inc.:
We have audited the accompanying consolidated balance sheets of Midas, Inc. (the “Company”) as of fiscal year end 2009 and 2008, and the related consolidated statements of operations, cash flows, and changes in shareholders’ equity for each of the fiscal years 2009, 2008 and 2007. These consolidated financial statements are the responsibility of Midas, Inc.’s management. Our responsibility is to express an opinion on these consolidated financial statements based on our audits.
We conducted our audits in accordance with the standards of the Public Company Accounting Oversight Board (United States). Those standards require that we plan and perform the audit to obtain reasonable assurance about whether the financial statements are free of material misstatement. An audit includes examining, on a test basis, evidence supporting the amounts and disclosures in the financial statements. An audit also includes assessing the accounting principles used and significant estimates made by management, as well as evaluating the overall financial statement presentation. We believe that our audits provide a reasonable basis for our opinion.
In our opinion, the consolidated financial statements referred to above present fairly, in all material respects, the financial position of Midas, Inc. as of fiscal year end 2009 and 2008, and the results of its operations and cash flows for fiscal years 2009, 2008 and 2007, in conformity with U.S. generally accepted accounting principles.
We also have audited, in accordance with the standards of the Public Company Accounting Oversight Board (United States), Midas, Inc.’s internal control over financial reporting as of January 2, 2010, based on criteria established in Internal Control—Integrated Framework issued by the Committee of Sponsoring Organizations of the Treadway Commission (COSO), and our report dated March 18, 2010 expressed an unqualified opinion on the effectiveness of the Company’s internal control over financial reporting.
KPMG LLP
Chicago, Illinois
March 18, 2010
F-2
Table of Contents
STATEMENTS OF OPERATIONS
(In millions, except for earnings per share)
| Fiscal Year |
2009 | 2008 | 2007 | |||||||||
| Sales and revenues: |
||||||||||||
| Franchise royalties and license fees |
$ | 53.6 | $ | 57.2 | $ | 60.3 | ||||||
| Real estate revenues from franchised shops |
32.6 | 34.6 | 35.9 | |||||||||
| Company-operated shop retail sales |
65.4 | 61.4 | 45.8 | |||||||||
| Replacement part sales and product royalties |
25.8 | 29.2 | 31.7 | |||||||||
| Software sales and maintenance revenue |
5.4 | 5.0 | 4.5 | |||||||||
| Total sales and revenues |
182.8 | 187.4 | 178.2 | |||||||||
| Operating costs and expenses: |
||||||||||||
| Franchised shops—occupancy expenses |
22.7 | 22.8 | 22.1 | |||||||||
| Company-operated shop parts cost of sales |
18.2 | 16.1 | 11.2 | |||||||||
| Company-operated shop payroll and employee benefits |
28.1 | 26.1 | 19.1 | |||||||||
| Company-operated shop occupancy and other operating expenses |
22.0 | 20.8 | 15.3 | |||||||||
| Replacement part cost of sales |
22.9 | 26.4 | 26.0 | |||||||||
| Warranty expense (benefit) |
0.1 | (2.7 | ) | (4.3 | ) | |||||||
| Selling, general, and administrative expenses |
51.2 | 54.1 | 53.2 | |||||||||
| Loss (gain) on sale of assets, net |
0.2 | 0.9 | (0.2 | ) | ||||||||
| Business transformation charges |
3.2 | 1.6 | 3.7 | |||||||||
| Total operating costs and expenses |
168.6 | 166.1 | 146.1 | |||||||||
| Operating income |
14.2 | 21.3 | 32.1 | |||||||||
| Interest expense |
(8.3 | ) | (9.1 | ) | (9.1 | ) | ||||||
| Other income, net |
0.4 | 0.8 | 0.4 | |||||||||
| Income before income taxes |
6.3 | 13.0 | 23.4 | |||||||||
| Income tax expense |
3.7 | 5.2 | 10.4 | |||||||||
| Net income |
$ | 2.6 | $ | 7.8 | $ | 13.0 | ||||||
| Earnings per share: |
||||||||||||
| Basic |
$ | 0.19 | $ | 0.58 | $ | 0.92 | ||||||
| Diluted |
$ | 0.19 | $ | 0.56 | $ | 0.89 | ||||||
| Average number of shares: |
||||||||||||
| Common shares outstanding |
13.7 | 13.5 | 14.1 | |||||||||
| Common stock warrants |
0.1 | 0.1 | 0.1 | |||||||||
| Shares applicable to basic earnings |
13.8 | 13.6 | 14.2 | |||||||||
| Equivalent shares on outstanding stock awards |
— | 0.3 | 0.4 | |||||||||
| Shares applicable to diluted earnings |
13.8 | 13.9 | 14.6 | |||||||||
See accompanying notes to financial statements.
F-3
Table of Contents
BALANCE SHEETS
(In millions, except per share data)
| Fiscal Year End |
2009 | 2008 | ||||||
| Assets: |
||||||||
| Current assets: |
||||||||
| Cash and cash equivalents |
$ | 0.9 | $ | 1.1 | ||||
| Receivables, net |
29.7 | 30.4 | ||||||
| Inventories |
5.6 | 4.3 | ||||||
| Deferred income taxes |
9.5 | 10.7 | ||||||
| Prepaid assets |
4.4 | 4.7 | ||||||
| Other current assets |
3.7 | 4.6 | ||||||
| Total current assets |
53.8 | 55.8 | ||||||
| Property and equipment, net |
86.4 | 92.6 | ||||||
| Goodwill and other intangible assets, net |
36.8 | 35.5 | ||||||
| Deferred income taxes |
45.4 | 46.9 | ||||||
| Other assets |
6.2 | 4.6 | ||||||
| Total assets |
$ | 228.6 | $ | 235.4 | ||||
| Liabilities and equity: |
||||||||
| Current liabilities: |
||||||||
| Current portion of long-term obligations |
$ | 1.5 | $ | 1.5 | ||||
| Current portion of accrued warranty |
2.0 | 2.4 | ||||||
| Accounts payable |
22.8 | 21.0 | ||||||
| Accrued expenses |
22.2 | 23.3 | ||||||
| Total current liabilities |
48.5 | 48.2 | ||||||
| Long-term debt |
71.9 | 83.6 | ||||||
| Obligations under capital leases |
1.6 | 1.8 | ||||||
| Finance lease obligation |
30.5 | 31.7 | ||||||
| Pension liability |
20.1 | 21.2 | ||||||
| Accrued warranty |
11.3 | 14.1 | ||||||
| Deferred warranty obligation |
5.3 | 3.0 | ||||||
| Other liabilities |
6.4 | 6.5 | ||||||
| Total liabilities |
195.6 | 210.1 | ||||||
| Temporary equity: |
||||||||
| Non-vested restricted stock subject to redemption |
3.7 | 5.7 | ||||||
| Shareholders’ equity: |
||||||||
| Common stock ($.001 par value, 100 million shares authorized, 17.7 million shares issued) and paid-in capital |
6.3 | 6.8 | ||||||
| Treasury stock, at cost (3.5 million shares and 3.7 million shares) |
(71.5 | ) | (76.8 | ) | ||||
| Retained income |
111.0 | 108.4 | ||||||
| Accumulated other comprehensive loss |
(16.5 | ) | (18.8 | ) | ||||
| Total shareholders’ equity |
29.3 | 19.6 | ||||||
| Total liabilities and shareholders’ equity |
$ | 228.6 | $ | 235.4 | ||||
See accompanying notes to financial statements.
F-4
Table of Contents
STATEMENTS OF CASH FLOWS
(In millions)
| Fiscal Year |
2009 | 2008 | 2007 | |||||||||
| Cash flows from operating activities: |
||||||||||||
| Net income |
$ | 2.6 | $ | 7.8 | $ | 13.0 | ||||||
| Adjustments reconciling net income to net cash provided by operating activities: |
||||||||||||
| Depreciation and amortization |
9.4 | 10.1 | 9.3 | |||||||||
| Stock-based compensation |
3.6 | 3.7 | 4.2 | |||||||||
| Amortization of financing fees and change in interest rate swap valuation |
0.4 | 0.3 | 0.4 | |||||||||
| Warranty liability adjustment |
(0.6 | ) | (3.4 | ) | (8.3 | ) | ||||||
| Business transformation charges |
3.2 | 1.6 | 3.7 | |||||||||
| Deferred income taxes |
2.7 | 5.9 | 9.9 | |||||||||
| Loss (gain) on sale of fixed assets |
0.2 | 0.9 | (0.2 | ) | ||||||||
| Cash outlays for business transformation costs |
(2.0 | ) | (1.5 | ) | (3.8 | ) | ||||||
| Changes in assets and liabilities, exclusive of effects of business transformation charges, acquisitions and dispositions: |
||||||||||||
| Receivables |
0.3 | (0.7 | ) | (3.6 | ) | |||||||
| Inventories |
(1.3 | ) | (1.0 | ) | — | |||||||
| Accounts payable |
2.0 | 6.2 | 3.1 | |||||||||
| Accrued expenses |
(1.4 | ) | (2.6 | ) | 1.9 | |||||||
| Other |
0.3 | (0.9 | ) | 1.0 | ||||||||
| Total changes in assets and liabilities |
(0.1 | ) | 1.0 | 2.4 | ||||||||
| Net cash provided by operating activities |
19.4 | 26.4 | 30.6 | |||||||||
| Cash flows from investing activities: |
||||||||||||
| Capital investments |
(3.1 | ) | (6.4 | ) | (5.1 | ) | ||||||
| Cash paid for acquired businesses |
(1.3 | ) | (24.5 | ) | (13.7 | ) | ||||||
| Proceeds from sales of assets |
0.3 | 1.0 | 2.6 | |||||||||
| Net cash used in investing activities |
(4.1 | ) | (29.9 | ) | (16.2 | ) | ||||||
| Cash flows from financing activities: |
||||||||||||
| Net borrowings (repayments) under revolving lines of credit |
(11.7 | ) | 7.3 | 15.2 | ||||||||
| Payments for debt financing fees |
(1.5 | ) | — | — | ||||||||
| Decrease in outstanding checks |
(0.2 | ) | (2.0 | ) | (2.3 | ) | ||||||
| Payment of principal obligations under capital leases |
(0.3 | ) | (0.7 | ) | (0.9 | ) | ||||||
| Payment of principal obligations under finance lease |
(1.1 | ) | (1.1 | ) | (1.0 | ) | ||||||
| Cash received for common stock |
— | 0.2 | 2.7 | |||||||||
| Cash paid for treasury shares |
(0.7 | ) | (0.4 | ) | (29.2 | ) | ||||||
| Net cash provided by (used in) financing activities |
(15.5 | ) | 3.3 | (15.5 | ) | |||||||
| Net change in cash and cash equivalents |
(0.2 | ) | (0.2 | ) | (1.1 | ) | ||||||
| Cash and cash equivalents at beginning of period |
1.1 | 1.3 | 2.4 | |||||||||
| Cash and cash equivalents at end of period. |
$ | 0.9 | $ | 1.1 | $ | 1.3 | ||||||
See accompanying notes to financial statements.
F-5
Table of Contents
STATEMENTS OF CHANGES IN SHAREHOLDERS’ EQUITY
(In millions)
| Common Stock And Paid-in Capital |
Treasury Stock | Retained Income |
Comprehensive Income (Loss) |
Accumulated Other Comprehensive Loss |
||||||||||||||||||||
| Shares | Amount | Shares | Amount | |||||||||||||||||||||
| Fiscal year end 2006 |
17.7 | $ | 10.3 | (2.7 | ) | $ | (57.8 | ) | $ | 87.6 | $ | (6.9 | ) | |||||||||||
| Restricted stock awards |
— | (2.5 | ) | 0.1 | 2.5 | — | $ | — | — | |||||||||||||||
| Purchase of treasury shares |
— | — | (1.5 | ) | (29.2 | ) | — | — | — | |||||||||||||||
| Stock option transactions |
— | (1.7 | ) | 0.2 | 4.1 | — | — | — | ||||||||||||||||
| Stock option expense |
— | 1.9 | — | — | — | — | — | |||||||||||||||||
| Forfeiture of restricted stock awards |
— | 0.6 | — | (0.6 | ) | — | — | — | ||||||||||||||||
| Restricted stock vesting |
— | 0.2 | — | — | — | — | — | |||||||||||||||||
| Net income |
— | — | — | — | 13.0 | 13.0 | — | |||||||||||||||||
| Other comprehensive income |
||||||||||||||||||||||||
| —foreign currency translation |
— | — | — | — | — | 2.1 | 2.1 | |||||||||||||||||
| —unrecognized pension costs, net of taxes |
— | — | — | — | — | 2.3 | 2.3 | |||||||||||||||||
| —loss on derivative financial instruments, net of tax |
— | — | — | — | — | (0.8 | ) | (0.8 | ) | |||||||||||||||
| Comprehensive income |
— | — | — | — | — | $ | 16.6 | — | ||||||||||||||||
| Fiscal year end 2007 |
17.7 | 8.8 | (3.9 | ) | (81.0 | ) | 100.6 | (3.3 | ) | |||||||||||||||
| Restricted stock awards |
— | (4.3 | ) | 0.2 | 4.3 | — | $ | — | — | |||||||||||||||
| Purchase of treasury shares |
— | — | — | (0.4 | ) | — | — | — | ||||||||||||||||
| Stock option transactions |
— | (0.1 | ) | — | 0.3 | — | — | — | ||||||||||||||||
| Stock option expense |
— | 1.3 | — | — | — | — | — | |||||||||||||||||
| Restricted stock vesting |
— | 1.1 | — | — | — | — | — | |||||||||||||||||
| Net income |
— | — | — | — | 7.8 | 7.8 | — | |||||||||||||||||
| Other comprehensive income |
||||||||||||||||||||||||
| —foreign currency translation |
— | — | — | — | — | (2.1 | ) | (2.1 | ) | |||||||||||||||
| —unrecognized pension costs, net of taxes |
— | — | — | — | — | (12.6 | ) | (12.6 | ) | |||||||||||||||
| —loss on derivative financial instruments, net of tax |
— | — | — | — | — | (0.8 | ) | (0.8 | ) | |||||||||||||||
| Comprehensive loss |
— | — | — | — | — | $ | (7.7 | ) | — | |||||||||||||||
| Fiscal year end 2008 |
17.7 | 6.8 | (3.7 | ) | (76.8 | ) | 108.4 | (18.8 | ) | |||||||||||||||
| Restricted stock awards |
— | (6.0 | ) | 0.3 | 6.0 | — | $ | — | — | |||||||||||||||
| Purchase of treasury shares |
— | — | (0.1 | ) | (0.7 | ) | — | — | — | |||||||||||||||
| Stock option expense |
— | 1.1 | — | — | — | — | — | |||||||||||||||||
| Restricted stock vesting |
— | 4.4 | — | — | — | — | — | |||||||||||||||||
| Net income |
— | — | — | — | 2.6 | 2.6 | — | |||||||||||||||||
| Other comprehensive income |
||||||||||||||||||||||||
| —foreign currency translation |
— | — | — | — | — | 1.2 | 1.2 | |||||||||||||||||
| —unrecognized pension costs, net of taxes |
— | — | — | — | — | 0.6 | 0.6 | |||||||||||||||||
| —gain on derivative financial instruments, net of tax |
— | — | — | — | — | 0.5 | 0.5 | |||||||||||||||||
| Comprehensive income |
— | — | — | — | — | $ | 4.9 | — | ||||||||||||||||
| Fiscal year end 2009 |
17.7 | $ | 6.3 | (3.5 | ) | $ | (71.5 | ) | $ | 111.0 | $ | (16.5 | ) | |||||||||||
See accompanying notes to financial statements.
F-6
Table of Contents
NOTES TO CONSOLIDATED FINANCIAL STATEMENTS
(1) Summary of Significant Accounting Policies
Nature of Business and Basis of Presentation
Midas, Inc. (“MDS” or the “Company”) provides retail automotive services principally through franchised or licensed shops in the U.S., Canada, Europe and other countries. Through March of 2008, the Company’s sole franchise concept was Midas auto repair centers (“Midas”). In April of 2008, MDS acquired the SpeeDee Oil Change and Tune-up franchise system (“SpeeDee”) and now sells Midas, SpeeDee and Midas-SpeeDee Co-Branded franchises. The consolidated financial statements presented herein include Midas, Inc. and all of its wholly-owned subsidiaries. All significant intercompany balances and transactions have been eliminated in consolidation.
On January 4, 2009, MDS adopted changes issued by the Financial Accounting Standards Board (“FASB”) to the calculation of earnings per share. These changes state that unvested share-based payment awards that contain nonforfeitable rights to dividends or dividend equivalents (whether paid or unpaid) are participating securities and shall be included in the computation of earnings per share pursuant to the two-class method for all periods presented. The adoption of these changes requires all prior-period earnings per share data that is presented to be adjusted retrospectively. Specifically, MDS included 361,000 incremental shares in the weighted-average common shares outstanding calculations for fiscal 2009, with a corresponding decrease in the effect of dilutive stock awards. MDS also was required to include 240,000 and 155,000 incremental shares in the weighted-average common shares outstanding calculations for 2008 and fiscal 2007 respectively. These incremental shares had no impact on fiscal 2008 Basic Earnings Per Share, but caused a $0.01 decrease in Basic Earnings Per Share in fiscal 2009 and 2007.
Fiscal Periods
Fiscal year 2009 ended on January 2, 2010 and consisted of 52 weeks. Fiscal year 2008 ended on January 3, 2009 and consisted of 53 weeks. Fiscal year 2007 ended on December 29, 2007 and consisted of 52 weeks.
Foreign Currency Translation and Transactions
All assets and liabilities of non-U.S. operations are translated into U.S. dollars using exchange rates as of the end of each fiscal period. Income and expense items are translated at average exchange rates prevailing during each fiscal period. The resulting translation adjustments are recorded as a component of shareholders’ equity. Gains and losses from foreign currency transactions are included in net earnings.
Cash and Cash Equivalents
Cash and cash equivalents consist of deposits with banks and financial institutions and are unrestricted as to withdrawal or use, and which have an original maturity of three months or less. Cash and cash equivalents includes customer credit card payments that settle within 2-3 business days of the fiscal period end.
Fair Value of Financial Instruments
MDS’s financial instruments include cash and cash equivalents, receivables, accounts payable, and long-term debt. No public market exists for the Company’s long term debt. The Company’s credit agreement was amended to reflect current market interest rates for debt on December 4, 2009. As a result, the Company believes that the carrying value of the debt approximates its fair value as of January 2, 2010. The carrying amounts of the other financial assets and liabilities approximate their fair values because of the short maturities of those instruments.
F-7
Table of Contents
MIDAS
NOTES TO CONSOLIDATED FINANCIAL STATEMENTS—(Continued)
Derivative Financial Instruments
The Company has market risk exposure to changes in interest rates, principally in the United States. MDS attempts to minimize this risk and fix a portion of its overall borrowing costs through the utilization of interest rate swaps. These swaps are entered into with financial institutions and have critical dates and terms that result in the swaps being highly effective.
Valuation of Receivables
The Company records receivables due from its franchisees and other customers at the time the sale is recorded in accordance with its revenue recognition policies. These receivables consist of amounts due from the sale of products, royalties due from franchisees and suppliers, rents and other amounts. The future collectability of these amounts can be impacted by the Company’s collection efforts, the financial stability of its customers, and the general economic climate in which it operates. Recent market conditions have increased the uncertainty in making these estimates. Any adverse change in these factors could have a significant impact on the collectability of these assets and could have a material impact on the Company’s consolidated financial statements.
The Company applies a consistent practice of establishing an allowance for accounts that it feels may become uncollectible through reviewing the historical aging of its receivables and by monitoring the financial strength of its franchisees and other customers. Where MDS becomes aware of a customer’s inability to meet its financial obligations (e.g., where it is in financial distress or has filed for bankruptcy), the Company specifically reserves for the potential bad debt to reduce the net recognized receivable to the amount it reasonably believes will be collected. The valuation of receivables is performed on a quarterly basis.
In addition, the Company records receivables from third parties at the time a transaction is completed. These third party receivables are recorded at their estimated net realizable value. On a quarterly basis, the Company assesses the collectibility of these receivables.
Notes Receivable
Notes receivable relate to franchisee financing arrangements for certain previously past due balances and other long-term receivables that exceed one year. They bear interest at a market rate based on the customer’s credit quality and are recorded at face value. Interest is recognized over the life of the note. The notes are typically collateralized by inventory, equipment or similar assets of the franchisee. The Company has not and does not intend to sell these receivables. Past due notes receivable are considered during the Company’s valuation of receivables.
Inventory Valuation
Inventories are valued at the lower of cost or net realizable value. Inventory cost is determined using the weighted-average cost method, which approximates the first-in, first-out method. Additionally, the Company periodically evaluates the carrying value of its inventory to assess the proper valuation. This evaluation includes having adequate allowances to cover losses in the normal course of operations, providing for excess and obsolete inventory, and ensuring that inventory is valued at the lower of cost or market. In performing this evaluation, the Company considers historical data such as actual loss experience, past and projected usage, and actual margins generated from sales of its products.
F-8
Table of Contents
MIDAS
NOTES TO CONSOLIDATED FINANCIAL STATEMENTS—(Continued)
Property and Equipment
Property and equipment are recorded at cost. Depreciation is computed using the straight-line method and includes amortization of assets held under capital and finance leases. When property is sold or retired, the cost and accumulated depreciation are eliminated from the accounts and gains or losses are recorded in the statement of operations. Expenditures for maintenance and repairs are expensed as incurred.
Buildings and improvements are depreciated over useful lives ranging from 10 to 40 years. Machinery and equipment is depreciated over useful lives ranging from three to 12 years, and computer hardware is depreciated over useful lives of three to five years. Major enterprise-level computer software is depreciated over 10 years while all other software is depreciated over five years.
Income Taxes
Income taxes are accounted for under the asset and liability method. Deferred tax assets and liabilities are recognized for the future tax consequences attributable to differences between the financial statement carrying amounts of existing assets and liabilities and their respective tax bases and operating loss and tax credit carryforwards. Deferred tax assets and liabilities are measured using enacted tax rates expected to apply to taxable income in the years in which those temporary differences are expected to be recovered or settled. The effect on deferred tax assets and liabilities of a change in tax rates is recognized in income in the period that includes the enactment date.
In assessing the valuation of deferred tax assets, management considers whether it is more likely than not that some portion or all of the deferred tax assets will not be realized. The ultimate realization of deferred tax assets is dependent upon the generation of future taxable income during the periods in which those temporary differences become deductible. Management considers the scheduled reversal of deferred tax liabilities, projected future taxable income, and tax planning strategies in making this assessment. Based upon the level of historical taxable income and projections for future taxable income over the periods in which the deferred tax assets are deductible, management believes it is more likely than not that the Company will realize the benefits of these deductible differences at January 2, 2010. In the event that management determines the Company would not be able to realize all or part of the net deferred tax assets in the future, an adjustment to the deferred tax assets would be charged to income in the period in which such determination was made.
Carrying Value of Goodwill and Long-Lived Assets
Goodwill: The Company tests the recorded amount of goodwill for recovery on an annual basis in the fourth quarter of each fiscal year. Goodwill is tested more frequently if indicators of impairment exist. The Company continually assesses whether any indicators of impairment exist, which requires a significant amount of judgment. Such indicators may include: a sustained significant decline in our share price and market capitalization; a decline in our expected future cash flows; a significant adverse change in legal factors or in the business climate; unanticipated competition; the testing for recoverability of a significant asset group within a reporting unit; or slower growth rates, among others. Any adverse change in these factors could have a significant impact on the recoverability of these assets and could have a material impact on our consolidated financial statements.
The goodwill impairment test is a two step analysis. In Step One, the fair value of each reporting unit is compared to its book value. Management must apply judgment in determining the estimated fair value of these reporting units. Fair value is determined using a combination of present value techniques and quoted market prices of comparable businesses. If the fair value of the reporting unit exceeds its carrying value, goodwill is not deemed to be impaired for that reporting unit, and no further testing would be necessary. If the fair value of the
F-9
Table of Contents
MIDAS
NOTES TO CONSOLIDATED FINANCIAL STATEMENTS—(Continued)
reporting unit is less than the carrying value, the Company performs Step Two. Step Two uses the calculated fair value of the reporting unit to perform a hypothetical purchase price allocation to the fair value of the assets and liabilities of the reporting unit. The difference between the fair value of the reporting unit calculated in Step One and the fair value of the underlying assets and liabilities of the reporting unit is the implied fair value of the reporting unit’s goodwill. A charge is recorded in the financial statements if the carrying value of the reporting unit’s goodwill is greater than its implied fair value.
The determination of fair value of the reporting units and assets and liabilities within the reporting units requires management to make significant estimates and assumptions. These estimates and assumptions primarily include, but are not limited to, the discount rate, terminal growth rates, earnings before depreciation and amortization, and capital expenditures forecasts. Due to the inherent uncertainty involved in making these estimates, actual results could differ from those estimates. In both the U.S. and Canada, the reporting unit is defined as retail operations, which consists of both franchised and Company-operated locations.
Long-lived Assets: Long-lived assets include property and equipment, intangible assets, long-term prepaid assets and other non-current assets. The Company reviews long-lived assets held for use for impairment whenever events or changes in circumstances indicate that the carrying amount may not be recoverable. Events that may indicate long-lived assets may not be recoverable include, but are not limited to, a significant decrease in the market price of long-lived assets, a significant adverse change in the manner in which the Company utilizes a long-lived asset, a significant adverse change in the business climate, a recent history of operating or cash flow losses, or a current expectation that it is more likely than not likely that a long-lived asset will be sold or disposed of in the future. For impairment testing purposes, the Company groups its long-lived assets at the lowest level for which identifiable cash flows are largely independent of the cash flows of other groups of assets and liabilities (the asset group).
If the Company determines that a long-lived asset or asset group may not be recoverable, it compares the sum of the expected undiscounted future cash flows that the asset or asset group is expected to generate to the asset or asset group’s carrying value. If the sum of the undiscounted future cash flows exceed the carrying amount of the asset or asset group, the asset or asset group is not considered impaired. However, if the sum of the undiscounted future cash flows is less than the carrying amount of the assets or asset group, a loss is recognized for the difference between the fair value of the asset or asset group and the carrying value of the asset or asset group. The fair value of the asset or asset group is generally determined by discounting the expected future cash flows using a discount rate that is commensurate with the risk associated with the amount and timing of the expected future cash flows. Due to the inherent uncertainty involved in making these estimates, actual results could differ from those estimates.
Fixed assets held for sale are carried at the lower of the carrying amount or fair value, less costs to sell. Assets held for sale are no longer depreciated.
Revenue Recognition
Franchise royalties are recognized in the periods that correspond to the periods in which retail sales and revenues are recognized by franchisees. Franchise renewal fees are recognized when the new franchise agreement is signed by the franchisee, the renewal period commences and all contractual obligations have been met. Product royalties are recognized as earned based on the volume of franchisee purchases of products from certain vendors. Real estate revenues are recognized as earned on a monthly basis in accordance with underlying property lease terms using the straight-line method. The majority of real estate revenues are derived from Midas shop locations. Nearly all of these locations are subject to an annual percentage rent based upon the location’s
F-10
Table of Contents
MIDAS
NOTES TO CONSOLIDATED FINANCIAL STATEMENTS—(Continued)
retail sales volume for the calendar year. Replacement part sales are recognized at the time products are shipped. Sales and revenues of company-operated shops are recognized when customer vehicles are repaired or serviced. Taxes collected on behalf of taxing authorities are not recognized as revenue, but rather are recorded as a liability and remitted to the proper taxing authority.
Revenues derived from franchise fees, which represented approximately 0.8%, 1.1% and 0.7% of franchising revenues in fiscal 2009, 2008 and 2007, respectively, are recognized when the franchised shop opens and after certain contractual obligations have been met. Costs related to securing initial franchise agreements and performing the required services under such agreements are charged to expense as incurred.
Advertising
Advertising costs are expensed as incurred.
Recognition of Warranty Costs
Customers are provided a written warranty from MDS on certain Midas products purchased from Midas shops in North America, namely brake friction, mufflers, shocks and struts. The warranty will be honored at any Midas shop in North America and is valid for the lifetime of the vehicle, but is voided if the vehicle is sold. The Company maintains a warranty accrual to cover the estimated future liability associated with outstanding warranties. The Company determines the estimated value of outstanding warranty claims based on: 1) an estimate of the percentage of all warranted products sold and registered in prior periods at retail that are likely to be redeemed; and 2) an estimate of the cost of redemption of each future warranty claim on a current cost basis. These estimates are computed using actual historical registration and redemption data as well as actual cost information on current redemptions.
Annual warranty activity is summarized as follows (in millions):
| Fiscal Year |
2009 | 2008 | 2007 | |||||||||
| Accrued warranty expense at beginning of period |
$ | 16.5 | $ | 24.8 | $ | 33.4 | ||||||
| Warranty benefit, net |
(0.3 | ) | (2.7 | ) | (4.3 | ) | ||||||
| Changes in foreign currency exchange rate |
0.5 | (1.1 | ) | 1.0 | ||||||||
| Warranty credit issued to franchisees (warranty claims paid) |
(3.4 | ) | (4.5 | ) | (5.3 | ) | ||||||
| Accrued warranty expense at end of period |
13.3 | 16.5 | 24.8 | |||||||||
| Less current portion |
2.0 | 2.4 | 3.5 | |||||||||
| Accrued warranty—non-current |
$ | 11.3 | $ | 14.1 | $ | 21.3 | ||||||
Warranty expense is included in operating costs and expenses in the statements of operations. A portion of warranty expense incurred is also paid as claims within the same fiscal year. Warranty expense was reduced by $0.6 million, $3.4 million and $8.3 million in fiscal 2009, 2008 and 2007, respectively, due to changes in estimated warranty redemptions.
As of January 1, 2008, the Company changed how the Midas warranty obligations are funded in the United States. From June 2003 through December 2007, product royalties received from the Company’s preferred supply chain vendors were recorded as revenue and substantially offset the cost of warranty claims. Beginning in fiscal 2008, the Midas warranty program in the United States is funded directly by Midas franchisees. The franchisees are charged a fee for each warranted product sold to customers. The fee is charged when the warranty
F-11
Table of Contents
MIDAS
NOTES TO CONSOLIDATED FINANCIAL STATEMENTS—(Continued)
is registered with the Company. The fee billed to franchisees is deferred and is recognized as revenue when the actual warranty is redeemed and included in warranty expense. This fee is intended to cover the Company’s cost of the new warranty program, thus revenues under this program will match expenses and the new warranty program will have no impact on the results of operations. In connection with this change, beginning in 2008 Midas system franchisees in the United States started receiving rebates on their purchases from the Company’s preferred supply chain vendors and MDS no longer receives product royalties on Midas franchisee purchases in the United States. Because the Company’s U.S. supply chain partners are responsible for the warranty of parts during the first 12 months, MDS did not begin to record revenues or expenses under the new program until fiscal 2009.
As of July 1, 2009, the Company changed how the Midas warranty obligations are funded in Canada to match the U.S. program. As a result, beginning in July 2009 Midas system franchisees in Canada started receiving rebates on their purchases from the Company’s preferred supply chain vendors and MDS no longer receives product royalties on Midas franchisee purchases in Canada. Because the Company’s Canadian supply chain partners are responsible for the warranty of parts during the first 12 months, MDS will not begin to record revenues or expenses under the new Canadian program until the third quarter of fiscal 2010.
Annual activity for the deferred warranty obligation related to this new program is summarized as follows (in millions):
| Fiscal Year |
2009 | 2008 | 2007 | |||||||
| Deferred warranty obligation at beginning of period |
$ | 3.0 | $ | — | $ | — | ||||
| Warranty fees charged to franchisees and company-operated shops |
2.7 | 3.0 | — | |||||||
| Warranty credits to franchisees |
(0.4 | ) | — | — | ||||||
| Deferred warranty obligation at end of period |
$ | 5.3 | $ | 3.0 | $ | — | ||||
In fiscal 2009, $0.4 million of warranty billing revenue was included in Replacement part sales and product royalties with an equal amount of warranty expense in the Statement of Operations related to this program.
Stock-Based Compensation
The Company records an expense for outstanding unvested stock awards based on the grant-date fair value of those awards. The fair value of stock option awards has been determined using the Black-Scholes option pricing model.
Earnings Per Share
Basic and diluted earnings per share were calculated based on the following share counts (in millions):
| Fiscal Year |
2009 | 2008 | 2007 | |||
| Weighted-average common shares outstanding |
13.7 | 13.5 | 14.1 | |||
| Common stock warrants |
0.1 | 0.1 | 0.1 | |||
| Shares applicable to basic earnings |
13.8 | 13.6 | 14.2 | |||
| Effect of dilutive stock awards |
— | 0.3 | 0.4 | |||
| Shares applicable to diluted earnings |
13.8 | 13.9 | 14.6 | |||
| Potential common share equivalents: |
||||||
| Stock options |
1.8 | 1.4 | 1.2 |
F-12
Table of Contents
MIDAS
NOTES TO CONSOLIDATED FINANCIAL STATEMENTS—(Continued)
Financial Statement Preparation
The preparation of the financial statements in conformity with accounting principles generally accepted in the United States of America requires management to make estimates and assumptions about future events. These estimates and the underlying assumptions affect the amounts of assets and liabilities reported, disclosures about contingent assets and liabilities, and reported amounts of revenues and expenses. Such estimates include inventory valuation, valuation of receivables, business transformation charges, carrying values of goodwill, intangible assets, long-lived assets, and net deferred tax assets and warranty obligations. These estimates and assumptions are based on management’s best estimates and judgment. Management evaluates its estimates and assumptions on an ongoing basis using historical experience and other factors, including the current economic environment, which management believes to be reasonable under the circumstances. The Company adjusts such estimates and assumptions when facts and circumstances dictate. Illiquid credit markets, volatile equity, foreign currency and energy markets, and declines in consumer spending have combined to increase the uncertainty inherent in such estimates and assumptions. As future events and their effects cannot be determined with precision, actual results could differ significantly from these estimates. Changes in those estimates resulting from continuing changes in the economic environment will be reflected in the financial statements in future periods.
Management has concluded that no material subsequent events have occurred that would require recognition in the Financial Statements or disclosure in the Notes to the Financial Statements, except for the acquisition of 22 California Midas shops from an existing Midas franchisee in January 2010 as disclosed in Note 17 Subsequent Event.
Impact of New Accounting Standards
On October 3, 2009, MDS adopted changes issued by the Financial Accounting Standards Board (“FASB”) to the authoritative hierarchy of Generally Accepted Accounting Principles (“GAAP”). These changes establish the FASB Accounting Standards Codification (Codification) as the source of authoritative accounting principles recognized by the FASB to be applied by nongovernmental entities in the preparation of financial statements in conformity with GAAP. Rules and interpretive releases of the Securities and Exchange Commission (“SEC”) under authority of federal securities laws are also sources of authoritative GAAP for SEC registrants. The FASB will no longer issue new standards in the form of Statements, FASB Staff Positions, or Emerging Issues Task Force Abstracts; instead the FASB will issue Accounting Standards Updates. Accounting Standards Updates (“ASUs”) will not be authoritative in their own right as they will only serve to update the Codification. These changes and the Codification itself do not change GAAP. Other than the manner in which new accounting guidance is referenced, the adoption of these changes had no impact on the Financial Statements.
On July 4, 2009, MDS adopted changes issued by the FASB to accounting for and disclosure of events that occur after the balance sheet date but before financial statements are issued or are available to be issued, otherwise known as “subsequent events.” Specifically, these changes set forth the period after the balance sheet date during which management of a reporting entity should evaluate events or transactions that may occur for potential recognition or disclosure in the financial statements, the circumstances under which an entity should recognize events or transactions occurring after the balance sheet date in its financial statements, and the disclosures that an entity should make about events or transactions that occurred after the balance sheet date. The adoption of these changes had no impact on the Financial Statements as management already followed a similar approach prior to the adoption of this new guidance.
On July 4, 2009, MDS adopted changes issued by the FASB to fair value disclosures of financial instruments. These changes require a publicly traded company to include disclosures about the fair value of its financial instruments whenever it issues summarized financial information for interim reporting periods. Such
F-13
Table of Contents
MIDAS
NOTES TO CONSOLIDATED FINANCIAL STATEMENTS—(Continued)
disclosures include the fair value of all financial instruments, for which it is practicable to estimate that value, whether recognized or not recognized in the statement of financial position; the related carrying amount of these financial instruments; and the method(s) and significant assumptions used to estimate the fair value. Other than the required disclosures, the adoption of these changes had no impact on the Financial Statements.
On January 4, 2009, MDS adopted changes issued by the FASB to the calculation of earnings per share. These changes state that unvested share-based payment awards that contain nonforfeitable rights to dividends or dividend equivalents (whether paid or unpaid) are participating securities and shall be included in the computation of earnings per share pursuant to the two-class method for all periods presented. The adoption of these changes requires all prior-period earnings per share data that is presented to be adjusted retrospectively. Specifically, MDS included 361,000 incremental shares in the weighted-average common shares outstanding calculations for fiscal 2009, with a corresponding decrease in the effect of dilutive stock awards. MDS also was required to include 240,000 and 155,000 incremental shares in the weighted-average common shares outstanding calculations for 2008 and fiscal 2007 respectively. These incremental shares had no impact on fiscal 2008 Basic Earnings Per Share but caused a $0.01 decrease in Basic Earnings Per Share in fiscal 2009 and 2007.
In August 2009, the FASB issued changes to fair value accounting for liabilities. These changes clarify existing guidance that in circumstances in which a quoted price in an active market for the identical liability is not available, an entity is required to measure fair value using a valuation technique that uses a quoted price of either a similar liability or a quoted price of an identical or similar liability when traded as an asset, or another valuation technique that is consistent with the principles of fair value measurements, such as an income approach (e.g., present value technique). This guidance also states that both a quoted price in an active market for the identical liability and a quoted price for the identical liability when traded as an asset in an active market when no adjustments to the quoted price of the asset are required are Level 1 fair value measurements. These changes became effective for MDS on October 4, 2009. The adoption of these changes did not have an impact on the Financial Statements.
In December 2008, the FASB issued changes to employers’ disclosures about postretirement benefit plan assets. These changes provide guidance on an employer’s disclosures about plan assets of a defined benefit pension or other postretirement plan. This guidance is intended to ensure that an employer meets the objectives of the disclosures about plan assets in an employer’s defined benefit pension or other postretirement plan to provide users of financial statements with an understanding of the following: how investment allocation decisions are made; the major categories of plan assets; the inputs and valuation techniques used to measure the fair value of plan assets; the effect of fair value measurements using significant unobservable inputs on changes in plan assets; and significant concentrations of risk within plan assets. These changes became effective for MDS on January 2, 2010. As these changes only require enhanced disclosures, the adoption of these changes did not have an impact on the Financial Statements.
(2) Business Transformation Charges
As part of the Company’s business transformation, the Company developed and implemented strategic initiatives during the past three fiscal years that it believes will enhance its long-term competitive position. These initiatives included a major update to its retail shop image, the closure and re-franchising of certain company-operated shops, the elimination of certain corporate positions and the development of a new Co-Brand image and customer interaction process.
F-14
Table of Contents
MIDAS
NOTES TO CONSOLIDATED FINANCIAL STATEMENTS—(Continued)
The implementation of these business transformation initiatives has resulted in the Company recording substantial business transformation charges to reflect the write-down of assets, the disposition of lease agreements, severance costs, and other related expenses. The charges recorded in connection with the Company’s business transformation process in fiscal years 2009, 2008 and 2007 are summarized in the following table (in millions):
| Fiscal Year |
2009 | 2008 | 2007 | |||||||
| Retail image update |
$ | 0.4 | $ | 1.3 | $ | 2.5 | ||||
| Rationalization of company-operated shops |
0.8 | 0.3 | (0.4 | ) | ||||||
| Severance and other separation costs |
0.4 | — | — | |||||||
| Third party consulting costs |
1.5 | — | — | |||||||
| Other |
0.1 | — | 1.6 | |||||||
| Total business transformation charges |
$ | 3.2 | $ | 1.6 | $ | 3.7 | ||||
Retail Image Update
In connection with the Company’s ongoing retail transformation, MDS developed a major update to its retail shop image. The new image program incorporates changes to internal shop appearance and merchandising, as well as a significant redesign of the Midas shop façade. MDS management believes the new image will better showcase the Company’s expansion into new services, enhance efforts to educate customers and significantly increase the visibility and curb appeal of the typical Midas shop. In order to encourage Midas franchisees to adopt this new image, the Company offered an incentive program whereby MDS provided a subsidy of up to $2,600 per shop for franchisees who agreed to adopt the program prior to certain target dates. Approximately 1,350 locations in North America have converted to the new image. The incentive program ended for U.S. shops in fiscal 2008 and concluded for Canadian shops in fiscal 2009.
Rationalization of Company-Operated Shops
During fiscal 2009, the Company closed four under-performing company-operated shops. In connection with the December 2009 closing of these shops, the Company recorded charges of $0.8 million consisting of $0.5 million of projected non-recoverable lease costs and $0.3 million of fixed asset, intangible and other asset write-downs. In fiscal 2008, the Company incurred charges of $0.3 million in connection with the closure of an under-performing company-operated shop located in Connecticut. In fiscal 2007, the Company recognized a reversal of a previously recorded reserve of $0.4 million upon the favorable disposition of certain leases.
The Company will continue to evaluate all company-operated shop locations and intends to re-franchise additional owned locations where it is determined that the Company’s return on investment objectives are best achieved through re-franchising instead of ownership.
Severance and other separation costs
The Company recorded charges of $0.4 million related to a reduction-in-force announced in October of 2009. The charges were for salary continuation, outplacement assistance and other costs. Three of the 19 employees affected by the reduction-in-force are still employed by the company. Cash paid out was approximately $0.1 million for this program.
Third party consulting costs
In fiscal 2009, the Company recorded charges of $1.5 million for third party consulting costs related to the development of the co-brand image, a re-design of the customer sales and follow-up process in Midas shops and a study of the Midas France business and marketplace.
F-15
Table of Contents
MIDAS
NOTES TO CONSOLIDATED FINANCIAL STATEMENTS—(Continued)
Other
In fiscal 2009, MDS recorded business transformation charges of $0.1 million in connection with the Company’s change in the Canadian warranty program. The Company recorded business transformation charges in fiscal 2007 of approximately $1.0 million related to the early termination of the Company’s supply agreement with AutoZone, $0.3 million in conjunction with the change in the U.S. warranty program and $0.3 million for other charges.
(3) Debt Agreements
On October 27, 2005, MDS entered into a five-year, unsecured $110 million revolving credit facility. On February 4, 2008, the Company amended the loan by increasing the revolving credit facility to $130 million. On December 4, 2009, MDS entered into a three-year extension of its existing unsecured revolving credit facility. The credit agreement was extended through October 27, 2013 with no material changes in existing covenants. The extended facility is for $125 million and is further expandable to $175 million by the Company with lender approval. The interest rate floats based on the underlying rate of LIBOR and the Company’s leverage and was priced at LIBOR plus 3.50% at January 2, 2010. The Company paid approximately $1.5 million in debt financing fees, which will be amortized as interest expense over the life of the agreement. This facility requires maintenance of certain financial covenants including maximum allowable leverage and minimum net worth. As of January 2, 2010, the Company was in compliance with all debt covenants.
As of January 2, 2010, a total of $71.9 million was outstanding under the revolving credit facility. As of January 3, 2009, a total of $83.6 million was outstanding under the revolving credit facility.
In November 2005, $20 million in revolving bank debt was converted from floating rate to fixed rate by locking-in LIBOR at 4.89% for a five-year period. In addition, in March 2007, MDS entered into an interest rate swap arrangement to convert an additional $25 million in revolving bank debt from floating rate to a fixed rate by locking-in LIBOR at 4.91% through October 2010. As a consequence, currently $45 million of the Company’s $71.9 million in revolving bank debt is at fixed rates.
The November 2005 and March 2007 swap arrangements have been designated as cash flow hedges and have been evaluated to be highly effective. As a result, the after-tax change in the fair value of these swaps is recorded in accumulated other comprehensive loss as a gain or loss on derivative financial instruments.
In January 2010, the Company entered into a $40 million forward starting swap to coincide with the end dates of its existing swaps. As a result of this forward swap transaction, in the period from November 2010 through October 2013 (end of the recently extended bank agreement) the Company has locked-in LIBOR at 2.71% for $40 million of revolving bank debt.
The fair value of the Company’s revolving credit facility is determined as the present value of expected future cash flows discounted at the current interest rate for loans of similar terms and comparable credit risk. The debt was refinanced on December 4, 2009 and as a consequence the fair value of the debt approximates the notional value of the debt.
| Expected Maturity Date |
2010 | 2011 | 2012 | There- after |
Total | Fair Value | ||||||||||||||
| Long-term debt: |
||||||||||||||||||||
| Revolving credit facility (variable rate) |
$ | — | $ | — | $ | — | $ | 71.9 | $ | 71.9 | $ | 71.9 | ||||||||
| Average interest rate |
3.73 | % | 3.73 | % | ||||||||||||||||
F-16
Table of Contents
MIDAS
NOTES TO CONSOLIDATED FINANCIAL STATEMENTS—(Continued)
(4) Supplemental Balance Sheet, Cash Flow and Shareholders’ Equity Information
Receivables
Receivables are stated net of an allowance for doubtful accounts. The allowance for doubtful accounts consisted of (in millions):
| Fiscal Year End |
2009 | 2008 | 2007 | |||||||||
| Allowance for doubtful accounts at beginning of year |
$ | 3.5 | $ | 3.8 | $ | 4.2 | ||||||
| Additions charged to bad debts |
2.0 | 2.1 | 1.9 | |||||||||
| Write-downs charged against allowance |
(0.8 | ) | (2.4 | ) | (2.3 | ) | ||||||
| Allowance for doubtful accounts at end of year |
$ | 4.7 | $ | 3.5 | $ | 3.8 | ||||||
The current portion of notes receivable is included in net receivables and the long term portion is included in other assets. Notes receivable consisted of (in millions):
| Fiscal Year End |
2009 | 2008 | ||||
| Current portion |
$ | 3.0 | $ | 3.6 | ||
| Long term portion |
4.2 | 3.7 | ||||
| Notes receivable |
$ | 7.2 | $ | 7.3 | ||
The acquisition of certain company-operated shops resulted in non-cash reductions of accounts receivable of approximately $0.3 million and $1.0 million during fiscal 2009 and 2008, respectively.
Receivables include certain non-trade receivables such as vendor receivables, insurance recoveries and other non-recurring items. Non-trade receivables were $4.9 million as of January 2, 2010 and $4.4 million as of January 3, 2009.
Inventories
Inventories are comprised of finished goods, net of reserves. Inventory reserves consisted of (in millions):
| Fiscal Year End |
2009 | 2008 | 2007 | |||||||||
| Inventory reserves at beginning of year |
$ | 0.4 | $ | 0.7 | $ | 0.7 | ||||||
| Additions charged to expense |
0.4 | 0.2 | 0.2 | |||||||||
| Reserve against inventory of newly acquired shops |
— | 0.1 | 0.2 | |||||||||
| Write-downs charged against reserves |
(0.6 | ) | (0.6 | ) | (0.4 | ) | ||||||
| Inventory reserves at end of year |
$ | 0.2 | $ | 0.4 | $ | 0.7 | ||||||
Property and Equipment
Property and equipment consisted of the following (in millions):
| Fiscal Year End |
2009 | 2008 | ||||||
| Land |
$ | 42.4 | $ | 42.9 | ||||
| Buildings and improvements |
94.4 | 97.2 | ||||||
| Machinery and equipment |
16.5 | 15.1 | ||||||
| Computer hardware |
7.9 | 24.4 | ||||||
| Computer software |
33.8 | 34.0 | ||||||
| Total property and equipment |
195.0 | 213.6 | ||||||
| Accumulated depreciation and amortization |
(108.6 | ) | (121.0 | ) | ||||
| Property and equipment, net |
$ | 86.4 | $ | 92.6 | ||||
F-17
Table of Contents
MIDAS
NOTES TO CONSOLIDATED FINANCIAL STATEMENTS—(Continued)
The Company recorded depreciation expense of $8.8 million, $9.3 million, and $8.9 million in fiscal 2009, 2008 and 2007, respectively. Depreciation expense is included in operating costs and expenses in the Statement of Operations.
Goodwill and Other Intangible Assets
Goodwill and other intangible assets consisted of the following (in millions):
| Fiscal Year End |
2009 | 2008 | ||||||
| Goodwill |
$ | 20.4 | $ | 18.7 | ||||
| Trademark |
12.5 | 12.6 | ||||||
| Franchise agreements |
4.1 | 3.9 | ||||||
| Customer lists |
1.5 | 1.5 | ||||||
| Total goodwill and other intangible assets |
38.5 | 36.7 | ||||||
| Accumulated amortization |
(1.7 | ) | (1.2 | ) | ||||
| Goodwill and other intangible assets, net |
$ | 36.8 | $ | 35.5 | ||||
During fiscal 2009, the Company acquired 10 Midas shops from franchisees for $1.6 million, which generated $1.3 million of incremental goodwill, franchised agreements and customer list intangibles. In addition, MDS completed the acquisition of three franchised SpeeDee shops from the founders of the SpeeDee business. This acquisition was part of the March 2008 SpeeDee acquisition, but the transfer of the shops from G.C. & K.B. Investments, Inc. to MDS was delayed due to leasing issues. As a result, funds held in escrow were released to G.C. & K.B. Investments, Inc. and $0.8 million of incremental goodwill was recorded. Goodwill, trademark and customer list intangibles were reduced by $0.3 million in connection with the re-franchising of four company-operated shops and the closure of four under performing company-operated shops.
In fiscal 2008, goodwill and other intangible assets increased $2.7 million due to the acquisition of 15 company-operated shops, which generated $3.4 million of incremental goodwill, trademark and customer list intangibles partially offset by write-offs of $0.7 million in conjunction with the re-franchising of seven company-operated shops.
On March 30, 2008, Midas acquired the assets of G.C. & K.B. Investments, Inc. and its affiliated entities that franchise and sub-franchise SpeeDee quick-lube and automotive maintenance shops. The purchase price was $21.0 million. As a result of this acquisition, the Company recorded $19.9 million in incremental goodwill and other intangibles, which included $8.7 million of intangible trademark, $3.9 million of intangible franchise agreements and $7.3 million of goodwill. The $3.9 million of intangible franchise agreements will be amortized over a period of 22 years.
Intangible trademarks and goodwill have indefinite lives and, therefore, are not amortized, but are tested annually for impairment in the fourth quarter. MDS computed its annual test in the fourth quarter, which resulted in no impairment. All of the acquired intangible assets are deductible for tax purposes.
Acquired customer lists are amortized over the first two years after acquisition. Acquired franchise agreements are amortized over the remaining life of the agreements acquired. Approximately $3.9 million of acquired franchise agreements were from the SpeeDee acquisition and will be amortized over the next 21 years. The Company recorded amortization expense of $0.6 million in fiscal 2009 and $0.8 million in fiscal 2008.
F-18
Table of Contents
MIDAS
NOTES TO CONSOLIDATED FINANCIAL STATEMENTS—(Continued)
Accrued Expenses
Accrued expenses consisted of the following (in millions):
| Fiscal Year End |
2009 | 2008 | ||||
| Advertising |
$ | 10.0 | $ | 11.4 | ||
| Salaries and wages |
1.4 | 1.4 | ||||
| Taxes other than income taxes |
4.6 | 3.5 | ||||
| Deferred gains / revenue |
0.1 | 0.1 | ||||
| Income taxes |
0.3 | 0.7 | ||||
| Business transformation charges |
0.3 | 0.1 | ||||
| Insurance reserves (current portion) |
0.5 | 0.4 | ||||
| Vendor rebates payable to franchisees |
1.8 | 1.1 | ||||
| Property reserves (current portion) |
0.3 | 0.1 | ||||
| Straight line rent (current portion) |
0.1 | 0.2 | ||||
| Accrued legal fees |
0.3 | 0.4 | ||||
| Accrued rent |
0.1 | 0.8 | ||||
| Accrued interest |
0.6 | 0.4 | ||||
| Other |
1.8 | 2.7 | ||||
| Accrued expenses |
$ | 22.2 | $ | 23.3 | ||
Supplemental Cash Flow Information
Net cash flow from operating activities includes cash payments for interest and income taxes as follows (in millions):
| Fiscal Year |
2009 | 2008 | 2007 | ||||||
| Interest paid |
$ | 7.7 | $ | 8.5 | $ | 8.8 | |||
| Income taxes paid, net of tax refunds |
0.7 | 0.7 | 1.2 | ||||||
Supplemental Shareholders’ Equity Information
Accumulated other comprehensive loss consisted of the following (in millions):
| Fiscal Year |
2009 | 2008 | 2007 | |||||||||
| Foreign currency translation |
$ | (1.1 | ) | $ | (2.3 | ) | $ | (0.2 | ) | |||
| Unrecognized pension costs, net of tax |
(14.4 | ) | (15.0 | ) | (2.4 | ) | ||||||
| Loss on derivative financial instruments, net of tax |
(1.0 | ) | (1.5 | ) | (0.7 | ) | ||||||
| Accumulated other comprehensive loss |
$ | (16.5 | ) | $ | (18.8 | ) | $ | (3.3 | ) | |||
(5) Advertising
Under the terms of its Midas franchise agreements, MDS is obligated to spend an amount equal to one-half of the royalty payments received from Midas franchisees for advertising expenditures. Amounts received from Midas franchisees for advertising are recorded as liabilities until disbursed. MDS also administers cooperative advertising programs under which amounts received from certain Midas franchisees are recorded as liabilities until they are disbursed. Aggregate expenditures under these programs by Midas’ North American operations amounted to $47.2 million, $49.6 million, and $48.7 million in fiscal 2009, 2008, and 2007, respectively.
F-19
Table of Contents
MIDAS
NOTES TO CONSOLIDATED FINANCIAL STATEMENTS—(Continued)
Under the terms of its SpeeDee franchise agreements, MDS must use all weekly marketing fees collected from franchisees for the development of advertising and marketing materials and programs or the placement of advertising. Amounts received from SpeeDee franchisees are recorded as a liability until disbursed. Aggregate expenditures under this program in fiscal 2009 were $3.4 million and for the nine months in fiscal 2008 after the MDS purchase of SpeeDee were $2.7 million.
MDS also incurs certain advertising costs that are included in selling, general and administrative expenses, which amounted to $4.2 million, $4.4 million, and $3.9 million in fiscal 2009, 2008, and 2007, respectively.
(6) Income Taxes
Income tax expense consisted of the following (in millions):
| Fiscal Year |
2009 | 2008 | 2007 | |||||||
| Current: |
||||||||||
| U.S. Federal |
$ | — | $ | — | $ | — | ||||
| Non-U.S. |
0.4 | 0.4 | 0.9 | |||||||
| U.S. state and local |
0.3 | 0.2 | 0.2 | |||||||
| Total current |
0.7 | 0.6 | 1.1 | |||||||
| Deferred: |
||||||||||
| U.S. Federal |
2.2 | 3.0 | 6.8 | |||||||
| Non-U.S. |
0.4 | 1.0 | (0.2 | ) | ||||||
| U.S. state and local |
0.4 | 0.6 | 2.7 | |||||||
| Total deferred |
3.0 | 4.6 | 9.3 | |||||||
| Total income tax expense |
$ | 3.7 | $ | 5.2 | $ | 10.4 | ||||
The items which gave rise to differences between the income taxes in the statements of operations and the income taxes computed at the U.S. statutory rate are summarized as follows:
| Fiscal Year |
2009 | 2008 | 2007 | ||||||
| Income tax expense computed at U.S. statutory rate |
35.0 | % | 35.0 | % | 35.0 | % | |||
| U.S. state and local taxes, net of U.S. Federal income tax effects |
4.3 | 3.4 | 4.1 | ||||||
| Non-U.S. effective tax rate differential |
(0.5 | ) | (0.5 | ) | 0.2 | ||||
| Write off of restricted stock deferred tax asset |
8.3 | — | — | ||||||
| Non-deductible expenses (primarily executive compensation) |
6.6 | 1.8 | 2.0 | ||||||
| Increase in valuation allowance |
1.4 | 1.2 | 0.3 | ||||||
| Revaluation of deferred tax asset for rate change and utilization |
4.0 | (0.5 | ) | 2.6 | |||||
| Other items |
(0.4 | ) | (0.1 | ) | (0.2 | ) | |||
| Effective income tax rate |
58.7 | % | 40.3 | % | 44.0 | % | |||
The Company’s effective tax rate for fiscal 2009 was 58.7%, which exceeds the 2009 statutory tax rate of 39.2%. The fiscal 2009 variance from the statutory rate was primarily due to incremental non-deductible expenses, a write down of the deferred tax asset related to the restricted stock that vested during the year at a value significantly lower than the amount that was expensed for financial statement purposes, as well as a write-down of the Canadian deferred tax asset due to a reduction in corporate income tax rates for both Ontario and British Columbia enacted during fiscal 2009.
F-20
Table of Contents
MIDAS
NOTES TO CONSOLIDATED FINANCIAL STATEMENTS—(Continued)
Pretax income from non-U.S. operations amounted to $0.9 million in fiscal 2009, $2.7 million in fiscal 2008, and $35 thousand in fiscal 2007. As of January 2010, the non-U.S. operations had no accumulated earnings and profits.
Deferred income taxes are created by “temporary differences” between amounts of assets and liabilities for financial reporting purposes and such amounts as reported under income tax regulations. Deferred tax assets and liabilities consisted of (in millions):
| Fiscal Year End |
2009 | 2008 | ||||||
| Deferred tax assets attributable to: |
||||||||
| Business transformation accruals |
$ | 1.0 | $ | 1.1 | ||||
| Employee benefits and vacation accruals |
4.5 | 4.6 | ||||||
| Goodwill |
1.6 | 3.1 | ||||||
| Net operating loss carryforwards and tax credits |
29.8 | 30.8 | ||||||
| Warranty reserve |
6.9 | 7.4 | ||||||
| Depreciation and amortization |
1.5 | 0.6 | ||||||
| Pensions |
7.4 | 8.5 | ||||||
| Other items |
2.6 | 2.1 | ||||||
| Total deferred tax assets |
55.3 | 58.2 | ||||||
| Valuation allowance |
(0.4 | ) | (0.6 | ) | ||||
| Net deferred tax asset |
$ | 54.9 | $ | 57.6 | ||||
| Net deferred tax assets included in: |
||||||||
| Current assets |
$ | 9.5 | $ | 10.7 | ||||
| Non-current assets |
45.4 | 46.9 | ||||||
| Net deferred tax assets |
$ | 54.9 | $ | 57.6 | ||||
As of January 2, 2010 and January 3, 2009, the Company had recorded valuation allowances of $0.4 million and $0.6 million, respectively, against certain state income tax net operating loss carryovers because the Company has determined that it is more likely than not that this portion of these deferred tax assets will not be realized. The Company believes that it is more likely than not that the results of future operations will generate sufficient taxable income to realize the remaining U.S. and Canadian deferred tax assets.
As of January 2, 2010, the Company has net operating loss carryforwards of approximately $69.9 million available to offset future taxable income for Federal and Canadian income tax purposes. The Federal net operating loss carryforwards of approximately $63.6 million expire between 2023 and 2024. The Company generated approximately $6.6 million in Federal taxable income in fiscal 2009 and $11.9 million in fiscal 2008. The Company believes that it will generate sufficient additional Federal taxable income in future years to fully utilize the $63.6 million net operating loss carryforward before it begins to expire in 2023.
The Canadian net operating loss carryforward is approximately $6.3 million and expires between 2010 and 2027. The Company’s Canadian operation generated taxable income of $1.0 million in fiscal 2009 and taxable income of $1.2 million in fiscal 2008. The Company believes that it will generate sufficient taxable income in Canada in future tax years to fully utilize the $6.3 million Canadian net operating loss carry forward before it expires.
The Company also has tax credits of approximately $3.7 million available to offset future Federal income taxes. The tax credits expire between 2015 and 2018.
F-21
Table of Contents
MIDAS
NOTES TO CONSOLIDATED FINANCIAL STATEMENTS—(Continued)
(7) Franchise Agreements
The Company’s franchise agreements generally cover a 15 to 20-year period and provide for renewals. A franchise agreement can be canceled by the Company only in the event a franchisee fails to comply with the provisions of the agreement. Franchise agreements provide for initial and renewal fees and continuing royalty payments based on a percentage of sales. Midas franchisees pay the Company monthly royalties based on a percentage of sales. In North America, MDS is obligated to spend an amount equal to one-half of the royalty payments it receives for advertising. SpeeDee franchisees pay advertising fees that are not included in the royalty payments.
Worldwide MDS shops in operation as of fiscal year end consisted of (unaudited):
| Midas Shops |
2009 | 2008 | 2007 | |||
| Franchised and licensed |
2,278 | 2,411 | 2,464 | |||
| Company-operated |
100 | 98 | 91 | |||
| Total |
2,378 | 2,509 | 2,555 | |||
| SpeeDee Shops |
||||||
| Franchised and licensed |
162 | 171 | ||||
| Company-operated |
7 | 2 | ||||
| Total |
169 | 173 | ||||
As of January 2, 2010, there were nine franchised shops and 14 company-operated shops within the Midas and SpeeDee systems operating as Co-Brand locations.
(8) Leases
Control of the real estate used by Midas shops is a fundamental strength of the Midas program. SpeeDee franchise agreements also contain provisions for lease control but until recently such control has not been required. Going forward, real estate control will be required of new and renewing SpeeDee franchisees.
MDS employs a number of methods to ensure continued dedication of the real estate to the franchise program. MDS leases real estate that is subleased to franchisees and owns real estate in the U.S. and Canada that is leased to franchisees. MDS has also entered into contingent operating lease agreements that are described below. At fiscal year end 2009, approximately 86% of real estate associated with North American Midas shops was controlled by Midas, using one of these methods.
Leased Real Estate and Equipment
Gross rent expense applicable to operating leases relates to rentals of shops, corporate administration facilities and other miscellaneous facilities. Gross rent expense, the sublease rental income from franchisees and other third parties that reduced gross rent expense, and the resulting net rent expense for fiscal 2009, 2008 and 2007 are presented below (in millions):
| Fiscal Year |
2009 | 2008 | 2007 | ||||||
| Gross rent expense |
$ | 28.2 | $ | 27.6 | $ | 26.6 | |||
| Sublease rental income |
24.0 | 25.6 | 24.8 | ||||||
| Net rent expense |
$ | 4.2 | $ | 2.0 | $ | 1.8 | |||
F-22
Table of Contents
MIDAS
NOTES TO CONSOLIDATED FINANCIAL STATEMENTS—(Continued)
Substantially all of the Company’s operating leases provide that MDS pay taxes, maintenance, insurance, and certain other operating expenses. The subleases with franchisees contain provisions for MDS to recover such costs. Real estate expenses are recognized using the straight-line method.
Real Estate Sale and Leaseback Transaction
MDS owns retail properties throughout the United States and Canada that are leased to franchisees and operated as Midas shops. During fiscal 2002, the Company sold 77 of these properties to Realty Income Corporation, a publicly traded real estate investment trust (REIT), and realized approximately $39.6 million in net proceeds. Simultaneous to that sale, MDS leased these properties from Realty Income Corporation and the sites continue to be leased to Midas franchisees under existing leases. Because these properties will continue to generate rents to MDS, the Company recorded a finance lease obligation pursuant to the Statement of Financial Accounting Standards No. 98 “Accounting for Leases” on the balance sheet of $39.6 million, equal to the net sale price of the properties, and no gain on the sale was recognized. The properties remain on the balance sheet at their historic cost and continue to be depreciated over their remaining useful lives. Annual lease payments (shown below) will be made through the expiration of the lease in 2022.
Minimum Annual Rental Payments
At fiscal year end 2009, annual minimum rental payments due under capital, finance and operating leases that have initial or remaining non-cancelable terms in excess of one year, along with sublease rental income on real estate due under non-cancelable subleases were as follows (in millions):
| Capital Leases |
Finance Leases |
Operating Leases |
Sublease Rentals |
Total | ||||||||||||
| 2010 |
$ | 0.4 | $ | 4.7 | $ | 26.8 | $ | (21.4 | ) | $ | 10.5 | |||||
| 2011 |
0.4 | 4.7 | 24.3 | (19.7 | ) | 9.7 | ||||||||||
| 2012 |
0.4 | 4.7 | 21.2 | (17.0 | ) | 9.3 | ||||||||||
| 2013 |
0.4 | 4.7 | 16.5 | (12.8 | ) | 8.8 | ||||||||||
| 2014 |
0.4 | 4.7 | 12.6 | (9.4 | ) | 8.3 | ||||||||||
| Thereafter |
0.5 | 35.0 | 40.5 | (28.7 | ) | 47.3 | ||||||||||
| Total minimum lease payments |
2.5 | 58.5 | $ | 141.9 | $ | (109.0 | ) | $ | 93.9 | |||||||
| Less imputed interest |
0.6 | 26.8 | ||||||||||||||
| Present value of minimum lease payments |
1.9 | 31.7 | ||||||||||||||
| Less current portion |
0.3 | 1.2 | ||||||||||||||
| Obligations under capital and finance lease obligations—noncurrent |
$ | 1.6 | $ | 30.5 | ||||||||||||
At fiscal year end 2009 and 2008, the net book value of property under capital leases included in the balance sheets amounted to $1.2 million and $1.4 million, respectively. At fiscal year end 2009 and 2008, the net book value of property under finance leases included in the balance sheets amounted to $24.7 million and $25.2 million, respectively.
Real Estate Owned by Midas and Leased to Franchisees
MDS owns real estate located in various communities throughout the United States and Canada that is leased to franchisees under operating lease agreements. Substantially all leases are for initial terms of 20 years and provide for minimum and contingent rentals.
F-23
Table of Contents
MIDAS
NOTES TO CONSOLIDATED FINANCIAL STATEMENTS—(Continued)
Real estate leased to franchisees and included in the balance sheets consisted of (in millions):
| Fiscal Year End |
2009 | 2008 | ||||||
| Land |
$ | 24.3 | $ | 24.9 | ||||
| Buildings and improvements |
50.8 | 52.9 | ||||||
| Total property and equipment |
75.1 | 77.8 | ||||||
| Accumulated depreciation |
(38.3 | ) | (37.5 | ) | ||||
| Property and equipment, net |
$ | 36.8 | $ | 40.3 | ||||
Rental revenue on owned real estate for fiscal 2009 was $8.8 million, compared to $9.0 million in fiscal 2008 and $9.5 million in fiscal 2007. Minimum future lease payments to be received are as follows (in millions):
| 2010 |
$ | 8.3 | |
| 2011 |
7.6 | ||
| 2012 |
7.1 | ||
| 2013 |
6.9 | ||
| 2014 |
6.9 | ||
| Thereafter |
55.4 | ||
| Total |
$ | 92.2 | |
Certain sub-leases on owned real estate contain a clause whereby future minimum rental income is contingent upon future retail sales at the location. As a result of this contingency, minimum future lease payments to be received, based upon retail sales, have not been included in the table above. The estimated future lease payments to be received by the Company under these lease agreements, based on the last fixed minimum rent, are as follows (in millions):
| 2010 |
$ | 0.1 | |
| 2011 |
0.8 | ||
| 2012 |
1.3 | ||
| 2013 |
1.4 | ||
| 2014 |
1.4 | ||
| Thereafter |
10.1 | ||
| Total |
$ | 15.1 | |
Contingent Operating Lease Agreements
MDS has entered into contingent operating lease agreements covering real estate that is leased by U.S. and Canadian franchisees from parties that are directly or indirectly related to the franchisees. At January 2, 2010, 64 Midas and 16 SpeeDee shops were covered by these contingent operating lease agreements, under which MDS could be required, under certain limited circumstances, to begin making rental payments with respect to individual shop locations. For the contingent Midas shop leases, the average annual shop rental is $59 thousand with an average remaining term of approximately five years. For the contingent SpeeDee shop leases, the average shop rental is $63 thousand with an average remaining term of approximately thirteen years.
Management believes that, individually and in the aggregate, any potential difference that might arise under these contingent lease agreements between the rental expense and the rental income from future subleases would not materially affect the financial position or results of operations of MDS.
F-24
Table of Contents
MIDAS
NOTES TO CONSOLIDATED FINANCIAL STATEMENTS—(Continued)
(9) Pension Plans
Defined Benefit Pension Plans and Other Postretirement Plans
Certain MDS employees in the U.S. and Canada are covered under various defined benefit pension plans sponsored and funded by MDS. Plans covering salaried employees provide pension benefits based on years of service, and generally are limited to a maximum of 20% of the employees’ average annual compensation during the five years preceding retirement. Plans covering hourly employees generally provide benefits of stated amounts for each year of service. Plan assets are invested primarily in common stocks, corporate bonds, and government securities. The cost of these plans is being funded currently.
Net periodic pension cost for fiscal 2009, 2008 and 2007 are presented in the following table (in millions):
| Fiscal Year |
2009 | 2008 | 2007 | |||||||||
| Service cost |
$ | 0.9 | $ | 0.9 | $ | 1.2 | ||||||
| Interest cost on projected benefit obligation |
3.8 | 3.6 | 3.4 | |||||||||
| Expected return on assets |
(4.4 | ) | (5.0 | ) | (4.9 | ) | ||||||
| Net amortization and deferral |
0.8 | 0.6 | 0.5 | |||||||||
| Other |
(0.4 | ) | — | — | ||||||||
| Total net periodic cost |
$ | 0.7 | $ | 0.1 | $ | 0.2 | ||||||
The principal economic assumptions used in the determination of net periodic pension cost of the U.S. Defined Benefits Plan included the following:
| Fiscal Year |
2009 | 2008 | 2007 | ||||||
| Discount rate |
5.875 | % | 6.125 | % | 6.25 | % | |||
| Expected long-term rate of return on plan assets |
8.25 | % | 8.25 | % | 8.50 | % | |||
| Rate of increase in compensation levels |
0.00 | % | 3.25 | % | 3.25 | % |
The Company used the Citigroup pension index as the basis for determining the 2009, 2008 and 2007 discount rates. Such indices are long term in nature, which reflects the future timing of the expected cash flows for the pension plan. The future compensation rate for 2009 reflects a 0.00% increase for 2009 due to the wage freeze implemented by the Company in 2009 while compensation rates for 2010 and beyond reflect a 3.25% increase.
The Company believes the assumed long-term rate of return on pension plan assets is appropriate given the Company’s target long-term asset allocation. The Company believes its target asset allocation is appropriate given the expected timing and amount of expenses for the plan. The Company’s target asset allocation and actual asset allocation for fiscal 2009 and fiscal 2008 were as follows for the U.S. Defined Benefit Plan:
| Fiscal Year |
Target | 2009 | 2008 | ||||||
| Large cap domestic equity securities |
29 | % | 29 | % | 27 | % | |||
| Mid cap domestic equity securities |
10 | 10 | 8 | ||||||
| Small cap domestic equity securities |
15 | 16 | 14 | ||||||
| International equity securities |
15 | 15 | 12 | ||||||
| Domestic fixed income and cash |
31 | 30 | 39 | ||||||
| Total |
100 | % | 100 | % | 100 | % | |||
F-25
Table of Contents
MIDAS
NOTES TO CONSOLIDATED FINANCIAL STATEMENTS—(Continued)
The Canadian Hourly Defined Benefit Plan and the Canadian Salary Defined Benefit Plan assets are allocated 100% to cash and cash equivalents as these plans are either in process of being fully wound up or are significantly over-funded. The fair value of the Canadian plan assets was approximately $5.8 million as of January 2, 2010.
The fair value of the pension plans’ assets at January 2, 2010 by asset category are as follows (in millions):
| End of Fiscal Year 2009 |
Quoted Prices in Active Markets for Identical Assets (Level 1) |
Significant Other Observable Inputs (Level 2) |
Significant Unobservable Inputs (Level 3) | |||||||||
| Large cap domestic equity securities |
$ | 12.7 | $ | — | $ | 12.7 | $ | — | ||||
| Mid cap domestic equity securities |
4.5 | — | 4.5 | — | ||||||||
| Small cap domestic equity securities |
6.9 | — | 6.9 | — | ||||||||
| International equity securities |
6.3 | 6.3 | — | — | ||||||||
| Domestic fixed income and cash |
18.8 | 17.9 | 0.9 | — | ||||||||
| Total |
$ | 49.2 | $ | 24.2 | $ | 25.0 | $ | — | ||||
Large Cap Domestic Equity Securities: Large cap domestic equity securities are primarily investments in common collective trust funds indexed to the Standard & Poor’s (“S&P”) 500 Index, which represents a market capitalization-weighted index of the 500 largest and most widely held stocks. Standards and Poor’s chooses the member companies for the 500 based on market size, liquidity and industry group representation. Included are the stocks of industrial, financial, utility and transportation companies.
Mid Cap Domestic Equity Securities: Mid cap domestic equity securities are primarily investments in common collective trust funds indexed to the S&P Mid Cap 400, which is the most widely used index for mid-sized companies. The S&P Mid Cap 400 covers over 7% of the U.S. equities market.
Small Cap Domestic Equity Securities: Small cap domestic equity securities are primarily investments in common collective trust funds indexed to the Russell 2000 Index, which measures the performance of the small-cap segment of the entire U.S. equity market. The Russell 2000 Index is a subset of the Russell 3000 Index representing approximately 8% of the total market capitalization of that index. It includes 2,000 of the smallest securities based on a combination of their market cap and current index membership.
International Equity Securities: International equity securities are primarily investments in common collective trust funds indexed to the Morgan Stanley Capital International (“MSCI”) Europe Australasia Far East (“EAFE”) Index. The MSCI EAFE Index is a benchmark of international equity investments representing approximately 85% of the developed market’s total capitalization, excluding the U.S. and Canada.
Domestic Fixed Income and Cash: Domestic fixed income and cash are primarily mutual funds indexed to the Barclay’s Capital Aggregate Bond Index, which is a market capitalization weighted index for U.S. investment grade bonds. A portion of the cash is invested in common collective trust money market funds.
F-26
Table of Contents
MIDAS
NOTES TO CONSOLIDATED FINANCIAL STATEMENTS—(Continued)
The following table presents estimated future benefits payments over the next 10 years, including expected future service, as appropriate, as of January 2, 2010 (in millions):
| Fiscal Year |
|||
| 2010 |
$ | 4.1 | |
| 2011 |
3.6 | ||
| 2012 |
3.3 | ||
| 2013 |
3.5 | ||
| 2014 |
3.7 | ||
| 2015 – 2019 |
21.9 | ||
Estimated payments in fiscal 2010 include special payouts associated with the 2003 partial wind-up of the Canadian Salary Defined Benefit Plan of approximately $1.1 million.
The changes in the projected benefit obligations for fiscal 2009 and fiscal 2008 were as follows (in millions):
| Fiscal Year |
2009 | 2008 | ||||||
| Benefit obligations as of the beginning of the year |
$ | 63.8 | $ | 61.7 | ||||
| Change in foreign currency exchange rates |
0.5 | (0.7 | ) | |||||
| Service cost |
0.9 | 1.1 | ||||||
| Interest cost |
3.8 | 4.3 | ||||||
| Actuarial loss |
1.7 | 2.0 | ||||||
| Census data adjustment |
(0.4 | ) | — | |||||
| Benefits paid and plan expenses |
(3.2 | ) | (4.6 | ) | ||||
| Benefit obligations as of the end of the year |
$ | 67.1 | $ | 63.8 | ||||
The changes in the fair market value of the plan assets for fiscal 2009 and fiscal 2008 were as follows (in millions):
| Fiscal Year |
2009 | 2008 | ||||||
| Fair value of assets as of the beginning of the year |
$ | 44.8 | $ | 65.3 | ||||
| Change in foreign currency exchange rates |
0.8 | (1.3 | ) | |||||
| Actual return on plan assets |
6.2 | (14.6 | ) | |||||
| Company contributions |
0.6 | — | ||||||
| Benefits paid and plan expenses |
(3.2 | ) | (4.6 | ) | ||||
| Fair value of assets as of the end of the year |
$ | 49.2 | $ | 44.8 | ||||
The Company’s policy is to fund the pension plans in accordance with applicable U.S. and Canadian government regulations and to make additional contributions as required. As of January 2, 2010, the Company has met all regulatory minimum funding requirements. In fiscal year 2008, MDS made no contributions to the Company’s pension plans as per the regulatory minimum funding requirements. As a result of the significant reduction in the fair value of the U.S. plan assets in 2008 MDS was be required to make a contribution to the U.S. plan in fiscal year 2009. Under the U.S. Pension Protection Act of 2006 (PPA) MDS would have been expected to contribute approximately $2.9 million to the U.S. pension plan during 2009. New legislation, the Worker, Retiree, Employer Recovery Act of 2008 (WRERA), was passed in late December 2008 and provides
F-27
Table of Contents
MIDAS
NOTES TO CONSOLIDATED FINANCIAL STATEMENTS—(Continued)
temporary relief of pension funding requirements. The 2009 funding requirements under WRERA were less than the funding requirements under PPA. Under WRERA, the Company made a $0.6 million contribution to the U.S. Plan in 2009 and expects to contribute approximately $1.4 million to the U.S. Plan during 2010.
The following table reconciles the pension plans’ funded status to the amounts recognized in MDS’s balance sheets as of fiscal year end 2009 and 2008 (in millions):
| Fiscal Year |
2009 | 2008 | ||||||
| Actuarial present value of projected benefit obligation |
$ | (67.1 | ) | $ | (63.8 | ) | ||
| Plan assets at fair market value |
49.2 | 44.8 | ||||||
| Plan assets below benefit obligation |
(17.9 | ) | (19.0 | ) | ||||
| Prepaid (accrued) pension cost recognized on balance sheets |
$ | (17.9 | ) | $ | (19.0 | ) | ||
Amounts recognized in accumulated other comprehensive loss as of fiscal 2009 and fiscal 2008 were as follows (in millions):
| Fiscal Year |
2009 | 2008 | ||||
| Net actuarial loss |
$ | 26.0 | $ | 26.6 | ||
| Prior service costs |
— | 0.1 | ||||
| Total recognized before tax |
$ | 26.0 | $ | 26.7 | ||
As of January 2, 2010, the Company has recorded accrued pension costs as follows (in millions):
| Fiscal Year |
2009 | |||
| Prepaid pension asset |
$ | 2.3 | ||
| Canadian prepaid reserve |
(2.3 | ) | ||
| Accrued pension liability |
(20.1 | ) | ||
| Pension liability |
$ | (20.1 | ) | |
The $2.3 million valuation reserve pertains to the partial wind-up of the Canadian Salaried Defined Benefit Plan. As per provincial laws, the asset balance in excess of the Projected Benefit Obligation is not an asset of the Company.
Defined Contribution Plans
Substantially all U.S. salaried employees, certain U.S. hourly employees, and certain Canadian employees participate in voluntary, contributory defined contribution plans to which MDS makes full or partial matching contributions. The Company’s matching contributions to these plans amounted to approximately $0.4 million, $1.0 million, and $0.9 million in fiscal 2009, 2008 and 2007, respectively. MDS incurred costs to maintain the non-qualified plans of approximately $0.1 million, $0.2 million and $0.1 million in fiscal 2009, 2008 and 2007, respectively.
F-28
Table of Contents
MIDAS
NOTES TO CONSOLIDATED FINANCIAL STATEMENTS—(Continued)
(10) Stock-Based Compensation and Other Equity Instruments
Stock Options
The Midas Stock Incentive Plan, the Midas Treasury Stock Plan and the Midas Directors’ Deferred Compensation Plan (the “Plans”) authorize the issuance of up to 4,806,886 shares of Midas common stock pursuant to the exercise of incentive stock options, non-qualified stock options and stock appreciation rights and the grant of restricted stock and performance awards. Options granted pursuant to the Plans generally vest over a period of four or five years commencing one year after the date of grant. It is the Company’s policy to issue shares out of treasury when options are exercised. The following table summarizes information regarding the outstanding stock options as January 2, 2010:
| Number of Shares |
Option Price Ranges |
Weighted Average Exercise Price |
Weighted Average Remaining Contractual Term (in years) |
Aggregate Intrinsic Value (in millions) | ||||||||||
| Outstanding at fiscal year end 2006 |
1,617,367 | $ | 6.77–$34.66 | $ | 13.51 | |||||||||
| Granted |
168,600 | 21.53–21.53 | 21.53 | |||||||||||
| Exercised |
(187,418 | ) | 8.09–22.00 | 12.69 | ||||||||||
| Cancelled and forfeited |
(47,300 | ) | 13.30–22.17 | 18.47 | ||||||||||
| Outstanding at fiscal year end 2007 |
1,551,249 | 6.77–34.66 | 14.33 | |||||||||||
| Granted |
230,000 | 15.22–15.22 | 15.22 | |||||||||||
| Exercised |
(14,088 | ) | 8.09–15.65 | 14.04 | ||||||||||
| Cancelled and forfeited |
(89,608 | ) | 15.65–22.17 | 21.40 | ||||||||||
| Outstanding at fiscal year end 2008 |
1,677,553 | 6.77–34.66 | 14.08 | |||||||||||
| Granted |
298,000 | 9.87–9.87 | 9.87 | |||||||||||
| Cancelled and forfeited |
(48,500 | ) | 14.88–34.66 | 26.41 | ||||||||||
| Outstanding at fiscal year end 2009 |
1,927,053 | 6.77–23.99 | 13.12 | 5.4 | $ | 0.9 | ||||||||
| Exercisable at fiscal year end 2009 |
1,249,753 | 6.77–23.99 | 12.18 | 3.8 | 0.9 | |||||||||
Additional information pertaining to option activity during fiscal 2009, 2008 and 2007 was as follows (in millions):
| 2009 | 2008 | 2007 | ||||||||||
| Weighted average grant-date fair value of: |
||||||||||||
| Stock options granted |
$ | 1.3 | $ | 1.3 | $ | 1.4 | ||||||
| Stock options exercised |
— | 0.1 | 1.2 | |||||||||
| Stock options vested |
1.2 | 2.3 | 1.3 | |||||||||
| Stock options forfeited |
(0.7 | ) | (1.1 | ) | (0.9 | ) | ||||||
The weighted average estimated fair value of the options granted in fiscal 2009, 2008 and 2007 was $4.52, $5.82 and $8.45, respectively, based on the Black-Scholes valuation model using the following assumptions:
| Fiscal Year |
2009 | 2008 | 2007 | ||||||
| Risk-free interest rate |
2.45 | % | 3.06 | % | 4.61 | % | |||
| Dividend yield |
0.0 | % | 0.0 | % | 0.0 | % | |||
| Expected volatility |
43.48 | % | 32.50 | % | 28.01 | % | |||
| Expected life in years |
6.25 | 6.25 | 6.50 |
F-29
Table of Contents
MIDAS
NOTES TO CONSOLIDATED FINANCIAL STATEMENTS—(Continued)
As of January 2, 2010, there was $2.7 million in stock option compensation expense related to unvested awards not yet recognized, which is expected to be recognized over a weighted average period of 1.5 years. Due to the limited number of stock option recipients, the Company uses the simplified method to estimate the expected life.
Restricted Stock
Annually the Company grants shares of restricted stock to certain of its employees, officers and directors. Certain restricted stock vests at the five or seven year anniversary, with provisions for accelerated vesting upon the occurrence of certain pre-determined events (“cliff-vesting shares”), while other restricted stock vests equally over periods of three to five-years or only upon the occurrence of certain pre-determined events (the latter being referred to as “performance shares”). The fair value of all but the performance share grants is equal to the stock price on the date of the grant. The fair value of the performance share grants is based on their derived service period calculated using either a Monte Carlo simulation model or management’s expectations of achieving the objectives depending on the nature of the performance criteria. Activity for restricted shares for the prior three years, including the non-vested restricted shares outstanding and the weighted average grant-date fair value of those restricted shares is shown in the table below:
| Number of Restricted Shares |
Weighted Average Grant-Date Fair Value |
||||||
| Non-vested balance at fiscal year end 2006 |
495,328 | $ | 19.72 | ||||
| Granted |
116,800 | 15.57 | |||||
| Vested |
(10,250 | ) | 9.07 | ||||
| Forfeited |
(31,833 | ) | 21.49 | ||||
| Non-vested balance at fiscal year end 2007 |
570,045 | 15.75 | |||||
| Granted |
208,000 | 10.08 | |||||
| Vested |
(87,680 | ) | 12.30 | ||||
| Non-vested balance at fiscal year end 2008 |
690,365 | 14.66 | |||||
| Granted |
288,900 | 9.03 | |||||
| Vested |
(221,062 | ) | (20.14 | ) | |||
| Non-vested balance at fiscal year end 2009 |
758,203 | $ | 10.57 | ||||
The performance shares granted in fiscal 2009 and fiscal 2008 vest only if certain internal performance measures, all pertaining to growth of the company’s cash flow, are met or exceeded. These conditionally vested grants were valued based on management’s estimate of meeting the performance requirement.
The performance shares granted in 2007 vest only if the total return on the Company’s stock exceeds the total return on the S&P 500 stock index as of certain measurement dates. These conditionally vested grants were valued based on the probability of meeting the performance requirement. The derived service period for the conditionally vested grants was calculated using a Monte Carlo simulation model which utilizes multiple input variables that determine the probability of satisfying each market condition stipulated in the award grant.
As of January 2, 2010, there was $4.0 million of unamortized restricted stock compensation of which $7.7 million was included as a reduction to paid-in capital and $3.7 million was included in non-vested restricted stock subject to redemption. The $4.0 million of unamortized restricted stock compensation is expected to be recognized over a weighted average period of 2.1 years.
Restricted stock grants include a “change in control” provision, which provides for cash redemption of unvested restricted stock in certain circumstances. ASC 480 Distinguishing Liabilities From Equity requires
F-30
Table of Contents
MIDAS
NOTES TO CONSOLIDATED FINANCIAL STATEMENTS—(Continued)
securities with contingent cash settlement provisions that are not solely in the control of the issuer, without regard to probability of occurrence, to be classified outside of shareholders’ equity. While the Company believes the possibility of occurrence of any such change of control event is remote, the contingent cash settlement of the restricted stock as a result of such event would not be solely in the control of the Company. As such, the Company presents the $3.7 million value of unvested restricted stock as temporary equity on the consolidated balance sheet. Upon the vesting of the restricted stock the Company reclassifies the value of the restricted stock to permanent equity.
Common Stock Warrants
On March 27, 2003, the Company issued 1.0 million warrants valued at $5.0 million in connection with its 2003 debt restructuring. On January 5, 2004, 500,000 of these warrants were automatically cancelled because the Company met certain financial objectives contained in the warrant agreements. As of January 2, 2010, a total of 41,273 warrants remained outstanding. The exercise price of the warrants is $0.01, and the warrants are exercisable at any time up to March 27, 2013. Any warrants that remain unexercised at March 27, 2013 are automatically exercised as of that date.
(11) Shareholder Rights Agreement and Series A Junior Participating Preferred Stock
In fiscal 2007, MDS adopted a Rights Agreement providing for the issuance of one Preferred Stock Purchase Right (a “Right”) with each share of MDS common stock. Each Right entitles the registered holder to purchase from MDS one one-hundredth of a share of Series A Junior Participating Preferred Stock (a “Preferred Share”) at a price of $80 per one one-hundredth of a Preferred Share (the “Purchase Price”), subject to adjustment. The Rights will become exercisable on the Rights Distribution Date, which is the earlier of the tenth day following a public announcement that a person(s) has acquired beneficial ownership of 20% or more of the MDS common stock (an “Acquiring Person”), or ten business days after the commencement of a tender offer or exchange offer that would result in a person(s) acquiring beneficial ownership of 20% or more of the outstanding shares of Midas common stock.
If a person becomes an Acquiring Person, each Right holder (other than the Acquiring Person) will be entitled to receive, upon exercise of the Right, a number of shares of MDS common stock having a market value of two times the exercise price of the Right. If MDS is acquired in a merger or other business combination, each Right holder (other than the Acquiring Person) will be entitled to receive, upon exercise of a Right, a number of the acquiring Company’s common shares having a market value at that time of two times the exercise price of the Right.
In general, MDS can redeem all the Rights for one cent per Right at any time until the date that a person has become an Acquiring Person. On December 14, 2009, the Rights Agreement was amended to exempt certain institutional investors from the definition of Acquiring Person. Specifically, it exempted investors who have Beneficially Owned (as defined in the Rights Agreement) more than 5% of the Company's outstanding common stock during the preceding three years and do not Beneficially Own 24.5% or more of the Company's outstanding common stock.
The Rights will expire on December 31, 2017. Until a Right is exercised, the holder of a Right (merely by being a Right holder) will have no rights as a shareholder of Midas, including voting or dividend rights.
Each Preferred Share will be entitled to a minimum preferential quarterly dividend payment of $0.01 per share, but will be entitled to an aggregate dividend of 100 times the dividend declared per share of MDS common
F-31
Table of Contents
MIDAS
NOTES TO CONSOLIDATED FINANCIAL STATEMENTS—(Continued)
stock. Each Preferred Share will have 100 votes, voting together with the MDS common stock. In the event of a merger or other transaction in which shares of common stock of the Company are exchanged, each Preferred Share will be entitled to receive 100 times the amount received per share of MDS common stock.
The Company has 20 million authorized shares of Series A Junior Participating Preferred Stock. There are no Series A Junior Participating Preferred Stock issued or outstanding.
(12) Contingencies
MDS has certain contingent liabilities arising from various pending claims and litigation related to a number of matters. While the Company believes that the claims are without merit and that the Company will ultimately prevail, an adverse outcome could have a material adverse effect on our business.
California Class Action
The Company is currently involved in a class action lawsuit filed in California in June 2006 that alleges that certain franchised California Midas shops intentionally issued invoices to certain brake customers which incorrectly indicated that the customers had received Midas-branded brake products when, in fact, they had received inferior non-Midas brake products. MDS denies the plaintiffs’ allegations and is vigorously defending this lawsuit. MDS has thus far been successful in challenging the legal sufficiency of the plaintiffs’ claims. The plaintiffs’ third amended complaint has been dismissed. The plaintiffs filed a fourth amended complaint in March of 2009. The Company continues to believe that the allegations are without merit.
Canadian Franchise Purported Class Action
A purported class action lawsuit was filed against the Company in Canada by two Canadian Midas franchisees. The plaintiffs alleged various violations of the Midas Franchise and Trademark Agreement and applicable law and sought class certification and monetary damages of approximately $168 million. The class certification hearing took place in February 2009 and the court released its certification ruling on March 26, 2009. Of the many claims asserted by the plaintiff, the only claim for which class certification was granted was the issue of whether Midas Canada breached its common law and statutory duties of good faith and fair dealing when it implemented its new supply chain program in 2003. All other causes of action were rejected by the court. The Company is currently in the process of compiling historical documents as a result of the plaintiffs’ discovery request. The Company continues to believe this lawsuit is without merit.
Norauto Arbitration
On June 12, 2009, the Company received a Notice of Arbitration from MESA S.p.A. (“MESA”) and Norauto Groupe SA (“Norauto”). MESA is an Italian company that operates the Midas system in Europe under a License Agreement and an Agreement of Strategic Alliance, as amended (the “ASA”) with the Company. Norauto is a French company that acquired MESA (previously known as Magneti Marelli Services S.p.A) from the Fiat Group in October 2004.
Background
Until 1998, the Company directly owned and managed its network of franchised and company-operated Midas shops throughout the world. In 1998, the Company reached an agreement with Magneti Marelli S.p.A. (“Marelli”), a member of the Fiat Group (the ASA). The Midas management concluded that Marelli had the financial and human resources to accelerate the development of the Midas business in Europe and South America at a much faster pace than the Company. Accordingly, under the ASA the Company sold its interests in Europe
F-32
Table of Contents
MIDAS
NOTES TO CONSOLIDATED FINANCIAL STATEMENTS—(Continued)
and South America (“Midas Europe”) to Marelli for $100 million in October 1998 (of which $84 million was paid under the ASA, and an upfront payment of $16 million was paid under a separate License Agreement). The License Agreement was entered into for the use of the Midas trademarks as part of the transaction.
In October 2004, Norauto acquired Magneti Marelli Services S.p.A. (“Marelli Services”) from the Fiat Group. Marelli Services was a newly-formed subsidiary of Fiat that was created to own the Midas Europe business that was purchased from the Company in 1998. Upon acquisition by Norauto in October 2004, Marelli Services was renamed MESA S.p.A. by Norauto.
The License Agreement with Marelli (and now with MESA) provided for fixed U.S. dollar denominated royalty payments of approximately $9 million per year until 2007. Effective January 1, 2008, the royalty converted to 1% of Midas Europe’s system-wide retail sales. As a result, the royalty paid to the Company by MESA decreased from approximately $8.9 million in 2007 to approximately $4.4 million in 2008.
Arbitration
Under the terms of the ASA, all disputes are to be settled by binding arbitration in Geneva, Switzerland under the UNCITRAL Arbitration Rules by a panel of three arbitrators. In demanding arbitration, MESA and Norauto claim that the Company has breached, and continues to breach, its obligations to cooperate and execute the agreement in good faith by failing to develop the Midas System in Europe and South America. As a result, MESA is asking the arbitrators to require the Company to pay for damages and losses incurred by MESA and Norauto, including a portion of royalties previously paid to the Company, and the alleged decrease in the value of the MESA business and lost profits because of MESA’s inability to successfully open Midas shops in new countries, in an estimated amount of Euros 102 million.
MESA and Norauto are also asking the arbitrator to require the Company to renegotiate the terms of the ASA and the License Agreement currently in effect or to cancel these agreements due to the alleged breach by the Company and require the Company to indemnify MESA and Norauto for any losses resulting from the termination of these agreements. These alleged losses are estimated to be between 57to 154 million Euros.
In January 2010, the arbitration panel issued an interim order permitting MESA to pay into escrow half the amounts MESA will owe Midas in royalties (beginning with the payment paid by MESA for royalties due in February 2010), which the arbitration panel estimated to be approximately 1.5 million Euros in total through the duration of the arbitration proceedings. The arbitration panel has taken the position that MESA would suffer harm that could not be easily remedied if damages were awarded and Midas was unable to pay them. The Company had not yet filed its first substantive written submission at the time the interim order was issued.
On February 10, 2010, Midas made its first substantive written submission to the arbitration panel and is currently conducting discovery. At present, Midas currently anticipates that the arbitration proceedings will conclude in the second half of 2010.
The Company believes that the claims by MESA and Norauto are without merit and is vigorously defending against these claims.
(13) Derivative Instruments
The Company has market risk exposure to changes in interest rates, principally in the United States. MDS attempts to minimize this risk and fix a portion of its overall borrowing costs through the utilization of interest rate swaps. MDS hedges variable cash flows resulting from floating-rate debt. Variable cash flows from
F-33
Table of Contents
MIDAS
NOTES TO CONSOLIDATED FINANCIAL STATEMENTS—(Continued)
outstanding debt are converted to fixed-rate cash flows by entering into receive-variable, pay-fixed interest-rate swaps. Hedge ineffectiveness is eliminated by matching all terms of the hedged item and the hedging derivative at inception and on an ongoing basis. MDS does not exclude any terms from consideration when applying the matched terms method.
The fair values of the Company’s interest rate swaps are estimated using Level 2 inputs, which are based on model-derived valuations in which all significant inputs and significant value drivers are observable in active markets. The Company also considers counterparty credit-risk and bilateral or “own” credit risk adjustments in estimating fair value, in accordance with the requirements of U.S. GAAP.
The fair value of derivative instruments is summarized as follows (in millions):
| As of January 2, 2010 | As of January 3, 2009 | |||||||||
| Balance Sheet Location | Fair Value |
Balance Sheet Location | Fair Value | |||||||
| Derivatives designed as hedging instruments |
||||||||||
| Interest rate contracts |
Other liabilities | $ | 1.8 | Other liabilities | $ | 2.6 | ||||
| Total |
$ | 1.8 | $ | 2.6 | ||||||
Because the interest rate contracts have been designated as cash flow hedges and have been evaluated to be highly effective, there is no impact on the Statement of Operations. The after-tax change in the fair value of these swaps is recorded in accumulated other comprehensive income as a gain or loss on derivative financial instruments.
(14) Business Segment Information
MDS operates in a single business segment and provides retail automotive services principally through franchised and company-operated shops located in North America (United States and Canada) and through franchised and licensed shops in international markets. The Company’s U.S. operations receive royalties from franchisees located in Central America. Such revenues amounted to less than one percent of U.S. sales and revenues in each of the fiscal years presented.
No MDS customer accounted for more than 10% of the Company’s total sales and revenues in fiscal 2009 or fiscal 2008.
F-34
Table of Contents
MIDAS
NOTES TO CONSOLIDATED FINANCIAL STATEMENTS—(Continued)
The following tables present financial information for each of the principal geographic areas in which the Company operates. Sales and revenues are attributed to geographic areas based on the location of customers.
| Sales and Revenues | |||||||||
| Fiscal Year |
2009 | 2008 | 2007 | ||||||
| (in millions) | |||||||||
| North American Operations: |
|||||||||
| U.S. |
$ | 156.9 | $ | 159.7 | $ | 149.4 | |||
| Canada |
21.5 | 23.2 | 19.7 | ||||||
| Total North America |
178.4 | 182.9 | 169.1 | ||||||
| International Operations |
4.4 | 4.5 | 9.1 | ||||||
| Total |
$ | 182.8 | $ | 187.4 | $ | 178.2 | |||
| Identifiable Assets | |||||||||
| Fiscal Year End |
2009 | 2008 | 2007 | ||||||
| (in millions) | |||||||||
| North American Operations: |
|||||||||
| U.S. |
$ | 215.6 | $ | 223.2 | $ | 200.3 | |||
| Canada |
12.4 | 11.9 | 14.6 | ||||||
| Total North America |
228.0 | 235.1 | 214.9 | ||||||
| International Operations |
0.6 | 0.3 | 0.7 | ||||||
| Total |
$ | 228.6 | $ | 235.4 | $ | 215.6 | |||
F-35
Table of Contents
MIDAS
NOTES TO CONSOLIDATED FINANCIAL STATEMENTS—(Continued)
(15) Selected Quarterly Financial Data (Unaudited)
Each quarter presented in the following table contains 13 weeks except for the fourth quarter of fiscal 2008, which contains 14 weeks.
| First Quarter |
Second Quarter |
Third Quarter |
Fourth Quarter |
Full Year |
||||||||||||||||
| (in millions, except per share data) | ||||||||||||||||||||
| Fiscal 2009 |
||||||||||||||||||||
| Sales and revenues |
$ | 44.3 | $ | 46.4 | $ | 46.4 | $ | 45.7 | $ | 182.8 | ||||||||||
| Franchised shops—occupancy expenses |
5.7 | 5.6 | 5.8 | 5.6 | 22.7 | |||||||||||||||
| Company-operated shop costs and expenses |
16.2 | 17.2 | 18.0 | 16.9 | 68.3 | |||||||||||||||
| Replacement part cost of sales |
5.3 | 5.3 | 5.2 | 7.1 | 22.9 | |||||||||||||||
| Warranty expense (benefit) |
0.1 | 0.3 | 0.1 | (0.4 | ) | 0.1 | ||||||||||||||
| Selling, general and administrative expenses |
13.2 | 13.9 | 12.5 | 11.6 | 51.2 | |||||||||||||||
| Loss on sale of assets, net |
0.1 | — | 0.1 | — | 0.2 | |||||||||||||||
| Business transformation charges |
— | 0.2 | 0.1 | 2.9 | 3.2 | |||||||||||||||
| Total operating costs and expenses |
40.6 | 42.5 | 41.8 | 43.7 | 168.6 | |||||||||||||||
| Operating income |
3.7 | 3.9 | 4.6 | 2.0 | 14.2 | |||||||||||||||
| Interest expense |
(2.0 | ) | (2.1 | ) | (2.0 | ) | (2.2 | ) | (8.3 | ) | ||||||||||
| Other income (expense), net |
0.1 | 0.2 | 0.1 | — | 0.4 | |||||||||||||||
| Income (loss) before taxes |
1.8 | 2.0 | 2.7 | (0.2 | ) | 6.3 | ||||||||||||||
| Income tax expense |
0.8 | 1.6 | 1.3 | — | 3.7 | |||||||||||||||
| Net income (loss) |
$ | 1.0 | $ | 0.4 | $ | 1.4 | $ | (0.2 | ) | $ | 2.6 | |||||||||
| Earnings (loss) per share—diluted |
$ | 0.07 | $ | 0.03 | $ | 0.10 | $ | (0.02 | ) | $ | 0.19 | |||||||||
| Fiscal 2008 |
||||||||||||||||||||
| Sales and revenues |
$ | 44.8 | $ | 48.8 | $ | 47.1 | $ | 46.7 | $ | 187.4 | ||||||||||
| Franchised shops—occupancy expenses |
5.8 | 5.7 | 5.6 | 5.7 | 22.8 | |||||||||||||||
| Company-operated shop costs and expenses |
15.0 | 16.1 | 15.8 | 16.1 | 63.0 | |||||||||||||||
| Replacement part cost of sales |
6.1 | 6.2 | 6.3 | 7.8 | 26.4 | |||||||||||||||
| Warranty expense (benefit) |
0.1 | 0.2 | 0.2 | (3.2 | ) | (2.7 | ) | |||||||||||||
| Selling, general and administrative expenses |
13.3 | 14.1 | 12.9 | 13.8 | 54.1 | |||||||||||||||
| Loss on sale of assets, net |
0.3 | 0.3 | 0.1 | 0.2 | 0.9 | |||||||||||||||
| Business transformation charges |
0.2 | 0.4 | 0.9 | 0.1 | 1.6 | |||||||||||||||
| Total operating costs and expenses |
40.8 | 43.0 | 41.8 | 40.5 | 166.1 | |||||||||||||||
| Operating income |
4.0 | 5.8 | 5.3 | 6.2 | 21.3 | |||||||||||||||
| Interest expense |
(2.2 | ) | (2.3 | ) | (2.2 | ) | (2.4 | ) | (9.1 | ) | ||||||||||
| Other income (expense), net |
0.2 | 0.2 | (0.1 | ) | 0.5 | 0.8 | ||||||||||||||
| Income before taxes |
2.0 | 3.7 | 3.0 | 4.3 | 13.0 | |||||||||||||||
| Income tax expense |
0.8 | 1.5 | 1.3 | 1.6 | 5.2 | |||||||||||||||
| Net income |
$ | 1.2 | $ | 2.2 | $ | 1.7 | $ | 2.7 | $ | 7.8 | ||||||||||
| Earnings per share—diluted |
$ | 0.09 | $ | 0.16 | $ | 0.12 | $ | 0.20 | $ | 0.56 | ||||||||||
The sum of earnings per share for the quarters may not equal the full year amount in each year due to the impact of changes in the average shares outstanding.
F-36
Table of Contents
MIDAS
NOTES TO CONSOLIDATED FINANCIAL STATEMENTS—(Continued)
As a result of changes in the Company’s business model over the past five years, including the exit from exhaust manufacturing and distribution, the outsourcing of parts distribution and the expansion into a broader retail service menu, the seasonality of the Company’s sales has been reduced. In fiscal 2009 and fiscal 2008 revenues by quarter were not significantly different.
Certain factors other than seasonality have impacted the Company’s quarterly net income and earnings per share and these are discussed in greater detail below.
Quarterly Variations—Fiscal 2009
In the second quarter MDS recorded incremental operating expenses of $0.4 million related to the vesting of certain restricted stock. Fourth quarter revenues and replacement part cost of sales were higher because of a seasonal increase in tire sales. Fourth quarter tire sales accounted for 31% of tire sales recorded for the year. In the fourth quarter the Company reduced its warranty liability by $0.6 million. The reduction was the result of the Company’s change in estimate for the warranty reserves. In the fourth quarter a pension adjustment resulted in a $0.4 million reduction in expenses.
The $2.9 million of business transformation charges recorded in the fourth quarter of fiscal 2009 consisted of $0.4 million related to a reduction-in-force announced in October of 2009, $1.5 million for third party consulting costs related to the development of the co-brand image, a re-design of the customer sales and follow-up process in Midas shops and a study of the Midas France business and marketplace, $0.8 million in connection with the closure of four under-performing company-operated shops and $0.2 million pertaining to the Company’s final funding of a new shop image for Midas.
In the second quarter of fiscal 2009, MDS recorded business transformation charges of $0.1 million in connection with the Company’s change in the Canadian warranty program. The remaining business transformation charges relate primarily to the Company’s partial funding of the rollout of a new shop image for Midas shops.
Quarterly Variations—Fiscal 2008
Revenues and company-operated shop expenses grew throughout the year due to the acquisition of 15 shops, partially offset by the re-franchising of seven shops. The Company re-negotiated the lease for its corporate office in Itasca, IL, which resulted in a net reduction of operating expenses of approximately $1.2 million compared to fiscal 2007. The rent savings were substantially offset by higher legal expenses throughout the year due to two potential class-action lawsuits. Fourth quarter revenues and replacement part cost of sales were higher because of a seasonal increase in tire sales. Fourth quarter tire sales accounted for 30% of tire sales recorded for the year. In the fourth quarter the Company reduced its warranty liability by $3.4 million. The reduction was the result of the Company’s change in estimate for the warranty reserves.
Revenues, primarily franchise royalties, and operating expenses increased in the last three quarters due to the purchase of the assets of G.C. & K.B. Investments, Inc. and its affiliated entities that franchised and sub-franchised SpeeDee quick-lube and automotive maintenance shops. SpeeDee operations contributed $1.6 million of operating income in the final three fiscal quarters of fiscal 2008.
The Company recorded business transformation charges of $0.3 million in the third quarter related to the closure of an unprofitable company-operated shop in Connecticut. The remaining business transformation charges relate primarily to the Company’s partial funding of the rollout of a new shop image for Midas shops.
F-37
Table of Contents
MIDAS
NOTES TO CONSOLIDATED FINANCIAL STATEMENTS—(Continued)
16) Acquisitions and Divestitures
During fiscal 2009, the Company acquired 10 franchised Midas shops from Midas franchisees to be run as company-operated shops for $1.6 million, which generated $1.3 million of incremental goodwill, trademark and customer list intangibles. In addition, MDS completed the acquisition of three franchised SpeeDee shops from the founders of the SpeeDee business. This acquisition was part of the March 2008 SpeeDee acquisition, but the transfer of the shops from G.C. & K.B. Investments, Inc. to MDS was delayed due to lease issues. Funds held in escrow were released to G.C. & K.B. Investments, Inc. and $0.8 million of incremental goodwill was recorded. Goodwill, trademark and customer list intangibles were reduced by $0.3 million in connection with the re-franchising of four company-operated shops and the closure of four under performing company-operated shops.
On March 30, 2008, Midas acquired the assets of G.C. & K.B. Investments, Inc. and its affiliated entities that franchise and sub-franchise SpeeDee quick-lube and automotive maintenance shops. The purchase price was $21.0 million. SpeeDee is based in New Orleans and was founded in 1980. SpeeDee generated system-wide sales of approximately $78 million in 2007 through its network of U.S. shops, four of which were owned and operated by SpeeDee. As of January 3, 2009, SpeeDee had 116 shop locations in the U.S. in 13 states, and 57 shops in Mexico. Of the U.S. shop locations, two were company-operated and 19 shops were sub-franchised to a licensee who controls the franchise rights to SpeeDee locations in the New England region.
As a result of this acquisition, the Company recorded $19.9 million in incremental goodwill and other intangibles, which included $8.7 million of intangible trademark, $3.9 million of intangible franchise agreements and $7.3 million of goodwill. The $3.9 million of intangible franchise agreements will be amortized over a period of 22 years. The intangible trademark and goodwill have indefinite lives and, therefore, are not amortized, but are tested annually for impairment in the fourth quarter. All of the acquired intangible assets are deductible for tax purposes. Supplemental pro forma financial information is not presented as it is not material.
During fiscal 2008, the Company acquired 15 shops to be run as company-operated shops, including 14 shops acquired from Midas franchisees and one shop acquired from a non-Midas operator, and acquired five shops, which were immediately re-franchised to Midas franchisees. Of the 15 shops acquired for the company-operated shop business, nine were in the Indianapolis area, three were in Ottawa, Canada, two were in New Jersey and one was in California. The purchase price of the 20 acquired shops was approximately $4.5 million, which consisted of $3.5 million paid in cash and $1.0 million used to settle accounts receivable from the selling Midas franchisees. These acquisitions resulted in $3.4 million of incremental goodwill and other intangibles. The re-franchising of certain company-operated shops generated $1.0 million in cash and a loss on sale of assets of $0.9 million.
During fiscal 2007, the Company acquired 36 shops and other assets from Midas franchisees to be run as company-operated shops, and acquired two shops to be franchised. Also in fiscal 2007 the Company re-franchised 12 company-operated shops to Midas franchisees. Of the shops acquired for the company-operated shop business, 12 were in California, 15 were in the northeast region of the U.S. and six were in Vancouver, Canada, while 10 of the 12 re-franchised shops were in Florida. The purchase price of the acquired shops was approximately $16.4 million, which consisted of $13.7 million paid in cash and $2.7 million used to settle accounts receivable from selling franchisees. These acquisitions resulted in $13.1 million of incremental goodwill and other intangibles. The re-franchising of 12 company-operated shops generated $1.5 million in cash proceeds and the retirement of $0.3 million of goodwill and other intangibles.
In September of fiscal 2007, the Company sold its former manufacturing plant in Hartford, WI. The sale generated $1.1 million in net cash proceeds and resulted in the retirement of $0.9 million of net property and equipment.
F-38
Table of Contents
MIDAS
NOTES TO CONSOLIDATED FINANCIAL STATEMENTS—(Continued)
17) Subsequent Event
In January 2010, MDS acquired 22 Midas shops from an existing Midas franchisee. MDS acquired these shops to be run as company-operated shops in connection with a settlement between the franchisee and the California Attorney General and the California Bureau of Automotive Repair. The franchisee had been charged with violating state business and professional codes in a suit seeking civil penalties and costs. The Company was not named in the suit and worked closely with the California Attorney General’s Office on acquiring these shops.
Simultaneous with the transaction, the Company re-franchised two of the locations to a new franchisee and bought out of the lease on a third location, bringing the net acquisition to 19 shops. The Company is actively seeking to re-franchise the remainder of these shops.
The total cash outlay for the purchase, net of proceeds received in the shop sale, was approximately $3.4 million. The acquisition also resulted in an approximately $2.9 million non-cash reduction of accounts receivable.
The Company has not yet completed the initial accounting for this acquisition as the third party valuation of identifiable intangible assets has not been completed.
F-39