Attached files
Table of Contents
Index to Financial Statements
UNITED STATES
SECURITIES AND EXCHANGE COMMISSION
Washington, D.C. 20549
Form 10-K
| x | ANNUAL REPORT PURSUANT TO SECTION 13 OR 15(d) OF THE SECURITIES EXCHANGE ACT OF 1934 |
For the fiscal year ended December 31, 2009
OR
| ¨ | TRANSITION REPORT PURSUANT TO SECTION 13 OR 15(d) OF THE SECURITIES EXCHANGE ACT OF 1934 |
Commission file number: 0-25141
MetroCorp Bancshares, Inc.
(Exact name of registrant as specified in its charter)
| Texas | 76-0579161 | |
| (State or other jurisdiction of incorporation or organization) |
(I.R.S. Employer Identification No.) |
9600 Bellaire Boulevard, Suite 252
Houston, Texas 77036
(Address of principal executive offices including zip code)
(713) 776-3876
(Registrant’s telephone number, including area code)
Securities registered pursuant to Section 12(b) of the Act:
| Common Stock, par value $1.00 per share | NASDAQ Global Market | |
| (Title of class) | (Name of each exchange on which registered) |
Securities registered pursuant to Section 12(g) of the Act:
None
Indicate by check mark if the registrant is a well-known seasoned issuer, as defined in Rule 405 of the Securities Act. Yes ¨ No x
Indicate by check mark if the registrant is not required to file reports pursuant to Section 13 or Section 15(d) of the Act. Yes ¨ No x
Indicate by check mark whether the registrant (1) has filed all reports required to be filed by Section 13 or 15(d) of the Securities Exchange Act of 1934 during the preceding 12 months (or for such shorter period that the registrant was required to file such reports), and (2) has been subject to such filing requirements for the past 90 days. Yes x No ¨
Indicate by check mark whether the registrant has submitted electronically and posted on its corporate Web site, if any, every Interactive Data File required to be submitted and posted pursuant to Rule 405 of Regulation S-T during the preceding 12 months (or for such shorter period that the registrant was required to submit and post such files). Yes ¨ No ¨
Indicate by check mark if disclosure of delinquent filers pursuant to Item 405 of Regulation S-K is not contained herein, and will not be contained, to the best of registrant’s knowledge, in definitive proxy or information statements incorporated by reference in Part III of this Form 10-K or any amendment to this Form 10-K. ¨
Indicate by check mark whether the registrant is a large accelerated filer, an accelerated filer, a non-accelerated filer, or a smaller reporting company. See the definitions of “large accelerated filer”, “accelerated filer” and “smaller reporting company” in Rule 12b-2 of the Exchange Act. (Check One):
| Large Accelerated Filer ¨ |
Accelerated Filer ¨ | Non-accelerated Filer ¨ | Smaller Reporting Company x |
Indicate by check mark whether the registrant is a shell company (as defined in Rule 12b-2 of the Exchange Act). Yes ¨ No x
As of March 4, 2010, the number of outstanding shares of Common Stock was 11,021,315.
As of June 30, 2009, the last business day of the registrant’s most recently completed second quarter, the aggregate market value of the shares of Common Stock held by non-affiliates based on the closing price of the Common Stock on the NASDAQ Global Market on such date was approximately $25.7 million.
DOCUMENTS INCORPORATED BY REFERENCE:
Portions of the Company’s Proxy Statement for the 2010 Annual Meeting of Shareholders, which will be filed within 120 days after December 31, 2009, are incorporated by reference into Part III, Items 10-14 of this Form 10-K.
Table of Contents
Index to Financial Statements
| Page | ||||
| PART I | ||||
| Item 1. |
Business | 1 | ||
| Item 1A. |
Risk Factors | 17 | ||
| Item 1B. |
Unresolved Staff Comments | 28 | ||
| Item 2. |
Properties | 28 | ||
| Item 3. |
Legal Proceedings | 28 | ||
| Item 4. |
[Reserved] | 28 | ||
| PART II | ||||
| Item 5. |
Market for Registrant’s Common Equity, Related Shareholder Matters and Issuer Purchases of Equity Securities. | 30 | ||
| Item 6. |
33 | |||
| Item 7. |
Management’s Discussion and Analysis of Financial Condition and Results of Operations | 35 | ||
| Item 7A. |
74 | |||
| Item 8. |
74 | |||
| Item 9. |
Changes in and Disagreements with Accountants on Accounting and Financial Disclosures | 75 | ||
| Item 9A. |
75 | |||
| Item 9B. |
76 | |||
| PART III | ||||
| Item 10. |
77 | |||
| Item 11. |
77 | |||
| Item 12. |
Security Ownership of Certain Beneficial Owners and Management and Related Shareholder Matters | 77 | ||
| Item 13. |
Certain Relationships and Related Transactions and Director Independence |
77 | ||
| Item 14. |
77 | |||
| PART IV | ||||
| Item 15. |
78 | |||
| 81 | ||||
Table of Contents
Index to Financial Statements
| Item 1. | Business |
The disclosures set forth in this item are qualified by Item 1A. Risk Factors and by the section captioned “Special Cautionary Notice Regarding Forward-Looking Statements” in Item 7 of this report and other cautionary statements set forth elsewhere in this report.
General
MetroCorp Bancshares, Inc. (the “Company”) was incorporated as a business corporation under the laws of the State of Texas in 1998 to serve as a holding company for MetroBank, National Association (“MetroBank”). On October 5, 2005, the Company acquired Metro United Bank (“Metro United”) (formerly known as First United Bank), with its locations in San Diego and Los Angeles, California. The Company’s headquarters are located at 9600 Bellaire Boulevard, Suite 252, Houston, Texas 77036, and its telephone number is (713) 776-3876.
The Company’s mission is to enhance shareholder value by maximizing profitability and operating as the premier commercial bank in each community that it serves. The Company operates branches in niche markets through its subsidiary banks, MetroBank and Metro United Bank (collectively, the “Banks”), by providing personalized service to the communities in Houston, Dallas, San Diego, Los Angeles, and San Francisco metropolitan areas. Historically, the Company has strategically opened banking offices in areas with large multicultural and Asian concentrations and intends to pursue branch opportunities in multicultural markets with significant small and medium-sized business activity. As a part of the Company’s business development strategy, MetroBank opened and commenced operations of representative offices in Xiamen, China during the fourth quarter of 2006, and Chongqing, China during the first quarter 2008. The representative offices do not conduct banking activities but were established to cultivate business relationships with customers that have the potential of expanding their business in the United States.
MetroBank, National Association
MetroBank was organized in 1987 by Don J. Wang, the Company’s current Chairman of the Board, and five other Asian-American small business owners, three of whom currently serve as directors of the Company and MetroBank. The organizers perceived that the financial needs of various ethnic groups in Houston were not being adequately served and sought to provide modern banking products and services that accommodated the cultures of the businesses operating in these communities. In 1989, MetroBank expanded its service philosophy to Houston’s Hispanic community by acquiring from the Federal Deposit Insurance Corporation (the “FDIC”) the assets and liabilities of a community bank located in a primarily Hispanic section of Houston. This acquisition broadened MetroBank’s market and increased its assets from approximately $30.0 million to approximately $100.0 million. Other than this acquisition, MetroBank has accomplished its growth internally through the establishment of de novo branches in various market areas. Since MetroBank’s formation in 1987, it has established numerous branches in the greater Houston metropolitan area and currently has nine banking offices in Houston. In 1996, MetroBank expanded into the Dallas metropolitan area, and currently has four banking offices in the area.
Metro United Bank
Metro United, which was acquired in October, 2005, was originally founded in 1990 in San Diego, California to meet the banking needs of the local business communities. Metro United caters its services to various businesses, professionals and individuals with diversified cultural backgrounds and focuses its lending activities primarily on commercial real estate. In 1999, Metro United opened its Los Angeles branch in Alhambra to serve the community along the Monterey Park/San Gabriel Valley corridor. During 2006, Metro United added
1
Table of Contents
Index to Financial Statements
four new locations to better serve its customers. It acquired a branch in Irvine from Omni Bank, N.A., opened loan production offices in San Mateo and San Francisco that were upgraded to full service branches in 2007, and established an executive office in the City of Industry, which also began functioning as a full service branch in the first quarter of 2007.
MCBI Statutory Trust I
MCBI Statutory Trust I (“MCBI Trust I”) is a business trust formed in 2005 for the purpose of issuing $35.0 million in trust preferred securities and lending the proceeds to the Company. The Company guarantees, on a limited basis, payments of distributions on the trust preferred securities and payments on redemption of the trust preferred securities.
MCBI Trust I is a variable interest entity for which the Company is not the primary beneficiary. As such, the accounts of MCBI Trust I are not included in the Company’s consolidated financial statements. See the Company’s accounting policy related to consolidation in Note 1—Summary of Significant Accounting Policies in the notes to consolidated financial statements included in this Annual Report on Form 10K.
Although the accounts of MCBI Trust I are not included in the Company’s consolidated financial statements, the $35.0 million in trust preferred securities issued by this subsidiary trust is included in the Tier 1 capital of the Company for regulatory capital purposes. The aggregate amount of restricted core capital elements (which includes trust preferred securities, among other things) that may be included in the Tier 1 capital of most bank holding companies, including the Company’s, is limited to 25% of all core capital elements, including restricted core capital elements, net of goodwill less any associated deferred tax liability. Amounts of restricted core capital elements in excess of these limits generally may be included in Tier 2 capital. The quantitative limits do not currently preclude the Company for including the $35.0 million in trust preferred securities in Tier 1 capital.
Available Information
The Company’s internet website is available through MetroBank, at www.metrobank-na.com. The Company makes available, free of charge, on or through its website its annual report on Form 10-K, quarterly reports on Form 10-Q, current reports on Form 8-K and all amendments to those reports filed or furnished pursuant to Section 13(a) of 15(d) of the Securities Exchange Act of 1934, as amended, as soon as reasonably practicable after such material is filed electronically with or furnished to the Securities and Exchange Commission. The information found on the Company’s website is not a part of this or any other report.
Regulatory Agreement
On August 10, 2009, MetroBank entered into a written agreement (the “Agreement”) with the Office of the Comptroller of the Currency (“OCC”). The Agreement is based on the findings of the OCC during the annual on-site examination of MetroBank performed in the first quarter of 2009, and is primarily focused on matters related to MetroBank’s asset quality. Pursuant to the Agreement, the Board of Directors of MetroBank has appointed a compliance committee to monitor and coordinate MetroBank’s performance under the Agreement. The Agreement provides for, among other things, the development and implementation of written programs to reduce MetroBank’s credit risks, monitor and reduce the level of criticized assets and manage commercial real estate loan concentrations in light of current adverse commercial real estate market conditions generally and in its market areas. During and since the completion of the examination, management of MetroBank has proactively made adjustments in policies and procedures in an effort to alleviate the effects of the credit challenge caused by the economic deterioration and market conditions generally and in its market areas. Additionally, management and the Boards of Directors of the Company and MetroBank have aggressively taken steps to address the findings of the exam and are aggressively working to comply with the requirements of the Agreement.
2
Table of Contents
Index to Financial Statements
Business
Management believes that quality products and services, cross-selling initiatives, relationship building, and outstanding customer service are all key elements to a successful commercial and retail banking endeavor. The Company continues to focus on optimizing the Texas and California operations to strengthen the platform for future growth. Specific goals include, but are not limited to: (i) improving asset quality and diversifying the loan portfolio; (ii) building solid customer relationships through cross-selling initiatives, enhancing product mix, and optimizing pricing structures; and (iii) streamlining operational processes of the Company’s two subsidiary banks in an effort to increase efficiencies in delivery of products and services.
In connection with the Company’s approach to community banking, the Company offers products designed to appeal to its niche market and enhance profitability. The Company believes that it has developed a reputation as the premier provider of financial products and services to small and medium-sized businesses and consumers located in the communities that it serves. The primary lending focus of the Company is to small and medium-sized businesses in a variety of industries. Each of its product lines is an outgrowth of the Company’s expertise in meeting the particular needs of its customers. The Company’s principal lines of business are the following:
Commercial and Industrial Loans. The Company’s commercial lending emphasis includes loans to wholesalers, manufacturers and business service companies. The Company makes available to businesses a broad array of short and medium-term commercial lending products for working capital (including inventory and accounts receivable), purchases of equipment and machinery and business expansion (including acquisitions of real estate and improvements). As of December 31, 2009, the Company’s commercial and industrial loan portfolio was $399.2 million or 31.3% of the gross loan portfolio.
Commercial Mortgage Loans. The Company originates commercial mortgage loans to finance the purchase of real property, which generally consists of developed real estate. The Company’s commercial mortgage loans are collateralized by first liens on real estate. For MetroBank, these loans typically have variable rates and amortize over a 15 to 20 year period, with balloon payments due at the end of five to seven years. For Metro United, these loans have both variable and fixed rates and amortize over a 25 to 30 year period, with balloon payments due at the end of five to ten years. As of December 31, 2009, the Company had a commercial mortgage portfolio of $743.0 million or 58.2% of the gross loan portfolio.
Construction Loans. The Company originates loans to finance the construction of residential and non-residential properties. The majority of the Company’s residential construction loans are in Texas and are for single-family dwellings. The Company also originates loans to finance the construction of commercial properties such as multi-family, office, industrial, warehouse and retail centers. As of December 31, 2009, the Company had a real estate construction portfolio of $97.8 million or 7.7% of the gross loan portfolio, of which $32.3 million was residential and $65.5 million was commercial.
Government Guaranteed Small Business Lending. The Company, through its subsidiary MetroBank, has developed an expertise in several government guaranteed lending programs in order to provide credit enhancement to its commercial and industrial and commercial mortgage portfolios. As a Preferred Lender under the United States Small Business Administration (the “SBA”) federally guaranteed lending program, MetroBank’s pre-approved status allows it to quickly respond to customers’ needs. Depending upon prevailing market conditions, the Company may sell the guaranteed portion of these loans into the secondary market, yet retain servicing of these loans. MetroBank specializes in SBA loans to minority-owned businesses. As of December 31, 2009, MetroBank had $32.4 million in the retained portion of its SBA loans.
Trade Finance. The Company, through its subsidiary MetroBank, originates trade finance loans and letters of credit to facilitate export and import transactions for small and medium-sized businesses. In this capacity, the Company has worked with the Export Import Bank of the United States (the “Ex-Im Bank”), an agency of the U.S. Government, which provides guarantees for trade finance loans. At December 31, 2009, the Company’s aggregate trade finance portfolio commitments were approximately $23.0 million.
3
Table of Contents
Index to Financial Statements
Residential Mortgage Brokerage and Lending. The Company, through its subsidiary MetroBank, uses its existing branch network to offer a complete line of single-family residential mortgage products through third party mortgage companies. The Company solicits and receives a fee to process residential mortgage loans, which are underwritten by and pre-sold to third party mortgage companies. The Company does not fund or service the loans underwritten by third party mortgage companies. The Company also originates five to seven year balloon residential mortgage loans, primarily collateralized by owner occupied residential properties, with a 15-year amortization, which are retained in the Company’s residential mortgage portfolio. As of December 31, 2009, the residential mortgage portfolio was $32.7 million or 2.6% of the gross loan portfolio. The Company had no subprime residential mortgage loans at December 31, 2009.
Retail Banking. The Company offers a variety of deposit products and services to retail customers through its branch networks in Texas and California. Retail deposit products and services include checking and savings accounts, money market accounts, time deposits, ATM cards, debit cards and online banking. The Company also offers retail loan products. At December 31, 2009, retail loan products totaled less than one percent of the gross loan portfolio.
Competition
The banking and financial services industry in Texas and California is highly competitive, and the profitability of the Company depends principally on the Company’s ability to compete in the market areas in which its banking operations are located. The Company competes with other commercial banks, savings banks, savings and loan associations, credit unions, finance companies, mutual funds, insurance companies, brokerage and investment banking firms, asset-based non-bank lenders and certain other non-financial entities, including retail stores which may maintain their own credit programs and certain governmental organizations which may offer more favorable financing. To compete with these other financial institutions, the Company emphasizes customer service, technology and responsive decision-making. Additionally, management believes the Company remains competitive by establishing long-term customer relationships, building customer loyalty and providing a broad line of products and services designed to address the specific needs of its customers.
Employees
As of December 31, 2009, the Company had 296 full-time equivalent employees, 63 of whom were officers of the Banks classified as Vice President or above. The Company considers its relations with employees to be satisfactory.
Supervision and Regulation
The supervision and regulation of bank holding companies and their subsidiaries is intended primarily for the protection of depositors, the deposit insurance fund of the FDIC and the banking system as a whole, and not for the protection of the bank holding company shareholders or creditors. The banking agencies have broad enforcement power over bank holding companies and banks including the power to impose substantial fines and other penalties for violations of laws and regulations.
The following description summarizes some of the laws to which the Company and the Banks are subject. References herein to applicable statutes and regulations are brief summaries thereof, do not purport to be complete, and are qualified in their entirety by reference to such statutes and regulations.
The Company
The Company is a bank holding company registered under the Bank Holding Company Act, as amended, (the “BHCA”), and is subject to supervision, regulation and examination by the Board of Governors of the Federal Reserve System (“Federal Reserve Board”). The BHCA and other federal laws subject bank holding
4
Table of Contents
Index to Financial Statements
companies to particular restrictions on the types of activities in which they may engage, and to a range of supervisory requirements and activities, including regulatory enforcement actions for violations of laws and regulations.
As a Company with securities registered under the Securities Exchange Act of 1934, as amended (the “Exchange Act”), and listed on the NASDAQ Global Market, the Company is also subject to the Sarbanes-Oxley Act of 2002 and regulation by the SEC and NASDAQ.
Regulatory Restrictions on Dividends; Source of Strength. It is the policy of the Federal Reserve Board that bank holding companies should pay cash dividends on common stock only out of income available over the past year and only if prospective earnings retention is consistent with the organization’s expected future needs and financial condition. The policy provides that bank holding companies should not maintain a level of cash dividends that undermines the bank holding company’s ability to serve as a source of strength to its banking subsidiaries. Given the current financial and economic environment, the Federal Reserve Board has indicated that bank holding companies should carefully review their dividend policy in relation to the organization’s overall asset quality, level of current and prospective earnings and level, composition and quality of capital. The guidance provides that the Company inform and consult with the Federal Reserve Board prior to declaring and paying a dividend that exceeds earnings for the period for which the dividend is being paid or that could result in an adverse change to the Company’s capital structure, including dividends on the Series A Preferred Stock issued to the U.S. Department of the Treasury (“U.S. Treasury”) under the Capital Purchase Program (“CPP”) or interest on the subordinated debentures underlying the Company’s trust preferred securities.
Under Federal Reserve Board policy, a bank holding company is expected to act as a source of financial strength to each of its banking subsidiaries and commit resources to their support. Such support may be required at times when, absent this Federal Reserve Board policy, a holding company may not be inclined to provide it. As discussed below, a bank holding company in certain circumstances could be required to guarantee the capital plan of an undercapitalized banking subsidiary.
In the event of a bank holding company’s bankruptcy under Chapter 11 of the U.S. Bankruptcy Code, the trustee will be deemed to have assumed and is required to cure immediately any deficit under any commitment by the debtor holding company to any of the federal banking agencies to maintain the capital of an insured depository institution, and any claim for breach of such obligation will generally have priority over most other uncollateralized claims.
Scope of Permissible Activities. Except as provided below, the Company is prohibited from acquiring a direct or indirect interest in or control of more than 5% of the voting shares of any company which is not a bank or bank holding company and from engaging directly or indirectly in activities other than those of banking, managing or controlling banks or furnishing services to its subsidiary banks, except the Company may engage in and may own shares of companies engaged in certain activities found by the Federal Reserve Board to be so closely related to banking or managing and controlling banks as to be a proper incident thereto. These activities include, among others, operating a mortgage, finance, credit card or factoring company; performing certain data processing operations; providing investment and financial advice; acting as an insurance agent for certain types of credit-related insurance; leasing personal property on a full-payout, non-operating basis; and providing certain stock brokerage and investment advisory services. In approving acquisitions or the addition of activities, the Federal Reserve Board considers, among other things, whether the acquisition or the additional activities can reasonably be expected to produce benefits to the public, such as greater convenience, increased competition, or gains in efficiency, that outweigh such possible adverse effects as undue concentration of resources, decreased or unfair competition, conflicts of interest or unsound banking practices.
The Gramm-Leach-Bliley Act amended the BHCA and granted certain expanded powers to bank holding companies. The Gramm-Leach-Bliley Act permits bank holding companies to become financial holding companies and thereby affiliate with securities firms and insurance companies and engage in other activities that
5
Table of Contents
Index to Financial Statements
are financial in nature. The Gramm-Leach-Bliley Act defines “financial in nature” to include securities underwriting, dealing and market making; sponsoring mutual funds and investment companies; insurance underwriting and agency; merchant banking activities; and activities that the Federal Reserve Board has determined to be closely related to banking. No regulatory approval will be required for a financial holding company to acquire a company, other than a bank or savings association, engaged in activities that are financial in nature or incidental to activities that are financial in nature, as determined by the Federal Reserve Board.
Under the Gramm-Leach-Bliley Act, a bank holding company may become a financial holding company if each of its subsidiary banks is well capitalized under the Federal Deposit Insurance Corporation Improvement Act (“FDICIA”) prompt corrective action provisions, is well managed, and has at least a satisfactory rating under the Community Reinvestment Act of 1977 (“CRA”) by filing a declaration that the bank holding company wishes to become a financial holding company. Subsidiary banks of a financial holding company must remain well capitalized and well managed in order to continue to engage in activities that are financial in nature without regulatory actions or restrictions, which could include divestiture of the financial in nature subsidiary or subsidiaries. In addition, a financial holding company may not acquire a company that is engaged in activities that are financial in nature unless each of its subsidiary banks has a CRA rating of satisfactory or better. Presently, the Company has no plans to become a financial holding company.
While the Federal Reserve Board serves as the “umbrella” regulator for financial holding companies and has the power to examine banking organizations engaged in new activities, regulation and supervision of activities which are financial in nature or determined to be incidental to such financial activities will be handled along functional lines. Accordingly, activities of subsidiaries of a financial holding company will be regulated by the agency or authorities with the most experience regulating that activity as it is conducted in a financial holding company.
Safe and Sound Banking Practices. Bank holding companies are not permitted to engage in unsafe and unsound banking practices. The Federal Reserve Board’s Regulation Y, for example, generally requires a holding company to give the Federal Reserve Board prior notice of any redemption or repurchase of its own equity securities, if the consideration to be paid, together with the consideration paid for any repurchases or redemptions in the preceding year, is equal to 10% or more of the company’s consolidated net worth. The Federal Reserve Board may oppose the transaction if it believes that the transaction would constitute an unsafe or unsound practice or would violate any law or regulation. Prior approval of the Federal Reserve Board would not be required for the redemption or purchase of equity securities for a bank holding company that would be well capitalized both before and after such transaction, well-managed and not subject to unresolved supervisory issues.
The Federal Reserve Board has broad authority to prohibit activities of bank holding companies and their non-banking subsidiaries which represent unsafe and unsound banking practices or which constitute violations of laws or regulations, and can assess civil money penalties for certain activities conducted on a knowing and reckless basis, if those activities caused a substantial loss to a depository institution. The penalties can be as high as $1.0 million for each day the activity continues.
Anti-Tying Restrictions. Bank holding companies and their affiliates are prohibited from tying the provision of certain services, such as extensions of credit, to other services offered by a holding company or its affiliates.
Capital Adequacy Requirements. The Federal Reserve Board has adopted a system using risk-based capital guidelines to evaluate the capital adequacy of bank holding companies. Under the guidelines, specific categories of assets are assigned different risk weights, based generally on the perceived credit risk of the asset. These risk weights are multiplied by corresponding asset balances to determine a “risk-weighted” asset base. The guidelines require a minimum total risk-based capital ratio of 8.0% (of which at least 4.0% is required to consist of Tier 1 capital elements). Total capital is the sum of Tier 1 and Tier 2 capital. As of December 31, 2009, the Company’s ratio of Tier 1 capital to total risk-weighted assets was 12.54% and its ratio of total capital to total risk-weighted assets was 13.80%.
6
Table of Contents
Index to Financial Statements
In addition to the risk-based capital guidelines, the Federal Reserve Board uses a leverage ratio as an additional tool to evaluate the capital adequacy of bank holding companies. The leverage ratio is a company’s Tier 1 capital divided by its average total consolidated assets. Certain highly rated bank holding companies may maintain a minimum leverage ratio of 3.0%, but other bank holding companies may be required to maintain a leverage ratio of at least 4.0%. As of December 31, 2009, the Company’s leverage ratio was 10.76%.
The federal banking agencies’ risk-based and leverage ratios are minimum supervisory ratios generally applicable to banking organizations that meet certain specified criteria. The federal bank regulatory agencies may set capital requirements for a particular banking organization that are higher than the minimum ratios when circumstances warrant. Federal Reserve Board guidelines also provide that banking organizations experiencing internal growth or making acquisitions will be expected to maintain strong capital positions substantially above the minimum supervisory levels, without significant reliance on intangible assets.
On September 3, 2009, the U.S. Treasury issued a policy statement (the “Treasury Policy Statement”) entitled “Principles for Reforming the U.S. and International Regulatory Capital Framework for Banking Firms.” The Treasury Policy Statement was developed in consultation with federal banking regulatory agencies and contemplates changes to the existing regulatory capital regime and affects all regulated banking organizations and other systemically important institutions. The Treasury Policy Statement calls for, among other things, higher and stronger capital requirements for all banking firms. The Treasury Policy Statement suggested that changes to the regulatory capital framework be phased in over a period of several years. The recommended schedule provides for a comprehensive international agreement by December 31, 2010, with the implementation of reforms by December 31, 2012, although it does remain possible that federal banking regulatory agencies could officially adopt, or informally implement, new capital standards at an earlier date.
On December 17, 2009, the Basel Committee on Banking Supervision issued a set of proposals (the “Capital Proposals”) that would significantly revise the definitions of Tier 1 capital and Tier 2 capital, with the most significant changes being to Tier 1 capital. Most notably, the Capital Proposals would disqualify certain structured capital instruments, such as trust preferred securities, from Tier 1 capital status. The Capital Proposals would also re-emphasize that common equity is the predominant component of Tier 1 capital by adding a minimum common equity to risk-weighted assets ratio and requiring that goodwill, general intangibles and certain other items that currently must be deducted from Tier 1 capital instead be deducted from common equity as a component of Tier 1 capital. The Capital Proposals also leave open the possibility that the committee will recommend changes to the minimum Tier 1 capital and total capital ratios of 4.0% and 8.0%, respectively.
Concurrently with the release of the Capital Proposals, the committee also released a set of proposals related to liquidity risk exposure (the “Liquidity Proposals”). The Liquidity Proposals have three key elements, including the implementation of (i) a “liquidity coverage ratio” designed to ensure that a bank maintains an adequate level of unencumbered, high-quality assets sufficient to meet the bank’s liquidity needs over a 30-day time horizon under an acute liquidity stress scenario, (ii) a “net stable funding ratio” designed to promote more medium and long-term funding of the assets and activities of banks over a one-year time horizon, and (iii) a set of monitoring tools that the committee indicates should be considered as the minimum types of information that banks should report to supervisors and that supervisors should use in monitoring the liquidity risk profiles of supervised entities.
Imposition of Liability for Undercapitalized Subsidiaries. Bank regulators are required to take “prompt corrective action” to resolve problems associated with insured depository institutions whose capital declines below certain levels. In the event an institution becomes “undercapitalized,” it must submit a capital restoration plan. The capital restoration plan will not be accepted by the regulators unless each company having control of the undercapitalized institution guarantees the subsidiary’s compliance with the capital restoration plan up to a certain specified amount. Any such guarantee from a depository institution’s holding company is entitled to a priority of payment in bankruptcy.
7
Table of Contents
Index to Financial Statements
The aggregate liability of the holding company of an undercapitalized bank is limited to the lesser of 5% of the institution’s assets at the time it became undercapitalized or the amount necessary to cause the institution to be “adequately capitalized.” The bank regulators have greater power in situations where an institution becomes “significantly” or “critically” undercapitalized or fails to submit a capital restoration plan. For example, a bank holding company controlling such an institution can be required to obtain prior Federal Reserve Board approval of proposed dividends, or might be required to consent to a consolidation or to divest the troubled institution or other affiliates.
Acquisitions by Bank Holding Companies. The BHCA requires every bank holding company to obtain the prior approval of the Federal Reserve Board before it may acquire all or substantially all of the assets of any bank, or ownership or control of any voting shares of any bank, if after such acquisition it would own or control, directly or indirectly, more than 5% of the voting shares of such bank. In approving bank acquisitions by bank holding companies, the Federal Reserve Board is required to consider the financial and managerial resources and future prospects of the bank holding company and the banks concerned, the convenience and needs of the communities to be served, and various competitive factors.
Control Acquisitions. The Change in Bank Control Act (“CBCA”) prohibits a person or group of persons from acquiring “control” of a bank holding company unless the Federal Reserve Board has been notified and has not objected to the transaction. Under a rebuttable presumption established by the Federal Reserve Board, the acquisition of 10% or more of a class of voting stock of a bank holding company with a class of securities registered under Section 12 of the Exchange Act, such as the Company, would, under the circumstances set forth in the presumption, constitute acquisition of control of the Company.
In addition, the CBCA prohibits any entity from acquiring 25% (5% in the case of an acquiror that is a bank holding company) or more of a bank holding company’s or bank’s voting securities, or otherwise obtaining control or a controlling influence over a bank holding company or bank without the approval of the Federal Reserve Board. In most circumstances, an entity that owns 25% or more of the voting securities of a banking organization owns enough of the capital resources to have a controlling influence over such banking organization for purposes of the CBCA. On September 22, 2008, the Federal Reserve Board issued a policy statement on equity investments in bank holding companies and banks, which allows the Federal Reserve Board to generally be able to conclude that an entity’s investment is not “controlling” if the entity does not own in excess of 15% of the voting power and 33% of the total equity of the bank holding company or bank. Depending on the nature of the overall investment and the capital structure of the banking organization, based on the policy statement, the Federal Reserve Board will permit noncontrolling investments in the form of voting and nonvoting shares that represent in the aggregate (i) less than one-third of the total equity of the banking organization (and less than one-third of any class of voting securities, assuming conversion of all convertible nonvoting securities held by the entity) and (ii) less than 15% of any class of voting securities of the banking organization.
The Banks—MetroBank, National Association and Metro United Bank
MetroBank is a national banking association, the deposits of which are insured by the Deposit Insurance Fund (“DIF”) of the FDIC up to the applicable legal limits. MetroBank’s primary regulator is the OCC. By virtue of the insurance of its deposits, however, MetroBank is also subject to supervision and regulation by the FDIC. Such supervision and regulation subjects MetroBank to special restrictions, requirements, potential enforcement actions, and periodic examination by the OCC. Because the Federal Reserve Board regulates the bank holding company parent of MetroBank, the Federal Reserve Board also has supervisory authority, which directly affects MetroBank.
Metro United is a California state banking association, the deposits of which are insured by the DIF of the FDIC up to the applicable legal limits. Metro United is supervised, examined and regulated by the Commissioner of the Department of Financial Institutions of the State of California (“DFI”), as well as the FDIC. Such supervision and regulation subjects Metro United to special restrictions, requirements, potential enforcement
8
Table of Contents
Index to Financial Statements
actions, and periodic examination by either of these regulators. Because the Federal Reserve Board regulates the bank holding company parent of Metro United, the Federal Reserve Board also has supervisory authority, which directly affects Metro United.
Financial Modernization. Under the Gramm-Leach-Bliley Act, a national bank may establish a financial subsidiary and engage, subject to limitations on investment, in activities that are financial in nature, other than insurance underwriting, insurance company portfolio investment, real estate development, real estate investment, annuity issuance and merchant banking activities. To do so, a bank must be well capitalized, well managed and have a Community Reinvestment Act (“CRA”) rating of satisfactory or better. National banks with financial subsidiaries must remain well capitalized and well managed in order to continue to engage in activities that are financial in nature without regulatory actions or restrictions, which could include divestiture of the financial in nature subsidiary or subsidiaries. In addition, a bank may not acquire a company that is engaged in activities that are financial in nature unless the bank has a CRA rating of satisfactory or better.
Branching—MetroBank. The establishment of a branch must be approved by the OCC, which considers a number of factors, including financial history, capital adequacy, earnings prospects, character of management, needs of the community and consistency with corporate powers.
Branching—Metro United. California law provides that a California-chartered bank can establish a branch anywhere in California provided that the branch is approved in advance by the DFI. The branch must also be approved by the FDIC, which considers a number of factors, including financial history, adequacy of the bank’s shareholders’ equity, earnings prospects, character of management, and the convenience and needs of the community to be served by the branch.
Restrictions on Transactions with Affiliates and Insiders. Transactions between MetroBank and its non-banking affiliates, and Metro United and its non-banking affiliates, including the Company, are subject to Section 23A of the Federal Reserve Act. An affiliate of a bank is any company or entity that controls, is controlled by, or is under common control with the bank. In general, Section 23A imposes limits on the amount of such transactions, and also requires certain levels of collateral for loans to affiliated parties. It also limits the amount of advances to third parties which are collateralized by the securities or obligations of the Company or its non-banking subsidiaries.
Affiliate transactions are also subject to Section 23B of the Federal Reserve Act which generally requires that certain transactions between MetroBank and its affiliates, and Metro United and its affiliates, be on terms substantially the same, or at least as favorable to MetroBank and Metro United, as those prevailing at the time for comparable transactions with or involving other nonaffiliated persons. The Federal Reserve Board has also issued Regulation W which codifies prior regulations under Sections 23A and 23B of the Federal Reserve Act and interpretive guidance with respect to affiliate transactions.
The restrictions on loans to directors, executive officers, principal shareholders and their related interests (collectively referred to herein as “insiders”) contained in the Federal Reserve Act and Regulation O apply to all insured depository institutions and their subsidiaries. These restrictions include limits on loans to insiders and conditions that must be met before such a loan can be made. There is also an aggregate limitation on all loans to insiders and their related interests. These loans cannot exceed the institution’s total unimpaired capital and surplus and the primary federal regulator may determine that a lesser amount is appropriate. Insiders are subject to enforcement actions for knowingly accepting loans in violation of applicable restrictions.
Restrictions on Distribution of Subsidiary Bank Dividends and Assets. Dividends paid by the Banks have provided a substantial part of the Company’s operating funds and for the foreseeable future it is anticipated that dividends paid by the Banks to the Company will continue to be the Company’s principal source of operating funds. Capital adequacy requirements serve to limit the amount of dividends that may be paid by the Banks.
9
Table of Contents
Index to Financial Statements
MetroBank. Until capital surplus equals or exceeds capital stock, a national bank must transfer to surplus 10% of its net income for the preceding four quarters in the case of an annual dividend or 10% of its net income for the preceding two quarters in the case of a quarterly or semiannual dividend. At December 31, 2009, MetroBank’s capital surplus exceeded its capital stock. Without prior approval, a national bank may not declare a dividend if the total amount of all dividends, declared by the bank in any calendar year exceeds the total of the bank’s retained net income for the current year and retained net income for the preceding two years. Under federal law, MetroBank cannot pay a dividend if, after paying the dividend, the bank will be “undercapitalized.” Federal regulators may declare a dividend payment to be unsafe and unsound even though MetroBank would continue to meet its capital requirements after the dividend.
Metro United. A California-chartered bank may not declare a dividend in an amount which exceeds the lesser of (i) the bank’s retained earnings or (ii) the bank’s net income for its last three fiscal years less the amount of any dividends paid to shareholders during such period. However, a bank may, with the prior approval of the DFI, declare a dividend in an amount not exceeding the greater of (a) its retained earnings, (b) its net income for its last fiscal year or (c) its net income for its current fiscal year. Under federal law, Metro United cannot pay a dividend if, after paying the dividend, Metro United will be “undercapitalized.” In the event that the DFI determines the shareholders’ equity of a bank is inadequate or that the making of the dividend by the bank would be unsafe or unsound, the DFI may order the bank to refrain from making the proposed dividend. Federal regulators may declare a dividend payment to be unsafe and unsound even though Metro United would continue to meet its capital requirements after the dividend.
Because the Company is a legal entity separate and distinct from its subsidiaries, its right to participate in the distribution of assets of any subsidiary upon the subsidiary’s liquidation or reorganization will be subject to the prior claims of the subsidiary’s creditors. In the event of a liquidation or other resolution of an insured depository institution, the claims of depositors and other general or subordinated creditors are entitled to a priority of payment over the claims of holders of any obligation of the institution to its shareholders, arising as a result of their status as shareholders, including any depository institution holding company (such as the Company) or any shareholder or creditor thereof.
Examinations—MetroBank. The OCC periodically examines and evaluates national banks. Based upon such an evaluation, the OCC may revalue the assets of the institution and require that it establish specific reserves to compensate for the difference between the OCC-determined value and the book value of such assets.
Examinations—Metro United. The DFI examines banks at least once every two years, but may conduct examinations whenever and as often as deemed necessary. The FDIC also periodically examines and evaluates insured, state non-member banks such as Metro United. Based upon such an evaluation, the FDIC may revalue the assets of the institution and require that it establish specific reserves to compensate for the difference between the FDIC determined value and the book value of such assets.
Audit Reports. Insured institutions with total assets of $500 million or more must submit annual audit reports prepared by independent auditors to federal regulators. In some instances, the audit report of the institution’s holding company can be used to satisfy this requirement. Auditors must receive examination reports, supervisory agreements, and reports of enforcement actions. For institutions with total assets of $1 billion or more, financial statements prepared in accordance with accounting principles generally accepted in the U.S., management’s certifications concerning responsibility for the financial statements, internal controls and compliance with legal requirements designated by their primary federal regulator, and an attestation by the auditor regarding the statements of management relating to the internal controls must be submitted. For institutions with total assets of more than $3 billion, independent auditors may be required to review quarterly financial statements. The Federal Deposit Insurance Corporation Improvement Act of 1991 (“FDICIA”) requires that independent audit committees be formed, consisting of outside directors only. The committees of such institutions must include members with experience in banking or financial management, must have access to outside counsel, and must not include representatives of large customers.
10
Table of Contents
Index to Financial Statements
Capital Adequacy Requirements. Similar to the Federal Reserve Board’s requirements for bank holding companies, the OCC and FDIC (“federal banking regulators”) have adopted regulations establishing minimum requirements for the capital adequacy of national banks. The federal banking regulators may establish higher minimum requirements if, for example, a bank has previously received special attention or has a high susceptibility to interest rate risk.
The federal banking regulators’ risk-based capital guidelines generally require banks to have a minimum ratio of Tier 1 capital to total risk-weighted assets of 4.0% and a ratio of total capital to total risk-weighted assets of 8.0%. As of December 31, 2009, MetroBank’s and Metro United’s ratio of Tier 1 capital to total risk-weighted assets was 12.74% and 11.48%, respectively. The ratio of total capital to total risk-weighted assets at December 31, 2009 was 14.01% for MetroBank, and 12.74% for Metro United.
The federal banking regulators’ leverage guidelines require banks to maintain Tier 1 capital of no less than 4.0% of average total assets, except in the case of certain highly rated banks for which the requirement is 3.0% of average total assets, unless a higher leverage capital ratio is warranted by the particular circumstances or risk profile of the depository institution. As of December 31, 2009, MetroBank’s and Metro United’s ratio of Tier 1 capital to average total assets (leverage ratio) was 10.69% and 10.47% respectively.
Corrective Measures for Capital Deficiencies. The federal banking regulators are required to take “prompt corrective action” with respect to capital-deficient institutions. Agency regulations define, for each capital category, the levels at which institutions are “well capitalized,” “adequately capitalized,” “under capitalized,” “significantly under capitalized” and “critically under capitalized.” A “well capitalized” bank has a total risk-based capital ratio of 10.0% or higher; a Tier 1 risk-based capital ratio of 6.0% or higher; a leverage ratio of 5.0% or higher; and is not subject to any written agreement, order or directive requiring it to maintain a specific capital level for any capital measure. An “adequately capitalized” bank has a total risk-based capital ratio of 8.0% or higher; a Tier 1 risk-based capital ratio of 4.0% or higher; a leverage ratio of 4.0% or higher (3.0% or higher if the bank was rated a composite 1 in its most recent examination report and is not experiencing significant growth); and does not meet the criteria for a well capitalized bank. A bank is “under capitalized” if it fails to meet any one of the ratios required to be adequately capitalized. Based on the most recent notification from the OCC with respect to MetroBank and from the FDIC with respect to Metro United, MetroBank and Metro United were classified as “well-capitalized” for purposes of the FDIC’s prompt corrective action regulations.
In addition to requiring undercapitalized institutions to submit a capital restoration plan, agency regulations authorize broad restrictions on certain activities of undercapitalized institutions including asset growth, acquisitions, branch establishment, and expansion into new lines of business. With certain exceptions, an insured depository institution is prohibited from making capital distributions, including dividends, and is prohibited from paying management fees to control persons if the institution would be undercapitalized after any such distribution or payment.
As an institution’s capital decreases, the federal banking regulator’s enforcement powers become more severe. A significantly undercapitalized institution is subject to mandated capital raising activities, restrictions on interest rates paid and transactions with affiliates, removal of management, and other restrictions. The federal banking regulators have only very limited discretion in dealing with a critically undercapitalized institution and are virtually required to appoint a receiver or conservator.
Banks with risk-based capital and leverage ratios below the required minimums may also be subject to certain administrative actions, including the termination of deposit insurance upon notice and hearing, or a temporary suspension of insurance without a hearing in the event the institution has no tangible capital.
Deposit Insurance Assessments. Substantially all of the deposits held by the Banks are insured up to applicable legal limits by the FDIC through the DIF and the Banks must pay deposit insurance assessments to the FDIC for such deposit insurance protection.
11
Table of Contents
Index to Financial Statements
The FDIC maintains the DIF by designating a reserve ratio between a range of 1.15% to 1.50%. If the reserve ratio falls below 1.15%, the FDIC must adopt a restoration plan that provides that the DIF will return to 1.15% generally within 5 years. If the reserve ratio equals or exceeds 1.35%, the FDIC must determine whether to declare a dividend to DIF members. Generally and unless otherwise determined by the FDIC, if the reserve ratio equals or exceeds 1.35% the FDIC declares a dividend equal to 50% of the amount in excess of the amount required to maintain the reserve ratio at 1.35% and when the reserve ratio exceeds 1.50% the FDIC declares a dividend equal to the amount in excess of the amount required to maintain the reserve ration at 1.50%. The designated reserve ratio is currently set at 1.25%. The FDIC has the discretion to price deposit insurance according to the risk for all insured institutions regardless of the level of the reserve ratio.
The DIF reserve ratio is maintained by assessing depository institutions an insurance premium based upon statutory factors that include the balance of insured deposits as well as the degree of risk the institution poses to the insurance fund. Under a risk-based assessment system required by the FDICIA, FDIC-insured depository institutions pay quarterly insurance premiums at rates based on their risk classification. Institutions assigned to higher-risk classifications (that is, institutions that pose a greater risk of loss to their respective deposit insurance funds) pay assessments at higher rates than institutions that pose a lower risk. An institution’s risk classification is assigned based on its capital levels and the level of supervisory concern the institution poses to regulators. An institution’s risk assignment includes assignment to Risk Category I, II, III, or IV.
On January 1, 2009, the FDIC increased the DIF assessment rates as part of the FDIC’s DIF restoration plan. Effective April 1, 2009, total base assessment rates range from 7 to 24 basis points for Risk Category I institutions, 17 to 43 basis points for Risk Category II institutions, 27 to 58 basis points for Risk Category III institutions, and 40 to 77.5 basis points for Risk Category IV institutions. Assessments are paid quarterly by all institutions and are based upon the assessment base that an institution reports at the end of that quarter. Risk assessments remain in effect for future assessment periods until changed by the FDIC.
In May 2009, the FDIC issued a final rule which levied a special assessment applicable to all insured depository institutions totaling 5 basis points of each institution’s total assets less Tier 1 capital as of June 30, 2009, not to exceed 10 basis points of domestic deposits. The special assessment was paid September 30, 2009 and was part of the FDIC’s efforts to rebuild the DIF. The Company’s deposit insurance expense during 2009 included approximately $723,000 recognized in the second quarter related to the special assessment.
In November 2009, the FDIC issued a rule that required all insured depository institutions, with limited exceptions, to prepay their estimated quarterly risk-based assessments for the fourth quarter of 2009 and for all of 2010, 2011 and 2012 on December 30, 2009. The assessment was calculated by taking the institution’s actual September 30, 2009 assessment base and increasing it quarterly by an estimated 5% annual growth rate through the end of 2012. The FDIC also adopted a uniform three basis point increase in assessment rates effective on January 1, 2011. Under generally accepted accounting principles (“GAAP”), the prepaid assessments would not immediately affect a bank’s earnings. Each institution records the entire amount of the prepaid assessment as a prepaid expense, an asset on its balance sheet, as of December 30, 2009, the date the payment was made. As of December 31, 2009, and each quarter thereafter, each institution records an expense for its quarterly assessment invoiced on its quarterly statement and an offsetting credit to the prepaid assessment until the asset is exhausted. The FDIC would also have the authority to exercise its discretion as supervisor and insurer to exempt an institution from the prepayment requirement if the FDIC determines that the prepayment would significantly impair the institution’s liquidity or would otherwise create significant hardship.
In December 2009, the Company paid $11.4 million in prepaid risk-based assessments, which included $746,000 related to the fourth quarter of 2009 that would have otherwise been payable in the first quarter of 2010. The $746,000 is included as a noninterest expense under FDIC assessment for 2009. The remaining $10.6 million in prepaid assessments is included in prepaid FDIC assessment in the accompanying consolidated balance sheet as of December 31, 2009.
12
Table of Contents
Index to Financial Statements
Enforcement Powers. The FDIC and the other federal banking agencies have broad enforcement powers, including the power to terminate deposit insurance, impose substantial fines and other civil and criminal penalties, and appoint a conservator or receiver. Failure to comply with applicable laws, regulations and supervisory agreements could subject the Company or its banking subsidiaries, as well as officers, directors and other institution-affiliated parties of these organizations, to administrative sanctions and potentially substantial civil money penalties. The appropriate federal banking agency may appoint the FDIC as conservator or receiver for a banking institution (or the FDIC may appoint itself, under certain circumstances) if any one or more of a number of circumstances exist, including, without limitation, the fact that the banking institution is undercapitalized and has no reasonable prospect of becoming adequately capitalized; fails to become adequately capitalized when required to do so; fails to submit a timely and acceptable capital restoration plan; or materially fails to implement an accepted capital restoration plan.
Brokered Deposit Restrictions. Adequately capitalized institutions (as defined for purposes of the prompt corrective action rules described above) cannot accept, renew or roll over brokered deposits except with a waiver from the FDIC, and are subject to restrictions on the interest rates that can be paid on such deposits. Undercapitalized institutions may not accept, renew, or roll over brokered deposits. Well-capitalized institutions are not subject to restrictions. Pursuant to the Agreement, MetroBank must obtain prior approval from the Assistant Deputy Comptroller of the OCC before it may accept, renew or roll over any brokered deposits.
Temporary Liquidity Guarantee Program. In November 2008, the Board of Directors of the FDIC adopted a final rule relating to the Temporary Liquidity Guarantee Program (“TLG Program”). Under the TLG Program, the FDIC will (i) guarantee, through the earlier of maturity or December 31, 2012 (extended from June 30, 2012 by subsequent amendment), certain newly issued senior unsecured debt issued by participating institutions on or after October 14, 2008, and before October 31, 2009 (extended from June 30, 2009 by subsequent amendment) and (ii) provide full FDIC deposit insurance coverage for non-interest bearing transaction deposit accounts, Negotiable Order of Withdrawal (“NOW”) accounts paying less than 0.5% interest per annum and Interest on Lawyers Trust Accounts held at participating FDIC insured institutions through June 30, 2010 (extended from December 31, 2009, subject to an opt-out provision, by subsequent amendment). The Company elected to participate in both guarantee programs and did not opt out of the six-month extension of the transaction account guarantee program. The Company does not intend to issue any senior unsecured dept under the TLG Program. Coverage under the TLG Program was available for the first 30 days without charge. The fee assessment for deposit insurance coverage was 10 basis points per quarter during 2009 on amounts in covered accounts exceeding $250,000. During the six-month extension period in 2010, the fee assessment increases to either 15 basis points, 20 basis points, or 25 basis points per quarter depending on the entity’s Risk Category.
Concentrated Commercial Real Estate Lending Regulations. The federal banking agencies, including the FDIC, have promulgated guidance governing financial institutions with concentrations in commercial real estate lending. The guidance provides that a bank has a concentration in commercial real estate lending if (i) total reported loans for construction, land development, and other land represent 100% or more of total capital or (ii) total reported loans secured by multifamily and non-farm residential properties and loans for construction, land development, and other land represent 300% or more of total capital and the bank’s commercial real estate loan portfolio has increased 50% or more during the prior 36 months. Owner occupied loans are excluded from this second category. If a concentration is present, management must employ heightened risk management practices that address the following key elements: including board and management oversight and strategic planning, portfolio management, development of underwriting standards, risk assessment and monitoring through market analysis and stress testing, and maintenance of increased capital levels as needed to support the level of commercial real estate lending.
U.S. Treasury Capital Purchase Program. On October 3, 2008, the Emergency Economic Stabilization Act of 2008 (“EESA”) (initially introduced as the Troubled Asset Relief Program or “TARP”) was enacted. TARP gave the U.S. Treasury authority to deploy up to $700 billion into the financial system with an objective of improving liquidity in capital markets. On October 14, 2008, the U.S. Treasury announced the CPP, which
13
Table of Contents
Index to Financial Statements
provides for direct equity investment of perpetual preferred stock by the U.S. Treasury in qualified financial institutions. The program is voluntary and requires an institution to comply with a number of restrictions and provisions, including limits on executive compensation, stock redemptions and declaration of dividends. The CPP provides for the purchase by the U.S. Treasury of perpetual senior preferred stock in an aggregate amount ranging from 1% to 3% of a participant’s risk-weighted assets. The CPP also requires a public company participant to issue to the U.S. Treasury warrants to purchase common stock equal to 15% of the capital invested by the U.S. Treasury. The Company elected to participate in the CPP, and on January 16, 2009, the Company issued and sold to the U.S. Treasury (i) 45,000 shares of the Company’s Fixed Rate Cumulative Perpetual Preferred Stock, Series A, par value $1.00 per share, with a liquidation value of $1,000 per share (the “Series A Preferred Stock”), and (ii) a warrant to purchase up to 771,429 shares of the Company’s Common Stock, par value $1.00 per share (the “Common Stock”), at an exercise price of $8.75 per share, subject to certain anti-dilution and other adjustments, for an aggregate purchase price of $45.0 million in cash.
American Recovery and Reinvestment Act of 2009. On February 17, 2009, the American Recovery and Reinvestment Act of 2009 (“ARRA”) was signed into law. Section 7001 of the ARRA amended Section 111 of the EESA in its entirety. While the U.S. Treasury must promulgate regulations to implement the restrictions and standards set forth in Section 7001, the ARRA, among other things, significantly expands the executive compensation restrictions previously imposed by the EESA. Such restrictions apply to any entity that has received or will receive financial assistance under the TARP, and shall generally continue to apply for as long as any obligation arising from financial assistance provided under TARP, including preferred stock the Company issued under the CPP, remains outstanding. These ARRA restrictions shall not apply to any TARP recipient during such time when the U.S. Treasury (i) only holds a warrant to purchase common stock of such recipient or (ii) holds no preferred stock or warrant to purchase common stock of such recipient.
As a result of the Company’s participation in the CPP, the restrictions and standards set forth in Section 7001 of the ARRA are applicable to the Company, subject to regulations to be promulgated by the U.S. Treasury. Pursuant to Section 7001(g) of the ARRA, the Company is permitted to repay the $45.0 million received under the CPP, subject to approval by its primary Federal banking regulator, without regard to certain repayment restrictions in the Securities Purchase Agreement.
Cross-Guarantee Provisions. The Financial Institutions Reform, Recovery and Enforcement Act of 1989 (“FIRREA”) contains a “cross-guarantee” provision which generally makes commonly controlled insured depository institutions liable to the FDIC for any losses incurred in connection with the failure of a commonly controlled depository institution.
Community Reinvestment Act. The CRA and the regulations issued thereunder are intended to encourage banks to help meet the credit needs of their service area, including low and moderate-income neighborhoods, consistent with the safe and sound operations of the banks. These regulations also provide for regulatory assessment of a bank’s record in meeting the needs of its service area when considering applications to establish branches, merger applications and applications to acquire the assets and assume the liabilities of another bank. FIRREA requires federal banking agencies to make public a rating of a bank’s performance under the CRA. In the case of a bank holding company, the CRA performance record of the banks involved in the transaction are reviewed in connection with the filing of an application to acquire ownership or control of shares or assets of a bank or to merge with any other bank holding company. An unsatisfactory record can substantially delay or block the transaction. In its most recent performance evaluation, MetroBank received an “outstanding” CRA performance rating from the OCC. Metro United Bank received a “satisfactory” CRA performance rating from the FDIC in its most recent performance evaluation.
Consumer Laws and Regulations. In addition to the laws and regulations discussed herein, the Banks are also subject to certain consumer laws and regulations that are designed to protect consumers in transactions with banks. While the list set forth herein is not exhaustive, these laws and regulations include the Truth in Lending Act, the Truth in Savings Act, the Electronic Funds Transfer Act, the Expedited Funds Availability Act, the
14
Table of Contents
Index to Financial Statements
Equal Credit Opportunity Act, and the Fair Housing Act, among others. These laws and regulations mandate certain disclosure requirements and regulate the manner in which financial institutions must deal with customers when taking deposits or making loans to such customers. The Banks must comply with the applicable provisions of these consumer protection laws and regulations as part of their ongoing customer relations.
Privacy. In addition to expanding the activities in which banks and bank holding companies may engage, the Gramm-Leach-Bliley Act imposes new requirements on financial institutions with respect to customer privacy. The Gramm-Leach-Bliley Act generally prohibits disclosure of customer information to non-affiliated third parties unless the customer has been given the opportunity to object and has not objected to such disclosure. Financial institutions are further required to disclose their privacy policies to customers annually. Financial institutions, however, will be required to comply with state law if it is more protective of customer privacy than the Gramm- Leach-Bliley Act.
Anti-money Laundering and Anti-Terrorism Legislation. Congress enacted the Bank Secrecy Act of 1970 (“BSA”) to require financial institutions, including the Company and the Banks, to maintain certain records and to report certain transactions to prevent such institutions from being used to hide money derived from criminal activity and tax evasion. The BSA establishes, among other things, (i) record keeping requirements to assist government enforcement agencies in tracing financial transactions and flow of funds; (ii) reporting requirements for Suspicious Activity Reports and Currency Transaction Reports to assist government enforcement agencies in detecting patterns of criminal activity; (iii) enforcement provisions authorizing criminal and civil penalties for illegal activities and violations of the BSA and its implementing regulations; and (iv) safe harbor provisions that protect financial institutions from civil liability for their cooperative efforts.
The Uniting and Strengthening America by Providing Appropriate Tools Required to Intercept and Obstruct Terrorism Act of 2001 (“USA PATRIOT Act”) was enacted in October 2001 and amended the BSA and incorporates anti-terrorist financing provisions into the BSA and its implementing regulations. The USA PATRIOT Act is intended to strengthen U.S. law enforcement’s and the intelligence communities’ ability to work cohesively to combat terrorism on a variety of fronts. The potential impact of the USA PATRIOT Act on financial institutions of all kinds is significant and wide ranging. The USA PATRIOT Act contains sweeping anti-money laundering and financial transparency laws and requires various regulations, including: (i) due diligence requirements for financial institutions that administer, maintain, or manage private bank accounts or correspondent accounts for non-U.S. persons; (ii) standards for verifying customer identification at account opening; (iii) rules to promote cooperation among financial institutions, regulators and law enforcement entities in identifying parties that may be involved in terrorism or money laundering; (iv) reports by nonfinancial trades and business filed with the Treasury Department’s Financial Crimes Enforcement Network for transactions exceeding $10,000; and (v) filing of suspicious activities reports involving securities by brokers and dealers if they believe a customer may be violating U.S. laws and regulations.
The U.S. Treasury’s Office of Foreign Asset Control (“OFAC”) administers and enforces economic and trade sanctions against targeted foreign countries, entities and individuals based on U.S. foreign policy and national security goals. As a result, financial institutions, including the Company and the Banks, must scrutinize transactions to ensure that they do not represent obligations of, or ownership interests in, entities owned or controlled by sanctioned targets. In addition, the Company and the Banks restrict transactions with certain targeted countries except as permitted by OFAC.
Legislative Initiatives
In light of current conditions and the market outlook for continuing weak economic conditions, regulators have increased their focus on the regulation of financial institutions. A number of government initiatives designed to respond to the current conditions have been introduced recently and proposals for legislation that could substantially intensify the regulation of financial institutions are expected to be introduced in Congress and state legislatures. Such initiatives may change banking statutes and the operating environment of the Company
15
Table of Contents
Index to Financial Statements
and the Banks in substantial and unpredictable ways. The Company cannot determine the ultimate effect that any potential legislation, if enacted, or implementing regulations with respect thereto, would have, upon the financial condition or results of operations of the Company or the Banks. A change in statutes, regulations or regulatory policies applicable to the Company or any of the Banks could have a material effect on the financial condition, results of operations or business of the Company and the Banks.
Regulatory Reform. In June 2009, the U.S. President’s administration proposed a wide range of regulatory reforms that, if enacted, may have significant effects on the financial services industry in the United States. Significant aspects of the administration’s proposals that may affect the Company included, among other things, proposals: (i) to reassess and increase capital requirements for banks and bank holding companies and examine the types of instruments that qualify as regulatory capital; (ii) to expand the current eligibility requirements for financial holding companies such as the Company so that the financial holding company must be “well capitalized” and “well managed” on a consolidated basis; (iii) to create a federal consumer financial protection agency to be the primary federal consumer protection supervisor with broad examination, supervision and enforcement authority with respect to consumer financial products and services; and (iv) to further limit the ability of banks to engage transactions with affiliates.
Separate comprehensive financial reform bills intended to address the proposals set forth by the administration were introduced in both houses of Congress in the second half of 2009 and remain under review by both the U.S. House of Representatives and the U.S. Senate. The Company cannot predict whether or in what form further legislation or regulations may be adopted or the extent to which the Company may be affected thereby.
Incentive Compensation. On October 22, 2009, the Federal Reserve issued a comprehensive proposal on incentive compensation policies (the “Incentive Compensation Proposal”) intended to ensure that the incentive compensation policies of banking organizations do not undermine the safety and soundness of such organizations by encouraging excessive risk-taking. The Incentive Compensation Proposal, which covers all employees that have the ability to materially affect the risk profile of an organization, either individually or as part of a group, is based upon the key principles that a banking organization’s incentive compensation arrangements should (i) provide incentives that do not encourage risk-taking beyond the organization’s ability to effectively identify and manage risks, (ii) be compatible with effective internal controls and risk management, and (iii) be supported by strong corporate governance, including active and effective oversight by the organization’s board of directors. Banking organizations are instructed to begin an immediate review of their incentive compensation policies to ensure that they do not encourage excessive risk-taking and implement corrective programs as needed. Where there are deficiencies in the incentive compensation arrangements, they must be immediately addressed.
The Federal Reserve will review, as part of the regular, risk-focused examination process, the incentive compensation arrangements of banking organizations, such as the Company, that are not “large, complex banking organizations.” These reviews will be tailored to each organization based on the scope and complexity of the organization’s activities and the prevalence of incentive compensation arrangements. The findings of the supervisory initiatives will be included in reports of examination. Deficiencies will be incorporated into the organization’s supervisory ratings, which can affect the organization’s ability to make acquisitions and take other actions. Enforcement actions may be taken against a banking organization if its incentive compensation arrangements, or related risk-management control or governance processes, pose a risk to the organization’s safety and soundness and the organization is not taking prompt and effective measures to correct the deficiencies.
The scope and content of the U.S. banking regulators’ policies on executive compensation are continuing to develop and are likely to continue evolving in the near future. It cannot be determined at this time whether compliance with such policies will adversely affect the Company’s ability to hire, retain and motivate its key employees.
16
Table of Contents
Index to Financial Statements
Expanding Enforcement Authority
One of the major additional burdens imposed on the banking industry by FDICIA is the increased ability of banking regulators to monitor the activities of banks and their holding companies. In addition, the federal regulators possess extensive authority to police unsafe or unsound practices and violations of applicable laws and regulations by depository institutions and their holding companies. For example, the FDIC may terminate the deposit insurance of any institution which it determines has engaged in an unsafe or unsound practice. The agencies can also assess civil money penalties, issue cease and desist or removal orders, seek injunctions, and publicly disclose such actions. FDICIA, FIRREA and other laws have expanded the agencies’ authority in recent years, and the agencies have not yet fully tested the limits of their powers.
Effect of Monetary Policy
The policies of regulatory authorities, including the monetary policy of the Federal Reserve Board, have a significant effect on the operating results of bank holding companies and their subsidiaries. Among the means available to the Federal Reserve Board to affect the money supply are open market operations in U.S. Government securities, changes in the discount rate or federal funds rate on member bank borrowings, and changes in reserve requirements against member bank deposits. These means are used in varying combinations to influence overall growth and distribution of bank loans, investments and deposits, and their use may affect interest rates charged on loans or paid for deposits.
Federal Reserve Board monetary policies have materially affected the operating results of commercial banks in the past and are expected to continue to do so in the future. The nature of future monetary policies and the effect of such policies on the business and earnings of the Company and its subsidiaries cannot be predicted.
| Item 1A. | Risk Factors |
An investment in the Company’s Common Stock involves risks. The following is a description of the material risks and uncertainties that the Company believes affect its business and an investment in its Common Stock. Additional risks and uncertainties that the Company are unaware of, or that it currently deems immaterial, also may become important factors that affect the Company and its business. If any of the risks described in this Annual Report on Form 10-K were to occur, the Company’s financial condition and results of operations could be materially and adversely affected. If this were to happen, the value of the Common Stock could decline significantly and you could lose all or part of your investment.
Risks Associated with the Company’s Business
The current economic environment poses significant challenges for the Company and could adversely affect the Company’s business, financial condition and results of operations.
The Company is operating in a challenging and uncertain economic environment, including generally uncertain conditions nationally and locally in its markets. Financial institutions continue to be affected by declines in the real estate market that have negatively impacted the credit performance of mortgage, construction and commercial real estate loans and resulted in significant write-downs of assets by many financial institutions. Concerns over the stability of the financial markets and the economy have resulted in decreased lending by financial institutions to their customers and to each other. The Company retains direct exposure to the residential and commercial real estate markets, and is affected by these events. Continued declines in real estate values, home sales volumes and financial stress on borrowers as a result of the uncertain economic environment, including job losses, could have an adverse affect on the Company’s borrowers or its customers, which could adversely affect its business, financial condition and results of operations.
The Company’s ability to assess the creditworthiness of customers and to estimate the losses inherent in its loan portfolio is made more complex by these difficult market and economic conditions. The Company also expects to face increased regulation and government oversight as a result of these downward trends. This
17
Table of Contents
Index to Financial Statements
increased government action may increase the Company’s costs and limit its ability to pursue certain business opportunities. In addition, the Company may be required to pay even higher FDIC deposit insurance assessments than the recently increased level because financial institution failures resulting from the depressed market conditions and other factors have depleted and may continue to deplete the DIF and reduce its ratio of reserves to insured deposits.
A prolonged national economic recession or further deterioration in these conditions in the Company’s markets could drive losses beyond that which is provided for in its allowance for loan losses and result in the following consequences:
| • | increases in loan delinquencies; |
| • | increases in nonperforming assets and foreclosures; |
| • | decreases in demand for the Company’s products and services, which could adversely affect its liquidity position; and |
| • | decreases in the value of the collateral securing the Company’s loans, especially real estate, which could reduce customers’ borrowing power. |
While economic conditions in the Company’s market areas and the U.S. generally are showing signs of recovery, there can be no assurance that these difficult conditions will improve. A worsening of these conditions would likely exacerbate the adverse effects of these difficult economic conditions on the Company, its customers and the other financial institutions in its market. As a result, the Company may experience increases in foreclosures, delinquencies and customer bankruptcies, as well as more restricted access to funds.
The Company’s business is subject to interest rate risk and fluctuations in interest rates may adversely affect its earnings and capital levels.
The majority of the Company’s assets are monetary in nature and, as a result, the Company is subject to significant risk from changes in interest rates. Changes in interest rates can impact the Company’s net interest income as well as the valuation of its assets and liabilities. The Company’s earnings are significantly dependent on its net interest income, which is the difference between interest income on interest-earning assets, such as loans and securities, and interest expense on interest-bearing liabilities, such as deposits and borrowings. The Company expects that it will periodically experience “gaps” in the interest rate sensitivities of its assets and liabilities, meaning that either its interest-bearing liabilities will be more sensitive to changes in market interest rates than its interest-earning assets, or vice versa. In either event, if market interest rates should move contrary to the Company’s position, this “gap” will negatively impact the Company’s earnings.
An increase in the general level of interest rates may also, among other things, reduce the demand for loans and the Company’s ability to originate loans. Conversely, a decrease in the general level of interest rates, among other things, may lead to an increase in prepayments on the Company’s loan and mortgage-backed securities portfolios and increased competition for deposits. Accordingly, changes in the general level of market interest rates affect the Company’s net yield on interest-earning assets, loan origination volume, market value of loans and mortgage-backed securities portfolios.
Market interest rates are affected by many factors outside of the Company’s control, including governmental monetary policies, inflation, recession, changes in unemployment, the money supply and international disorder, and instability in domestic and foreign financial markets. In view of the low interest rates on savings, loans and investments that currently prevail, it is quite possible that significant changes in interest rates may take place in the future, and the Company cannot always accurately predict the nature or magnitude of such changes or how such changes may affect its business. Although the Company’s asset-liability management strategy is designed to control its risk from changes in the general level of market interest rates, it may not be able to prevent changes in interest rates from having a material adverse affect on the Company’s earnings and capital levels.
18
Table of Contents
Index to Financial Statements
The Company continues to face market volatility, which could adversely impact the results of operations and access to capital
The capital and credit markets have been experiencing volatility and disruption for more than two years. While volatility in, and disruption of, these markets no longer remain at unprecedented levels, in some cases, the markets have produced downward pressure on stock prices and credit capacity without regard to an issuer’s underlying financial strength. If current levels of market disruption and volatility continue or worsen, there can be no assurance that the Company will not experience adverse effects, which may be material, on its ability to access capital and on the results of operations and financial condition, including the Company’s liquidity position.
If the goodwill that the Company recorded in connection with a business acquisition becomes impaired, it could have a negative impact on the Company’s profitability.
Goodwill represents the amount of acquisition cost over the fair value of net assets we acquired in the purchase of another financial institution. The Company reviews goodwill for impairment at least annually, or more frequently if events or changes in circumstances indicate the carrying value of the asset might be impaired. Examples of those events or circumstances include the following:
| • | significant decline in the Company’s stock price; |
| • | significant reductions in profitability; |
| • | significant adverse change in business climate; |
| • | significant changes in credit quality; |
| • | significant unanticipated loss of customers; |
| • | unanticipated loss of key personnel; or |
| • | significant loss of deposits or loans. |
The Company determines impairment by comparing the implied fair value of the reporting unit goodwill with the carrying amount of that goodwill. If the carrying amount of the reporting unit goodwill exceeds the implied fair value of that goodwill, an impairment loss is recognized in an amount equal to that excess. Any such adjustments are reflected in the Company’s results of operations in the periods in which they become known. Goodwill is reviewed at least annually or more frequently if events or changes in circumstances indicate the carrying value may not be recoverable. Given the continued weakness and adverse economic conditions with respect to the Company’s California markets, the Company reviewed the carrying value of its goodwill and recorded a non-cash impairment charge of $2.5 million as a component of noninterest expense during the fourth quarter of 2009. At December 31, 2009, the Company’s goodwill after the impairment was $19.3 million. If the weakness and adverse economic conditions with respect to the Company’s California markets worsen or fail to improve, the Company may be required to recognize additional goodwill impairment charges in the future, which could have a material adverse effect on the Company’s equity and financial condition.
A large percentage of the Company’s loans are collateralized by real estate, and an adverse change in the real estate market may result in losses and adversely affect its profitability.
Approximately 90.3% of the Company’s loan portfolio as of December 31, 2009 was comprised of loans collateralized by real estate. The real estate collateral in each case provides an alternate source of repayment in the event of default by the borrower and may deteriorate in value during the time the credit is extended. A weakening of the real estate market in the Company’s primary market areas could have an adverse effect on the demand for new loans, the ability of borrowers to repay outstanding loans, the value of real estate and other collateral securing the loans and the value of real estate owned by the Company. If real estate values decline, it is also more likely that the Company would be required to increase its allowance for loan losses, which could
19
Table of Contents
Index to Financial Statements
adversely affect its financial condition and results of operations. In the event of a default with respect to any of these loans, amounts received upon disposal of the collateral may be insufficient to recover outstanding principal and interest on the loan. As a result, the Company’s profitability and financial condition could be adversely impacted.
As of December 31, 2009, approximately $97.8 million or 7.7% of the Company’s gross loan portfolio was in real estate construction loans. Of this amount, $32.3 million were made to finance residential construction projects, of which 77.1% were located in Texas, and 22.9% were located in California. Further, $65.5 million of real estate construction loans were made to finance commercial construction, with 64.9% of these loans made to finance construction projects located in Texas and 35.1% of those loans made to finance construction projects located in California. Construction loans are subject to risks during the construction phase that are not present in standard residential real estate and commercial real estate loans. These risks include:
| • | the viability of the contractor; |
| • | the contractor’s ability to complete the project, to meet deadlines and time schedules and to stay within cost estimates; and |
| • | concentrations of such loans with a single contractor and its affiliates. |
Real estate construction loans also present risks of default in the event of declines in property values or volatility in the real estate market during the construction phase. The current slowdown in the sales of residential properties, and the related reduction in prices, has affected construction lending activities in the Company’s market area, and the Company expects that these conditions will have the effect of extending the durations of its construction loans and increasing the risk of possible loss on these loans. If any of these risks were to occur, it could adversely affect the Company’s financial condition and results of operations.
The federal banking agencies have issued guidance regarding high concentrations of commercial real estate loans within bank loan portfolios. The guidance requires financial institutions that exceed certain levels of commercial real estate lending compared with their total capital to maintain heightened risk management practices that address the following key elements: including board and management oversight and strategic planning, portfolio management, development of underwriting standards, risk assessment and monitoring through market analysis and stress testing, and maintenance of increased capital levels as needed to support the level of commercial real estate lending. If there is any deterioration in the Company’s commercial mortgage or construction portfolios or if its regulators conclude that the Company has not implemented appropriate risk management practices, it could adversely affect the Company’s business and result in a requirement of increased capital levels, and such capital may not be available at that time.
The Company has a high level of nonperforming assets, which take significant time to resolve, have required it to significantly increase the provision for loan losses and are likely to continue to materially adversely affect the Company’s business, results of operations and financial condition.
The Company has experienced a substantial increase in nonperforming assets from December 31, 2008 to December 31, 2009, resulting in increases in its provisions for loan losses. At December 31, 2008 and 2009, total nonperforming assets (which include nonperforming loans and ORE) were $57.6 million and $102.9 million, or 3.65% and 6.47% of total assets, respectively.
Nonperforming assets adversely affect the Company’s net income in various ways. Until economic and market conditions improve, the Company may continue to incur losses relating to an increase in nonperforming assets. The Company does not record interest income on nonaccrual loans or ORE, thereby adversely affecting its net interest income, and increasing its loan administration costs. When the Company takes collateral in foreclosures and similar proceedings, it is required to mark the related loan to the then fair value of the collateral, which may ultimately result in a loss. Further, an increase in the level of nonperforming assets increases the Company’s regulatory risk profile. While the Company reduces problem assets through workouts,
20
Table of Contents
Index to Financial Statements
restructurings, loan sales and otherwise, decreases in the value of the underlying collateral, or in these borrowers’ performance or financial condition, whether or not due to economic and market conditions beyond the Company’s control, could adversely affect the Company’s business, results of operations and financial condition. In addition, the resolution of nonperforming assets requires significant commitments of time from management and the Board of Directors, which can be detrimental to the performance of their other responsibilities. There can be no assurance that the Company will not experience future increases in nonperforming assets.
MetroBank’s failure to comply with the provisions of the Agreement with the OCC could subject MetroBank to more severe regulatory enforcement actions.
On August 10, 2009, MetroBank entered into the Agreement with the OCC, which was based on the findings of the OCC during the annual on-site examination of MetroBank performed in the first quarter of 2009. Pursuant to the Agreement, MetroBank has agreed to take certain actions intended to address various issues that have impacted MetroBank’s asset quality. Management and the Boards of Directors of the Company and MetroBank have aggressively taken steps to address the findings of the exam and are aggressively working to comply with the requirements of the Agreement. Failure by MetroBank to meet the requirements and conditions imposed by the Agreement could result in more severe regulatory enforcement actions such as capital directives to raise additional capital, civil money penalties, cease and desist or removal orders, injunctions, and public disclosure of such actions against MetroBank. Any such failure and resulting regulatory action could have a material adverse effect on the financial condition and results of operations of the Company and MetroBank.
The Company’s allowance for loan losses may not be sufficient to cover actual loan losses, which could adversely affect its earnings.
As a lender, the Company is exposed to the risk that its loan customers may not repay their loans according to the terms of these loans and the collateral securing the payment of these loans may be insufficient to fully compensate the Company for the outstanding balance of the loan plus the costs to dispose of the collateral. Management makes various assumptions and judgments about the collectability of the Company’s loan portfolio, including the diversification by industry of its commercial loan portfolio, the amount of nonperforming loans and related collateral, the volume, growth and composition of its loan portfolio, the effects on the loan portfolio of current economic indicators and their probable impact on borrowers and the evaluation of its loan portfolio through its internal loan review process and other relevant factors.
The Company maintains an allowance for loan losses in an attempt to cover loan losses inherent in its loan portfolio. Additional loan losses will likely occur in the future and may occur at a rate greater than the Company has experienced to date. In determining the size of the allowance, the Company relies on an analysis of its loan portfolio, its experience and its evaluation of general economic conditions. If the Company’s assumptions prove to be incorrect or if it experiences significant loan losses, its current allowance may not be sufficient to cover actual losses and adjustments may be necessary to allow for different economic conditions or adverse developments in its loan portfolio. A material addition to the allowance could cause a material decrease in net income.
In addition, federal and state regulators periodically review the Company’s allowance for loan losses and may require the Company to increase its provision for loan losses or recognize further charge-offs, based on judgments different than those of the Company’s management. Any increase in the Company’s allowance for loan losses or charge-offs as required by these regulatory agencies could have a material adverse effect on the Company’s operating results and financial condition.
Liquidity risk could impair the Company’s ability to fund operations and jeopardize its financial condition.
Liquidity is essential to the Company’s business. An inability to raise funds through deposits, borrowings, and other sources could have a substantial negative effect on its liquidity. The Company’s access to funding sources in amounts adequate to finance its activities or on terms which are acceptable to it could be impaired by
21
Table of Contents
Index to Financial Statements
factors that affect the Company specifically or the financial services industry or economy in general. Factors that could detrimentally impact the Company’s access to liquidity sources include a decrease in the level of its business activity as a result of a downturn in the markets in which its loans are concentrated or adverse regulatory action against it. The Company’s ability to borrow could also be impaired by factors that are not specific to it, such as a disruption in the financial markets or negative views and expectations about the prospects for the financial services industry in light of the recent turmoil faced by banking organizations and the continued deterioration in credit markets.
The Company may need to raise additional capital in the future and such capital may not be available when needed or at all.
The Company may need to raise additional capital in the future to provide it with sufficient capital resources and liquidity to meet its commitments and business needs. The Company’s ability to raise additional capital, if needed, will depend on, among other things, conditions in the capital markets at that time, which are outside of its control, and its financial performance. The ongoing liquidity crisis and the loss of confidence in financial institutions may increase the Company’s cost of funding and limit its access to some of its customary sources of capital, including, but not limited to, inter-bank borrowings, repurchase agreements and borrowings from the discount window of the Federal Reserve.
The Company cannot assure you that such capital will be available to it on acceptable terms or at all. Any occurrence that may limit its access to the capital markets, such as a decline in the confidence of investors, depositors of the Banks or counterparties participating in the capital markets, may adversely affect the Company’s capital costs and its ability to raise capital and, in turn, its liquidity. An inability to raise additional capital on acceptable terms when needed could have a materially adverse effect on the Company’s businesses, financial condition and results of operations.
The Company’s profitability depends significantly on local economic conditions.
The Company’s success depends primarily on the general economic conditions of the geographic markets in which it operates. Unlike larger banks that are more geographically diversified, the Company provides banking and financial services to customers primarily in the greater Houston and Dallas metropolitan areas in Texas, and in the greater San Diego, Los Angeles, and San Francisco metropolitan areas in California. The local economic conditions in these areas have a significant impact on the Company’s commercial, real estate and construction loans, the ability of its borrowers to repay their loans and the value of the collateral securing these loans. In addition, if the population or income growth in the Company’s market areas is slower than projected, income levels, deposits and housing starts could be adversely affected and could result in a reduction of the Company’s expansion, growth and profitability. Recently, economic conditions in California and, to a lesser extent, Texas have declined and if either of these regions experiences a downturn or a recession for a prolonged period of time, the Company would likely experience significant increases in nonperforming loans, which could lead to operating losses, impaired liquidity and eroding capital. A significant decline in general economic conditions, caused by inflation, recession, acts of terrorism, outbreak of hostilities or other international or domestic calamities, unemployment or other factors could impact these local economic conditions and negatively affect the Company’s financial condition, results of operations and future prospects.
The small to medium-sized businesses that the Company lends to may have fewer resources to weather a downturn in the economy, which may impair a borrower’s ability to repay a loan to the Company, and such impairment could materially harm our operating results.
The Company targets its business development and marketing strategy primarily to serve the banking and financial services needs of small to medium-sized businesses. These small to medium-sized businesses generally have fewer resources in terms of capital or borrowing capacity than larger entities, may be more vulnerable to economic downturns, often need substantial additional capital to expand or compete and may experience significant volatility in operating results. Any one or more of these factors may impair the borrower’s ability to repay a loan.
22
Table of Contents
Index to Financial Statements
The Company makes both secured and some unsecured commercial and industrial loans. Unsecured loans generally involve a higher degree of risk of loss than do secured loans because, without collateral, repayment is wholly dependent upon the success of the borrowers’ businesses. Secured commercial loans may be collateralized by accounts receivable, inventory, equipment or other assets owned by the borrower and include a personal guaranty of the business owner. Compared to real estate, that type of collateral is more difficult to monitor, its value is harder to ascertain, it may depreciate more rapidly and it may not be as readily saleable if repossessed.
In addition, the success of a small to medium-sized business often depends on the management talents and efforts of one or two persons or a small group of persons, and the death, disability or resignation of one or more of these persons could have a material adverse impact on the business and its ability to repay a loan. Economic downturns and other events that negatively impact the Company’s market areas could cause the Company to incur substantial credit losses that could negatively affect the Company’s results of operations and financial condition may be negatively affected.
The Company may be required to pay significantly higher FDIC deposit insurance assessments in the future.
Recent insured depository institution failures, as well as deterioration in banking and economic conditions generally, have significantly increased the loss provisions of the FDIC, resulting in a decline in the designated reserve ratio of the FDIC to historical lows. The FDIC expects a higher rate of insured depository institution failures in the next few years compared to recent years; thus, the reserve ratio may continue to decline. In addition, the deposit insurance limit on FDIC deposit insurance coverage generally has increased to $250,000 through December 31, 2013. These developments will cause the premiums assessed on the Company by the FDIC to increase and materially increase its noninterest expense.
On January 1, 2009, the FDIC increased the DIF assessment rates as part of the FDIC’s DIF restoration plan. Effective April 1, 2009, the assessment rates increased to 7 to 24 basis points for Risk Category I institutions, 17 to 43 basis points for Risk Category II institutions, 27 to 58 basis points for Risk Category III institutions, and 40 to 77.5 basis points for Risk Category IV institutions. In May 2009, the FDIC issued a final rule which levied a special assessment applicable to all insured depository institutions totaling 5 basis points of each institution’s total assets less Tier 1 capital as of June 30, 2009, not to exceed 10 basis points of domestic deposits, which for the Company totaled approximately $723,000 recognized in the second quarter of 2009.
In November 2009, the FDIC issued a rule that required all insured depository institutions, with limited exceptions, to prepay their estimated quarterly risk-based assessments for the fourth quarter of 2009 and for all of 2010, 2011 and 2012 on December 30, 2009. The assessment, which for the Company totaled $11.4 million was calculated by taking the institution’s actual September 30, 2009 assessment base and adjusting it quarterly by an estimated 5% annual growth rate through the end of 2012. Under GAAP accounting rules, the prepaid assessments would not immediately affect a bank’s earnings. Each institution records the entire amount of the prepaid assessment as a prepaid expense, an asset on its balance sheet, as of December 30, 2009, the date the payment was made. As of December 31, 2009, and each quarter thereafter, each institution records an expense for its quarterly assessment invoiced on its quarterly statement and an offsetting credit to the prepaid assessment until the asset is exhausted. The FDIC also adopted a uniform three-basis point increase in assessment rates effective on January 1, 2011.
These higher FDIC assessment rates will have an adverse impact on the Company’s results of operations. For the year ended December 31, 2009, the Company’s FDIC insurance related costs were $3.9 million compared with $617,000 and $173,000 for the years ended December 31, 2008 and 2007, respectively. The Company is unable to predict the impact in future periods; including whether and when additional special assessments may occur.
23
Table of Contents
Index to Financial Statements
Recent legislative and regulatory initiatives to support the financial services industry, including the Capital Purchase Program, have been coupled with numerous restrictions and requirements that could detrimentally affect the Company’s business, financial condition and results of operations.
In addition to the U.S. Treasury’s CPP announced in the fall of 2008, the U.S. Treasury and the FDIC have taken further steps to support and regulate the financial services industry, that include enhancing the liquidity support available to financial institutions, temporarily guaranteeing money market funds and certain types of debt issuances, and increasing insurance on bank deposits. The U.S. Congress, through the EESA, has imposed a number of restrictions and limitations on the operations of financial services firms participating in the federal programs, such as the CPP. Accordingly, the Company and other financial institutions who participate in such programs are subject to additional restrictions, oversight, reporting obligations and costs, each of which could have an adverse impact on the Company’s business, financial condition and results of operations. As a participant in the CPP, the Company is subject to the executive compensation limitations under Section 111 of EESA. The EESA contains restrictions on bonus and other incentive compensation payable to certain of the Company’s most highly compensated employees. Such restrictions and standards may impact the Company’s ability to retain key officers and employees and to compete with financial institutions that are not subject to the same limitations as the Company. The unexpected loss of services of any of these key employees could adversely impact the Company’s business.
The Company may be adversely affected by the soundness of other financial institutions.
Financial services institutions are interrelated as a result of trading, clearing, counterparty, or other relationships. The Company has exposure to many different industries and counterparties, and routinely executes transactions with counterparties in the financial services industry, including commercial banks, brokers and dealers, investment banks, and other institutional clients. Many of these transactions expose the Company to credit risk in the event of a default by a counterparty or client. In addition, the Company’s credit risk may be exacerbated when the collateral held by the Company cannot be realized upon or is liquidated at prices not sufficient to recover the full amount of the credit or derivative exposure due to the Company. Any such losses could have a material adverse effect on the Company’s financial condition, results of operations and cash flows.
The Company could be subject to environmental risks and associated costs on its foreclosed real estate assets.
A significant portion of the Company’s loan portfolio is secured by real property. There is a risk that hazardous or toxic waste could be discovered on the properties that secure the Company’s loans. If the Company acquires such properties as a result of foreclosure, it could be held responsible for the cost of cleaning up or removing this waste, and this cost could exceed the value of the underlying properties and adversely affect the Company’s profitability. Although the Company has policies and procedures that require it to perform an environmental review before initiating any foreclosure action on real property, these reviews may not be sufficient to detect all potential environmental hazards.
Potential acquisitions may disrupt the Company’s business and dilute shareholder value.
The Company has in the past, and may in the future consider acquisition opportunities with other financial institutions. The Company seeks merger or acquisition partners that are culturally similar and have experienced management and possess either significant market presence or have potential for improved profitability through financial management, economies of scale or expanded services. Acquiring other banks, businesses, or branches involves various risks commonly associated with acquisitions, including, among other things:
| • | Potential exposure to unknown or contingent liabilities of the target company; |
| • | Exposure to potential asset quality issues of the target company; |
| • | Difficulty and expense of integrating the operations, management, products and services of the target company; |
24
Table of Contents
Index to Financial Statements
| • | Potential disruption to the Company’s business; |
| • | Potential diversion of the Company management’s time and attention; |
| • | Possible loss of key employees and customers of the target company; and |
| • | Difficulty in estimating the value of the target company. |
Acquisitions typically involve the payment of a premium over book and market values, and, therefore, some dilution of the Company’s tangible book value and net income per common share may occur in connection with any future transaction. The Company’s failure to successfully integrate any entity it may acquire and realize the expected revenue increases, cost savings, increases in geographic or product presence, and/or other projected benefits from such acquisition could have a material adverse effect on the Company’s financial condition, results of operations and business.
The Company is subject to losses resulting from fraudulent and negligent acts on the part of loan applicants, correspondents or other third parties.
The Company relies heavily upon information supplied by third parties, including the information contained in credit applications, property appraisals, title information, equipment pricing and valuation and employment and income documentation, in deciding which loans the Company will originate, as well as the terms of those loans. If any of the information upon which the Company relies is misrepresented, either fraudulently or inadvertently, and the misrepresentation is not detected prior to asset funding, the value of the asset may be significantly lower than expected, or the Company may fund a loan that it would not have funded or on terms it would not have extended. Whether a misrepresentation is made by the applicant or another third party, the Company generally bears the risk of loss associated with the misrepresentation. A loan subject to a material misrepresentation is typically unsellable or subject to repurchase if it is sold prior to detection of the misrepresentation. The sources of the misrepresentations are often difficult to locate, and it is often difficult to recover any of the monetary losses the Company may suffer.
An interruption in or breach in security of the Company’s information systems may result in a loss of customer business.
The Company relies heavily on communications and information systems to conduct its business. Any failure, interruption or breach in security of these systems could result in failures or disruptions in the Company’s customer relationship management, general ledger, deposits, servicing or loan origination systems. Although the Company has policies and procedures designed to prevent or minimize the effect of a failure, interruption or security breach of its communications or information systems, the Company cannot assure that such failures, interruptions or security breaches will not occur or, if they do occur, that they will be adequately addressed by the Company. The occurrence of any such failures, interruptions or security breaches could result in a loss of customer business and have a negative effect on the Company’s results of operations and financial condition.
The business of the Company is dependent on technology and its inability to invest in technological improvements may adversely affect its results of operations and financial condition.
The financial services industry is undergoing rapid technological changes with frequent introductions of new technology driven products and services. In addition to better serving customers, the effective use of technology increases efficiency and enables financial institutions to reduce costs. The Company’s future success will depend in part upon its ability to address the needs of its customers by using technology to provide products and services that will satisfy customer demands for convenience as well as create additional efficiencies in its operations. Many of the Company’s competitors have substantially greater resources to invest in technological improvements. There can be no assurance that the Company will be able to effectively implement new technology driven products and services or be successful in marketing these products and services to its customers.
25
Table of Contents
Index to Financial Statements
The Company operates in a highly regulated environment and, as a result, is subject to extensive regulation and supervision that could adversely affect its financial performance, and the Company may be adversely affected by changes in federal and local laws and regulations.
The Company and the Banks are subject to extensive regulation, supervision and examination by federal and state banking authorities. Any change in applicable regulations or federal or state legislation could have a substantial impact on the Company, the Banks, and their respective operations. In response to the downturn in the economy, recent market volatility and lack of liquidity in the credit markets, new legislation has been introduced and passed and it is likely that there will be significant changes to the banking regulatory regime in the future. Such additional legislation and regulations could significantly affect the Company’s powers, authority and operations, or the powers, authority and operations of MetroBank or Metro United, which could have a material adverse effect on the Company’s financial condition and results of operations. Further, regulators have significant discretion and power to prevent or remedy unsafe or unsound practices or violations of laws by banks and bank holding companies in the performance of their supervisory and enforcement duties. The exercise of this regulatory discretion and power may have a negative impact on the Company.
Risks Associated with the Company’s Common Stock
The Company’s corporate organizational documents and the provisions of Texas law to which it is subject may delay or prevent a change in control of the Company that you may favor.
The Company’s amended and restated articles of incorporation and amended and restated bylaws contain various provisions which may delay, discourage or prevent an attempted acquisition or change of control of the Company. These provisions include:
| • | a board of directors classified into three classes of directors with the directors of each class having staggered three year terms; |
| • | a provision that any special meeting of the Company’s shareholders may be called only by the chairman of the board, the president and chief executive officer, the majority of the board of directors or the holders of at least 50% of the Company’s shares entitled to vote at the meeting; |
| • | a provision establishing certain advance notice procedures for nomination of candidates for election as directors and for shareholder proposals to be considered at an annual or special meeting of shareholders; and |
| • | a provision that denies shareholders the right to amend the Company’s bylaws. |
The Company’s articles of incorporation provide for noncumulative voting for directors and authorize the Board of Directors to issue shares of its preferred stock without shareholder approval and upon such terms as the Board of Directors may determine. The issuance of the Company preferred stock, while providing desirable flexibility in connection with possible acquisitions, financings and other corporate purposes, could have the effect of making it more difficult for a third party to acquire, or of discouraging a third party from acquiring, a controlling interest in the Company. In addition, certain provisions of Texas law, including a provision which restricts certain business combinations between a Texas corporation and certain affiliated shareholders, may delay, discourage or prevent an attempted acquisition or change in control of the Company.
The trading volume in the Company Common Stock has been low.
Although the Company Common Stock is listed for trading on the NASDAQ Global Market, the trading volume in the Company Common Stock has been limited and is less than that of larger financial services companies. A public trading market having the desired characteristics of depth, liquidity and orderliness depends on the presence in the market place of willing buyers and sellers of the Company Common Stock at any given time. This presence depends on the individual decisions of investors and general economic and market conditions over which the Company has no control. Given the limited trading volume of the Company Common Stock,
26
Table of Contents
Index to Financial Statements
significant sales of its Common Stock, or the expectation of these sales, could cause the Company’s stock price to fall. As of December 31, 2009, the Company’s executive officers and directors owned approximately 24.2% of the Common Stock. The significant amount of Common Stock owned by the Company’s executive officers and directors may adversely affect the development of a more active trading market.
The Company has currently suspended the payment of dividends on its Common Stock. In addition, the Company’s future ability to pay dividends is subject to restrictions.
In April 2009, the Company suspended regular cash dividends on its Common Stock for an indefinite period of time. In the event that the Company decides to pay dividends, there are a number of restrictions on its ability to do so. Given the current financial and economic environment, the Federal Reserve Board has indicated that bank holding companies should carefully review their dividend policy in relation to the organization’s overall asset quality, level of current and prospective earnings and level, composition and quality of capital. The guidance provides that the Company inform and consult with the Federal Reserve Board prior to declaring and paying a dividend that exceeds earnings for the period for which the dividend is being paid or that could result in an adverse change to the Company’s capital structure, including dividends on the Series A Preferred Stock or interest on the subordinated debentures underlying the Company’s trust preferred securities.
The Company’s principal source of funds to pay dividends on its Common Stock will be cash dividends that it receives from the Banks. The payment of dividends by the Banks to the Company is subject to certain restrictions imposed by federal banking laws, regulations and authorities. The federal banking statutes prohibit federally insured banks from making any capital distributions (including a dividend payment) if, after making the distribution, the institution would be “under capitalized” as defined by statute. In addition, the relevant federal regulatory agencies have authority to prohibit an insured bank from engaging in an unsafe or unsound practice, as determined by the agency, in conducting an activity. The payment of dividends could be deemed to constitute such an unsafe or unsound practice, depending on the financial condition of the Banks. Regulatory authorities could impose administratively stricter limitations on the ability of the Banks to pay dividends to the Company if such limits were deemed appropriate to preserve certain capital adequacy requirements. Under applicable restrictions as of December 31, 2009, no dividends could be paid by MetroBank and Metro United to the Company without prior regulatory approval.
Future dividend payments and Common Stock repurchases are restricted by the terms of the U.S. Treasury’s equity investment in the Company.
Under the terms of the CPP, for so long as any preferred stock issued under the CPP remains outstanding, the Company is prohibited from increasing dividends on its Common Stock, and from making certain repurchases of equity securities, including its Common Stock, without the U.S. Treasury’s consent until the third anniversary of the U.S. Treasury’s investment or until the U.S. Treasury has transferred all of the preferred stock it purchased under the CPP to third parties. Further, as long as the preferred stock issued to the U.S. Treasury is outstanding, dividend payments and repurchases or redemptions relating to certain equity securities, including Company Common Stock, are prohibited until all accrued and unpaid dividends are paid on such preferred stock, subject to certain limited exceptions.
The holders of the Company’s Series A Preferred Stock may have the right to appoint two directors to the Company’s Board of Directors.
If the dividends on the Series A Preferred Stock have not been paid for an aggregate of six quarterly dividend periods or more (whether or not consecutive), the authorized number of directors then constituting the Company’s Board of Directors will be increased by two. Holders of the Series A Preferred Stock will be entitled to elect the two additional members of the Company’s Board of Directors at the next annual meeting (or at a special meeting called by the Company’s Board of Directors for the purpose of electing the preferred stock
27
Table of Contents
Index to Financial Statements
directors prior to the next annual meeting) and at each subsequent annual meeting until all accrued and unpaid dividends for all past dividend periods have been declared and paid.
The holders of the Company’s junior subordinated debentures have rights that are senior to those of the Company’s shareholders.
As of December 31, 2009, the Company had $36.1 million in junior subordinated debentures outstanding which were issued to the Company’s subsidiary trust, MCBI Statutory Trust I. The Trust purchased the junior subordinated debentures from the Company using the proceeds from the sale of trust preferred securities to third party investors and common securities to the Company. Payments of the principal and interest on the trust preferred securities are conditionally guaranteed by the Company to the extent not paid or made by the Trust, provided the Trust has funds available for such obligations.
The junior subordinated debentures are senior to the Company’s shares of Common Stock. As a result, the Company must make payments on the junior subordinated debentures (and the related trust preferred securities) before any dividends can be paid on its Common Stock and, in the event of the Company’s bankruptcy, dissolution or liquidation, the holders of the debentures must be satisfied before any distributions can be made to the holders of the Common Stock. The Company has the right to defer distributions on the junior subordinated debentures (and the related trust preferred securities) for up to five years, during which time no dividends may be paid to holders of the Company’s Common Stock. The Company’s ability to pay the future distributions depends upon the earnings of the Banks and dividends from the Banks to the Company, which may be inadequate to service the obligations.
| Item 1B. | Unresolved Staff Comments |
None.
| Item 2. | Properties |
The principal executive offices of the Company and MetroBank are located in leased space at 9600 Bellaire Boulevard, Suite 252, Houston, Texas. The principal executive offices of Metro United are located in the City of Industry branch, in leased space at 17870 Castleton Street, in City of Industry, California. The following table sets forth the Company’s locations by geographic area:
| Owned | Leased | Total | ||||
| Branches in Houston metropolitan area |
4 | 5 | 9 | |||
| Branches in Dallas metropolitan area |
— | 4 | 4 | |||
| Branch in San Diego, California |
— | 1 | 1 | |||
| Branches in Los Angeles metropolitan area(1) |
— | 2 | 2 | |||
| Branches in San Francisco metropolitan area(2) |
— | 2 | 2 | |||
| Branch in City of Industry, California |
— | 1 | 1 | |||
| Corporate headquarters in Houston, Texas |
— | 1 | 1 | |||
| Total |
4 | 16 | 20 | |||
| (1) | Los Angeles metropolitan area includes Irvine and Alhambra, California |
| (2) | San Francisco metropolitan area includes San Mateo, California |
The leases for the branches in Texas have expiration dates ranging from December 2010 to October 2014, excluding any renewal periods available at the Company’s option. The leases for branches in California have expiration dates ranging from August 2010 to January 2017. The leases covering the corporate headquarters have expiration dates ranging from December 2010 to May 2013.
28
Table of Contents
Index to Financial Statements
| Item 3. | Legal Proceedings |
The Company is involved in various legal proceedings that arise in the normal course of business. In the opinion of management of the Company, after consultation with its legal counsel, such legal proceedings are not expected to have a material adverse effect on the Company’s consolidated financial position, results of operations, or cash flows.
| Item 4. | [Reserved] |
29
Table of Contents
Index to Financial Statements
| Item 5. | Market for Registrant’s Common Equity, Related Shareholder Matters and Issuer Purchases of Equity Securities |
Common Stock Market Prices
The Company’s Common Stock is listed on the NASDAQ Global Market under the symbol “MCBI.” As of March 4, 2010, there were 11,021,315 shares outstanding and approximately 195 shareholders of record. The number of beneficial owners is unknown to the Company at this time.
The following table presents the high and low intra-day sales prices for the Company’s Common Stock reported by NASDAQ during the two years ended December 31, 2009:
| High | Low | |||||
| 2009 |
||||||
| Fourth quarter |
$ | 3.84 | $ | 2.78 | ||
| Third quarter |
4.46 | 3.01 | ||||
| Second quarter |
3.85 | 2.50 | ||||
| First quarter |
7.64 | 2.29 | ||||
| 2008 |
||||||
| Fourth quarter |
$ | 13.25 | $ | 6.46 | ||
| Third quarter |
13.49 | 9.85 | ||||
| Second quarter |
13.37 | 11.46 | ||||
| First quarter |
14.19 | 12.08 | ||||
Dividends
Holders of Common Stock are entitled to receive dividends when and if declared by the Company’s Board of Directors, out of funds legally available. In April 2009, the Company suspended regular cash dividends on its Common Stock for an indefinite period of time. The cash dividends paid per share by quarter for the Company’s last two fiscal years were as follows:
| 2009 | 2008 | |||||
| Fourth quarter |
$ | 0.00 | $ | 0.04 | ||
| Third quarter |
0.00 | 0.04 | ||||
| Second quarter |
0.00 | 0.04 | ||||
| First quarter |
0.04 | 0.04 | ||||
The principal source of cash revenues to the Company is dividends paid by the subsidiary banks with respect to the subsidiary banks’ capital stock. Future dividends on the Common Stock will depend upon the Company’s earnings and financial condition, liquidity and capital requirements, the general economic and regulatory climate, the Company’s ability to service any equity or debt obligations senior to the Common Stock and other factors deemed relevant by the Board of Directors of the Company.
As a holding company, the Company is ultimately dependent upon its subsidiaries to provide funding for its operating expenses, debt service and dividends. Various banking laws applicable to MetroBank and Metro United limit the payment of dividends and other distributions by the Banks to the Company, and may therefore limit the Company’s ability to pay dividends on its Common Stock. Regulatory authorities could impose administratively stricter limitations on the ability of the Banks to pay dividends to the Company if such limits were deemed appropriate to preserve certain capital adequacy requirements. Under applicable restrictions as of December 31, 2009, no dividends could be paid by MetroBank and Metro United to the Company without prior regulatory approval. Furthermore, the Federal Reserve Board has indicated that bank holding companies should
30
Table of Contents
Index to Financial Statements
carefully review their dividend policy in relation to the organization’s overall asset quality, level of current and prospective earnings and level, composition and quality of capital. The guidance provides that the Company inform and consult with the Federal Reserve Board prior to declaring and paying a dividend that exceeds earnings for the period for which the dividend is being paid or that could result in an adverse change to the Company’s capital structure, including dividends on the Series A Preferred Stock or interest on the subordinated debentures underlying the Company’s trust preferred securities.
In addition, the terms of the Company’s junior subordinated debentures may limit the Company’s ability to pay dividends on its Common Stock. If required payments on the Company’s outstanding junior subordinated debentures held by its unconsolidated subsidiary trusts are not made or are deferred, the Company will be prohibited from paying dividends on its Common Stock. Beginning on January 16, 2009 and until (i) the third anniversary of the U.S. Treasury’s investment, (ii) the Company has redeemed the Series A Preferred Stock or (iii) the U.S. Treasury has transferred the Series A Preferred Stock to a third party, the consent of the U.S. Treasury will be required for the Company to increase dividends or make any distribution on the Common Stock. Also, as long as the Series A Preferred Stock is outstanding, dividend payments will be prohibited until all accrued and unpaid dividends are paid on the Series A Preferred Stock, subject to certain limited exceptions.
Recent Sales of Unregistered Securities
None.
Purchases of Equity Securities by the Issuer and Affiliated Purchases
None.
Securities Authorized for Issuance Under Equity Compensation Plans
The Company currently has stock options outstanding pursuant to two equity compensation plans, which were approved by the Company’s shareholders. The following table provides information as of December 31, 2009 regarding the Company’s equity compensation plan under which the Company’s equity securities are authorized for issuance:
EQUITY COMPENSATION PLAN INFORMATION
| Plan category |
(a) | (b) | (c) | ||||
| Number of Securities to be Issued Upon Exercise of Outstanding Options, Warrants and Rights |
Weighted Average Exercise Price of Outstanding Options, Warrants and Rights |
Number of Securities Remaining Available for Future Issuance Under Equity Compensation Plans (excluding securities reflected in column (a)) | |||||
| Equity compensation plans approved by security holders |
1,050,950 | $ | 13.83 | 319,196 | |||
| Equity compensation plans not approved by security holders |
— | — | — | ||||
| Total |
1,050,950 | $ | 13.83 | 319,196 | |||
31
Table of Contents
Index to Financial Statements
Performance Graph
The following Stock Performance Graph compares the cumulative total shareholder return on the Company’s Common Stock for the period from December 31, 2004 to December 31, 2009, with the cumulative total return of the NASDAQ Stock Market (US) Index (“NASDAQ Composite”), and the SNL $1 Billion to $5 Billion Bank Asset-Size Index (“SNL Bank $1B-$5B Index”) for the same period. Dividend reinvestment has been assumed. The Stock Performance Graph assumes $100 invested on December 31, 2004 in the Company’s Common Stock, the NASDAQ Composite and the SNL $1B-$5B Index. The historical stock price performance for the Company’s Common Stock shown on the graph below is not necessarily indicative of future stock performance.
Composite of Cumulative Total Return
MetroCorp Bancshares, Inc.,
The NASDAQ Stock Market (US) Index,
and the SNL $1 Billion to $5 Billion Bank Asset-Size Index
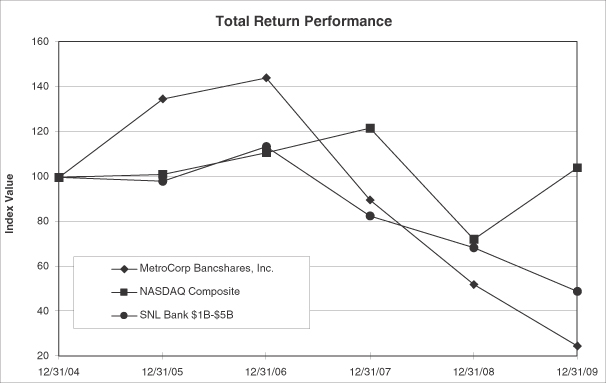
| Index |
Period Ending | |||||||||||
| 12/31/04 | 12/31/05 | 12/31/06 | 12/31/07 | 12/31/08 | 12/31/09 | |||||||
| MetroCorp Bancshares, Inc. |
100.00 | 134.97 | 144.33 | 89.99 | 52.35 | 24.94 | ||||||
| NASDAQ Composite |
100.00 | 101.37 | 111.03 | 121.92 | 72.49 | 104.31 | ||||||
| SNL Bank $1B-$5B |
100.00 | 98.29 | 113.74 | 82.85 | 68.72 | 49.26 | ||||||
| Source: | SNL Financial LC, Charlottesville, VA |
©2009
32
Table of Contents
Index to Financial Statements
| Item 6. | Selected Financial Data |
The following Selected Financial Data of the Company should be read in conjunction with the consolidated financial statements of the Company, and the accompanying notes, appearing elsewhere in this Annual Report on Form 10-K, and the information contained in “Item 7, Management’s Discussion and Analysis of Financial Condition and Results of Operations.” The following data has been derived from audited financial statements, including those included in this Annual Report on Form 10-K.
| Years Ended December 31, | ||||||||||||||||||||
| 2009 | 2008 | 2007 | 2006 | 2005 | ||||||||||||||||
| (Dollars in thousands, except per share data) | ||||||||||||||||||||
| Income Statement Data: |
||||||||||||||||||||
| Interest income |
$ | 86,334 | $ | 97,030 | $ | 102,298 | $ | 86,678 | $ | 59,104 | ||||||||||
| Interest expense |
31,041 | 40,731 | 45,392 | 33,498 | 17,538 | |||||||||||||||
| Net interest income |
55,293 | 56,299 | 56,906 | 53,180 | 41,566 | |||||||||||||||
| Provision for loan losses |
25,713 | 16,649 | 3,145 | 612 | 1,936 | |||||||||||||||
| Net interest income after provision for loan losses |
29,580 | 39,650 | 53,761 | 52,568 | 39,630 | |||||||||||||||
| Noninterest income |
8,169 | 6,465 | 8,288 | 7,924 | 8,061 | |||||||||||||||
| Noninterest expense |
47,808 | 43,075 | 42,935 | 39,467 | 31,852 | |||||||||||||||
| Income (loss) before provision for income taxes |
(10,059 | ) | 3,040 | 19,114 | 21,025 | 15,839 | ||||||||||||||
| Provision (benefit) for income taxes |
(2,987 | ) | 1,205 | 6,939 | 7,521 | 5,059 | ||||||||||||||
| Net income (loss) |
(7,072 | ) | 1,835 | 12,175 | 13,504 | 10,780 | ||||||||||||||
| Dividends—preferred stock |
(2,157 | ) | — | — | — | — | ||||||||||||||
| Net (loss) available to common shareholders |
$ | (9,229 | ) | $ | 1,835 | $ | 12,175 | $ | 13,504 | $ | 10,780 | |||||||||
| Common Share Data(1): |
||||||||||||||||||||
| Earnings (loss) per share: |
||||||||||||||||||||
| Basic |
$ | (0.85 | ) | $ | 0.17 | $ | 1.11 | $ | 1.24 | $ | 1.00 | |||||||||
| Diluted |
(0.85 | ) | 0.17 | 1.10 | 1.22 | 0.98 | ||||||||||||||
| Book value |
10.14 | 11.00 | 10.74 | 9.72 | 8.53 | |||||||||||||||
| Cash dividends(2) |
0.04 | 0.16 | 0.16 | 0.16 | 0.16 | |||||||||||||||
| Dividend payout ratio |
(4.71 | )% | 94.55 | % | 14.35 | % | 12.91 | % | 16.08 | % | ||||||||||
| Weighted average shares outstanding (in thousands): |
||||||||||||||||||||
| Basic |
10,904 | 10,833 | 10,935 | 10,906 | 10,812 | |||||||||||||||
| Diluted |
10,904 | 10,897 | 11,110 | 11,112 | 10,959 | |||||||||||||||
| Balance Sheet Data (Period End): |
||||||||||||||||||||
| Total assets |
$ | 1,589,548 | $ | 1,580,238 | $ | 1,459,706 | $ | 1,268,434 | $ | 1,128,204 | ||||||||||
| Securities |
102,412 | 102,104 | 137,749 | 181,544 | 236,100 | |||||||||||||||
| Total loans |
1,273,997 | 1,346,048 | 1,201,911 | 886,556 | 771,473 | |||||||||||||||
| Allowance for loan losses |
29,403 | 24,235 | 13,125 | 11,436 | 13,169 | |||||||||||||||
| Goodwill and core deposit intangibles |
19,656 | 22,333 | 22,583 | 22,930 | 23,035 | |||||||||||||||
| Total deposits |
1,364,167 | 1,269,153 | 1,191,043 | 1,081,664 | 961,750 | |||||||||||||||
| Junior subordinated debentures |
36,083 | 36,083 | 36,083 | 36,083 | 36,083 | |||||||||||||||
| Other borrowings |
25,513 | 139,046 | 99,796 | 26,316 | 26,054 | |||||||||||||||
| Total shareholders’ equity |
155,306 | 119,159 | 117,410 | 105,948 | 92,228 | |||||||||||||||
| Balance Sheet Data (Average): |
||||||||||||||||||||
| Total assets |
$ | 1,614,541 | $ | 1,546,611 | $ | 1,358,422 | $ | 1,191,239 | $ | 963,952 | ||||||||||
| Securities |
108,669 | 119,233 | 164,829 | 207,371 | 254,505 | |||||||||||||||
| Total loans(3) |
1,319,770 | 1,294,744 | 1,059,654 | 819,103 | 640,703 | |||||||||||||||
| Allowance for loan losses |
25,013 | 15,457 | 12,599 | 13,031 | 11,567 | |||||||||||||||
| Goodwill and core deposit intangibles |
22,238 | 22,465 | 22,768 | 22,911 | 5,580 | |||||||||||||||
| Total deposits |
1,364,538 | 1,229,246 | 1,164,903 | 1,012,887 | 813,457 | |||||||||||||||
| Junior subordinated debentures |
36,083 | 36,083 | 36,083 | 36,083 | 8,897 | |||||||||||||||
| Other borrowings |
36,558 | 139,993 | 26,403 | 25,949 | 42,877 | |||||||||||||||
| Total shareholders’ equity |
163,131 | 122,602 | 113,001 | 99,104 | 89,271 | |||||||||||||||
| Performance Ratios: |
||||||||||||||||||||
| Return on average assets |
(0.44 | )% | 0.12 | % | 0.90 | % | 1.13 | % | 1.12 | % | ||||||||||
| Return on average equity |
(4.34 | ) | 1.50 | 10.77 | 13.63 | 12.08 | ||||||||||||||
| Net interest margin |
3.65 | 3.87 | 4.47 | 4.76 | 4.52 | |||||||||||||||
| Efficiency ratio(4) |
70.61 | 66.55 | 65.86 | 64.60 | 64.18 | |||||||||||||||
33
Table of Contents
Index to Financial Statements
| Years Ended December 31, | |||||||||||||||
| 2009 | 2008 | 2007 | 2006 | 2005 | |||||||||||
| (Dollars in thousands, except per share data) | |||||||||||||||
| Asset Quality Ratios: |
|||||||||||||||
| Total nonperforming assets to total loans and other real estate |
7.94 | % | 4.27 | % | 0.76 | % | 1.37 | % | 2.52 | % | |||||
| Total nonperforming assets to total assets |
6.47 | 3.65 | 0.62 | 0.96 | 1.73 | ||||||||||
| Net charge-offs to average total loans |
1.56 | 0.43 | 0.14 | 0.29 | 0.25 | ||||||||||
| Allowance for loan losses to total loans |
2.31 | 1.80 | 1.09 | 1.29 | 1.71 | ||||||||||
| Allowance for loan losses to net nonperforming loans(5) |
37.49 | 47.54 | 247.13 | 173.64 | 84.21 | ||||||||||
| Capital Ratios: |
|||||||||||||||
| Leverage ratio(6) |
10.76 | % | 8.54 | % | 9.50 | % | 9.70 | % | 9.96 | % | |||||
| Average shareholders’ equity to average total assets |
10.10 | 7.93 | 8.32 | 8.32 | 9.26 | ||||||||||
| Tier 1 risk-based capital ratio—period end |
12.54 | 8.75 | 9.20 | 11.19 | 11.18 | ||||||||||
| Total risk-based capital ratio—period end |
13.80 | 10.17 | 10.44 | 13.15 | 13.73 | ||||||||||
| (1) | Per share data for all periods prior to September 1, 2006 has been restated to give effect to the 3-for-2 stock split effective on such date. |
| (2) | The amount for 2009 represents dividends paid on the Common Stock for the first quarter of 2009. In April 2009, the Company suspended regular cash dividends on the Common Stock for an indefinite period of time. |
| (3) | Includes loans held-for-sale with an average balance of $621,000 for the year ended December 31, 2005. |
| (4) | Calculated by dividing total noninterest expense, excluding loan loss provisions and goodwill impairment, by net interest income plus noninterest income, excluding impairment on securities. |
| (5) | Net nonperforming loans consist of nonaccrual loans, loans contractually past due 90 days or more and troubled debt restructurings, net of guaranteed portion. |
| (6) | The leverage ratio is calculated by dividing Tier 1 capital by average assets for the year. |
34
Table of Contents
Index to Financial Statements
| Item 7. | Management’s Discussion and Analysis of Financial Condition and Results of Operations |
Special Cautionary Notice Regarding Forward-Looking Statements
Statements and financial discussion and analysis contained in this Annual Report on Form 10-K and documents incorporated herein by reference that are not historical statements of fact constitute forward-looking statements made pursuant to the safe harbor provisions of the Private Securities Litigation Reform Act of 1995. These forward-looking statements describe the Company’s future plans, strategies and expectations, are based on assumptions and involve a number of risks and uncertainties, many of which are beyond the Company’s control. In addition to the factors discussed in Item 1A “Risk Factors” of this Annual Report on Form 10-K, the important factors that could cause actual results to differ materially from the results, performance or achievements expressed or implied by the forward-looking statements include, without limitation:
| • | changes in the strength of the United States economy in general and the strength of the local economies in which the Company conducts operations resulting in, among other things, a deterioration in credit quality or a reduced demand for credit, including the resultant effect on the Company’s loan portfolio and allowance for loan losses; |
| • | changes in interest rates and market prices, which could reduce the Company’s net interest margins, asset valuations and expense expectations; |
| • | changes in the levels of loan prepayments and the resulting effects on the value of the Company’s loan portfolio; |
| • | changes in local economic and business conditions which adversely affect the ability of the Company’s customers to transact profitable business with the Company, including the ability of borrowers to repay their loans according to their terms or a change in the value of the related collateral; |
| • | increased competition for deposits and loans adversely affecting rates and terms; |
| • | the concentration of the Company’s loan portfolio in loans collateralized by real estate; |
| • | the Company’s ability to raise additional capital; |
| • | the effect of compliance, or failure to comply within stated deadlines, of the provisions of the formal agreement with the OCC; |
| • | the Company’s ability to identify suitable acquisition candidates; |
| • | the timing, impact and other uncertainties of the Company’s ability to enter new markets successfully and capitalize on growth opportunities; |
| • | increased credit risk in the Company’s assets and increased operating risk caused by a material change in commercial, consumer and/or real estate loans as a percentage of the total loan portfolio; |
| • | the failure of assumptions underlying the establishment of and provisions made to the allowance for loan losses; |
| • | increases in the level of nonperforming assets; |
| • | the incurrence and possible impairment of goodwill associated with an acquisition and possible adverse short-term effects on the results of operation; |
| • | changes in the availability of funds resulting in increased costs or reduced liquidity; |
| • | a deterioration or downgrade in the credit quality and credit agency ratings of the securities in the Company’s securities portfolio; |
| • | increased asset levels and changes in the composition of assets and the resulting impact on our capital levels and regulatory capital ratios; |
| • | the Company’s ability to acquire, operate and maintain cost effective and efficient systems without incurring unexpectedly difficult or expensive but necessary technological changes; |
35
Table of Contents
Index to Financial Statements
| • | increases in FDIC deposit insurance assessments; |
| • | government intervention in the U.S. financial system; |
| • | the loss of senior management or operating personnel and the potential inability to hire qualified personnel at reasonable compensation levels; and |
| • | changes in statutes and government regulations or their interpretations applicable to bank holding companies and our present and future banking and other subsidiaries, including changes in tax requirements and tax rates. |
All written or oral forward-looking statements attributable to the Company are expressly qualified in their entirety by these cautionary statements. Forward-looking statements speak only as of the date on which such statements are made. The Company undertakes no obligation to publicly update or otherwise revise any forward-looking statements, whether as a result of new information, future events or otherwise.
Management’s Discussion and Analysis of Financial Condition and Results of Operations of the Company analyzes the major elements of the Company’s balance sheets and statements of income. This section should be read in conjunction with the Company’s consolidated financial statements and accompanying notes and other detailed information appearing elsewhere in this Annual Report on Form 10-K.
Critical Accounting Estimates
The Company has established various accounting policies which govern the application of accounting principles generally accepted in the United States in the preparation of the Company’s consolidated financial statements. Certain accounting policies involve significant judgments and assumptions by management which have a material impact on the carrying value of certain assets and liabilities; management considers such accounting policies to be critical accounting policies. The judgments and assumptions used by management are based on historical experience and other factors, and are believed to be reasonable under the circumstances. Because of the nature of the judgments and assumptions made by management, actual results could differ from these judgments and estimates which could have a material impact on the carrying values of assets and liabilities and the results of operations of the Company.
Allowance for loan losses. The Company believes the allowance for loan losses is a critical accounting estimate that requires the most significant judgments and estimates used in the preparation of its consolidated financial statements. The allowance for loan losses is increased by provisions charged against current earnings and is reduced by net charge-offs. Loans are charged off when they are deemed to be uncollectible in whole or in part. Recoveries are recorded when cash payments are received. In developing the assessment, the Company relies on estimates and exercises judgment regarding matters where the ultimate outcome is uncertain. Circumstances may change and future assessments of credit risk may yield materially different results, resulting in an increase or decrease in the allowance for credit losses.
The allowance for credit losses consists of the allowance for loan losses and the reserve for unfunded lending commitments and is maintained at levels that the Company believes are adequate to absorb probable losses inherent in the loan portfolio and unfunded lending commitments as of the date of the financial statements. The Company employs a systematic methodology for determining the allowance for credit losses that consists of four components: (i) a formula-based general reserve based on historical average losses by loan grade and grade migration, (ii) specific reserves on larger individual impaired credits that are based on the difference between the current loan balance and the loan’s collateral value, observable market price, or discounted present value, (iii) a qualitative component that reflects current market conditions and other factors precedent to losses different from historical averages, and (iv) a reserve for unfunded lending commitments.
In estimating the allowance for loan losses, management reviews the effect of changes in the local real estate market on collateral values, the effect of current economic indicators on the loan portfolio and their
36
Table of Contents
Index to Financial Statements
probable impact on borrowers and increases or decreases in nonperforming and impaired loans. Changes in these factors may cause management’s estimate of the allowance to increase or decrease and result in adjustments to the Company’s provision for loan losses. See—“Financial Condition—Allowance for Loan Losses and the Reserve for Unfunded Lending Commitments.”
Goodwill. The Company believes goodwill is a critical accounting estimate that requires significant judgment and estimates to be used in the preparation of its consolidated financial statements. The Company reviews goodwill for impairment on an annual basis, or more often, if events or circumstances indicate that it is more likely than not that the fair value of Metro United, the Company’s only reporting unit with assigned goodwill, is below the carrying value of its equity. The Company’s annual evaluation is performed as of August 31 of each year.
In determining the fair value of Metro United, the Company uses both the income approach and market approach for the step one evaluation.
The income approach was based on projected cash flow derived from balance sheet and income statement activities discounted to estimate the value of Metro United. Financial forecasts were developed by projecting net income for the next five years and discounting the average terminal values based on the valuation multiples observed in a normalized market. The financial forecasts considered several key business drivers such as anticipated loan and deposit growth, forward interest rates, historical performance, and industry and economic trends, among other considerations. The Company used an average asset growth rate of 2.5% for the 5-year period and discounted Metro United’s terminal value using a 10% rate of return. The Company also performed a sensitivity analysis utilizing additional discount rates ranging from 8% to 15%.
The market approach uses guideline bank transactions selected from a similar geographic footprint as Metro United or having a similar market focus, based on publicly available information. Valuation multiples such as price-to-book, price-to-tangible book, price-to-deposits, and price-to-earnings from the guideline transactions are compared with Metro United’s operating results to derive the fair value as of the valuation date.
The Company also considered the fair value of Metro United in relationship to the Company’s stock price and performed a reconciliation to the market price. This reconciliation was performed by first using the Company’s market price on a minority basis with an estimated control premium of 30%. The Company then allocated the total fair value to both of its segments, MetroBank and Metro United. The allocation was based upon an average of the following internal ratios:
| • | Metro United’s assets as a percentage of total assets |
| • | Metro United’s loans as a percentage of total loans |
| • | Metro United’s deposits as a percentage of total deposits |
| • | Metro United’s shareholder’s equity as a percentage of total shareholders’ equity |
The derived fair value of Metro United is compared to the carrying value of its equity. If the carrying value of its equity exceeds the fair value, then step one of the impairment test fails, and the second step of the goodwill impairment evaluation is performed which involves calculating the implied fair value of Metro United’s goodwill.
The implied fair value of goodwill is determined in the same manner as goodwill is recognized in a business combination. The fair value of Metro United’s assets and liabilities, including previously unrecognized intangible assets, is individually determined. Significant judgment and estimates are involved in estimating the fair value of the assets and liabilities of Metro United. The value of the implied goodwill is highly sensitive to the estimated fair value of Metro United’s net assets. The fair value of Metro United in excess of the fair value of its net assets is the implied goodwill. The fair value of Metro United’s net assets is estimated using recent data observed in the market, including similar assets and liabilities.
37
Table of Contents
Index to Financial Statements
Observable market information is utilized to the extent available and relevant. The estimated fair values reflect management’s assumptions regarding how a market participant would value the net assets and includes appropriate credit, liquidity, and market risk adjustments that are indicative of the current environment. The valuation of the loan portfolio resulted in an overall discount consistent with the “exit price” principle of fair value. The estimated liquidity and market risk adjustments on certain loan categories ranged from 20% to 50% due to the distressed nature of the market in California. The size of the implied goodwill was significantly affected by the estimated fair value of the loans pertaining to Metro United. The significant market risk adjustment that is a consequence of the current distressed market conditions was a significant contributor to the valuation discounts associated with these loans.
If the implied fair value of the goodwill for Metro United exceeds its carrying value of the goodwill, no goodwill impairment is recorded. Changes in the estimated fair value of the individual assets and liabilities may result in a different amount of implied goodwill, and ultimately the amount of goodwill impairment, if any. Sensitivity analysis is performed to assess the potential ranges of implied goodwill.
The Company performed the evaluation detailed above as of December 31, 2008, and as a result of declining stock price the Company performed the evaluation at each of the subsequent interim quarters, including the annual evaluation as of August 31, 2009. On all of the quarterly evaluations, including the annual evaluation at August 31, 2009, the step one impairment test failed, but passed the second step of the impairment test as of the test dates.
During the fourth quarter of 2009, the Company’s stock continued to trade below book value and declined further. The Company performed an evaluation of goodwill as of December 31, 2009 and impaired goodwill by $2.5 million. Due to the staleness of the guideline bank transactions multiples and fluctuations in market capitalization of peer banks used in the market approach, management reduced the weight of the market approach and relied primarily on the income approach for the step one evaluation. The step one impairment test failed, and the Company performed the step two impairment test to derive the implied fair value of goodwill. As a result of the evaluation, the implied fair value of goodwill was less than the carrying value of goodwill by $2.5 million and impairment was recorded in the fourth quarter of 2009. The charge is a noncash adjustment to the Company’s financial statements. As goodwill and other intangible assets are not included in the calculation of regulatory capital, the Company’s well capitalized regulatory ratios are not affected. Subsequent reversal of goodwill impairment is prohibited.
It is possible that future changes in the fair value of Metro United’s net assets could result in additional future goodwill impairment. For example, to the extent that market liquidity returns and the fair value of the individual assets of Metro United increases at a faster rate than the fair value of Metro United as a whole, that may cause the implied goodwill to be lower than the carrying value of goodwill, resulting in further goodwill impairment. Ultimately, future potential changes in valuation assumptions may impact the estimated fair value of Metro United and cause its fair value to be below its carrying value, therefore resulting in an impairment of the goodwill. Subsequent to year end 2009, fluctuations in the stock price may require reassessment of goodwill in the quarters of 2010.
Impairment of investment securities. Investments classified as available-for-sale are carried at fair value and the impact of changes in fair value are recorded on the consolidated balance sheet as an unrealized gain or loss in accumulated other comprehensive income (loss), a separate component of shareholders’ equity. Securities classified as available-for-sale or held-to-maturity are subject to review to identify when a decline in value is other-than-temporary. Factors considered in determining whether a decline in value is other-than-temporary include: the extent and the duration of the decline; the reasons for the decline in value (credit event, and interest-rate related including general credit spread widening); the financial condition of and near-term prospects of the issuer, and the Company’s intent to sell and whether or not it is more likely than not that the Company would be required to sell the security before the anticipated recovery of its amortized cost basis. When it is determined that an other-than-temporary impairment exists and the Company does not intend to sell the security or if it not more
38
Table of Contents
Index to Financial Statements
likely than not that the Company will be required to sell the security before recovery of its amortized cost basis, the impairment is separated into the amount that is credit-related and the amount due to all other factors. The credit-related impairment is recognized in earnings.
For debt securities, determining credit-related impairment is driven principally by assumptions regarding the amount and timing of projected cash flows. For mortgage-backed and asset-backed securities, cash flow estimates are determined based on prepayment assumptions, default rates and loss severity rates derived from widely accepted third-party data sources. The Company has developed these estimates using information based on historical experience as well as using market observable data, such as industry analyst reports and forecasts, sector credit ratings and other data relevant to the collectability of a security. See Note 3 “Securities” for additional discussion on other-than-temporary impairment.
Stock-based compensation. The Company believes stock-based compensation is a critical accounting estimate that requires significant judgment and estimates used in the preparation of its consolidated financial statements. The Company accounts for stock-based compensation in accordance with generally accepted accounting principles. The Company uses the Black-Scholes option-pricing model which requires the input of highly subjective assumptions. These assumptions include estimating the length of time employees will retain their vested stock options before exercising them (“expected term”), the estimated volatility of the Company’s Common Stock price over the expected term and the number of options that will ultimately not complete their vesting requirements (“forfeitures”). Changes in the subjective assumptions can materially affect the estimate of fair value of stock-based compensation and consequently, the related amount recognized on the consolidated statements of income.
Fair Value. The Company believes that the determination of fair value is a critical accounting estimate that requires significant judgment used in the preparation of its consolidated financial statements. Certain portions of the Company’s assets are reported on a fair value basis. Fair value is used on a recurring basis for certain assets in which fair value is the primary basis of accounting. An example of this recurring use of fair value includes available-for-sale securities. Additionally, fair value is used on a non-recurring basis to evaluate assets for impairment or for disclosure purposes. Examples of these non-recurring uses of fair value include goodwill and intangible assets. Depending on the nature of the asset various valuation techniques and assumptions are used when estimating fair value.
Fair value is the price that could be received to sell an asset or paid to transfer a liability in an orderly transaction between market participants. Fair value determination requires that a number of significant judgments are made. First, where prices for identical assets and liabilities are not available, application of the three-level hierarchy would require that similar assets are identified. If observable market prices are unavailable or impracticable to obtain, then fair value is estimated using modeling techniques such as discounted cash flow analyses. These modeling techniques incorporate the Company’s assessments regarding assumptions that market participants would use in pricing the asset or the liability, including assumptions about the risks inherent in a particular valuation technique, the effect of a restriction on the sale or use of an asset, and the risk of nonperformance. Assessments with respect to assumptions that market participants would make are inherently difficult to determine and use of different assumptions could result in material changes to these fair value measurements. The use of significant, unobservable inputs would be described in Note 19 “Fair Value” to the consolidated financial statements.
In estimating the fair values for investment securities the Company believes that independent, third-party market prices are the best evidence of exit price and where available, estimates are based on such prices. If such third-party market prices are not available on the exact securities owned, fair values are based on the market prices of similar instruments, independent pricing service estimates or are estimated using industry-standard or proprietary models whose inputs may be unobservable. When market observable data is not available, the valuation of financial instruments becomes more subjective and involves substantial judgment. The need to use unobservable inputs generally results from the lack of market liquidity for certain types of loans and securities, which results in diminished observability of both actual trades and assumptions that would otherwise be available to value these instruments.
39
Table of Contents
Index to Financial Statements
For the Years Ended December 31, 2009, 2008 and 2007
Overview
The Company, primarily through the Banks, generates earnings from several sources. The Banks attract customer deposits through their nineteen branches located in the greater Houston, Dallas, San Diego, Los Angeles, and San Francisco metropolitan areas. The types of deposits vary from noninterest-bearing demand deposit transaction accounts to interest-bearing NOW and money market transaction accounts, savings accounts, and various termed time deposits such as certificates of deposit (“CD’s”) and individual retirement accounts (“IRA’s”). With the funds attracted from the communities surrounding the branches, the Banks originate loans to individuals and small businesses to finance business operations, purchases of real estate, or other business opportunities. The Company’s net interest income represents the difference between the interest income earned on interest-earning assets, including loans and securities, and the interest expense paid on interest-bearing liabilities, including customer deposits and other borrowed funds. Interest rate fluctuations, as well as changes in the amount and type of earning assets and liabilities, combine to affect net interest income. This represents the primary source of income generated by the Company during each fiscal year and can be found on the Statement of Operations under “net interest income.”
To complement net interest income, the Company also earns fee income from both deposits and loans through service fees and charges collected from customers, and fee income from letters of credit commissions through its international banking business. Generally, the Company receives the greater portion of its fees from its deposit customers in the form of service fees, NSF fees, and other fees for services provided to the customer. Loan related fees are generally earned from administrative document and processing fees, and other loan-related type fees. The fees collected by the Company may be found on the Statement of Income under “noninterest income.” Offsetting these earnings are operating expenses referred to as “noninterest expense” and provisions for loan losses. Because banking is a very people intensive industry, the largest of the Company’s operating expenses is salaries and employee benefits.
The 2009 year was challenging for the financial and banking industry. With the credit crisis spreading across the United States, many businesses were affected including those in the two major markets that the Company was serving, Texas and California. The deterioration of real estate values had severely affected the overall commercial real estate market. As a result, the Company recorded a net loss of $7.1 million for the year ended December 31, 2009 due to a higher than normal level of provision for loan losses, charge-offs and foreclosure expenses. Loan growth was negatively affected, especially in commercial real estate loans, construction and land development loans, and commercial and industrial loans. The overall financial performance for 2009 was also affected by the significant increase in FDIC assessments and the impairment of goodwill.
The following is a summary of 2009 performance:
Total assets at December 31, 2009 were $1.59 billion, an increase of $9.3 million or 0.6% compared with $1.58 billion at December 31, 2008. Total loans at December 31, 2009 were $1.27 billion, a decrease of $72.1 million or 5.4% compared with $1.35 billion at December 31, 2008. Total investment securities available-for-sale and held-to-maturity at December 31, 2009 were $102.4 million, an increase of $308,000 or 0.3% from $102.1 million at December 31, 2008. Total deposits at December 31, 2009 were $1.36 billion, an increase of $95.0 million or 7.5% compared with $1.27 billion at December 31, 2008. Other borrowings at December 31, 2009 were $25.5 million, down $113.5 million or 81.7% compared with $139.0 million at December 31, 2008. Junior subordinated debentures were $36.1 million at both December 31, 2009 and 2008. (Total risk-based capital for 2009 increased to 13.80% compared with 10.17% for 2008, and 10.44% for 2007, primarily as a result of the Company’s participation in the CPP.)
Net loss for the year ended December 31, 2009 was $7.1 million, and for the years ended December 31, 2008, and 2007, net income was $1.8 million and $12.2 million, respectively. Diluted loss per share for the year ended December 31, 2009, which included the effect of preferred stock, was ($0.85), and for the years ended
40
Table of Contents
Index to Financial Statements
December 31, 2008, and 2007, when there was no preferred stock, diluted earnings per share were $0.17, and $1.10, respectively. The Company’s returns on average assets for the years ended December 31, 2009, 2008, and 2007 were (0.44)%, 0.12%, and 0.90%, respectively. The Company’s returns on average equity for the same periods were (4.34)%, 1.50%, and 10.77%, respectively. The 2009 decreases in net income, diluted earnings per share, return on average assets, and return on average equity were primarily due to increases in the provision for loan losses, foreclosure expenses, net charge-offs, FDIC assessments, and impairment of goodwill, all of which were the primary result of the deteriorating general economic conditions and downturn in the real estate market.
The provision for loan losses was $25.7 million for the year ended December 31, 2009, up $9.1 million or 54.4% compared with $16.6 million in 2008. The increase was primarily due to an increase in nonperforming assets and higher net charge-offs, the majority of which were related to loans in Texas. The provision for loan losses was $16.6 million for the year ended December 31, 2008, up $13.5 million or 429.4% compared with $3.1 million in 2007. The increase was primarily due to concerns of deteriorating economic conditions in both Texas and California, primarily in the residential and commercial real estate markets.
Results of Operations
Net Interest Income
Net interest income represents the amount by which interest income on interest-earning assets, including securities and loans, exceeds interest expense incurred on interest-bearing liabilities, including deposits and other borrowed funds.
2009 versus 2008. Net interest income, before provision for loan losses, in 2009 was $55.3 million compared with $56.3 million in 2008, a decrease of $1.0 million or 1.8%, primarily due to lower loan yields as a result of interest rate cuts in 2008 and an increase in nonperforming assets. Interest rate cuts by the Federal Reserve throughout 2008 resulted in a decrease in yields and costs for the year ended December 31, 2009, compared with the same period in 2008. The decrease of $10.7 million in interest income was partially offset by a $9.7 million decrease in interest expense. The net interest spread, which is the difference between the yield on earning assets and the cost of interest-bearing liabilities, decreased 9 basis points from 3.26% in 2008 to 3.17% in 2009. The decrease in the net interest spread is the result of a 97 basis point decrease in the average yield on earning assets that was partially offset by an 88 basis point decrease in the average cost of interest-bearing liabilities. The net interest margin is the difference between the yield on earning assets and the cost of earning assets. The cost of earning assets is calculated as annualized interest expense divided by average earning assets. The net interest margin decreased 22 basis points from 3.87% in 2008 to 3.65% in 2009. The decrease reflects the 97 basis point decline in the yield on average earning assets, partially offset by a decrease in the average cost of earning assets of 75 basis points.
Interest income in 2009 was $86.3 million, down $10.7 million or 11.0% compared with $97.0 million in 2008. The decrease was primarily due to lower loan yields and increased nonperforming assets. However, the effect of the decrease in loan yields was partially offset by rate floors set on certain variable rate loans, substantially all of which had reached the applicable floor rate as of December 31, 2009. Interest expense in 2009 was $31.0 million, down $9.7 million or 23.8% compared with $40.7 million in 2008. The average cost of interest-bearing liabilities decreased 88 basis points primarily due to lower interest rates paid on interest-bearing deposits, and due to a decreased volume of average other borrowings. Average other borrowings decreased primarily due to liquidity provided by deposit growth and the $45.0 million of funds received in January from participation in the CPP.
At December 31, 2009, approximately $867.7 million or 68.0% of the loans in the loan portfolio were variable rate loans that periodically reprice and are sensitive to changes in market interest rates. At December 31, 2009, the average yield on total loans was approximately 292 basis points above the average prime rate. To lessen interest rate sensitivity in the event of a falling interest rate environment, the Company originates variable
41
Table of Contents
Index to Financial Statements
rate loans with interest rate floors. At December 31, 2009, approximately $719.3 million in loans or 56.4% of the total loan portfolio were variable rate loans with interest rate floors that carried a weighted average interest rate of 6.33%.
2008 versus 2007. Net interest income, before provision for loan losses, in 2008 was $56.3 million compared with $56.9 million in 2007, a decrease of $607,000 or 1.1%, primarily due to lower loan yields partially offset by increased loan volume and lower deposit and borrowing cost. Interest rate cuts by the Federal Reserve since December 31, 2007, which caused the prime rate to decrease by 4% to 3.25%, resulted in a decrease in yields and costs for the year ended December 31, 2008, compared with the same period in 2007. The decrease of $5.3 million in interest income was partially offset by a $4.7 million decrease in interest expense. The net interest spread, which is the difference between the yield on earning assets and the cost of interest- bearing liabilities, decreased 33 basis points from 3.59% in 2007 to 3.26% in 2008. The decrease in the net interest spread is the result of a 136 basis point decrease in the average yield on earning assets that was partially offset by a 103 basis point decrease in the average cost of interest-bearing liabilities. The net interest margin is the difference between the yield on earning assets and the cost of earning assets. The cost of earning assets is calculated as annualized interest expense divided by average earning assets. The net interest margin decreased 60 basis points from 4.47% in 2007 to 3.87% in 2008. The decrease reflects the 136 basis point decline in the yield on average earning assets, partially offset by a decrease in the average cost of earning assets of 76 basis points.
Interest income in 2008 was $97.0 million, down $5.3 million or 5.1% compared with $102.3 million in 2007. The decrease, caused by Federal Reserve rate cuts, was offset by loan growth with average total loans increasing 22.2% from $1.06 billion at December 31, 2007 to $1.29 billion at December 31, 2008, while other earning assets declined. Interest expense in 2008 was $40.7 million, down $4.7 million or 10.3% compared with $45.4 million in 2007. The average cost of interest-bearing liabilities decreased 103 basis points primarily due to lower interest rates paid on interest-bearing deposits, partially offset by an increase in other borrowings cost due to growth in average borrowings. Average other borrowings increased as they were a lower cost funding alternative to interest-bearing deposits. At December 31, 2008, approximately $942.2 million or 69.8% of the loans in the loan portfolio were variable rate loans that periodically reprice and are sensitive to changes in market interest rates. At December 31, 2008, the average yield on total loans was approximately 191 basis points above the average prime rate. To lessen interest rate sensitivity in the event of a falling interest rate environment, the Company originates variable rate loans with interest rate floors. At December 31, 2008, approximately $718.4 million in loans or 53.2% of the total loan portfolio were variable rate loans with interest rate floors that carried a weighted average interest rate of 6.58%.
42
Table of Contents
Index to Financial Statements
The following table presents for the periods indicated the total dollar amount of interest income from average interest-earning assets and the resulting yields, as well as the interest expense on average interest-bearing liabilities, expressed both in dollars and rates. No tax-equivalent adjustments were made and all average balances are average daily balances. Nonaccrual loans have been included in the table as loans carrying a zero yield with income, if any, recognized at the end of the loan term.
| Year Ended December 31, | ||||||||||||||||||||||||||||||
| 2009 | 2008 | 2007 | ||||||||||||||||||||||||||||
| Average Outstanding Balance |
Interest Earned/ Paid |
Average Yield/ Rate |
Average Outstanding Balance |
Interest Earned/ Paid |
Average Yield/ Rate |
Average Outstanding Balance |
Interest Earned/ Paid |
Average Yield/ Rate |
||||||||||||||||||||||
| (Dollars in thousands) | ||||||||||||||||||||||||||||||
| Assets |
||||||||||||||||||||||||||||||
| Interest-earning assets: |
||||||||||||||||||||||||||||||
| Loans |
$ | 1,319,770 | $ | 81,366 | 6.17 | % | $ | 1,294,744 | $ | 90,715 | 7.01 | % | $ | 1,059,654 | $ | 92,556 | 8.73 | % | ||||||||||||
| Taxable securities |
102,051 | 3,971 | 3.89 | 114,527 | 5,006 | 4.37 | 158,590 | 6,909 | 4.36 | |||||||||||||||||||||
| Tax-exempt securities |
6,618 | 322 | 4.87 | 4,706 | 231 | 4.91 | 6,239 | 307 | 4.92 | |||||||||||||||||||||
| Other investments |
23,407 | 470 | 2.01 | 17,900 | 653 | 3.65 | 4,970 | 275 | 5.53 | |||||||||||||||||||||
| Federal funds sold and other short-term investments |
62,082 | 205 | 0.33 | 22,033 | 425 | 1.93 | 43,977 | 2,251 | 5.12 | |||||||||||||||||||||
| Total interest-earning assets |
1,513,928 | 86,334 | 5.70 | % | 1,453,910 | 97,030 | 6.67 | % | 1,273,430 | 102,298 | 8.03 | % | ||||||||||||||||||
| Less allowance for loan losses |
(25,013 | ) | (15,457 | ) | (12,599 | ) | ||||||||||||||||||||||||
| Total interest-earning assets, net of allowance for loan losses |
1,488,915 | 1,438,453 | 1,260,831 | |||||||||||||||||||||||||||
| Noninterest earning assets |
125,626 | 108,158 | 97,591 | |||||||||||||||||||||||||||
| Total assets |
$ | 1,614,541 | $ | 1,546,611 | $ | 1,358,422 | ||||||||||||||||||||||||
| Liabilities and shareholders’ equity |
||||||||||||||||||||||||||||||
| Interest-bearing liabilities: |
||||||||||||||||||||||||||||||
| Interest-bearing demand deposits |
$ | 54,774 | $ | 279 | 0.51 | % | $ | 58,680 | $ | 464 | 0.79 | % | $ | 64,252 | $ | 767 | 1.19 | % | ||||||||||||
| Saving and money market accounts |
409,874 | 7,602 | 1.85 | 302,113 | 8,189 | 2.71 | 245,765 | 9,200 | 3.74 | |||||||||||||||||||||
| Time deposits |
691,507 | 20,076 | 2.90 | 656,603 | 26,690 | 4.06 | 650,446 | 32,140 | 4.94 | |||||||||||||||||||||
| Junior subordinated debentures |
36,083 | 2,079 | 5.76 | 36,083 | 2,079 | 5.76 | 36,083 | 2,039 | 5.65 | |||||||||||||||||||||
| Other borrowings |
36,558 | 1,005 | 2.75 | 139,993 | 3,309 | 2.36 | 26,403 | 1,246 | 4.72 | |||||||||||||||||||||
| Total interest-bearing liabilities |
1,228,796 | 31,041 | 2.53 | % | 1,193,472 | 40,731 | 3.41 | % | 1,022,949 | 45,392 | 4.44 | % | ||||||||||||||||||
| Noninterest-bearing liabilities: |
||||||||||||||||||||||||||||||
| Noninterest-bearing demand deposits |
208,383 | 211,850 | 204,440 | |||||||||||||||||||||||||||
| Other liabilities |
14,231 | 18,687 | 18,032 | |||||||||||||||||||||||||||
| Total liabilities |
1,451,410 | 1,424,009 | 1,245,421 | |||||||||||||||||||||||||||
| Shareholders’ equity |
163,131 | 122,602 | 113,001 | |||||||||||||||||||||||||||
| Total liabilities and shareholders’ equity |
$ | 1,614,541 | $ | 1,546,611 | $ | 1,358,422 | ||||||||||||||||||||||||
| Net interest income |
$ | 55,293 | $ | 56,299 | $ | 56,906 | ||||||||||||||||||||||||
| Net interest spread |
3.17 | % | 3.26 | % | 3.59 | % | ||||||||||||||||||||||||
| Net interest margin |
3.65 | % | 3.87 | % | 4.47 | % | ||||||||||||||||||||||||
43
Table of Contents
Index to Financial Statements
The following table presents the dollar amount of changes in interest income and interest expense for the major components of interest-earning assets and interest-bearing liabilities and distinguishes between changes in outstanding balances and changes in interest rates. For purposes of this table, changes attributable to both rate and volume have been allocated to each accordingly.
| Years Ended December 31, | ||||||||||||||||||||||||
| 2009 vs 2008 | 2008 vs 2007 | |||||||||||||||||||||||
| Increase (Decrease) Due to |
Total | Increase (Decrease) Due to |
Total | |||||||||||||||||||||
| Volume | Rate | Volume | Rate | |||||||||||||||||||||
| (Dollars in thousands) | ||||||||||||||||||||||||
| Interest-earning assets: |
||||||||||||||||||||||||
| Loans |
$ | 1,753 | $ | (11,102 | ) | $ | (9,349 | ) | $ | 20,534 | $ | (22,375 | ) | $ | (1,841 | ) | ||||||||
| Taxable securities |
(545 | ) | (490 | ) | (1,035 | ) | (1,920 | ) | 17 | (1,903 | ) | |||||||||||||
| Tax-exempt securities |
94 | (3 | ) | 91 | (75 | ) | (1 | ) | (76 | ) | ||||||||||||||
| Other investments |
201 | (384 | ) | (183 | ) | 715 | (337 | ) | 378 | |||||||||||||||
| Federal funds sold and other temporary investments |
773 | (993 | ) | (220 | ) | (1,123 | ) | (703 | ) | (1,826 | ) | |||||||||||||
| Total increase (decrease) in interest income |
2,276 | (12,972 | ) | (10,696 | ) | 18,131 | (23,399 | ) | (5,268 | ) | ||||||||||||||
| Interest-bearing liabilities: |
||||||||||||||||||||||||
| Interest-bearing demand deposits |
(31 | ) | (154 | ) | (185 | ) | (67 | ) | (236 | ) | (303 | ) | ||||||||||||
| Saving and money market accounts |
2,921 | (3,508 | ) | (587 | ) | 2,109 | (3,120 | ) | (1,011 | ) | ||||||||||||||
| Time deposits |
1,419 | (8,033 | ) | (6,614 | ) | 304 | (5,754 | ) | (5,450 | ) | ||||||||||||||
| Junior subordinated debentures |
— | — | — | — | 40 | 40 | ||||||||||||||||||
| Other borrowings |
(2,445 | ) | 141 | (2,304 | ) | 5,360 | (3,297 | ) | 2,063 | |||||||||||||||
| Total increase (decrease) in interest expense |
1,864 | (11,554 | ) | (9,690 | ) | 7,706 | (12,367 | ) | (4,661 | ) | ||||||||||||||
| Increase (decrease) in net interest income |
$ | 412 | $ | (1,418 | ) | $ | (1,006 | ) | $ | 10,425 | $ | (11,032 | ) | $ | (607 | ) | ||||||||
Provision for Loan Losses
Provisions for loan losses are charged to income to bring the Company’s allowance for loan losses to a target level based on the factors discussed under—“Financial Condition—Allowance for Loan Losses and Reserve for Unfunded Lending Commitments.” The 2009 provision for loan losses was $25.7 million, up approximately $9.1 million or 54.4% compared with $16.6 million in 2008. The increase, primarily the result of deteriorating economic conditions in both Texas and California, was in part due to an increase in nonperforming assets and higher net charge-offs, the majority of which came from Texas. In the first quarter, charge-offs were significantly comprised of a $6.0 million medical relationship loan. During the fourth quarter of 2009, deterioration in commercial real estate values, reflected in new appraisals obtained by the Banks, resulted in net charge-offs of $9.2 million, with the largest write-downs from Texas of $4.1 million related to two retail centers and $1.2 million on a residential project in Texas. In California, the largest write-downs were $1.2 million on a hotel relationship and $830,000 on a commercial land loan. The Company performed evaluations of sectors of the loan portfolio perceived to be most at risk under current market conditions, including residential and commercial land and construction and commercial real estate. As part of this process, the Company obtained new appraisals for the underlying collateral of loans, considered the financial strength of the borrowers, and the past due status of the loan. In some cases, notification from the borrower of an inability to repay per loan terms was also a factor. The results of the evaluation led to the downgrade of certain loans and as a result an increase in the provision for loan losses.
44
Table of Contents
Index to Financial Statements
As of December 31, 2009, total nonperforming assets were $102.9 million compared with $57.6 million at December 31, 2008. The increase in nonperforming assets in 2009 compared with 2008 was primarily due to $29.8 million in retail centers and $10.4 million in commercial land in the Texas market and $3.2 million in commercial land in California moving to nonaccrual status, all of which were partially offset by net charge-offs and paydowns. Other real estate increased by $11.0 million in Texas and $6.4 million in California.
The ratio of the allowance for loan losses to total loans at December 31, 2009 was 2.31% compared with 1.80% and 1.09% at December 31, 2008 and 2007, respectively. The Company strives to maintain its allowance for loan losses at calculated levels commensurate with probable losses inherent in the loan portfolio. Management conducts ongoing risk assessments that may, from time to time, necessitate varying levels of allowance for loan losses based on these risk assessments.
Noninterest Income
For the years ended December 31, 2009, 2008 and 2007, noninterest income was $8.2 million, $6.5 million, and $8.3 million, respectively, reflecting an increase of approximately $1.7 million or 26.4% in 2009 compared with 2008, and a decrease of approximately $1.8 million or 22.0% in 2008 compared with 2007. The increase in noninterest income for the year ended December 31, 2009 was primarily due to an increase in net gains on securities transactions and lower net impairment of securities, which were partially offset by decreases in service fees and reduced gains on the sale of loans. Net gains on sales of securities increased $1.1 million primarily due to the sale of available-for-sale securities during 2009 as a result of portfolio realignment. Service fees declined in 2009 as a result of expanded customer participation in electronic banking products resulting in a lower volume of check transactions. Net impairment on securities available-for-sale was $708,000 and $2.0 million at December 31, 2009 and 2008, respectively. There were no impairment charges during 2007. Additional information is presented in Note 3—“Securities” of the Notes to consolidated financial statements.
The decrease in noninterest income for the year ended December 31, 2008 was primarily due to net impairment on securities mentioned above, a decrease in service fee income, and the effect of the $358,000 gain on sale of a branch property that occurred in 2007, which were partially offset by increases in the cash value of bank owned life insurance and other loan related fees. Service fees declined in 2008 as a result of expanded customer participation in electronic banking products resulting in a lower volume of check transactions, and a decline in the number of active checking accounts in Texas. Service fees for 2007 were $5.2 million, down $443,000 compared with $5.6 million, primarily due to fewer NSF service charges. The service fees category of noninterest income includes monthly deposit account service charge assessments, non-sufficient funds charges, and all other traditional non-lending bank service fees.
The following table presents, for the periods indicated, the major categories of noninterest income:
| Years Ended December 31, | |||||||||||
| 2009 | 2008 | 2007 | |||||||||
| (Dollars in thousands) | |||||||||||
| Service fees |
$ | 4,393 | $ | 4,839 | $ | 5,175 | |||||
| Loan related fees |
1,522 | 1,721 | 1,511 | ||||||||
| Gain on securities transactions, net |
1,220 | 91 | 2 | ||||||||
| Net impairment on securities |
(708 | ) | (1,961 | ) | — | ||||||
| Gain on sale of loans |
— | 288 | 277 | ||||||||
| Increase in cash value of bank owned life insurance |
1,436 | 1,352 | 738 | ||||||||
| Other noninterest income |
306 | 135 | 585 | ||||||||
| Total noninterest income |
$ | 8,169 | $ | 6,465 | $ | 8,288 | |||||
45
Table of Contents
Index to Financial Statements
Noninterest Expense
For the years ended December 31, 2009, 2008 and 2007, noninterest expense was $47.8 million, $43.1 million, and $42.9 million, respectively, reflecting an increase of approximately $4.7 million or 11.0% in 2009 compared with 2008, and an increase of approximately $140,000 or 0.3% in 2008 compared with 2007. The increase in noninterest expense in 2009 was primarily due to higher expenses related to other real estate, higher FDIC assessments and goodwill impairment, partially offset by decreases in salaries and employee benefits and other noninterest expense. The components of noninterest expense are discussed below.
Salaries and employee benefits for the years ended December 31, 2009, 2008 and 2007 was $20.4 million, $24.3 million, and $24.8 million, respectively, reflecting a decrease of $3.9 million or 16.0% in 2009 compared with 2008, and a decrease of $548,000 or 2.2% in 2008 compared with 2007. The decrease in 2009 versus 2008 was primarily due to reduction in the number of employees as a result of streamlined operations and decreases in bonus accrual and stock-based compensation expense. The decrease in 2008 versus 2007 was primarily due to a reduction in the number of employees and amount of bonus accrual, partially offset by an increase in severance expenses, employee health care benefits, and stock-based compensation expense. Total full-time equivalent employees at December 31, 2009, 2008 and 2007 were 296, 320, and 349, respectively.
Occupancy and equipment expense for the year ended December 31, 2009 was $7.9 million, down $220,000 or 2.7% compared with $8.1 million for the same period in 2008. Occupancy and equipment expense for the year ended December 31, 2008 was $8.1 million, down $29,000 or 0.4% compared with $8.2 million for the same period in 2007.
Foreclosed assets expense for the year ended December 31, 2009 was $4.1 million, an increase of $3.8 million compared with $289,000 for the same period in 2008. Foreclosed assets expense for the year ended December 31, 2008 was $289,000, an increase of $11,000 compared with $278,000 for the same period in 2007. The increase in foreclosed assets expense in 2009 was primarily due an increase in the volume of foreclosed assets and write-downs on foreclosed assets as a result of the weakening of the economy and the real estate market.
Legal and professional fees for the years ended December 31, 2009, 2008 and 2007 were $2.4 million, $1.9 million, and $1.4 million, respectively. The increase in legal and professional fees in 2009 and 2008 was primarily due to legal fees resulting from activities related to nonperforming assets.
The FDIC assessment for the years ended December 31, 2009, 2008 and 2007 was $3.9 million, $617,000, and $173,000, respectively. The increase in the FDIC assessment was due to increased DIF assessment rates as part of the FDIC’s DIF restoration plan, and the special FDIC assessment applicable to all insured depository institutions, which was paid September 30, 2009.
Goodwill impairment charges were $2.5 million for the year ended December 31, 2009. There were no impairment charges during 2008 or 2007. Additional information is presented in Note 6—“Goodwill and Core Deposit Intangibles” of the Notes to consolidated financial statements.
46
Table of Contents
Index to Financial Statements
Other noninterest expense, noted in the table below, for the year ended December 31, 2009 was $6.4 million, a decrease of $1.2 million compared with $7.6 million for the same period in 2008, primarily due to cost control efforts which resulted in cost reductions across the organization. Other noninterest expense for the year ended December 31, 2008 was $7.6 million, a decrease of $133,000 compared with $7.7 million for the same period in 2007, primarily due to decreases in business development expenses and other miscellaneous expenses. The following table presents, for the periods indicated, the major categories of noninterest expense:
| Years Ended December 31, | |||||||||
| 2009 | 2008 | 2007 | |||||||
| (Dollars in thousands) | |||||||||
| Salaries and employee benefits |
$ | 20,406 | $ | 24,298 | $ | 24,846 | |||
| Occupancy and equipment |
7,908 | 8,128 | 8,157 | ||||||
| Core deposit intangible amortization |
177 | 250 | 347 | ||||||
| Foreclosed assets, net |
4,107 | 289 | 278 | ||||||
| Legal and professional fees |
2,360 | 1,935 | 1,443 | ||||||
| FDIC assessment |
3,915 | 617 | 173 | ||||||
| Goodwill impairment |
2,500 | — | — | ||||||
| Other noninterest expense |
6,435 | 7,558 | 7,691 | ||||||
| Total noninterest expenses |
$ | 47,808 | $ | 43,075 | $ | 42,935 | |||
The efficiency ratio is a supplementary financial measure designed to show how well a company utilizes its resources and manages its expenses. The efficiency ratio is calculated by dividing total noninterest expense, excluding loan loss provisions and goodwill impairment, by net interest income plus noninterest income, excluding impairment on securities. The Company’s efficiency ratio for 2009 was 70.61%, up from the 2008 efficiency ratio of 66.55%. The increase for 2009 was due to the decrease of net interest income as a result of declining market interest rates and the effect of an increase in nonperforming assets, in addition to higher noninterest expense mainly due to increased FDIC assessments, foreclosed asset expenses and legal and professional fees. The Company’s efficiency ratio for 2008 was 66.55%, up from the 2007 efficiency ratio of 65.86%. The increase for 2008 was due to the compression of net interest income as a result of declining market interest rates, coupled with higher noninterest expense.
Income Taxes
Income taxes for the years ended December 31, 2009, 2008 and 2007 include the federal income tax and California state tax at the statutory rate plus the Texas Margin tax. The amount of federal income tax expense (benefit) is influenced by the amount of taxable income, the amount of tax-exempt income (loss), the amount of non-deductible interest expense and the amount of other non-deductible expenses. The Texas Margin tax is based on consolidated gross revenue from all sources, excluding interest and dividends from U.S. obligations, reduced by interest expense, certain personnel costs or an amount equal to 30% of gross income, whichever is greater. Margin tax income is apportioned to Texas based on the source of gross income and is taxed at a rate of 1%.
Income tax benefit for 2009 was $3.0 million, a decrease of $4.2 million or 347.9% compared with income tax expense of $1.2 million in 2008. Income tax expense for 2008 was $1.2 million, a decrease of $5.7 million or 82.6% compared with income tax of $6.9 million in 2007. The effective income tax rates in 2009, 2008 and 2007 were (29.7%), 39.6%, and 36.3%, respectively. The decrease in the effective income tax rate in 2009 as compared to 2008 was primarily the result of non-deductible goodwill partially offset by increases in state income tax expense which did not correlate with the pre-tax loss. The increase in the effective income tax rate in 2008 as compared to 2007 was primarily the result of increases in the state income taxes for California and Texas and the increase in nondeductible stock-based compensation as a percentage of pre-tax income. The Texas tax is based on the Company’s gross margin with limited deductions. Because the Texas tax allows only limited deductions the tax may not correlate, from year to year, with pre-tax income. The California tax is based on the
47
Table of Contents
Index to Financial Statements
unitary income of the consolidated group which can vary disproportionately with pre-tax income depending on the apportionment of income among members of the unitary group. The increase in the effective income tax rate was partially offset by the increase in the cash value of bank owned life insurance, which is non-taxable.
Impact of Inflation
The effects of inflation on the local economy and on the Company’s operating results have been relatively modest for the past several years. Since substantially all of the Company’s assets and liabilities are monetary in nature, such as cash, securities, loans and deposits, their values are less sensitive to the effects of inflation than to changing interest rates, which do not necessarily change in accordance with inflation rates. The Company attempts to control the impact of interest rate fluctuations by managing the relationship between its interest rate sensitive assets and liabilities. See “—Financial Condition—Interest Rate Sensitivity and Market Risk.”
Business Segment Results
The Company manages its operations and prepares management reports with a primary focus on two geographical areas. Operating segment information is presented in Note 21—“Operating Segment Information” of the Notes to consolidated financial statements.
Financial Condition
Loan Portfolio
Total loans were $1.27 billion at December 31, 2009, a decrease of $72.1 million, or 5.4% from $1.35 billion at December 31, 2008. The decrease in 2009 was mainly the result of a decline of $68.3 million in commercial and industrial loans and $46.6 million in real estate construction loans, partially offset by an increase of $43.3 million in real estate mortgage loans. Total loans were $1.35 billion at December 31, 2008, up $144.1 million, or 12.0% from $1.20 billion at December 31, 2007. The increase in 2008 represented growth of $9.4 million in commercial and industrial loans, $130.5 million in real estate mortgage loans, and $5.2 million in real estate construction loans.
The ratio of total loans to total deposits was 93.4%, 106.1%, and 100.9% as of December 31, 2009, 2008, and 2007, respectively. As of the same dates, total loans represented 80.1%, 85.2%, and 82.3% of total assets, respectively.
48
Table of Contents
Index to Financial Statements
The following table summarizes the loan portfolio of the Company by type of loan at the dates indicated:
| As of December 31, | |||||||||||||||||||||||||||||||||||
| 2009 | 2008 | 2007 | 2006 | 2005 | |||||||||||||||||||||||||||||||
| Amount | Percent | Amount | Percent | Amount | Percent | Amount | Percent | Amount | Percent | ||||||||||||||||||||||||||
| (Dollars in thousands) | |||||||||||||||||||||||||||||||||||
| Commercial and industrial |
$ | 399,235 | 31.27 | % | $ | 467,546 | 34.65 | % | $ | 458,117 | 38.01 | % | $ | 367,072 | 41.25 | % | $ | 331,869 | 42.84 | % | |||||||||||||||
| Real estate mortgage |
|||||||||||||||||||||||||||||||||||
| Residential |
32,730 | 2.56 | 12,399 | 0.92 | 5,306 | 0.44 | 4,847 | 0.55 | 7,739 | 1.00 | |||||||||||||||||||||||||
| Commercial |
742,974 | 58.20 | 720,052 | 53.37 | 596,618 | 49.50 | 424,431 | 47.70 | 368,508 | 47.57 | |||||||||||||||||||||||||
| 775,704 | 60.76 | 732,451 | 54.29 | 601,924 | 49.94 | 429,278 | 48.25 | 376,247 | 48.57 | ||||||||||||||||||||||||||
| Real estate construction |
|||||||||||||||||||||||||||||||||||
| Residential |
32,257 | 2.52 | 43,242 | 3.20 | 58,971 | 4.89 | 27,781 | 3.13 | 12,095 | 1.56 | |||||||||||||||||||||||||
| Commercial |
65,532 | 5.14 | 101,125 | 7.50 | 80,208 | 6.65 | 58,311 | 6.55 | 44,315 | 5.72 | |||||||||||||||||||||||||
| 97,789 | 7.66 | 144,367 | 10.70 | 139,179 | 11.54 | 86,092 | 9.68 | 56,410 | 7.28 | ||||||||||||||||||||||||||
| Consumer and other |
3,888 | 0.31 | 4,864 | 0.36 | 6,132 | 0.51 | 7,332 | 0.82 | 10,172 | 1.31 | |||||||||||||||||||||||||
| Gross loans |
1,276,616 | 100.00 | % | 1,349,228 | 100.00 | % | 1,205,352 | 100.00 | % | 889,774 | 100.00 | % | 774,698 | 100.00 | % | ||||||||||||||||||||
| Less: unearned discounts, interest and deferred fees |
(2,619 | ) | (3,180 | ) | (3,441 | ) | (3,218 | ) | (3,225 | ) | |||||||||||||||||||||||||
| Total loans |
$ | 1,273,997 | $ | 1,346,048 | $ | 1,201,911 | $ | 886,556 | $ | 771,473 | |||||||||||||||||||||||||
Each of the following principal product lines is an outgrowth of the Company’s expertise in meeting the particular needs of the small and medium-sized businesses and consumers in the multicultural communities it serves:
Commercial and Industrial Loans. A major lending focus of the Company is on loans to small and medium-sized businesses in a wide variety of industries. The Company’s commercial lending emphasis includes loans to wholesalers, manufacturers and business service companies. A broad array of short and medium-term commercial lending products are made available to businesses for working capital (including inventory and accounts receivable), purchases of equipment and machinery and business expansion (including acquisitions of real estate and improvements). Generally, the Company’s commercial loans are underwritten on the basis of the borrower’s ability to service such debt as reflected by cash flow projections. Commercial loans are generally collateralized by business assets, which may include real estate, accounts receivable and inventory, certificates of deposit, securities, guarantees or other collateral. The Company also generally obtains personal guarantees from the principals of the business. Working capital loans are primarily collateralized by short-term assets, whereas term loans are primarily collateralized by long-term assets. As a result, commercial loans involve additional complexities, variables and risks and require more thorough underwriting and servicing than other types of loans. Indigenous to individuals in the Asian business community is the desire to own the building and land which house their businesses. Accordingly, while a loan may be principally driven and classified by the type of business operated, real estate is frequently the primary source of collateral. As of December 31, 2009, the Company’s commercial and industrial loan portfolio was $399.2 million or 31.3% of the gross loan portfolio. Approximately $279.8 million or 70.1% of the commercial and industrial loan portfolio was collateralized by real estate. As a result of the economic downturn in 2009, the Company recorded net charge-offs of $9.7 million in this portfolio. As a result, the total volume for commercial and industrial loans declined $68.3 million or 14.6% compared with 2008. The Company continually monitors real estate value trends and takes into consideration changes in market trends in its underwriting standards.
Commercial Mortgage Loans. In addition to commercial loans, the Company makes commercial mortgage loans to finance the purchase of real property, which generally consists of developed real estate. The Company’s commercial mortgage loans are collateralized by first liens on real estate. For MetroBank, these loans typically
49
Table of Contents
Index to Financial Statements
have variable rates and amortize over a 15 to 20 year period, with balloon payments due at the end of five to seven years. For Metro United, these loans have both variable and fixed rates and amortize over a 25 to 30 year period, with balloon payments due at the end of five to ten years. Payments on loans collateralized by such properties are dependent on the successful operation or management of the properties. Accordingly, repayment of these loans may be subject to adverse conditions in the real estate market or the economy to a greater extent than other types of loans. In underwriting commercial mortgage loans, consideration is given to the property’s historical cash flow, current and projected occupancy, location and physical condition. The underwriting analysis also includes credit checks, appraisals, environmental impact reports and a review of the financial condition of the borrower. As of December 31, 2009, the Company had a commercial mortgage portfolio of $743.0 million or 58.2% of the gross loan portfolio, which were comprised of $463.3 million in loans from MetroBank and $279.7 million in loans from Metro United. Due to weakness in the commercial real estate market in 2009, the Company recorded net charge-offs of $6.5 million related to commercial mortgage loans. Growth of this portfolio also declined to 3.2% for 2009 compared with 20.7% for 2008 and 40.6% for 2007.
Construction Loans. The Company makes loans to finance the construction of residential and non-residential properties. The majority of the Company’s residential construction loans in Texas are for single-family dwellings that are pre-sold or are under earnest money contracts. The Company also originates loans to finance the construction of commercial properties such as multi-family, office, industrial, warehouse and retail centers. Construction loans involve additional risks attributable to the fact that loan funds are advanced upon the security of a project under construction, and the project is of uncertain value prior to its completion. Because of uncertainties inherent in estimating construction costs, the market value of the completed project and the effects of governmental regulation on real property, it can be difficult to accurately evaluate the total funds required to complete a project and the related loan to value ratio. As a result of these uncertainties, construction lending often involves the disbursement of substantial funds with repayment dependent, in part, on the success of the ultimate project rather than the ability of a borrower or guarantor to repay the loan. If the Company is forced to foreclose on a project prior to completion, there is no assurance that the Company will be able to recover the entire unpaid portion of the loan. In addition, the Company may be required to fund additional amounts to complete a project and may have to hold the property for an indeterminable period of time. While the Company has underwriting procedures designed to identify what it believes to be acceptable levels of risks in construction lending, no assurance can be given that these procedures will prevent losses from the risks described above. As of December 31, 2009, the Company had a real estate construction portfolio of $97.8 million or 7.7% of the gross loan portfolio, of which $32.3 million was residential and $65.5 million was commercial. Of the residential construction loans, $24.9 million and $7.4 million were from MetroBank and Metro United, respectively. The commercial construction loans were comprised of $42.5 million from MetroBank and $23.0 million from Metro United. Due to weakness in the commercial real estate market in 2009, the Company recorded net charge-offs of $3.8 million related to construction loans. Loan origination also declined 32.3% compared with 2008.
Government Guaranteed Small Business Lending. The Company, through its subsidiary MetroBank, has developed an expertise in several government guaranteed lending programs in order to provide credit enhancement to its commercial and industrial and commercial mortgage portfolios. As a Preferred Lender under the federally guaranteed SBA lending program, the Company’s pre-approved status allows it to quickly respond to customers’ needs. Under this program, the Company originates and funds SBA 7-A and 504 chapter loans qualifying for federal guarantees of 75% to 90% of principal and accrued interest. Depending upon prevailing market conditions, the Company may sell the guaranteed portion of these loans into the secondary market with servicing retained. MetroBank specializes in SBA loans to minority-owned businesses. As of December 31, 2009, MetroBank had $32.4 million in the retained portion of SBA loans. These loans are included in most all types of loans including commercial and industrial, real estate mortgage, and real estate construction.
Trade Finance. The Company, through its subsidiary MetroBank, originates trade finance loans and letters of credit to facilitate export and import transactions for small and medium-sized businesses. In this capacity, the Company has worked with the Ex-Im Bank, an agency of the U.S. Government which provides guarantees for trade finance loans. Trade finance credit facilities rely heavily on the quality of the business
50
Table of Contents
Index to Financial Statements
customer’s accounts receivable and the ability to perform the underlying transaction which, if monitored and controlled properly, limits the financial risks to the Company associated with this short-term financing. To mitigate the risk of nonpayment, the Company generally obtains a governmental guaranty or credit insurance from a governmental agency such as the Ex-Im Bank. As of December 31, 2009, the Company’s aggregate trade finance portfolio commitments were $23.0 million.
Residential Mortgage Brokerage and Lending. The Company, through its subsidiary MetroBank, uses its existing branch network to offer a complete line of single-family residential mortgage products through third party mortgage companies. The Company solicits and receives a fee to process these residential mortgage loans, which are then underwritten by and pre-sold to third party mortgage companies. The Company does not fund or service these loans. The volume of residential mortgage loans processed by the Company and pre-sold to third party mortgage companies in 2009 was $3.0 million. Since the Company does not fund these loans, there is no interest rate or credit risk to the Company. The Company also originates five to seven year balloon residential mortgage loans with a 15-year amortization primarily collateralized by owner occupied residential properties, which are retained in the Company’s residential mortgage portfolio. At December 31, 2009, the Company’s residential mortgage portfolio was $32.7 million, which was comprised of loans from MetroBank. The Company had no subprime residential mortgage loans at December 31, 2009.
Consumer Loans. The Company, through its subsidiary Metro United Bank, offers a wide variety of loan products to retail customers through its branch network. Loans to retail customers include automobile loans, lines of credit and other personal loans. The terms of these loans typically range from 12 to 60 months depending on the nature of the collateral and the size of the loan. At December 31, 2009, the Company’s consumer loan portfolio was $3.9 million.
The Company selectively extends credit for the purpose of establishing long-term relationships with its customers. The Company mitigates the risks inherent in lending by focusing on businesses and individuals with demonstrated payment history, historically favorable profitability trends and stable cash flows. In addition to these primary sources of repayment, the Company looks to tangible collateral and personal guarantees as secondary sources of repayment. Lending officers are provided with detailed underwriting policies covering all lending activities in which the Company is engaged and that require all lenders to obtain appropriate approvals for the extension of credit. The Company also maintains documentation requirements and extensive credit quality assurance practices in order to identify credit portfolio weaknesses as early as possible so any exposures that are discovered may be reduced.
Inherent in all lending is the risk of nonpayment. The types of collateral required, the terms of the loans and the underwriting practices discussed under each category above are all designed to minimize the risk of nonpayment. In addition, as further risk protection, the Banks rarely makes loans at their respective legal lending limit. MetroBank generally does not make loans larger than $12 million to one borrower and Metro United generally does not make loans larger than $6 million to one borrower. Loans greater than the Banks’ lending limits are subject to participation with other financial institutions, including with each other. Loans originated by MetroBank are approved by the Chief Lending Officer, Chief Credit Officer, MetroBank’s Loan Committee, or the Director’s Credit Committee based on the size of the loan relationship and its risk rating. Loans originated by Metro United are approved by the Director’s Credit Committee except for certain consumer loans. Control systems and procedures are in place to ensure all loans are approved in accordance with credit policies. The Company’s policies and procedures, discussed under “Nonperforming Assets,” are designed to minimize the risk of nonpayment with respect to outstanding loans.
51
Table of Contents
Index to Financial Statements
The following table summarizes the industry concentrations of the Company’s loan portfolio that were greater than 25% of capital as of the dates indicated:
| As of December 31, | |||||||||
| 2009 | 2008 | 2007 | |||||||
| (Dollars in thousands) | |||||||||
| Nonresidential building for rent/lease |
$ | 396,639 | $ | 407,556 | $ | 450,586 | |||
| Hotels/motels |
165,811 | 156,032 | 126,118 | ||||||
| Other related to real estate |
118,943 | 148,853 | 78,864 | ||||||
| Wholesale trade |
118,069 | 122,109 | 90,780 | ||||||
| Health/education/social assistance |
89,714 | 98,323 | 55,096 | ||||||
| Construction |
77,002 | 110,307 | 64,443 | ||||||
| Restaurants |
69,342 | 67,634 | 69,709 | ||||||
| Convenience stores/gasoline stations |
53,391 | 54,798 | 34,618 | ||||||
| All other |
187,705 | 183,616 | 235,138 | ||||||
| Gross loans |
$ | 1,276,616 | $ | 1,349,228 | $ | 1,205,352 | |||
The contractual maturity ranges of the commercial and industrial, real estate, and consumer loan portfolios and the amount of such loans with predetermined interest rates and floating rates in each maturity range as of December 31, 2009 are summarized in the following table:
| As of December 31, 2009 | ||||||||||||
| One Year or Less |
After One Through Five Years |
After Five Years |
Total | |||||||||
| (Dollars in thousands) | ||||||||||||
| Commercial and industrial |
$ | 139,719 | $ | 162,736 | $ | 96,780 | $ | 399,235 | ||||
| Real estate mortgage: |
||||||||||||
| Residential |
1,296 | 27,572 | 3,862 | 32,730 | ||||||||
| Commercial |
160,899 | 358,972 | 223,103 | 742,974 | ||||||||
| Real estate construction: |
||||||||||||
| Residential |
27,822 | 4,435 | — | 32,257 | ||||||||
| Commercial |
27,781 | 28,093 | 9,658 | 65,532 | ||||||||
| Consumer and other |
773 | 2,797 | 318 | 3,888 | ||||||||
| Total |
$ | 358,290 | $ | 584,605 | $ | 333,721 | $ | 1,276,616 | ||||
| Loans with a predetermined interest rate |
$ | 46,697 | $ | 207,637 | $ | 154,582 | $ | 408,916 | ||||
| Loans with a floating interest rate |
311,593 | 376,968 | 179,139 | 867,700 | ||||||||
| Total |
$ | 358,290 | $ | 584,605 | $ | 333,721 | $ | 1,276,616 | ||||
The Company may renew loans at maturity when requested by a customer whose financial strength appears to support such renewal or when such renewal appears to be in the Company’s best interest. In such instances, the Company generally requires payment of accrued interest and may adjust the rate of interest, require a principal reduction or modify other terms of the loan at the time of renewal.
Nonperforming Assets
The Company has certain lending procedures in place that are designed to maximize loan income within an acceptable level of risk. These procedures include the approval of lending policies and underwriting guidelines by the Board of Directors of each bank, and separate policy, administrative and approval oversight by the Directors’ Loan Committee of MetroBank, and by the Directors’ Credit Committee of Metro United. Additionally, the Company’s loan portfolio is reviewed by its internal loan review department.
52
Table of Contents
Index to Financial Statements
The loan review process of both banks involves the grading of each loan by its respective loan officer. Depending on the grade, a loan will be aggregated with other loans of similar grade and a loss factor is applied to the total loans in each group to establish the required level of allowance for loan losses. For both banks, grades of 1-10 are applied to each loan, with loans graded 7-10 requiring the most allowance for loan losses. Factors utilized in the grading process include but are not limited to historical performance, payment status, collateral value, and financial strength of the borrower. Oversight of the loan review process is the responsibility of the Loan Review/Compliance Officer. Differences of opinion are resolved among the loan officer, compliance officer, and the chief credit officer.
MetroBank’s credit department reports credit risk grade changes on a monthly basis to its management and the Board of Directors. MetroBank performs monthly and quarterly, and Metro United performs quarterly concentration analyses based on industries, collateral types, business lines, large credit sizes and officer portfolio loads. Metro United’s loan review process is outsourced and performed quarterly by the loan review department of its affiliate MetroBank, which acts as an external independent loan review agent. Findings of each respective examination are reported to the Director’s Credit Committee of each bank. It is the responsibilities of the loan administration personnel and loan officers to respond to the findings of the examination and take corrective actions so as to reduce and minimize risk exposure to the bank. Loan concentration reports based on type and geographic regions are prepared, monitored and reviewed quarterly and presented to the Directors’ Loan Committee for MetroBank, the Directors’ Credit Committee for Metro United and the Board of Directors of each respective bank.
In addition, the Company reviews the real estate values, and when necessary, orders new appraisals on loans collateralized by real estate when loans are renewed, prior to foreclosure and at other times as necessary, particularly in problem loan situations. In instances where updated appraisals reflect reduced collateral values, an evaluation of the borrower’s overall financial condition is made to determine the need, if any, for possible write-downs or appropriate additions to the allowance for loan losses. The Company records other real estate at fair value at the time of acquisition less estimated costs to sell.
There can be no assurance, however, that the Company’s loan portfolio will not become subject to increasing pressures from deteriorating borrowers’ financial condition due to general economic and other factors. While future deterioration in the loan portfolio is possible, management is continuing its risk assessment and resolution program. In addition, management is focusing its attention on minimizing the Company’s credit risk through more diversified business development avenues.
The Company generally places a loan on nonaccrual status and ceases accruing interest when, in the opinion of management, full payment of loan principal or interest is in doubt. All loans past due 90 days are placed on nonaccrual status unless the loan is both well collateralized and in the process of collection. Cash payments received while a loan is classified as nonaccrual are recorded as a reduction of principal as long as significant doubt exists as to collection of the principal. In addition to nonaccrual loans, the Company evaluates on an ongoing basis other loans which are potential problem loans as to risk exposure in determining the adequacy of the allowance for loan losses.
The Company requires that nonperforming assets be monitored by the special assets department or senior lenders for MetroBank, and internal credit personnel with the assistance of third party consultants and attorneys for Metro United. All nonperforming assets are actively managed pursuant to the Company’s loan policy. Management is apprised on a weekly basis of the workout endeavors and provides assistance as necessary to determine the best strategy for problem loan resolution and maximizing repayment on nonperforming assets.
A loan is considered impaired based on current information and events, if it is probable that the Company will be unable to collect the scheduled payments of principal or interest when due according to the contractual terms of the loan agreement. The measurement of impaired loans is based on the present value of expected future cash flows discounted at the loan’s effective interest rate or the loan’s observable market price or based on the fair value of the collateral if the loan is collateral-dependent.
53
Table of Contents
Index to Financial Statements
In addition to the Banks’ loan review process described in the preceding paragraphs, the OCC periodically examines and evaluates MetroBank, while the FDIC and DFI periodically examine and evaluate Metro United. Based upon such examinations, the regulators may revalue the assets of the institution and require that it charge-off certain assets, establish specific reserves to compensate for the difference between the regulators-determined value and the book value of such assets or take other regulatory action designed to lessen the risk in the asset portfolio.
2009 versus 2008. Total nonperforming assets at December 31, 2009 were $102.9 million, an increase of $45.2 million compared with $57.6 million at December 31, 2008. The increase in nonperforming assets in 2009 compared with 2008 was primarily due to $29.8 million in retail centers and $10.4 million in commercial land in the Texas market, and $3.2 million in commercial land in California moving to nonaccrual status, all of which were partially offset by net charge-offs and paydowns. Other real estate increased by $11.0 million in Texas and $6.4 million in California. Had the total of nonaccrual loans remained on an accrual basis, interest in the amount of approximately $1.8 million would have been recorded on these loans for both years ended December 31, 2009 and 2008.
2008 versus 2007. Total nonperforming assets at December 31, 2008 were $57.6 million, an increase of $48.5 million compared with $9.1 million at December 31, 2007. The increase in nonperforming assets in 2008 compared with 2007 was primarily due to a medical relationship loan in the amount of $16.0 million in Texas, $6.4 million in single family home loans in Texas and California, $5.1 million in residential land loans in Texas and California, $5.1 million in three commercial land loans in Texas, a $4.8 million loan on a skilled nursing center in Texas, $3.5 million in loans on two retail centers in Texas, a $2.4 million restaurant loan secured by real estate in Texas, a $2.0 million loan secured by townhomes in Texas and a $1.0 million loan on an owner occupied veterinary clinic in Texas, which were partially offset by payoffs, sales of other real estate properties and write-downs on nonperforming assets. Also contributing to the increase in nonperforming assets was a $4.5 million troubled debt restructuring representing a loan participation purchased that is secured by commercial land in California. Had the total of nonaccrual loans remained on an accrual basis, interest in the amount of approximately $1.8 million and $557,000 would have been recorded on these loans during the years ended December 31, 2008 and 2007, respectively.
The amount of interest income recognized on nonaccrual loans for the years ended December 31, 2009 and 2008 was $131,000 and $397,000, respectively. Nonaccrual loans at December 31, 2009 and 2008 were $75.2 million and $48.2 million, respectively, an increase of $27.0 million. Troubled debt restructurings at December 31, 2009 and 2008 were $4.9 million and $4.5 million, respectively, an increase of $453,000. Other real estate at December 31, 2009 and 2008 was $22.3 million and $4.8 million, an increase of $17.5 million.
Included in total nonperforming assets are the portions guaranteed by the SBA, Overseas Chinese Community Guaranty Fund (“OCCGF”) and Ex-Im Bank, which was $2.1 million at December 31, 2009 and 2008. Nonperforming assets, net of their guaranteed portions, were $100.7 million and $55.8 million, for the same periods, respectively. The ratios for net nonperforming assets to total loans and other real estate were 7.77% and 4.13% at December 31, 2009 and 2008, respectively. The ratios for net nonperforming assets to total assets were 6.34% and 3.53%, for the same periods, respectively.
54
Table of Contents
Index to Financial Statements
The following table presents information regarding nonperforming assets at the dates indicated:
| As of December 31, | ||||||||||||||||||||
| 2009 | 2008 | 2007 | 2006 | 2005 | ||||||||||||||||
| (Dollars in thousands) | ||||||||||||||||||||
| Nonaccrual loans |
$ | 75,229 | $ | 48,239 | $ | 6,336 | $ | 9,414 | $ | 15,606 | ||||||||||
| Accruing loans 90 days or more past due |
420 | 103 | 1,284 | 29 | 32 | |||||||||||||||
| Troubled debt restructurings |
4,927 | 4,474 | — | — | — | |||||||||||||||
| Other real estate (“ORE”) |
22,291 | 4,825 | 1,474 | 2,747 | 3,866 | |||||||||||||||
| Total nonperforming assets |
102,867 | 57,641 | 9,094 | 12,190 | 19,504 | |||||||||||||||
| Less: nonperforming loans guaranteed by the SBA, Ex-Im Bank, or the OCCGF |
(2,138 | ) | (1,843 | ) | (2,309 | ) | (2,857 | ) | (2,210 | ) | ||||||||||
| Net nonperforming assets |
$ | 100,729 | $ | 55,798 | $ | 6,785 | $ | 9,333 | $ | 17,294 | ||||||||||
| Total nonperforming assets to total loans and ORE |
7.94 | % | 4.27 | % | 0.76 | % | 1.37 | % | 2.52 | % | ||||||||||
| Total nonperforming assets to total assets |
6.47 | 3.65 | 0.62 | 0.96 | 1.73 | |||||||||||||||
| Net nonperforming assets to total loans and ORE |
7.77 | 4.13 | 0.56 | 1.05 | 2.23 | |||||||||||||||
| Net nonperforming assets to total assets |
6.34 | 3.53 | 0.46 | 0.74 | 1.53 | |||||||||||||||
Allowance for Loan Losses and Reserve for Unfunded Lending Commitments
The allowance for loan losses provides for the risk of losses inherent in the lending process and the Company allocates the allowance for loan losses according to management’s assessments of risk inherent in the portfolio. The allowance for loan losses is increased by provisions charged against current earnings and is reduced by net charge-offs. Loans are charged off when they are deemed to be uncollectible in whole or in part. Recoveries are recorded when cash payments are received. In developing the assessment, the Company relies on estimates and exercises judgment regarding matters where the ultimate outcome is uncertain. Circumstances may change and future assessments of credit risk may yield materially different results, resulting in an increase or decrease in the allowance for credit losses.
The allowance for credit losses consists of the allowance for loan losses and the reserve for unfunded lending commitments and is maintained at levels that the Company believes are adequate to absorb probable losses inherent in the loan portfolio and unfunded lending commitments as of the date of the financial statements. The Company employs a systematic methodology for determining the allowance for credit losses that consists of four components: (1) a formula-based general reserve based on historical average losses by loan grade and grade migration, (2) specific reserves on larger individual credits that are based on the difference between the current loan balance and the loan’s collateral value, observable market price, or discounted present value, (3) a qualitative component that reflects current market conditions and other factors precedent to losses different from historical averages, and (4) a reserve for unfunded lending commitments.
In setting the qualitative reserve portion of the allowance for loan losses, the factors the Company may consider include, but are not limited to, concentrations of credit, common characteristics of known problem loans, potential problem loans, and other loans that exhibit weaknesses or deterioration, the general economic environment in the Company’s markets as well as the national economy, particularly the real estate markets, changes in value of the collateral securing loans, results of portfolio stress tests, and changes in lending processes, procedures and personnel. After the aforementioned assessment of the loan portfolio, the general economic environment and other relevant factors, management determines the appropriate allowance for loan loss level and makes the provision necessary to achieve that level. This methodology is consistently followed so that the level of the allowance for loan losses is reevaluated in response to changes in circumstances, economic conditions or other factors on an ongoing basis.
The Company follows a loan review program to evaluate the credit risk in the loan portfolio as discussed under “Nonperforming Assets.” Through the loan review process, the Company maintains an internally
55
Table of Contents
Index to Financial Statements
classified loan list which, along with the delinquency list of loans, helps management assess the overall quality of the loan portfolio and the adequacy of the allowance for loan losses. Loans classified as “substandard” are those loans with clear and defined weaknesses such as a highly-leveraged position, unfavorable financial ratios, uncertain repayment sources or poor financial condition, which may jeopardize recoverability of the debt. Loans classified as “doubtful” are those loans which have characteristics similar to substandard loans but with an increased risk that a loss may occur, or at least a portion of the loan may require a charge-off if liquidated at present. Although loans classified as substandard do not duplicate loans classified as doubtful, both substandard and doubtful loans include some loans that are delinquent at least 30 days or on nonaccrual status. Loans classified as “loss” are those loans which are in the process of being charged off.
In addition to the internally classified loan list and delinquency list of loans, the Company maintains a separate “watch list” which further aids the Company in monitoring loan portfolios. Watch list loans show warning elements where the present status portrays one or more deficiencies that require attention in the short-term or where pertinent ratios of the loan account have weakened to a point where more frequent monitoring is warranted. These loans do not have all of the characteristics of a classified loan (substandard or doubtful) but do show weakened elements compared with those of a satisfactory credit. The Company reviews these loans to assist in assessing the adequacy of the allowance for loan losses.
Policies and procedures have been developed to assess the adequacy of the allowance for loan losses and the reserve for unfunded lending commitments that include the monitoring of qualitative and quantitative trends described above. Management of both banks review and approve their respective allowance for loan losses and the reserve for unfunded lending commitments monthly and perform a comprehensive analysis quarterly, which is also presented for approval by each banks’ Board of Directors. The allowance for credit losses is also subject to federal banking regulations. The Banks’ primary regulators conduct periodic examinations of the allowance for credit losses and make assessments regarding its adequacy and the methodology used in its determination.
The Company maintains a reserve for unfunded commitments to provide for the risk of loss inherent in its unfunded lending related commitments. The process used in determining the reserve is consistent with the process used for the allowance for loan losses discussed above.
56
Table of Contents
Index to Financial Statements
The following table presents an analysis of the allowance for loan losses and unfunded lending commitments for the periods indicated:
| As of and for the Years Ended December 31, | ||||||||||||||||||||
| 2009 | 2008 | 2007 | 2006 | 2005 | ||||||||||||||||
| (Dollars in thousands) | ||||||||||||||||||||
| Average total loans outstanding |
$ | 1,319,770 | $ | 1,294,744 | $ | 1,059,654 | $ | 819,103 | $ | 640,703 | ||||||||||
| Total loans outstanding at end of period |
$ | 1,273,997 | $ | 1,346,048 | $ | 1,201,911 | $ | 886,556 | $ | 771,473 | ||||||||||
| Allowance for loan losses at beginning of period |
$ | 24,235 | $ | 13,125 | $ | 11,436 | $ | 13,169 | $ | 10,501 | ||||||||||
| Provision for loan losses |
25,713 | 16,649 | 3,145 | 612 | 1,936 | |||||||||||||||
| Allowance acquired through acquisition |
— | — | — | — | 2,307 | |||||||||||||||
| Charge-offs: |
||||||||||||||||||||
| Commercial and industrial |
(10,453 | ) | (2,783 | ) | (2,044 | ) | (3,737 | ) | (2,146 | ) | ||||||||||
| Real estate—mortgage |
(6,511 | ) | (374 | ) | (611 | ) | (21 | ) | — | |||||||||||
| Real estate—construction |
(4,089 | ) | (2,066 | ) | — | (39 | ) | (5 | ) | |||||||||||
| Consumer and other |
(558 | ) | (628 | ) | (66 | ) | (202 | ) | (274 | ) | ||||||||||
| Total charge-offs |
(21,611 | ) | (5,851 | ) | (2,721 | ) | (3,999 | ) | (2,425 | ) | ||||||||||
| Recoveries: |
||||||||||||||||||||
| Commercial and industrial |
790 | 304 | 646 | 680 | 804 | |||||||||||||||
| Real estate—mortgage |
3 | — | 573 | 874 | 6 | |||||||||||||||
| Real estate—construction |
270 | 1 | — | — | — | |||||||||||||||
| Consumer and other |
3 | 7 | 46 | 100 | 40 | |||||||||||||||
| Total recoveries |
1,066 | 312 | 1,265 | 1,654 | 850 | |||||||||||||||
| Net charge-offs |
(20,545 | ) | (5,539 | ) | (1,456 | ) | (2,345 | ) | (1,575 | ) | ||||||||||
| Allowance for loan losses at end of period |
29,403 | 24,235 | 13,125 | 11,436 | 13,169 | |||||||||||||||
| Reserve for unfunded lending commitments at beginning of period |
1,092 | 816 | 793 | 546 | 362 | |||||||||||||||
| Provision for unfunded lending commitments |
(49 | ) | 276 | 23 | 247 | 174 | ||||||||||||||
| Reserve acquired through acquisition |
— | — | — | — | 10 | |||||||||||||||
| Reserve for unfunded lending commitments at end of period |
1,043 | 1,092 | 816 | 793 | 546 | |||||||||||||||
| Allowance for credit losses |
$ | 30,466 | $ | 25,327 | $ | 13,941 | $ | 12,229 | $ | 13,715 | ||||||||||
| Ratio of allowance for loan losses to end of period total loans |
2.31 | % | 1.80 | % | 1.09 | % | 1.29 | % | 1.71 | % | ||||||||||
| Ratio of net charge-offs to average total loans |
1.56 | 0.43 | 0.14 | 0.29 | 0.25 | |||||||||||||||
| Ratio of allowance for loan losses to end of period total nonperforming loans |
36.49 | 45.89 | 172.24 | 121.11 | 84.21 | |||||||||||||||
For the years ended December 31, 2009, 2008, and 2007, net charge-offs were $20.5 million, $5.5 million, and $1.5 million, respectively. The significant charge-offs for 2009 primarily consisted of $16.4 million from Texas and $5.2 million from California, which were partially offset by $1.0 million in recoveries. The significant Texas charge-offs consisted of $4.7 million medical relationship loan, $4.1 million in two retail center loans, $2.0 million in an import wholesaler loan, $1.2 million in a loan secured by single family residences, $685,000 in a commercial land relationship and $678,000 in a restaurant loan secured by real estate. The significant California charge-offs consisted of $1.4 million in the Texas medical relationship loan, a $1.2 million hotel loan, an $830,000 commercial land relationship and a $663,000 retail center loan.
57
Table of Contents
Index to Financial Statements
The significant charge-offs for 2008 primarily consisted $3.6 million of charge-offs from California and $2.3 million from Texas, which were partially offset by $312,000 in recoveries. The significant California charge-offs consisted of $2.3 million in three residential land loan relationships, $600,000 on a restaurant loan, and $500,000 on a gas station loan. The significant Texas charge-offs consisted of $826,000 on a wholesale food business loan, $284,000 on a multi-family property loan, $250,000 on an owner-occupied veterinary clinic loan, and $210,000 on a residential land loan.
The following table describes the allocation of the allowance for loan losses among various categories of loans and certain other information. The allocation is made for analytical purposes and is not necessarily indicative of the categories in which future losses may occur, and does not preclude its availability to absorb losses in other categories. The total allowance is available to absorb losses from any segment of the loan portfolio.
| As of December 31, | ||||||||||||||||||||||||||||||
| 2009 | 2008 | 2007 | 2006 | 2005 | ||||||||||||||||||||||||||
| Amount | Percent of Loans to Gross Loans |
Amount | Percent of Loans to Gross Loans |
Amount | Percent of Loans to Gross Loans |
Amount | Percent of Loans to Gross Loans |
Amount | Percent of Loans to Gross Loans |
|||||||||||||||||||||
| (Dollars in thousands) | ||||||||||||||||||||||||||||||
| Balance of allowance for loan losses applicable to: |
||||||||||||||||||||||||||||||
| Commercial and industrial |
$ | 8,526 | 31.27 | % | $ | 8,190 | 34.65 | % | $ | 5,584 | 38.01 | % | $ | 4,210 | 41.25 | % | $ | 5,349 | 42.84 | % | ||||||||||
| Real estate—mortgage |
16,862 | 60.76 | 11,494 | 54.29 | 5,416 | 49.94 | 4,745 | 48.25 | 6,361 | 48.57 | ||||||||||||||||||||
| Real estate—construction |
3,649 | 7.66 | 3,700 | 10.70 | 2,007 | 11.54 | 666 | 9.68 | 665 | 7.28 | ||||||||||||||||||||
| Consumer and other |
262 | 0.31 | 119 | 0.36 | 79 | 0.51 | 110 | 0.82 | 114 | 1.31 | ||||||||||||||||||||
| Unallocated |
104 | — | 732 | — | 39 | — | 1,705 | — | 680 | — | ||||||||||||||||||||
| Total allowance for loan losses |
$ | 29,403 | 100.00 | % | $ | 24,235 | 100.00 | % | $ | 13,125 | 100.00 | % | $ | 11,436 | 100.00 | % | $ | 13,169 | 100.00 | % | ||||||||||
Securities
The Company uses its securities portfolio primarily as a source of income and secondarily as a source of liquidity. At the date of purchase, the Company is required to classify debt and equity securities into one of three categories: held-to-maturity, trading or available-for-sale. Held-to-maturity securities are carried at amortized cost in the financial statements when management has the positive intent and ability to hold them to maturity. Available-for-sale securities are carried at fair value in the financial statements with unrealized gains and losses reported net of tax, as a component of accumulated other comprehensive income in shareholders’ equity. The Company has no trading securities.
The amortized cost of securities held-to-maturity at December 31, 2009 was $4.0 million. There were no securities held-to-maturity at December 31, 2008. The fair value of securities available-for-sale was $98.4 million at December 31, 2009, a decrease of $3.7 million or 3.7% compared with $102.1 million at December 31, 2008. The fair value of securities available-for-sale was $102.1 million at December 31, 2008, a decrease of $35.6 million or 25.9% compared with $137.7 million at December 31, 2007. The decrease in 2009 and 2008 was primarily the result of sales of securities and normal runoff on the portfolio consisting primarily of paydowns on mortgage-backed securities and collateralized mortgage obligations and maturities and calls of securities. At December 31, 2009, investment securities with a fair value of $45.3 million were pledged to secure public deposits, Federal Reserve advances, repurchase obligations, and for other purposes required or permitted by law.
Prior to April 1, 2009, declines in the fair value of held-to-maturity and available-for-sale securities below their cost that were deemed to be other-than-temporary are reflected in earnings as realized losses to the extent the impairment is related to credit losses. The amount of impairment related to other factors is recognized in other comprehensive income.
58
Table of Contents
Index to Financial Statements
In April 2009, the Financial Accounting Standards Board (“FASB”) issued a change in accounting guidance involving the recognition and presentation of other-than-temporary impairments. The Company adopted this guidance on April 1, 2009. Under the new guidance Accounting Standards Codification (“ASC”) Topic 320-10, when an other-than-temporary-impairment (“OTTI”) of a debt security has occurred, the amount of the OTTI recognized in earnings depends on whether the Company intends to sell the security or more likely than not will be required to sell the security before recovery of its amortized cost basis. If the debt security meets either of these two criteria, the OTTI recognized in earnings is equal to the entire difference between the security’s amortized cost basis and its fair value at the impairment measurement date. For OTTIs of debt securities that do not meet these two criteria, the net amount recognized in earnings is equal to the difference between the amortized cost of the debt security and its net present value calculated. Any difference between the fair value and the net present value of the debt security at the impairment measurement date is recorded in other comprehensive income (loss) (“OCI”). Unrealized gains or losses on securities for which an OTTI has been recognized in earnings is tracked as a separate component of accumulated other comprehensive income (loss) (“AOCI”). Prior to the adoption of the new guidance, an OTTI recognized in earnings for debt securities was equal to the total difference between amortized cost and fair value at the time of impairment.
For debt securities, the split between the amount of an OTTI recognized in other comprehensive income and the net amount recognized in earnings is driven principally by assumptions regarding the amount and timing of projected cash flows. For mortgage-backed and asset-backed securities, cash flow estimates are determined based on prepayment assumptions, default rates and loss severity rates derived from widely accepted third-party data sources. The Company has developed these estimates using information based on historical experience as well as using market observable data, such as industry analyst reports and forecasts, sector credit ratings and other data relevant to the collectability of a security.
The new cost basis of an impaired security is not adjusted for subsequent increases in estimated fair value. In periods subsequent to the recognition of an OTTI, the impaired security is accounted for as if it had been purchased on the measurement date of the impairment. For debt securities, the discount (or reduced premium) based on the new cost basis may be accreted into net investment income in future periods based on prospective changes in cash flow estimates, to reflect adjustments to the effective yield.
For equity securities, the Company evaluates whether unrealized losses on securities represent impairment that is other-than-temporary. If such impairment is identified, the carrying amount of the security is reduced with a charge to earnings. In making this evaluation, management first considers the reasons for the indicated impairment. These could include changes in market rates relative to those available when the security was acquired, changes in market expectations about the timing of cash flows from securities that can be prepaid, and changes in the market’s perception of the issuer’s financial health and the security’s credit quality. The Company then considers the likelihood of a recovery in fair value sufficient to eliminate the indicated impairment and the length of time over which an anticipated recovery would occur. Finally, the Company determines its ability to hold the impaired security until an anticipated recovery, in which case the impairment would be considered temporary.
The Company’s available-for-sale and held-to-maturity securities with unrealized losses are reviewed quarterly to identify OTTIs in value. In evaluating whether a decline in value is other-than-temporary, the Company considers several factors including, but not limited to the following: (1) the extent and the duration of the decline; (2) the reasons for the decline in value (credit event, and interest-rate related including general credit spread widening); (3) the financial condition of and near-term prospects of the issuer, and (4) the Company’s intent not to sell and that it is not more likely than not that the Company would be required to sell the security before the anticipated recovery of its amortized cost basis. With regard to available-for-sale equity securities, the Company also considers the ability and intent to hold the investment for a period of time to allow for a recovery of value. When it is determined that a decline in value of an equity security is other-than-temporary, the carrying value of the equity security is reduced to its fair value, with a corresponding charge to earnings.
59
Table of Contents
Index to Financial Statements
For the year ended December 31, 2009, the Company recognized credit-related losses of $746,000 on 45 non-agency residential mortgage-backed securities and $36,000 on four asset-backed securities. The noncredit portion of these impairments of $1.1 million on non-agency residential mortgage-backed securities and $283,000 on asset-backed securities was included in accumulated other comprehensive loss for the year ended December 31, 2009. To measure credit losses, external credit ratings and other relevant collateral details and performance statistics on a security-by-security basis were considered. Securities exhibiting significant deterioration are subjected to further analysis. Assumptions were developed for prepayment speed, default rate, and loss severity for each security using third party sources and based on the collateral history. The resulting projections of future cash flows of the underlying collateral were then discounted by the underlying yield before any write-downs were considered to determine the net present value of the cash flows (“NPV”). The difference between the cost basis and the NPV was taken as a credit loss in the current period to the extent that these losses have not been previously recognized. The difference between the NPV and the quoted market price is considered a noncredit related loss and was included in other comprehensive loss.
In the second quarter of 2008, the Company recognized an other-than-temporary impairment charge of approximately $1.5 million on its $14.2 million investment in the AMF Ultra Short Mortgage Fund (the “Fund”). The Fund was a mutual fund investing primarily in adjustable rate agency and private label mortgage-backed securities. The Company reclassified the unrealized mark-to-market loss on these securities to an other-than-temporary impairment charge because of the significant decline in the net asset value of the Fund, and because the Fund manager activated the redemption-in-kind provision on May 6, 2008 to protect shareholders against forced liquidation of Fund holdings to satisfy cash redemptions.
In July 2008, the Company redeemed its shares in the Fund for approximately $2.2 million in cash, with the remaining value of approximately $10.5 million distributed in the form of securities held by the Fund that approximated the Company’s respective interest in each of the underlying securities. Upon redemption, the previously recognized $1.5 million other-than-temporary impairment plus an additional $57,000 of loss was realized. The redemption of securities from the Fund resulted in the Company receiving all of the principal payments, including prepayments, made each month on the securities. The redemption also eliminated the non-maturity characteristic associated with investments in a mutual fund since each individual security has a final maturity date. In the third and fourth quarters of 2008, as part of its quarterly impairment review, the Company evaluated the securities received in the Fund redemption in kind transaction and determined that certain securities had declines in fair value below their cost that were considered other-than-temporary due to downgrades by one or more of the three major rating agencies. As a result, the Company recorded non-cash impairment charges of $421,000 pre-tax during the third and fourth quarters of 2008 to reduce the individual securities to their fair value.
In the second quarter of 2008, the Company also reviewed the impairment related to two other mutual funds and determined that the impairment on one fund was other-than-temporary. Accordingly, the Company recorded a non-cash impairment charge of $74,000 pre-tax. The unrealized loss on the remaining fund was determined to not be other-than-temporary.
60
Table of Contents
Index to Financial Statements
The following table presents the amortized cost of securities classified as available-for-sale and their approximate fair values as of the dates shown, and other investments at cost. The Company had no securities classified as trading at December 31, 2009, 2008 and 2007, and no held-to-maturity at December 31, 2008 and 2007.
| As of December 31, 2009 | |||||||||||||||||
| Amortized Cost |
Unrealized | Fair Value | |||||||||||||||
| Gains | Losses | OTTI | |||||||||||||||
| Securities available-for-sale |
|||||||||||||||||
| Debt Securities |
|||||||||||||||||
| U.S. Treasury and other U.S. government corporations and agencies |
$ | 57,882 | $ | — | $ | (654 | ) | $ | — | $ | 57,228 | ||||||
| Obligations of state and political subdivisions |
5,724 | 118 | (29 | ) | — | 5,813 | |||||||||||
| Mortgage-backed securities and collateralized mortgage obligations |
|||||||||||||||||
| Government issued or guaranteed |
32,014 | 397 | (103 | ) | (1,104 | ) | 31,204 | ||||||||||
| Privately issued residential |
3,947 | 233 | (241 | ) | — | 3,939 | |||||||||||
| Asset backed securities |
467 | — | — | (283 | ) | 184 | |||||||||||
| Total available-for-sale securities |
$ | 100,034 | $ | 748 | $ | (1,027 | ) | $ | (1,387 | ) | $ | 98,368 | |||||
| Securities held-to-maturity |
|||||||||||||||||
| Obligations of state and political subdivisions |
$ | 4,044 | $ | 308 | $ | — | $ | — | $ | 4,352 | |||||||
| Total held-to-maturity securities |
$ | 4,044 | $ | 308 | $ | — | $ | — | $ | 4,352 | |||||||
| Other investments |
|||||||||||||||||
| Investment in CDARS(1) |
$ | 14,042 | $ | — | $ | — | $ | — | $ | 14,042 | |||||||
| FHLB(2)/Federal Reserve Bank(3) stock |
6,452 | — | — | — | 6,452 | ||||||||||||
| Investment in subsidiary trust(4) |
1,083 | — | — | — | 1,083 | ||||||||||||
| Total other investments |
$ | 21,577 | $ | — | $ | — | $ | — | $ | 21,577 | |||||||
| (1) | The investment in Promontory Interfinancial Network LLC’s Certificate of Deposit Account Registry Service (“CDARS”) is carried at cost. |
| (2) | FHLB stock held by MetroBank is subject to certain restrictions under a credit policy of the FHLB dated May 1, 1997. Redemption of FHLB stock is dependent upon repayment of borrowings from the FHLB. |
| (3) | Federal Reserve Bank stock held by MetroBank is subject to certain restrictions under Federal Reserve Bank Policy. |
| (4) | The Company’s ownership of common securities of MCBI Statutory Trust I is carried at cost. |
61
Table of Contents
Index to Financial Statements
| As of December 31, 2008 | |||||||||||||
| Amortized Cost |
Gross Unrealized Gains |
Gross Unrealized Losses |
Fair Value | ||||||||||
| Securities available-for-sale |
|||||||||||||
| Debt Securities |
|||||||||||||
| U.S. Treasury and other U.S. government corporations and agencies |
$ | 14,908 | $ | 179 | $ | — | $ | 15,087 | |||||
| Obligations of state and political subdivisions |
3,853 | 24 | — | 3,877 | |||||||||
| Mortgage-backed securities and collateralized mortgage obligations |
|||||||||||||
| Government issued or guaranteed |
72,787 | 555 | (956 | ) | 72,386 | ||||||||
| Privately issued residential |
5,639 | 19 | (1,299 | ) | 4,359 | ||||||||
| Asset backed securities |
550 | — | — | 550 | |||||||||
| Equity Securities |
|||||||||||||
| Investment in CRA funds |
5,809 | 36 | — | 5,845 | |||||||||
| Total available-for-sale securities |
$ | 103,546 | $ | 813 | $ | (2,255 | ) | $ | 102,104 | ||||
| Other investments |
|||||||||||||
| Investment in CDARS |
$ | 20,240 | $ | — | $ | — | $ | 20,240 | |||||
| FHLB/Federal Reserve Bank stock |
7,897 | — | — | 7,897 | |||||||||
| Investment in subsidiary trust |
1,083 | — | — | 1,083 | |||||||||
| Total other investments |
$ | 29,220 | $ | — | $ | — | $ | 29,220 | |||||
| As of December 31, 2007 | |||||||||||||
| Amortized Cost |
Gross Unrealized Gain |
Gross Unrealized Loss |
Fair Value | ||||||||||
| (Dollars in thousands) | |||||||||||||
| Securities available for sale |
|||||||||||||
| U.S. Treasury and other U.S. government corporations and agencies |
$ | 20,497 | $ | 12 | $ | (11 | ) | $ | 20,498 | ||||
| Obligations of state and political subdivisions |
5,936 | 162 | (7 | ) | 6,091 | ||||||||
| Mortgage-backed securities and collateralized mortgage obligations |
|||||||||||||
| Government issued or guaranteed |
92,673 | 173 | (1,123 | ) | 91,723 | ||||||||
| Privately issued residential |
33 | — | — | 33 | |||||||||
| Equity Securities |
|||||||||||||
| Investment in CRA funds |
5,680 | 39 | (55 | ) | 5,664 | ||||||||
| Investment in ARM funds |
14,178 | — | (438 | ) | 13,740 | ||||||||
| Total available for sale securities |
$ | 138,997 | $ | 386 | $ | (1,634 | ) | $ | 137,749 | ||||
| Other investments |
|||||||||||||
| FHLB/Federal Reserve Bank Stock |
$ | 5,803 | — | — | $ | 5,803 | |||||||
| Investment in subsidiary trust |
1,083 | — | — | 1,083 | |||||||||
| Total other investments |
$ | 6,886 | $ | — | $ | — | $ | 6,886 | |||||
62
Table of Contents
Index to Financial Statements
The following table summarizes the contractual maturity of investment securities held-to-maturity and available-for-sale at amortized cost and their weighted average yields as of December 31, 2009. No tax-equivalent adjustments were made.
| As of December 31, 2009 | ||||||||||||||||||||||||||||||
| Within One Year |
After One Year But Within Five Years |
After Five Years But Within Ten Years |
Non-maturing or After Ten Years |
Total | ||||||||||||||||||||||||||
| Amount | Yield | Amount | Yield | Amount | Yield | Amount | Yield | Amount | Yield | |||||||||||||||||||||
| (Dollars in thousands) | ||||||||||||||||||||||||||||||
| U.S. Treasury and other U.S. government corporations and agencies |
$ | — | — | $ | 23,969 | 1.94 | % | $ | 24,963 | 4.05 | % | $ | 8,950 | 5.19 | % | $ | 57,882 | 3.35 | % | |||||||||||
| Obligations of state and political subdivisions |
— | — | 230 | 4.29 | 2,646 | 4.88 | 6,892 | 4.73 | 9,768 | 4.76 | ||||||||||||||||||||
| Mortgage-backed securities and collateralized mortgage obligations |
||||||||||||||||||||||||||||||
| Government issued or guaranteed |
1,078 | 3.94 | 3,433 | 4.32 | 5,451 | 3.29 | 22,052 | 3.61 | 32,014 | 3.64 | ||||||||||||||||||||
| Privately issued residential |
— | — | 273 | 2.08 | — | — | 3,674 | 4.33 | 3,947 | 4.17 | ||||||||||||||||||||
| Asset backed securities |
— | — | — | — | — | — | 467 | 9.89 | 467 | 9.89 | ||||||||||||||||||||
| Investment in CDARS |
14,042 | 1.87 | — | — | — | — | — | — | 14,042 | 1.87 | ||||||||||||||||||||
| FHLB/Federal Reserve Bank stock |
— | — | — | — | — | — | 6,452 | 1.77 | 6,452 | 1.77 | ||||||||||||||||||||
| Investment in subsidiary trust |
— | — | — | — | — | — | 1,083 | 5.76 | 1,083 | 5.76 | ||||||||||||||||||||
| Total securities |
$ | 15,120 | 1.74 | % | $ | 27,905 | 2.25 | % | $ | 33,060 | 3.99 | % | $ | 49,570 | 3.85 | % | $ | 125,655 | 3.36 | % | ||||||||||
The securities portfolio includes mortgage-backed securities which have been developed by pooling a number of real estate mortgages and are principally issued by U. S. Government agencies such as Ginnie Mae and U.S. Government sponsored enterprises such as Fannie Mae and Freddie Mac. These securities are deemed to have high credit ratings, and certain minimum levels of regular monthly cash flows of principal and interest are insured or guaranteed by the issuing agencies.
As of December 31, 2009, 2008 and 2007, 71.5%, 53.1%, and 51.9%, respectively, of the mortgage-backed securities held by the Company had final maturities of more than ten years. However, unlike U.S. Treasury and other U.S. government corporations and agencies debt securities, which have a lump sum payment at maturity, mortgage-backed securities provide cash flows from regular principal and interest payments and principal prepayments throughout the lives of the securities. Mortgage-backed securities which are purchased at a premium will generally suffer decreasing net yields as interest rates drop because homeowners tend to prepay or refinance their higher-rate mortgages. As prepayments increase, the average life of the security shortens and the premium paid must be amortized over a shorter period. Securities purchased at a discount will obtain higher net yields in a decreasing interest rate environment as the discount is accreted over a shorter average life. As interest rates rise, the opposite will generally be true. During a period of rising interest rates, fixed rate mortgage-backed securities tend to experience smaller prepayments of principal and consequently, the average life of this security will be longer. Additionally, the value of mortgage-backed securities generally decreases as interest rates increase. At December 31, 2009, approximately $7.8 million or 22.1% of the Company’s mortgage-backed securities and CMOs earn interest at floating rates and reprice within one year, and accordingly are less susceptible to declines in value should interest rates increase.
Included in the Company’s mortgage-backed securities at December 31, 2009, 2008 and 2007, were $13.0 million, $34.9 million, and $38.1 million, respectively, in agency-issued collateralized mortgage obligations
63
Table of Contents
Index to Financial Statements
(“CMOs”). CMOs are bonds that are backed by pools of mortgages and are issued by Ginnie Mae, Fannie Mae, Freddie Mac, or other private-label underwriters. The CMOs use the cash flows from the underlying mortgage collateral to structure classes of bonds called tranches with differing repayment priorities, interest characteristics and risk profiles, tailored to the needs of various types of investors. This is accomplished by dividing the bonds into classes to which payments on the underlying mortgage pools are allocated in different order. The mortgage pool’s cash flow, for example is directed to paying off the principal to one tranche before the other classes receive any principal. When the first tranche is paid off, then the next successive tranche begins to receive principal. CMOs issued by Ginnie Mae, Fannie Mae, Freddie Mac carry the protection against loss of the issuing entity. In private-label CMOs, any losses on underlying mortgages are directed to dedicated tranches, giving other tranches enough credit protection to be given investment grade credit ratings by the rating agencies. At December 31, 2009 and 2008, the fair value of private-label CMOs was $3.0 million and $4.9 million, respectively, all of which were acquired in the redemption of the Fund in July 2008. Private-label CMOs constituted less than 0.1% of total investment securities at December 31, 2007.
The Banks are members of the Promontory Interfinancial Network LLC’s Certificate of Deposit Account Registry Service (“CDARS”). The CDARS program is a deposit-placement service designed to allow FDIC-insured depository institutions to accept deposits of more than the FDIC insured amount and obtain full coverage for the depositor by spreading the funds among as many separate FDIC insured institutions as necessary so that no institution holds more than the FDIC insured limit. Under the CDARS One-Way Sell Institutional Investment Program, financial institutions may invest their own funds and obtain full FDIC coverage.
At December 31, 2009, $14.0 million was invested in the CDARS One-Way Sell program, earning interest at rates ranging from 0.15% to 0.90%, with original maturities ranging from one month to one year. Maturities of any investments in CDARS with maturities subsequent to December 31, 2009 have not been renewed. At December 31, 2008, $20.1 million was invested in the CDARS One-Way Sell program and earned interest at rates ranging from 2.55% to 3.65%, with original maturities ranging from six months to one year.
Investment in subsidiary trust represents the Company’s ownership of trust common securities of the statutory business trust, formed for the purpose of issuing junior subordinated debentures to third-party investors. See the discussion in—“Junior Subordinated Debentures.”
Deposits
The Company’s lending and investing activities are funded principally by deposits. At December 31, 2009, 48.3% of the Company’s total deposits were interest-bearing certificates of deposit (CDs), 36.8% were interest-bearing savings, NOW, and money market accounts and 14.9% were noninterest-bearing demand deposit accounts. Total deposits at December 31, 2009 were $1.36 billion compared with $1.27 billion at December 31, 2008, an increase of $95.0 million or 7.5%. Total deposits at December 31, 2008 were $1.27 billion compared with $1.19 billion at December 31, 2007, an increase of $78.1 million or 6.6%.
Average noninterest-bearing demand deposits for the year ended December 31, 2009 were $208.4 million, a decrease of $3.5 million or 1.6%, compared with $211.9 million for the same period in 2008. Average noninterest-bearing demand deposits for the year ended December 31, 2008 were $211.9 million, an increase of $7.5 million or 3.6%, compared with $204.4 million for the same period in 2007.
Average interest-bearing deposits for the year ended December 31, 2009 were $1.16 billion, an increase of $138.8 million or 13.6%, compared with $1.02 billion for the same period in 2008. Average interest-bearing deposits for the year ended December 31, 2008 were $1.02 billion, an increase of $56.9 million or 5.9%, compared with $960.5 million for the same period in 2007.
Average total deposits for the year ended December 31, 2009 were $1.36 billion, an increase of $135.3 million or 11.0%, compared with $1.23 billion for the same period in 2008. Average total deposits for the year ended December 31, 2008 were $1.23 billion, an increase of $64.3 million or 5.5%, compared with $1.16 billion for the same period in 2007.
64
Table of Contents
Index to Financial Statements
The increase in deposits during 2009 and 2008 was the result of new relationships cultivated and deposit campaigns. As part of its effort to cross-sell its products and services, the Company actively solicits time deposits from existing customers. In addition, the Company receives time deposits and other deposits from government municipalities and utility districts. These time deposits typically renew at maturity and all deposit sources have provided a stable source of funds. The Company believes that based on its historical experience a significant portion of its large time deposits, other than brokered time deposits, have core-type characteristics. In pricing its time deposits, the Company seeks to be competitive but typically prices near the middle of a given market.
The average daily balances and weighted average rates paid on deposits for each of the years ended December 31, 2009, 2008 and 2007 are presented below:
| Years Ended December 31, | ||||||||||||||||||
| 2009 | 2008 | 2007 | ||||||||||||||||
| Amount | Rate | Amount | Rate | Amount | Rate | |||||||||||||
| (Dollars in thousands) | ||||||||||||||||||
| Average interest-bearing deposits: |
||||||||||||||||||
| NOW checking |
$ | 54,774 | 0.51 | % | $ | 58,680 | 0.79 | % | $ | 64,252 | 1.19 | % | ||||||
| Savings and money market deposits |
409,874 | 1.85 | 302,113 | 2.71 | 245,765 | 3.74 | ||||||||||||
| Time deposits less than $100,000 |
251,462 | 2.77 | 239,196 | 3.97 | 234,710 | 4.75 | ||||||||||||
| Time deposits $100,000 and over |
440,045 | 2.98 | 417,407 | 4.12 | 415,736 | 5.05 | ||||||||||||
| Total average interest-bearing deposits |
1,156,155 | 2.42 | 1,017,396 | 3.47 | 960,463 | 4.38 | ||||||||||||
| Average noninterest-bearing deposits |
208,383 | — | 211,850 | — | 204,440 | — | ||||||||||||
| Total average deposits |
$ | 1,364,538 | 2.05 | % | $ | 1,229,246 | 2.88 | % | $ | 1,164,903 | 3.61 | % | ||||||
The following table sets forth the amount of the Company’s time deposits that are $100,000 or greater by time remaining until maturity as of December 31, 2009:
| December 31, 2009 | |||
| (Dollars in thousands) | |||
| Three months or less |
$ | 120,995 | |
| Over three through six months |
92,009 | ||
| Over six through 12 months |
164,138 | ||
| Over 12 months |
71,654 | ||
| Total |
$ | 448,796 | |
The Company had $66.5 million and $35.0 million of brokered deposits as of December 31, 2009 and 2008, respectively. Pursuant to the Agreement, MetroBank must obtain prior approval from the OCC before it may accept, renew or roll over any brokered deposits.
Junior Subordinated Debentures
As of December 31, 2009 and 2008, the Company had $36.1 million outstanding in junior subordinated debentures issued to its unconsolidated subsidiary trust, MCBI Statutory Trust I. The debentures were issued to fund the Company’s acquisition of Metro United.
The debentures accrue interest at a fixed rate of 5.7625% until December 15, 2010, at which time the debentures will accrue interest at a floating rate equal to the 3-month LIBOR plus 1.55%. The quarterly distributions on the capital and common securities of the Trust will be paid at the same rate that interest is paid on the debentures. The ability of the Trust to pay amounts due on the capital securities and common securities is solely dependent upon the Company making payment on the related debentures. The debentures, which are the only assets of the Trust, are subordinate and junior in right of payment to all of the Company’s present and future
65
Table of Contents
Index to Financial Statements
senior indebtedness. Under the provisions of the debentures, the Company has the right to defer payment of interest on the debentures at any time, or from time to time, for a period not exceeding five years. If interest payments on the debentures are deferred, the distributions on the capital securities and common securities will also be deferred.
The debentures mature on December 15, 2035, but are redeemable at the Company’s option at par plus accrued and unpaid interest on or after December 15, 2010. If the Company redeems any amount of the debentures, the Trust must redeem a like amount of the capital securities. The Company has guaranteed the payment of distributions and payments on liquidation or redemption of the capital securities, but only in each case if and to the extent of funds held by the Trust.
During the third quarter of 2009, the Company entered into a forward-starting interest rate swap contract on the junior subordinated debentures with a notional amount of $17.5 million. Under the five-year swap contract, beginning December 2010, the Company will pay a fixed interest rate of 5.38% and receive a variable interest rate of three-month LIBOR plus a margin of 1.55% on a total notional amount of $17.5 million, with quarterly settlements beginning March 2011. See Note 18 “Derivative Financial Instruments” to the Notes in the consolidated financial statements.
Other Borrowings
The Company utilizes borrowings to supplement deposits to fund its lending and investing activities. Other borrowings sources typically include advances from the Federal Home Loan Bank (“FHLB”) of Dallas and from the FHLB of San Francisco. At December 31, 2009, there were no advances outstanding from the FHLB.
The Company has entered into securities repurchase agreements with two counterparty financial institutions that bear a weighted average interest rate per annum of 3.71% and mature on December 31, 2014. Securities sold under securities repurchase agreements are currently puttable by the counterparty at a fixed repurchase price at the end of each calendar quarter. In addition, securities under one repurchase agreement are puttable by either the counterparty or the Company at the replacement cost of the repurchase transaction at the end of each calendar year commencing on December 31, 2011. The Company has pledged and transferred securities as collateral under repurchase agreements with an aggregate fair value of $31.6 million as of December 31, 2009. The counterparties are permitted, in certain instances, to sell or repledge securities transferred or pledged by the Company to secure the repurchase obligations.
The total unused borrowing capacity from the FHLBs was $391.8 million and $331.2 million at December 31, 2009 and 2008, respectively. Additionally, at December 31, 2009 and 2008, unused borrowing capacity from the Federal Reserve Bank discount window was $21.8 million and $9.8 million, respectively. The Company had pledged securities with a fair value of $9.8 million and $10.1 million at December 31, 2009 and 2008, respectively and pledged loans at a collateral value of $12.3 million and $0 at December 31, 2009 and 2008, respectively to secure the discount window borrowing capacity. The Company also had unused, unsecured lines of credit with correspondent banks of $10.0 and $17.0 million at December 31, 2009 and 2008.
66
Table of Contents
Index to Financial Statements
The following table presents, as of the dates indicated, the categories of other borrowings by the Company:
| As of and for the Years Ended December 31, |
||||||||||||
| 2009 | 2008 | 2007 | ||||||||||
| (Dollars in thousands) | ||||||||||||
| Federal funds purchased: |
||||||||||||
| On December 31, |
$ | — | $ | — | $ | — | ||||||
| average during the year |
22 | 84 | — | |||||||||
| maximum month end balance during the year |
— | 4,500 | — | |||||||||
| Interest rate at end of period |
— | % | — | % | — | % | ||||||
| Interest rate during period |
0.50 | 1.51 | — | |||||||||
| FHLB notes and advances: |
||||||||||||
| On December 31, |
$ | — | $ | 109,000 | $ | 74,000 | ||||||
| average during the year |
10,695 | 112,118 | 25,516 | |||||||||
| maximum month end balance during the year |
55,000 | 133,000 | 74,000 | |||||||||
| Interest rate at end of period |
— | % | 0.48 | % | 4.07 | % | ||||||
| Interest rate during period |
0.50 | 2.21 | 4.89 | |||||||||
| Security repurchase agreements: |
||||||||||||
| On December 31, |
$ | 25,000 | $ | 25,000 | $ | 25,000 | ||||||
| average during the year |
25,000 | 25,000 | 68 | |||||||||
| maximum month end balance during the year |
25,000 | 25,000 | 25,000 | |||||||||
| Interest rate at end of period |
3.71 | % | 3.71 | % | 2.87 | % | ||||||
| Interest rate during period |
3.71 | 2.91 | 2.94 | |||||||||
| Subordinated debentures: |
||||||||||||
| On December 31, |
$ | — | $ | 4,000 | $ | — | ||||||
| average during the year |
153 | 2,060 | — | |||||||||
| maximum month end balance during the year |
— | 4,000 | — | |||||||||
| Interest rate at end of period |
— | % | 6.50 | % | — | |||||||
| Interest rate during period |
7.19 | 5.05 | — | |||||||||
| Federal Reserve TT&L: |
||||||||||||
| On December 31, |
$ | 513 | $ | 1,046 | $ | 796 | ||||||
| average during the year |
687 | 731 | 819 | |||||||||
| maximum month end balance during the year |
1,020 | 1,283 | 1,067 | |||||||||
Contractual Obligations
The following table presents the payments due by period for the Company’s contractual borrowing obligations (other than deposit obligations with no stated maturities) as of December 31, 2009:
| Within One Year |
After One But Within Three Years |
After Three But Within Five Years |
After Five Years |
Total | |||||||||||
| (Dollars in thousands) | |||||||||||||||
| Certificates of deposit |
$ | 567,471 | $ | 77,070 | $ | 13,639 | $ | — | $ | 658,180 | |||||
| Federal Reserve TT&L |
513 | — | — | — | 513 | ||||||||||
| FHLB advances |
— | — | — | — | — | ||||||||||
| Security repurchase agreements |
— | 25,000 | — | — | 25,000 | ||||||||||
| Junior subordinated debentures |
— | — | — | 36,083 | 36,083 | ||||||||||
| Interest on time deposits, junior subordinated debentures and borrowings(1) |
10,739 | 6,807 | 4,900 | 13,294 | 35,740 | ||||||||||
| Total borrowing obligations |
$ | 578,723 | $ | 108,877 | $ | 18,539 | $ | 49,377 | $ | 755,516 | |||||
| Operating lease obligations |
2,181 | 2,327 | 1,127 | 498 | 6,133 | ||||||||||
| Total contractual obligations |
$ | 580,904 | $ | 111,204 | $ | 19,666 | $ | 49,875 | $ | 761,649 | |||||
| (1) | Assumes that variable interest rates on borrowings will contractually reset based on LIBOR as of January 30, 2010. |
67
Table of Contents
Index to Financial Statements
Interest Rate Sensitivity and Market Risk
As a financial institution, the Company’s primary component of market risk is interest rate risk, which is the effect of changes in interest rates on the profitability and capital position of the Company. Although the Company has limited exposure to other market risk factors, including foreign exchange or commodity risk, interest rate risk has the most significant impact on the income potential and the future capital position. Fluctuations in interest rates impact both the level of income and expense recorded on most of the Company’s assets and liabilities, and the market value of all interest-earning assets and interest-bearing liabilities.
Management of these risks and the equally critical liquidity management are vital to the long-term health of the organization. Both MetroBank and Metro United have an Asset and Liability Committee (“ALCO”), which manages these risk factors in accordance with policies approved by each bank’s Board of Directors. The ALCO of MetroBank is composed of senior officers and an independent director, and the ALCO for Metro United is comprised of senior officers. The ALCO of each bank formulates strategies in order to manage the exposure to interest rate risk within Board of Director approved tolerance limits while maximizing profitability and capital stability in various interest rate environments. The ALCO of each bank meets regularly to review, among other things, the overall asset and liability composition, the sensitivity of assets and liabilities to interest rate changes, the book and market values of assets and liabilities, unrealized gains and losses, purchase and sale activities, commitments to originate loans and the maturities of investments and borrowings. Additionally, the ALCO of each bank reviews liquidity, cash flow flexibility, pricing structures, loan and deposit activity and current market conditions on both a local and national level.
The ALCO of each bank continuously monitors and manages the balance between interest rate-sensitive assets and liabilities. The objective is to manage the impact of fluctuating market rates on net interest income within acceptable levels. In order to meet this objective, management may lengthen or shorten the duration of assets or liabilities or enter into derivative contracts to mitigate potential market risk. Management uses simulation analysis to model the impact of changes in interest rates on the net interest income and the market value of the assets and liabilities. The model is based on maturity and repricing characteristics of the existing assets and liabilities. The model further incorporates estimated prepayment rates on loans and securities and pricing changes under varying rate scenarios. The results of the model provide estimates of interest rate sensitivity and quantified interest rate risk that the ALCO of each bank uses to develop appropriate strategies.
A basic tool for measuring interest rate sensitivity is “GAP” analysis, or the difference between interest-earning assets and interest-bearing liabilities that mature or reprice during a specific time period. Interest rate sensitivity reflects the net assets or liabilities that potentially could be impacted by a movement in interest rates over a given time frame. A company is considered to be asset sensitive, or having a positive GAP, when the amount of its interest-earning assets maturing or repricing within a given period exceeds the amount of its interest-bearing liabilities also maturing or repricing within that time period, generally one year. Conversely, a company is considered to be liability sensitive, or having a negative GAP, when the amount of its interest-bearing liabilities maturing or repricing within a given period exceeds the amount of its interest-earning assets also maturing or repricing within that time period. During a period of declining interest rates, a positive GAP would tend to adversely affect net interest income, while a negative GAP would tend to result in an increase in net interest income. Toward the end of 2007, in anticipation of a declining rate environment, the Company moved to preserve net income by placing a greater emphasis on core deposit growth and fixed rate lending, which by the end of 2008 resulted in liability sensitivity over a one-year horizon. At the end of 2009, the Company remained liability sensitive primarily because all of its variable rate loans with floors are at the floor rates. Rates are expected to remain low for an extended period according to statements by the Chairman of the Federal Reserve, among others.
68
Table of Contents
Index to Financial Statements
The following table sets forth an interest rate sensitivity analysis for the Company at December 31, 2009:
| Volumes Subject to Repricing | |||||||||||||||||||||||||||||||
| 0-30 Days |
31-180 Days |
181-365 Days |
1-3 Years | 3-5 Years | 5-10 Years |
Greater Than 10 Years |
Total | ||||||||||||||||||||||||
| (Dollars in thousands) | |||||||||||||||||||||||||||||||
| Interest-earning assets: |
|||||||||||||||||||||||||||||||
| Securities(1) |
$ | 8,434 | $ | 19,330 | $ | 17,218 | $ | 49,103 | $ | 13,742 | $ | 11,709 | $ | 3,370 | $ | 122,906 | |||||||||||||||
| Gross loans |
677,600 | 124,347 | 59,640 | 117,280 | 108,245 | 110,885 | 78,619 | 1,276,616 | |||||||||||||||||||||||
| Federal funds sold and other short-term investments |
82,006 | — | — | — | — | — | — | 82,006 | |||||||||||||||||||||||
| Total interest-bearing assets |
768,040 | 143,677 | 76,858 | 166,383 | 121,987 | 122,594 | 81,989 | 1,481,528 | |||||||||||||||||||||||
| Interest-bearing liabilities: |
|||||||||||||||||||||||||||||||
| Demand, money market and savings deposits |
502,560 | — | — | — | — | — | — | 502,560 | |||||||||||||||||||||||
| Time deposits |
68,959 | 258,689 | 239,823 | 77,070 | 13,639 | — | — | 658,180 | |||||||||||||||||||||||
| Other borrowings |
513 | — | — | 25,000 | — | — | — | 25,513 | |||||||||||||||||||||||
| Junior subordinated debentures |
— | — | 36,083 | — | — | — | — | 36,083 | |||||||||||||||||||||||
| Total interest-bearing liabilities |
572,032 | 258,689 | 275,906 | 102,070 | 13,639 | — | — | 1,222,336 | |||||||||||||||||||||||
| Period GAP |
$ | 196,008 | $ | (115,012 | ) | $ | (199,048 | ) | $ | 64,313 | $ | 108,348 | $ | 122,594 | $ | 81,989 | $ | 259,192 | |||||||||||||
| Cumulative GAP |
$ | 196,008 | $ | 80,996 | $ | (118,052 | ) | $ | (53,739 | ) | $ | 54,609 | $ | 177,203 | $ | 259,192 | |||||||||||||||
| Period GAP to total assets |
13.43 | % | (7.88 | )% | (13.63 | )% | 4.41 | % | 7.42 | % | 8.40 | % | 5.62 | % | |||||||||||||||||
| Cumulative GAP to total assets |
13.43 | % | 5.55 | % | (8.09 | )% | (3.68 | )% | 3.74 | % | 12.14 | % | 17.75 | % | |||||||||||||||||
| Cumulative interest-earning assets to cumulative interest-bearing liabilities |
134.27 | % | 109.75 | % | 89.33 | % | 95.55 | % | 104.47 | % | 114.50 | % | 121.20 | % | |||||||||||||||||
| (1) | Includes Federal Reserve Bank stock, Federal Home Loan Bank stock and Investment in CDARS. |
GAP reflects a one-day position that is continually changing and is not indicative of the Company’s position at any other time. While the GAP position is a useful tool in measuring interest rate risk and contributes toward effective asset and liability management, it is difficult to predict the effect of changing interest rates solely on that measure, without accounting for alterations in the maturity or repricing characteristics of the balance sheet that occur during changes in market interest rates or the magnitude of the impact of market rate changes on the pricing of individual products. For example, the GAP position reflects only the prepayment assumptions pertaining to the current rate environment. Fixed rate assets tend to prepay more rapidly during periods of declining interest rates than during periods of rising interest rates. Because of this and other risk factors not contemplated by the GAP position, an institution could have a matched GAP position in the current rate environment and still have its net interest income exposed to increased rate risk. This inherent weakness has led to the development of more sophisticated modeling techniques to quantify the interest rate risk identified by the GAP analysis.
Interest rate risk can be quantified by calculating the impact of interest rates under various stable, rising and falling interest rate scenarios on the overall net interest income over a given time frame or on the economic or market value of the equity (EVE). The Company utilizes its simulation model to gauge its interest rate risk exposure using both methodologies. The simulation results are not intended to be a forecast of the actual effects of changes in interest rates, but a standardized method of calculating the inherent risk. The net interest income simulation applies expected rate changes to the repricing of variable rate assets and liabilities and reinvests cash flows from the existing assets and liabilities at market rates to estimate the net interest income for a forward
69
Table of Contents
Index to Financial Statements
looking one-year period. The interest rate scenarios in the table reflect rate shocks that cause an immediate and permanent parallel shift in the market yield curve by the stated magnitude. It also assumes no changes in the composition of the balance sheet over the measurement period. EVE analysis uses the same simulation data to determine the expected cash flows of the assets and liabilities under the shocked interest rate conditions and discounts the cash flows to determine the net present value of the assets and the net present value of the liabilities. The difference between these present values is the market value of the equity or the EVE.
Presented below, as of December 31, 2009, is an analysis of the Company’s interest rate risk as measured by volatility in net interest income and EVE for an instantaneous parallel shift of 100 to 200 basis points in interest rates over the next 12 months:
| Net Interest Income Volatility(1) |
Economic Value of Equity (EVE) Volatility(2) |
|||||
| Change in Interest Rates |
||||||
| +200 bp |
(1.96 | )% | (5.48 | )% | ||
| +100 bp |
(1.59 | ) | (3.16 | ) | ||
| –100 bp |
(0.30 | ) | 3.66 | |||
| –200 bp |
(4.86 | ) | 8.24 |
| (1) | Net interest income volatility is measured as the percentage change in net interest income in the various rate scenarios from the net interest income in a stable interest rate environment. |
| (2) | EVE volatility is measured as the percentage change in the EVE in the various interest rate scenarios from the EVE in a stable interest rate environment. |
Management believes that the simulation methodology overcomes two shortcomings of the typical maturity GAP methodology. First, because the simulation methods project cash flows under differing interest rate environments, it can incorporate the effect of embedded options on an institution’s interest rate risk exposure. It also assumes the reinvestment of financial instruments and their subsequent behavior after the initial maturity or repricing. Second, it allows interest rates on different instruments to change by varying amounts in response to a change in market interest rates, resulting in more realistic estimates of cash flows. As with any method of gauging interest rate risk, however, there are certain shortcomings inherent to the simulation methodology. The model assumes interest rate changes are instantaneous parallel shifts in the yield curve. In reality, rate changes are rarely instantaneous. The use of the simplifying assumption that short-term and long-term rates change by the same degree may also misstate historical rate patterns which rarely show parallel yield curve shifts. Further, the model assumes that certain assets and liabilities of similar maturity or repricing will react identically to changes in rates. In reality, the market value of certain types of financial instruments may adjust in anticipation of changes in market rates, while any adjustment in the valuation of other types of financial instruments may lag behind the change in general market rates. Additionally, the simulation methodology does not reflect the full impact of contractual restrictions on changes in rates for certain assets, such as adjustable rate loans. When interest rates change, actual loan prepayments and actual early withdrawals from time deposits may deviate significantly from the assumptions used in the model. Finally, this methodology does not measure or reflect the impact that higher rates may have on the ability of adjustable rate loan clients to service their debt. All of these factors are considered in monitoring the Company’s exposure to interest rate risk.
The prime rate in effect for December 31, 2009 and 2008 was 3.25%. The Federal Open Markets Committee lowered interest rates a combined 400 basis points during 2008, while leaving rates unchanged in 2009. The Company has mitigated interest rate risk as illustrated above by the reduced volatility on both net interest income and EVE.
Liquidity
Liquidity involves the Company’s ability to maintain adequate cash levels to fund obligations to depositors, borrowers and other creditors, maintain reserve requirements and otherwise operate the Company, all at a reasonable cost. Stability of the funding base is critical to this goal. Liquidity is actively managed on a daily basis
70
Table of Contents
Index to Financial Statements
and supervised by the ALCO according to policies adopted by the Board of Directors. The Company also maintains a contingency funding plan to address funding needs in the event of a local or widespread financial crisis. The key to maintaining a strong liquidity program is the growth and maintenance of a diverse base of core deposits with stable, lower-cost balances. By offering the basic services and products demanded by its customer base, the Company is building these relationships, thereby reducing the need for volatile, high-cost deposits. Through competitive pricing, the Company has extended the contractual maturities of time deposits to further reduce volatility.
The Company’s liquidity needs are met primarily from deposits and advances from both the FHLB of Dallas and the FHLB of San Francisco, supplemented by cash flows from investment securities and loans, other borrowings, security repurchase agreements and earnings through operating activities. Deposit growth can be realized through the existing branch network or purchased from institutional or wholesale funding sources. Although access to purchased funds from brokers has been utilized on occasion to take advantage of opportunities, the Company does not generally rely on these external funding sources. The main uses of funds are for withdrawal of deposits, loan originations, purchase of investment securities and payment of operating expenses.
Management believes the Company has sufficient liquidity or ready access to liquidity to fund all anticipated obligations that could arise in the present economic environment. Access to credit facilities at the Federal Reserve Bank discount window, the FHLB and other correspondent banks ensure the availability of cash for short-term and long-term needs. In addition to overnight borrowings, the Company has used FHLB advances and security repurchase agreements as a longer-term funding source to balance interest rate sensitivity and reduce interest rate risk. FHLB advances and borrowings are collateralized by blanket liens that include one-to-four-family mortgage loans, multi-family mortgage loans, home equity, commercial construction real estate and other commercial real estate loans as noted on MetroBank’s and Metro United’s most current Call Report Data filed with the FDIC which is updated quarterly. In addition, the blanket lien includes investment securities held in safekeeping at the FHLB. At December 31, 2009, the Company had unused borrowing capacity of $391.8 million from the FHLB, $21.8 million from the Federal Reserve Bank discount window, and $10.0 million from other correspondent banks.
Off-Balance Sheet Arrangements
The Company is party to financial instruments with off-balance sheet risk in the normal course of business to meet the financing needs of its customers. These financial instruments include various guarantees, commitments to extend credit and standby letters of credit which may involve, to varying degrees, credit risk in excess of the amount recognized in the consolidated balance sheets. The Company’s maximum exposure to credit loss under such arrangements is represented by the contractual amount of those instruments. The Company applies the same credit policies and collateralization guidelines in making commitments and conditional obligations as it does for on-balance sheet instruments. In addition, the Company conducts a portion of its operations utilizing leased premises and equipment under operating leases.
The contractual amount of the Company’s financial instruments with off-balance sheet risk expiring by period at December 31, 2009 is presented below:
| Within One Year |
After One but Within Three Years |
After Three but Within Five Years |
After Five Years |
Total | |||||||||||
| (Dollars in thousands) | |||||||||||||||
| Unfunded loan commitments including unfunded lines of credit |
$ | 72,358 | $ | 18,530 | $ | 8,115 | $ | 22,163 | $ | 121,166 | |||||
| Standby letters of credit |
8,200 | 2,953 | 662 | 741 | 12,556 | ||||||||||
| Commercial letters of credit |
10,415 | — | — | — | 10,415 | ||||||||||
| Operating leases |
2,181 | 2,327 | 1,127 | 498 | 6,133 | ||||||||||
| Total financial instruments with off-balance sheet risk |
$ | 93,154 | $ | 23,810 | $ | 9,904 | $ | 23,402 | $ | 150,270 | |||||
71
Table of Contents
Index to Financial Statements
Due to the nature of the Company’s unfunded loan commitments, including unfunded lines of credit, the amounts presented above do not necessarily represent amounts the Company anticipates funding in the periods presented above.
Capital Resources
Capital management consists of providing equity to support both current and future operations. The Company is subject to capital adequacy requirements imposed by the Federal Reserve Board, MetroBank is subject to capital adequacy requirements imposed by the OCC and Metro United is subject to capital adequacy requirements imposed by the FDIC. All the regulators have adopted risk-based capital requirements for assessing bank holding company and bank capital adequacy. These standards define capital and establish minimum capital requirements in relation to assets and off-balance sheet exposure, adjusted for credit risk. The risk-based capital standards currently in effect are designed to make regulatory capital requirements more sensitive to differences in risk profiles among bank holding companies and banks, to account for off-balance sheet exposure and to minimize disincentives for holding liquid assets. Assets and off-balance sheet items are assigned to broad risk categories, each with appropriate relative risk weights. The resulting capital ratios represent capital as a percentage of total risk-weighted assets and off-balance sheet items.
Bank regulatory authorities in the United States have issued risk-based capital standards by which all bank holding companies and banks are evaluated in terms of capital adequacy. These guidelines relate a financial institution’s capital to the risk profile of its assets. The risk-based capital standards require all financial institutions to have “Tier 1 capital” of at least 4.0% and “total risk-based” capital (Tier 1 and Tier 2) of at least 8.0% of total risk-adjusted assets. “Tier 1 capital” generally includes common shareholders’ equity and unqualifying noncumulative perpetual preferred stock together with related surpluses and retained earnings, qualifying perpetual preferred stock, trust preferred securities, and minority interest in equity amounts of consolidated subsidiaries, but excluding goodwill and various other intangibles. “Tier 2 capital” may consist of a limited amount of intermediate-term preferred stock, a limited amount of term subordinated debt, certain hybrid capital instruments and other debt securities, perpetual preferred stock not qualifying as Tier 1 capital, and a limited amount of the general valuation allowance for loan losses. The sum of Tier 1 capital and Tier 2 capital is “total risk-based capital.”
The Federal Reserve Board has also adopted guidelines which supplement the risk-based capital guidelines with a minimum ratio of Tier 1 capital to average total consolidated assets (“leverage ratio”) of 3.0% for institutions with well diversified risk, including no undue interest rate exposure; excellent asset quality; high liquidity; good earnings; and that are generally considered to be strong banking organizations, rated composite “1” under applicable federal guidelines, and that are not experiencing or anticipating significant growth. Other banking organizations are required to maintain a leverage ratio of at least 4.0%. These rules further provide that banking organizations experiencing internal growth or making acquisitions will be expected to maintain capital positions substantially above the minimum supervisory levels and comparable to peer group averages, without significant reliance on intangible assets.
Pursuant to FDICIA, each federal banking agency revised its risk-based capital standards to ensure that those standards take adequate account of interest rate risk, concentration of credit risk and the risks of nontraditional activities, as well as reflect the actual performance and expected risk of loss on multifamily mortgages.
Shareholders’ equity at December 31, 2009 was $155.3 million, an increase of $36.1 million or 30.3% compared with shareholders’ equity of $119.2 million at December 31, 2008. This increase was primarily the result of the $45.0 million preferred stock issuance in January 2009, partially offset by the net loss of $7.1 million and the payment of preferred stock dividends for the year ended December 31, 2009 and common stock dividends paid for the first quarter of 2009.
72
Table of Contents
Index to Financial Statements
The following table provides a comparison of the Company’s and the Banks’ leverage and risk-weighted capital ratios as of December 31, 2009 to the minimum and well capitalized regulatory standards:
| Minimum Required For Capital Adequacy Purposes |
To Be Capitalized as Well Capitalized Under Prompt Corrective Action Provisions |
Actual Ratio At December 31, 2009 |
|||||||
| The Company |
|||||||||
| Leverage ratio |
4.00 | %(1) | N/A | 10.76 | % | ||||
| Tier 1 risk-based capital ratio |
4.00 | N/A | 12.54 | ||||||
| Total risk-based capital ratio |
8.00 | N/A | 13.80 | ||||||
| MetroBank |
|||||||||
| Leverage ratio |
4.00 | %(2) | 5.00 | % | 10.69 | % | |||
| Tier 1 risk-based capital ratio |
4.00 | 6.00 | 12.74 | ||||||
| Total risk-based capital ratio |
8.00 | 10.00 | 14.01 | ||||||
| Metro United |
|||||||||
| Leverage ratio |
4.00 | %(3) | 5.00 | % | 10.47 | % | |||
| Tier 1 risk-based capital ratio |
4.00 | 6.00 | 11.48 | ||||||
| Total risk-based capital ratio |
8.00 | 10.00 | 12.74 |
| (1) | The Federal Reserve Board may require the Company to maintain a leverage ratio above the required minimum. |
| (2) | The OCC may require MetroBank to maintain a leverage ratio above the required minimum. |
| (3) | The FDIC may require Metro United to maintain a leverage ratio above the required minimum. |
As of December 31, 2009, $35.0 million in capital securities issued by MCBI Statutory Trust I were included in the Company’s Tier 1 capital for regulatory purposes and $0 were included in Tier 2 capital. As of December 31, 2008, $32.6 million in capital securities issued by MCBI Statutory Trust I were included in the Company’s Tier 1 capital for regulatory purposes and the excess $2.4 million were included in Tier 2 capital. On March 1, 2005, the Federal Reserve adopted final rules that would continue to allow trust preferred securities to be included in Tier 1 capital, subject to stricter quantitative and qualitative limits. Currently, trust preferred securities and qualifying perpetual preferred stock are limited in the aggregate to no more than 25% of a bank holding company’s core capital elements. The new rule amends the existing limit by providing that restricted core capital elements (including trust preferred securities and qualifying perpetual preferred stock) can be no more than 25% of core capital, net of goodwill and associated deferred tax liability. Because the 25% limit currently is calculated without deducting goodwill, the final rule reduces the amount of trust preferred securities that the Company can include in Tier 1 capital. The amount of such excess trust preferred securities are includable in Tier 2 capital. The new quantitative limits will be fully effective on March 31, 2011.
MCBI Statutory Trust I holds junior subordinated debentures the Company issued with a 30-year maturity. The final rules provide that in the last five years before the junior subordinated debentures mature, the associated trust preferred securities will be excluded from Tier 1 capital and included in Tier 2 capital, subject (together with subordinated debt and certain other investments) to an aggregate limit of 50% of Tier I capital. In addition, the trust preferred securities during this five-year period would be amortized out of Tier 2 capital by one-fifth each year and excluded from Tier 2 capital completely during the year prior to maturity of the debentures.
New Accounting Pronouncements
See Note 1, “Summary of Significant Accounting Policies” of the Notes to consolidated financial statements for details of recently issued accounting pronouncements and their expected impact on the Company’s financial statements.
73
Table of Contents
Index to Financial Statements
| Item 7A. | Quantitative and Qualitative Disclosure About Market Risk |
For information regarding the market risk of the Company’s financial instruments, see “Item 7. Management’s Discussion and Analysis of Financial Condition and Results of Operations—Interest Rate Sensitivity and Market Risk.” The Company’s principal market risk exposure is to interest rates.
As discussed in “Item 7. Management’s Discussion and Analysis of Financial Condition and Results of Operations—Junior Subordinated Debentures”, the Company entered into a forward starting interest rate swap contract on the junior subordinated debentures with a notional amount of $17.5 million. This transaction was designed as a cash flow hedge to effectively fix the interest payment on the variable rate debentures and reduce market risk of future earnings volatility. The five-year swap contract commences on December 15, 2010 at which time the Company will pay on a quarterly basis beginning March 2011, a fixed rate of 5.38% and receive a variable interest rate of three-month LIBOR plus a margin of 1.55% on the notional amount. The effects on net interest income for the next 12 months of hypothetical fluctuations in interest rates on this swap contract are not significant, and as such, separate quantitative disclosure is not presented.
| Item 8. | Financial Statements and Supplementary Data |
Reference is made to the financial statements, the reports thereon, the notes thereto commencing at page 82 of this Annual Report on Form 10-K, which financial statements, reports, notes and data are incorporated herein by reference.
Quarterly Financial Data (Unaudited)
The following table represents summarized data for each of the quarters in fiscal 2009 and 2008 (in thousands, except per share data):
| 2009 | 2008 | ||||||||||||||||||||||||||||
| Fourth Quarter |
Third Quarter |
Second Quarter |
First Quarter |
Fourth Quarter |
Third Quarter |
Second Quarter |
First Quarter | ||||||||||||||||||||||
| Interest income |
$ | 20,749 | $ | 21,822 | $ | 22,054 | $ | 21,709 | $ | 23,466 | $ | 23,894 | $ | 24,601 | $ | 25,069 | |||||||||||||
| Interest expense |
6,533 | 7,207 | 8,390 | 8,911 | 9,451 | 10,074 | 10,132 | 11,074 | |||||||||||||||||||||
| Net interest income |
14,216 | 14,615 | 13,664 | 12,798 | 14,015 | 13,820 | 14,469 | 13,995 | |||||||||||||||||||||
| Provision for loan losses |
13,003 | 3,596 | 1,827 | 7,287 | 11,846 | 1,754 | 1,465 | 1,584 | |||||||||||||||||||||
| Net interest income after provision for loan losses |
1,213 | 11,019 | 11,837 | 5,511 | 2,169 | 12,066 | 13,004 | 12,411 | |||||||||||||||||||||
| Noninterest income |
2,635 | 1,965 | 1,879 | 1,690 | 1,585 | 1,913 | 838 | 2,129 | |||||||||||||||||||||
| Noninterest expense |
14,117 | 11,286 | 12,074 | 10,331 | 11,256 | 10,598 | 10,258 | 10,963 | |||||||||||||||||||||
| Income (loss) before income taxes |
(10,269 | ) | 1,698 | 1,642 | (3,130 | ) | (7,502 | ) | 3,381 | 3,584 | 3,577 | ||||||||||||||||||
| Provision (benefit) for income taxes |
(2,941 | ) | 560 | 490 | (1,096 | ) | (2,758 | ) | 1,305 | 1,316 | 1,342 | ||||||||||||||||||
| Net income (loss) |
$ | (7,328 | ) | $ | 1,138 | $ | 1,152 | $ | (2,034 | ) | $ | (4,744 | ) | $ | 2,076 | $ | 2,268 | $ | 2,235 | ||||||||||
| Dividend—preferred stock |
(563 | ) | (563 | ) | (562 | ) | (469 | ) | — | — | — | — | |||||||||||||||||
| Net income (loss) available to common shareholders |
$ | (7,891 | ) | $ | 575 | $ | 590 | $ | (2,503 | ) | $ | (4,744 | ) | $ | 2,076 | $ | 2,268 | $ | 2,235 | ||||||||||
| Earnings (loss) per share: |
|||||||||||||||||||||||||||||
| Basic |
$ | (0.72 | ) | $ | 0.05 | $ | 0.05 | $ | (0.23 | ) | $ | (0.44 | ) | $ | 0.19 | $ | 0.21 | $ | 0.21 | ||||||||||
| Diluted |
$ | (0.72 | ) | $ | 0.05 | $ | 0.05 | $ | (0.23 | ) | $ | (0.44 | ) | $ | 0.19 | $ | 0.21 | $ | 0.21 | ||||||||||
| Weighted average shares outstanding: |
|||||||||||||||||||||||||||||
| Basic |
10,916 | 10,915 | 10,906 | 10,875 | 10,861 | 10,842 | 10,819 | 10,811 | |||||||||||||||||||||
| Diluted |
10,916 | 10,923 | 10,912 | 10,875 | 10,861 | 10,911 | 10,899 | 10,897 | |||||||||||||||||||||
| Dividends per common share |
$ | — | $ | — | $ | — | $ | 0.04 | $ | 0.04 | $ | 0.04 | $ | 0.04 | $ | 0.04 | |||||||||||||
74
Table of Contents
Index to Financial Statements
| Item 9. | Changes in and Disagreements With Accountants on Accounting and Financial Disclosure |
There were no changes in or disagreements with accountants on accounting principles or practices or financial disclosure.
| Item 9A. | Controls and Procedures |
Evaluation of Disclosure Controls and Procedures. As of the end of the period covered by this report, the Company has carried out an evaluation, under the supervision and with the participation of the Company’s management, including the Chief Executive Officer and Chief Financial Officer, of the effectiveness of the design and operation of the Company’s disclosure controls and procedures. As defined in Rule 13a-15(e) and 15d-15(e) under the Securities Exchange Act of 1934, as amended (the “Exchange Act”), disclosure controls and procedures are controls and procedures designed to ensure that information required to be disclosed in reports filed or submitted under the Exchange act is recorded, processed, summarized and reported within the time periods specified by the SEC’s rules and forms and that such information is accumulated and communicated to the Company’s management, including its Chief Executive Officer and Chief Financial Officer, as appropriate, to allow timely decisions regarding required financial disclosure. Based upon their evaluation and because of the material weakness in the Company’s internal control over financial reporting described below, the Chief Executive Officer and Chief Financial Officer concluded that the Company’s disclosure controls and procedures were not effective as of December 31, 2009.
Management’s Annual Report on Internal Control Over Financial Reporting
The management of the Company is responsible for establishing and maintaining adequate internal control over financial reporting (as defined in Exchange Act Rule 13a-15(f)). Internal control over financial reporting is a process designed by or under the supervision of, our Chief Executive Officer and Chief Financial Officer to provide reasonable assurance regarding the reliability of financial reporting and the preparation of financial statements for external purposes in accordance with generally accepted accounting principles in the United States of America. A company’s internal control over financial reporting includes those policies and procedures that (i) pertain to the maintenance of records that, in reasonable detail, accurately and fairly reflect the transactions and dispositions of the assets of the company; (ii) provide reasonable assurance that transactions are recorded as necessary to permit preparation of financial statements in accordance with generally accepted accounting principles, and that receipts and expenditures of the company are being made only in accordance with authorizations of management and directors of the company; and (iii) provide reasonable assurance regarding prevention or timely detection of unauthorized acquisition, use, or disposition of the company’s assets that could have a material effect on the financial statements.
Because of its inherent limitations, internal control over financial reporting may not prevent or detect misstatements. Also, projections of any evaluation of effectiveness to future periods are subject to the risk that controls may become inadequate because of changes in conditions, or that the degree of compliance with the policies or procedures may deteriorate.
As of December 31, 2009, management, including the Chief Executive Officer and Chief Financial Officer, assessed the effectiveness of the Company’s internal control over financial reporting based on the criteria established in “Internal Control—Integrated Framework” issued by the Committee of Sponsoring Organizations of the Treadway Commission (“COSO”).
A material weakness is a control deficiency, or combination of control deficiencies, that results in more than a remote likelihood that a material misstatement of the annual or interim financial statements will not be prevented or detected. Based upon this assessment, management believes that, as of December 31, 2009, there was a control deficiency that constituted a material weakness. As of December 31, 2009, the Company did not maintain effective controls over the monitoring of nonperforming loans. Specifically, the Company’s internal
75
Table of Contents
Index to Financial Statements
controls over the staffing of nonperforming loan monitoring were not operating effectively to ensure that certain loans were identified in the appropriate risk grade and assigned an appropriate level of the allowance for loan losses. This control deficiency was partially responsible for a revision of earnings relating to the Company’s three and twelve month periods ended December 31, 2009 to reflect an increase in the provision for loan losses. The Company is not restating any prior period financial statements. This control deficiency, if not remediated, could materially affect the Company’s provision for loan losses, allowance for loan losses, and related disclosures which would result in a material misstatement of the Company’s consolidated financial statements that would not be prevented or detected on a timely basis.
Accordingly, management determined that this control deficiency constitutes a material weakness in internal control over financial reporting as of December 31, 2009.
Remediation of Material Weakness
The Company has been actively remediating this material weakness by assigning dedicated and experienced resources at the Company with the responsibility of monitoring loans and related risk grade changes. More specifically, MetroBank has created a senior vice president position and has hired an experienced individual for this task. MetroBank intends to create and fill an additional position and provide the necessary training to improve the timeliness of loan grade changes. The Company intends to continue to monitor, evaluate and test the operating effectiveness of these controls.
The effectiveness of the Company’s internal control over financial reporting as of December 31, 2009, has been audited by PricewaterhouseCoopers LLP, an independent registered public accounting firm, as stated in their report which appears herein.
Changes in internal control over financial reporting. Other than the identification of the material weakness described above, there have been no other changes in the Company’s internal control over financial reporting that occurred during the quarter ended December 31, 2009 that have materially affected, or are reasonably likely to materially affect, the Company’s internal control over financial reporting.
| Item 9B. | Other Information |
None.
76
Table of Contents
Index to Financial Statements
| Item 10. | Directors, Executive Officers and Corporate Governance |
The information under the captions “Election of Directors,” “Continuing Directors and Executive Officers,” “Section 16(a) Beneficial Ownership Reporting Compliance,” “Corporate Governance—Committees of the Board—Audit Committee,” “Corporate Governance—Director Nominations Process” and “Corporate Governance—Code of Ethics” in the Company’s definitive Proxy Statement for its 2010 Annual Meeting of Shareholders to be filed with the Securities and Exchange Commission within 120 days after December 31, 2009 pursuant to Regulation 14A under the Exchange Act (the “2010 Proxy Statement”), is incorporated herein by reference in response to this item.
| Item 11. | Executive Compensation |
The information under the captions “Executive Compensation and Other Matters” and “Director Compensation” in the 2010 Proxy Statement is incorporated herein by reference in response to this item.
| Item 12. | Security Ownership of Certain Beneficial Owners and Management and Related Shareholder Matters |
Certain information required by this Item 12 is included under “Securities Authorized for Issuance Under Equity Compensation Plans” in Part II, Item 5 of this Annual Report on Form 10-K. The information under the caption “Beneficial Ownership of Common Stock by Management of the Company and Principal Shareholders” in the 2010 Proxy Statement is incorporated herein by reference in response to this item.
| Item 13. | Certain Relationships and Related Transactions, and Director Independence |
The information under the captions “Corporate Governance—Director Independence” and “Certain Relationships and Related Transactions” in the 2010 Proxy Statement is incorporated herein by reference in response to this item.
| Item 14. | Principal Accountant Fees and Services |
The information under the caption “Independent Registered Public Accounting Firm Fees and Services” in the 2010 Proxy Statement is incorporated herein by reference in response to this item.
77
Table of Contents
Index to Financial Statements
| Item 15. | Exhibits and Financial Statement Schedules |
Consolidated Financial Statements and Financial Statement Schedules
(a) The following documents are filed as part of this Annual Report on Form 10-K:
1. Consolidated Financial Statements. Reference is made to the Consolidated Financial Statements, the report thereon and the notes thereto commencing on page 82 of this Annual Report on Form 10-K. Set forth below is a list of such Consolidated Financial Statements:
Report of Independent Registered Public Accounting Firm
Consolidated Balance Sheets as of December 31, 2009 and 2008
Consolidated Statements of Operations for the Years Ended December 31, 2009, 2008, and 2007
Consolidated Statements of Comprehensive Income (Loss) for the Years Ended December 31, 2009, 2008, and 2007
Consolidated Statements of Changes in Shareholders’ Equity for the Years Ended December 31, 2009, 2008, and 2007
Consolidated Statements of Cash Flows for the Years Ended December 31, 2009, 2008, and 2007
Notes to Consolidated Financial Statements
2. Financial Statement Schedules. All supplemental schedules are omitted as inapplicable or because the required information is included in the Consolidated Financial Statements or notes thereto.
3. The exhibits to this Annual Report on Form 10-K listed below have been included only with the copy of this report filed with the Securities and Exchange Commission. The Company will furnish a copy of any exhibit to shareholders upon written request to the Company and payment of a reasonable fee.
| Exhibit Number(1) |
Description | |
| 2.1 | Letter Agreement, dated January 16, 2009, including the Securities Purchase Agreement—Standard Terms incorporated by reference therein, by and between the Company and the United States Department of the Treasury (incorporated herein by reference to Exhibit 10.1 to the Company’s Current Report on Form 8-K filed on January 21, 2009). | |
| 3.1 | Amended and Restated Articles of Incorporation of the Company (incorporated herein by reference to Exhibit 3.1 to the Company’s Registration Statement on Form S-1 (Registration No. 333-62667) (the “Registration Statement”)). | |
| 3.2 | Articles of Amendment to the Articles of Incorporation of the Company (incorporated herein by reference to Exhibit 3.2 to the Company’s Quarterly Report on Form 10-Q for the quarter ended March 31, 2008). | |
| 3.3 | Statement of Designations establishing the terms of the Series A Preferred Stock of the Company (incorporated herein by reference to Exhibit 3.1 to the Company’s Current Report on Form 8-K filed on January 21, 2009). | |
| 3.4 | Amended and Restated Bylaws of the Company (incorporated herein by reference to Exhibit 3.1 to the Company’s Current Report of Form 8-K filed on November 19, 2007). | |
| 4.1 | Specimen form of certificate evidencing the Common Stock (incorporated herein by reference to Exhibit 4 to the Registration Statement). | |
78
Table of Contents
Index to Financial Statements
| Exhibit Number(1) |
Description | |
| 4.2 | Warrant, dated January 16, 2009, to purchase 771,429 shares of the Company’s Common Stock (incorporated herein by reference to Exhibit 4.1 to the Company’s Current Report on Form 8-K filed on January 21, 2009). | |
| 4.3 | Form of Certificate for the Company’s Fixed Rate Cumulative Perpetual Preferred Stock, Series A, par value $1.00 per share (incorporated herein by reference to Exhibit 4.2 to the Company’s Current Report on Form 8-K filed on January 21, 2009). | |
| 10.1† | MetroCorp Bancshares, Inc. 1998 Stock Incentive Plan (incorporated herein by reference to Exhibit 10.5 to the Registration Statement). | |
| 10.2† | MetroCorp Bancshares, Inc. 2007 Stock Awards and Incentive Plan, as amended (incorporated herein by reference to Exhibit 4.2 to the Company’s Registration Statement of Form S-8 (Registration No. 333-160112)). | |
| 10.3† | Form of Incentive Stock Option Agreement under the 2007 Stock Awards and Incentive Plan (incorporated herein by reference to Exhibit 4.3 to the Company’s Registration Statement on Form S-8 (Registration No. 333-143502) the “S-8 Registration Statement”)). | |
| 10.4† | Form of Non Qualified Stock Option Agreement under the 2007 Stock Awards and Incentive Plan (incorporated herein by reference to Exhibit 4.4 of the S-8 Registration Statement). | |
| 10.5† | Form of Stock Appreciation Rights Agreement under the 2007 Stock Awards and Incentive Plan (incorporated herein by reference to Exhibit 4.5 of the S-8 Registration Statement). | |
| 10.6† | Form of Restricted Stock Agreement under the 2007 Stock Awards and Incentive Plan (incorporated herein by reference to Exhibit 4.6 of the S-8 Registration Statement). | |
| 10.7† | First Amendment to the Employment Agreement between the Company and George M. Lee dated as of December 31, 2008 (incorporated herein by reference to the Company’s Current Report on Form 8-K filed on January 6, 2009). | |
| 10.8† | Letter Agreement between MetroBank, N.A. and David Tai dated as of February 14, 2005 (incorporated herein by reference to Exhibit 10.7 to the Company’s Annual Report on Form 10-K for the year ended December 31, 2006). | |
| 10.9† | Letter Agreement between MetroBank, N.A. and David Choi dated as of February 14, 2005 (incorporated herein by reference to Exhibit 10.8 to the Company’s Annual Report on Form 10-K for the year ended December 31, 2006). | |
| 10.10† | Letter Agreement between MetroBank, N.A. and Terry Tangen dated as of February 14, 2005 (incorporated herein by reference to Exhibit 10.9 to the Company’s Annual Report on Form 10-K for the year ended December 31, 2006). | |
| 10.11 | Form of Waiver, executed by each of George M. Lee, David C. Choi, David Tai and Terrance J. Tangen (incorporated herein by reference to Exhibit 10.2 to the Company’s Current Report on Form 8-K filed on January 21, 2009). | |
| 10.12† | Form of Executive Compensation Letter Agreement, executed by each of George M. Lee, David C. Choi, David Tai and Terrance J. Tangen (incorporated herein by reference to Exhibit 10.3 to the Company’s Current Report on Form 8-K filed on January 21, 2009). | |
| 11 | Computation of Earnings Per Common Share, included as Note (16) to the Consolidated Financial Statements of this Form 10-K. | |
| 21 | Subsidiaries of MetroCorp Bancshares, Inc. (incorporated herein by reference to Exhibit 21 of the Company’s Annual Report on Form 10-K for the year ended December 31, 2006). | |
79
Table of Contents
Index to Financial Statements
| Exhibit Number(1) |
Description | |
| 23.1* | Consent of PricewaterhouseCoopers LLP. | |
| 31.1* | Certification of the Chief Executive Officer pursuant to Rule 13a-14(a) of the Securities Exchange Act of 1934, as amended. | |
| 31.2* | Certification of the Chief Financial Officer pursuant to Rule 13a-14(a) of the Securities Exchange Act of 1934, as amended. | |
| 32.1** | Certification of the Chief Executive Officer pursuant to 18 U.S.C Section 1350, as adopted pursuant to Section 906 of the Sarbanes-Oxley Act of 2002. | |
| 32.2** | Certification of the Chief Financial Officer pursuant to 18 U.S.C. Section 1350, as adopted pursuant to Section 906 of the Sarbanes Oxley Act of 2002. | |
| 99.1* | Certification of the Chief Executive Officer and Chief Financial Officer pursuant to Section 111(b)(4) of the Emergency Economic Stabilization Act of 2008. | |
| (1) | The Company has other long-term debt agreements that meet the exclusion set forth in Section 601(b)(4)(iii)(A) of Regulation S-K. The Company hereby agrees to furnish a copy of such agreements to Securities and Exchange Commission upon request. |
| † | Management contract or compensatory plan or arrangement. |
| * | Filed herewith. |
| ** | Furnished herewith. |
| (b) | Exhibits. See the exhibit list included in Item 15(a)3 of this Annual Report on Form 10-K. |
| (c) | Financial Statement Schedules. See Item 15(a)2 of this Annual Report on Form 10-K. |
80
Table of Contents
Index to Financial Statements
Pursuant to the requirements of Section 13 or 15(d) of the Securities Exchange Act of 1934, the registrant has duly caused this report to be signed on its behalf by the undersigned, thereunto duly authorized, in the City of Houston.
| METROCORP BANCSHARES, INC. (Registrant) | ||||
| Date: March 18, 2010 |
By: | /s/ GEORGE M. LEE | ||
| George M. Lee Executive Vice Chairman, President and Chief Executive Officer (principal executive officer) | ||||
Pursuant to the requirements of the Securities Exchange Act of 1934, this report has been signed below by the following persons in the capacities on the dates indicated.
| Signature |
Title |
Date | ||
| /s/ DON J. WANG Don J. Wang |
Chairman of the Board | March 18, 2010 | ||
| /s/ GEORGE M. LEE George M. Lee |
Executive Vice Chairmen, President and Chief Executive Officer (principal executive officer) | March 18, 2010 | ||
| /s/ DAVID TAI David Tai |
Director | March 18, 2010 | ||
| /s/ DAVID C. CHOI David C. Choi |
Chief Financial Officer (principal financial officer and principal accounting officer) | March 18, 2010 | ||
| /s/ KRISHNAN BALASUBRAMANIAN Krishnan Balasubramanian |
Director | March 18, 2010 | ||
| /s/ HELEN F. CHEN Helen F. Chen |
Director | March 18, 2010 | ||
| /s/ MAY P. CHU May P. Chu |
Director | March 18, 2010 | ||
| /s/ SHIRLEY L. CLAYTON Shirley L. Clayton |
Director | March 18, 2010 | ||
| /s/ ROBERT W. HSUEH Robert W. Hsueh |
Director | March 18, 2010 | ||
| /s/ JOHN LEE John Lee |
Director | March 18, 2010 | ||
| /s/ CHARLES L. ROFF Charles L. Roff |
Director | March 18, 2010 | ||
| /s/ JOE TING Joe Ting |
Director | March 18, 2010 | ||
| /s/ SAISHI FRANK LI Saishi Frank Li |
Director | March 18, 2010 | ||
81
Table of Contents
Index to Financial Statements
INDEX TO CONSOLIDATED FINANCIAL STATEMENTS
METROCORP BANCSHARES, INC. AND SUBSIDIARIES
82
Table of Contents
Index to Financial Statements
REPORT OF INDEPENDENT REGISTERED PUBLIC ACCOUNTING FIRM
To the Board of Directors and Shareholders of
MetroCorp Bancshares, Inc.:
In our opinion, the consolidated financial statements listed in the accompanying index, present fairly, in all material respects, the financial position of MetroCorp Bancshares, Inc. and its subsidiaries (the “Company”) at December 31, 2009 and 2008, and the results of their operations and their cash flows for each of the three years in the period ended December 31, 2009 in conformity with accounting principles generally accepted in the United States of America. Also in our opinion, the Company did not maintain, in all material respects, effective internal control over financial reporting as of December 31, 2009, based on criteria established in Internal Control—Integrated Framework issued by the Committee of Sponsoring Organizations of the Treadway Commission (COSO) because a material weakness in internal control over financial reporting related to the monitoring of non-performing loans existed as of that date. A material weakness is a deficiency, or a combination of deficiencies, in internal control over financial reporting, such that there is a reasonable possibility that a material misstatement of the annual or interim financial statements will not be prevented or detected on a timely basis. The material weakness referred to above is described in Management’s Annual Report on Internal Control over Financial Reporting under Item 9A. We considered this material weakness in determining the nature, timing, and extent of audit tests applied in our audit of the December 31, 2009 financial statements, and our opinion regarding the effectiveness of the Company’s internal control over financial reporting does not affect our opinion on those consolidated financial statements. The Company’s management is responsible for these financial statements, for maintaining effective internal control over financial reporting and for its assessment of the effectiveness of internal control over financial reporting included in management’s report referred to above. Our responsibility is to express opinions on these financial statements and on the Company’s internal control over financial reporting based on our integrated audits. We conducted our audits in accordance with the standards of the Public Company Accounting Oversight Board (United States). Those standards require that we plan and perform the audits to obtain reasonable assurance about whether the financial statements are free of material misstatement and whether effective internal control over financial reporting was maintained in all material respects. Our audits of the financial statements included examining, on a test basis, evidence supporting the amounts and disclosures in the financial statements, assessing the accounting principles used and significant estimates made by management, and evaluating the overall financial statement presentation. Our audit of internal control over financial reporting included obtaining an understanding of internal control over financial reporting, assessing the risk that a material weakness exists, and testing and evaluating the design and operating effectiveness of internal control based on the assessed risk. Our audits also included performing such other procedures as we considered necessary in the circumstances. We believe that our audits provide a reasonable basis for our opinions.
As discussed in Note 3 to the consolidated financial statements, the Company changed the manner in which it accounts for other-than-temporary impairment related to investment securities in 2009.
A company’s internal control over financial reporting is a process designed to provide reasonable assurance regarding the reliability of financial reporting and the preparation of financial statements for external purposes in accordance with generally accepted accounting principles. A company’s internal control over financial reporting includes those policies and procedures that (i) pertain to the maintenance of records that, in reasonable detail, accurately and fairly reflect the transactions and dispositions of the assets of the company; (ii) provide reasonable assurance that transactions are recorded as necessary to permit preparation of financial statements in accordance with generally accepted accounting principles, and that receipts and expenditures of the company are being made only in accordance with authorizations of management and directors of the company; and (iii) provide reasonable assurance regarding prevention or timely detection of unauthorized acquisition, use, or disposition of the company’s assets that could have a material effect on the financial statements.
Because of its inherent limitations, internal control over financial reporting may not prevent or detect misstatements. Also, projections of any evaluation of effectiveness to future periods are subject to the risk that controls may become inadequate because of changes in conditions, or that the degree of compliance with the policies or procedures may deteriorate.
/s/ PricewaterhouseCoopers LLP
Houston, Texas
March 18, 2010
83
Table of Contents
Index to Financial Statements
CONSOLIDATED BALANCE SHEETS
(In thousands, except share amounts)
| December 31, | ||||||||
| 2009 | 2008 | |||||||
| ASSETS | ||||||||
| Cash and due from banks |
$ | 26,087 | $ | 26,383 | ||||
| Federal funds sold and other short-term investments |
82,006 | 11,718 | ||||||
| Total cash and cash equivalents |
108,093 | 38,101 | ||||||
| Securities held-to-maturity, at cost (fair value $4,352 at December 31, 2009) |
4,044 | — | ||||||
| Securities available-for-sale, at fair value |
98,368 | 102,104 | ||||||
| Other investments |
21,577 | 29,220 | ||||||
| Loans, net of allowance for loan losses of $29,403 and $24,235, respectively |
1,244,594 | 1,321,813 | ||||||
| Accrued interest receivable |
5,161 | 5,946 | ||||||
| Premises and equipment, net |
6,042 | 7,368 | ||||||
| Goodwill |
19,327 | 21,827 | ||||||
| Core deposit intangibles |
329 | 506 | ||||||
| Deferred tax asset |
14,443 | 11,479 | ||||||
| Customers’ liability on acceptances |
3,011 | 8,012 | ||||||
| Foreclosed assets, net |
22,291 | 4,825 | ||||||
| Cash value of bank owned life insurance |
28,526 | 27,090 | ||||||
| Prepaid FDIC assessment |
10,637 | — | ||||||
| Other assets |
3,105 | 1,947 | ||||||
| Total assets |
$ | 1,589,548 | $ | 1,580,238 | ||||
| LIABILITIES AND SHAREHOLDERS’ EQUITY | ||||||||
| Deposits: |
||||||||
| Noninterest-bearing |
$ | 203,427 | $ | 204,107 | ||||
| Interest-bearing |
1,160,740 | 1,065,046 | ||||||
| Total deposits |
1,364,167 | 1,269,153 | ||||||
| Junior subordinated debentures |
36,083 | 36,083 | ||||||
| Other borrowings |
25,513 | 139,046 | ||||||
| Accrued interest payable |
625 | 1,279 | ||||||
| Acceptances outstanding |
3,011 | 8,012 | ||||||
| Other liabilities |
4,843 | 7,506 | ||||||
| Total liabilities |
1,434,242 | 1,461,079 | ||||||
| Commitments and contingencies |
— | — | ||||||
| Shareholders’ equity: |
||||||||
| Preferred stock, $1.00 par value, 2,000,000 shares authorized; 45,000 shares issued and outstanding at December 31, 2009 and none at December 31, 2008 |
44,718 | — | ||||||
| Common stock, $1.00 par value, 50,000,000 shares authorized; 10,994,965 shares issued and 10,926,315 shares and 10,885,081 shares outstanding at December 31, 2009 and 2008, respectively |
10,995 | 10,995 | ||||||
| Additional paid-in-capital |
29,114 | 28,222 | ||||||
| Retained earnings |
72,505 | 82,311 | ||||||
| Accumulated other comprehensive loss |
(1,106 | ) | (910 | ) | ||||
| Treasury stock, at cost, 68,650 and 109,884 shares at December 31, 2009 and 2008, respectively |
(920 | ) | (1,459 | ) | ||||
| Total shareholders’ equity |
155,306 | 119,159 | ||||||
| Total liabilities and shareholders’ equity |
$ | 1,589,548 | $ | 1,580,238 | ||||
The accompanying notes are an integral part of these consolidated financial statements.
84
Table of Contents
Index to Financial Statements
CONSOLIDATED STATEMENTS OF OPERATIONS
(In thousands, except per share amounts)
| Years Ended December 31, | |||||||||||
| 2009 | 2008 | 2007 | |||||||||
| Interest income: |
|||||||||||
| Loans |
$ | 81,366 | $ | 90,715 | $ | 92,556 | |||||
| Securities: |
|||||||||||
| Taxable |
3,971 | 5,006 | 6,909 | ||||||||
| Tax-exempt |
322 | 231 | 307 | ||||||||
| Other investments |
470 | 653 | 275 | ||||||||
| Federal funds sold and other short-term investments |
205 | 425 | 2,251 | ||||||||
| Total interest income |
86,334 | 97,030 | 102,298 | ||||||||
| Interest expense: |
|||||||||||
| Time deposits |
20,076 | 26,690 | 32,140 | ||||||||
| Demand and savings deposits |
7,881 | 8,653 | 9,967 | ||||||||
| Junior subordinated debentures |
2,079 | 2,079 | 2,039 | ||||||||
| Subordinated debentures and other borrowings |
1,005 | 3,309 | 1,246 | ||||||||
| Total interest expense |
31,041 | 40,731 | 45,392 | ||||||||
| Net interest income |
55,293 | 56,299 | 56,906 | ||||||||
| Provision for loan losses |
25,713 | 16,649 | 3,145 | ||||||||
| Net interest income after provision for loan losses |
29,580 | 39,650 | 53,761 | ||||||||
| Noninterest income: |
|||||||||||
| Service fees |
4,393 | 4,839 | 5,175 | ||||||||
| Loan-related fees |
1,522 | 1,721 | 1,511 | ||||||||
| Gain (loss) on securities, net |
1,220 | 91 | 2 | ||||||||
| Total other-than-temporary-impairment (“OTTI”) on securities |
(2,095 | ) | (1,961 | ) | — | ||||||
| Less: Noncredit portion of “OTTI” |
1,387 | — | — | ||||||||
| Net impairments on securities |
(708 | ) | (1,961 | ) | — | ||||||
| Gain on sale of loans |
— | 288 | 277 | ||||||||
| Other noninterest income |
1,742 | 1,487 | 1,323 | ||||||||
| Total noninterest income |
8,169 | 6,465 | 8,288 | ||||||||
| Noninterest expense: |
|||||||||||
| Salaries and employee benefits |
20,406 | 24,298 | 24,846 | ||||||||
| Occupancy and equipment |
7,908 | 8,128 | 8,157 | ||||||||
| Foreclosed assets, net |
4,107 | 289 | 278 | ||||||||
| Legal and other professional fees |
2,360 | 1,935 | 1,443 | ||||||||
| FDIC Assessment |
3,915 | 617 | 173 | ||||||||
| Goodwill impairment |
2,500 | — | — | ||||||||
| Other noninterest expense |
6,612 | 7,808 | 8,038 | ||||||||
| Total noninterest expense |
47,808 | 43,075 | 42,935 | ||||||||
| Income (loss) before provision for income taxes |
(10,059 | ) | 3,040 | 19,114 | |||||||
| Provision (benefit) for income taxes |
(2,987 | ) | 1,205 | 6,939 | |||||||
| Net income (loss) |
$ | (7,072 | ) | $ | 1,835 | $ | 12,175 | ||||
| Dividends—preferred stock |
2,157 | — | — | ||||||||
| Net income (loss) available to common shareholders |
$ | (9,229 | ) | $ | 1,835 | $ | 12,175 | ||||
| Earnings (loss) per common share: |
|||||||||||
| Basic |
$ | (0.85 | ) | $ | 0.17 | $ | 1.11 | ||||
| Diluted |
$ | (0.85 | ) | $ | 0.17 | $ | 1.10 | ||||
| Weighted average shares outstanding: |
|||||||||||
| Basic |
10,904 | 10,833 | 10,935 | ||||||||
| Diluted |
10,904 | 10,897 | 11,110 | ||||||||
| Dividends per common share |
$ | 0.04 | $ | 0.16 | $ | 0.16 | |||||
The accompanying notes are an integral part of these consolidated financial statements.
85
Table of Contents
Index to Financial Statements
CONSOLIDATED STATEMENTS OF COMPREHENSIVE INCOME (LOSS)
(In thousands)
| Years Ended December 31, | |||||||||||
| 2009 | 2008 | 2007 | |||||||||
| Net income (loss) |
$ | (7,072 | ) | $ | 1,835 | $ | 12,175 | ||||
| Other comprehensive income (loss), net of tax: |
|||||||||||
| Change in accumulated loss on effective cash flow derivatives |
(39 | ) | — | — | |||||||
| Unrealized gains (losses) on investment securities, net of tax: |
|||||||||||
| Securities with OTTI charges during the period |
(1,341 | ) | (317 | ) | — | ||||||
| Less: OTTI charges recognized in net income |
(453 | ) | (317 | ) | — | ||||||
| Net unrealized losses on investment securities with OTTI |
(888 | ) | — | — | |||||||
| Unrealized holding gains (losses) arising during the period |
1,512 | (66 | ) | 1,636 | |||||||
| Less: reclassification adjustment for gains included in net income |
781 | 58 | 1 | ||||||||
| Net unrealized gains (losses) on investment securities |
731 | (124 | ) | 1,635 | |||||||
| Other comprehensive income (loss) |
(196 | ) | (124 | ) | 1,635 | ||||||
| Total comprehensive income (loss) |
$ | (7,268 | ) | $ | 1,711 | $ | 13,810 | ||||
The accompanying notes are an integral part of these consolidated financial statements.
86
Table of Contents
Index to Financial Statements
CONSOLIDATED STATEMENTS OF CHANGES IN SHAREHOLDERS’ EQUITY
Years Ended December 31, 2009, 2008 and 2007
(In thousands)
| Preferred Stock | Common Stock | Additional Paid-In Capital |
Retained Earnings |
Accumulated Other Comprehensive Income (Loss) |
Treasury Stock At Cost |
Total | |||||||||||||||||||||||||
| Shares | At Par | Shares | At Par | ||||||||||||||||||||||||||||
| Balance at December 31, 2006 |
— | — | 10,946 | $ | 10,995 | $ | 25,974 | $ | 71,783 | $ | (2,421 | ) | $ | (383 | ) | $ | 105,948 | ||||||||||||||
| Re-issuance of treasury stock |
— | — | 47 | — | 459 | — | — | 368 | 827 | ||||||||||||||||||||||
| Repurchase of common stock |
— | — | (167 | ) | — | — | — | — | (2,381 | ) | (2,381 | ) | |||||||||||||||||||
| Stock-based compensation expense related to stock options recognized in earnings |
— | — | — | — | 953 | — | — | — | 953 | ||||||||||||||||||||||
| Net income |
— | — | — | — | — | 12,175 | — | — | 12,175 | ||||||||||||||||||||||
| Other comprehensive income |
— | — | — | — | — | — | 1,635 | — | 1,635 | ||||||||||||||||||||||
| Dividends ($0.16 per share) |
— | — | — | — | — | (1,747 | ) | — | — | (1,747 | ) | ||||||||||||||||||||
| Balance at December 31, 2007 |
— | — | 10,826 | 10,995 | 27,386 | 82,211 | (786 | ) | (2,396 | ) | 117,410 | ||||||||||||||||||||
| Re-issuance of treasury stock |
— | — | 59 | — | (292 | ) | — | — | 937 | 645 | |||||||||||||||||||||
| Stock-based compensation expense related to stock options recognized in earnings |
— | — | — | — | 1,128 | — | — | — | 1,128 | ||||||||||||||||||||||
| Net income |
— | — | — | — | — | 1,835 | — | — | 1,835 | ||||||||||||||||||||||
| Other comprehensive loss |
— | — | — | — | — | — | (124 | ) | — | (124 | ) | ||||||||||||||||||||
| Dividends ($0.16 per share) |
— | — | — | — | — | (1,735 | ) | — | — | (1,735 | ) | ||||||||||||||||||||
| Balance at December 31, 2008 |
— | — | 10,885 | 10,995 | 28,222 | 82,311 | (910 | ) | (1,459 | ) | 119,159 | ||||||||||||||||||||
| Preferred stock issuance |
45 | 44,289 | — | — | 711 | — | — | — | 45,000 | ||||||||||||||||||||||
| Re-issuance of treasury stock |
— | — | 42 | — | (373 | ) | — | — | 542 | 169 | |||||||||||||||||||||
| Stock-based compensation expense related to stock options recognized in earnings |
— | — | — | — | 554 | — | — | — | 554 | ||||||||||||||||||||||
| Forfeiture of restricted stock |
— | — | — | — | — | — | — | (3 | ) | (3 | ) | ||||||||||||||||||||
| Net income (loss) |
— | — | — | — | — | (7,072 | ) | — | — | (7,072 | ) | ||||||||||||||||||||
| Amortization of preferred stock discount |
— | 142 | — | — | — | (142 | ) | — | — | — | |||||||||||||||||||||
| Other comprehensive loss |
— | — | — | — | — | (196 | ) | (196 | ) | ||||||||||||||||||||||
| Dividends—preferred stock |
— | 287 | — | — | — | (2,157 | ) | — | — | (1,870 | ) | ||||||||||||||||||||
| Dividends—common stock ($0.04 per share) |
— | — | — | — | — | (435 | ) | — | — | (435 | ) | ||||||||||||||||||||
| Balance at December 31, 2009 |
45 | $ | 44,718 | 10,927 | $ | 10,995 | $ | 29,114 | $ | 72,505 | $ | (1,106 | ) | $ | (920 | ) | $ | 155,306 | |||||||||||||
The accompanying notes are an integral part of these consolidated financial statements.
87
Table of Contents
Index to Financial Statements
CONSOLIDATED STATEMENTS OF CASH FLOWS
(In thousands)
| Years Ended December 31, | ||||||||||||
| 2009 | 2008 | 2007 | ||||||||||
| Cash flows from operating activities: |
||||||||||||
| Net income (loss) |
$ | (7,072 | ) | $ | 1,835 | $ | 12,175 | |||||
| Adjustments to reconcile net income (loss) to net cash provided by operating activities: |
||||||||||||
| Depreciation |
1,902 | 2,139 | 1,954 | |||||||||
| Provision for loan losses |
25,713 | 16,649 | 3,145 | |||||||||
| Impairment on securities |
708 | 1,961 | — | |||||||||
| Impairment on goodwill |
2,500 | — | — | |||||||||
| Gain on securities transactions, net |
(1,220 | ) | (91 | ) | (2 | ) | ||||||
| (Gain) loss on sale and write-downs of foreclosed assets |
1,671 | (102 | ) | — | ||||||||
| (Gain) loss on sale of premises and equipment |
(36 | ) | 10 | (358 | ) | |||||||
| Gain on sale of loans, net |
— | (288 | ) | (277 | ) | |||||||
| Amortization of premiums and discounts on securities |
(12 | ) | (26 | ) | 53 | |||||||
| Amortization of deferred loan fees and discounts |
(1,902 | ) | (2,375 | ) | (2,606 | ) | ||||||
| Amortization of core deposit intangibles |
177 | 250 | 347 | |||||||||
| Stock-based compensation expense |
551 | 1,128 | 953 | |||||||||
| Deferred income taxes |
(3,140 | ) | (4,067 | ) | (1,000 | ) | ||||||
| Changes in: |
||||||||||||
| Accrued interest receivable |
785 | 516 | (621 | ) | ||||||||
| Other assets |
(12,987 | ) | (1,724 | ) | (977 | ) | ||||||
| Accrued interest payable |
(654 | ) | (448 | ) | (95 | ) | ||||||
| Other liabilities |
(2,268 | ) | (176 | ) | (1,223 | ) | ||||||
| Net cash provided by operating activities |
4,716 | 15,191 | 11,468 | |||||||||
| Cash flows from investing activities: |
||||||||||||
| Purchases of securities available-for-sale |
(122,444 | ) | (15,098 | ) | (201 | ) | ||||||
| Purchases of securities held-to-maturity |
(4,044 | ) | — | — | ||||||||
| Purchases of other investments |
(40,412 | ) | (24,020 | ) | (4,255 | ) | ||||||
| Purchase of bank owned life insurance |
— | — | (25,000 | ) | ||||||||
| Proceeds from sales of securities available-for-sale |
77,554 | 4,196 | — | |||||||||
| Proceeds from sales and maturities of other investments |
48,055 | 1,685 | 2,301 | |||||||||
| Proceeds from maturities and principal paydowns of securities available-for-sale |
48,925 | 44,511 | 46,507 | |||||||||
| Net change in loans |
20,588 | (152,063 | ) | (315,143 | ) | |||||||
| Proceeds from sale of foreclosed assets |
13,683 | 1,801 | 2,488 | |||||||||
| Proceeds from sale of premises and equipment |
37 | 8 | 561 | |||||||||
| Purchases of premises and equipment |
(577 | ) | (730 | ) | (3,367 | ) | ||||||
| Net cash provided by (used in) investing activities |
41,365 | (139,710 | ) | (296,109 | ) | |||||||
| Cash flows from financing activities: |
||||||||||||
| Net change in: |
||||||||||||
| Deposits |
95,014 | 78,110 | 109,379 | |||||||||
| Other borrowings |
(113,533 | ) | 39,250 | 73,480 | ||||||||
| Proceeds from security repurchase agreements |
— | — | 25,000 | |||||||||
| Repayment of long-term debt |
— | — | (25,000 | ) | ||||||||
| Proceeds from stock option exercises |
— | 228 | 126 | |||||||||
| Proceeds from issuance of preferred stock with common stock warrant |
45,000 | — | — | |||||||||
| Re-issuance of treasury stock |
169 | 495 | 701 | |||||||||
| Repurchase of common stock |
— | — | (2,381 | ) | ||||||||
| Dividends paid on preferred stock |
(1,870 | ) | — | — | ||||||||
| Dividends paid on common stock |
(869 | ) | (1,733 | ) | (1,752 | ) | ||||||
| Net cash provided by financing activities |
23,911 | 116,350 | 179,553 | |||||||||
| Net increase (decrease) in cash and cash equivalents |
69,992 | (8,169 | ) | (105,088 | ) | |||||||
| Cash and cash equivalents at beginning of period |
38,101 | 46,270 | 151,358 | |||||||||
| Cash and cash equivalents at end of period |
$ | 108,093 | $ | 38,101 | $ | 46,270 | ||||||
The accompanying notes are an integral part of these consolidated financial statements.
88
Table of Contents
Index to Financial Statements
NOTES TO CONSOLIDATED FINANCIAL STATEMENTS
1. Summary of Significant Accounting Policies
Business
MetroCorp Bancshares, Inc. (the “Parent”) is a Texas Corporation headquartered in Houston, Texas, which is engaged in commercial banking activities through its wholly-owned subsidiaries, MetroBank, National Association (“MetroBank”) in Texas and Metro United Bank (“Metro United”) in California (collectively, the “Banks”).
Basis of Financial Statement Presentation
The consolidated financial statements include the accounts of the Parent and all other entities in which the Parent has a controlling financial interest (collectively, the “Company”). The accounting principles followed by the Company and the methods of applying these principles conform with accounting principles generally accepted in the United States of America and with general practices within the banking industry. All significant intercompany accounts and transactions have been eliminated in consolidation. Certain principles which significantly affect the determination of financial position, results of operations and cash flows are summarized below.
The Company determines whether it has a controlling financial interest in an entity by first evaluating whether the entity is a voting interest entity or a variable interest entity under accounting principles generally accepted in the United States. Voting interest entities are entities in which the total equity investment at risk is sufficient to enable the entity to finance itself independently and provides the equity holders with the obligation to absorb losses, the right to receive residual returns and the right to make decisions about the entity’s activities. The Company consolidates voting interest entities in which it has all, or at least a majority of, the voting interest. Variable interest entities, (“VIEs”) are entities that lack one or more of the characteristics of a voting interest entity. A controlling financial interest is present when an enterprise has a variable interest, or a combination of variable interests, that will absorb a majority of the entity’s expected losses, receive a majority of the entity’s expected residual returns, or both. The enterprise with a controlling financial interest, known as the primary beneficiary, consolidates the VIE. The Company’s wholly owned subsidiary, MCBI Statutory Trust I, is a VIE for which the Company is not the primary beneficiary. Accordingly, the accounts of this entity are not consolidated in the Company’s financial statements.
Certain items in prior financial statements have been reclassified to conform to the 2009 presentation, with no impact on the balance sheet, net income (loss), shareholders’ equity, or cash flows.
Accounting Standards Codification
The Financial Accounting Standards Board’s (FASB) Accounting Standards Codification (ASC) became effective on July 1, 2009. At that date, the ASC became FASB’s officially recognized source of authoritative U.S. generally accepted accounting principles (GAAP) applicable to all public and non-public non-governmental entities, superseding existing FASB, American Institute of Certified Public Accountants (AICPA), Emerging Issues Task Force (EITF) and related literature. Rules and interpretive releases of the SEC under the authority of federal securities laws are also sources of authoritative GAAP for SEC registrants. All other accounting literature is considered non-authoritative. The switch to the ASC affects the way companies refer to U.S. GAAP in financial statements and accounting policies. Citing particular content in the ASC involves specifying the unique numeric path to the content through the Topic, Subtopic, Section and Paragraph structure.
89
Table of Contents
Index to Financial Statements
Use of Estimates
These financial statements are prepared in conformity with accounting principles generally accepted in the United States of America, which require management to make estimates and assumptions. These assumptions affect the reported amounts of assets and liabilities and the disclosure of contingent assets and liabilities at the date of the financial statements and the reported amounts of revenues and expenses during the reporting period. Significant estimates include the allowance for loan losses. Amounts are recognized when it is probable that an asset has been impaired or a liability has been incurred and the cost can be reasonably estimated. Actual results could differ from those estimates.
Cash and Cash Equivalents
Cash and cash equivalents include cash on hand, amounts due from banks, federal funds sold, and other short-term investments with original maturities of less than three months.
Securities
Securities are classified as held to maturity and carried at amortized cost when management has the positive intent and ability to hold them until maturity. Investment securities classified as available-for-sale are reported at estimated fair value, and unrealized net gains and temporary losses are excluded from income and reported, net of the associated deferred income tax effect, as a separate component of accumulated other comprehensive income in shareholders’ equity. The Company does not have trading securities. Realized gains and losses from sales of securities available-for-sale are recorded in earnings using the specific identification method. The Company’s available-for-sale and held-to-maturity securities with unrealized losses are reviewed quarterly to identify OTTIs in value. In evaluating whether a decline in value is other-than-temporary, the Company considers several factors including, but not limited to the following: (1) the extent and the duration of the decline; (2) the reasons for the decline in value (credit event, and interest-rate related including general credit spread widening); (3) the financial condition of and near-term prospects of the issuer, and (4) the Company’s intent not to sell and that it is not more likely than not that the Company would be required to sell the security before the anticipated recovery of its amortized cost basis. With regard to available-for-sale equity securities, the Company also considers the ability and intent to hold the investment for a period of time to allow for a recovery of value. When it is determined that a decline in value of an equity security is other-than-temporary, the carrying value of the equity security is reduced to its fair value, with a corresponding charge to earnings. Prior to April 1, 2009, declines in the fair value of individual available-for-sale securities below their cost that are other-than-temporary would result in a write-down of the individual securities to their fair value. The related write-downs would be included in earnings as realized losses. Beginning April 1, 2009, declines in the fair value of individual securities below their cost that are other-than-temporary would result in write-downs, as a recognized loss, of the individual securities to their fair value. Under the new guidance Accounting Standards Codification (“ASC”) Topic 320-10, when an other-than-temporary-impairment (“OTTI”) of a debt security has occurred, the amount of the OTTI recognized in earnings depends on whether the Company intends to sell the security or more likely than not will be required to sell the security before recovery of its amortized cost basis. If the debt security meets either of these two criteria, the OTTI recognized in earnings is equal to the entire difference between the security’s amortized cost basis and its fair value at the impairment measurement date. For OTTIs of debt securities that do not meet these two criteria, the net amount recognized in earnings is equal to the difference between the amortized cost of the debt security and its net present value calculated. Any difference between the fair value and the net present value of the debt security at the impairment measurement date is recorded in other comprehensive income (loss) (“OCI”).
Loans, Allowance for Loan Losses and Reserve for Unfunded Lending Commitments
Loans are reported at the principal amount outstanding, reduced by unearned discounts, net deferred loan fees, and an allowance for loan losses. Unearned income on installment loans is recognized using the effective interest method over the term of the loan. Interest on other loans is calculated using the simple interest method on the daily principal amount outstanding.
90
Table of Contents
Index to Financial Statements
Loans are placed on nonaccrual status when principal or interest is past due more than 90 days or when, in management’s opinion, collection of principal and interest is not likely to be made in accordance with a loan’s contractual terms. Interest accrued but not collected at the date a loan is placed on nonaccrual status is reversed against interest income. Interest income on nonaccrual loans may be recognized only to the extent received in cash; however, where there is doubt regarding the ultimate collectability of the loan principal, cash receipts, whether designated as principal or interest, are thereafter applied to reduce the principal balance of the loan. Loans are restored to accrual status only when interest and principal payments are brought current and, in management’s judgment, future payments are reasonably assured.
Loans are classified as a restructured in cases where a borrower experiences financial difficulty but is current on their payment and the Company makes limited concessionary modifications to contractual terms. Restructured loans typically involve a modification of terms such as a reduction of the stated interest rate and an extension of the maturity date(s). Generally, a nonaccrual loan that is restructured remains on nonaccrual for a minimum period of six months to demonstrate that the borrower can meet the restructured terms. Once performance has been demonstrated the loan may be returned to performing status after the calendar year end.
A loan, with the exception of groups of smaller-balance homogenous loans that are collectively evaluated for impairment, is considered impaired when, based on current information, it is probable that the borrower will be unable to pay contractual interest or principal payments as scheduled in the loan agreement. The Company recognizes interest income on impaired loans pursuant to the discussion above for nonaccrual loans.
The allowance for loan losses related to impaired loans is determined based on the difference of carrying value of loans and the present value of expected cash flows discounted at the loan’s effective interest rate or, as a practical expedient, the loan’s observable market price or the fair value of the collateral if the loan is collateral dependent.
The reserve for unfunded lending commitments provides for the risk of loss inherent in the Company’s unfunded lending related commitments, which is included in other liabilities. The process used in determining the reserve is consistent with the process used for the allowance for loan losses discussed below.
The allowance for credit losses consists of allowance for loan losses and the reserve for unfunded lending commitments which provide for the risk of losses inherent in the lending process. The allowance for loan losses is based on periodic reviews and analyses of the loan portfolio which include consideration of such factors as the risk grading of individual credits, the size and diversity of the portfolio, economic conditions, prior loss experience and results of periodic credit reviews of the portfolio. In addition, the effect of changes in the local real estate market on collateral values, the results of recent regulatory examinations, the amount of potential charge-offs for the period, the amount of nonperforming loans and related collateral security are considered in determining the allowance for loan losses. Based on an evaluation of the loan portfolio, management presents a quarterly review of the allowance for loan losses to the Company’s Board of Directors, indicating any change in the allowance since the last review and any recommendations as to adjustments in the allowance. The allowance for loan losses is increased by provisions for loan losses charged against income and reduced by charge-offs, net of recoveries. Charge-offs occur when loans are deemed to be uncollectible in whole or in part. Estimates of loan losses involve an exercise of judgment. While it is possible that in the short-term the Company may sustain losses which are substantial in relation to the allowance for loan losses, it is the judgment of management that the allowance for loan losses and reserve for unfunded lending commitments reflected in the consolidated balance sheets is adequate to absorb probable losses that exist in the current loan portfolio.
Nonrefundable Fees and Costs Associated with Lending Activities
Loan origination fees in excess of the associated costs are recognized over the life of the related loan as an adjustment to yield using the interest method.
91
Table of Contents
Index to Financial Statements
Loan commitment fees are deferred and recognized as an adjustment of yield by the interest method over the related commitment period or, if the commitment expires unexercised, recognized in income upon expiration of the commitment.
Loan Sales Recognition
Loan sales are recorded when control over the transferred assets has been relinquished. Control over transferred assets is deemed to be surrendered when the assets have been isolated from the Company, the transferee obtains the right (free of conditions that constrain it from taking advantage of that right) to pledge or exchange the transferred assets, and the Company does not maintain effective control over the transferred assets through an agreement to repurchase them before their maturity.
To calculate the gain (loss) on sale of loans, the Company’s investment in the loan is allocated among the retained portion of the loan, the servicing retained, and the sold portion of the loan, based on the relative fair market value of each portion. The gain (loss) on the sold portion of the loan is recognized at the time of sale based on the difference between the sale proceeds and the allocated investment. As a result of the relative fair value allocation, the carrying value of the retained portion is discounted, with the discount accreted to interest income over the life of the loan.
Premises and Equipment
Premises and equipment are stated at cost, less accumulated depreciation. For financial accounting purposes, depreciation is computed using the straight-line method over the estimated useful lives of the assets. Leasehold improvements are depreciated over the lesser of the term of the respective leases or the estimated useful lives of the improvements. Gains and losses on the sale of premises and equipment are recorded using the specific identification method at the time of sale. Expenditures for maintenance and repairs, which do not extend the life of bank premises and equipment, are charged to operations as incurred.
Goodwill and Core Deposit Intangibles
Goodwill is recorded for the excess of the purchase price over the fair value of identifiable net assets, including core deposit intangibles, acquired through an acquisition transaction. Goodwill is not amortized, but instead is tested for impairment at least annually or on an interim basis if an event occurs or circumstances change that would more likely than not reduce the fair value of a reporting unit below its carrying value. Other acquired intangible assets determined to have finite lives, such as core deposit intangibles, are amortized over their estimated useful lives in a manner that best reflects the economic benefits of the intangible asset. Impairment tests are performed quarterly on these finite-lived intangible assets.
Foreclosed Assets
Foreclosed assets consist of properties acquired through a foreclosure proceeding or acceptance of a deed in lieu of foreclosure. These properties are initially recorded at fair value less estimated costs to sell. Prior to foreclosure, the recorded amount of the loan is written down, if necessary, to the appraised fair value of the real estate to be acquired, less selling costs, by charging the allowance for loan losses. Any subsequent reduction in fair value net of estimated selling costs is charged to noninterest expense. Operating expenses, net of related revenue and gains and losses on sale of such assets, are reported in noninterest expense. Expenditures to complete or improve foreclosed properties are capitalized only if expected to be recovered; otherwise, they are expensed.
Other Borrowings
Other borrowings include U.S. Treasury tax note option accounts with maturities of 14 days or less, Federal Home Loan Bank (FHLB) borrowings and Subordinated Debentures.
92
Table of Contents
Index to Financial Statements
Repurchase Agreements
The Company has entered into securities repurchase agreements for the purpose of long-term borrowing to control interest rate risk. Under these repurchase agreements the Company sells and transfers securities to counterparties subject to agreements to repurchase the securities from the counterparties on a future date. Securities sold by the Company under repurchase agreements include direct obligations of the U.S. government, government sponsored entities and federal agencies. The securities repurchase agreements are accounted for as collateralized financing transactions in the accompanying consolidated balance sheet and the Company’s obligations to repurchase securities under the repurchase agreements are reflected as a liability at the sale price plus accrued interest. The Company may be required to pledge other securities, financial instruments and cash from time to time to secure the Company’s repurchase obligations under repurchase agreements. These pledged assets are carried on the Company’s consolidated balance sheet as assets of the Company.
Junior Subordinated Debentures
The Company has established a statutory business trust that is a wholly-owned subsidiary of the Company. The Trust issued fixed/floating rate capital securities representing undivided preferred beneficial interests in the assets of the Trust. The Company is the owner of the beneficial interests represented by the common securities of the Trust. The Trust used the proceeds from the issuance of the capital securities and the common securities to purchase the Company’s junior subordinated debentures. The purpose of forming the Trust to issue the capital securities was to provide the Company with a cost-effective means of funding the Metro United acquisition. Junior subordinated debentures represent liabilities of the Company to the Trust.
Income Taxes
The Company utilizes an asset and liability approach to provide for income taxes that requires the recognition of deferred tax assets and liabilities for the expected future tax consequences of events that have been recognized in the Company’s financial statements or tax returns. When management determines that it is more likely than not that a deferred tax asset will not be realized, a valuation allowance is established. In estimating future tax consequences, all expected future events other than enactments of changes in tax laws or rates are considered.
The Company records tax effects from an uncertain tax positions in the financial statements, only if the position is more likely than not of being sustained on examination by taxing authorities, based on the technical merits of the position. The Company had no unrecognized tax benefits as of December 31, 2009, and as a result there is no impact on the Company’s effective tax rate.
To the extent penalties and interest would be assessed on any underpayment of income tax, such amounts have been accrued and classified as a component of income tax expense in the financial statements. This is an accounting policy election made by the Company that is a continuation of the Company’s historical policy. As of December 31, 2009, the Company has not accrued any interest and penalties related to unrecognized tax benefits.
The Company does not anticipate a significant change in the balance of unrecognized tax benefits within the next 12 months.
Earnings Per Share
Basic earnings per common share is calculated by dividing net earnings available for common shareholders by the weighted average number of common shares outstanding during the period. Diluted earnings per share is calculated by dividing net earnings available for common shareholders by the weighted average number of common and potentially dilutive common shares. Stock options can be dilutive common shares and are therefore considered in the earnings per share calculation, if dilutive. The number of potentially dilutive common shares is determined using the treasury stock method. For earnings per share calculation purposes, the impact of dilutive securities are excluded from the diluted share count during periods that the Company has recognized a net loss available to common shareholders.
93
Table of Contents
Index to Financial Statements
Stock-Based Compensation
Stock-based compensation is accounted for in accordance with the fair value recognition provisions of FASB accounting guidance. The Black-Scholes option-pricing model is utilized which requires the input of highly subjective assumptions. These assumptions include estimating the length of time employees will retain their vested stock options before exercising them (“expected term”), the estimated volatility of the Company’s Common Stock price over the expected term and the number of options that will ultimately not complete their vesting requirements (“forfeitures”). Changes in the subjective assumptions can materially affect the estimate of fair value of stock-based compensation and consequently, the related amount recognized on the consolidated statements of income.
Off-Balance Sheet Instruments
The Company has entered into off-balance sheet financial instruments consisting of commitments to extend credit, commercial letters of credit, standby letters of credit and operating leases. Such financial instruments are recorded in the financial statements when they are funded.
Derivative Financial Instruments
The Company’s hedging policies permit the use of derivative financial instruments to manage interest rate risk. Derivatives are recorded at fair value on the Company’s balance sheet. To qualify for hedge accounting, derivatives must be highly effective at reducing the risk associated with the exposure being hedged and must be designated as a hedge at the inception of the derivative contract. Fair value adjustments related to cash flow hedges are recorded in other comprehensive income. Ineffective portions of hedges are reflected in earnings as they occur. Actual cash receipts and/or payments and related accruals on derivatives related to hedges are recorded as adjustments to the interest income or interest expense associated with the hedged item. During the life of the hedge, the Company formally assesses whether derivatives designated as hedging instruments continue to be highly effective in offsetting changes in the fair value or cash flows of hedged items. If it is determined that a hedge has ceased to be highly effective, the Company will discontinue hedge accounting.
Fair Value
Certain portions of the Company’s assets are reported on a fair value basis. Fair value is used on a recurring basis for certain assets in which fair value is the primary basis of accounting. An example of this recurring use of fair value is available for sale securities. Additionally, fair value is used on a non-recurring basis to evaluate assets for impairment or as required for disclosure purposes. Examples of these non-recurring uses of fair value include goodwill, intangible assets, and certain collateral dependent impaired loans. Depending on the nature of the asset, various valuation techniques and assumptions are used when estimating fair value.
Fair market values of financial instruments are based on the fair value hierarchy established which requires an entity to maximize the use of observable inputs and minimize the use of unobservable inputs when measuring fair value. Therefore, fair value measurements are determined based on the assumptions that market participants would use in pricing the asset or liability and establishes a fair value hierarchy. The fair value hierarchy consists of three levels of inputs that may be used to measure fair value.
Comprehensive Income
Comprehensive income includes all changes in equity during the period presented that result from transactions and other economic events other than transactions with shareholders. The Company reports comprehensive income in the consolidated statements of comprehensive income and the consolidated statement of changes in shareholders’ equity.
94
Table of Contents
Index to Financial Statements
New Accounting Pronouncements
Accounting Standards Codification
FASB ASC Topic 810, “Consolidation.” New authoritative accounting guidance under ASC Topic 810 amends prior guidance to change how a company determines when an entity that is insufficiently capitalized or is not controlled through voting (or similar rights) should be consolidated. The determination of whether a company is required to consolidate an entity is based on, among other things, an entity’s purpose and design and a company’s ability to direct the activities of the entity that most significantly impact the entity’s economic performance. The new authoritative accounting guidance requires additional disclosures about the reporting entity’s involvement with variable-interest entities and any significant changes in risk exposure due to that involvement as well as its affect on the entity’s financial statements. The new authoritative accounting guidance under ASC Topic 810 was effective January 1, 2010 and is not expected to have a significant impact on the Company’s on the financial condition, results of operations, or cash flows of the Company.
FASB ASC Topic 860, “Transfers and Servicing.” ASC Topic 860 amends prior accounting guidance to enhance reporting about transfers of financial assets, including securitization, and where companies have continuing exposure to the risks related to the transferred financial assets. The new authoritative accounting guidance eliminates the concept of a “qualifying special-purpose entity” and changes the requirements for derecognizing financial assets. The new authoritative accounting guidance also requires additional disclosures about all continuing involvements with transferred financial assets including information about gains and losses resulting from transfers during the period. The new authoritative accounting guidance under ASC Topic 860 was effective January 1, 2010 and is not expected to have a significant impact on the Company’s financial condition, results of operations, or cash flows.
2. Cash and Cash Equivalents
The Company is required by the Board of Governors of the Federal Reserve System to maintain average reserve balances. As of December 31, 2009, the Company’s vault cash balance was more than sufficient to meet the average daily reserve balance requirement.
3. Securities
In the normal course of business, the Company invests in securities issued by the Federal government, government sponsored enterprises, and political subdivisions, which inherently carry interest rate risks based upon overall economic trends and related market yield fluctuations. Securities within the held-to-maturity portfolio are generally used for pledging purposes. Securities within the available-for-sale portfolio may be used as part of the Company’s asset/liability strategy and may be sold in response to changes in interest rate risk, prepayment risk or other similar economic factors.
95
Table of Contents
Index to Financial Statements
At December 31, 2009 and 2008, the amortized cost and fair value of securities was as follows (in thousands):
| As of December 31, 2009 | |||||||||||||||||
| Amortized Cost |
Unrealized | Fair Value | |||||||||||||||
| Gains | Losses | OTTI | |||||||||||||||
| Securities available-for-sale |
|||||||||||||||||
| Debt Securities |
|||||||||||||||||
| U.S. Treasury and other U.S. government corporations and agencies |
$ | 57,882 | $ | — | $ | (654 | ) | $ | — | $ | 57,228 | ||||||
| Obligations of state and political subdivisions |
5,724 | 118 | (29 | ) | — | 5,813 | |||||||||||
| Mortgage-backed securities and collateralized mortgage obligations |
|||||||||||||||||
| Government issued or guaranteed |
32,014 | 397 | (103 | ) | — | 32,308 | |||||||||||
| Privately issued residential |
3,947 | 233 | (241 | ) | (1,104 | ) | 2,835 | ||||||||||
| Asset backed securities |
467 | — | — | (283 | ) | 184 | |||||||||||
| Total available-for-sale securities |
$ | 100,034 | $ | 748 | $ | (1,027 | ) | $ | (1,387 | ) | $ | 98,368 | |||||
| Securities held-to-maturity |
|||||||||||||||||
| Obligations of state and political subdivisions |
$ | 4,044 | $ | 308 | $ | — | $ | — | $ | 4,352 | |||||||
| Total held-to-maturity securities |
$ | 4,044 | $ | 308 | $ | — | $ | — | $ | 4,352 | |||||||
| Other investments |
|||||||||||||||||
| Investment in CDARS(1) |
$ | 14,042 | $ | — | $ | — | $ | — | $ | 14,042 | |||||||
| FHLB(2)/Federal Reserve Bank(3) stock |
6,452 | — | — | — | 6,452 | ||||||||||||
| Investment in subsidiary trust(4) |
1,083 | — | — | — | 1,083 | ||||||||||||
| Total other investments |
$ | 21,577 | $ | — | $ | — | $ | — | $ | 21,577 | |||||||
| (1) | The investment in Promontory Interfinancial Network LLC’s Certificate of Deposit Account Registry Service (“CDARS”) is carried at cost. |
| (2) | FHLB stock held by MetroBank is subject to certain restrictions under a credit policy of the FHLB dated May 1, 1997. Redemption of FHLB stock is dependent upon repayment of borrowings from the FHLB. |
| (3) | Federal Reserve Bank stock held by MetroBank is subject to certain restrictions under Federal Reserve Bank Policy. |
| (4) | The Company’s ownership of common securities of MCBI Statutory Trust I is carried at cost. |
| As of December 31, 2008 | |||||||||||||
| Amortized Cost |
Gross Unrealized Gains |
Gross Unrealized Losses |
Fair Value | ||||||||||
| Securities available-for-sale |
|||||||||||||
| Debt Securities |
|||||||||||||
| U.S. Treasury and other U.S. government corporations and agencies |
$ | 14,908 | $ | 179 | $ | — | $ | 15,087 | |||||
| Obligations of state and political subdivisions |
3,853 | 24 | — | 3,877 | |||||||||
| Mortgage-backed securities and collateralized mortgage obligations |
|||||||||||||
| Government issued or guaranteed |
72,787 | 555 | (956 | ) | 72,386 | ||||||||
| Privately issued residential |
5,639 | 19 | (1,299 | ) | 4,359 | ||||||||
| Asset backed securities |
550 | — | — | 550 | |||||||||
| Equity Securities |
|||||||||||||
| Investment in CRA funds |
5,809 | 36 | — | 5,845 | |||||||||
| Total available-for-sale securities |
$ | 103,546 | $ | 813 | $ | (2,255 | ) | $ | 102,104 | ||||
| Other investments |
|||||||||||||
| Investment in CDARS |
$ | 20,240 | $ | — | $ | — | $ | 20,240 | |||||
| FHLB/Federal Reserve Bank stock |
7,897 | — | — | 7,897 | |||||||||
| Investment in subsidiary trust |
1,083 | — | — | 1,083 | |||||||||
| Total other investments |
$ | 29,220 | $ | — | $ | — | $ | 29,220 | |||||
96
Table of Contents
Index to Financial Statements
The following table displays the gross unrealized losses and fair value of securities available-for-sale as of December 31, 2009 and 2008, for which OTTI has not been recognized, that were in a continuous unrealized loss position for the periods indicated. There were no held-to-maturity securities in a continuous unrealized loss position as of December 31, 2009.
| As of December 31, 2009 | |||||||||||||||||||||
| Less Than 12 Months |
Greater Than 12 Months |
Total | |||||||||||||||||||
| Fair Value |
Unrealized Loss |
Fair Value |
Unrealized Loss |
Fair Value |
Unrealized Loss |
||||||||||||||||
| U.S. Treasury and other U.S. government corporations and agencies |
$ | 52,228 | $ | (654 | ) | $ | — | $ | — | $ | 52,228 | $ | (654 | ) | |||||||
| Obligations of state and political subdivisions |
1,516 | (29 | ) | — | — | 1,516 | (29 | ) | |||||||||||||
| Mortgage-backed securities and collateralized mortgage obligations |
|||||||||||||||||||||
| Government issued or guaranteed |
10,937 | (103 | ) | — | — | 10,937 | (103 | ) | |||||||||||||
| Privately issued residential |
86 | (33 | ) | — | — | 86 | (33 | ) | |||||||||||||
| Asset backed securities |
— | — | 488 | (208 | ) | 488 | (208 | ) | |||||||||||||
| Total securities |
$ | 64,767 | $ | (819 | ) | $ | 488 | $ | (208 | ) | $ | 65,255 | $ | (1,027 | ) | ||||||
| As of December 31, 2008 | |||||||||||||||||||||
| Less Than 12 Months |
Greater Than 12 Months |
Total | |||||||||||||||||||
| Fair Value |
Unrealized Loss |
Fair Value |
Unrealized Loss |
Fair Value |
Unrealized Loss |
||||||||||||||||
| Mortgage-backed securities and collateralized mortgage obligations |
$ | 27,283 | $ | (1,692 | ) | $ | 18,027 | $ | (563 | ) | $ | 45,310 | $ | (2,255 | ) | ||||||
As of December 31, 2009, management does not have the intent to sell any of the securities classified as available for sale in the table above and believes it is more likely than not that the Company will not have to sell any such securities before a recovery of the cost. The unrealized losses are largely due to increases in the market interest rates over the yields available at the time the underlying securities were purchased. The fair value is expected to recover as the bonds approach their maturity date or repricing date or if market yields for such securities decline. Management does not believe any of the unrealized losses above are due to credit quality. Accordingly, $796,000 of unrealized loss noted above is temporary and the remaining $1.4 million represents an unrealized loss for which an other-than-temporary impairment has been recognized in other comprehensive loss.
Other-Than-Temporary Impairments (OTTI)
In April 2009, the Financial Accounting Standards Board (“FASB”) issued a change in accounting guidance involving the recognition and presentation of other-than-temporary impairments. The Company adopted this guidance on April 1, 2009. Under the new guidance Accounting Standards Codification (“ASC”) Topic 320-10, when an other-than-temporary-impairment (“OTTI”) of a debt security has occurred, the amount of the OTTI recognized in earnings depends on whether the Company intends to sell the security or more likely than not will be required to sell the security before recovery of its amortized cost basis. If the debt security meets either of these two criteria, the OTTI recognized in earnings is equal to the entire difference between the security’s amortized cost basis and its fair value at the impairment measurement date. For OTTIs of debt securities that do not meet these two criteria, the net amount recognized in earnings is equal to the difference between the amortized cost of the debt security and its net present value calculated. Any difference between the fair value and the net present value of the debt security at the impairment measurement date is recorded in other comprehensive income (loss) (“OCI”). Unrealized gains or losses on securities for which an OTTI has been recognized in
97
Table of Contents
Index to Financial Statements
earnings is tracked as a separate component of accumulated other comprehensive income (loss) (“AOCI”). Prior to the adoption of the new guidance, an OTTI recognized in earnings for debt securities was equal to the total difference between amortized cost and fair value at the time of impairment.
For debt securities, the split between the amount of an OTTI recognized in other comprehensive income and the net amount recognized in earnings is driven principally by assumptions regarding the amount and timing of projected cash flows. For mortgage-backed and asset-backed securities, cash flow estimates are determined based on prepayment assumptions, default rates and loss severity rates derived from widely accepted third-party data sources. The Company has developed these estimates using information based on historical experience as well as using market observable data, such as industry analyst reports and forecasts, sector credit ratings and other data relevant to the collectability of a security.
The new cost basis of an impaired security is not adjusted for subsequent increases in estimated fair value. In periods subsequent to the recognition of an OTTI, the impaired security is accounted for as if it had been purchased on the measurement date of the impairment. For debt securities, the discount (or reduced premium) based on the new cost basis may be accreted into net investment income in future periods based on prospective changes in cash flow estimates, to reflect adjustments to the effective yield.
For equity securities, the Company evaluates whether unrealized losses on securities represent impairment that is other-than-temporary. If such impairment is identified, the carrying amount of the security is reduced with a charge to earnings. In making this evaluation, management first considers the reasons for the indicated impairment. These could include changes in market rates relative to those available when the security was acquired, changes in market expectations about the timing of cash flows from securities that can be prepaid, and changes in the market’s perception of the issuer’s financial health and the security’s credit quality. The Company then considers the likelihood of a recovery in fair value sufficient to eliminate the indicated impairment and the length of time over which an anticipated recovery would occur. Finally, the Company determines its ability to hold the impaired security until an anticipated recovery, in which case the impairment would be considered temporary.
The adoption of the new guidance on April 1, 2009 had no effect on previously recognized OTTI.
The following table represents the impairment activity related to debt securities for the year ended December 31, 2009.
| Year ended December 31, 2009 | ||||||||||||
| Impairment related to credit losses |
Impairment related to other factors |
Total impairment |
||||||||||
| (Dollars in thousands) | ||||||||||||
| Beginning balance, January 1, 2009 |
$ | 421 | $ | — | $ | 421 | ||||||
| Addition of OTTI that was not previously recognized |
542 | 1,615 | 2,157 | |||||||||
| Additions to OTTI that was previously recognized when there is no intent to sell and no requirement to sell before recovery of amortized cost basis |
100 | — | 100 | |||||||||
| Transfers from AOCI to OTTI related to credit losses |
228 | (228 | ) | — | ||||||||
| Reclassifications from OTTI to realized losses |
(88 | ) | — | (88 | ) | |||||||
| Ending balance, December 31, 2009 |
$ | 1,203 | $ | 1,387 | $ | 2,590 | ||||||
For the year ended December 31, 2009, the Company recognized credit-related losses of $746,000 on 45 non-agency residential mortgage-backed securities and $36,000 on four asset-backed securities. The noncredit portion of these impairments of $1.1 million on non-agency residential mortgage-backed securities and $283,000
98
Table of Contents
Index to Financial Statements
on asset-backed securities was included in accumulated other comprehensive loss for the year ended December 31, 2009. To measure credit losses, external credit ratings and other relevant collateral details and performance statistics on a security-by-security basis were considered. Securities exhibiting significant deterioration are subjected to further analysis. Assumptions were developed for prepayment speed, default rate, and loss severity for each security using third party sources and based on the collateral history. The resulting projections of future cash flows of the underlying collateral were then discounted by the underlying yield before any write-downs were considered to determine the net present value of the cash flows (“NPV”). The difference between the cost basis and the NPV was taken as a credit loss in the current period to the extent that these losses have not been previously recognized. The difference between the NPV and the quoted market price is considered a noncredit related loss and was included in other comprehensive loss.
For the year ended December 31, 2008, OTTI was $2.0 million, which included impairment from quarterly reviews of the Shay Fund (“the Fund”) prior to the redemption in kind transaction, as well as the individual securities acquired in the redemption in kind transaction.
The Fund was a mutual fund investing primarily in adjustable rate agency and private label mortgage-backed securities. OTTI was recognized because of the significant decline in the net asset value of the Fund, and because the Fund manager activated the redemption-in-kind provision on May 6, 2008 to protect shareholders against forced liquidation of Fund holdings to satisfy cash redemptions. In July 2008, the Company redeemed its shares in the Fund for approximately $2.2 million in cash, with the remaining value of approximately $10.5 million distributed in the form of securities held by the Fund that approximated the Company’s respective interest in each of the underlying securities. As a result, the Company realized $1.5 million of OTTI on the date of redemption.
Other Securities Information
Investments carried at approximately $45.3 million and $42.9 million at December 31, 2009 and 2008, respectively, were pledged to collateralize public deposits and other borrowings.
The following sets forth information concerning sales (excluding calls and maturities) of available-for-sale securities (in thousands). There were no sales of held-to-maturity securities.
| Years Ended December 31, | |||||||||
| 2009 | 2008 | 2007 | |||||||
| Amortized cost |
$ | 76,249 | $ | 4,072 | $ | — | |||
| Proceeds |
77,554 | 4,196 | — | ||||||
| Gross realized gains |
1,306 | 124 | — | ||||||
| Gross realized losses |
— | — | — | ||||||
At December 31, 2009, future contractual maturities of debt securities were as follows (in thousands):
| Securities Available-for-sale |
Securities Held-to-maturity | |||||||||||
| Amortized Cost |
Fair Value |
Amortized Cost |
Fair Value | |||||||||
| Within one year |
$ | — | $ | — | $ | — | $ | — | ||||
| Within two to five years |
24,198 | 24,105 | — | — | ||||||||
| Within six to ten years |
27,609 | 27,271 | — | — | ||||||||
| After ten years |
12,265 | 11,849 | 4,044 | 4,352 | ||||||||
| Mortgage-backed securities and collateralized mortgage obligations |
35,962 | 35,143 | — | — | ||||||||
| Total debt securities |
$ | 100,034 | $ | 98,368 | $ | 4,044 | $ | 4,352 | ||||
99
Table of Contents
Index to Financial Statements
The Company holds mortgage-backed securities which may mature at an earlier date than the contractual maturity due to prepayments. The Company also holds certain securities which may be called by the issuer at an earlier date than the contractual maturity date.
4. Loans and Allowance for Loan Losses
The loan portfolio is summarized by major categories as follows (in thousands):
| As of December 31, | ||||||||
| 2009 | 2008 | |||||||
| Commercial and industrial |
$ | 399,235 | $ | 467,546 | ||||
| Real estate-mortgage |
775,704 | 732,451 | ||||||
| Real estate-construction |
97,789 | 144,367 | ||||||
| Consumer and other |
3,888 | 4,864 | ||||||
| Gross loans |
1,276,616 | 1,349,228 | ||||||
| Unearned discounts and interest |
— | — | ||||||
| Deferred loan fees |
(2,619 | ) | (3,180 | ) | ||||
| Total loans |
1,273,997 | 1,346,048 | ||||||
| Allowance for loan losses |
(29,403 | ) | (24,235 | ) | ||||
| Loans, net |
$ | 1,244,594 | $ | 1,321,813 | ||||
| Variable rate loans |
$ | 867,700 | $ | 942,168 | ||||
| Fixed rate loans |
408,916 | 407,060 | ||||||
| Gross loans |
$ | 1,276,616 | $ | 1,349,228 | ||||
Although the Company’s loan portfolio is diversified, a substantial portion of its customers’ ability to service their debts is dependent primarily on the service sectors of the economy. At December 31, 2009 and 2008, the Company’s loan portfolio consisted of concentrations in the following industries, which represent loan concentrations greater than 25% of capital (in thousands):
| As of December 31, | ||||||
| 2009 | 2008 | |||||
| Nonresidential building for rent/lease |
$ | 396,639 | $ | 407,556 | ||
| Hotels/motels |
165,811 | 156,032 | ||||
| Other related to real estate |
118,943 | 148,853 | ||||
| Wholesale trade |
118,069 | 122,109 | ||||
| Health/education/social assistance |
89,714 | 98,323 | ||||
| Construction |
77,002 | 110,307 | ||||
| Restaurants |
69,342 | 67,634 | ||||
| Convenience stores/gasoline stations |
53,391 | 54,798 | ||||
| All other |
187,705 | 183,616 | ||||
| Gross loans |
$ | 1,276,616 | $ | 1,349,228 | ||
100
Table of Contents
Index to Financial Statements
Changes in the allowance for loan losses and unfunded lending commitments are as follows (in thousands):
| As of December 31, | ||||||||||||
| 2009 | 2008 | 2007 | ||||||||||
| Allowance for loan losses at beginning of year |
$ | 24,235 | $ | 13,125 | $ | 11,436 | ||||||
| Provision for loan losses |
25,713 | 16,649 | 3,145 | |||||||||
| Charge-offs |
(21,611 | ) | (5,851 | ) | (2,721 | ) | ||||||
| Recoveries |
1,066 | 312 | 1,265 | |||||||||
| Allowance for loan losses at end of year |
29,403 | 24,235 | 13,125 | |||||||||
| Reserve for unfunded lending commitments at beginning of year |
1,092 | 816 | 793 | |||||||||
| Provision for unfunded lending commitments |
(49 | ) | 276 | 23 | ||||||||
| Reserve for unfunded lending commitments at end of year |
1,043 | 1,092 | 816 | |||||||||
| Allowance for credit losses |
$ | 30,446 | $ | 25,327 | $ | 13,941 | ||||||
The following table presents information regarding nonperforming assets at the dates indicated:
| 2009 | 2008 | |||||||
| Nonaccrual loans |
$ | 75,229 | $ | 48,239 | ||||
| Accruing loans 90 days or more past due |
420 | 103 | ||||||
| Troubled debt restructurings |
4,927 | 4,474 | ||||||
| Other real estate (“ORE”) |
22,291 | 4,825 | ||||||
| Total nonperforming assets |
102,867 | 57,641 | ||||||
| Less: nonperforming loans guaranteed by the SBA, Ex-Im Bank, or the OCCGF |
(2,138 | ) | (1,843 | ) | ||||
| Net nonperforming assets |
$ | 100,729 | $ | 55,798 | ||||
Had nonaccrual loans remained on an accrual basis, interest of approximately $1.8 million would have been accrued on these loans for each of the years ended December 31, 2009 and 2008, and $557,000 for the year ended December 31, 2007.
The recorded investment in impaired loans, which includes nonaccrual loans and troubled debt restructurings, and the related specific allowance for loan losses on such loans at December 31, 2009 and 2008, is presented below (in thousands):
| As of December 31, | ||||||
| 2009 | 2008 | |||||
| Impaired loans with no valuation reserve |
$ | 56,413 | $ | 35,640 | ||
| Impaired loans with a valuation reserve |
23,743 | 17,073 | ||||
| Total recorded investment in impaired loans |
$ | 80,156 | $ | 52,713 | ||
| Valuation allowance related to impaired loans |
$ | 2,731 | $ | 3,280 | ||
The average recorded investment in impaired loans was approximately $49.8 million and $17.5 million for the years ended December 31, 2009 and 2008, respectively. Interest income of $347,000, $397,000 and $85,000 was recognized on impaired loans for the years ended December 31, 2009, 2008 and 2007.
101
Table of Contents
Index to Financial Statements
5. Premises and Equipment
Premises and equipment are summarized as follows (in thousands):
| Estimated useful lives (in years) |
As of December 31, | |||||||||
| 2009 | 2008 | |||||||||
| Furniture, fixtures and equipment |
3-10 | $ | 17,689 | $ | 17,492 | |||||
| Building and improvements |
3-20 | 4,422 | 4,422 | |||||||
| Land |
— | 1,548 | 1,548 | |||||||
| Leasehold improvements |
5 | 5,726 | 5,718 | |||||||
| 29,385 | 29,180 | |||||||||
| Accumulated depreciation |
(23,343 | ) | (21,812 | ) | ||||||
| Premises and equipment, net |
$ | 6,042 | $ | 7,368 | ||||||
6. Goodwill and Core Deposit Intangibles
Changes in the carrying amount of the Company’s goodwill and core deposit intangibles (“CDI”) for the years ended December 31, 2009, 2008 and 2007 were as follows (in thousands):
| Goodwill | Core Deposit Intangibles |
|||||||
| Balance, January 1, 2007 |
$ | 21,827 | $ | 1,103 | ||||
| Amortization |
— | (347 | ) | |||||
| Balance, December 31, 2007 |
21,827 | 756 | ||||||
| Amortization |
— | (250 | ) | |||||
| Balance, December 31, 2008 |
21,827 | 506 | ||||||
| Impairment |
(2,500 | ) | — | |||||
| Amortization |
— | (177 | ) | |||||
| Balance, December 31, 2009 |
$ | 19,327 | $ | 329 | ||||
Core Deposit Intangibles
Gross CDI outstanding was $1.7 million at December 31, 2009, 2008 and 2007. CDI is amortized using an economic life method based on deposit attrition projections derived from nationally-observed patterns within the banking industry and Metro United’s historical data. Accordingly, CDI is amortized over time under an accelerated method, being a weighted average period of 10 years with no residual value. Accumulated amortization of CDI was $1.4 million, $1.2 million and $974,000 as of December 31, 2009, 2008 and 2007, respectively.
The estimated aggregate future amortization expense for CDI remaining as of December 31, 2009 is as follows (in thousands):
| 2010 |
126 | ||
| 2011 |
88 | ||
| 2012 |
56 | ||
| 2013 |
37 | ||
| 2014 |
22 | ||
| Thereafter |
— | ||
| Total |
$ | 329 | |
102
Table of Contents
Index to Financial Statements
Goodwill
Goodwill is recorded on the acquisition date of each entity, and evaluated annually for possible impairment. Goodwill is required to be tested for impairment on an annual basis or as events occur or circumstances change that would more likely than not reduce the fair value of a reporting unit below its carrying amount. The Company’s only reporting unit with assigned goodwill is Metro United.
The Company performed the annual impairment testing based on information that was as of August 31, 2009. The review utilized the income approach and the market approach.
The income approach was based on projected cash flow derived from balance sheet and income statement activities discounted to estimate the value of Metro United. Financial forecasts were developed by projecting net income for the next five years and discounting the average terminal values based on the valuation multiples listed in the previous paragraph in a normalized market. The financial forecasts considered several key business drivers such as anticipated loan and deposit growth, forward interest rates, historical performance, and industry and economic trends, among other considerations.
The market approach uses guideline bank transactions selected from a similar geographic footprint as Metro United or having a similar market focus, based on publicly available information. Valuation multiples such as price-to-book, price-to-tangible book, price-to-deposits, and price-to-earnings from the guideline transactions are compared with Metro United’s operating results to derive the fair value as of the valuation date.
Using the income approach, the Company utilized a discounted cash flow analysis to determine the fair value of Metro United. Multi-year financial forecasts were developed by projecting net income for the next five years and discounting the average terminal values based on the transaction multiples such as price-to-book, price-to-tangible book, and price-to-deposits in a normalized market. For the test as of August 31, 2009, the Company used an average growth rate of 2.5% for the five-year period and discounted Metro United’s terminal value using a 10% rate of return. The Company also performed a sensitivity analysis utilizing additional discount rates ranging from 8% to 15%. In the sensitivity analysis, an 8% discount rate indicated a fair value that was $20.3 million greater than carrying value, a 13.8% discount rate indicated that the fair value and carrying value were approximately equal, and a 15% discount rate indicated a fair value that was $3.3 million less than carrying value.
The Company also considered the fair value of Metro United in relationship to the Company’s stock price and performed a reconciliation to the market price. This reconciliation was performed by first using the Company’s market price on a minority basis with an estimated control premium of 30%. The Company then allocated the total fair value to both of its reporting units, MetroBank and Metro United. The derived fair value of Metro United was then compared to the carrying value of its equity. As the carrying value of its equity exceeded the fair value, the second step of goodwill impairment evaluation was performed which involved calculating the implied fair value of Metro United’s goodwill.
The implied fair value of goodwill is determined in the same manner as the amount of goodwill recognized in a business combination. The fair value of Metro United’s assets and liabilities, including unrecognized intangible assets, is individually evaluated. The fair value of Metro United in excess of the fair value of its net assets is the implied fair value of goodwill. The Company estimated the fair value of Metro United’s assets and liabilities, including previously unrecognized intangible assets, through a variety of valuation techniques that incorporated interest rates, credit or nonperformance risk, as well as market risk adjustments that are indicative of the current economic environment. The estimated values are based on an exit price and reflect management’s expectations regarding how a market participant would value the assets and liabilities. This evaluation and resulting conclusion were significantly affected by the estimated fair value of the loans of Metro United that were evaluated, particularly the market risk adjustment that is a consequence of the current distressed market conditions. Based on this analysis, the Company determined that the implied fair value of the goodwill for Metro United was in excess of the carrying value of the goodwill; therefore, no goodwill impairment was recorded as of August 31, 2009 the annual test date.
103
Table of Contents
Index to Financial Statements
The Company performed the evaluation detailed above as of December 31, 2008, and as a result of declining stock price of the Company, the Company performed the evaluation at each of the subsequent interim quarters, including the annual evaluation as of August 31, 2009. On all of the quarterly evaluations, including the annual evaluation at August 31, 2009, the Company failed the first step of the impairment test but passed the second step of the impairment test as of the testing dates.
During the fourth quarter of 2009, the Company’s stock continued to trade below book value and declined further. The Company performed an evaluation of goodwill as of December 31, 2009 and impaired goodwill by $2.5 million. Due to the staleness of the guideline bank transactions multiples and fluctuations in market capitalization of peer banks used in the market methods, management reduced the weight of the market approach and relied primarily on the income approach for the step one evaluation. The step one impairment test failed, and the Company performed the step two impairment test to derive the implied fair value of goodwill. As a result of the evaluation, the implied fair value of goodwill was less than the carrying value of goodwill by $2.5 million, and an impairment was recorded in the fourth quarter of 2009. The charge is a noncash adjustment to the Company’s financial statements. As goodwill and other intangible assets are not included in the calculation of regulatory capital, the Company’s well capitalized regulatory ratios are not affected. Subsequent reversal of goodwill impairment is prohibited.
It is possible that future changes in the fair value of Metro United’s net assets could result in future goodwill impairment. For example, to the extent that market liquidity returns and the fair value of the individual assets of Metro United increases at a faster rate than the fair value of Metro United as a whole, that may cause the implied goodwill to be lower than the carrying value of goodwill, resulting in further goodwill impairment. Ultimately, future potential changes in valuation assumptions may impact the estimated fair value of Metro United and cause its fair value to be below its carrying value, therefore resulting in an impairment of the goodwill. Subsequent to year end, fluctuations in the stock price may require reassessment of goodwill in the subsequent quarters of 2010.
7. Interest-Bearing Deposits
The types of accounts and their respective balances included in interest-bearing deposits are as follows (in thousands):
| As of December 31, | ||||||
| 2009 | 2008 | |||||
| Interest-bearing demand deposits |
$ | 55,912 | $ | 59,422 | ||
| Savings and money market accounts |
446,648 | 334,348 | ||||
| Time deposits less than $100,000 |
209,384 | 283,785 | ||||
| Time deposits $100,000 and over |
448,796 | 387,491 | ||||
| Interest-bearing deposits |
$ | 1,160,740 | $ | 1,065,046 | ||
At December 31, 2009, the scheduled maturities of time deposits were as follows (in thousands):
| 2010 |
$ | 567,471 | |
| 2011 |
52,431 | ||
| 2012 |
24,639 | ||
| 2013 |
4,130 | ||
| 2014 |
9,509 | ||
| Thereafter |
— | ||
| $ | 658,180 | ||
The Company had $66.5 million and $35.0 million of brokered deposits at December 31, 2009 and 2008, respectively. Pursuant to the Agreement, MetroBank must obtain prior approval from the Assistant Deputy Comptroller of the OCC before it may accept, renew or roll over any brokered deposits. There were no major deposit concentrations as of December 31, 2009 or 2008.
104
Table of Contents
Index to Financial Statements
8. Junior Subordinated Debentures
In September 2005, the Company formed MCBI Statutory Trust I, a variable interest entity for which the Company is not the primary beneficiary. Accordingly, the accounts of the trust are not included in the Company’s consolidated financial statements. See Note 1—“Summary of Significant Accounting Policies” for additional information about the Company’s consolidation policy.
On October 3, 2005, the Trust issued 35,000 Fixed/Floating Rate Capital Securities with an aggregate liquidation value of $35.0 million to a third party in a private placement. Concurrent with the issuance of the capital securities, the Trust issued trust common securities to the Company in the aggregate liquidation value of $1.1 million. The proceeds of the issuance of the capital securities and trust common securities were invested in $36.1 million of the Company’s Fixed/Floating Rate Junior Subordinated Deferrable Interest Debentures. The net proceeds to the Company from the sale of the debentures to the Trust were used to fund the Company’s acquisition of Metro United.
The proceeds from the sale of debentures represent liabilities of the Company to the Trust and are reported in the consolidated balance sheet as junior subordinated debentures. Interest payments on these debentures are deductible for tax purposes. The capital securities of the Trust are not registered with the Securities and Exchange Commission. For regulatory reporting purposes, the capital securities can qualify up to 25% of the total Tier I capital of the Company.
The debentures accrue interest at a fixed rate of 5.7625% until December 15, 2010, at which time the debentures will accrue interest at a floating rate equal to the 3-month LIBOR plus 1.55%. The quarterly distributions on the capital securities will be paid at the same rate that interest is paid on the debentures, and will be paid on the 15th day of December, March, June and September. The ability of the Trust to pay amounts due on the capital securities and common securities is solely dependent upon the Company making payment on the related debentures. The debentures, which are the only assets of the Trust, are subordinate and junior in right of payment to all of the Company’s present and future senior indebtedness. Under the provisions of the debentures, the Company has the right to defer payment of interest on the debentures at any time, or from time to time, for a period not exceeding five years. If interest payments on the debentures are deferred, the distributions on the capital securities and common securities will also be deferred.
During the third quarter of 2009, the Company entered into a forward-starting interest rate swap contract on the junior subordinated debentures with a notional amount of $17.5 million. Under the five-year swap contract, beginning December 2010, the Company will pay a fixed interest rate of 5.38% and receive a variable interest rate of three-month LIBOR plus a margin of 1.55% on a total notional amount of $17.5 million, with quarterly settlements beginning March 2011. See Note 18 “Derivative Financial Instruments”.
The debentures mature on December 15, 2035, but are redeemable at the Company’s option at par plus accrued and unpaid interest on or after December 15, 2010. If the Company redeems any amount of the debentures, the Trust must redeem a like amount of the capital securities. The Company has guaranteed the payment of distributions and payments on liquidation or redemption of the capital securities, but only in each case if and to the extent of funds held by the Trust.
9. Other Borrowings
Other borrowings are as follows (in thousands):
| As of December 31, | ||||||
| 2009 | 2008 | |||||
| FHLB advances and loans |
$ | — | $ | 109,000 | ||
| Repurchase agreements |
25,000 | 25,000 | ||||
| Subordinated debentures |
— | 4,000 | ||||
| TT&L deposits |
513 | 1,046 | ||||
| $ | 25,513 | $ | 139,046 | |||
105
Table of Contents
Index to Financial Statements
The Company utilizes borrowings to supplement deposits to fund its lending and investing activities. Other borrowings sources typically include advances from the Federal Home Loan Bank (“FHLB”) of Dallas and from the FHLB of San Francisco. At December 31, 2009, there were no advances outstanding from the FHLB.
The Company has entered into securities repurchase agreements with two counterparty financial institutions that bear a weighted average interest rate per annum of 3.71% and mature on December 31, 2014. Securities sold under securities repurchase agreements are currently puttable by the counterparty at a fixed repurchase price at the end of each calendar quarter. In addition, securities under one repurchase agreement are puttable by either the counterparty or the Company at the replacement cost of the repurchase transaction at the end of each calendar year commencing on December 31, 2011. The Company has pledged and transferred securities as collateral under repurchase agreements with an aggregate fair value of $31.6 million as of December 31, 2009. The counterparties are permitted, in certain instances, to sell or repledge securities transferred or pledged by the Company to secure the repurchase obligations.
Other short-term borrowings at December 31, 2009 and 2008 consist of $513,000 and $1.0 million respectively, in Treasury, Tax and Loan (“TT&L”) payments deposited in Company accounts for the benefit of the U.S. Treasury. These funds typically remain in the Company for one day and are then moved to the U.S. Treasury. The Company has pledged securities with a fair value of $1.5 million and $1.1 million at December 31, 2009 and 2008, respectively to secure these TT&L deposits.
The Company’s unused borrowing capacity from the Federal Reserve Bank discount window at December 31, 2009 and 2008 was $21.8 million and $9.8 million, respectively. The Company had pledged securities with a fair value of $9.8 million and $10.1 million at December 31, 2009 and 2008, respectively and pledged loans at a collateral value of $12.3 million and $0 at December 31, 2009 and 2008, respectively to secure the discount window borrowing capacity. The Company also had unused, unsecured lines of credit with correspondent banks of $10.0 and $17.0 million at December 31, 2009 and 2008, respectively.
10. Income Taxes
The Company is subject to taxation in the United States and Texas and California. State income tax returns are generally subject to examination for a period of three to five years after filing. The state impact of any changes made to the federal return remains subject to examination by various states for a period up to one year after formal notification to the state. The Company is open to federal tax authority examinations for the tax years ended December 31, 2005 through December 31, 2008.
The Company’s effective tax rate was 29.7% for year ended December 31, 2009 compared with 39.6% for the year ended December 31, 2008. The decrease in the effective income tax rate in 2009 as compared to 2008 was primarily the result of non-deductible goodwill impairment, offset in part by an increase in the rate attributable to state income taxes and the increase in nondeductible stock-based compensation as a percentage of pre-tax income. The Texas tax is based on the Company’s gross margin with limited deductions. Because the Texas tax allows only limited deductions the tax may not correlate, from year to year, with pre-tax income. The California tax is based on the unitary income of the consolidated group which can vary disproportionately from pre-tax income depending on the apportionment of income among members of the unitary group.
106
Table of Contents
Index to Financial Statements
Deferred income taxes result from differences between the amounts of assets and liabilities as measured for income tax return and for financial reporting purposes. The significant components of the net deferred tax asset are as follows (in thousands):
| As of December 31, | ||||||
| 2009 | 2008 | |||||
| Deferred tax assets: |
||||||
| Allowance for loan losses |
$ | 10,831 | $ | 8,942 | ||
| Deferred loan fees |
466 | 572 | ||||
| Premises and equipment |
1,361 | 1,488 | ||||
| Interest on nonaccrual loans |
341 | 254 | ||||
| Unrealized losses on investment securities available-for-sale |
600 | 532 | ||||
| Securities impairment |
421 | 173 | ||||
| Foreclosed assets |
598 | 90 | ||||
| Deferred compensation |
25 | 52 | ||||
| Other |
127 | 20 | ||||
| Gross deferred tax assets |
14,770 | 12,123 | ||||
| Deferred tax liabilities: |
||||||
| Core deposit intangibles |
133 | 205 | ||||
| FHLB stock dividends |
194 | 439 | ||||
| Gross deferred tax liabilities |
327 | 644 | ||||
| Net deferred tax assets |
$ | 14,443 | $ | 11,479 | ||
The Company has not provided a valuation allowance for the net deferred tax assets at December 31, 2009 and 2008 due primarily to its ability to offset reversals of net deductible temporary differences against income taxes paid in previous years and expected to be paid in future years.
Components of the provision (benefit) for income taxes are as follows (in thousands):
| Years Ended December 31, | ||||||||||||
| 2009 | 2008 | 2007 | ||||||||||
| Federal |
||||||||||||
| Current provision (benefit) for federal income taxes |
$ | (343 | ) | $ | 4,454 | $ | 7,529 | |||||
| Deferred federal income tax benefit |
(2,695 | ) | (3,850 | ) | (972 | ) | ||||||
| Total provision (benefit) for federal income taxes |
(3,038 | ) | 604 | 6,557 | ||||||||
| State |
||||||||||||
| Current provision for state income taxes |
301 | 818 | 410 | |||||||||
| Deferred state income tax benefit |
(250 | ) | (217 | ) | (28 | ) | ||||||
| Total provision for state income taxes |
51 | 601 | 382 | |||||||||
| Total provision (benefit) for income taxes |
$ | (2,987 | ) | $ | 1,205 | $ | 6,939 | |||||
107
Table of Contents
Index to Financial Statements
A reconciliation of the provision (benefit) for income taxes computed at statutory rates compared with the actual provision (benefit) for income taxes is as follows (in thousands):
| Years Ended December 31, | |||||||||||||||||||||
| 2009 | 2008 | 2007 | |||||||||||||||||||
| Amount | Percent | Amount | Percent | Amount | Percent | ||||||||||||||||
| Federal income tax provision (benefit) at statutory rate |
$ | (3,488 | ) | (35 | )% | $ | 1,064 | 35 | % | $ | 6,690 | 35 | % | ||||||||
| Tax-exempt interest income |
(107 | ) | (1 | ) | (72 | ) | (2 | ) | (93 | ) | (1 | ) | |||||||||
| Stock-based compensation |
185 | 2 | 395 | 13 | 333 | 2 | |||||||||||||||
| State income taxes |
33 | — | 390 | 13 | 208 | 1 | |||||||||||||||
| Non-deductible goodwill impairment |
875 | 9 | — | — | — | — | |||||||||||||||
| Bank owned life insurance |
(502 | ) | (5 | ) | (473 | ) | (16 | ) | (258 | ) | (1 | ) | |||||||||
| Other, net |
17 | — | (99 | ) | (3 | ) | 59 | — | |||||||||||||
| Provision (benefit) for income taxes |
$ | (2,987 | ) | (30 | )% | $ | 1,205 | 40 | % | $ | 6,939 | 36 | % | ||||||||
The following sets forth the deferred tax benefit (provision) related to other comprehensive income (in thousands):
| Years Ended December 31, | |||||||||||
| 2009 | 2008 | 2007 | |||||||||
| Accumulated gains (losses) on effective cash flow hedging derivatives |
$ | (22 | ) | $ | — | $ | — | ||||
| Unrealized gains (losses) on investment securities: |
|||||||||||
| Securities with OTTI charges during the period |
(754 | ) | (317 | ) | — | ||||||
| Less: OTTI charges recognized in net income |
(255 | ) | (317 | ) | — | ||||||
| Net unrealized losses on investment securities with OTTI |
(499 | ) | — | — | |||||||
| Unrealized gains (losses) arising during the period |
870 | (37 | ) | 921 | |||||||
| Less: reclassification adjustment for gains (losses) realized in net income |
439 | 33 | 1 | ||||||||
| Net unrealized gains (losses) on investment securities |
431 | (70 | ) | 920 | |||||||
| Total comprehensive income (loss) |
$ | (90 | ) | $ | (70 | ) | $ | 920 | |||
11. Shareholders’ Equity
In connection with the Company’s participation in the Capital Purchase Program (“CPP”), on January 16, 2009, the Company issued and sold to the U.S. Treasury (i) 45,000 shares of its Fixed Rate Cumulative Perpetual Preferred Stock, Series A, par value $1.00 per share, with a liquidation value of $1,000 per share (the “Series A Preferred Stock”), and (ii) a warrant (“Warrant”) to purchase 771,429 shares of the Company’s Common Stock, at an exercise price of $8.75 per share, subject to certain anti-dilution and other adjustments, for an aggregate purchase price of $45.0 million in cash. Approximately $44.3 million was allocated to the initial carrying value of the preferred stock and $711,000 to the warrant based on their relative estimated fair values on the issue date. The fair value of the warrant was determined using a valuation model which incorporates assumptions including the Company’s Common Stock price, dividend yield, stock price volatility and the risk-free interest rate. The fair value of the preferred stock was determined based on assumptions regarding the discount rate for the Company which was estimated to be approximately 8% at the date of issuance. The difference between the initial carrying value of the preferred stock and the $45 million full redemption value is accreted over five years using a straight-line method over the expected life of the preferred stock. The total capital raised through this issue qualifies as Tier 1 regulatory capital and can be used in calculating all regulatory capital ratios.
The Series A Preferred Stock pays cumulative dividends at a rate of 5% per year for the first five years and thereafter at a rate of 9% per year. Pursuant to Section 111 of the Emergency Economic Stabilization Act of
108
Table of Contents
Index to Financial Statements
2008, as amended, the Company may, at its option, subject to the necessary bank regulatory approval, redeem the Series A Preferred Stock at par value plus accrued and unpaid dividends.
The Company may not declare or pay dividends on its common stock or, with certain exceptions, repurchase common stock without first having paid all accrued cumulative preferred dividends that are due. For three years from the issue date, the Company also may not increase its common stock dividend rate above a quarterly rate of $0.04 per share or repurchase its common shares without Treasury’s consent, unless Treasury has transferred all the preferred shares to third parties or the preferred stock has been redeemed. In April 2009, the Company suspended regular cash dividends on its common stock for an indefinite period of time.
The Company declared and paid dividends of $0.04 per share to the common shareholders of record for the three months ended March 31, 2009, and paid dividends declared of $0.04 per share to shareholders of record as of December 31, 2008, which were paid on January 15, 2009. The Company declared and paid dividends of $0.16 per share to the common shareholders of record during the year ended December 31, 2008 which included a dividend declared of $0.04 per share to shareholders of record as of December 31, 2007, which was paid on January 15, 2008. Preferred dividends paid for the year ended December 31, 2009 were $1.87 million.
The Company maintains a stock repurchase plan that was announced on August 30, 2007. Under the plan, the Board of Directors authorized the Company to repurchase up to 500,000 shares of its Common Stock from time to time, with no expiration date, at various prices in the open market or through privately negotiated transactions. No shares were repurchased in 2009 or 2008, and at of December 31, 2009, the Company did not have any plan for future purchases.
12. Regulatory Matters
The Banks are subject to regulations and, among others things, may be limited in their ability to pay dividends or otherwise transfer funds to the holding company. Under applicable restrictions as of December 31, 2009, no dividends could be paid by MetroBank and Metro United to the Parent without regulatory approval. In addition, dividends paid by the Banks to the holding company would be prohibited if the effect thereof would cause the Banks’ capital to be reduced below applicable minimum capital requirements.
On August 10, 2009, MetroBank entered into a written agreement (the “Agreement”) with the OCC. The Agreement is based on the findings of the OCC during the annual on-site examination of MetroBank performed in the first quarter of 2009 and is primarily focused on matters related to MetroBank’s asset quality. Pursuant to the Agreement, the Board of Directors of MetroBank has appointed a compliance committee to monitor and coordinate MetroBank’s performance under the Agreement. The Agreement provides for, among other things, the development and implementation of written programs to reduce MetroBank’s credit risks, monitor and reduce the level of criticized assets and manage commercial real estate loan concentrations in light of current adverse commercial real estate market conditions generally and in its market areas. During and since the completion of the examination, management of MetroBank has proactively made adjustments in policies and procedures in an effort to alleviate the effects of the credit challenge caused by the economic deterioration and market conditions generally and in its market areas. Additionally, management and the Boards of Directors of the Company and MetroBank have aggressively taken steps to address the findings of the exam and are aggressively working to comply with the requirements of the Agreement. Failure by MetroBank to meet the requirements and conditions imposed by the Agreement could result in more severe regulatory enforcement actions such as capital directives to raise additional capital, civil money penalties, cease and desist or removal orders, injunctions, and public disclosure of such actions against MetroBank. Any such failure and resulting regulatory action could have a material adverse effect on the financial condition and results of operations of the Company and MetroBank.
The Company and the Banks are subject to various regulatory capital requirements administered by the federal banking agencies. Failure to meet minimum capital requirements can initiate certain mandatory, and possibly additional discretionary, actions by regulators that, if undertaken, could have a direct material effect on
109
Table of Contents
Index to Financial Statements
the Company’s financial statements. The regulations require the Company to meet specific capital adequacy guidelines that involve quantitative measures of the Company’s assets, liabilities, and certain off-balance sheet items as calculated under regulatory accounting practices. The Banks’ capital classification is also subject to qualitative judgments by the regulators about components, risk weightings and other factors.
Quantitative measures established by regulation to ensure capital adequacy require the Company and the Banks to maintain minimum amounts and ratios of total and Tier 1 capital to risk-weighted assets, and of Tier 1 capital to average assets. Management believes, as of December 31, 2009, that the Company and the subsidiary banks met all capital adequacy requirements to which they were subject.
As of December 31, 2009, the most recent notifications from the OCC with respect to MetroBank and the FDIC with respect to Metro United categorized MetroBank and Metro United as “well capitalized” under the regulatory framework for prompt corrective action. There are no conditions or events since the notifications that management believes have changed MetroBank’s level of capital adequacy.
The Company’s and the Banks’ actual capital amounts and ratios at the dates indicated are presented in the following table (dollars in thousands):
| Actual | Minimum Required For Capital Adequacy Purposes |
To be Categorized as Well Capitalized under Prompt Corrective Action Provisions |
|||||||||||||||
| Amount | Ratio | Amount | Ratio | Amount | Ratio | ||||||||||||
| As of December 31, 2009 |
|||||||||||||||||
| Total risk-based capital ratio |
|||||||||||||||||
| MetroCorp Bancshares, Inc |
$ | 189,043 | 13.80 | % | $ | 109,586 | 8.00 | % | N/A | N/A | % | ||||||
| MetroBank, N.A |
138,342 | 14.01 | 79,012 | 8.00 | 98,766 | 10.00 | |||||||||||
| Metro United Bank |
48,625 | 12.74 | 30,537 | 8.00 | 38,171 | 10.00 | |||||||||||
| Tier 1 risk-based capital ratio |
|||||||||||||||||
| MetroCorp Bancshares, Inc |
171,756 | 12.54 | 54,793 | 4.00 | N/A | N/A | |||||||||||
| MetroBank, N.A |
125,853 | 12.74 | 39,506 | 4.00 | 59,259 | 6.00 | |||||||||||
| Metro United Bank |
43,832 | 11.48 | 15,268 | 4.00 | 22,903 | 6.00 | |||||||||||
| Leverage ratio |
|||||||||||||||||
| MetroCorp Bancshares, Inc |
171,756 | 10.76 | 63,845 | 4.00 | N/A | N/A | |||||||||||
| MetroBank, N.A |
125,853 | 10.69 | 47,113 | 4.00 | 58,891 | 5.00 | |||||||||||
| Metro United Bank |
43,832 | 10.47 | 16,750 | 4.00 | 20,937 | 5.00 | |||||||||||
| As of December 31, 2008 |
|||||||||||||||||
| Total risk-based capital ratio |
|||||||||||||||||
| MetroCorp Bancshares, Inc |
$ | 151,453 | 10.17 | % | $ | 119,150 | 8.00 | % | N/A | N/A | % | ||||||
| MetroBank, N.A |
114,358 | 10.39 | 88,019 | 8.00 | 110,024 | 10.00 | |||||||||||
| Metro United Bank |
40,447 | 10.41 | 31,079 | 8.00 | 38,848 | 10.00 | |||||||||||
| Tier 1 risk-based capital ratio |
|||||||||||||||||
| MetroCorp Bancshares, Inc |
130,316 | 8.75 | 59,575 | 4.00 | N/A | N/A | |||||||||||
| MetroBank, N.A |
100,513 | 9.14 | 44,009 | 4.00 | 66,014 | 6.00 | |||||||||||
| Metro United Bank |
35,584 | 9.16 | 15,539 | 4.00 | 23,309 | 6.00 | |||||||||||
| Leverage ratio |
|||||||||||||||||
| MetroCorp Bancshares, Inc |
130,316 | 8.54 | 61,022 | 4.00 | N/A | N/A | |||||||||||
| MetroBank, N.A |
100,513 | 8.86 | 45,395 | 4.00 | 56,744 | 5.00 | |||||||||||
| Metro United Bank |
35,584 | 9.09 | 15,662 | 4.00 | 19,577 | 5.00 | |||||||||||
As of December 31, 2009, $35.0 million in capital securities issued by MCBI Statutory Trust I were included in the Company’s Tier 1 capital for regulatory purposes and $0 were included in Tier 2 capital. As of
110
Table of Contents
Index to Financial Statements
December 31, 2008, $32.6 million in capital securities issued by MCBI Statutory Trust I were included in the Company’s Tier 1 capital for regulatory purposes and the excess $2.4 million were included in Tier 2 capital. On March 1, 2005, the Federal Reserve adopted final rules that would continue to allow trust preferred securities to be included in Tier 1 capital, subject to stricter quantitative and qualitative limits. Currently, trust preferred securities and qualifying perpetual preferred stock are limited in the aggregate to no more than 25% of a bank holding company’s core capital elements. The new rule amends the existing limit by providing that restricted core capital elements (including trust preferred securities and qualifying perpetual preferred stock) can be no more than 25% of core capital, net of goodwill and associated deferred tax liability. Because the 25% limit currently is calculated without deducting goodwill, the final rule reduces the amount of trust preferred securities that the Company can include in Tier 1 capital. The amount of such excess trust preferred securities are includable in Tier 2 capital. The new quantitative limits will be fully effective on March 31, 2011.
13. 401(k) Profit Sharing Plan
The Company has established a defined contribution profit sharing plan pursuant to Internal Revenue Code Section 401(k) covering substantially all employees (the “Plan”). The Plan provides for pretax employee contributions of up to 100% of annual compensation with an annual dollar limit of $22,000 per participant for the year ended December 31, 2009, and $20,500 per participant for the years ended December 31, 2008 and 2007. The Banks match each participant’s contributions to the Plan up to 4% of such participant’s salary for the years ended December 31, 2009 and 2007, and 5% of such participant’s salary for the year ended December 31, 2008. MetroBank made contributions to the Plan of approximately $445,000, $630,000, and $649,000 during the years ended December 31, 2009, 2008, and 2007, respectively. Metro United made contributions to the Plan of approximately $132,000, $170,000 and $145,000 during the years ended December 31, 2009, 2008 and 2007, respectively.
14. Stock-Based Compensation
The Company issues stock options to employees under the Company’s 2007 Stock Awards and Incentive Plan (“2007 Plan”) and prior to December 16, 2008 under the Company’s 1998 Stock Incentive Plan (“1998 Plan”). The Company estimates fair value of stock option awards as of grant date using the Black-Scholes option valuation model. This model was developed for use in estimating the fair value of traded options which have no vesting restrictions and are fully transferable. In addition, it requires the input of highly subjective assumptions including the expected stock price volatility. Because the Company’s employee stock options awards have characteristics significantly different from those of traded options, and because changes in the subjective input assumptions can materially affect the fair value estimate, the existing model does not necessarily provide a reliable single measure of the fair value of employee stock options. The expected term of the options was derived using the “simplified” method. The Company’s option grants met the “plain vanilla” option definition and did not have sufficient historical option exercise data to calculate an alternative expected term. Expected stock price volatility is based on historical volatility of the Company’s stock that covers a period which corresponds to the expected life of the options. The risk-free interest rate for the expected life of the options granted is based on the U.S. Treasury yield in effect as of the grant date. The dividend yield is calculated using the expected annual dividend amount divided by the published stock price on grant date.
For the years ended December 31, 2009, 2008 and 2007, total stock-based compensation cost recognized in the Company’s Consolidated Statements of Operations was $671,000, $1.1 million and $1.1 million, respectively.
Stock Incentive Plans. The Company has one active stock incentive plan. Shares of stock may be issued under the plan from unissued common stock or treasury stock. Shares of stock were also issued under the 1998 Plan, which expired on December 16, 2008.
The 1998 Plan authorized the issuance of up to 1,050,000 shares of Common Stock under both “non qualified” and “incentive” stock options and performance shares of Common Stock. Non-qualified options and
111
Table of Contents
Index to Financial Statements
incentive stock options were granted at no less than the fair market value of the Common Stock and must be exercised within ten years unless the applicable award agreement specifies a shorter term. Performance shares are certificates representing the right to acquire shares of Common Stock upon the satisfaction of performance goals established by the Company. Holders of performance shares have all of the voting, dividend and other rights of shareholders of the Company, subject to the terms of the award agreement relating to such shares. If the performance goals are achieved, the performance shares will vest and may be exchanged for shares of Common Stock. If the performance goals are not achieved, the performance shares may be forfeited. No performance shares have been awarded under the 1998 Plan since inception.
As amended on May 8, 2009, the 2007 Plan authorizes the issuance of up to 650,000 shares of Common Stock, and provides for the granting of incentive stock options, nonqualified stock options, stock appreciation rights, restricted stock awards, performance awards, phantom stock awards or any combination of the foregoing. No more than 50,000 shares of stock may be subject to options or stock appreciation rights granted under the 2007 Plan to any one individual during any 12 month period. No more than 20,000 shares of stock may be granted under the 2007 Plan as a restricted stock award to any one individual during any 12 month period. Restricted stock may be granted with or without payment except to the extent required by law and awards are subject to performance or service restrictions as determined by the Compensation Committee. The recipient of restricted stock is entitled to voting rights and dividends on the common stock prior to the lapsing of the forfeiture restrictions with respect to such stock. As of December 31, 2009, there were 319,196 shares available for future grants under the 2007 Plan.
The Company classifies all share-based awards as equity instruments and recognizes the vesting of the awards ratably over their respective terms. Compensation expense for each tranche of each award was separately recognized as if it was a separate award with its own vesting date.
Stock option awards generally vest 30% in each of the two years following the date of the grant and 40% in the third year following the date of the grant and have contractual terms of up to ten years. For all options granted on or after January 1, 2007, compensation expense is recognized on a graded-vesting basis from the grant date until the vesting date of the respective option.
Restricted stock vests in equal increments in each of the three years following the date of the grant. Compensation expense is recognized on a straight-line basis from the grant date until the vesting date of the respective award.
Stock Option Activity. The Company granted stock options to employees under both the 2007 Plan and the 1998 Plan. There were 30,000, 302,500, and 138,500 options granted during 2009, 2008, and 2007, respectively. All options are granted at a fixed exercise price. The fair value of stock awards was estimated at the date of grant using the Black-Scholes option valuation model with the following weighted average assumptions:
| Assumptions |
2009 | 2008 | 2007 | |||||||||
| Expected term (in years) |
6.0 | 6.0 | 4.5–6.1 | |||||||||
| Expected stock price volatility |
39.26 | % | 27.21 | % | 23.93 | % | ||||||
| Expected dividend yield |
0.00 | % | 0.80 | % | 0.80 | % | ||||||
| Risk-free interest rate |
2.93 | % | 3.33 | % | 4.85 | % | ||||||
| Estimated weighted average grant-date fair value per option granted |
$ | 1.53 | $ | 3.70 | $ | 6.17 | ||||||
112
Table of Contents
Index to Financial Statements
A summary of activity for the Company’s stock options as of December 31, 2009 and the changes during the year then ended is presented below:
| Number of Options Outstanding |
Weighted Average Exercise Price |
Weighted Average Remaining Contractual Life |
Aggregate Intrinsic Value (in thousands) | ||||||||
| Outstanding options at December 31, 2008 |
1,142,700 | $ | 14.28 | ||||||||
| Options granted |
30,000 | 3.98 | |||||||||
| Options exercised |
(0 | ) | 0.00 | ||||||||
| Options forfeited |
(121,750 | ) | 15.60 | ||||||||
| Outstanding options at December 31, 2009 |
1,050,950 | $ | 13.83 | 4.98 | $ | — | |||||
| Exercisable options at December 31, 2009 |
790,400 | $ | 14.09 | 3.92 | $ | — | |||||
There was no exercise of stock options in 2009. The total intrinsic value of options exercised during the years ended December 31, 2008 and 2007 was approximately $46,000 and $48,000, respectively.
As of December 31, 2009, compensation cost not yet recognized for unvested share-based awards was approximately $273,000, which is expected to be recognized over a weighted average period of 1.2 years. The total fair value of shares vested during the years ended December 31, 2009, 2008, and 2007 was $927,000, $845,000, and $446,000, respectively.
Restricted Stock Activity. The Company granted restricted stock to employees under the 2007 Plan. Compensation expense for restricted stock is measured based upon the number of shares granted multiplied by the difference of the stock price on the grant date less payment required, if any. Such expense is recognized in the Company’s Consolidated Statement of Income.
The following table summarizes the Company’s restricted stock activity for 2009:
| Shares | Weighted Average Grant Date Fair Value | |||||
| Outstanding at December 31, 2008 |
23,066 | $ | 15.15 | |||
| Granted |
— | — | ||||
| Vested |
(11,951 | ) | 15.36 | |||
| Forfeited |
(1,000 | ) | 16.97 | |||
| Outstanding at December 31, 2009 |
10,115 | 14.72 | ||||
As of December 31, 2009, compensation cost not yet recognized for unvested share-based awards was approximately $25,000, which is expected to be recognized over a weighted average period of 0.85 years. The total fair value of shares vested during the years ended December 31, 2009, 2008, and 2007 was $184,000, $96,000 and $0. No shares were converted nor were there any share-based liabilities paid during 2009, 2008, and 2007.
113
Table of Contents
Index to Financial Statements
15. Accumulated Other Comprehensive Income (Loss)
The balance of and changes in each component of accumulated other comprehensive income for the years ended December 31, 2009 and 2008 are as follows (net of taxes):
| Gains (Loss) on Effective Cash Hedging Derivatives |
Net Unrealized Losses on Investments with OTTI |
Net Unrealized Investment Gains (Losses) |
Total Accumulated Other Comprehensive Income (Losses) |
|||||||||||||
| Balance December 31, 2008 |
$ | — | $ | — | $ | (910 | ) | $ | (910 | ) | ||||||
| Current-year change |
(39 | ) | (888 | ) | 731 | (196 | ) | |||||||||
| Balance December 31, 2009 |
$ | (39 | ) | $ | (888 | ) | $ | (179 | ) | $ | (1,106 | ) | ||||
16. Earnings Per Share
Basic earnings per share (“EPS”) is computed by dividing net income available to common shareholders by the weighted-average number of common shares outstanding during the period. Diluted EPS is computed by dividing net income available to common shareholders by the weighted-average number of common shares and potentially dilutive common shares outstanding during the period. Stock options and restricted stock can be dilutive common shares and are therefore considered in the earnings per share calculation, if dilutive. Stock options and restricted stock that are antidilutive are excluded from the earnings per share calculation. Stock options and restricted shares are antidilutive when the exercise price is higher than the current market price of the Company’s Common Stock. As of December 31, 2009, 2008 and 2007 there were 1,803,000, 331,000 and 58,000, respectively, of antidilutive common shares comprised of stock options and restricted stock which were excluded from the diluted shares calculation. The number of potentially dilutive common shares is determined using the treasury stock method. For earnings per share calculation purposes, the impact of dilutive securities are excluded from the diluted share count during periods that the Company has recognized a net loss available to common shareholders.
Earnings per share for the years ended December 31, 2009, 2008 and 2007 are calculated below (in thousands, except per share amounts):
| Years Ended December 31, | ||||||||||
| 2009 | 2008 | 2007 | ||||||||
| Net income (loss) available to common shareholders |
$ | (9,229 | ) | $ | 1,835 | $ | 12,175 | |||
| Weighted average common shares in basic EPS |
10,904 | 10,833 | 10,935 | |||||||
| Effect of dilutive securities(1) |
— | 64 | 175 | |||||||
| Weighted average common and potentially dilutive common shares used in diluted EPS |
10,904 | 10,897 | 11,110 | |||||||
| Earnings (loss) per common share: |
||||||||||
| Basic |
$ | (0.85 | ) | $ | 0.17 | $ | 1.11 | |||
| Diluted |
$ | (0.85 | ) | $ | 0.17 | $ | 1.10 | |||
| (1) | For earnings per share calculation purposes, the impact of dilutive securities are excluded from the diluted share count during periods that the Company has recognized a net loss available to common shareholders. |
17. Off-Balance Sheet Activities
The Company is party to financial instruments with off-balance sheet risk in the normal course of business to meet the financing needs of its customers. These financial instruments include various guarantees, commitments to extend credit and standby letters of credit. Additionally, these instruments may involve, to varying degrees, credit risk in excess of the amount recognized in the consolidated balance sheets. The Company’s maximum exposure to credit loss under such arrangements is represented by the contractual amount
114
Table of Contents
Index to Financial Statements
of those instruments. The Company applies the same credit policies and collateralization guidelines in making commitments and conditional obligations as it does for on-balance sheet instruments. Off-balance sheet financial instruments include commitments to extend credit and guarantees under standby and other letters of credit. Unfunded loan commitments including unfunded lines of credit at December 31, 2009 and 2008 were $121.2 million and $247.7 million, respectively. Commitments under standby and commercial letters of credit at December 31, 2009 and 2008 were $23.0 million and $22.2 million, respectively. The Company conducts a portion of its operations utilizing leased premises and equipment under operating leases.
The contractual amount of the Company’s financial instruments with off-balance sheet risk at December 31, 2009 and 2008 is presented below (in thousands):
| 2009 | 2008 | |||||
| Unfunded loan commitments including unfunded lines of credit |
$ | 121,166 | $ | 247,731 | ||
| Standby letters of credit |
12,556 | 9,981 | ||||
| Commercial letters of credit |
10,415 | 12,244 | ||||
| Operating leases |
6,133 | 8,065 | ||||
| Total financial instruments with off-balance sheet risk |
$ | 150,270 | $ | 278,021 | ||
18. Derivative Financial Instruments
The fair value of derivative positions outstanding is included in other liabilities in the consolidated balance sheet and in the net change in this financial statement line item in the consolidated statements of cash flows.
Interest Rate Derivatives. During the third quarter of 2009, the Company entered into a forward-starting interest rate swap contract on its junior subordinated debentures with a notional amount of $17.5 million. The interest rate swap contract was designated as a hedging instrument in a cash flow hedge with the objective of protecting the quarterly interest payments on a portion of the Company’s $36.1 million of junior subordinated debentures issued to the Company’s unconsolidated subsidiary trust MCBI Statutory Trust I throughout the five-year period beginning in December 2010 and ending in December 2015 from the risk of variability of those payments resulting from changes in the three-month LIBOR interest rate. Under the five-year swap contract, beginning December 2010, the Company will pay a fixed interest rate of 5.38% and receive a variable interest rate of three-month LIBOR plus a margin of 1.55% on a total notional amount of $17.5 million, with quarterly settlements beginning March 2011.
The notional amount and estimated fair value of the interest rate derivative contract outstanding at December 31, 2009 was $17.5 million and ($61,000), respectively. There were no interest rate derivative contracts outstanding at December 31, 2008. The Company obtains dealer quotations to value its interest rate derivative contract designated as hedges of cash flows.
The Company applies hedge accounting to interest rate derivatives. To qualify for hedge accounting, a derivative must be highly effective at reducing the risk associated with the exposure being hedged. In addition, for a derivative to be designated as a hedge, the risk management objective and strategy must be documented. Hedge documentation must identify the derivative hedging instrument, the asset or liability and type of risk to be hedged, and how the effectiveness of the derivative will be assessed prospectively and retrospectively. To assess effectiveness, the Company compares the dollar-value of the change in the fair value of the derivative to the change in the fair value or cash flows of the hedged item. The extent to which a derivative has been, and is expected to continue to be, effective at offsetting changes in the fair value or cash flows of the hedged item must be assessed and documented at least quarterly. Any hedge ineffectiveness (i.e., the amount by which the gain or loss on the designated derivative instrument does not exactly offset the gain or loss on the hedged item attributable to the hedged risk) must be reported in current-period earnings. If it is determined that a derivative is not highly effective at hedging the designated exposure, hedge accounting is discontinued.
115
Table of Contents
Index to Financial Statements
Gains, Losses and Derivative Cash Flows. For cash flow hedges, the effective portion of the gain or loss due to changes in the fair value of the derivative hedging instrument is included in other comprehensive income, while the ineffective portion (indicated by the excess of the cumulative change in the fair value of the derivative over that which is necessary to offset the cumulative change in expected future cash flows on the hedge transaction) is included in other non-interest income or other non-interest expense. Net cash flows from the interest rate swap on junior subordinated debentures designated as a hedging instrument in an effective hedge of cash flows are included in interest expense on junior subordinated debentures.
Amounts included in the consolidated statements of operations and in other comprehensive income for the year ended December 31, 2009 to interest rate derivatives designated as hedges of cash flows were as follows:
| Gains/(losses) recorded in income and other comprehensive income (loss) (in thousands) | |||||||||||||||||
| Year ended December 31, 2009 |
Derivatives— effective portion reclassified from AOCI into income |
Hedge ineffectiveness recorded directly in income |
Total income statement impact |
Derivatives— effective portion recorded in OCI |
Total change in OCI for year |
||||||||||||
| Contract type |
|||||||||||||||||
| Interest rate |
$ | — | $ | — | $ | — | $ | (61 | ) | $ | (61 | ) | |||||
Counterparty Credit Risk. Derivative contracts involve the risk of dealing with institutional derivative counterparties and their ability to meet contractual terms. Derivative contracts are executed with a Credit Support Annex, or CSA, which is a bilateral ratings-sensitive agreement that requires collateral postings at established credit threshold levels. These agreements protect the interests of the Company and its counterparties, should either party suffer credit rating deterioration. Institutional counterparties must have an investment grade credit rating. The Company’s credit exposure on interest rate swaps is limited to the net favorable value and interest payments of all swaps by each counterparty. Credit exposure may be reduced by the amount of collateral pledged by the counterparty. There are no credit-risk-related contingent features associated with any of the Company’s derivative contracts. The Company had no credit exposure relating to the interest rate swap at December 31, 2009. The amount of cash collateral posted by the Company related to derivative contracts was $875,000 at December 31, 2009.
19. Fair Value
Financial Instruments Measured at Fair Value
FASB accounting guidance relating to fair value measurements defines fair value as the exchange price that would be received for an asset or paid to transfer a liability (an exit price) in the principal or most advantageous market for the asset or liability in an orderly transaction between market participants on the measurement date. FASB accounting guidance also establishes a fair value hierarchy which requires an entity to maximize the use of observable inputs and minimize the use of unobservable inputs when measuring fair value. FASB accounting guidance relating to fair value measurements were updated to apply to non-financial assets and non-financial liabilities and were adopted January 1, 2009. In addition, further updates affirm that the objective of fair value when the market for an asset is not active is the price that would be received to sell the asset in an orderly transaction, and clarify and include additional factors for determining whether there has been a significant decrease in market activity for an asset when the market for that asset is not active. This update was adopted April 1, 2009.
FASB accounting guidance describes three levels of inputs that may be used to measure fair value:
| • | Level 1—Quoted prices in active markets for identical assets or liabilities. |
| • | Level 2—Observable inputs other than Level 1 prices such as quoted prices for similar assets or liabilities; quoted prices in markets that are not active; or other inputs that are observable or can be corroborated by observable market data for substantially the full term of the assets or liabilities. |
116
Table of Contents
Index to Financial Statements
| • | Level 3—Unobservable inputs that are supported by little or no market activity and that are significant to the fair value of the assets or liabilities. Level 3 assets and liabilities include financial instruments whose value is determined using pricing models, discounted cash flow methodologies, or similar techniques, as well as instruments for which the determination of fair value requires significant management judgment or estimation. |
Financial assets measured at fair value on a recurring basis are as follows:
Securities. Where quoted prices are available in an active market, securities are reported at fair value utilizing Level 1 inputs. Level 1 securities are comprised of bond funds. If quoted market prices are not available, the Company obtains fair values from an independent pricing service. The fair value measurements consider data that may include proprietary pricing models, quoted prices of securities with similar characteristics or discounted cash flows. Level 2 securities are comprised of highly liquid government bonds, and collateralized mortgage and debt obligations. Market values provided by the pricing service are compared to prices from other sources for reasonableness. The Company has not adjusted the values from the pricing service. See Note 3 “Securities” for additional discussion on valuation of securities.
Interest Rate Derivatives. The Company’s derivative position is classified within Level 2 in the fair value hierarchy and is valued using models generally accepted in the financial services industry that use actively quoted or observable market input values from external market data providers and/or non-binding broker-dealer quotations. The fair value of the derivative is determined using discounted cash flow models. These models’ key assumptions include the contractual terms of the respective contract, along with significant observable inputs, including interest rates, yield curves, non-performance risk and volatility. Derivative contracts are executed with a Credit Support Annex, which is a bilateral ratings-sensitive agreement that requires collateral postings at established credit threshold levels. These agreements protect the interests of the Company and its counterparties, should either party suffer a credit rating deterioration.
117
Table of Contents
Index to Financial Statements
The following table presents the financial instruments carried at fair value on a recurring basis as of December 31, 2009 and 2008, by caption on the consolidated balance sheets and by valuation hierarchy (as described above):
| Fair Value Measurements, using | Fair Value Measurements |
|||||||||||||
| Quoted Prices in Active Markets for Identical Assets (Level 1) |
Significant Other Observable Inputs (Level 2) |
Significant Unobservable Inputs (Level 3) |
||||||||||||
| (In thousands) | ||||||||||||||
| Securities available-for-sale at December 31, 2009 |
||||||||||||||
| U.S. Treasury and other U.S. government corporations and agencies |
$ | — | $ | 57,228 | $ | — | $ | 57,228 | ||||||
| Obligations of state and political subdivisions |
— | 5,813 | — | 5,813 | ||||||||||
| Mortgage-backed securities and collateralized mortgage obligations |
— | |||||||||||||
| Government issued or guaranteed |
— | 32,308 | — | 32,308 | ||||||||||
| Privately issued residential |
— | 2,835 | — | 2,835 | ||||||||||
| Asset backed securities |
— | 184 | — | 184 | ||||||||||
| Total available-for-sale securities |
$ | — | $ | 98,368 | $ | — | $ | 98,368 | ||||||
| Derivative liabilities at December 31, 2009 |
$ | — | $ | (61 | ) | $ | — | $ | (61 | ) | ||||
| Securities available-for-sale at December 31, 2008 |
||||||||||||||
| U.S. Treasury and other U.S. government corporations and agencies |
$ | — | $ | 15,087 | $ | — | $ | 15,087 | ||||||
| Obligations of state and political subdivisions |
— | 3,877 | — | 3,877 | ||||||||||
| Mortgage-backed securities and collateralized mortgage obligations |
— | |||||||||||||
| Government issued or guaranteed |
— | 72,386 | — | 72,386 | ||||||||||
| Privately issued residential |
— | 4,359 | — | 4,359 | ||||||||||
| Asset backed securities |
— | 550 | — | 550 | ||||||||||
| Investment in CRA funds |
5,845 | — | — | 5,845 | ||||||||||
| Total available-for-sale securities |
$ | 5,845 | $ | 96,259 | $ | — | $ | 102,104 | ||||||
Certain non-financial assets measured at fair value on a recurring basis include reporting units measured at fair value in the first step of a goodwill impairment test. Certain non-financial assets measured at fair value on a non-recurring basis include non-financial assets and non-financial liabilities measured at fair value in the second step of a goodwill impairment test, as well as intangible assets measured at fair value for impairment assessment.
Certain financial assets are measured at fair value on a non-recurring basis; that is, the instruments are not measured at fair value on an ongoing basis but are subject to fair value adjustments in certain circumstances (for example, when there is evidence of impairment).
Goodwill. Goodwill is measured at fair value on a non-recurring basis using Level 3 inputs. In the first step of a goodwill impairment test, the Company primarily uses a review of the valuation of recent guideline bank acquisitions, if available, as well as discounted cash flow analysis. If the second step of a goodwill impairment test is required, the implied fair value of goodwill is determined in the same manner as goodwill is recognized in a business combination. See Note 6 “Goodwill and Core Deposit Intangibles” for additional information.
Impaired Loans. Certain impaired loans with a valuation reserve are measured for impairment using the practical expedient, whereby fair value of the loan is based on the fair value of the loan’s collateral, provided the loan is collateral dependent. The fair value measurements of loan collateral can include real estate appraisals, comparable real estate sales information, cash flow projections, realization estimates, etc., all of which can
118
Table of Contents
Index to Financial Statements
include observable and unobservable inputs. As a result, the categorization of impaired loans can be either Level 2 or Level 3 of the fair value hierarchy, depending on the nature of the inputs used for measuring the related collateral’s fair value. As of December 31, 2009, certain impaired loans were remeasured and reported at fair value through a specific valuation allowance allocation of the allowance for loan losses based upon the fair value of the underlying collateral. Impaired loans with a carrying value of $14.6 million were reduced by specific valuation allowance allocations of $2.0 million to a fair value of $12.6 million based on collateral valuations utilizing Level 2 valuation inputs. Impaired loans with a carrying value of $9.2 million were reduced by specific valuation allowance allocations of $726,000 to a fair value of $8.4 million based on collateral valuations utilizing Level 3 valuation inputs. At December 31, 2008, impaired loans with a carrying value of $2.3 million were reduced by specific valuation allowance allocations of $382,000 to a fair value of $1.9 million based on collateral valuations utilizing Level 2 valuation inputs. Impaired loans with a carrying value of $14.8 million were reduced by specific valuation allowance allocations of $2.9 million to a fair value of $11.9 million based on collateral valuations utilizing Level 3 valuation inputs.
Fair Value of Financial Instruments
The following table summarizes the carrying value and estimated fair values of financial instruments for the years ended December 31, 2009 and 2008 (in thousands):
| As of December 31, | ||||||||||||
| 2009 | 2008 | |||||||||||
| Carrying Amount |
Estimated Fair Value |
Carrying Amount |
Estimated Fair Value | |||||||||
| Financial Assets |
||||||||||||
| Cash and cash equivalents |
$ | 108,093 | $ | 108,093 | $ | 38,101 | $ | 38,101 | ||||
| Investment securities available-for-sale |
98,368 | 98,368 | 102,104 | 102,104 | ||||||||
| Investment securities held-to-maturity |
4,044 | 4,352 | — | — | ||||||||
| Other investments |
21,577 | 21,577 | 29,220 | 29,220 | ||||||||
| Loans held-for-investment, net |
1,244,594 | 1,133,959 | 1,321,813 | 1,194,550 | ||||||||
| Cash value of bank owned life insurance |
28,526 | 28,526 | 27,090 | 27,090 | ||||||||
| Accrued interest receivable |
5,161 | 5,161 | 5,946 | 5,946 | ||||||||
| Financial Liabilities |
||||||||||||
| Deposits |
||||||||||||
| Transaction accounts |
705,987 | 705,987 | 597,877 | 597,876 | ||||||||
| Time deposits |
658,180 | 659,296 | 671,276 | 677,416 | ||||||||
| Total deposits |
1,364,167 | 1,365,283 | 1,269,153 | 1,275,292 | ||||||||
| Other borrowings |
25,513 | 27,429 | 139,046 | 138,992 | ||||||||
| Junior subordinated debentures |
36,083 | 37,883 | 36,083 | 38,623 | ||||||||
| Interest rate derivative |
61 | 61 | — | — | ||||||||
| Accrued interest payable |
625 | 625 | 1,279 | 1,279 | ||||||||
| Off-balance sheet financial instruments |
||||||||||||
| Unfunded loan commitments, including unfunded lines of credit |
— | 224 | — | 353 | ||||||||
| Standby letters of credit |
— | 16 | — | 27 | ||||||||
| Commercial letters of credit |
— | — | — | — | ||||||||
The following methodologies and assumptions were used to estimate the fair value of the Company’s financial instruments as disclosed in the table:
Assets for Which Fair Value Approximates Carrying Value. The fair values of certain financial assets and liabilities carried at cost, including cash and due from banks, deposits with banks, federal funds sold, cash value of bank owned life insurance, due from customers on acceptances and accrued interest receivable, are considered to approximate their respective carrying values due to their short-term nature and negligible credit losses.
119
Table of Contents
Index to Financial Statements
Investment Securities. Fair values are based primarily upon quoted market prices obtained from an independent pricing service.
Loans. The fair value of loans originated by the Banks is estimated by discounting the expected future cash flows using the current interest rates at which similar loans with similar terms would be made. The presence of floors on a large portion of the variable rate loans has supported the yields above current market levels and is the key factor causing the fair value of the variable rate loans with floors to exceed the book value. The fair value of the remainder of the variable rate loans approximates the carrying value while fixed rate loans are generally above the carrying values. Using these results, valuation adjustments are made for specific credit risks as well as general portfolio credit and market risks to arrive at the fair value.
Liabilities for Which Fair Value Approximates Carrying Value. The estimated fair value for transactional deposit liabilities with no stated maturity (i.e., demand, savings, and money market deposits) approximates the carrying value. The estimated fair value of deposits does not take into account the value of the Company’s long-term relationships with depositors, commonly known as core deposit intangibles, which are separate intangible assets, and not considered financial instruments. Nonetheless, the company would likely realize a core deposit premium if its deposit portfolio were sold in the principal market for such deposits.
The fair value of acceptances outstanding, accounts payable and accrued liabilities are considered to approximate their respective carrying values due to their short-term nature.
Time Deposits. Fair values for fixed-rate time deposits are estimated using a discounted cash flow calculation that applies interest rates currently being offered on time deposits to a schedule of aggregated expected monthly maturities on time deposits.
Other Borrowings. The carrying amounts of federal funds purchased, borrowings under repurchase agreements, and other borrowings maturing within fourteen days approximate their fair values. Fair values of other borrowings are estimated using discounted cash flow analyses based on the Company’s current incremental borrowing rates for similar types of borrowing arrangements.
Junior Subordinated Debentures. The fair value of the junior subordinated debentures was estimated by discounting the cash flows through maturity based on the prevailing market rate.
Interest Rate Derivatives. The fair value was estimated using discounted cash flow models that use actively quoted or observable market input values from external market data providers and/or non-binding broker-dealer quotations.
Commitments to Extend Credit and Letters of Credit. The fair value of such instruments is estimated using the unamortized portion of fees collected for execution of such credit facility.
20. Commitments and Contingencies
Litigation
The Company is involved in various litigation that arises in the normal course of business. In the opinion of management, after consultations with its legal counsel, such litigation is not expected to have a material adverse effect of the Company’s consolidated financial position, result of operations or cash flows.
120
Table of Contents
Index to Financial Statements
Leases
The Company leases certain branch premises and equipment under operating leases, which expire between 2010 through 2017. The Company incurred rental expense of $1.6 million, $2.3 million, and $2.1 million, for the years ended December 31, 2009, 2008 and 2007, respectively, under these lease agreements. Future minimum lease payments at December 31, 2009 due under these lease agreements are as follows (in thousands):
| Year |
Amount | ||
| 2010 |
$ | 2,181 | |
| 2011 |
1,428 | ||
| 2012 |
899 | ||
| 2013 |
617 | ||
| 2014 |
510 | ||
| Thereafter |
498 | ||
| $ | 6,133 | ||
21. Operating Segment Information
In October 2005, the Company acquired Metro United and continued its operation as a separate subsidiary. Because the Company operates two community banks in distinct geographical areas, the Company manages its operations and prepares management reports and other information with a primary focus on these geographical areas. Performance assessment and resource allocation are also based upon this geographical structure. The operating segment identified as “Other” includes the Parent and eliminations of transactions between segments. The accounting policies of the individual operating segments are the same as those of the Company as described in Note 1. Transactions between operating segments are primarily conducted at fair value, resulting in profits that are eliminated for reporting consolidated results of operations. Operating segments pay for centrally provided services based upon estimated or actual usage of those services.
The following is a summary of selected operating segment information as of and for the years ended December 31, 2009, 2008 and 2007 (in thousands):
| As of and for the year ended December 31, 2009 | ||||||||||||||||
| MetroBank | Metro United |
Other | Consolidated Company |
|||||||||||||
| Interest income |
$ | 64,041 | $ | 22,230 | $ | 63 | $ | 86,334 | ||||||||
| Interest expense |
20,463 | 8,488 | 2,090 | 31,041 | ||||||||||||
| Net interest income |
43,578 | 13,742 | (2,027 | ) | 55,293 | |||||||||||
| Provision for loan losses |
19,638 | 6,075 | — | 25,713 | ||||||||||||
| Net interest income after provision for loan losses |
23,940 | 7,667 | (2,027 | ) | 29,850 | |||||||||||
| Noninterest income |
9,023 | 419 | (1,273 | ) | 8,169 | |||||||||||
| Noninterest expense |
33,640 | 13,945 | 223 | 47,808 | ||||||||||||
| Income (loss) before income tax provision |
(677 | ) | (5,859 | ) | (3,523 | ) | (10,059 | ) | ||||||||
| Provision (benefit) for income taxes |
(517 | ) | (1,430 | ) | (1,040 | ) | (2,987 | ) | ||||||||
| Net income (loss) |
$ | (160 | ) | $ | (4,429 | ) | $ | (2,483 | ) | $ | (7,072 | ) | ||||
| Assets |
$ | 1,117,234 | $ | 475,904 | $ | (3,590 | ) | $ | 1,589,548 | |||||||
| Net loans |
892,545 | 352,049 | — | 1,244,594 | ||||||||||||
| Goodwill |
— | 19,327 | — | 19,327 | ||||||||||||
| Deposits |
958,242 | 412,632 | (6,707 | ) | 1,364,167 | |||||||||||
121
Table of Contents
Index to Financial Statements
| As of and for the year ended December 31, 2008 | ||||||||||||||
| MetroBank | Metro United |
Other | Consolidated Company | |||||||||||
| Interest income |
$ | 71,699 | $ | 25,266 | $ | 65 | $ | 97,030 | ||||||
| Interest expense |
26,949 | 11,599 | 2,183 | 40,731 | ||||||||||
| Net interest income |
44,750 | 13,667 | (2,118 | ) | 56,299 | |||||||||
| Provision for loan losses |
11,109 | 5,540 | — | 16,649 | ||||||||||
| Net interest income after provision for loan losses |
33,641 | 8,127 | (2,118 | ) | 39,650 | |||||||||
| Noninterest income |
7,303 | 474 | (1,312 | ) | 6,465 | |||||||||
| Noninterest expense |
31,806 | 10,283 | 986 | 43,075 | ||||||||||
| Income before income tax provision |
9,138 | (1,682 | ) | (4,416 | ) | 3,040 | ||||||||
| Provision for income taxes |
2,885 | (507 | ) | (1,173 | ) | 1,205 | ||||||||
| Net income |
$ | 6,253 | $ | (1,175 | ) | $ | (3,243 | ) | $ | 1,835 | ||||
| Assets |
$ | 1,153,152 | $ | 429,128 | $ | (2,042 | ) | $ | 1,580,238 | |||||
| Net loans |
955,270 | 366,543 | — | 1,321,813 | ||||||||||
| Goodwill |
— | 21,827 | — | 21,827 | ||||||||||
| Deposits |
954,598 | 318,637 | (4,082 | ) | 1,269,153 | |||||||||
| As of and for the year ended December 31, 2007 | ||||||||||||||
| MetroBank | Metro United |
Other | Consolidated Company | |||||||||||
| Interest income |
$ | 77,567 | $ | 24,665 | $ | 66 | $ | 102,298 | ||||||
| Interest expense |
30,724 | 12,629 | 2,039 | 45,392 | ||||||||||
| Net interest income |
46,843 | 12,036 | (1,973 | ) | 56,906 | |||||||||
| Provision for loan losses |
1,705 | 1,440 | — | 3,145 | ||||||||||
| Net interest income after provision for loan losses |
45,138 | 10,596 | (1,973 | ) | 53,761 | |||||||||
| Noninterest income |
9,196 | 477 | (1,385 | ) | 8,288 | |||||||||
| Noninterest expense |
32,254 | 9,773 | 908 | 42,935 | ||||||||||
| Income before income tax provision |
22,080 | 1,300 | (4,266 | ) | 19,114 | |||||||||
| Provision for income taxes |
7,736 | 395 | (1,192 | ) | 6,939 | |||||||||
| Net income |
$ | 14,344 | $ | 905 | $ | (3,074 | ) | $ | 12,175 | |||||
| Assets |
$ | 1,083,536 | $ | 376,218 | $ | (48 | ) | $ | 1,459,706 | |||||
| Net loans |
856,837 | 331,949 | — | 1,188,786 | ||||||||||
| Goodwill |
— | 21,827 | — | 21,827 | ||||||||||
| Deposits |
909,521 | 286,891 | (5,369 | ) | 1,191,043 | |||||||||
22. Supplemental Statement of Cash Flow Information
| Years Ended December 31, | |||||||||
| 2009 | 2008 | 2007 | |||||||
| (In thousands) | |||||||||
| Cash payments during the year for: |
|||||||||
| Interest |
$ | 31,695 | $ | 41,179 | $ | 45,487 | |||
| Income taxes |
838 | 6,748 | 8,696 | ||||||
| Noncash investing and financing activities: |
|||||||||
| Dividends accrued not paid on preferred stock |
287 | — | — | ||||||
| Dividends declared not paid on common stock |
— | 434 | 432 | ||||||
| Foreclosed assets acquired |
32,820 | 5,050 | 1,215 | ||||||
| Loans originated to finance foreclosed assets |
3,760 | — | — | ||||||
| Securities in-kind redemption |
— | 10,494 | — | ||||||
122
Table of Contents
Index to Financial Statements
23. Parent Company Financial Information
The condensed balance sheets, statements of income and statements of cash flows for MetroCorp Bancshares, Inc. (parent only) are presented below:
Condensed Balance Sheets
(In thousands, except share amounts)
| As of December 31, | ||||||||
| 2009 | 2008 | |||||||
| Assets | ||||||||
| Cash and due from subsidiary banks |
$ | 1,641 | $ | 704 | ||||
| Investment in subsidiary trust |
1,083 | 1,083 | ||||||
| Investment in bank subsidiaries |
188,283 | 157,536 | ||||||
| Other assets |
624 | 269 | ||||||
| Total assets |
$ | 191,631 | $ | 159,592 | ||||
| Liabilities and Shareholders’ Equity | ||||||||
| Accrued interest payable |
$ | 87 | $ | 90 | ||||
| Junior subordinated debentures |
36,083 | 36,083 | ||||||
| Subordinated debentures |
— | 4,000 | ||||||
| Other liabilities |
155 | 260 | ||||||
| Total liabilities |
36,325 | 40,433 | ||||||
| Shareholders’ equity: |
||||||||
| Preferred stock, $1.00 par value, 2,000,000 shares authorized; 45,000 and shares issued and outstanding at December 31, 2009, and none outstanding at December 31, 2008 |
44,718 | — | ||||||
| Common stock, $1.00 par value, 50,000,000 shares authorized; 10,994,965 shares issued and 10,926,315 and 10,885,081 shares outstanding at December 31, 2009 and 2008, respectively |
10,995 | 10,995 | ||||||
| Additional paid-in-capital |
29,114 | 28,222 | ||||||
| Retained earnings |
72,505 | 82,311 | ||||||
| Other comprehensive loss |
(1,106 | ) | (910 | ) | ||||
| Treasury stock, at cost |
(920 | ) | (1,459 | ) | ||||
| Total shareholders’ equity |
155,306 | 119,159 | ||||||
| Total liabilities and shareholders’ equity |
$ | 191,631 | $ | 159,592 | ||||
123
Table of Contents
Index to Financial Statements
Condensed Statements of Operations
(In thousands)
| Years Ended December 31, | ||||||||||||
| 2009 | 2008 | 2007 | ||||||||||
| Income | ||||||||||||
| Interest income on deposits |
$ | 1 | $ | 3 | $ | 5 | ||||||
| Dividends received from subsidiary trust |
62 | 62 | 61 | |||||||||
| Dividends received from bank subsidiaries |
2,000 | 5,234 | 16,747 | |||||||||
| Total income |
2,063 | 5,299 | 16,813 | |||||||||
| Expenses | ||||||||||||
| Interest expense on junior subordinated debentures |
2,079 | 2,079 | 2,039 | |||||||||
| Interest expense on subordinated debentures |
11 | 104 | — | |||||||||
| Stock-based compensation expense |
554 | 1,154 | 1,050 | |||||||||
| Other expenses |
934 | 1,136 | 1,235 | |||||||||
| Total expenses |
3,578 | 4,473 | 4,324 | |||||||||
| Income (loss) before taxes and equity in undistributed net income (loss) of subsidiaries |
(1,515 | ) | 826 | 12,489 | ||||||||
| Income tax benefit |
1,040 | 1,172 | 1,192 | |||||||||
| Income before equity in undistributed net income of subsidiaries |
(475 | ) | 1,998 | 13,681 | ||||||||
| (Distributions in excess of net income) equity in undistributed net income of subsidiaries |
(6,597 | ) | (163 | ) | (1,506 | ) | ||||||
| Net income (loss) |
$ | (7,072 | ) | $ | 1,835 | $ | 12,175 | |||||
| Dividends—preferred stock |
(2,157 | ) | — | — | ||||||||
| Net income (loss) available to common shareholders |
$ | (9,229 | ) | $ | 1,835 | $ | 12,175 | |||||
124
Table of Contents
Index to Financial Statements
Condensed Statements of Cash Flows
(In thousands)
| Years Ended December 31, | ||||||||||||
| 2009 | 2008 | 2007 | ||||||||||
| Cash flow from operating activities: |
||||||||||||
| Net income (loss) |
$ | (7,072 | ) | $ | 1,835 | $ | 12,175 | |||||
| Stock-based compensation expense |
551 | 1,128 | 953 | |||||||||
| Distributions in excess of earnings (equity in undistributed earnings of subsidiaries) |
6,597 | 163 | 1,506 | |||||||||
| Decrease (increase) in other assets |
23 | (53 | ) | 630 | ||||||||
| Decrease in other liabilities |
(92 | ) | (26 | ) | (30 | ) | ||||||
| Net cash provided by (used in) operating activities |
7 | 3,047 | 15,234 | |||||||||
| Cash flow from investment activities: |
||||||||||||
| Investment in bank subsidiaries |
(37,500 | ) | (9,300 | ) | (10,020 | ) | ||||||
| Net cash used in investing activities |
(37,500 | ) | (9,300 | ) | (10,020 | ) | ||||||
| Cash flow from financing activities: |
||||||||||||
| Proceeds from issuance of subordinated debentures |
— | 4,000 | — | |||||||||
| Repayment of subordinated debentures |
(4,000 | ) | — | — | ||||||||
| Proceeds from issuance of preferred stock with common stock warrant |
45,000 | — | — | |||||||||
| Re-issuance of treasury stock |
169 | 723 | 827 | |||||||||
| Repurchase of common stock |
— | — | (2,381 | ) | ||||||||
| Cash dividends paid on preferred stock |
(1,870 | ) | — | — | ||||||||
| Cash dividends paid on common stock |
(869 | ) | (1,733 | ) | (1,752 | ) | ||||||
| Net cash provided by (used in) financing activities |
38,430 | 2,990 | (3,306 | ) | ||||||||
| Net increase (decrease) in cash and cash equivalents |
937 | (3,263 | ) | 1,908 | ||||||||
| Cash and cash equivalents at beginning of year |
704 | 3,967 | 2,059 | |||||||||
| Cash and cash equivalents at end of year |
$ | 1,641 | $ | 704 | $ | 3,967 | ||||||
| Dividends declared but not paid |
$ | — | $ | 434 | $ | 432 | ||||||
24. Related Party Transactions
In the ordinary course of business, the Company enters into transactions with its and the Banks’ executive officers, directors and their affiliates. It is the Company’s policy that all transactions with these parties are on the same terms, including interest rates and collateral requirements on loans, as those prevailing at the same time for comparable transactions with unrelated parties. At December 31, 2009 and 2008, certain of these officers and directors and their affiliated companies were indebted to the Company in the aggregate amount of approximately $149,000.
The following is an analysis of activity for the years ended December 31, 2009 and 2008 for such amounts (in thousands):
| 2009 | 2008 | ||||||
| Balance at January 1, |
$ | 149 | $ | 158 | |||
| New loans and advances |
— | — | |||||
| Repayments |
— | (9 | ) | ||||
| Other |
— | — | |||||
| Balance at December 31, |
$ | 149 | $ | 149 | |||
125
Table of Contents
Index to Financial Statements
In addition, as of December 31, 2009 and 2008, the Company held demand and other deposits for related parties of approximately $6.8 million and $5.3 million, respectively.
The Company’s Chairman is a principal shareholder and the Chairman of the Board of New Era Life Insurance Company (New Era). MetroBank had 10 commercial real estate loan participations with New Era as of December 31, 2009, and eleven as of December 31, 2008. These loans were originated by and are being serviced by MetroBank. Nine of the loans are contractually current on their payments, and one real estate loan in the amount of $3.1 million, is on nonaccrual status as of December 31, 2009. The following is an analysis of these loans as of December 31, 2009 and 2008 (in thousands):
| 2009 | 2008 | |||||||
| Gross balance |
$ | 68,111 | $ | 77,731 | ||||
| Less: participation portion sold to New Era |
(32,322 | ) | (36,771 | ) | ||||
| Net balance outstanding |
$ | 35,789 | $ | 40,960 | ||||
With the exception of the $3.1 million nonaccrual loan, $31.0 million of the loans have interest rates ranging from 6.50% to 7.25% and the remaining $34.0 million in loans have interest rates which float with the prime rate. With the exception of the nonaccrual loan, the loans mature between April 2010 and February 2017. The percent of the participation portions sold to New Era varies from 16.00% to 100.00%.
In addition, prior to July, 2007, New Era was the agency used by MetroBank for the insurance coverage it provides to employees and their dependents. The Company, however, discontinued using New Era in July, 2007. The insurance coverage consisted of medical and dental insurance. MetroBank paid New Era $1.1 million for such insurance coverage for the year ended December 31, 2007.
Gaumnitz, Inc. owns the building in which the Company’s corporate headquarters and MetroBank’s Bellaire branch are located and has entered into lease agreements for these locations with the Company and MetroBank. The controlling shareholder of Gaumnitz, Inc. is a major shareholder of the Company. The lease agreements covering the different areas comprising the Company’s headquarters have lease commencement dates ranging from June 2003 to March 2006, at a net rent of $31,000 per month, and the expiration dates ranging from December 2010 to May 2013. The lease agreement for MetroBank’s Bellaire branch commenced on December 29, 2003 at a total rent of $12,000 per month and expires in December 2011. For these respective lease agreements, the Company paid Gaumnitz, Inc. $704,000, $698,000 and $640,000 during the years ended December 31, 2009, 2008 and 2007, respectively.
126
Table of Contents
Index to Financial Statements
EXHIBIT INDEX
| Exhibit Number(1) |
Description | |
| 2.1 | Letter Agreement, dated January 16, 2009, including the Securities Purchase Agreement—Standard Terms incorporated by reference therein, by and between the Company and the United States Department of the Treasury (incorporated herein by reference to Exhibit 10.1 to the Company’s Current Report on Form 8-K filed on January 21, 2009). | |
| 3.1 | Amended and Restated Articles of Incorporation of the Company (incorporated herein by reference to Exhibit 3.1 to the Company’s Registration Statement on Form S-1 (Registration No. 333-62667) (the “Registration Statement”)). | |
| 3.2 | Articles of Amendment to the Articles of Incorporation of the Company (incorporated herein by reference to Exhibit 3.2 to the Company’s Quarterly Report on Form 10-Q for the quarter ended March 31, 2008). | |
| 3.3 | Statement of Designations establishing the terms of the Series A Preferred Stock of the Company (incorporated herein by reference to Exhibit 3.1 to the Company’s Current Report on Form 8-K filed on January 21, 2009). | |
| 3.4 | Amended and Restated Bylaws of the Company (incorporated herein by reference to Exhibit 3.1 to the Company’s Current Report of Form 8-K filed on November 19, 2007). | |
| 4.1 | Specimen form of certificate evidencing the Common Stock (incorporated herein by reference to Exhibit 4 to the Registration Statement). | |
| 4.2 | Warrant, dated January 16, 2009, to purchase 771,429 shares of the Company’s Common Stock (incorporated herein by reference to Exhibit 4.1 to the Company’s Current Report on Form 8-K filed on January 21, 2009). | |
| 4.3 | Form of Certificate for the Company’s Fixed Rate Cumulative Perpetual Preferred Stock, Series A, par value $1.00 per share (incorporated herein by reference to Exhibit 4.2 to the Company’s Current Report on Form 8-K filed on January 21, 2009). | |
| 10.1† | MetroCorp Bancshares, Inc. 1998 Stock Incentive Plan (incorporated herein by reference to Exhibit 10.5 to the Registration Statement). | |
| 10.2† | MetroCorp Bancshares, Inc. 2007 Stock Awards and Incentive Plan, as amended (incorporated herein by reference to Exhibit 4.2 to the Company’s Registration Statement of Form S-8 (Registration No. 333-160112)). | |
| 10.3† | Form of Incentive Stock Option Agreement under the 2007 Stock Awards and Incentive Plan (incorporated herein by reference to Exhibit 4.3 to the Company’s Registration Statement on Form S-8 (Registration No. 333-143502) the “S-8 Registration Statement”)). | |
| 10.4† | Form of Non Qualified Stock Option Agreement under the 2007 Stock Awards and Incentive Plan (incorporated herein by reference to Exhibit 4.4 of the S-8 Registration Statement). | |
| 10.5† | Form of Stock Appreciation Rights Agreement under the 2007 Stock Awards and Incentive Plan (incorporated herein by reference to Exhibit 4.5 of the S-8 Registration Statement). | |
| 10.6† | Form of Restricted Stock Agreement under the 2007 Stock Awards and Incentive Plan (incorporated herein by reference to Exhibit 4.6 of the S-8 Registration Statement). | |
| 10.7† | First Amendment to the Employment Agreement between the Company and George M. Lee dated as of December 31, 2008 (incorporated herein by reference to the Company’s Current Report on Form 8-K filed on January 6, 2009). | |
127
Table of Contents
Index to Financial Statements
| Exhibit Number(1) |
Description | |
| 10.8† | Letter Agreement between MetroBank, N.A. and David Tai dated as of February 14, 2005 (incorporated herein by reference to Exhibit 10.7 to the Company’s Annual Report on Form 10-K for the year ended December 31, 2006). | |
| 10.9† | Letter Agreement between MetroBank, N.A. and David Choi dated as of February 14, 2005 (incorporated herein by reference to Exhibit 10.8 to the Company’s Annual Report on Form 10-K for the year ended December 31, 2006). | |
| 10.10† | Letter Agreement between MetroBank, N.A. and Terry Tangen dated as of February 14, 2005 (incorporated herein by reference to Exhibit 10.9 to the Company’s Annual Report on Form 10-K for the year ended December 31, 2006). | |
| 10.11 | Form of Waiver, executed by each of George M. Lee, David C. Choi, David Tai and Terrance J. Tangen (incorporated herein by reference to Exhibit 10.2 to the Company’s Current Report on Form 8-K filed on January 21, 2009). | |
| 10.12† | Form of Executive Compensation Letter Agreement, executed by each of George M. Lee, David C. Choi, David Tai and Terrance J. Tangen (incorporated herein by reference to Exhibit 10.3 to the Company’s Current Report on Form 8-K filed on January 21, 2009). | |
| 11 | Computation of Earnings Per Common Share, included as Note (16) to the Consolidated Financial Statements of this Form 10-K. | |
| 21 | Subsidiaries of MetroCorp Bancshares, Inc. (incorporated herein by reference to Exhibit 21 of the Company’s Annual Report on Form 10-K for the year ended December 31, 2006). | |
| 23.1* | Consent of PricewaterhouseCoopers LLP. | |
| 31.1* | Certification of the Chief Executive Officer pursuant to Rule 13a-14(a) of the Securities Exchange Act of 1934, as amended. | |
| 31.2* | Certification of the Chief Financial Officer pursuant to Rule 13a-14(a) of the Securities Exchange Act of 1934, as amended. | |
| 32.1** | Certification of the Chief Executive Officer pursuant to 18 U.S.C Section 1350, as adopted pursuant to Section 906 of the Sarbanes-Oxley Act of 2002. | |
| 32.2** | Certification of the Chief Financial Officer pursuant to 18 U.S.C. Section 1350, as adopted pursuant to Section 906 of the Sarbanes Oxley Act of 2002. | |
| 99.1* | Certification of the Chief Executive Officer and Chief Financial Officer pursuant to Section 111(b)(4) of the Emergency Economic Stabilization Act of 2008. | |
| (1) | The Company has other long-term debt agreements that meet the exclusion set forth in Section 601(b)(4)(iii)(A) of Regulation S-K. The Company hereby agrees to furnish a copy of such agreements to Securities and Exchange Commission upon request. |
| † | Management contract or compensatory plan or arrangement. |
| * | Filed herewith. |
| ** | Furnished herewith. |
| (b) | Exhibits. See the exhibit list included in Item 15(a)3 of this Annual Report on Form 10-K. |
| (c) | Financial Statement Schedules. See Item 15(a)2 of this Annual Report on Form 10-K. |
128