Attached files
| file | filename |
|---|---|
| 8-K - FMC CORP--FORM 8-K - FMC CORP | d8k.htm |
 FMC
Corporation UBS Chemicals Conference Boston, MA March 18, 2010 Pierre Brondeau President and CEO W. Kim Foster Senior Vice President and CFO Exhibit 99.1 |
 1 Disclaimer Safe Harbor Statement under the Private Securities Litigation Reform Act of 1995 These slides and the accompanying presentation contain “forward-looking
statements” that represent management’s best judgment as of the date hereof based on information currently available. Actual results of the Company may differ materially from those contained in the forward-looking statements.
Additional information concerning factors that may cause results to differ materially from those in the forward-looking statements is contained in the
Company’s periodic reports filed under the Securities Exchange Act of 1934,
as amended. The Company undertakes no obligation to update or revise these forward- looking statements to reflect new events or uncertainties. Non-GAAP Financial Terms These slides contain certain “non-GAAP financial terms” which are defined in the appendix. In addition, we have provided reconciliations of non-GAAP terms
to the closest GAAP term in the appendix. |
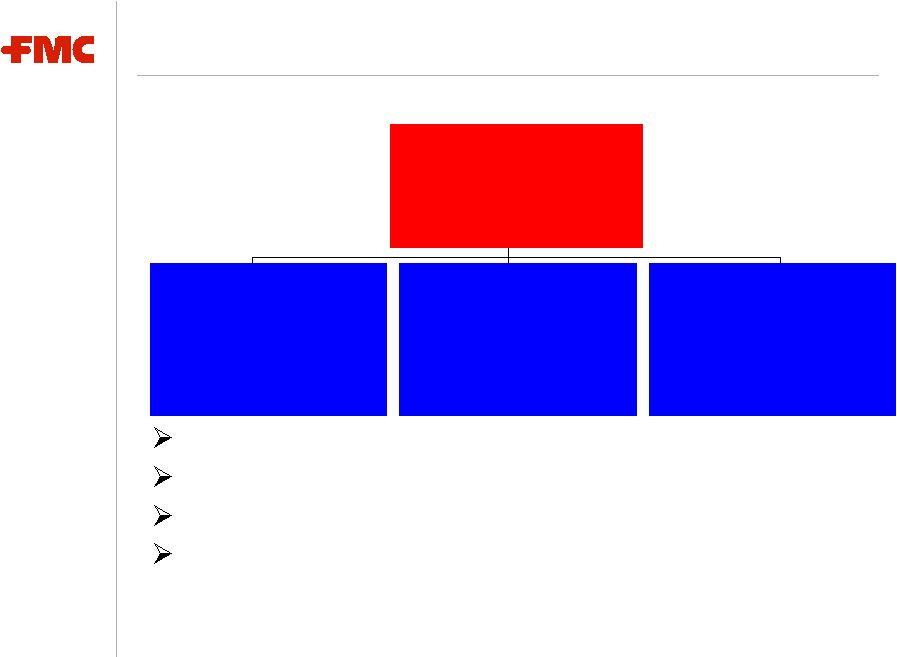 2 FMC Corporation LTM ending December 31, 2009 ($ millions) FMC CORPORATION Revenue: $2,826 EBITDA:
$594 Margin*:
21.0% INDUSTRIAL CHEMICALS Revenue: $1,027 EBITDA: $160 Margin*: 15.6% AGRICULTURAL PRODUCTS Revenue: $1,052 EBITDA: $306 Margin*: 29.1% SPECIALTY CHEMICALS Revenue: $753 EBITDA: $193 Margin*: 25.6% * EBITDA margin Leading Market Positions Diverse End Markets - Low Correlation to Economic Cycles Diversified and Integrated Cost Structure Limited Dependence on Petrochemical Feedstocks |
 3 Focusing the portfolio on our growth businesses • Managing Agricultural Products and Specialty Chemicals for growth • Managing Industrial Chemicals for cash while addressing product portfolio issues Maintaining financial strength and flexibility • Solid investment grade rating S&P BBB+/Moody’s Baa1 • Debt maturing in next 5 years < $200 million. • Free cash flow of ~$200 million projected in 2010 Blending organic and external growth initiatives • Increased emphasis on internal technology development • Complemented by financially attractive bolt-on acquisitions and technology in-licensing • Biased toward capturing share in rapidly developing economies Disciplined Approach to Unlocking Value |
 4 Leading Market Positions (1) Based on 2009 consolidated sales Industrial Chemicals #1 in N.A. Soda Ash #1 in N.A. Persulfates #1 Globally Carrageenan #1 Globally Carbofuran #2 in N.A. Pyrethroids Agricultural Products #1 Globally Alginates Specialty Chemicals #2 Globally #1 Globally Lithium Specialties Microcrystalline Cellulose Product Group Position (1) |
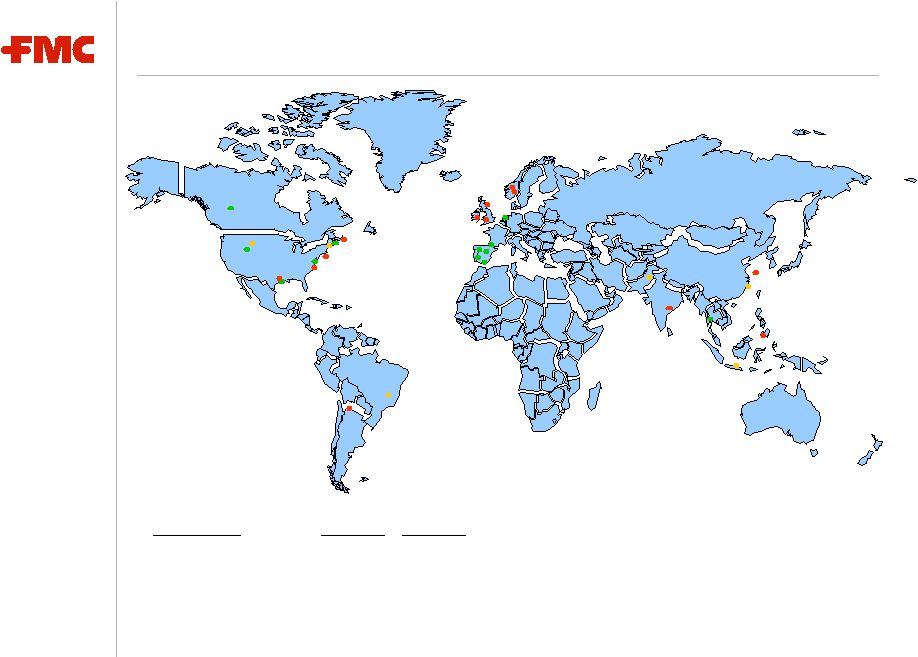 5 Global Presence Based on 2009 Consolidated Sales North America 37% of Sales Latin America 25% of Sales Europe / Middle East / Africa 25% of Sales Asia / Pacific 13% of Sales Sales CAGR 2006-08 2006-09 North America 5.4% 2.9% Latin America 27.4% 15.1% Asia 20.3% 8.0% EMEA 17.9% 3.9% |
 6 Diversified Customers and End Markets Approximately 80% of sales to non GDP-cyclical end markets Long-term relationships with blue chip customers No single customer represents more than ~1 % of sales Top 10 customers in total represent ~11% of sales Based on 2009 Consolidated Sales Non-Cyclical 80% Cyclical 20% |
 7 Diversified and Integrated Cost Structure Backward integrated in soda ash and lithium Agricultural Product’s sourcing from low-cost economies Diversified raw material structure and sourcing - No single raw material accounted for over 9% of total raw material purchases in 2009 - Global sourcing of renewable resources - Limited use of petrochemical feedstocks Low energy demand requirements - Energy costs represented ~ 11% of cost of sales in 2009 - Hedge 80% of planned natural gas purchases |
 8 Agricultural Products Based on 2009 Consolidated Sales of $1,052 million Strong niche positions in the Americas, Europe and Asia Proprietary, branded insecticides and herbicides Strategic Focus: • Focused in attractive intersections of products, crops and regions • Developing new actives & formulations to serve selected new crops • Enhancing growth through acquisitions |
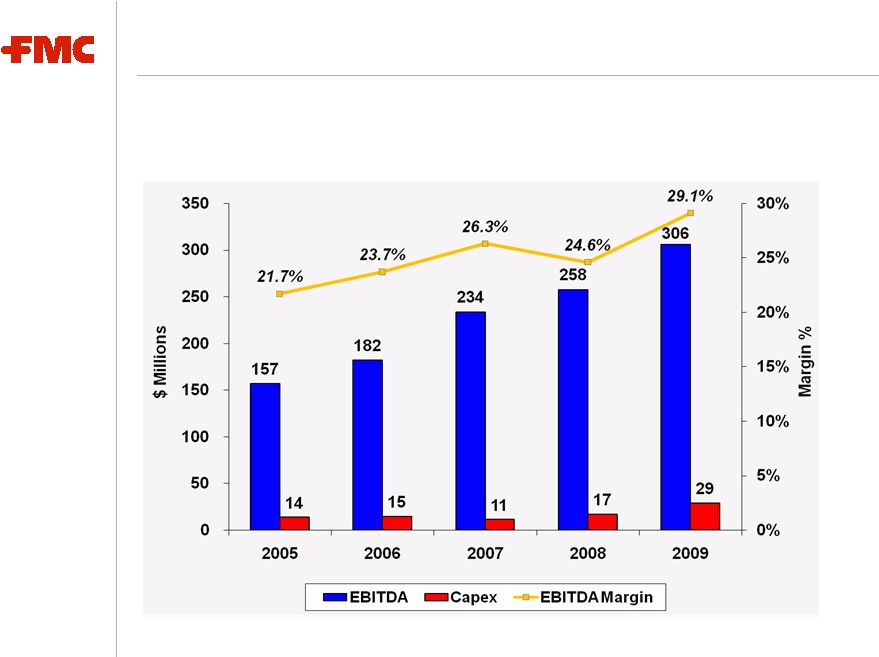 9 Agricultural Products 2010 segment earnings growth in the mid to high single digits reflecting higher sales in most regions partially offset by less favorable product and geographic mix and increased spending on growth initiatives |
 10 Specialty Chemicals BioPolymers – pharmaceutical and food ingredients Lithium focus on specialties – pharmaceuticals and energy storage Strategic Focus: • Strengthening positions in core market segments • Continue high focus on close to customer technology development and formulation • Pursuing financially attractive bolt-on acquisitions to strengthen core platforms or
expand portfolio • Positioning capacity and technology to capture premium growth in lithium Based on 2009 Consolidated Sales of $753 million |
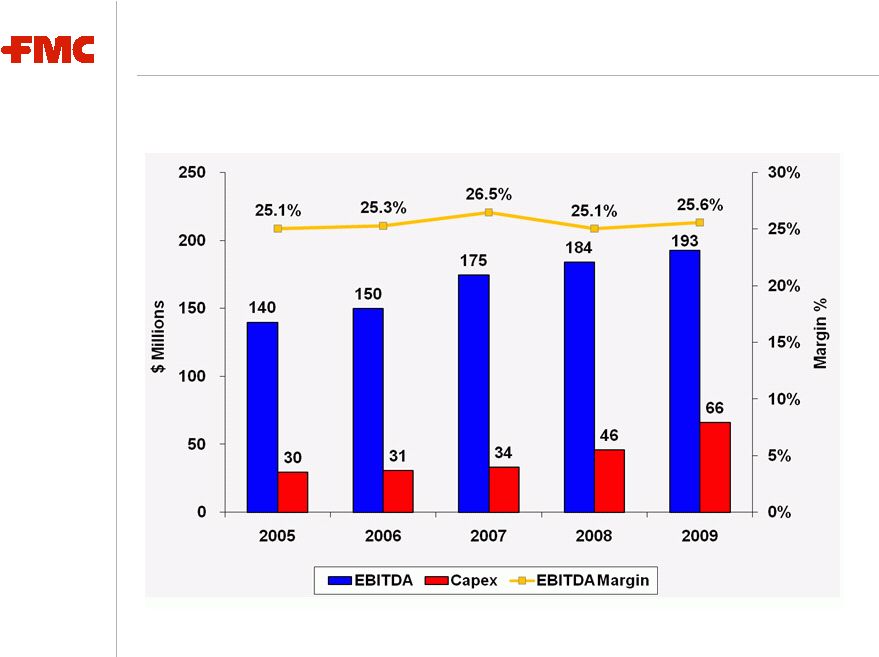 11 Specialty Chemicals 2010 segment earnings up in the mid-teens, reflecting volume-driven sales growth
and productivity improvements |
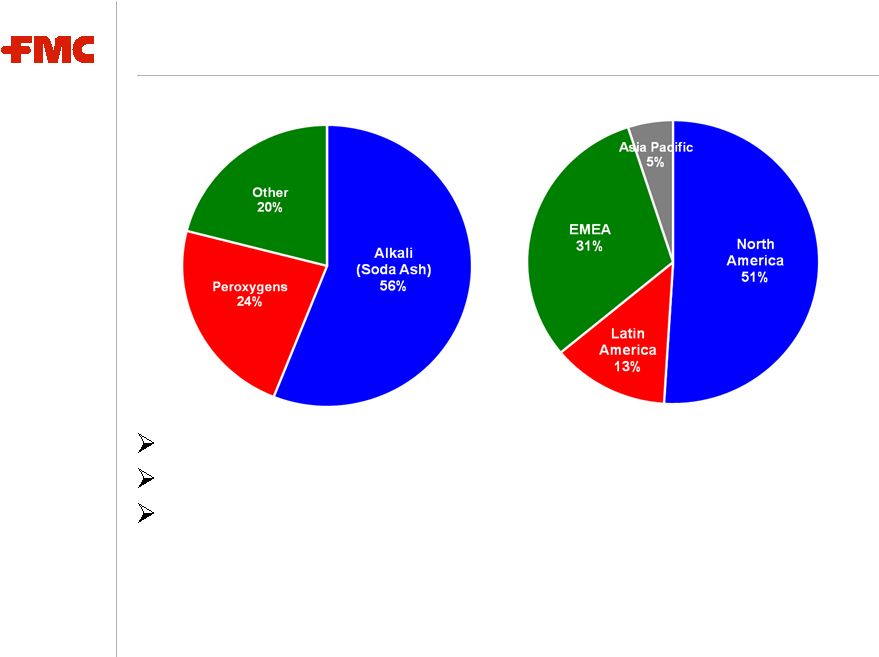 12 Industrial Chemicals Based on 2009 Consolidated Sales of $1,027 million #1 North American manufacturer of soda ash Low cost, proprietary production technologies Strategic Focus: - Managing for cash generation - Aligning capacity to highest margin markets and managing portfolio - Controlling costs and increasing productivity |
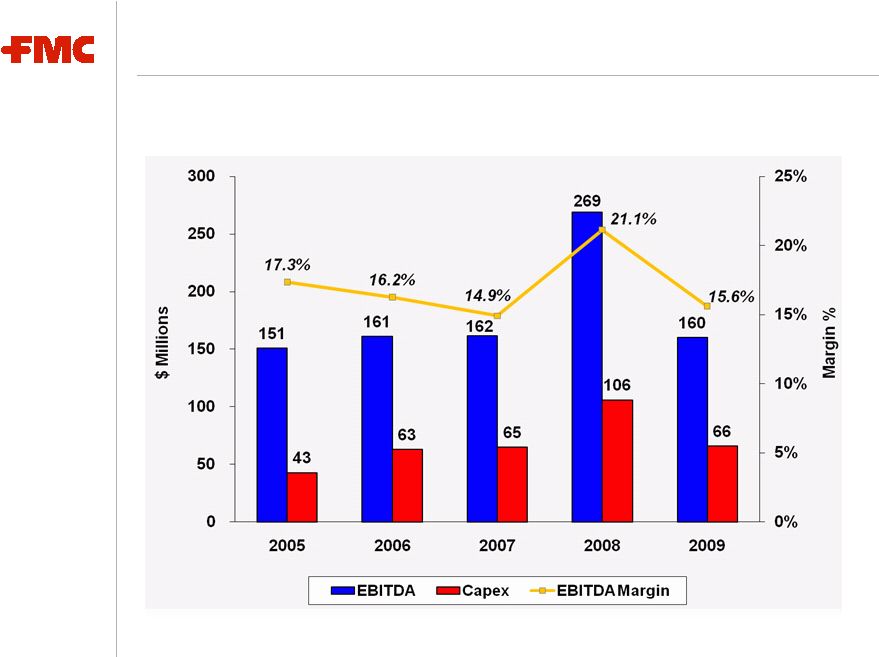 13 Industrial Chemicals 2010 segment earnings up 5-15 percent versus prior year, as volume growth and favorable raw material and energy costs are partially offset by lower selling prices
|
 14 FMC in Summary Focusing the portfolio on higher growth businesses • Managing Specialty Chemicals and Agricultural Products for growth • Managing Industrial Chemicals for cash while addressing product portfolio issues Sustaining double-digit earnings growth (1) • Diverse end-markets, low correlation to economic cycles • Products aligned with global secular growth trends • Blending organic and external growth initiatives • Biased toward capturing share in rapidly developing economies • Limit impact of industry cycles on Industrial Chemicals’ business performance Strategic and financial flexibility • Solid balance sheet • Conservative liquidity profile • Strong cash flow Disciplined approach to unlocking value (1) Earnings before restructuring and
other income and charges |
 FMC
Corporation |
 FMC
Corporation Glossary of Financial Terms & Reconciliations of GAAP to Non-GAAP |
 17 Non-GAAP Financial Terms These slides contain certain “non-GAAP financial terms” which are defined below. In addition, we have provided reconciliations of non-GAAP terms to the closest GAAP term in the appendix of this presentation. EBITDA (Earnings Before Interest, Taxes, Depreciation and Amortization) is the sum of Income (loss) from continuing operations before income taxes and Depreciation and Amortization. EBITDA Margin is the quotient of EBITDA
(defined above) divided by Revenue. ROIC (Return on Invested Capital) is the sum of Earnings from continuing operations before restructuring and other income and charges and after-tax Interest expense divided by the sum of Short- term debt, Current
portion of long-term debt, Long-term debt and Total shareholders’ equity.
|
 18 Segment Financial Terms These slides contain references to segment financial items. Some of the segment financial terms are “non-GAAP financial terms” and are defined below. In addition, we have provided reconciliations of non-GAAP terms to the closest GAAP term in the appendix of this presentation. EBITDA (Earnings Before Interest, Taxes, Depreciation and Amortization) for a segment is the sum of Income (loss) from continuing operations before income taxes for that segment and Depreciation and Amortization for that segment. EBITDA Margin for a segment is the quotient of EBITDA (defined above) divided by Revenue for that segment. |
 19 Reconciliation of consolidated income from continuing operations before income taxes (a GAAP measure) to EBITDA (a Non-GAAP measure) EBITDA Reconciliation: LTM 12/31/2009 (Unaudited, in $ millions) LTM 12/31/2009 Income (loss) from continuing operations before income taxes $310.0 Net Income attributable to non-controlling interests (10.3) Restructuring and other charges/(income), net 132.8 Purchase accounting inventory fair value impact and other related inventory adjustments 7.1 Interest expense, net 27.0 Depreciation and amortization 127.2 EBITDA (Non-GAAP) $593.8 |
 20 Reconciliation of Segment Operating Profit (a GAAP measure) to EBITDA (a Non-GAAP measure) Segment EBITDA Reconciliation: LTM 12/31/2009 (Unaudited, in $ millions) LTM 12/31/2009 Segment Industrial Chemicals Specialty Chemicals Agricultural Products Segment Operating Profit (GAAP) $89.7 $159.6 $289.0 Add: Depreciation and Amortization 70.7 33.5 17.3 EBITDA (Non-GAAP) $160.4 $193.1 $306.3 |
 FMC
Corporation |