Attached files
Exhibit 13
DIMECO, INC. 2009 ANNUAL REPORT
| The mission of Dimeco, Inc. is the operation of a fully integrated financial services institution through its subsidiary The Dime Bank in a market that is defined by the institution’s ability to provide services consistent with sound, prudent principles and to fulfill the social, economic, moral and political considerations ordinarily associated with a responsible, well-run financial institution. |
F I N A N C I A L H I G H L I G H T S
| (amounts in thousands, except per share data) | 2009 | 2008 | % Increase (decrease) | |||||||
| Performance for the year ended December 31, |
||||||||||
| Interest income |
$ | 24,517 | $ | 28,175 | (13.0%) | |||||
| Interest expense |
$ | 8,750 | $ | 10,665 | (18.0%) | |||||
| Net interest income |
$ | 15,767 | $ | 17,510 | (10.0%) | |||||
| Net income |
$ | 4,402 | $ | 6,401 | (31.2%) | |||||
| Shareholders’ Value (per share) |
||||||||||
| Net income - basic |
$ | 2.82 | $ | 4.17 | (32.4%) | |||||
| Net income - diluted |
$ | 2.79 | $ | 4.05 | (31.1%) | |||||
| Dividends |
$ | 1.44 | $ | 1.32 | 9.1% | |||||
| Book value |
$ | 30.21 | $ | 28.53 | 5.9% | |||||
| Market value |
$ | 33.00 | $ | 38.00 | (13.2%) | |||||
| Market value/book value ratio |
109.2 | % | 133.2 | % | (18.0%) | |||||
| Price/earnings multiple |
11.7 | X | 9.1 | X | 28.6% | |||||
| Dividend yield |
4.36 | % | 3.47 | % | 25.6% | |||||
| Financial Ratios |
||||||||||
| Return on average assets |
.90 | % | 1.43 | % | (37.1%) | |||||
| Return on average equity |
9.58 | % | 15.28 | % | (37.3%) | |||||
| Shareholders’ equity/asset ratio |
8.88 | % | 9.41 | % | (5.6%) | |||||
| Dividend payout ratio |
51.06 | % | 31.65 | % | 61.3% | |||||
| Nonperforming assets/total assets |
1.90 | % | 1.81 | % | 5.0% | |||||
| Allowance for loan loss as a % of loans |
1.53 | % | 1.42 | % | 7.7% | |||||
| Net charge-offs/average loans |
.12 | % | .26 | % | (53.8%) | |||||
| Allowance for loan loss/nonaccrual loans |
83.10 | % | 1,392.1 | % | (94.0%) | |||||
| Allowance for loan loss/nonperforming loans |
64.6 | % | 86.6 | % | (81.8%) | |||||
| Risk-based capital |
11.7 | % | 11.9 | % | (1.7%) | |||||
| Financial Position at December 31, |
||||||||||
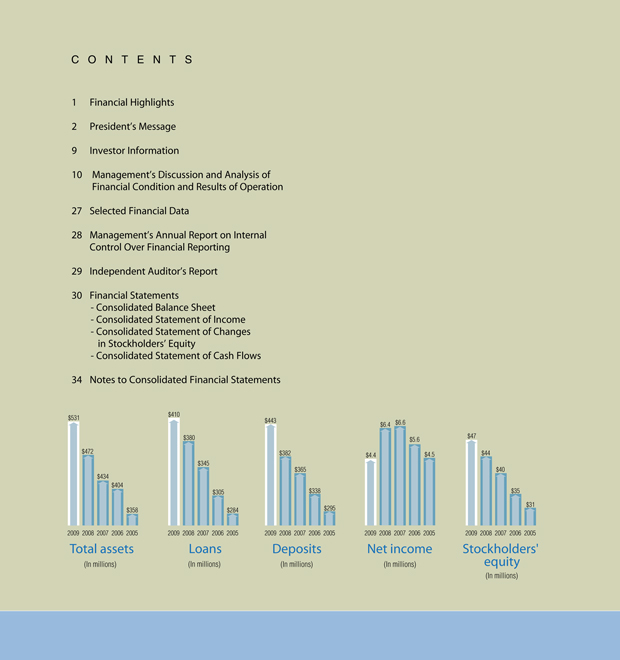
| Assets |
$ | 530,657 | $ | 472,478 | 12.3% | |||||
| Loans |
$ | 410,012 | $ | 380,207 | 7.8% | |||||
| Deposits |
$ | 443,116 | $ | 381,989 | 16.0% | |||||
| Stockholders’ equity |
$ | 47,117 | $ | 44,468 | 6.0% | |||||


Dear Shareholder:


| DIMECO, INC. OFFICERS | THE DIME BANK OFFICERS | |||
| WILLIAM E. SCHWARZ | WILLIAM E. SCHWARZ | MARCIA F. GUBERMAN | ||
| Chairman of the Board | Chairman of the Board | Vice President | ||
| JOHN S. KIESENDAHL | JOHN S. KIESENDAHL | FRANK R. REDINGTON | ||
| Vice Chairman of the Board | Vice Chairman of the Board | Vice President | ||
| GARY C. BEILMAN | JOHN F. SPALL | CHERYL A. SMITH | ||
| President and Chief Executive Officer | Assistant Secretary | Vice President | ||
| MAUREEN H. BEILMAN Chief Financial Officer, Treasurer and Assistant Secretary
PETER BOCHNOVICH Senior Vice President and Assistant Secretary
JOHN F. SPALL Secretary
TDB INSURANCE SERVICES, LLC OFFICERS
GARY C. BEILMAN President
PETER BOCHNOVICH Secretary
MAUREEN H. BEILMAN Treasurer
JOSEPH PIZZO Vice President |
GARY C. BEILMAN President and Chief Executive Officer
MAUREEN H. BEILMAN Chief Financial Officer and Treasurer
PETER BOCHNOVICH Senior Vice President and Assistant Secretary
L. JILL GEORGE Vice President
JOSEPH W. ADAMS Vice President
MARY CAROL CICCO Vice President
RUTH E. DANIELS Vice President
JANETTE M. DAVIS Vice President
THOMAS M. DIDATO Vice President |
JEROME D. THEOBALD Vice President
DEBORAH L. UNFLAT Vice President
MICHELLE E. URBAN Assistant Vice President
CYNTHIA D. BURDICK Bank Security Officer
AMY L. BURKE Community Office Manager
JAN M. HOADLEY Community Office Manager
MARY JANE HUNTER Trust Officer
NANCY M. LAVENDUSKI Loan Officer
MELANIE F. SEAGRAVES Community Office Manager
LINDA S. TALLMAN Secretary | ||

| ||||
I N V E S T O R I N F O R M A T I O N
| CORPORATE HEADQUARTERS P.O. Box 509 820 Church Street Honesdale, PA 18431 570-253-1970 email: dimeco@thedimebank.com www.thedimebank.com
INDEPENDENT AUDITORS S.R. Snodgrass, A.C. 2100 Corporate Drive, Suite 400 Wexford, PA 15090-7647 724-934-0344 www.srsnodgrass.com
LEGAL COUNSEL Malizia Spidi & Fisch, P.C. 901 New York Avenue, N.W. Suite 210 East Washington, DC 20001 202-434-4660 www.malizialaw.com |
TRANSFER AGENT Registrar and Transfer Company 10 Commerce Drive Cranford, NJ 07016 800-368-5948 email: info@rtco.com www.rtco.com
For change of name, address, or to replace lost stock certificates, write or call the securities transfer division.
DIVIDEND REINVESTMENT PLAN The Company offers a plan for stockholders to automatically reinvest their dividends in shares of common stock. There are no brokerage commissions or fees imposed. For more information contact the transfer agent.
ANNUAL MEETING Shareholders are cordially invited to attend the Annual Meeting of Shareholders, which will be held at The Community Room of the Wayne County Chamber of Commerce Building, 303 Commercial Street, Honesdale, PA on Thursday, April 22, 2010 at 2:00 pm. |
FIRMS KNOWN TO HANDLE DIMECO, INC. STOCK TRANSACTIONS Boenning & Scattergood, Inc.* Four Tower Bridge 200 Barr Harbor Drive, Suite 300 West Conshohocken, PA 19428-2979 610-862-5368 or 800-842-8928
Howe Barnes Hoefer & Arnett, Inc.* 21B South Main Street Cohasset, MA 02025 781-383-3350 888-239-4463 www.howebarnes.com
RBC Wealth Management 2101 Oregon Pike Lancaster, PA 17601-9669 717-519-5940 or 866-604-1471
Stifel Nicolaus* 7111 Fairway Drive, Suite 301 Palm Beach Gardens, FL 33418 800-793-7226
* Denotes Market Maker |
9

MANAGEMENT’S DISCUSSION AND ANALYSIS OF FINANCIAL CONDITION
AND RESULTS OF OPERATION
This consolidated review and analysis of Dimeco, Inc. (the “Company”) is intended to assist the reader in evaluating the performance of the Company for the years ended December 31, 2009 and 2008. This information should be read in conjunction with the consolidated financial statements and accompanying notes to the consolidated financial statements.
Dimeco, Inc., headquartered in Honesdale, Pennsylvania, is the one-bank holding company of The Dime Bank (the “Bank”), which is wholly-owned by the Company. TDB Insurance Services, LLC, a limited liability company, offering title insurance services, was formed by the Bank and is owned 100% by the Bank. Both the Company and the Bank derive their primary income from the operation of a commercial bank, including earning interest on loans and investment securities, fees on services performed and providing investment and trust services. The Bank’s main expenses are related to interest paid on deposits and other borrowings along with salary and benefits for employees. The Bank operates six full-service branches in Honesdale, Hawley, Damascus, Greentown and Dingmans Ferry, Pennsylvania, two off-site automatic teller machines, one each in Wayne and Pike County, Pennsylvania and an operations center in Wayne County, Pennsylvania. Principal market areas include Wayne and Pike Counties, Pennsylvania and Sullivan County, New York. The Bank employed 113 full-time employees and 19 part-time employees at December 31, 2009.
FORWARD-LOOKING STATEMENT
This Management Discussion and Analysis section of the Annual Report contains certain forward-looking statements (as defined in the Private Securities Litigation Reform Act of 1995). In the normal course of business, we, in an effort to help keep our shareholders and the public informed about our operations, may from time to time issue or make certain statements, either in writing or orally, that are or contain forward-looking statements, as that term is defined in the U.S. federal securities laws. Generally, these statements relate to business plans or strategies, projections involving anticipated revenues, earnings, profitability or other aspects of operating results or other future developments in our affairs or the industry in which we conduct business. Forward-looking statements may be identified by reference to a future period or periods or by the use of forward-looking terminology such as “anticipate,” “believe,” “expect,” “intend,” “plan,” “estimate” or similar expressions.
Although we believe that the anticipated results or other expectations reflected in our forward-looking statements are based on reasonable assumptions, we can give no assurance that those results or expectations will be attained. Forward-looking statements involve risks, uncertainties and assumptions (some of which are beyond our control), and as a result actual results may differ materially from those expressed in forward-looking statements. Factors that could cause actual results to differ from forward-looking statements include, but are not limited to, the following, as well as those discussed elsewhere herein:
| • | our investments in our businesses and in related technology could require additional incremental spending, and might not produce expected deposit and loan growth and anticipated contributions to our earnings; |
| • | general economic or industry conditions could be less favorable than expected, resulting in a deterioration in credit quality, a change in the allowance for loan and lease losses or a reduced demand for credit or fee-based products and services; |
| • | changes in the interest rate environment could reduce net interest income and could increase credit losses; |
| • | the conditions of the securities markets could change, which could adversely affect, among other things, the value or credit quality of our assets, the availability and terms of funding necessary to meet our liquidity needs and our ability to originate loans and leases; |
| • | changes in the extensive laws, regulations and policies governing financial holding companies and their subsidiaries could alter our business environment or affect our operations; |
| • | the potential need to adapt to industry changes in information technology systems, on which we are highly dependent, could present operational issues or require significant capital spending; |
10
| • | competitive pressures could intensify and affect our profitability, including as a result of continued industry consolidation, the increased availability of financial services from non-banks, technological developments such as the internet or bank regulatory reform; and |
| • | acts or threats of terrorism and actions taken by the United States or other governments as a result of such acts or threats, including possible military action, could further adversely affect business and economic conditions in the United States generally and in our principal markets, which could have an adverse effect on our financial performance and that of our borrowers and on the financial markets and the price of our common stock. |
You should not put undue reliance on any forward-looking statements. Forward-looking statements speak only as of the date they are made, and we undertake no obligation to update them in light of new information or future events except to the extent required by federal securities laws.
NON-GAAP FINANCIAL MEASURES
This annual report contains or references tax-equivalent interest income and yields, which are non-GAAP financial measures. Tax-equivalent interest income and yields are derived from GAAP interest income using an assumed tax rate of 34%. We believe the presentation of interest income and yield on a tax-equivalent basis ensures comparability of interest income and yield arising from both taxable and tax-exempt sources and is consistent with industry practice. Although the Company believes that these non-GAAP financial measures enhance investors’ understanding of our business and performance, these non-GAAP financial measures should not be considered an alternative to GAAP measures.
CRITICAL ACCOUNTING POLICIES
The Company’s accounting policies are integral to understanding the results reported. The accounting policies are described in detail in Note 1 of the “Notes to Consolidated Financial Statements.” Our most complex accounting policies require management’s judgment to ascertain the valuation of assets, liabilities, commitments and contingencies. We have established detailed policies and control procedures that are intended to ensure that valuation methods are well controlled and applied consistently from period to period. In addition, the policies and procedures are intended to ensure that the process for changing methodologies occurs in an appropriate manner. The following is a brief description of our current accounting policies involving significant management valuation judgments.
Allowance for Loan Losses
Arriving at an appropriate level of allowance for loan losses involves a high degree of judgment. The Company’s allowance for loan losses provides for probable losses based upon evaluations of known and inherent risks in the loan portfolio.
Management uses both historical and current information relating to the loan portfolio, as well as general economic information, in order to determine our estimation of the prevailing business environment. The probability of collection of loans is affected by changing economic conditions and various external factors which may impact the portfolio in ways currently unforeseen. We monitor this information in an effort to assess the adequacy of the allowance for loan losses. The allowance is increased by provisions for loan losses and by recoveries of loans previously charged-off and reduced by loans charged-off. For a full discussion of the Company’s methodology of assessing the adequacy of the reserve for loan losses refer to Note 1 of the “Notes to Consolidated Financial Statements.”
Mortgage Servicing Rights
The Bank originates residential mortgages that are sold in the secondary market. It is the Bank’s normal practice to retain the servicing of these loans, meaning that the customers whose loans have been sold in the secondary market still make their monthly payments to the Bank. As a result of these mortgage loan sales, the Bank capitalizes a value allocated to the servicing rights categorized in other assets and recognizes other income from the sale and servicing of these loans. The capitalized servicing rights are amortized against noninterest income in proportion to the estimated net servicing income over the remaining periods of the underlying financial assets.
11
Capitalized servicing rights are evaluated for impairment periodically based upon the fair value of the rights as compared to amortized cost. The rights are deemed to be impaired when the fair value of the rights is less than the amortized cost. The fair value of the servicing rights is estimated using projected, discounted cash flows by means of a computer pricing model, based on objective characteristics of the portfolio and commonly used industry assumptions.
Deferred Tax Assets
The Company uses an estimate of future earnings to support our position that the benefit of our deferred tax assets will be realized. If future income should prove non-existent or less than the amount of the deferred tax assets within the tax years to which they may be applied, the asset may not be realized and our net income will be reduced. Our deferred tax assets are described further in Note 11 of the “Notes to Consolidated Financial Statements.”
Other than Temporary Impairment of Investments
Investments are evaluated periodically to determine whether a decline in their value is other than temporary. Management utilizes criteria such as the magnitude and duration of the decline, in addition to the reasons underlying the decline, to determine whether the loss in value is other than temporary. The term “other than temporary” is not intended to indicate that the decline is permanent. It indicates that the prospects for a near term recovery of value are not necessarily favorable, or that there is a lack of evidence to support fair values equal to, or greater than, the carrying value of the investment. Once a decline in value is determined to be other than temporary, the value of the security is reduced and a corresponding charge to earnings is recognized.
All dollars are stated in thousands, with the exception of per share numbers.
STATEMENT OF CONDITION
Total assets increased by $58,179 or 12.3% during the year ended December 31, 2009. Loans, investments and cash on hand were the main areas of this growth which was mainly funded by deposits, in particular time deposits.
Cash and cash equivalents increased by $17,294 or 433.1% from December 31, 2008 to December 31, 2009. The primary increase was in interest-bearing deposits in other banks of $13,928. As deposits grew during the year, we placed these funds in loans and investments and maintained liquidity by placing funds in cash or cash equivalents. We monitor cash requirements to assure that we have funds available for loan closings and time deposit maturities which is partially accomplished by keeping funds in accounts with immediate availability. Management attempts to balance interest-bearing deposits and has kept levels of federal funds sold and interest-bearing deposits at what we believe the optimum configuration in this historically low interest rate environment. Therefore balances of interest-bearing deposits are greater due to higher interest rates paid on these balances than earned on money kept in federal funds sold. In addition, we continue to monitor cash on hand, and have been able to maintain lower balances in the branch network, lowering these balances by $317 or 19.0% at the end of 2009 as compared to a year earlier.
Investment securities available for sale increased $8,028 or 12.2% at December 31, 2009 from balances one year earlier. Balances of U.S. government agency bonds increased $11,568 or 109.6% greater than at December 31, 2008. During the year, we purchased investments in U.S. government agency and tax-exempt municipal bonds while lowering balances of commercial paper. Although we have historically used commercial paper as a favorable source of liquidity since these issues typically mature within a few months of purchase, issues of high quality paper slowed in 2009 and those that were offered frequently paid a lower interest rate than we were able to earn on balances held at the Federal Reserve Bank of Philadelphia. We purchased $16,000 of U.S. government agency step-up bonds during the year which offer the opportunity of higher interest rates in future periods but also contain callable features. These bonds were purchased because they offered higher interest rates than other bonds available at the time and included the opportunity for increased rates in future periods even though we understand that they will be called if market interest rates become lower than the step-up rates of the security. In addition, we purchased $3,996 of U.S. government agency bonds without step-up features which offered favorable interest rates, $2,945 of adjustable rate SBA pool bonds which offer a payment stream as the underlying loans make payments and $1,463 of mortgage backed securities that also have monthly principal payments. We are beginning to increase holdings of bonds which offer monthly principal payments in the portfolio in order to offset the liquidity decline in the investment portfolio since we have not been purchasing the same level of commercial paper as in previous years. Balances of tax-exempt municipal bonds increased $5,556 or 26.3% as these investments continued to offer favorable tax-equivalent interest rates over other offerings at the time purchased.
12
The largest portion of asset growth was centered in loans for 2009. Total loans increased by $29,805 or 7.8%, during the year with loans secured by commercial real estate showed the greatest growth at $25,636 or 11.8% greater than the prior year. The most significant increase was $12,478 in loans to finance children’s summer camps. We continued to originate loans for purchase or improvement of children’s summer camps while maintaining our stringent reviews of each loan in order to maintain the quality of our loan portfolio. Management monitors the concentration levels of loans granted in each industry. Due to reaching the maximum level of loans to the children’s summer camp industry, we originated and sold participations of an additional $9,750 in these loans to other financial institutions in 2009. In addition, $6,158 of loans were granted for acquisition and the associated production of stone quarries. We established several new relationships with customers in the health services profession, resulting in an increase of $4,045 in this business sector. We have continued to originate loans to finance real estate investment with balances of this type loan increasing $3,365 over the previous year end. Loans to borrowers along with principal reductions or pay-offs of loans in various industries account for the remaining changes from December 31, 2008. The loan department has upheld their conservative underwriting guidelines and continued to grant loans for qualified business development. Construction and development loans increased $2,883 or 21.5% at December 31, 2009 as compared to a year earlier. This category represents loans to construct 1 – 4 family residential properties. Loan balances outstanding increase as projects progress toward completion therefore the balances at the end of 2009 were for loans which were closer to completion than balances a year earlier. Balances of home equity lines of credit increased $2,315 or 36.5% during 2009 as homeowners used the equity in their homes to take advantage of historically low interest rates to consolidate other higher costing debt. Our standard policy is to lend up to a total of 80% of a recent appraised home value for residential mortgages. First lien residential mortgage volume was very robust for 2009 with 191 mortgages being closed totaling $29,938. This compares to 91 mortgages closed totaling $14,979 in 2008. The high volume was a result of historically low interest rates creating refinancing opportunities for borrowers. The majority of these originations were sold on the secondary market to avoid the interest rate risk associated with holding long term fixed rates. Consumer loans declined $1,450 or 10.6% which we believe is a direct reflection of the overall reduction in consumer spending being evidenced throughout the United States economy.
The December 31, 2008 balance of $1,955 in other real estate owned declined to $389 at the end of 2009. The largest property in that category, a former automobile dealership carried at $1,566, was sold in the third quarter of 2009 with the Company recognizing a loss of $141. The balance at December 31, 2009 consisted of two residential properties.
In the fourth quarter of 2009, the FDIC mandated that all insured financial institutions prepay an estimate of three years assessments as a means to collect enough cash to meet upcoming liquidity needs to fund future resolutions. We were never required to prepay these assessments in the past therefore the balance of $2,309 at December 31, 2009 was unmatched in 2008.
Other assets increased $2,629 or 56.2% from December 31, 2008 to December 31, 2009. In January 2009, we invested $2,729 to purchase a one third interest in a limited partnership that will own and operate a residential housing project and is expected to generate federal income tax credits over the next ten years. There is a small additional investment required when the project receives their certificate of occupancy which we expect to happen in 2010. Other smaller changes in various assets make up the additional change, no one of which independently is material.
Deposits increased by $61,127 or 16.0% in 2009. Balances of noninterest-bearing deposits increased $2,061 or 5.5% with new relationships developed both through marketing initiatives in all branches and new accounts opened in the Lake Region branch which began operation in December 2008. The greatest contributor to deposit growth came from time deposits which increased $59,379 or 26.3% over balances one year earlier. Of that increase in time deposits, $44,149 was in certificates of deposit greater than or equal to $100. Several public entities in our marketplace contact us for pricing on short term certificates of deposit and we typically are able to accept some of each of these bids. Balances of certificates of deposit at December 31, 2009 included $7,830 more deposits from those entities than we had a year earlier. During 2009 we offered special interest rates on certificates of deposit for 7 months and 9 months in order to attract new customers to all branches but in particular to the Lake Region branch which was opened in December 2008. The special certificate of deposit product attracted many customers who would not necessarily have entered our branches and gave our branch personnel the opportunity to cross sell other products to those customers. We were successful to some degree in cross sells but did also attract special certificate of deposit accounts without cross sells. We have another opportunity to complete those cross sells when those customers come back in to the branches in 2010 upon maturity of the deposit and believe that our staff will open other accounts at that time. We do recognize that this effort will not be completely successful and expect to lose a percentage of those deposits at maturity. Funds were invested in the higher
13
yielding certificates of deposit not only from new customers but also from transfers of funds out of other noninterest-bearing and interest-bearing deposit accounts. We have lowered the interest rates on these specials in 2010 and will monitor the results of that strategy to determine the best course of action as the year unfolds. We have garnered some additional deposits from customers who have signed gas leases for their properties that are in the Marcellus Shale region. This area is expected to offer one of the largest natural gas deposits in the United States and we expect to gather additional deposits as drilling begins and royalties are paid to residents in northern Wayne county and other areas that are part of this geographical territory.
Short-term borrowings declined $5,697 or 34.2% from balances at December 31, 2008. Balances in our Financial Manager account, which is a commercial sweep product, increased $469 or 4.5% over the period. Short-term borrowings at the Federal Home Loan Bank of Pittsburgh (“FHLB”) of $6,166 at the end of 2008 were repaid during the year with no corresponding balance at December 31, 2009. Of these repayments, $3,166 was in overnight borrowings at FHLB and was repaid in January 2009 while $3,000 was the short-term portion of longer term borrowings.
CAPITAL RESOURCES
Stockholders’ Equity of $47,117 at December 31, 2009 represented an increase of $2,649 or 6.0% from the previous year end. Net income of $4,402 was the primary source of this increase, representing earnings per share of $2.82 and a return on average equity of 9.58%. Dividends of $2,244, or $1.44 per share, were returned to shareholders.
The Company’s capital position at December 31, 2009 as it relates to regulatory guidelines is presented below:
| Dimeco, Inc. | Well-Capitalized | Minimum Requirements | ||||
| Leverage Ratio |
9.47% | 5.00% | 4.00% | |||
| Tier I Capital Ratio |
10.47% | 6.00% | 4.00% | |||
| Total Capital Ratio |
11.73% | 10.00% | 8.00% | |||
LIQUIDITY
The liquidity risk in financial institutions is based upon the institution’s ability to have sources of funds available to meet its needs for the outflow of cash at any specific time. Liquidity begins with cash and cash equivalents, which Dimeco, Inc. defines as cash on hand and in banks, along with overnight investments in federal funds sold. Balances of these accounts totaled $21,287 or 4.0% of total assets at December 31, 2009. This amount is supplemented by various other sources of liquidity. We analyze our liquidity at least quarterly considering cash and cash equivalents along with other sources of liquidity. These sources include principal and interest payments on loans, the opportunity to borrow funds, deposit generation, sales and maturities of investment securities, sales of residential loans in the secondary market, participations of other commercial loans, access to certificates of deposit through a brokered network and operating income. An integral part of this analysis of our liquidity position is our borrowing capacity. The Bank has a credit line of $183,321 at the FHLB with $158,919 available at December 31, 2009. We also have the ability to borrow from the Federal Reserve Bank of Philadelphia discount window and have an agreement with one of our correspondent banks that would allow us to borrow additional funds if needed. Uses of liquidity include origination of loans for addition to our portfolio and to sales in the secondary market, purchases of investment securities, capital projects, operating expenses and payment of dividends. A review of the Consolidated Statement of Cash Flows indicates the sources of funds generated and used during the past three years. The key is to maintain appropriate levels of liquidity to allow for customers’ cash needs from both a lending and deposit perspective, to maintain sufficient cash for operating expenses and to have amounts available to take advantage of earning opportunities as they arise.
Companies in the financial service industry are dependent on their ability to maintain proper levels of short-term and long-term liquidity. Both short-term and long-term liquidity are primarily generated through the methods enumerated above. The Company may also acquire funds by issuance of additional common stock. The primary source of liquidity for the Company has been through origination of deposits both with our ability to maintain current deposits and garner new funds. It continues to be the main source of funds, but has been augmented by the Bank’s ability to borrow from outside sources. The borrowing capacity at the FHLB is viewed as both a long-term and short-term source of liquidity. In the short term, it provides the ability to borrow overnight or for other short-term funds as needed. The FHLB also has long-term funding products which supplement those needs that are longer term in nature.
14
Management believes that the Company has sufficient liquidity to meet both its short-term and long-term needs. We understand that liquidity may be adversely affected by many factors including unexpected deposit outflows, aggressive competitive pricing by other financial intermediaries and other cash requirements. We are aware of our dependence on customers’ deposits to sustain our liquidity levels. We are also aware of customer concerns relating to recent bank failures and constant news reports of uncertainty regarding the banking industry. We have sustained our level of disseminating information regarding our financial position and have continued to reiterate the fact that we did not get involved in subprime lending or risky investments. We believe that the FDIC’s increased insurance levels have assisted us to maintain deposits in light of this increased customer concern of the financial services industry.
QUANTITATIVE AND QUALITATIVE DISCLOSURES ABOUT MARKET RISK
Market risk is inherent in the financial services industry, encompassing the risk of loss associated with adverse changes in market interest rates and prices. As an organization, we have placed the management of this risk in the Asset/Liability Committee (“ALCO”). This committee is comprised of ten members including all senior officers, vice presidents representing each product offering, information technology, community banking and marketing. The committee follows guidelines enumerated in the ALCO policy which was developed to achieve earnings consistent with established goals while maintaining acceptable levels of interest rate risk, adequate levels of liquidity and adherence to regulatory mandates. The committee reports to the Board of Directors on at least a quarterly basis.
Asset market risk is most prevalent in the investment and loan portfolios. With interest rates continuing at low levels, it has continued to be difficult to locate and purchase investments with the credit quality required by our guidelines that offer yields that we believe will offer long term benefit for the Company. We continued to purchase well rated tax-exempt municipal bonds along with U.S. government agency bonds as the most appropriate investments available in the market. Management has maintained a portfolio which includes investments in short term commercial paper and U.S. government agencies that contain interest rate step-ups and calls over the life of the bonds along with callable municipal bonds. All investments are held in the available for sale category but management anticipates holding all investments to maturity or call date and has historically not had the need to sell investments for liquidity needs. Interest rates on consumer loans are determined by the Loan Committee and reviewed by the ALCO and are subject to change continually. The committees review local rates along with internal rate guidelines to determine the appropriate interest rates to charge. Commercial loan rates are determined on a case by case basis and are dependent on the characteristics of each loan and borrower. The Loan Committee instituted interest rates with floors on a majority of all new loans originated in 2009 and continues to negotiate the introduction of floor interest rates as revolving lines of credit are reviewed or loan terms are extended. Market risk inherent in loans held for sale has been mitigated by controlling the length of time between origination and sale of these loans. The balance of loans in this category is generally less than $500.
To address credit risk, both the loan portfolio and the investment portfolio have stringent guidelines as to the credit quality of acceptable investments. These guidelines are dictated by the safety and soundness provisions of the regulators which govern the Bank and the Company.
Liability market risk is associated with the adverse affects of our pricing strategies compared to competitors’ pricing strategies. The markets in which we have offices are also served by other financial institutions. If there is not enough flexibility in our pricing models to quickly move interest rates on deposits, we may lose accounts to other financial intermediaries. We have offered special certificate of deposit products at times and at other times borrowed funds from the FHLB at current market rates rather than meet inflated interest rates offered by competitors. We believe that by working within our guidelines we will continue to achieve profitability.
The ALCO is cognizant of the ability of interest rates to adversely affect assets, liabilities, capital, and interest income and expense. In particular, two analytical tools are used to ascertain our ability to manage this market risk. The first is the Statement of Interest Sensitivity Gap. This report matches all interest-earning assets and all interest-bearing liabilities by the time frame in which funds can be reinvested or repriced. The second report is the Analysis of Sensitivity to Changes in Market Interest Rates which is used to determine the affect on income of various shifts in the interest rate environment. Both reports include inherent assumptions in order to process the information. Management is aware that
15
these assumptions affect results and that actual results may differ from the projected results suggested by these tools. These assumptions include an estimate of the maturity or repricing times of deposits, even though all deposits, other than time deposits, have no stated maturity and the reference that interest rate shifts will be parallel, with the rates of assets and liabilities shifting in the same amount in the same time frame. In reality, various assets and various liabilities will react differently to changes in interest rates, with some lagging behind the change and some anticipating the upcoming change and reacting before any actual change occurs. Each tool also suggests that there is a propensity to replace assets and liabilities with similar assets and liabilities rather than taking into consideration management’s ability to reallocate the balance sheet. In addition, the models used do not include any elements to determine how an action by management to increase or decrease interest rates charged on loans or paid on deposits or to increase other borrowings will affect the results of the analysis. Despite these limitations, these analyses are good tools to use in a consistent fashion to assist in the management of the Company. Similar versions of these same reports are used by most financial institutions. Both measurements are as of December 31, 2009.
STATEMENT OF INTEREST SENSITIVITY GAP
| 90 days or less |
>90 days but < 1 year |
1 - 5 years |
>5 years | Total | |||||||||||
| Assets |
|||||||||||||||
| Interest-bearing deposits in other banks |
$ | 17,296 | $ | - | $ | - | $ | - | $ | 17,296 | |||||
| Investment securities |
20,975 | 9,949 | 13,686 | 29,018 | 73,628 | ||||||||||
| Loans (1) (4) |
72,809 | 136,140 | 109,593 | 84,969 | 403,511 | ||||||||||
| Rate sensitive assets |
$ | 111,080 | $ | 146,089 | $ | 123,279 | $ | 113,987 | $ | 494,435 | |||||
| Liabilities |
|||||||||||||||
| Interest-bearing deposits: |
|||||||||||||||
| Interest-bearing demand (2) |
$ | 3,167 | $ | 9,896 | $ | 26,521 | $ | - | $ | 39,584 | |||||
| Money market (3) |
7,001 | 20,590 | 13,589 | - | 41,180 | ||||||||||
| Savings (2) |
2,983 | 9,322 | 24,983 | - | 37,288 | ||||||||||
| Time deposits |
83,558 | 154,578 | 47,241 | - | 285,377 | ||||||||||
| Short-term borrowings |
10,974 | - | - | - | 10,974 | ||||||||||
| Other borrowings |
2,455 | 2,395 | 11,577 | 7,975 | 24,402 | ||||||||||
| Rate sensitive liabilities |
$ | 110,138 | $ | 196,781 | $ | 123,911 | $ | 7,975 | $ | 438,805 | |||||
| Interest sensitivity gap |
$ | 942 | $ | (50,692) | $ | (632) | $ | 106,012 | $ | 55,630 | |||||
| Cumulative gap |
$ | 942 | $ | (49,750) | $ | (50,382) | $ | 55,630 | |||||||
| Cumulative gap to total assets |
.18% | (9.38%) | (9.49%) | 10.48% | |||||||||||
| (1) | Loans are included in the earlier period in which interest rates are next scheduled to adjust or in which they are due. No adjustment has been made for scheduled repayments or for anticipated prepayments. |
| (2) | Interest-bearing demand deposits and savings are segmented based on the percentage of decay method. The decay rates used include 8% “90 days or less,” 25% “ >90 days but <1 year” and 67% “1-5 years.” |
| (3) | Money market deposits are segmented based on the percentage of decay method. The decay rates used include “90 days or less” 17%, “>90 days but < 1 year” 50% and “1-5 years” 33%. |
| (4) | Does not include loans in nonaccrual status, deposit overdrafts, unposted items or deferred fees on loans. |
| (5) | Investments are included in the earlier period in which interest rates are next scheduled to adjust or in which they are due. |
Included are U.S. Government Agency step-up bonds characterized by having tiered interest rates over their life. Due to this feature these securities have been reallocated from their maturity date to their next step-up date. The specific impact of this policy by timeframe is as follows: “90 days or less” increased $2,500, “>90 but < 1 year” increased $7,985, “1-5 years” decreased $4,559 and “>5 years” decreased $5,926. In addition, municipal bonds and corporate bonds with market values of $2,500 and $1,230, respectively, have been reallocated from the “> 5 year” category to the “90 days or less“ because they are variable interest rate bonds, some of which have a put feature. A corporate bond with a market value of $249 was reallocated from “1-5 years” to “90 days or less” because the interest rate reprices quarterly.
16
This report shows the Company to be in an asset sensitive position of $942 in 90 days or less, meaning that there are more assets which will reprice in this period than liabilities. Traditionally management focuses the greatest attention to the net gap of the balance sheet in the second time frame, assets and liabilities which mature in less than or equal to one year. Our statement shows that the Company becomes liability sensitive in this cumulative time frame, with $49,750 of net liabilities repricing in the next twelve months. With interest rates at historic lows, this liability sensitive position offers the opportunity to reprice some liabilities to lower rates but is typically not the ideal position to be in for rising rates. Given the current low interest rate environment, we have seen declines in the interest earned on assets in direct proportion to the market declines. On the liability side, we have been hampered in decreasing interest rates past a minimum of something just above zero. Therefore, as interest rates begin to increase, the assets will certainly increase but liabilities will lag as to increases because we have not been able to decrease them in the same proportion that our standard strategy would have indicated. Management has established a range of sensitivity that we feel depicts prudent banking practice and we manage the balance sheet to be within that range. The most conservative position is perfectly balanced in any time frame.
The following table presents the Company’s potential sensitivity in net interest income, net income and equity value at risk, or the potential of adverse change in the economic value of equity (“EVE”) with rates up or down 100 and 200 basis points. EVE is the present value of assets minus the present value of liabilities at a point in time.
ANALYSIS OF SENSITIVITY TO CHANGES IN MARKET INTEREST RATES
| 100 basis points | 200 basis points | |||||||||||||||||||||||||||
| Up | Down | Up | Down | |||||||||||||||||||||||||
| Amount | % | Amount | % | Amount | % | Amount | % | |||||||||||||||||||||
| Net interest income |
$ | 178 | 1.12 % | $ | 482 | 3.04% | $ | 223 | 1.41 % | $ | (1,085) | (6.85)% | ||||||||||||||||
| Net income |
$ | 131 | 3.09 % | $ | 309 | 7.30% | $ | 171 | 4.04 % | $ | (731) | (17.25)% | ||||||||||||||||
| EVE |
$ | (2,274) | (3.97)% | $ | 2,943 | 5.14% | $ | (5,396) | (9.42)% | $ | 6,731 | 11.75 % | ||||||||||||||||
The greatest risk to the Company from an income perspective is an immediate decline in market interest rates of 200 basis points. With a sudden shift of that magnitude we would experience a decline of $731 or 17.25% of net income. With market interest rates at their current levels, we believe that a decline of this magnitude is near impossible. In the EVE measurement, an increase of 200 basis points would affect the Company by lowering equity by $5,396 or 9.42%, a level that is within our established tolerance limits. Management believes that we have the ability to affect the changes in income and equity by taking actions which are not factored in this analysis.
ALLOWANCE FOR LOAN LOSSES
The allowance for loan losses represents the amount that management estimates is adequate to provide for probable losses inherent in the loan portfolio. It is the largest subjective measurement in the financial statements. The balance is derived by charging losses against the allowance while recoveries are credited to it with charges to provision expense providing the amount necessary to maintain the appropriate balance per our analysis. As of December 31, 2009, the balance of the Company’s allowance was $6,253 which represented 1.53% of the loan portfolio at that date.
Given the current national economic condition there has been greater concern regarding higher-risk lending. The Company has no option ARM loans, negative amortizing loans, interest-only loans, subprime loans, or loans with initial teaser rates. We do, however, grant junior lien residential mortgage loans. Balances of these loans were $17,085, or 4.2% of total loans at December 31, 2009. These loans are made for various reasons capitalizing on the borrower’s home equity values for which the loans are typically granted with a maximum loan to value ratio of 80%. In addition, the Company has granted other loans with residential real estate serving as collateral for which the loan to value ratio is greater than 80%. These loans represent less than 1.0% of total loans at December 31, 2009.
Provision expense is based on management’s periodic evaluation of the adequacy of the allowance for loan losses, taking into consideration the overall risk characteristics of the portfolio, our specific loan loss experience, current and projected economic conditions, industry loan experience and other relevant factors. These estimates, including the amounts and timing of future cash flows relating to impaired loans, used to determine the adequacy of the allowance are particularly
17
susceptible to significant change. The total allowance for loan losses is a combination of a specific allowance for identified problem loans, a formula allowance and a qualitative allowance. The specific allowance is determined by measuring impairment based upon the practices outlined in U.S generally accepted accounting standards. These standards prescribe methods to measure impairment and income recognition as well as documenting disclosure requirements. The formula allowance is calculated using two separate methods. First, we apply factors to outstanding loans by type and risk weighting, excluding those loans for which a specific allowance has been determined. These loss factors are determined by management using historical loss information, current economic factors, portfolio concentration analysis, current delinquency ratios and the experience level of the loan officers in conjunction with evaluations of specific loans during the loan review process. The second formula evaluates selected loans on an individual basis and allocates specific amounts to the allowance based on our internal risk assessment. The qualitative portion of the allowance is determined based upon management’s evaluation of a number of factors including: national and local economic business conditions, collateral values within the portfolio, credit quality trends and management’s evaluation of our particular loan portfolio as a whole.
The Company employs an experienced outside professional loan review agency to perform the loan review function. This review places each evaluated loan in a category ranging from prime quality to loss. In order to test the majority of the commercial loan category, a review of loan relationships is performed to include approximately 70% of the average portfolio. Current financial information of the customer, an analysis of loan concentrations, financial ratio comparisons, adherence to payment schedule, regulatory evaluations and peer comparisons are all considered in the loan review procedure. Management evaluates all loans that are not included in the third party loan review process utilizing similar guidelines. After careful evaluation of all factors, a risk rate is assigned and an amount is calculated for each category of reviewed loans. Groups of smaller dollar loans are evaluated as a homogeneous pool with similar factors used to evaluate the appropriateness of the allowance for those loans.
SUMMARY OF LOAN LOSS EXPERIENCE
| 2009 | 2008 | 2007 | 2006 | 2005 | |||||||||||
| Balance January 1, |
$ | 5,416 | $ | 5,392 | $ | 4,469 | $ | 3,973 | $ | 3,172 | |||||
| Charge-offs: |
|||||||||||||||
| Commercial, financial and agricultural |
187 | 139 | 146 | 37 | 106 | ||||||||||
| Real estate-construction |
- | - | - | - | - | ||||||||||
| Real estate-mortgage |
144 | 691 | - | 181 | - | ||||||||||
| Installment loans to individuals |
187 | 178 | 214 | 153 | 200 | ||||||||||
| Total charge-offs |
518 | 1,008 | 360 | 371 | 306 | ||||||||||
| Recoveries: |
|||||||||||||||
| Commercial, financial and agricultural |
- | 6 | 4 | 5 | 46 | ||||||||||
| Real estate-construction |
- | - | - | - | - | ||||||||||
| Real estate-mortgage |
5 | 1 | 19 | 6 | 141 | ||||||||||
| Installment loans to individuals |
50 | 75 | 130 | 71 | 70 | ||||||||||
| Total recoveries |
55 | 82 | 153 | 82 | 257 | ||||||||||
| Net charge-offs |
463 | 926 | 207 | 289 | 49 | ||||||||||
| Additions charged to operations |
1,300 | 950 | 1,130 | 785 | 850 | ||||||||||
| Balance at December 31, |
$ | 6,253 | $ | 5,416 | $ | 5,392 | $ | 4,469 | $ | 3,973 | |||||
| Ratio of net charge-offs during the period to average loans outstanding during the period |
.12% | .26% | .06% | .10% | .02% | ||||||||||
| Allowance for loan loss as a % of loans outstanding |
1.53% | 1.42% | 1.56% | 1.46% | 1.40% | ||||||||||
18
Included in the footnotes to the financial statements are schedules which include the total loans which were past due 90 days or more or in nonaccrual and/or impaired status. At December 31, 2009, $7,418 of loans were classified as impaired. Included in that balance are three loans to one borrower totaling $1,751 for which all payments have been made and were not delinquent at December 31, 2009. These loans were placed in impaired status due to cash flow concerns that their financial statements do not show evidence of the ability to make all future payments. The company has been able to make payments due to financial contributions of the principals who have substantial assets which would allow them to continue to finance cash shortfalls until the company has the ability to make all payments in accordance with the loan agreement. Also included in impaired loans are $1,861 to customers who have been slow making payments but for which we believe we have sufficient collateral value and, therefore didn’t record any specific allowance on those loans. We had one relationship including four loans totaling $3,806 that did not made any payments in 2009. We have commenced foreclosure proceedings on the collateral but do not expect the sheriff sale until sometime in the first half of 2010. Our allowance calculation for these loans added $1,103 to the allowance at December 31, 2009. At December 31, 2008, there was one loan in impaired status with a balance of $267. The level of loans past due 90 days or more and still accruing interest at December 31, 2009 was $2,152. The majority of these loans are secured by real estate and management does not believe that we have any one loan that would have a material charge to the allowance for loan loss. Loans in nonaccrual status were $7,522 at December 31, 2009 with the majority of those loans also classified as impaired as of the balance sheet date. The majority of these loans were secured by real estate and in the process of collection. Due to the current economic climate, we have experienced a noticeably longer timeframe for loans to be in an adverse position before we are able to take ownership of the assets. Local government agencies responsible to enforce the collection process have experienced a large backlog due to the increase in legal collection actions and have not increased their staffing due to their own budgetary issues. We continue to proceed with collection efforts but expect that those actions may take a minimum of one year until these conditions improve.
OFF-BALANCE SHEET ARRANGEMENTS
In the normal course of business, the Company engages in a variety of financial transactions that in accordance with generally accepted accounting principles are not recorded on its consolidated financial statements. These off-balance sheet arrangements primarily consist of loan commitments, letters of credit and unused lines of credit, including commercial lines for the financing needs of our customers. These off-balance sheet arrangements involve, to varying degrees, elements of credit, interest rate, and liquidity risk. During the year ended December 31, 2009, the Company did not engage in any off-balance sheet transactions reasonably likely to have a material effect on its consolidated financial condition, results of operations or cash flows.
RESULTS OF OPERATIONS
2009 Compared to 2008
Net income for the year ended December 31, 2009 was $4,402, a decline of $1,999 or 31.2% from a year earlier. The Company encountered several obstacles to performing at the same level in 2009 as it had in 2008. With interest rates remaining at the same low levels as the year 2008 ended, interest spread was compressed. The FDIC increased its assessment rates for insured financial institutions during the year. In addition, economic conditions made it more difficult for our customers to make timely payments on some loans, driving our delinquency levels higher which resulted in an increase in nonaccrual loans and the provision for loan loss. Offsetting some of those issues, we were able to begin new relationships in all of our branches by offering deposit products at historically low interest rates. We also improved our technological position by instituting new delivery methods and outsourcing computer processing to a third party which we believe will position the Company for the future growth and prosperity. Although net income dropped in 2009, the income level of the Bank represented returns in the top third of similar sized banks in the United States. The following discussion will address each area of the income statement.
19
Net Interest Income
This discussion regarding net interest income should be read in conjunction with the schedule Distribution of Assets, Liabilities and Stockholders’ Equity: Interest Rates and Interest Differential and Rate/Volume Analysis of Changes in Net Interest Income.
Net interest income declined $1,743, or 10.0% ($1,409 or 7.9% on a tax-equivalent basis), as interest income declined at a faster rate than interest expense. The decline in interest income reflects the continued downward re-pricing of our interest-earning assets. Reflecting these same factors, our interest rate spread and net interest margin narrowed to 3.34% and 3.60%, respectively from 3.76% and 4.19%, respectively, in 2008.
Interest income declined $3,658 or 13.0% ($3,324 or 11.7% on a tax-equivalent basis) in 2009 as compared to 2008. Interest and fees earned on loans declined $3,076 or 12.1% in 2009 as compared to 2008. The average interest rate earned on loans declined by 1.27% in 2009 as compared to 2008. We had 77% of our loan portfolio invested in variable interest rate loans and we continued to see loans reprice downward in 2009. We typically offer to fix the interest rate on new loans for two to three years at the outset of projects in order to offer customers the ability to project stable cash flows; during 2009 we continued to see interest rates adjust downward as those loans reached their interest reprice date. We still have many loan relationships to reprice in 2010 and expect that interest income may be impacted by approximately $400 if interest rates remain constant.
Simultaneously, as we purchased investments, the interest rates available for new bonds were offered at lower rates than were available in our existing investment portfolio, resulting in a decrease of $842 or 41.4% in taxable interest income investments. The average balance of taxable investments declined by $10,865 due to our inability to purchase qualified commercial paper or corporate bonds as bonds matured throughout 2009. The rates we were able to earn on bonds to replace matured bonds carried lower market rates. We did invest in more tax-exempt bonds throughout 2008 and 2009, thereby increasing the average balance of those investments by $9,684 from 2008 to 2009, resulting in an increase in tax- equivalent interest income of $500 or 54.3%.
As a result of lower market interest rates in each interest-bearing liability account, interest expense declined by $1,915 or 18.0% in 2009 as compared to 2008. This decrease in expense was accomplished in spite of an average increase of $37,232 or 10.2% in interest-paying liabilities. Savings accounts increased $1,961 or 5.7% on average while the average rate paid for those deposits declined by 21 basis points in 2009 as compared to 2008. These changes resulted in a net decline of $66 in expense with the rate attributable for $76 decline and additional balances adding $10 to the expense. Interest-bearing demand deposits declined $5,936 or 6.9% as customers either used the funds for routine business and personal expenses or transferred the balances to higher interest rate products during 2009. The expense related to these deposits decreased $545 due primarily to a decline of $471 in relation to lower average interest rates paid for these deposits. Time deposits showed the greatest average balance growth of $32,739 or 15.7% during 2009 with the majority of the growth in short term special certificates of deposit. Many higher interest rate certificate of deposit accounts matured in 2009 and were reinvested in these lower interest rate special certificate of deposit accounts. In spite of this growth in the average balances, expense for time deposits decreased $1,361 with a decline of $2,654 related to lower average rates and an increase of $1,293 related to the higher average balance of these deposits. Local competition continued to offer interest rates much higher than national average rates for deposits and, in order to maintain relationships with our customers, we also paid a higher rate than the national average. We expect to further lower rates on certificates of deposit gradually as interest rates remain flat and expect to be slower to increase those rates as market rates move upward. Average balances of other borrowed funds increased $8,606 or 44.6% primarily due to borrowings made during 2008. During 2009, we borrowed $1,850 but repaid $4,746 to decrease the year-end balance of these borrowings. The expense related to these borrowings increased $172 with the primary element being additional expense of $413 related to higher average balances and an offset of $241 related to a decline of 87 basis points in the average rate paid for the borrowings. In an effort to increase profitability, management has continued to offer programs aimed at attracting as many noninterest-bearing deposits as possible and will continue with this effort.
20
DISTRIBUTION OF ASSETS, LIABILITIES AND STOCKHOLDERS’ EQUITY;
INTEREST RATES AND INTEREST DIFFERENTIAL
| 2009 | 2008 | 2007 | ||||||||||||||||||||||
| Average Balance (3) |
Revenue/ Expense |
Yield/ Rate |
Average Balance (3) |
Revenue/ Expense |
Yield/ Rate |
Average Balance (3) |
Revenue/ Expense |
Yield/ Rate | ||||||||||||||||
| ASSETS |
||||||||||||||||||||||||
| Interest-earning assets: |
||||||||||||||||||||||||
| Loans, net of unearned (1)(2)(4) |
$ | 387,767 | $ | 22,530 | 5.81% | $ | 359,119 | $ | 25,442 | 7.08% | $ | 324,706 | $ | 26,107 | 8.04% | |||||||||
| Investment securities: |
||||||||||||||||||||||||
| Taxable (5) |
37,090 | 1,194 | 3.22% | 47,955 | 2,036 | 4.25% | 61,604 | 3,249 | 5.27% | |||||||||||||||
| Exempt from federal income tax (2) |
24,116 | 1,421 | 5.89% | 14,432 | 921 | 6.38% | 9,105 | 552 | 6.05% | |||||||||||||||
| Interest-bearing deposits in other banks |
3,971 | 12 | .30% | 911 | 22 | 2.41% | 605 | 30 | 4.96% | |||||||||||||||
| Federal funds sold |
2,549 | 7 | .27% | 3,505 | 67 | 1.91% | 3,946 | 201 | 5.09% | |||||||||||||||
| Total interest-earning assets/ interest income |
455,493 | 25,164 | 5.52% | 425,922 | 28,488 | 6.69% | 399,966 | 30,139 | 7.54% | |||||||||||||||
| Cash and due from banks |
4,947 | 5,395 | 5,577 | |||||||||||||||||||||
| Premises and equipment |
11,099 | 8,127 | 5,743 | |||||||||||||||||||||
| Other assets, less allowance for loan losses |
20,245 | 8,534 | 7,802 | |||||||||||||||||||||
| Total Assets |
$ | 491,784 | $ | 447,978 | $ | 419,088 | ||||||||||||||||||
| LIABILITIES AND STOCKHOLDERS’ EQUITY |
||||||||||||||||||||||||
| Interest-bearing liabilities: |
||||||||||||||||||||||||
| Savings |
$ | 36,446 | $ | 116 | .32% | $ | 34,485 | $ | 182 | .53% | $ | 33,176 | $ | 246 | .74% | |||||||||
| Demand - interest-bearing |
80,369 | 533 | .66% | 86,305 | 1,078 | 1.25% | 80,333 | 1,828 | 2.28% | |||||||||||||||
| Time deposits |
241,220 | 6,882 | 2.85% | 208,481 | 8,243 | 3.95% | 200,886 | 9,403 | 4.68% | |||||||||||||||
| Short-term borrowings |
15,488 | 122 | .79% | 15,626 | 237 | 1.52% | 13,538 | 349 | 2.58% | |||||||||||||||
| Other borrowed funds |
27,889 | 1,097 | 3.93% | 19,283 | 925 | 4.80% | 16,410 | 775 | 4.72% | |||||||||||||||
| Total interest-bearing liabilities/ interest expense |
401,412 | 8,750 | 2.18% | 364,180 | 10,665 | 2.93% | 344,343 | 12,601 | 3.66% | |||||||||||||||
| Noninterest-bearing deposits |
40,489 | 38,014 | 33,530 | |||||||||||||||||||||
| Other liabilities |
3,936 | 3,887 | 3,526 | |||||||||||||||||||||
| Total Liabilities |
445,837 | 406,081 | 381,399 | |||||||||||||||||||||
| Stockholders’ Equity |
45,947 | 41,897 | 37,689 | |||||||||||||||||||||
| Total Liabilities and Stockholders’ Equity |
$ | 491,784 | $ | 447,978 | $ | 419,088 | ||||||||||||||||||
| Net interest income/interest spread |
$ | 16,414 | 3.34% | $ | 17,823 | 3.76% | $ | 17,538 | 3.88% | |||||||||||||||
| Margin Analysis: |
||||||||||||||||||||||||
| Interest income/earning assets |
$ | 25,164 | 5.52% | $ | 28,488 | 6.69% | $ | 30,139 | 7.54% | |||||||||||||||
| Interest expense/earning assets |
8,750 | 1.92% | 10,665 | 2.50% | 12,601 | 3.15% | ||||||||||||||||||
| Net interest income/earning assets |
$ | 16,414 | 3.60% | $ | 17,823 | 4.19% | $ | 17,538 | 4.38% | |||||||||||||||
| Ratio of average interest-earning assets to average interest-bearing liabilities |
113.47% | 116.95% | 116.15% | |||||||||||||||||||||
| (1) | Nonaccrual loans are not included. |
| (2) | Income on tax-exempt assets is calculated on a taxable equivalent basis using a federal income tax rate of 34%. (3) Average balances are calculated using daily balances. |
| (3) | Average balances are calculated using daily balances. |
| (4) | Interest on loans includes fee income. |
| (5) | Includes equity investments in FHLB and ACBB for 2007, 2008. In 2009 FHLB paid no dividend and the investment was moved to other assets for that year. |
Certain amounts for prior years have been reclassified in order to conform to current presentation.
21
RATE/VOLUME ANALYSIS OF CHANGES IN NET INTEREST INCOME
| 2009 Compared to 2008 | 2008 Compared to 2007 | |||||||||||||||||
| Total Variance |
Caused by | Total Variance |
Caused by | |||||||||||||||
| Rate(1) | Volume | Rate(1) | Volume | |||||||||||||||
| Interest income: |
||||||||||||||||||
| Loans (gross) |
$ | (2,912) | $ | (4,940) | $ | 2,028 | $ | (665) | $ | (3,432) | $ | 2,767 | ||||||
| Investment securities: |
||||||||||||||||||
| Taxable |
(842) | (380) | (462) | (1,213) | (493) | (720) | ||||||||||||
| Exempt from federal income tax (2) |
500 | (118) | 618 | 369 | 46 | 323 | ||||||||||||
| Interest-bearing deposits |
(10) | (84) | 74 | (8) | (23) | 15 | ||||||||||||
| Federal funds sold |
(60) | (42) | (18) | (134) | (112) | (22) | ||||||||||||
| Total interest-earning assets |
(3,324) | (5,564) | 2,240 | (1,651) | (4,014) | 2,363 | ||||||||||||
|
Interest expense: |
||||||||||||||||||
| Savings |
(66) | (76) | 10 | (64) | (74) | 10 | ||||||||||||
| Interest-bearing checking |
(545) | (471) | (74) | (750) | (886) | 136 | ||||||||||||
| Time deposits |
(1,361) | (2,654) | 1,293 | (1,160) | (1,516) | 356 | ||||||||||||
| Short-term borrowings |
(115) | (113) | (2) | (112) | (166) | 54 | ||||||||||||
| Other borrowed funds |
172 | (241) | 413 | 150 | 14 | 136 | ||||||||||||
| Total interest-bearing liabilities |
(1,915) | (3,555) | 1,640 | (1,936) | (2,628) | 692 | ||||||||||||
| Net change in net interest income |
$ | (1,409) | $ | (2,009) | $ | 600 | $ | 285 | $ | (1,386) | $ | 1,671 | ||||||
| (1) | Changes in interest income or expense not arising solely as a result of volume or rate variances are allocated to rate variances due to the interest sensitivity of assets and liabilities. |
| (2) | Income on interest-earning assets is calculated on a taxable equivalent basis using a federal income tax rate of 34%. |
Provision for Loan Losses
The provision for loan losses for 2009 was $1,300, representing an increase of $350 or 36.8% over this expense in 2008.
Management analyzes the characteristics of the loan portfolio through the calculation of the allowance for loan loss and determines the appropriate balance for the allowance. The balance is funded through provision expense after adjustments for loans charged off and recoveries of loans that were charged off in previous periods. The net balance of loans charged off during 2009 was $463 compared to $926 in 2008. The calculation of the appropriate balance in the allowance for loan loss results in an acceptable range for the allowance.
Noninterest Income
Noninterest income increased $194 or 5.2% in 2009 as compared to 2008 primarily due to the sale of mortgage loans. Service charges on deposit accounts are the largest contributor to noninterest income with income of $1,497 for 2009. Fees charged in relation to overdrafts on checking accounts were $1,385 in 2009, a decrease of $137 or 9.0% less than the previous year. We believe that consumers are taking a more active role in managing their finances and using the overdraft protection feature of their deposit account less frequently. We did not increase the fee charged per use for this privilege from 2008 to 2009. In addition, we eliminated minimum balance fees on many of our checking accounts in 2009 in an effort to increase market penetration for this important funding liability. By eliminating those fees, we saw a decline of $29 or 34.0% in fees earned in 2009 as compared to 2008. We are willing to accept lower minimum balance fees in order to be more competitive for new deposits and to effectively compete with other institutions in our markets.
Mortgage loan originations were much stronger in 2009 than in the previous year and by selling the majority of those loans in the secondary market we were able to increase earnings on those sales by $448 or 292.8%. The majority of the loan originations were for refinances of mortgages not only from loans which we had previously originated but also from those that were previously originated by mortgage brokers, many of whom have either gone out of business or severely limited their operations as the economy deteriorated.
Investment security losses were $142, an increase of $114 or 407.1% in 2009 than in 2008. In the first quarter of 2009, we recognized a loss of $27 on an equity investment in a financial institution that was merged with another institution.
22
In the third quarter of 2009 we sold a corporate bond which had declined in credit quality and market value and partially offset this loss with the sale of two municipal bonds that had an increase in market value, with the net effect of those sales recognizing a net loss of $22 on these sales. In addition, we recognized a loss of $93 on the reorganization of the issuer of a corporate bond that was held in the corporate bond portfolio.
Brokerage commissions declined $117 or 19.0% in 2009 as compared to 2008. Declines in the market values of customers’ equity positions negatively affected the earnings of the investments department as their fee income is partially based on a percentage of the market value of customers’ investment portfolios. In addition, this department saw lower initial interest in customers’ willingness to invest in the stock market during this volatile economic period. We believe that activity will improve for this department in correlation to improvement in the national economy.
Other income increased $119 or 12.2% in 2009 over income in 2008. This category includes many sources of other than interest related items. The most notable of these was an increase of $62 or 17.2% in interchange fees related to the use of debit cards by our customers. In recent years management decided to offer debit cards to nearly all deposit customers with no internal fee attached to usage of the cards, thereby dramatically increasing the number of debit cards issued. We earn a small fee each time a customer uses the credit option for point of sale transactions and have seen a large increase in this income due to this strategy. Smaller changes in various income categories accounted for the remaining increased income.
Noninterest Expense
Salaries and employee benefits decreased $93 or 1.5% in 2009 as compared to 2008. Salaries and wages increased $174 or 3.9% in 2009 over the previous year and were mainly due to percentage wage increases. We tried to maintain staffing rather than hire additional staff as our income level declined during the year. Payroll incentives declined $330 or 82.7% in 2009 as compared to 2008 since these incentives are based on predetermined goals that were not attained in 2009. A 2% across the board incentive was approved for employees in 2009 as a portion of the goals set for the year were attained and management recognized that economic conditions hampered attainment of some goals. Employee benefits expense continued to increase during 2009 with $87 or 9.1% higher costs than the previous year. The primary increase was associated with an increase in the cost of medical insurance per employee along with a greater number of employees becoming eligible for benefits. Contributions to employees’ 401(k) plans decreased $54 or 17.9% in 2009 as compared to 2008 due to the level of profit sharing declining by 2%. The level of employer matching did not change but due to lower net income for the Company, the Board of Directors felt it appropriate to grant a smaller profit sharing benefit for the year. Smaller changes on other payroll expenses accounted for the remaining difference in 2009 as compared to 2008.
Occupancy expense increased $216 or 24.8% in 2009 as compared to 2008 due primarily to the added expenses of operating an additional branch during 2009. The Lake Region branch opened in December 2008 so we recognized the expense of operating that facility for the entire year 2009 as compared to one month in 2008.
Furniture and equipment expense increased $49 or 9.4% in 2009 as compared to 2008 with the primary component of the increase related to operation of the Lake Region branch for the entire year.
Data processing expenses increased $305 or 85.0% due to management’s decision to outsource this function in March 2009. By shifting this function we were able to utilize personnel for other electronic banking functions while offering the ability to grow the Company without capacity concerns.
The FDIC insurance assessment for 2009 increased $642 or 279.1% more than in 2008 as that federal agency needed additional funds to weather the economic storm of bank closings and the costs related to those closings. The sudden downturn in the national economy in 2008 resulted in an unprecedented number of bank closings in 2009, leading the FDIC to increase assessments in order to bring the insurance fund’s reserve ratio to the statutorily mandated minimum of 1.15% of insured deposits.
Other expense increased $174 or 7.8% from 2008 to 2009. This category encompasses all remaining expenses associated with the operation of a financial services company. The largest category of increase is in loss on the sale of other real estate which was $144 in 2009 as compared to $27 in 2008. In taking this loss, we were able to put $1,892 of assets back into the interest-earning category and cease to incur additional expenses in relation to ownership of those properties. Those ownership expenses were $63 in 2009 as compared to $18 of expenses in 2008. Telephone expenses
23
were $37 or 17.8% greater in 2009 than the previous year due to the addition of lines for the Lake Region branch and additional usage of all lines for the year. To partially offset those increases we curtailed some other operating expenses in 2009. The largest decline in expenses was in travel and entertainment expense. Travel expense to conferences and seminars was limited in 2009 while replacing several daily courier runs between offices serving to decrease this expense by $55 or 54.4% than in the previous year. The remaining increase was due to smaller changes in various other accounts, none of which are material alone.
Income Taxes
Income taxes decreased $1,194 or 43.5% primarily due to the decline in income before income taxes of $3,193 or 34.9% from 2008 to 2009 but also due to an increase in tax-exempt investments and loans during 2008 and 2009 which served to lower the effective tax rate to 26.1% from 30.1% in 2008.
2008 Compared to 2007
Net income for the year ended December 31, 2008 was $6,401, a decline of $211 or 3.2% from a year earlier. The year 2008 presented us with interest rate challenges greater than we have experienced in previous years. In addition, several expenses were higher due to increased operating costs in conjunction with the opening of our sixth branch in December 2008. The following discussion will address each area of the income statement.
Net Interest Income
Net interest income was $17,510, an increase of $160 or .9% over 2007 as declining interest rates reduced our cost of funds more rapidly than our interest income. This discussion regarding net interest income should be read in conjunction with the schedule Distribution of Assets, Liabilities and Stockholders’ Equity: Interest Rates and Interest Differential and Rate/Volume Analysis of Changes in Net Interest Income.
Interest income declined $1,776 or 5.9% ($1,651 or 5.5% on a tax-equivalent basis) in 2008 as compared to 2007 with interest rates decreasing throughout the year, ending with a total decline of 4.00% in the prime rate of interest at year end. Interest and fees earned on loans decreased $665 or 2.6% as these rates declined over the period. As can be seen in the above report, the average balances of loans increased by $34,413 or 10.6% while the average rate received on the portfolio declined to 7.08% from 8.04% one year earlier. The ratio of variable or adjustable rate loans included in our loan portfolio was 74.4% at December 31, 2008, with the majority of these loans tied to changes in the prime rate of interest. Most loans have a spread to the prime rate of between 25 and 250 basis points but lag actual market changes for up to two years. We expect to continue to see a decline in the average rates earned on the loan portfolio as the variable rate loans hit their repricing date and other loans mature and are replaced by loans at current market rates.
Interest earned on taxable investment securities declined $1,213 or 37.3% in 2008 as compared to 2007. The average balance of taxable investment securities, which declined $13,649 or 22.2%, contributed to a decrease of $720 of income. Declines in market interest rates contributed to the remainder of the decrease in taxable investment income since at the end of 2007 we had 55.5% of debt securities invested in short-term commercial paper with maturities of less than 90 days as compared to 31.4% of the these securities at the end of 2008. We have historically used these investments to complement our liquidity needs while receiving a better rate of interest as compared to other short-term investments. In light of credit quality issues that emerged during 2008 with many issuers of commercial paper, we decreased balances of these investments and increased investment in short-term highly rated corporate bonds, longer term municipal securities and in U.S. government agency bonds. This strategy increased the average balance of tax-exempt obligations of states and political subdivisions by $5,327 or 58.5% which accounted for $323 greater tax-equivalent income in 2008 while slightly higher interest rates added $46 to this income category.
Interest expense declined by $1,936 or 15.4% in 2008 as compared to 2007. Lower market interest rates accounted for $2,628 of the decrease with greater balances offsetting that decline by $692, resulting in total interest expense of $10,665 in 2008. Although we were not able to mirror changes in market interest rates throughout the year, we have decreased interest rates in every category by an average of 73 basis points. It was not possible to decrease the rates on lower costing liabilities in direct proportion to market rate declines because our rates were lower than the total rate of decline. In this regard, we will continue to see tightening of interest rate spread because rates are at historical lows. Management has been diligent in trying to attract as many noninterest-bearing deposits as possible and is continuing with this effort for 2009.
24
Provision for Loan Losses
The provision for loan losses declined $180 or 15.9% in 2008 as compared to 2007. Management calculates the appropriate balance for the allowance for loan losses to determine the annual provision expense. Many factors are considered in the calculation of the appropriate level for the allowance including information collected from the loan review process, current economic indicators both on a local and national level and the historical rate of delinquency for our loan portfolio along with other statistical and subjective information. In addition, the provision expense is affected by the amount of loans charged-off and recoveries of prior loan charge-offs the net amount of which was $926 in 2008. Included in this amount were loans of $642 to one commercial borrower which were charged-off, thereby decreasing the necessary balance in the analysis. At the level of expense in both 2008 and 2007, we believe that the balance of allowance for loan losses was appropriate.
Noninterest Income
Service charges on deposit accounts have historically been the largest contributor to noninterest income and continued to be in 2008. Fees generated from activities related to deposit accounts increased $55 or 3.4% in 2008 as compared to 2007. Fees charged in relation to overdrafts on checking accounts were $1,522 in 2008 compared to $1,467 in 2007. The fees charged for this privilege remained the same with greater use of this payment privilege in 2008 based on a greater number of accounts eligible for the service. We also believe that more difficult economic conditions have caused greater use of this privilege.
It was necessary to book an adjustment for an “other than temporary” decline in market value of a security in December 2008 due to the announced merger price. This adjustment was $25 and was in addition to a $3 loss incurred in the second quarter due to a merger.
Brokerage commissions increased $167 or 37.1% in 2008 as compared to 2007 with this department continuing to attract new customers and gather greater dollars under management. Declines in the market values of customers’ equity positions will negatively affect the earnings of this department as long as this economic climate continues. We believe that general economic conditions will also cause current and potential future clients to suspend investing. With this said, we expect a challenge in 2009 to meet the revenue level of 2008.
Noninterest Expense
Salaries and employee benefits increased $434 or 7.3% in 2008 as compared to 2007. The largest part of this increase was related to wages which increased $441 or 11.2%. Normal wage increases along with hiring additional staff during the year for the Lake Region branch which opened in December 2008 were the main reasons for the increase. We hired management staff in the first quarter of 2008 in order to assure that they would learn our policies and procedures along with our corporate culture before opening the branch. As the year progressed we hired the remaining staff, training these employees and utilizing them to fill vacancies on a part-time basis until their permanent jobs became available. Offsetting these increases, payroll incentives declined $106 or 21.0% in 2008 as compared to 2007. These incentives are based on predetermined goals that begin with return on equity. Several of the goals were not met in 2008, thereby lowering incentives paid to employees. Employee benefits increased $84 or 9.6% due to higher costs of medical insurance along with a greater number of employees who were eligible for benefits. In 2007 the Board of Directors granted a 6% profit sharing contribution due to the high level of performance in that year. Due to the performance level in 2008 they awarded 4% as had been the norm before 2006. This decrease accounted for $67 or 18.2% lower 401(k) expense in 2008 as compared to 2007. Due to adoption of Emerging Issues Task Force Issue 06-04 (“EITF 06-04”), Accounting for Deferred Compensation and Postretirement Benefit Aspects of Endorsement Split-Dollar Life Insurance Arrangements, as of January 1, 2008 we recorded $60 of expense in 2008 that was unmatched in 2007. Smaller changes on other payroll expenses accounted for the remaining difference in 2008 as compared to 2007.
Occupancy expense increased $75 or 9.4% in 2008 as compared to 2007 which is attributable to general price increases in all expense categories mainly in building maintenance expenses which increased $46 or 29.1% more than the year before. At the end of 2007 we hired a new cleaning service for three of our locations and paid more for their services to enhance the services received. This change accounted for $21 of this increase along with experiencing $14 more in relation to additional snow plowing required in 2008. Increases in the cost of utilities, real estate taxes and higher depreciation on improvements made in 2007 and 2008 accounted for the remaining increase.
25
Professional fees were $65 or 12.5% greater in 2008 than in 2007 due to use of an outside consultant hired to assist us to review processes and search for efficiencies along with converting to using outside vendors to process payroll and deliver deposit account monthly statements.
Other expense increased $463 or 23.3% from 2007 to 2008. This category encompasses all remaining expenses associated with the operation of a financial services company. FDIC insurance coverage expense increased $186 or 425.4% greater in 2008 than in 2007. The FDIC fees increased because the FDIC reinstated risk-based assessment rates in 2007 for which we were allowed to utilize a one-time credit in 2007 against the assessment. We had no remaining credit available in 2008 and therefore paid the entire assessment. FDIC insurance premiums are scheduled to increase substantially during 2009, in addition to a special assessment equal to 20 basis points of deposits at June 30, 2009 which we estimate will be approximately $800. Donations were $122 or 112.0% greater in 2008 than in 2007 mainly due to donations of $103 in conjunction with the Pennsylvania Educational Assistance Tax Credit Program for which we were not approved in 2007. The Bank receives a credit of 90% of the amounts donated under this program which is applied against the Pennsylvania tax liability. Expenses in relation to the operation of our ATM network increased $51 or 24.0% due to conversion to a new processor late in 2007 that offers additional capabilities. Also, we issued additional debit cards to new customers during the year; the fees associated with those cards are included in our ATM expense. Telephone costs increased $46 or 28.8% in 2008 as compared to 2007 due to conversion to a higher speed transmission service that combines the telephone system with computer communications to our branches. We also added new lines to the Lake Region branch in the fourth quarter of 2008. The remaining increase was due to smaller changes in various other accounts, none of which are material alone.
Income Taxes
Income taxes decreased $251 or 8.4% primarily due to the income before income taxes being $462 or 4.8% less in 2008 than in 2007. Investments during 2008 in tax-exempt municipal bonds and loans along with earnings on bank-owned life insurance augmented this decline by changing the effective tax rate to 30.1% from 31.2% in 2007.
MARKET PRICES OF STOCK/DIVIDENDS DECLARED
The Company’s stock is listed on the OTC Bulletin Board under the symbol “DIMC.” The book value per share at December 31, 2009 was $30.21, representing an increase of 5.9% over the 2008 book value of $28.53. There were approximately 731 shareholders of record at December 31, 2009. This number does not include persons or entities that hold their stock in nominee name through various brokerage firms.
The following table sets forth high and low sale prices per share of the common stock and dividends declared for the calendar quarters indicated, based upon information obtained from published sources:
| 2009 | 2008 | |||||||||||||||||
| High | Low | Dividend Declared |
High | Low | Dividend Declared | |||||||||||||
| First Quarter |
$ | 44.50 | $ | 31.00 | $ | .36 | $ | 48.00 | $ | 43.00 | $ | .32 | ||||||
| Second Quarter |
$ | 38.00 | $ | 32.00 | $ | .36 | $ | 48.75 | $ | 42.21 | $ | .32 | ||||||
| Third Quarter |
$ | 41.00 | $ | 35.85 | $ | .36 | $ | 46.50 | $ | 40.05 | $ | .32 | ||||||
| Fourth Quarter |
$ | 42.00 | $ | 31.00 | $ | .36 | $ | 43.00 | $ | 38.00 | $ | .36 | ||||||
The ability of the Company to pay dividends is dependent upon the ability of the Bank to pay dividends to the Company. The Bank is a depository institution insured by the FDIC and therefore it may not pay dividends or distribute capital assets if it is in default on any assessment due the FDIC. Additionally, the Bank is subject to certain state banking regulations that limit the ability of the Bank to pay dividends to the Company. Under Federal Reserve policy, the Company is required to maintain adequate regulatory capital and is expected to act as a source of financial strength to the Bank and to commit resources to support the Bank in circumstances where it might not do so absent such a policy. These regulations may have the effect of reducing the amount of future dividends declarable by the Company.
26
SUMMARY OF SELECTED FINANCIAL DATA
| 2009 | 2008 | 2007 | 2006 | 2005 | |||||||||||
| Summary of operations |
|||||||||||||||
| Interest income |
$ | 24,517 | $ | 28,175 | $ | 29,951 | $ | 24,646 | $ | 19,202 | |||||
| Interest expense |
$ | 8,750 | $ | 10,665 | $ | 12,601 | $ | 9,478 | $ | 6,118 | |||||
| Net interest income |
$ | 15,767 | $ | 17,510 | $ | 17,350 | $ | 15,168 | $ | 13,084 | |||||
| Provision for loan losses |
$ | 1,300 | $ | 950 | $ | 1,130 | $ | 785 | $ | 850 | |||||
| Net interest income after provision for |
$ | 14,467 | $ | 16,560 | $ | 16,220 | $ | 14,383 | $ | 12,234 | |||||
| Other income |
$ | 3,958 | $ | 3,764 | $ | 3,517 | $ | 3,156 | $ | 2,801 | |||||
| Other expenses |
$ | 12,471 | $ | 11,177 | $ | 10,128 | $ | 9,341 | $ | 8,498 | |||||
| Income before income taxes |
$ | 5,954 | $ | 9,147 | $ | 9,609 | $ | 8,198 | $ | 6,537 | |||||
| Income taxes |
$ | 1,552 | $ | 2,746 | $ | 2,997 | $ | 2,613 | $ | 2,082 | |||||
| Net income |
$ | 4,402 | $ | 6,401 | $ | 6,612 | $ | 5,585 | $ | 4,455 | |||||
| Per common share |
|||||||||||||||
| Earnings - basic |
$ | 2.82 | $ | 4.17 | $ | 4.34 | $ | 3.67 | $ | 2.89 | |||||
| Earnings - diluted |
$ | 2.79 | $ | 4.05 | $ | 4.18 | $ | 3.55 | $ | 2.80 | |||||
| Cash dividends |
$ | 1.44 | $ | 1.32 | $ | 1.19 | $ | 1.07 | $ | 1.01 | |||||
| Book value |
$ | 30.21 | $ | 28.53 | $ | 26.23 | $ | 23.17 | $ | 20.53 | |||||
| Shares outstanding at year end |
1,559,778 | 1,558,728 | 1,522,200 | 1,525,024 | 1,522,669 | ||||||||||
| Balance sheet data - end of year |
|||||||||||||||
| Total assets |
$ | 530,657 | $ | 472,478 | $ | 434,322 | $ | 403,577 | $ | 358,204 | |||||
| Loans |
$ | 410,012 | $ | 380,207 | $ | 344,758 | $ | 305,291 | $ | 283,562 | |||||
| Loans held for sale |
$ | - | $ | - | $ | - | $ | - | $ | 211 | |||||
| Investment securities: |
|||||||||||||||
| Available for sale |
$ | 73,628 | $ | 65,600 | $ | 66,739 | $ | 67,266 | $ | 54,129 | |||||
| Held to maturity |
$ | - | $ | - | $ | - | $ | - | $ | 199 | |||||
| Deposits |
$ | 443,116 | $ | 381,989 | $ | 364,600 | $ | 338,117 | $ | 294,856 | |||||
| Stockholders’ equity |
$ | 47,117 | $ | 44,468 | $ | 39,923 | $ | 35,337 | $ | 31,260 | |||||
| Performance |
|||||||||||||||
| Return on average assets |
.90% | 1.43% | 1.58% | 1.50% | 1.30% | ||||||||||
| Return on average equity |
9.58% | 15.28% | 17.54% | 16.80% | 14.53% | ||||||||||
| Dividend payout ratio |
51.06% | 31.65% | 27.42% | 29.16% | 34.95% | ||||||||||
| Average equity to average assets ratio |
9.34% | 9.35% | 8.99% | 8.93% | 8.92% | ||||||||||
27
MANAGEMENT’S ANNUAL REPORT ON INTERNAL CONTROL OVER FINANCIAL REPORTING
Management of the Company is responsible for establishing and maintaining adequate internal control over financial reporting as defined in Rules 13a-15(f) and 15d-15(f) under the Exchange Act. The Company’s internal control over financial reporting is designed to provide reasonable assurance regarding the reliability of financial reporting and the preparation of financial statements for external purposes in accordance with generally accepted accounting principles.
Because of its inherent limitations, internal control over financial reporting may not prevent or detect misstatements. Also, projections of any evaluation of effectiveness to future periods are subject to the risk that controls may become inadequate because of changes in conditions, or that the degree of compliance with the policies or procedures may deteriorate.
A material weakness is a significant deficiency (as defined in Public Company Accounting Oversight Board Auditing Standard No. 2), or a combination of significant deficiencies, that results in there being more than a remote likelihood that a material misstatement of the annual or interim financial statements will not be prevented or detected on a timely basis by management or employees in the normal course of performing their assigned functions.
Management assessed the effectiveness of the Company’s internal control over financial reporting as of December 31, 2009. In making this assessment, management used the criteria set forth by the Committee of Sponsoring Organizations of the Treadway Commission (COSO) in Internal Control-Integrated Framework. Based on this assessment, management believes that, as of December 31, 2009, the Company’s internal control over financial reporting was effective.
This annual report does not include an attestation report of the Company’s registered public accounting firm regarding internal control over financial reporting. Management’s report was not subject to attestation by the Company’s registered public accounting firm pursuant to temporary rules of the Securities and Exchange Commission that permit the Company to provide only management’s report in this annual report.
|
|
| By: Gary C. Beilman |
| President and Chief Executive Officer |
| (Principal Executive Officer) |
| Date: March 12, 2010 |
|
|
| By: Maureen H. Beilman |
| Chief Financial Officer |
| (Principal Financial & Accounting Officer) |
| Date: March 12, 2010 |


28

REPORT OF INDEPENDENT REGISTERED PUBLIC ACCOUNTING FIRM
The Board of Directors and Stockholders
Dimeco, Inc.
We have audited the consolidated balance sheet of Dimeco, Inc. and subsidiary as of December 31, 2009 and 2008, and the related consolidated statements of income, changes in stockholders’ equity, and cash flows for each of the three years in the period ended December 31, 2009. These financial statements are the responsibility of the Company’s management. Our responsibility is to express an opinion on these financial statements based on our audits.
We conducted our audits in accordance with the standards of the Public Company Accounting Oversight Board (United States). Those standards require that we plan and perform the audit to obtain reasonable assurance about whether the financial statements are free of material misstatement. An audit includes examining, on a test basis, evidence supporting the amounts and disclosures in the financial statements. An audit also includes assessing the accounting principles used and significant estimates made by management, as well as evaluating the overall financial statement presentation. We believe that our audits provide a reasonable basis for our opinion.
In our opinion, the consolidated financial statements referred to above present fairly, in all material respects, the financial position of Dimeco, Inc. and subsidiary as of December 31, 2009 and 2008, and the consolidated results of their operations and their cash flows for each of the three years in the period ended December 31, 2009, in conformity with U.S. generally accepted accounting principles.
As discussed in Note 1 to the consolidated financial statements, effective January 1, 2008, the Company adopted Emerging Issues Task Force No. 06-4, Accounting for Deferred Compensation and Post-retirement Benefit Aspects of Endorsement Split Dollar Life Insurance Arrangements. This guidance was subsequently codified into Financial Accounting Standards Board ASC Topic 715-60, Compensation - Retirement Benefits.
We were not engaged to examine management’s assertion about the effectiveness of the Company’s internal control over financial reporting as of December 31, 2009, included in the accompanying Management’s Report on Internal Control over Financial Reporting and, accordingly, we do not express an opinion thereon.
|
|
| Wexford, Pennsylvania |
| March 12, 2010 |

S.R. Snodgrass, A.C. 2100 Corporate Drive, Suite 400 Wexford, PA 15090-7647 Phone: 724-934-0344 Facsimile: 724-934-0345
29
CONSOLIDATED BALANCE SHEET
| December 31, | ||||||
| (In thousands) | 2009 | 2008 | ||||
| Assets |
||||||
| Cash and due from banks |
$ | 3,991 | $ | 3,625 | ||
| Interest-bearing deposits in other banks |
14,296 | 368 | ||||
| Federal funds sold |
3,000 | - | ||||
| Total cash and cash equivalents |
21,287 | 3,993 | ||||
| Investment securities available for sale |
73,628 | 65,600 | ||||
| Loans (net of unearned income of $101 and $272) |
410,012 | 380,207 | ||||
| Less allowance for loan losses |
6,253 | 5,416 | ||||
| Net loans |
403,759 | 374,791 | ||||
| Premises and equipment |
10,965 | 10,880 | ||||
| Accrued interest receivable |
1,842 | 2,050 | ||||
| Bank-owned life insurance |
9,175 | 8,535 | ||||
| Other real estate owned |
389 | 1,955 | ||||
| Prepaid FDIC insurance |
2,309 | - | ||||
| Other assets |
7,303 | 4,674 | ||||
| TOTAL ASSETS |
$ | 530,657 | $ | 472,478 | ||
| Liabilities |
||||||
| Deposits: |
||||||
| Noninterest-bearing |
$ | 39,687 | $ | 37,626 | ||
| Interest-bearing |
403,429 | 344,363 | ||||
| Total deposits |
443,116 | 381,989 | ||||
| Short-term borrowings |
10,974 | 16,671 | ||||
| Other borrowed funds |
24,402 | 24,298 | ||||
| Accrued interest payable |
1,080 | 1,158 | ||||
| Other liabilities |
3,968 | 3,894 | ||||
| TOTAL LIABILITIES |
483,540 | 428,010 | ||||
| Stockholders’ Equity |
||||||
| Common stock, $.50 par value; 5,000,000 shares authorized; |
807 | 806 | ||||
| Capital surplus |
5,552 | 5,516 | ||||
| Retained earnings |
42,318 | 40,160 | ||||
| Accumulated other comprehensive income |
507 | 18 | ||||
| Treasury stock, at cost (54,100 and 53,100 shares) |
(2,067) | (2,032) | ||||
| TOTAL STOCKHOLDERS’ EQUITY |
47,117 | 44,468 | ||||
| TOTAL LIABILITIES AND STOCKHOLDERS’ EQUITY |
$ | 530,657 | $ | 472,478 | ||
The accompanying notes are an integral part of these consolidated financial statement.
30
CONSOLIDATED STATEMENT OF INCOME
| Year Ended December 31, | |||||||||
| (In thousands, except per share data) | 2009 | 2008 | 2007 | ||||||
| Interest Income |
|||||||||
| Interest and fees on loans |
$ | 22,366 | $ | 25,442 | $ | 26,107 | |||
| Interest-bearing deposits in other banks |
12 | 22 | 30 | ||||||
| Federal funds sold |
7 | 67 | 201 | ||||||
| Investment securities: |
|||||||||
| Taxable |
1,194 | 2,036 | 3,249 | ||||||
| Exempt from federal income tax |
938 | 608 | 364 | ||||||
| Total interest income |
24,517 | 28,175 | 29,951 | ||||||
| Interest Expense |
|||||||||
| Deposits |
7,531 | 9,503 | 11,477 | ||||||
| Short-term borrowings |
122 | 237 | 349 | ||||||
| Other borrowed funds |
1,097 | 925 | 775 | ||||||
| Total interest expense |
8,750 | 10,665 | 12,601 | ||||||
| Net Interest Income |
15,767 | 17,510 | 17,350 | ||||||
| Provision for loan losses |
1,300 | 950 | 1,130 | ||||||
| Net Interest Income After Provision for |
14,467 | 16,560 | 16,220 | ||||||
| Noninterest Income |
|||||||||
| Service charges on deposit accounts |
1,497 | 1,662 | 1,607 | ||||||
| Mortgage loans held for sale gains, net |
601 | 153 | 154 | ||||||
| Investment securities losses |
(142) | (28) | - | ||||||
| Brokerage commissions |
500 | 617 | 450 | ||||||
| Earnings on bank-owned life insurance |
408 | 385 | 355 | ||||||
| Other income |
1,094 | 975 | 951 | ||||||
| Total noninterest income |
3,958 | 3,764 | 3,517 | ||||||
| Noninterest Expense |
|||||||||
| Salaries and employee benefits |
6,303 | 6,396 | 5,962 | ||||||
| Occupancy expense, net |
1,087 | 871 | 796 | ||||||
| Furniture and equipment expense |
569 | 520 | 525 | ||||||
| Professional fees |
585 | 584 | 519 | ||||||
| Data processing expense |
664 | 359 | 342 | ||||||
| FDIC insurance |
872 | 230 | 44 | ||||||
| Other expense |
2,391 | 2,217 | 1,940 | ||||||
| Total noninterest expense |
12,471 | 11,177 | 10,128 | ||||||
| Income before income taxes |
5,954 | 9,147 | 9,609 | ||||||
| Income taxes |
1,552 | 2,746 | 2,997 | ||||||
| NET INCOME |
$ | 4,402 | $ | 6,401 | $ | 6,612 | |||
| Earnings Per Share: |
|||||||||
| Basic |
$ | 2.82 | $ | 4.17 | $ | 4.34 | |||
| Diluted |
$ | 2.79 | $ | 4.05 | $ | 4.18 | |||
The accompanying notes are an integral part of these consolidated financial statements.
31
CONSOLIDATED STATEMENT OF CHANGES IN STOCKHOLDERS' EQUITY
| (In thousands, except per share data) | Common Stock |
Capital Surplus |
Retained Earnings |
Accumulated Other Comprehensive Income (Loss) |
Treasury Stock |
Total Stockholders’ Equity |
Comprehensive Income | ||||||||||||||
| Balance, December 31, 2006 |
$ | 784 | $ | 4,775 | $ | 31,355 | $ | (35) | $ | (1,542) | $ | 35,337 | |||||||||
| Net income |
6,612 | 6,612 | $ | 6,612 | |||||||||||||||||
| Other comprehensive income: |
|||||||||||||||||||||
| Unrealized gain on available for sale securities, net of tax expense of $38 |
72 | 72 | 72 | ||||||||||||||||||
| Comprehensive income |
$ | 6,684 | |||||||||||||||||||
| Purchase of treasury stock (10,100 shares) |
(490) | (490) | |||||||||||||||||||
| Exercise of stock options (7,276 shares) |
4 | 203 | 207 | ||||||||||||||||||
| Cash dividends ($1.19 per share) |
(1,815) | (1,815) | |||||||||||||||||||
| Balance, December 31, 2007 |
788 | 4,978 | 36,152 | 37 | (2,032) | 39,923 | |||||||||||||||
| Net income |
6,401 | 6,401 | $ | 6,401 | |||||||||||||||||
| Other comprehensive loss: |
|||||||||||||||||||||
| Unrealized loss on available for sale securities, net of tax benefit of $10 |
(19) | (19) | (19) | ||||||||||||||||||
| Comprehensive income |
$ | 6,382 | |||||||||||||||||||
| Exercise of stock options (36,528 shares) |
18 | 538 | 556 | ||||||||||||||||||
| Cumulative effect of change in accounting for split dollar life insurance arrangements |
(358) | (358) | |||||||||||||||||||
| Cash dividends ($1.32 per share) |
(2,035) | (2,035) | |||||||||||||||||||
| Balance, December 31, 2008 |
806 | 5,516 | 40,160 | 18 | (2,032) | 44,468 | |||||||||||||||
| Net income |
4,402 | 4,402 | $ | 4,402 | |||||||||||||||||
| Other comprehensive income: |
|||||||||||||||||||||
| Unrealized gain on available for sale securities, net of tax expense of $252 |
489 | 489 | 489 | ||||||||||||||||||
| Comprehensive income |
$ | 4,891 | |||||||||||||||||||
| Exercise of stock options (2,050 shares) |
1 | 36 | 37 | ||||||||||||||||||
| Purchase of treasury stock (1,000 shares) |
(35) | (35) | |||||||||||||||||||
| Cash dividends ($1.44 per share) |
(2,244) | (2,244) | |||||||||||||||||||
| Balance, December 31, 2009 |
$ | 807 | $ | 5,552 | $ | 42,318 | $ | 507 | $ | (2,067) | $ | 47,117 | |||||||||
| 2009 | 2008 | 2007 | |||||||||||||||||||
| Components of other comprehensive income (loss): |
|||||||||||||||||||||
| Change in net unrealized gain (loss) on investment securities available for sale |
$ | 583 | $ | (37) | $ | 72 | |||||||||||||||
| Realized loss included in net income, net of tax benefit of $48, $10 and $0 |
94 | 18 | — | ||||||||||||||||||
| Total |
$ | 489 | $ | (19) | $ | 72 | |||||||||||||||
The accompanying notes are an integral part of these consolidated financial statements.
32
CONSOLIDATED STATEMENT OF CASH FLOWS
| Year Ended December 31, | |||||||||
| (In thousands) | 2009 | 2008 | 2007 | ||||||
| Operating Activities |
|||||||||
| Net income |
$ | 4,402 | $ | 6,401 | $ | 6,612 | |||
| Adjustments to reconcile net income to net cash provided by operating activities: |
|||||||||
| Provision for loan losses |
1,300 | 950 | 1,130 | ||||||
| Depreciation and amortization |
1,138 | 726 | 705 | ||||||
| Amortization of premium and discount on investment securities, net |
(217) | (975) | (2,146) | ||||||
| Amortization of net deferred loan origination fees |
(153) | (144) | (169) | ||||||
| Investment securities losses |
142 | 28 | - | ||||||
| Origination of loans held for sale |
(24,773) | (8,059) | (8,028) | ||||||
| Proceeds from sale of loans |
25,374 | 8,212 | 8,182 | ||||||
| Mortgage loans sold gains, net |
(601) | (153) | (154) | ||||||
| (Increase) decrease in accrued interest receivable |
208 | (84) | (168) | ||||||
| Increase (decrease) in accrued interest payable |
(78) | (533) | 263 | ||||||
| Deferred federal income taxes |
(338) | 4 | (414) | ||||||
| Earnings on bank-owned life insurance |
(408) | (385) | (355) | ||||||
| Prepayment of FDIC insurance |
(2,309) | - | - | ||||||
| Other, net |
(810) | 796 | (274) | ||||||
| Net cash provided by operating activities |
2,877 | 6,784 | 5,184 | ||||||
| Investing Activities |
|||||||||
| Investment securities available for sale: |
|||||||||
| Proceeds from sales or merger |
1,262 | 2 | - | ||||||
| Proceeds from maturities or paydown |
194,694 | 286,897 | 295,220 | ||||||
| Purchases |
(202,168) | (284,843) | (292,436) | ||||||
| Redemption of Federal Home Loan Bank stock |
- | 1,176 | 797 | ||||||
| Purchase of Federal Home Loan Bank stock |
(66) | (1,670) | (1,063) | ||||||
| Net increase in loans |
(29,380) | (38,396) | (39,505) | ||||||
| Investment in limited partnership |
(2,729) | - | - | ||||||
| Purchase of bank-owned life insurance |
(279) | - | (2,000) | ||||||
| Proceeds of sale of other real estate owned |
687 | 182 | - | ||||||
| Purchase of premises and equipment |
(896) | (5,033) | (1,189) | ||||||
| Net cash used for investing activities |
(38,875) | (41,685) | (40,176) | ||||||
| Financing Activities |
|||||||||
| Net increase in deposits |
61,127 | 17,389 | 26,483 | ||||||
| Increase (decrease) in short-term borrowings |
(2,697) | 8,461 | (4,495) | ||||||
| Proceeds from other borrowed funds |
1,850 | 7,872 | 6,900 | ||||||
| Repayment of other borrowed funds |
(4,746) | (1,235) | (3,002) | ||||||
| Purchase of treasury stock |
(35) | - | (490) | ||||||
| Proceeds from exercise of stock options |
37 | 556 | 207 | ||||||
| Cash dividends paid |
(2,244) | (1,961) | (1,770) | ||||||
| Net cash provided by financing activities |
53,292 | 31,082 | 23,833 | ||||||
| Increase (decrease) in cash and cash equivalents |
17,294 | (3,819) | (11,159) | ||||||
| Cash and cash equivalents at beginning of year |
3,993 | 7,812 | 18,971 | ||||||
| Cash and cash equivalents at end of year |
$ | 21,287 | $ | 3,993 | $ | 7,812 | |||
The accompanying notes are an integral part of these consolidated financial statements.
33
NOTES TO CONSOLIDATED FINANCIAL STATEMENTS
NOTE 1 - SUMMARY OF SIGNIFICANT ACCOUNTING POLICIES
A summary of the significant accounting and reporting policies applied in the presentation of the accompanying financial statements follows:
Nature of Operations and Basis of Presentation
Dimeco, Inc. (the “Company”) is a Pennsylvania company organized as the holding company of The Dime Bank (the “Bank”) and its wholly owned subsidiary, TDB Insurance Services, LLC. The Bank is a state-chartered bank and operates from six locations in northeastern Pennsylvania. The Company and its subsidiary derive substantially all of their income from banking and bank-related services that include interest earnings on residential real estate, commercial mortgage, commercial, and consumer financings as well as interest earnings on investment securities. The Company, through its subsidiary, provides deposit services including checking, savings and certificate of deposit accounts and investment and trust services. The Company is supervised by the Federal Reserve Board, while the Bank is subject to regulation and supervision by the Federal Deposit Insurance Corporation (“FDIC”) and the Pennsylvania Department of Banking.
The consolidated financial statements of the Company include its wholly owned subsidiary, the Bank. All inter-company items have been eliminated in preparing the consolidated financial statements. The investment in subsidiary on the parent company financial statements is carried at the parent company’s equity in the underlying net assets of the Bank.
The financial statements have been prepared in conformity with U.S. generally accepted accounting principles. In preparing the financial statements, management is required to make estimates and assumptions that affect the reported amounts of assets and liabilities as of the balance sheet date and revenues and expenses for the period. Actual results could differ significantly from those estimates.
Investment Securities
Investment securities are classified at the time of purchase, based on management’s intention and ability, as securities held to maturity or securities available for sale. Debt and equity securities have been classified as available for sale to serve principally as a source of liquidity. Unrealized holding gains and losses for available for sale securities are reported as a separate component of stockholders’ equity, net of tax, until realized. Realized securities gains and losses are computed using the specific identification method. Interest and dividends on investment securities are recognized as income when earned.
Common stock of the Federal Home Loan Bank (“FHLB”) and the Atlantic Central Bankers Bank represents ownership in institutions that are wholly owned by other financial institutions. These securities are accounted for at cost and are classified with other assets.
Securities are periodically reviewed for other than temporary impairment based upon a number of factors. Those factors include, but are not limited to, the length of time and extent to which the market value has been less than cost, the financial condition of the underlying issuer, the ability of the issuer to meet contractual obligations, the likelihood of the security’s ability to recover any decline in its market value and whether management intends to sell and their belief that they will not be required to sell these securities before recovery of their cost basis, which may be at maturity. A decline in value that is considered to be other than temporary is recorded as a loss within noninterest income in the Consolidated Statement of Income.
34
NOTE 1 - SUMMARY OF SIGNIFICANT ACCOUNTING POLICIES (continued)
Mortgage Loans Held for Sale
In general, fixed rate residential mortgage loans originated by the Bank that qualify for sale in the secondary market are held for sale and are carried at the aggregate lower of cost or market. Such loans sold are generally serviced by the Bank.
Loans
Loans are stated at the principal amount outstanding, net of any unearned income, deferred loan fees, and the allowance for loan losses. Interest on consumer loans is credited to operations over the term of each loan using a method which results in a level yield or the simple interest method. Interest income on mortgage loans is accrued on the amortized balance. Interest income on other loans is accrued on the principal amount outstanding. Loan fees which represent an adjustment to interest yield are deferred and amortized over the life of the loan. Loans on which the accrual of interest has been discontinued are designated as nonaccrual loans. Accrual of interest on loans is generally discontinued when it is determined that a reasonable doubt exists as to the collectibility of additional interest. When a loan is placed on nonaccrual status, unpaid interest is charged against income. Payments received on nonaccrual loans are either applied to principal or reported as interest income according to management’s judgment as to the collectibility of principal. Loans are returned to accrual status when past due interest is collected and the collection of principal is probable.
Allowance for Loan Losses
The allowance for loan losses represents the amount which management estimates is adequate to provide for probable losses inherent in its loan portfolio, as of the balance sheet date. The allowance method is used in providing for loan losses. Accordingly, all loan losses are charged to the allowance, and all recoveries are credited to it. The allowance for loan losses is established through a provision for loan losses charged to operations. The provision for loan losses is based on management’s periodic evaluation of individual loans, economic factors, past loan loss experience, changes in the composition and volume of the portfolio, and other relevant factors. The estimates used in determining the adequacy of the allowance for loan losses, including the amounts and timing of future cash flows expected on impaired loans, are particularly susceptible to changes in the near term.
Impaired loans are commercial and commercial real estate loans for which it is probable that the Company will not be able to collect all amounts due according to the contractual terms of the loan agreement. The Company individually evaluates such loans for impairment and does not aggregate loans by major risk classifications. The definition of “impaired loans” is not the same as the definition of “nonaccrual loans,” although the two categories overlap. The Company may choose to place a loan on nonaccrual status due to payment delinquency or uncertain collectability, while not classifying the loan as impaired if the loan is not a commercial or commercial real estate loan. Factors considered by management in determining impairment include payment status and collateral value. The amount of impairment for these types of impaired loans is determined by the difference between the present value of the expected cash flows related to the loan, using the original interest rate, and its recorded value, or as a practical expedient in the case of collateralized loans, the difference between the fair value of the collateral and the recorded amount of the loans. When foreclosure is probable, impairment is measured based on the fair value of the collateral.
Mortgage loans on one-to-four family properties and all consumer loans are large groups of smaller-balance homogeneous loans and are measured for impairment collectively. Loans that experience insignificant payment delays, which are defined as 90 days or less, generally are not classified as impaired. Management determines the significance of payment delays on a case-by-case basis taking into consideration all of the circumstances surrounding the loan and the borrower including the length of the delay, the borrower’s prior payment record, and the amount of shortfall in relation to the principal and interest owed.
35
NOTE 1 - SUMMARY OF SIGNIFICANT ACCOUNTING POLICIES (continued)
Premises and Equipment
Premises and equipment are stated at cost less accumulated depreciation. Depreciation is principally computed on the straight-line method over the estimated useful lives of the related assets, which range from 3 to 20 years for furniture and equipment and 5 to 31 years for office buildings and improvements. Leasehold improvements are amortized over the shorter of their estimated useful lives or their respective lease terms, which range from 5 to 20 years. Expenditures for maintenance and repairs are charged against income as incurred. Costs of major additions and improvements are capitalized.
Bank-Owned Life Insurance (“BOLI”)
The Company owns insurance on the lives of a certain group of key employees. The policies were purchased to help offset the increase in the costs of various fringe benefit plans including healthcare. The cash surrender value of these policies is included as an asset on the consolidated statements of financial condition, and any increases in cash surrender value are recorded as noninterest income on the consolidated statement of income. In the event of the death of an insured individual under these policies, the Company would receive a death benefit which would be recorded as noninterest income.
Other Real Estate
Real estate acquired by foreclosure is classified on the Consolidated Balance Sheet at the lower of the recorded investment in the property or its fair value minus estimated costs of sale. Prior to foreclosure, the value of the underlying collateral is written down by a charge to the allowance for loan losses, if necessary. Any subsequent write-downs are charged against operating expenses. Operating expenses of such properties, net of related income and losses on their disposition, are included as other expense.
Income Taxes
The Company and the Bank file a consolidated federal income tax return. Deferred tax assets or liabilities are computed based on the difference between the financial statement and the income tax basis of assets and liabilities using the enacted marginal tax rates. Deferred income tax expenses or benefits are based on the changes in the deferred tax asset or liability from period to period.
Earnings Per Share
The Company provides dual presentation of basic and diluted earnings per share. Basic earnings per share are calculated utilizing net income as reported as the numerator and average shares outstanding as the denominator. The computation of diluted earnings per share differs in that the dilutive effects of any options are adjusted for in the denominator.
Stock Options
The Company accounts for stock-based compensation issued to employees, and where appropriate non-employees, in accordance with FASB ASC 718, Compensation – Stock Compensation. Under fair value provisions , stock-based compensation cost is measured at the grant date based on the fair value of the award and is recognized as expense over the appropriate vesting period using the straight-line method. The amount of stock-based compensation recognized at any date must at least equal the portion of the grant date fair value of the award that is vested at that date and as a result it may be necessary to recognize the expense using a ratable method. Determining the fair value of stock-based awards at the date of grant requires judgment, including estimating the expected term of the stock options and the expected volatility of the Company’s stock. In addition, judgment is required in estimating the amount of stock-based awards that are expected to be forfeited. If actual results differ significantly from these estimates or different key assumptions were used, it could have a material effect on the Company’s Consolidated Financial Statements.
36
NOTE 1 - SUMMARY OF SIGNIFICANT ACCOUNTING POLICIES (continued)
For 2009, 2008 and 2007, the Company did not recognize any compensation expense as all outstanding options were vested at January 1, 2006.
Mortgage Servicing Rights (“MSRs”)
The Company has agreements for the express purpose of selling loans in the secondary market. The Company maintains servicing rights for most of these loans. Originated MSRs are recorded by allocating total costs incurred between the loan and servicing rights based on their relative fair values. MSRs are amortized in proportion to the estimated servicing income over the estimated life of the servicing portfolio. MSRs are a component of other assets on the Consolidated Balance Sheet.
Comprehensive Income
The Company is required to present comprehensive income in a full set of general-purpose financial statements for all periods presented. Other comprehensive income is composed of unrealized holding gains (losses) on the available for sale securities portfolio. The Company has elected to report the effects of other comprehensive income as part of the Consolidated Statement of Changes in Stockholders’ Equity.
Endorsement Split-Dollar Life Insurance Arrangements
On January 1, 2008, the Company changed its accounting policy and recognized a cumulative-effect adjustment to retained earnings totaling $358,000 related to accounting for certain endorsement split-dollar life insurance arrangements in connection with the adoption of Emerging Issues Task Force Issue No. 06-4, Accounting for Deferred Compensation and Postretirement Benefit Aspects of Endorsement Split Dollar Life Insurance Arrangements.
Cash Flows
The Company has defined cash and cash equivalents as cash and due from banks, interest-bearing deposits in other banks, and federal funds sold that have original maturities of 90 days or less.
Amounts paid for interest and income taxes and noncash activities are as follows (in thousands):
| 2009 | 2008 | 2007 | |||||||
| Cash paid during the year for: |
|||||||||
| Interest |
$ | 8,828 | $ | 11,198 | $ | 12,338 | |||
| Income taxes |
$ | 1,575 | $ | 2,745 | $ | 3,539 | |||
| Noncash investing activities: |
|||||||||
| Transfer of loans to other real estate |
$ | - | $ | 1,955 | $ | - | |||
| Transfer of other real estate to loans |
$ | 1,125 | $ | - | $ | - | |||
| Changes in unrealized holding gains and losses on available for sale securities |
$ | 741 | $ | (30) | $ | 110 | |||
| Investment purchases not settled |
$ | 1,000 | $ | 1,196 | $ | - | |||
37
NOTE 1 - SUMMARY OF SIGNIFICANT ACCOUNTING POLICIES (continued)
Recent Accounting Pronouncements
In June 2009, the Financial Accounting Standards Board (“FASB”) issued Accounting Standards Update (“ASU”) No. 2009-01, Topic 105 - Generally Accepted Accounting Principles - FASB Accounting Standards Codification™ and the Hierarchy of Generally Accepted Accounting Principles. The Codification is the single source of authoritative nongovernmental U.S. generally accepted accounting principles (GAAP). The Codification does not change current GAAP, but is intended to simplify user access to all authoritative GAAP by providing all the authoritative literature related to a particular topic in one place. Rules and interpretive releases of the SEC under federal securities laws are also sources of authoritative GAAP for SEC registrants. The Company adopted this standard for the interim reporting period ending September 30, 2009. The adoption of this standard did not have a material impact on the Company’s results of operations or financial position.
In September 2006, the FASB issued an accounting standard related to fair value measurements, which was effective for the Company on January 1, 2008. This standard defined fair value, established a framework for measuring fair value, and expanded disclosure requirements about fair value measurements. On January 1, 2008, the Company adopted this accounting standard related to fair value measurements for the Company’s financial assets and financial liabilities. The Company deferred adoption of this accounting standard related to fair value measurements for the Company’s nonfinancial assets and nonfinancial liabilities, except for those items recognized or disclosed at fair value on an annual or more frequently recurring basis, until January 1, 2009. The adoption of this accounting standard related to fair value measurements for the Company’s nonfinancial assets and nonfinancial liabilities had no impact on retained earnings and is not expected to have a material impact on the Company’s statements of income and condition. This accounting standard was subsequently codified into ASC Topic 820, Fair Value Measurements and Disclosures. See Notes 15 and 16 for the necessary disclosures.
In December 2007, the FASB issued an accounting standard related to noncontrolling interests in consolidated financial statements, which is effective for fiscal years beginning on or after December 15, 2008. This standard establishes accounting and reporting standards for the noncontrolling interest in a subsidiary and for the deconsolidation of a subsidiary. It clarifies that a noncontrolling interest in a subsidiary, which is sometimes referred to as minority interest, is an ownership interest in the consolidated entity that should be reported as equity in the consolidated financial statements. Among other requirements, this statement requires consolidated net income to be reported at amounts that include the amounts attributable to both the parent and the noncontrolling interest. It also requires disclosure, on the face of the consolidated income statement, of the amounts of consolidated net income attributable to the parent and to the noncontrolling interest. This accounting standard was subsequently codified into ASC 810-10, Consolidation. The adoption of this new guidance did not have a material effect on the Company’s results of operations or financial position.
On April 1, 2009, the FASB issued new authoritative accounting guidance under ASC Topic 805, Business Combinations, which became effective for periods beginning after December 15, 2008. ASC Topic 805 applies to all transactions and other events in which one entity obtains control over one or more other businesses. ASC Topic 805 requires an acquirer, upon initially obtaining control of another entity, to recognize the assets, liabilities and any non-controlling interest in the acquiree at fair value as of the acquisition date. Contingent consideration is required to be recognized and measured at fair value on the date of acquisition rather than at a later date when the amount of that consideration may be determinable beyond a reasonable doubt. This fair value approach replaces the cost-allocation process required under previous accounting guidance whereby the cost of an acquisition was allocated to the individual assets acquired and liabilities assumed based on their estimated fair value. ASC Topic 805 requires acquirers to expense acquisition-related costs as incurred rather than allocating such costs to the assets acquired and liabilities assumed, as was previously the case under prior accounting guidance. Assets acquired and liabilities assumed in a business combination that arise from contingencies are to be recognized at fair value if fair value can be reasonably estimated. If fair value of such an asset or liability cannot be reasonably estimated, the asset or liability would generally be recognized in accordance with ASC Topic 450, Contingencies.
38
NOTE 1 - SUMMARY OF SIGNIFICANT ACCOUNTING POLICIES (continued)
Recent Accounting Pronouncements
Under ASC Topic 805, the requirements of ASC Topic 420, Exit or Disposal Cost Obligations, would have to be met in order to accrue for a restructuring plan in purchase accounting. Pre-acquisition contingencies are to be recognized at fair value, unless it is a non-contractual contingency that is not likely to materialize, in which case, nothing should be recognized in purchase accounting and, instead, that contingency would be subject to the probable and estimable recognition criteria of ASC Topic 450, Contingencies. The adoption of this new guidance did not have a material impact on the Company’s financial position or results of operations.
In June 2008, the FASB issued accounting guidance related to determining whether instruments granted in share-based payment transactions are participating securities, which is effective for financial statements issued for fiscal years beginning after December 15, 2008, and interim periods within those years. This guidance clarified that instruments granted in share-based payment transactions can be participating securities prior to the requisite service having been rendered. A basic principle of this guidance is that unvested share-based payment awards that contain nonforfeitable rights to dividends or dividend equivalents (whether paid or unpaid) are participating securities and are to be included in the computation of EPS pursuant to the two-class method. All prior-period EPS data presented (including interim financial statements, summaries of earnings, and selected financial data) are required to be adjusted retrospectively to conform with this guidance. This accounting guidance was subsequently codified into ASC Topic 260, Earnings Per Share. The adoption of this standard did not have a material effect on the Company’s results of operations or financial position.
In April 2009, the FASB issued new guidance impacting ASC Topic 820, Fair Value Measurements and Disclosures. This ASC provides additional guidance in determining fair values when there is no active market or where the price inputs being used represent distressed sales. It reaffirms the need to use judgment to ascertain if a formerly active market has become inactive and in determining fair values when markets have become inactive. The adoption of this new guidance did not have a material effect on the Company’s results of operations or financial position.
In April 2009, the FASB issued new guidance impacting ASC 825-10-50, Financial Instruments, which relates to fair value disclosures for any financial instruments that are not currently reflected on the balance sheet of companies at fair value. This guidance amended existing GAAP to require disclosures about fair value of financial instruments for interim reporting periods of publicly traded companies as well as in annual financial statements. This guidance is effective for interim and annual periods ending after June 15, 2009. The Company has presented the necessary disclosures in Note 16 herein.
In April 2009, the FASB issued new guidance impacting ASC 320-10, Investments - Debt and Equity Securities, which provides additional guidance designed to create greater clarity and consistency in accounting for and presenting impairment losses on securities. This guidance is effective for interim and annual periods ending after June 15, 2009. The Company has presented the necessary disclosures in Note 3 herein.
In June 2009, the FASB issued an accounting standard related to the accounting for transfers of financial assets, which is effective for fiscal years beginning after November 15, 2009, and interim periods within those fiscal years. This standard enhances reporting about transfers of financial assets, including securitizations, and where companies have continuing exposure to the risks related to transferred financial assets. This standard eliminates the concept of a “qualifying special-purpose entity” and changes the requirements for derecognizing financial assets. This standard also requires additional disclosures about all continuing involvements with transferred financial assets including information about gains and losses resulting from transfers during the period. This accounting standard was subsequently codified into ASC Topic 860. The adoption of this standard is not expected to have a material effect on the Company’s results of operations or financial position.
39
NOTE 1 - SUMMARY OF SIGNIFICANT ACCOUNTING POLICIES (continued)
Recent Accounting Pronouncements (continued)
In June 2009, the FASB issued new authoritative accounting guidance under ASC Topic 810, Consolidation, which amends prior guidance to change how a company determines when an entity that is insufficiently capitalized or is not controlled through voting (or similar rights) should be consolidated. The determination of whether a company is required to consolidate an entity is based on, among other things, an entity’s purpose and design and a company’s ability to direct the activities of the entity that most significantly impact the entity’s economic performance. The new authoritative accounting guidance requires additional disclosures about the reporting entity’s involvement with variable-interest entities and any significant changes in risk exposure due to that involvement as well as its affect on the entity’s financial statements. The new authoritative accounting guidance under ASC Topic 810 will be effective January 1, 2010 and is not expected to have a significant impact on the Company’s financial statements.
In August 2009, the FASB issued ASU No. 2009-05, Fair Value Measurements and Disclosures (Topic 820) – Measuring Liabilities at Fair Value. This ASU provides amendments for fair value measurements of liabilities. It provides clarification that in circumstances in which a quoted price in an active market for the identical liability is not available, a reporting entity is required to measure fair value using one or more techniques. ASU 2009-05 also clarifies that when estimating a fair value of a liability, a reporting entity is not required to include a separate input or adjustment to other inputs relating to the existence of a restriction that prevents the transfer of the liability. ASU 2009-05 is effective for the first reporting period (including interim periods) beginning after issuance or fourth quarter 2009. The adoption of this standard did not have a material impact on the Company’s financial condition, results of operations and disclosures.
Reclassification of Comparative Amounts
Certain comparative amounts for prior years have been reclassified to conform to current year presentations. The reclassified amounts did not affect net income or stockholders’ equity.
NOTE 2 - EARNINGS PER SHARE
There are no convertible securities that would affect the numerator in calculating basic and diluted earnings per share; therefore, net income as presented on the Consolidated Statement of Income will be used as the numerator. The following table sets forth the composition of the weighted-average common shares (denominator) used in the basic and diluted earnings per share computation.
| 2009 | 2008 | 2007 | ||||
| Weighted-average common shares outstanding |
1,612,807 | 1,589,258 | 1,572,604 | |||
| Average treasury stock shares |
(53,930) | (53,100) | (48,068) | |||
| Weighted-average common shares and common stock equivalents used to calculate basic earnings per share |
1,558,877 | 1,536,158 | 1,524,536 | |||
| Additional common stock equivalents (stock options) used to calculate diluted earnings per share |
21,125 | 44,112 | 56,598 | |||
| Weighted-average common shares and common stock equivalents used to calculate diluted earnings per share |
1,580,002 | 1,580,270 | 1,581,134 | |||
40
NOTE 3 - INVESTMENT SECURITIES
The amortized costs and fair value of investment securities are summarized as follows (in thousands):
| 2009 | ||||||||||||
| Amortized Cost |
Gross Unrealized Gains |
Gross Unrealized Losses |
Fair Value | |||||||||
| AVAILABLE FOR SALE |
||||||||||||
| U.S. government agencies |
$ | 22,178 | $ | 53 | $ | (111) | $ | 22,120 | ||||
| Mortgage-backed securities |
4,182 | 143 | (20) | 4,305 | ||||||||
| Obligations of states and political subdivisions: |
||||||||||||
| Taxable |
400 | 15 | - | 415 | ||||||||
| Tax-exempt |
26,279 | 452 | (58) | 26,673 | ||||||||
| Corporate securities |
6,211 | 426 | (1) | 6,636 | ||||||||
| Commercial paper |
13,045 | - | - | 13,045 | ||||||||
| Total debt securities |
72,295 | 1,089 | (190) | 73,194 | ||||||||
| Equity securities |
565 | 35 | (166) | 434 | ||||||||
| Total |
$ | 72,860 | $ | 1,124 | $ | (356) | $ | 73,628 | ||||
| 2008 | ||||||||||||
| Amortized Cost |
Gross Unrealized Gains |
Gross Unrealized Losses |
Fair Value | |||||||||
| AVAILABLE FOR SALE |
||||||||||||
| U.S. government agencies |
$ | 10,478 | $ | 84 | $ | (10) | $ | 10,552 | ||||
| Mortgage-backed securities |
3,652 | 92 | (1) | 3,743 | ||||||||
| Obligations of states and political subdivisions: |
||||||||||||
| Taxable |
1,275 | - | - | 1,275 | ||||||||
| Tax-exempt |
21,156 | 147 | (186) | 21,117 | ||||||||
| Corporate securities |
8,056 | 154 | (176) | 8,034 | ||||||||
| Commercial paper |
20,463 | - | - | 20,463 | ||||||||
| Total debt securities |
65,080 | 477 | (373) | 65,184 | ||||||||
| Equity securities |
493 | 32 | (109) | 416 | ||||||||
| Total |
$ | 65,573 | $ | 509 | $ | (482) | $ | 65,600 | ||||
41
NOTE 3 - INVESTMENT SECURITIES (continued)
The following table shows the Company’s fair value and gross unrealized losses, aggregated by investment category and length of time that the individual securities have been in a continuous unrealized loss position, at December 31 (in thousands):
| 2009 | ||||||||||||||||||
| Less than Twelve Months | Twelve Months or Greater | Total | ||||||||||||||||
| Fair Value |
Gross Unrealized Losses |
Fair Value |
Gross Unrealized Losses |
Fair Value |
Gross Unrealized Losses | |||||||||||||
| U.S. government agencies |
$ | 13,765 | $ | 111 | $ | - | $ | - | $ | 13,765 | $ | 111 | ||||||
| Mortgage-backed securities |
976 | 19 | 23 | 1 | 999 | 20 | ||||||||||||
| Obligations of states and political subdivisions |
4,442 | 53 | 343 | 5 | 4,785 | 58 | ||||||||||||
| Corporate securities |
131 | 1 | - | - | 131 | 1 | ||||||||||||
| Total debt securities |
19,314 | 184 | 366 | 6 | 19,680 | 190 | ||||||||||||
| Equity securities |
85 | 4 | 158 | 162 | 243 | 166 | ||||||||||||
| Total |
$ | 19,399 | $ | 188 | $ | 524 | $ | 168 | $ | 19,923 | $ | 356 | ||||||
| 2008 | ||||||||||||||||||
| Less than Twelve Months | Twelve Months or Greater | Total | ||||||||||||||||
| Fair Value |
Gross Unrealized Losses |
Fair Value |
Gross Unrealized Losses |
Fair Value |
Gross Unrealized Losses | |||||||||||||
| U.S. government agencies |
$ | 989 | $ | 10 | $ | - | $ | - | $ | 989 | $ | 10 | ||||||
| Mortgage-backed securities |
37 | 1 | - | - | 37 | 1 | ||||||||||||
| Obligations of states and political subdivisions |
5,693 | 186 | - | - | 5,693 | 186 | ||||||||||||
| Corporate securities |
3,361 | 121 | 183 | 55 | 3,544 | 176 | ||||||||||||
| Total debt securities |
10,080 | 318 | 183 | 55 | 10,263 | 373 | ||||||||||||
| Equity securities |
161 | 75 | 39 | 34 | 200 | 109 | ||||||||||||
| Total |
$ | 10,241 | $ | 393 | $ | 222 | $ | 89 | $ | 10,463 | $ | 482 | ||||||
42
NOTE 3 - INVESTMENT SECURITIES (continued)
The Company reviews its position quarterly and has asserted that at December 31, 2009, the declines outlined in the above table represent temporary declines and the Company does not intend to sell and does not believe they will be required to sell these securities before recovery of their cost basis, which may be at maturity. There were 59 and 42 positions that were temporarily impaired at December 31, 2009 and December 31, 2008, respectively. The Company has concluded that the unrealized losses disclosed above are not other than temporary, but are the result of interest rate changes, sector credit ratings changes or company-specific ratings changes that are not expected to result in the non-collection of principal and interest during the period.
The amortized cost and estimated market values of debt securities at December 31, 2009, by contractual maturity, are shown below. Expected maturities of mortgage-backed securities will differ from contractual maturities because borrowers may have the right to call or prepay obligations with or without call or prepayment penalties (in thousands):
| Available for Sale | ||||||
| Amortized Cost |
Fair Value | |||||
| Due in one year or less |
$ | 19,151 | $ | 19,215 | ||
| Due after one year through five years |
16,128 | 16,510 | ||||
| Due after five years through ten years |
9,975 | 10,149 | ||||
| Due after ten years |
27,041 | 27,320 | ||||
| Total debt securities |
$ | 72,295 | $ | 73,194 | ||
During the fourth quarter of 2009, the Company recorded a transaction wherein a corporate bond held in the available for sale category was exchanged for various securities of the same issuer in conjunction with the reorganization of the issuer. The Company received five corporate bonds and 3,083 shares of common stock in exchange for the corporate bond. All new securities are held in the available for sale category. At the time of transfer, in accordance with generally accepted accounting principles, the Company recorded a pretax loss of $93 on the exchange.
The Company received proceeds of $1,262 from sales of securities in 2009. Those sales represented gross gains of $52 and gross losses of $74. In addition, the Company recognized a loss of $27 on an equity merger transaction during 2009. There were no sales of investment securities during 2008. In 2008, the Company recorded an investment security loss of $3 resulting from a business combination where by the Company received a combination of the common stock of the acquirer in a non-monetary exchange and cash proceeds of $2. In 2008, the Company recognized an other than temporary impairment of $25. There were no such impairments in 2009.
Investment securities with amortized costs of $63,534 and $51,179 and estimated market value of $64,448 and $57,379 at December 31, 2009 and 2008, respectively, were pledged to secure deposits, short-term borrowings and for other purposes as required by law.
43
NOTE 4 - LOANS
Major classifications of loans are as follows (in thousands):
| 2009 | 2008 | |||||
| Loans secured by real estate: |
||||||
| Construction and development |
$ | 16,286 | $ | 13,403 | ||
| Secured by farmland |
1,684 | 1,804 | ||||
| Secured by 1 - 4 family residential properties: |
||||||
| Revolving, open-end loans secured by 1 - 4 family residential properties |
8,657 | 6,342 | ||||
| All other loans secured by 1- 4 family residential properties |
76,193 | 75,715 | ||||
| Secured by nonfarm, nonresidential properties |
243,014 | 217,378 | ||||
| Commercial and industrial loans |
42,502 | 42,396 | ||||
| Loans to individuals for household, family, and other personal expenditures: |
||||||
| Ready credit loans |
680 | 1,111 | ||||
| Other installment loans |
12,189 | 13,639 | ||||
| Other loans: |
||||||
| Agricultural loans |
1,426 | 694 | ||||
| All other loans |
7,381 | 7,725 | ||||
| Loans, net of unearned income |
$ | 410,012 | $ | 380,207 | ||
Real estate loans serviced for others which are not included in the Consolidated Balance Sheet totaled $103,986 and $84,878 at December 31, 2009 and 2008, respectively.
Information with respect to impaired loans as of and for the year ended December 31 is as follows (in thousands):
| 2009 | 2008 | 2007 | |||||||
| Impaired loans without related allowance for loan losses |
$ | 1,861 | $ | 267 | $ | 298 | |||
| Impaired loans with related allowance for loan losses |
$ | 5,557 | $ | - | $ | 725 | |||
| Related allowance for loan losses |
$ | 1,329 | $ | - | $ | 410 | |||
| Average recorded balance for of impaired loans |
$ | 6,488 | $ | 621 | $ | 1,051 | |||
| Interest income recognized on impaired loans |
$ | - | $ | - | $ | 61 | |||
44
NOTE 4 – LOANS (continued)
The following is a summary of past due and nonaccrual loans as of December 31, 2009 and 2008 (in thousands):
| 2009 | ||||||
| Past Due 90 days or more |
Nonaccrual | |||||
| Real estate - construction loans |
$ | 6 | $ | - | ||
| Real estate - mortgage loans |
1,988 | 5,966 | ||||
| Commercial and all other loans |
67 | 1,524 | ||||
| Installment loan |
61 | 32 | ||||
| Other loans |
30 | - | ||||
| Total |
$ | 2,152 | $ | 7,522 | ||
| 2008 | ||||||
| Past Due 90 days or more |
Nonaccrual | |||||
| Real estate - construction loans |
$ | 6 | $ | - | ||
| Real estate - mortgage loans |
5,823 | 341 | ||||
| Commercial and all other loans |
11 | 23 | ||||
| Installment loan |
20 | 25 | ||||
| Other loans |
4 | - | ||||
| Total |
$ | 5,864 | $ | 389 | ||
Changes in the allowance for loan losses are as follows (in thousands):
| 2009 | 2008 | 2007 | |||||||
| Balance, beginning of year |
$ | 5,416 | $ | 5,392 | $ | 4,469 | |||
| Provision charged to operations |
1,300 | 950 | 1,130 | ||||||
| Recoveries credited to allowance |
55 | 82 | 153 | ||||||
| Losses charged to allowance |
(518) | (1,008) | (360) | ||||||
| Balance, end of year |
$ | 6,253 | $ | 5,416 | $ | 5,392 | |||
45
NOTE 4 – LOANS (continued)
In the normal course of business, loans are extended to officers and directors and corporations in which they are beneficially interested as stockholders, officers, or directors. A summary of loan activity for those officers and directors with aggregate loan balances in excess of $60,000 for the year ended December 31, 2009, is as follows (in thousands):
| 2008 |
Additions |
Amounts Collected |
2009 | |||||||
| $ | 10,748 | $ | 5,072 | $ | 4,548 | $ | 11,272 | |||
The Company’s primary business activity is with customers located within its local trade area. Generally, the Company grants commercial, residential and personal loans. The Company also selectively funds and purchases commercial and residential loans outside of its local trade area provided such loans meet the Company’s credit policy guidelines. At December 31, 2009 and 2008, the Company had approximately $110 million and $97 million, respectively, of outstanding loans to summer camps and recreational facilities in the northeastern United States. Although the Company has a diversified loan portfolio at December 31, 2009 and 2008, loans outstanding to individuals and businesses are dependent upon the local economic conditions in its immediate trade area.
NOTE 5 - PREMISES AND EQUIPMENT
A summary by asset classification is as follows (in thousands):
| 2009 | 2008 | |||||
| Land |
$ | 1,417 | $ | 1,465 | ||
| Premises and improvements |
10,610 | 9,998 | ||||
| Furniture and equipment |
4,173 | 3,876 | ||||
| Leasehold improvements |
1,649 | 1,636 | ||||
| Total, at cost |
17,849 | 16,975 | ||||
| Less accumulated depreciation |
6,884 | 6,095 | ||||
| Net premises and equipment |
$ | 10,965 | $ | 10,880 | ||
Depreciation and amortization expense was $811, $533 and $526, in 2009, 2008 and 2007, respectively.
NOTE 6 - DEPOSITS
Deposits are summarized as follows (in thousands):
| 2009 | 2008 | |||||
| Demand - noninterest-bearing |
$ | 39,687 | $ | 37,626 | ||
| Demand - interest-bearing |
39,584 | 40,715 | ||||
| Money market |
41,180 | 41,925 | ||||
| Savings |
37,288 | 35,556 | ||||
| Time deposits of $100,000 or more |
135,621 | 91,473 | ||||
| Other time deposits |
149,756 | 134,694 | ||||
| Total |
$ | 443,116 | $ | 381,989 | ||
46
NOTE 6 – DEPOSITS (continued)
The following table summarizes the maturity distribution of time deposits (in thousands):
| 2010 |
$ | 238,136 | |
| 2011 |
25,050 | ||
| 2012 |
11,435 | ||
| 2013 |
4,940 | ||
| 2014 |
5,816 | ||
| Total |
$ | 285,377 | |
The following table summarizes the maturity distribution of certificates of deposit of $100,000 or more (in thousands):
| 2009 | |||
| Three months or less |
$ | 48,012 | |
| Four through six months |
29,236 | ||
| Seven through twelve months |
42,189 | ||
| Over twelve months |
16,184 | ||
| Total |
$ | 135,621 | |
Interest expense on certificates of deposit of $100,000 or amounted to $2,859, $3,073 and $3,449, for the years ended December 31, 2009, 2008 and 2007, respectively.
NOTE 7 - SHORT-TERM BORROWINGS
Short-term borrowings consist of borrowings from the FHLB of Pittsburgh and securities sold under agreements to repurchase. Average amounts outstanding during the year represent daily average balances and average interest rates represent interest expense divided by the related average balance.
The outstanding balances and related information for short-term borrowings are summarized as follows (in thousands):
| 2009 | 2008 | |||||||||
| Amount | Rate | Amount | Rate | |||||||
| Balance at year-end |
$ | 10,974 | .65% | $ | 16,671 | .83% | ||||
| Average balance outstanding during the year |
$ | 15,488 | .79% | $ | 15,626 | 1.51% | ||||
| Maximum amount outstanding at any month-end |
$ | 21,003 | $ | 19,454 | ||||||
The Bank has pledged, as collateral for the borrowings from the FHLB, all stock in the FHLB and certain other qualifying collateral. Investment securities with amortized costs of $14,452 and $12,638 and market values of $14,857 and $12,712, respectively, at December 31, 2009 and 2008, were pledged as collateral for the securities sold under agreements to repurchase.
47
NOTE 7 - SHORT-TERM BORROWINGS (continued)
The Bank has the capability to borrow additional funds through its credit arrangement with the FHLB. The FHLB borrowings are subject to annual renewal, incur no service charges and are secured by a blanket security agreement on certain investment securities, qualifying loans and the Bank’s investment in FHLB stock. At December 31, 2009, the Bank’s remaining borrowing capacity with the FHLB was approximately $159 million.
NOTE 8 - OTHER BORROWED FUNDS
FHLB advances consist of separate fixed rate and convertible select-fixed to float rate loans as follows (in thousands):
| Maturity Range | Weighted- Average |
Stated Interest Rate Range |
||||||||||||||||
| Description | From | To | Rate | From | To | 2009 | 2008 | |||||||||||
| Fixed rate |
09/17/10 | 09/17/12 | 3.31% | 1.70 | % | 3.87 | % | $ | 6,000 | $ | 5,000 | |||||||
| Fixed rate amortizing |
11/06/13 | 01/26/26 | 4.64% | 3.20 | % | 5.55 | % | 17,402 | 18,298 | |||||||||
| Convertible select-fixed to float |
02/18/10 | 02/18/10 | 5.91% | 5.91 | % | 5.91 | % | 1,000 | 1,000 | |||||||||
| Total |
$ | 24,402 | $ | 24,298 | ||||||||||||||
The advance maturing in 2010 is convertible to a variable rate advance on specific dates at the discretion of the FHLB. Should the FHLB convert this advance, the Bank has the option of accepting the variable rate or repaying the advance without penalty.
| Year Ending December 31, | Maturities/ repayments |
Weighted- Average Rate | |||
| 2010 |
$ | 4,850 | 4.56% | ||
| 2011 |
4,434 | 4.62% | |||
| 2012 |
3,521 | 4.73% | |||
| 2013 |
2,071 | 4.91% | |||
| 2014 |
1,551 | 4.99% | |||
| 2015 and beyond |
7,975 | 5.06% | |||
| Total |
$ | 24,402 | |||
NOTE 9 - DIVIDEND REINVESTMENT AND STOCK PURCHASE PLAN
The Company maintains a Dividend Reinvestment and Stock Purchase Plan (the “Plan”). Participation is available to all common stockholders. The Plan provides each participant with a simple and convenient method of purchasing additional common shares without payment of any brokerage commission or other service fees.
A participant in the Plan may elect to reinvest dividends on all or part of his or her shares to acquire additional common stock. A participant may withdraw from the Plan at any time. Stockholders purchased 18,824 shares in 2009, 14,789 shares in 2008 and 12,786 shares in 2007 through the Plan.
48
NOTE 10 - EMPLOYEE BENEFITS
Retirement Plan
The Bank maintains a section 401(k) employee savings and investment plan for substantially all employees and officers of the Bank. The Bank’s contribution to the plan is based on 100 percent matching of voluntary contributions up to 3 percent and 50 percent matching on the next 2 percent of individual compensation. Additionally, the Bank may contribute a discretionary amount each year. For each of the years of 2009, 2008 and 2007, the Board of Directors authorized an additional 2 percent, 4 percent and 6 percent, respectively, of each eligible employee’s compensation. Employee contributions are vested at all times, and Bank contributions are fully vested after five years. Contributions for 2009, 2008 and 2007 to this plan amounted to $247, $300 and $373, respectively.
Supplemental Retirement Plan
The Bank maintains a Salary Continuation Plan for the certain officers of the Bank to provide guaranteed consecutive postretirement payments totaling a predetermined amount over a ten or fifteen year period. Expenses for the years ended December 31, 2009, 2008 and 2007 amounted to $156, $150 and $144, respectively, and are included as a component of salaries and employee benefits.
Stock Option Plan
The Company maintains a stock incentive plan and a stock option plan that provide for granting incentive stock options to key officers and other employees of the Company and Bank, as determined by the Compensation Committee, and nonqualified stock options to nonemployee directors of the Company. A total of 120,000 and 50,000 shares, respectively, of either authorized and unissued shares or authorized shares issued by and subsequently reacquired by the Company as treasury stock shall be issuable under the plans. The plans shall terminate after the tenth anniversary of the date of shareholder ratification. The per share exercise price of any option granted will not be less than the fair market value of a share of common stock on the date the option is granted.
The following table presents share data related to the stock option plans:
| 2009 | Weighted- Average Exercise Price |
2008 | Weighted- Average Exercise Price | |||||||
| Outstanding, beginning of year |
68,832 | $ | 23.77 | 105,360 | $ | 20.33 | ||||
| Granted |
- | - | - | - | ||||||
| Exercised |
(2,050) | 13.10 | (36,528) | 13.86 | ||||||
| Forfeited |
- | - | - | - | ||||||
| Outstanding, end of year |
66,782 | $ | 24.10 | 68,832 | $ | 23.77 | ||||
| Exercisable at year-end |
66,782 | $ | 24.10 | 68,832 | $ | 23.77 | ||||
49
NOTE 10 - EMPLOYEE BENEFITS (continued)
The following table summarizes characteristics of stock options outstanding at December 31, 2009:
| Outstanding | Exercisable | ||||||||||||
| Exercise Price |
Shares |
Average |
Average |
Shares |
Average | ||||||||
| $ | 13.00 | 6,250 | 0.20 | $ | 13.00 | 6,250 | $ | 13.00 | |||||
| $ | 13.25 | 19,940 | 0.20 | $ | 13.25 | 19,940 | $ | 13.25 | |||||
| $ | 16.50 | 4,550 | 0.20 | $ | 16.50 | 4,550 | $ | 16.50 | |||||
| $ | 21.30 | 4,000 | 0.20 | $ | 21.30 | 4,000 | $ | 21.30 | |||||
| $ | 23.00 | 1,250 | 0.20 | $ | 23.00 | 1,250 | $ | 23.00 | |||||
| $ | 26.50 | 1,000 | 0.20 | $ | 26.50 | 1,000 | $ | 26.50 | |||||
| $ | 32.55 | 2,000 | 3.85 | $ | 32.55 | 2,000 | $ | 32.55 | |||||
| $ | 34.00 | 7,712 | 5.96 | $ | 34.00 | 7,712 | $ | 34.00 | |||||
| $ | 35.00 | 1,000 | 4.85 | $ | 35.00 | 1,000 | $ | 35.00 | |||||
| $ | 35.95 | 19,080 | 5.73 | $ | 35.95 | 19,080 | $ | 35.95 | |||||
| Total | 66,782 | Total | 66,782 | ||||||||||
NOTE 11 - INCOME TAXES
Federal income tax expense consists of the following (in thousands):
| 2009 | 2008 | 2007 | |||||||
| Currently payable |
$ | 1,890 | $ | 2,742 | $ | 3,411 | |||
| Deferred taxes |
(338) | 4 | (414) | ||||||
| Total provision |
$ | 1,552 | $ | 2,746 | $ | 2,997 | |||
The components of the net deferred tax assets and liabilities at December 31 are as follows (in thousands):
| 2009 | 2008 | |||||
| Deferred tax assets: |
||||||
| Allowance for loan losses |
$ | 1,923 | $ | 1,613 | ||
| Salary continuation plan |
273 | 237 | ||||
| Mortgage servicing rights |
35 | 24 | ||||
| Non-accrual loans |
157 | - | ||||
| Unrealized loss on nonmonetary exchange |
10 | - | ||||
| Total |
2,398 | 1,874 | ||||
| Deferred tax liabilities: |
||||||
| Premises and equipment |
753 | 575 | ||||
| Deferred loan origination fees, net |
111 | 126 | ||||
| PA Shares Tax |
23 | - | ||||
| Unrealized gain on investment securities |
261 | 9 | ||||
| Total |
1,148 | 710 | ||||
| Net deferred tax assets |
$ | 1,250 | $ | 1,164 | ||
50
NOTE 11 - INCOME TAXES (continued)
No valuation allowance was established at December 31, 2009 and 2008, in view of the Company’s ability to carryback taxes paid in previous years and certain tax strategies and anticipated future taxable income as evidenced by the Company’s earnings potential.
A reconciliation between the expected statutory income tax rate and the effective income tax rate follows (in thousands):
| 2009 | 2008 | 2007 | ||||||||||||||||
| Amount | % of Pretax Income |
Amount | % of Pretax Income |
Amount | % of Pretax Income |
|||||||||||||
| Provision at statutory rate |
$ | 2,024 | 34.0 | % | $ | 3,110 | 34.0 | % | $ | 3,267 | 34.0 | % | ||||||
| Tax-exempt income |
(428) | (7.2) | (306) | (3.4) | (194) | (2.0) | ||||||||||||
| BOLI earnings |
(139) | (2.3) | (131) | (1.4) | (121) | (1.3) | ||||||||||||
| Nondeductible interest |
52 | 0.9 | 42 | 0.5 | 29 | 0.3 | ||||||||||||
| Other, net |
43 | 0.7 | 31 | 0.4 | 16 | 0.2 | ||||||||||||
| Effective income tax and rate |
$ | 1,552 | 26.1 | % | $ | 2,746 | 30.1 | % | $ | 2,997 | 31.2 | % | ||||||
U.S. generally accepted accounting principles prescribe a recognition threshold and a measurement attribute for the financial statement recognition and measurement of a tax position taken or expected to be taken in a tax return. Benefits from tax positions should be recognized in the financial statements only when it is more likely than not that the tax position will be sustained upon examination by the appropriate taxing authority that would have full knowledge of all relevant information. A tax position that meets the more-likely-than-not recognition threshold is measured at the largest amount of benefit that is greater than 50 percent likely of being realized upon ultimate settlement. Tax positions that previously failed to meet the more-likely-than-not recognition threshold should be recognized in the first subsequent financial reporting period in which that threshold is met. Previously recognized tax positions that no longer meet the more-likely-than-not recognition threshold should be derecognized in the first subsequent financial reporting period in which that threshold is no longer met.
NOTE 12 - COMMITMENTS AND CONTINGENT LIABILITIES
Commitments
In the normal course of business, there are outstanding commitments and contingent liabilities such as commitments to extend credit, financial guarantees and letters of credit that are not reflected in the accompanying consolidated financial statements. The Company does not anticipate any losses as a result of these transactions. These instruments involve, to varying degrees, elements of credit and interest rate risk in excess of the amount recognized in the Consolidated Balance Sheet. The contract or notional amounts of those instruments reflect the extent of involvement the Company has in the particular classes of financial instruments.
Financial instruments whose contract amounts represent credit risk are as follows (in thousands):
| 2009 | 2008 | |||||
| Commitments to extend credit |
$ | 55,235 | $ | 49,671 | ||
| Standby letters of credit |
$ | 5,782 | $ | 3,683 | ||
51
NOTE 12 - COMMITMENTS AND CONTINGENT LIABILITIES
Commitments (continued)
Commitments to extend credit are agreements to lend to a customer as long as there is no violation of any condition established in the contract. Commitments generally have fixed expiration dates or other termination clauses and may require payment of a fee. Since many of the commitments are expected to expire without being drawn upon, the total commitment amounts do not necessarily represent future cash requirements.
Standby letters of credit represent conditional commitments issued by the Company to guarantee the performance of a customer to a third party. These instruments are issued primarily to support bid or performance-related contracts. The coverage period for these instruments is typically a one year period with an annual renewal option subject to prior approval by management. Fees earned from the issuance of these letters are recognized at the expiration of the coverage period.
At December 18, 2008, the Company entered into an Agreement of Limited Partnership which would generate low income housing credits for use in future periods. The agreement states the Bank will acquire a 33.33% interest in the partnership at a cost of $3,109. The first installment of this investment in the amount of $2,729 was made on January 16, 2009 with the remainder expected to be paid in 2010.
At December 31, 2009, the minimum rental commitments for all noncancelable leases are as follows (in thousands):
| 2010 |
$ | 184 | |
| 2011 |
165 | ||
| 2012 |
159 | ||
| 2013 |
81 | ||
| 2014 |
41 | ||
| 2015 and thereafter |
24 | ||
| Total |
$ | 654 | |
Contingent Liabilities
The Company and its subsidiary are involved in various legal actions from the normal course of business activities. Management believes the liability, if any, arising from such actions will not have a material adverse effect on the Company’s financial position.
NOTE 13 - REGULATORY RESTRICTIONS
Cash and Due From Banks
The district Federal Reserve Bank requires the Bank to maintain certain average reserve balances. As of each of the years ended December 31, 2009 and 2008, the Bank had required reserves of $225, composed of vault cash and a depository amount held directly with the Federal Reserve Bank.
Dividends
The Pennsylvania Banking Code restricts the availability of capital funds for payment of dividends by all state-chartered banks to the surplus of the Bank. Accordingly, at December 31, 2009, the balance in the capital surplus account totaling approximately $1,756 is unavailable for dividends.
52
NOTE 14 - REGULATORY CAPITAL REQUIREMENTS
Federal regulations require the Company and the Bank to maintain minimum amounts of capital. Specifically, each is required to maintain certain minimum dollar amounts and ratios of Total and Tier I capital to risk-weighted assets and of Tier I capital to average total assets.
In addition to the capital requirements, the Federal Deposit Insurance Corporation Improvement Act (“FDICIA”) established five capital categories ranging from “well capitalized” to “critically undercapitalized.” Should any institution fail to meet the requirements to be considered “adequately capitalized,” it would become subject to a series of increasingly restrictive regulatory actions.
As of December 31, 2009 and 2008, the FDIC categorized the Bank as well capitalized under the regulatory framework for prompt corrective action. To be classified as a well capitalized financial institution, Total risk-based, Tier 1 risk-based, and Tier 1 Leverage capital ratios must be at least 10 percent, 6 percent and 5 percent, respectively.
The Company’s actual capital ratios are presented in the following table, which shows the Company met all regulatory capital requirements. The capital position of the Bank does not differ significantly from the Company’s (in thousands):
| 2009 | 2008 | |||||||||
| Amount | Ratio | Amount | Ratio | |||||||
| Total Capital |
||||||||||
| (to Risk-Weighted Assets) |
||||||||||
| Actual |
$ | 52,116 | 11.73% | $ | 49,636 | 11.91% | ||||
| For capital adequacy purposes |
$ | 35,556 | 8.00% | $ | 33,339 | 8.00% | ||||
| To be well capitalized |
$ | 44,445 | 10.00% | $ | 41,673 | 10.00% | ||||
| Tier I Capital |
||||||||||
| (to Risk-Weighted Assets) |
||||||||||
| Actual |
$ | 46,552 | 10.47% | $ | 44,390 | 10.65% | ||||
| For capital adequacy purposes |
$ | 17,778 | 4.00% | $ | 16,669 | 4.00% | ||||
| To be well capitalized |
$ | 26,667 | 6.00% | $ | 25,004 | 6.00% | ||||
| Tier I Capital |
||||||||||
| (to Average Assets) |
||||||||||
| Actual |
$ | 46,552 | 9.47% | $ | 44,390 | 9.90% | ||||
| For capital adequacy purposes |
$ | 19,658 | 4.00% | $ | 17,927 | 4.00% | ||||
| To be well capitalized |
$ | 24,572 | 5.00% | $ | 22,408 | 5.00% | ||||
53
NOTE 15 – FAIR VALUE MEASUREMENTS
The following disclosures show the hierarchal disclosure framework associated with the level of pricing observations utilized in measuring assets and liabilities at fair value. The three broad levels defined by U.S. generally accepted accounting principles are as follows:
| Level I: |
Quoted prices are available in active markets for identical assets or liabilities as of the reported date. | |
| Level II: |
Pricing inputs are other than quoted prices in active markets, which are either directly or indirectly observable as of the reported date. The nature of these assets and liabilities include items for which quoted prices are available but traded less frequently, and items that are fair valued using other financial instruments, the parameters of which can be directly observed. | |
| Level III: |
Valuations derived from valuation techniques in which one or more significant inputs or significant value drivers are unobservable. | |
This hierarchy requires the use of observable market data when available.
The following tables present the assets reported on the balance sheet at their fair value as of December 31, 2009 and 2008, by level within the fair value hierarchy. Financial assets and liabilities are classified in their entirety based on the lowest level of input that is significant to the fair value measurement (in thousands):
| 2009 | ||||||||||||
| Level 1 | Level II | Level III | Total | |||||||||
| Assets: |
||||||||||||
| U.S. government agencies |
$ | - | $ | 22,120 | $ | - | $ | 22,120 | ||||
| Mortgage-backed securities |
- | 4,305 | - | 4,305 | ||||||||
| Obligations of states and political subdivisions: |
||||||||||||
| Taxable |
- | 415 | - | 415 | ||||||||
| Tax-exempt |
- | 26,673 | - | 26,673 | ||||||||
| Corporate securities |
- | 6,636 | - | 6,636 | ||||||||
| Commerical paper |
13,045 | - | - | 13,045 | ||||||||
| Total debt securities |
13,045 | 60,149 | - | 73,194 | ||||||||
| Equity Securities |
434 | - | - | 434 | ||||||||
| Total |
$ | 13,479 | $ | 60,149 | $ | - | $ | 73,628 | ||||
| 2008 | ||||||||||||
| Level 1 | Level II | Level III | Total | |||||||||
| Assets: |
||||||||||||
| U.S. government agencies |
$ | - | $ | 10,552 | $ | - | $ | 10,552 | ||||
| Mortgage-backed securities |
- | 3,743 | - | 3,743 | ||||||||
| Obligations of states and political subdivisions: |
||||||||||||
| Taxable |
1,275 | - | - | 1,275 | ||||||||
| Tax-exempt |
- | 21,117 | - | 21,117 | ||||||||
| Corporate securities |
- | 8,034 | - | 8,034 | ||||||||
| Commerical paper |
20,463 | - | - | 20,463 | ||||||||
| Total debt securities |
21,738 | 43,446 | - | 65,184 | ||||||||
| Equity Securities |
416 | - | - | 416 | ||||||||
| Total |
$ | 22,154 | $ | 43,446 | $ | - | $ | 65,600 | ||||
54
NOTE 15 – FAIR VALUE MEASUREMENTS (continued)
The following tables present the assets measured on a nonrecurring basis on the consolidated statements of financial condition at their fair value as of December 31, 2009 and 2008, by level within the fair value hierarchy. Impaired loans that are collateral dependent are written down to fair value through the establishment of specific reserves. Techniques used to value the collateral that secure the impaired loan include: quoted market prices for identical assets classified as Level I inputs; observable inputs, employed by certified appraisers, for similar assets classified as Level II inputs. In cases where valuation techniques included inputs that are unobservable and are based on estimates and assumptions developed by management based on the best information available under each circumstance, the asset valuation is classified as Level III inputs (in thousands):
| 2009 | ||||||||||||
| Level 1 | Level II | Level III | Total | |||||||||
| Assets measured on a nonrecurring basis: |
||||||||||||
| Impaired loans |
$ | - | $ | 4,564 | $ | 1,525 | $ | 6,089 | ||||
| Other real estate owned |
$ | - | $ | 389 | $ | - | $ | 389 | ||||
| 2008 | ||||||||||||
| Level 1 | Level II | Level III | Total | |||||||||
| Assets measured on a nonrecurring basis: |
||||||||||||
| Impaired loans |
$ | - | $ | 267 | $ | - | $ | 267 | ||||
| Other real estate owned |
$ | - | $ | 1,955 | $ | $ | 1,955 | |||||
NOTE 16 - FAIR VALUE DISCLOSURE
The estimated fair values of the Company’s financial instruments are as follows (in thousands):
| 2009 | 2008 | |||||||||||
| Carrying Value |
Fair Value |
Carrying Value |
Fair Value | |||||||||
| Financial assets: |
||||||||||||
| Cash and cash equivalents |
$ | 21,287 | $ | 21,287 | $ | 3,993 | $ | 3,993 | ||||
| Investment securities |
$ | 73,628 | $ | 73,628 | $ | 65,600 | $ | 65,600 | ||||
| Net loans |
$ | 403,759 | $ | 419,825 | $ | 374,791 | $ | 395,672 | ||||
| Accrued interest receivable |
$ | 1,842 | $ | 1,842 | $ | 2,050 | $ | 2,050 | ||||
| Regulatory stock |
$ | 1,741 | $ | 1,741 | $ | 1,675 | $ | 1,675 | ||||
| Bank-owned life insurance |
$ | 9,175 | $ | 9,175 | $ | 8,535 | $ | 8,535 | ||||
| Mortgage servicing rights |
$ | 583 | $ | 583 | $ | 602 | $ | 602 | ||||
| Financial liabilities: |
||||||||||||
| Deposits |
$ | 443,116 | $ | 446,972 | $ | 381,989 | $ | 388,164 | ||||
| Short-term borrowings |
$ | 10,974 | $ | 10,974 | $ | 16,671 | $ | 16,696 | ||||
| Other borrowed funds |
$ | 24,402 | $ | 25,964 | $ | 24,298 | $ | 26,858 | ||||
| Accrued interest payable |
$ | 1,080 | $ | 1,080 | $ | 1,158 | $ | 1,158 | ||||
Financial instruments are defined as cash, evidence of ownership interest in an entity, or a contract which creates an obligation or right to receive or deliver cash or another financial instrument from/to a second entity on potentially favorable or unfavorable terms.
Fair value is defined as the amount at which a financial instrument could be exchanged in a current transaction between willing parties other than in a forced or liquidation sale. If a quoted market price is available for a financial instrument, the estimated fair value would be calculated based upon the market price per trading unit of the instrument.
55
NOTE 16 - FAIR VALUE DISCLOSURE (continued)
If no readily available market exists, the fair value estimates for financial instruments should be based upon management’s judgment regarding current economic conditions, interest rate risk, expected cash flows, future estimated losses and other factors as determined through various option pricing formulas or simulation modeling. As many of these assumptions result from judgments made by management based upon estimates that are inherently uncertain, the resulting estimated fair values may not be indicative of the amount realizable in the sale of a particular financial instrument. In addition, changes in assumptions on which the estimated fair values are based may have a significant impact on the resulting estimated fair values.
As certain assets such as deferred tax assets and premises and equipment are not considered financial instruments, the estimated fair value of financial instruments would not represent the full value of the Company.
The Company employed simulation modeling in determining the estimated fair value of financial instruments for which quoted market prices were not available based upon the following assumptions:
Cash and Cash Equivalents, Accrued Interest Receivable, Regulatory Stock, and Accrued Interest Payable
The fair value is equal to the current carrying value.
Investment Securities
The fair value of investment securities available for sale is equal to the available quoted market price. If no quoted market price is available, fair value is estimated using the quoted market price for similar securities.
Loans and Mortgage Servicing Rights
The fair value is estimated by discounting future cash flows using current market inputs at which loans with similar terms and qualities would be made to borrowers of similar credit quality. Where quoted market prices were available, primarily for certain residential mortgage loans, such market rates were utilized as estimates for fair value.
Deposits, Short-Term Borrowings and Other Borrowed Funds
The fair values of certificates of deposit and other borrowed funds are based on the discounted value of contractual cash flows. The discount rates are estimated using rates currently offered for similar instruments with similar remaining maturities. Demand, savings and money market deposit accounts are valued at the amount payable on demand as of year-end.
Bank-Owned Life Insurance
The fair value is equal to the cash surrender value of the life insurance policies.
Commitments to Extend Credit and Standby Letters of Credit
These financial instruments are generally not subject to sale and estimated fair values are not readily available. The carrying value, represented by the net deferred fee arising from the unrecognized commitment or letter of credit and the fair value, determined by discounting the remaining contractual fee over the term of the commitment using fees currently charged to enter into similar agreements with similar credit risk, are not considered material for disclosure. The contractual amounts of unfunded commitments and letters of credit are presented in Note 12.
56
NOTE 17 - PARENT COMPANY
Following are condensed financial statements for the parent company:
CONDENSED BALANCE SHEET
| December 31, | ||||||
| (In thousands) | 2009 | 2008 | ||||
| Assets |
||||||
| Cash and due from banks |
$ | 1,364 | $ | 2,752 | ||
| Investment securities available for sale |
349 | 416 | ||||
| Investment in bank subsidiary |
45,379 | 41,185 | ||||
| Other assets |
596 | 685 | ||||
| Total Assets |
$ | 47,688 | $ | 45,038 | ||
| Liabilities |
||||||
| Dividends payable |
$ | 561 | $ | 561 | ||
| Other liabilities |
10 | 9 | ||||
| Total Liabilities |
571 | 570 | ||||
| Stockholders’ Equity |
47,117 | 44,468 | ||||
| Total Liabilities and Stockholders’ Equity |
$ | 47,688 | $ | 45,038 | ||
CONDENSED STATEMENT OF INCOME
| Year Ended December 31, | |||||||||
| 2009 | 2008 | 2007 | |||||||
| (In thousands) |
|||||||||
| Dividends from bank subsidiary |
$ | 800 | $ | 2,575 | $ | 2,450 | |||
| Dividends on investment securities |
10 | 19 | 10 | ||||||
| Investment securities losses |
(27) | (28) | - | ||||||
| Total income |
783 | 2,566 | 2,460 | ||||||
| Noninterest expense |
92 | 89 | 101 | ||||||
| Net income before undistributed earnings of bank subsidiary and income taxes |
691 | 2,477 | 2,359 | ||||||
| Undistributed earnings of bank subsidiary |
3,672 | 3,886 | 4,220 | ||||||
| Income tax benefit |
(39) | (38) | (33) | ||||||
| Net Income |
$ | 4,402 | $ | 6,401 | $ | 6,612 | |||
57
NOTE 17 - PARENT COMPANY (continued)
CONDENSED STATEMENT OF CASH FLOWS
| Year Ended December 31, | |||||||||
| (In thousands) | 2009 | 2008 | 2007 | ||||||
| Operating Activities |
|||||||||
| Net income |
$ | 4,402 | $ | 6,401 | $ | 6,612 | |||
| Adjustments to reconcile net income to net cash provided by operating activities: |
|||||||||
| Undistributed earnings of bank subsidiary |
(3,672) | (3,886) | (4,220) | ||||||
| Investment securities losses |
27 | 28 | - | ||||||
| Other, net |
107 | 212 | (346) | ||||||
| Net cash provided by operating activities |
864 | 2,755 | 2,046 | ||||||
| Investing Activities |
|||||||||
| Purchases of investment securities |
(10) | (204) | (53) | ||||||
| Proceeds from merger of investment securities |
- | 2 | - | ||||||
| Net cash used for investing activities |
(10) | (202) | (53) | ||||||
| Financing Activities |
|||||||||
| Purchase of treasury stock |
(35) | - | (490) | ||||||
| Proceeds from exercise of stock options |
37 | 556 | 207 | ||||||
| Cash dividends paid |
(2,244) | (1,961) | (1,770) | ||||||
| Net cash used for financing activities |
(2,242) | (1,405) | (2,053) | ||||||
| Increase (decrease) in cash and cash equivalents |
(1,388) | 1,148 | (60) | ||||||
| Cash at beginning of year |
2,752 | 1,604 | 1,664 | ||||||
| Cash at end of year |
$ | 1,364 | $ | 2,752 | $ | 1,604 | |||
58
NOTE 18 – QUARTERLY DATA (unaudited)
The Company’s selected quarterly financial data is presented in the following tables (in thousands, except per share data):
| Three Months Ended | ||||||||||||
| March 2009 |
June 2009 |
September 2009 |
December 2009 | |||||||||
| Total interest income |
$ | 6,166 | $ | 6,135 | $ | 6,123 | $ | 6,093 | ||||
| Total interest expense |
2,185 | 2,212 | 2,208 | 2,145 | ||||||||
| Net interest income |
3,981 | 3,923 | 3,915 | 3,948 | ||||||||
| Provision for loan losses |
368 | 272 | 260 | 400 | ||||||||
| Net interest income after provision for loan losses |
3,613 | 3,651 | 3,655 | 3,548 | ||||||||
| Total noninterest income |
899 | 1,031 | 1,027 | 1,001 | ||||||||
| Total noninterest expense |
3,051 | 3,285 | 3,191 | 2,944 | ||||||||
| Income before income taxes |
1,461 | 1,397 | 1,491 | 1,605 | ||||||||
| Income taxes |
384 | 336 | 405 | 427 | ||||||||
| Net income |
$ | 1,077 | $ | 1,061 | $ | 1,086 | $ | 1,178 | ||||
| Per share data: |
||||||||||||
| Net income |
||||||||||||
| Basic |
$ | .69 | $ | .68 | $ | .70 | $ | .75 | ||||
| Diluted |
$ | .68 | $ | .67 | $ | .69 | $ | .75 | ||||
| Weighted-average shares outstanding: |
||||||||||||
| Basic |
1,558,570 | 1,558,028 | 1,559,115 | 1,559,778 | ||||||||
| Diluted |
1,579,418 | 1,579,644 | 1,582,631 | 1,580,263 | ||||||||
59
NOTE 18 – QUARTERLY DATA (unaudited) (continued)
| Three Months Ended | ||||||||||||
| March 2008 |
June 2008 |
September 2008 |
December 2008 | |||||||||
| Total interest income |
$ | 7,371 | $ | 7,012 | $ | 6,913 | $ | 6,879 | ||||
| Total interest expense |
3,029 | 2,670 | 2,455 | 2,511 | ||||||||
| Net interest income |
4,342 | 4,342 | 4,458 | 4,368 | ||||||||
| Provision for loan losses |
150 | 200 | 230 | 370 | ||||||||
| Net interest income after provision for loan losses |
4,192 | 4,142 | 4,228 | 3,998 | ||||||||
| Total noninterest income |
937 | 858 | 1,025 | 944 | ||||||||
| Total noninterest expense |
2,750 | 2,752 | 2,775 | 2,900 | ||||||||
| Income before income taxes |
2,379 | 2,248 | 2,478 | 2,042 | ||||||||
| Income taxes |
714 | 679 | 752 | 601 | ||||||||
| Net income |
$ | 1,665 | $ | 1,569 | $ | 1,726 | $ | 1,441 | ||||
| Per share data: |
||||||||||||
| Net income |
||||||||||||
| Basic |
$ | 1.09 | $ | 1.03 | $ | 1.12 | $ | .93 | ||||
| Diluted |
$ | 1.06 | $ | .99 | $ | 1.09 | $ | .91 | ||||
| Weighted-average shares outstanding: |
||||||||||||
| Basic |
1,522,708 | 1,523,131 | 1,540,116 | 1,558,393 | ||||||||
| Diluted |
1,577,099 | 1,577,863 | 1,580,243 | 1,585,589 | ||||||||
60