Attached files
| file | filename |
|---|---|
| 8-K - FORM 8-K - DARLING INGREDIENTS INC. | d8k.htm |
 Stephens Inc. Investment Conference March 17, 2010 NYSE: DAR Exhibit 99.1 |
 2 Forward-Looking Statements This presentation contains forward-looking statements regarding the business
operations of Darling and the industry in which it operates. These statements are
identified by words such as “may,” “will,” “expect,” “believe,” “intend,” “anticipate,” “should,” “estimate,” “continue,” and other words referring to events to occur in the future. These statements reflect Darling's current view of future events and are
based on its assessment of, and are subject to, a variety of risks and
uncertainties beyond its control, including business and economic
conditions in its existing markets that could cause actual results to
differ materially from those projected in the forward-looking
statements. Other risks and uncertainties regarding Darling, its business
and the industry in which it operates are referenced from time to time in
the Company's filings with the Securities and Exchange Commission. Darling is under no obligation to (and expressly disclaims any such obligation to) update or
alter its forward-looking statements whether as a result of new
information, future events or otherwise. |
 3 Over a century old, Darling International Inc. is America’s leading provider of rendering, recycling and recovery solutions to the nation’s food industry, converting valuable waste streams into sustainable feed and fuel products.” . |
 Founded in 1882 Headquartered in Dallas, TX 1870 employees Public since 1994 NYSE Listed (DAR) Largest independent rendering company with 81 locations nationwide, including 45 processing plants Reports under two segments: – Rendering – Restaurant services Renewable fuel initiative Who we are: 4 |
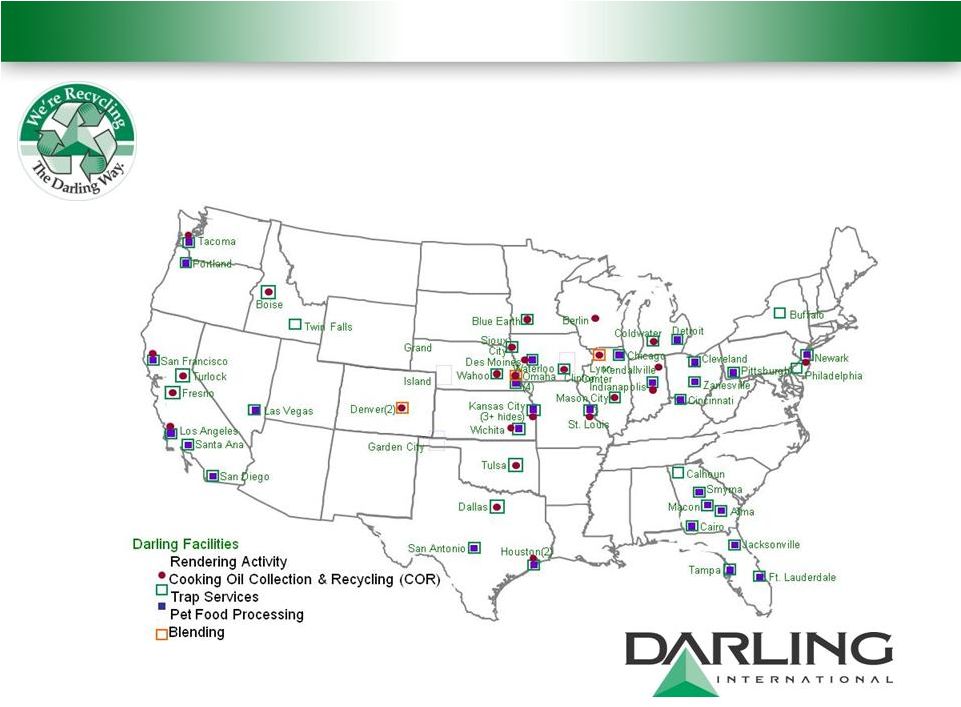 5 A national footprint with scale . . . The only recycling/rendering company with a national footprint operating in 42 states – Network of 45 processing facilities from coast to coast – Supported by 36 accumulation centers. |
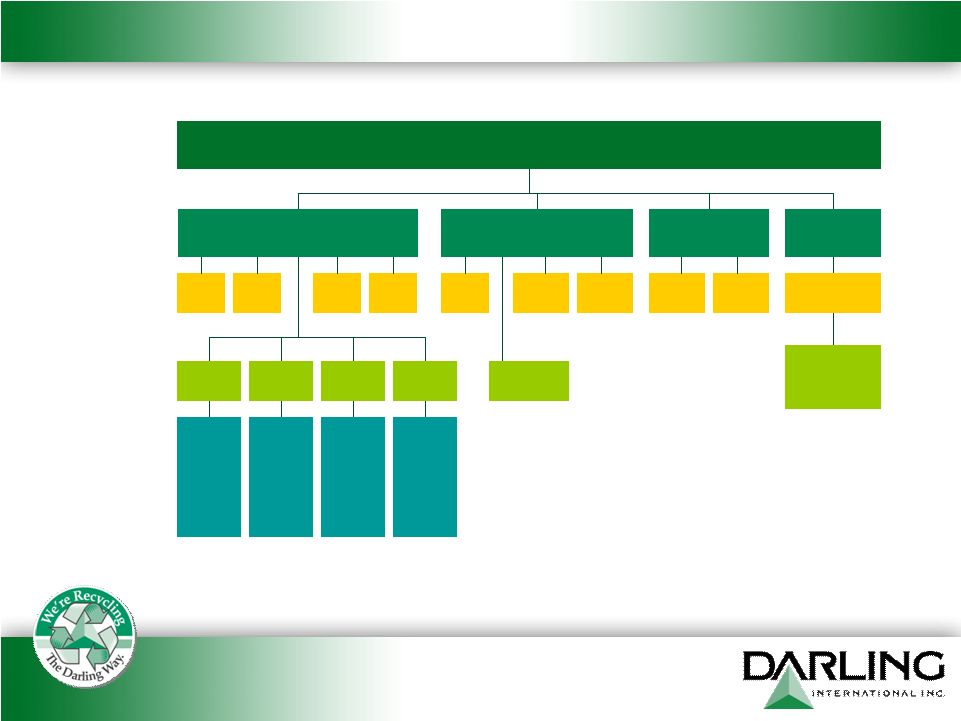 The products we produce: RAW MATERIAL Tallow Meat & Bone Grease Hides Leather Shoes Garments Upholstery Bio- Fuels Animal Feed Pet Food Poultry Feed Hog Food Animal Feed Pet Food Bio- Fuels Soap Linoleic Acid Oleic Acid Glycerin Stearic Acid Fertilizer Lubricants Textiles Plastics Shampoo Emulsifiers Cleaners Creams Esters Paints Plastics Lubricants Inks Glues Solvents Antifreeze Explosives Rubber Plastics Tires Lubricants Finished Products Component By-Products Component By-Products Applications 6 |
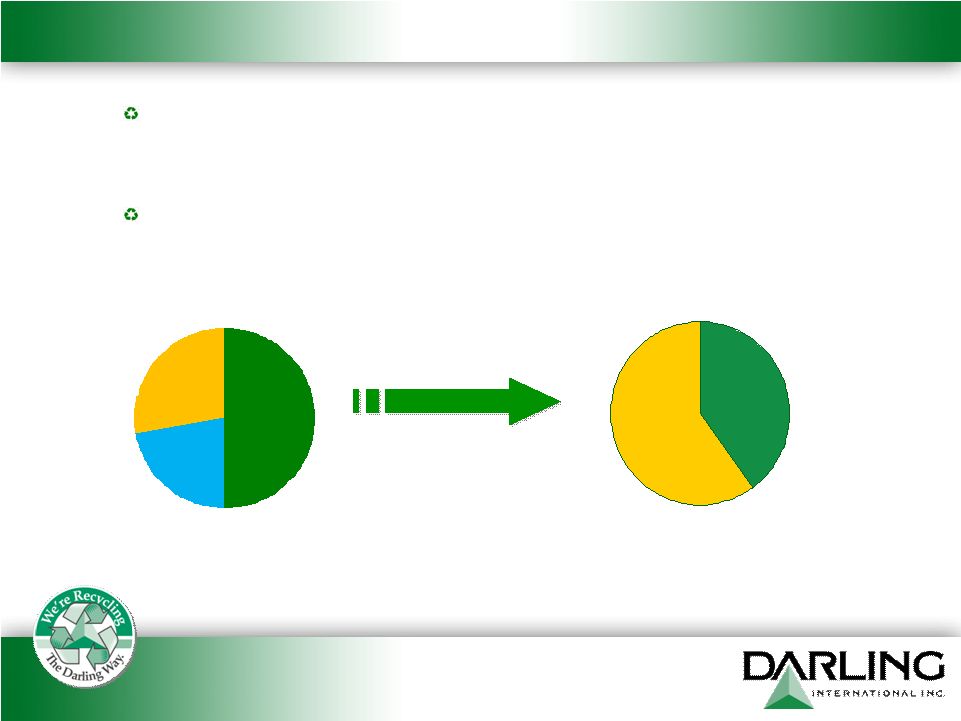 7 The industry we operate within: Animal and food by-product recycling industry is “mission critical”
in the food supply chain and is the most efficient and environmentally sound disposal alternative for a sustainable society. Over 59 billion pounds of inedible by-products generated annually from meat packers, poultry processors and retail food stores.
US Rendering Breakdown Non-Captive 40 % Integrated or Captive 60 % Inedible By-Product Origin Cattle 50% Swine 22 % Poultry 28 % Source: NRA/Harvard Risk Assessment |
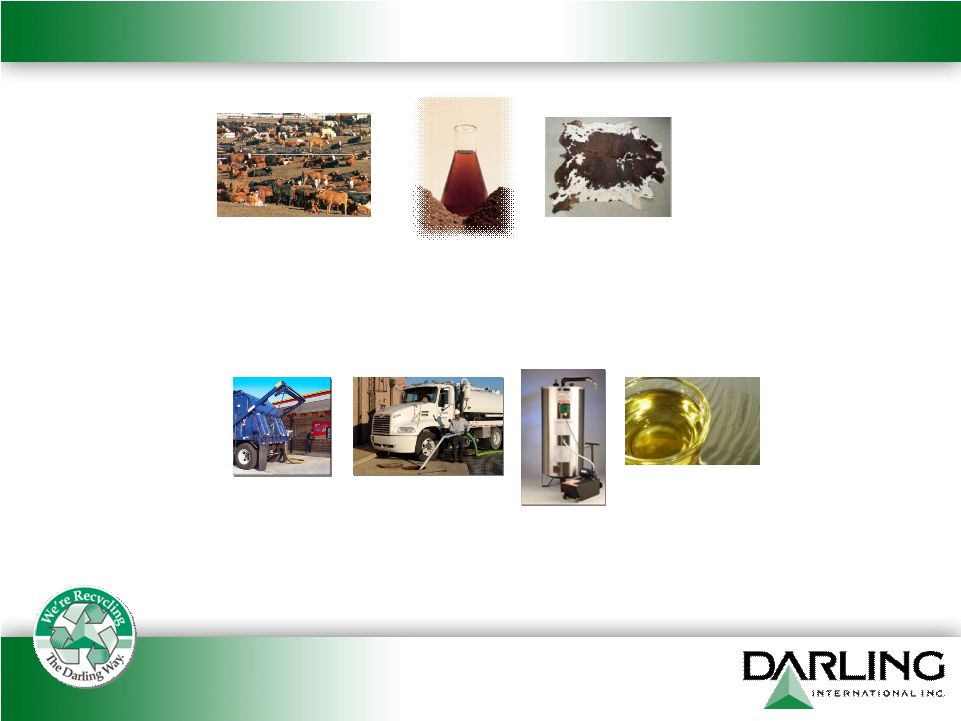 8 How we report: Rendering Rendering is the process of recycling animal and food waste products into useful
commercial goods, including tallow, protein meals (meat and bone meal), yellow grease, and hides. Restaurant Services Darling is the only US provider of collection, storage, transport, and recycling of
old grease on a national scale. |
 9 How the business operates: Darling operates a fleet of approx 1,000 trucks to collect raw materials from
approx 110,000 food service establishments, butcher shops, grocery stores, and
independent meat and poultry processors nationwide. “Formula” basis: Applied to approx 53% of Darling’s annual raw material volume; cost is tied to published finished product commodity prices after deducting a fixed service charge. “Non-formula” basis: Applied to remaining volume; suppliers are either paid a fixed price, are not paid, or are charged for the expense of collection, depending
on various economic and competitive factors Darling markets finished products worldwide. Primarily BFT and YG, and also MBM, a protein; Oils used in pet food, animal feed, soaps and biofuels; Oleo-chemical producers use oils to produce ingredients for paint, rubber, paper, concrete, plastics; MBM is used as high protein additives in pet food and animal feed Purchase & Collection Risk Management & Pricing Marketing, Sales & Distribution |
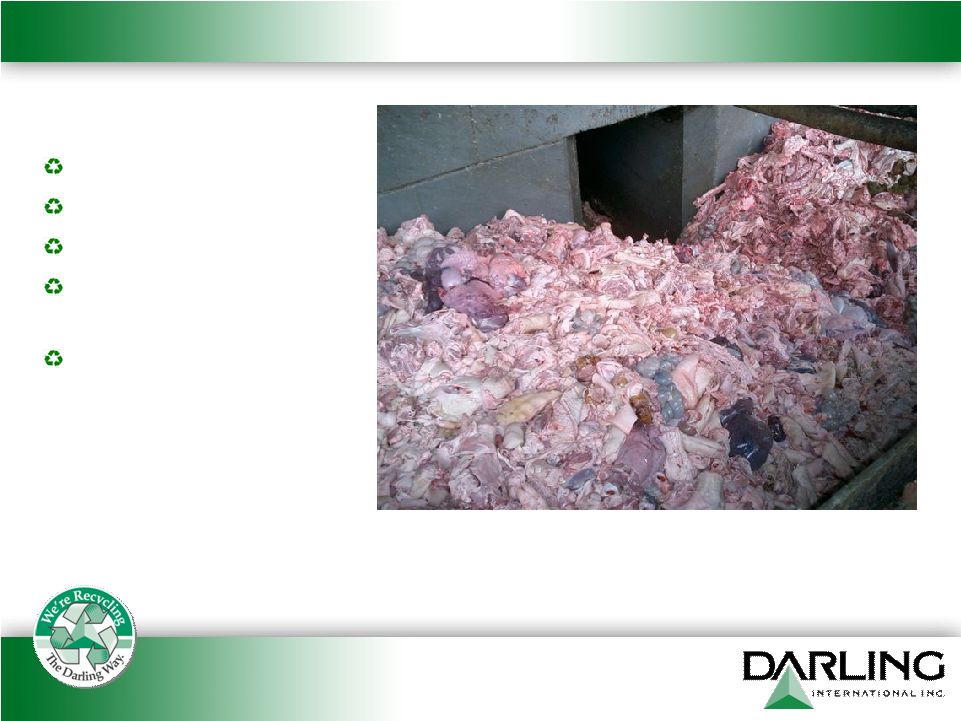 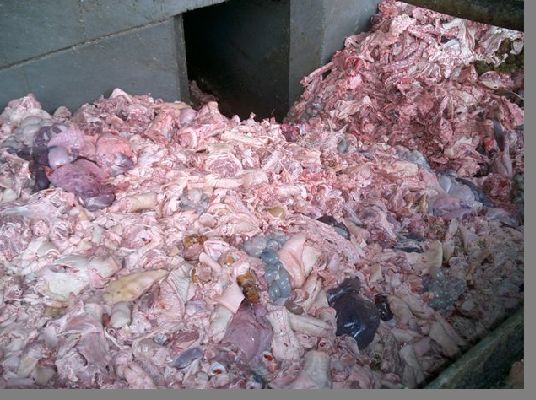 Rendering…..turning this … Offal Bones and fat Blood Animals dead on arrival, in transit or on farms Feathers 10 |
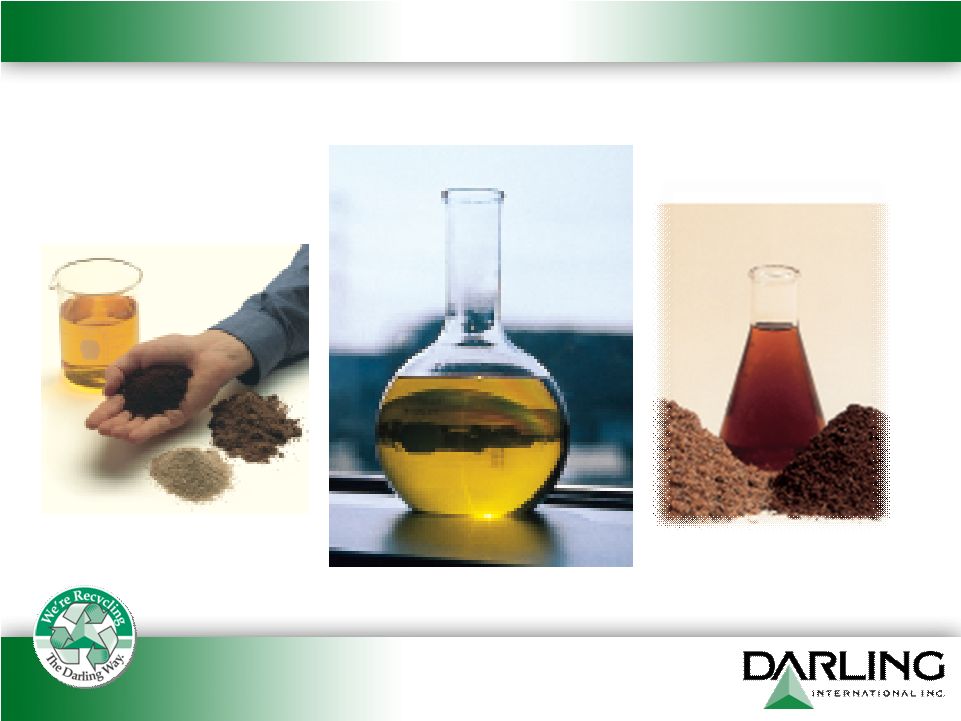 … into this 11 |
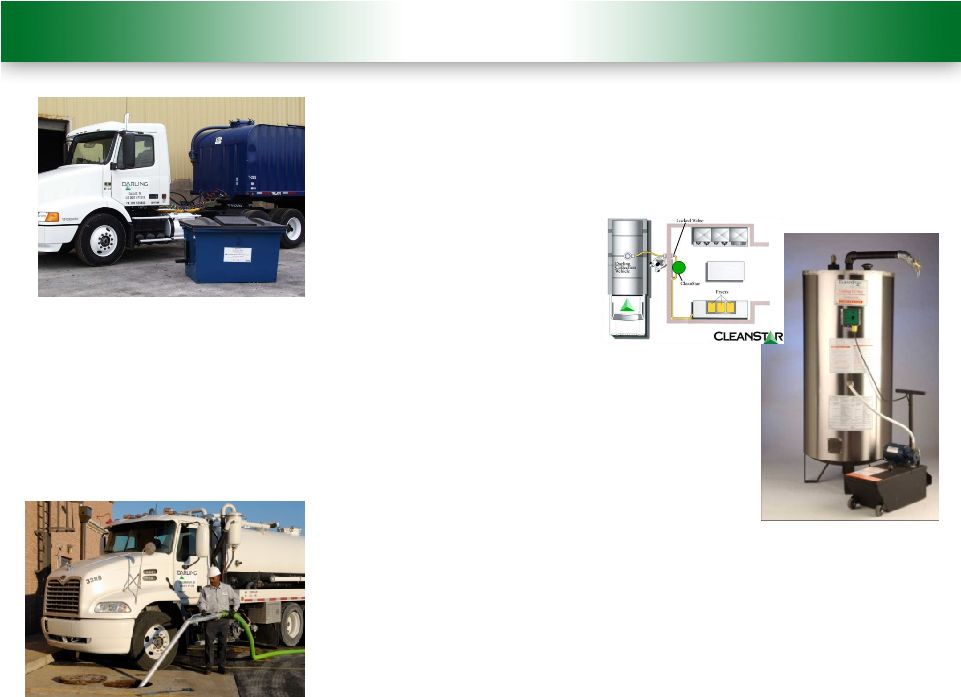 12 Restaurant Services Overview Basic Cooking Oil Removal (COR) Service – Complete, individualized used cooking oil collection services offered nationwide – recycling 100% of the used oil we collect Grease Trap Maintenance and Cleaning Service – Operates in 20 markets – Customers represent FSEs, malls and industrial food processors CleanStar® Used Cooking Oil Storage Tank System – Premium service offered in conjunction with COR – Installed inside or outside, this self-contained storage system offers a clean, efficient and safe storage and collection option
|
 13 A “One Stop” National Approach: Darling’s National Service Center (NSC) offers complete service management for all cooking oil removal, grease trap and rendering services. Manages grease and rendering related service needs. Ensures compliance for trap regulations and ordinances. 24 hr/day, 7 day/week high-quality customer service. Web-based records management system. |
 14 A proposed 50/50 Joint Venture Company between Darling and Valero |
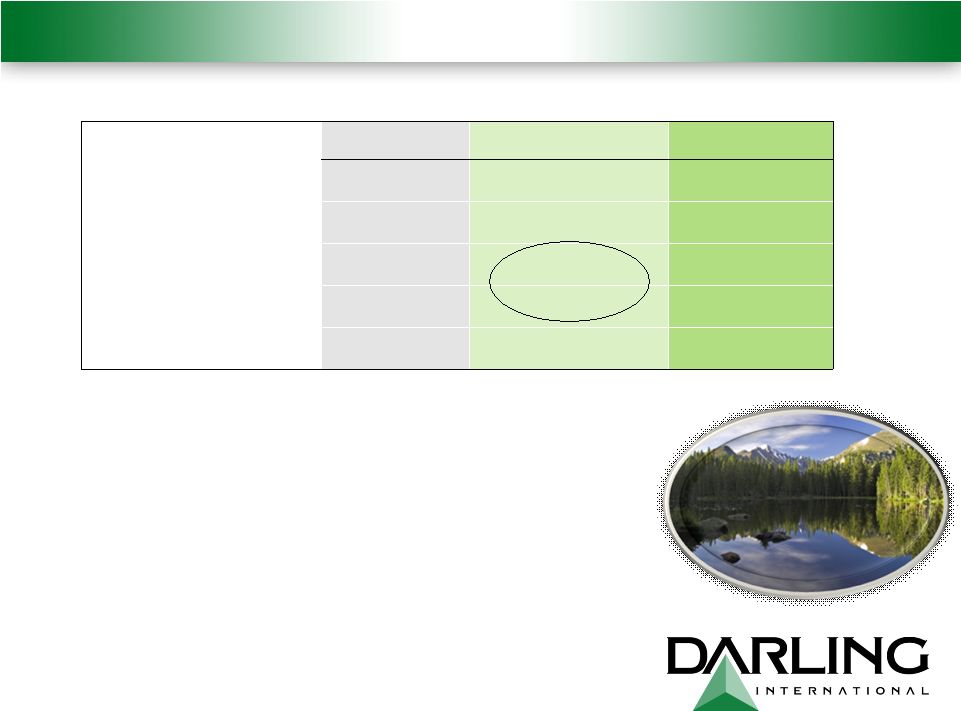 Valero and Darling have chosen Green Diesel! Animal fat based bio-diesel (TME) has not been embraced because of cold flow properties… hard to handle in the distribution system and variable quality. Petro-Diesel Biodiesel (FAME) Green Diesel NOx Emission Baseline + 10 -10 to 0 Cetane 40-55 50-65 75-90 Cold flow properties Baseline Poor Excellent Oxidative stability Baseline Poor Excellent Energy content Baseline Lower Similar 15 Pipeline ready….. |
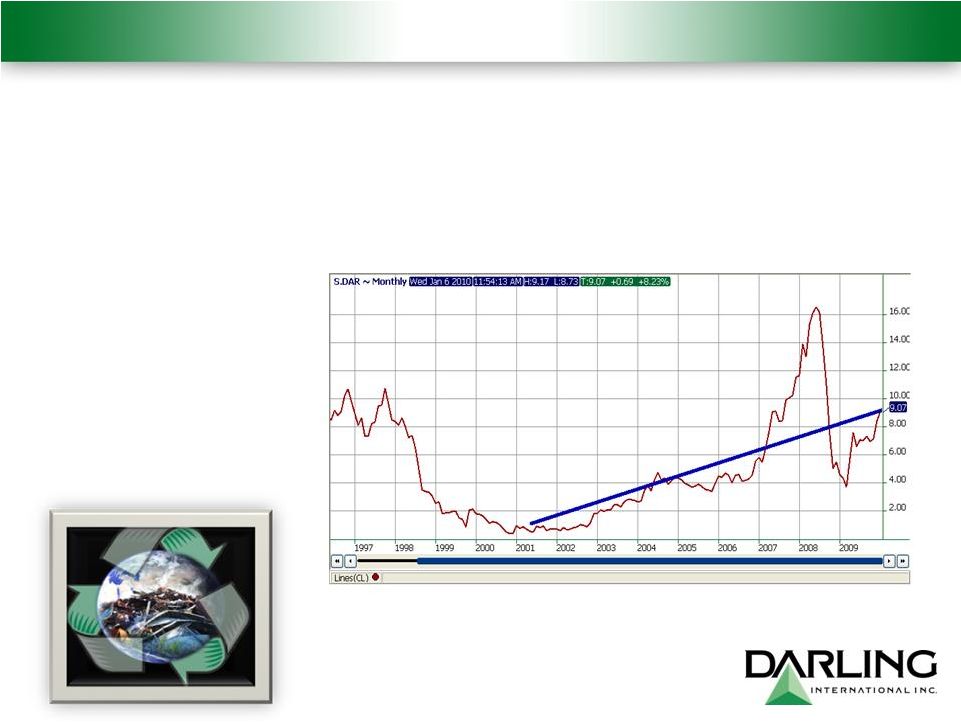 What Motivates Darling to do this? 16 |
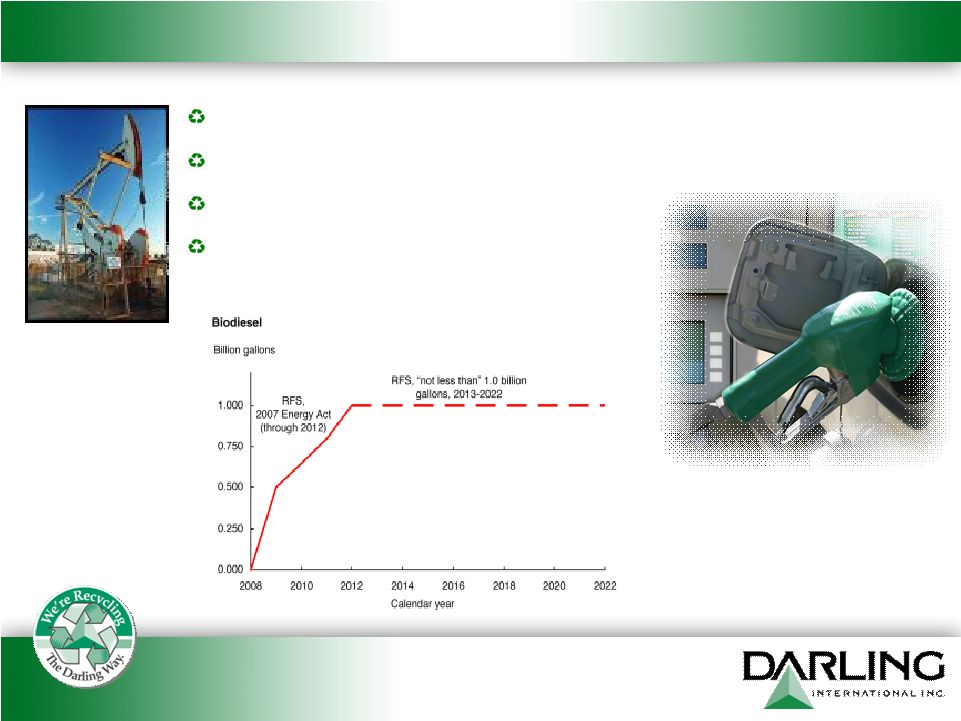 17 Darling is uniquely positioned RFS 2…mandates apply! “Similar to owning the oil field” Not a food oil (Feed vs. Fuel) Own the arbitrage! Source: National Biodiesel Board. |
 Darling owns an “Oil Field”… MIDWESTERN FEEDSTOCK Coldwater Indianapolis Mason City Chicago Berlin
Blue Earth Sioux City Denver Omaha (3) Bellevue Des Moines Clinton St. Louis Kansas City Wichita Tulsa Little Rock Dallas Houston WESTERN FEEDSTOCK EASTERN FEEDSTOCK Los Angeles Las Vegas Fresno Turlock San Francisco Boise Tacoma Cleveland Kendallville Newark Florida Georgia Representing about 15% of US Supply!....200mm gallons. 18 |
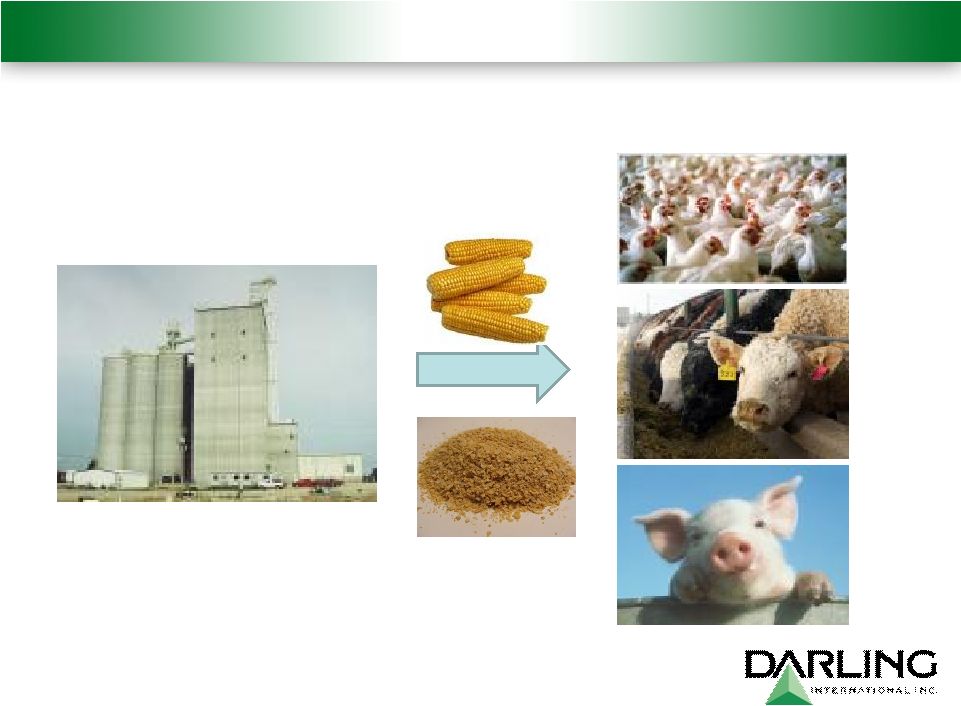 Darling‘s fats and oils have one use: Feed Fat calories supplement corn calories….. 19 |
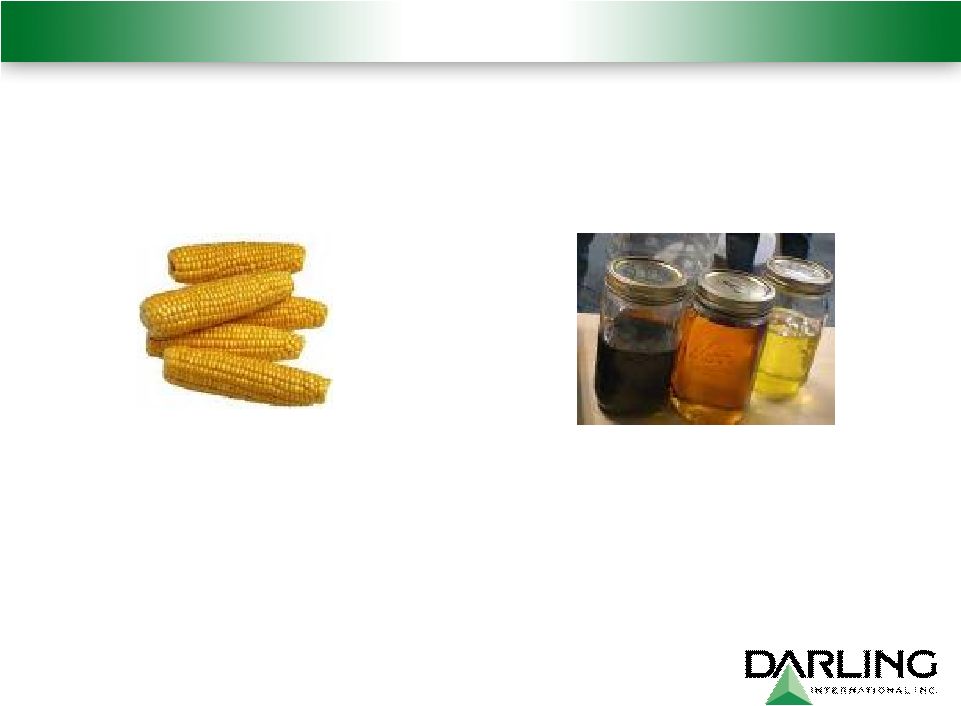 How is the value of fat determined? = Price per Bushel / 56 multiplied by 3.0 = The value of fats and greases 20 |
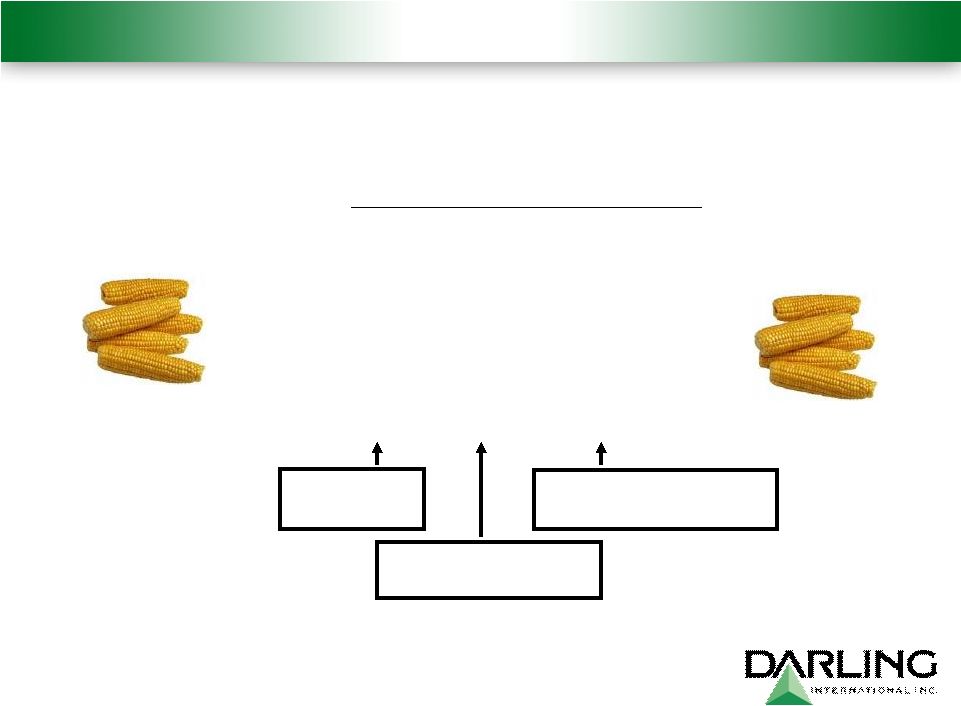 Corn…..understanding it‘s impact -----------Billions of annual
bushels--------- CORN NON-ETHANOL SURPLUS SUPPLY DEMAND NO ETHANOL 99/00
9.4 9.0 .4 00/01
9.9 9.2 .7 01/02
9.5 9.1 .4 02/03
9.0 8.5 .5 03/04
10.1 9.0 1.1 04/05
11.8 9.3 2.5 05/06
11.1 9.6 1.5 06/07
10.5 9.1 1.4 07/08
12.5 9.0 3.5 08/09
12.0 8.5 3.5 Increasing due to higher yields Non-ethanol demand is static at 9MM bushels Excess corn bushels priced by petroleum markets Grown on virtually same acreage over the last 10 Years? Will yield improvement end? 21 |
 A changing value proposition CRUDE OIL GASOLINE/DIESEL FUEL CORN Animal Fat & Used Cooking Oil Determines*the*price Heavily*influences*the*price Has*been*and*will*become*even*more*in*the*future*key*influence Primary*determinant*for*price ETHANOL 22 |
 Fat is more valuable as a fuel than as a feed Per # price Diesel fuel Per # price Tallow/YG Per # premium Fuel to feed Per # value Tax credit Per # premium Fuel after tax credit 23 2002 2003 2004 2005 2006 2007 2008 2009 AVERAGE .10 .12 (.02) .12 .14 .12 .17 (.05) .09 .14 .16 .17 (.01) .13 .14 .24 .17 .07 .21 .14 .27 .16 .11 .25 .14 .30 .26 .04 .18 .14 .41 .32 .09 .23 .14 .20 .22 (.02) .12 .14 .21 .19 .02 .16 .14 |
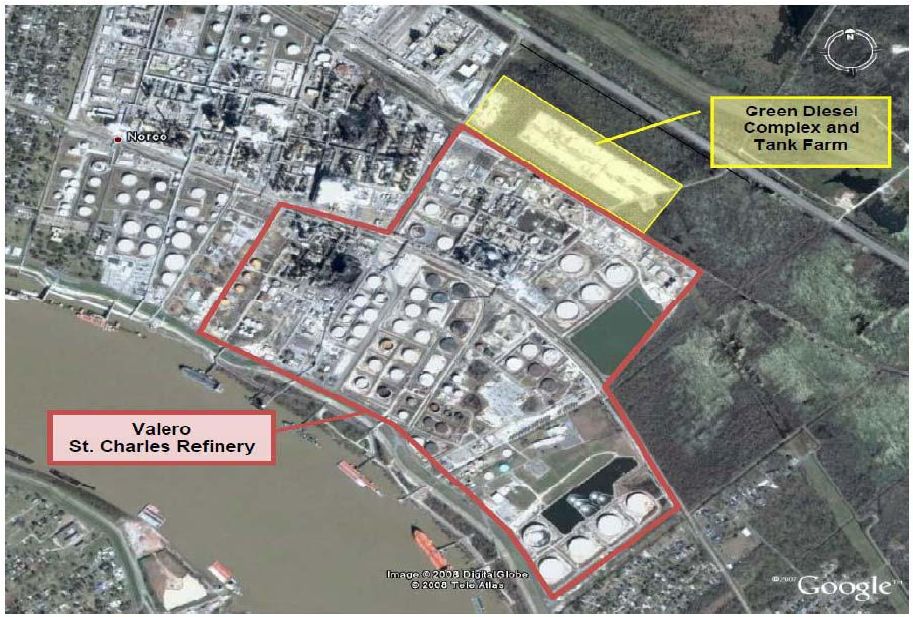 OVERVIEW OF ST. CHARLES REFINERY/GREEN DIESEL LOCATION ______________________________________________________________ 24 |
 Our Financials Our Financials March 2010 NYSE: DAR |
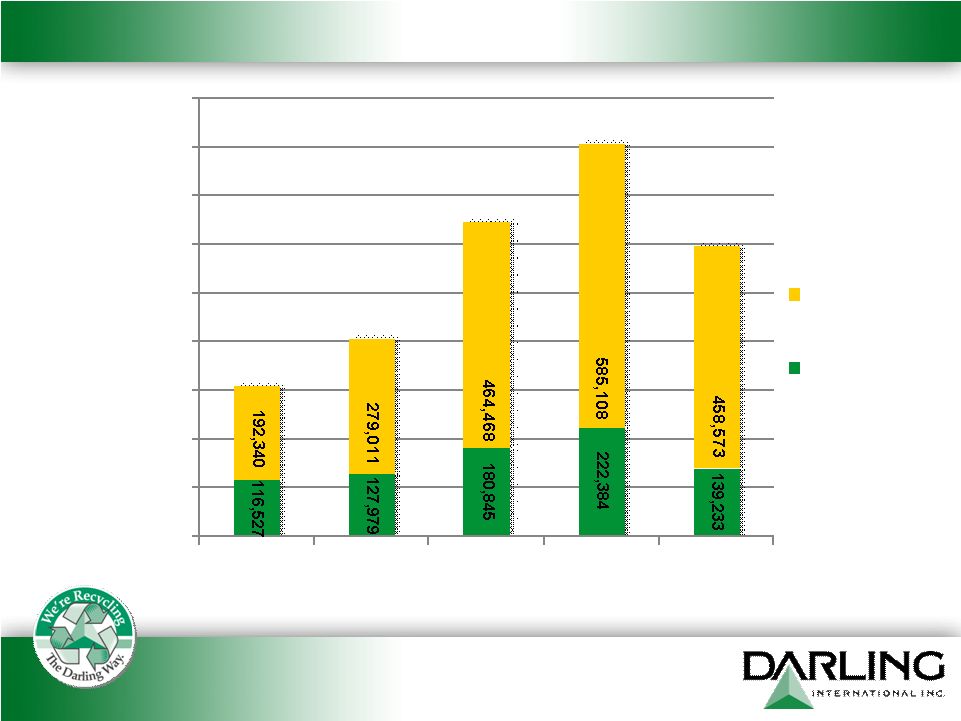 Revenue is commodity price influenced… 26 $0 $100,000 $200,000 $300,000 $400,000 $500,000 $600,000 $700,000 $800,000 $900,000 2005 2006 2007 2008 2009 Rendering Revenues Restaurant Services Revenues $308,867 $406,990 $645,313 $807,492 $597,806 |
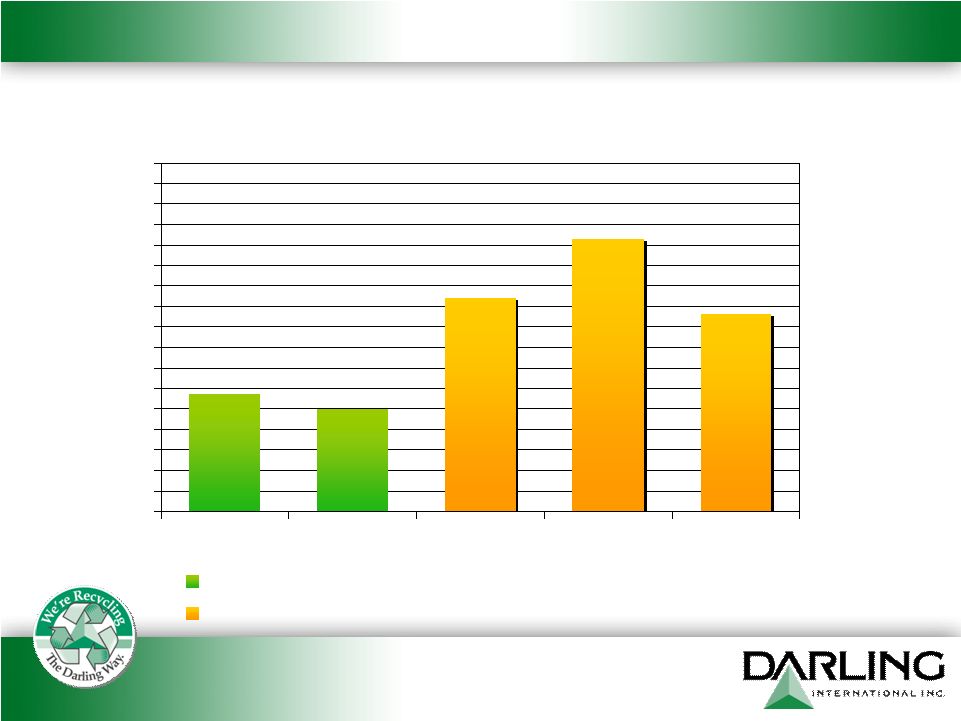 27 Operating Cash Flows (in millions) $49.9 $103.9 $133.0 $57.5 $96.2 $0 $10 $20 $30 $40 $50 $60 $70 $80 $90 $100 $110 $120 $130 $140 $150 $160 $170 2005 2006 2007 2008 2009 Darling & National By-Products Combined (Proforma) Darling International Inc. (Post - Acquisition) |
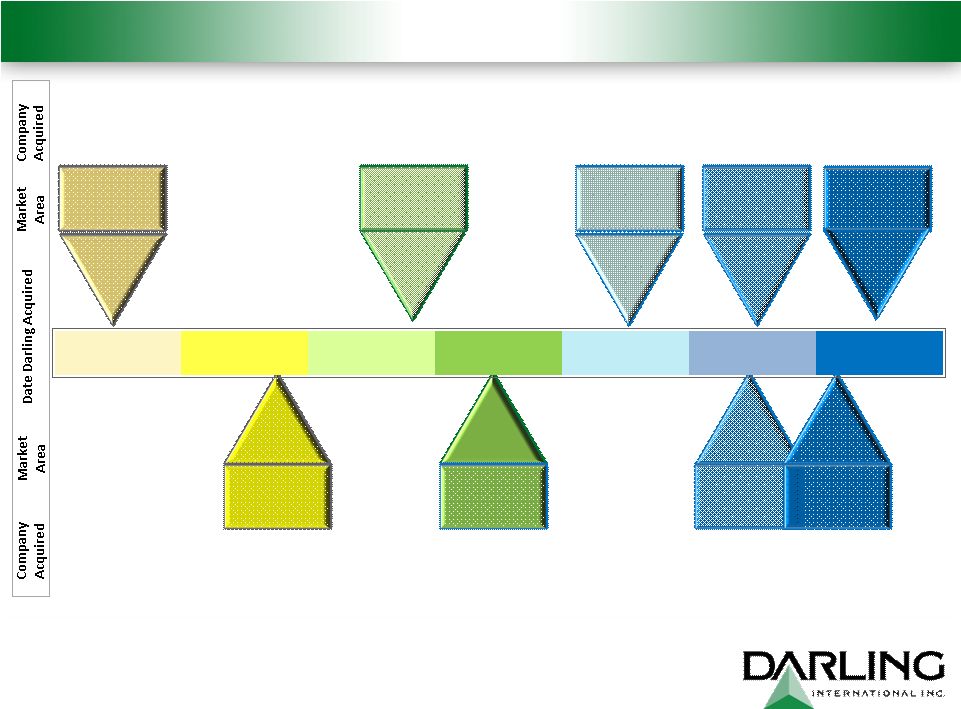 28 Core Business Growth through Acquisition 28 March 03 Dec 04 May 06 July 07 Dec 08 Feb 09 Aug 08 Oct 05 2003 2004 2005 2006 2007 2008 2009 Enviro Vac, Inc. FL, GA KC metro NYC metro GA GA So CA TX Burrows Industries, Inc. dba Minuteman Pumping Ace Grease Service J&R Rendering, Inc. Southeastern Maintenance & Construction Inc. National By-Products, LLC API Recycling, div of American Proteins Inc. Boca Transport, Inc. Midwest US Sanimax USA Great Lakes Dec 09 |
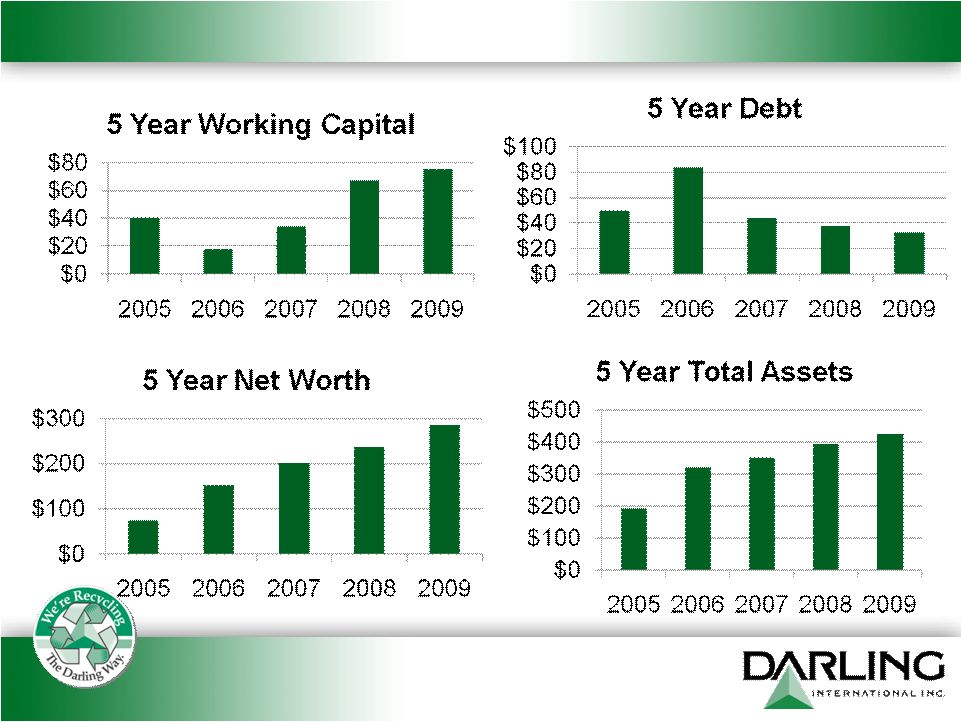 Key Financials 29 |
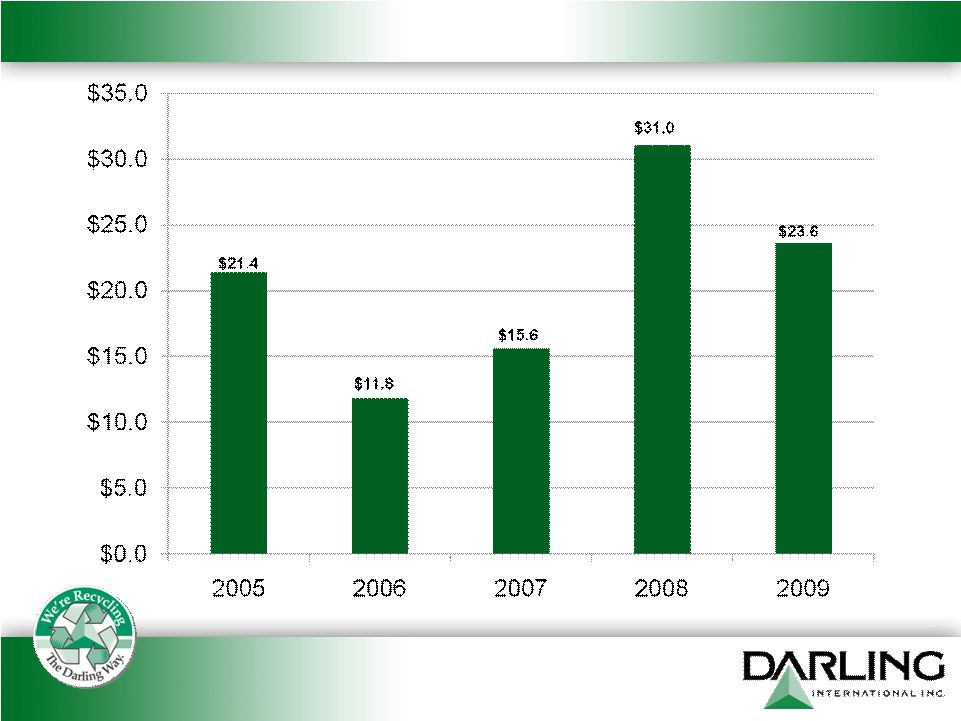 Capital Expenditures 30 Millions |
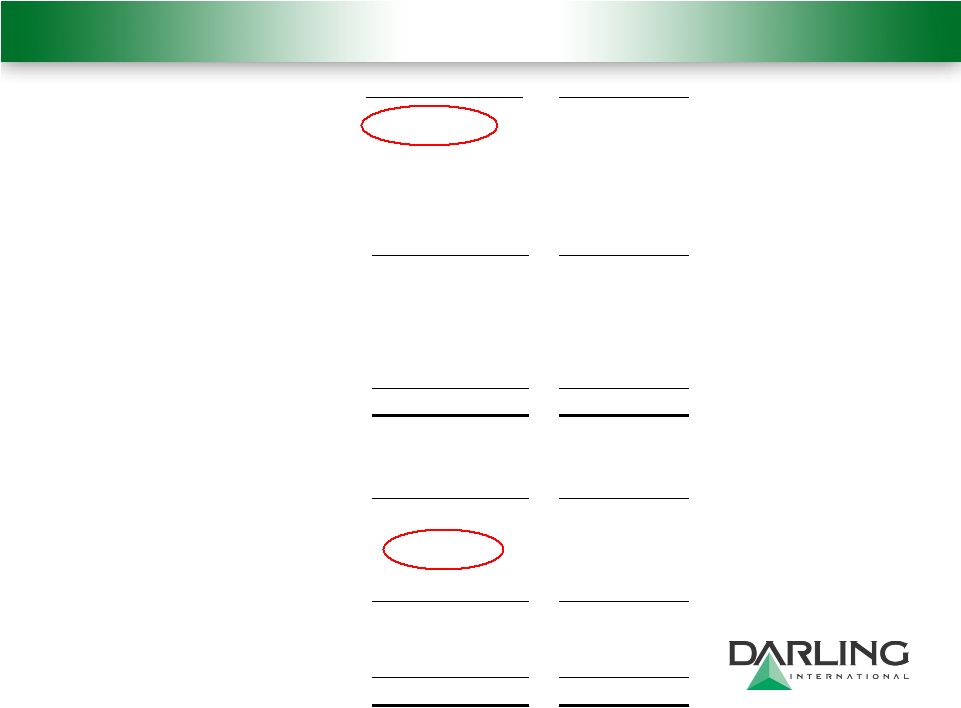 Balance Sheet 31 January 2, 2010 January 3, 2009 CASH $ 68,579 $ 51,263 ACCOUNTS RECEIVABLE 45,572 40,424 INVENTORIES 19,057 22,182 INCOME TAXES REFUNDABLE 605 11,248 OTHER CURRENT ASSETS 12,564 13,352 TOTAL CURRENT ASSETS 146,377 138,469 PROPERTY, PLANT & EQUIP 151,982 143,291 GOODWILL 79,085 61,133 OTHER 48,727 51,482 TOTAL ASSETS $ 426,171 $ 394,375 CURRENT PORTION - DEBT $ 5,009 $ 5,000 A/P AND ACCRUED EXPENSES 66,268 66,023 TOTAL CURRENT LIABILITIES 71,277 71,023 LONG-TERM DEBT, LESS CURRENT 27,539 32,500 OTHER LIABILITIES 42,478 54,274 TOTAL LIABILITIES 141,294 157,797 STOCKHOLDERS' EQUITY 284,877 236,578 TOTAL LIABILITIES AND EQUITY $ 426,171 $ 394,375 |
 “Darling*International*Inc.*is America’s*leading*provider*of*rendering, recycling*and*recovery*solutions*to the * nation’s*food*industry*… * converting valuable*waste*streams*into*sustainable feed*and*fuel*products.” 32 |
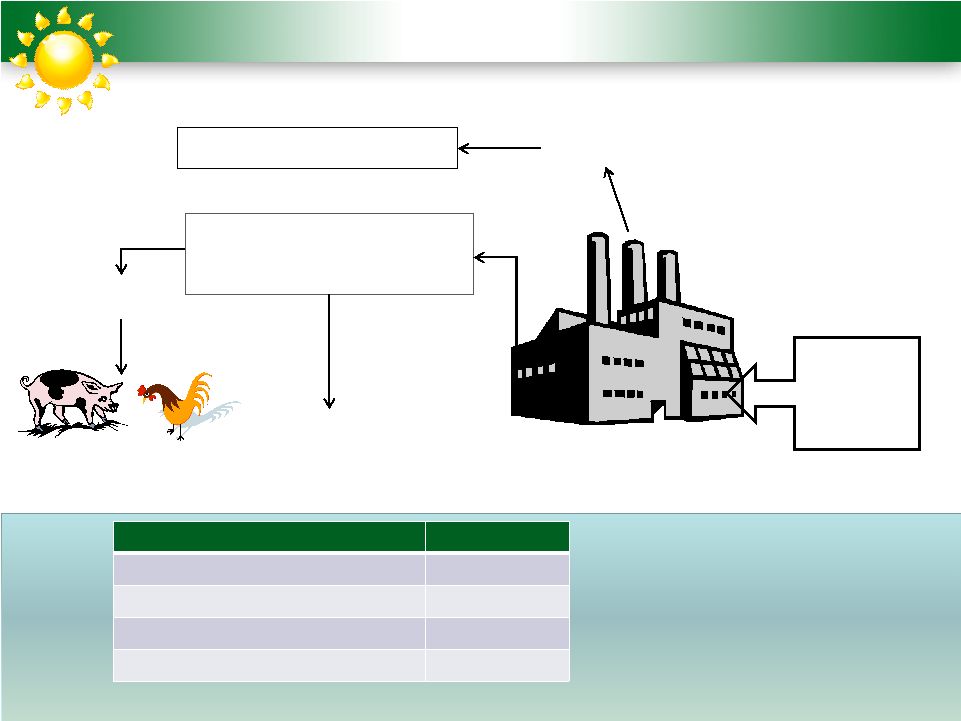 Darling Captures and Recycles Carbon (Emissions per 1000 lb raw material) Rendering Facility 573 kg CO eq avoided by recycling 64 kg CO 2 Industrial uses and biofuels Feed Material Darling recycles in a year: Carbon Darling captures, lb/year 1.23 billion CO2 Darling avoids, metric ton/year 2.1 million CO2 emitted per metric ton avoided 0.14 metric ton GHG avoided ,metric ton/year* 4 million Atmospheric CO *Avoided when materials are rendered rather than composted, based on a study by Xu et al., 2008 Animal Byproducts & Mortalities 33 2 2 |
 34 The RECYCLING COMPANY of YESTERDAY… The CARBON CARBON FRIENDLY FRIENDLY FUEL COMPANY of TOMORROW |
