Attached files
| file | filename |
|---|---|
| EX-31.1 - CERTIFICATION CEO - AUTHENTEC INC | ex31-1.htm |
| EX-23.2 - CONSENT OF PRINCIPAL, PCE VALUATION, LLC - AUTHENTEC INC | ex23-2.htm |
| EX-23.1 - CONSENT OF PRICEWATERHOUSE COOPERS, LLP - AUTHENTEC INC | ex23-1.htm |
| EX-31.2 - CERTIFICATION CFO - AUTHENTEC INC | ex31-2.htm |
| EX-32.2 - CERTIFICATION CFO - AUTHENTEC INC | ex32-2.htm |
| EX-32.1 - CERTIFICATION CEO - AUTHENTEC INC | ex32-1.htm |
United States
SECURITIES AND EXCHANGE COMMISSION
Washington, D.C. 20549
FORM 10-K
(Mark One)
|
x
|
ANNUAL REPORT PURSUANT TO SECTION 13 OR 15(d) OF THE SECURITIES EXCHANGE ACT OF 1934
For the fiscal year ended January 1, 2010
|
OR
|
¨
|
TRANSITION REPORT PURSUANT TO SECTION 13 OR 15(d) OF THE SECURITIES EXCHANGE ACT OF 1934
For the transition period from to .
|
Commission File Number 001-33552

AuthenTec, Inc.
(Exact name of Registrant as Specified in its Charter)
|
Delaware
|
59-3521332
|
|
(State or Other Jurisdiction of
Incorporation or Organization)
|
(I.R.S. Employer
Identification No.)
|
|
100 Rialto Place, Suite 100, Melbourne, Florida
|
32901
|
|
(Address of Principal Executive Offices)
|
(Zip Code)
|
Registrant’s Telephone Number, Including Area Code: (321) 308-1300
Securities Registered Pursuant to Section 12(b) of the Act:
|
Title of Each Class
|
Name of Exchange on Which Registered
|
|
|
Common Stock, $0.01 par value
|
Nasdaq Stock Market, LLC
|
Securities Registered Pursuant to Section 12(g) of the Act: None
Indicate by check mark whether the registrant is a well-known seasoned issuer, as defined in Rule 405 of the Securities Act. Yes ¨ No x
Indicate by check mark if the registrant is not required to file reports pursuant to Section 13 or 15(d) of the Exchange Act. Yes ¨ No x
Indicate by check mark whether the registrant (1) has filed all reports required to be filed by Section 13 or 15(d) of the Securities Exchange Act of 1934 during the preceding 12 months (or for such shorter period that the registrant was required to file such reports), and (2) has been subject to such filing requirements for the past 90 days. Yes x No ¨
Indicate by check mark whether the registrant has submitted electronically and posted on its corporate Web site, if any, every Interactive Data File required to be submitted and posted pursuant to Rule 405 of Regulation S-T (§ 232.405 of this chapter) during the preceding 12 months (or for such shorter period that the registrant was required to submit and post such files). Yes ¨ No ¨
Indicate by check mark if disclosure of delinquent filers pursuant to Item 405 of Regulation S-K (§ 229.405) is not contained herein, and will not be contained, to the best of registrant’s knowledge, in definitive proxy or information statements incorporated by reference in Part III of this Form 10-K or any amendment to this Form 10-K. ¨
1
Indicate by check mark whether the registrant is a large accelerated filer, an accelerated filer, a non-accelerated filer, or a smaller reporting company. See the definitions of “large accelerated filer,” “accelerated filer” and “smaller reporting company” in Rule 12b-2 of the Exchange Act. (Check one):
|
Large accelerated filer
|
¨
|
Accelerated filer
|
x
|
|
Non-accelerated filer
|
¨
|
Smaller reporting company
|
¨
|
Indicate by check mark whether the registrant is a shell company (as defined in Rule 12b-2 of the Act). Yes ¨ No x
The aggregate market value of the registrant’s common stock held by non-affiliates computed by reference to the NASDAQ Global Market closing price on July 3, 2009 (the last business day of the registrant’s most recently completed second fiscal quarter) was approximately $50,001,000. The number of shares of the registrant’s common stock outstanding as of March 17, 2010 was 29,900,986. Documents Incorporated By Reference: Certain sections of AuthenTec, Inc.’s definitive Proxy Statement for use in connection with its 2010 annual meeting of stockholders, to be filed subsequently, are incorporated by reference into Part III of this Annual Report where indicated.
2
AUTHENTEC, INC.
TABLE OF CONTENTS
|
Page No.
|
||
| PART I | ||
|
Item 1.
|
Business
|
4
|
|
Item 1A.
|
Risk Factors
|
17
|
|
Item 1B.
|
Unresolved Staff Comments
|
27
|
|
Item 2.
|
Properties
|
27
|
|
Item 3.
|
Legal Proceedings
|
27
|
|
Item 4.
|
Submission of Matters to a Vote of Security Holders
|
28
|
| PART II | ||
|
Item 5.
|
Market for Registrant’s Common Equity, Related Stockholder Matters and Issuer Purchases of Equity Securities
|
28
|
|
Item 6.
|
Selected Consolidated Financial Data
|
29
|
|
Item 7.
|
Management’s Discussion and Analysis of Financial Condition and Results of Operations
|
31
|
|
Item 8.
|
Consolidated Financial Statements and Supplementary Data
|
44
|
|
Item 9.
|
Changes in and Disagreements with Accountants on Accounting and Financial Disclosure
|
72
|
|
Item 9A.
|
Controls and Procedures
|
72
|
|
Item 9B.
|
Other Information
|
72
|
| PART III | ||
|
Item 10.
|
Directors, Executive Officers and Corporate Governance
|
73
|
|
Item 11.
|
Executive Compensation
|
73
|
|
Item 12.
|
Security Ownership of Certain Beneficial Owners and Management and Related Stockholder Matters
|
73
|
|
Item 13.
|
Certain Relationships and Related Transactions, and Director Independence
|
73
|
|
Item 14.
|
Principal Accountant Fees and Services
|
73
|
| PART IV | ||
|
Item 15.
|
Exhibits, Financial Statement Schedules
|
73
|
|
SIGNATURES
|
77
|
|
3
CAUTIONARY STATEMENT RELATING TO THE SAFE HARBOR PROVISIONS OF THE PRIVATE SECURITIES LITIGATION REFORM ACT OF 1995
This Annual Report on Form 10-K contains statements relating to expected future results and business trends that are based upon our current estimate, expectations, and projections about the industry, and upon our beliefs, and certain assumptions we have made that are “forward-looking statements” as defined in the Private Securities Litigation Reform Act of 1995. Words such as “anticipates,” “guidance,” “expects,” “intends,” “plans,” “believes,” “seeks,” “estimates,” “may,” “will,” “prospects,” “outlook,” “forecast,” and variations of these words or similar expressions are intended to identify “forward-looking statements.” In addition, any statements that refer to expectations, projections, or other characterizations of future events or circumstances, including any underlying assumptions, are “forward-looking statements.” Such statements are not guarantees of future performance and are subject to certain risks, uncertainties, and assumptions that are difficult to predict. Therefore, our actual results may differ materially and adversely from those expressed in any “forward-looking statement” as a result of various factors. These factors include, among others, those discussed under “Risk Factors” in Part I, Item 1A of this Annual Report and “Management’s Discussion and Analysis of Financial Condition and Results of Operations” in Part II, Item 7 of this Annual Report, and each of the following factors: the timely introduction of new products, demand for, and market acceptance of those products in our target markets, our ability to secure design-wins and these design-wins leading to future production, the adoption of our products in new applications, the rate at which we increase our activity and opportunities in the wireless market, the introduction of new software products and the ability to generate any revenues based on those new products, changes in product mix, the actions of existing or future competitors, our ability to successfully complete and integrate strategic acquisitions, the impact of litigation and the impact of the macroeconomic trends on our served markets as well as other risks detailed from time to time in our filings with the Securities and Exchange Commission. These “forward-looking statements” are made only as of the date hereof, and we undertake no obligation to update or revise the “forward-looking statements,” whether as a result of new information, future events or otherwise.
PART I
In this report, the words “AuthenTec,” “the Company,” “we,” “us” and “our” refer to AuthenTec, Inc. and our wholly owned subsidiaries.
|
Item 1.
|
Business
|
Company Overview
We are a leading provider of security, identity management and touch control technologies for PC, wireless device and information technology (IT) markets. We provide a series of products including fingerprint sensors, software and intellectual property (IP) cores that provide security, convenience, personalization and navigation features in such end products as PCs, cell phones, printers, network servers and many other products.
Since our inception in 1998, we have shipped over 50 million sensors most of which have been integrated into laptops, desktops and PC peripherals as well as over 10 million mobile phones and wireless devices. In 2009, we shipped 10.3 million sensors, compared to 17.7 million sensor units in 2008 and 12.7 million sensor units in 2007, as the weak economy negatively affected customer demand for certain end products that our sensors were incorporated into. Correspondingly, our revenue decreased to $34.1 million in 2009 compared to $63.9 million in 2008.
In the last two years, we generated revenue from approximately 50 customers, including some of the world’s leading PC and wireless device manufacturers and their suppliers. These companies have included Acer, Inc., ASUSTeK Computer, Inc., Dell Inc., Fujitsu Ltd., Hewlett-Packard Company, High Tech Computer Corp., Lenovo Group Limited, LG Electronics Inc., Samsung Electronics Co., Ltd., and Toshiba Corporation.
We continue to evolve from a mixed-signal semiconductor component supplier to the provider of complete solutions focused on security, identity management and touch control solutions, including smart fingerprint sensors, identity management software and IP products and services. Our new generation of TruePrint smart sensors and TrueSuite identity management software provide users secure one-touch access to favorite websites, online social networks and their digital identity. Furthermore, in February of 2010, we acquired the SafeNet, Inc. Embedded Security Division and now provide a series of security IP and software products under the TrueProtect brand name. All of these products can be sold individually or as part of higher value system solutions.
Over the past several years, fingerprint sensors have grown in features and functionality, and continue to be integrated into new computing and wireless communication devices. These devices store an increasing amount of sensitive and valuable personal and corporate data, yet are highly vulnerable to loss, theft, intrusion and fraud. In light of these vulnerabilities, the enhanced security features provided by our solutions have become increasingly important. Moreover, beyond security and identity management, our smart fingerprint sensors now offer touch control functionality. Thanks to advances in sensor design and navigation software, our sensors can translate movement of a finger across the sensor into touch control in cell phones, netbooks and other products.
4
Our customers continue to be interested in adding new features to, and enhance the functionality of, their products including the demand for integrated and convenient security, identity management and touch control solutions. Our research, development and marketing efforts are primarily focused on the following markets which are characterized by significant unit volumes:
|
•
|
PCs: laptops, netbooks, desktops and PC peripheral products, such as memory keys, hard drives, keyboards, mice and other devices; and
|
|
•
|
Wireless devices: cellular phones and other wireless communication devices, particularly smart phones and higher end feature phones.
|
Regarding the PC market, we estimate that approximately 10-15% of laptops shipped in 2009 contained an integrated fingerprint sensor. After growing rapidly, the percentage of laptops integrating fingerprint sensors decreased in 2009 from 2008 levels, we believe as a result of the economic slowdown and higher sales growth of lower-cost laptops that did not include a fingerprint sensor. As part of our response to these changing market conditions, we introduced our newest smart sensor, the AES1660 fingerprint sensor for the PC market during 2009. The AES1660 smart sensor offers lower costs, increased functionality, improved biometric performance, low-power consumption, multiple packaging options, LED drivers and a low bill of materials (BOM) cost. The AES1660 is ideally suited for today's growing consumer notebooks and netbook markets where size, performance, durability and low costs are key considerations. We also introduced a slightly larger version of the product, the AES2660 early in 2010 and plan further packaging options in 2010 as well.
Complementing our newest smart sensors for the PC market, we also introduced our new TrueSuite identity management software application during 2009. TrueSuite is an identity management software application designed to be very easy and convenient for the end user/consumer. TrueSuite is tailored for consumers and users who demand simplicity, improved usability, and one-touch access to their digital ID and social networks. TrueSuite is the result of a year long development effort which started with our software asset purchase of EZ-Validation in 2008. Optimized for Microsoft’s Windows 7 operating system when introduced, TrueSuite is expected to be integrated into new laptop models during 2010. We also plan to extend the capability of TrueSuite to our older sensors integrated into millions of laptops over the last few years.
All of the sensors we develop are based on our patented TruePrint technology, and thus, we believe are the most accurate, reliable, cost-effective, easy to use, small and versatile products commercially available today. Unlike most competing sensor technologies which read the skin’s surface layer, our TruePrint technology is capable of obtaining high-density images from fingers under virtually any condition by reading the live layer below the skin’s surface. This technology also allows us to build sensors that use less silicon than competing silicon-based technologies, making our solution well suited for our target markets where small form factor and cost are critical determinants. Because TruePrint technology uses radio frequency (RF) technology, our sensors can also image fingerprints through thicker coatings.
Leveraging this feature of TruePrint, we developed a new packaging technology named TouchStone which is a more durable and aesthetically pleasing packaging technology, increasingly important attributes in today’s PC and cell phone markets. TouchStone also provides a smooth surface for a better “feel” while using our navigation features and will eventually be offered in colors. The first products with TouchStone were offered in 2009 in cell phones in Japan and our first product designed specifically to use TouchStone, the AES1750, was introduced in February 2010 at the GSMA Mobile World Congress.
Wireless device manufacturers in certain countries, particularly in Japan, have incorporated our sensors into their products in order to support security, mobile commerce (“M-commerce”) applications and touch control (navigation) features. M-commerce is the use of a wireless device for personal financial transactions including credit or debit transactions. Most recently, and associated with our newest smart sensors, particularly the AES1750, wireless device customers have shown strong interest in leveraging the capabilities of our sensors for touch-based navigation in addition to their security and identity management functions.
The technology behind this touch-based navigation, TrueNav, allows the sensor to be used for 360 degrees of directional control for phone functions including turbo scrolling through long lists and documents, camera zoom, media player control (volume, play, fast forward, rewind, pause, skip, etc.), mouse mode, precise text cursor positioning, Web browser scrolling and a new feature called “Quick Gesture,” which provides the user with the ability to select one of four favorite Websites or applications with the single swipe of a finger. Functionality of our smart sensors is further enhanced by TrueYou, a feature that allows each finger to be used for a specific function, using for example each finger for a separate speed dial on a phone or for launching a specific PC application or Website.
5
We expect the attach rates for fingerprint sensors in the wireless market to grow in 2010 due to increased growth in Japan, but also due to interest outside of Japan as well. In 2009, LG introduced the first fingerprint enabled smart phone in the US market. Referred to as the LG eXpo®, the phone was introduced by AT&T and the sensor is used for both security and navigation.
We believe we are well positioned to benefit from our focus during 2009 on developing and introducing new hardware and software products and features. While our PC market share will decrease in 2010 based on OEM customer decisions made in previous years, we believe our company will benefit from new design wins based upon these new solutions, an expected improvement in overall economic conditions, new design wins for 2010 and 2011 PC products, and increased interest from cell phone OEMs worldwide.
Our headquarters is located in Melbourne, Florida, and we have development centers in Melbourne, Florida and Shanghai, China. We also have sales and application engineering offices in several locations throughout the United States, Europe and Asia to service our global customer base. We had 126 full-time employees worldwide as of January 1, 2010, of which over 80% were in research and development, and selling and marketing.
Industry Overview
The Increasing Need for Authentication
The proliferation of portable computing and communications devices including laptop PCs and wireless devices has been driven by improvements in computing power, battery life, performance, communications infrastructure and decreases in cost and size. There has been a corresponding growth in the amount of electronic data accessed and exchanged due to the increasing number of applications that manage, manipulate, store, transmit and secure such information, as well as those that facilitate electronic commerce (“E-commerce”) and M-commerce. Businesses and consumers increasingly use a variety of devices, including PCs and wireless devices, to store and transmit sensitive data electronically. These devices are often shipped with minimal authentication protection, if any, and can be easily manipulated by unauthorized users should the devices be lost or stolen.
Effective identification and authentication systems controlling access to sensitive information are critical to the safety and integrity of data, transactions and communications. Security breaches and fraud resulting from failures in authentication and identification systems can cause economic harm for individuals and corporations and have become chief concerns for businesses and consumers alike. Today, the primary method of protecting and securing electronic information is through the use of passwords. The average person must remember multiple passwords and regularly uses common identifiers such as maiden names and birthdays as passwords. These types of passwords are not foolproof and can be relatively easy to copy, lose, forget or have stolen. As a result of poor computer security and the proliferation of mobile electronic devices used to store large amounts of information, including databases of personal information, the potential for a corporate data breach that result in consumer identity theft is increasing.
In addition, growing concerns about personal privacy and information security in businesses have driven interest in and requirements for convenient identity management solutions. Business security concerns continue to increase, driven by compliance requirements for privacy such as the Health Insurance Portability and Accountability Act of 1996 (HIPAA), Sarbanes-Oxley, and the Financial Services Modernization Act of 1999, as well as growth in a workforce requiring access to company networks via mobile devices.
According to the Privacy Rights Clearinghouse, a non-profit consumer advocacy group, over 342 million personal information records were reported as compromised due to data device loss, theft, or hacking from January 2005 through December 2009. In addition, the lost business of disconcerted customers, escalating legal and public relations expenses, and other costs associated with breaches are costing companies millions of dollars each year. According to its fifth annual survey, the Ponemon Institute, an independent research firm, reports that data breach incidents cost U.S. companies $204 per compromised customer record in 2009 with an average total per-incident cost of $6.75 million in 2009.
6
Our Target Markets
To respond to a more electronically oriented and mobile society, we expect that our customers will increasingly demand security and identity management that provide their end users with confidence that their sensitive personal and corporate information will not be compromised. We also believe our customers are looking for newer touch control technologies as either a complement to touch screen technologies or as the primary navigation capability if a touch screen is not included. To achieve this, we believe device manufacturers will require the integration of smart fingerprint sensor technologies into their products that are low-cost, easy to use, reliable, accurate, fast, multi-functional, small in size and capable of reading fingerprints under virtually any condition. Our target markets include:
|
•
|
PCs. The PC market, particularly laptops, currently represents the largest market segment using fingerprint sensors. Demand for our PC products is being driven by the need for increased security to protect personal and corporate data stored on the PC and the networks to which it connects, and by the convenience of replacing logins and passwords with the simple swipe of a finger. According to IDC, a leading market research and analysis firm, approximately 165 million laptops were shipped worldwide in 2009. Of this amount, we believe approximately 10-15% of laptops had an integrated fingerprint sensor, down from an estimated 15%-20% in 2008. Weakening macroeconomic conditions have accelerated the growth in sales of lower-cost laptops, including netbooks, which have more often not included a fingerprint sensor as a standard feature compared to more expensive laptops. To help penetrate the lower-cost segment of the market, we introduced a complete solution for netbooks and lower-cost laptops during 2009, which includes our AES1660 smart sensor and TrueSuite identity management software.
Although the adoption of fingerprint sensors has been somewhat limited in desktop PCs and PC peripherals, these additional markets represent significant opportunities for our products.
|
|
•
|
Wireless Devices. We believe the integration of fingerprint sensors into wireless devices is in its early stages and will accelerate consistent with the adoption rates of other wireless device features that first found acceptance in the Japanese market such as camera functionality, internet access and mobile television. According to research firm IDC, the mobile phone market declined 5.2% from 2008, with all mobile phone vendors worldwide shipping 1.13 billion units in 2009. However, the segment of the mobile phone market with the highest attach rate of fingerprint sensors – smart phones – grew 15% during 2009, up from 151.4 million units in 2008, and clearly outpacing the rest of the industry according to IDC. We believe the demand for our products will grow as mobile phone manufacturers and mobile phone users discover the multi-functional benefits of our fingerprint sensors, including convenient security, personalization and touch control. More mobile phone manufacturers are leveraging the personalization features of our sensors, which associate different phone functions and applications with different fingers, as well as the touch-powered navigation features offered by our products.
|
In addition to these target markets, our products are used in physical access control products, including door locks, smart cards, and other devices.
Biometrics Background
Biometrics is the process of gathering and processing a certain set of physical or behavioral characteristics in order to identify an individual. Government and law enforcement agencies were the first to develop and adopt biometric technologies with a focus on fingerprint biometrics. In the United States, law enforcement agencies have long used both manual and electronic methods for collecting and comparing fingerprints. Other countries have similar systems which have been used for a variety of purposes from criminal background checks to voter registration. Today, there are several types of biometric alternatives including fingerprint, iris scan, voice authentication, retina scan, hand geometry, and facial scan. These alternatives provide varying levels of identification and authentication success. For example, iris scan and retina scan technologies have been adopted, but are generally expensive and require a significant amount of equipment to deploy a solution. As a result, these technologies are being used on a limited basis, and primarily in lower volume governmental, law enforcement or physical access control applications. Other biometric alternatives, such as facial recognition, have proven to be inexpensive but are reportedly vulnerable to spoofing.
Fingerprint Biometric Security
In the 1990s, electronic fingerprint scanners were developed to replace ink and paper-based systems and primarily used optical technologies to image the patterns on the surface of the finger and convert those patterns into images of the fingerprint. These technologies were sometimes not able to acquire useful data from people with imperfections in their finger skin such as dry, thickly callused or worn smooth fingerprints. The cost, size and performance issues associated with these early technologies gave rise to semiconductor-based (silicon) sensors as companies began to explore the commercial application of fingerprint authentication. In addition to our TruePrint technology, there are now several types of silicon fingerprint technologies in the market, such as DC and RF capacitive. While these technologies along with other biometric and non-biometric alternatives, are capable of individual identification, we believe these other technologies are limited as compared to TruePrint at this time. Although generally lower in cost and smaller in size than the predecessor optical fingerprint scanners, these competitive silicon fingerprint sensor technologies often suffer some of the same performance issues.
Silicon fingerprint sensors are a segment of the global fingerprint biometrics industry, and this segment includes sensors based on various technologies of varying capabilities, size and cost. Over the past several years, the silicon fingerprint sensor segment has experienced growth driven by the proliferation of mobile computing and wireless communication devices. With the recent macroeconomic downturn, however, there has been a retraction in this business line. We believe that by offering the right hardware and software products, together with an improvement in the macroeconomic conditions, this segment will once again grow.
7
The silicon fingerprint sensor segment, the area in which we operate, comprises two different types of products: touch and swipe sensors. Touch, or area, sensors are generally larger and more costly than swipe sensors. Users of touch sensors place their finger on the sensor. They generally are only used in government applications and some access control markets presently. Swipe sensors are generally smaller and less costly and involve the user swiping their finger across the sensor. Swipe sensors have become the more dominant form of fingerprint sensor over the past few years and now represent a significant majority of sensors shipped. All fingerprint sensors, whether or not they are silicon-based, are alternatives to other potential biometric identification systems as well as a multitude of non-biometric identification procedures.
Identity Management
Growth in online social networks such as Facebook, MySpace, Twitter and LinkedIn, have increased the importance of convenient yet secure user control over their digital identity. We believe that AuthenTec is well positioned to benefit from growth in identity management for social networks and online services by way of our complete solutions, which includes our smart sensors, TrueSuite identity management software and applications from third parties that link the user with their online social networks and digital identity.
We believe that the fingerprint sensor can easily become the portal to our digital identity, and that as digital identities become more important, more services will be aggregated and accessible through authentication and personalization events via the sensor. We foresee a day when a swipe of the sensor will replace login/password events with services like Google ID, Facebook Connect, OpenID, Twitter API, and Microsoft Live ID, and securely connect the user to their personal accounts with Google, Yahoo, Flickr and thousands of other websites.
Furthermore, we believe that the fingerprint sensor has the potential to become the portal for digital identities used in cloud-based computing, which is the delivery of software, services and other computing tasks via the Internet rather than using on-premise computing resources. It is a style of computing where scalable IT-enabled capabilities are provided as a service to external customers by way of the Internet. Cloud computing is increasingly used for business processes, including advertising, e-commerce, human resources and payment processing. It is also used for delivering advertising content and media, providing infrastructure services and application services. According to research analyst firm Gartner, worldwide cloud services revenue is on pace to surpass $56.3 billion in 2009, a 21.3 percent increase from 2008 revenue of $46.4 billion, and the market is expected to reach $150.1 billion in 2013.
We believe that AuthenTec is well positioned to provide convenient yet secure identity management at the point of user entry (PC, smartphone, mobile device, etc.) for cloud-based computing via its smart sensors, software and solutions, and that demand for these solutions will grow as security concerns and interest in personalization in cloud computing increase.
Touch Control
Following the market success of Apple’s iPhone with its touch-screen interface, many leading electronics manufacturers have continued to refine and enhance touch-based functionality of their devices. Touch-based technologies such as touch screens, touch pads, track pads, optical mice and other human interface devices help people more easily and intuitively interact with smartphones, PDAs, notebook and tablet PCs, and other electronic products.
AuthenTec’s TrueNav technology leverages the touch control capability of our sensors' high definition pixel array and subsurface imaging to track small movements of a finger across the sensor and translate that motion into on-screen actions and other touch control. On a smartphone, for example, TrueNav technology adds significantly to the value of AuthenTec sensors by combining fingerprint authentication with enhanced touch control for functions such as camera zoom, media control (play, pause, fast-forward, rewind, skip, etc.), precise cursor positioning, and turbo scrolling. Turbo scrolling allows a user to rapidly scroll through a long list of contacts, lengthy e-mails, music play lists or web pages without repetitive finger movements. TrueNav also allows a user to perform button clicks with a single or double tap of the sensor to access programs or open files or folders.
Because of this touch control capability, our products can replace a wide variety of mechanical input control devices including track balls, touch pads, scroll wheels, optical mice and directional pads, reducing hardware and bill of materials costs for OEMs while offering the enhanced features of security and personalization. Our sensors complement today’s touch-screen equipped smartphones and other wireless devices by providing additional control, offering increased versatility, precision, and ease-of-use – all with the combined benefit of fingerprint security.
We believe that our sensors offer the small size, multi-functionality and low cost needed to position the Company well for the increased adoption and refinement of touch control technologies.
8
Our Competitive Strengths
We believe the following competitive strengths will enable us to succeed as a leading provider of solutions for security, identity management and touch control:
Patented and Proven Advanced Technology Platform. While other fingerprint technologies generally read only the surface layer of the skin, our patented TruePrint technology is able to read the live layer of skin below the skin’s outer surface. By reading the live layer, we are able to produce a high density and accurate image of the skin under virtually any condition regardless of changing environments and finger conditions. Our TrueMatch matching algorithms use these higher quality images to accurately and securely match the user, a process which we believe is one of the most accurate and secure matching capabilities available in the market today. Our proprietary technologies are protected by 121 filed and pending U.S. patents for sensors and sensor packaging, software, and end user applications.
Complete Hardware and Software Solutions. We offer comprehensive solutions optimized for security, identity management and touch control in our target markets. Our solutions include the sensors, algorithms, software, reference designs, packaging and end-user applications which allow our customers to easily integrate our solutions into their products. By using our solutions, our customers benefit from improved time-to-market, reduced development costs and higher quality.
Low-Cost Advantage. As a result of our TruePrint and TrueMatch technologies, we believe our sensors use less silicon as compared to other commercially available semiconductor-based solutions. We believe this provides us with a cost advantage over our competitors. We operate a fabless manufacturing model and utilize standard, high volume fabrication processes, allowing us to take full advantage of the cost reduction and yield enhancements associated with these processes.
Multiple Products Targeted for High Volume End Markets. As of the end of 2009, we have introduced (or acquired) 19 sensor products tailored specifically to our target markets since our founding in 1998. Our products include some of the smallest fingerprint sensors available in the market, a critical consideration for many of our customers. Complementing these products is our TrueSuite application software which simplifies and enhances the use of our sensors.
Strong Relationships with Leading Global PC and Wireless Device Manufacturers. We have developed collaborative relationships with leading customers worldwide. These relationships enable us to work with our customers and tailor our solutions to fit into their research and development efforts. We have support offices in North America, Europe and Asia to provide our global customers with convenient local sales and technical support.
Increased Functionality with the Power of Touch. In addition to the convenient security aspects of our products, our sensor solutions also provide other features such as TrueNav and TrueYou. TrueNav allows the sensor to be used as a “touchpad” or “joystick” type device where the sensor tracks the motion of the finger. By controlling the cursor with the finger, the sensor can be used to augment, or replace, the directional pads, track pads, trackballs, optical mice and other mechanical switches found on cellphones and other wireless devices. TrueYou allows the sensor to be used to personalize or customize a customer’s product. Capitalizing on the fact that each fingerprint is unique, each finger can represent a different function. For example, in a PC, each finger can launch a different application or website. In a mobile phone, each finger can be used as a separate speed dial. With the Power of Touch, customers can add additional features and functions to their own products, with the potential to also reduce overall costs.
Financial and Operational Stability and Reputation. Founded in 1998, we have been a leading provider of identity, security and touch control technologies for PC, wireless device and other markets. With $52.4 million of cash and cash equivalents and short-term investments as of January 1, 2010, we believe we have a strong financial position compared to our competitors. We believe that our strong balance sheet and long operating history is attractive to our customers as a sign of financial stability. Furthermore, our strong balance sheet has allowed us to continue making investments in new products which positions us well for new opportunities and to help drive the growth of our business.
9
Our Growth Strategy
We intend to maintain and extend our leadership in our target markets by pursuing the following strategies:
Increase Penetration of the Lower-cost PC Market. The global macroeconomic downturn has accelerated the growth in sales of lower-cost PCs, including netbooks. Market research firm IDC said that netbooks had a breakthrough year in 2009, with over 30 million units shipped – up from the 10 million netbooks shipped in 2008. For 2010, IDC predicts nearly 40 million netbooks will ship. The fingerprint sensor attach rate in netbooks and lower-cost PCs is much lower relative to more expensive and feature rich models. To increase penetration of the lower-cost PC market, which includes netbooks, we are bringing lower cost fingerprint sensors and client application software to market that are tailored for use in this growing portion of the PC market.
Increase Penetration of the Wireless Market. The adoption of fingerprint sensors in wireless products has been somewhat limited outside of Japan. We believe that market growth in smart phones that are capable of storing more personal and business information are helping to drive increased global demand for more convenient security. Beyond security, we are expanding our multi-functional capabilities of our sensors and promoting other Power of Touch features such as personalization and navigation. Our TrueNav capabilities have drawn strong interest from customers as a possible replacement for current navigation technologies used on smart phones, in addition to the touch screen. Finally, we are focused on improving the durability and aesthetics of our sensors for wireless devices though continued development of our new TouchStone packaging.
Expand our Offering and Availability of Software and End-user Applications. We intend to expand our TrueSuite application software for the PC market and also offer a version of TrueSuite for use in mobile systems. We plan to expand the features and functions of TrueSuite, which will be shipping in new notebook models in 2010, and will offer an API (TrueAPI) to application developers in order to further expand the uses of our sensors in PCs and mobile systems. We also plan to make certain versions of TrueSuite available for purchase via a web store that we expect to introduce in 2010.
Continue to Enhance the Functionality of Our Products. Our current product offering provides our customers with an accurate, reliable, cost-effective, versatile and secure solution. Our products provide several security features including the protection of hardware and data and the replacement of passwords. Our products allow for personalization of a device such as the ability to use different fingerprints to launch different applications. In addition, our products can be used for navigation, in which the sensor can be used for cursor control. We believe our sensor technologies will increasingly be used to replace mechanical switches and other user input controls on wireless handsets and other small form factor devices. We plan to continue to provide solutions that offer enhanced security, innovation, convenience and navigation control for our customers as we believe this is critical to achieving increased market penetration.
Capitalize on Growth of New Markets. We intend to capitalize on the growth of new markets, including game systems, digital cameras, remote controls and toys. We plan to offer security, identity management and touch control solutions that address the evolving portability, connectivity, and functionality requirements of these new markets.
Pursue Selective Acquisitions of Complementary Technologies or Companies. We intend to evaluate and potentially make acquisitions of companies, technologies and products that are complementary to our focus in security, identity management and touch control. We believe we are capable of integrating certain ancillary technologies into our solution in order to broaden our product portfolio functionality and accelerate growth and entry into new markets. In February 2010, we acquired the Embedded Security Division of SafeNet. We believe that this acquisition will help transform us into a more comprehensive supplier of security, identity management, and touch control solutions.
Continue to Maintain Low–Cost Leadership. We believe we currently offer one of the smallest commercially available fingerprint sensors at the lowest cost in the industry. We believe this is a critical attribute for our current customers and will help enable further proliferation of our fingerprint sensors into products in other markets. Our management and engineering teams have significant experience reducing product costs. We intend to preserve our low-cost advantages by seeking to improve our design process and packaging techniques, integrating additional functionality into our existing solutions and leveraging our fabless manufacturing model as our shipments increase.
Products
We design, develop and sell mixed-signal fingerprint sensor semiconductors primarily used in the PC and wireless device markets. We offer a broad range of fingerprint sensors that enable users to securely and easily access and control multiple functions on an electronic device by touching or sliding their finger across the sensor. Our fingerprint sensors utilize unique information in fingerprints to verify both the identity of the individual as well as the unique, individual fingers on the same person. Our solutions capture an image of the fingerprint, extract unique information from it and save it as a template, a mathematical representation of the fingerprint image. Subsequently, the information is compared to that from a future template to determine if it is the same finger.
10
Because our fingerprint sensors can accurately and consistently identify individual fingers, we can use our sensors in multiple applications related to security, password replacement, financial transaction authentication and personalization applications within our target markets. Our sensors also can track the relative location of one’s finger movement and thus can be used as a form of cursor control, functionality valued in a smaller form factor device where we can replace a four way mechanical switch. We refer to this ability to use our sensors for such a wide variety of tasks as the “Power of Touch.” With the Power of Touch, our customers can use our sensors to add a number of value-added features to their own products. In the PC, this may include network log on, password replacement, parental control, fast user switching, quick applications access, menu scrolling and other features that differentiate their products and improve the user experience. In the cell phone, in addition to the items noted for the PC, other added capabilities include using the sensor for cursor control which replaces the mechanical switch, M-commerce authentication and speed dial capabilities where each finger is associated with a different number.
Our products are used in a wide range of PC products and related peripherals including laptops, desktops, memory keys, hard drives, keyboards, mice and other devices. Our products have also been integrated into a number of wireless devices including mobile phones, PDAs and personal navigation devices (PNDs) as well as access control devices such as door locks, time and attendance devices and remote wireless entry keys.
We offer a complete client-level solution to our customers including the sensors, matching algorithms and device level software (device drivers, algorithms and applications programming interfaces) and PC client applications, along with a complete set of documentation and application support. In addition to internally developed software included in our products, we support third-party software vendors whose products interact with our sensor products.
We provided fingerprint sensor products to three major markets during 2009:
PCs – The AES4000, AES3400, AES2501, AES2810, AES2550, AES1610 and AES1660 series of touch and swipe sensors are designed for integration into laptops and netbooks, desktop PCs and PC peripherals. These devices enable security, personalization and touch control features and can be found in products sold into the business and consumer markets.
In 2009, we released the AES1660, our newest “smart sensor” for the PC market. The AES1660 offers the expanded functionality, biometric performance, low-power consumption, multiple packaging and form factor options, and low bill of materials (BOM) cost needed for easy integration into upcoming consumer notebooks and netbooks. This 128-pixel wide sensor incorporates LED drivers for enhanced PC user feedback including programmable alerts and notifications. The AES1660, formerly codenamed “Marcy”, is ideally suited for today's consumer notebooks and netbooks where size, performance, durability and low BOM costs are key considerations.
In early 2010, we introduced an additional smart sensor (the AES2660) for the PC market which incorporates the many advantages of the AES1660 but in a wider form factor with a 192 pixel-wide array, further expanding our portfolio of smart sensors for the PC market.
Wireless Devices – The AES2510, AES1510, AES1710, AES1711 and AES1750 families of swipe sensors are designed for integration into mobile phones and other wireless communications devices. These devices enable security, personalization and a host of touch control features used today worldwide in full featured mobile phones.
In early 2010, we introduced the AES1750 smart sensor for the wireless device market. The highly durable AES1750 – formerly codenamed “Rogers” – offers a variety of fingerprint-enabled convenience, control, security and personalization functions in an ultra-thin, easy-to-integrate device. The AES1750 adds user functionality to today’s wireless devices while offering significant savings through reduced component count and cost. The AES1750 is the first AuthenTec sensor to be completely designed using our TouchStone packaging technology, which increases device durability and robustness in outside-the-case mounting applications, and offers a smooth surface for improved navigation and device aesthetics.
Access Control – AuthenTec’s AFS2 and AFS8600 series of sensors are designed for integration into a wide range of access control applications including physical access control systems and time and attendance devices. These touch sensors can be used in applications that provide secure physical access control in corporate and home environments.
11
Other markets for our security, identity management and touch control solutions include Personal Navigation Devices (PNDs), game systems, remote controls, digital cameras and other consumer electronics.
Technology
Fingerprint biometrics use unique information in fingerprints to verify the identity of individuals. Fingerprint sensors and the associated solutions capture an image of the fingerprint, extract unique information from it and save it as a template. A template is a mathematical representation of the unique information extracted. Subsequently, the template information is compared to that from a future image to determine if it is the same finger. Many competitive fingerprint sensors observe or interact with the surface of a finger to form an image of the fingerprint. Such methods can be sensitive to finger wear, damage and contamination of the skin surface, resulting in interference that degrades the quality and amount of information that can be used for verification. The performance of these systems thus varies according to the condition of individual fingers, which can be affected by factors such as occupation, age, ethnicity, contamination and climate. Certain technologies can create a poor user experience as the system cannot obtain enough information for adequate verification, resulting in the user being incorrectly and inconveniently rejected. Alternatively, certain technologies can result in poor security as the system has less information to use, thereby increasing the probability that an imposter could be falsely verified.
Our sensors are based on our proprietary, core technologies and are supported by software components from the driver framework to the client application software.
TruePrint. Our technology was developed to address the concerns of previous technologies and provide a low- cost, convenient, effective and secure method for verification that is effective under virtually any condition. Skin has distinct layers that separate the underlying tissue from the environment. On the surface is a layer of dead skin cells that are formed in the shape of the fingerprint pattern. On the inside is a layer of living cells that regenerate the skin’s surface as it wears down. This live, inside layer is where the shape of the fingerprint pattern originates and is separated from the dead skin by an electrically conductive fluid layer. TruePrint works by coupling a small RF signal into the finger once the finger is placed on the sensor. The RF signal couples with the conductive fluid layer, forming a two dimensional field between the finger and the silicon sensor. The strength of the field is modulated by the shape of the conductive fluid layer, and thus mimics the shape of the fingerprint pattern. An array of tiny antenna plates combined with instrumentation amplifiers, signal processing and data acquisition circuits inside the sensor sense the strength of the field and convert it into digital data corresponding to the image of the fingerprint pattern. Because the image originates from the shape of the live layer, it is much less affected by surface conditions of the finger such as wear, dirt, contamination and moisture. Since TruePrint technology is an active system controlling both the transmission of the RF signal, and the receivers, it can adapt the tuning of both components to obtain the best quality image for different fingers and environments.
TrueMatch . Once captured, the digital fingerprint image from TruePrint is analyzed by our TrueMatch technology. TrueMatch is our patented algorithm technology for extracting and matching unique information from a fingerprint. The technology typically runs in software on the host processor attached to the fingerprint reader. The combination of TruePrint and TrueMatch technologies allows us to acquire a large amount of unique information from a very small area of the finger enabling us to significantly reduce the surface area and hence the silicon cost of our products. Unlike many alternative algorithms, which require larger images to perform acceptably, TrueMatch uses a combination of global and local features in the fingerprint image to maximize the information density. TrueMatch also incorporates patented compositing techniques to build a fingerprint template over time that is physically larger than a single image obtained from the sensor. This is essential for the convenient operation of a small sensor and eliminates the need for the user to accurately position a finger in the same place each time. Compositing also allows the template to be dynamically updated with new information during normal use, thus improving ease of use over time. TruePrint’s high quality images and TrueMatch’s high accuracy algorithms have allowed us to develop one of the smallest fingerprint sensors commercially available.
TrueFinger. TrueFinger dynamically adapts the TrueMatch circuits to measure certain properties of finger skin placed on the sensor while the finger is being scanned. These properties are used to help differentiate between real fingers and fake fingers, often referred to as anti-spoofing. TrueFinger converts the properties of the skin into digital data which are then sent to the host computer for analysis by TrueMatch. TrueMatch compares the data with expected properties to ensure fingerprint authentication.
TrueNav. TrueNav uses the high quality image capabilities of TruePrint to track the motion of a finger placed on the sensor. Motion is tracked and processed to create two dimensional direction vectors which are then used by the display system on the host to control the motion of an on screen cursor. TrueNav uses a combination of silicon circuitry and software with techniques to minimize the amount of power consumed by the silicon. This is important for mobile applications where frequent use of cursor navigation would otherwise drain the battery.
12
TrueYou. TrueYou takes advantage of each finger’s uniqueness and allows for the programming of different functions on a device based on which finger is used. This might include each finger launching a different application or being used to speed dial a phone number. TrueYou technology is a key enabler for capabilities offered by our TrueSuite software, allowing users to associate one or multiple websites with each finger. This enables a “Quick Launch” capability that not only launches a favorite web site with the single swipe of a finger but authenticates the user and automatically fills in user names and passwords for those sites.
TouchStone. Unlike most semiconductor integrated circuit products, our fingerprint sensors are visible in consumer devices and must be designed to account for durability, ergonomic and aesthetic requirements. TouchStone is a highly durable, thin profile fingerprint sensor packaging technology which expands aesthetic and product integration options for makers of cell phones, laptops, and other consumer electronics. TouchStone enables a new class of fingerprint sensors that combine all the features of our patented TruePrint technology with thin, durable, easy to integrate, waterproof packaging, and multiple color options for today’s stylistic cell phone designs.
Selling and Marketing
We sell our products worldwide through multiple channels, including our international direct sales force and our network of independent sales representatives and distributors. Each of these sales channels is supported by our customer service and marketing organizations. We have customer service personnel in Melbourne, Florida and Taipei, Taiwan. Our sales and application engineering offices are in the United States, Germany, Taiwan, China, South Korea and Japan. We will expand our sales and technical support capabilities in key regions as necessary.
Our sales organization engages directly with all major customers and is instrumental to the design process. Our direct sales force is supplemented with independent sales representatives and distributors, who have been selected based on their understanding of our target markets, technical knowledge and relationships with our target customers. Our sales representatives and distributors include Acal plc, ActiveComp Electronic GmbH, Alexander Schneider Ltd, Arrow Electronics Inc, BAE Sales Inc, Centaur Corporation, ClearComm Technical Sales Inc, CompTronic AB, Concord Sales Inc, Crestone Technology Group, Edom Technology Co Ltd, Empa Elektronik A.S, HB Corp, High Technology Sales Inc, High Technology Sales Assoc. Inc, Murata Manufacturing Company Ltd, New Tech Solutions Inc, OAS de Mexico, O’Donnell Associates Southwest, Parallax Sales, Richpower Electronic Devices Co. Ltd, RTI Holdings Limited, Sabre Technologies Pte Ltd, Westmark Electronics Inc, and WPG Electronics (HK) Limited. Sales in conjunction with our sales representatives accounted for substantially all of our revenue in 2009, 2008 and 2007.
Our sales cycle can vary widely and is dependent on the specific customer’s research and development cycle. The sales cycle requires a significant investment in time, resources and engineering support before realization of income from product sales, if at all.
Our marketing group is responsible for market analysis, market and customer development as well as product definition and is focused on capitalizing on market opportunities. This group works closely with our product research and development groups to align development programs and product launches with our customers’ schedules. Additionally, this group is responsible for the production and dissemination of sales and marketing materials, such as product announcements, press releases, brochures, magazine articles, advertisements and cover features in trade journals and other publications. We also participate in public relations and promotional events, including industry tradeshows and technical conferences.
As of January 1, 2010, we had 27 full time employees in our selling and marketing group.
Customers
We principally sell our products, either directly or through distributors, to OEMs, ODMs and contract manufacturers. ODMs and contract manufacturers typically design and manufacture products to sell to OEMs. The primary markets utilizing our products and services are PCs served by large PC OEMs, such as Acer, ASUSTek, Fujitsu, Dell, Hewlett-Packard, Lenovo and Toshiba, and wireless device OEMs such as Acer, ASUSTek, Fujitsu, LG, Medion, and Microsoft. We work with these and other OEMs to understand their requirements and provide them with solutions which they then qualify and, in some cases, specify for use within their systems. We sell our products with standard warranty provisions for defects in materials, workmanship and product performance. At our option, defective products may be returned for their purchase price or for replacement.
13
In any given year, our customer shipment mix will change based on new products, design wins, our customer’s success selling their end products and shifts in the ODM’s used by the OEM’s. In 2009, Edom Technology Co., Ltd., Fujitsu, Ltd. and Lenovo (Singapore) Pte., Ltd. constituted 27%, 19%, and 17%, of our revenue, respectively. In 2008, they represented 11%, 13%, and below 10% of our revenue, respectively, and in 2007, below 10%, 23%, and below 10% of our revenue, respectively. Edom Technology Co., Ltd. is a distributor that sells products to ODMs that manufacture products for OEMs. Our distributors are independent entities that assist us in identifying and servicing OEMs and generally purchase our products directly from us for resale to OEMs, ODMs or contract manufacturers. In general, our distributors exclusively service a particular region or customer base, and purchase our products through purchase orders that may be cancelled or rescheduled. Our distributors may also act as sales representatives and receive commissions on sales of our products. In 2009, two of our distributors, Edom Technology Co., Ltd. and Richpower Electronic Devices, accounted for 27% and 15% of our revenue, respectively, in 2008, 11% and 15% of our revenue, respectively, and in 2007, 5% and 24% of our revenue, respectively.
Manufacturing
We do not own or operate semiconductor fabrication, wafer bumping, assembly or test facilities. We depend on third-party subcontractors to fabricate, assemble and test our fingerprint sensor products. By outsourcing manufacturing, we are able to avoid the cost associated with owning and operating our own manufacturing facility. This allows us to focus our efforts on the design and marketing of our products.
Semiconductor Fabrication. We currently outsource most of our semiconductor fabrication to Taiwan Semiconductor Manufacturing Company, Ltd., or TSMC. Our fingerprint sensors are currently fabricated in several advanced sub-micron manufacturing processes in TSMC fabrication facilities located in Taiwan and China which allows for significant capacity along with geographic diversity. Because finer manufacturing processes lead to enhanced performance, smaller silicon chip size and lower power requirements, we continually evaluate the benefits and feasibility of migrating to smaller geometry process technologies in order to reduce cost and improve performance. Our engineers work closely with TSMC to increase yields, lower manufacturing costs and improve quality. We may eventually qualify and retain additional foundries to manufacture our products in the future.
Wafer Bumping. Most of our products are shipped from TSMC to a third-party wafer bumping facility. Bumping is the application of a thin layer of metal to hermetically seal the bond pads on the wafer and to add the drive ring on certain of our sensors. We outsource most of the wafer gold bumping of our products to Chipbond in Taiwan, which is one of the largest providers of such subcontract services in the world.
Assembly and Test. We presently outsource all assembly and testing of our products to subcontractors, Signetics in South Korea and ChipMOS in Taiwan. We are also bringing up a third supplier for volume manufacturing in 2010. Our products are designed to use low cost packages and to be tested with widely available test equipment. We intend to qualify and retain additional assembly and test subcontractors in the future to meet our capacity and diversity requirements.
Quality Assurance. We are committed to maintaining the highest level of quality in our fingerprint sensors. We have designed and implemented a quality management system that we believe provides the framework for continual improvement of products, processes and customer service. We also rely on in-depth simulation studies, testing and practical application testing to validate and verify our semiconductors. To help ensure consistent product quality, reliability and yield, we work closely with our manufacturing logistics partners to monitor the production cycle by reviewing manufacturing process data from each wafer foundry and assembly subcontractor. In 2009, after an audit and certification process, we received ISO9001:2008 quality certification.
Research and Development
We devote substantial resources to the research and development of new products that enhance our competitive position and provide increased value. We continue to increase our product performance by driving improvements in all aspects of our technologies and products. Such improvements include the development of cost effective sensors that maintain strong biometric accuracy as well as the incorporation of security capabilities that support end-to-end system security. Our developments also include efforts to substantially improve the usability and convenience of our products by making them simple and easy to use. In 2009, 2008 and 2007, we had research and development expenses of $14.5 million, $16.5 million and $12.9 million, respectively. As of January 1, 2010, we had 79 employees in our research and development group.
Intellectual Property
We seek to protect our intellectual property rights with a combination of patents, trademarks, copyrights, trade secret laws and disclosure restrictions. We rely primarily on trade secrets, technical know-how and other unpatented proprietary information relating to our design and product development activities. We have 74 issued patents, including 22 patents purchased during the year ended January 1, 2010, five (5) patents purchased during the year ended January 2, 2009 and 47 pending patent applications in the U.S. We have also applied for patents for many of our key technologies in regions such as Asia and the European Union. The oldest patents owned by us were originally filed in the United States Patent Office in 1995 and will begin to expire in 2015.
14
The laws of other countries in which we market our products, such as some countries in the Asia/Pacific region, may offer little or no protection for our proprietary technologies. Reverse engineering, unauthorized copying or other misappropriation of our proprietary technologies could enable third parties to benefit from our technologies without paying us for doing so. We also enter into confidentiality and proprietary rights agreements with our employees, consultants, customers, subcontractors and other third parties and control access to our designs, documentation and other proprietary information. If a claim is asserted that we have infringed the intellectual property of a third-party, we may be required to seek licenses to that technology. In addition, we license third-party technologies that are incorporated into some elements of our products. Third-parties may infringe or misappropriate our proprietary rights. See “Risk Factors.”
In addition to the proceedings described in “Legal Proceedings” in Part I, Item 3 of this Annual Report, we may be required to resort to additional litigation to enforce our intellectual property rights. We may also be subject to legal proceedings and claims relating to our intellectual property in the ordinary course of our business. Intellectual property litigation is expensive and time-consuming and could divert management’s attention away from running our business. If a claim is asserted that we infringe the intellectual property of a third-party, we may be required to pay substantial damages to the party claiming infringement, stop selling products or using technology that contains the allegedly infringing intellectual property, develop non-infringing technology or enter into royalty or license arrangements that may not be available on commercially reasonable terms and conditions. See “Legal Proceedings.”
Competition
The markets for our products are highly competitive and are characterized by rapid technological change, declining average selling price and continuously evolving customer requirements. We believe that the principal competitive factors in our markets include:
|
|
•
|
The ability to consistently deliver biometric performance across the widest user demographics;
|
|
|
•
|
The ability to provide solutions that meet evolving security requirements;
|
|
|
•
|
Providing complete solutions including the sensor and application software;
|
|
|
•
|
Low-cost;
|
|
|
•
|
The ability to add value by offering products with more functionally, such as navigation;
|
|
|
•
|
Small size, convenience and ease of use;
|
|
|
•
|
Aesthetics and ergonomic designs that complement the customers’ products;
|
|
|
•
|
The breadth and diversity of product offerings;
|
|
|
•
|
The ability to provide a reliable supply of products in sufficient quantities and in a timely manner;
|
|
|
•
|
The quality of customer service and technical support;
|
|
|
•
|
The ability to operate in harsh physical environments; and
|
|
|
•
|
Financial and operational stability and reputation.
|
We believe we currently compete favorably with respect to many of these factors in the aggregate, although some of our present or future competitors could have substantial competitive advantages including greater name recognition and deeper penetration of our target markets, broader and more diversified products and services, larger sales forces and budgets, more established relationships with customers, better sales channels and substantially greater financial, technical and/or other resources. We cannot assure that our products will continue to compete favorably or that we will be successful in the face of increasing competition from new products and enhancements introduced by existing competitors or new companies entering our market. Increased competition could harm our business, by, for example, increasing pressure on our profit margins or causing us to lose customers. In addition, delivery of products with defects or reliability, quality or compatibility problems may damage our reputation and competitive position.
We compete primarily with other suppliers of biometric fingerprint sensors used in PC, wireless device and other markets. Our principal competitors include private companies focused on the fingerprint sensor market such as EgisTec Inc., UPEK, Inc. (“UPEK”), and Validity Sensors, Inc. In the future, competition in our markets could intensify if new competitors enter the market.
15
Employees
As of January 1, 2010, we had 126 full-time employees, including 79 in research and development, four in operations, 27 in sales and marketing and 16 in general and administrative functions. We have never experienced a work stoppage and none of our employees is represented by a labor organization or under any collective bargaining arrangements. We consider our employee relations to be good.
Facilities
Our main offices occupy approximately 38,000 square feet in Melbourne, Florida under a lease that expires in October 2014. We lease approximately 5,000 square feet in Shanghai, China. We also lease properties in South Korea, Taiwan and Japan. We do not own any manufacturing facilities and contract to third parties the production and distribution of our semiconductors. We believe that our existing facilities meet our current needs and that suitable additional or substitute space will be available as needed to accommodate expansion of our operations.
Trademarks and Service Marks
Our trademarks include AuthenTec®, EntréPad®, FingerLoc®, Personal Security for the Real World ® , Power of Touch ® , TrueFinger ® , TruePrint ® , TrueMatch tm , TrueNav tm , TrueProtect™, TrueSuite® tm TrueYou tm and TouchStone tm. All other trademarks or service marks appearing in this Annual Report on Form 10-K are trademarks or service marks of others.
Corporate Information
We were incorporated in Delaware in 1998. Our principal executive offices are located at 100 Rialto Place, Suite 100, Melbourne, Florida 32901, and our telephone number is (321) 308-1300. Our website address is www.authentec.com. The information on, or that can be accessed through, our website is not part of this Annual Report on Form 10-K.
Website Posting of SEC Filings
Our annual reports on Form 10-K, quarterly reports on Form 10-Q, current reports on Form 8-K and amendments to such reports are available, free of charge, on our website: http://investors.authentec.com/. Further, the public can read and copy any materials we file with the SEC, including a copy of this Annual Report on Form 10-K at the SEC’s Public Reference Room at 100 F Street, NE, Washington, D.C. 20549. Information on the operation of the Public Reference Room can be obtained by calling the SEC at 1-800-SEC-0330. The SEC maintains an internet site that contains reports, proxy and information statements and other information regarding our filings at www.sec.gov.
16
Item 1A. Risk Factors
We have identified certain risk factors that apply to us. You should carefully consider each of the following risk factors and all of the other information included or incorporated by reference in this Form 10-K. If any of the following risks, or other risks not presently known to us or that we currently believe not to be significant, develop into actual events, then our business, financial condition and results of operations could be adversely affected. In that case, the trading price of our common stock could decline and you might lose all or part of your investment in our common stock.
Risks Related to Our Business
Adverse changes in general economic or political conditions in any of the major countries in which we do business could adversely affect our operating results.
The direction and relative strength of the global economy continues to be uncertain. As economic growth in the United States and other countries’ economies has slowed and, in some countries, turned negative, many customers delayed or reduced technology purchases or marketing spending. In addition, after growing rapidly, we believe fingerprint sensor attach rates in 2009 have gone down as a result of the macroeconomic slowdown and sales have shifted to lower-cost laptops versus the full-featured, higher-cost laptops. All of the above factors could result in continued reductions in the sales of our products, longer sales cycles, slower adoption of new technologies and increased price competition.
There could be a number of follow-on effects from the overall economic downturn, including insolvency of certain of our key suppliers, distributors, resellers, OEMs, retailers and systems integrators, which could impair our supply of products, distribution channels, the ability of customers, including our distributors, to obtain credit to finance purchases of our products. The failure of derivative counterparties and other financial institutions could negatively impact our treasury operations. Other income and expense could also vary from expectations depending on gains or losses realized on the sale or exchange of financial instruments, impairment charges related to investment securities as well as equity and other investments, interest rates, cash balances, and changes in fair value of derivative instruments. Any of these events would likely harm our business, results of operations and financial condition.
We are in a rapidly changing industry and must adapt quickly to succeed.
You must consider our business and prospects in light of the risks and difficulties we encountered over the past three years as a growing technology company in a very competitive market. These risks and difficulties include, but are not limited to the risks identified below and in particular the following factors:
|
|
•
|
the timing and success of new products and new technologies introduced by us and our competitors;
|
|
|
•
|
our ability to build brand awareness in a highly competitive market; and
|
|
|
•
|
our ability to increase production in a timely and cost effective basis.
|
We may not be able to successfully address any of these risks or others. Failure to do so adequately could harm our business and cause our operating results to suffer.
We are dependent upon a relatively small number of significant end customers for more than 75% of our 2009 and 2008 revenue.
A relatively small number of end customers account for a significant portion of our revenue in any particular period. Our top five end customers accounted for 79% of our revenue in fiscal 2009 and 78% of our revenue in fiscal 2008. We expect that our customer concentration will go down in 2010, but it is expected to remain high and attendant risk will continue in future periods. The loss of any significant end customer will limit our ability to sustain or grow our revenue.
If we acquire any companies or technologies in the future, they could prove difficult to integrate, disrupt our business, dilute stockholder value and adversely affect our operating results.
In the future, we may acquire or make investments in companies, assets or technologies that we believe are complementary or strategic. We have made a limited number of acquisitions and investments to date, and therefore our ability as an organization to make acquisitions or investments is largely unproven. If we decide to make additional acquisitions or investments, we face numerous risks, including:
|
|
•
|
difficulties in integrating operations, technologies, products and personnel;
|
|
|
•
|
diversion of financial and managerial resources from existing operations;
|
17
|
|
•
|
risk of overpaying for or misjudging the strategic fit of an acquired company, asset or technology;
|
|
|
•
|
problems or liabilities stemming from defects of an acquired product or intellectual property or other litigation that may result from offering the acquired product in our markets;
|
|
|
•
|
challenges in retaining employees key to realizing the value of the acquisition or investment;
|
|
|
•
|
inability to generate sufficient return on investment;
|
|
|
•
|
incurrence of significant one-time write-offs; and
|
|
|
•
|
delays in customer purchases due to uncertainty.
|
If we proceed with an acquisition or investment, we may be required to use a considerable amount of our cash and investments, which may decrease our liquidity, or to finance the transaction through debt or equity securities offerings, which may dilute our stockholders and affect the market price of our stock. As a result, if we fail to properly evaluate and execute acquisitions or investments, our business and prospects may be harmed.
On February 26, 2010, we acquired SafeNet, Inc.’s Embedded Security Solutions Division. Under terms of the transaction, we paid $8.5 million in cash and issued 1.2 million shares (valued at $2.8 million at the closing) of our common stock. The transaction also calls for an earn-out of up to $2.5 million in cash based on the attainment of certain revenue goals for the remainder of 2010. There can be no guarantee that we will realize the anticipated benefits of this transaction.
As a public company, we may be the subject of unsolicited attempts to control our board of directors, which may require significant expense and attention from management.
The semiconductor industry as a whole is facing increasing pressures to consolidate. As a public company, we may be the subject of unsolicited bids for the control of our company, such as hostile proxy contests and tender offers that fail to deliver adequate value to our shareholders. In addition to the concern that certain parties employing these techniques may tailor their processes to deliver less than fair value, defending against any such advances that our board does not believe are in the best interests of our stockholders may require significant expense and may divert the attention of our management from operating our business.
On January 29, 2010, one of our smaller competitors, UPEK, made an offer to acquire control of our company. UPEK also filed a solicitation statement with the SEC seeking agency designations to call a special meeting at which the following proposals would be considered: (i) the removal without cause of each of our current directors; (ii) electing UPEK’s own director nominees to fill the resulting vacancies on our board; and (iii) repealing any provisions of our bylaws adopted by our board of directors after November 5, 2009. The underlying purpose of each of these proposals is to advance UPEK’s proposal to combine its business with that of AuthenTec in a stock-for-stock merger. As participants in the industry, AuthenTec is very familiar with UPEK and its business. In rejecting the offer, our board of directors expressed a lack of confidence in UPEK’s financial condition and concern regarding its weakening market position. As a result, our board of directors believes UPEK’s merger proposal is highly dilutive, speculative and contrary to the best interests of our stockholders. In order to defend against UPEK’s proposals, we may incur significant legal, financial and other advisory fees and the attention of our board and management may be diverted from operating our business. Furthermore, there can be no guarantee that we will be successful in defending against their proposal and if we are not successful, UPEK may gain control of our board and consummate a transaction that our board believes will be dilutive to our stockholders and contrary to their best interests.
We may not be able to manage our future growth effectively, and we may need to incur significant expenditures to address the additional operational and control requirements of our growth and those of being a public company.
To manage any growth successfully, we believe we must effectively:
|
|
•
|
hire, train, integrate and manage additional qualified engineers for research and development activities, as well as sales, marketing, financial and information technology personnel;
|
|
|
•
|
expand and upgrade our technological capabilities;
|
|
|
•
|
manage simultaneous relationships with our customers, distributors, sales representatives, subcontractors, suppliers and other third parties;
|
|
|
•
|
implement new customer service and production control systems; and
|
|
|
•
|
execute and successfully integrate strategic investments
|
Our efforts may require substantial managerial and financial resources and may increase our operating costs even though these efforts may not be successful. If we are unable to manage any growth effectively, we may not be able to take advantage of market opportunities, develop new products, satisfy customer requirements, execute our business plan, respond to competitive pressures or comply with public company requirements.
18
The semiconductor industry has historically experienced significant fluctuations with prolonged downturns, which could impact our operating results, financial condition and cash flows.
The semiconductor industry has historically exhibited cyclical behavior, which at various times has included significant downturns in customer demand. Because a significant portion of our expenses is fixed in the near term or is incurred in advance of anticipated revenue, we may not be able to decrease our expenses rapidly enough to offset any unanticipated shortfall in revenue. If this situation were to occur, it could adversely affect our operating results, cash flow and financial condition. Due to the macroeconomic downturn, the results of companies in our industry generally and our financial results specifically for fiscal 2009 were adversely impacted by a sharp decline in demand for products provided by our industry.
Furthermore, the semiconductor industry has experienced periods of increased demand and production constraints. If this happens in the future, we may not be able to produce sufficient quantities of our products to meet the increased demand. We may also have difficulty in obtaining sufficient wafer, assembly and test resources from our independent subcontractors. Any factor adversely affecting the semiconductor industry in general, or the particular segments of the industry that our products target, may adversely affect our ability to generate revenue and could negatively impact our operating results.
The market in which we participate is highly competitive, and if we do not compete effectively, we may not be able to increase our market penetration, grow our revenue or improve our gross margins.
The fingerprint authentication market is very competitive and changing rapidly. We expect increased challenges from existing as well as potentially new competitors. Some of our competitors have offered solutions at lower prices, which have resulted in pricing pressure on sales of our fingerprint sensors. We expect further downward pricing pressure from our competitors and expect that we will have to price our fingerprint sensors aggressively to maintain or increase our market share. If we are unable to reduce our costs, our operating results could be negatively impacted. Increased competition generally may also result in reduced revenue, lower margins or the failure of our products to achieve or maintain widespread market acceptance, any of which could have a material adverse effect on our business, results of operations and financial condition.
Some of our present or future competitors could enjoy one or more substantial competitive advantages, such as:
|
|
•
|
more established relationships with customers, contract manufacturers and suppliers;
|
|
|
•
|
greater name recognition and deeper penetration of our target markets;
|
|
|
•
|
a broader and more diversified array of products and services;
|
|
|
•
|
larger selling and marketing organizations, research and development teams and budgets;
|
|
|
•
|
better sales channels;
|
|
|
•
|
larger customer service and support organizations with greater geographic scope;
|
|
|
•
|
longer operating histories; and
|
|
|
•
|
greater financial, technical and other resources.
|
Our present competitors include private companies such as EgisTec, Inc., UPEK, Inc. and Validity Sensors, Inc. In addition, certain of our customers offer competitive technologies which could displace our own. Our competitors may be able to respond more quickly and effectively than we can to new or changing opportunities, technologies, standards or customer requirements. The challenges we face from new and potentially larger competitors will become greater if consolidation or collaboration between or among our competitors occurs in our industry. For all of these reasons, we may not be able to compete successfully against our current or future competitors, and if we do not compete effectively, our ability to increase our revenue may be impaired.
Resolution of claims that we have violated or may violate the intellectual property rights of others could materially harm our business and could require us to indemnify our customers, resellers or vendors, redesign our products, pay significant royalties to third parties or expend additional development resources to redesign our products.
The semiconductor industry is marked by a large number of patents, copyrights, trade secrets and trademarks and by frequent litigation based on allegations of infringement or other violation of intellectual property rights. At any time, a third-party may assert that our technology or products violates such party’s intellectual property rights. We are currently involved in patent litigation with UPEK and claims relating to UPEK’s misappropriation of our trade secrets. See also “Legal Proceedings” in Part I, Item 3 of this Annual Report on Form 10-K. Successful intellectual property claims against us could result in significant financial liability or prevent us from operating our business or portions of our business as currently conducted. In addition, resolution of claims may require us to redesign our solutions, to obtain licenses to use intellectual property belonging to third parties, which we may not be able to obtain on reasonable terms, to cease using the technology covered by those rights and to indemnify our customers, resellers or vendors. Any claim, regardless of its merits, could be expensive and time consuming to defend against and divert the attention of our technical and management resources.
19
Questions of infringement in the biometrics and semiconductor market involve highly technical and subjective analyses. Litigation may be necessary in the future to enforce our patents and other intellectual property rights, to protect our trade secrets, to determine the validity and scope of the proprietary rights of others or to defend against claims of infringement or invalidity, and we may not prevail in any such future litigation. Litigation, whether or not determined in our favor or settled, is costly, could harm our reputation, could cause our customers to use our competitors’ products and could divert the efforts and attention of our management and technical personnel from normal business operations.
Any failure to protect our intellectual property rights, trade secrets, copyrights, trademarks and technical know-how could impair our competitiveness.
Our ability to prevent competitors from gaining access to our technology is essential to our success. If we fail to protect our intellectual property rights adequately, we may lose an important advantage in the markets in which we compete. Trademark, patent, copyright and trade secret laws in the United States and other jurisdictions as well as our internal confidentiality procedures and contractual provisions are the core of our efforts to protect our proprietary technology and our brand. Our patents and other intellectual property rights may be challenged by others or invalidated through administrative proceedings or litigation, and we may initiate claims or litigation against third parties for infringement of our proprietary rights. Such administrative proceedings and litigation are inherently uncertain and divert resources that could be put towards other business priorities. We may not be able to obtain a favorable outcome and may spend considerable resources in our efforts to defend and protect our intellectual property.
Furthermore, legal standards relating to the validity, enforceability and scope of protection of intellectual property rights are uncertain. We may be unable to obtain additional patent protection in the future or obtain patents with claims of scope necessary to cover our technology. Effective patent, trademark, copyright and trade secret protection may not be available to us in every country in which our products are available. The laws of some foreign countries may not be as protective of intellectual property rights as those in the United States, and mechanisms for enforcement of intellectual property rights may be inadequate.
Accordingly, despite our efforts, we may be unable to prevent third parties from infringing upon or misappropriating our intellectual property and using our technology for their competitive advantage. Any such infringement or misappropriation could have a material adverse effect on our business, results of operations and financial condition.
There can be no assurance that the patents of others will not have an effect on our ability to do business. In addition, we cannot assure you that our intellectual property rights will be adequate to prevent our competitors from copying or reverse-engineering our products, or that our competitors will not independently develop similar or competing technologies or methods or design around any patents that may be issued to us.
Our products must meet exacting specifications, and defects and failures may occur, which may cause customers to return or stop buying our products.
Our customers generally establish demanding specifications for quality, performance and reliability that our products must meet. However, our products are highly complex and may contain defects and failures when they are first introduced or as new versions are released. Our products are also subject to rough environments as they are integrated into our customer products for use by the end customers. If defects and failures occur in our products, we could experience lost revenue, increased costs, including warranty expense and costs associated with customer support, delays in or cancellations or rescheduling of orders or shipments, product returns or discounts, diversion of management resources or damage to our reputation and brand equity, and in some cases consequential damages, any of which would harm our operating results. In addition, delays in our ability to fill product orders as a result of quality control issues may negatively impact our relationship with our customers. We cannot assure you that we will have sufficient resources, including any available insurance, to satisfy any asserted claims.
Our future financial performance will depend on the widespread acceptance of biometric solutions.
In its short history, the biometrics market has been characterized by the frequent introduction of new technologies and products. Although the market has grown rapidly in the past, the overall market witnessed a material reduction in 2009. There is no assurance that the market will see the growth it had in the past. Consumers and corporations may not find value in having biometric technologies integrated in the products they use such as PCs, wireless devices and access control systems. If end users do not value the product, then our customers may decide not to use our sensors in their future products. In addition, there are multiple variants of biometric technologies beyond fingerprint including face, hand, vein, voice, iris and others. Our customers, and their end users, may find these technologies of greater value and choose these technologies over our own.
20
The expansion of the biometric market also depends on the following factors:
|
|
•
|
public perception regarding the intrusiveness of our biometrics and the manner in which organizations use the biometric information collected;
|
|
|
•
|
legislation related to biometric information;
|
|
|
•
|
publicity regarding biometric solutions; and
|
|
|
•
|
security or use issues associated with our or competitive products that may reflect poorly on the biometrics market in general.
|
Even if biometric solutions gain wide market acceptance, our solutions may not adequately address market requirements and may not gain market acceptance.
If we fail to achieve initial design-wins for our products, we may lose the opportunity to generate revenue for a lengthy period of time and be unable to recoup our investments in our products.
We expend considerable resources to achieve design-wins for our products, especially our new products and product enhancements. After a design-win has been awarded, customers may cancel, postpone, or significantly reduce production volume, which could adversely impact our future revenue. If we fail to achieve an initial design-win in a customer’s procurement process, we may lose the opportunity for significant sales to that customer for a number of its products and for a lengthy period of time. This may cause us to be unable to recoup our investments in our products, which would harm our business. Once a customer designs a fingerprint sensor into a product, it is likely to continue to use the same sensor or enhanced versions of that sensor from the same supplier across a number of similar and successor products for a period of time due to the significant costs associated with qualifying a new supplier and potentially redesigning the product to incorporate a different fingerprint sensor.
We rely on a limited number of independent subcontractors for the manufacture, warehousing and shipping of our products, and the failure of any of these third-party vendors to deliver products or otherwise perform as requested could damage our relationships with our customers, decrease our revenue and limit our growth.
We do not have our own wafer fabrication, assembly or test facilities and have a very limited in-house prototype testing operation. Therefore, we must rely on third-party subcontractors to manufacture the products we design and sell. We currently primarily rely on TSMC to fabricate our semiconductor products. We also rely on Chipbond Technology Corp., or Chipbond, for special coating technologies, which are referred to as bumping, and on Signetics Corporation, or Signetics, and ChipMOS Technologies, or ChipMOS, to assemble and test most of our products. If these vendors do not provide us with high-quality manufacturing services and capacity in a timely manner, or if one or more of these vendors terminates its relationship with us, we may be unable to obtain satisfactory replacements to fulfill customer orders on a timely basis, our relationships with our customers could suffer and our revenue could decrease. We may also be unable to find new vendors to provide needed supplies or other inputs for new products, which could materially impact our ability to introduce new products.
The fabrication of integrated circuits is a complex and technically demanding process. Our subcontractors could, from time to time, experience manufacturing defects and reduced manufacturing yields. Changes in manufacturing processes or the inadvertent use of defective or contaminated materials could result in lower than anticipated manufacturing yields or unacceptable performance. Many of these problems are difficult to detect at an early stage of the manufacturing process and may be time consuming and expensive to correct. In addition, production yields for new products are generally lower at the initial production ramp. Product yields depend on our product design, the fabrication technology and the assembly process. Identifying yield problems can only occur in the production cycle when a product can be physically analyzed and tested in volume. Poor yields, integration issues or other performance problems in our products could cause us significant customer relations and business reputation problems, harm our financial results and result in financial or other damages to our customers. Our customers could also seek damages from us for their losses. A product liability claim brought against us, even if unsuccessful, would likely be time consuming and costly to defend.
Other potential risks associated with relying on third-party subcontractors include:
|
|
•
|
reduced control over product cost, delivery schedules and product quality;
|
|
|
•
|
potential price increases;
|
|
|
•
|
inability to achieve required production or test capacity and acceptable yields on a timely basis;
|
|
|
•
|
longer delivery times;
|
21
|
|
•
|
increased exposure to potential misappropriation of our intellectual property;
|
|
|
•
|
shortages of materials used to manufacture our products;
|
|
|
•
|
labor shortages or labor strikes;
|
|
|
•
|
quarantines or closures of manufacturing facilities due to the outbreak of viruses, such as SARS, the avian flu or any similar future outbreaks worldwide; and
|
|
|
•
|
political risks in countries we operate in.
|
We currently do not have long-term supply contracts with any of our subcontractors. Therefore, they are not obligated to perform services or supply products to us for any specific period, in any specific quantities or at any specific price, except as may be provided in a particular purchase order. Our subcontractors have not provided contractual assurances to us that adequate capacity will be available for us to meet future demand for our products. These third-party vendors may allocate capacity to the production of other companies’ products while reducing deliveries to us on short notice. In particular, other customers that are larger and better financed than we are or that have long-term agreements with TSMC, Chipbond, Signetics or ChipMOS may cause them to reallocate capacity to those customers, decreasing the capacity available to us.
Our success will depend on the timely introduction of new products with increased functionality.
Our future financial performance will depend on our ability to meet customer specifications and requirements by enhancing our current fingerprint authentication solutions and developing products with new and better functionality. We expect to devote significant resources to identifying new market trends and developing products to meet anticipated customer demand for fingerprint sensor solutions. Ultimately, however, customers may not purchase our solutions. Accordingly, we cannot assure you that demand for the type of solutions we offer and plan to offer will continue to develop as we anticipate, or at all. We must develop new products and enhance our existing products with improved technologies to meet rapidly evolving customer requirements. The success of new features depends on several factors, including their timely introduction and market acceptance. We may not be successful in developing enhancements or new solutions or bringing them to market in a timely manner. We could experience delays in completing the development and introduction of new products and product enhancements that may render our products, when introduced, obsolete and unmarketable. Customers may also defer purchases of our existing products pending the introduction of anticipated new products. If our new solutions are not competitive with solutions offered by other vendors, we may not be perceived as a technology leader and could miss market opportunities. If we are unable to enhance the functionality of our solutions or introduce new solutions which achieve widespread market acceptance, our reputation will be damaged, the value of our brand will diminish, and our business will suffer. In addition, uncertainties about the timing and nature of new features and products could result in increases in our research and development expenses with no assurance of future sales.
We manufacture our products based on our estimates of customer demand, and if our estimates are incorrect, our financial results could be negatively impacted.
Our revenue is made on the basis of purchase orders rather than long-term purchase commitments. In addition, our customers may cancel purchase orders or defer the shipments of our products. We manufacture our products according to our estimates of customer demand. This process requires us to make multiple demands forecast assumptions, each of which may introduce error into our estimates. If we overestimate customer demand, we may manufacture products that we may not be able to sell. In addition, the rapid pace of innovation in our industry could render obsolete significant portions of such inventory. Excess or obsolete inventory levels for these or other reasons could result in unexpected expenses or increases in our reserves which would adversely affect our business and financial results. Conversely, if we underestimate customer demand or if sufficient manufacturing capacity were unavailable, we would forego revenue opportunities, lose market share and damage our customer relationships.
Our sales cycle is lengthy and expensive and could adversely affect the amount, timing and predictability of future revenue.
Our customers generally need three months to three years, if not longer, after initial contact to make a final purchase decision with respect to our products. Our typical sales cycle often includes a prototype phase as a method to show proof of concept and manufacturability. As customers weigh their purchase options, we may expend significant resources in pursuit of a sale that may ultimately fail to close. We have little control over our customers’ budget cycles and approval processes, or the strength of competitors’ relationships with our potential customers, all of which could adversely affect our sales efforts. The introduction of new products and product enhancements may lengthen our sales cycle as customers defer a decision on purchasing existing products and evaluate our new products. If we are unsuccessful in closing sales after expending significant resources, our revenue and operating expenses will be adversely affected.
22
We must work closely with our subcontractors to make timely new product introductions.
We rely on our close working relationships with our independent subcontractors and other suppliers, including TSMC, Chipbond, Signetics, ChipMOS and Compass Technology Limited, or Compass, to anticipate and deliver new products on a timely basis when new generation materials and technologies are made available. If we are not able to maintain our relationships with our subcontractors, our ability to quickly offer advanced technology and product innovations to our customers would be impaired.
Maintaining and improving our financial controls and complying with rules and regulations applicable to public companies may be a significant burden on our management team and require considerable expenditures of our resources.
The Exchange Act requires, among other things, filing of annual, quarterly and current reports with respect to our business and financial condition. The Sarbanes-Oxley Act requires, among other things, that we maintain effective disclosure controls and procedures and internal control over financial reporting. Satisfying these requirements involves a commitment of significant resources and management oversight. As a result of management’s efforts to comply with such requirements, other important business concerns may receive insufficient attention, which could have a material adverse effect on our business, financial condition and results of operations. Failure to meet certain of these regulatory requirements could cause us to be delisted from the Nasdaq Global Market.
Our headquarters are located in Florida, and our third-party manufacturing subcontractors are concentrated in Asia, areas subject to significant natural disaster risks.
TSMC, which fabricates our semiconductors, and Chipbond, which performs substantially all of our bumping, are located in China and Taiwan, respectively, and Signetics and ChipMOS, which provide substantially all of our assembly and test support, are located in South Korea and Taiwan, respectively. The risk of extreme weather and an earthquake in the Pacific Rim region is significant due to the proximity of major earthquake fault lines. In September 1999, a major earthquake in Taiwan affected the facilities of TSMC, as well as other providers of foundry, assembly and test services. In 2005, several typhoons also disrupted the operations of TSMC. As a result of these natural disasters, these subcontractors suffered power outages and disruptions that impaired their production capacity. In March 2002 and June 2003, additional earthquakes occurred in Taiwan. The occurrence of earthquakes and other natural disasters could result in the disruption of operations. We may not be able to obtain alternate capacity on favorable terms, if at all, which could harm our operating results.
In addition, our headquarters are located in Florida. The risk of a hurricane in Florida is significant. In 2004, the centers of two hurricanes came close to the area in which we operate, and we suffered power outages and disrupted business operations.
If we lose any key employees or are unable to attract additional key employees, we may not be able to implement our business strategy in a timely manner.
Our future success depends in large part upon the continued service of our executive management team and other key employees. We are particularly dependent on the continued service of our existing research and development personnel because of the complexity of our products and technologies. Our employment arrangements with our executives and employees do not require them to provide services to us for any specific length of time, and they can terminate their employment with us at any time, with or without notice, without penalty. The loss of services of any of these executives or of one or more other key members of our team could seriously harm our business.
To execute our growth plan, we must continue to attract additional highly qualified personnel. We have experienced in the past, and may continue to experience, difficulty in hiring and retaining highly skilled employees with appropriate qualifications. If we are unable to attract and integrate additional key employees in a manner that enables us to scale our business and operations effectively, or if we do not maintain competitive compensation policies to retain our employees, our ability to operate effectively and efficiently could be limited.
Security breaches in systems which integrate our products could result in the disclosure of sensitive information that could result in the loss of customers and negative publicity.
Many of the sensors we sell protect private corporate or personal information. A security breach in one of these systems which integrate our products could cause serious harm to our business as a result of negative publicity and lost business. This risk is difficult to manage since our primary customer base, OEMs and ODMs, control the overall system design and security feature integration. In addition, most customers currently use third party software to interface with our fingerprint sensors. However, should a customer or end user lose important sensitive information, they may elect to pursue a legal claim against us for their perceived damage.
23
We work with distributors and sales representatives to sell our products, and if our relationships with one or more of those distributors or sales representatives were to terminate, our operating results may be impacted.
We rely in part upon third parties, including our independent sales representatives and our distributors, to promote our products, generate demand and sales leads, and obtain orders for our products. Our distributors and sales representatives also provide technical sales support to our customers. The activities of these third parties are not within our direct control. Our failure to manage our relationships with these third parties effectively could impair the effectiveness of our sales, marketing and support activities. A reduction in the sales efforts, technical capabilities or financial viability of these parties, a misalignment of interest between us and them, or a termination of our relationship with a major sales representative or our distributor could have a negative effect on our revenue, financial results and ability to support our customers. These parties are engaged under short-term contracts, which typically may be terminated by either party on 30 to 60 days notice. It generally takes approximately three months for a third-party such as a sales representative to become educated about our products and capable of providing quality sales and technical support to our customers. If we were to terminate our relationship with our distributor or one of our larger sales representatives, or if one of them decided to discontinue its relationship with us, sales to current and prospective customers could be disrupted or delayed, and we could experience a diversion of substantial time and resources as we seek to identify, contract with and train a replacement.
If we switch to another foundry to manufacture our semiconductors, our current manufacturing process could be disrupted which could negatively impact our unit volumes and revenue.
As a result of the complexity in semiconductor manufacturing, it is difficult to retain and rely on a new foundry. We may not be able to enter into a relationship with a new foundry that produces satisfactory yields on a cost-effective basis. If we need another foundry because of increased demand, or the inability to obtain timely and adequate deliveries from our current provider, we might not be able to cost-effectively and quickly retain other vendors to satisfy our requirements. Any failure to successfully integrate a new foundry could negatively impact our unit volumes and revenue.
Our business depends on customers, suppliers and our own operations outside the United States, and as a result we are subject to regulatory, operational, financial and political risks, which could adversely affect our financial results.
The percentage of our revenue attributable to shipments to customers outside the United States was 95% in fiscal 2009, 97% in fiscal 2008 and 96% in fiscal 2007. We expect that revenue from customers outside the United States will continue to account for a significant percentage of our revenue. In addition, we maintain international sales and technical support offices in China, Germany, Japan, South Korea and Taiwan, and we rely on a network of distributors and sales representatives to sell our products internationally. Moreover, we have in the past relied on, and expect to continue to rely on, subcontractors located in China, South Korea and Taiwan. Accordingly, we are subject to several risks and challenges, any of which could harm our business and financial results. These risks and challenges include:
|
|
•
|
difficulties and costs of staffing and managing international operations across different geographic areas and cultures;
|
|
|
•
|
compliance with a wide variety of domestic and foreign laws and regulations, including those relating to the import or export of semiconductor products;
|
|
|
•
|
legal uncertainties regarding employee issues, taxes, tariffs, quotas, export controls, export licenses and other trade barriers;
|
|
|
•
|
our ability to receive timely payment and collect our accounts receivables;
|
|
|
•
|
political, legal and economic instability, foreign conflicts, natural disasters and the impact of regional and global infectious diseases such as SARS, avian flu or swine flu in the countries in which we and our customers, suppliers and subcontractors are located; and
|
|
|
•
|
legal uncertainties regarding protection of intellectual property rights.
|
Future transactions may limit our ability to use our net operating loss carry forwards.
As of January 1, 2010, we had U.S. federal tax net operating loss carry forwards of approximately $59.7 million. These net operating loss carry forwards may be used to offset future taxable income and thereby reduce our U.S. federal income taxes otherwise payable. Section 382 of the Internal Revenue Code of 1986, as amended, or the Code, imposes an annual limit on the ability of a corporation that undergoes an “ownership change” to use its net operating loss carry forwards to reduce its tax liability. Due in part to equity financings, we experienced “ownership changes” as defined in Section 382 of the Code. Accordingly, our use of the net operating loss carry forwards and credit carry forwards is limited by the annual limitations described in Sections 382 and 383 of the Code. The limitation on the use of net operating loss carry forwards means that we may need to pay U.S. federal income taxes prior to utilizing these carry forwards in their entirety. It is impossible for us to ensure that we will not experience an ownership change in the future because changes in our stock ownership that may result from future equity financings or certain merger and acquisition activity, some of which are outside of our control, could result in an ownership change under Section 382 of the Code. Any such further changes in our stock ownership could further limit our ability to use our net operating loss carry forwards.
24
If we fail to comply with export control regulations we could be subject to substantial fines or other sanctions.
Certain of our products are subject to the Export Administration Regulations, administered by the Department of Commerce, Bureau of Industry Security, which require that we obtain an export license before we can export products or technology to specified countries. Additionally, some of our products are subject to the International Traffic in Arms Regulations, which restrict the export of information and material that may be used for military or intelligence applications by a foreign person. Failure to comply with these laws could result in sanctions by the government, including substantial monetary penalties, denial of export privileges and debarment from government contracts and could negatively impact our business, financial condition and results of operations.
We rely on partners to enhance our product offerings, and our inability to continue to develop or maintain such relationships in the future would harm our ability to remain competitive.
We have developed relationships with third-party partners, which provide application software, hardware reference designs and other services designed for specific uses with our products. We believe these relationships enhance our customers’ ability to get their products to market quickly. If we are unable to continue to develop or maintain these relationships, we might not be able to enhance our customers’ ability to commercialize their products in a timely fashion and our ability to remain competitive would be harmed.
Our quarterly operating results will likely fluctuate in the future.
We believe our quarterly operating results will be subject to fluctuation due to various factors, many of which are beyond our control. Factors that may affect quarterly operating results in the future include:
|
|
•
|
our ability to attract new customers, retain existing customers and increase revenue;
|
|
|
•
|
unpredictability of the timing and size of customer orders or customer cancellations of existing orders, since most of our customers purchase our products on a purchase order basis rather than pursuant to a long-term contract;
|
|
|
•
|
general economic conditions in our geographic markets;
|
|
|
•
|
fluctuations in the capacities of and costs from our subcontractors in order to satisfy customer requirements;
|
|
|
•
|
variability of our margins based on changes in the mix of products shipped, production yields and other costs;
|
|
|
•
|
variability of operating expenses as a percentage of revenue;
|
|
|
•
|
our ability to introduce new and innovative fingerprint authentication solutions that appeal to our customers;
|
|
|
•
|
changes in our product pricing including those made in response to new product announcements and pricing changes of our competitors;
|
|
|
•
|
fluctuations based upon seasonality;
|
|
|
•
|
our rate of expansion, domestically and internationally;
|
|
|
•
|
the effectiveness of our sales force and the efforts of our distributors and sales representatives; and
|
|
|
•
|
the effect of mergers and acquisitions on our company, our competitors, our suppliers or our customers.
|
Accordingly, it is difficult for us to accurately forecast our business and results of operations on a quarterly basis. If we fail to meet expectations of investors or analysts, our stock price may fall rapidly and without notice. Further, the fluctuation of quarterly operating results may render period-to-period comparisons of our operating results less meaningful, and you should not rely upon them as an indication of future performance.
Risks Related To Our Common Stock
We cannot assure you what the market price for our common stock will be in the future.
We cannot predict the extent to which investor interest in our common stock will be sustained. The lack of a robust trading market may result in limited research coverage by securities analysts. Prices for the shares of our common stock are determined in the market and may be influenced by many factors, including the depth and liquidity of the market for our common stock, investor perception of our business, profit margins in the fingerprint identification industry generally and general economic and market conditions.
25
Further, the trading prices of technology company securities in general have been highly volatile. Accordingly, the trading price of our common stock is likely to be subject to wide fluctuations. Factors, in addition to those outlined elsewhere in this Annual Report on Form 10-K, that may affect the trading price of our common stock include:
|
|
•
|
actual or anticipated variations in our operating results;
|
|
|
•
|
announcements of technological innovations, new products or product enhancements, strategic alliances or significant agreements by us or by our competitors;
|
|
|
•
|
changes in recommendations by any securities analysts that elect to follow our common stock;
|
|
|
•
|
the financial projections we may provide to the public, any changes in these projections or our failure to meet these projections;
|
|
|
•
|
the completion of a merger or acquisition;
|
|
|
•
|
the loss of a key customer;
|
|
|
•
|
the loss of a key supplier;
|
|
|
•
|
the loss of key personnel;
|
|
|
•
|
government regulations affecting biometrics;
|
|
|
•
|
technological advancements rendering our products less valuable;
|
|
|
•
|
lawsuits filed against us;
|
|
|
•
|
changes in operating performance and stock market valuations of other companies that sell similar products;
|
|
|
•
|
price and volume fluctuations in the overall stock market;
|
|
|
•
|
market conditions in our industry, the industries of our customers and the economy as a whole; and
|
|
|
•
|
other events or factors, including those resulting from war, incidents of terrorism or responses to these events.
|
In addition, the stock market in general, and the Nasdaq Global Market in particular, have experienced substantial price and volume fluctuations that have often been unrelated or disproportionate to the operating performance of particular companies affected. These broad market and industry factors may materially harm the market price of our common stock, regardless of our operating performance. In the past, following periods of volatility in the market price of certain companies’ securities, securities class-action litigation has been instituted against these companies. Such litigation has been initiated against us in the past and may be initiated against us in the future, and any such litigation could adversely affect our business and results of operations.
Substantial future sales of our common stock in the public market could cause our stock price to fall.
Any sale by our current stockholders of our common stock in the public market, or the perception that sales could occur, could adversely affect the prevailing market price for our common stock. We may also sell additional shares of common stock in subsequent public offerings, which may also adversely affect market prices for our common stock.
If securities analysts do not publish research or reports about our business or if they downgrade our stock, the price of our stock could decline.
The research and reports that industry or financial analysts publish about us or our business will likely have an effect on the trading price of our common stock. If an industry analyst decides not to cover us, or if an industry analyst decides to cease covering us at some point in the future, we could lose visibility in the market, which in turn could cause our stock price to decline. If an industry analyst downgrades our stock, our stock price would likely decline rapidly in response.
Provisions of our certificate of incorporation and bylaws and Delaware law might discourage, delay or prevent a change of control of or changes in our management and, as a result, depress the trading price of our common stock.
Our certificate of incorporation and bylaws contain provisions that could discourage, delay or prevent a change in control or changes in our management that our stockholders may deem advantageous. These provisions:
|
|
•
|
require super-majority voting to amend some provisions in our certificate of incorporation and bylaws;
|
|
|
•
|
authorize the issuance of “blank check” preferred stock that our board could issue to increase the number of outstanding shares and to discourage a takeover attempt;
|
26
|
|
•
|
prohibit stockholder action by written consent, which requires all stockholder actions to be taken at a meeting of our stockholders;
|
|
|
•
|
provide that the board of directors is expressly authorized to make, alter or repeal our bylaws; and
|
|
|
•
|
establish advance notice requirements for nominations for election to our board or for proposing matters that can be acted upon by stockholders at stockholder meetings.
|
In addition, we are subject to Section 203 of the Delaware General Corporation Law, which, subject to some exceptions, prohibits “business combinations” between a Delaware corporation and an “interested stockholder,” which is generally defined as a stockholder who becomes a beneficial owner of 15% or more of a Delaware corporation’s voting stock for a three-year period following the date that the stockholder became an interested stockholder. Section 203 could have the effect of delaying, deferring or preventing a change in control that our stockholders might consider to be in their best interests.
These anti-takeover defenses could discourage, delay or prevent a transaction involving a change in control. These provisions could also discourage proxy contests and make it more difficult for you and other stockholders to elect directors of your choosing and cause us to take corporate actions other than those you desire.
We do not expect to pay any cash dividends for the foreseeable future.
We do not anticipate that we will pay any cash dividends to holders of our common stock in the foreseeable future. Accordingly, investors must rely on sales of their common stock after price appreciation, which may never occur, as the only way to realize any future gains on their investment. Investors seeking cash dividends in the foreseeable future should not purchase our common stock.
|
Item 1B.
|
Unresolved Staff Comments
|
As of the date of the filing of this Annual Report, there were no unresolved comments from the staff of the Securities and Exchange Commission.
|
Item 2.
|
Properties
|
Our main offices occupy approximately 38,000 square feet in Melbourne, Florida under a lease that expires in October 2014. We lease approximately 5,000 square feet in Shanghai, China. We also lease properties in South Korea, Taiwan and Japan. These leases have been classified as operating leases. We do not own any manufacturing facilities and contract to third parties the production and distribution of our semiconductors. We believe that our existing facilities meet our current needs and that suitable additional or substitute space will be available as needed to accommodate expansion of our operations.
|
Item 3.
|
Legal Proceedings
|
AuthenTec sent UPEK, Inc. (“UPEK”) a letter on January 23, 2009 providing notice to UPEK that its products infringed the claims of five AuthenTec U.S. patents and expressing its concerns about UPEK’s trade secret misappropriation. AuthenTec’s January 23, 2009 letter invited UPEK to negotiate the claims outside the court system. In response, on January 29, 2010, UPEK filed a complaint against AuthenTec in the U.S. District Court for the Northern District of California alleging that our products infringe a single U.S. patent and seeking a declaratory judgment of non-infringement and invalidity with respect to the five previously identified AuthenTec patents. AuthenTec filed its answer to UPEK’s complaint on February 2, 2010, denied that it infringes UPEK’s patent, asserted that UPEK does infringe the five AuthenTec patents and also asserted that UPEK misappropriated AuthenTec trade secrets. The five AuthenTec patents in this lawsuit relate to packaging of fingerprint sensors and various features related to fingerprint sensors. Both parties have requested injunctive relief, as well as damages, prejudgment interest, and attorneys’ fees and expenses.
On February 17, 2010, AuthenTec filed a Motion for Partial Summary Judgment of Infringement and requested that the U.S. District Court find that UPEK products infringe Claim 13 of AuthenTec’s U.S. Patent No.: 5,940,526. Claim 13 of the ‘526 patent relates to a power conservation feature of fingerprint sensors and specifies a means for conserving power by switching from a low power mode (“touch to wake”) to an increased power mode (“wake up mode”) when a user touches a portion of the sensor. On February 23, 2010, AuthenTec filed a Motion for Summary Judgment of Non-Infringement and Invalidity of UPEK’s U.S. Patent No.: 6,028,773 and requested that the Court summarily resolve UPEK’s patent infringement claim against AuthenTec. AuthenTec requested that the Court find the ‘773 patent invalid as anticipated and obvious based, in part, on AuthenTec’s public display and publication of its fingerprint sensors more than a year before the UPEK ‘773 patent was filed. The motion also requests that the Court find that the accused AuthenTec products do not infringe any claims of the ‘773 patent. UPEK has claimed that its’ asserted ‘773 patent is “foundational” to the packaging of silicon-based fingerprint sensors. Should UPEK obtain an adverse judgment for treble damages or obtain an injunction, such judgment may have a material adverse impact on our financial condition. There is a Court hearing date of April 16, 2010 for the two pending summary judgment motions. On February 23, 2010 UPEK filed an amended complaint alleging that AuthenTec’s U.S. Patent No.: 6,049,620 being asserted against UPEK is unenforceable. AuthenTec looks forward to an opportunity for the matters related to the purchase and revival of the ‘620 patent, purchased by AuthenTec from biometric industry pioneer Veridicom, to be fully briefed for the Court’s consideration. A scheduling conference has not yet taken place and the discovery phase has not yet begun.
27
In addition to the federal patent infringement lawsuit filed by UPEK in California, on January 29, 2010, UPEK filed a state court action in the Court of Chancery of the State of Delaware against AuthenTec. The Delaware action relates to UPEK's notice regarding its intent to nominate candidates for election to AuthenTec's board of directors and to propose business at the upcoming 2010 annual meeting of AuthenTec stockholders. UPEK is asking the Court to declare that its “business proposal” and its nomination of directors are in proper form and in accord with Delaware law as filed and declare that stockholders have a right to call a special meeting. Following an expedited hearing on February 3, 2010, AuthenTec answered UPEK’s complaint on February 12, 2010, and asserted counterclaims for UPEK’s breaches of a non-disclosure agreement between us and lack of compliance with the AuthenTec bylaws advance notice requirements. AuthenTec requested limited discovery which the Court of Chancery granted, and this discovery is ongoing.
The two legal disputes with UPEK come amid UPEK's unsolicited January 29, 2010 proposal to combine the two businesses, a plan that AuthenTec's board of directors rejected after deciding that it was a highly dilutive and speculative transaction that is not in the best interests of AuthenTec stockholders.
In addition to these legal actions, from time to time, we may be involved in various legal proceedings arising from the normal course of business activities. In our opinion, resolution of these matters is not expected to have a material adverse impact on our consolidated results of operations, cash flows or our financial position. However, depending on the amount and timing, an unfavorable resolution of a matter could materially affect our future results of operations, cash flows or financial position in a particular period.
|
Item 4.
|
Submission of Matters to a Vote of Security Holders
|
No matters were submitted to a vote of security holders during the quarter ended January 1, 2010.
PART II
|
Item 5.
|
Market for the Registrant’s Common Equity, Related Stockholder Matters and Issuer Purchases of Equity Securities
|
Our common stock has been listed on the Nasdaq Global Market under the symbol “AUTH” and started trading on June 27, 2007. The following tables set forth, for the periods indicated, the high and low intra-day prices for our common stock as reported on the Nasdaq Global Market.
| Year ended January 1, 2010 | High | Low | ||||||
| First Quarter | $ | 2.40 | $ | 1.26 | ||||
| Second Quarter | 2.08 | 1.59 | ||||||
| Third Quarter | 3.45 | 1.63 | ||||||
| Fourth Quarter | 2.89 | 2.13 | ||||||
| Year ended January 2, 2009 | High | Low | ||||||
| First Quarter | $ | 15.00 | $ | 8.65 | ||||
| Second Quarter | 14.35 | 9.79 | ||||||
| Third Quarter | 11.18 | 1.75 | ||||||
| Fourth Quarter | 2.30 | 1.28 | ||||||
As of March 17, 2010 the number of stockholders of record of our common stock was 37.
Unregistered Sales of Equity Securities
There were no unregistered securities sold during the year ended January 1, 2010 or January 2, 2009.
28
Dividend Policy
We have never paid or declared any cash dividends on our common stock. We currently anticipate that we will retain all of our future earnings for use in developing our business and do not expect to pay any dividend in the foreseeable future.
Performance Graph
The following graph presents a comparison of the cumulative total stockholder return on our stock with the cumulative total return of the Nasdaq Composite Index and the Philadelphia Semiconductor Index for the period of thirty months commencing June 27, 2007 and ending January 1, 2010. The graph assumes that $100 was invested on June 27, 2007 in each of AuthenTec common stock, the Nasdaq Composite Index, and the Philadelphia Semiconductor Index, and that all dividends were reinvested.
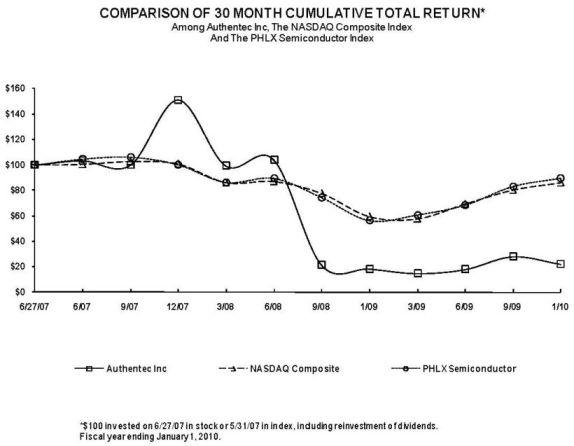
Above graph shows the performance of $100 invested (1) on June 27, 2007 (the date of our initial public offering) in our common stock through January 1, 2010 (end of fiscal year), and (2) on May 31, 2007 in the Nasdaq Composite Index and the Philadelphia Semiconductor Index, index-including reinvestment of dividends through December 31, 2009.
Purchases of Equity Securities by the Issuer and Affiliated Purchasers
None.
Item 6. Selected Consolidated Financial Data
The following selected consolidated financial data should be read in conjunction with, and is qualified by reference to, our consolidated financial statements and related notes and “Management’s Discussion and Analysis of Financial Condition and Results of Operations” in Part II, Item 7 of this Annual Report on Form 10-K. The data as of January 1, 2010 and January 2, 2009, and for the fiscal years ended January 1, 2010, January 2, 2009 and December 28, 2007, are derived from our audited consolidated financial statements and related notes included elsewhere in this Annual Report on Form 10-K. The data as of December 28, 2007, December 29, 2006 and December 31, 2005, and for the fiscal years ended December 31, 2006 and December 31, 2005, are derived from our audited consolidated financial statements and related notes not included in this Annual Report on Form 10-K. Our historical results are not necessarily indicative of the results to be expected in any future period.
29
|
Fiscal year ended
|
||||||||||||||||||||
|
January 1,
|
January 2,
|
December 28,
|
December 29,
|
December 31,
|
||||||||||||||||
|
2010
|
2009
|
2007
|
2006
|
2005
|
||||||||||||||||
|
(In thousands, except per share data)
|
||||||||||||||||||||
|
Revenue
|
$ | 34,066 | $ | 63,948 | $ | 52,344 | $ | 33,174 | $ | 19,243 | ||||||||||
|
Cost of revenue (1)
|
18,369 | 33,397 | 27,554 | 19,264 | 11,314 | |||||||||||||||
|
Gross profit
|
15,697 | 30,551 | 24,790 | 13,910 | 7,929 | |||||||||||||||
|
Expenses
|
||||||||||||||||||||
|
Research and development (1)
|
14,491 | 16,459 | 12,876 | 9,631 | 7,355 | |||||||||||||||
|
Selling and marketing (1)
|
7,649 | 9,466 | 9,112 | 7,067 | 5,432 | |||||||||||||||
|
General and administrative (1)(2)
|
11,278 | 6,580 | 5,750 | 5,084 | 1,284 | |||||||||||||||
|
Total expenses
|
33,418 | 32,505 | 27,738 | 21,782 | 14,071 | |||||||||||||||
|
Loss from operations
|
(17,721 | ) | (1,954 | ) | (2,948 | ) | (7,872 | ) | (6,142 | ) | ||||||||||
|
Other income (expense)
|
||||||||||||||||||||
|
Warrant expense (3)
|
— | — | (9,637 | ) | (2,195 | ) | (933 | ) | ||||||||||||
|
Interest expense
|
— | — | (110 | ) | — | — | ||||||||||||||
|
Impairment on investments
|
(47 | ) | (266 | ) | — | — | — | |||||||||||||
|
Interest income
|
365 | 2,265 | 1,798 | 285 | 449 | |||||||||||||||
|
Total other income (expense), net
|
318 | 1,999 | (7,949 | ) | (1,910 | ) | (484 | ) | ||||||||||||
|
Income (loss) before income tax expense and
|
||||||||||||||||||||
|
cumulative effect of change in accounting principle
|
(17,403 | ) | 45 | (10,897 | ) | (9,782 | ) | (6,626 | ) | |||||||||||
|
Income tax expense
|
— | — | — | — | — | |||||||||||||||
|
Income (loss) before cumulative effect of change
|
||||||||||||||||||||
|
in accounting principle
|
(17,403 | ) | 45 | (10,897 | ) | (9,782 | ) | (6,626 | ) | |||||||||||
|
Cumulative effect of change in
|
||||||||||||||||||||
|
accounting principle (4)
|
— | — | — | — | (4,469 | ) | ||||||||||||||
|
Net income (loss)
|
$ | (17,403 | ) | $ | 45 | $ | (10,897 | ) | $ | (9,782 | ) | $ | (11,095 | ) | ||||||
|
Net income (loss) per common share, basic
|
$ | (.61 | ) | $ | .00 | $ | (.80 | ) | $ | (15.18 | ) | $ | (36.59 | ) | ||||||
|
Shares used in computing basic net income (loss) per common share
|
28,663 | 28,339 | 13,681 | 644 | 303 | |||||||||||||||
|
Net income (loss) per common share, diluted
|
$ | (.61 | ) | $ | .00 | $ | (.80 | ) | $ | (15.18 | ) | $ | (36.59 | ) | ||||||
|
Shares used in computing diluted net income (loss) per common share
|
28,663 | 30,308 | 13,681 | 644 | 303 | |||||||||||||||
|
(1) Includes charges for stock-based compensation:
|
||||||||||||||||||||
|
Cost of revenue
|
$ | 254 | $ | 109 | $ | 46 | $ | — | $ | — | ||||||||||
|
Research and development
|
954 | 773 | 346 | 11 | — | |||||||||||||||
|
Selling and marketing
|
957 | 665 | 214 | 5 | — | |||||||||||||||
|
General and administrative
|
1,034 | 871 | 480 | 79 | — | |||||||||||||||
|
(2) 2009 includes legal and acquisition related costs of $4,816 (please see Note 13 for more information) and 2006 includes accrued legal expenses of $2,781.
|
||||||||||||||||||||
|
(3) Reflects changes in the fair value of our freestanding preferred stock warrants. See note (4) below.
|
||||||||||||||||||||
|
(4) 2005 includes the cumulative effect of a change in accounting principle related to the manner in which we account for freestanding warrants on redeemable preferred stock.
|
||||||||||||||||||||
|
|
||||||||||||||||||||
|
As Of
|
||||||||||||||||||||
|
January 1,
|
January 2,
|
December 28,
|
December 29,
|
December 31,
|
||||||||||||||||
| 2010 | 2009 | 2007 | 2006 | 2005 | ||||||||||||||||
|
(In thousands)
|
||||||||||||||||||||
|
Consolidated Balance Sheet data:
|
||||||||||||||||||||
|
Cash and cash equivalents
|
$ | 27,482 | $ | 45,193 | $ | 15,703 | $ | 6,076 | $ | 690 | ||||||||||
|
Short term investments
|
24,893 | 18,132 | 42,573 | — | 9,454 | |||||||||||||||
|
Working capital
|
53,113 | 64,942 | 59,692 | 6,130 | 12,932 | |||||||||||||||
|
Total assets
|
66,179 | 83,463 | 81,934 | 15,927 | 19,721 | |||||||||||||||
|
Long-term obligations, net of current portion
|
514 | 417 | — | 8,495 | 5,402 | |||||||||||||||
|
Total stockholders' equity (deficit)
|
$ | 59,827 | $ | 74,069 | $ | 71,036 | $ | (63,539 | ) | $ | (54,028 | ) | ||||||||
30
Item7. Management’s Discussion and Analysis of Financial Condition and Results of Operation
This section should be read in conjunction with “Cautionary Statements” and “Risk Factors” in Part I, Item 1A of this Annual Report on Form 10-K and “Consolidated Financial Statements and Supplementary Data,” in Part II, Item 8 of this Annual Report on Form 10-K. The following discussion contains forward-looking statements that involve risks and uncertainties. Our actual results could differ materially from those anticipated in these forward-looking statements as a result of various factors, including those discussed below and elsewhere in this Annual Report on Form 10-K.
Overview
We are a leading provider of security, identity management and touch control technologies for PC, wireless device and information technology (IT) markets. We provide a series of products including fingerprint sensors, software and intellectual property (IP) cores that provide security, convenience, personalization and navigation features in such end products as PCs, cell phones, printers, network servers and many other products.
We continue to evolve from a mixed-signal semiconductor component supplier to the provider of complete solutions focused on security, identity management and touch control solutions, including smart fingerprint sensors, identity management software and IP products and services. Our new generation of TruePrint® smart sensors and TrueSuite® identity management software provide users secure one-touch access to favorite websites, online social networks and their digital identity. We believe our products, which are based on our patented TruePrint-based technology, are the most accurate, reliable, cost-effective, easy to use and versatile products commercially available today. Since our inception in 1998, we have shipped over 54 million sensors which have been integrated into over 250 different models of laptops, desktops and PC peripherals as well as over 10 million mobile phones. We shipped over 10.3 million sensor units in 2009, a 42% decrease from the 17.7 million sensor units we shipped in 2008.
Since inception, we have invested heavily in research and development. From our incorporation through 2000, we were primarily engaged in the design and development of our first products, which we began shipping commercially in 2000. Our revenue has grown from $13.8 million in 2004 to $63.9 million in 2008, primarily by demand in the PC and wireless device markets, while declining in 2009 to $34.1 million as customer demand was severely impacted by weak macroeconomic conditions. We expect sales of our products for use in the PC and wireless device markets to continue to represent a substantial portion of our revenue in the foreseeable future.
We primarily sell our products to OEMs, ODMs, or contract manufacturers. Our customers’ products are complex and require significant time to define, design and ramp to volume production. Our sales cycle begins with our selling and marketing staff and application engineers engaging with our customers’ system designers and management, which is typically a multi-month, or even multi-year, process. If we are successful, a customer will decide to incorporate our solution in its product, which we refer to as a design-win. There is no assurance that a design-win will make it to full production as the product we are designed into could be cancelled for any number of reasons by the customer. Because the sales cycles for our products are long, we incur expenses to develop and sell our products, regardless of whether we achieve the design-win and well in advance of generating revenue, if any, from those expenditures. We do not have long-term purchase commitments from any of our customers, as sales of our products are generally made under individual purchase orders. However, once one of our products is incorporated into a customer’s design, it is likely to remain designed in for the life cycle of that specific product. We believe this to be the case because a redesign of a product already in production would generally be time consuming and expensive. In September 2008, we issued a press release and held a conference call which, in part, disclosed the loss of a 2009 design-in opportunity at one of our significant PC customers. This began to impact revenue in the fourth quarter of fiscal 2009 and we anticipate the transition to be completed by the middle of fiscal 2010. As in prior years, there were other design wins and losses in the PC market during the same design-in cycle.
We do not own or operate our own semiconductor fabrication, wafer bumping, assembly or test facilities. We depend on independent vendors to manufacture, assemble and test our fingerprint sensor products. By outsourcing manufacturing, we are able to avoid the cost associated with owning and operating our own manufacturing facility and take advantage of the scale of operations these third parties provide.
Our future profitability and rate of growth, if any, will be directly affected by the continued acceptance of our products in the marketplace, as well as the timing and size of orders, product mix, average selling prices and costs of our products, timely introduction of new products and general economic conditions. Our ability to maintain profitability will also be affected by the extent to which we must incur additional expenses to expand our sales, marketing, development, and general and administrative capabilities to expand our business. The largest component of our operating expenses is personnel costs. Personnel costs consist of salaries, benefits and incentive compensation, including bonuses and stock-based compensation, for our employees. The following are material trends that are creating opportunities and risks to our business, and a discussion of how we are responding.
|
|
•
|
The global macroeconomic downturn has accelerated the growth in sales of lower-cost PCs, including netbooks. The fingerprint sensor attach rate in lower-cost PCs is lower relative to more expensive, feature rich models. To increase penetration of the lower-cost PC market, we are focusing development efforts on lower-cost fingerprint sensors and client application software tailored for use in this growing portion of the PC market. We introduced a small, lower-cost fingerprint sensor for the PC market, the AES1660 and our TrueSuite identity management software, in 2009. These new solutions are tailored for consumer PCs and the growing portion of the lower-cost laptop market.
|
31
|
|
•
|
Outside of Japan, wireless network carriers are still evaluating the value proposition of integrating fingerprint sensors into devices sold for use on their networks. We expect eventual widespread integration of fingerprint sensors into wireless devices; however, the timing of adoption by wireless network carriers will have a significant impact on our future revenues. In response, we are working with wireless device manufacturers to accelerate adoption of fingerprint sensors by highlighting our Power of Touch features such as personalization and navigation. We are starting to see results of our efforts such as the eXpo® smartphone – the first fingerprint enabled phone in the United States, introduced by LG Electronics, Inc. and AT&T Corporation in late 2009. In addition, we are focused on improving the durability and aesthetics of our sensors for wireless devices through continued development of our new TouchStone packaging technology. In February 2010, we introduced the AES1750, first smart sensor for the mobile systems market, which is to take full advantage of AuthenTec’s new TouchStone packaging technology.
|
|
|
•
|
Weak macroeconomic conditions impacted customer demand in 2009, resulting in a sequential decline in revenue and a net loss, as compared to fiscal 2008. We have and continue taking actions to reduce our expenses to minimize losses.
|
|
|
•
|
On February 26, 2010 we announced that we had acquired SafeNet, Inc.’s Embedded Security Solutions Division in a cash and stock transaction. This acquisition further strengthens our offering of security and identity management solutions. Please see Note 15 – Subsequent Events in our Notes to Consolidated Financial Statements for further discussion related to this matter.
|
Description of Our Revenue, Cost of Revenue and Expenses
Revenue. Our revenue is generated primarily from shipments of our fingerprint authentication sensors and solutions. The price of our products is based upon market and competitive conditions. Therefore, the main factors that impact our revenue are unit volumes and average selling prices.
We supply our products to several end customers either directly or through their suppliers, which may be ODMs, contract manufacturers or distributors. The following table identifies our customers who generated 10% or more of our revenue in the periods indicated.
|
Fiscal year ended
|
||||||||||||
|
January 1,
|
January 2,
|
December 28,
|
||||||||||
|
2010
|
2009
|
2007
|
||||||||||
|
Edom Technology Co., Ltd.
|
27 | % | 11 | % | * | |||||||
|
Fujitsu Ltd.
|
19 | 13 | 23 | % | ||||||||
|
Lenovo (Singapore) Pte., Ltd.
|
17 | * | * | |||||||||
|
Richpower Electronic Devices Co.
|
15 | 15 | 24 | |||||||||
|
Inventec Corporation
|
* | 18 | 19 | |||||||||
|
Compal Electronics, Inc.
|
* | 14 | 15 | |||||||||
|
* Less than 10%
|
||||||||||||
The following table is based on the geographic location of OEMs, ODMs and the distributors which purchased our products. For shipments to ODMs, contract manufacturers or distributors, their geographic location may be different from the geographic locations of the ultimate end customers. For the three years ended January 1, 2010, January 2, 2009 and December 28, 2007, revenue generated from international customers accounted for approximately 95%, 97% and 96%, respectively, of total revenue. We denominate all revenue in U.S. dollars.
|
Fiscal year ended
|
||||||||||||||||||||||||
|
January 1,
|
January 2,
|
December 28,
|
||||||||||||||||||||||
|
2010
|
2009
|
2007
|
||||||||||||||||||||||
|
Revenue $
|
% of total
|
Revenue $
|
% of total
|
Revenue $
|
% of total
|
|||||||||||||||||||
|
(In thousands)
|
||||||||||||||||||||||||
|
Asia/Pacific
|
$ | 23,832 | 70 | % | $ | 48,709 | 76 | % | $ | 36,379 | 69 | % | ||||||||||||
|
Japan
|
7,562 | 22 | 12,459 | 19 | 12,548 | 24 | ||||||||||||||||||
|
United States
|
1,799 | 5 | 1,649 | 3 | 2,181 | 4 | ||||||||||||||||||
|
Canada
|
830 | 3 | 1,021 | 2 | 917 | 2 | ||||||||||||||||||
|
Europe
|
43 | --- | 110 | --- | 319 | 1 | ||||||||||||||||||
| $ | 34,066 | 100 | % | $ | 63,948 | 100 | % | $ | 52,344 | 100 | % | |||||||||||||
|
% Int'l
|
95 | % | 97 | % | 96 | % | ||||||||||||||||||
32
Our distributors are used primarily to support logistics, including credit management and importation outside the U.S. Total revenue through distributors was $16.5 million, $21.5 million and $17.1 million in 2009, 2008 and 2007, respectively, which accounted for 48%, 34% and 32% of revenue, respectively.
Cost of revenue and gross margin. We outsource all manufacturing activities associated with our products, which includes wafer fabrication, wafer bumping, assembly and test functions. A significant portion of our cost of revenue consists of the costs to manufacture our products. Cost of revenue also includes items such as equipment depreciation, royalty expense, production planning personnel and related expenses, warranty costs, inventory valuation write-downs and stock-based compensation under ASC Topic 718, Compensation – Stock Compensation and ASC Subtopic 505-50, Equity-Based Payments to Non-Employees (formerly SFAS No. 123, Share Based Payment). The primary factors that impact our cost of revenue are the number of units sold, mix of products sold, wafer and other raw material costs, outsourced manufacturing costs and product yields. In the future, we believe cost of revenue could increase in absolute dollars from an expected increase in revenue or could decline in absolute dollars from a decrease in revenue. Cost of revenue as a percentage of total revenue may increase over time if decreases in average selling prices are not offset by corresponding decreases in our product costs.
We use third-party foundries, bumping, assembly and test subcontractors, which are primarily located in Asia, to manufacture our semiconductor products. We purchase processed wafers from our fabrication suppliers, which are currently Taiwan Semiconductor Manufacturing Company Limited and Chartered Semiconductor Manufactured. We also outsource the bumping, assembly, test and other processing of our products to third-party subcontractors, primarily Chipbond Technology Corporation, Signetics Corporation and ChipMOS Technologies (Bermuda), Ltd. We do not have long-term agreements with any of our third-party subcontractors. A significant disruption in the operations of one or more of these subcontractors would impact the production of our products and could have a material adverse impact on our business, financial condition and results of operation.
Our gross margin has been and will continue to be affected by a variety of factors, including average selling prices of our products, product mix, and timing of cost reductions for outsourced manufacturing services, inventory write downs and the timing and changes in production yields. In addition, we tend to experience lower yields on the initial production release of a new product.
Research and development expenses. Research and development expenses primarily include personnel, the cost of fabrication masks, engineering development software, depreciation and amortization associated with capital equipment and intellectual property, third-party development support, allocated facilities expense, and stock-based compensation under ASC Topic 718, Compensation – Stock Compensation and ASC Subtopic 505-50, Equity-Based Payments to Non-Employees (formerly SFAS No. 123, Share Based Payment). All research and development costs are expensed as incurred.
We believe that research and development expenses could decrease in absolute dollars in fiscal 2010 as we have less spending on wafer masks and intellectual property fees. Additionally, as a percentage of revenue, these costs fluctuate from one period to another.
Selling and marketing expenses. Selling and marketing expenses consist primarily of salaries and commissions for our sales and marketing personnel, independent sales representative commissions, travel, marketing communications, press releases, advertising, costs for tradeshows, marketing programs, allocated facilities expense, consultants and market studies, and stock-based compensation under ASC Topic 718, Compensation – Stock Compensation and ASC Subtopic 505-50, Equity-Based Payments to Non-Employees (formerly SFAS No. 123, Share Based Payment) . As we align our operating expenses with current economic conditions, we expect selling and marketing expenses to remain relatively flat or decrease in absolute dollars in fiscal 2010.
General and administrative expenses. General and administrative expenses consist primarily of general corporate costs, including personnel expenses, financial reporting, corporate governance and compliance and outside legal, audit, tax compliance fees, allocated facilities expense, and stock-based compensation under ASC Topic 718, Compensation – Stock Compensation and ASC Subtopic 505-50, Equity-Based Payments to Non-Employees (formerly SFAS No. 123, Share Based Payment). We believe that general and administrative expenses could decrease in absolute dollars in fiscal 2010 due to lower legal and acquisition related costs.
Other income (expense) net. Other income (expense) net includes interest income earned on our short term and long term investments of cash and cash equivalents and realized and other-than-temporary unrealized losses on our available-for-sale investments.
33
Provision for income taxes. As of January 1, 2010, we had federal net operating loss carry forwards of approximately $59.7 million. These federal net operating loss carry forwards will expire commencing in 2018. Utilization of these net operating loss carry forwards may be subject to an annual limitation due to provisions of the Internal Revenue Code of 1986, as amended, that are applicable if we have experienced an “ownership change” in the past or if an ownership change occurs in the future aggregated with certain other sales of our stock after our initial public offering.
Critical Accounting Policies
Our discussion and analysis of our financial condition and results of operations are based upon our financial statements, which have been prepared in accordance with United States generally accepted accounting principles, or GAAP. These accounting principles require us to make certain estimates and judgments that can affect the reported amounts of assets and liabilities as of the dates of the consolidated financial statements, the disclosure of contingencies as of the dates of the consolidated financial statements, and the reported amount of revenue and expenses during the periods represented. Although we believe that our judgments and estimates are reasonable under the circumstances, actual results may differ from those estimates.
We believe the following are our most critical accounting policies because they are important to understanding our financial condition and results of operations and they require critical management judgment and estimates about matters that are uncertain:
|
|
•
|
Revenue recognition;
|
|
|
•
|
Inventory valuation;
|
|
|
•
|
Fair value measurements;
|
|
|
•
|
Stock-based compensation;
|
|
|
•
|
Product warranty;
|
|
|
•
|
Accounting for income taxes, and
|
|
|
•
|
Estimation of fair value of warrants to purchase convertible preferred stock.
|
If actual results or events differ materially from those contemplated by us in making these estimates, our reported financial condition and results of operations for future periods could be materially affected. See “Risk Factors” for certain matters that may affect our future financial condition or results of operations.
Revenue recognition. We recognize revenue from product sales to customers when products are shipped, the title and risk of loss has passed to the customer, the sales price is fixed or determinable and collectability is reasonably assured. Our sales to certain distributors are made under arrangements allowing for limited returns or credits under certain circumstances, and we defer recognition of revenue on sales to these distributors until the products are resold by the distributor to the end customer. We assess the ability to collect from our customers based on a number of factors, including credit worthiness and any past transaction history of the customer. If the customer is not deemed credit worthy, we may defer all revenue from the arrangement until payment is received and other revenue recognition criteria have been met.
We expect revenue generated from sales of software to become a material part of our business in the future. We will account for these software sales according to the provisions of ASC Topic 605-985, Revenue Recognition: Software. We did not have any software revenue in the year ended January 1, 2010 or prior.
Inventory valuation. Inventory, consisting principally of outsourced semiconductor products, is valued at the lower of cost or market. We utilize a standard costing application which approximates the first-in, first-out method. We evaluate inventory for excess and obsolescence and write down units that are unlikely to be sold based upon a twelve month demand forecast. This evaluation takes into account various matters including expected demand, product obsolescence and other factors. If actual future demand for our products is less than currently forecasted, additional inventory adjustments may be required. Once a reserve is established, it is maintained until the product to which it relates is sold or scrapped. If a unit that has been written down or off is subsequently sold, the cost associated with the revenue from this unit is reduced to the extent of the write down, resulting in an increase in gross profit.
Fair Value Measurements. Effective December 29, 2007, we adopted ASC Topic 820, Fair Value Measurements and Disclosures (formerly SFAS 157, Fair Value Measurements), which defines fair value, provides a consistent framework for measuring fair value under accounting principles generally accepted in the United States and expands fair value financial statement disclosure requirements. ASC 820 does not require any new fair value measurements. It only applies to accounting pronouncements that already require or permit fair value measures, except for standards that relate to share-based payments (ASC 718, Compensation – Stock Compensation), ASC Topic 840, Leases, (formerly SFAS 13, Accounting for Leases) and other accounting pronouncements that address fair value measurements for purposes of lease classification or measurement under ASC 840.
34
We determine the fair value of our available for sale securities using the criteria of ASC 820. This accounting standard, among other things, defines fair value, establishes a consistent framework for measuring fair value and expands disclosure for each major asset and liability category measured at fair value on either a recurring or nonrecurring basis. ASC 820 clarifies that fair value is an exit price, representing the amount that would be received to sell an asset or paid to transfer a liability in an orderly transaction between market participants. As such, fair value is a market-based measurement that should be determined based on assumptions that market participants would use in pricing an asset or liability. As a basis for considering such assumptions, ASC 820 establishes a three-tier fair value hierarchy, which prioritizes the inputs used in measuring fair value as follows:
|
Level 1
|
—
|
Observable inputs such as quoted prices in active markets;
|
|
Level 2
|
—
|
Inputs, other than the quoted prices in active markets, that are observable either directly or indirectly; and
|
|
Level 3
|
—
|
Unobservable inputs in which there is little or no market data, which require the reporting entity to develop its own assumptions.
|
We estimate the fair value of our auction rate securities based on the following: (i) the underlying structure of each security; (ii) the present value of future principal and interest payments discounted at rates considered to reflect current market conditions; (iii) consideration of the probabilities of default, passing a future auction, or repurchase at par for each period; and (iv) estimates of the liquidity risk for each security. These estimated fair values could change significantly based on future market conditions.
We review declines in the fair value of our investments in marketable securities in accordance with ASC 820 to determine the classification of the impairment as temporary or other than temporary. A temporary impairment charge results in an unrealized loss being recorded in the other comprehensive income component of stockholders’ equity. Unrealized losses are recognized in our consolidated statement of operations when a decline in fair value is determined to be other than temporary. We review our investments on an ongoing basis for indications of possible impairment, and if impairment is identified, we determine whether the impairment is temporary or other than temporary. Determination of whether the impairment is temporary or other than temporary requires significant judgment. The primary factors that we consider in classifying the impairment include the extent and period of time the fair value of each investment has declined below its cost basis, the expected holding or recovery period for each investment, and our intent and ability to hold each investment until recovery.
Our non-financial assets are reviewed for potential impairment and considered for the need to perform an impairment test pursuant to ASC 360-40, Property Plant and Equipment, Derecognition (formerly SFAS No. 144, Accounting for the Impairment or Disposal of Long Lived Assets) and ASC 350-30-35, Intangibles – Goodwill and Other – Subsequent measurement (formerly SFAS No. 142 Goodwill and Other Intangible Assets), by assessing current usage, estimated remaining useful life, and considering other general factors impacting value of these assets.
Refer to the “Liquidity and Capital Resources” section and Note 4 – Fair Value Measurements and Disclosures of “Notes to Consolidated Financial Statements” for further discussion of our investments in marketable securities.
Product warranty. We offer a one-year product replacement warranty. In general, our standard policy is to either credit or replace the defective units. We accrue for estimated returns of defective products based on historical activity for the prior twelve months at the time revenue is recognized as well as for specific known product issues. The determination of these accruals requires us to make estimates of the frequency and extent of warranty activity and estimate future costs to replace the products under warranty. If the actual warranty activity and/or repair and replacement costs differ significantly from these estimates, adjustments to recognize additional cost of revenue may be required in future periods.
Stock-based compensation. Effective January 1, 2006, we adopted ASC Topic 718, Compensation – Stock Compensation (formerly SFAS No. 123, Share Based Payment), which requires the measurement and recognition of compensation expense for all share-based payment awards made to employees and directors, including employee stock options, based on estimated fair values recognized over the requisite service period. We used the prospective transition method, under which, ASC 718 is applied to new awards and to awards modified, repurchased, or cancelled after January 1, 2006.
We estimate the fair value of options granted from and after January 1, 2006 using the Black-Scholes option-pricing valuation model. This valuation model requires us to make assumptions and judgments about the variables used in the calculations. These variables and assumptions include the fair value of our common stock, the weighted average period of time that the options granted are expected to be outstanding, the estimated volatility of comparable companies, the risk free interest rate and the estimated rate of forfeitures of unvested stock options. If actual forfeitures differ from our estimates, we will record the difference as an adjustment in the period we revise our estimates. From January 1, 2006 to January 8, 2007, the fair value of our common stock was determined using enterprise values based on a discounted cash flow approach. The enterprise valuation was allocated between our various securities using the option-pricing method. For options granted on February 21, 2007 and through June 27, 2007, the fair value of our common stock was determined using a weighted average of discounted cash flow, comparable transactions, and market comparables. After June 27, 2007, we used the NASDAQ closing price.
35
For the period of January 1, 2006 through June 29, 2007, we used the simplified calculation of expected life described in the Securities and Exchange Commission Staff Accounting Bulletin 107, and we estimated our stock’s volatility based on an average of historical volatilities of the common stock of several entities with characteristics similar to us. Given our current public company status, for stock options granted after June 29, 2007, we refined our pool of peer companies that reflect characteristics similar to us taking into account industry trends, market capitalization, annual revenue, option life and option vesting terms. During the quarter ended October 3, 2008, we have introduced our common stock volatility in addition to the pool of peer companies’ in order to move towards more reliance on our volatility over time. The risk-free rate is based on U.S. Treasury securities. We estimated expected forfeitures based on our historical experience. Furthermore, if different assumptions are used in future periods, stock-based compensation expense could be materially impacted in the future.
Accounting for income taxes. We account for income taxes under the provisions of ASC Topic 740, Income Taxes (formerly SFAS No. 109, Accounting for Income Taxes). In applying ASC 740, we are required to estimate our current tax expense together with assessing temporary differences resulting from differing treatments of items for tax and accounting purposes. These differences result in deferred tax assets and liabilities. Significant management judgment is required to assess the likelihood that our deferred tax assets will be recovered from future taxable income. As of January 1, 2010, our total deferred tax assets were principally comprised of net operating loss carry forwards.
Estimation of fair value of warrants to purchase convertible preferred stock. On June 29, 2005, the FASB issued FSP 150-5 (Under codification, ASC Topic 480, Distinguishing Liabilities from Equity). FSP 150-5 affirms that warrants to purchase shares of our mandatorily redeemable convertible preferred stock are subject to the requirements in FSP 150-5 and requires us to classify these warrants as liabilities and revalue them to fair value at the end of each reporting period. We adopted FSP 150-5 in July 2005 and recorded a charge in the amount of $4.5 million for the cumulative effect of the change in accounting principle, to reflect the estimated fair value of the warrants as of that date. We recorded no charges for the fiscal years 2009 and 2008 and a $9.6 million charge for the fiscal year 2007 to reflect increases in the estimated fair value of the warrants.
Upon the July 2, 2007 close of our initial public offering, these warrants became exercisable for common stock and the associated liability was reclassified to additional-paid-in-capital.
Recent Accounting Pronouncements
See Note 1 of “Notes to Consolidated Financial Statements” for recent accounting pronouncements that could have an effect on us.
36
Results of Operations
The following table sets forth selected statement of operations data for the periods indicated expressed as a percentage of revenue:
|
Fiscal year ended
|
||||||||||||
|
January 1,
|
January 2,
|
December 28,
|
||||||||||
|
2010
|
2009
|
2007
|
||||||||||
|
Revenue
|
100 | % | 100 | % | 100 | % | ||||||
|
Cost of revenue
|
54 | 52 | 53 | |||||||||
|
Gross profit
|
46 | 48 | 47 | |||||||||
|
Expenses
|
||||||||||||
|
Research and development
|
43 | 26 | 25 | |||||||||
|
Selling and marketing
|
22 | 15 | 17 | |||||||||
|
General and administrative
|
33 | 10 | 11 | |||||||||
|
Total expenses
|
98 | 51 | 53 | |||||||||
|
Loss from operations
|
(52 | ) | (3 | ) | (6 | ) | ||||||
|
Other income (expense)
|
||||||||||||
|
Warrant expense
|
— | — | (18 | ) | ||||||||
|
Interest expense
|
— | — | — | |||||||||
|
Impairment on investments
|
— | — | — | |||||||||
|
Interest income
|
1 | 3 | 3 | |||||||||
|
Total other income (expense), net
|
1 | 3 | (15 | ) | ||||||||
|
Income (loss) before income tax expense
|
— | — | (21 | ) | ||||||||
|
Income tax expense
|
— | — | — | |||||||||
|
Net income (loss)
|
(51 | %) | 0 | % | (21 | %) | ||||||
Fiscal 2009 Compared to Fiscal 2008
Revenue. Our revenue was $34.1 million in 2009 as compared to $63.9 million in 2008, a decrease of $29.8 million, or 47%. The decline in revenue was mostly attributable to the overall global macroeconomic conditions which caused a dramatic drop in end user demand in the PC market for higher end laptops that incorporate our sensors. The reduction in shipments to our customers adversely impacted our revenue by $26.3 million for the fiscal year ended January 1, 2010 as compared to the same timeframe last year. We are also experiencing declining sales prices at the product level which is considered a typical trend within the semiconductor industry. Our average selling prices (“ASPs”), driven by market conditions and competition within the same, adversely impacted our revenue by $3.5 million for the year ended January 1, 2010, as compared to the year ended January 2, 2009.
Cost of revenue and gross profit. Our cost of revenue for 2009 was $18.4 million as compared to $33.4 million in 2008, resulting in a gross profit of $15.7 million in 2009 as compared to $30.6 million in 2008, a decrease of $14.9 million, or 49%. Our gross margin was 46% in 2009 as compared to 48% in 2008. Lower volume and decline in ASPs contributed to $12.6 million and $3.6 million of decreased gross profit, respectively. The decrease was somewhat offset by lower inventory provision of $0.9 million and product mix and manufacturing cost reductions of $0.4 million for the year ended January 1, 2010 as compared to the same time frames last year.
Research and development expenses. Research and development expenses were $14.5 million in 2009 as compared to $16.5 million in 2008, a decrease of $2.0 million, or 12%. Research and development expenses were 43% and 26% of revenue for 2009 and 2008, respectively. The dollar decrease in 2009 was primarily due to a decrease of $1.4 million in contract labor costs mostly related to the support of new design-wins and software improvement activities in 2008 as well as the purchase of software. Personnel and related costs decreased by $0.9 million and travel expenses decreased by $0.4 million due to cost savings initiatives taken during the year that included reduction in headcount, salaries and incentive compensation and more restrictive travel policy. These decreases were offset by the increase in direct materials of $0.7 million associated with the purchase of wafer masks for development programs.
Selling and marketing expenses. Selling and marketing expenses were $7.6 million in 2009 as compared to $9.5 million in 2008, a decrease of $1.9 million, or 20%. Selling and marketing expenses were 22% and 15% of revenue for 2009 and 2008, respectively. The decrease in absolute dollars in selling and marketing expenses was mainly attributed to the decrease in sales commissions of $0.6 million, as a result of lower revenue, a decrease in outside services and travel spending of $0.5 million and $0.4 million, respectively, due to tighter spending controls and a decrease in labor costs of $0.4 million driven by reduced headcount and salaries as well as incentive compensation.
37
General and administrative expenses.General and administrative expenses. General and administrative expenses were $11.3 million in 2009 as compared to $6.6 million in 2008, an increase of $4.7 million, or 71%. General and administrative expenses were 33% and 10% of revenue for 2009 and 2008, respectively. The general and administrative expenses increased in absolute dollars in 2009 mostly as a result of legal and litigation dismissal related fees of $4.3 million, associated with the Atrua asset purchase and higher outside legal services of $0.7 million. These increases were slightly offset by a decrease in labor and related costs of $0.3 million due to salary reductions and cancellation of incentive compensation.
Other income (expense), net. Other income (expense), net decreased $1.7 million to a net income of $0.3 million in 2009 from a net income of $2.0 million in 2008. The decrease in other income (expense) was primarily due to lower yields on our short-term investments.
Fiscal 2008 Compared to Fiscal 2007
Revenue. Our revenue was $63.9 million in 2008 as compared to $52.3 million in 2007, an increase of $11.6 million, or 22%. Our revenue growth was primarily attributable to new design-wins reaching commercial production in the PC market, as well as platform expansions at existing customers. The increased shipments to our PC customers was the main factor which favorably impacted our revenue by $16.0 million for the fiscal year ended January 2, 2009, as compared to the fiscal year ended December 28, 2007. Declining sales prices at the product level, however, adversely affected our revenue by $4.4 million for the year ended January 2, 2009, as compared to the same timeframe in 2008. PC products were influenced the most by the decline in ASPs as a result of high volume shipments, market conditions and pressures of competition.
Cost of revenue and gross profit. Our cost of revenue for 2008 was $33.4 million as compared to $27.6 million in 2007, resulting in a gross profit of $30.6 million in 2008 as compared to $24.8 million in 2007, an increase of $5.8 million, or 23%. Our gross margin was 48% in 2008 as compared to 47% in 2007. Lower product costs and manufacturing yield improvements exceeded the overall decline in ASPs, resulting in increased gross margin.
Research and development expenses. Research and development expenses were $16.5 million in 2008 as compared to $12.9 million in 2007, an increase of $3.6 million, or 28%. Research and development expenses were 26% and 25% of revenue for 2008 and 2007, respectively. The increase in 2008 was primarily due to an increase of $2.3 million in personnel and related costs, including $0.5 million in stock-based compensation expense, as the headcount increased by 15 employees to 83 employees worldwide at January 2, 2009. An increase of $1.2 million in outside services included the purchase of software for $0.3 million and the remainder was attributed to additional contract labor to support new design-win activities.
Selling and marketing expenses. Selling and marketing expenses were $9.5 million in 2008 as compared to $9.1 million in 2007, an increase of $0.4 million, or 4%. Selling and marketing expenses were 15% and 17% of revenue for 2008 and 2007, respectively. The increase in 2008 was mostly attributable to $0.8 million increase in personnel and hiring related costs, including stock-based compensation of $0.5 million. These increases were offset by lower travel expenses of $0.2 million and decrease in outside services by $0.2 million.
General and administrative expenses. General and administrative expenses were $6.6 million in 2008 as compared to $5.8 million in 2007, an increase of $0.8 million, or 14%. General and administrative expenses were 10% and 11% of revenue for 2008 and 2007, respectively. The increase in absolute dollars in 2008 was primarily due to higher legal fees of $0.5 million as a result of patent litigation and the defense of the class action law suit filed against us. In addition, audit and Sarbanes-Oxley compliance related fees increased by $0.2 million and facilities costs increased by $0.1 million.
Other income (expense), net. Other income (expense), net increased $9.9 million to a net income of $2.0 million in 2008 from a net expense of $7.9 million in 2007. $9.6 million warrant revaluation expense was recognized in 2007 in accordance with ASC 480, Distinguishing Liabilities from Equity (formerly FSP 150-5). Interest income increased by $0.5 million due to the timing of proceeds received from our initial public offering that were invested into various short-term and long-term investments such as corporate bonds, notes, auction rate securities, U.S. treasuries, and government agency funds.
Selected Quarterly Financial Information
The following table sets forth our unaudited quarterly consolidated statements of operations for each of the eight most recent fiscal quarters ended January 1, 2010. We have prepared the unaudited quarterly financial information on a basis consistent with the audited consolidated financial statements included in this Annual Report on Form 10-K, and the financial information reflects all necessary adjustments, consisting only of normal recurring adjustments, necessary for a fair statement of our financial position and operating results for the quarters presented. The results of operations for any quarter are not necessarily indicative of the results of the operations for any future period.
38
|
For the three months ended
|
|||||||||||||||||||||||||
|
January 1,
|
October 2,
|
July 3,
|
April 3,
|
January 2,
|
October 3,
|
June 27,
|
March 28,
|
||||||||||||||||||
|
2010
|
2009
|
2009
|
2009
|
2009
|
2008
|
2008
|
2008
|
||||||||||||||||||
|
(In thousands, except per share data)
|
|||||||||||||||||||||||||
|
Revenue
|
$ | 8,315 | $ | 10,267 | $ | 8,446 | $ | 7,038 | $ | 11,615 | $ | 18,409 | $ | 18,410 | $ | 15,514 | |||||||||
|
Cost of revenue (1)
|
4,533 | 5,616 | 4,557 | 3,663 | 6,325 | 9,735 | 9,509 | 7,828 | |||||||||||||||||
|
Gross profit
|
3,782 | 4,651 | 3,889 | 3,375 | 5,290 | 8,674 | 8,901 | 7,686 | |||||||||||||||||
|
Expenses
|
|||||||||||||||||||||||||
|
Research and development (1)
|
3,400 | 3,644 | 3,642 | 3,805 | 3,546 | 4,619 | 4,196 | 4,098 | |||||||||||||||||
|
Selling and marketing (1)
|
1,815 | 2,028 | 1,786 | 2,020 | 1,692 | 2,710 | 2,592 | 2,472 | |||||||||||||||||
|
General and administrative (1) (2)
|
1,570 | 3,186 | 4,303 | 2,219 | 1,526 | 1,353 | 2,033 | 1,668 | |||||||||||||||||
|
Total expenses
|
6,785 | 8,858 | 9,731 | 8,044 | 6,764 | 8,682 | 8,821 | 8,238 | |||||||||||||||||
|
Income (loss) from operations
|
(3,003 | ) | (4,207 | ) | (5,842 | ) | (4,669 | ) | (1,474 | ) | (8 | ) | 80 | (552 | ) | ||||||||||
|
Other income (expense)
|
|||||||||||||||||||||||||
|
Impairment on investments
|
(19 | ) | — | — | (28 | ) | (266 | ) | — | — | — | ||||||||||||||
|
Interest income
|
49 | 52 | 89 | 175 | 396 | 558 | 571 | 740 | |||||||||||||||||
|
Total other income, net
|
30 | 52 | 89 | 147 | 130 | 558 | 571 | 740 | |||||||||||||||||
|
Income (loss) before income tax expense
|
(2,973 | ) | (4,155 | ) | (5,753 | ) | (4,522 | ) | (1,344 | ) | 550 | 651 | 188 | ||||||||||||
|
Income tax expense
|
— | — | — | — | — | — | — | — | |||||||||||||||||
|
Net income (loss)
|
$ | (2,973 | ) | $ | (4,155 | ) | $ | (5,753 | ) | $ | (4,522 | ) | $ | (1,344 | ) | $ | 550 | $ | 651 | $ | 188 | ||||
|
Net income (loss) per common share, basic
|
$ | (.10 | ) | $ | (.14 | ) | $ | (.20 | ) | $ | (.16 | ) | $ | (.05 | ) | $ | .02 | $ | .02 | $ | .01 | ||||
|
Net income (loss) per common share, diluted
|
$ | (.10 | ) | $ | (.14 | ) | $ | (.20 | ) | $ | (.16 | ) | $ | (.05 | ) | $ | .02 | $ | .02 | $ | .01 | ||||
| Shares used in computing basic net income | |||||||||||||||||||||||||
|
(loss) per common share
|
28,685 | 28,668 | 28,658 | 28,647 | 28,622 | 28,501 | 28,304 | 27,927 | |||||||||||||||||
| Shares used in computing diluted net income | |||||||||||||||||||||||||
|
(loss) per common share
|
28,685 | 28,668 | 28,658 | 28,647 | 28,622 | 30,317 | 30,618 | 30,525 | |||||||||||||||||
| (1) Includes charges for stock-based compensation: | |||||||||||||||||||||||||
|
Cost of revenue
|
$ | 55 | $ | 68 | $ | 74 | $ | 58 | $ | 23 | $ | 35 | $ | 36 | $ | 15 | |||||||||
|
Research and development
|
254 | 231 | 267 | 201 | 209 | 258 | 172 | 134 | |||||||||||||||||
|
Selling and marketing
|
216 | 255 | 283 | 203 | 150 | 249 | 175 | 92 | |||||||||||||||||
|
General and administrative
|
209 | 261 | 325 | 239 | 203 | 299 | 210 | 158 | |||||||||||||||||
|
(2) 2009 includes legal and acquisition related costs of $4,816 (please see Note 13 for more information) and 2006 includes accrued legal expenses of $2,781.
|
|||||||||||||||||||||||||
The following table sets forth our unaudited historical operating results on a quarterly basis as a percentage of revenue for the periods indicated above:
|
For the three months ended
|
||||||||||||||||||||||||||||||||
|
January 1,
|
October 2,
|
July 3,
|
April 3,
|
January 2,
|
October 3,
|
June 27,
|
March 28,
|
|||||||||||||||||||||||||
|
2010
|
2009
|
2009
|
2009
|
2009
|
2008
|
2008
|
2008
|
|||||||||||||||||||||||||
|
Revenue
|
100 | % | 100 | % | 100 | % | 100 | % | 100 | % | 100 | % | 100 | % | 100 | % | ||||||||||||||||
|
Cost of revenue
|
54 | 55 | 54 | 52 | 54 | 53 | 51 | 51 | ||||||||||||||||||||||||
|
Gross profit
|
46 | 45 | 46 | 48 | 46 | 47 | 49 | 49 | ||||||||||||||||||||||||
|
Expenses
|
||||||||||||||||||||||||||||||||
|
Research and development
|
41 | 35 | 43 | 54 | 31 | 25 | 23 | 26 | ||||||||||||||||||||||||
|
Selling and marketing
|
22 | 20 | 21 | 29 | 15 | 15 | 14 | 16 | ||||||||||||||||||||||||
|
General and administrative
|
19 | 31 | 51 | 31 | 13 | 7 | 11 | 11 | ||||||||||||||||||||||||
|
Total expenses
|
82 | 86 | 115 | 114 | 58 | 47 | 48 | 53 | ||||||||||||||||||||||||
|
Income (loss) from operations
|
(36 | ) | (41 | ) | (69 | ) | (66 | ) | (13 | ) | — | 1 | (4 | ) | ||||||||||||||||||
|
Other income (expense)
|
||||||||||||||||||||||||||||||||
|
Impairment on investments
|
— | — | — | — | (2 | ) | — | — | — | |||||||||||||||||||||||
|
Interest income
|
— | 1 | 1 | 2 | 3 | 3 | 3 | 5 | ||||||||||||||||||||||||
|
Total other income, net
|
— | 1 | 1 | 2 | 1 | 3 | 3 | 5 | ||||||||||||||||||||||||
|
Income (loss) before income tax expense
|
(36 | ) | 40 | (68 | ) | (64 | ) | (12 | ) | 3 | 4 | 1 | ||||||||||||||||||||
|
Income tax expense
|
— | — | — | — | — | — | — | — | ||||||||||||||||||||||||
|
Net income (loss)
|
(36 | %) | (40 | %) | (68 | %) | (64 | %) | (12 | %) | 3 | % | 4 | % | 1 | % | ||||||||||||||||
Our revenue increased sequentially or remained relatively flat during the first three quarters of 2008 primarily due to the increase in our shipments to the PC market. Our growth reflected new design-wins reaching commercial production, driven by increased demand by consumers and businesses for fingerprint sensors on their PCs. Beginning fourth quarter of 2008, we started experiencing a significant decline in revenue, as customer demand was severely impacted by weakening macroeconomic conditions. Our revenue improved in the second and third quarters of 2009 due to customers replenishing their depleted inventory and booking orders in preparation for the holiday season. Revenues were down sequentially in the fourth quarter of 2009 as a result of cell phone model transitions as well as the initial impacts of the disclosed loss of a 2009 design-in opportunity at one of our significant PC customers.
Our gross margins have fluctuated from quarter to quarter due to several factors, including changes in product mix and lower manufacturing costs, timing of new product introductions and manufacturing yields. Improvements in manufacturing yields on high volume sensors were the primary drivers of the increased margins during the first half of 2008. Product mix and the overall decline in average selling prices were the primary contributors to the lower margin results experienced in the second half of 2008 and throughout 2009 that were slightly offset by lower inventory provisions.
39
Our research and development costs remained relatively flat in the first and second quarter of 2008 and increased slightly in the third quarter of 2008 mostly due to higher personnel and related costs. Starting with the fourth quarter of 2008, our research and development costs have declined mostly as a result of decreased headcount, lower contract labor costs and travel expenses due to cost savings initiatives taken to compensate for revenue decline.
Selling and marketing expenses increased during the third quarter of 2008 as we experienced an increase in personnel and hiring related costs. In the fourth quarter of 2008 selling and marketing costs decreased due to savings in labor and travel expenses. The fourth quarter of 2008 also included a reversal of an incentive compensation accrual which lowered overall expenses as compared to the first quarter of 2009. Increase in our selling and marketing expenses in the third quarter of 2009 was mostly due to an increase in labor costs and applicable hiring related costs due to adding additional headcount to our China and Japan operations with the focus of expanding our market share in the Asian countries.
General and administrative expenses were significantly higher in the second quarter of 2008 as we incurred additional legal fees associated with the Atmel and Atrua litigation. Legal costs declined in the third quarter of 2008, resulting in reduced general and administrative costs, largely driven by the proceeds related to the settlement of a lawsuit. During the first quarter of 2009, we encountered more legal fees as a result of Atrua litigation, which resulted in increased general and administrative expenses. During the second and third quarters of 2009, we experienced substantial increase in our general and administrative expenses mostly attributable to the legal and acquisition fees associated with Atrua asset purchase completed in the second quarter of 2009.
Interest income decreased sequentially each quarter presented due to maturity of our investments and a drop in interest rates as well as a change in our investment strategy where proceeds from matured investments were reinvested into U.S. Treasury and U.S. government agency funds.
Liquidity and Capital Resources
Since our inception, we have financed our growth primarily with funds generated from the issuance and sale of our common stock, preferred stock and senior secured convertible debt. Our cash, cash equivalents and short term and long term investments were $55.5 million as of January 1, 2010, a decrease of $13.2 million from January 2, 2009. The decrease in our cash, cash equivalents and investments as of January 1, 2010 was primarily attributable to the loss from operations and purchase of fixed and intangible assets.
|
Fiscal year ended
|
||||||||||||
|
January 1,
2010
|
January 2,
2009
|
December 28,
2007
|
||||||||||
|
(In thousands)
|
||||||||||||
|
Consolidated statement of cash flows data:
|
||||||||||||
|
Purchase of property and equipment
|
$ | (736 | ) | $ | (1,921 | ) | $ | (1,996 | ) | |||
|
Purchase of intellectual property - patents
|
(930 | ) | (120 | ) | — | |||||||
|
Cash flows from operating activities
|
(11,156 | ) | 4,470 | (2,547 | ) | |||||||
|
Cash flows from investing activities
|
(6,583 | ) | 24,412 | (52,316 | ) | |||||||
|
Cash flows from financing activities
|
$ | 28 | $ | 608 | $ | 64,490 | ||||||
Operating activities. Net cash provided by (used in) operating activities was $(11.2) million, $4.5 million and $(2.5) million in fiscal years ended 2009, 2008 and 2007, respectively. Net cash used in operating activities in fiscal year 2009 was mostly attributable to operating net loss, after adjustments for non-cash items such as stock-based compensation, depreciation and amortization; offset by a decrease in inventory due to active management of inventory to keep the levels in line with current sales volume. Our net operating loss for fiscal year 2009 included $4.3 million of acquisition and litigation dismissal related fees, associated with Atrua asset purchase. Net cash provided by operating activities for fiscal year 2008 was primarily attributable to net income, before stock-based compensation and depreciation and amortization, decrease in accounts receivable due to collections, offset by increase in inventory due to new product builds and decrease in accrued litigation expenses due to payment of legal expenses associated with the Atmel lawsuit, which was settled in the third quarter of 2008. Net cash used in operating activities for 2007 was primarily due to increases in accounts receivable, inventory and prepaid expenses related to licensed design tools, offset by increases in accounts payable due to growth in revenue.
Investing activities. Net cash provided by (used in) investing activities was $(6.6) million, $24.4 million and $(52.3) million for fiscal years ended 2009, 2008 and 2007, respectively. Net cash used in investing activities in fiscal year 2009 was primarily attributable to the purchase of short-term investments in U.S. treasury and U.S. government agency funds, purchase of property, plant and equipment and the purchase of patents. Net cash provided by investing activities in 2008 was mostly due to redemption of investments (net of purchases) of $26.7 million that were reinvested in U.S. treasury and U.S. government agency funds due to market instability, offset by purchase of property and equipment of $1.9 million as well as purchase of research and development software of $0.3 million and purchase of intellectual property of $0.1 million. Net cash used in 2007 was primarily attributable to purchases of short-term and long-term investments (net of redemptions) of $50.3 million and purchase of equipment of $2.0 million.
40
We purchased property and equipment of $0.7 million, $1.9 million and $2.0 million in fiscal years 2009, 2008 and 2007, respectively, primarily for equipment used by our third-party manufacturing subcontractors. Although we do not operate manufacturing facilities under our business model, we do provide certain custom assembly and test related equipment to our subcontractors for use in manufacturing our products. We anticipate that purchases of property and equipment may increase to the extent we invest in new products which require custom assembly and test related equipment.
We purchased intellectual property of $0.9 million, $0.1 million and none in fiscal years 2009, 2008 and 2007, respectively. In the year 2009 we purchased patent portfolios from Veridicom and also Atrua, as part of the asset purchase completed in the second quarter of 2009. In the fiscal year 2008, we purchased patents from Atmel as an outcome of litigation settlement.
Financing Activities. Net cash provided by our financing activities was $28,000, $0.6 million and $64.5 million for fiscal years 2009, 2008 and 2007, respectively. Net cash provided in 2009 and 2008 was mostly attributable to cash received from the exercise of stock options. Net cash provided in 2007 was due primarily to the net proceeds of $55.9 million received from our initial public offering and the issuance of $7.4 million of senior secured convertible notes, net of issuance costs. These convertible notes were purchased by existing preferred stockholders or their affiliates. Interest on the notes was 4.0% per annum, payable semi-annually with all payments of interest until December 31, 2008 being paid in shares of our common stock and thereafter, in cash. The notes and accrued interest were converted into shares of our common stock at the rate of $6.00 per share upon the July 2, 2007 closing of our initial public offering.
Our investment policies are designed to provide liquidity, preserve capital and achieve an acceptable return on invested assets. As of January 1, 2010, our investment portfolio consisted primarily of U.S. treasury and U.S. government agency funds and fixed-income securities. The weighted average maturity is less than twelve months. We utilize investment vehicles such as treasuries, U.S. government agency funds and auction rate securities.
As of January 1, 2010, $3.2 million of our $28.1 million in short-term and long-term investments were comprised of preferred stock investments and a student loan backed security with an auction reset feature (“auction rate securities”). The preferred stock is issued by a closed-end mutual fund that invests primarily in common stock and fixed income securities. Our preferred stock investments carry AAA credit ratings. The student loan backed auction rate security is a state issued note with its underlying student loans being substantially insured by the U.S. government.
Liquidity for these auction rate securities is typically provided by an auction process which allows holders to sell their notes and resets the applicable interest rate at pre-determined intervals, usually every seven, 28 or 35 days. In the beginning of 2008 the auction rate securities markets became disrupted and we experienced auction failures for the first time. An auction failure means that the parties wishing to sell their securities could not be matched with an adequate volume of buyers. In the event that there is a failed auction, the indenture governing the security requires the issuer to pay interest at a contractually defined rate that is generally above market rates for other types of similar short-term instruments. The securities for which auctions have failed will continue to accrue interest at the contractual rate and be auctioned every seven, 28 or 35 days until the auction succeeds, the issuer calls the securities, or they mature. As a result, our ability to liquidate and fully recover the carrying value of our remaining auction rate securities in the near term may be limited. These developments resulted in the classification of these securities as long-term investments in our consolidated financial statements at January 1, 2010.
At January 1, 2010, the estimated fair value of our preferred stock ARS was $215,000 less than its cost. As we intend to hold on to this security until the sooner of a recovery in the ARS market or a call of the security by the issuer and it is more-likely-than-not that we will not be required to sell this ARS prior to recovery, we concluded the decline in the fair value was temporary and recorded the unrealized loss to accumulated other comprehensive income on the accompanying Consolidated Balance Sheet at January 1, 2010.
At January 1, 2010, the estimated fair value of our student loan ARS was $313,000 less than its cost. We recorded other-than-temporary impairment charge in the amount of $266,000 in our Consolidated Statement of Operations for the year ended January 2, 2009. We continue to believe that the impairment is other-than-temporary as this investment has been impaired for an extended period of time and we are not sure of the likelihood of the issuer being able to make payments in the future or our ability to hold this security until maturity. As a result, we recorded additional other-than-temporary impairment in the amount of $47,000 in our Consolidated Statement of Operations for the year ended January 1, 2010.
We believe that, even if we hold all such securities for an indefinite period of time, our remaining cash and cash equivalents and short-term investments will be sufficient to support our projected operating requirements over the next twelve months. Our long-term future capital requirements will depend on many factors, including our level of revenue, the timing and extent of spending to support our research and development efforts, the expansion of selling and marketing activities, acquisitions, the timing of our introductions of new products, the costs to ensure access to adequate manufacturing capacity and the continuing market acceptance of our products. We could be required, or could elect, to seek additional funding through public or private equity or debt financing. These additional funds may not be available on terms acceptable to us or at all.
41
On February 26, 2010 we announced that we had acquired SafeNet, Inc.’s Embedded Security Solutions Division in a cash and stock transaction. Under terms of the transaction, we paid $8.5 million in cash and issued 1.2 million of our common stock. The transaction also calls for an earn-out of up to $2.5 million in cash based on the attainment of certain revenue goals for the remainder of 2010.
Contractual Obligations
The following table describes our contractual obligations as of January 1, 2010:
|
Total
|
Less than
1 year
|
1-3 years
|
3-5 years
|
More than
5 years
|
||||||||||||||||
| (In thousands) | ||||||||||||||||||||
|
Operating Leases
|
$ | 4,544 | $ | 882 | $ | 2,702 | $ | 960 | — | |||||||||||
|
Inventory purchase commitments (1)
|
1,412 | 1,412 | — | — | — | |||||||||||||||
|
License fees
|
726 | 311 | 415 | — | — | |||||||||||||||
|
Total
|
$ | 6,682 | $ | 2,605 | $ | 3,117 | $ | 960 | $ | - | ||||||||||
|
(1) Open purchase obligations represent inventory commitments. These obligations are not recorded in the consolidated financial statements until commitments are fulfilled and such obligations are subject to change based on negotiations with manufacturers.
|
||||||||||||||||||||
We adopted the accounting guidance on uncertainty in income taxes as of December 30, 2006. The total amount of gross unrecognized tax benefits for uncertain tax positions, including positions impacting only the timing of tax benefits, was $1.4 million at January 1, 2010. Due to the difficulty in determining the timing of settlements, these obligations are not included in the table above. We do not expect a significant tax payment related to these obligations within the next year.
Off-Balance Sheet Arrangements
We do not maintain any off-balance sheet arrangements, transactions, obligations or other relationships with unconsolidated entities that would be expected to have a material current or future effect upon our financial condition or results of operations.
|
Item 7A.
|
Qualitative and Quantitative Disclosure about Market Risks
|
Foreign currency risk. All of our revenue is presently denominated in U.S. dollars. We therefore have no foreign currency risk associated with sales of our products at this time. However, we do have risk of our products being more expensive outside the United States if the value of the U.S. dollar increases as compared to the local currency of our customer. This could result in pricing pressure, lower revenue and lower gross margins. Our international sales and research and development operations incur expenses that are denominated in foreign currencies. These expenses presently do not constitute a significant portion of our total spending and therefore any currency fluctuations would not have a material effect on us.
Interest rate risk. We had cash, cash equivalents and investments of $55.5 million as of January 1, 2010, which were held for working capital and strategic purposes. The primary objectives of our investment activity are to preserve principal, provide liquidity and achieve an acceptable return without significantly increasing our risk. Some of the securities we invest in are subject to market risk. This means that a change in prevailing interest rates may cause the principal amount of the investment to fluctuate. To minimize this risk and reduce exposure, we maintain our portfolio of cash equivalents and short-term and long-term investments in investment grade securities that are primarily of a conservative nature. Since our results of operations are not dependent on investments, the risk associated with fluctuating interest rates is limited to our investment portfolio, and we believe that a 10% change in interest rates would not have a significant impact on our results from operations.
Market risk. Our short term and long term investments consist of U.S. Treasury and U.S. Government agency funds and auction rate securities that are exposed to certain risks. Although these various investments are managed to a standard designed to avoid principal loss, market forces can have an adverse effect on asset valuations, and it is possible for these investment grade securities to lose a portion of their principal. The ability to determine the risks presented by these investments is limited by, among other things, restrictions on the ability to know the holdings or the collateral backing of the securities.
42
At January 1, 2010, we held $3.2 million in auction rate securities and consider them inactively traded securities. The rate of interest paid on the auction rate securities is determined at auctions held at pre-determined intervals, usually every seven, 28 or 35 days. If sufficient clearing bids are not made in a particular auction, that can result in the inability to liquidate the asset-backed securities in the auction. All of our auction rate securities held as of January 1, 2010 had experienced failed auctions, although a portion of one of the securities was called at par by the issuer during the year ended January 1, 2010. There can be no assurance that auctions on the auction rate securities in our investment portfolio will succeed. If the issuers are unable to successfully close future auctions and their credit ratings deteriorate, the fair value of those auction rate securities may decline even further and we may record additional temporary or other than temporary impairment charges.
Credit ratings and the market for debt securities may continue to worsen which may also require us to record other than temporary impairment charges. A 10% change in interest rates would not have a material impact in the fair value of our investments. For more information on fair value assumptions please see Note 4, “Fair Value Measurements and Disclosures”, of the financial statements.
43
|
Item 8.
|
Consolidated Financial Statements and Supplementary Data
|
Report of Independent Registered Certified Public Accounting Firm
To the Board of Directors and Stockholders of AuthenTec, Inc.:
In our opinion, the consolidated financial statements listed in the index appearing under Item 15(a)(1) present fairly, in all material respects, the financial position of AuthenTec, Inc and its subsidiaries (the Company) at January 1, 2010 and January 2, 2009, and the results of their operations and their cash flows for each of the three years in the period ended January 1, 2010 in conformity with accounting principles generally accepted in the United States of America. In addition, in our opinion, the financial statement schedule appearing under Item 15(a)(2) presents fairly, in all material respects, the information set forth therein when read in conjunction with the related consolidated financial statements. Also in our opinion, the Company maintained, in all material respects, effective internal control over financial reporting as of January 1, 2010, based on criteria established in Internal Control - Integrated Framework issued by the Committee of Sponsoring Organizations of the Treadway Commission (COSO). The Company's management is responsible for these financial statements and the financial statement schedule, for maintaining effective internal control over financial reporting and for its assessment of the effectiveness of internal control over financial reporting, included in Management’s Annual Report on Internal control over Financial Reporting appearing under Item 9A. Our responsibility is to express opinions on these financial statements, on the financial statement schedule, and on the Company's internal control over financial reporting based on our audits (which were integrated audits for the years ended January 1, 2010 and January 2, 2009). We conducted our audits in accordance with the standards of the Public Company Accounting Oversight Board (United States). Those standards require that we plan and perform the audits to obtain reasonable assurance about whether the financial statements are free of material misstatement and whether effective internal control over financial reporting was maintained in all material respects. Our audits of the financial statements included examining, on a test basis, evidence supporting the amounts and disclosures in the financial statements, assessing the accounting principles used and significant estimates made by management, and evaluating the overall financial statement presentation. Our audit of internal control over financial reporting included obtaining an understanding of internal control over financial reporting, assessing the risk that a material weakness exists, and testing and evaluating the design and operating effectiveness of internal control based on the assessed risk. Our audits also included performing such other procedures as we considered necessary in the circumstances. We believe that our audits provide a reasonable basis for our opinions.
As discussed in Note 4 to the consolidated financial statements, effective December 29, 2007 the Company changed the manner in which it measures fair value in accordance with the ASC Topic 820, Fair Value Measurements.
A company’s internal control over financial reporting is a process designed to provide reasonable assurance regarding the reliability of financial reporting and the preparation of financial statements for external purposes in accordance with generally accepted accounting principles. A company’s internal control over financial reporting includes those policies and procedures that (i) pertain to the maintenance of records that, in reasonable detail, accurately and fairly reflect the transactions and dispositions of the assets of the company; (ii) provide reasonable assurance that transactions are recorded as necessary to permit preparation of financial statements in accordance with generally accepted accounting principles, and that receipts and expenditures of the company are being made only in accordance with authorizations of management and directors of the company; and (iii) provide reasonable assurance regarding prevention or timely detection of unauthorized acquisition, use, or disposition of the company’s assets that could have a material effect on the financial statements.
Because of its inherent limitations, internal control over financial reporting may not prevent or detect misstatements. Also, projections of any evaluation of effectiveness to future periods are subject to the risk that controls may become inadequate because of changes in conditions, or that the degree of compliance with the policies or procedures may deteriorate.
|
/s/ PricewaterhouseCoopers LLP
|
|
Orlando, Florida
|
|
March 17, 2010
|
44
AuthenTec, Inc. and Subsidiaries
Consolidated Balance Sheets
(In thousands, except per share data)
|
As of
|
||||||||
|
January 1,
|
January 2,
|
|||||||
|
2010
|
2009
|
|||||||
|
Assets
|
||||||||
|
Current assets
|
||||||||
|
Cash and cash equivalents
|
$ | 27,482 | $ | 45,193 | ||||
|
Short-term investments
|
24,893 | 18,132 | ||||||
|
Accounts receivable, net of allowances of $5 and $41, respectively
|
3,208 | 3,985 | ||||||
|
Inventory
|
2,245 | 5,770 | ||||||
|
Other current assets
|
1,123 | 839 | ||||||
|
Total current assets
|
58,951 | 73,919 | ||||||
|
Long-term investments
|
3,173 | 5,334 | ||||||
|
Other long-term assets
|
1,007 | 494 | ||||||
|
Property and equipment, net
|
3,048 | 3,716 | ||||||
|
Total assets
|
$ | 66,179 | $ | 83,463 | ||||
|
Liabilities and stockholders’ equity
|
||||||||
|
Current liabilities
|
||||||||
|
Accounts payable
|
$ | 2,458 | $ | 4,050 | ||||
|
Accrued compensation and benefits
|
920 | 1,505 | ||||||
|
Other accrued liabilities
|
2,460 | 3,422 | ||||||
|
Total current liabilities
|
5,838 | 8,977 | ||||||
|
Deferred rent
|
514 | 417 | ||||||
|
Total liabilities
|
6,352 | 9,394 | ||||||
|
Commitments and contingencies (see note 5)
|
||||||||
|
Stockholders’ equity
|
||||||||
| Common stock, $.01 par value; 100,000 shares authorized; 28,722 and | ||||||||
|
28,628 issued and outstanding at January 1, 2010 and January 2, 2009
|
287 | 286 | ||||||
|
Additional paid-in capital
|
153,063 | 149,837 | ||||||
|
Other comprehensive loss
|
(195 | ) | (129 | ) | ||||
|
Accumulated deficit
|
(93,328 | ) | (75,925 | ) | ||||
|
Total stockholders’ equity
|
$ | 59,827 | $ | 74,069 | ||||
|
Total liabilities and stockholders’ equity
|
$ | 66,179 | $ | 83,463 | ||||
The accompanying notes are an integral part of these consolidated financial statements.
45
AuthenTec, Inc. and Subsidiaries
Consolidated Statements of Operations
(In thousands, except per share data)
|
Fiscal Year Ended
|
||||||||||||
|
January 1,
2010
|
January 2,
2009
|
December 28,
2007
|
||||||||||
|
Revenue
|
$ | 34,066 | $ | 63,948 | $ | 52,344 | ||||||
|
Cost of revenue
|
18,369 | 33,397 | 27,554 | |||||||||
|
Gross profit
|
15,697 | 30,551 | 24,790 | |||||||||
|
Operating expenses
|
||||||||||||
|
Research and development
|
14,491 | 16,459 | 12,876 | |||||||||
|
Selling and marketing
|
7,649 | 9,466 | 9,112 | |||||||||
|
General and administrative
|
11,278 | 6,580 | 5,750 | |||||||||
|
Total operating expenses
|
33,418 | 32,505 | 27,738 | |||||||||
|
Loss from operations
|
(17,721 | ) | (1,954 | ) | (2,948 | ) | ||||||
|
Other income (expense):
|
||||||||||||
|
Warrant expense
|
— | — | (9,637 | ) | ||||||||
|
Interest expense
|
— | — | (110 | ) | ||||||||
|
Impairment on investments
|
(47 | ) | (266 | ) | — | |||||||
|
Interest income
|
365 | 2,265 | 1,798 | |||||||||
|
Total other income (expense), net
|
318 | 1,999 | (7,949 | ) | ||||||||
|
Income (loss) before income tax expense
|
(17,403 | ) | 45 | (10,897 | ) | |||||||
|
Income tax expense
|
— | — | — | |||||||||
|
Net income (loss)
|
$ | (17,403 | ) | $ | 45 | $ | (10,897 | ) | ||||
|
Net income (loss) per common share, basic
|
$ | (0.61 | ) | $ | 0.00 | $ | (0.80 | ) | ||||
|
Net income (loss) per common share, diluted
|
$ | (0.61 | ) | $ | 0.00 | $ | (0.80 | ) | ||||
|
Shares used in computing basic net income (loss) per common share
|
28,663 | 28,339 | 13,681 | |||||||||
|
Shares used in computing diluted net income (loss) per common share
|
28,663 | 30,308 | 13,681 | |||||||||
The accompanying notes are an integral part of these consolidated financial statements
46
AuthenTec, Inc. and Subsidiaries
Consolidated Statements of Stockholders’ Equity
(In thousands)
|
Junior convertible
preferred stock
|
Common stock
|
Addit-
ional
|
Accum- | Accum-
ulated
other
compre
hensive
|
||||||||||||||||||||||||||||
|
Number
|
Par
|
Number
|
Par
|
paid-in
|
ulated
|
income
|
Total | |||||||||||||||||||||||||
|
of shares
|
value
|
of shares
|
value
|
capital
|
deficit
|
(loss)
|
equity
|
|||||||||||||||||||||||||
|
Balance, December 29, 2006
|
4,500 | $ | 45 | 744 | $ | 7 | $ | 1,482 | $ | (65,073 | ) | - | $ | (63,539 | ) | |||||||||||||||||
|
Exercise of stock options
|
- | - | 342 | 4 | 160 | - | - | 164 | ||||||||||||||||||||||||
|
Exercise of warrants
|
- | - | 977 | 9 | 581 | - | - | 590 | ||||||||||||||||||||||||
|
Stock-based compensation
|
- | - | - | - | 1,086 | - | - | 1,086 | ||||||||||||||||||||||||
|
Reclassification of warrant liability
|
- | - | - | - | 9,199 | - | - | 9,199 | ||||||||||||||||||||||||
|
Conversion of junior preferred stock
|
(4,500 | ) | (45 | ) | 1,125 | 11 | 34 | - | - | - | ||||||||||||||||||||||
|
Conversion of redeemable preferred stock
|
- | - | 17,671 | 177 | 70,788 | - | - | 70,965 | ||||||||||||||||||||||||
| Conversion of senior secured convertible | ||||||||||||||||||||||||||||||||
| notes and associated accrued interest | ||||||||||||||||||||||||||||||||
|
(net of issuance costs)
|
- | - | 1,260 | 13 | 7,504 | - | - | 7,517 | ||||||||||||||||||||||||
| Proceeds from initial public offering | ||||||||||||||||||||||||||||||||
|
(net of offering costs)
|
- | - | 5,625 | 56 | 55,887 | - | - | 55,943 | ||||||||||||||||||||||||
|
Issuance of common stock
|
- | - | 1 | - | 8 | - | - | 8 | ||||||||||||||||||||||||
|
Net loss
|
- | - | - | - | - | (10,897 | ) | - | (10,897 | ) | ||||||||||||||||||||||
|
Balance, December 28, 2007
|
- | - | 27,745 | 277 | 146,729 | (75,970 | ) | - | 71,036 | |||||||||||||||||||||||
|
Exercise of stock options
|
- | - | 837 | 9 | 665 | - | - | 674 | ||||||||||||||||||||||||
|
Exercise of warrants
|
- | - | 44 | - | - | - | - | - | ||||||||||||||||||||||||
|
Stock-based compensation
|
- | - | - | - | 2,418 | - | - | 2,418 | ||||||||||||||||||||||||
|
Issuance of common stock
|
- | - | 2 | - | 25 | - | - | 25 | ||||||||||||||||||||||||
|
Unrealized loss on investments
|
- | - | - | - | - | - | (129 | ) | (129 | ) | ||||||||||||||||||||||
|
Net income
|
- | - | - | - | - | 45 | - | 45 | ||||||||||||||||||||||||
|
Balance, January 2, 2009
|
- | - | 28,628 | 286 | 149,837 | (75,925 | ) | (129 | ) | 74,069 | ||||||||||||||||||||||
|
Exercise of stock options
|
- | - | 65 | 1 | 49 | - | - | 50 | ||||||||||||||||||||||||
|
Issuance of restricted stock units
|
- | - | 29 | - | (22 | ) | - | - | (22 | ) | ||||||||||||||||||||||
|
Stock-based compensation
|
- | - | - | - | 3,199 | - | - | 3,199 | ||||||||||||||||||||||||
|
Unrealized loss on investments
|
- | - | - | - | - | - | (66 | ) | (66 | ) | ||||||||||||||||||||||
|
Net loss
|
- | - | - | - | - | (17,403 | ) | - | (17,403 | ) | ||||||||||||||||||||||
|
Balance, January 1, 2010
|
- | $ | - | 28,722 | $ | 287 | $ | 153,063 | $ | (93,328 | ) | $ | (195 | ) | $ | 59,827 | ||||||||||||||||
The accompanying notes are an integral part of these consolidated financial statements.
47
AuthenTec Inc. and Subsidiaries
Consolidated Statements of Cash Flows
(In thousands)
|
Twelve months ended
|
||||||||||||
|
January 1,
2010
|
January 2,
2009
|
December 28,
2007
|
||||||||||
|
Cash flows from operating activities
|
||||||||||||
|
Net income (loss)
|
$ | (17,403 | ) | $ | 45 | $ | (10,897 | ) | ||||
| Adjustments to reconcile net income (loss) to net cash provided by (used in) operating activities | ||||||||||||
|
Depreciation and amortization
|
1,311 | 1,085 | 826 | |||||||||
|
Amortization of deferred Rent
|
88 | 3 | — | |||||||||
|
Increase (decrease) in bad debt provision
|
(8 | ) | 18 | (52 | ) | |||||||
|
Increase in inventory provision
|
37 | 422 | 590 | |||||||||
|
Stock-based compensation expense
|
3,199 | 2,418 | 1,086 | |||||||||
|
Warrant expense
|
— | — | 9,637 | |||||||||
|
Interest accrued on senior secured convertible notes
|
— | — | 110 | |||||||||
|
Decrease (increase) in investment discounts/premiums
|
147 | 75 | (310 | ) | ||||||||
|
Impairment on investments
|
47 | 266 | — | |||||||||
|
Purchase of research and development software
|
— | 250 | — | |||||||||
|
Decrease (increase) in assets:
|
||||||||||||
|
Accounts receivable
|
784 | 2,371 | (2,625 | ) | ||||||||
|
Inventory
|
3,488 | (1,072 | ) | (1,211 | ) | |||||||
|
Other assets
|
92 | 278 | (1,273 | ) | ||||||||
|
Increase (decrease) in liabilities:
|
||||||||||||
|
Accounts payable
|
(1,486 | ) | (54 | ) | 1,662 | |||||||
|
Accrued compensation and benefits and other accrued liabilities
|
(1,452 | ) | (2,135 | ) | (90 | ) | ||||||
|
Lease incentive
|
— | 500 | — | |||||||||
|
Net cash provided by (used in) operating activities
|
(11,156 | ) | 4,470 | (2,547 | ) | |||||||
|
Cash flows from investing activities
|
||||||||||||
|
Purchase of property and equipment
|
(736 | ) | (1,921 | ) | (1,996 | ) | ||||||
|
Purchase of research and development software
|
— | (250 | ) | — | ||||||||
|
Purchase of intellectual property
|
(150 | ) | (120 | ) | — | |||||||
|
Purchase of Atrua assets
|
(837 | ) | — | — | ||||||||
|
Purchase of available-for-sale investments
|
(24,700 | ) | (7,008 | ) | (64,661 | ) | ||||||
|
Redemption of available-for-sale investments
|
19,840 | 41,132 | 40,641 | |||||||||
|
Purchase of held-to-maturity investments
|
— | (16,940 | ) | (28,300 | ) | |||||||
|
Redemption of held-to-maturity investments
|
— | 9,519 | 2,000 | |||||||||
|
Net cash provided by (used in) investing activities
|
(6,583 | ) | 24,412 | (52,316 | ) | |||||||
|
Cash flows from financing activities
|
||||||||||||
|
Deferred initial public offering costs
|
— | (66 | ) | — | ||||||||
|
Proceeds from exercise of stock options, net of tax withholdings
|
28 | 674 | 164 | |||||||||
|
Proceeds from exercise of preferred and common stock warrants
|
— | — | 910 | |||||||||
|
Proceeds from the issuance of senior secured convertible notes, net of issuance costs
|
— | — | 7,407 | |||||||||
|
Proceeds from initial public offering of common stock, net of offering costs
|
— | — | 56,009 | |||||||||
|
Net cash provided by financing activities
|
28 | 608 | 64,490 | |||||||||
|
Net increase (decrease) in cash and cash equivalents
|
(17,711 | ) | 29,490 | 9,627 | ||||||||
|
Cash and cash equivalents, beginning of period
|
45,193 | 15,703 | 6,076 | |||||||||
|
Cash and cash equivalents, end of period
|
$ | 27,482 | $ | 45,193 | $ | 15,703 | ||||||
|
Supplemental non-cash disclosures
|
||||||||||||
|
Accrued purchase of property and equipment
|
$ | 82 | $ | 273 | — | |||||||
|
Exercise of 1,595 preferred stock warrants
|
— | — | $ | 3,558 | ||||||||
|
Exercise of 54 common stock warrants
|
— | $ | 137 | — | ||||||||
|
Redemption of shares on exercise of 158,590 stock options
|
— | $ | 63 | — | ||||||||
|
Stock issuance
|
— | $ | 25 | $ | 8 | |||||||
|
Accrued deferred offering costs
|
— | — | $ | 66 | ||||||||
|
Reclassification of warrant liability to equity upon initial public offering
|
— | — | $ | 9,199 | ||||||||
|
Reclassification of senior secured convertible notes and associated accrued interest
|
— | |||||||||||
|
to equity upon initial public offering
|
— | — | $ | 7,610 | ||||||||
The accompanying notes are an integral part of these consolidated financial statements.
48
AuthenTec, Inc. and Subsidiaries
Notes to Consolidated Financial Statements
1. Description of Business and Summary of Significant Accounting Policies
Organization
AuthenTec, Inc., a Delaware corporation, incorporated in 1998 for the purpose of developing and commercializing certain Harris Corporation technology. In 1998, we entered into an Assignment and Assumption Agreement with HVFM-V, L.P. (“HVFM”), a venture capital affiliate of Harris Corporation, for the rights, title and interests under a Technology Transfer Agreement between HVFM and Harris Corporation.
Nature of Business
We are a leading provider of identity, security and touch control technologies for PC, wireless device and other markets. AuthenTec brings multiple touch-powered features including security, convenience, personalization and navigation to PCs, cell phones and many other products. AuthenTec continues to evolve from a mixed-signal semiconductor component supplier to the provider of a complete smart sensor solution, which includes smart fingerprint sensor hardware and software as well as end-user applications. Our new generation of smart sensors will give users secure one-touch access to favorite websites, online social networks and their digital identity. We primarily sell our products to original equipment manufacturers, or OEMs, original design manufacturers, or ODMs or contract manufacturers. We operate a fabless manufacturing model, whereby manufacturing requirements are outsourced to third parties.
Initial Public Offering
On July 2, 2007, we completed our initial public offering, selling 5,625,000 shares of our common stock and yielding approximately $56,000 common stock and $55,887,000 additional paid in capital proceeds to us, net of offering costs of approximately $1,600,000. At that time, all shares of our outstanding convertible preferred stock were converted into approximately 18,796,000 shares of common stock, resulting in an increase in common stock of approximately 188,000 and an increase in additional paid in capital of approximately $70,822,000. In addition, the preferred stock warrant liability with a carrying value of approximately $9,199,000 was reclassified to additional paid in capital upon conversion of these preferred stock warrants into warrants to purchase the aforementioned common stock. Our outstanding senior secured convertible notes and the associated accrued interest were converted into approximately 1,260,000 shares of our common stock at the rate of $6.00 per share, increasing common stock by approximately $13,000 and additional paid in capital by approximately $7,504,000.
Principles of Consolidation
The consolidated financial statements include accounts of AuthenTec, Inc. and our wholly owned subsidiaries: AuthenTec K.K. and AuthenTec (Shanghai) Co., Ltd. All significant intercompany accounts and transactions have been eliminated.
Our fiscal year ends on the Friday closest to December 31. Fiscal year 2009 began January 3, 2009 and ended January 1, 2010. Fiscal years 2009 and 2007 contained 52 weeks and fiscal year 2008 contained 53 weeks.
Use of Estimates
The preparation of financial statements in conformity with generally accepted accounting principles requires management to make estimates and assumptions that affect the reported amounts of assets and liabilities and disclosure of contingent assets and liabilities at the date of the financial statements and reported amounts of revenue and expenses during the reporting period. Actual results may differ from those estimates.
Comprehensive Income (Loss)
Comprehensive income (loss) is defined as a change in equity resulting from non-owner sources. Accumulated other comprehensive loss includes unrealized losses on investment securities classified as available-for-sale of $0.2 million and $0.1 million at January 1, 2010 and January 2, 2009, respectively. We did not have any amounts recorded in accumulated other comprehensive income (loss) at December 28, 2007. During the years ended January 1, 2010, January 2, 2009 and December 28, 2007, none, $0.3 million and none, respectively, of unrealized losses on available-for-sale investment securities were transferred into earnings as a result of other-than-temporary impairment charge.
49
AuthenTec, Inc. and Subsidiaries
Notes to Consolidated Financial Statements
(Continued)
Revenue Recognition
We recognize revenue from product sales to customers when products are shipped, the title and risk of loss has passed to the customer, the sales price is fixed or determinable, and collectability is reasonably assured. Our sales to certain distributors are made under agreements allowing for limited returns or credits under certain circumstances, and we defer recognition of revenue on sales to these distributors until the products are resold by the distributor to the end-user. We assess the ability to collect from our customers based on a number of factors, including credit worthiness and any past transaction history of the customer. If the customer is not deemed credit worthy, we defer all revenue from the arrangement until payment is received and other revenue recognition criteria have been met. During the second quarter of 2007, we changed our contract terms with a few major distributors. The new terms do not allow for a right of return or price protection, which terms under our old agreements have previously caused sales to these distributors to be deferred until resold to end customers. We therefore now recognize revenue to these distributors upon shipment. At the time of the contract changes, this created an increase to revenue and decrease in deferred revenue of approximately $566,000 since such term changes were retroactive to prior shipments also.
Product Warranty
We offer a one-year product replacement warranty. We accrue for estimated returns of defective products based on historical activity for the prior twelve months at the time revenue is recognized as well as any specific known product issues. The determination of these accruals requires us to make estimates of the frequency and extent of warranty activity and estimated future costs to replace the products under warranty. If the actual warranty activity and/or repair and replacement costs differ significantly from these estimates, adjustments to recognize additional cost of revenue may be required in future periods. The following table presents a reconciliation of our product warranty liability, which is included in other accrued liabilities in the consolidated balance sheets:
|
Fiscal year ended
|
||||||||||||
|
January 1,
|
January 2,
|
December 28,
|
||||||||||
|
2009
|
2009
|
2007
|
||||||||||
|
(In thousands)
|
||||||||||||
|
Balance — beginning of year
|
$ | 215 | $ | 135 | $ | 181 | ||||||
|
Accruals/(reversals) of warranty liabilities
|
(30 | ) | 205 | 14 | ||||||||
|
Costs incurred
|
(11 | ) | (125 | ) | (60 | ) | ||||||
|
Balance — end of year
|
$ | 174 | $ | 215 | $ | 135 | ||||||
Cash, Cash Equivalents and Investments
Our investments are tailored to appropriately balance the trade-off between the preservation of capital and return. We consider all highly liquid investments with an original maturity of three months or less at the date of purchase to be cash equivalents. Our other investments that include U.S. treasury and U.S. government agency funds and auction rate securities, corporate and euro bonds, medium and short term notes and certificates of deposits are classified as investments and are accounted for under the provisions of Accounting Standards Codification (“ASC”) Topic 320, Investments – Debt and Equity Securities (formerly Statement of Financial Accounting Standards (“SFAS”) No. 115, Accounting for Certain Investments in Debt and Equity Securities). We have classified our auction rate securities as available-for-sale (AFS) and reported at fair value, with unrealized gains and losses, if any, excluded from earnings and reported in other comprehensive income (loss), a separate component of stockholders’ equity.
Prior to our adoption of the ASC 320-10-65, Investments- Debt and Equity Securities – Transition and Open Effective Date Information (issued as FSP FAS 115-2, FAS 124-2, and EITF 99-20-2, Recognition and Presentation of Other-Than-Temporary Impairments), we recognized all other-than-temporary impairment amounts related to our debt securities in earnings as required under the previously effective guidance which required that management assert that it had the ability and intent to hold a debt security until maturity or until we recovered the cost of our investment. Under the new accounting standards, other-than-temporary impairment must be recognized through earnings if an investor has the intent to sell the debt security or if it is more likely than not that the investor will be required to sell the debt security before recovery of its amortized cost basis. However, even if an investor does not expect to sell a debt security, expected cash flows to be received must be evaluated to determine if a credit loss has occurred. In the event of a credit loss, only the amount associated with the credit loss is recognized in income. The amount of losses relating to other factors, including those resulting from changes in interest rates, are recorded in accumulated other comprehensive income.
The amortized cost, gross unrealized gains and losses, and fair value of investments, by type, were as follows:
|
As of
|
||||||||||||||||||||||||
|
Amortized cost
|
Unrealized gains/(losses)
|
Fair value
|
||||||||||||||||||||||
|
January 1,
|
January 2,
|
January 1,
|
January 2,
|
January 1,
|
January 2,
|
|||||||||||||||||||
|
2010
|
2009
|
2010
|
2009
|
2010
|
2009
|
|||||||||||||||||||
|
(In thousands)
|
||||||||||||||||||||||||
|
U.S. Government agency notes (AFS)
|
$ | 24,873 | $ | — | $ | 20 | $ | — | $ | 24,893 | $ | — | ||||||||||||
|
Auction rate securities (AFS)
|
3,701 | 5,600 | (528 | ) | (266 | ) | 3,173 | 5,334 | ||||||||||||||||
|
Certificates of deposits (AFS)
|
— | 1,526 | — | 6 | — | 1,532 | ||||||||||||||||||
|
Corporate bonds (AFS)
|
— | 7,547 | — | 1 | — | 7,548 | ||||||||||||||||||
|
Euro bonds (AFS)
|
— | 1,036 | — | (41 | ) | — | 995 | |||||||||||||||||
|
Notes (AFS)
|
— | 8,152 | — | (95 | ) | — | 8,057 | |||||||||||||||||
|
Total
|
$ | 28,574 | $ | 23,861 | $ | (508 | ) | $ | (395 | ) | $ | 28,066 | $ | 23,466 | ||||||||||
50
AuthenTec, Inc. and Subsidiaries
Notes to Consolidated Financial Statements
(Continued)
The amortized cost and fair value of available-for-sale investments as of January 1, 2010 and January 2, 2009, by contractual maturity, were as follows:
|
As of
|
||||||||||||||||||||||||
|
Amortized cost
|
Fair value
|
Unrealized gains/(losses)
|
||||||||||||||||||||||
|
January 1,
|
January 2,
|
January 1,
|
January 2,
|
January 1,
|
January 2,
|
|||||||||||||||||||
|
2010
|
2009
|
2010
|
2009
|
2010
|
2009
|
|||||||||||||||||||
|
(In thousands)
|
||||||||||||||||||||||||
|
Due in one year or less
|
$ | 24,873 | $ | 18,261 | $ | 24,893 | $ | 18,132 | $ | 20 | $ | (129 | ) | |||||||||||
|
Due after one year through five years
|
— | — | — | — | — | — | ||||||||||||||||||
|
Due after five years through ten years
|
— | — | — | — | — | — | ||||||||||||||||||
|
Due after ten years
|
1,300 | 2,700 | 987 | 2,434 | (313 | ) | (266 | ) | ||||||||||||||||
|
Preferred stock auction rate securities
|
2,401 | 2,900 | 2,186 | 2,900 | (215 | ) | — | |||||||||||||||||
|
Total
|
$ | 28,574 | $ | 23,861 | $ | 28,066 | $ | 23,466 | $ | (508 | ) | $ | (395 | ) | ||||||||||
The fair value of investments with gross unrealized losses by investment type and length of time that individual securities haven been in a continuous loss position were as follows:
|
As of January 1, 2010
|
||||||||||||||||||||||||
|
Less than 12 months
|
12 months or greater
|
Total
|
||||||||||||||||||||||
|
Fair
|
Gross
unrealized
|
Fair
|
Gross
unrealized
|
Fair
|
Gross
unrealized
|
|||||||||||||||||||
|
value
|
losses
|
value
|
losses
|
value
|
losses
|
|||||||||||||||||||
| (In thousands) | ||||||||||||||||||||||||
|
Available-for-sale investments
|
|
|||||||||||||||||||||||
|
Auction rate securities - student loan
|
$ | — | $ | — | $ | 987 | $ | (313 | ) | $ | 987 | $ | (313 | ) | ||||||||||
|
Auction rate securities - preferred stock
|
2,186 | (215 | ) | — | — | 2,186 | (215 | ) | ||||||||||||||||
|
Total
|
$ | 2,186 | $ | (215 | ) | $ | 987 | $ | (313 | ) | $ | 3,173 | $ | (528 | ) | |||||||||
|
As of January 2, 2009
|
||||||||||||||||||||||||
|
Less than 12 months
|
12 months or greater
|
Total
|
||||||||||||||||||||||
| Fair |
Gross
unrealized
|
Fair |
Gross
unrealized
|
Fair |
Gross
unrealized
|
|||||||||||||||||||
|
value
|
losses
|
value
|
losses
|
value
|
losses
|
|||||||||||||||||||
| (In thousands) | ||||||||||||||||||||||||
|
Available-for-sale investments
|
||||||||||||||||||||||||
|
Auction rate securities - student loan
|
$ | 1,134 | $ | (266 | ) | $ | — | $ | — | $ | 1,134 | $ | (266 | ) | ||||||||||
|
Total
|
$ | 1,134 | $ | (266 | ) | $ | — | $ | — | $ | 1,134 | $ | (266 | ) | ||||||||||
As of January 1, 2010 and January 2, 2009, $3.2 million and $5.3 million, respectively, of our $28.1 million and $23.5 million in short-term and long-term investments, respectively, were comprised of municipal notes, preferred stock and student loan backed investments with an auction reset feature (“auction rate securities”). The municipal notes are issued by various state and local municipal entities for the purpose of public projects and other activities. The preferred stock is issued by various closed-end mutual funds that invest primarily in common stock and fixed income securities. The student loan backed auction rate security is a state issued note with its underlying student loans being substantially insured by the U.S. government.
Due to auction rate securities markets being disrupted, in the beginning of 2008, we experienced auction failures for the first time. An auction failure means that the parties wishing to sell their securities could not be matched with an adequate volume of buyers. In the event that there is a failed auction, the indenture governing the security requires the issuer to pay interest at a contractually defined rate that is generally above market rates for other types of similar short-term instruments and we continue to receive contractual payments. The securities for which auctions have failed will continue to accrue interest at the contractual rate and be auctioned every seven, 28 or 35 days until the auction succeeds, the issuer calls the securities, or they mature.
All of our auction rate securities held at January 1, 2010 had experienced failed auctions. As a result, our ability to liquidate and fully recover the carrying value of our remaining auction rate securities in the near term may be limited or not exist.
We estimated the fair value of our short-term and long-term investments based our own analysis. Our estimates were based on assumptions we believe market participants would use in pricing similar assets in a current transaction, which could change significantly over time based on market conditions. Please refer to Note 4 Fair Value Measurements and Disclosures for more information.
51
AuthenTec, Inc. and Subsidiaries
Notes to Consolidated Financial Statements
(Continued)
Inventory
Inventory, consisting principally of outsourced semiconductor chips and finished goods, is valued at the lower of cost or market. Cost is determined by standard costs which approximate the first-in, first-out method. We evaluate inventory for excess and obsolescence and write down units that are unlikely to be sold based upon a twelve months’ demand forecast. This evaluation takes into account various matters, which might include expected demand, product obsolescence and other factors. If actual future demand for our products is less than currently forecasted, additional inventory adjustments may be required. Once a reserve is established, it is maintained until the product to which it relates is sold or scrapped. If a unit that has been written down or off is subsequently sold, the cost associated with the revenue from this unit is reduced to the extent of the write down, resulting in an increase in gross profit.
Concentration of Credit Risk and Significant Customers and Suppliers
Financial instruments that potentially subject us to a concentration of credit risk consist of cash, cash equivalents, investments and accounts receivable. The majority of cash and cash equivalents are deposited with two credit worthy financial institutions and the federal government. We have not experienced any losses on deposits of cash and cash equivalents. We believe that the financial institutions are reputable and, accordingly, minimal credit risk exists. However, at times we have cash balances in these banks in excess of FDIC insurance limits.
We currently sell our products to a limited number of customers and maintain reserves for potential credit losses related to accounts receivable arising from sales of our products. We also perform credit evaluations of our customers and provide credit to certain customers in the normal course of business.
The following table illustrates the concentration of customer accounts receivable as a percent of total accounts receivable:
|
As of
|
||||||||
|
January 1,
|
January 2,
|
|||||||
|
2010
|
2009
|
|||||||
|
Lenovo (Singapore) Pte., Ltd.
|
43 | % | 15 | % | ||||
|
Edom Technology Co., Ltd.
|
23 | * | ||||||
|
Bioscrypt, Inc.
|
11 | * | ||||||
|
Richpower Electronic Devices Co.
|
10 | * | ||||||
|
Inventec Corporation
|
* | 23 | ||||||
|
Compal Electronics, Inc.
|
* | 10 | ||||||
|
* Less than 10%
|
||||||||
A change in or loss of one or more of our customers could adversely effect results of operations. The following table illustrates the concentration of customer revenue as a percent of total revenue:
|
Fiscal year ended
|
||||||||||||
|
January 1,
|
January 2,
|
December 28,
|
||||||||||
|
2010
|
2009
|
2007
|
||||||||||
|
Edom Technology Co., Ltd.
|
27 | % | 11 | % | * | |||||||
|
Fujitsu Ltd.
|
19 | 13 | 23 | % | ||||||||
|
Lenovo (Singapore) Pte., Ltd.
|
17 | * | * | |||||||||
|
Richpower Electronic Devices Co.
|
15 | 15 | 24 | |||||||||
|
Inventec Corporation
|
* | 18 | 19 | |||||||||
|
Compal Electronics, Inc.
|
* | 14 | 15 | |||||||||
|
* Less than 10%
|
||||||||||||
For the years ended January 1, 2010, January 2, 2009 and December 28, 2007, sales to international customers accounted for 95%, 97%, and 96% of revenue, respectively.
In September 2008, we disclosed the loss of a 2009 design-in opportunity at one of our significant PC customers. This began to impact revenue in the fourth quarter of fiscal 2009 and we anticipate the transition to be completed by the middle of fiscal 2010.
We depend upon a limited number of subcontractors for our production requirements. The failure of any of our subcontractors to fulfill our production requirements on a timely basis would adversely impact future results. Although there are other subcontractors that are capable of providing similar services, an unexpected change in our subcontractors could cause delays in our ability to meet our customer’s demands, resulting in loss of revenue.
52
AuthenTec, Inc. and Subsidiaries
Notes to Consolidated Financial Statements
(Continued)
Property and Equipment
Property and equipment are stated at cost, less accumulated depreciation. The cost of additions and improvements are capitalized, while maintenance and repairs are charged to expense when incurred. Depreciation is provided on the straight-line method over the shorter of the lease term or the estimated useful lives of the related assets (three to eight years). Depreciation of property, plant and equipment amounted to approximately $1,261,000, $1,083,000 and $826,000 for the years ended January 1, 2010, January 2, 2009 and December 28, 2007, respectively.
Intangible Assets
During the year ended January 1, 2010, we purchased certain patents subject to amortization for $930,000 with estimated useful lives ranging from 6 years to 18.5 years. We allocated the total purchase price individually to each patent family based on their relative fair values and began amortizing them using straight-line amortization method over their remaining useful lives. The weighted average amortization period is 11.1 years. These amortizable intangible assets are classified under other long-term assets on our Consolidated Balance Sheet.
The change in the carrying amount of intangible assets is as follows:
| As of | ||||||||||||||||||||||||
| January 1, 2010 | January 2, 2009 | |||||||||||||||||||||||
| Gross
carrying
value
|
Accumulated
amortization
|
Net
book
value
|
Gross
carrying
value
|
Accumulated
amortization
|
Net
book
value
|
|||||||||||||||||||
| (In thousands) | ||||||||||||||||||||||||
|
Patents subject to amortization (6-19 years)
|
$ | 1,050 | $ | 52 | $ | 998 | $ | 120 | $ | 2 | $ | 118 | ||||||||||||
ASC Topic 350, Intangibles – Goodwill and Other (formerly SFAS No. 142 Goodwill and Other Intangible Assets) requires that intangible assets with estimable useful lives be amortized over their respective estimated useful lives and reviewed for impairment in accordance with ASC Topic 350, Intangibles – Goodwill and Other (formerly SFAS No. 144, Accounting for the Impairment or Disposal of Long-Lived Assets) whenever events or changes in circumstances indicate that its carrying amount may not be recoverable.
Amortization expense for intangible assets amounted to approximately $50,000, $2,000 and none for the year ended January 1, 2010 and January 2, 2009, and December 28, 2007, respectively. The estimated aggregate amortization expense for all amortizable intangibles for each of the succeeding years ending January 2, 2015 is as follows:
|
Fiscal year
|
Amount
|
|||
|
2010
|
$ | 92,398 | ||
|
2011
|
92,398 | |||
|
2012
|
92,398 | |||
|
2013
|
92,398 | |||
|
2014
|
94,174 | |||
| $ | 463,766 | |||
Deferred Rent
One of our leases contains predetermined fixed increases in the base rental rate over the term of the lease. For this lease, we recognize the related rental expense on a straight-line basis over the lease term. Additionally, the lessor under this lease agreement provided an incentive to us in the form of funding for certain leasehold improvements made during the fiscal year 2008. We have recorded this lease incentive as deferred rent along with the difference between amounts charged to expenses and currently payable under the lease. The lease incentive is amortized as a reduction to lease expense over the lease term.
Research and Development
Development costs incurred in the research and development of products are expensed as incurred. ASC Topic 985-20-25, Costs of Software to Be Sold, Leased, or Marketed, requires certain software development costs to be capitalized upon the establishment of technological feasibility. The establishment of technological feasibility and the ongoing assessment of the recoverability of these costs requires considerable judgment by management with respect to certain external factors such as anticipated future revenue, estimated economic life, and changes in software and hardware technologies. Costs incurred beyond the establishment of technological feasibility have not been significant to date and accordingly no software development costs were capitalized during the years ended January 1, 2010, January 2, 2009 and December 28, 2007. Software development costs have been recorded as research and development expense.
53
AuthenTec, Inc. and Subsidiaries
Notes to Consolidated Financial Statements
(Continued)
Advertising Expense
We expense advertising costs as incurred. Advertising expense was approximately $160,000, $444,000 and $430,000 for the years ended January 1, 2010, January 2, 2009 and December 28, 2007, respectively.
Long-Lived Assets
ASC Topic 360-10-40, Property, Plant and Equipment – Derecognition (formerly SFAS No. 144, Accounting for the Impairment or Disposal of Long-Lived Assets), requires us to review long-lived assets for impairment whenever events or changes in circumstances indicate that the carrying amount of an asset may not be recoverable. Recoverability of assets to be held and used is measured by a comparison of the carrying amount of an asset to future net undiscounted cash flows expected to be generated by the asset. If such assets are considered to be impaired, the impairment to be recognized is measured by the amount by which the carrying amount of the assets exceeds the discounted cash flows. No impairment losses were recognized by us for the years ended January 1, 2010, January 2, 2009 and December 28, 2007.
Litigation Related Expenses
We accrue all litigation related legal expenses if these costs are probable and estimable, regardless of whether a liability can be estimated for the loss contingency, itself. No such amounts were accrued or expensed for fiscal years 2009, 2008 or 2007.
Stock-Based Compensation
We estimate the fair value of options granted using the Black-Scholes option-pricing valuation model. This valuation model requires us to make assumptions and judgments about the variables used in the calculation. These variables and assumptions include the fair value of our common stock, weighted average period of time that the options granted are expected to be outstanding, the estimated volatility of comparable companies, the risk free interest rate and the estimated rate of forfeitures of unvested stock options.
For the period of January 1, 2006 through June 29, 2007, we used the simplified calculation of expected life described in the Securities and Exchange Commission Staff Accounting Bulletin 107, and we estimated our stock’s volatility based on an average of historical volatilities of the common stock of several entities with characteristics similar to us. Given our current public company status, for stock options granted after June 29, 2007, we refined our pool of peer companies that reflect characteristics similar to us taking into account industry trends, market capitalization, annual revenue, option life and option vesting terms. During the quarter ended October 3, 2008, we introduced our common stock volatility in addition to the pool of peer companies’ in order to move towards more reliance on our volatility over time. The risk-free rate is based on U.S. Treasury securities. We estimated expected forfeitures based on our historical experience. Furthermore, if different assumptions are used in future periods, stock-based compensation expense could be materially impacted in the future.
Net Loss per Share
We calculate net income (loss) per share in accordance with ASC Topic 260, Earnings per Share (formerly SFAS No. 128, Earnings per Share). Under ASC 260, basic net income (loss) per common share is calculated by dividing net income (loss) by the weighted-average number of common shares outstanding during the reporting period. Diluted net income (loss) per common share reflects the effects of potentially dilutive securities, which consist of convertible preferred stock, senior convertible notes, common stock options and warrants.
54
AuthenTec, Inc. and Subsidiaries
Notes to Consolidated Financial Statements
(Continued)
The following table sets forth the computation of basic and diluted income (loss) per common share:
|
Fiscal year ended
|
||||||||||||
|
January 1,
2010
|
January 2,
2009
|
December 28,
2007
|
||||||||||
|
(In thousands, except per share data)
|
||||||||||||
|
Numerator:
|
||||||||||||
|
Net income (loss)
|
$ | (17,403 | ) | $ | 45 | $ | (10,897 | ) | ||||
|
Denominator:
|
||||||||||||
|
Denominator for basic income (loss) per share -
|
||||||||||||
|
weighted average common shares outstanding
|
28,663 | 28,339 | 13,681 | |||||||||
|
Effect of dilutive securities:
|
||||||||||||
|
Stock options and non vested restricted stock units
|
— | 1,965 | — | |||||||||
|
Warrants to purchase common stock
|
— | 4 | — | |||||||||
|
Denominator for diluted income (loss) per share -
|
||||||||||||
|
weighted average common shares and potential
|
||||||||||||
|
common shares outstanding
|
28,663 | 30,308 | 13,681 | |||||||||
|
Basic net income (loss) per share
|
$ | (0.61 | ) | $ | 0.00 | $ | (0.80 | ) | ||||
|
Diluted net income (loss) per share
|
$ | (0.61 | ) | $ | 0.00 | $ | (0.80 | ) | ||||
Basic net income (loss) per common share was the same as diluted net income (loss) per common share for the years ended January 1, 2010 and December 28, 2007 as the outstanding options and warrants were anti-dilutive due to losses during the respective periods. The following table presents the potentially dilutive securities outstanding that were excluded from the computation of diluted net income (loss) per common share for the periods presented because their inclusion would have had an anti-dilutive effect:
|
Fiscal year ended
|
||||||||||||
|
January 1,
2010
|
January 2,
2009
|
December 28,
2007
|
||||||||||
|
Options to purchase common stock
|
||||||||||||
|
non vested restricted stock awards
|
4,689 | 2,237 | 3,779 | |||||||||
|
Warrants to purchase common or preferred stock
|
25 | 25 | 79 | |||||||||
| 4,714 | 2,262 | 3,858 | ||||||||||
Accounting for Income Taxes
We account for income taxes under the provisions ASC Topic 740, Income Taxes (formerly SFAS, No. 109, Accounting for Income Taxes). In applying ASC 740, we are required to estimate our current tax expense together with assessing temporary differences resulting from differing treatments of items for tax and accounting purposes. These differences result in deferred tax assets and liabilities. Significant management judgment is required to assess the likelihood that our deferred tax assets will be recovered from future taxable income. As of January 1, 2010, our total deferred tax assets were principally comprised of net operating loss carry forwards. As of January 1, 2010, based on the available objective evidence, we believe it is more likely than not that our deferred tax assets will not be realizable in the foreseeable future. We based this belief primarily on the fact that we have incurred cumulative pre-tax losses in all years since inception, except one. Accordingly, we provided a full valuation allowance against our net deferred tax assets as of January 1, 2010. Should sufficient positive, objectively verifiable evidence of the realization of our net deferred tax assets exist at a future date, we would reverse any remaining valuation allowance to the extent supported by estimates of future taxable income at that time.
55
AuthenTec, Inc. and Subsidiaries
Notes to Consolidated Financial Statements
(Continued)
Recent Accounting Pronouncements
In September 2006, the FASB issued SFAS No. 157, Fair Value Measurements (ASC 820-10, Fair Value Measurements and Disclosures). The purpose of SFAS No. 157 is to increase consistency and comparability in fair value measurements by defining fair value, establishing a framework for measuring fair value in generally accepted accounting principles, and expanding disclosures about fair value measurements. SFAS No. 157 emphasizes that fair value is a market-based measurement, not an entity-specific measurement. It clarifies the extent to which fair value is used to measure recognized assets and liabilities, the inputs used to develop measurements, and the effect of certain measurements on earnings for the period. SFAS No. 157 is effective for financial statements issued for fiscal years beginning after November 15, 2007, and is applied on a prospective basis. In February 2008, the FASB released a FASB Staff Position (“FSP”) 157-2, “Effective Date of FASB Statement No. 157,” (FSP 157-2), which delayed the effective date of SFAS No. 157 for all nonfinancial assets and nonfinancial liabilities, except those that are recognized or disclosed at fair value in the financial statements on a recurring basis. SFAS No. 157 was first effective for us on December 29, 2007 (See Note 4). Effective January 3, 2009, we adopted FSP 157-2. The adoption of SFAS 157 to non-financial assets and liabilities did not have a significant impact on our consolidated financial statements.
In December 2007, the FASB issued SFAS No. 141 (revised 2007), Business Combinations (ASC 805-10, Business Combinations), to increase relevance, representational faithfulness, and comparability of the information that a reporting entity provides in its financial reports about a business combination and its effects. SFAS No. 141R replaces SFAS No. 141, “Business Combinations,” but, retains the fundamental requirements of SFAS No. 141 that the acquisition method of accounting be used and an acquirer be identified for all business combinations. SFAS 141R expands the definition of a business and of a business combination and establishes how the acquirer is to: (1) recognize and measure in its financial statements the identifiable assets acquired, the liabilities assumed, and any non controlling interest in the acquiree; (2) recognize and measure the goodwill acquired in the business combination or a gain from a bargain purchase; and (3) determine what information to disclose to enable users of the financial statements to evaluate the nature and financial effects of the business combination. This Statement applies prospectively to business combinations for which the acquisition date is on or after the beginning of the first annual reporting period beginning on or after December 15, 2008. We adopted FSP 141R on January 3, 2009. The adoption did not have a material impact on our consolidated results of operations or financial condition. SFAS No. 141R will impact us in the future if we acquire a business.
In April 2008, the FASB issued FSP 142-3, Determination of the Useful Life of Intangible Assets (ASC 350-30, General Intangibles Other than Goodwill). FSP 142-3 amends the factors that should be considered in developing renewal or extension assumptions used to determine the useful life of a recognized intangible asset under SFAS No. 142, Goodwill and Other Intangible Assets. FSP 142-3 also requires additional disclosures on information that can be used to assess the extent to which future cash flows associated with intangible assets are affected by an entity’s intent or ability to renew or extend such arrangements and on associated accounting policies. We adopted FSP 142-3, Determination of the Useful Life of Intangible Assets, on January 3, 2009. The adoption did not have a material impact on our consolidated results of operations or financial condition.
In October 2008, the FASB issued FSP 157-3, Determining the Fair Value of a Financial Asset When the Market for That Asset is Not Active (ASC 820-10-35, Fair Value Measurements and Disclosures – Subsequent Measurement). This FSP clarifies the application of FASB Statement No. 157, Fair Value Measurements, in a market that is not active and provides an example to illustrate key considerations in determining the fair value of a financial asset when the market for that financial asset is not active. This FSP applies to financial assets within the scope of accounting pronouncements that require or permit fair value measurements in accordance with Statement 157. This FSP shall be effective upon issuance, including prior periods for which financial statements have not been issued. Revisions resulting from a change in the valuation technique or its application shall be accounted for as a change in accounting estimate (FASB Statement No. 154, Accounting Changes and Error Corrections, paragraph 19). The disclosure provisions of Statement 154 for a change in accounting estimate are not required for revisions resulting from a change in valuation technique or its application. We used this guidance for fair value measurement of our financial assets as of January 2, 2009.
In April 2009, the FASB simultaneously issued the following three FSPs:
|
•
|
FSP FAS 157-4, Determining Fair Value When the Volume and Level of Activity for the Asset or Liability Have Significantly Decreased and Identifying Transactions That Are Not Orderly (ASC 820-10-65, Fair Value Measurements and Disclosures – Transition and Open Effective Date Information), provides additional guidance to companies for determining fair values of financial instruments for which there is no active market or quoted prices may represent distressed transactions. The guidance includes a reaffirmation of the need to use judgment in certain circumstances.
|
|
•
|
FSP FAS 107-1 and APB 28-1, Interim Disclosures about Fair Value of Financial Instruments (ASC 825-10-65, Financial Instruments – Transition and Open Effective Date Information), requires companies to provide additional fair value information for certain financial instruments in interim financial statements, similar to what is currently required to be disclosed on an annual basis.
|
|
•
|
FSP FAS 115-2, FAS 124-2, and EITF 99-20-2, Recognition and Presentation of Other-Than-Temporary Impairments (ASC 320-10-65, Investments- Debt and Equity Securities – Transition and Open Effective Date Information), amends the existing guidance regarding impairments for investments in debt securities. Specifically, it changes how companies determine if impairment is considered to be other-than-temporary and the related accounting. This standard also provides for increased disclosures.
|
56
AuthenTec, Inc. and Subsidiaries
Notes to Consolidated Financial Statements
(Continued)
These FSPs apply to both interim and annual periods and were effective for us beginning April 4, 2009. The adoption of the FSPs did not have a material impact on our financial statements.
In May 2009, the FASB issued SFAS No. 165, Subsequent Events (ASC 855-10, Subsequent Events), with an objective to establish general standards of accounting for and disclosure of events that occur after the balance sheet date but before financial statements are issued or are available to be issued. This statement should not result in significant changes in the subsequent events that an entity reports—either through recognition or disclosure—in its financial statements. This Statement introduces the concept of financial statements being available to be issued. We adopted SFAS No. 165 in the second quarter of 2009. The adoption of FAS No. 165 did not have a material impact on our financial statements.
In June 2009, the FASB issued SFAS No. 168 “The FASB Accounting Standards Codification and the Hierarchy of Generally Accepted Accounting Principles—a replacement of SFAS No. 162” (ASC 105-10, Generally Accepted Accounting Principles). SFAS No. 168 establishes the FASB Accounting Standards Codification as the source of authoritative accounting principles recognized by the FASB to be applied by non-governmental entities in the preparation of financial statements in conformity with GAAP in the United States. SFAS 168 is effective for financial statements issued for interim and annual periods ending after September 15, 2009. We adopted SFAS No. 168 in the third quarter of 2009. The adoption of FAS No. 168 did not have a material impact on our financial statements.
In October 2009, the FASB issued EITF Issue 08-1 (ASU 2009-13), Multiple-Deliverable Revenue Arrangements, (amendments to FASB ASC Topic 605, Revenue Recognition) and EITF Issue 09-3 (ASU 2009-14), Certain Arrangements That Include Software Elements, (amendments to FASB ASC Topic 985, Software). EITF Issue 08-1 requires entities to allocate revenue in an arrangement using estimated selling prices of the delivered goods and services based on a selling price hierarchy. The amendments eliminate the residual method of revenue allocation and require revenue to be allocated using the relative selling price method. EITF Issue 09-3 removes tangible products from the scope of software revenue guidance and provides guidance on determining whether software deliverables in an arrangement that includes a tangible product are covered by the scope of the software revenue guidance. EITF Issues 08-1 and 09-3 should be applied on a prospective basis for revenue arrangements entered into or materially modified in fiscal years beginning on or after June 15, 2010 with early adoption permitted. We do not expect adoption of EITF Issue 08-1 and EITF Issue 09-3 to have a material impact on our consolidated results of operations or financial condition.
57
AuthenTec, Inc. and Subsidiaries
Notes to Consolidated Financial Statements
(Continued)
2. Inventory
|
As of
|
||||||||
|
January 1,
|
January 2,
|
|||||||
|
2010
|
2009
|
|||||||
|
(In thousands)
|
||||||||
|
Work-in-process
|
$ | 2,077 | $ | 4,343 | ||||
|
Finished goods
|
1,704 | 2,934 | ||||||
|
Valuation allowance
|
(1,536 | ) | (1,507 | ) | ||||
| $ | 2,245 | $ | 5,770 | |||||
3. Property and Equipment
|
As of
|
|||||||||||
|
Useful life
|
January 1,
|
January 2,
|
|||||||||
|
(years)
|
2010
|
2009
|
|||||||||
|
(In thousands)
|
|||||||||||
|
Production and lab equipment
|
3 - 8 | $ | 4,660 | $ | 4,203 | ||||||
|
Computer equipment
|
3 - 5 | 1,199 | 1,163 | ||||||||
|
Office furniture and fixtures
|
3 | 527 | 526 | ||||||||
|
Computer software
|
3 - 5 | 872 | 787 | ||||||||
|
Leasehold improvements
|
3 - 6 | 1,191 | 1,179 | ||||||||
| 8,449 | 7,858 | ||||||||||
|
Less: accumulated depreciation
|
(5,401 | ) | (4,142 | ) | |||||||
| $ | 3,048 | $ | 3,716 | ||||||||
4. Fair Value Measurements and Disclosures
Effective December 29, 2007, we adopted ASC Topic 820, Fair Value Measurements and Disclosures (formerly SFAS No. 157, Fair Value Measurement). ASC 718 defines fair value, provides a consistent framework for measuring fair value under accounting principles generally accepted in the United States and expands fair value financial statement disclosure requirements. ASC 718 does not require any new fair value measurements. It only applies to accounting pronouncements that already require or permit fair value measures, except for standards that relate to share-based payments (ASC Topic 718, Compensation – Stock Compensation).
Valuation techniques considered under ASC 820 techniques are based on observable and unobservable inputs. The Standard classifies these inputs into the following hierarchy:
Level 1 inputs are observable inputs and use quoted prices in active markets for identical assets or liabilities that the reporting entity has the ability to access at the measurement date and are deemed to be most reliable measure of fair value.
Level 2 inputs are observable inputs and reflect assumptions that market participants would use in pricing the asset or liability developed based on market data obtained from sources independent of the reporting entity. Level 2 inputs includes 1) quoted prices for similar assets or liabilities in active markets, 2) quoted prices for identical or similar assets or liabilities in markets that are not active, 3) observable inputs such as interest rates and yield curves observable at commonly quoted intervals, volatilities, prepayment speeds, credits risks, default rates, and 4) market-corroborated inputs.
Level 3 inputs are unobservable inputs and reflect the reporting entity’s own assumptions about the assumptions market participants would use in pricing the asset or liability based on the best information available under the circumstances.
Recurring Fair Value Measurements
At January 1, 2010 we had $52.1 million in cash equivalents, short-term and long-term investments that were subject to fair value measurements in accordance to ASC 718.
58
AuthenTec, Inc. and Subsidiaries
Notes to Consolidated Financial Statements
(Continued)
The fair values of our investments based on the level of inputs are summarized below:
|
Fair value measurements
|
||||||||||||||||||||||||||||||||||||||||
|
As of
|
||||||||||||||||||||||||||||||||||||||||
|
January 1, 2010
|
January 2, 2009
|
|||||||||||||||||||||||||||||||||||||||
| Fair | Fair | |||||||||||||||||||||||||||||||||||||||
|
Description
|
value total
|
Level 1
|
Level 2
|
Level 3
|
Gains (losses)
|
value
total
|
Level 1
|
Level 2
|
Level 3
|
Gains (losses)
|
||||||||||||||||||||||||||||||
|
(In thousands)
|
(In thousands)
|
|||||||||||||||||||||||||||||||||||||||
|
Money market and treasury funds
|
$ | 24,031 | $ | 24,031 | $ | — | $ | — | $ | — | $ | 37,875 | $ | 37,875 | $ | — | $ | — | $ | — | ||||||||||||||||||||
|
U.S. Government agency notes
|
24,893 | 24,893 | — | — | 20 | — | — | — | — | — | ||||||||||||||||||||||||||||||
|
Corporate bonds
|
— | — | — | — | — | 7,548 | — | 7,548 | — | 1 | ||||||||||||||||||||||||||||||
|
Medium and short term notes
|
— | — | — | — | — | 8,057 | — | 8,057 | — | (95 | ) | |||||||||||||||||||||||||||||
|
Euro bonds
|
— | — | — | — | — | 995 | — | 995 | — | (41 | ) | |||||||||||||||||||||||||||||
|
Certificates of deposit
|
— | — | — | — | — | 1,532 | — | 1,532 | — | 6 | ||||||||||||||||||||||||||||||
|
Auction rate securities
|
3,173 | — | — | 3,173 | (528 | ) | 5,334 | — | 4,200 | 1,134 | (266 | ) | ||||||||||||||||||||||||||||
|
Total
|
$ | 52,097 | $ | 48,924 | $ | — | $ | 3,173 | $ | (508 | ) | $ | 61,341 | $ | 37,875 | $ | 22,332 | $ | 1,134 | $ | (395 | ) | ||||||||||||||||||
In measuring fair value where Level 1 inputs were available, we used a single valuation technique which valued our securities based on quoted market prices. At January 1, 2010 our Money market funds and U.S. Government agency funds were measured using Level 1 inputs and the fair value was based on daily observable trades.
In measuring fair value where Level 2 inputs were available, we used valuations performed by an independent pricing vendor utilized by our investment broker for our bonds, notes and CDs. In measuring fair value of our municipal notes and preferred stock auction rate securities (ARS), we used valuations performed by the same pricing vendor as well as a the most recent history of successful auctions where similar securities were sold in an active market and a discounted cash flow model. The discounted cash flow model took into consideration the interest being earned on these securities versus interest earned on similar securities such as Corporate and Municipal bonds. Most of the assumptions used are observable in the market place and can be derived from or are supported by observable data at which transactions were (are) executed in the market place.
In measuring fair value where Level 3 inputs were available, we used a single valuation technique which valued our securities based on a multiple discounted cash flow scenarios with various liquidation time horizons. We believe that this pricing model reflects the assumptions a marketplace participant would use in valuing similar assets, which could change significantly over time based on market conditions. Factors that may impact our valuation include changes to credit ratings of the securities as well as to the underlying assets supporting those securities, rates of default of the underlying assets, underlying collateral value, discount rates, credit risk and ongoing strength and quality of market credit and liquidity.
At January 1, 2010 our investments in auction rate securities were measured using unobservable inputs with a fair value of $3.2 million which represented approximately six percent (6%) of total assets subject to fair value measurements on a recurring basis. The preferred stock auction rate security was transferred to Level 3 during the three months ended January 1, 2010, because the pricing vendor utilized by our investment broker no longer valued this investment and therefore some of the inputs to measure fair value are no longer observable. Our student loan backed auction rate security with a fair value of $1.0 million at January 1, 2010 remains in Level 3. The pricing vendor utilized by our investment broker valued this investment at 25% below par value at January 1, 2010. Due to lack of market activity, the pricing vendor used unobservable inputs to value this ARS. Although this investment did not resume active trading during the three months ended January 1, 2010, a partial amount of the security was called at par.
The table below provides a reconciliation of all assets measured at fair value on a recurring basis which use Level 3 or significant unobservable inputs for the twelve months ended January 1, 2010 and January 2, 2009:
59
AuthenTec, Inc. and Subsidiaries
Notes to Consolidated Financial Statements
(Continued)
|
Description
|
Total
|
Auction rate
securities
|
Corp and Euro
bonds
|
Short-term
notes
|
||||||||||||
|
(In Thousands)
|
||||||||||||||||
|
Beginning balance December 28, 2007
|
$ | — | $ | — | $ | — | $ | — | ||||||||
|
Realized/unrealized gains and losses
|
||||||||||||||||
|
Included in earnings
|
(266 | ) | (266 | ) | — | — | ||||||||||
|
Included in other comprehensive income (loss)
|
(194 | ) | — | (74 | ) | (120 | ) | |||||||||
|
Purchases, issuances, and settlements
|
— | — | — | — | ||||||||||||
|
|
||||||||||||||||
|
Transfers in/(out) of Level 3
|
1,594 | 1,400 | 74 | 120 | ||||||||||||
|
Ending balance January 2, 2009
|
$ | 1,134 | $ | 1,134 | $ | — | $ | — | ||||||||
|
Realized/unrealized gains and losses
|
||||||||||||||||
|
Included in earnings
|
(47 | ) | (47 | ) | — | — | ||||||||||
|
Included in other comprehensive income (loss)
|
(215 | ) | (215 | ) | — | — | ||||||||||
|
Purchases, issuances, and settlements
|
(100 | ) | (100 | ) | — | — | ||||||||||
|
|
||||||||||||||||
|
Transfers in/(out) of Level 3
|
2,401 | 2,401 | — | — | ||||||||||||
|
Ending balance January 1, 2010
|
$ | 3,173 | $ | 3,173 | $ | — | $ | — | ||||||||
As of January 1, 2010, we classified $3.2 million of investments in ARS as long-term due to the fact that they had experienced failed auctions. The remaining securities with a value of $24.9 million have a maturity date of twelve months or less and therefore are classified as short-term investments on our Consolidated Balance Sheet.
At January 1, 2010, the estimated fair value of our preferred stock ARS was $215,000 less than its cost. As we intend to hold this security until the sooner of a recovery in the ARS market or a call of the security by the issuer and it is more-likely-than-not that we will not be required to sell this ARS prior to recovery, we concluded that the decline in the fair value was temporary and not related to a credit loss. We recorded the unrealized loss in the accumulated other comprehensive loss on the accompanying Consolidated Balance Sheet at January 1, 2010.
At January 1, 2010, the estimated fair value of our student loan ARS was $313,000 less than its cost. We recorded an other-than-temporary impairment charge in the amount of $266,000 in our Consolidated Statement of Operations for the year ended January 2, 2009. We continue to believe that the impairment is other-than-temporary as this investment has been impaired for an extended period of time and we are uncertain of the likelihood of the issuer being able to make payments in the future or our ability to hold this security until maturity. As a result, we recorded additional other-than-temporary impairment in the amount of $47,000 in our Consolidated Statement of Operations for the year ended January 1, 2010.
We will continue to monitor these securities and may be required to record additional temporary or other-than-temporary impairment charge in the future.
Non-recurring Fair Value Measurements
We did not have any non-financial liabilities as of January 1, 2010. Our non-financial assets are reviewed for potential impairment and considered for the need to perform an impairment test pursuant to ASC 360-40, Property Plant and Equipment, Derecognition (formerly SFAS No. 144, Accounting for the Impairment or Disposal of Long Lived Assets). We did not have any non-recurring fair value measurements during the year ended January 1, 2010.
5. Contractual Commitments
Operating leases and license fees
We lease our office space, equipment and certain design software under non-cancelable operating lease agreements. Future minimum lease payments under non-cancelable operating leases are approximately $882,000, $878,000, $897,000, $928,000, and $960,000 for fiscal years 2010, 2011, 2012, 2013, and 2014 respectively. During the fiscal year ended December 28, 2007, we prepaid for licenses to be used over the next three years ending December 31, 2010. This cost was being amortized over the initial license term. During the fiscal year ended January 1, 2010, we extended the contract for the prepaid license fees until February 27, 2012 and contracted for additional licenses. Future minimum license fee payments under the agreement are approximately $311,000 and $415,000 for fiscal years 2010 and 2011, respectively.
Rental expense under the operating leases was approximately $749,000, $811,000 and $701,000 for the years ended January 1, 2010, January 2, 2009 and December 28, 2007, respectively. License expense for the design software was approximately $442,000, $449,000, and $358,000 for the years ended January, 1, 2010, January 2, 2009 and December 28, 2007, respectively.
60
AuthenTec, Inc. and Subsidiaries
Notes to Consolidated Financial Statements
(Continued)
Non-Cancelable Purchase Commitments
We enter into various inventory- related purchase commitments with the third-party contract manufacturers and suppliers. We had approximately $1,412,000 of non-cancelable purchase commitments with our contract manufacturers as of January 1, 2010. We expect to sell all products which we have committed to purchase.
License Agreements
We have entered into a software design license and maintenance agreement with a supplier. This agreement originally provided for quarterly payments of approximately $89,400, which were expensed as paid. During the fiscal year ended December 28, 2007, we prepaid for licenses to be used over the next three years ending December 31, 2010. During the fiscal year ended January 1, 2010, the agreement was again extended through February 28, 2012 with payments made quarterly. Expense under this agreement for the years ended January 1, 2010, January 2, 2009, and December 28, 2007 was approximately $434,000, $449,000, and $358,000 respectively.
During 2002, we entered into a license agreement under which we obtained a nonexclusive right to use certain software technology through the term of the licensor’s copyrights on such technology. In exchange, we are required to pay a fee no lower than $.25 per copy. Under this agreement, we recorded license fee expense of approximately $65,000 for the year ended December 28, 2007.
In 2005, we entered into a license agreement for the use and modification of certain software technology for a term of 5 years in exchange for a non-recurring development fee of $175,000 and royalty payments of $.05 – $.12 per product sold with this technology based on the volume of products sold. We expensed the non-recurring development fee of $175,000 in 2005 and we recognized additional royalty related expense of approximately $258,000 and $331,000 during fiscal years January 1, 2010, January 2, 2009, respectively.
In 2007, we entered into a license agreement for the use of certain silicon technology for a term of five years, and renewable annually thereafter, in exchange for a non-recurring development fee of $70,000 and royalty payments of 2.5% – 3% of the cost of wafers manufactured with this technology. We expensed the non-recurring development fee of $70,000 in 2007 and we recognized additional royalty related expense of approximately $57,000 and $113,000 during fiscal years January 1, 2010, January 2, 2009, respectively.
During 2007, we entered into a license agreement under which we obtained a nonexclusive right to use certain software technology through the term of the licensor’s copyrights on such technology. In exchange, we are required to pay a fee no lower than $.15 per copy. Under this agreement, we recorded license fee expense of approximately $74,000 and $232,000 for the years ended January 1, 2010 and January 2, 2009, respectively.
During 2009, we entered into a license agreement for the development and reproduction of certain silicon technology for a term of three years in exchange for a license fee of $110,500 and a royalty fee no lower than $.005 per chip. Under this agreement, we recorded license fee expense of approximately $77,000 in 2009. No royalty fees were recorded during the fiscal year ended January 1, 2010.
During 2009, we entered into a license agreement for certain hardware and software technology for a term of three years, in exchange for a license fee of $188,000 and a royalty fee no lower than $.01 per chip. Under this agreement, we recorded license fee expense of $188,000 in 2009. No royalty fees were recorded during the fiscal year ended January 1, 2010.
Legal Proceedings
AuthenTec sent UPEK, Inc. (“UPEK”) a letter on January 23, 2009 providing notice to UPEK that its products infringed the claims of five AuthenTec U.S. patents and expressing its concerns about UPEK’s trade secret misappropriation. AuthenTec’s January 23, 2009 letter invited UPEK to negotiate the claims outside the court system. In response, on January 29, 2010, UPEK filed a complaint against AuthenTec in the U.S. District Court for the Northern District of California alleging that our products infringe a single U.S. patent and seeking a declaratory judgment of non-infringement and invalidity with respect to the five previously identified AuthenTec patents. AuthenTec filed its answer to UPEK’s complaint on February 2, 2010, denied that it infringes UPEK’s patent, asserted that UPEK does infringe the five AuthenTec patents and also asserted that UPEK misappropriated AuthenTec trade secrets. The five AuthenTec patents in this lawsuit relate to packaging of fingerprint sensors and various features related to fingerprint sensors. Both parties have requested injunctive relief, as well as damages, prejudgment interest, and attorneys’ fees and expenses.
61
AuthenTec, Inc. and Subsidiaries
Notes to Consolidated Financial Statements
(Continued)
On February 17, 2010, AuthenTec filed a Motion for Partial Summary Judgment of Infringement and requested that the U.S. District Court find that UPEK products infringe Claim 13 of AuthenTec’s U.S. Patent No.: 5,940,526. Claim 13 of the ‘526 patent relates to a power conservation feature of fingerprint sensors and specifies a means for conserving power by switching from a low power mode (“touch to wake”) to an increased power mode (“wake up mode”) when a user touches a portion of the sensor. On February 23, 2010, AuthenTec filed a Motion for Summary Judgment of Non-Infringement and Invalidity of UPEK’s U.S. Patent No.: 6,028,773 and requested that the Court summarily resolve UPEK’s patent infringement claim against AuthenTec. AuthenTec requested that the Court find the ‘773 patent invalid as anticipated and obvious based, in part, on AuthenTec’s public display and publication of its fingerprint sensors more than a year before the UPEK ‘773 patent was filed. The motion also requests that the Court find that the accused AuthenTec products do not infringe any claims of the ‘773 patent. UPEK has claimed that its’ asserted ‘773 patent is “foundational” to the packaging of silicon-based fingerprint sensors. Should UPEK obtain an adverse judgment for treble damages or obtain an injunction, such judgment may have a material adverse impact on our financial condition. There is a Court hearing date of April 16, 2010 for the two pending summary judgment motions. On February 23, 2010 UPEK filed an amended complaint alleging that AuthenTec’s U.S. Patent No.: 6,049,620 being asserted against UPEK is unenforceable. AuthenTec looks forward to an opportunity for the matters related to the purchase and revival of the ‘620 patent, purchased by AuthenTec from biometric industry pioneer Veridicom, to be fully briefed for the Court’s consideration. A scheduling conference has not yet taken place and the discovery phase has not yet begun.
In addition to the federal patent infringement lawsuit filed by UPEK in California, on January 29, 2010, UPEK filed a state court action in the Court of Chancery of the State of Delaware against AuthenTec. The Delaware action relates to UPEK's notice regarding its intent to nominate candidates for election to AuthenTec's board of directors and to propose business at the upcoming 2010 annual meeting of AuthenTec stockholders. UPEK is asking the Court to declare that its “business proposal” and its nomination of directors are in proper form and in accord with Delaware law as filed and declare that stockholders have a right to call a special meeting. Following an expedited hearing on February 3, 2010, AuthenTec answered UPEK’s complaint on February 12, 2010, and asserted counterclaims for UPEK’s breaches of a non-disclosure agreement between us and lack of compliance with the AuthenTec bylaws advance notice requirements. AuthenTec requested limited discovery which the Court of Chancery granted, and this discovery is ongoing.
The two legal disputes with UPEK come amid UPEK's unsolicited January 29, 2010 proposal to combine the two businesses, a plan that AuthenTec's board of directors rejected after deciding that it was a highly dilutive and speculative transaction that is not in the best interests of AuthenTec stockholders.
In addition to these legal actions, from time to time, we may be involved in various legal proceedings arising from the normal course of business activities. In our opinion, resolution of these matters is not expected to have a material adverse impact on our consolidated results of operations, cash flows or our financial position. However, depending on the amount and timing, an unfavorable resolution of a matter could materially affect our future results of operations, cash flows or financial position in a particular period.
62
AuthenTec, Inc. and Subsidiaries
Notes to Consolidated Financial Statements
(Continued)
6. Income Taxes
The components of the provision (benefit) for income taxes are as follows:
|
Fiscal year ended
|
||||||||||||
|
January 1,
|
January 2,
|
December 28,
|
||||||||||
|
2010
|
2009
|
2007
|
||||||||||
|
(In thousands)
|
||||||||||||
|
Current tax provision (benefit)
|
||||||||||||
|
Federal
|
$ | (3,601 | ) | $ | — | $ | (281 | ) | ||||
|
State
|
(219 | ) | — | (16 | ) | |||||||
|
Foreign
|
(42 | ) | (22 | ) | (55 | ) | ||||||
| (3,862 | ) | (22 | ) | (352 | ) | |||||||
|
Current tax provision (benefit)
|
||||||||||||
|
Federal
|
$ | (1,523 | ) | $ | 430 | $ | 220 | |||||
|
State
|
(93 | ) | 24 | 12 | ||||||||
|
Foreign
|
(51 | ) | (68 | ) | — | |||||||
| (1,667 | ) | 386 | 232 | |||||||||
| (5,529 | ) | 364 | (120 | ) | ||||||||
|
Valuation Allowance
|
5,529 | (364 | ) | 120 | ||||||||
|
Total tax provision (benefit)
|
$ | — | $ | — | $ | — | ||||||
The reconciliation of income taxes at the U.S. federal statutory rate to the provision (benefit) for income taxes is as follows:
|
Fiscal year ended
|
||||||||||||
|
January 1,
|
January 2,
|
December 28,
|
||||||||||
|
2010
|
2009
|
2007
|
||||||||||
|
(In thousands)
|
||||||||||||
|
Income taxes at federal statutory rate
|
$ | (5,918 | ) | $ | 5 | $ | (3,704 | ) | ||||
|
State income taxes, net of federal benefit
|
(233 | ) | — | (132 | ) | |||||||
|
Non-deductible permanent items
|
538 | 281 | 3,709 | |||||||||
|
Foreign rate differential
|
84 | 78 | 7 | |||||||||
|
Federal valuation allowances, net of reversals
|
5,436 | (454 | ) | 65 | ||||||||
|
Foreign valuation allowances, net of reversals
|
93 | 90 | 55 | |||||||||
|
Total
|
$ | — | $ | — | $ | — | ||||||
The components of the net deferred tax asset and the tax effects of the primary differences giving rise to our deferred tax asset are as follows:
|
Fiscal year ended
|
||||||||
|
January 1,
|
January 2,
|
|||||||
|
2010
|
2009
|
|||||||
|
(In thousands)
|
||||||||
|
Deferred tax assets:
|
||||||||
|
Intangible assets and property and equipment
|
$ | 1,438 | $ | 128 | ||||
|
Inventory reserve
|
543 | 531 | ||||||
|
Unrealized loss on investment
|
111 | 94 | ||||||
|
Other accrued liabilities
|
1,645 | 1,383 | ||||||
|
Chinese capitalized expenses
|
175 | 124 | ||||||
|
Other
|
24 | 58 | ||||||
|
Foreign NOL
|
224 | 188 | ||||||
|
Federal and state NOLs
|
21,083 | 17,220 | ||||||
|
Total
|
25,243 | 19,726 | ||||||
|
Valuation allowance
|
(25,243 | ) | (19,726 | ) | ||||
|
Net deferred tax assets
|
$ | — | $ | — | ||||
At January 1, 2010, we have federal net operating loss carry forwards of approximately $59,659,000 available to reduce future taxable income, which will begin to expire in the year 2018.
At January 1, 2010, we have foreign net operating loss carry forwards of approximately $713,000 available to reduce future taxable income, which will begin to expire in the year 2012.
63
AuthenTec, Inc. and Subsidiaries
Notes to Consolidated Financial Statements
(Continued)
The entire balance of the deferred tax assets has been offset by a valuation allowance or uncertain tax provision since realization of any future benefit from deductible temporary differences and utilization of net operating loss carry forwards cannot be sufficiently assured at January 1, 2010.
Under the provisions of the Internal Revenue Code, certain substantial changes in our ownership may result in limitation on the amount of net operating loss carry forwards which can be used in future years.
Adoption of Accounting for Uncertainty in Income Taxes
In June 2006, the FASB issued Interpretation No. 48, Accounting for Uncertainty in Income Taxes (FIN 48), which clarifies the accounting for uncertainty in income taxes recognized in a company’s financial statements in accordance with ASC 740, Income Taxes (formerly SFAS No. 109, Accounting for Income Taxes. This interpretation prescribes a recognition threshold and measurement attribute for the financial statement recognition and measurement of a tax position taken or expected to be taken in a tax return. Accounting for Uncertainty in Income Taxes also provides guidance on derecognition of tax benefits, classification on the balance sheet, interest and penalties, accounting in interim periods, disclosure, and transition. We adopted Accounting for Uncertainty in Income Taxes effective December 30, 2006.
In conjunction with the adoption of Accounting for Uncertainty in Income Taxes, we analyzed filing positions in all of the federal, state and foreign jurisdictions where we are required to file income tax returns, as well as all open tax years in these jurisdictions. We have identified our federal tax return and state tax return in Florida as “major” tax jurisdictions, as defined. The periods subject to examination for our federal and Florida returns are the 2006 through 2009 tax years. We are not currently under audit by the Internal Revenue Service or the Florida Department of Revenue. As a result of the implementation of Accounting for Uncertainty in Income Taxes, we recognized approximately $1,424,000 decrease in assets for unrecognized tax benefits associated with state net operating losses. The application of Accounting for Uncertainty in Income Taxes would have resulted in a decrease in retained earnings of approximately $1,424,000, except that the decrease was fully offset by the application of a valuation allowance. There have been no significant changes to these amounts during the year ended January 1, 2010. A reconciliation of the beginning and ending amount of unrecognized tax benefits is as follows:
|
|
(in thousands)
|
|||
|
Balance at December 30, 2006
|
$ | 1,424 | ||
|
Increase/(decrease) based on tax positions related to the current year
|
— | |||
|
Increase/(decrease) for tax positions of prior years
|
— | |||
|
Decrease related to settlements
|
— | |||
|
Decrease related to the lapse of the statute of limitations
|
— | |||
|
Balance at December 28, 2007
|
1,424 | |||
|
Increase/(decrease) based on tax positions related to the current year
|
— | |||
|
Increase/(decrease) for tax positions of prior years
|
— | |||
|
Decrease related to settlements
|
— | |||
|
Decrease related to the lapse of the statute of limitations
|
— | |||
|
Balance at January 2, 2009
|
1,424 | |||
|
Increase/(decrease) based on tax positions related to the current year
|
— | |||
|
Increase/(decrease) for tax positions of prior years
|
— | |||
|
Decrease related to settlements
|
— | |||
|
Decrease related to the lapse of the statute of limitations
|
— | |||
|
Balance at January 1, 2010
|
$ | 1,424 | ||
We recognize interest and penalties related to uncertain tax positions in income tax expense which were none as of and for the years ended January 1, 2010 and January 1, 2009.
7. Redeemable Preferred Stock
Prior to our public offering in July 2007, our amended certificate of incorporation authorized 100,000,000 shares of common stock and 80,444,003 shares of redeemable convertible preferred stock. Redeemable convertible preferred stock at December 29, 2006, consisted of the following:
64
AuthenTec, Inc. and Subsidiaries
Notes to Consolidated Financial Statements
(Continued)
|
Shares
|
Liquidation
Preference
|
Proceeds Net
of Issuance
Costs
|
|||||||||||||||
|
Series
|
Authorized
|
Issued and
Outstanding
|
|||||||||||||||
|
(In thousands)
|
|||||||||||||||||
| A | 13,510,000 | 13,500,000 | $ | — | $ | 13,461 | |||||||||||
| B | 9,324,702 | 9,005,812 | 20,263 | 20,227 | |||||||||||||
| C | 38,109,301 | 29,928,769 | 30,000 | 13,986 | |||||||||||||
| D | 15,000,000 | 15,000,000 | 15,000 | 14,935 | |||||||||||||
|
Junior preferred
|
4,500,000 | 4,500,000 | — | 450 | |||||||||||||
| 80,444,003 | 71,934,581 | $ | 65,263 | $ | 63,059 | ||||||||||||
Preferred Stock Series A (“Series A”)
Through 1999, we issued 13,500,000 shares of Series A for gross proceeds of $13,000,000 and the extinguishment of a $500,000 note payable.
The Series A holders had the following rights and privileges: (1) when and as declared dividends, noncumulative, of $.08 per share; (2) each four shares of Series A was convertible into one share of common stock, subject to certain anti-dilution provisions; and (3) the Series A was automatically converted into shares of common stock upon a qualified public offering of our common stock with an offering price per share of at least $6.48, with aggregate proceeds of at least $30 million.
Preferred Stock Series B (“Series B”)
On March 14, 2001, we issued 9,005,812 shares of Series B for cash proceeds of approximately $15,100,000 plus the conversion of convertible promissory notes of $4,390,806 including accrued interest of $131,506 and the conversion of the convertible stock for a value of $763,568 including accrued dividends.
The Series B holders had the following rights and privileges: (1) when and as declared dividends, noncumulative, of $.18 per share; (2) each four shares of Series B was convertible into one share of common stock, subject to certain anti-dilution provisions; and (3) the Series B was automatically converted into shares of common stock upon a qualified public offering of our common stock with an offering price per share of at least $6.48, with aggregate proceeds of at least $30 million.
Preferred Stock Series C (“Series C”)
During 2003, we issued 27,933,518 shares of Series C convertible preferred stock (“Series C”) for cash proceeds of approximately $14,000,000 plus the conversion of certain convertible promissory notes of $1,000,000 into 1,995,251 shares of Series C Preferred Stock for an aggregate of 29,928,769 shares of Series C.
The Series C holders had the following rights and privileges: (1) dividends at the rate of $.04 per share, non-cumulative, when and as declared; (2) each four shares of Series C was convertible into one share of common stock subject to certain anti-dilution provisions; (3) the Series C was automatically converted into shares of common stock upon a qualified public offering of our common stock with an offering price per share of at least $6.48, with aggregate proceeds of at least $30 million; and (4) the Series C had a liquidation preference of $1.0234 per share and including any dividends payable thereon up to a maximum aggregate amount of $30 million.
Preferred Stock Series D (“Series D”)
During 2004, we issued 15,000,000 shares of Series D convertible preferred stock (“Series D”) for cash proceeds of approximately $15,000,000.
The Series D holders had the following rights and privileges: (1) dividends at the rate of $.08 per share, non-cumulative, when and as declared; (2) each four shares of Series D was convertible into one share of common stock, subject to certain anti-dilution provisions; (3) the Series D was automatically converted into shares of common stock upon a qualified public offering of our common stock with an offering price per share of at least $6.48, with aggregate proceeds of at least $30 million; and (4) the Series D had a liquidation preference of $1.00 per share and including any dividends payable thereon up to a maximum aggregate of $15 million.
Junior Convertible Preferred Stock (“Junior Preferred”)
Through October 1998, we issued 4,500,000 shares of Junior Preferred for the purchase of technology and fixtures valued at $450,000. Each four shares of Junior Preferred was convertible into one share of common stock and automatically converted into shares of common stock and upon qualified public offering price per share of at least $6.48 with aggregate proceeds at least $30 million.
65
AuthenTec, Inc. and Subsidiaries
Notes to Consolidated Financial Statements
(Continued)
Upon our liquidation, and after the Series C and Series D have received their liquidation preference, all funds were to be distributed on a pari passu basis to Common, Series C, Series D and a Series A/B/Junior Preferred Pool. The funds in the Series A/B/Junior Preferred Pool were to be distributed first to the Series A and Series B on a pari passu basis with each other, before any amounts were distributed to the Junior Preferred and until such time as the Series A and Series B had received $1.00 per share and $2.25 per share, respectively. The funds then were to be distributed to the Junior Preferred until such time as the Junior Preferred had received $1.00 per share. Thereafter, all proceeds in the Series A/B/Junior Preferred Pool were to be distributed on a pari passu basis to the Series A, Series B and Junior Preferred.
The Series A, B, C and D Preferred Stock was considered mandatorily redeemable since the following were all deemed to be a liquidation, dissolution, or winding up of our company: (1) any transaction or series of related transactions to which we are a party (including without limitation any reorganization, merger or consolidation) that results in the transfer of 50% or more of our outstanding voting power; (2) a sale, lease or other disposition of all or substantially all of our assets; or (3) the transfer of more than 50% of our voting power.
In April 2007, we issued additional 3,249,062 shares of Preferred Stock Series C upon exercise of preferred stock warrants held by investors. Total cash paid to us upon exercise of the warrants was $320,000.
Upon the closing of our initial public offering in July 2007, the total of 75,183,643 shares of outstanding preferred stock were converted into 18,795,911 shares of our common stock, taking into effect a one for four reverse stock split that was completed on June 26, 2007.
As of January 1, 2010, no shares of preferred stock were designated or outstanding. Our Board of Directors is authorized, without action by the stockholders, to designate and issue up to 10,000,000 shares of preferred stock in one or more series.
8. Warrants
During the year ended January 1, 2010, no warrants were exercised.
As of January 1, 2010, approximately 25,000 warrants to purchase shares of our common stock were outstanding and exercisable. These warrants were issued on September 25, 2000 and January 5, 2001 with an exercise price of $9.00 and will expire on September 25, 2010.
Under ASC Topic 480, Distinguishing Liabilities from Equity (formerly FSP150-5), we were required to classify warrants to purchase shares of our mandatorily redeemable convertible preferred stock as liabilities and revalue them to fair value at the end of each reporting period. We recognized warrant expense for approximately $9,637,000 and $2,195,000 for years ended December 28, 2007 and December 29, 2006.
On July 2, 2007, the fair value ascribed to the warrants to purchase mandatorily redeemable convertible preferred stock, using the closing price of our common stock on the NASDAQ Global Market as of the closing of our initial public offering, was approximately $9,199,000. On that date, the carrying value of such warrants was reclassified to additional paid in capital as the underlying preferred stock securities were converted into common stock on that date and the warrants to purchase shares of redeemable convertible preferred stock were converted to warrants to purchase an equivalent number of shares of common stock. Warrants to purchase approximately 2,049,000 shares were exercised and approximately 1,789,000 shares were issued after the net exercise during the fiscal year ended December 28, 2007. Exercise of approximately 1,595,000 shares and issuance of approximately 1,335,000 shares from the aforementioned warrants was a cashless transaction.
9. Stock-Based Compensation
In 1998, we adopted a stock option plan, which we later amended and restated into our 2004 Stock Incentive Plan, which authorized our Board of Directors to grant incentive stock options (“ISOs”) and non-qualified stock options (“NQSOs”), stock appreciation rights, stock and phantom stock awards, performance awards and other stock-based awards to employees, directors, officers, and consultants. As of January 1, 2010, the total number of shares authorized under our 2004 Stock Incentive Plan by the Board of Directors was approximately 4,720,000 and the total number of shares available to grant was approximately 57,000.
In June 2007, our “2007 Stock Incentive Plan” was approved by our Board of Directors and stockholders. This plan allows for the grant of incentive stock options (“ISOs”) and non-qualified stock options (“NQSOs”), stock appreciation rights, stock and phantom stock awards, performance awards and other stock-based awards to employees, officers, directors, and other individuals providing bona fide services to us or any of our affiliates. As of January 1, 2010, the total number of shares authorized under our 2007 Stock Incentive Plan by the Board of Directors was approximately 3,524,000 and the total number of shares available to grant was approximately 1,102,000.
NQSOs may be granted to employees, officers, directors and consultants. ISOs may be granted only to employees. Under our 2004 Stock Incentive Plan and our 2007 Stock Incentive Plan (“the Plans”), ISOs are granted at a price that is not less than 100% of the fair market value, as is determined at the market close on the date of grant. If ISOs and NQSOs are granted to an employee who owns more than 10% of the total combined voting power of all classes of stock, the exercise price per share will be not less than 110% of the fair market value on the date of grant.
66
AuthenTec, Inc. and Subsidiaries
Notes to Consolidated Financial Statements
(Continued)
Options under the Plans may be granted for periods of up to ten years. Any option granted shall be exercisable at such times and under such conditions as determined by our Board and as permissible under the terms of the Plan. Options generally vest at the rate of 25% on the one year anniversary of the vesting commencement date and ratably over the next 36 months.
A summary of the stock option activity is presented below:
|
Number of
Shares
(in thousands)
|
Weighted
Average
Exercise Price
|
|||||||
|
Outstanding as of January 2, 2009
|
3,618 | $ | 4.81 | |||||
|
Granted
|
1,390 | 1.79 | ||||||
|
Forfeited
|
(119 | ) | 4.45 | |||||
|
Exercised
|
(64 | ) | 0.78 | |||||
|
Outstanding as of January 1, 2010
|
4,825 | $ | 4.00 | |||||
The total intrinsic value of options exercised during the years ended January 1, 2010, January 2, 2009 and December 28, 2007 was approximately $173,000, $8,188,000 and $3,212,000, respectively.
During the fiscal year ended January 1, 2010 we granted restricted stock units. Restricted stock units granted under the 2007 Stock Incentive Plan are either incentive or performance based awards that will result in a payment to a participant in shares of our common stock. The incentive based awards vest as the service conditions are met while the performance based awards also have performance conditions as well as usual service conditions. The plan administrator will determine the number of shares and the conditions that must be satisfied, which typically are based on achievement of performance milestones and service conditions.
Restricted stock awards are measured at fair value based on the market price which is determined upon the closing price of our common stock on the NASDAQ Global Market on the date of the grant.
A summary of the restricted stock activity for the year ended January 1, 2010 is presented below:
|
Weighted
|
||||||||
|
Number of
|
average
|
|||||||
|
shares
|
grant-date
|
|||||||
|
(in thousands)
|
fair value
|
|||||||
|
Outstanding as of January 2, 2009
|
160 | $ | 13.71 | |||||
|
Granted
|
430 | 1.55 | ||||||
|
Forfeited
|
(283 | ) | 4.93 | |||||
|
Issued
|
(39 | ) | 8.65 | |||||
|
Outstanding as of January 1, 2010
|
268 | $ | 4.22 | |||||
We estimate expected forfeitures based on our historical experience and recognize compensation cost over a four-year vesting period on a straight-line basis. Any performance based awards are recognized in earnings over the requisite service period for each separately vesting portion of the award. We recognize expense over the attribution period beginning when it is determined that meeting the performance condition is probable.
The total unrecognized stock-based compensation for options and restricted stock awards granted accounted for under ASC 780 (formerly SFAS No. 123(R)) was approximately $6,143,000 as of January 1, 2010. These options had a remaining weighted-average period over which they are expected to be recognized of 2.2 years as of January 1, 2010.
The weighted average estimated values of stock option grants, as well as the weighted average assumptions used in calculating these values were based on estimates at the date of grant as follows:
67
AuthenTec, Inc. and Subsidiaries
Notes to Consolidated Financial Statements
(Continued)
|
Fiscal Year Ended
|
||||||||||||
|
January 1,
2010
|
January 2,
2009
|
December 28,
2007
|
||||||||||
|
Grant date fair value
|
$ | 1.02 | $ | 5.73 | $ | 5.07 | ||||||
|
Expected life (in years)
|
4.3 | 4.9 | 5.9 | |||||||||
|
Risk free rate
|
2 | % | 3 | % | 5 | % | ||||||
|
Volatility
|
74 | % | 55 | % | 93 | % | ||||||
|
Dividend yield
|
0 | % | 0 | % | 0 | % | ||||||
|
Estimated forfeiture rate
|
12 | % | 10 | % | 9 | % | ||||||
Prior to our initial public offering, given the absence of an active market for our common stock, our board of directors was required to estimate the fair value of our common stock for purposes of determining stock-based compensation expense. Our board considered objective and subjective factors in determining the estimated value of our common stock on each option grant date, including the timing of the grant in relation to previous valuation dates, the rights, preferences and privileges of our convertible preferred stock relative to those of our common stock, our stage of development and revenue growth, the hiring of key personnel, the likelihood of achieving a liquidity event, such as our initial public offering or sale, for the shares of common stock underlying the options given prevailing market conditions, and valuations conducted by independent valuation consultants (PCE Valuation, LLC). The independent valuation firm used a discounted cash flow approach to estimate the aggregate enterprise value of our company at each valuation date during 2006. The discounted cash flow approach involves applying appropriate risk adjusted discount rates to estimated debt-free cash flow, based on forecasted revenues and costs. The projections used in connection with these valuations were based on contemporaneously prepared forecasts of our operating performance through the year 2019.
The independent valuation firm allocated the aggregate implied enterprise value that it estimated to the shares of preferred stock, common stock, warrants for preferred stock and options for common stock, using the option-pricing method at each valuation date. The option-pricing method involves making assumptions regarding the anticipated timing of a potential liquidity event, such as an initial public offering, estimates of the volatility of our equity securities and the risk free rate of interest.
During 2006, we granted options to purchase our common stock at dates that generally fell between the dates of the valuations performed by the independent valuation firm. In those instances, our board granted awards with an exercise price equal to the per-share fair value determined by the most recent valuation. In conjunction with preparing our financial statements, we estimated the fair value of our common stock underlying stock options on the dates of grant under ASC 780 (formerly SFAS No. 123(R)). We retrospectively considered changes in business conditions between the dates of the independent party valuations received immediately prior to and subsequent to the grant date and utilized this information to interpolate an estimated per share value of our common stock between those dates.
From January 1, 2006 to January 8, 2007, the fair value of our common stock was determined using enterprise values based on a discounted cash flow approach. The enterprise valuation was allocated between our various securities using the option-pricing method. For options granted on February 21, 2007, the fair value of our common stock was determined using a weighted average of discounted cash flow, comparable transactions, and market comparables. For the period of January 1, 2006 through March 30, 2007, we used the simplified calculation of expected life described in the Securities and Exchange Commission Staff Accounting Bulletin 107 and we estimated our stock’s volatility based on an average of historical volatilities of the common stock of several entities with characteristics similar to us. For options granted after March 30, 2007, and prior to our initial public offering, the fair value of our common stock was determined utilizing anticipated pricing of our initial public offering.
After our initial public offering, stock options are granted with an exercise price equal to the closing price of our common stock on the NASDAQ Global Market on the date of the grant. Given our current public company status, for stock options granted after June 29, 2007, we refined our pool of peer companies that reflect characteristics similar to us taking into account industry trends, market capitalization, annual revenue, option life and option vesting terms. The risk-free rate is based on U.S. Treasury securities. We estimated expected forfeitures based on our historical experience.
68
AuthenTec, Inc. and Subsidiaries
Notes to Consolidated Financial Statements
(Continued)
The following table contains information about outstanding stock options at January 1, 2010 (in thousands, except years and per share data):
|
Exercisable Options:
|
||||
|
Number of options
|
2,665 | |||
|
Average exercise price
|
$ | 3.48 | ||
|
Aggregate intrinsic value
|
$ | 2,602 | ||
|
Weighted average remaining contractual life
|
6.5 years
|
|||
|
Outstanding Options:
|
||||
|
Number of options
|
4,825 | |||
|
Average exercise price
|
$ | 4.00 | ||
|
Aggregate intrinsic value
|
$ | 3,312 | ||
|
Weighted average remaining contractual life
|
8.0 years
|
|||
10. Employee Benefit Plans
We maintain a 401(k) plan for our employees. The plan has provisions to allow for company matching. We have chosen not to exercise such provisions. To be eligible to participate, employees must be 21 years of age, and are expected to work a minimum of 1,000 hours during the year.
We have bonus plans, based on revenue and operating income goals, which provide incentive compensation for certain officers and employees. Amounts charged to expense for such incentive compensation totaled approximately none, $541,000 and $1,314,000 in fiscal years ended January 1, 2010, January 2, 2009 and December 28, 2007, respectively.
11. Segment Information
We have determined that we operate in one reportable segment based on review of ASC 280, Segment Reporting (formerly SFAS No. 131, Disclosures about Segments of an Enterprise and Related Information). Characteristics of our operations in the designing, marketing and selling of security, identity management and touch control technologies for PC, wireless device and IT markets, which are relied on in making and reviewing business decisions include the similarities in our products, the commonality of our customers across brands, our unified marketing strategy, and the nature of the financial information used by our Executive Officers. Our chief operating decision maker is the Chief Executive Officer.
The following table is based on the geographic location of the original equipment manufacturers, original design manufacturer, contract manufacturer or the distributors who purchased our products. For sales to our distributors, their geographic location may be different from the geographic locations of the ultimate end customers. Sales by geography for the periods indicated were:
|
Fiscal year ended
|
||||||||||||||||||||||||
|
January 1,
|
January 2,
|
December 28,
|
||||||||||||||||||||||
|
2010
|
2009
|
2007
|
||||||||||||||||||||||
|
Revenue $
|
% of total
|
Revenue $
|
% of total
|
Revenue $
|
% of total
|
|||||||||||||||||||
|
(In thousands)
|
||||||||||||||||||||||||
|
Asia/Pacific
|
$ | 23,832 | 70 | % | $ | 48,709 | 76 | % | $ | 36,379 | 69 | % | ||||||||||||
|
Japan
|
7,562 | 22 | 12,459 | 19 | 12,548 | 24 | ||||||||||||||||||
|
United States
|
1,799 | 5 | 1,649 | 3 | 2,181 | 4 | ||||||||||||||||||
|
Canada
|
830 | 3 | 1,021 | 2 | 917 | 2 | ||||||||||||||||||
|
Europe
|
43 | --- | 110 | --- | 319 | 1 | ||||||||||||||||||
| $ | 34,066 | 100 | % | $ | 63,948 | 100 | % | $ | 52,344 | 100 | % | |||||||||||||
|
% Int'l
|
95 | % | 97 | % | 96 | % | ||||||||||||||||||
Although a significant portion of the revenue is from customers located outside of the United States, all revenue is denominated in U.S. dollars.
The following table is based on the geographic location of our long-lived assets:
|
As of
|
||||||||
|
January 1,
|
January 2,
|
|||||||
|
2010
|
2009
|
|||||||
|
(In thousands)
|
||||||||
|
Asia/Pacific
|
1,508 | 1,639 | ||||||
|
Japan
|
23 | 50 | ||||||
|
United States
|
1,517 | 2,027 | ||||||
|
Total
|
3,048 | 3,716 | ||||||
69
AuthenTec, Inc. and Subsidiaries
Notes to Consolidated Financial Statements
(Continued)
12. Senior Secured Convertible Notes
On February 28, 2007, we issued $7.5 million of senior secured convertible notes (the “Notes”), due December 31, 2010, secured by substantially all of our assets. The Notes were purchased by several of our existing preferred stockholders. Upon the closing of our initial public offering, the Notes and the associated accrued interest were converted into approximately 1,260,000 shares of common stock at a rate of $6.00 per share. The principal, accrued interest and issuance costs were reclassified from liability to equity.
13. Asset Acquisitions
On July 8, 2009, we completed the acquisition of certain assets of a biometric fingerprint sensor company, Atrua, LLC (“Atrua”), for approximately $4.9 million in cash. The purpose of this asset purchase was to further extend our industry leading position in the biometrics market and add to our expansive intellectual property portfolio. Through this transaction, we acquired certain assets from Atrua including its “Fingerprint Touch Control” and “Micro Pressure Control” products, and fixed assets as well as technologies and intellectual property, associated with Atrua’s fingerprint sensor hardware and software. The acquired intellectual property includes all of Atrua’s 30 issued and pending U.S. patents, focused primarily on biometric fingerprint sensor and intelligent touch controls for mobile devices. The parties agreed to drop all legal claims and counterclaims against the other as a part of this purchase agreement.
In addition to the purchase price, we incurred $0.3 million in acquisition related costs, which were expensed as incurred. During the year ended January 1, 2010, $3.9 million of the purchase price was charged to the general and administrative caption on our statement of operations as related to the litigation dismissal.
The following summarizes the estimated allocation of the purchase price to the fair value of the assets acquired and expenses recorded in connection with the Atrua acquisition:
|
Assets acquired (in thousands):
|
||||
|
Inventory
|
$ | 114 | ||
|
Property, plant and equipment, net
|
47 | |||
|
Patents and other intangible assets
|
790 | |||
|
Total assets acquired
|
$ | 951 | ||
|
Expenses recorded (in thousands):
|
||||
|
Lawsuit dismissal
|
$ | 3,938 | ||
|
Total purchase price
|
$ | 4,889 | ||
70
AuthenTec, Inc. and Subsidiaries
Notes to Consolidated Financial Statements
(Continued)
14. Unaudited Quarterly Financial Data
Selected unaudited, quarterly financial data for the years ended January 1, 2010 and January 2, 2009 are presented below:
|
For the three months ended
|
|||||||||||||||||||||||||
|
January 1,
|
October 2,
|
July 3,
|
April 3,
|
January 2,
|
October 3,
|
June 27,
|
March 28,
|
||||||||||||||||||
|
2010
|
2009
|
2009
|
2009
|
2009
|
2008
|
2008
|
2008
|
||||||||||||||||||
|
Unaudited
|
|||||||||||||||||||||||||
|
(In thousands, except per share data)
|
|||||||||||||||||||||||||
|
Revenue
|
$ | 8,315 | $ | 10,267 | $ | 8,446 | $ | 7,038 | $ | 11,615 | $ | 18,409 | $ | 18,410 | $ | 15,514 | |||||||||
|
Cost of revenue
|
4,533 | 5,616 | 4,557 | 3,663 | 6,325 | 9,735 | 9,509 | 7,828 | |||||||||||||||||
|
Gross profit
|
3,782 | 4,651 | 3,889 | 3,375 | 5,290 | 8,674 | 8,901 | 7,686 | |||||||||||||||||
|
Expenses
|
|||||||||||||||||||||||||
|
Research and development
|
3,400 | 3,644 | 3,642 | 3,805 | 3,546 | 4,619 | 4,196 | 4,098 | |||||||||||||||||
|
Selling and marketing
|
1,815 | 2,028 | 1,786 | 2,020 | 1,692 | 2,710 | 2,592 | 2,472 | |||||||||||||||||
|
General and administrative
|
1,570 | 3,186 | 4,303 | 2,219 | 1,526 | 1,353 | 2,033 | 1,668 | |||||||||||||||||
|
Total expenses
|
6,785 | 8,858 | 9,731 | 8,044 | 6,764 | 8,682 | 8,821 | 8,238 | |||||||||||||||||
|
Income (loss) from operations
|
(3,003 | ) | (4,207 | ) | (5,842 | ) | (4,669 | ) | (1,474 | ) | (8 | ) | 80 | (552 | ) | ||||||||||
|
Other income (expense)
|
|||||||||||||||||||||||||
|
Impairment on investments
|
(19 | ) | — | — | (28 | ) | (266 | ) | — | — | — | ||||||||||||||
|
Interest income
|
49 | 52 | 89 | 175 | 396 | 558 | 571 | 740 | |||||||||||||||||
|
Total other income, net
|
30 | 52 | 89 | 147 | 130 | 558 | 571 | 740 | |||||||||||||||||
|
Income (loss) before income tax expense
|
(2,973 | ) | (4,155 | ) | (5,753 | ) | (4,522 | ) | (1,344 | ) | 550 | 651 | 188 | ||||||||||||
|
Income tax expense
|
— | — | — | — | — | — | — | — | |||||||||||||||||
|
Net income (loss)
|
$ | (2,973 | ) | $ | (4,155 | ) | $ | (5,753 | ) | $ | (4,522 | ) | $ | (1,344 | ) | $ | 550 | $ | 651 | $ | 188 | ||||
|
Net income (loss) per common share, basic
|
$ | (.10 | ) | $ | (.14 | ) | $ | (.20 | ) | $ | (.16 | ) | $ | (.05 | ) | $ | .02 | $ | .02 | $ | .01 | ||||
|
Net income (loss) per common share, diluted
|
$ | (.10 | ) | $ | (.14 | ) | $ | (.20 | ) | $ | (.16 | ) | $ | (.05 | ) | $ | .02 | $ | .02 | $ | .01 | ||||
Earnings per share are computed separately for each quarter. Therefore, the sum of such quarterly per share amounts may differ from the total for the years.
15. Subsequent Events
On February 26, 2010, we acquired certain assets and liabilities of SafeNet, Inc.’s Embedded Security Solutions Division in a cash and stock transaction which is expected to further strengthen our offering of security and identity management solutions. Under terms of the transaction, we paid $8.5 million in cash and issued 1.2 million shares (valued at $2.8 million at the closing) of our common stock. The transaction also calls for an earn-out of up to $2.5 million in cash based on the attainment of certain revenue goals for the remainder of 2010.
We have incurred $0.1 million of acquisition related costs, associated with this transaction during the first quarter of 2010. These costs will be recorded as general and administrative expenses in our Consolidated Statement of Operations for the quarter ending April 2, 2010. This acquisition is expected to be accounted for as a business combination under the guidance of ASC 805 - Business Combinations. We are currently performing a valuation study for the allocation of the purchase price to assets acquired and liabilities assumed.
71
|
Item 9.
|
Changes in and Disagreements with Accountants on Accounting and Financial Disclosure
|
None.
|
Item 9A.
|
Controls and Procedures
|
Disclosure Controls and Procedures
Our Chief Executive Officer and Chief Financial Officer performed an evaluation of our disclosure controls and procedures (as defined in Rule 13a-15(e) of the Exchange Act, which have been designed to provide reasonable assurance that the information required to be disclosed by us in the reports we file or submit under the Exchange Act is (i) accumulated and communicated to our management, including our Chief Executive Officer and Chief Financial Officer, to allow timely decisions regarding required disclosure and (ii) recorded, processed, summarized and reported within the time periods specified in the rules and forms of the SEC. Our Chief Executive Officer and Chief Financial Officer concluded that our disclosure controls and procedures were effective as of January 1, 2010 to provide reasonable assurance of the achievement of these objectives.
Management’s Annual Report on Internal control over Financial Reporting
Our management is responsible for establishing and maintaining adequate internal control over financial reporting as defined in Rules 13a-15(f) and 15d-15(f) under the Exchange Act. Our internal control over financial reporting is a process designed to provide reasonable assurance regarding the reliability of financial reporting and the preparation of financial statements for external purposes in accordance with generally accepted accounting principles. Our internal control over financial reporting includes those policies and procedures that:
|
|
(i)
|
pertain to the maintenance of records that, in reasonable detail, accurately and fairly reflect the transactions and dispositions of the assets of the Company;
|
|
|
(ii)
|
Provide reasonable assurance that transactions are recorded as necessary to permit preparation of financial statements in accordance with generally accepted accounting principles, and that receipts and expenditures of the Company are being made only in accordance with authorizations of management and directors of the Company; and
|
|
|
(iii)
|
Provide reasonable assurance regarding prevention or timely detection of unauthorized acquisition, use or disposition of the Company’s assets that could have a material effect on the financial statements.
|
Because of its inherent limitation, internal control over financial reporting may not prevent or detect misstatements. Also, projections of any evaluation of effectiveness to future periods are subject to the risk that controls may become inadequate because of changes in conditions, or that the degree of compliance with the policies or procedures may deteriorate.
Our management assessed the effectiveness of the Company’s internal control over financial reporting as of January 1, 2010. In making this assessment, management used the criteria set forth by the Committee of Sponsoring Organizations of the Treadway Commission (COSO) in Internal Control-Integrated Framework.
Based upon our assessment and those criteria, management has concluded that the Company maintained effective internal control over financial reporting as of January 1, 2010.
The effectiveness of the Company’s internal control over financial reporting as of January 1, 2010 has been audited by PricewaterhouseCoopers LLP, our independent registered certified public accounting firm, who also audited our consolidated financial statements included in this Annual Report on Form 10-K, as stated in their report which appears under Item 8.
Changes in Internal Controls over Financial Reporting.
There was no change in our internal control over financial reporting during the quarter ended January 1, 2010, that materially affected, or is reasonably likely to materially affect, our internal control over financial reporting.
|
Item 9B.
|
Other Information
|
None.
72
PART III
|
Item 10.
|
Directors, Executive Officers and Corporate Governance
|
The information required by this item is incorporated by reference to our Proxy Statement for our 2010 Annual Meeting of Stockholders to be filed with the SEC within 120 days after the end of the fiscal year ended January 1, 2010.
|
Item 11.
|
Executive Compensation
|
The information required by this item is incorporated by reference to our Proxy Statement for our 2010 Annual Meeting of Stockholders to be filed with the SEC within 120 days after the end of the fiscal year ended January 1, 2010.
|
Item 12.
|
Security Ownership of Certain Beneficial Owners and Management and Related Stockholder Matters
|
The information required by this item is incorporated by reference to our Proxy Statement for our 2010 Annual Meeting of Stockholders to be filed with the SEC within 120 days after the end of the fiscal year ended January 1, 2010.
|
Item 13.
|
Certain Relationships and Related Transactions, and Director Independence
|
The information required by this item is incorporated by reference to our Proxy Statement for our 2010 Annual Meeting of Stockholders to be filed with the SEC within 120 days after the end of the fiscal year ended January 1, 2010.
|
Item 14.
|
Principal Accountant Fees and Services
|
The information required by this item is incorporated by reference to our Proxy Statement for our 2010 Annual Meeting of Stockholders to be filed with the SEC within 120 days after the end of the fiscal year ended January 1, 2010.
PART IV
|
Item 15.
|
Exhibits and Financial Statement Schedules
|
(a)(1) Financial Statements
The following is a list of the Financial Statements included in Item 8 of Part II of this Report.
|
Page
|
|
|
Report of Independent Registered Certified Public Accounting Firm
|
44
|
|
Consolidated Balance Sheets as of January 1, 2010 and January 2, 2009
|
45
|
|
Consolidated Statements of Operations for the years ended January 1, 2010, January 2, 2009 and December 28, 2007
|
46
|
|
Consolidated Statements of Stockholders’ Equity for the period From December 29, 2006 through January 1, 2010
|
47
|
|
Consolidated Statements of Cash Flows for the years ended January 1, 2010, January 2, 2009 and December 28, 2007
|
48
|
|
Notes to Consolidated Financial Statements
|
49
|
(a)(2) Financial Statement Schedules
Schedules not included herein are omitted because they are inapplicable or not required or because the required information is given in the financial statements and notes thereto
73
SCHEDULE II
VALUATION AND QUALIFYING ACCOUNTS
|
Balance at
|
Charges to
|
Balance at
|
||||||||||||||
|
beginning
|
cost and
|
end of
|
||||||||||||||
|
of period
|
expenses
|
Deductions
|
period
|
|||||||||||||
|
(in thousands)
|
||||||||||||||||
|
Year ended January 1, 2010
|
||||||||||||||||
|
Bad debt allowance
|
$ | 41 | $ | (8 | ) | $ | (28 | ) | $ | 5 | ||||||
|
Income tax valuation allowance
|
19,726 | 5,517 | - | 25,243 | ||||||||||||
|
Inventory valuation allowance
|
1,507 | 29 | - | 1,536 | ||||||||||||
|
Year ended January 2, 2009
|
||||||||||||||||
|
Bad debt allowance
|
23 | 18 | - | 41 | ||||||||||||
|
Income tax valuation allowance
|
20,220 | - | (494 | ) | 19,726 | |||||||||||
|
Inventory valuation allowance
|
1,110 | 422 | (25 | ) | 1,507 | |||||||||||
|
Year ended December 28, 2007
|
||||||||||||||||
|
Bad debt allowance
|
75 | - | (52 | ) | 23 | |||||||||||
|
Income tax valuation allowance
|
21,737 | - | (1,517 | ) | 20,220 | |||||||||||
|
Inventory valuation allowance
|
$ | 520 | $ | 590 | $ | - | $ | 1,110 | ||||||||
74
(a)(3) Exhibits
The exhibits required by this item and included in this report or incorporated herein by reference are as follows:
|
Exhibit
Number
|
Description of Document
|
|
*2.1
|
Asset Purchase Agreement, dated February 26, 2010, by and between AuthenTec, Inc. and SafeNet, Inc. (Incorporated herein by reference to Exhibit 2.1 of AuthenTec’s Current Report on Form 8-K filed February 26, 2010)
|
|
*3.1
|
Amended and restated certificate of incorporation of AuthenTec, Inc. (Incorporated herein by reference to Exhibit 3.1 of AuthenTec’s Current Report of Form 8-K filed February 18, 2010)
|
|
*3.2
|
Second amended and restated bylaws of AuthenTec, Inc. (Incorporated herein by reference to Exhibit 3.1 of AuthenTec’s Quarterly Report on Form 10-Q filed November 5, 2009)
|
|
*4.1
|
Specimen stock certificate for shares of common stock of AuthenTec, Inc. (Incorporated herein by reference to Exhibit 4.1 of AuthenTec’s Amendment No. 4 to Form S-1 filed June 20, 2007)
|
|
*10.1
|
AuthenTec, Inc. 2004 Stock Incentive Plan, as amended (Incorporated herein by reference to Exhibit 10.1 of AuthenTec’s Amendment No. 3 to Form S-1 filed June 7, 2007)
|
|
*10.2
|
Form of Incentive Stock Option Agreement under 2004 Stock Incentive Plan (Incorporated herein by reference to Exhibit 10.2 of AuthenTec’s Form S-1 filed March 16, 2007)
|
|
*10.3
|
Form of Non statutory Stock Option Agreement under 2004 Stock Incentive Plan(Incorporated herein by reference to Exhibit 10.3 of AuthenTec’s Form S-1 filed March 16, 2007)
|
|
*10.4
|
Form of directors’ and officers’ Indemnity Agreement (Incorporated herein by reference to Exhibit 10.4 of AuthenTec’s Amendment No. 3 to Form S-1 filed June 7, 2007)
|
|
*10.5
|
Commercial lease dated December 27, 2006, by and between AuthenTec, Inc. and Rialto, LLC. (Incorporated herein by reference to Exhibit 10.6 of AuthenTec’s Form S-1 filed March 16, 2007)
|
|
*10.6
|
Employment Agreement dated March 21, 2005 between AuthenTec, Inc. and Lawrence J. Ciaccia, Jr. (Incorporated herein by reference to Exhibit 10.8 of AuthenTec’s Form S-1 filed March 16, 2007)
|
|
*10.7
|
Employment Agreement dated November 13, 2006 between AuthenTec, Inc. and Frederick R. Jorgenson. (Incorporated herein by reference to Exhibit 10.9 of AuthenTec’s Form S-1 filed March 16, 2007)
|
|
*10.8
|
Employment Agreement dated December 12, 2006 between AuthenTec, Inc. and Gary R. Larsen (Incorporated herein by reference to Exhibit 10.10 of AuthenTec’s Form S-1 filed March 16, 2007)
|
|
*10.9
|
Form of Change of Control Agreement (Incorporated herein by reference to Exhibit 10.11 of AuthenTec’s Amendment No. 3 to Form S-1 filed June 7, 2007)
|
|
*10.10
|
AuthenTec, Inc. 2007 Stock Incentive Plan (Incorporated herein by reference to Exhibit 10.12 of AuthenTec’s Amendment No. 4 to Form S-1 filed June 20, 2007)
|
|
*10.11
|
Form of Incentive Stock Option Grant Agreement under 2007 Stock Incentive (Incorporated herein by reference to Exhibit 10.13 of AuthenTec’s Amendment No. 4 to Form S-1 filed June 20, 2007)
|
|
*10.12
|
Form of Non statutory Stock Option Grant Agreement Plan under 2007 Stock Incentive Plan (Incorporated herein by reference to Exhibit 10.14 of AuthenTec’s Amendment No. 4 to Form S-1 filed June 20, 2007)
|
|
*10.13
|
Executive Employment Agreement, dated June 7, 2007 between AuthenTec, Inc. and F. Scott Moody (Incorporated herein by reference to Exhibit 10.15 of AuthenTec’s Amendment No. 4 to Form S-1 filed June 20, 2007)
|
|
*10.14
|
First Amendment to Employment Agreement dated June 7, 2007 between AuthenTec, Inc. and Gary R. Larsen (Incorporated herein by reference to Exhibit 10.10.1 of AuthenTec’s Amendment No. 4 to Form S-1 filed June 20, 2007)
|
75
|
Exhibit
Number
|
Description of Document
|
|
*10.15
|
First Amendment to Lease dated March 3, 2008, by and between AuthenTec, Inc. and Rialto, LLC (Incorporated herein by reference to Exhibit 10.16 of AuthenTec’s Quarterly Report on Form 10-Q filed May 1, 2008)
|
|
*10.16
|
First Amendment to Employment Agreement dated December 22, 2008 between AuthenTec, Inc. and F. Scott Moody (Incorporated herein by reference to Exhibit 10.17 of AuthenTec’s Annual Report on Form 10-K filed March 18, 2009)
|
|
*10.17
|
First Amendment to Employment Agreement dated December 19, 2008 between AuthenTec, Inc. and Lawrence J. Ciaccia, Jr. (Incorporated herein by reference to Exhibit 10.18 of AuthenTec’s Annual Report on Form 10-K filed March 18, 2009)
|
|
*10.18
|
Third Amendment to Employment Agreement dated December 19, 2008 between AuthenTec, Inc. and Frederick R. Jorgenson (Incorporated herein by reference to Exhibit 10.19 of AuthenTec’s Annual Report on Form 10-K filed March 18, 2009)
|
|
*10.19
|
Second Amendment to Employment Agreement dated December 19, 2008 between AuthenTec, Inc. and Gary R. Larsen (Incorporated herein by reference to Exhibit 10.20 of AuthenTec’s Annual Report on Form 10-K filed March 18, 2009)
|
|
*10.20
|
Amendment to Form of Change of Control Agreement (Exec) (Incorporated herein by reference to Exhibit 10.21 of AuthenTec’s Annual Report on Form 10-K filed March 18, 2009)
|
|
*10.21
|
Second Amendment to Employment Agreement dated April 6, 2009 between AuthenTec, Inc. and Lawrence J. Ciaccia, Jr. (Incorporated herein by reference to Exhibit 10.23 of AuthenTec’s Quarterly Report on Form 10-Q filed August 8, 2009)
|
|
*10.22
|
Fourth Amendment to Employment Agreement dated April 6, 2009 between AuthenTec, Inc. and Frederick R. Jorgenson (Incorporated herein by reference to Exhibit 10.24 of AuthenTec’s Quarterly Report on Form 10-Q filed August 8, 2009)
|
|
*10.23
|
Third Amendment to Employment Agreement dated April 6, 2009 between AuthenTec, Inc. and Gary R. Larsen (Incorporated herein by reference to Exhibit 10.25 of AuthenTec’s Quarterly Report on Form 10-Q filed August 8, 2009)
|
|
*10.24
|
Second Amendment to Form of Change of Control Agreement (Exec) (Incorporated herein by reference to Exhibit 10.26 of AuthenTec’s Quarterly Report on Form 10-Q filed August 8, 2009)
|
|
*10.25
|
First Amendment to Director Option Agreement (Incorporated herein by reference to Exhibit 10.27 of AuthenTec’s Quarterly Report on Form 10-Q filed August 8, 2009)
|
|
*10.26
|
Form of Restricted Stock Unit Agreement (Incorporated herein by reference to Exhibit 10.28 of AuthenTec’s Quarterly Report on Form 10-Q filed August 8, 2009)
|
|
*21.1
|
Subsidiaries of AuthenTec, Inc. (Incorporated herein by reference to Exhibit 21.1 of AuthenTec’s Form S-1 filed March 16, 2007)
|
|
23.1
|
Consent of PricewaterhouseCoopers LLP
|
|
23.2
|
Consent of PCE Valuation, LLC
|
|
24.1
|
Power of Attorney (included in signature pages)
|
|
31.1
|
Certification of the Chief Executive Officer Pursuant to Section 302 of the Sarbanes-Oxley Act of 2002
|
|
31.2
|
Certification of the Chief Financial Officer Pursuant to Section 302 of the Sarbanes-Oxley Act of 2002
|
|
32.1
|
Certification Pursuant to Section 906 of the Sarbanes-Oxley Act of 2002
|
|
32.2
|
Certification Pursuant to Section 906 of the Sarbanes-Oxley Act of 2002
|
|
*
|
Indicates exhibit incorporated by reference.
|
76
SIGNATURES
Pursuant to the requirements of Section 13 or 15(d) of the Securities Exchange Act of 1934, the registrant has duly caused this report to be signed on its behalf by the undersigned, thereunto duly authorized.
|
AUTHENTEC, INC.
|
|||
|
Date: March 17, 2010
|
By:
|
/s/ F. Scott Moody | |
|
F. Scott Moody
Chief Executive Officer
|
|||
POWER OF ATTORNEY
KNOW ALL PERSONS BY THESE PRESENTS, that each person whose signature appears below hereby constitutes and appoints F. Scott Moody and Gary R. Larsen and each of them acting individually, as his or her attorney-in-fact and agents, each with full power of substitution, for him or her in his or her name, place and stead, in any and all capacities, to sign any and all amendments, to this Annual Report, and to file the same, with all exhibits thereto and all other documents in connection therewith, with the SEC, granting unto said attorneys-in-fact and agents, and each of them, full power and authority to do and perform each and every act and thing requisite and necessary to be done, as fully to all intents and purposes as he or she might or could do in person, hereby ratifying and confirming all that said attorneys-in-fact and agents or any of them, or his, her or their substitute or substitutes, may lawfully do or cause to be done or by virtue hereof.
Pursuant to the requirements of the Securities Exchange Act of 1934, this report has been signed by the following persons on behalf of the registrant and in the capacities and on the dates indicated:
|
Signature
|
Title
|
Date
|
||
|
/s/ F. Scott Moody
|
Chief Executive Officer | |||
|
F. Scott Moody
|
(Principal Executive Officer)
|
March 17, 2010
|
||
|
/s/ Gary R. Larsen
|
Chief Financial Officer | |||
|
Gary Larsen
|
(Principal Accounting and Financial Officer)
|
March 17, 2010
|
||
|
/s/ Chris Fedde
|
Director
|
|||
|
Chris Fedde
|
March 17, 2010
|
|||
|
/s/ Matthew P. Crugnale
|
Director
|
|||
|
Matthew P. Crugnale
|
March 17, 2010
|
|||
|
/s/ Robert E. Grady
|
Chairman of the Board
|
|||
|
Robert E. Grady
|
March 17, 2010
|
|||
|
/s/ Gustav H. Koven III
|
Director
|
|||
|
Gustav H. Koven
|
March 17, 2010
|
|||
|
/s/ William Washecka
|
Director
|
|||
|
William Washecka
|
March 17, 2010
|
77