Attached files
| file | filename |
|---|---|
| EX-23.1 - EXHIBIT 23.1 - TNS INC | a2197217zex-23_1.htm |
| EX-32.1 - EXHIBIT 32.1 - TNS INC | a2197217zex-32_1.htm |
| EX-31.1 - EXHIBIT 31.1 - TNS INC | a2197217zex-31_1.htm |
| EX-31.2 - EXHIBIT 31.2 - TNS INC | a2197217zex-31_2.htm |
UNITED STATES
SECURITIES AND EXCHANGE COMMISSION
WASHINGTON, DC 20549
FORM 10-K
FOR ANNUAL AND TRANSITION REPORTS
PURSUANT TO SECTIONS 13 OR 15(d) OF THE
SECURITIES EXCHANGE ACT OF 1934
| (Mark One) | ||
ý |
ANNUAL REPORT PURSUANT TO SECTION 13 OR 15(d) OF THE SECURITIES EXCHANGE ACT OF 1934 |
|
For the fiscal year ended December 31, 2009 |
||
OR |
||
o |
TRANSITION REPORT PURSUANT TO SECTION 13 OR 15(d) OF THE SECURITIES EXCHANGE ACT OF 1934 |
|
For the transition period from to |
||
Commission file number 1-32033
TNS, INC.
(Exact Name of Registrant as Specified in Its Charter)
| DELAWARE (State or Other Jurisdiction of Incorporation or Organization) |
36-4430020 (IRS Employer Identification No.) |
|
11480 COMMERCE PARK DRIVE, SUITE 600, RESTON, VIRGINIA (Address of Principal Executive Offices) |
20191 (Zip Code) |
(703) 453-8300
Registrant's telephone number, including area code
Securities registered pursuant to Section 12(b) of the Act:
| Title of Each Class | Name of Each Exchange on Which Registered | |
|---|---|---|
| Common Stock | New York Stock Exchange |
Securities registered pursuant to Section 12(g) of the Act: None
Indicate by check mark if registrant is a well-known seasoned issuer, as defined in Rule 405 of the Securities Act. Yes o No ý
Indicate by check mark if the registrant is not required to file reports pursuant to Section 13 or 15(d) of the Act. Yes o No ý
Indicate by check mark whether the Registrant (1) has filed all reports required to be filed by Section 13 or 15(d) of the Securities Exchange Act of 1934 during the preceding twelve (12) months (or such shorter period that the Registrant was required to file such report) and (2) has been subject to such filing requirements for the past ninety (90) days. Yes ý No o
Indicate by checkmark whether the Registrant has submitted electronically and posted on its corporate Web site, if any, every Interactive Data File required to be submitted and posted pursuant to Rule 405 of Regulation S-T (§232.405 of this chapter) during the preceding 12 months (or for such shorter period that the registrant was required to submit and post such files). Yes o No o
Indicate by check mark if disclosure of delinquent filers pursuant to Item 405 of Regulation S-K is not contained herein, and will not be contained, to the best of the Registrant's knowledge in definitive proxy or information statements incorporated by reference in Part III of this Form 10-K or any amendment to this Form 10-K. o
Indicate by check mark whether the registrant is a large accelerated filer, an accelerated filer, a non-accelerated filer, or a smaller reporting company. See the definitions of "large accelerated filer," "accelerated filer," and "smaller reporting company" in Rule 12b-2 of the Exchange Act.
| Large accelerated filer o | Accelerated filer ý | Non-accelerated filer o (Do not check if a smaller reporting company) |
Smaller reporting company o |
Indicate by check mark whether the Registrant is a shell company (as defined in Rule 12b-2 of the Exchange Act). Yes o No ý
As of March 10, 2010, 25,977,350 shares of the Registrant's common stock were outstanding. As of June 30, 2009 (the last business day of the Registrant's most recently completed second fiscal quarter), the aggregate market value of such shares held by non-affiliates of the Registrant was approximately $463 million.
DOCUMENTS INCORPORATED BY REFERENCE
Portions of the Registrant's definitive Proxy Statement relating to the 2010 Annual Meeting of Stockholders, filed with the Securities and Exchange Commission, are incorporated by reference in Part III, Items 9 - 13 of this Annual Report on Form 10-K as indicated herein.
TNS, INC.
FORM 10-K
FOR THE YEAR ENDED DECEMBER 31, 2009
INDEX
EXPLANATORY NOTE
2
Throughout this report, we refer to TNS, Inc., together with its subsidiaries, as "we," "us," "our," "TNS" or "the Company." LEConnect and the TNS logo are our registered trademarks, and TNSLink, TNSConnect, Synapse, FusionPoint by TNS, Dialect and Secure Trading Extranet are our service marks. This report contains trade names, trademarks and service marks of other companies. We do not intend our use or display of other parties' trade names, trademarks or service marks to imply a relationship with, or endorsement or sponsorship of, these other parties.
Forward-Looking Statements
We make forward-looking statements in this report based on the beliefs, expectations, estimates, targets and assumptions of our management and on information currently available to us. Forward-looking statements include information about our possible or assumed future results of operations in "Business," "Management's Discussion and Analysis of Financial Condition and Results of Operations" under the headings "Overview," "Results of Operations," and "Liquidity and Capital Resources," and other sections throughout this report. The forward-looking statements are based on current expectations, forecasts and assumptions that are subject to known and unknown risks, uncertainties and other factors, many of which may be beyond our control, that could cause actual results to differ materially from those set forth in, or implied by, the forward-looking statements. The Company has attempted, whenever possible, to identify these forward-looking statements using words such as "may," "will," "should," "projects," "estimates," "expects," "plans," "intends," "anticipates," "believes," and variations of these words and similar expressions. Similarly, statements herein that describe the Company's business strategy, prospects, opportunities, outlook, objectives, plans, intentions or goals are also forward-looking statements.
Forward-looking statements involve risks, uncertainties and assumptions, including risks described below and other risks that we describe from time to time in our periodic filings with the SEC, and our actual results may differ materially from those expressed in our forward-looking statements. We therefore caution you not to rely unduly on any forward-looking statement. The forward-looking statements in this report speak only as of the date of the report, and we undertake no obligation to update or revise any forward-looking statement, whether as a result of new information, future developments or otherwise. The forward-looking statements should not be relied upon as representing the Company's views as of any date subsequent to the date of this filing. The forward-looking statements in this document are intended to be subject to the safe harbor protection provided by Sections 27A of the Securities Act and 21E of the Securities Exchange Act of 1934, as amended.
Overview
We are an international data communications company which provides networking, data communications and value added services to many of the world's leading retailers, banks, payment processors, financial institutions and telecommunication firms. Our data communication services enable secure and reliable transmission of time-sensitive, transaction-related information critical to our customers' operations. Our customers outsource their data communications requirements to us because of our substantial expertise, comprehensive customer support and cost-effective services. We provide services to customers in the United States and increasingly to international customers in over 40 countries including Canada and Mexico and countries in Europe, Latin America and the Asia-Pacific region. We currently maintain operations and/or employees in 28 countries.
We provide services through our data network, which is designed specifically for transaction-oriented applications. Our network supports a variety of widely accepted communications protocols and
3
is designed to be scalable, interoperable and accessible by multiple methods, including dial-up, dedicated, wireless, broadband and Internet connections.
In 2009, we reported our operations in four distinct business segments. Our Point-of-Sale Division was focused on the payments industry in North America. Our International Services Division (ISD) was primarily focused on serving payments-related customers outside of North America and, to a much lesser extent, customers within the financial services industry. Our Telecommunication Services Division (TSD) principally served telecommunication customers in North America but has recently started generating revenue outside of North America from certain products. Our Financial Services Division (FSD) served customers in the financial services industry in the United States.
In our Point-of-Sale and ISD divisions, we have over a thousand customers, making us, on the basis of total transactions transmitted, a leading provider of data communications services and other value added services to processors of credit card, debit card and ATM transactions. Within TSD, we operate the largest unaffiliated Signaling System No. 7 network in the United States capable of providing services nationwide, including call signaling and database access services, to the domestic telecommunication industry. We also provide roaming and clearing services to both domestic and international mobile phone operators. In FSD, we are a leading provider of secure data network services to the global financial services industry, connecting over 1,700 financial community end-points located at over 625 distinct financial services companies, representing buy and sell-side institutions, market data and software vendors, exchanges and alternative trading venues.
In each of our divisions, our revenues are generally recurring in nature and we typically enter into multi-year service contracts that require minimum transaction or revenue commitments from our customers.
Our business began operations in 1991 to address the needs of the Point-of-Sale industry in the United States. The strong operating cash flows generated by our business have enabled us to invest in our data network to make our communications services more rapid, secure, reliable and cost efficient. In addition, we have leveraged these investments and used our continued strong operating cash flows to expand our service offerings to related market opportunities in the telecommunications and financial services industries in the United States and abroad. By implementing and executing this strategy, we have grown our revenues every year, from $285,000 for the year ended December 31, 1991, to $474.8 million for the year ended December 31, 2009.
Over recent years our business and the customers to whom we provide services have evolved to become more global in scope. For example, our ISD and Point-of-Sale divisions increasingly provided services to the same customers with the primary difference being the geographic location of the services provided. Driven by the demands of our customers, our Point-of-Sale and ISD sales teams increasingly work together to sell services to global customers in a consistent manner. In recognition of this evolution, at the beginning of 2010 our management team determined it was more appropriate to align the company's business along industry segments on a global basis. Our management team determined it was no longer necessary to have a separate ISD business unit and that it was more appropriate to group the ISD payment related business with the Point-of-Sale Division and to group the ISD financial services business with FSD. In 2010, we reorganized our divisional management structure to reflect this decision to operate the company in three business divisions. The three business divisions will be the telecommunication services division, the payments division and the financial services division. We will begin to report revenues in these three business divisions beginning with the three month period ended March 31, 2010.
4
Business Overview
Point-of-Sale (POS) Opportunity
According to the industry information source The Nilson Report, the four card-based systems of payments—credit, debit, prepaid, and electronic benefits transfer—generated 66.7 billion transactions, or 45.7% of total payments in the United States in 2008, up 6.8% from the previous year. In 2002, these payment types accounted for 30.4% of transaction volume, or 36.7 billion transactions. By 2012, debit card transactions alone are projected to overtake the number of transactions performed using cash in the United States. Along with the growth in electronic transactions, the increase in the number of options for POS device connectivity, which now includes wireless, Internet-based and dial-up access, is adding complexity to retailers and processors running large-scale payment networks. As our scaleable network accepts a wide variety of connectivity types, we believe it is well-suited to deliver mission-critical services to almost any size retailer, bank or processor as requirements for managing network connectivity expand.
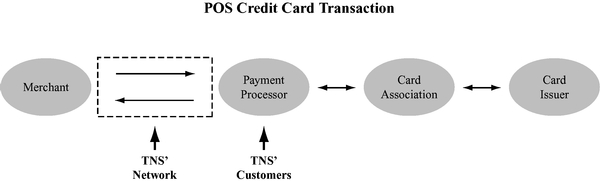
POS and off-premise ATM (an automated teller machine at a location other than a branch office of a financial institution) transactions require the two-way transfer of information over a secure, reliable data network. Typically, at POS and off-premise ATM locations where a credit, debit or ATM card is accepted, the customer's account information and transaction amount must be electronically transmitted to a payment processor. The payment processor then electronically communicates with the financial institution that issued the card to determine whether to authorize the transaction. After this determination is made, the processor returns an authorization or rejection response to the POS or ATM terminal.
Financial institutions in the United States and Canada typically outsource the processing of credit and debit card accounts to payment processors who are able to leverage technical expertise and capitalize on economies of scale. Payment processors, in turn, typically have outsourced to third party service providers such as TNS the data networking services used to transport transaction data between the processor's host computers and the POS or ATM terminal.
POS or off-premise ATM terminals access data network connections to payment processors through a variety of methods, the most common of which are dial-up and dedicated, or leased line, services and increasingly include broadband connections. Dial-up access services allow merchants and off-premise ATMs to connect to payment processors by dialing a telephone number each time a transaction is initiated. Wireless access provides the same capability as dial-up access without a physical connection to the POS device or ATM. A leased line is a dedicated connection provided to a merchant or ATM location for the exclusive purpose of connecting the POS terminal or ATM to the payment processor. Dial-up services are less expensive than leased line services as leased line services impose greater fixed monthly communication service charges, making a leased line economically viable only in high-volume merchant or off-premise ATM locations. A broadband connection such as a digital subscriber line, or DSL, or wireless connection is an always-on connection utilized by a merchant or ATM location for various purposes including to connect a POS terminal or ATM to the payment processor. With the introduction of broadband services, merchants and other POS providers have begun to deploy integrated wide-area-network solutions. These solutions include POS services, inventory management and other back-office solutions utilized by merchants.
Outside of the payment processing industry, businesses, such as pre-paid card providers, kiosk operators, loyalty card providers and merchants situated in locations other than brick and mortar stores, such as mobile merchants and merchants on the internet, are expanding their use of electronic transaction processing in an attempt to reduce costs, increase sales through the acceptance of credit and debit cards, and increase the reliability and efficiency of data transmission. As the number of merchants situated in locations other than brick and mortar stores increases, the number of
5
transactions being performed without the cardholder or card present also is increasing, creating a growing need for card-not-present services.
Another significant factor facing the electronic payment processing industry is susceptibility to fraudulent transactions and as the number of electronic payment transactions has increased, the industry's exposure to fraud has increased. Payment processors desire secure and reliable data communications and other transaction related services.
We believe we will be able to increase the number of connections to our network and the number of transactions we transport as these and other industries look to outsource the data communications requirements necessary to transmit transactions securely.
Our POS services
Our POS division markets our data communications services directly to payment processors in the United States, Canada and Mexico. The following chart illustrates the route of a typical card-present POS transaction using our data communications services. The route of a typical off-premise ATM transaction is similar.
We also market our POS data communications services to entities responsible for the transmission of state lottery transactions, federal and state electronic benefits transfer and healthcare transactions as well as directly to select categories of merchants and retailers.
Our private, secure data network was designed specifically to address the data communications requirements of the payment processing industry. Our data communication services provide customized routing technology, built-in redundancy and geographic diversity and are configured to provide fast and reliable call connection and efficient network utilization. Our data network is Payment Card Industry Data Security Standard (PCI DSS) certified and is used to connect a merchant's POS terminal or an off-premise ATM securely to the payment processor's host computer.
Our core service offering is network connectivity which enables the processing of POS transactions. We provide multiple means for the POS terminal or off-premise ATM to access our data network. Merchant POS terminals and off-premise ATMs can connect directly to our network using our dial-up service, which utilizes telephone services obtained from interexchange carriers and local exchange carriers. While our customers primarily choose to access our network using our dial-up services, we are increasingly providing alternative methods of connecting to our network, including fixed broadband, wireless and internet connectivity via our TNSLink product line.
Our wireless payment gateway platform, called Synapse, enables merchants and kiosk machine operators to process credit and other card transactions without the inconvenience and cost of having to connect to a telephone line. The mobile merchant market has been experiencing strong growth in the United States and around the world. Our fixed broadband and wireless service offerings enable merchants to utilize broadband connectivity in their store to transmit data from the POS terminal or
6
ATM to the payment processor. Our services include a proprietary performance monitoring and management information reporting application which is used by our customers to centrally monitor and manage the equipment at their locations.
We configure and provide terminal adapters that enable off-premise ATM operators to convert leased line ATMs to ATMs that use dial-up connections, fixed broadband or wireless service. This allows the ATM operators to avoid the costs associated with the need to replace or refit the ATM. Because our terminal adapters allow the ATM and the payment processor's system to operate as if they are connected by a leased line, off-premise ATM operators retain the functionality and speed of existing leased line ATMs while reducing monthly recurring telecommunications expenses.
In addition to our core network connectivity service offering, we have been investing in several network-related applications that provide value added services for various types of transactions transported over our network. In 2009, we invested in an ATM processing business in Canada, which provides transaction processing and settlement account services to the deployers of ATMs. We also operate a service which delivers card-not-present transactions to the eCommerce industry. We recently established a physical instance of our card-not-present gateway in the United States. Additionally, along with two strategic partners, we now provide end-to-end transaction encryption services for specific POS devices using our network to deliver secure transactions from the terminal all the way through to the processor, enhancing the security of these transactions. As connectivity and network routing become increasingly IP-based, we will work to build value added services within our network with a focus on security, reliability and business intelligence.
We generally enter into multi-year contracts that usually have minimum transaction or revenue commitments from our POS customers. Our traditional business of providing dial-up connectivity service to POS and off-premise ATMs continues to generate the majority of the revenue of our POS division. For dial-up access services, we typically charge our customers a fixed fee per transaction plus a variable time-based charge for transactions that exceed a specified period of time. Generally, our contracts provide for a reduction in the fixed fee per transaction as our customers achieve higher monthly transaction volumes. We typically charge our customers fixed monthly fees for leased line and broadband services. We also generate POS revenue from usage charges, circuit charges, charges for access to real-time transaction monitoring and charges for ancillary services. For the year ended December 31, 2009, we transmitted approximately 4.9 billion dial POS transactions in North America and generated $76.1 million of revenue in the POS division, which represented 16.0% of our total revenues.
International Service Division (ISD) opportunity
While credit and debit card payments are growing in the United States, the international market for these payment methods is expanding at a greater rate. According to Mercator Advisory Group, between 2007 and 2008 the total number of general purpose credit and debit card transactions outside of the United States increased by 13.7%, to approximately 70.4 billion transactions. Outside of the United States, the regions with the highest transaction volumes in the world were Europe, Asia-Pacific and Latin America, while Middle East/Africa and Latin America experienced the fastest growth in 2008. (© 2009, Mercator Advisory Group, Inc.)
In markets outside of the United States, we believe there are opportunities with the large financial institutions, foreign-based processors and US-based processors increasing their international presence. In several of the countries we currently serve, many financial institutions have historically performed their own processing services for ATM, credit and debit card transactions using outsourced communications services from local telecommunication providers. For these institutions, we believe the redundancy, security and routing intelligence we provide gives us an opportunity to replace these incumbent network providers. Financial institutions in Europe, however, have increasingly outsourced
7
the processing of credit and debit card transactions to payment processors in an effort to leverage technical expertise, reduce costs and capitalize on economies of scale. As part of this trend, several of the largest payment processors based in the United States are increasing their international presence. As they expand into additional international markets, these payment processors will require providers of outsourced data communications services to deal with the complexity of transporting transactions across various network protocols, currencies and message formats.
Internationally we serve more retailers than we do in the United States. One of the key sectors of retail growth continues to be the eCommerce industry. For example, within the United Kingdom it is estimated that eCommerce transactions will account for 21% of all card transactions by 2015, growing from just under 11% in 2008 (Copyright (c) 2010 by Payment Systems Europe Limited). The growing needs of this class of merchant creates opportunities for payment gateway providers. Within the traditional retail market, opportunities exist to migrate merchants to high speed broadband connectivity for payment applications or to enable merchants with the ability to accept payments via wireless point of sale terminals.
Additionally, the growth, automation and globalization of financial markets have led to increased demand for outsourced, secure, reliable data communications services. Banks, mutual funds, pension funds, broker-dealers, alternative trading systems, electronic communications networks, or ECNs, securities and commodities exchanges and other market participants increasingly use data communications services to exchange trading information, distribute research and review trading positions.
Our ISD services
The network technology and services we have developed to serve our customers in the United States are applicable to the data communications needs of payment processing and financial services industries in other countries. Our international services revenues are currently generated primarily through the sale of our POS services. We generate the majority of our international revenues in the United Kingdom, where we are one of the leading providers of data communications and value-added services to the POS industry. We provide services to substantially all of the financial institutions in the United Kingdom which acquire and process credit and debit transactions in the United Kingdom. We also provide services to financial institutions operating ATMs. Within Europe, our services are predominantly related to providing data connectivity to the POS and ATM industries. Within the Asia-Pacific region, we generate revenue from POS and ATM connectivity services and increasingly from our card-not-present gateway services based in Australia.
In addition to our network connectivity services in ISD, we provide card present and card not present payment gateway services to multi-channel merchants as well as card associations which offer services over the Internet. We also provide managed broadband solutions and dial to IP conversion devices to merchants who desire to migrate their payment infrastructure from dial to IP technology as well as payment processing services to ATM owners. Additionally, we provide services to payment processors that are not used by payment processors in the United States. These include settlement and offline polling services which enable merchants to store transaction data until the payment processor retrieves the data after business hours.
We also generate international services revenues through the sale of our FSD services. TNS' international financial services business has experienced steady growth by expanding its presence globally, with a focus on developing business in the Asia-Pacific region. By signing exchanges and ECNs, and offering value-added services such as market-data offerings, we are expanding our financial community of interest over our Secure Trading Extranet. Additionally, TNS has launched a suite of low latency services to capitalize on the opportunity to provide high levels of system efficiency to the securities trading marketplace.
8
We consider a number of factors when evaluating opportunities in international markets, including the regulatory environment of the telecommunications and payments market, consumer use of credit and debit cards, the competitive landscape and the rules applicable to foreign investment. Historically, we typically provided our services internationally through a subsidiary located in the country identified for expansion. Recently, we have decided to expand into new countries by providing services from nearby countries in which we have existing operations. In some instances, we have elected to enter new markets through strategic acquisitions. While we continue to look for opportunities to expand into international markets, we plan to focus our efforts to grow internationally in those countries in which we currently have operations, being Australia, Austria, Bermuda, France, Germany, Hong Kong, India, Ireland, Italy, Japan, Malaysia, New Zealand, Poland, Romania, Singapore, South Korea, Spain, Sweden, Thailand, the Netherlands, Turkey and the United Kingdom. Continued expansion into international markets is an important part of our operating strategy. We currently plan to expand into additional countries in the Asia-Pacific region. We also expect to expand into additional countries in Central Europe as opportunities arise.
For the year ended December 31, 2009, we generated $138.3 million of revenue in the international services division, which represented 29.1% of our total revenues, of which $120.8 million was generated from the sale of our payment-related services and $17.5 million was generated from the sale of our financial service offerings. Our operations in the United Kingdom, France and Australia comprised 68.1% of our international revenues in 2009. For financial information about geographic areas where we do business, please refer to Note 9 of the consolidated financial statements and related notes included in Item 8 of this annual report.
Telecommunication Services Division (TSD) Opportunity
Every wireline and wireless telephone call consists of the content of the call, such as the voice, data or video communication, and the signaling information necessary to establish and close the transmission path over which the call is carried. Substantially all telecommunications carriers in the United States and Canada use Signaling System No. 7, or SS7, as the signaling protocol to identify the network route to be used to connect individual telephone calls. SS7 networks are data networks that transport call-signaling information separate from the public switched telecommunication network over which the call content is communicated. Telecommunication service providers require access to an SS7 network connected to the signaling networks of other carriers to be able to provide telecommunication services to their customers. In addition to circuit set-up and tear-down, wireless operators use SS7 signaling to locate and authenticate subscribers, to determine service parameters, and to update location registers.
SS7 networks are also used to retrieve information from centralized databases maintained by telecommunication services providers and other third parties. By accessing this information, telecommunication services providers are able to offer services that enable intelligent network services such as local number portability, line information database, caller identification and toll-free number services, as well as credit card, calling card, third-party billing and collect calling. Companies which provide voice over IP (VoIP) services also use SS7 networks to exchange and maintain subscription and location data on subscribers to support voice and wireless roaming services. Competitive pressures are encouraging telecommunication services providers to develop and offer additional services that utilize the signaling services provided by an SS7 network. For example, wireless carriers offer content delivery such as video and ring tones, short message service, and internet browsing and commerce capabilities.
According to Pyramid Research, the U.S. telecommunications market will reach $406 billion in 2014 with mobile data revenue climbing to $94 billion, surpassing fixed voice during the forecast period. The market for communication services is expected to grow at a compound annual growth rate, or CAGR, of 2.5 percent from year-end 2009 to year-end 2014, with most of the growth being attributed to mobile data and IP-based networks. VoIP is expected to grow from $8 billion in 2008 to $22 billion
9
in 2014. Mobile broadband will be a further source for growth for the U.S. telecommunications market due to growing popularity of unlimited data and mobile broadband plans. Revenue related to mobile broadband access for laptop computers and Internet access for handsets is estimated to grow rapidly at CAGRs of 28 percent and 18 percent, respectively, from 2009 to 2014.
Our TSD Services
At the beginning of 2009, we owned and operated an SS7 network and partnered with other providers to offer services delivered throughout the network. In May, 2009, we acquired the Communications Services Group assets from VeriSign, Inc. As a result of the acquisition, we now operate the largest unaffiliated SS7 network in the United States capable of providing call signaling and database access services nationwide. Our SS7 network is connected with the signaling networks of all of the incumbent local exchange carriers and a significant number of wireless carriers, competitive local exchange carriers, interexchange carriers and voice over IP (VoIP) service providers. We believe that our independence and neutrality enhance our attractiveness as a provider of outsourced SS7 services. Through the acquisition of the Communication Services Group assets we also now own proprietary services such as database and registry services, which include caller-name identification, and roaming and clearing services to wireless carriers. TSD's customer base includes incumbent and competitive local exchange carriers, IP-based communications providers, and mobile operators.
The deployment, operation and maintenance of a nationwide SS7 network connected to all of the major signaling networks and database providers requires significant capital and specific technical expertise. For these reasons, many telecommunication services providers have chosen not to build the networks and applications necessary to satisfy all of their SS7 signaling requirements. Rather, they turn to outsourced SS7 network service providers such as TNS to obtain the call signaling, database access and value-added services critical to their business in an effort to increase speed to market and to remain competitive.
With our SS7 network, we provide switching and transport services throughout the United States as well as in the Caribbean and Latin America. Our SS7 network is connected to the SS7 networks of local exchanges and wireless carriers through various mated pairs of signal transfer points deployed throughout the country. By connecting to our SS7 network, our customers eliminate their need to implement, operate and maintain numerous, complex connections linking their SS7 switches to the signaling networks of other telecommunications carriers. We believe that our SS7 network enables us to offer our data communications services more reliably and cost-effectively than our competitors.
Within our database services, we offer our customers access to databases maintained internally and to those operated by telecommunications carriers and other third parties. These databases are used to provide subscribers with intelligent network services such as local number portability, line information database, caller identification and toll-free number services. These databases also are used to provide the registry services required to route IP-based and mobile messaging services. Our database and registry service includes the following:
- •
- Local number portability databases. Wireline and wireless
telecommunications carriers are required to provide local number portability, a service that enables a subscriber to change service providers within a particular location and keep the same phone
number. Our SS7 network provides access to internally managed databases that host all wireline and wireless number portability data.
- •
- Line information databases. Telecommunications service providers develop and maintain databases that store subscriber information, including names and addresses. This information is necessary to provide enhanced services such as validating subscriber and billing information.
10
- •
- Toll-free databases. Each time a subscriber
calls a toll-free number, the telecommunication services provider must access a national database of toll-free numbers in order to route the call.
- •
- Calling name storage and delivery databases. A
telecommunication services provider must access a database containing the name and other information about the subscriber for the telephone number placing the call in order to offer caller
identification services.
- •
- Validation and fraud control services. Our validation and
fraud control services combine our access to line information databases with our proprietary fraud control technology to provide interexchange carriers, operator services providers and payphone
service providers real-time telephone call billing validation and fraud control services for calling card, credit card, third-party billing and collect calls. Our services assist our
customers in determining whether telephone company calling cards, credit cards, travel and entertainment cards and telephone numbers constitute valid accounts and billable telephone numbers.
- •
- ID Plus. ID Plus gives users access to a telephone name
and address database, which will increase service providers' ability to either discern the identity of a caller or to direct bill for services.
- •
- IP directory services. Our carrier electronic numbering
service enables applications using internet protocols to communicate with consumer devices addressed by telephone numbers. Our registry is populated with information sourced from industry and
regulatory number management systems, along with authoritative data sourced directly from the carriers. Through a query or number lookup, the registry provides accurate
carrier-of-record information and the applicable IP address for a telephone number enabling VoIP calls, data messages, and text messages to be terminated to the proper
location.
- •
- VoIP peering registry services. Our managed VoIP peering services provide advanced routing capabilities, protocol technology and other services to enable VoIP network providers to interconnect their networks with traditional telecommunications networks. With a single interconnection, our VoIP peering services can connect VoIP networks and traditional telecommunications networks anywhere in the world. Domestically, we combine our VoIP peering services with our database access services.
Additionally, we offer a suite of roaming and clearing services to wireless carriers using the ANSI-41 and GSM Mobile Application Part signaling protocols. Our roaming and clearing services allow carriers to provide support for mobile phone customers of other carriers visiting their service area, referred to as roamers, and for their customers when they roam outside their service area. Our service manages signaling conversion and implementation anomalies between different countries to provide activation processing, seamless international roaming, and fraud protection. Our roaming data clearinghouse services facilitate financial settlement between carriers. We provide these services in addition to access to a pre-established international roaming footprint. In addition, we offer roaming services for carriers utilizing third generation packet radio services, or 3GPRS, and code division multiple access, or CDMA, technologies to offer wireless roaming to their subscribers over broadband wireless networks. We also offer a variety of roaming application and value-add services that help wireless operators better manage and maximize the profitability of their roaming operations.
Our LEConnect data services provide telecommunication services providers with a fast and reliable method of transmitting billing and collection data to and from local exchange carrier data centers over our secure IP networks. Our LEConnect data service minimizes the data transmission errors and time lags associated with a traditional billing and collection system, which requires numerous interexchange carriers and information service providers to send billing data on magnetic data tapes to local exchange carriers. We also offer short message service offload services, which allow telecommunication services
11
providers to avoid the incurrence of additional costs, relieve message congestion and preserve network capacity by offloading short message traffic from SS7 signaling networks to our IP networks.
We generally enter into multi-year contracts with our telecommunication services customers, many of whom agree to minimum volume commitments. We charge fixed monthly fees for SS7 network services, LEConnect services, and VoIP peering services and per-message fees for our database access, call validation, and roaming and clearing services. For the year ended December 31, 2009, we generated $213.0 million of revenue in the telecommunication services division, which represented 44.8% of our total revenues.
As demands for services other than voice continue to grow, we believe there are a number of additional factors that contribute favorably to ongoing demand for our network and other services:
- •
- Despite marketing focus on newer technologies, SS7 presently remains the signaling protocol of choice for many operators.
With the large size of the installed base in legacy circuit-switched SS7 networks, we believe that the evolution to IP communications will be gradual.
- •
- Service providers with a purely next-generation network must terminate traffic on traditional networks using
SS7. We believe these service providers will continue to require SS7 and intelligent database interoperability services into the foreseeable future.
- •
- The growth of mobile data services requires interoperability between mobile operators' radio networks, private IP
networks, and the public Internet. We believe TNS' database and registry services enable the exchange and accurate routing of mobile data communications between these networks.
- •
- Mobile and IP-based communication service providers participate in the porting of telephone numbers, which complicates the
accurate and efficient routing of communications data. We believe TNS' database and registry services resolve these complexities on behalf of service providers.
- •
- Competition between service providers has made delivering services in the most cost-efficient manner critical. For this reason, communication service providers are looking for flexible product offerings which decrease investments in legacy infrastructure, achieve economies of scale and increase speed to market. We believe TNS' business model fits strategically in this increasingly competitive environment.
We believe our network will continue to play a critical role in delivering necessary intelligence for communication service providers to maintain a sustainable market position. Furthermore, we believe that significant opportunities exist for service providers and mobile operators with the technical and commercial strategies to capitalize on the convergence of communications networks. Accordingly, TNS' strategy is to deliver network-based intelligence and infrastructure services that enhance the service distribution capabilities of telecommunication service providers.
Financial Services Division (FSD) Opportunity
The securities trading and investment management industry is increasingly requiring high-speed, reliable, secure data communications services to communicate information among industry participants, including commercial banks, mutual funds, pension funds, broker-dealers, alternative trading systems (ATS), electronic communications networks (ECN's) and securities and commodities exchanges. Transaction volume in the global equity markets has increased rapidly over the past decade. During the same period, the emergence of new electronic trading venues such as ECN's and ATS and regulatory requirements such as the shift to decimalization have placed increasing emphasis on trading and cost efficiencies. To meet these needs, market participants use outsourced data communications services that provide industry participants with access to other participants through a single, managed access point
12
on the service provider's network. These services allow participants to cost-effectively connect to each other to conduct time-sensitive transactions and communicate real-time information.
Our FSD Services
Our fast, private, secure and reliable IP data networks are designed specifically to address the data and voice communications requirements of the financial services industry. TNS connects over 1,700 financial community end-points located at over 625 distinct financial services companies, representing buy and sell-side institutions, market data and software vendors, exchanges and alternative trading venues. Our IP network services allow our customers to access multiple financial services companies through a single network connection, thereby eliminating the need for costly dedicated institution-to-institution leased line connections. Additionally, these services facilitate secure and reliable communications between financial services companies by supporting multiple communications standards and protocols, including the Financial Information eXchange (FIX) protocol. Our network has over 134 points of presence and provides services to customers in 30 countries across the Americas, Europe and the Asia Pacific region, with connections to endpoints in many more. Our financial services customers may have one or more access points to our IP network, depending on the location of their offices and other factors.
We refer to our primary financial service offering as our Secure Trading Extranet. Our Secure Trading Extranet service links financial services companies through our IP network. Through a single network connection, a customer can communicate with any other entity connected to our IP network. Given the large number of industry participants connected to our network, including commercial banks, mutual funds, pension funds, broker-dealers, alternative trading systems, electronic communications networks, multilateral trading facilities and securities and commodities exchanges, a single customer can use its connection to our IP network to conduct seamless, real-time electronic trading and access a variety of content including news, research and market data.
We generate financial services revenue primarily from monthly recurring fees based on the number of customer connections to and through our IP network. For the year ended December 31, 2009, we generated $47.7 million of revenue in the financial services division, which represented 10.1% of our total revenues.
The growth of electronic trading continues to present opportunities for our financial services division. There is increasing demand for low latency market data feeds and higher bandwidth connectivity to improve the effectiveness of buy-side, sell-side, and exchange customers. Along with the increasing bandwidth demands, we continue to see opportunities to expand upon our global community of interest. This community consists of stock exchanges and other trading venues such as multilateral trading facilities, or MTFs, as well as buy-side and sell-side organizations that wish to connect with one another and also receive low latency market data.
Our Strengths
We believe our competitive strengths include:
Recurring revenues and strong operating cash flows. Our established customer base enables us to generate high levels of recurring revenues and strong operating cash flows. Our business model is based upon the number of transactions we transport and the number of connections to our networks. We typically enter into multi-year service contracts that usually have minimum transaction or revenue commitments from our customers. We believe that our recurring revenues and strong operating cash flows will enable us to continue to invest in the development of new products and services and to continue to expand internationally.
13
Established customer base. We have an established customer base of leading industry participants in each division and have experienced limited customer turnover. For the year ended December 31, 2009, we provided payment-related services to more than 1,000 customers. In addition, for the year ended December 31, 2009, we provided services to more than 800 telecommunication services providers and to more than 625 financial services companies. Internationally we generate revenue in over 40 countries and provide services to some of the largest financial institutions, wireless operators and other services providers in those countries and neighboring countries. Through our established customer relationships, we have developed an extensive knowledge of each of our customer's industries. We believe that our knowledge and experience enhance our ability to deliver new and timely data communications services and solutions.
Well-positioned to continue international growth. The network technology and data communications products and services we have developed to serve customers in the United States, Europe and the Asia-Pacific region are applicable to the data communications needs of the payment processing and financial services industries in other countries. We believe that our data communications services and technologies, our technical expertise and our customer relationships with the largest domestic payment processors and global financial institutions strategically position us to take advantage of substantial international opportunities. We have grown our international revenues from $33.1 million for the year ended December 31, 2002 to $138.3 million for the year ended December 31, 2009.
Highly customized data network. We operate a highly customized global network designed and configured for the transmission of time-sensitive data. Our network supports multiple communications protocols and access methods and, as a result, is able to support a wide variety of applications. The flexibility and scalability of our network and our technical expertise allow us to rapidly add new data communications services to our existing offerings in response to emerging technologies with limited service disruptions or capital expenditures. We also believe our ability to leverage our fixed cost base provides us with significant economies of scale, resulting in a competitive advantage.
Substantial experience in our target markets. The nine members of our executive management team have on a combined basis more than 130 years experience in the transaction services and telecommunications industries as well as experience managing large, multinational corporations, and on average have been employees of the company for more than six years. We have focused on creating data communications services for developing and established markets. We believe this gives us an understanding of the unique needs and risks of our target markets and provides us with a competitive advantage over larger service providers that have a broader market perspective. We also believe our extensive experience provides us with a competitive advantage over service providers of similar or smaller size.
Proven acquisition strategy. Our management team has augmented the growth of our business by successfully identifying and integrating strategic acquisitions. We have made a number of acquisitions that have accelerated the growth of each of our service divisions. For example, we acquired the assets of VeriSign's Communications Services Group (CSG) in 2009, to increase our market share in call signaling and intelligent database services as well as to expand our product offerings with the addition of wireless roaming and clearing and IP registry services. We also acquired Dialect Payment Technologies in 2007 to provide Internet payment gateway services to our customers throughout the world.
Our Strategy
Our objective is to continue to grow our business and enhance our position as a leading provider of outsourced business-critical data communications services enabling secure and reliable transmission
14
of time-sensitive information for our transaction processing, telecommunications and financial services customers. Key elements of our strategy include:
Focus on key geographies. We continue to focus our efforts and resources to expand our business in six countries and their surrounding areas in which we already have operations. These countries are Australia, France, Italy, Spain, the United Kingdom and the United States. We believe concentrating our efforts in this way will enable us to grow our business in these geographic markets as well as in adjacent countries, enabling us to generate growth with less capital investment.
Continue to expand our customer base. We believe our experience, existing customer relationships and our ability to consistently deliver secure and reliable data communications services will enable us to expand our customer base in domestic and international markets. For example, in our POS and international services divisions we intend to expand our service offerings to certain customer segments in the traditional and Internet-based retail industry, focusing on selling our broadband managed connectivity solutions and our managed payment services, such as card-not-present gateway services. In our financial services division, we will continue to increase the scope of services and leverage our existing customer base of over 625 financial services companies to acquire new customers. Our recent acquisition of the assets of CSG expanded our product offerings and we anticipate this will help us acquire new customers.
We intend to continue to leverage our customer relationships and technical expertise to provide our POS and financial offerings internationally. Additionally, during 2009, we started to expand our telecommunications services division presence outside of the U.S., adding several new international wireless customers with our roaming and clearing product. We are increasing our focus on expanding our TSD business outside the U.S., focusing on opportunities in and around the countries in which we have an existing presence.
Develop new product and service offerings. We will continue to expand our service offerings to address new markets for secure and reliable transmission of time-sensitive information. We continue to enhance our broadband services to payment processors, financial institutions and merchants in connection with the global POS industry's adoption of new technologies. We are currently offering internet payment gateway services to POS customers in the Asia-Pacific region and the United Kingdom and we intend to begin serving the United States and Western Europe this year. In our telecommunication services division we are deploying data communications services to cable companies allowing them to deploy VoIP network services without incurring the capital expenses of building an SS7 network. Additionally, we are working on several new products within TSD, leveraging our existing technology platforms and focusing on revenue-generating products for our customers.
Increase sales to existing customers. We will continue our efforts to further expand our existing customer relationships to increase business domestically and abroad. For example, we intend to encourage: our domestic and international POS customers to increase their number of connections to our networks and to transmit a greater percentage of their transaction volume with us; our telecommunication services customers to increase the number of signaling routes they establish through our SS7 network and to increase the amount of data we store on their behalf in our databases; and our financial services customers to connect more endpoints and virtual connections to, and use greater bandwidth on, our data network.
Our longstanding relationships with our customers provides us with an opportunity to increase the sales we make to our existing customers as they and we expand internationally. Within POS, our domestic processing customers are looking for growth outside the United States, opening up several new opportunities for cross-border routing of transactions. In TSD, our CSG acquisition gave us several new products and services, such as database and registry services, roaming and clearing and short messaging services, that we can now offer to our legacy customers on a stand-alone basis or as a
15
bundled service. We also provide managed services to legacy CSG customers, helping them control network costs as they start to focus on building next-generation IP-based networks. We believe we have an opportunity to sell broadband POS services along the business chain to new customers currently using the services of our existing TSD customers. We also believe our telecommunication customers will be interested in our managed payment services such as our card-not-present platform. We intend to work closely with our customers to increase our knowledge of their businesses and technical requirements in an effort to identify additional sales opportunities.
Pursue strategic acquisitions. We will continue to seek opportunities to acquire businesses that expand our range of services, provide opportunities to increase our customer base and enter into new domestic and international markets. We will need to use operating cash flows or additional financing to pursue our strategy. In May 2009 we acquired the CSG assets for $230.7 million. We funded the transaction through a new $230.0 million term loan facility as part of the May 2009 Credit Facility.
Our Network
We operate a highly-customized data network specifically designed and configured for the transmission of time-sensitive data. Our diverse data network architecture supports a variety of widely-accepted communications protocols and is accessible through a variety of methods, including dial-up, leased line, wireless and secure Internet connections. We have designed our data network to be scalable and to allow easy adoption of new access technologies. The hardware utilized in our network is installed at 134 points of presence worldwide, 50 of which are in North America. We connect these points of presence with digital circuits leased from multiple telecommunication services providers. In addition, our network control centers allow us to administer our network and enable us to monitor our customers' transactions in real time.
We believe that our network provides the following important benefits to our customers:
Our network is designed specifically to address the data communications needs of our diverse customer base. Our data network supports multiple communications protocols and includes customized hardware, software and value- added features developed by us or by vendors to our specifications. The following is a description of the various protocols we operate within our network:
- •
- IP. Internet protocol, or IP, is a communications
technology that routes outgoing data messages and recognizes incoming data messages. Our secure domestic and international IP infrastructure provides the services offered by our financial services
division, the broadband services offered by our POS division and the LEConnect data services offered by our telecommunication services division. We also use our IP infrastructure for our internal
processes, such as accounting functions and network monitoring and management. We have designed and implemented this with a high level of system redundancy, dynamic routing and sophisticated security
and authorization technologies.
- •
- X.25. X.25 is a communications protocol used to transmit
packets of data. Our domestic and international X.25 protocol transports our customers' POS transactions and is used to provide the validation services offered by our telecommunication services
division. This protocol is designed to provide fast call connection times, a high level of system redundancy, dynamic rerouting, wide geographic coverage and value-added features, at a low cost per
transaction. Customers may access our X.25 infrastructure using various methods, including dial-up services, leased line services, wireless services, satellite services and secure internet
connections.
- •
- SS7. SS7 is a communications protocol used to transmit signaling information to establish and close the transmission path over which a telephone call is routed. Our domestic SS7-based infrastructure sets up, routes and terminates the transactions transmitted through the services offered by our POS division. It also provides the call signaling services and database access services offered by our telecommunication services division. Our SS7 infrastructure is accessed using dedicated SS7 links provided by local exchange carriers and interexchange carriers.
16
Our network is reliable, redundant and secure. We believe we have configured the major components of our network to eliminate any single point of failure. The reliability of our data network is enhanced significantly because we have deployed our network with redundant hardware installed at geographically diverse facilities connected by multiple telecommunications carriers. Our facilities are deployed with battery back-up and emergency generator power systems. We coordinate the physical routing of the digital circuits connecting our facilities with multiple telecommunication service providers to ensure the availability of diverse paths for routing any transaction or data, thereby enhancing network reliability. Due to such physical diversity, minor outages or failures typically do not require the immediate intervention of our technicians. We are able to respond quickly to service problems because the network monitoring, management and troubleshooting systems we use permit our network control centers to correct problems remotely. Our data network contains industry standard firewalls and protections, and security is further enhanced by limiting access. Our network is PCI DSS certified.
Our IP and X.25 protocols incorporate several customized, value-added features that distinguish our services and performance from our competitors. We believe that various value-added features we have developed permit our POS customers accessing our data network through dial-up services to process a greater volume of transactions than other dial-up service providers.
These features include:
- •
- the use of equipment that supports and converts transaction data delivered to our data network in multiple protocols and
message formats into the protocols employed by our data network, thereby eliminating the need for our customers to incur the high costs associated with reprogramming POS terminals and host computers
and performing continuous network enhancements and software upgrades, and
- •
- real-time call tracking, which enables us to quickly resolve host, terminal or network problems experienced by
our customers and to recommend to our customers ways to improve their systems, and
- •
- the ability to convert message protocols within our network, allowing acquiring organizations to bring various transaction
types with various message formats into their processing hosts without having to make costly changes within their own infrastructure, and
- •
- a secure Internet-based transaction monitoring system, which permits our customers to monitor the status of their transactions in real-time using the Internet.
Our network can accommodate growth in our business. Our network is deployed with sufficient capacity to accommodate significant growth in transaction volumes without incurring delays relating to the provisioning and deployment of additional hardware and telecommunications circuits. We have also designed the network so that we may easily increase capacity as necessary.
Our network operations centers continuously monitor and manage our network. We provide 24-hour, seven days a week network control coverage domestically through our network control centers located in Reston, Virginia and Overland Park, Kansas and internationally through our network control centers located in Sheffield, England and Sydney, Australia. Each of these network control centers serves as the backup network control center for the other control center. Our network control centers are staffed with skilled technicians experienced with the services we offer. Our network control centers remotely monitor the components of our data network and manage our network using sophisticated network management tools we have either developed internally or licensed from others.
Customers
As of December 31, 2009, we provided our payment-related services to more than 1,000 customers. In addition, as of December 31, 2009, we provided services to more than 800 telecommunication
17
services providers and more than 625 financial services companies. Historically we have experienced limited customer turnover. We believe this is a result of our strong relationships with our customers and is one of our strengths. Maintaining these relationships is critical to our long-term success.
For the year ended December 31, 2009, we derived approximately 15.7% of our total revenues from our five largest customers. No customer accounted for more than 10% of our total revenues for the year ended December 31, 2009. We typically enter into multi-year service contracts with our customers with minimum commitments. Under some of our contracts, once the customer has met its minimum commitment on an annual or contract term basis, the customer is no longer obligated to purchase services from us. The contracts with our five largest customers contain minimum transaction or revenue commitments on an annual or contract term basis. The contracts with our five largest customers expire from 2010 to 2011.
Sales and Marketing
In 2009, we sold our services directly to customers through geographically dispersed sales teams. In North America, we had a specialized sales team for each of our POS and telecommunication service divisions, and globally we had a specialized sales team for our financial services division. In our international services division, our sales teams were organized geographically with each team responsible for selling all of our services in the country in which the team is based and, in some cases, proximate countries. Our international sales teams are based in Australia, France, Germany, Hong Kong, India, Ireland, Italy, Japan, Poland, Romania, Singapore, South Korea, Spain, Thailand, Turkey, and the United Kingdom. Generally, each sales team includes a managing director or sales manager, account representatives, business development personnel, sales engineers and customer service representatives experienced in the industries of our customers and the services we offer. In connection with our decision to align the Company's business along global industry lines, we currently have global, specialized sales teams for our telecommunication services division, payments division and financial services division.
Our business development groups based in North America and Europe are focused on selling large service-based solutions to our largest customers and prospects. They work closely with the divisional sales teams to provide in-depth industry and solution capabilities to our customers.
Our sales teams work to establish and maintain relationships with customers by identifying a customer's need for our services and promoting our secure, reliable, efficient, competitively priced services. We also pursue opportunities to customize our solutions to meet the requirements of large customers.
When a customer initially purchases services from us, the customer typically purchases some, but not all, of the services we offer. Our sales teams then strive to increase the services purchased by existing customers and to expand the range of services we provide to our customers. Our sales teams consult with our customers to identify the new business-critical services we may provide.
Our global marketing group works with our sales teams around the world and the product group to promote interest in our services and to generate new sales prospects. In addition they ensure that any news associated with the company is distributed in a timely manner to all of the company's stakeholders.
Suppliers
The operation of our networks depends upon the capacity, reliability and security of services provided to us by a limited number of telecommunication service providers. We have no control over the operation, quality or maintenance of those services or whether the vendors will improve their
18
services or continue to provide services that are essential to our business. In addition, telecommunication service providers may increase the prices at which they provide services.
Some key components we use in our networks are available only from a limited number of suppliers. The number of available suppliers of components for our X.25 networks is particularly limited. The Company has entered into long term contracts with two vendors for the provision of network equipment and the maintenance of hardware and software utilized on our network.
Competition
POS division. Our POS division competes on the basis of industry expertise, network service quality and reliability, transaction speed, value-added features, customer support and cost-efficiency. The primary competitors for our POS division's dial-up services are interexchange carriers such as Verizon Business Solutions, an operating unit of Verizon Communications, Inc., AT&T Corp, and Hypercom Corporation. The carriers typically do not aggressively pursue transaction-oriented business as a stand-alone service but rather offer it in conjunction with other products and services. The primary competitors of our POS division's counter-top integration and broadband connectivity services are Cybera, Inc. and broadband access providers such as MegaPath Networks, Inc. The primary competitor of our POS division's wireless services is APRIVA.
Telecommunication services division. Our telecommunication services division competes on the basis of industry expertise, network service quality and reliability, transaction speed, customer support, cost-efficiency and value-added services. The primary competitors of our telecommunication services division include telecommunication carriers such as Verizon Communications, Inc. and AT&T Corp., Syniverse Technologies, Inc., and TARGUSinfo.
Financial services division. Our financial services division competes on the basis of access to multiple financial services companies, security, support services, cost-efficiency and discrete service offerings. The primary competitors of our financial services division are other private communications networks and telecommunications carriers including AT&T Corp. and BT Group PLC, providers of quote terminals and market data services such as Bloomberg, Reuters and Thomson Financial, and other network service providers such as SAVVIS, Inc.
International services division. Our international services division competes on a similar basis as our POS and financial services divisions. Primary competitors of our international services division's POS services are incumbent telephone companies in the geographic location, such as BT Group PLC in the United Kingdom, France Telecom in France, Telecom Italia in Italy, Telefonica in Spain and Telstra in Australia. The primary competitor of our processing services in the United Kingdom is Avantra.
Government Regulation
The Federal Communications Commission, or FCC, retains general regulatory jurisdiction over the sale of interstate telecommunications services. We believe that TNS' services in general are properly characterized as "information" or "enhanced" services rather than "telecommunications services." Providers of information services are not required to maintain a certificate of public convenience and necessity with the FCC, to contribute directly to the Universal Service Fund, to file tariffs with the FCC, or to comply with any of the other FCC regulations applicable to telecommunications carriers. The application of the "information" and "telecommunications" categories to particular services and activities is an evolving standard with no bright lines of demarcation. TNS continues to monitor its businesses to ensure that its services remain properly characterized for regulatory purposes.
Further, the FCC has found information (or enhanced) services to be inherently interstate in nature. In addition, nearly all TNS services cross state boundaries and are thus interstate offerings. Consequently, our services are not subject to state public utility commission regulation.
19
The only "telecommunications service" within our business is provided by our wholly-owned subsidiary, TNS Transline LLC. TNS Transline is subject to regulatory oversight by the FCC due to its provision of interstate telecommunications services. TNS Transline complies with all regulatory registration and payment obligations mandated by the FCC. As a "non-dominant" carrier, however, TNS Transline is not required to file tariffs or submit to other forms of "dominant" carrier regulation. Further, TNS Transline provides exclusively interstate telecommunications services and thus is not subject to state public utility commission regulation of its services. State regulators may regulate purely intrastate telecommunications services and may regulate mixed intrastate/interstate telecommunications services to the extent their regulation does not impede federal policies. We do not believe that we currently are subject to state regulations for our existing services, and we believe that, even if we were subjected to state regulation, we could obtain all necessary approvals.
Even though we provide unregulated services, federal and state regulations can affect the costs of business for us and our competitors by changing the rate structure for access services purchased from local exchange carriers to originate and terminate calls. Under the Telecommunications Act of 1996 ("the 1996 Act"), the FCC implemented rules and regulations known as Access Charge Reform to reform the system of interstate access charges. The FCC's implementation of these rules increased some components of our costs for access while decreasing others. The FCC is currently considering additional rulemaking proceedings concerning this intercarrier compensation scheme, and we currently cannot predict whether any rule changes will be adopted or the impact these rule changes might have on our access charges if they are adopted. Recent and pending decisions of the FCC and state regulatory commissions may limit the availability and increase pricing used by our suppliers to provide telecommunication services to us. We cannot predict whether the rules will change or, if they do, whether the changes will increase the cost or availability of services we purchase from our suppliers.
In connection with the regulated telecommunications services of our subsidiary, TNS Transline, we are required to pay directly into the Federal Universal Service Fund. The monies generated by Federal Universal Service Fund surcharges are used to help provide affordable telecommunication services throughout the country, including to consumers in high-cost areas, low-income consumers, eligible schools and libraries and rural healthcare providers. In addition, the third party telecommunications service suppliers for our information services are obligated to contribute directly to the Federal Universal Service Fund. Our telecommunications service suppliers, in turn, recover the cost of their contribution obligations by imposing surcharges on us and our competitors based upon a percentage of their interstate and international end-user telecommunications revenues. If the Federal Universal Service Fund surcharges increase, our telecommunications service suppliers will pass those increased surcharges on to us. We in turn will pass those potential increased Federal Universal Service Fund surcharges on to our customers to the extent permitted under our contracts with them. The United States Congress and the FCC are considering modifying the way in which Federal Universal Service Fund charges are calculated, including considering whether to assess universal service charges on a flat-fee basis, such as a per-line, per-telephone number or per-account charge. We currently cannot predict whether Congress will mandate or the FCC will adopt changes in the calculation of Federal Universal Service Fund contributions or whether these changes, if adopted, would increase our Federal Universal Service Fund surcharges. If the FCC implements any legislation, adopts any proposal or takes any administrative action that increases our Federal Universal Service Fund surcharges, our network operating costs will increase. In addition, if the FCC implements any legislation, adopts any proposal, or takes any administrative action that increases our supplier's Federal Universal Service Fund obligations, these telecommunications service suppliers may seek to pass through cost-recovery charges to us, which would result in an increase in our cost of network services, an increased cost which the Company may or may not be able to pass on to our customers.
20
Intellectual Property
Our success is dependent in part upon our proprietary technology. We rely principally upon trade secret and copyright law to protect our technology, including our software and network design. We enter into confidentiality or license agreements with our employees, distributors, customers and potential customers and limit access to and distribution of our software, documentation and other proprietary information. We believe, however, that because of the rapid pace of technological change in the data communications industry, the legal protections for our services are less significant factors in our success than the knowledge, ability and experience of our employees and the timeliness and quality of services provided by us.
Employees
As of December 31, 2009, we employed 1,163 persons worldwide, of whom 802 were engaged in systems operation, development and engineering, 199 of whom were engaged in sales and sales support, 153 of whom were engaged in finance and administration and 9 comprised executive management. Of our total employees as of December 31, 2009, 716 were employed domestically and the balance were in other countries, including 232 in the United Kingdom and 119 in Australia. None of our employees are currently represented by a labor union. We have not experienced any work stoppages and consider our relationship with our employees to be good.
Internet Address and Company SEC Filings
Our internet address is www.tnsi.com. On the investor relations portion of our web site, we provide a link to our electronic SEC filings, including our annual report on Form 10-K, our quarterly reports on Form 10-Q, our current reports on Form 8-K and any amendments to these reports. All such filings are available free of charge and are available as soon as reasonably practicable after filing. The reference to our website address does not constitute incorporation by reference of the information contained in the website and such information should not be considered part of this report.
Executive Officers of the Registrant
See Item 10 of this report for information about our executive officers.
We are subject to various risks that could have a negative effect on the Company and its financial condition. You should understand that these risks could cause results to differ materially from those expressed in forward-looking statements contained in this report and in other Company communications. Because there is no way to determine in advance whether, or to what extent, any present uncertainty will ultimately impact our business, you should give equal weight to each of the following.
We derive a substantial portion of our revenue from a small number of customers. If one or more of our top five customers were to cease doing business with us, or to substantially reduce its dealings with us, our revenues and earnings could decline.
For the year ended December 31, 2009, we derived approximately 15.7% of our total revenues from our five largest customers. We expect to continue to depend upon a relatively small number of customers for a significant percentage of our revenues. No customers accounted for more than 10% of revenues for the year ended December 31, 2009. The loss of any of our largest customers or a decision by one of them to purchase our services at a reduced level could negatively impact our revenues, earnings and business.
21
The contracts with our five largest customers contain minimum transaction or revenue commitments on an annual or contract term basis. Upon meeting these commitments, the customers are no longer obligated to purchase services from us and may elect not to make further use of our services. In addition, our customers may elect not to renew their contracts when they expire. Even if contracts are renewed, the renewal terms may be less favorable to us than under the current contracts. The contracts with our five largest customers expire from 2010 to 2011.
We face significant pressure on the prices for our services from our competitors and customers. Our failure to sustain pricing could impair our ability to maintain profitability or positive cash flow.
Our competitors and customers have caused and may continue to cause us to reduce the prices we charge for services. We may not be able to offset the effects of these price reductions by increasing the number of transactions we transport using our networks or by reducing our costs. The primary sources of pricing pressure include:
- •
- Competitors offering our customers services at reduced prices. For example, telecommunications carriers may reduce the
overall cost of their services by bundling their data networking services with other services such as voice communications.
- •
- Payments and telecommunication services customers seeking greater pricing discounts during contract negotiations in
exchange for maintaining or increasing their minimum transaction or revenue commitments.
- •
- Consolidation of existing customers resulting in pricing reductions. For example, one of our customers with relatively lower contract prices may acquire another of our customers, enabling the acquired customer's transactions to receive the benefit of the lower prices. In addition, if an existing customer acquires another customer, the combined transaction volume may qualify for reduced pricing under our contract. Further, consolidation among our customers may cause us to reduce prices in order to avoid losing these customers and their transaction volume.
Our Payments and Telecommunications Services businesses are highly dependent upon our customers' transaction volumes and our ability to expand into new markets.
We already serve most of the largest payment processors in the United States and the United Kingdom. Accordingly, our POS and international services divisions are highly dependent on the number of transactions transmitted by our existing customers through our networks in the United States and the United Kingdom. Factors which may reduce the number of credit and debit card and ATM transactions include economic downturns, acts of war or terrorism and other events that reduce consumer spending. Revenues from our POS division have decreased primarily as a result of a decline in transaction volumes which we attribute to softness in the economy, as well as a decrease in revenue per transaction as a result of negotiated price reductions upon renewal of certain contracts.
We may be unable to increase our business from convenience stores, gas stations, quick service restaurants and other retail services that we have identified as potential sources of future growth for our Payments business in the United States and abroad. Factors that may interfere with our ability to expand further into these areas include:
- •
- market participants' adoption of alternative technologies such as broadband; and
- •
- our potential inability to enter into commercial relationships with additional market participants.
Our Telecommunications Services business is also dependent on our customers' transaction volumes. In the past, consolidation among our Telecommunications Service Division (TSD) customers has caused us to lose transaction volume. In addition, certain of our TSD customers have developed in-house solutions to replace part or all of the services we provide to them. In the future, consolidation
22
among our customers or the decision by existing customers to deploy in-house solutions to replace our services could cause us to lose transaction volume and our revenues to decline.
Our efforts to integrate recent or future acquisitions into our operations could be disruptive, and we may not be able to successfully integrate them on a timely basis. Even if we are able to successfully integrate an acquisition into our operations, we may not realize the anticipated cost saving of the acquisition on the timetable currently contemplated, or at all. Recent or future acquisitions could negatively affect our operating results and could dilute the interests of existing stockholders.
We acquired the Communications Services Group in 2009. Following the acquisition of the Communications Services Group, we have begun to integrate certain networks, systems, and technology platforms. Integrating our operations with the Communications Services Group may prove to be difficult and disruptive, and could result in the combined businesses failing to meet expectations. This integration may take longer or be more difficult than we currently contemplate. Furthermore, we may encounter unanticipated difficulties in the process, which could possibly cause customer disruptions. The measures we have taken to date or plan to take in the future may not adequately resolve these potential problems. If we fail to successfully integrate our networks, systems, and technology platforms, our ability to achieve the cost efficiencies expected to result from this acquisition may be impaired, which may adversely affect our future financial position, results of operations, and customer relationships. Even if we were to successfully integrate our networks, systems, and technology platforms, and the Communications Services Group into our operations, we may not realize the anticipated cost savings or synergies of the acquisition on the timetable currently contemplated, or at all.
In addition, we expect to continue to seek selective acquisitions and investments as an element of our growth strategy. Recent and future acquisitions could subject us to risks including:
- •
- If we are not able to successfully integrate acquired businesses in a timely manner, our operating results may decline. We
also may incur substantial costs, delays or other operational or financial problems during the integration process.
- •
- If we are not able to successfully integrate acquired businesses in a timely manner, our operating results may decline,
particularly in the fiscal quarters immediately following the completion of such transactions while the operations of the acquired entities are being integrated into our operations. We also may incur
substantial costs, delays or other operational or financial problems during the integration process.
- •
- Acquisitions could result in large, immediate write-offs and assumption of contingent liabilities, either of
which could harm our operating results.
- •
- Acquisitions may divert the attention of senior management from our existing business.
- •
- Additional indebtedness incurred to finance acquisitions are likely to increase our interest expense, and new debt
agreements may involve new restrictive covenants that could reduce our flexibility in managing our business.
- •
- If we issue additional equity to finance our acquisitions or investments, it could result in dilution for our existing stockholders.
Our strategy to expand internationally may fail, which may impede our growth and harm our operating results.
As of December 31, 2009, we have yet to generate positive operating cash flows in 6 out of the 22 countries in which we have operations and provide services outside of North America. In addition, we
23
are planning expansion into new and existing international markets. Key challenges we will face in pursuing our international strategy include the need to:
- •
- secure commercial relationships to help establish our presence in international markets,
- •
- obtain telecommunications services from incumbent telecommunication service providers that may compete with us,
- •
- adapt our services to support varying telecommunications protocols that differ from those markets where we have
established operations,
- •
- hire and train personnel capable of marketing, installing and integrating our data communications services, supporting
customers and managing operations in foreign countries,
- •
- localize our products to target the specific needs and preferences of foreign customers, which may differ from our
traditional customer base in the United States and United Kingdom,
- •
- build our brand name and awareness of our services among foreign customers,
- •
- implement new systems, procedures and controls to monitor our operations in new markets, and
- •
- obtain licenses or authorizations that may be required to sell our services internationally.
In addition, we are subject to risks associated with operating in foreign countries, including:
- •
- multiple, changing and often inconsistent enforcement of telecommunications, foreign ownership and other laws and
regulations that could have a direct or indirect adverse impact on our business and market opportunities,
- •
- competition with existing market participants which have a longer history in and greater familiarity with the foreign
markets we enter,
- •
- laws and business practices that favor local competitors,
- •
- fluctuations in currency exchange rates,
- •
- imposition of limitations on conversion of foreign currencies into U.S. dollars or remittance of dividends and other
payments by foreign subsidiaries,
- •
- changes in a specific country's or region's political or economic conditions,
- •
- longer payment cycles for customers in some foreign countries,
- •
- difficulty and expense associated with enforcement of agreements and collection of receivables through legal systems in
some foreign countries, and
- •
- difficulty and expense associated with managing a large organization spread throughout numerous foreign countries.
If we fail to address the challenges and risks associated with international expansion, we may encounter difficulties implementing our strategy, which could impede our growth or harm our operating results.
We conduct business in many international markets with complex and evolving tax rules, which subjects us to international tax compliance risks.
In the year ended December 31, 2007, we updated our transfer pricing policy. While we obtain advice from tax and legal advisors as necessary to help ensure compliance with tax and regulatory matters, most tax jurisdictions in which we operate have complex and subjective rules regarding the valuation of inter-company services, cross-border payments between affiliated companies and the related effects on the taxes to which we are subject, including income tax, value-added tax and transfer
24
tax. From time to time our foreign subsidiaries are subject to tax audits and may be required to pay additional taxes, interest or penalties should the taxing authority assert different interpretations, or different allocations or valuations of our services. There is a risk, if one or more taxing authorities significantly disagrees with our interpretations, allocations or valuations, that any additional taxes, interest or penalties which may result could be material and could reduce our income and cash flow from our international services division.
Our customers may develop in-house networks and divert part or all of their data communications from our network to their networks.
As a payment processor's business grows larger and generates a greater number of credit card and debit card transactions, it could become economically advantageous for the processor to develop its own network for transmitting transaction data, including credit card and debit card transactions. Currently, some of the largest processors and some very large merchants globally, such as supermarkets, department stores and major discount stores, operate their own networks to transmit some or all of their transactions. Also, as the number of outsourced providers of network services has decreased, payment processors and large merchants have developed, and may continue to seek to develop, their own networks in order to maintain multiple sources of supply. In addition, our telecommunication services division customers may elect to connect their call signaling networks directly to the call signaling networks of other telecommunications carriers, thus decreasing their need for our services. As a result of any of these events, we could experience lower revenues.
System failures or slowdowns, security breaches and other problems could harm our reputation and business, cause us to lose customers and revenue, and expose us to customer liability.
Our business is based upon our ability to securely, rapidly and reliably receive and transmit data through our networks. One or more of our networks could slow down significantly or fail, or be breached, for a variety of reasons, including:
- •
- failure of third party equipment, software or services utilized by us,
- •
- undetected defects or errors in our software programs, especially when first integrated into a network,
- •
- unexpected problems encountered when integrating changes, enhancements or upgrades of third party equipment or software
with our systems,
- •
- computer viruses,
- •
- natural or man-made disasters disrupting power or telecommunications systems generally, and
- •
- damage to, or failure of, our systems due to human error or intentional disruption such as physical or electronic break-in, sabotage, acts of vandalism and similar events.
We may not have sufficient redundant systems or backup telecommunications facilities to allow us to receive and transmit data in the event of significant system failures. Any significant security breach degradation or failure of one or more of the networks on which we rely, including the networks of our vendors and customers could disrupt the operation of our network and cause our customers to suffer delays in transaction processing, which could damage our reputation, increase our service costs, or cause us to lose customers and revenues.
Our customers' inability to successfully implement our services could negatively impact our business.
Significant technological challenges can arise for our customers when they implement our services. Our customers' ability to support the deployment of our services and integrate them successfully within their operations depends, in part, on our customers' technological capabilities and the level of
25
technological complexity involved. Difficulty in deploying our services could increase our customer service support costs, delay the recognition of revenues received until the services are implemented and reduce our operating margins.
Our capacity limits on current network and application platforms may be difficult to manage and project, and we may not be able to expand or upgrade our systems to meet increased demand or use.
As customers' usage of our services increase, we will need to expand our network and application platforms. We may not be able to accurately project the rate of increase in usage of our services. In addition, we may not be able to expand and upgrade our systems, networks, and application platforms in a timely manner to accommodate increased usage of our services. If we do not timely and appropriately expand and upgrade our systems, networks, application platforms, we may limit our ability to add new customers or lose customers and our operating performance may suffer.
Our dependence on third-party providers for network equipment, network connectivity, software, hardware, and hosting or co-location services exposes us to a variety of risks we cannot control.
To deliver our services successfully, we depend on network equipment, network connectivity, software, hardware, and hosting or co-location services supplied by our vendors and customers. We cannot assure that we be able to continue to purchase all of these necessary components of our services from these third-party vendors on acceptable terms or at all. Our third-party vendors have increased and in the future may increase the prices charged for their services, which have increased and would further increase our costs.
Our business also depends on the capacity, reliability and security of the network infrastructure owned and managed by third parties, including our vendors and customers. Our payments services, telecommunication services, and financial services, including technology interoperability services, payment processing services, network services, database services, call signaling and roaming and clearing services, all depend to some extent on the capacity, reliability and security of the infrastructure of third parties. We have no control over the operation, quality, or maintenance of a significant portion of that infrastructure and whether these third parties will upgrade or improve their equipment, software and services to meet our and our customers' evolving requirements. We depend on these companies to maintain the operational integrity of our services. If one or more of these companies is unable or unwilling to supply or expand its levels of services to us in the future, our operations and customer services could be negatively impacted or severely interrupted.
We depend on a limited number of network equipment suppliers and do not have supply contracts. Our inability to obtain necessary network equipment or technical support could harm our business.
Some key components we use in our networks are available only from a limited number of suppliers. The number of available suppliers of components and technical support for our X.25 networks are particularly limited. We do not have long-term supply contracts with these or any other limited source vendors, and we purchase data network equipment on a purchase order basis. If we are unable to obtain sufficient quantities of limited source equipment and required technical support, or to develop alternate sources as required in the future, our ability to deploy equipment in our networks could be delayed or reduced, or we may be forced to pay higher prices for our network components. Delays or reductions in supplies could lead to slowdowns or failures of our networks.
We may experience fluctuations in quarterly results because of the seasonal nature of our business and other factors outside of our control, which could cause the market price of our common stock to decline.
Credit card and debit card transactions account for a major percentage of the transaction volume processed by our customers. The volume of these transactions on our networks generally is greater in
26
the fourth quarter holiday season than during the rest of the year. Consequently, revenues and earnings from credit card and debit card transactions in the first quarter generally are lower than revenues and earnings from credit card and debit card transactions in the fourth quarter of the immediately preceding year. We expect that our operating results in the foreseeable future will be significantly affected by seasonal trends in the credit card and debit card transaction market.
In addition, a variety of other factors may cause our results to fluctuate from one quarter to the next, including:
- •
- varying costs incurred for network expansion,
- •
- the impact of quarterly variations in general economic conditions,
- •
- acquisitions made or customers acquired or lost during the quarter,
- •
- changes in pricing policy by us, our competitors and our third party supplier and service providers during a particular
quarter, and
- •
- foreign currency translation rates, in particular the British pound, Euro and Australian dollar.
We may not be able to adapt to changing technology and our customers' technology needs.
We face rapidly changing technology and frequent new service offerings by competitors that can render existing services obsolete or unmarketable. Our future success depends on our ability to enhance existing services and to develop, introduce and market, on a timely and cost effective basis, new services that keep pace with technological developments and customer requirements.
We may be unable to protect our proprietary technology, which would allow competitors to duplicate our services. This would make it more difficult for us to compete with them.
We may not be able to protect sufficiently our proprietary technology, which could make it easier for competitors to develop services that compete with our services. We rely principally on copyright and trade secret laws and contractual provisions to protect our proprietary technology. The laws of some countries in which we sell our services and products may not protect software and intellectual property rights to the same extent as the laws of the United States. If these measures do not adequately prevent misappropriation of our technology, competitors may be able to use and adapt our technology. Our failure to protect our technology could diminish our competitive advantage and cause us to lose customers to competitors.
We may face claims of infringement of proprietary rights, which could harm our business and operating results.
Third parties may assert claims that we are infringing their proprietary rights. If infringement claims are asserted against us, we could incur significant costs in defending those claims. We may be required to discontinue using and selling any infringing technology and services, to expend resources to develop non-infringing technology or to purchase licenses or pay royalties for other technology. We may be unable to acquire licenses for the other technology on reasonable commercial terms or at all. As a result, we may find that we are unable to continue to offer the services and products upon which our business depends.
We may not have adequate resources to meet demands resulting from growth.
Growth may strain our management systems and resources. We may need to make additional investments in the following areas:
- •
- recruitment and training,
27
- •
- communications and information systems,
- •
- sales and marketing,
- •
- facilities and other infrastructure,
- •
- treasury and accounting functions,
- •
- licensing and acquisition of technology and rights, and
- •
- employee and customer relations and management.
If we fail to develop systems, procedures and controls to handle current and future growth on a timely basis, we may be less efficient in the management of our business or encounter difficulties implementing our strategy, either of which could harm our results of operations.
We may lack the capital required to maintain our competitive position or to sustain our growth.
We have historically relied on cash flow from operations and proceeds from equity and debt to fund our operations, capital expenditures and expansion. If we are unable to obtain sufficient capital in the future, we may face the following risks:
- •
- We may not be able to continue to meet customer demand for service quality, availability and competitive pricing.
- •
- We may not be able to expand rapidly internationally or to acquire complementary businesses.
- •
- We may not be able to develop new services or otherwise respond to changing business conditions or unanticipated competitive pressures.
Our level of debt could adversely affect our financial health.
As of December 31, 2009, we had $374.4 million in debt outstanding
This level of debt could have important consequences. Below, we have identified some of the material potential consequences resulting from this debt:
- •
- A significant portion of our cash flow from operations must be dedicated to the repayment or servicing of indebtedness, thereby reducing the amount of cash we have available for other purposes, including reinvestment in the company.
28
- •
- We may be unable to obtain additional financing for working capital, capital expenditures, acquisitions and general
corporate purposes.
- •
- Our ability to adjust to changing market conditions may be hampered.
- •
- We may be at a competitive disadvantage compared to our less leveraged competitors.
- •
- We may be vulnerable to the impact of adverse economic and industry conditions and, to the extent of our outstanding debt under our senior secured credit facility, the impact of increases in interest rates.
We cannot assure you that we will continue to generate sufficient cash flow or that we will be able to borrow funds under our senior secured credit facility in amounts sufficient to enable us to service our debt, or meet our working capital and capital expenditure requirements. We must satisfy borrowing base restrictions in order to borrow additional amounts under our November 2009 Credit Facility. If we are not able to generate sufficient cash flow from operations or to borrow sufficient funds to service our debt, due to borrowing base restrictions or otherwise, we may be required to sell assets, reduce capital expenditures, refinance all or a portion of our existing debt, or obtain additional financing. We cannot assure you that we will be able to refinance our debt, sell assets or borrow more money on terms acceptable to us, if at all.
If we do not compete effectively, we may lose market share to competitors and suffer a decline in revenues.
Many of our competitors have greater financial, technical, marketing and other resources than us. As a result, they may be able to support lower pricing and margins and to devote greater resources to marketing their current and new products and services.
We face competition in each of our four divisions as follows:
- •
- The primary competitors of our POS division are APRIVA, AT&T Corp., Cybera, Inc., Hypercom Corporation, and Verizon
Business Solutions, an operating unit of Verizon Communications, Inc.
- •
- The primary competitors of our telecommunication services division include telecommunication carriers such as Verizon
Communications, Inc. and AT&T Corp., Syniverse Technologies, Inc., and TARGUSinfo.
- •
- The primary competitors of our financial services division include AT&T Corp., BT Group PLC, Bloomberg, Reuters and
The Thomson Corporation (Thomson Financial).
- •
- The primary competitors of our international services division include BT Group PLC and Avantra in the United Kingdom, France Telecom in France, Telecom Italia in Italy, Telefonica in Spain and Telstra in Australia.
We depend on key personnel.
Our success depends largely on the ability and experience of a number of key employees, including Henry H. Graham, Jr., our Chief Executive Officer, and Michael Q. Keegan, our Chief Operating Officer. If we lose the services of any of our key employees, our business may be adversely affected.
Our stock price may be volatile.
The trading price of our common stock could be subject to wide fluctuations in response to various factors, some of which are beyond our control, such as:
- •
- actual or anticipated variations in quarterly results of operations;
29
- •
- fluctuations in foreign exchange rates for the currencies of countries in which we have operations;
- •
- announcements of technological innovations;
- •
- pricing by us or our competitors;
- •
- changes in financial estimates by securities analysts;
- •
- announcements of significant acquisitions, strategic partnerships, joint ventures or capital commitments by us or our
customers or competitors;
- •
- additions or departures of key personnel; and
- •
- generally adverse market conditions.
Regulatory changes may increase our costs or impair our growth.
Federal and state regulations can affect the costs of business for us and our competitors by changing the rate structure for access services purchased from local exchange carriers to originate and terminate calls, by restricting access to dedicated connections available from local exchange carriers, by changing the basis for computation of other charges, such as universal service charges, or by revising the basis for taxing the services we purchase or provide. The Federal Communications Commission ("FCC") is currently considering changes to the rate structure for services provided by local exchange carriers, including the rate structure for access services, and we currently cannot predict whether these rule changes will be adopted or the impact these rule changes may have on our charges for access and other services if they are adopted.
Recent and pending decisions of the FCC may limit the availability and increase pricing of network elements used by our suppliers to provide telecommunications services to us. We cannot predict whether these rule changes will increase the cost of services we purchase from our suppliers. Further, the United States Congress and the FCC is considering modifying the way in which Federal Universal Service Fund charges are calculated, including considering whether to assess universal service charges on a flat-fee basis, such as a per-line, per-telephone number or per-account charge. We currently cannot predict whether Congress will mandate or the FCC will adopt changes in the calculation of Federal Universal Service Fund contributions or whether these changes, if adopted, would increase our Federal Universal Service Fund surcharges. If the FCC implements any legislation, adopts any proposal or takes any administrative action that increases our Federal Universal Service Fund surcharges, our network operating costs will increase. In addition, if the FCC implements any legislation, adopts any proposal, or takes any administrative action that increases our telecommunications service supplier's Universal Service Fund obligations, these suppliers may seek to pass through cost-recovery charges to us. We in turn will pass those potential increased Federal Universal Service Fund surcharges on to our customers to the extent permitted under our contracts with them. An increase in the Federal Universal Service Fund surcharges that we are required to pay would result in an increase in our cost of network services, a cost which the Company may or may not be able to pass on to our customers.
The business of our telecommunication services division customers is or may become subject to regulation that indirectly affects our business. Many of our telecommunication services division customers are subject to federal and state regulations applicable to the telecommunications industry. Changes in these regulations could cause our customers to alter or decrease the services they purchase from us.
In addition, the payment processing industry in which our POS and international services divisions operate may become subject to regulation as a result of recent data security breaches that have exposed consumer data to potential fraud. To the extent this occurs, our POS and international services division customers could impose on us additional technical, contractual or other requirements as a condition to
30
continuing to do business with them. These requirements could cause us to incur additional costs, which could be significant, or to lose revenues to the extent we do not comply with these requirements.
We cannot predict when, or upon what terms and conditions, further regulation or deregulation might occur or the effect future regulation or deregulation may have on our business. Our operating costs may be increased because our service providers and several services that we offer may be indirectly affected by federal and state regulations. In addition, future services we may provide could become subject to direct regulation.
We face risks related to securities litigation that could have a material adverse effect on our business, financial position and results of operations.
In the past we have been named as a defendant in a securities class action lawsuit. We are generally obliged, to the extent permitted by law, to indemnify our current and former directors and officers who are named as defendants in lawsuits. Defending against existing and potential securities litigation may divert financial and management resources that would otherwise be used to benefit our operations. Regardless of the outcome, securities litigation can result in significant legal expenses. A materially adverse resolution of a securities lawsuit could have a material adverse affect on our business, financial position and results of operations
We face risks related to movements in foreign exchange rates that could have a material adverse effect on our business, financial position and results of operations.
Our revenues and earnings are affected by fluctuations in the value of the U.S. dollar as compared with foreign currencies, predominantly the Euro, the British Pound and the Australian dollar as the functional currency of each of our foreign subsidiaries is the local currency. To the extent that the U.S. dollar continues to appreciate in value against these currencies, the reported value of our revenues, earnings and financial position may be materially adversely affected.
Due to uncertainties associated with the future performance of acquired businesses and assets, we may not realize the full fair value of associated intangible assets and goodwill. Our financial results may be adversely affected if we have to write-off a material portion of our intangible assets or goodwill.
As a result of our acquisitions, a significant portion of our total assets consists of intangible assets including goodwill. Goodwill and intangible assets, net of amortization, together accounted for approximately 47% of the total assets on our balance sheet as of December 31, 2009. We may not realize the full fair value of our intangible assets and goodwill. We also expect to engage in additional acquisitions, which may result in our recognition of additional intangible assets and goodwill. Under current accounting standards, we are able to amortize certain intangible assets over the useful life of the asset, while goodwill is not amortized. We evaluate on a regular basis whether all or a portion of our goodwill intangible assets may be impaired. Under current accounting rules, any determination that impairment has occurred would require us to write-off the impaired portion of goodwill and such intangible assets, resulting in a charge to our earnings. Such a write-off could adversely affect our financial condition and results of operations.
The current national and world-wide financial crisis could adversely affect our operating results and stock price in a material manner.
General world-wide economic conditions have recently deteriorated due to credit conditions resulting from the recent financial crisis affecting the banking system and financial markets, slower economic activity, concerns about inflation and deflation, volatility in energy costs, decreased consumer confidence, reduced corporate profits and capital spending, adverse business conditions and liquidity concerns in the wireless communications markets. These conditions make it difficult for our customers,
31
our vendors and us to accurately forecast and plan future business activities, and they could cause U.S. and foreign businesses to further slow spending on our services. Furthermore, during challenging economic times such as the current downturn, our customers may face issues gaining timely access to sufficient credit, which could impair their ability to make timely payments to us. If that were to occur, we may be required to increase our allowance for doubtful accounts and our accounts receivable outstanding would be negatively impacted. The current economic downturn and any future downturn may reduce our revenue or our percentage of revenue growth on a quarter-to-quarter basis. We cannot predict the timing, strength or duration of any economic slowdown or subsequent economic recovery, world-wide, or in the telecommunications industry or the wireless communications markets. If the economy or the markets in which we operate do not improve from their current condition or if they continue to deteriorate, our customers or potential customers could continue to reduce or further delay their use of our services, which would adversely impact our revenues and ultimately our profitability. In addition, we may record additional charges related to the restructuring of our business and the impairment of our goodwill and other long-lived assets, and our business, financial condition and results of operations will likely be materially and adversely affected.
Item 1B. Unresolved Staff Comments
None
Our principal executive offices are located in Reston, Virginia and consist of approximately 46,157 square feet of office space under a lease expiring in February 2013. Our primary network control center is also located in Reston, Virginia and consists of approximately 44,500 square feet of separate office space under a lease expiring in June 2013. In addition, we lease the following additional principal facilities:
Use
|
Location | Approximate square footage |
Lease expiration date |
||||
|---|---|---|---|---|---|---|---|
European technology and finance center |
Dublin, Ireland | 14,500 | January 2022 | ||||
United Kingdom headquarters and network control centre |
Sheffield, England | 16,000 | April 2015 | ||||
United Kingdom processing centre |
Welwyn Garden City, England | 21,680 | June 2012 | ||||
TSD Operations and Engineering |
Overland Park, Kansas | 39,200 | December 2010 | ||||
TSD Sales and Development |
Tampa, Florida | 12,558 | December 2013 | ||||
We also lease and occupy regional sales offices in various cities. We house our remote network switching equipment in facilities owned and maintained by some of our digital telecommunications circuit providers and also in leased telecommunications point-of-presence facilities located in various cities. These leases total approximately 50,792 square feet and expire on dates ranging from September 2011 to June 2018. We believe that our existing facilities are adequate to meet current requirements and that suitable additional space will be available as needed to accommodate the expansion of our operations and development.
In addition, we also own approximately 67,500 square feet of office space in Lacey, Washington, which is being used for TSD Operations and Development. This property was acquired through our acquisition of the Communication Services Group from VeriSign, Inc. on May 1, 2009.
We are from time to time a party to other legal proceedings, which arise in the normal course of business. We are not currently involved in any material litigation the outcome of which could, in management's judgment based on information currently available, have a material adverse effect on our results of operations or financial condition. Management is not aware of any material litigation threatened against us.
32
Item 4. Market for Registrant's Common Equity, Related Stockholder Matters and Issuer Purchases of Equity Securities
Our common stock trades on The New York Stock Exchange ("NYSE") under the symbol "TNS". The following tables reflect the range of high and low sale prices for the period indicated as reported by the NYSE.
Fiscal Year Ended December 31, 2008
|
HIGH | LOW | |||||
|---|---|---|---|---|---|---|---|
First quarter ended March 31, 2008 |
$ | 21.79 | $ | 14.98 | |||
Second quarter ended June 30, 2008 |
$ | 25.39 | $ | 20.43 | |||
Third quarter ended September 30, 2008 |
$ | 24.98 | $ | 18.80 | |||
Fourth quarter ended December 31, 2008 |
$ | 19.21 | $ | 6.23 | |||
Fiscal Year Ended December 31, 2009
|
HIGH | LOW | |||||
|---|---|---|---|---|---|---|---|
First quarter ended March 31, 2009 |
$ | 10.62 | $ | 5.80 | |||
Second quarter ended June 30, 2009 |
$ | 19.81 | $ | 8.68 | |||
Third quarter ended September 30, 2009 |
$ | 28.51 | $ | 18.16 | |||
Fourth quarter ended December 31, 2009 |
$ | 31.35 | $ | 23.82 | |||
As of March 12, 2010, there were 46 stockholders of record of our common stock, excluding shares held in street name by various brokerage firms. We estimate that there are approximately 3,000 beneficial owners of our common stock.
On March 28, 2007, our board of directors declared a special cash dividend of $4.00 per common share which was paid on April 12, 2007. With the exception of this dividend, we have never declared or paid any cash dividends, regular or special, on our common stock. We do not anticipate paying any regular cash dividends in the foreseeable future. Under our senior secured credit agreement, we are subject to restrictions on paying dividends.
During the period covered by this report, we did not sell any equity securities without registration under the Securities Act.
Issuer Purchases of Equity Securities
| |
Total Number of Shares Purchased(1) |
Average Price Paid per Share |
Total Number of Shares Purchased as Part of Publicly Announced Plans or Programs |
Maximum Number of Shares that May Yet be Purchased Under the Plans or Programs |
|||||||||
|---|---|---|---|---|---|---|---|---|---|---|---|---|---|
Period: |
|||||||||||||
1/1/09–1/31/09 |
28,989 | $ | 9.22 | — | — | ||||||||
2/1/09–2/28/09 |
18,673 | $ | 7.12 | — | — | ||||||||
3/1/09–3/31/09 |
28,715 | $ | 6.62 | — | — | ||||||||
4/1/09–4/30/09 |
322 | $ | 16.86 | — | — | ||||||||
5/1/09–5/31/09 |
13,607 | $ | 17.27 | — | — | ||||||||
7/1/09–7/31/09 |
13,215 | $ | 22.22 | — | — | ||||||||
8/1/09–8/31/09 |
14,606 | $ | 22.83 | — | — | ||||||||
10/1/09–10/31/09 |
14,769 | $ | 27.28 | — | — | ||||||||
|
132,896 | $ | 14.00 | — | — | ||||||||
- (1)
- These shares represent shares surrendered by employees to satisfy payroll tax withholding obligations on the vesting of Restricted Stock Units. Neither we nor any affiliated purchaser (as that term is defined in Securities Exchange Rule 10b-18(a)(3)) made any other repurchases of our shares during the year ended December 31, 2009.
33
Item 5. Selected Consolidated Financial Data
The following selected consolidated financial data should be read in conjunction with "Management's Discussion and Analysis of Financial Condition and Results of Operations" and our consolidated financial statements and related notes included elsewhere in this report. The consolidated statement of operations data for the years ended December 31, 2007, 2008 and 2009, and the consolidated balance sheet data as of December 31, 2008 and 2009, are derived from our consolidated financial statements, which are included elsewhere in this report. The consolidated statement of operations data for the years ended December 31, 2005 and 2006, and the balance sheet data as of December 31, 2005, 2006, and 2007 are derived from our consolidated financial statements, which are not included in this report.
The historical results are not necessarily indicative of the results to be expected for any future period.
34
Selected Consolidated Financial Data
(In thousands, except per share and transaction data)
| |
Year ended December 31, | |||||||||||||||
|---|---|---|---|---|---|---|---|---|---|---|---|---|---|---|---|---|
| |
2005 | 2006 | 2007 | 2008 | 2009 | |||||||||||
Consolidated Statements of Operations Data: |
||||||||||||||||
Revenues |
$ | 258,940 | $ | 286,160 | $ | 325,524 | $ | 343,991 | $ | 474,817 | ||||||
Cost of network services |
121,682 | 146,181 | 163,559 | 162,423 | 224,497 | |||||||||||
Engineering and development |
15,521 | 22,287 | 27,626 | 29,149 | 36,268 | |||||||||||
Selling, general and administrative |
55,245 | 71,757 | 75,287 | 78,104 | 100,588 | |||||||||||
Depreciation and amortization of property and equipment |
18,972 | 22,208 | 23,114 | 25,286 | 32,247 | |||||||||||
Amortization of intangible assets |
22,773 | 24,820 | 25,656 | 25,734 | 32,353 | |||||||||||
Total operating expenses(1) |
234,193 | 287,153 | 315,242 | 320,696 | 425,953 | |||||||||||
Income (loss) from operations before income taxes, equity in net loss of unconsolidated affiliates and cumulative effect of a change in accounting principle |
24,747 | (993 | ) | 10,322 | 23,295 | 48,864 | ||||||||||
Interest expense |
(9,052 | ) | (9,261 | ) | (16,655 | ) | (10,868 | ) | (58,553 | ) | ||||||
Interest income |
674 | 598 | 1,105 | 707 | 497 | |||||||||||
Other (expense) income, net |
(699 | ) | 2,197 | 2,356 | (241 | ) | 471 | |||||||||
Income tax (provision) benefit |
(7,218 | ) | 2,665 | (586 | ) | (9,213 | ) | 6,777 | ||||||||
Equity in net (loss) income of unconsolidated affiliates |
(2,686 | ) | (5,186 | ) | 643 | (202 | ) | (115 | ) | |||||||
Cumulative effect of a change in accounting principle, net of tax provision |
— | 84 | — | — | — | |||||||||||
Net income (loss) |
5,766 | (9,896 | ) | (2,815 | ) | 3,478 | (2,059 | ) | ||||||||
Per Share Information: |
||||||||||||||||
Basic net income (loss) per common share |
$ | 0.24 | $ | (0.41 | ) | $ | (0.12 | ) | $ | 0.14 | $ | (0.08 | ) | |||
Diluted net income (loss) per common share |
$ | 0.23 | $ | (0.41 | ) | $ | (0.12 | ) | $ | 0.14 | $ | (0.08 | ) | |||
Basic weighted average common shares outstanding |
24,519 | 24,076 | 24,204 | 24,763 | 25,403 | |||||||||||
Diluted weighted average common shares outstanding |
24,767 | 24,076 | 24,204 | 25,196 | 25,403 | |||||||||||
| |
December 31, | |||||||||||||||
|---|---|---|---|---|---|---|---|---|---|---|---|---|---|---|---|---|
| |
2005 | 2006 | 2007 | 2008 | 2009 | |||||||||||
Consolidated Balance Sheet Data: |
||||||||||||||||
Cash and cash equivalents |
$ | 26,628 | $ | 17,322 | $ | 17,805 | $ | 38,851 | $ | 32,480 | ||||||
Working capital |
33,114 | 31,829 | 32,844 | 49,438 | 44,099 | |||||||||||
Total assets |
352,184 | 381,677 | 383,098 | 363,284 | 603,177 | |||||||||||
Total debt, including current portion and net of discount |
113,448 | 123,313 | 205,500 | 178,500 | 369,713 | |||||||||||
Total stockholders' equity |
177,846 | 179,265 | 92,272 | 102,815 | 121,340 | |||||||||||
- (1)
- On January 1, 2006, we adopted FASB ASC 718; Compensation-Stock Compensation. As a result, compensation expense is recorded for all share-based payments in our operating expenses.
35
Item 6. Management's Discussion and Analysis of Financial Condition and Results of Operations
Overview
We are an international data communications company which provides networking, data communications and value added services to many of the world's leading retailers, banks and payment processors. We are also a leading provider of secure data and voice network services to the global financial services industry. We operate the largest unaffiliated Signaling System No. 7 network in the United States capable of providing services nationwide, and we utilize this network to provide call signaling and database access services to the domestic telecommunications industry. We also provide roaming and clearing services to both domestic and international mobile phone operators. Our data communications services enable secure and reliable transmission of time-sensitive, transaction-related information critical to our customers' operations. Our customers outsource their data communications requirements to us because of our substantial expertise, comprehensive customer support and cost-effective services. We provide services to customers in the United States and increasingly to international customers in over 40 countries, including Canada and Mexico and countries in Europe, Latin America and the Asia-Pacific region.
We provide services through our data network, which is designed specifically for transaction oriented applications. Our network supports a variety of widely accepted communications protocols and is designed to be scalable and accessible by multiple methods, including dial-up, dedicated, wireless, fixed broadband and internet connections.
During the year ended December 31, 2009, we reported revenues from four business divisions:
- •
- POS
services. We currently provide fast, secure and reliable data communications services primarily to payment processors in North America.
POS services revenue is derived primarily from per transaction fees paid by our customers for the transmission of transaction data through our networks between payment processors and POS or ATM
terminals.
- •
- Telecommunication
services. We provide call signaling services that enable telecommunications service providers to establish and terminate telephone calls
placed by their subscribers. We also provide database access services that enable our customers to provide intelligent network services, such as caller identification, toll-free call
routing and local number portability, and validation services, such as credit card, calling card, third-party billing and collect calling. In addition, we provide roaming and clearing services to
mobile phone operators. Our telecommunication services division generates revenues primarily from fixed monthly fees charged for our call signaling services and per-message fees charged
for our database access, roaming and clearing and validation services.
- •
- Financial
services. We provide fast, secure and reliable private data networking services that enable seamless communications and facilitate
electronic trading among commercial banks, mutual funds, pension funds, broker-dealers, alternative trading systems, electronic communications networks, securities and commodities exchanges and other
market participants. Our network supports multiple communications protocols including the Financial Information eXchange, or FIX, protocol. Our financial services division generates revenues from
monthly recurring fees based on the number of customer connections to and through our networks.
- •
- International services. We sell our POS and financial services through our international services division. We are one of the leading providers of data communications services to the POS industry in the United Kingdom. Our international services division also provides POS and financial services in Australia, Austria, Belgium, Bermuda, Finland, France, Gibraltar, Germany, Greece, Hong Kong, India, Ireland, Italy, Japan, Malaysia, the Netherlands, New Zealand, Norway, Poland, Romania, Singapore, South Korea, Spain, Sweden, Taiwan, Thailand and Turkey.
36
In connection with a reorganization of our divisional management team structure, we will begin to report revenues in three business divisions beginning with the three month period ending March 31, 2010. The three business divisions will be the telecommunication services division, the payments division and the financial services division. We will no longer separately report international services as a division. The following table provides the revenue breakout in both the historical business divisions and the new divisional structure (in thousands):
SEGMENT TABLE
| |
Year ended December 31, | |||||||||
|---|---|---|---|---|---|---|---|---|---|---|
| |
2007 | 2008 | 2009 | |||||||
Historical business divisions |
||||||||||
Point of sale division |
$ | 81,243 | $ | 74,450 | $ | 76,057 | ||||
Telecommunication services division |
64,469 | 67,131 | 212,744 | |||||||
Financial services division |
40,917 | 45,874 | 47,749 | |||||||
International services division(1) |
138,935 | 156,536 | 138,267 | |||||||
|
$ | 325,564 | $ | 343,991 | $ | 474,817 | ||||
Revised business divisions |
||||||||||
Payments division |
$ | 206,593 | $ | 213,237 | $ | 196,836 | ||||
Telecommunication services division |
64,469 | 67,131 | 212,744 | |||||||
Financial services division |
54,502 | 63,623 | 65,237 | |||||||
|
$ | 325,564 | $ | 343,991 | $ | 474,817 | ||||
- (1)
- International services division
Payments revenue |
$ | 125,350 | $ | 138,787 | $ | 120,779 | ||||||
Financial services revenue |
13,585 | 17,749 | 17,488 | |||||||||
|
$ | 138,935 | $ | 156,536 | $ | 138,267 | ||||||
Our most significant expense is cost of network services, which is comprised primarily of telecommunications charges, including data transmission and database access, leased digital capacity charges, circuit installation charges, activation charges, and compensation paid to providers of calling name and line information database records. The cost of data transmission is based on a contract or tariff rate per minute of usage in addition to a prescribed rate per transaction for some vendors. The costs of database access, circuits, installation charges and activation charges are based on fixed fee contracts with local exchange carriers and interexchange carriers. The compensation charges paid to providers of calling name and line information database records are based on a percentage of query revenue generated from our customers accessing those records. The cost of network services also includes salaries, equipment maintenance and other costs related to the ongoing operation of our data networks. Depreciation expense on our network equipment and amortization of developed technology are excluded from our cost of network services and included in depreciation and amortization of property and equipment and amortization of intangible assets in our consolidated statements of operations.
Our engineering and development expenses include salaries and other costs related to product development, engineering, hardware maintenance and materials. The majority of these costs are expensed as incurred, including costs related to the development of internal use software in the preliminary project, the post-implementation and operation stages. Development costs we incur during
37
the software application development stage are capitalized and amortized over the estimated useful life of the developed software.
Our selling, general and administrative expenses include costs related to sales, marketing, administrative and management personnel, as well as external legal, accounting and consulting services.
Dividend and Recapitalization
On March 28, 2007, our board of directors declared a special dividend of $4.00 per common share which was paid on April 12, 2007. Also, on March 28, 2007, we entered into a secured credit facility (2007 Credit Facility), which consisted of two facilities: a senior secured term loan facility in an aggregate principal amount of $225 million and a senior secured revolving credit facility in an aggregate principal amount of $15 million. We used approximately $98.3 million of the proceeds from the term facility to pay the special dividend. The remainder of the proceeds from the term facility were used to refinance existing debt, to pay fees related to the 2007 Credit Facility and the special dividend and for general corporate purposes.
Acquisition of the Communications Services Group (CSG)
On March 2, 2009, we entered into an asset purchase agreement with VeriSign, Inc. pursuant to which we agreed to purchase from Verisign, Inc. certain assets and assume certain liabilities of CSG. On May 1, 2009, we completed the acquisition in accordance with the terms and conditions of the asset purchase agreement. The initial purchase price was approximately $226.2 million in cash and was subject to a post-closing working capital adjustment. During the third quarter of 2009 and fourth quarter of 2009, working capital and other adjustments were negotiated resulting in a $4.5 million increase in the purchase price to $230.7 million. We funded the transaction through a new $230.0 million term loan facility as part of the May 2009 Credit Facility. CSG provides call signaling services, intelligent database services such as caller ID, toll-free call routing and local number portability to the U.S. telecommunications industry. In addition, CSG provides wireless roaming and clearing services to mobile phone operators. We are integrating CSG into our telecommunication services division. Our statement of operations for the year ended December 31, 2009 includes the results of CSG from May 1, 2009 and is therefore not comparable to the year-ago period. Please refer to our amended Current Report on Form 8-K/A filed with the SEC on July 15, 2009 for more detail on the historical and pro-forma results of CSG and Note 3 to the consolidated financial statements included elsewhere in this report.
On May 1, 2009, we entered into a $423.5 million amended and restated senior secured credit facility (May 2009 Credit Facility) to finance the acquisition of the CSG assets from VeriSign, Inc. and to refinance the 2007 Credit Facility. The May 2009 Credit Facility consisted of a fully funded term loan facility with an outstanding principal amount equal to $178.5 million, a new fully funded term loan facility with an outstanding principal amount equal to $230.0 million, and a senior secured revolving credit facility in an aggregate principal amount of $15.0 million. Interest on the outstanding balances under the term loan facilities was payable, at our option, at a rate equal to the higher of the prime rate announced by Suntrust Bank, the federal funds rate plus 50 basis points, or the one-month London Interbank Offered Rate ("LIBOR") plus 100 basis points (the "Base Rate"), plus in each case a margin of 5.0%, or at LIBOR plus a margin of 6.0%. Interest on the outstanding balances under the senior secured revolving credit facility were payable, at our option, at the Base Rate plus a margin of 5.0%, or at LIBOR plus a margin of 6.0%. Additionally, in no event would the LIBOR rate be less than 3.5%. In connection with the closing of the May 2009 Credit Facility, we wrote off approximately $1.7 million in unamortized deferred financing costs related to the 2007 Credit Facility which has been included in interest expense in the accompany consolidated statement of operations for the year ended December 31, 2009. On closing the May 2009 Credit Facility, we incurred approximately $5.4 million in financing costs, which were deferred and were being amortized using the effective interest method over
38
the life of the May 2009 Credit Facility. A debt discount of $23 million was created by recording the new debt at fair value and was being amortized to interest expense over the life of the May 2009 Credit Facility.
On November 19, 2009 we entered into a secured credit facility (November 2009 Credit Facility) to refinance our May 2009 Credit Facility principally to take advantage of a more favorable interest rate environment. The November 2009 Credit Facility consisted of a fully funded $325 million term loan facility and a senior secured revolving credit facility in an aggregate principal amount of $75 million, of which $49.4 million was funded at closing. Interest on outstanding balances under the November 2009 Credit Facility is payable, at our option, at the Base Rate plus a margin of 3%, or at LIBOR plus a margin of 4%. Additionally, in no event will the LIBOR rate be less than 2.0%. The November 2009 Credit Facility also provides for optional incremental term loan(s) and revolving loan(s) to increase the term and revolving facilities in an aggregate principal amount not to exceed $100 million. In connection with the closing of the November 2009 Credit Facility, we wrote-off $21.9 million in unamortized deferred financing costs and debt discount related to the May 2009 Credit Facility and incurred a $3.3 million term loan call premium charge. These items have been included in interest expense in the accompanying consolidated statement of operations for the year ended December 31, 2009. On closing of the November 2009 Credit Facility, we incurred approximately $2.9 million in financing costs. These financing costs have been deferred and are being amortized using the effective interest method over the life of the November 2009 Credit Facility.
Results of Operations
We acquired the assets of the CSG business on May 1, 2009, and have included its results since that date in our statement of operations for the year ended December 31, 2009. Therefore, our results for the full-year 2009 are not comparable to our results for the full year 2008. The following tables set forth, for the periods indicated, the selected statements of operations data (in thousands):
| |
Year ended December 31, | |||||||||
|---|---|---|---|---|---|---|---|---|---|---|
| |
2007 | 2008 | 2009 | |||||||
Statements of Operations Data: |
||||||||||
Revenues |
$ | 325,564 | $ | 343,991 | $ | 474,817 | ||||
Operating expenses: |
||||||||||
Cost of network services, exclusive of the items shown separately below |
163,559 | 162,423 | 224,497 | |||||||
Engineering and development |
27,626 | 29,149 | 36,268 | |||||||
Selling, general and administrative |
75,287 | 78,104 | 100,588 | |||||||
Depreciation and amortization of property and equipment |
23,114 | 25,286 | 32,247 | |||||||
Amortization of intangible assets |
25,656 | 25,734 | 32,353 | |||||||
Total operating expenses |
315,242 | 320,696 | 425,953 | |||||||
Income from operations |
10,322 | 23,295 | 48,864 | |||||||
Interest expense |
(16,655 | ) | (10,868 | ) | (58,553 | ) | ||||
Interest income |
1,105 | 707 | 497 | |||||||
Other income (expense), net |
2,356 | (241 | ) | 471 | ||||||
(Loss) income before income taxes and equity in net loss of unconsolidated affiliates |
(2,872 | ) | 12,893 | (8,721 | ) | |||||
Income tax (provision) benefit |
(586 | ) | (9,213 | ) | 6,777 | |||||
Equity in net income (loss) of unconsolidated affiliates |
643 | (202 | ) | (115 | ) | |||||
Net (loss) income |
$ | (2,815 | ) | $ | 3,478 | $ | (2,059 | ) | ||
39
Year ended December 31, 2009 compared to the year ended December 31, 2008
Revenues. Total revenues increased $131.0 million, or 38.0%, to $474.8 million for the year ended December 31, 2009, from $344.0 million for the year ended December 31, 2008. We reported revenues from four business divisions. The adverse effect of foreign exchange translation on a year-over-year basis was $15.5 million. Excluding the adverse effect of foreign exchange rates, total revenues increased $146.3 million, or 42.5%, to $490.3 million for the year ended December 31, 2009.
International services division. Revenues from the international services division decreased $18.2 million, or 11.7%, to $138.3 million for the year ended December 31, 2009, from $156.5 million for the year ended December 31, 2008. The adverse effect of foreign exchange translation on a year-over-year basis was $15.3 million. Excluding the adverse impact of foreign exchange rates, international services revenue decreased $2.9 million, or 1.9% to $153.6 million for the year ended December 31, 2009. The decrease was due to a $3.7 million decrease in POS revenue in the UK as described below, a decrease of $2.6 million from a reduction in development revenue for our card-not-present service, a decrease of $1.0 million due to lower transactions volumes in Spain and France and a decrease of $0.8 million due to lower transaction volumes in Japan. This was partially offset by an increase of $2.8 million in revenue in Italy as result of increased market share, an increase of $1.1 million due to higher transaction volumes in Australia and an increase in international financial services revenue of $1.5 million due to additional customer connections.
Revenues from our UK subsidiary decreased $13.6 million, or 18.9%, to $58.4 million for the year ended December 31, 2009, from $72.0 million for the year ended December 31, 2008. On a constant dollar basis, revenue from our UK subsidiaries for the year ended December 31, 2009 would have decreased $4.1 million, or 5.7%, to $67.9 million. UK POS revenue decreased $4.0 million due to lower transaction volumes and $1.4 million due to the loss of two processing customers. This was partially offset by an increase of $0.5 million resulting from market share gains and $0.8 million due to increased sales of our payment gateway products. In addition, UK financial services revenue increased $0.3 million as a result of increased customer connections.
Future revenue growth in the international markets we do business in depends on a number of factors including the success of our POS and financial service products in countries we have recently entered, the total number of POS transactions that we transport, the success of our new product offerings, the successful expansion of our card-not-present service offerings, the effects of foreign currency translation and global market conditions. In recent months, we have continued to see a reduction in the growth rates of our dial-up transaction volumes in many of the markets in which we operate, which we attribute to the overall weakness of the global economy. As we generate the majority of our international revenue from transaction volumes our future revenue may be adversely affected by the continued weakness of the global economy. In addition, our Australian telecommunications partner has indicated that they have lost business from one of their largest customers. We expect this dial traffic to begin moving off our network in the second quarter of 2010 which we anticipate will reduce our revenues by approximately $3 million in 2010.
In our international services division we enter into arrangements with our customers in the currency of the markets we operate in. As a result, our reported results are affected by fluctuations in the value of the U.S. dollar as compared to foreign currencies, predominantly the British Pound, the Euro and the Australian dollar. The following table shows the currency composition of our revenues in
40
the international services division for the year ended December 31, 2009 and 2008 and weighted average exchange rates used to translate our local currency results to the U.S. dollar:
| |
2009 | 2008 | |||||||||||
|---|---|---|---|---|---|---|---|---|---|---|---|---|---|
| |
% of ISD Revenue |
Weighted Average Exchange Rates |
% of ISD Revenue |
Weighted Average Exchange Rates |
|||||||||
British Pound |
42 | % | 1.57 | 46 | % | 1.85 | |||||||
Euro |
34 | % | 1.39 | 31 | % | 1.47 | |||||||
Australian Dollar |
18 | % | 0.79 | 18 | % | 0.84 | |||||||
POS division. Revenues from the POS division increased $1.6 million, or 2.2%, to $76.1 million for the year ended December 31, 2009, from $74.5 million for the year ended December 31, 2008. This increase is due to a $3.9 million increase in revenue from our managed broadband products, a $3.4 million increase from sales of our ATM processing products, primarily in Canada, and a $1.5 million increase in development revenue associated with the our ATM switching product. This was partially offset by a $7.2 million decrease in revenue from our dial-up POS offering which was due to a 7.1% decline in transaction volumes, which we attribute to softness in the economy, and to a lesser extent from a decrease in revenue per transaction for our dial-up POS offering mainly resulting from the renewal of certain customer contracts. Growth in the POS division depends on a number of factors including the success of our managed broadband products and payment gateway applications, the total number of POS dial-up transactions we transport and global economic conditions. Smaller merchants, which represent a large proportion of our dial customer base, have in our opinion been more adversely impacted by recent global economic conditions than the larger merchants and may take longer to recover if and when the economy improves. In addition, during the fourth quarter of 2009 we made the determination that we would discontinue the sale of our ATM switching product as we do not believe this product fits within our overall payments service offerings as we move forward. The total revenue recognized related to this product was $3.8 million and $2.1 million for the years ended December 31, 2009 and 2008, respectively. We do not anticipate generating more than $0.5 million from this product in 2010.
Telecommunication services division. Revenues from the telecommunication services division increased $145.6 million, or 217.0%, to $212.7 million for the year ended December 31, 2009, from $67.1 million for the year ended December 31, 2008. Included in revenues were pass-through charges of $22.8 million and $6.1 million for the years ended December 31, 2009 and 2008, respectively. Excluding the increase in pass through charges, revenues increased $128.8 million to $189.9 million for the year ended December 31, 2009, from $61.1 million for the year ended December 31, 2008. The incremental revenue contribution from the CSG acquisition which took place on May 1, 2009 was $135.8 million, excluding $6.5 million from our customers which switched services to CSG in 2008 and which became our customers again through the acquisition. Revenue from cable customers increased $0.7 million and revenue from other customers increased $0.9 million due to increased demand for our network and database services. These increases were partially offset by a decrease in revenue of $7.0 million due to volume declines from a customer following the acquisition of CSG based on the expectation that we will compete with the customer and a decrease of $1.6 million due to a reduction in volumes in our payphone fraud and validation service.
Future revenue growth in the telecommunication services division depends on a number of factors including the number of database access queries we transport, the number of call signaling routes our customers purchase, and the success of our new product offerings, which potentially may be offset by customers seeking pricing discounts due to industry consolidation or other reasons, as well as the successful integration of the business acquired through our purchase of CSG. We currently anticipate a revenue reduction of approximately $12.0 million for the year ended December 31, 2010 due to volume and price reductions from legacy CSG customers.
41
Financial services division. Revenues from the financial services division increased $1.8 million, or 4.1%, to $47.7 million for the year ended December 31, 2009, from $45.9 million for the year ended December 31, 2008. The increase in revenues was primarily due to an incremental $2.6 million from new customer endpoints which was partially offset by a decrease of $0.4 million due to a reduction in the number of connections between endpoints which we believe is a result of the consolidation in the financial services industry and $0.3 million from lower market data services revenue. Future revenue growth in the financial services division depends on a number of factors including the number of connections to and through our networks as well as the success of our new product offerings. We also expect that the current difficulties in the financial services sector may have a negative impact on our future growth rates in this division.
Cost of network services. Cost of network services increased $62.1million, or 38.2%, to $224.5 million for the year ended December 31, 2009, from $162.4 million for the year ended December 31, 2008. On a constant dollar basis, cost of network services would have increased $68.5 million, or 42.2%, to $230.9 million. Cost of network services were 47.3% of revenues for the year ended December 31, 2009, compared to 47.2% of revenues for the year ended December 31, 2008. The cost of network services increased $74.5 million due to the operation of the assets acquired from CSG, $4.7 million due to increased headcount and facilities costs required to support our growth, $4.1 million due to increased international broadband connections, $3.4 million due to higher bandwidth connections and increased exchange subscription charges to support our financial services revenue both internationally and domestically, and $1.6 million to support the growth in our ATM processing business, primarily in Canada. This was partially offset by a decrease of $13.7 million in our legacy telecommunications services business primarily due to reduced volumes and a decrease of $6.3 million primarily due to lower transaction volumes and to a lesser extent negotiated price reductions from our vendors in relation to our POS business.
Gross profit represented 52.7% of total revenues for the year ended December 31, 2009, compared to 52.8% for the year ended December 31, 2008. On a constant dollar basis, gross margins for the year ended December 31, 2009 remained flat at 52.9% compared to the year ended December 31, 2008.
Future cost of network services depends on a number of factors including total transaction and query volumes, the relative growth and contribution to total transaction volume of each of our customers, the success of our new service offerings, the timing and extent of our network expansion and the timing and extent of any network cost increases or reductions.
Engineering and development expense. Engineering and development expense increased $7.2 million, or 24.7%, to $36.3 million for the year ended December 31, 2009, from $29.1 million for the year ended December 31, 2008. On a constant dollar basis, engineering and development expense would have increased $8.2 million, or 28.1% to $37.3 million. Engineering and development expense represented 7.6% of revenues for the year ended December 31, 2009 and 8.5% for the year ended December 31, 2008. Capitalized software development costs, which are offset against engineering and development costs, increased $3.2 million to $8.9 million from $5.7 million for the year ended December 31, 2009. The increase in capitalized software development costs is primarily due to investment in our roaming and clearing and IP registry platforms and to a lesser extent from development of our payment gateway platforms. Included in engineering and development expense for the year ended December 31, 2009 and 2008 is stock compensation expense of $1.3 million and $1.6 million, respectively. Excluding stock compensation, the increase in capitalized software and the effects of foreign exchange, engineering and development expense would have increased $11.6 million to $44.9 million for the year ended December 31, 2009 from $33.3 million for the year ended December 31, 2008. The increase relates primarily to additional headcount and other costs required to support our acquisition of CSG.
42
Selling, general and administrative expense. Selling, general and administrative expenses increased $22.5 million, or 28.8%, to $100.6 million for the year ended December 31, 2009, from $78.1 million for the year ended December 31, 2008. On a constant dollar basis, selling, general and administrative expenses would have increased $25.9 million, or 33.1%, to $104.0 million. Selling, general and administrative expenses represented 21.2% of revenues for the year ended December 31, 2009, compared to 22.7% of revenues for the year ended December 31, 2008. Included in selling, general and administrative expenses for the year ended December 31, 2009 and 2008 is $8.2 million and $8.5 million of stock compensation expense, respectively. The decrease in stock compensation expense is due to a reduction in performance related stock compensation as a result of fewer grants. Included in selling, general and administrative expenses for the year ended December 31, 2009 and 2008 is $2.0 million and $1.2 million in severance expenses, respectively. Included in selling, general and administrative expenses for the year ended December 31, 2009 are $2.2 million in professional fees related to our acquisition of CSG that were expensed in accordance with the provisions of FASB ASC 805, Business Combinations. Included in selling, general and administrative expenses for the year ended December 31, 2008 was a $0.9 million benefit associated with the settlement of a state sales tax liability. Excluding these items and the effects of foreign exchange, selling, general and administrative expenses increased $23.1 million for the year ended December 31, 2009. This increase was primarily attributable to additional headcount and other costs necessary to support the acquired CSG operations and to a lesser extent an increase in professional fees related to the CSG integration effort as well as costs incurred to support our Canadian ATM processing business.
Depreciation and amortization of property and equipment. Depreciation and amortization of property and equipment increased $6.9 million, or 27.3%, to $32.2 million for the year ended December 31, 2009, from $25.3 million for the year ended December 31, 2008. On a constant dollar basis, depreciation and amortization of property and equipment would have increased $8.2 million, or 32.7%, to $33.5 million. Depreciation and amortization of property and equipment represented 6.8% of revenues for the year ended December 31, 2009, compared to 7.4% of revenues for the year ended December 31, 2008. Included in depreciation expense for the year ended December 31, 2008 is a charge of $1.1 million related to the impairment of certain capitalized software assets, primarily related to our vending platform. Excluding this item and the effects of foreign exchange, depreciation expense increased $9.3 million for the year ended December 31, 2009. The increase in depreciation expense was primarily due to an incremental $7.7 million related to the acquired CSG assets and to a lesser extent from increases in capital expenditures made to support our revenue growth.
Amortization of intangible assets. Amortization of intangible assets increased $6.7 million, or 26.1%, to $32.4 million for the year ended December 31, 2009, from $25.7 million for the year December 31, 2008 and relates solely to intangible assets resulting from acquisitions. On a constant dollar basis, amortization of intangible assets would have increased $7.4 million, or 28.7% to $33.1 million. The increase primarily relates to additional amortization expense of $11.5 million related to the CSG acquisition. This was partially offset by a decrease of $2.3 million as certain intangible assets reached the end of their economic useful lives and $1.8 million less in accelerated amortization on a portion of our customer relationship intangible assets in connection with the loss of certain customers. Beginning in 2005, we experienced revenue and transaction volume declines with a major customer. The intangible asset value attributable to this customer relationship was approximately $17.9 million as of December 31, 2009. We assessed recoverability of this customer relationship asset based upon undiscounted anticipated future cash flows and concluded no impairment existed as of December 31, 2009.
Interest expense. Interest expense increased $47.7 million to $58.6 million for the year ended December 31, 2009, from $10.9 million for the year ended December 31, 2008. Included in interest expense for the year ended December 31, 2009 were charges of $1.7 million related to the write-off of deferred financing fees following the refinancing of the 2007 Credit Facility in May 2009 and the
43
write-off of $21.9 million in debt discount and deferred financing fees related to the May 2009 Credit Facility in November 2009. Also included was a $3.3 million term loan call premium related to the refinancing of the May 2009 credit facility in November 2009. Excluding the write off of deferred financing fees, debt discount and the term loan call premium, amortization of deferred financing fees and debt discount, interest expense increased $6.4 million to $7.1 million from $0.7 million as a result of the refinancing transactions which took place in May and November 2009. Excluding the amortization and charges noted above associated with the refinancing transactions, interest expense would have increased $14.4 million to $24.6 million for the year ended December 31, 2009, from $10.2 million for the year ended December 31, 2008, primarily as a result of the increased level of borrowings used to finance the CSG acquisition and to a lesser extent from an increase in the weighted average interest rate.
Income tax benefit. For the year ended December 31, 2009, our income tax benefit was approximately $6.8 million compared to a $9.2 million expense for the year ended December 31, 2008. The decrease in our tax expense is related to lower income in the U.S. partially offset by higher income from our non-U.S. operations. Our effective tax rate for the year ended December 31, 2009 was 76.7% versus the U.S. federal statutory rate of 34.0% due primarily to the recognition of tax benefits relating to research credits in the U.S., nondeductible stock based compensation expense, profits from our international subsidiaries being taxed at rates different than the U.S. federal statutory rate, the effect of adjustments to income tax expense for the six months ending June 30, 2009 resulting from the finalization of tax returns in the United Kingdom, and certain excessive employee remuneration not deductible for tax purposes. Our effective tax rate for the year ended December 31, 2008 was 72.5% versus the U.S. federal statutory rate of 34.0% due primarily to changes in uncertain tax positions and deductions for stock based compensation.
Year ended December 31, 2008 compared to the year ended December 31, 2007
Revenues. Total revenues increased $18.4 million, or 5.7%, to $344.0 million for the year ended December 31, 2008, from $325.6 million for the year ended December 31, 2007. We reported revenues from four business divisions.
International services division. Revenues from the international services division increased $17.6 million, or 12.7%, to $156.5 million for the year ended December 31, 2008, from $138.9 million for the year ended December 31, 2007. On a constant dollar basis, revenue for the year ended December 31, 2008 would have increased $19.9 million, or 14.3% to $158.8 million. This increase was the result of $9.0 million from higher transaction volumes and increased broadband connections from POS customers in Europe and Asia Pacific, an incremental $6.3 million from sales of our card-not-present POS service offering in the Asia Pacific region and $4.6 million from additional connections from financial services customers. Revenues from our U.K. subsidiary increased $1.7 million, or 2.5%, to $72.0 million for the year ended December 31, 2008, from $70.3 million for the year ended December 31, 2007. On a constant dollar basis, revenue from our U.K. subsidiary for the year ended December 31, 2008 would have increased $7.8 million, or 11.1%, to $78.1 million. In our international services division we enter into arrangements with our customers in the currency of the markets we operate in. As a result, our reported results are affected by fluctuations in the value of the U.S. dollar as compared to foreign currencies, predominantly the British Pound, the Euro and the Australian dollar. The following table shows the currency composition of our revenues in the international services division for the year ended December 31, 2008 and weighted average exchange rates used to translate our local currency results to the U.S. dollar:
| |
2008 | 2007 | |||||||||||
|---|---|---|---|---|---|---|---|---|---|---|---|---|---|
| |
% of ISD Revenue |
Weighted Average Exchange Rates |
% of ISD Revenue |
Weighted Average Exchange Rates |
|||||||||
British Pound |
46 | % | 1.85 | 50 | % | 2.00 | |||||||
Euro |
31 | % | 1.47 | 30 | % | 1.38 | |||||||
Australian Dollar |
18 | % | 0.84 | 14 | % | 0.86 | |||||||
44
POS division. Revenues from the POS division decreased $6.7 million, or 8.3%, to $74.5 million for the year ended December 31, 2008, from $81.2 million for the year ended December 31, 2007. Included in POS revenue for the year ended December 31, 2008 is $1.9 million in pass-through revenues compared with $2.6 million for year ended December 31, 2007. POS dial-up transaction volumes decreased 9.7% to 5.3 billion transactions for the year ended December 31, 2008, from 5.8 billion transactions for the year ended December 31, 2007. Excluding the decrease in pass-through revenues, revenues for the year ended December 31, 2008 decreased 7.8% to $72.6 million from $78.7 million for the year ended December 31, 2007. This decrease in revenue was due primarily to lower transaction volumes which decreased primarily as a result of a customer moving a portion of their traffic off our network for the stated purpose of vendor diversification and to a lesser extent what we believe to be the negative effect on volumes due to weakness in the economy. To a lesser extent the decrease in revenue is due to price compression following the renewal of certain customer contracts. These decreases were partially offset by increased revenue from sales of our managed broadband products.
Telecommunication services division. Revenues from the telecommunication services division increased $2.6 million, or 4.0%, to $67.1 million for the year ended December 31, 2008, from $64.5 million for the year ended December 31, 2007. Included in TSD revenue for the year ended December 31, 2008 is $6.1 million in pass-through revenues compared with $5.4 million for the year ended December 31, 2007. Excluding the increase in pass-through revenues, revenues increased $1.9 million, or 3.2% to $61.0 million from $59.1 million for the year ended December 31, 2008 and 2007, respectively. This was due to an increase of $11.3 million in network and database access services provided to cable customers which was partially offset by a decrease of $9.7 million related to the loss of two customers' caller ID business to CSG.
Financial services division. Revenues from the financial services division increased $5.0 million, or 12.2%, to $45.9 million for the year ended December 31, 2008, from $40.9 million for the year ended December 31, 2007. The increase in revenues was primarily due to increases in new customer endpoint installations and to a lesser extent increases in connectivity between existing customers. In addition, we have seen increased demand for greater bandwidth connectivity which results in higher average revenue per customer endpoint.
Cost of network services. Cost of network services decreased $1.1 million, or 0.7%, to $162.4 million for the year ended December 31, 2008, from $163.6 million for the year ended December 31, 2007. On a constant dollar basis, cost of network services would have decreased $0.6 million, or 0.4%, to $162.9 million. Cost of network services were 47.2% of revenues for the year ended December 31, 2008, compared to 50.2% of revenues for the year ended December 31, 2007. Excluding the effect of foreign exchange, the decrease in cost of network services resulted primarily from declines in transaction volumes in our POS division, as mentioned above, and to a lesser extent reductions in the cost of services provided to us through focus on cost control of key suppler contracts in our POS and telecommunication services divisions. This was partially offset by higher volumes in our international services and telecommunications services divisions and to a lesser extent our financial services division.
Gross profit represented 52.8% of total revenues for the year ended December 31, 2008, compared to 49.8% for the year ended December 31, 2007. The improvement in gross margin from last year is primarily a result of increased contribution from our international services division, our highest gross margin division, and to a lesser extent improvement in the gross margins of our POS division as we worked to lower the cost of services provided to us and to a lesser extent from improvements in the gross margin of the telecom services division due to a change in the product mix towards our network based products.
45
Engineering and development expense. Engineering and development expense increased $1.5 million, or 5.4%, to $29.1 million for the year ended December 31, 2008, from $27.6 million for the year ended December 31, 2007. On a constant dollar basis, engineering and development expense would have increased $1.6 million, or 5.8% to $29.2 million. Engineering and development expense represented 8.5% of revenues for each of the years ended December 31, 2008 and 2007. Included in engineering and development expense for the year ended December 31, 2008 and 2007 is stock compensation expense of $1.6 million and $2.1 million, respectively. For the year ended December 31, 2007 stock compensation expense includes a $0.4 million charge related to the decision by the Board of Directors to allow for dividend equivalent payments on the outstanding restricted stock units. Excluding these items and the effects of foreign exchange, engineering and development expense increased $2.1 million for the year ended December 31, 2008. This increase is primarily due to increased headcount to support our IP financial services and POS division offerings, and to a lesser extent our investment in the development of our card-not-present payment gateway. This was partially offset by an increase of $2.0 million in the labor costs capitalized for software development projects, primarily related to our card-not-present applications and to a lesser extent from development of our back-office systems to enhance our internal reporting and network monitoring capabilities.
Selling, general and administrative expense. Selling, general and administrative expenses increased $2.8 million, or 3.7%, to $78.1 million for the year ended December 31, 2008, from $75.3 million for the year ended December 31, 2007. On a constant dollar basis, selling, general and administrative expenses would have increased $3.0 million, or 4.0%, to $78.3 million. Selling, general and administrative expenses represented 22.7% of revenues for the year ended December 31, 2008, compared to 23.1% of revenues for the year ended December 31, 2007. Included in selling, general and administrative expenses for the year ended December 31, 2008 and 2007 is $8.5 million and $9.4 million of stock compensation expense, respectively. For the year ended December 31, 2007, stock compensation expense includes a $1.0 million charge related to the decision by the board of directors to allow for dividend equivalent payments on the outstanding restricted stock units. Included in selling, general and administrative expenses for the year ended December 31, 2008 is $0.9 million benefit associated with the settlement of a state sales tax liability. Included in selling, general and administrative expenses for the year ended December 31, 2008 and 2007 is $1.2 million and $3.0 million in severance expenses, respectively, associated with the departure of certain executives. Excluding these items and the effects of foreign exchange, selling, general and administrative expenses increased $6.6 million for the year ended December 31, 2008. This is due to headcount related increases of $4.4 million in connection with our business development group that is focused on driving revenue growth from our customers in our domestic and international POS business, an increase of $1.0 million in professional fees in connection with advice on our international tax planning strategy and an increase of $1.0 million in bad debts expense.
Depreciation and amortization of property and equipment. Depreciation and amortization of property and equipment increased $2.2 million, or 9.5%, to $25.3 million for the year ended December 31, 2008, from $23.1 million for the year ended December 31, 2007. On a constant dollar basis, depreciation and amortization of property and equipment would have increased $2.3 million, or 10.0% to $25.4 million. Depreciation and amortization of property and equipment represented 7.4% of revenues for the year ended December 31, 2008, compared to 7.1% of revenues for the year ended December 31, 2007. Included in depreciation expense for the year ended December 31, 2008 is a charge of $1.1 million related to the impairment of certain capitalized software assets, primarily related to our vending platform. Excluding this item and the effects of foreign exchange, depreciation expense increased $1.2 million for the year ended December 31, 2008. This increase was primarily due to capital expenditures made to support our revenue growth.
Amortization of intangible assets. Amortization of intangible assets remained constant at $25.7 million for the year ended December 31, 2008 and the year ended December 31, 2007 and relates
46
solely to intangible assets resulting from acquisitions. In the years ended December 31, 2008 and 2007, we accelerated amortization on a portion of our customer relationship intangible assets in connection with the loss of certain customers by $2.2 million and $1.5 million, respectively. Excluding these items, amortization of intangible assets decreased $0.6 million as certain intangible assets reached the end of their useful lives, partially offset by a full year of amortization from our acquisition of Dialect Payment Technologies.
Interest expense. Interest expense decreased $5.8 million, or 34.7%, to $10.9 million for the year ended December 31, 2008, from $16.7 million for the year ended December 31, 2007. Included in interest expense for the year ended December 31, 2007 is a charge of $1.4 million related to the acceleration of deferred financing costs as a result of the recapitalization in March 2007 supporting our special dividend. Excluding this charge, interest expense decreased $4.4 million primarily due to the lower effective interest rate associated with our 2007 credit facility and to a lesser extent the lower average debt balance outstanding during 2008.
Interest income. Interest income was $0.7 million for the year ended December 31, 2008 compared to $1.1 million for the year ended December 31, 2007. The decrease in interest income is due primarily to a lower effective interest rate partially offset by higher outstanding cash balances.
Other income (expense), net. Other income (expense), net was an expense of $0.2 million for the year ended December 31, 2008 compared to income of $2.4 million for the year ended December 31, 2007. Included in other income (expense), net for the year ended December 31, 2008 are foreign currency revaluation losses of approximately $0.1 million due to fluctuations in the value of the U.S. dollar, principally against the Euro and Pound Sterling, versus a gain on foreign currency revaluation of $2.2 million for the year ended December 31, 2007.
Income tax expense. For the year ended December 31, 2008, our income tax expense was approximately $9.2 million compared to $0.6 million for the year ended December 31, 2007. The increase in our income tax expense is related to higher income in the U.S. that cannot be offset against losses in other jurisdictions. Our effective tax rate for the year ended December 31, 2008 was 72.5% versus the the U.S. federal statutory rate of 34.0% due primarily to changes in uncertain tax positions and deductions for stock based compensation. Our effective tax rate for the year ended December 31, 2007 was (26.3%) versus the U.S. federal statutory rate of 34.0% due primarily to lower tax rates in certain international jurisdictions in which we have operations and nondeductible stock compensation expense.
Equity in net income (loss) of unconsolidated affiliates. Equity in net income (loss) of unconsolidated affiliates for the year ended December 31, 2008 was a loss of $0.2 million, compared to income of $0.6 million for the year ended December 31, 2007. The decrease was due primarily to the realized gain of $0.6 million on the sale of all our outstanding shares of our investment in WAY Systems, Inc. during the year ended December 31, 2007. The loss for the year ended December 31, 2008 relates to our investment in AK Jensen, Inc. As of December 31, 2008, the carrying value of our investment in AK Jensen, Inc. was $0.4 million.
Outlook
We expect to experience operational benefits from the acquisition of CSG, primarily through consolidating our two SS7 call signaling networks and eliminating duplicate intelligent database platforms and duplicate telecommunications facilities. We also expect reduced overall combined capital expenditures as a result of greater economies of scale and the rationalization of network assets. We realized incremental pretax operational cost savings of $1 million in 2009, and expect to realize an additional $5 million to $6 million in 2010, and an additional $2 million to $3 million in 2011, for total expected annualized pretax operating expense reductions of $8 million to $10 million. We anticipate
47
that these savings will be fully implemented on a run rate basis by the beginning of the fourth quarter of 2010. In addition, we expect to achieve lower interest expense as a result of the debt refinancing that occurred in November 2009.
Seasonality
Credit card and debit card transactions account for a major percentage of the transaction volume processed by our customers. The volume of these transactions on our networks generally is greater in the third and fourth quarter vacation and holiday seasons than during the rest of the year. Consequently, revenues and earnings from credit card and debit card transactions in the first and second quarter generally are lower than revenues and earnings from credit card and debit card transactions in the third and fourth quarters of the immediately preceding year. We expect that our operating results in the foreseeable future will be significantly affected by seasonal trends in the credit card and debit card transaction market.
Liquidity and Capital Resources
Our primary liquidity and capital resource needs are to finance the costs of our operations, to make capital expenditures and to service our debt. Based upon our current level of operations, we expect that our cash flow from operations, together with the amounts we are able to borrow under our November 2009 Credit Facility, will be adequate to meet our anticipated needs for the foreseeable future.
Our operations provided us cash of $105.5 million for the year ended December 31, 2009, which was attributable to a net loss of $2.1 million, adjusted by depreciation, amortization and other non-cash charges of $96.6 million and a decrease in working capital of $10.9 million. Our operations provided us cash of $73.7 million for the year ended December 31, 2008, which was attributable to net income of $3.5 million, adjusted by depreciation, amortization and other non-cash charges of $68.4 million and a decrease in working capital of $1.8 million. Our operations provided us cash of $42.0 million for the year ended December 31, 2007, which was attributable to a net loss of $2.8 million, adjusted by depreciation, amortization and other non-cash charges of $53.5 million and an increase in working capital of $8.7 million.
We used cash of $271.3 million in investing activities for the year ended December 31, 2009 which included $230.7 million to fund our acquisition of CSG and $40.6 million to fund capital expenditures primarily to support our revenue growth. We used cash of $32.0 million in investing activities for the year ended December 31, 2008 in order to fund capital expenditures primarily to support our revenue growth. We used cash of $20.6 million in investing activities for the year ended December 31, 2007, which included $4.2 million for business acquisitions and $19.5 million in capital expenditures primarily to support our revenue growth, partially offset by cash proceeds of $0.9 million from the sale of certain equity investments and $2.2 million from the sale of non-strategic property and equipment.
Our financing activities provided us cash of $162.5 million for the year ended December 31, 2009. This consisted of proceeds (net of debt discount, financing fees and term loan call premium) from the May and November 2009 Credit Facilities of $201.6 million and $363.2 million of which $48.5 million was from the Revolver Credit Facility, respectively, less the payment of the 2007 and May 2009 credit facilities of $178.5 million and $230.0 million, respectively. In addition, $1.8 million was used to repurchase stock to satisfy employee tax withholding requirements on the vesting of restricted stock units and we received $8.1 million from the exercise of employee stock options. We used cash of $19.4 million from financing activities for the year ended December 31, 2008, which included voluntary pre-payments of $27.0 million on our 2007 senior secured credit facility, and $2.2 million was used to repurchase stock to satisfy employee tax withholding requirements on the vesting of restricted stock units. In addition we received $9.6 million from the exercise of employee stock options. We used cash
48
of $19.7 million from financing activities for the year ended December 31, 2007, which included net proceeds of $222 million from our 2007 senior secured credit facility, of which $98.3 million was used for payment of a special dividend and $123.3 million was used to repay our 2005 amended and restated senior secured credit facility. In addition, we made $19.5 million of voluntary pre-payments on our 2007 senior secured credit facility.
Commitments
The following table summarizes our contractual obligations as of December 31, 2009 that require us to make future cash payments (dollars in thousands):
| |
|
Year ending December 31, | |
|||||||||||||||||||
|---|---|---|---|---|---|---|---|---|---|---|---|---|---|---|---|---|---|---|---|---|---|---|
| |
Total | 2010 | 2011 | 2012 | 2013 | 2014 | Thereafter | |||||||||||||||
Contractual Cash Obligations by Period: |
||||||||||||||||||||||
Long-term debt under the senior secured credit facility |
$ | 374,371 | $ | 16,250 | $ | 16,250 | $ | 16,250 | $ | 16,250 | $ | 65,621 | $ | 243,750 | ||||||||
Supplier commitments |
43,634 | 24,082 | 16,821 | 2,731 | — | — | — | |||||||||||||||
Operating lease obligations |
37,562 | 10,604 | 8,037 | 6,155 | 3,957 | 2,038 | 6,771 | |||||||||||||||
|
$ | 455,567 | $ | 50,936 | $ | 41,108 | $ | 25,136 | $ | 20,207 | $ | 18,288 | $ | 250,521 | ||||||||
Due to uncertainty with respect to the timing of future cash flows associated with unrecognized tax benefits at December 31, 2009, the Company is unable to make reasonably reliable estimates of the period of cash settlement. Therefore $4.3 million of unrecognized tax benefits have been excluded from the contractual obligations table above. See Note 8 to the Consolidated Financial Statements for further discussion of income tax.
Not included in the table above are commitments to make interest payments under the terms of our November 2009 Credit Facility due to the variable nature of the interest rates. See note 5 to the consolidated financial statements for further details on interest rates and other terms and conditions of this facility.
We expect that we will be able to fund our remaining obligations and commitments with cash flow from operations. To the extent we are unable to fund these obligations and commitments with cash flow from operations, we intend to fund these obligations and commitments with proceeds from borrowings under our November 2009 Credit Facility or future debt or equity financings.
Critical Accounting Policies
Our significant accounting policies are described in Note 2 to our consolidated financial statements included elsewhere in this report. We consider the accounting policies related to revenue and related cost recognition, valuation of goodwill and other intangible assets, stock based compensation and accounting for income taxes to be critical to the understanding of our results of operations. Critical accounting policies include the areas where we have made what we consider to be particularly subjective or complex judgments in making estimates and where these estimates can significantly impact our financial results under different assumptions and conditions. We prepare our financial statements in conformity with U.S. generally accepted accounting principles. As such, we are required to make certain estimates, judgments and assumptions that we believe are reasonable based upon the information available. These estimates, judgments and assumptions affect the reported amounts of assets and liabilities at the date of the financial statements and the reported amounts of revenue and expenses during the periods presented. Actual results could be different from these estimates.
49
The following is a discussion on the most significant accounting estimates affecting the financial statements:
Acquisitions
We account for acquisitions in accordance with FASB ASC 805, Business Combinations. We preliminarily record the fair value of assets acquired and liabilities assumed based on guidance defined in FASB ASC820, Fair Value Measurments and Disclosures and adjust these values once valuations are finalized within 12 months of the close of the acquisition. When the valuations are finalized, any changes to the preliminary valuation of assets acquired and liabilities assumed may result in significant adjustments to the fair value of net identifiable assets acquired and goodwill.
Goodwill, intangible and other long-lived assets
We account for goodwill and intangible assets in accordance with FASB ASC 350, Intangibles—Goodwill and Other (ASC 350). Under this standard, goodwill and intangible assets deemed to have indefinite lives are not amortized and are subject to annual impairment tests. We have elected to perform the impairment test annually as of October 1 of each year. An interim goodwill impairment test is performed if an event occurs or circumstances change between annual tests that would more likely than not reduce the fair value of a reporting unit below its carrying amount. If facts and circumstances indicate goodwill may be impaired, we perform a recoverability evaluation based upon a determination of fair value.
In accordance with FASB ASC 360, Property, Plant and Equipment (ASC 360) and ASC 350, we review our long-lived assets including property and equipment, capitalized software development costs and definite-lived intangible assets for impairment whenever events or changes in circumstances indicate that the carrying amount of the assets may not be fully recoverable. To determine the recoverability of our long-lived assets, we evaluate the probability that future estimated undiscounted net cash flows will be less than the carrying amount of the assets. If we estimate that the assets are impaired, the assets are written down to their fair value. For purposes of measuring and recognizing impairment of long-lived assets, we assess whether separate cash flows can be attributed to the individual asset. We group our long-lived assets where separately identifiable cash flows are available. In the event that long-lived assets, including intangibles are abandoned or otherwise disposed of, we recognize an impairment charge upon disposition. For our customer relationship intangible assets, we evaluate impairment upon the significant loss of revenue from a customer. Beginning in 2005, we experienced revenue and transaction volume declines with a major customer. The intangible asset value attributable to this customer relationship was approximately $17.9 million as of December 31, 2009. We assessed the recoverability of this customer relationship asset based upon undiscounted anticipated future cash flows and concluded no impairment existed as of December 31, 2009.
The calculation of fair value in accordance with ASC 350 and 360 contains uncertainties due to judgment in estimates and assumptions, including projections of future income and cash flows, the identification of appropriate market multiples and the choice of an appropriate discount rate. Our estimates of anticipated future income and cash flows used in determining fair value contain uncertainties due to uncontrollable events that could positively or negatively impact the anticipated future economic and operating conditions. Therefore, those estimates could be reduced significantly in the future due to changes in technologies, regulation, available financing, competition or other circumstances. As a result, the carrying amount of our long-lived assets could be reduced through impairment charges in the future. Additionally, changes in estimated future cash flows could result in a shortening of estimated useful lives for long-lived assets including intangibles.
50
Income taxes
We account for income taxes pursuant to the provisions of FASB ASC 740, Income Taxes. Under this method, deferred tax assets or liabilities are computed based upon the difference between the financial statement and income tax bases of assets and liabilities using the enacted marginal tax rate. Deferred income tax expense or benefits are based upon the changes in the asset or liability from period to period. We provide a valuation allowance on net deferred tax assets when it is more likely than not that such assets will not be realized. We must exercise significant judgment in evaluating the amount and timing of recognition of deferred tax liabilities and assets, and related valuation allowance, including projections of future taxable income. These judgments and estimates are reviewed on a continual basis as regulatory and business factors change. We expect to realize the benefit of our deferred tax assets for which no valuation allowance is recorded as we expect to generate sufficient taxable income in future years. We believe our ability to generate future taxable income has been significantly enhanced through the CSG acquisition as well as through the November 2009 debt refinancing, which we expect to lower interest expense in future years. An additional valuation allowance for deferred tax assets may be required if our future taxable income is not sufficient to realize our deferred tax assets.
We record unrecognized tax benefit liabilities for known or anticipated tax issues based on our analysis of whether, and the extent to which, additional taxes will be due. This analysis is performed in accordance with the requirements of ASC 740 and is based on a two-step process. Both steps presume that the tax position will be examined by the appropriate taxing authority that has full knowledge of all relevant information. The first step is to evaluate the tax position for recognition by determining if, based on the weight of available evidence, it is more likely than not that the position will be sustained on examination. The second step requires us to estimate and measure the tax benefit as the largest amount that is more than 50% likely of being realized upon ultimate settlement with a taxing authority. It is inherently difficult and subjective to estimate such amounts, as this may require us to determine the probability of various possible outcomes. We reevaluate these uncertain tax positions on a periodic basis. This evaluation is based on factors including, but not limited to, current year tax positions, expiration of statutes of limitations, litigation, legislative activity, or other changes in facts and circumstances. Such a change in recognition or measurement would result in the recognition of a tax benefit or an additional charge to the tax provision in that period. The amounts ultimately paid upon resolution of such uncertain tax positions could be materially different from the amounts previously included in our income tax expense and therefore could have a material impact on our consolidated results of operations. The tax liabilities for uncertain tax positions are recorded as a separate component in our long-term income taxes payable balance.
Effects of Inflation
Our monetary assets, consisting primarily of cash and receivables, and our non-monetary assets, consisting primarily of intangible assets and goodwill, are not affected significantly by inflation. We believe that replacement costs of equipment, furniture and leasehold improvements will not materially affect our operations. However, the rate of inflation affects our expenses, such as those for employee compensation and costs of network services, which may not be readily recoverable in the price of services offered by us.
Item 6A. Quantitative and Qualitative Disclosures about Market Risk
Interest rates
Our principal exposure to market risk relates to changes in interest rates. As of December 31, 2009 we had $374.4 million outstanding under our November 2009 Credit Facility with interest rates tied to changes in the lender's base rate or the LIBOR rate. Interest on outstanding balances under the
51
November 2009 Credit Facility, is payable, at the Company's option, at the base rate plus a margin of 3%, or at LIBOR plus a margin of 4%. Additionally, in no event will the base rate be less than 3.0% or the LIBOR rate be less than 2.0%. At December 31, 2009 the 1 month LIBOR rate was 0.23%. Based upon the outstanding borrowings on December 31, 2009 and assuming repayment of the Term Loan in accordance with scheduled maturities, each 1.0% increase or decrease in these rates, once the LIBOR rate exceeds the 2.0% minimum, could affect our annual interest expense by $3.7 million.
As of December 31, 2009, we did not hold derivative financial or commodity instruments and all of our cash and cash equivalents were held in money market or commercial accounts.
Foreign currency risk
Our earnings are affected by fluctuations in the value of the U.S. dollar as compared with foreign currencies, predominately the Euro, the British Pound and the Australian dollar due to our operations in Europe and Australia.
We have operations in 24 countries outside of the U.S., including the United Kingdom, Austria, Australia, Bermuda, Canada, France, Germany, Hong Kong, India, Ireland, Italy, Japan, Malaysia, Mexico, New Zealand, Poland, Romania, Singapore, South Korea, Spain, Sweden, Thailand ,the Netherlands and Turkey. We provide services in these countries using networks deployed in each country. We manage foreign exchange risk through the structure of our business. In the substantial majority of our transactions, we receive payments denominated in the U.S. dollar, British Pound, Euro or Australian dollar. Therefore, we do not rely on international currency markets to obtain and pay illiquid currencies. The foreign currency exposure that does exist is limited by the fact that the majority of transactions are paid according to our standard payment terms, which are generally short-term in nature. Our policy is not to speculate in foreign currencies, and we promptly buy and sell foreign currencies as necessary to cover our net payables and receivables, which are denominated in foreign currencies. For the year ended December 31, 2009, we recorded a gain on foreign currency revaluation of approximately $0.3 million.
52
Item 7. Financial Statements and Supplementary Data
The following financial information is included on the pages indicated:
53
REPORT OF INDEPENDENT REGISTERED PUBLIC ACCOUNTING FIRM
To the Board of Directors and Shareholders of TNS, Inc.:
We have audited the accompanying consolidated balance sheets of TNS, Inc. as of December 31, 2008 and 2009, and the related consolidated statements of operations, stockholders' equity, and cash flows for each of the three years in the period ended December 31, 2009. Our audits also included the financial statement schedule listed in Item 7. These financial statements and schedule are the responsibility of the Company's management. Our responsibility is to express an opinion on these financial statements and schedule based on our audits.
We conducted our audits in accordance with the standards of the Public Company Accounting Oversight Board (United States). Those standards require that we plan and perform the audit to obtain reasonable assurance about whether the financial statements are free of material misstatement. An audit includes examining, on a test basis, evidence supporting the amounts and disclosures in the financial statements. An audit also includes assessing the accounting principles used and significant estimates made by management, as well as evaluating the overall financial statement presentation. We believe that our audits provide a reasonable basis for our opinion.
In our opinion, the financial statements referred to above present fairly, in all material respects, the consolidated financial position of TNS, Inc. at December 31, 2008 and 2009, and the consolidated results of its operations and its cash flows for each of the three years in the period ended December 31, 2009, in conformity with U.S. generally accepted accounting principles. Also, in our opinion, the related financial statement schedule, when considered in relation to the basic financial statements taken as a whole, presents fairly in all material respects the information set forth therein.
As discussed in Notes 2 and 3 to the consolidated financial statements, the Company changed its method of accounting for business combinations with the adoption of the guidance originally issued in FASB Statement No. 141(R), Business Combinations (codified in FASB ASC Topic 805, Business Combinations) effective January 1, 2009.
We also have audited, in accordance with the standards of the Public Company Accounting Oversight Board (United States), TNS, Inc.'s internal control over financial reporting as of December 31, 2009, based on criteria established in Internal Control—Integrated Framework issued by the Committee of Sponsoring Organizations of the Treadway Commission and our report dated March 15, 2010 expressed an unqualified opinion thereon.
| /s/ Ernst & Young LLP |
McLean,
Virginia
March 15, 2010
54
REPORT OF INDEPENDENT REGISTERED PUBLIC ACCOUNTING FIRM
ON INTERNAL CONTROL OVER FINANCIAL REPORTING
The Board of Directors and Shareholders of TNS, Inc.:
We have audited TNS, Inc.'s internal control over financial reporting as of December 31, 2009, based on criteria established in Internal Control—Integrated Framework issued by the Committee of Sponsoring Organizations of the Treadway Commission (the COSO criteria). TNS, Inc.'s management is responsible for maintaining effective internal control over financial reporting, and for its assessment of the effectiveness of internal control over financial reporting included in the accompanying management report located in Item 8A. Our responsibility is to express an opinion on the Company's internal control over financial reporting based on our audit.
We conducted our audit in accordance with the standards of the Public Company Accounting Oversight Board (United States). Those standards require that we plan and perform the audit to obtain reasonable assurance about whether effective internal control over financial reporting was maintained in all material respects. Our audit included obtaining an understanding of internal control over financial reporting, assessing the risk that a material weakness exists, testing and evaluating the design and operating effectiveness of internal control based on the assessed risk, and performing such other procedures as we considered necessary in the circumstances. We believe that our audit provides a reasonable basis for our opinion.
A company's internal control over financial reporting is a process designed to provide reasonable assurance regarding the reliability of financial reporting and the preparation of financial statements for external purposes in accordance with generally accepted accounting principles. A company's internal control over financial reporting includes those policies and procedures that (1) pertain to the maintenance of records that, in reasonable detail, accurately and fairly reflect the transactions and dispositions of the assets of the company; (2) provide reasonable assurance that transactions are recorded as necessary to permit preparation of financial statements in accordance with generally accepted accounting principles, and that receipts and expenditures of the company are being made only in accordance with authorizations of management and directors of the company; and (3) provide reasonable assurance regarding prevention or timely detection of unauthorized acquisition, use, or disposition of the company's assets that could have a material effect on the financial statements.
Because of its inherent limitations, internal control over financial reporting may not prevent or detect misstatements. Also, projections of any evaluation of effectiveness to future periods are subject to the risk that controls may become inadequate because of changes in conditions, or that the degree of compliance with the policies or procedures may deteriorate.
As indicated in the accompanying management's report on internal control over financial reporting located in Item 8A, management's assessment of and conclusion on the effectiveness of internal control over financial reporting did not include internal controls of the Communications Services Group, which is included in the 2009 consolidated financial statements of TNS Inc. and constituted $160.8 million of revenues for the year ended December 31, 2009. Our audit of internal control over financial reporting of TNS Inc. also did not include an evaluation of the internal control over financial reporting of the Communications Services Group.
In our opinion, TNS, Inc. maintained, in all material respects, effective internal control over financial reporting as of December 31, 2009, based on the COSO criteria.
55
We also have audited, in accordance with the standards of the Public Company Accounting Oversight Board (United States), the consolidated balance sheets of TNS, Inc. as of December 31, 2008 and 2009, and the related consolidated statements of operations, stockholders' equity, and cash flows of TNS, Inc. for each of the three years in the period ended December 31, 2009 and our report dated March 15, 2010 expressed an unqualified opinion thereon.
/s/ Ernst & Young LLP |
McLean,
Virginia
March 15, 2010
56
TNS, INC.
CONSOLIDATED BALANCE SHEETS
| |
December 31, | |||||||
|---|---|---|---|---|---|---|---|---|
| |
2008 | 2009 | ||||||
| |
(in thousands, except per share and share amounts) |
|||||||
ASSETS |
||||||||
Current assets: |
||||||||
Cash and cash equivalents |
$ | 38,851 | $ | 32,480 | ||||
Accounts receivable, net of allowance for doubtful accounts of $3,631 and $6,019, respectively |
69,501 | 97,834 | ||||||
Prepaid expenses |
5,351 | 8,207 | ||||||
Deferred tax assets |
1,805 | 7,355 | ||||||
Income taxes receivable |
1,824 | 380 | ||||||
Inventory |
1,774 | 2,716 | ||||||
Other receivables |
— | 12,180 | ||||||
Other current assets |
2,737 | 1,776 | ||||||
Total current assets |
121,843 | 162,928 | ||||||
Property and equipment, net |
58,795 | 125,596 | ||||||
Identifiable intangible assets, net |
151,811 | 268,925 | ||||||
Goodwill |
10,954 | 16,581 | ||||||
Deferred tax assets, net |
16,141 | 24,720 | ||||||
Other assets |
3,740 | 4,427 | ||||||
Total assets |
$ | 363,284 | $ | 603,177 | ||||
LIABILITIES AND STOCKHOLDERS' EQUITY |
||||||||
Current liabilities: |
||||||||
Accounts payable, accrued expensed and other current liabilities |
$ | 56,045 | $ | 89,740 | ||||
Deferred revenue |
16,360 | 13,970 | ||||||
Current portion of long term debt, net of discount |
— | 15,119 | ||||||
Total current liabilities |
72,405 | 118,829 | ||||||
Long-term debt, net of current portion and discount |
178,500 | 354,594 | ||||||
Deferred tax liabilities |
2,420 | 3,416 | ||||||
Other liabilities |
7,144 | 4,998 | ||||||
Total liabilities |
260,469 | 481,837 | ||||||
Commitments and contingencies (see Note 10) |
||||||||
Stockholders' equity: |
||||||||
Common stock, $0.001 par value; 130,000,000 shares authorized; 25,082,007 shares issued and 25,053,226 shares outstanding and 25,957,444 shares issued and 25,795,767 shares outstanding, respectively |
25 | 26 | ||||||
Treasury stock, 28,781 shares and 161,677 shares, respectively |
(578 | ) | (2,439 | ) | ||||
Additional paid-in capital |
150,839 | 168,780 | ||||||
Accumulated deficit |
(40,800 | ) | (42,859 | ) | ||||
Accumulated other comprehensive (loss) |
(6,671 | ) | (2,168 | ) | ||||
Total stockholders' equity |
102,815 | 121,340 | ||||||
Total liabilities and stockholders' equity |
$ | 363,284 | $ | 603,177 | ||||
See accompanying notes.
57
TNS, INC.
CONSOLIDATED STATEMENTS OF OPERATIONS
| |
Year ended December 31, | ||||||||||
|---|---|---|---|---|---|---|---|---|---|---|---|
| |
2007 | 2008 | 2009 | ||||||||
| |
(in thousands, except per share and share amounts) |
||||||||||
Revenues |
$ | 325,564 | $ | 343,991 | $ | 474,817 | |||||
Operating expenses: |
|||||||||||
Cost of network services, exclusive of the items shown separately below |
163,559 | 162,423 | 224,497 | ||||||||
Engineering and development |
27,626 | 29,149 | 36,268 | ||||||||
Selling, general, and administrative |
75,287 | 78,104 | 100,588 | ||||||||
Depreciation and amortization of property and equipment |
23,114 | 25,286 | 32,247 | ||||||||
Amortization of intangible assets |
25,626 | 25,734 | 32,353 | ||||||||
Total operating expenses |
315,242 | 320,696 | 425,953 | ||||||||
Income from operations |
10,322 | 23,295 | 48,864 | ||||||||
Interest expense |
(16,655 | ) | (10,868 | ) | (58,553 | ) | |||||
Interest income |
1,105 | 707 | 497 | ||||||||
Other income (expense), net |
2,356 | (241 | ) | 471 | |||||||
(Loss) income before income tax provision, and equity in net (loss) of unconsolidated affiliates |
(2,872 | ) | 12,893 | (8,721 | ) | ||||||
Income tax benefit (provision) |
(586 | ) | (9,213 | ) | 6,777 | ||||||
Equity in net (loss) income of unconsolidated affiliates |
643 | (202 | ) | (115 | ) | ||||||
Net (loss) income |
$ | (2,815 | ) | 3,478 | (2,059 | ) | |||||
Basic and diluted net income (loss) per common share |
$ | (0.12 | ) | $ | 0.14 | $ | (0.08 | ) | |||
Basic weighted average common shares outstanding |
24,203,735 | 24,763,299 | 25,402,506 | ||||||||
Diluted weighted average common shares outstanding |
24,203,735 | 25,195,521 | 25,402,506 | ||||||||
Dividends declared per common share |
$ | 4.00 | $ | — | $ | — | |||||
See accompanying notes.
58
CONSOLIDATED STATEMENTS OF STOCKHOLDERS' EQUITY
| |
Common Stock | |
|
|
Accumulated other comprehensive income (loss) |
|
|
||||||||||||||||||
|---|---|---|---|---|---|---|---|---|---|---|---|---|---|---|---|---|---|---|---|---|---|---|---|---|---|
| |
Treasury Stock |
Additional paid-in capital |
Accumulated deficit |
Total stockholders' equity |
Comprehensive (loss) income |
||||||||||||||||||||
| |
Shares | Amount | |||||||||||||||||||||||
| |
(in thousands, except per share and share amounts) |
||||||||||||||||||||||||
Balance, December 31, 2006 |
24,145,804 | 24 | (605 | ) | 218,099 | (41,463 | ) | 3,210 | 179,265 | ||||||||||||||||
Exercise of employee stock options |
5,545 | — | — | 78 | — | — | 78 | ||||||||||||||||||
Issuance of common stock upon vesting of restricted stock units |
196,724 | — | — | — | — | — | — | ||||||||||||||||||
Tax benefit of share based payments |
— | — | — | 277 | — | — | 277 | ||||||||||||||||||
Purchase of treasury stock |
(929 | ) | — | — | — | (929 | ) | ||||||||||||||||||
Stock compensation expense |
— | — | — | 12,620 | — | — | 12,620 | ||||||||||||||||||
Foreign currency translation |
— | — | — | — | — | 2,070 | 2,070 | $ | 2,070 | ||||||||||||||||
Special cash dividend declared, $4 per common share |
— | — | — | (98,294 | ) | — | — | (98,294 | ) | ||||||||||||||||
Retirement of treasury shares |
(73,878 | ) | — | 1,295 | (1,295 | ) | — | — | — | ||||||||||||||||
Net loss |
— | — | — | — | (2,815 | ) | — | (2,815 | ) | (2,815 | ) | ||||||||||||||
Balance, December 31, 2007 |
24,274,195 | $ | 24 | $ | (239 | ) | $ | 131,485 | $ | (44,278 | ) | $ | 5,280 | $ | 92,272 | ||||||||||
Total, December 31, 2007 |
$ | (745 | ) | ||||||||||||||||||||||
Exercise of employee stock options |
543,328 | 1 | — | 9,588 | — | — | 9,589 | ||||||||||||||||||
Issuance of common stock upon vesting of restricted stock units |
364,627 | — | — | — | — | — | — | ||||||||||||||||||
Tax benefit of share based payments |
— | — | — | 284 | — | — | 284 | ||||||||||||||||||
Purchase of treasury stock |
— | — | (2,162 | ) | — | — | — | (2,162 | ) | ||||||||||||||||
Stock compensation expense |
— | — | — | 11,305 | — | — | 11,305 | ||||||||||||||||||
Foreign currency translation |
— | — | — | — | — | (11,951 | ) | (11,951 | ) | $ | (11,951 | ) | |||||||||||||
Retirement of treasury shares |
(100,143 | ) | — | 1,823 | (1,823 | ) | — | — | — | ||||||||||||||||
Net income |
— | — | — | — | 3,478 | — | 3,478 | 3,478 | |||||||||||||||||
Balance, December 31, 2008 |
25,082,007 | $ | 25 | $ | (578 | ) | $ | 150,839 | $ | (40,800 | ) | $ | (6,671 | ) | $ | 102,815 | |||||||||
Total, December 31, 2008 |
$ | (8,473 | ) | ||||||||||||||||||||||
Issuance of common stock upon vesting of restricted stock units |
402,514 | — | — | — | — | — | |||||||||||||||||||
Exercise of employee stock options |
472,923 | 1 | — | 8,141 | — | — | 8,142 | ||||||||||||||||||
Tax benefit of share based payments |
— | — | — | (646 | ) | — | — | (646 | ) | ||||||||||||||||
Purchase of treasury stock |
— | — | (1,861 | ) | — | — | — | (1,861 | ) | ||||||||||||||||
Stock compensation expense |
— | — | — | 10,446 | — | — | 10,446 | ||||||||||||||||||
Foreign currency translation |
— | — | — | — | — | 4,503 | 4,503 | 4,503 | |||||||||||||||||
Net loss |
— | — | — | — | (2,059 | ) | — | (2,059 | ) | (2,059 | ) | ||||||||||||||
Balance, December 31, 2009 |
25,957,444 | $ | 26 | $ | (2,439 | ) | $ | 168,780 | $ | (42,859 | ) | $ | (2,168 | ) | $ | 121,340 | |||||||||
Total, December 31, 2009 |
$ | 2,444 | |||||||||||||||||||||||
See accompanying notes.
59
TNS, INC.
CONSOLIDATED STATEMENTS OF CASH FLOWS
| |
Year ended December 31, | ||||||||||||
|---|---|---|---|---|---|---|---|---|---|---|---|---|---|
| |
2007 | 2008 | 2009 | ||||||||||
| |
(in thousands) |
||||||||||||
Cash flows from operating activities: |
|||||||||||||
Net (loss) income |
$ | (2,815 | ) | $ | 3,478 | $ | (2,059 | ) | |||||
Adjustments to reconcile net (loss) income to net cash provided by operating activities: |
|||||||||||||
Depreciation and amortization of property and equipment |
23,114 | 25,286 | 32,247 | ||||||||||
Amortization of intangible assets |
25,626 | 25,734 | 32,353 | ||||||||||
Deferred income tax (benefit) provision |
(10,136 | ) | 4,960 | (12,685 | ) | ||||||||
Loss on disposal of property and equipment |
60 | 165 | 25 | ||||||||||
Amortization of deferred financing costs and debt discount |
722 | 722 | 7,126 | ||||||||||
Loss on debt extinguishment |
1,368 | — | 26,944 | ||||||||||
Equity in net loss of unconsolidated affiliates |
118 | 202 | 115 | ||||||||||
Stock compensation |
12,620 | 11,305 | 10,446 | ||||||||||
Changes in operating assets and liabilities, net of effect of acquisitions: |
|||||||||||||
Accounts receivable, net |
(7,227 | ) | (174 | ) | 8,888 | ||||||||
Other current and noncurrent assets |
3,549 | (368 | ) | (11,344 | ) | ||||||||
Accounts payable and accrued expenses |
290 | 3,585 | 17,932 | ||||||||||
Deferred revenue |
(3,648 | ) | (4,115 | ) | (3,533 | ) | |||||||
Other current and noncurrent liabilities |
(1,679 | ) | 2,945 | (998 | ) | ||||||||
Net cash provided by operating activities |
41,962 | 73,725 | 105,457 | ||||||||||
Cash flows from investing activities: |
|||||||||||||
Purchases of property and equipment |
(19,526 | ) | (32,047 | ) | (40,638 | ) | |||||||
Proceeds from sale of property and equipment |
2,164 | — | — | ||||||||||
Cash paid for business acquisitions, net of cash acquired |
(4,166 | ) | — | (230,656 | ) | ||||||||
Proceeds from sale of unconsolidated affiliates |
888 | — | — | ||||||||||
Net cash used in investing activities |
(20,640 | ) | (32,047 | ) | (271,294 | ) | |||||||
Cash flows from financing activities: |
|||||||||||||
Net proceeds from issuance of long-term debt |
221,949 | — | 516,335 | ||||||||||
Net borrowings on revolving credit facility |
— | — | 48,522 | ||||||||||
Repayment of long-term debt |
(142,813 | ) | (27,000 | ) | (408,500 | ) | |||||||
Payment of long-term debt financing costs |
— | (75 | ) | (175 | ) | ||||||||
Proceeds from stock option exercises |
78 | 9,589 | 8,142 | ||||||||||
Excess tax benefits from share based payments |
277 | 284 | |||||||||||
Payment of special cash dividend, $4 per common share |
(98,294 | ) | — | — | |||||||||
Purchase of treasury stock |
(929 | ) | (2,162 | ) | (1,861 | ) | |||||||
Net cash (used in) provided by financing activities |
(19,732 | ) | (19,364 | ) | 162,463 | ||||||||
Effect of exchange rates on cash and cash equivalents |
(1,107 | ) | (1,268 | ) | (2,997 | ) | |||||||
Net increase (decrease) in cash and cash equivalents |
483 | 21,046 | (6,371 | ) | |||||||||
Cash and cash equivalents, beginning of year |
17,322 | 17,805 | 38,851 | ||||||||||
Cash and cash equivalents, end of year |
$ | 17,805 | $ | 38,851 | $ | 32,480 | |||||||
Supplemental disclosures of cash flow information: |
|||||||||||||
Cash paid for interest |
$ | 15,636 | $ | 10,835 | $ | 22,281 | |||||||
Cash paid for income taxes |
$ | 13,863 | $ | 2,547 | $ | 2,192 | |||||||
See accompanying notes.
60
TNS, INC.
NOTES TO CONSOLIDATED FINANCIAL STATEMENTS
December 31, 2009
1. The Company:
Business Description
TNS, Inc. (TNS or the Company) is a Delaware corporation. TNS is a leading provider of business-critical data communications services to processors of credit card, debit card and automated teller machine (ATM) transactions. TNS is also a leading provider of call signaling and database access services to the domestic telecommunications industry and of secure data and voice network services to the global financial services industry. TNS' data communication services enable secure and reliable transmission of time-sensitive, transaction-related information critical to its customers' operations. The Company's customers outsource their data communication requirements to TNS because of the Company's expertise, comprehensive customer support, and cost-effective services. TNS provides services to customers in the United States and increasingly to customers in 40 countries, including Canada, Mexico and countries in Europe, Latin America and the Asia-Pacific region.
The Company provides its services through its multiple data networks, each designed specifically for transaction applications. These networks support a variety of widely accepted communications protocols, are designed to be scalable and are accessible by multiple methods, including dial-up, dedicated, wireless and Internet connections.
In 2009, the Company had four business divisions: (1) the point-of-sale/point-of-service (POS) division, which provides data communications services to payment processors in North America, (2) the telecommunication services division (TSD), which provides call signaling services and database access services and roaming and clearing services primarily to the domestic telecommunications industry, (3) the financial services division (FSD), which provides data and voice communications services to the financial services community in support of the Financial Information eXchange (FIX) messaging protocol and other transaction-oriented trading applications, and (4) the international services division (ISD), which markets the Company's POS and financial services in countries outside of North America.
Dividend and Recapitalization
On March 28, 2007, the Company's board of directors declared a special dividend of $4.00 per common share which was paid on April 12, 2007. Also, on March 28, 2007, the Company entered into a secured credit facility (2007 Credit Facility), which consisted of two facilities: a senior secured term loan facility in an aggregate principal amount of $225 million and a senior secured revolving credit facility in an aggregate principal amount of $15 million. The Company used approximately $98.3 million of the proceeds from the term facility to pay the special dividend. The remainder of the proceeds from the term facility were used to refinance existing debt, to pay fees related to the 2007 Credit Facility and the special dividend and for general corporate purposes. The 2007 Credit Facility was refinanced in 2009 as part of the May 2009 Credit Facility. See Note 5.
On February 25, 2010, the Company's board of directors approved the retirement of 205,997 shares of treasury stock.
61
TNS, INC.
NOTES TO CONSOLIDATED FINANCIAL STATEMENTS (Continued)
December 31, 2009
2. Summary of Significant Accounting Policies:
Principles of Consolidation
The consolidated financial statements include the accounts of the Company and its subsidiaries. All significant intercompany accounts and transactions are eliminated upon consolidation. The Company consolidates investments where it has a controlling financial interest as defined by Financial Accounting Standards Board (FASB) Accounting Standards Codification (ASC) Topic 810, Consolidation. The usual condition for controlling financial interest is ownership of a majority of the voting interest and, therefore, as a general rule ownership, directly or indirectly, of over fifty percent of the outstanding voting shares is a condition pointing towards consolidation. For investments in variable interest entities the Company consolidates when it is determined to be the primary beneficiary of the variable interest entity. For those investments in entities where the Company has significant influence over operations, but where the Company neither has a controlling financial interest nor is the primary beneficiary of a variable interest entity, the Company follows the equity-method of accounting pursuant to FASB ASC 323, Investments—Equity Method and Joint Ventures.
Use of Estimates
The preparation of financial statements in conformity with accounting principles generally accepted in the United States requires management to make estimates and assumptions that affect the reported amounts of certain assets and liabilities and disclosure of contingent assets and liabilities at the date of the financial statements. Significant estimates affecting the consolidated financial statements include management's judgments regarding the allowance for doubtful accounts, realization of deferred tax assets, future cash flows from long-lived assets, accrued expenses for probable losses, and estimates related to the fair value of the Company's employee stock options, including volatility, expected term and estimates of forfeitures in future periods. Actual results could differ from those estimates.
Revenue Recognition
The Company recognizes revenue when persuasive evidence of an agreement exists, the terms are fixed and determinable, services are performed, and collection is probable. Cash received in advance of revenue recognition is recorded as deferred revenue.
POS services revenue is derived primarily from per transaction fees paid by the Company's customers for the transmission of transaction data, through the Company's networks, between payment processors and POS or ATM terminals and monthly recurring fees for broadband and wireless offerings. TSD revenue is derived primarily from fixed monthly fees for call signaling services and per message fees charged for database access, call validation and roaming and clearing services. FSD revenue is derived primarily from monthly recurring fees based on the number of customer connections to and through the Company's networks.
The Company considers the criteria established primarily by FASB ASC 605-45, "Reporting Revenue Gross as a Principal versus Net as an Agent," in determining whether revenue should be recognized on a gross versus a net basis. Factors considered in determining if gross or net basis recognition is appropriate include whether the Company is primarily responsible to the client for the services, has discretion on vendor selection, or bears credit risk.
62
TNS, INC.
NOTES TO CONSOLIDATED FINANCIAL STATEMENTS (Continued)
December 31, 2009
2. Summary of Significant Accounting Policies: (Continued)
Incentives granted to new customers or upon contract renewals are deferred and recognized ratably as a reduction of revenue over the contract period to the extent that the incentives are recoverable against the customer's minimum purchase commitments under the contract. Deferred customer incentives were approximately $0.2 million and $0.8 million as of December 31, 2008 and 2009, respectively, of which approximately $0.1 million and $0.3 million was classified in other current assets as of December 31, 2008 and 2009, respectively. The remaining balance was classified in other assets in the accompanying consolidated balance sheets. The Company performs periodic evaluations of its customer base and establishes allowances for estimated credit losses.
In addition, the Company receives installation fees related to the configuration of the customers' systems. Revenue from installation fees is being deferred and recognized ratably over the customer's contractual service period, generally three years. Installation fees were approximately $2.9 million, $4.1 million, and $3.9 million for the years ended December 31, 2007, 2008 and 2009, respectively. Approximately $4.3 million and $5.0 million of installation fees are included in deferred revenue as of December 31, 2008 and 2009, respectively.
Cost of Network Services
Cost of network services is comprised primarily of telecommunications charges, which include data transmission and database access charges, leased digital capacity charges, circuit installation charges, activation charges and compensation paid to the providers of calling name and line information database records. The cost of data transmission is based on a contract or tariff rate per minute of usage in addition to a prescribed rate per transaction for certain vendors. The costs of database access, circuits, installation and activation charges are based on fixed fee contracts with local exchange carriers and interexchange carriers. The compensation charges paid to the providers of calling name and line information database records are based on a percentage of query revenue generated from the Company's customers accessing those records. The cost of network services also includes salaries, equipment maintenance and other costs related to the ongoing operation of the Company's data networks. These costs are expensed by the Company as incurred. The Company recognizes a liability for telecommunications charges based upon network services utilized at historical invoiced rates. Direct costs of installations are deferred and amortized over the customers contracted service period, generally three years. Deferred installation costs as of December 31, 2008 and 2009 were approximately $2.4 million and $2.4 million, respectively, and are classified as other current assets and other assets in the accompanying consolidated balance sheets. Depreciation expense on network equipment was approximately $15.4 million, $16.3 million, and $23.6 million for the years ended December 31, 2007, 2008 and 2009, respectively, and is included in depreciation and amortization of property and equipment in the accompanying consolidated statements of operations. Amortization expense on developed technology, an intangible asset recorded in various acquisitions was approximately $4.0 million, $4.6 million, and $5.0 million for the years ended December 31, 2007, 2008 and 2009, respectively and is included in amortization of intangible assets in the accompanying consolidated statements of operations.
63
TNS, INC.
NOTES TO CONSOLIDATED FINANCIAL STATEMENTS (Continued)
December 31, 2009
2. Summary of Significant Accounting Policies: (Continued)
Cash and Cash Equivalents
The Company considers all highly liquid investments with an original maturity of three months or less to be cash and cash equivalents.
Concentrations of Credit Risk
Financial instruments that potentially subject the Company to significant concentrations of credit risk consist principally of cash and cash equivalents and accounts receivable. The Company does not, as a matter of policy, require collateral on credit granted to customers. The Company performs periodic evaluations of its customer base and establishes allowances for estimated credit losses.
Fair Value of Financial Instruments
In September 2006, the FASB issued FASB ASC 820, Fair Value Measurements and Disclosures. FASB ASC 820 defines fair value, establishes a framework for measuring fair value in accordance with generally accepted accounting principles, and expands disclosures about fair value measurements. In February 2007, the FASB issued FASB ASC 825, Financial Instruments. FASB ASC 825 permits entities to choose to measure many financial assets and financial liabilities at fair value. For financial assets and financial liabilities, FASB ASC 820 was effective for the Company on January 1, 2008. The adoption of FASB ASC 820 to the Company's financial assets and financial liabilities did not have a material effect on the Company's consolidated financial statements. As we did not elect to fair value any of our financial instruments under the provisions of FASB ASC 825, the adoption of this statement did not have any impact on our financial position or results of operations.
The fair value of the Company's long-term debt is based upon quoted market prices for the same and similar issues giving consideration to quality, interest rates, maturity and other characteristics. As of December 31, 2009, the Company believes the carrying amount of its long-term debt approximates its fair value since the variable interest rate of the debt approximates a market rate. See Note 5 for further discussions regarding application of fair value to our debt instruments.
Allowance for doubtful accounts
The allowance for doubtful accounts reflects the company's estimate of credit exposure, determined principally on the basis of its collection experience, aging of its receivables and significant individual account credit risks.
Inventory
Inventory is stated at the lower of cost or market, using the average cost method. Inventory consists primarily of network and computer parts and equipment. The Company's products are subject to technological change and changes in the Company's respective competitive markets. It is possible that new product launches or changes in customer demand could result in unforeseen changes in inventory requirements for which no write-down has been recorded.
64
TNS, INC.
NOTES TO CONSOLIDATED FINANCIAL STATEMENTS (Continued)
December 31, 2009
2. Summary of Significant Accounting Policies: (Continued)
Long-Lived Assets
In accordance with FASB ASC 360, Property, Plant and Equipment, and FASB ASC 350, Intangibles—Goodwill and Other, the Company reviews its long-lived assets, including property and equipment, capitalized software development costs and definite-lived intangibles, for impairment whenever events or changes in circumstances indicate that the carrying amount of the assets may not be fully recoverable. To determine recoverability of its long-lived assets, the Company evaluates the probability that future undiscounted net cash flows will be less than the carrying amount of the assets. If future estimated undiscounted cash flows are less than the carrying amount of long-lived assets, then such assets are written down to their estimated fair value.
For purposes of measuring and recognizing impairment of long-lived assets, including definite-lived intangibles, the Company assesses whether separate cash flows can be attributed to the individual asset. Included in amortization of intangibles expense for the years ended December 31, 2007, 2008 and 2009 is approximately $1.5 million, $2.2 million and $0.4 million, respectively, in accelerated amortization on a portion of the Company's customer relationship assets in connection with the loss of certain customers, primarily POS customers, during those respective periods. In the past, the Company experienced revenue and transaction volume declines with a major customer. The net book value of the customer relationship intangible asset assigned to this customer is approximately $17.9 million as of December 31, 2009. The Company assessed the recoverability of this customer relationship intangible asset based upon anticipated undiscounted future cash flows and concluded that no impairment existed as of December 31, 2009.
The Company's estimates of anticipated cash flows could be reduced significantly in the future due to changes in technologies, regulation, available financing, competition or other circumstances. As a result, the carrying amount of long-lived assets could be reduced through impairment charges in the future. Additionally, changes in estimated future cash flows could result in a change to the method of amortization or a shortening of estimated useful lives for long-lived assets including intangibles.
Property and Equipment
Property and equipment is recorded at acquisition date cost or fair value, as appropriate, net of accumulated depreciation and amortization. Replacements and improvements that extend the useful life of property and equipment are capitalized. In accordance with FASB ASC 350, Intangibles—Goodwill and Other, costs for internal use software that are incurred in the preliminary project stage and the post-implementation and operation stage are expensed as incurred. Costs incurred during the application development stage are capitalized and amortized over the estimated useful life of the software.
65
TNS, INC.
NOTES TO CONSOLIDATED FINANCIAL STATEMENTS (Continued)
December 31, 2009
2. Summary of Significant Accounting Policies: (Continued)
Depreciation and amortization of property and equipment is computed using the straight-line method over the estimated useful lives of the assets as follows:
Network equipment and purchased software |
3 – 7 years | |
Office furniture and equipment |
3 – 5 years | |
Leasehold improvements |
Shorter of the useful life or the lease term, generally 5 – 15 years | |
Capitalized software development |
3 – 5 years | |
Buildings |
39 years | |
Land |
Indefinite |
Goodwill and Identifiable Intangible Assets
The Company accounts for goodwill and identifiable intangible assets in accordance with FASB ASC 350, Intangibles—Goodwill and Other. Under this standard, goodwill and intangible assets deemed to have indefinite lives are not amortized and are subject to annual impairment tests or between annual tests if events occur or circumstances change that would more likely than not reduce the fair value of a reporting unit below its carrying amount. The Company performs its annual impairment testing of its goodwill as of October 1 of each year. The Company is required to determine the fair value of each reporting unit and compare it to the carrying amount of the reporting unit. Fair value of the reporting unit is determined using a market based approach. If the carrying amount of the reporting unit exceeds the fair value of the reporting unit, the Company performs the second step of the impairment test, as this is an indication that the reporting unit goodwill may be impaired. In the second step of the impairment test, the Company determines the implied fair value of the reporting unit's goodwill. If the carrying value of a reporting unit's goodwill exceeds its implied fair value, then an impairment of goodwill has occurred and the Company must recognize an impairment loss for the difference between the carrying amount and the implied fair value of goodwill. To date, the Company's testing has indicated that there is no impairment of its goodwill and none of its reporting units have failed step one of the goodwill impairment test.
Goodwill increased from 2008 to 2009 due to $4.6 million related to the acquisition of the Communications Services Group (CSG) and $1.0 million due to foreign exchange translation. Amortization of definite-lived intangible assets is recorded on a straight-line or accelerated basis, as appropriate, over their expected useful lives. The Company evaluates the useful lives assigned to intangible assets on a regular basis. Amortization periods are as follows:
Developed technology |
4 – 15 years | |
Trade names |
20 years | |
Customer relationships |
3 – 20 years | |
Non-compete agreements |
2 or 3 years | |
Research and development |
4 years |
66
TNS, INC.
NOTES TO CONSOLIDATED FINANCIAL STATEMENTS (Continued)
December 31, 2009
2. Summary of Significant Accounting Policies: (Continued)
Developed technology represents the Company's proprietary knowledge, including processes and procedures, used to configure its networks. Network equipment and software, both purchased and internally developed, are components used to build the networks and are separately identified assets classified within property and equipment.
Income Taxes
The Company accounts for income taxes in accordance with FASB ASC 740, Income Taxes. Under FASB ASC 740, deferred tax assets or liabilities are computed based upon the difference between financial statement and income tax bases of assets and liabilities using the enacted marginal tax rate. The Company provides a valuation allowance on its net deferred tax assets when it is more likely than not that such assets will not be realized. Deferred income tax expense or benefits are based upon the changes in the asset or liability from period to period. The Company recognizes interest and penalties related to uncertain tax positions in income tax expense.
Effective January 1, 2007, the Company adopted an amendment to FASB ASC 740, Income Taxes which prescribes a recognition threshold and measurement attribute for the financial statement recognition and measurement of a tax position taken, or expected to be taken, in a tax return, and provides guidance on derecognition, classification, interest and penalties, accounting in interim periods, disclosure and transition. The adoption of the amendment did not result in a cumulative adjustment to the Company's accumulated deficit.
Net Income (Loss) Per Common Share
FASB ASC 260, Earnings Per Share, requires the presentation of basic and diluted earnings per share. Basic earnings (loss) per common share is computed by dividing income (loss) attributable to common stockholders by the weighted average number of common shares outstanding for the period. The diluted earnings (loss) per common share data is computed using the weighted average number of common shares outstanding plus the dilutive effect of common stock equivalents, unless the common stock equivalents are anti-dilutive. The treasury stock effect of options to purchase 2,385,656 shares of common stock and 983,446 restricted stock units that were outstanding as of December 31, 2007, options to purchase 885,323 shares of common stock that were outstanding as of December 31, 2008 and options to purchase 1,364,720 shares of common stock and 806,607 restricted stock units that were outstanding as of December 31, 2009 were excluded from the computation of diluted net loss per common share for the years ended December 31, 2007, 2008 and 2009 as their effect would have been anti-dilutive.
67
TNS, INC.
NOTES TO CONSOLIDATED FINANCIAL STATEMENTS (Continued)
December 31, 2009
2. Summary of Significant Accounting Policies: (Continued)
The following details the computation of the net income (loss) per common share (dollars in thousands, except share and per share data):
| |
Year ended December 31, | |||||||||||
|---|---|---|---|---|---|---|---|---|---|---|---|---|
| |
2007 | 2008 | 2009 | |||||||||
Net income (loss) attributable to common stockholders |
$ | (2,815 | ) | 3,478 | (2,059 | ) | ||||||
Weighted average common share calculation: |
||||||||||||
Basic weighted average common shares outstanding |
24,203,735 | 24,763,299 | 25,402,506 | |||||||||
Treasury stock effect of unvested common stock |
— | 288,671 | — | |||||||||
Treasury stock effect of options |
— | 143,551 | — | |||||||||
Diluted weighted average common shares outstanding |
24,203,735 | 25,195,521 | 25,402,506 | |||||||||
Basic and diluted income (loss) per common share |
$ | (0.12 | ) | $ | 0.14 | $ | (0.08 | ) | ||||
Stock-Based Compensation
Effective January 1, 2006, the Company adopted FASB ASC 718, Compensation—Stock Compensation, using the modified prospective transition method. FASB ASC 718 requires all stock-based compensation to employees be measured at fair value and expensed over the requisite service period and also requires an estimate of forfeitures when calculating compensation expense. Refer to Note 6 for additional discussion regarding details of the Company's stock-based compensation plans.
Foreign Currency Translation and Revaluation
The Company has operations in 24 countries outside the United States including the United Kingdom, Austria, Australia, Bermuda, Canada, France, Germany, Hong Kong, India, Ireland, Italy, Japan, Malaysia, Mexico, New Zealand, Poland, Romania, Singapore, South Korea, Spain, Sweden, Thailand, Netherlands and Turkey. The Company has determined that the functional currency of its non-U.S. operations is the local currency. Assets and liabilities denominated in foreign currencies are translated into U.S. dollars at current exchange rates. Operating results are translated into U.S. dollars using the average rates of exchange prevailing during the period. The Company's results of operations are affected by fluctuations in the value of the U.S. dollar as compared with foreign currencies, predominately the euro, the British pound and the Australian dollar. Gains or losses resulting from the translation of assets and liabilities are included as a component of accumulated other comprehensive income (loss) in stockholders' equity, except for the translation effect of intercompany balances that are anticipated to be settled in the foreseeable future, which are included in the statements of operations. For the years ended December 31, 2007, 2008 and 2009, the Company recorded foreign exchange gain (losses) of $2.2 million, $(0.1) million and $0.3 million, respectively, which are included in other (expense) income, net in the accompanying consolidated statements of operations.
Comprehensive Income (Loss)
Comprehensive income (loss) is the change in equity of a business enterprise during a period from transactions and other events and circumstances from non-owner sources. Other comprehensive income
68
TNS, INC.
NOTES TO CONSOLIDATED FINANCIAL STATEMENTS (Continued)
December 31, 2009
2. Summary of Significant Accounting Policies: (Continued)
(loss) refers to revenue, expenses, gains and losses that under accounting principles generally accepted in the United States are included in comprehensive income (loss), but excluded from the determination of net income (loss). The Company's comprehensive income consists solely of foreign currency translation adjustments. The cumulative foreign currency translation adjustment as of December 31, 2008 and 2009 was a $6.6 million and $2.2 million decrease to equity, respectively.
Segment Reporting
The Company provides segment information in accordance with FASB ASC 280, Segment Reporting. The Company classifies its business into two segments: North America and ISD. In addition, the Company's management evaluates revenues for its four business divisions: POS, TSD, FSD and ISD. A significant portion of the Company's North American operating expenses are shared between the POS division, TSD and FSD, and, therefore, management analyzes operating results for these three business divisions on a combined basis. FASB ASC 280 designates the internal information used by management for allocating resources and assessing performance as the source of the Company's reportable segments and requires disclosure about products and services, geographical areas and major customers.
Reclassifications
Certain amounts from prior years have been reclassified to conform to the current year presentation.
Recent Accounting Pronouncements
In September 2006, the FASB issued FASB ASC 820, Fair Value Measurements and Disclosures, which is effective for fiscal years beginning after November 15, 2007. The Company adopted FASB ASC 820 on January 1, 2008. FASB ASC 820 defines fair value, establishes a framework for measuring fair value in GAAP, and expands disclosures about fair value measurements. The adoption of FASB ASC 820 to the Company's financial assets and liabilities did not have a material effect on the Company's consolidated financial statements. In November 2007, the FASB agreed to a one-year deferral of the effective date for nonfinancial assets and liabilities that are recognized or disclosed at fair value on a nonrecurring basis. Accordingly, for nonfinancial assets and liabilities, FASB ASC 820 became effective on January 1, 2009 and the Company has applied its disclosure and measurement provisions prospectively whenever applicable, such as in determining fair values of the assets acquired and liabilities assumed as part of the CSG acquisition described above. We also applied the provisions of FASB ASC 820 in our required goodwill and intangibles annual impairment test performed as of October 1, 2009.
In December 2007, the FASB issued a revision to ASC 805, Business Combinations that establishes principles and requirements for how the acquirer of a business recognizes and measures in its financial statements the identifiable assets acquired, the liabilities assumed, and any noncontrolling interest in the acquiree. The statement also provides guidance for recognizing and measuring the goodwill acquired in the business combination and determines what information to disclose to enable users of the financial statement to evaluate the nature and financial effects of the business combination. The Company adopted the revised FASB ASC 805 on January 1, 2009. Accordingly, any business
69
TNS, INC.
NOTES TO CONSOLIDATED FINANCIAL STATEMENTS (Continued)
December 31, 2009
2. Summary of Significant Accounting Policies: (Continued)
combination we engage in beginning January 1, 2009 will be recorded and disclosed following the revised FASB ASC 805. The application of FASB ASC 805 to the CSG acquisition is detailed in the acquisition section above and in Note 3.
In June 2008, the FASB issued an amendment to ASC 260, Earnings Per Share. This amendment provides that unvested share-based payment awards that contain nonforfeitable rights to dividends or dividend equivalents (whether paid or unpaid) are participating securities and shall be included in the computation of earnings per share pursuant to the two-class method. The amendment is effective for financial statements issued for fiscal years beginning after December 15, 2008, and interim periods within those years. The adoption of the amendment on January 1, 2009 did not have any material effect on the Company's consolidated financial statements.
In May 2009, the FASB issued FASB ASC 855, Subsequent Events, which is effective for interim or annual periods ending after June 15, 2009. The standard establishes principles and requirements for subsequent events. We have adopted FASB ASC 855 in the second quarter of 2009 and the adoption of the standard did not significantly impact our financial statements.
Effective September 30, 2009, the Company adopted Accounting Standards Update No. 2009-01, "Statement of Financial Accounting Standards No. 168—The FASB Accounting Standards Codification and Hierarchy of Generally Accepted Accounting Principles," (ASU 2009-01). ASU 2009-01 did not change U.S. generally accepted accounting principles but combines all nongovernmental authoritative standards into a comprehensive, topically organized online database. All other accounting literature excluded from ASU 2009-01 will be considered nonauthoritative. All references to authoritative accounting literature herein have been made in accordance with ASU 2009-01.
3. Acquisitions and Long-Term Investments:
VeriSign Communications Services Group (CSG)
On March 2, 2009, the Company entered into an Asset Purchase Agreement (the Purchase Agreement), by and between the Company and VeriSign, Inc. (the Seller) pursuant to which the Company agreed to purchase certain assets and assume certain liabilities of the Seller's Communications Services Group (CSG). On May 1, 2009, the Company completed the acquisition in accordance with the terms and conditions of the Purchase Agreement. The initial purchase price was approximately $226.2 million in cash and subject to a post-closing working capital adjustment. During the third quarter of 2009 and fourth quarter of 2009, working capital and other adjustments were made resulting in a $4.5 million increase in the purchase price to $230.7 million. The Company funded the transaction through a new $230 million term loan facility as part of its 2009 Credit Facility (see Note 5). CSG provides call signaling services and intelligent database services such as caller ID, toll-free call routing and local number portability to the U.S. telecommunications industry. In addition, CSG provides wireless roaming and clearing services to mobile phone operators. The Company is integrating CSG into its telecommunications services division. The statements of operations for the year ended December 31, 2009 include the results of CSG from May 1, 2009. In conjunction with the CSG acquisition, the Company incurred total acquisition related costs of $2.5 million, from which $2.2 million were incurred in 2009 and $0.3 million were incurred in 2008. Such costs are included in selling, general and administrative expenses in the accompanying consolidated statement of operations for each of those years.
70
TNS, INC.
NOTES TO CONSOLIDATED FINANCIAL STATEMENTS (Continued)
December 31, 2009
3. Acquisitions and Long-Term Investments: (Continued)
The acquisition of CSG has been accounted for as a business combination under FASB ASC 805, Business Combinations. The Company has commenced the appraisals necessary to assess the fair values of the tangible and intangible assets acquired and liabilities assumed and the amount of goodwill to be recognized as of the acquisition date. As the values of certain assets and liabilities are preliminary in nature, they are subject to adjustment as additional information is obtained about the facts and circumstances that existed as of the acquisition date. The valuations will be finalized within 12 months of the close of the acquisition. When the valuations are finalized, any changes to the preliminary valuation of assets acquired and liabilities assumed may result in significant adjustments to the fair value of net identifiable assets acquired and goodwill.
The fair values of the assets acquired and liabilities assumed were preliminarily determined using the income, cost and market approaches. The fair value measurements were primarily based on significant inputs that are not observable in the market and therefore represent a Level 3 measurement as defined in FASB ASC 820, Fair Value Measurements and Disclosures. Developed technology, research and development and customer relationships were valued using the excess earnings method, a variation on the income method. The excess earnings method considers the use of other assets in the generation of the projected cash flows in order to determine the economic benefit generated by the subject intangible asset. Non competition agreements were valued using the income approach. The income approach indicates value for a subject asset based on the present value of cash flows projected to be generated by the asset. Projected cash flow is discounted at a rate of return that reflects the relative risk of achieving the cash flow and the time value of money. Fixed assets and real estate were valued using the market and cost approaches, as appropriate. The market approach indicates value for a subject asset based on available market pricing for comparable assets. The cost approach indicates value by determining the current cost of replacing an asset with another of equivalent economic utility. The cost to replace a given asset reflects the estimated reproduction or replacement cost for the property, less an allowance for loss in value due to depreciation.
The purchase price for CSG was allocated, on a preliminary basis, as follows (in thousands):
| |
Amount | ||||
|---|---|---|---|---|---|
Purchase price allocation: |
|||||
Accounts receivable, |
$ | 34,766 | |||
Prepaid expenses |
2,963 | ||||
Property and equipment |
44,287 | ||||
Land and buildings |
10,034 | ||||
Goodwill |
4,633 | ||||
Identifiable intangible assets |
|||||
Customer relationships |
141,500 | ||||
Developed technology |
4,800 | ||||
Non competition agreements |
600 | ||||
Research and development |
300 | ||||
Total assets |
243,883 | ||||
Accounts payable, accrued expenses and other current liabilities |
(13,227 | ) | |||
Total purchase price |
230,656 | ||||
71
TNS, INC.
NOTES TO CONSOLIDATED FINANCIAL STATEMENTS (Continued)
December 31, 2009
3. Acquisitions and Long-Term Investments: (Continued)
The amounts allocated to property and equipment are being depreciated on a straight line basis over their weighted average estimated useful lives of 4 years. The amount allocated to buildings is being depreciated on a straight line basis over their estimated useful lives of 39 years. The customer relationships included in intangible assets are being amortized on a straight line basis over 9 years and other intangible assets are being amortized on a straight line basis over 2 to 4 years. The goodwill of $4.6 million is expected to be deductible for tax purposes.
The weighted average amortization period by each major class of assets and in total is as follows (in years):
| |
Weighted average amortization period |
|||
|---|---|---|---|---|
Customer relationships |
9 | |||
Developed technology |
4 | |||
Non competition agreements |
2 | |||
Research and development |
4 | |||
Total weighted average amortization period |
8.8 | |||
The allocation of the purchase price for CSG has not been finalized as of December 31, 2009 as certain information required to confirm the assumptions used in the initial valuation of the acquired assets and liabilities remains outstanding.
Pro Forma Information
The unaudited pro forma information presents the combined operating results of TNS and CSG, with the results prior to the acquisition date adjusted to include the pro forma impact of: the elimination of transactions between TNS and CSG; the adjustment of amortization of intangibles assets and depreciation of fixed assets based on the preliminary purchase price allocation; and the adjustment of interest expense to reflect the incremental borrowings incurred by TNS to complete the acquisition of CSG.
The unaudited pro forma results are presented for illustrative purposes only and do not reflect the realization of potential cost savings, or any related integration costs.
The following unaudited pro forma consolidated results of operations assume that the acquisition of CSG was completed as of January 1, for each of the respective periods presented (dollars in thousands, except per share amounts):
| |
Year ended December 31, |
|||||||
|---|---|---|---|---|---|---|---|---|
| |
2008 | 2009 | ||||||
Operating revenues |
$ | 604,098 | $ | 556,607 | ||||
Net income (loss) |
(4,346 | ) | (2,248 | ) | ||||
Earnings (loss) per common share: |
||||||||
Basic |
$ | (0.18 | ) | $ | (0.09 | ) | ||
Diluted |
$ | (0.18 | ) | $ | (0.09 | ) | ||
72
TNS, INC.
NOTES TO CONSOLIDATED FINANCIAL STATEMENTS (Continued)
December 31, 2009
3. Acquisitions and Long-Term Investments: (Continued)
The CSG historical operating results include the direct costs related to the business and certain allocated costs for services and support functions provided by Verisign, Inc. Included in net income for the years ended December 31, 2008 and 2009 are allocated after tax costs of $17.2 million, or ($0.68) per share, and $4.8 million, or ($0.18) per share, related to those functions, respectively. Because the selected unaudited pro forma consolidated results of operations are based on CSG's operating results during the period when CSG was not under the control, influence or management of TNS, the information presented may not be representative of the results for the periods indicated that would have actually occurred had the acquisition been consummated as of January 1, 2008, nor is it indicative of the future financial or operating results of the combined entity.
The contribution of CSG to the Company's consolidated results was approximately $160.8 million in revenues and $74.5 million of network service costs for the year ended December 31, 2009. Due to the extent and nature of the integration of CSG's operations into the operations of TNS as well as the overlap with the Company's telecommunication services division, remaining amounts related to the contribution of CSG to the Company's consolidated results are not separately identifiable. Accordingly, the stand alone results of CSG for the year ended December 31, 2009 have not been disclosed.
Dialect Payment Technologies, Pty Limited
On June 8, 2007, the Company acquired all of the outstanding shares of Dialect Payment Technologies Pty Limited (Dialect), an Australian provider of internet payment gateway services to the card-not-present transaction market, for a purchase price of $4.2 million, plus direct acquisition costs of approximately $0.4 million. The Company accounted for the transaction as a purchase under the provisions of SFAS No. 141. The Company purchased Dialect primarily to expand its current suite of POS product offerings. During 2008, the Company finalized the purchase accounting for Dialect and the purchase price was allocated as follows (in thousands):
Current assets |
$ | 580 | |||
Accounts receivable |
964 | ||||
Property and equipment |
866 | ||||
Developed technology |
6,315 | ||||
Customer relationships |
5,132 | ||||
Tradename |
168 | ||||
Non-compete agreements |
946 | ||||
Deferred tax asset |
206 | ||||
Accounts payable, accrued expenses and other liabilities |
(1,983 | ) | |||
Deferred revenue |
(8,608 | ) | |||
Net assets acquired |
$ | 4,586 | |||
The amounts allocated to the customer relationships and developed technology are being amortized over their estimated useful life of seven years. The amounts allocated to the non-compete agreements and tradename are being amortized over their estimated useful life of three years and two years, respectively. Unaudited pro forma results of operations are not provided because the historical operating results were not significant and pro forma results would not be significantly different from
73
TNS, INC.
NOTES TO CONSOLIDATED FINANCIAL STATEMENTS (Continued)
December 31, 2009
3. Acquisitions and Long-Term Investments: (Continued)
reported results for the periods presented. The Company's results of operations include the operating results of this acquisition beginning June 8, 2007.
Long-Term Investments
In September 2004, the Company made an investment in AK Jensen Group, Limited (AKJ), a company that provides order routing systems and integrated electronic trading solutions to financial software companies and end clients. The Company purchased 94,429 common shares for $1.0 million and obtained representation on AKJ's board of directors. The Company is accounting for this investment under the equity method of accounting as the Company has significant influence over AKJ's operating and financing activities through its representation on the board of directors. Due to timing of the receipt of AKJ's financial statements, the Company is accounting for the income or loss in this equity method investment on a one month lag. For the years ended December 31, 2007, 2008 and 2009 the Company recognized a net loss in the equity of an unconsolidated affiliate of approximately, $118,000, $201,000 and $115,000 respectively. In August 2007, the Company sold 10% of its holding in AKJ for a gain of $135,000. This amount is included in equity in net (loss) income of unconsolidated affiliates for the year ended December 31, 2007. As of December 31, 2009, the carrying value of the Company's AKJ investment was approximately $0.4 million.
In August 2004, the Company made an investment in WAY Systems, Inc. (WAY), which provides mobile POS transaction infrastructure and solutions for mobile merchants. The Company purchased 5,952,381 shares or 38.5 percent of WAY's Series B convertible preferred stock for $2.5 million and became entitled to representation on WAY's board of directors. The Company accounted for its investment under the equity method of accounting as the Company had significant influence over the financing and operating activities of WAY through its representation on the board of directors. In March 2005, the Company made an additional investment of $0.8 million to purchase 1,910,401 shares of WAY's Series B convertible preferred stock representing an additional 1.9 percent of WAY's outstanding shares. In July 2005, the Company made an additional investment of $0.7 million in exchange for a convertible note bearing interest at a rate of 8 percent per annum and due January 1, 2009. In September 2005, the Company exercised its option on the convertible note to convert the outstanding principal and accrued interest of approximately $0.8 million to 1,185,085 shares of WAY's Series C convertible preferred stock and made an additional investment of $1.1 million to purchase 1,676,429 shares of WAY's Series C convertible preferred stock. During December 2006, in conjunction with management's decision to not advance additional capital to WAY and continuing and projected operating losses from WAY, the Company determined its WAY investment was impaired and recorded a $1.3 million charge to reduce the carrying value of its WAY investment to zero. This is included in equity in net (loss) income of unconsolidated affiliates for the year ended December 31, 2006. In June 2007, the Company sold all of its WAY shares for $625,000, and vacated its seat on the board of directors of WAY Systems, Inc. This gain of $625,000 is included in equity in net (loss) income of unconsolidated affiliates for the year ended December 31, 2007 in the accompanying consolidated statement of operations.
74
TNS, INC.
NOTES TO CONSOLIDATED FINANCIAL STATEMENTS (Continued)
December 31, 2009
4. Balance Sheet Details:
Property and Equipment, Net
Property and equipment consists of the following (in thousands):
| |
December 31, | ||||||
|---|---|---|---|---|---|---|---|
| |
2008 | 2009 | |||||
Network equipment and software |
$ | 104,922 | $ | 178,338 | |||
Office furniture and equipment |
16,126 | 22,458 | |||||
Capitalized software development costs |
40,720 | 50,965 | |||||
Leasehold improvements |
14,521 | 16,864 | |||||
Land and buildings |
— | 10,311 | |||||
|
176,289 | 278,936 | |||||
Accumulated depreciation and amortization |
(117,494 | ) | (153,340 | ) | |||
Property and equipment, net |
$ | 58,795 | $ | 125,596 | |||
In December 2008, approximately $1.1 million of capitalized software costs related to the Company's vending platform were impaired following the decision to discontinue the vending product. This charge is included in depreciation and amortization of property and equipment in the accompanying consolidated statement of operations for the year ended December 31, 2008.
Amortization expense associated with capitalized software was approximately $4.8 million and $5.6 million for the years ended December 31, 2009 and 2008, respectively.
Identifiable Intangible Assets, Net
Identifiable intangible assets consist of the following (in thousands):
| |
December 31, | |||||||
|---|---|---|---|---|---|---|---|---|
| |
2008 | 2009 | ||||||
Customer relationships |
$ | 175,644 | $ | 317,144 | ||||
Accumulated amortization |
(89,559 | ) | (111,740 | ) | ||||
Customer relationships, net |
86,085 | 205,404 | ||||||
Developed technology |
86,142 | 90,942 | ||||||
Accumulated amortization |
(62,473 | ) | (66,231 | ) | ||||
Developed technology, net |
23,669 | 24,711 | ||||||
Trade names |
68,644 | 68,644 | ||||||
Accumulated amortization |
(27,155 | ) | (30,632 | ) | ||||
Trade names, net |
41,489 | 38,012 | ||||||
Non-compete agreements |
9,955 | 10,555 | ||||||
Accumulated amortization |
(9,387 | ) | (10,007 | ) | ||||
Non-compete agreements, net |
568 | 548 | ||||||
Research and development |
— | 300 | ||||||
Accumulated amortization |
— | (50 | ) | |||||
Research and development, net |
— | 250 | ||||||
Identifiable intangible assets, net |
$ | 151,811 | $ | 268,925 | ||||
75
TNS, INC.
NOTES TO CONSOLIDATED FINANCIAL STATEMENTS (Continued)
December 31, 2009
4. Balance Sheet Details: (Continued)
Future scheduled amortization of intangible assets is as follows as of December 31, 2009 (in thousands):
2010 |
$ | 35,469 | ||
2011 |
32,121 | |||
2012 |
30,263 | |||
2013 |
29,413 | |||
2014 |
28,008 | |||
Thereafter |
113,651 | |||
|
$ | 268,925 | ||
Accounts Payable, Accrued Expenses and Other Current Liabilities
Accounts payable, accrued expenses and other current liabilities consist of the following (in thousands):
| |
December 31, | ||||||
|---|---|---|---|---|---|---|---|
| |
2008 | 2009 | |||||
Accounts payable and accrued network costs |
$ | 37,354 | $ | 53,604 | |||
Accrued sales and use tax |
1,554 | 1,141 | |||||
Income taxes payable |
— | 2,975 | |||||
Accrued legal and professional fees |
2,341 | 1,855 | |||||
Accrued compensation and benefits |
7,754 | 16,886 | |||||
Accrued severance and benefits |
953 | 782 | |||||
Accrued interest |
482 | 2,708 | |||||
Accrued customer credits |
147 | 1,250 | |||||
Other accrued expenses |
3,604 | 6,038 | |||||
Other current liabilities |
1,856 | 2,501 | |||||
Accounts payable, accrued expenses and other current liabilities |
$ | 56,045 | $ | 89,740 | |||
5. Long-Term Debt:
Debt consists of the following (in thousands):
| |
December 31, | ||||||
|---|---|---|---|---|---|---|---|
| |
2008 | 2009 | |||||
Revolving credit facility |
$ | — | $ | 49,371 | |||
Term Loan |
178,500 | 325,000 | |||||
Total credit facility outstanding |
178,500 | 374,371 | |||||
Unamortized discount |
— | (4,658 | ) | ||||
|
178,500 | 369,713 | |||||
Less: Current portion, net of discount |
— | (15,119 | ) | ||||
Long-term portion |
$ | 178,500 | $ | 354,594 | |||
76
TNS, INC.
NOTES TO CONSOLIDATED FINANCIAL STATEMENTS (Continued)
December 31, 2009
5. Long-Term Debt: (Continued)
2007 Credit Facility
On March 28, 2007, the Company entered into a $240.0 million senior secured credit facility ("2007 Credit Facility") to finance the special cash dividend and to refinance its 2005 amended and restated senior secured credit facility ("2005 Credit Facility"). This facility was refinanced in May 2009.
May 2009 Credit Facility
On May 1, 2009, the Company entered into a $423.5 million amended and restated senior secured credit facility (May 2009 Credit Facility) to finance the acquisition of the CSG assets from Verisign, Inc. and to refinance the 2007 Credit Facility. The May 2009 Credit Facility consisted of a fully funded term loan facility with an outstanding principal amount equal to $178.5 million, a new fully funded term loan facility with an outstanding principal amount equal to $230.0 million and a senior secured revolving credit facility in an aggregate principal amount of $15.0 million. Interest on the May 2009 Credit Facility was payable, at the Company's option, at the Base Rate plus a margin of 5.0%, or at LIBOR plus a margin of 6.0%. In no event was the Base Rate to be less than 4.5%, or the LIBOR Rate less than 3.5%.
November 2009 Credit Facility
On November 19, 2009 the Company entered into a new secured credit facility (the November 2009 Credit Facility) and refinanced the May 2009 Credit Facility primarily to take advantage of a more favorable interest rate environment. The November 2009 Credit Facility consists of a senior secured term loan facility in an aggregate principal amount of $325 million (the "Term Facility") and a senior secured revolving credit facility in an aggregate principal amount of $75 million (the "Revolving Facility") of which $49.4 million was funded at closing and was outstanding as of December 31, 2009.
In connection with the May and November 2009 refinancings and in accordance with the modifications and extinguishments requirements of FASB ASC 470, Debt, the Company recorded pretax losses of approximately $26.9 million which are classified in interest expense in the accompanying consolidated statement of operations for the year ended December 31, 2009. These losses resulted from recording the new debt at fair value as of the time of the debt exchange and extinguishing the old term loans at their historical book values, and include the write off of unamortized deferred financing costs and debt discount of $23.6 million. Also included in these losses is a $3.3 million term loan call premium charge paid in November 2009 in connection with the refinancing of the May 2009 Credit Facility. Fair value of the new debt was based on quoted market prices for similar debt issuances. The discount created by recording the new debt at fair value is being amortized using the effective interest method over the life of the November 2009 Credit Facility.
Payments on the Term Facility are due in quarterly installments over the term beginning March 31, 2010, with the remainder payable on November 18, 2015. Voluntary prepayments on the Term Facility are applied as directed by the Company. In January 2010, the Company made a voluntary payment of $15 million on the Term Facility which was applied against the first $15 million of scheduled loan repayments due in 2010. The outstanding balance on the Revolving Facility is due on November 18, 2014.
77
TNS, INC.
NOTES TO CONSOLIDATED FINANCIAL STATEMENTS (Continued)
December 31, 2009
5. Long-Term Debt: (Continued)
The total scheduled remaining payments on the November 2009 Credit Facility are as follows (in thousands):
2010 |
$ | 16,250 | ||
2011 |
16,250 | |||
2012 |
16,250 | |||
2013 |
16,250 | |||
2014 |
65,621 | |||
Thereafter |
243,750 | |||
|
$ | 374,371 | ||
Interest on the outstanding balances under the Revolving Facility is payable, at the Company's option, at a rate equal to the higher of the prime rate announced by SunTrust Bank, the federal funds rate plus 50 basis points, or the one-month London Interbank Offered Rate ("LIBOR") rate plus 100 basis points (the "Base Rate"), in each case, plus a margin of 3.0% or at LIBOR, plus a margin of 4.0%. Interest on the outstanding balances under the Term Facility is payable, at the Company's option, at the Base Rate plus a margin of 3.0%, or at LIBOR plus a margin of 4.0%. Additionally, in no event will the LIBOR rate be less than 2.0%. The applicable margins on the Revolving Facility and Term Facility are subject to step-downs based on the Company's leverage ratio. The Revolving Facility is subject to an annual commitment fee in an amount equal to between 0.375% and 0.50% (based on the Company's leverage ratio) per annum multiplied by the amount of funds available for borrowing under the Revolving Facility. Interest payments on the November 2009 Credit Facility are due biweekly, monthly, bimonthly or quarterly at the Company's option.
The weighted average interest rates for the years ended December 31, 2007, 2008 and 2009 were 7.71%, 5.74% and 18.82%, respectively. Excluding the losses on the debt refinancings of $26.9 million, the weighted average interest rate for the year ended December 31, 2009 would have been 10.14%.
The terms of the November 2009 Credit Facility require the Company to make an annual prepayment in an amount that may range from 0% to 50% of the Company's "excess cash flow" (as such term is defined in the Credit Agreement) depending on the Company's Leverage Ratio for any fiscal year. Prepayments are also required to be made in other circumstances, including upon asset sales and sale-leaseback transaction in excess of $2 million. The Company is permitted to repay borrowings under the November 2009 Credit Facility at any time in whole or in part without premium or penalty.
The obligations under the November 2009 Credit Facility are unconditionally and irrevocably guaranteed, subject to certain exceptions, by the Company and each existing and future direct and indirect domestic subsidiary of the Company. In addition, the November 2009 Credit Facility is secured, subject to certain exceptions, by a first priority perfected security interest in substantially all of the present and future property and assets (real and personal) of the Company and a pledge of 100% of the Company's capital stock of its respective domestic subsidiaries and 65% of the Company's capital stock of its respective first-tier foreign subsidiaries.
The terms of the November 2009 Credit Facility require the Company to comply with financial and nonfinancial covenants, including maintaining a maximum specified leverage ratio at the end of each
78
TNS, INC.
NOTES TO CONSOLIDATED FINANCIAL STATEMENTS (Continued)
December 31, 2009
5. Long-Term Debt: (Continued)
fiscal quarter and a minimum consolidated fixed charge coverage ratio and complying with specified annual limits on capital expenditures. As of December 31, 2009, the Company is required to maintain a leverage ratio of less than 3.00 to 1.0. The Company's leverage ratio as of December 31, 2009 was 2.4 to 1.0. The maximum leverage ratio declines over the term of the 2009 Credit Facility. Also beginning December 31, 2009 and as of the end of each subsequent quarter for the twelve month period then ended, the Company is required to maintain a consolidated fixed charge coverage ratio of not less than 2.10 to 1.0. The Company's consolidated fixed charge coverage ratio as of December 31, 2009 was 2.2 to 1.0. The November 2009 Credit Facility also contains nonfinancial covenants that restrict some of the Company's corporate activities, including its ability to dispose of assets, incur additional debt, pay dividends, create liens, make investments, make capital expenditures and engage in specified transactions with affiliates. Noncompliance with any of the financial or nonfinancial covenants without cure or waiver would constitute an event of default under the November 2009 Credit Facility. An event of default resulting from a breach of a financial or nonfinancial covenant may result, at the option of the lenders, in an acceleration of the principal and interest outstanding, and a termination of the Revolving Facility. The November 2009 Credit Facility also contains other customary events of default (subject to specified grace periods), including defaults based on events of bankruptcy and insolvency, nonpayment of principal, interest or fees when due, breach of specified covenants, change in control and material inaccuracy of representations and warranties. The Company was in compliance with the financial and non-financial covenants of the November 2009 Credit Facility as of December 31, 2009.
On closing of the November 2009 Credit Facility, the Company incurred approximately $2.9 million in financing costs. These financing costs were deferred and are being amortized using the effective interest method over the life of the November 2009 Credit Facility.
6. Stock Compensation and Retirement Plans:
Stock-Based Compensation
During 2001, the Board of Directors of the Company adopted the TNS Holdings, Inc. 2001 Founders' Stock Option Plan (the 2001 Plan) whereby employees, nonemployee directors, and certain other individuals are granted the opportunity to acquire an equity interest in the Company. Either incentive stock options or nonqualified options may be granted under the 2001 Plan. Options granted under the 2001 Plan have an exercise price equal to or greater than the estimated fair value of the underlying common stock at the date of grant and become exercisable based on a vesting schedule determined at the date of grant, generally over four years. The options expire 10 years from the date of grant.
In February 2004, the Board of Directors of the Company adopted the TNS, Inc. 2004 Long-Term Incentive Plan (the Plan) and the Company's stockholders approved the Plan in March 2004. The Plan reserves 3,847,384 shares of common stock for grants of incentive stock options, nonqualified stock options, restricted stock awards and performance shares to employees, non-employee directors and consultants performing services for the Company. Options granted under the Plan have an exercise price equal to or greater than the fair market value of the underlying common stock at the date of grant and become exercisable based on a vesting schedule determined at the date of grant, generally in equal monthly installments over three or four years. The options expire 10 years from the date of
79
TNS, INC.
NOTES TO CONSOLIDATED FINANCIAL STATEMENTS (Continued)
December 31, 2009
6. Stock Compensation and Retirement Plans: (Continued)
grant. Restricted stock awards and performance shares granted under the Plan are subject to a vesting period determined at the date of grant, generally in equal annual installments over three or four years.
As discussed in Note 1, effective January 1, 2006, the Company adopted FASB ASC 718, Compensation—Stock Compensation using the modified prospective transition method. During each of the years ended December 31, 2007, 2008 and 2009, the Company capitalized approximately $0.3 million of stock-based compensation costs for employees working on software developed for internal use during the application and development stage.
The Company's stock-based compensation expense is included in the following areas in the consolidated statement of operations for the periods indicated (in thousands):
| |
Year ended December 31, | |||||||||
|---|---|---|---|---|---|---|---|---|---|---|
| |
2007(1) | 2008 | 2009 | |||||||
Cost of network services |
$ | 1,146 | $ | 1,190 | $ | 928 | ||||
Engineering and development |
2,095 | 1,618 | 1,344 | |||||||
Selling, general and administrative |
9,379 | 8,497 | 8,174 | |||||||
|
$ | 12,620 | $ | 11,305 | $ | 10,446 | ||||
- (1)
- On
March 28, 2007, in connection with the special dividend, the Company's Board of Directors decided to allow the outstanding restricted stock units
to receive dividend equivalent payments. As a result of this decision, the Company recorded $1.5 million of additional stock-based compensation, which is included in the total
$12.6 million of stock-based compensation. The $1.5 million charge related to this decision is reported as follows: $0.1 million is included in cost of network services,
$0.4 million is included in engineering and development and $1.0 million is included in selling, general and administrative expenses.
The tax benefit related to the Company's stock-based compensation expense was approximately $1.8 million, $3.2 million, and $3.1 million for the years ended December 31, 2007, 2008 and 2009, respectively.
Details of the Company's stock-based compensation plans are discussed below.
The fair value for stock options granted during the periods were estimated at the grant date using a Black-Scholes option pricing model with the following weighted average assumptions:
| |
Year ended December 31, | |||||||||
|---|---|---|---|---|---|---|---|---|---|---|
| |
2007 | 2008 | 2009 | |||||||
Expected term (in years) |
5.5 | 5.5 | 5.5 | |||||||
Risk-free interest rate |
4.7 | % | 3.3 | % | 3.0 | % | ||||
Volatility |
48.6 | % | 40.5 | % | 49.0 | % | ||||
Dividend yield |
0.0 | % | 0.0 | % | 0.0 | % | ||||
Expected volatility The expected volatility is based on the historical volatility of the Company's stock.
80
TNS, INC.
NOTES TO CONSOLIDATED FINANCIAL STATEMENTS (Continued)
December 31, 2009
6. Stock Compensation and Retirement Plans: (Continued)
Expected dividend yield The dividend yield is based on actual dividends expected to be paid over the expected term of the option. In April of 2007, the Company paid a special cash dividend of $4.00 per share. With the exception of this special dividend, the Company has paid no regular dividends and as of this date has no plans to issue regular dividends.
Expected term The expected term is based on historical exercise patterns of the Company's stock options. The Company accounts for stock options with graded vesting as a single award with the expected term equal to the average of the expected term of the component vesting tranches and recognizes the related compensation cost on a straight-line basis over the vesting period of the award for awards with only time-vesting requirements and on an accelerated basis for awards with performance vesting requirements.
Risk-free interest rate The risk-free rate for stock options granted during the period is determined by using U.S. treasury rates of the same period as the expected option term of each option.
Time-Vested Stock Options
A summary of time-vested option activity under the Plan as of December 31, 2009, and changes during the year then ended, is presented below (in thousands, except share and per share amounts):
| |
Number of shares |
Exercise price per share |
Weighted average exercise price |
Aggregate Intrinsic Value |
Weighted Average Remaining Contractual Term |
|||||||||||
|---|---|---|---|---|---|---|---|---|---|---|---|---|---|---|---|---|
Outstanding, January 1, 2009 |
1,175,186 | $ | 11.88 – $39.20 | $ | 18.69 | |||||||||||
Granted |
8,372 | 7.00 – 21.90 | 18.11 | |||||||||||||
Exercised |
(381,763 | ) | 16.60 – 29.00 | 25.17 | ||||||||||||
Canceled |
(44,552 | ) | 7.00 – 39.20 | 17.77 | ||||||||||||
Outstanding, December 31, 2009 |
757,243 | $ | 7.00 – 39.20 | $ | 18.96 | $ | 5,232,396 | 5.45 | ||||||||
Exercisable, December 31, 2009 |
696,119 | $ | 7.00 – 39.20 | $ | 19.14 | $ | 4,704,948 | 5.27 | ||||||||
81
TNS, INC.
NOTES TO CONSOLIDATED FINANCIAL STATEMENTS (Continued)
December 31, 2009
6. Stock Compensation and Retirement Plans: (Continued)
The following table summarizes the weighted-average option information as of December 31, 2009:
Range of Exercise Prices
|
Number Outstanding |
Weighted Average Remaining Life |
Weighted Average Exercise Price |
Number Exercisable |
Weighted Average Exercise Price |
|||||||||||
|---|---|---|---|---|---|---|---|---|---|---|---|---|---|---|---|---|
$7.00 |
1,290 | 9.16 | 7.00 | 210 | 7.00 | |||||||||||
$11.88 – $15.68 |
125,492 | 7.34 | $ | 12.43 | 101,410 | $ | 12.37 | |||||||||
$15.69 – $19.60 |
254,686 | 3.91 | $ | 18.43 | 243,444 | $ | 18.52 | |||||||||
$19.61 – $23.52 |
360,057 | 5.82 | $ | 21.00 | 335,337 | $ | 20.95 | |||||||||
$23.53 – $27.44 |
5,430 | 5.81 | $ | 24.45 | 5,430 | $ | 24.45 | |||||||||
$39.20 |
10,288 | 3.00 | $ | 39.20 | 10,288 | $ | 39.20 | |||||||||
$7.00 – $39.20 |
757,243 | 5.40 | $ | 18.96 | 696,119 | $ | 19.14 | |||||||||
The Company expects 722,410 of the 757,243 options outstanding as of December 31, 2009 to ultimately vest. The weighted average grant date fair value of options granted during the years ended December 31, 2007, 2008 and 2009 was $6.31, $8.32, and $8.70 respectively. The total intrinsic value of stock options exercised during the years ended December 31, 2007, 2008 and 2009 was approximately $16,000, $2.4 million and $2.7 million, respectively. As of December 31, 2009, there was a total of $0.4 million of unrecognized compensation cost related to time-vested stock options, which is expected to be recognized over a weighted average period of approximately one year.
During the year ended December 31, 2009, the Company received approximately $8.1million in cash related to the exercise of stock options. The adoption of FASB ASC 718 also resulted in reflecting the excess tax benefit from the exercise of stock based compensation awards in cash flows from financing activities.
Performance-Based Stock Options
Performance-based stock options are tied to the Company's annual performance against pre-established internal targets. Under the Company's long-term incentive program, the actual payout under these awards may vary from zero to 200% of an employee's target payout, based upon the Company's actual performance during the fiscal year. The performance-based stock options are also subject to vesting requirements, and generally vest in equal annual installments over three years. The fair value for stock options granted during the period was estimated at the grant date using the Black-Scholes option pricing model, as described above. Compensation cost is based on the expected payout level that will be achieved and is adjusted in subsequent periods as changes in the estimates occur until the performance criteria have been satisfied.
82
TNS, INC.
NOTES TO CONSOLIDATED FINANCIAL STATEMENTS (Continued)
December 31, 2009
6. Stock Compensation and Retirement Plans: (Continued)
A summary of performance-based stock options outstanding as of December 31, 2009, and changes during the year then ended is presented below (in thousands, except share and per share amounts):
| |
Number of shares |
Weighted- average exercise price |
Aggregate Intrinsic Value |
Weighted- average remaining contractual term |
|||||||||
|---|---|---|---|---|---|---|---|---|---|---|---|---|---|
Outstanding, January 1, 2009 |
698,637 | $ | 13.30 | ||||||||||
Granted |
— | — | |||||||||||
Exercised |
(91,160 | ) | 27.02 | ||||||||||
Cancelled |
— | — | |||||||||||
Outstanding at December 31, 2009 |
607,477 | $ | 13.08 | $ | 7,493,005 | 7.47 | |||||||
Exercisable at December 31, 2009 |
325,200 | $ | 12.72 | $ | 4,088,208 | 7.39 | |||||||
The following table summarizes the weighted-average option information as of December 31, 2009:
Range of Exercise Prices
|
Number Outstanding |
Weighted Average Remaining Life |
Weighted Average Exercise Price |
Number Exercisable |
Weighted Average Exercise Price |
|||||||||||
|---|---|---|---|---|---|---|---|---|---|---|---|---|---|---|---|---|
$12.39 |
477,652 | 7.2 | $ | 12.39 | 281,789 | $ | 12.39 | |||||||||
$16.15 |
107,535 | 7.6 | $ | 16.15 | 26,693 | 16.15 | ||||||||||
$20.56 |
22,290 | 7.1 | $ | 20.56 | 16,718 | $ | 20.56 | |||||||||
$12.39 – $20.56 |
607,477 | 7.2 | $ | 13.36 | 325,200 | $ | 13.12 | |||||||||
The Company expects all of the outstanding performance-based options as of December 31, 2009 to ultimately vest. The weighted average grant date fair value of performance-based options granted during the years ended December 31, 2007 and 2008 was $6.23 and $6.78, respectively. The total intrinsic value of stock options exercised during the year ended December 31, 2009 was approximately $1.3 million.
As of December 31, 2009, there was a total of $0.1 million of unrecognized compensation cost related to performance-based stock options, which is expected to be recognized over a weighted average period of approximately two years.
83
TNS, INC.
NOTES TO CONSOLIDATED FINANCIAL STATEMENTS (Continued)
December 31, 2009
6. Stock Compensation and Retirement Plans: (Continued)
Time-Vested Restricted Stock Units
The fair value of restricted stock units is determined based on the closing price of the Company's shares at the date of grant. A summary of the status of the Company's time-vested restricted stock units as of December 31, 2009, and changes during the year then ended is presented below:
| |
Number of shares |
Weighted-average grant-date fair value |
|||||
|---|---|---|---|---|---|---|---|
Non-vested at January 1, 2009 |
557,162 | $ | 16.74 | ||||
Granted |
71,250 | 23.62 | |||||
Vested |
(283,040 | ) | 17.83 | ||||
Forfeited |
(11,698 | ) | 15.82 | ||||
Non-vested at December 31, 2009 |
333,674 | $ | 17.37 | ||||
The Company expects 318,325 of the 333,674 restricted stock units outstanding as of December 31, 2009 to ultimately vest. The total fair value of shares vested (measured as of the vesting date) during the years ended December 31, 2007, 2008 and 2009 was $2.9 million, $6.0 million and $4.8 million, respectively. As of December 31, 2009, there was $4.2 million of unrecognized compensation cost related to restricted stock units, which is expected to be recognized over a weighted average period of approximately one year.
Performance-Based Restricted Stock Units
Performance-based restricted stock units are tied to the Company's annual performance against pre-established internal targets. Under the Company's long-term incentive program, the actual payout under these awards may vary from zero to 200% of an employee's target payout, based upon the Company's actual performance over the fiscal year. The fair value is based on the market price of the Company's stock on the date of grant. The performance-based restricted stock units are also subject to vesting requirements, and generally vest in equal annual installments over three years. Compensation cost is based on the expected payout level that will be achieved and is adjusted in subsequent periods as changes in the estimates occur until the performance criteria have been satisfied.
84
TNS, INC.
NOTES TO CONSOLIDATED FINANCIAL STATEMENTS (Continued)
December 31, 2009
6. Stock Compensation and Retirement Plans: (Continued)
A summary of performance-based restricted stock units outstanding as of December 31, 2009, and changes during the year then ended is presented below:
| |
Number of shares |
Weighted-average grant-date fair value |
|||||
|---|---|---|---|---|---|---|---|
Balance at January 1, 2009 |
289,847 | $ | 16.41 | ||||
Granted(1) |
302,560 | 16.85 | |||||
Cancelled |
— | — | |||||
Vested |
(119,474 | ) | 13.76 | ||||
Balance at December 31, 2009 |
472,933 | $ | 15.99 | ||||
- (1)
- Represents 100% of the targeted payout for the 2009 long-term incentive plan, the results of which were approved by the Company's board of directors in February 2010.
The Company expects all of the outstanding performance-based restricted stock units as of December 31, 2009 to ultimately vest. The total value of shares vested (measured as of the vesting date) during the years ended December 31, 2007, 2008 and 2009 was $0.4 million, $1.3 million and $1.0 million, respectively. As of December 31, 2009, there was a total of $2.6 million of unrecognized compensation cost related to performance-based restricted stock units, which is expected to be recognized over a weighted average period of approximately three years.
Retirement Savings Plan
During 2001, the Company established a 401(k) and profit-sharing plan (the 401(k) Plan). Employees are eligible for the 401(k) Plan on the first payroll of the month following their date of hire. Participants may elect to defer up to 20.0 percent of their salary, and the Company may match up to a maximum of the amount contributed by the employee during the 401(k) Plan year. Profit-sharing contributions are entirely discretionary. Participants are 100 percent vested in all contributions made to the 401(k) Plan. For the year ended December 31, 2007, 2008 and 2009, the Board of Directors approved contributions of approximately $0.6 million, $0.4 million and $0.7 million, respectively, to the 401(k) Plan.
7. Severance and Restructuring Costs
In August 2006, the Company implemented a plan to reduce its cost structure and improve operating efficiencies by reducing its workforce and implementing productivity improvement initiatives and expense reduction measures (2006 Restructuring Plan). In connection with the 2006 Restructuring Plan, the Company incurred approximately $5.6 million of severance associated with its workforce reduction, of which $4.2 million was included in selling, general and administrative expense, $0.8 million was included in engineering and development expense and $0.6 million was included in cost of network services in the consolidated statement of operations for the year ended December 31, 2006 which is not included in this report. Of the total $5.6 million in severance, $5.0 million related to the Company's U.S. operations and $0.6 million related to its International Services Division operations.
85
TNS, INC.
NOTES TO CONSOLIDATED FINANCIAL STATEMENTS (Continued)
December 31, 2009
7. Severance and Restructuring Costs (Continued)
During 2007, the Company incurred an additional $3.0 million in severance and benefits. Of the total, $3.0 million in severance and benefits, $2.7 million is included in selling, general and administrative expense and $0.3 million is included in engineering and development expense in the accompanying consolidated statement of operations for the year ended December 31, 2007.
During 2008, the Company incurred an additional $1.2 million in severance and benefits, which is included in selling, general and administrative expense in the accompanying consolidated statement of operations for the year ended December 31, 2008.
During 2009, the Company incurred an additional $2.0 million in severance and benefits, which is included in selling, general and administrative expense in the accompanying consolidated statement of operations for the year ended December 31, 2009.
A summary of the liability for the Company's severance and benefits obligation is as follows (in thousands):
| |
2007 | 2008 | 2009 | |||||||
|---|---|---|---|---|---|---|---|---|---|---|
Balance as of January 1 |
$ | 4,778 | $ | 4,216 | $ | 953 | ||||
Severance and benefits from executive departures |
3,004 | 1,209 | 2,011 | |||||||
Accretion of liability due to the passage of time |
169 | 59 | 3 | |||||||
Total restructuring costs |
7,951 | 5,484 | 2,967 | |||||||
Effects of foreign currency translation |
142 | 25 | (12 | ) | ||||||
Cash paid |
(3,877 | ) | (4,556 | ) | (2,173 | ) | ||||
Balance as of December 31 |
$ | 4,216 | $ | 953 | $ | 782 | ||||
The above severance and benefits expenses are based on estimates that are subject to change. The remaining cash expenditures relating to the severance and benefits will be paid through 2010. As of December 31, 2009, the liability for severance and benefits was classified as accounts payable, accrued expenses and other liabilities in the accompanying consolidated balance sheet.
8. Income Taxes:
The components of income (loss) before income tax (provision) benefit and equity in net loss of unconsolidated affiliate are as follows (in thousands):
| |
Year ended December 31, | |||||||||
|---|---|---|---|---|---|---|---|---|---|---|
| |
2007 | 2008 | 2009 | |||||||
U.S. |
$ | (33,274 | ) | $ | 7,164 | $ | (30,293 | ) | ||
Non-U.S. |
30,402 | 5,729 | 21,572 | |||||||
Income (loss) before income tax (provision) benefit and equity in net loss of unconsolidated affiliate |
$ | (2,872 | ) | $ | 12,893 | $ | (8,721 | ) | ||
86
TNS, INC.
NOTES TO CONSOLIDATED FINANCIAL STATEMENTS (Continued)
December 31, 2009
8. Income Taxes: (Continued)
The components of the Company's income tax provision (benefit) consisted of the following (in thousands):
| |
Year ended December 31, | |||||||||
|---|---|---|---|---|---|---|---|---|---|---|
| |
2007 | 2008 | 2009 | |||||||
Current provision: |
||||||||||
U.S. |
$ | 143 | $ | 883 | $ | 434 | ||||
Non-U.S. |
10,579 | 3,370 | 5,474 | |||||||
|
10,722 | 4,253 | 5,908 | |||||||
Deferred provision (benefit): |
||||||||||
U.S. |
(7,921 | ) | 5,221 | (11,183 | ) | |||||
Non-U.S. |
(2,215 | ) | (261 | ) | (1,502 | ) | ||||
|
(10,136 | ) | 4,960 | (12,685 | ) | |||||
Total income tax provision (benefit) |
$ | 586 | $ | 9,213 | $ | (6,777 | ) | |||
The components of the Company's net deferred tax assets (liabilities) as of December 31, 2008 consisted of the following (in thousands):
| |
U.S. | Non-U.S. | Total | |||||||
|---|---|---|---|---|---|---|---|---|---|---|
Deferred tax assets: |
||||||||||
Allowance for doubtful accounts |
$ | 781 | $ | 47 | $ | 828 | ||||
Accrued expenses |
1,556 | 179 | 1,735 | |||||||
Deferred revenue |
2,495 | 566 | 3,061 | |||||||
Intangible assets |
3,788 | — | 3,788 | |||||||
Depreciation and amortization of property and equipment |
5,787 | 954 | 6,741 | |||||||
Stock-based compensation |
2,328 | — | 2,328 | |||||||
Equity in net loss of unconsolidated affiliates |
1,407 | — | 1,407 | |||||||
Foreign tax credits |
2,541 | — | 2,541 | |||||||
Other assets |
128 | 293 | 421 | |||||||
Net operating loss carryforwards |
14,906 | 4,264 | 19,170 | |||||||
Capital loss carryforwards |
1,723 | — | 1,723 | |||||||
|
37,440 | 6,303 | 43,743 | |||||||
Less—valuation allowance |
(5,671 | ) | (4,264 | ) | (9,935 | ) | ||||
|
31,769 | 2,039 | 33,808 | |||||||
Deferred tax liabilities: |
||||||||||
Prepaid expenses |
(1,267 | ) | — | (1,267 | ) | |||||
Capitalized software development costs |
(11,570 | ) | — | (11,570 | ) | |||||
Intangible assets |
— | (5,445 | ) | (5,445 | ) | |||||
|
(12,837 | ) | (5,445 | ) | (18,282 | ) | ||||
Net deferred tax assets |
$ | 18,932 | $ | (3,406 | ) | $ | 15,526 | |||
87
TNS, INC.
NOTES TO CONSOLIDATED FINANCIAL STATEMENTS (Continued)
December 31, 2009
8. Income Taxes: (Continued)
The components of the Company's net deferred tax assets (liabilities) as of December 31, 2009, consisted of the following (in thousands):
| |
U.S. | Non-U.S. | Total | |||||||
|---|---|---|---|---|---|---|---|---|---|---|
Deferred tax assets: |
||||||||||
Allowance for doubtful accounts |
$ | 746 | $ | 82 | $ | 828 | ||||
Accrued expenses |
1,670 | 181 | 1,851 | |||||||
Deferred revenue |
1,805 | 566 | 2,371 | |||||||
Intangible assets |
4,644 | 426 | 5,070 | |||||||
Depreciation and amortization of property and equipment |
5,917 | 989 | 6,906 | |||||||
Stock-based compensation |
3,250 | — | 3,250 | |||||||
Equity in net loss of unconsolidated affiliates |
1,407 | — | 1,407 | |||||||
Foreign tax credits |
2,278 | — | 2,278 | |||||||
Research and Development tax credits |
1,886 | — | 1,886 | |||||||
Other assets |
152 | 42 | 194 | |||||||
Net operating loss carryforwards |
23,742 | 4,060 | 27,802 | |||||||
Capital loss carryforwards |
1,723 | — | 1,723 | |||||||
|
49,220 | 6,346 | 55,566 | |||||||
Less—valuation allowance |
(5,408 | ) | (3,705 | ) | (9,113 | ) | ||||
|
43,812 | 2,641 | 46,453 | |||||||
Deferred tax liabilities: |
||||||||||
Prepaid expenses |
(1,438 | ) | (141 | ) | (1,579 | ) | ||||
Unrealized foreign exchange gains/losses |
493 | 493 | ||||||||
Capitalized software development costs |
(12,605 | ) | — | (12,605 | ) | |||||
Intangible assets |
— | (4,103 | ) | (4,103 | ) | |||||
|
(14,043 | ) | (3,751 | ) | (17,878 | ) | ||||
Net deferred tax assets |
$ | 29,769 | $ | (1,110 | ) | $ | 28,659 | |||
The Company has foreign net operating loss carryforwards for tax purposes in jurisdictions outside the U.S. amounting to $11.8 million as of December 31, 2009. The majority of the non-U.S. loss carryforwards will never expire under local country tax rules, however, some of the non-U.S. loss carryforwards will expire in varying amounts in five to ten years. In addition, the Company has a U.S. loss carryforward of approximately $65.5 million, which will begin to expire in 2025. Approximately $3.5 million of the net operating loss relates to the exercise of stock options and vesting of restricted stock, the benefits of which will be credited to equity when realized. The Company also has a foreign tax credit carryforward of $2.3 million, which will begin to expire in 2015, a research and development tax credit carryforward of $1.9 million which will begin to expire in 2023 and a capital loss carryforward of $4.5 million, which will expire in 2012. The Company has provided a valuation allowance against its deferred tax asset related to certain of its foreign net operating loss carryforwards, all of its foreign tax credit carryforwards, and all of its capital loss carryforwards since, in management's judgment, realization of these tax benefits through future income of the requisite character and prior to their expiration is not more likely than not.
88
TNS, INC.
NOTES TO CONSOLIDATED FINANCIAL STATEMENTS (Continued)
December 31, 2009
8. Income Taxes: (Continued)
Taxes computed at the U.S. statutory federal income tax rate of 34.0 percent are reconciled to the Company's effective income tax rate as follows:
| |
Year ended December 31, | |||||||||
|---|---|---|---|---|---|---|---|---|---|---|
| |
2007 | 2008 | 2009 | |||||||
U.S. federal taxes at statutory rate |
34.0 | % | 34.0 | % | 34.0 | % | ||||
U.S. state taxes (net of federal tax benefit) |
6.0 | 4.3 | 4.3 | |||||||
Non-U.S. taxes |
255.8 | 1.4 | 30.6 | |||||||
Valuation allowance |
7.6 | 0.9 | 6.3 | |||||||
Changes in uncertain tax positions |
(114.7 | ) | 12.7 | 6.1 | ||||||
U.S. tax on undistributed foreign earnings |
(95.6 | ) | — | — | ||||||
Stock based compensation expense |
(100.2 | ) | 10.2 | (9.8 | ) | |||||
Research and development credit |
— | — | 16.2 | |||||||
Nondeductible items |
(19.2 | ) | 9.0 | (11.0 | ) | |||||
Effective tax rate |
(26.3 | )% | 72.5 | % | 76.7 | % | ||||
The Company has made no provision for U.S. income taxes or additional foreign taxes on the cumulative unremitted earnings of non-U.S. subsidiaries (approximately $73.5 million as of December 31, 2009) because the Company considers these earnings to be indefinitely reinvested in these foreign locations. These earnings could become subject to additional taxes if remitted as dividends, loaned to the Company or a U.S. affiliate or if it sold the Company's interests in the foreign affiliates. Determination of the amount of any unrecognized deferred U.S. income tax liability associated with these foreign earnings is not practicable due to complexities associated with this hypothetical calculation.
On January 1, 2007 the Company adopted an amendment to FASB ASC 740, Income Taxes. The adoption and implementation of the amendment resulted in a $0.6 million increase in the liability for unrecognized income tax benefits, which was accounted for as an increase to goodwill as the amounts related to pre-acquisition income tax exposures. A reconciliation of the beginning and ending balance for liabilities associated with unrecognized tax benefits is as follows (in thousands):
| |
Year ended December 31, | ||||||
|---|---|---|---|---|---|---|---|
| |
2008 | 2009 | |||||
Balance as of January 1 |
$ | 3,863 | $ | 4,749 | |||
Additions for tax positions related to the current year |
1,584 | 487 | |||||
Reductions for settlements |
(77 | ) | — | ||||
Lapses of applicable statutes of limitation |
(285 | ) | (977 | ) | |||
Effects of foreign currency translation |
(336 | ) | 36 | ||||
Balance as of December 31 |
$ | 4,749 | $ | 4,294 | |||
The Company recognizes interest and penalties accrued related to unrecognized tax benefits as income tax expense. During the years ended December 31, 2007, 2008 and 2009 the Company recognized approximately $79,000, $299,000 and $(86,000) respectively in interest and penalties relating to its liability for unrecognized income tax benefits. The Company had approximately $420,000 and
89
TNS, INC.
NOTES TO CONSOLIDATED FINANCIAL STATEMENTS (Continued)
December 31, 2009
8. Income Taxes: (Continued)
$334,000 accrued for the payment of interest and penalties at December 31, 2008 and 2009, respectively. The entire balance of unrecognized tax benefits as of December 31, 2009 would impact the effective tax rate if recognized. The Company and its subsidiaries are subject to taxation in the U.S. and in various state, local and foreign jurisdictions. The Company remains subject to examination by U.S. Federal, state, local and foreign tax authorities for tax years 2003 through 2009.
It is reasonably possible that the Company's liability for unrecognized tax benefits will decrease in the next 12 months by $0.8 million as a result of the expiration of certain statutes of limitation. In addition, it is also reasonably possible that the Company's liability for unrecognized tax benefits will increase in the next 12 months relating to the structuring of certain U.S. and non-U.S. transactions, the effects of which are still being analyzed.
9. Segment Information:
The Company classifies its business into two segments: North America and ISD. In addition, the Company's management evaluates revenues for its four business divisions: POS, TSD, FSD and ISD. A significant portion of the Company's North American operating expenses are shared between the POS division, TSD and FSD, and, therefore, management analyzes operating results for these three business divisions on a combined basis.
Management evaluates the North American and ISD performance on EBITDA before stock compensation expense because operating expenses are distinguishable between North American and ISD operations. The Company defines EBITDA before stock compensation expense as income from operations before depreciation, amortization and stock compensation expense. EBITDA before stock compensation expense is not a generally accepted accounting principle measure, but rather a measure employed by management to view operating results adjusted for major noncash items. The Company believes that this measure, viewed in addition to and not in lieu of the Company's reported GAAP results, provides additional useful information to the investors regarding the Company's performance and overall operating results exclusive of selected significant non-cash items, as described below. This metric is frequently requested by investors and is also an integral part of the Company's internal reporting to measure the performance of reportable segments and the overall effectiveness of senior management. The Company's definition of EBITDA before stock compensation expense may not be comparable to similarly titled measures used by other entities.
In connection with a reorganization of the Company's divisional management team structure, the Company will begin to report revenues in three business divisions beginning with the three month period ending March 31, 2010. The three business divisions will be the telecommunication services division, the payments division and the financial services division. The Company will no longer separately report ISD.
90
TNS, INC.
NOTES TO CONSOLIDATED FINANCIAL STATEMENTS (Continued)
December 31, 2009
9. Segment Information: (Continued)
Revenue for the Company's two segments is presented below (in thousands):
| |
Year ended December 31, | |||||||||
|---|---|---|---|---|---|---|---|---|---|---|
| |
2007 | 2008 | 2009 | |||||||
Revenues: |
||||||||||
POS |
$ | 81,231 | $ | 74,450 | $ | 76,057 | ||||
TSD |
64,484 | 67,131 | 212,744 | |||||||
FSD |
40,915 | 45,874 | 47,749 | |||||||
Total North America |
186,630 | 187,455 | 336,550 | |||||||
ISD |
138,934 | 156,536 | 138,267 | |||||||
Total revenues |
$ | 325,564 | $ | 343,991 | $ | 474,817 | ||||
EBITDA before stock compensation expense for North American and ISD operations are reflected below (in thousands):
| |
Year ended December 31, | |||||||||
|---|---|---|---|---|---|---|---|---|---|---|
| |
2007 | 2008 | 2009 | |||||||
EBITDA before stock compensation expense(i): |
||||||||||
North America |
$ | 21,200 | $ | 26,072 | $ | 74,956 | ||||
ISD |
50,512 | 59,548 | 48,954 | |||||||
Total EBITDA before stock compensation expense |
$ | 71,712 | $ | 85,620 | $ | 123,910 | ||||
- (i)
- Management evaluates the performance of its segments before consideration of certain intercompany transactions. Accordingly these transactions are not reflected in EBITDA by segment. In addition, certain corporate expenses are reflected in the North American segment, consistent with information reviewed by the Company's chief operating decision maker.
91
TNS, INC.
NOTES TO CONSOLIDATED FINANCIAL STATEMENTS (Continued)
December 31, 2009
9. Segment Information: (Continued)
EBITDA before stock compensation expense differs from income (loss) before income taxes and equity in net loss of unconsolidated affiliates reported in the consolidated statements of operations as follows (in thousands):
| |
Year ended December 31, | |||||||||
|---|---|---|---|---|---|---|---|---|---|---|
| |
2007 | 2008 | 2009 | |||||||
EBITDA before stock compensation expense |
$ | 71,712 | $ | 85,620 | $ | 123,910 | ||||
Reconciling items: |
||||||||||
Stock compensation expense |
(12,620 | ) | (11,305 | ) | (10,446 | ) | ||||
Depreciation and amortization of property and equipment |
(23,114 | ) | (25,286 | ) | (32,247 | ) | ||||
Amortization of intangible assets |
(25,656 | ) | (25,734 | ) | (32,353 | ) | ||||
Interest expense |
(16,655 | ) | (10,868 | ) | (58,553 | ) | ||||
Interest income |
1,105 | 707 | 497 | |||||||
Other income (expense), net |
2,356 | (241 | ) | 471 | ||||||
(Loss) income before income tax provision and equity in net loss of unconsolidated affiliates |
$ | (2,872 | ) | $ | 12,893 | $ | (8,721 | ) | ||
Geographic Information
The Company sells its services through foreign subsidiaries in Australia, Austria, Bermuda, Canada, France, Germany, Hong Kong, India, Ireland, Italy, Japan, Malaysia, Mexico, the Netherlands, New Zealand, Poland, Romania, Singapore, South Korea, Spain, Sweden, Thailand and the United Kingdom. Information regarding revenues and long-lived tangible assets attributable to each geographic region is stated below.
The Company's revenues were generated in the following geographic regions (in thousands):
| |
Year ended December 31, | |||||||||
|---|---|---|---|---|---|---|---|---|---|---|
| |
2007 | 2008 | 2009 | |||||||
North America |
$ | 186,630 | $ | 187,455 | $ | 336,550 | ||||
Europe |
115,244 | 123,825 | 108,486 | |||||||
Asia-Pacific |
23,690 | 32,711 | 29,781 | |||||||
Total revenues |
$ | 325,564 | $ | 343,991 | $ | 474,817 | ||||
The Company's long-lived assets, including goodwill and intangible assets, were located as follows (in thousands):
| |
December 31, | ||||||
|---|---|---|---|---|---|---|---|
| |
2008 | 2009 | |||||
North America |
$ | 182,990 | $ | 369,905 | |||
Europe |
23,408 | 22,527 | |||||
Asia-Pacific |
15,162 | 18,670 | |||||
Total long-lived assets |
$ | 221,560 | $ | 411,102 | |||
92
TNS, INC.
NOTES TO CONSOLIDATED FINANCIAL STATEMENTS (Continued)
December 31, 2009
9. Segment Information: (Continued)