Attached files
| file | filename |
|---|---|
| EX-23.1 - EDELMAN FINANCIAL GROUP INC. | v177327_ex23-1.htm |
| EX-31.1 - EDELMAN FINANCIAL GROUP INC. | v177327_ex31-1.htm |
| EX-32.1 - EDELMAN FINANCIAL GROUP INC. | v177327_ex32-1.htm |
| EX-32.2 - EDELMAN FINANCIAL GROUP INC. | v177327_ex32-2.htm |
| EX-23.2 - EDELMAN FINANCIAL GROUP INC. | v177327_ex23-2.htm |
| EX-31.2 - EDELMAN FINANCIAL GROUP INC. | v177327_ex31-2.htm |
| EX-21.1 - EDELMAN FINANCIAL GROUP INC. | v177327_ex21-1.htm |
| EX-10.06 - EDELMAN FINANCIAL GROUP INC. | v177327_ex10-06.htm |
| EX-10.07 - EDELMAN FINANCIAL GROUP INC. | v177327_ex10-07.htm |
SECURITIES
AND EXCHANGE COMMISSION
Washington,
D.C. 20549
FORM
10-K
(mark
one)
|
x
|
ANNUAL
REPORT PURSUANT TO SECTION 13 OR 15(d) OF THE SECURITIES EXCHANGE ACT OF
1934
|
For
the Fiscal Year Ended December 31, 2009
or
|
¨
|
TRANSITION
REPORT PURSUANT TO SECTION 13 OR 15(d) OF THE SECURITIES EXCHANGE ACT OF
1934
|
Commission
File No. 000-30066
Sanders
Morris Harris Group Inc.
(Exact
name of registrant as specified in its charter)
|
Texas
|
76-0583569
|
|
(State
or other jurisdiction of
|
(I.R.S.
Employer
|
|
incorporation
or organization)
|
Identification
No.)
|
|
600
Travis, Suite 5800
|
|
|
Houston,
Texas
|
77002
|
|
(Address
of principal executive offices)
|
(Zip
code)
|
(713)
993-4610
(Registrant's
telephone number, including area code)
Securities
Registered Pursuant to Section 12(b) of the Act:
None
Securities
Registered Pursuant to Section 12(g) of the Act:
Common
Stock, $0.01 Par Value
(Title of
each class)
Indicate by check mark if the
registrant is a well-known seasoned issuer, as defined in Rule 405 of the
Securities Act.
¨ Yes x No
Indicate by check mark if the
registrant is not required to file reports pursuant to Section 13 or Section
15(d) of the Act.
¨ Yes x No
Indicate by check mark whether the
registrant (1) has filed all reports required to be filed by Section
13 or 15(d) of the Securities Exchange Act of 1934 during the preceding 12
months (or for such shorter period that the registrant was required to file such
reports), and (2) has been subject to such filing requirements for the past 90
days. x Yes ¨ No
Indicate by check mark whether the
registrant has submitted electronically and posted on its corporate Web site, if
any, every Interactive Data File required to be submitted and posted pursuant to
Rule 405 of Regulation S-T (§232.405 of this chapter) during the preceding 12
months (or for such shorter period that the registrant was required to submit
and post such files). ¨ Yes ¨ No
Indicate by check mark if disclosure of
delinquent filers pursuant to Item 405 of Regulation S-K is not contained
herein, and will not be contained, to the best of registrant’s knowledge, in
definitive proxy or information statements incorporated by reference in Part III
of this Form 10-K or any amendment to this Form 10-K. x
Indicate by check mark whether the
registrant is a large accelerated filer, an accelerated filer, a non-accelerated
filer, or a smaller reporting company. See the definitions of “large
accelerated filer,” “accelerated filer” and “smaller reporting company” in Rule
12b-2 of the Exchange Act.
|
Large
accelerated filer ¨
|
Accelerated
filer x
|
|
Non-accelerated
filer ¨
|
Smaller
reporting company ¨
|
Indicate by check mark whether the
registrant is a shell company (as defined in Rule 12b-2 of the Act). ¨ Yes x No
As of June 30, 2009, the aggregate
market value of the shares of Common Stock held by nonaffiliates of the
registrant was $94.8 million. For purposes of this computation, all
executive officers, directors and 10% beneficial owners of the registrant were
deemed to be affiliates. Such determination is not an admission that such
officers, directors, and beneficial owners are, in fact, affiliates of the
registrant.
As of March 10, 2010, the registrant
had 29,953,239 outstanding shares of Common Stock, par value $0.01 per
share.
DOCUMENTS
INCORPORATED BY REFERENCE
Information
in the Registrant's definitive Proxy Statement pertaining to the 2010 Annual
Meeting of Shareholders (the "Proxy Statement") to be filed with the SEC is
incorporated herein by reference into Part III of this Report.
SANDERS
MORRIS HARRIS GROUP INC. AND SUBSIDIARIES
INDEX
|
PART
I
|
||
|
Item
1.
|
Business
|
1
|
|
Item1A.
|
Risk
Factors
|
8
|
|
Item
1B.
|
Unresolved
Staff Comments
|
19
|
|
Item
2.
|
Properties
|
19
|
|
Item
3.
|
Legal
Proceedings
|
19
|
|
Item
4.
|
Reserved
|
20
|
|
PART
II
|
||
|
Item
5.
|
Market
for Registrant's Common Equity, Related Stockholder Matters and
Issuer
|
|
|
Purchases
of Equity Securities
|
21
|
|
|
Item
6.
|
Selected
Financial Data
|
24
|
|
Item
7.
|
Management's
Discussion and Analysis of Financial Condition and
|
|
|
Results
of Operations
|
25
|
|
|
Item
7A.
|
Quantitative
and Qualitative Disclosures About Market Risk
|
35
|
|
Item
8.
|
Financial
Statements and Supplementary Data
|
38
|
|
Item
9.
|
Changes
in and Disagreements with Accountants on Accounting
|
|
|
and
Financial Disclosure
|
72
|
|
|
Item
9A.
|
Controls
and Procedures
|
72
|
|
Item
9B.
|
Other
Information
|
74
|
|
PART
III
|
||
|
Item
10.
|
Directors,
Executive Officers and Corporate Governance
|
75
|
|
Item
11.
|
Executive
Compensation
|
75
|
|
Item
12.
|
Security
Ownership of Certain Beneficial Owners and Management and
Related
|
|
|
Stockholder
Matters
|
75
|
|
|
Item
13.
|
Certain
Relationships and Related Transactions, and Director
Independence
|
75
|
|
Item
14.
|
Principal
Accountant Fees and Services
|
75
|
|
PART
IV
|
||
|
Item
15.
|
Exhibits,
Financial Statement Schedules
|
76
|
PART
I
Item
1. Business
General
Sanders
Morris Harris Group Inc. (“SMHG” or “the Company”) is a wealth management
company. Through our subsidiaries and affiliates, we provide wealth management
services to a wide range of investors. Our businesses include asset
management activities, programs, and products to support our wealth managers. In
addition, we offer a variety of trading, sales, and research services for
institutional investors.
Our
company was formed through the merger in January 2000 of Sanders Morris Mundy
Inc., a Houston-based full-service investment bank, and Harris, Webb &
Garrison, Inc., a Houston securities firm. In 2009, we made
substantial progress in the execution of our strategy to move away from capital
markets operations and focus on wealth management. Since 2000, the
Company has evolved through both organic growth and strategic acquisitions. In
the past ten years, we have:
|
|
•
|
grown
our client assets from approximately $3.2 billion to $11.3
billion;
|
|
|
•
|
increased
our wealth management staff from 56 to 336
employees;
|
|
|
•
|
expanded
our number of client accounts from 21,000 to 71,000;
and
|
|
|
•
|
expanded
our geographic presence by growing from 11 offices in six states to 67
offices in 20 states and the District of
Columbia.
|
We
believe that our strategies have been successful. Our growth in client assets
represents a compound annual growth rate of 12.7%. Our revenue has grown from
$43.9 million in 2000 to $175.4 million in 2009, representing a compound annual
growth rate of 15.5%.
We think
that these operating results validate our operating strategies. Further, we
believe we have in place the people, infrastructure, and brand recognition at
each of our businesses, which, combined with sufficient working capital, will
enable us to leverage our operating platform to further increase our
profitability and market share.
Transition
In 2008
we made a strategic decision to focus our efforts and resources on the wealth
management sector of the financial service industry and to exit certain of the
businesses that we had historically operated. In furtherance of that
decision to reshape our operations, we have completed three steps and are
working on a fourth:
In August
2008, we entered into two agreements to dispose of our interest in Salient
Partners, L.P. and Endowment Advisers, L.P. and its affiliates, which serve as
investment advisor to The Endowment Registered Fund, L.P. and The Endowment TEI
Fund, L.P. Pursuant to these two agreements, we are entitled to receive
aggregate payments of approximately $93.1 million plus interest through
September 2018. As of December 31, 2009, we had received payments of $14.0
million, and had a remaining balance of $79.1 million.
In May
and December 2009, we completed transactions with Ric Edelman and the employees
of Edelman Financial Services, LLC (“EFS”) pursuant to which Mr. Edelman
retained a 24% interest in Edelman Financial Center, LLC, and (i) we purchased
an additional 66% interest in Edelman Financial Advisors, LLC., (ii) Edelman
Financial Advisors, LLC was merged with EFS, and (iii) all cash and stock
payments to Mr. Edelman and the employees of EFS as part of the acquisition were
completed. As a result of these transactions, we have a 76% interest
in all of the Edelman operations.
In
December 2009, we completed a transaction pursuant to which we contributed our
investment banking and certain of our institutional equity and fixed income
trading operations (excluding The Juda Group and the Concept Capital division)
to Madison Williams and Company, LLC, a new entity formed by a number of the
managing directors of the investment banking group and two financial partners.
We received a cash payment of $2.7 million and a note for $8.0 million as part
of this transaction and retain a 17.5% interest in Madison Williams Capital LLC,
subject to call for $4.0 million.
1
In
February 2010, we entered into an agreement with the principals of the Concept
Capital division pursuant to which we agreed to contribute certain of the
assets, properties, and other rights pertaining to the Concept Capital division,
including the prime brokerage, research and capital markets, fund accounting and
administration, and research library businesses, including the Washington
Research Group to Concept Capital Markets, LLC and Concept Capital
Administration, LLC, two new entities formed by the principals of the Concept
Capital division. We will retain a 24% capital interest and 43.48% profit and
loss interest in Concept Capital Markets, LLC and a 43.48% member interest in
Concept Capital Administration, LLC. The terms of the transaction provide
generally that we will retain 50% of the cash and cash equivalents held by the
division at closing. Current members of management of the division will retain
the remaining interests in the new entities. The transaction is expected to
close following approval by the Financial Industry Regulatory Authority
(“FINRA”) of a new member application by Concept Capital Markets, LLC and a
continuing membership application by Sanders Morris Harris Inc., which we
anticipate will be in the second half of 2010.
Our
Products and Services
Our firm
is organized in three major client sectors.
Mass
Affluent
Edelman
Financial Services, LLC (“EFS”) is our largest subsidiary. SMHG owns
76% of EFS. It is managed by our President, Ric Edelman. Although
nearly 1,000 clients have invested more than $1 million with EFS, the business
is centered on serving the mass affluent household; which we define as
households with $50,000 to $1 million in investable assets. The
average household account at EFS has client assets of $352,000. The core of the
Edelman experience is personal financial planning and advice. Most
investments are managed in the Edelman Managed Asset Program (“EMAP”). Through
EMAP, investors get a professionally designed investment portfolio that provides
a broad array of asset classes and market sectors — far greater diversification
than they could normally obtain on their own. EMAP also offers
dynamic security selection, strategic rebalancing, and an array of
state-of-the-art client services, all for a single, fully disclosed annual fee,
calculated as a percentage of client assets under management. Nearly
10,000 investors have placed $4.0 billion in EMAP, making it one of the largest
and fastest-growing investment management programs in the nation.
The Ric Edelman Show provides
listeners with comprehensive, educational financial advice — how to buy a home,
pay for college, prepare for retirement, care for elders, get out of debt, and
invest appropriately for their situation. The show is heard on more than two
dozen radio stations, potentially reaching more than 56 million
households.
In 2009,
Ric Edelman was recognized by Barron’s as the #1
Independent Advisor in the country. Through his best-selling books, nationally
syndicated radio program, monthly newsletter, seminars, media appearances and
websites, he has positively impacted the lives of millions of
Americans.
Ric
Edelman is also a #1 New York
Times bestselling author. His books on personal finance include Ordinary People, Extraordinary
Wealth; The New Rules
of Money; Discover the Wealth Within You; What You Need To Do Now; The Lies
About Money; the personal finance classic, The Truth About Money; and
his newest book, Rescue Your
Money. Collectively, more than 1 million copies of Ric’s books are in
print and have been translated into several languages. Ric also publishes a
monthly newsletter and offers a comprehensive free financial education website
at RicEdelman.com.
In all,
EFS manages $4.5 billion in client assets for nearly 13,000 families. Its legacy
business is in the Washington, D.C. metropolitan area, with 24 financial
planners in three offices, predominantly in its Fairfax, Virginia headquarters.
These offices have approximately 10,000 clients with $3.7 billion in client
assets, and recorded revenue of $44.4 million in 2009, up 182% since
2005. It earned $9.1 million in 2009.
EFS
opened its first six offices outside the Washington D.C. area in September,
2009. They are located in the New York City metropolitan area. Each office is
designed to accommodate one to three financial planners plus support staff. A
new office has an expected cash cost of approximately $250,000 and cash burn of
approximately $500,000 before becoming cash flow positive, which is estimated to
occur between the 12th and
15th
month of operation.
EFS also
has small direct response and outside advisor departments. Between them, they
handle nearly 3,000 clients who have $719.4 million invested with the firm and
recorded revenue of $7.6 million in 2009.
2
High Net
Worth
Our high
net worth business provides investment advisory, wealth and investment
management, asset management and financial planning to high net worth and mass
affluent individuals and institutions. We define high net worth
clients as individuals who have in excess of $1 million in investable
assets.
Each of
our high net worth units generally focuses on a different portion of the wealth
management business in terms of client type and location, asset and product
type, and distribution channel. These business units are generally operated as
individual businesses that market their products under our or their own brand
name, with certain products offered through multiple external and internal
distribution channels. Administrative and back office functions for most of
these units are provided by the parent company. In addition, one or more of our
executive officers serve on the board of directors or management committee of
each of these business units.
Our high
net worth business primarily earns revenue by charging fees for managing the
investment assets of clients. Fees are typically calculated as a percentage of
the value of assets under management and vary with the type of account managed,
the asset manager, and the account size. We believe an asset-based fee structure
helps align our interests with those of our clients, particularly as compared to
a commission-based fee structure, which is based on the number and value of
securities trades executed. Our wealth management business may also earn
performance fees if the investment performance of the assets in the account
meets or exceeds a specified benchmark during a measurement
period. We also generate a substantial portion of revenue from a
traditional, commission-based structure where we earn commissions on client
purchase and sale transactions.
At
December 31, 2009, our high net worth subsidiaries and affiliates had
approximately $6.8 billion in client assets. Our high net worth revenue in 2009
was $48.9 million and pre-tax income from continuing operations was $16.4
million.
We have a
number of affiliates in which we own an interest ranging from 50.1% to
100%. The larger of these are:
Sanders Morris Harris
Inc. Sanders Morris Harris Inc. (“SMH”), member FINRA/
Securities Investor Protection Corporation (“SIPC”), headquartered in Houston,
Texas, provides wealth management services directly through its private client
business and its affiliation with independent contractors who are members of the
SMH Partners program. Its financial advisors (both internal and affiliated
through SMH Partners) serve high net worth clients, many of whom have
long-standing relationships with SMH. As a full service firm, SMH offers its
clients wealth management financial advice relating to equity securities, bonds,
underwritings in which we participate, private placements, mutual funds, defined
contribution plans, wrap-fee programs, money market funds, insurance products,
and tax, trust, and estate advice. At December 31, 2009, SMH had $3.8 billion in
client assets in those channels.
Kissinger Financial
Services. Kissinger Financial Services (“Kissinger”), a
division of SMH based in Hunt Valley, Maryland, provides financial planning and
investment management services to high net worth and mass affluent individuals.
Kissinger derives revenue from fees charged to clients for the preparation of
financial plans and for monitoring services and earns commissions and fees from
investment and insurance products sold to clients. At December 31, 2009,
Kissinger had approximately $314.1 million in client assets.
The Rikoon Group,
LLC. The Rikoon Group, LLC (“Rikoon”), based in Santa Fe, New
Mexico, provides wealth management services to high net worth individuals
including financial and estate planning, investment management services, wealth
education, and family retreats. Rikoon operates nationally with fee
only investment counsel and also offers comprehensive family office
services. At December 31, 2009, Rikoon had approximately $416.5
million in client assets. We own 75% of Rikoon.
Leonetti & Associates,
LLC. Leonetti & Associates, LLC (“Leonetti”), a registered
investment advisor based in Buffalo Grove, Illinois, provides fee-based
investment advice for individuals and small businesses. Leonetti
provides investment management and financial planning services to enhance client
portfolios and help them reach their financial goals. At December 31,
2009, Leonetti had approximately $396.9 million in client assets. We
own 50.1% of Leonetti.
Miller-Green Financial Services,
Inc. Miller-Green Financial Services, Inc. (“Miller-Green”), a
registered investment advisor based in The Woodlands, Texas provides financial,
investment, retirement, and/or estate planning services to individuals and
families. It does extensive pre-retirement planning for a variety of
clients. At December 31, 2009, Miller-Green had approximately $273.2
million in client assets. We own 100% of Miller-Green.
3
The Dickenson Group,
LLC. The Dickenson Group, LLC (“Dickenson”), based in Solon,
Ohio, has extensive expertise in insurance planning for individuals, families,
and businesses as well as employee benefits communications and estate
planning. It serves a number of corporations, practices, and
individuals. We own 50.1% of Dickenson.
Select Sports Group Holdings,
LLC. Select Sports Group Holdings, LLC, (“SSG”) and its
affiliates, based in Houston, Texas, provide sports representation and
management services to professional athletes, principally professional football
players, in contract negotiation, marketing and endorsements, public relations,
legal counseling, and related areas. SSG receives fees from its athlete clients
for the representation and management services provided. Our SSG clients have
access to our investment programs in the areas of stocks, bonds, private equity,
and specialized investment vehicles. Additionally, we provide a deal-screening
program that reviews the numerous investment opportunities offered to
professional athletes. We own 50% of SSG.
SMH Capital Advisors,
Inc. SMH Capital Advisors, Inc. (“SMH Capital Advisors”), a
registered investment advisor located in Fort Worth, Texas, provides investment
management services primarily related to high-yield fixed income securities.
This business is also known by its previous name of Cummer/Moyers. At
December 31, 2009, SMH Capital Advisors had approximately $1.6 billion in client
assets. Its client assets had declined with the high-yield
market’s drop in 2007 and 2008, but rose 48% in 2009, reflecting that market’s
recovery. We own 100% of SMH Capital Advisors.
Additionally,
SMH has organized 19 proprietary funds for the purpose of investing primarily in
equity or equity-linked securities, interest-bearing debt securities, and debt
securities convertible into common stock. These funds invest primarily in small
to mid-capitalization companies, both public and private, that we believe are
either significantly undervalued relative to their growth potential or that have
substantial prospects for capital appreciation. Companies in which the funds
invest represent a number of industries, including life sciences, energy,
technology, and industrial services. We account for our interests in all of
these funds using the equity method, which approximates fair value. At December
31, 2009, the 14 remaining proprietary funds had approximately $284.4 million in
assets under management and committed capital.
Institutional
Services
Our
institutional businesses provide institutional brokerage, fixed income
brokerage, and prime brokerage services to institutional customers.
Institutional
Equity. Our institutional clients include a broad array of
institutions throughout North America, Europe, and Asia, including banks,
retirement funds, mutual funds, endowments, investment advisors, and insurance
companies. Our institutional equity strategy is to provide broad based sales and
trading services, together with equity research coverage focused on companies
concentrated on technology. We provide our institutional clients with execution
and trading services in both exchange-listed equity securities and equity
securities quoted on Nasdaq. Commissions are charged on all institutional
securities transactions based on rates formulated by us. We also distribute
securities which we underwrite to those institutional clients. We
have institutional equity operations in Los Angeles and New York.
Concept
Capital. The Concept Capital division of SMH (“Concept
Capital”), based in New York, which had 98 on staff as of December 31, 2009,
provides prime brokerage services, research and capital markets trading, fund
accounting and administration, and a research library through the Washington
Research Group. We earn commission income on the securities transactions that we
process, interest income from arranging financing for hedge funds on the
platform, and fees for providing various administrative services. The
profitability of this division is directly related to the volume of transactions
that we process, borrowings of the funds, and the administrative services we
provide to them.
Concept
Capital also has asset management agreements with a number of individual third
party asset managers to manage a portfolio of the Company’s assets. The Company
shares in the profits or losses of these accounts and receives the commissions
generated in them. The accounts are designed to diversify the aggregate risks,
thus limiting potential losses or gains. Most of the accounts have escrow
deposits held with the related clearing broker to insulate the Company
from trading losses. We have procedures in place to monitor trading to ensure
that in the event that any escrow deposits are depleted by a manager, activity
is suspended.
4
In 2009,
revenue from our institutional services business was $65.8 million and the
pre-tax loss from continuing operations was $361,000. As noted above,
our plan is to spin-off Concept Capital into a stand alone operation in which we
will retain a minority interest.
Industry
Trends
We
believe that we are well positioned to capitalize on a number of trends in the
financial services industry, including:
|
|
•
|
consolidation
among firms offering financial products and
services;
|
|
|
•
|
continued
and substantial growth in the high net worth and mass affluent
markets;
|
|
|
•
|
increasing
acceptance of alternative investments by many high net worth, mass
affluent, and institutional investors;
and
|
|
|
•
|
increased
demand by investors for unbiased
advice.
|
Our
Strengths
The
ongoing consolidation trend in the financial services industry has provided us
access to many highly skilled professionals who have chosen to be part of a
smaller yet sophisticated firm that has flexibility and preserves an
entrepreneurial environment when providing financial services to clients. We
attribute our success and distinctiveness not only to our highly skilled
professionals but also to the following strengths:
|
|
•
|
Focus on Growing High Net
Worth and Mass Affluent Markets. We offer financial
products and services designed to benefit both high net worth and mass
affluent individuals. We believe that there is a particularly significant
opportunity in providing products and services to the large and growing
mass affluent market.
|
|
|
•
|
Highly Regarded Distribution
Network and Investment Managers. Our wealth management
business includes SMH, Edelman, SMH Capital Advisors, Kissinger, Rikoon,
Dickenson, Leonetti, and Miller-Green, each of which benefits from a sound
regional reputation. Moreover, our wealth advisors and asset managers
include Ric Edelman, the founder of Edelman and our largest shareholder,
named to Barron’s
100 Top Financial Advisors six times (2004 - 2009), SMH Capital Advisors,
a No. 1 ranked firm in 2005 and 2006 by Nelson’s World’s Best Money
Managers, and Don Sanders, our Vice Chairman, who has more than 45
years of investment experience and is well-known and regarded in the
Southwest.
|
|
|
•
|
Regional and Industry
Focus. We are a full-service regional financial services
company based in Texas with 67 offices in 20 states and the District of
Columbia and have achieved a strong brand recognition and sound reputation
in the Southwest. Our presence in Texas allows us to focus our investment
and financial advisory efforts on industries that have established markets
in Texas and the Southwest, including energy, health care, environmental,
technology, financial and business services, retail and consumer products,
and media and communications. We believe that our focus on these
industries has allowed us to develop a level of industry expertise that
distinguishes us from many of our
competitors.
|
|
|
•
|
Alignment of
Interests. Where suitable and permissible, we and
members of our executive management frequently invest in the same
investment opportunities as our clients, which creates a financial
identity of interest and trust among our senior management, our clients,
and us. We believe that by creating these wealth partnerships with our
clients, we and our executives solidify our client relationships by
validating the quality of the products and services that we offer. We also
believe that our unbiased offering of a broad range of both proprietary
and external investment products and our increasing use of an asset-based
fee structure further align our interests with those of our wealth
management clients.
|
|
|
•
|
Proven Management
Team. Our executive management averages more than 30
years of experience in the financial services industry and provides senior
level management to every aspect of our business. Our executive management
is supported by a core team of professionals who also have significant
experience in the financial services industry. Their collective experience
has resulted in a large network of both leaders of corporations and
institutions and affluent investors with whom our executive management has
developed extensive relationships. We strengthen these relationships
further by providing our clients personalized service, senior level
attention, and access to other areas of our
business.
|
5
Our
Strategy
We
believe there is an uncommon opportunity for a high quality wealth management
firm that can tailor its product and service offerings to fit the needs of its
individual, corporate, and institutional clients. Further, we believe we have
put in place the people, infrastructure, and brand recognition at each of our
businesses, which, combined with sufficient working capital, will enable us to
leverage our operating platform to further increase our profitability and market
share. Specifically, we intend to:
|
|
•
|
Capitalize on Growth of Our
Target Markets by Expanding Our Wealth Management
Business. We intend to take advantage of favorable
demographic trends to continue to expand our wealth management business
by:
|
|
|
•
|
continuing
to gather client assets through internal growth, expansion of external
distribution channels, and
acquisitions;
|
|
|
•
|
continuing
to add additional experienced and productive wealth managers and
advisors;
|
|
|
•
|
marketing
the skills of our wealth management professionals to our other business
areas; and
|
|
|
•
|
continuing
to develop, market, and invest in our proprietary
funds.
|
We have
increased our client assets and expanded our product offerings through the
acquisitions of Edelman in 2005, Rikoon in 2007, and Leonetti and Miller-Green
in 2008. At December
31, 2009, Edelman’s client assets were $4.5 billion, Rikoon’s client assets were
$416.5 million, Leonetti’s client assets were $396.9 million, and Miller-Green’s
client assets were $273.2 million.
|
|
•
|
Supplement Internal Growth
with Strategic Acquisitions. We plan to actively pursue
opportunities to acquire all or a significant portion of other
complementary wealth management businesses to gain access to additional
proprietary products to offer our high net worth, mass affluent, and
institutional clients, to gain access to new clients, to increase our
assets under management or advisement, and to expand our geographic base.
We believe that attractive acquisition opportunities exist, particularly
among smaller, specialized regional financial services firms that want to
affiliate with a larger company while still retaining their identity and
entrepreneurial culture. Since 2000, we have acquired or gained control of
14 significant firms with products and services that we believe complement
or expand our client base and the services and products that we provide.
In addition, we believe that the ongoing consolidation trend in the
financial services industry will allow us to continue to hire proven
financial professionals who prefer the culture and opportunities inherent
in an innovative regional firm such as
ours.
|
Marketing
While we
believe cross-selling opportunities exist among our various businesses based on
the relationships developed by the individual companies, each major subsidiary
has its own branding identity subject to an overall Sanders Morris Harris Group
umbrella.
SMH
markets through its 41 offices and through 26 offices of independent registered
representatives who are affiliated with SMH through SMH Partners. SMH targets
its client groups through financial advisor relationships, mailings, telephone
calls, in-person presentations, and firm-sponsored workshops. Due to the nature
of its business, its regional name recognition, and the reputation of its
management, business is obtained through referrals from existing clients,
corporate relationships, investment bankers, or initiated directly by the
client, as well as through senior level calling programs.
Edelman
conducts its marketing efforts through media channels designed to educate
individuals on the subject of personal finance. Ric Edelman hosts a
nationally syndicated weekly radio program in the Washington, D.C. area and in
25 other markets. Ric Edelman also publishes a monthly newsletter,
and is the author of seven books plus video and audio educational programs
designed to help people achieve their financial goals.
SMH
Capital Advisors focuses its marketing and business development efforts on
specific client groups through consultants, mailings, telephone calls, and
multi-media client presentations. Kissinger conducts its marketing and business
development primarily through referrals from existing clients and other
professionals (i.e., accountants and attorneys) and sponsored or co-sponsored
workshops and seminars. The seminars are sponsored by Kissinger, local
employers, government agencies, and local colleges and
universities.
6
Existing
and potential clients can also gain a variety of information about our firm and
the services we provide through the Internet websites for our various
businesses. The information on those websites is not a part of this Annual
Report on Form 10-K.
Competition
The
wealth management and institutional services businesses are highly
competitive. The principal competitive factors influencing our businesses
are:
|
|
•
|
expertise
and quality of the professional
staff;
|
|
|
•
|
reputation
in the marketplace;
|
|
|
•
|
existing
client relationships;
|
|
|
•
|
ability
to commit capital to client
transactions;
|
|
|
•
|
mix
of market capabilities; and
|
|
|
•
|
quality
and price of our products and
services.
|
We
compete directly with many other national and regional full service financial
services firms and, to a lesser extent, with discount brokers, investment
banking firms, investment advisors, broker-dealer subsidiaries of major
commercial bank holding companies, and other companies offering financial
services in the U.S., globally, and through the Internet. We also compete for
wealth management services with commercial banks, private trust companies,
sponsors of mutual funds, insurance companies, financial planning firms, venture
capital, private equity and hedge funds, and other wealth and asset managers. We
believe that our principal competitive advantages include our regional and
industry focus, focus on the growing high net worth and mass affluent markets,
highly regarded distribution network and investment managers, ability to
cross-sell our products, creating wealth partnerships with our clients, and
proven management team.
The
financial services industry has become considerably more concentrated as many
securities firms have either ceased operations or been acquired by or merged
into other firms. Many of these larger firms have significantly greater
financial and other resources than we do and can offer their customers more
product offerings, lower pricing, broader research capabilities, access to
international markets, and other products and services we do not offer, which
may give these firms a competitive advantage over us.
During
2008 and 2009, many of our largest competitors were materially negatively
affected by the global financial crisis. Certain of our larger competitors
ceased to do business, while others merged, obtained substantial government
assistance, and changed their business models and regulatory status, including
becoming bank holding companies. It is likely that the companies that
survive will remain competitors and that they will continue to have resources
and product offerings that will continue to have a competitive impact on
us.
As we
seek to expand our wealth management business, we face competition in the
pursuit of clients interested in our services, the recruitment and retention of
wealth management professionals, and the identification and acquisition of other
wealth management firms that can be integrated into our group.
Government
Regulation
The
securities industry is one of the nation's most extensively regulated
industries. The U.S. Securities and Exchange Commission (“SEC”) is
responsible for the administration of the federal securities laws and serves as
a supervisory body over all national securities exchanges and
associations. The regulation of broker-dealers has to a large extent
been delegated by the federal securities laws to Self Regulatory Organizations
(“SROs”). These SROs include, among others, all the national
securities and commodities exchanges and the FINRA (formerly the
NASD). Subject to approval by the SEC and certain other regulatory
authorities, SROs adopt rules that govern the industry and conduct periodic
examinations of the operations of our broker-dealer subsidiary. Our
broker-dealer subsidiary is registered in all 50 states, Puerto Rico, and the
province of Ontario, Canada and is also subject to regulation under the laws of
these jurisdictions.
7
As a
registered broker-dealer, SMH, our brokerage subsidiary, is subject to certain
net capital requirements of Rule 15c3-1 under the Exchange Act. The
net capital rules, which specify minimum net capital requirements for registered
broker-dealers, are designed to measure the financial soundness and liquidity of
broker-dealers. Failure to maintain the required net capital may
subject a firm to suspension or revocation of registration by the SEC and
suspension or expulsion by other regulatory bodies, and ultimately may require
its liquidation. Further, a decline in a broker-dealer's net capital
below certain “early warning levels”, even though above minimum capital
requirements, could cause material adverse consequences to the
broker-dealer.
As
registered investment advisors under the Investment Advisers Act of 1940, SMH,
SMH Capital Advisors, Edelman, Rikoon, Leonetti, Miller-Green, and certain other
subsidiaries are subject to the requirements of regulations under both the
Investment Advisers Act and certain state securities laws and
regulations. Such requirements relate to, among other things, (1)
limitations on the ability of investment advisors to charge performance-based or
non-refundable fees to clients, (2) record-keeping and reporting requirements,
(3) disclosure requirements, (4) limitations on principal transactions between
an advisor or its affiliates and advisory clients, and (5) general anti-fraud
prohibitions.
Additional
legislation, changes in rules promulgated by the SEC and SROs, or changes in the
interpretation or enforcement of existing laws and rules may directly effect the
mode of our operation and profitability.
Employees
At
December 31, 2009, we had 540 employees. Of these, 20 are in
institutional sales and trading, 9 are in securities analysis and research, 98
are in prime brokerage services, 329 are in investment management, 28 are in
systems development, 7 are in sports representation and management, and 49 are
in accounting, administration, legal, compliance, and support
operations. None of our employees are subject to collective
bargaining agreements. We believe our relations with our employees
generally are good.
Available
Information
Our
annual report on Form 10-K, quarterly reports on Form 10-Q, current reports on
Form 8-K, and amendments to those reports filed or furnished pursuant to Section
13(a) or 15(d) of the Securities Exchange Act of 1934, as well as proxy
statements, are made available free of charge on our internet website, www.smhgroup.com, as
soon as reasonably practicable after we electronically file such material with,
or furnish it to, the SEC.
Additionally,
we make available on our website and in print upon request of any shareholder to
our Chief Financial Officer, a number of our corporate governance documents.
These include: the Audit Committee charter, the Nominating and Corporate
Governance Committee charter, and the Business Ethics Policy for Employees.
Within the time period required by the SEC and the Nasdaq Stock Market, we will
post on our website any modifications to any of the available documents. The
information on our website is not incorporated by reference into this
report.
Our Chief
Financial Officer can be contacted at Sanders Morris Harris Group Inc., 600
Travis, Suite 5800, Houston, Texas 77002, telephone: (713)
224-3100.
Item
1A. Risk Factors
We face a
variety of risks that are substantial and inherent in our businesses, including
market, liquidity, credit, operational, legal, and regulatory
risks. In addition to the other information included in this Form
10-K, the following risk factors should be considered in evaluating our business
and future prospects. The risk factors described below represent what
we believe are the most significant risk factors with respect to us and our
business. In assessing the risks relating to our business, investors
should also read the other information included in this Form 10-K, including the
Consolidated Financial Statements and Notes thereto and “Item 7. – Management’s
Discussion and Analysis of Financial Condition and Results of Operations – Special Cautionary Notice Regarding
Forward-Looking Statements.”
8
Risks
Relating to the Nature of Our Business
Difficult
market conditions have adversely affected the financial services industry and
could adversely affect us.
The
financial services industry experienced unprecedented change and volatility
in 2008 and 2009. Since 2008, several large securities, insurance, and
financial firms in the U.S. and elsewhere have failed outright or have been
acquired by other financial institutions, often in distressed sales. Others
received substantial government assistance and in certain cases continue to
operate with substantial government assistance and oversight. Concern about the
stability of financial markets and the strength of counterparties has caused
many traditional sources of credit, such as banks, securities firms, and
insurers, as well as institutional and private investors, to reduce or cease
providing funding to borrowers. Although financial markets stabilized during
2009, reflecting substantial efforts by the U.S. and other governments to
restore confidence and recapitalize major financial institutions, it is not
possible to predict the extent to which such measures will prove
successful.
The
economic uncertainties affecting the financial industry or worsening of current
conditions may cause us to face some or all of the following
risks:
• We may
experience losses in securities trading activities or as a result of write-downs
in the value of securities that we own as a result of deteriorations in the
businesses or creditworthiness of the issuers of such
securities.
• Declines
in stock prices and trading volumes could result in declines in commission
income, margin interest revenue, asset management and service fees that
could adversely affect our profitability.
• Our
opportunity to act as underwriter or placement agent in equity and debt
offerings could be adversely affected by competing government sources of equity
or by volatile equity or debt markets.
• Our plans
for expansion of our client base or the services we provide may be delayed or
impaired.
• As an
introducing broker to clearing firms, we are responsible to the clearing firms
and could be held liable for the defaults of our customers, including losses
incurred as the result of a customer’s failure to meet a margin call. Although
we review credit exposure to specific customers, default risk may arise from
events or circumstances that are difficult to detect or foresee. When we allow
customers to purchase securities on margin, we are subject to risks inherent in
extending credit. This risk increases when a market is rapidly declining and the
value of the collateral held falls below the amount of a customer’s
indebtedness. If a customer’s account is liquidated as the result of a margin
call, we are liable to our clearing firm for any deficiency.
• Competition
in our sales and trading businesses could intensify as a result of the
increasing pressures on financial services companies and larger firms competing
for transactions and business that historically would have been too small for
them to consider.
• Our
industry could face increased regulation as a result of legislative or
regulatory initiatives, and the responsibilities of the SEC and other federal
agencies may be reallocated. Compliance with such regulation may increase our
costs and limit our ability to pursue business opportunities.
• Government
intervention may not succeed in stabilizing the financial and credit markets and
may have negative consequences for our business.
If one or
more of the foregoing risks occurs, we could experience an adverse effect, which
may be material, on our business, financial condition, and results of
operations.
9
Lack
of sufficient liquidity or access to capital could impair our business and
financial condition.
Historically,
we have satisfied our need for funding from internally generated funds, sales of
shares of our common stock to our employees and to the public, and a credit
facility with a financial institution. As a result of the low level of leverage
that we have traditionally employed in our business model, we have not been
forced to significantly curtail our business activities as a result of lack of
credit sources and we believe that our capital resources are currently
sufficient to continue to support our current business activities. In
the event existing financial resources did not satisfy our needs, we might have
to seek additional outside financing. The availability of outside financing will
depend on a variety of factors, such as our financial condition and results of
operations, the availability of acceptable collateral, market conditions, the
general availability of credit, the volume of trading activities, and the
overall availability of credit to the financial services industry.
The
soundness of other financial institutions could adversely affect
us.
Our
ability to engage in routine funding transactions could be adversely affected by
the actions and commercial soundness of other financial institutions. Financial
services institutions are interrelated as a result of trading, clearing,
counterparty, or other relationships. We have exposure to many different
counterparties and we routinely execute transactions with counterparties in the
financial services industry, including brokers and dealers, commercial banks,
investment banks, mutual and hedge funds, and other institutional clients. As a
result, defaults by, or even rumors or questions about, one or more financial
services institutions, or the financial services industry generally, have led to
market-wide liquidity problems and could lead to losses or defaults by us or by
other institutions. Many of these transactions expose us to credit risk in the
event of default of our counterparty or client. In addition, our credit risk may
be exacerbated when the collateral held by us cannot be realized upon or is
liquidated at prices not sufficient to recover the full amount of the receivable
due us. Any such losses could be material and could materially and adversely
affect our business, financial condition, and results of
operations.
The wealth management and
institutional services industries are highly competitive. If we are not able to
compete successfully against current and future competitors, our business,
financial condition, and results of operations will be adversely
affected.
The
financial services business is highly competitive, and we expect it to remain
so. The principal competitive factors influencing our wealth management and
institutional services businesses are:
|
|
•
|
the
experience and quality of the professional
staff;
|
|
|
•
|
reputation
in the marketplace;
|
|
|
•
|
existing
client relationships; and
|
|
|
•
|
mix
of market capabilities.
|
We
compete directly with many other national and regional full service financial
services firms and, to a lesser extent, with discount brokers, investment
banking firms, investment advisors, broker-dealer subsidiaries of major
commercial bank holding companies, and other companies offering financial
services in the U.S., globally, and through the Internet. We also compete for
wealth management services with commercial banks, private trust companies,
sponsors of mutual funds, insurance companies, financial planning firms, venture
capital, private equity and hedge funds, and other wealth managers.
We are a
relatively small firm with 540 employees as of December 31, 2009, and total
revenue of $175.4 million in 2009. Many of our competitors have greater
personnel and financial resources than we do. Larger competitors are able to
advertise their products and services on a national or regional basis and may
have a greater number and variety of products and distribution outlets for their
products, larger customer bases, and greater name recognition. These larger and
better capitalized competitors may be better able to respond to changes in
the wealth management and institutional services industries, to
finance acquisitions, to fund internal growth, and to compete for market share
generally. In addition to competition from firms currently in the securities
business, there has been increasing competition from other firms offering
financial services, including automated trading and other services based on
technological innovations.
Increased
pressure created by current or future competitors, individually or collectively,
could materially and adversely affect our business and results of operations.
Increased competition may result in reduced revenue and loss of market share.
Further, as a strategic response to changes in the competitive environment, we
may from time to time make certain pricing, service, or marketing decisions or
acquisitions that also could materially and adversely affect our business and
results of operations. In addition, new technologies and the expansion of
existing technologies may increase competitive pressures on us. We may not be
able to compete successfully against current and future
competitors.
10
Competition
also extends to the hiring and retention of highly skilled employees. A
competitor may be successful in hiring away an employee or group of employees,
which may result in our losing business formerly serviced by them. Such
competition can also raise our costs of hiring and retaining the key employees
we need to effectively execute our business plan.
If we are
unable to compete effectively, our business, financial condition, and results of
operations will be adversely affected.
We may experience reduced revenue due
to downturns or disruptions in the securities markets that reduce market
volumes, securities prices, and liquidity, which can also cause counterparties
to fail to perform.
The
securities business is, by its nature, subject to significant risks,
particularly in volatile or illiquid markets, including:
|
|
•
|
the
risk of trading losses;
|
|
|
•
|
losses
resulting from the ownership or underwriting of
securities;
|
|
|
•
|
counterparty
failure to meet commitments;
|
|
|
•
|
customer,
employee, or issuer fraud;
|
|
|
•
|
errors
and misconduct;
|
|
|
•
|
failure
in connection with the processing of securities transactions;
and
|
|
|
•
|
customer
litigation.
|
We are a
wealth management and institutional services firm and changes in the financial
markets or economic conditions in the U.S. and elsewhere in the world could
adversely affect our business in many ways. The securities business is directly
affected by many factors, including market, economic, and political conditions;
broad trends in business and finance; investor sentiment and confidence in the
financial markets; legislation and regulation affecting the national and
international business and financial communities; currency values; inflation;
the availability and cost of short-term and long-term funding and capital; the
credit capacity or perceived creditworthiness of the securities industry in the
marketplace; the level and volatility of equity prices and interest rates; and
technological changes. These and other factors can contribute to lower price
levels for securities and illiquid markets.
This
market downturn could result in lower prices for securities, which may result in
reduced management fees calculated as a percentage of assets managed. The market
downturn could also lead to a decline in the volume of transactions that we
execute for our customers and, therefore, to a decline in the revenue we receive
from commissions and spreads. Fluctuations in market activity could impact the
flow of investment capital into or from assets under management and advisement
and the way customers allocate capital among money market, equity, fixed income,
or other investment alternatives, which could negatively impact our wealth
management business. In periods of low volume or price levels, profitability is
further adversely affected because certain of our expenses remain relatively
fixed.
Sudden
sharp declines in market values of securities can result in illiquid markets and
the failure of counterparties to perform their obligations, which could make it
difficult for us to sell securities, hedge securities positions, and invest
funds under management. Market declines could also increase claims and
litigation, including arbitration claims from customers.
We are
also subject to risks inherent in extending credit to the extent our clearing
brokers permit our customers to purchase securities on margin. The margin risk
increases during rapidly declining markets when collateral values may fall below
the amount our customer owes us. Any resulting losses could adversely affect our
business, financial condition, and results of operations.
11
There
are market, credit and counterparty, and liquidity risks associated with our
market making, principal trading, merchant banking, and arbitrage activities. We
may experience significant losses if the value of our marketable security
positions deteriorates.
We
conduct principal trading, market making, merchant banking, and arbitrage
activities for our own account, which subjects our capital to significant risks.
These activities often involve the purchase, sale, or short sale of securities
as principal in markets that are characterized as relatively illiquid or that
may be susceptible to rapid fluctuations in liquidity and price. Current
unfavorable market conditions could limit our resale of purchased securities or
the repurchase of securities sold short. These risks involve market, credit and
counterparty, and liquidity risks, which could result in losses for us. Market
risk relates to the risk of fluctuating values and the ability of third parties
to whom we have extended credit to repay us. Credit and counterparty risks
represent the potential loss due to a client or counterparty failing to perform
its contractual obligations, such as delivery of securities or payment of funds.
Liquidity risk relates to our inability to liquidate assets or redirect illiquid
investments. In any period we may experience losses as a result of price
declines, lack of trading volume, or lack of liquidity.
In our
merchant banking, wealth management, and other activities, we may have large
concentrations in securities of, or commitments to, a single issuer or issuers
engaged in a specific industry. These concentrations increase our exposure to
market risks.
Our
business depends on the services of our executive officers, senior management,
and many other skilled professionals and may suffer if we lose the services of
our executive officers, senior management, or other skilled
professionals.
We depend
on the continuing efforts of our executive officers and senior management. That
dependence may be intensified by our decentralized operating strategy. If
executive officers or members of senior management leave us, our business or
prospects could be adversely affected until we attract and retain qualified
replacements.
We derive
a substantial portion of our revenue from the efforts of our financial services
professionals. Therefore, our future success depends, in large part, on our
ability to attract, recruit, and retain qualified financial services
professionals. Demand for these professionals is high and their qualifications
make them particularly mobile. These circumstances have led to escalating
compensation packages in the industry. Up front payments, increased payouts, and
guaranteed contracts have made recruiting these professionals more difficult and
can lead to departures by current professionals. From time to time we have
experienced, and we may in the future experience, losses of wealth management,
sales and trading, and research professionals. Departures can also cause client
defections due to close relationships between clients and the professionals. If
we are unable to retain our key employees or attract, recruit, integrate, or
retain other skilled professionals in the future, our business could
suffer.
We have a
number of investment advisor affiliates, including Edelman, Rikoon, SMH Capital
Advisors, Kissinger, Dickenson, Leonetti, and Miller-Green, which were founded
by and are identified with one individual. The departure, death, or
disability of that individual could result in the loss of clients and assets
under management.
We
generally do not have employment agreements with our senior executive officers
or other professionals. We attempt to retain our employees with incentives such
as the issuance of our stock subject to continued employment. These incentives,
however, may be insufficient in light of increasing competition for experienced
professionals in the securities industry, particularly if our stock price
declines or fails to appreciate sufficiently to be a competitive source of a
portion of a professional’s compensation.
Litigation
and potential securities laws liabilities may adversely affect our
business.
Many
aspects of our business involve substantial risks of liability, litigation, and
arbitration, which could adversely affect us. As a normal part of our business,
we are from time to time named as a defendant or co-defendant in civil
litigation and arbitration proceedings and as a subject of regulatory
investigations arising from our business activities as a financial services
firm. Some of these proceedings involve claims for substantial amounts of
damages, based on allegations such as misconduct by us or our failure to
properly supervise our wealth management advisors, bad investment advice,
unsuitable investment recommendations or excessive trading in a client’s account
by our wealth management advisors, materially false or misleading
statements made in connection with securities offerings and other transactions,
the advice we provide to participants in corporate transactions, and disputes
over the terms and conditions of complex trading arrangements. The risks of
liability, litigation, and arbitration often may be difficult to assess or
quantify, and their existence and magnitude often remain unknown for substantial
periods of time. In view of the inherent difficulty of predicting the outcome of
legal and regulatory proceedings, particularly where the plaintiffs or
regulatory authorities seek substantial or indeterminate damages or fines or
where novel legal theories or a large number of parties are involved, we cannot
state with confidence what the eventual outcome of currently pending matters
will be or what the timing of the ultimate resolution of these matters will be.
Depending on our results for a particular period, an adverse determination could
have a material effect on quarterly or annual operating results in the period in
which it is resolved. See “Item 3. – Legal Proceedings”.
12
Poor
investment performance, in either relative or absolute terms, may reduce the
profitability of our wealth management business.
In 2009,
our wealth management revenue was $100.9 million, accounting for 57.6% of our
total revenue. We derive our revenue from this business primarily from
management fees that are based on committed capital, assets under management or
advisement, and incentive fees, which are earned if the return of our
proprietary funds exceeds certain threshold returns. Our ability to maintain or
increase assets under management or advisement is subject to a number of
factors, including investors’ perception of our past performance, in either
relative or absolute terms, market or economic conditions, and competition from
other fund managers.
Investment
performance is one of the most important factors in retaining existing clients
and competing for new wealth management business. Poor investment performance
could reduce our revenue and impair our growth in a number of ways:
|
|
•
|
existing
clients may withdraw funds from our wealth management business in favor of
better performing products;
|
|
|
•
|
our
incentive fees could decline or be eliminated
entirely;
|
|
|
•
|
asset-based
advisory fees could decline as a result of a decrease in assets under
management;
|
|
|
•
|
our
ability to attract funds from existing and new clients might
diminish;
|
|
|
•
|
firms
with which we have business relationships may terminate their
relationships with us; and
|
|
|
•
|
our
wealth managers and investment advisors may depart, whether to join a
competitor or otherwise.
|
Even when
market conditions are generally favorable, our investment performance may be
adversely affected by the investment style of our wealth management and
investment advisors and the particular investments that they make. To the extent
our future investment performance is perceived to be poor in either relative or
absolute terms, the revenue and profitability of our wealth management business
will likely be reduced and our ability to attract new clients and funds will
likely be impaired.
Our
wealth management clients can terminate their relationships with us, reduce the
aggregate assets under management or advisement, or shift their funds to other
types of accounts with different rate structures for any number of reasons,
including investment performance, changes in prevailing interest rates,
inflation, changes in investment preferences of clients, changes in our
reputation in the marketplace, changes in management or control of clients or
third party distributors with whom we have relationships, loss of key investment
management personnel or wealth advisors, and financial market
performance.
13
We
may experience substantial fluctuations in our operating results from period to
period due to the nature of our business and therefore fail to meet
profitability expectations.
Our
operating results may fluctuate from quarter to quarter and from year to year
due to a combination of factors. These factors include:
|
|
•
|
levels
of assets under our management;
|
|
|
•
|
the
number of institutional and retail brokerage transactions and the
commissions we receive from those
transactions;
|
|
|
•
|
changes
in the market valuations of investments held by proprietary investment
funds that we organize and manage and of companies in which we have
invested as a principal;
|
|
|
•
|
the
timing of recording of wealth management fees and special allocations of
income, if any;
|
|
|
•
|
the
realization of profits and losses on principal
investments;
|
|
|
•
|
variations
in expenditures for personnel, consulting, accounting, and legal
expenses;
|
|
|
•
|
expenses
of establishing any new business units, including marketing and technology
expenses; and
|
|
|
•
|
changes
in accounting principles.
|
We
depend on proprietary and third party systems, so a systems failure could
significantly disrupt our business. These and other operational risks
may disrupt our business, result in regulatory action against us, or limit our
growth.
Our
business depends highly on our ability to process, on a daily basis, a large
number of transactions across numerous and diverse markets, and the transactions
we process have become increasingly complex. Consequently, we rely heavily on
our communications and financial, accounting, and other data processing systems,
including systems provided by our clearing brokers and service providers. We
face operational risk arising from mistakes made in the confirmation or
settlement of transactions or from transactions not being properly recorded,
evaluated, or accounted.
If any of
these systems do not operate properly or are disabled, we could suffer financial
loss, a disruption of our business, liability to clients, regulatory
intervention, or reputational damage. Any failure or interruption of our
systems, the systems of our clearing brokers, or third party trading systems
could cause delays or other problems in our securities trading activities, which
could have a material adverse effect on our operating results. In addition, our
clearing brokers provide our principal disaster recovery system. We cannot
assure you that we or our clearing brokers will not suffer any systems failures
or interruption, including ones caused by earthquake, fire, other natural
disasters, power or telecommunications failure, act of God, act of war,
terrorism, or otherwise, or that our or our clearing brokers’ back-up procedures
and capabilities in the event of any such failure or interruption will be
adequate. The inability of our or our clearing brokers’ systems to accommodate
an increasing volume of transactions could also constrain our ability to expand
our business.
Strategic
investments or acquisitions may result in additional risks and uncertainties in
our business.
We intend
to grow our core businesses through both internal expansion and through
strategic investments and acquisitions. To the extent we make strategic
investments or acquisitions, we face numerous risks and uncertainties combining
or integrating the relevant businesses and systems, including the need to
combine accounting and data processing systems and management controls, and to
integrate relationships with clients, vendors, and business partners.
Acquisitions pose the risk that any business we acquire may lose clients or
employees or could under-perform relative to expectations.
Growth
of our business could result in increased costs.
We may
incur significant expenses in connection with any expansion of our existing
businesses or in connection with any strategic acquisitions and investments, if
and to the extent they arise from time to time. Our overall profitability would
be negatively affected if investments and expenses associated with such growth
are not matched or exceeded by the revenue that is derived from such
growth.
14
In the
wealth management business, opening new offices involves recruiting and hiring
the personnel necessary to staff the offices. Such personnel may be employed by
competitors, and the retention of such individuals may require us to enter into
guaranteed compensation contracts for a period following commencement of
employment. The compensation terms provided for in such contracts may be fixed
in whole or in part. Any guaranteed compensation expenses that cannot be
adjusted based on the success or profitability of the offices could reduce our
operating margins.
During
2009, we began to implement our plan to expand the Edelman offices throughout
the U.S. with the opening of six new offices in the New York City metropolitan
area. Our current plans call for us to open an additional 12 new
Edelman offices during 2010. These expansion efforts have required and will
continue to require increased investment in management personnel, facilities,
and financial and management systems and controls, all of which, in the absence
of sufficient corresponding revenue growth, would cause our operating margins to
decline from current levels. In addition, we estimate that the cost of opening
each new office requires expenditures of approximately
$250,000.
Expansion
also creates a need for additional compliance, documentation, risk management
and internal control procedures, and often involves the hiring of additional
personnel to monitor such procedures. To the extent such procedures are not
adequate to appropriately monitor any new or expanded business, we could be
exposed to a material loss or regulatory sanction.
We are a holding
company and depend on our subsidiaries for dividends, distributions and other
payments.
As a
holding company, we may require dividends, distributions and other payments from
our subsidiaries to fund payments on our obligations, including debt
obligations. As a result, regulatory actions could impede access to funds that
we need to make payments on obligations or dividend payments. In addition,
because we hold equity interests in our subsidiaries, our rights as an equity
holder to the assets of these subsidiaries are subordinated to any claims of the
creditors of these subsidiaries. At December 31, 2009, none of our subsidiaries
had any long term indebtedness to any third party.
Risks
Related to Our Business
Our
securities broker-dealer and investment advisor subsidiaries are subject to
substantial regulation. If we fail to comply with applicable requirements, our
business will be adversely affected.
Our
businesses are subject to extensive regulation under both federal and state
laws. SMH is registered as a broker-dealer with the SEC and FINRA; SMH Capital
Advisors, Edelman, Rikoon, Leonetti, and Miller-Green are registered with the
SEC as investment advisors. All of the professional agents employed by SSG are
registered as certified contract advisors with the National Football League
Players Association.
The SEC
is the federal agency responsible for the administration of federal securities
laws. In addition, self-regulatory organizations, principally FINRA and the
securities exchanges, are actively involved in the regulation of broker-dealers.
We are also subject to regulation by state securities commissions in those
states in which we do business. The principal purpose of regulation and
discipline of broker-dealers is the protection of clients and the securities
markets rather than protection of creditors and shareholders of broker-dealers.
Broker-dealers are subject to regulations that cover all aspects of the
securities business, including sales methods, trade practices among
broker-dealers, use and safekeeping of customers’ funds and securities, capital
structure of securities firms, record-keeping, and the conduct of directors,
officers, and employees.
The SEC,
FINRA and state securities commissions may conduct administrative proceedings
that can result in:
|
|
•
|
censure,
fines, or civil penalties;
|
|
|
•
|
issuance
of cease-and-desist orders;
|
|
|
•
|
deregistration,
suspension, or expulsion of a broker-dealer or investment
advisor;
|
|
|
•
|
suspension
or disqualification of the broker-dealer’s officers or
employees;
|
15
|
|
•
|
prohibition
against engaging in certain lines of business;
and
|
|
|
•
|
other
adverse consequences.
|
The
imposition of any penalties or orders on us could have a material adverse effect
on our business, financial condition, and results of operations. The investment
banking and brokerage industries have recently come under scrutiny at both the
state and federal levels, and the cost of compliance and the potential liability
for non-compliance has increased as a result.
The
regulatory environment in which we operate is also subject to change. Our
business may be adversely affected as a result of new or revised legislation, or
changes in rules promulgated by the SEC, FINRA, and other SRO’s. We may also be
adversely affected by changes in the interpretation or enforcement of existing
laws and rules by the SEC and FINRA.
Our
financial services businesses may be materially affected not only by regulations
applicable to our subsidiaries as financial market intermediaries but also by
regulations of general application. For example, the volume of our merchant
banking and principal investment business in a given period could be affected by
existing and proposed tax legislation, antitrust policy, and other governmental
regulations and policies, (including the monetary policies of the Federal
Reserve Board), as well as changes in interpretation or enforcement of existing
laws and rules that affect the business and financial communities.
Our
ability to comply with laws and regulations relating to our financial services
businesses depends in large part upon maintaining a system to monitor compliance
and our ability to attract and retain qualified compliance personnel. Although
we believe we are in material compliance with all applicable laws and
regulations, we may not be able to comply in the future. Any noncompliance could
have a material adverse effect on our business, financial condition, and results
of operations.
The
business operations of SMH may face limitations due to net capital
requirements.
As a
registered broker-dealer, SMH is subject to the net capital rules administered
by the SEC and FINRA. These rules, which specify minimum net capital
requirements for registered broker-dealers and FINRA members, are designed to
assure that broker-dealers maintain adequate net capital in relation to their
liabilities and the size of their customers’ business. These requirements have
the effect of requiring that a substantial portion of a broker-dealer’s assets
be kept in cash or highly liquid investments. Failure to maintain the required
net capital may subject a firm to suspension or revocation of its registration
by the SEC and suspension or expulsion by FINRA and other regulatory bodies.
Compliance with these net capital rules could limit operations that require
extensive capital, such as underwriting or trading activities.
These net
capital rules could also restrict our ability to withdraw capital in situations
where SMH has more than the minimum required capital. We may be limited in our
ability to pay dividends, implement our strategies, pay interest or repay
principal on our debt, and redeem or repurchase our outstanding shares. In
addition, a change in these net capital rules or new rules affecting the scope,
coverage, calculation, or amount of the net capital requirements, or a
significant operating loss or significant charge against net capital, could have
similar effects.
As a
holding company, we depend on dividends, distributions, and other payments from
our subsidiaries to fund any dividend payments and to fund all payments on our
obligations. As a result, any regulatory action that restricts SMH’s ability to
make payments to us could impede access to funds we need to make dividend
payments or payments on our obligations.
Our
exposure to legal liability is significant, and damages that we may be required
to pay and the reputational harm that could result from legal or regulatory
action against us could materially adversely affect our businesses.
We face
significant legal risks in our businesses and, in recent years, the volume of
claims and amount of damages sought in litigation and regulatory proceedings
against financial institutions have been increasing. These risks include
potential liability under securities or other laws for materially false or
misleading statements made in connection with securities offerings and other
transactions. We are also potentially subject to claims arising from
disputes with employees. These risks often may be difficult to assess or
quantify and their existence and magnitude often remain unknown for substantial
periods of time. See Item 3 — “Legal Proceedings” for a further
discussion of certain legal matters applicable to us.
16
We depend
to a large extent on our reputation for integrity and high-caliber professional
services to attract and retain clients and customers. As a result, if a client
or customer is not satisfied with our services, it may be more damaging in our
business than in other businesses. Our activities may subject us to the risk of
significant legal liabilities to our clients and aggrieved third parties. As a
result, we may incur significant legal and other expenses in defending against
litigation and may be required to pay substantial damages for settlements and
adverse judgments. Substantial legal liability or significant regulatory action
against us could have a material adverse effect on our results of operations or
cause significant reputational harm to us, which could seriously harm our
business and prospects.
Regulatory
inquiries and subpoenas or other requests for information or testimony in
connection with litigation may require incurrence of significant expenses,
including fees for legal representation and fees associated with document
production. These costs may be incurred even if we are not a target of the
inquiry or a party to litigation.
There
have been a number of highly publicized cases involving fraud or other
misconduct by employees in the financial services industry in recent years, and
we run the risk that employee misconduct could occur at our company. For
example, misconduct by employees could involve the improper use or disclosure of
confidential information, which could result in regulatory sanctions and serious
reputational or financial harm. It is not always possible to deter employee
misconduct and the precautions we take to detect and prevent this activity may
not be effective in all cases, and we may suffer significant reputational harm
for any misconduct by our employees.
Risks
Relating to Owning Our Common Stock
The market price of our common stock
may be volatile, which could adversely affect the value of your shares.
Our common stock may trade at
prices below your purchase price.
The
market price of our common stock may be subject to significant fluctuations in
response to many factors, including:
|
|
•
|
our
perceived prospects;
|
|
|
•
|
the
perceived prospects of the securities and financial services industries in
general;
|
|
|
•
|
differences
between our actual financial results and those expected by investors and
analysts;
|
|
|
•
|
changes
in securities analysts’ recommendations or
projections;
|
|
|
•
|
our
announcements of significant contracts, milestones, or
acquisitions;
|
|
|
•
|
sales
of substantial amounts of our common
stock;
|
|
|
•
|
changes
in general economic or market conditions, including conditions in the
securities brokerage and investment banking
markets;
|
|
|
•
|
changing
conditions in the industry of one of our major client groups;
and
|
|
|
•
|
fluctuations
in stock market price and volume unrelated to us or our operating
performance.
|
Many of
these factors are beyond our control. Any one of the factors noted herein could
have an adverse effect on the value of our common stock. Our common
stock may trade at prices below your purchase price.
Because
our board of directors can issue common stock without shareholder approval, you
could experience substantial dilution.
Our board
of directors has the authority to issue up to 100,000,000 shares of common
stock, to issue options and warrants to purchase shares of our common stock, and
to issue debt convertible into common stock without shareholder approval in
certain circumstances. Future issuances of additional shares of our common stock
could be at values substantially below the price at which you may purchase our
stock and, therefore, could represent substantial dilution. In addition, our
board of directors could issue large blocks of our common stock to fend off
unwanted tender offers or hostile takeovers without shareholder
approval.
17
Our
ability to issue “blank check” preferred stock without approval by the holders
of our common stock could adversely affect your rights as a common shareholder
and could be used as an anti-takeover device.
Our
charter allows our board of directors to issue preferred stock and to determine
its rights, powers, and preferences without shareholder approval (“blank check
preferred stock”). Future preferred stock issued under the board’s authority
could contain preferences over our common stock as to dividends, distributions,
and voting power. Holders of preferred stock could, for example, be given the
right to separately elect some number of our directors in all or specified
events or an independent veto right over certain transactions, and redemption
rights and liquidation preferences assigned to preferred shareholders could
affect the residual value of your common stock. We could also use the preferred
stock to deter or delay a change in control that may be opposed by management
even if the transaction might be favorable to you as a common
shareholder.
Anti-takeover
provisions of the Texas Business Corporation Act and our charter could
discourage a merger or other type of corporate reorganization or a change in
control even if it could be favorable to the interests of our
shareholders.
Provisions
of our corporate documents and Texas law may delay or prevent an attempt to
obtain control of our company, whether by means of a tender offer, business
combination, proxy contest, or otherwise. These provisions include:
|
|
•
|
the
authorization of blank check preferred
stock;
|
|
|
•
|
the
ability to remove directors only for cause, and then only on approval of
the holders of two-thirds of the outstanding voting
stock;
|
|
|
•
|
a
restriction on the ability of shareholders to take actions by less than
unanimous written consent; and
|
|
|
•
|
a
restriction on business combinations with interested
parties.
|
Our
officers and directors own a substantial amount of our common stock and,
therefore, exercise significant control over our corporate governance and
affairs, which may result in their taking actions with which you do not
agree.
Our
executive officers, directors, and affiliates, and entities affiliated with
them, control approximately 30% of our outstanding common stock (including
exercisable stock options held by them). These shareholders, if they act
together, may be able to exercise substantial influence over the outcome of all
corporate actions requiring approval of our shareholders, including the election
of directors and approval of significant corporate transactions, which may
result in corporate action with which you do not agree. This concentration of
ownership may also have the effect of delaying or preventing a change in control
and might affect the market price of our common stock.
An
impairment in the carrying value of our goodwill could adversely affect our
financial condition and results of operations and share price.
Goodwill
represents the difference between the purchase price of acquired companies and
the related fair values of net assets acquired. Under generally accepted
accounting principles, we review our goodwill and other intangible assets for
impairment when events or changes in circumstances indicate the carrying value
may not be recoverable. Goodwill is required to be tested for impairment at
least annually. Factors that may be considered a change in circumstances
indicating that the carrying value of our goodwill or amortizable intangible
assets may not be recoverable include a decline in our stock price and market
capitalization, future cash flows, and slower growth rates in our industry. A
significant amount of judgment is involved in determining if an indication of
impairment exists. We may be required to record a significant charge to earnings
in our financial statements during the period in which any impairment of our
goodwill or other intangible assets is determined, resulting in an impact on our
results of operations. For example, in March 2009, we announced a loss of $58.3
million for the fourth quarter of 2008, which included non-cash goodwill and
other intangible assets impairment charges of $56.7 million, due to the decline
in our stock price causing our market capitalization to fall below the net book
value of our assets.
18
Item
1B. Unresolved Staff Comments
None.
Item
2. Properties
Our
principal executive office together with certain brokerage and wealth management
operations of SMH are located at 600 Travis, Houston, Texas and comprise
approximately 67,000 square feet of leased office space pursuant to lease
arrangements expiring in 2018. The Company has 30 other office
locations including one in California, one in Colorado, one in Connecticut, two
in Illinois, two in Maryland, one in Mississippi, one in North Carolina, three
in New Jersey, one in New Mexico, seven in New York, one in Ohio, one in
Oklahoma, four in Texas, three in Virginia, and one in Washington,
D.C. We lease all of our office space which management believes, at
the present time, is adequate for our business.
Item
3. Legal Proceedings
Many
aspects of our business involve substantial risks of liability. In the normal
course of business, we have been and in the future may be named as defendant or
co-defendant in lawsuits and arbitration proceedings involving primarily claims
for damages. We are also involved in a number of regulatory matters arising out
of the conduct of our business. There can be no assurance that these matters
will not have a material adverse effect on our results of operations in any
future period and a significant judgment could have a material adverse impact on
our consolidated financial position, results of operations, and cash flows. In
addition to claims for damages and monetary sanctions that may be made against
us, we incur substantial costs in investigating and defending claims and
regulatory matters.
In July
2008, the Dallas regional office of FINRA conducted a routine examination of
SMH’s broker-dealer activities. SMH received an examination report on
December 31, 2008, which identified a number of deficiencies in SMH’s
operations. In April 2009, SMH resolved half of the deficiencies
noted through a compliance conference procedure. The remaining deficiencies are
subject to possible enforcement action by FINRA. SMH has not received a Wells
notice from FINRA with respect to the deficiencies, which is a formal notice
from FINRA that it intends to take enforcement action. SMH is in communication
with the FINRA staff to resolve the matter. However, there is no
assurance that a prompt resolution can be reached or that the ultimate impact on
SMH and the Company will not be material.
In May
2005, SMH acted as placement agent for a private placement of $50.0 million in
convertible preferred stock of Ronco Corporation, a company involved in direct
response marketing. Subsequent to the offering, Ronco experienced financial
difficulties and ultimately filed a voluntary petition under Chapter 11 of the
Bankruptcy Code on June 14, 2007. The bankruptcy court approved the sale
of substantially all of Ronco’s assets in August 2007, and the case was
converted to a liquidation under Chapter 7.
In May
2007, two purchasers of Ronco convertible preferred stock filed a complaint
against SMH, US
Special Opportunities Trust PLC and Renaissance US Growth Investment Trust PLC
vs. Sanders Morris Harris Inc., in the 193rd Judicial District Court,
Dallas County, Texas, alleging common law fraud, statutory fraud in a stock
transaction, violations of the Texas Securities Act, and negligent
misrepresentation in connection with their purchase of $2.0 million in Ronco
convertible preferred stock. On March 17, 2009, a third purchaser of Ronco
convertible preferred stock filed a complaint against SMH, Palisades Master Fund, L.P.
and PEF Advisors, LLC vs. Sanders Morris Harris Inc., in the 11th
Judicial District Court of Harris County, Texas. The claims are
similar to the above referenced case. Palisades Master Fund, L.P.
invested $1.9 million in Ronco convertible preferred stock. In addition, in July
2009, the Bankruptcy Trustee filed a derivative action on behalf of the
shareholders of Ronco against two former directors of Ronco (who were employees
of SMH) for negligently authorizing the closing of the purchase of the assets of
Ronco Marketing Corp. in breach of their fiduciary duties of care and loyalty
and against SMH for negligent misrepresentation, breach of fiduciary duties,
breach of contract, and violation of the Texas Fraudulent Transfer Act, Diane Weil, Solely in Her
Capacity as Trustee of Ronco Corporation and Ronco Marketing Corporation vs. A.
Emerson Martin II, Gregg Mockenhaupt, and Sanders Morris Harris Inc., in
the 190th
Judicial District Court of Harris County, Texas. No amount of damages is
alleged. SMH has filed an answer and special exceptions in each of these cases
and believes it has valid defenses to all claims made by the
plaintiffs. However, there is no assurance that the Company will
successfully defend such claims.
In view
of the inherent difficulty of predicting the outcome of legal proceedings,
particularly where the plaintiffs seek substantial or indeterminate damages or
where novel legal theories or a large number of parties are involved, we cannot
state with confidence what the eventual outcome of currently pending matters
will be, what the timing of the ultimate resolution of these matters will be, or
what the eventual result in each pending matter will be. Based on
currently available information, we have established reserves for certain
litigation matters and our management does not believe that resolution of any
matter will have a material adverse effect on our liquidity or financial
position although, depending on our results for a particular period, an adverse
determination could have a material effect on quarterly or annual operating
results in the period in which it is resolved.
19
Item
4. Reserved
20
PART
II
Item
5. Market for Registrant's Common Equity, Related Stockholder Matters
and Issuer Purchases of Equity Securities
Our
common stock trades on the Global Market Security tier of The Nasdaq Stock
Market under the symbol “SMHG”. The following table sets forth the
quarterly high and low sales prices for our common stock during 2009 and 2008
for the calendar quarters indicated, each as reported on the Nasdaq National
Market, and cash dividends declared per share of common stock:
|
Cash
|
||||||||||||
|
Calendar Period
|
High
|
Low
|
Dividend
|
|||||||||
|
2009:
|
||||||||||||
|
First
Quarter
|
$ | 6.45 | $ | 3.51 | $ | 0.045 | ||||||
|
Second
Quarter
|
$ | 6.38 | $ | 3.80 | $ | 0.045 | ||||||
|
Third
Quarter
|
$ | 6.21 | $ | 5.05 | $ | 0.045 | ||||||
|
Fourth
Quarter
|
$ | 6.25 | $ | 4.74 | $ | 0.045 | ||||||
|
2008:
|
||||||||||||
|
First
Quarter
|
$ | 10.26 | $ | 7.92 | $ | 0.045 | ||||||
|
Second
Quarter
|
$ | 9.02 | $ | 6.67 | $ | 0.045 | ||||||
|
Third
Quarter
|
$ | 11.07 | $ | 5.08 | $ | 0.045 | ||||||
|
Fourth
Quarter
|
$ | 8.97 | $ | 4.23 | $ | 0.045 | ||||||
At March
9, 2010, there were 302 holders of record of our common stock.
Dividend
Policy
In 2002,
our board of directors instituted a policy of paying regular quarterly dividends
on our common stock. During 2005, we increased the declared quarterly
dividend payment to $0.045 per share (an annual amount of $0.18 per
share). In February 2010, the board of directors declared a cash
dividend for the first quarter of 2010 in the amount of $0.045 per
share. Our declaration and payment of future dividends is subject to
the discretion of our board of directors. In exercising this
discretion, the board of directors will take into account various factors,
including general economic and business conditions, our strategic plans, our
financial results and condition, our expansion plans, any contractual, legal and
regulatory restrictions on the payment of dividends, and such other factors the
board considers relevant.
21
Securities
Authorized for Issuance Under Equity Compensation Plans
For our
equity compensation plans, the following table shows, at the end of fiscal year
2009, (a) the number of securities to be issued upon the exercise of outstanding
options, warrants and rights, (b) the weighted-average exercise price of such
options, warrants and rights, and (c) the number of securities remaining
available for future issuance under the plans, excluding those issuable upon
exercise of outstanding options, warrants and rights.
|
Number of securities
|
||||||||||||
|
remaining available for
|
||||||||||||
|
Number of securities
|
future issuance under
|
|||||||||||
|
to be issued
|
Weighted-average
|
equity compensation
|
||||||||||
|
upon exercise of
|
exercise price of
|
plans
|
||||||||||
|
outstanding options,
|
oustanding options,
|
(excluding securities
|
||||||||||
|
Plan category
|
warrants and rights
|
warrants and rights
|
reflected in column(a))
|
|||||||||
|
(a)
|
(b)
|
(c)
|
||||||||||
|
Equity
compensation plans approved
|
||||||||||||
|
by
security holders
|
601,141 | $ | 9.95 | 2,797,240 | (1) | |||||||
|
Equity
compensation plans not
|
||||||||||||
|
approved
by security holders
|
- | - | - | |||||||||
|
Total
|
601,141 | $ | 9.95 | 2,797,240 | ||||||||
|
(1)
|
The
number of shares of our common stock available for incentive awards under
our 1998 Incentive Plan is the greater of 4.0 million shares or 25% of the
total number of shares of our common stock from time to time
outstanding.
|
22
Corporate
Performance
The
following chart shows a comparison of the cumulative total shareholder return on
our common stock for the five-year period ended December 31, 2009, as compared
to the cumulative total return of the Nasdaq Stock Market Index and the Nasdaq
Financial Stocks Index, a peer group, assuming $100 was invested at market close
on December 31, 2004 in our common stock and the two indices and dividends were
reinvested.
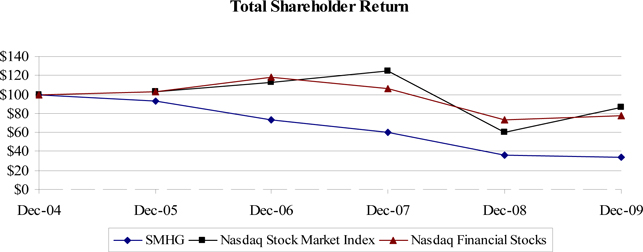
|
Dec-04
|
Dec-05
|
Dec-06
|
Dec-07
|
Dec-08
|
Dec-09
|
|||||||||||||||||||
|
Sanders
Morris Harris Group Inc
|
$ | 100.00 | $ | 93.21 | $ | 73.56 | $ | 60.07 | $ | 35.98 | $ | 34.24 | ||||||||||||
|
Nasdaq
Stock Market Index (U.S. & Foreign)
|
100.00 | 102.27 | 112.80 | 124.68 | 59.76 | 86.83 | ||||||||||||||||||
|
Nasdaq
Financial Stocks Index (1)
|
100.00 | 102.38 | 117.71 | 105.82 | 73.77 | 77.25 | ||||||||||||||||||
|
(1)
|
The
Nasdaq Financial Stocks Index is composed of all Nasdaq companies with
Standard Industrial Classification codes ranging from 6000 through
6799.
|
The foregoing performance graph is not
deemed to be “soliciting material” or to be “filed” with the SEC or subject to
Regulation 14A or 14C, other than as provided in Item 201 of Regulation S-K, or
to the liabilities of Section 18 of the Securities Exchange Act of 1934, and
will not be deemed to be incorporated by reference into any filing under the
Securities Act of 1933 or Securities Exchange Act of 1934, except to the extent
that we specifically incorporate it by reference.
23
Item
6. Selected Financial Data
The
following data should be read together with the Consolidated Financial
Statements and their related notes and “Management's Discussion and Analysis of
Financial Condition and Results of Operations” included later in this
report.
|
Year Ended December 31,
|
||||||||||||||||||||
|
2009
|
2008
|
2007
|
2006
|
2005
|
||||||||||||||||
|
(in
thousands except per share amounts)
|
||||||||||||||||||||
|
Statements
of Operations:
|
||||||||||||||||||||
|
Total
revenue
|
$ | 175,364 | $ | 171,941 | $ | 155,071 | $ | 134,297 | $ | 100,360 | ||||||||||
|
Income
(loss) from
|
||||||||||||||||||||
|
continuing
operations
|
$ | (93 | ) | $ | (13,423 | ) | $ | 20,431 | $ | 15,815 | $ | 11,430 | ||||||||
|
Income
(loss) from discontinued
|
||||||||||||||||||||
|
operations,
net of income taxes
|
(277 | ) | (4,974 | ) | 499 | (5,701 | ) | 3,819 | ||||||||||||
|
Net
income (loss)
|
(370 | ) | (18,397 | ) | 20,930 | 10,114 | 15,249 | |||||||||||||
|
Less: Net
income attributable to
|
||||||||||||||||||||
|
the
noncontrolling interest
|
(5,112 | ) | (6,896 | ) | (15,837 | ) | (6,708 | ) | (4,575 | ) | ||||||||||
|
Net
income (loss) atttributable to
|
||||||||||||||||||||
|
Sanders
Morris Harris Group Inc.
|
$ | (5,482 | ) | $ | (25,293 | ) | $ | 5,093 | $ | 3,406 | $ | 10,674 | ||||||||
|
Diluted
earnings (loss)
|
||||||||||||||||||||
|
per
common share:
|
||||||||||||||||||||
|
Continuing
operations
|
$ | (0.18 | ) | $ | (0.75 | ) | $ | 0.18 | $ | 0.43 | $ | 0.35 | ||||||||
|
Discontinued
operations
|
(0.01 | ) | (0.19 | ) | 0.02 | (0.27 | ) | 0.20 | ||||||||||||
|
Net
earnings (loss)
|
$ | (0.19 | ) | $ | (0.94 | ) | $ | 0.20 | $ | 0.16 | $ | 0.55 | ||||||||
|
Weighted
average common shares
|
||||||||||||||||||||
|
outstanding
- diluted
|
28,402 | 26,972 | 25,086 | 20,915 | 19,253 | |||||||||||||||
|
As of December 31,
|
||||||||||||||||||||
|
2009
|
2008
|
2007
|
2006
|
2005
|
||||||||||||||||
|
(in thousands except per share amounts)
|
||||||||||||||||||||
|
Balance
Sheet Data:
|
||||||||||||||||||||
|
Cash
and cash equivalents
|
$ | 41,926 | $ | 30,224 | $ | 46,503 | $ | 68,861 | $ | 17,867 | ||||||||||
|
Securities
owned
|
39,380 | 54,559 | 85,567 | 83,929 | 75,541 | |||||||||||||||
|
Total
assets
|
320,038 | 297,470 | 291,548 | 282,042 | 208,689 | |||||||||||||||
|
Total
liabilities
|
79,411 | 66,111 | 48,265 | 49,982 | 46,223 | |||||||||||||||
|
Sanders
Morris Harris Group Inc.
|
||||||||||||||||||||
|
shareholders'
equity
|
224,194 | 222,554 | 223,178 | 219,936 | 154,685 | |||||||||||||||
|
Noncontrolling
interest
|
16,433 | 8,805 | 20,105 | 12,124 | 7,781 | |||||||||||||||
|
Total
equity
|
240,627 | 231,359 | 243,283 | 232,060 | 162,466 | |||||||||||||||
|
Cash
dividends declared
|
||||||||||||||||||||
|
per
common share
|
$ | 0.18 | $ | 0.18 | $ | 0.18 | $ | 0.18 | $ | 0.18 | ||||||||||
24
Item
7. Management's Discussion and Analysis of Financial Condition
and Results of Operations
Special
Cautionary Notice Regarding Forward-Looking Statements
This
Annual Report on Form 10-K includes “forward-looking statements” within the
meaning of Section 27A of the Securities Act of 1933, as amended, and Section
21E of the Securities Exchange Act of 1934, as amended. These forward-looking
statements may relate to such matters as anticipated financial performance,
future revenue or earnings, business prospects, projected ventures, new
products, anticipated market performance, and similar matters. We
caution you that a variety of factors could cause our actual results to differ
materially from the anticipated results or other expectations expressed in our
forward-looking statements. These risks and uncertainties, many of which are
beyond our control, include, but are not limited to (1) trading volume in the
securities markets; (2) volatility of the securities markets and interest rates;
(3) changes in regulatory requirements that could affect the demand for our
services or the cost of doing business; (4) general economic conditions, both
domestic and foreign, especially in the regions where we do business; (5)
changes in the rate of inflation and related impact on securities markets; (6)
competition from existing financial institutions and other new participants in
the securities markets; (7) legal developments affecting the litigation
experience of the securities industry; (8) successful implementation of
technology solutions; (9) changes in valuations of our trading and warrant
portfolios resulting from mark-to-market adjustments; (10) dependence on key
personnel; (11) demand for our services; and (12) litigation and securities law
liabilities. See “Item 1A. – Risk Factors.” The Company
does not undertake any obligation to publicly update or revise any
forward-looking statements.
The
following discussion should be read in conjunction with the Consolidated
Financial Statements and their related notes and other detailed information
appearing elsewhere in this Annual Report.
Overview
The
Company is a holding company that, through its subsidiaries and affiliates,
provides wealth management and institutional services to a large and diversified
group of clients and customers, including individuals, corporations, and
financial institutions. A summary of these services follows:
Our Wealth Management segment
provides investment advisory, wealth and investment management, and financial
planning services to high net worth and mass affluent individuals and
institutions, including investment strategies and alternatives, tax efficient
estate and financial planning, trusts, and agent/fiduciary investment management
services, throughout their financial life cycle, as well as private client
brokerage services. In addition, we provide specialized wealth management
products and services in specific investment styles to individuals,
corporations, and institutions both through internal marketing efforts and
externally through formal sub-advisory relationships and other distribution
arrangements with third parties.
Our Institutional Services
segment provides institutional equity brokerage and prime brokerage
services to institutional clients, and third party management of a portion of
our assets.
Institutional Brokerage
provides institutional equity brokerage and hedge funds research to a broad
array of institutions, including banks, retirement funds, mutual funds,
endowments, investment advisors, and insurance companies.
Prime Brokerage Services provides trade
execution, clearing, bookkeeping, reporting, custodial, securities borrowing,
financing, research, and fund raising to hedge fund clients. The
Company maintains a small number of asset management accounts on behalf of
individual asset managers through this division. The Washington
Research Group provides research, sales, and trading services to a broad range
of institutional investors.
25
We are
exposed to volatility and trends in the general securities market and the
economy. Due to the downturn in the market and the economic recession
that began during the second half of 2008, client assets declined during the
last half of 2008 and into the first quarter of 2009. However, during
the second quarter of 2009, the market began to improve and client assets have
recovered resulting in, among other things, higher fee and commission
revenue. Client assets under management or advisement were as
follows:
|
Client
Assets(1)
|
||||
|
(in
millions)
|
||||
|
December
31, 2007
|
$ | 11,344 | ||
|
March
31, 2008
|
11,342 | |||
|
June
30, 2008
|
10,979 | |||
|
September
30, 2008
|
10,290 | |||
|
December
31, 2008
|
8,627 | |||
|
March
31, 2009
|
8,501 | |||
|
June
30, 2009
|
9,534 | |||
|
September
30, 2009
|
10,595 | |||
|
December
31, 2009
|
11,273 | |||
|
(1) Client assets include the gross value of assets under management directly or via outside managers and assets held in brokerage accounts for clients by outside clearing firms. |
||||
Fiscal
year 2008 and the first quarter of 2009 was a very challenging environment for
the capital markets given the unprecedented events on Wall Street that led to
increased uncertainty and turmoil in the U.S. economy and global financial
markets. We made the necessary adjustments to our business and
adapted to the current environment. We focused on the following
items:
|
|
•
|
preserving
capital and retaining key people in order to emerge as a strong player
once market stability returns;
|
|
|
•
|
reducing
compensation and non-compensation expenses in order to operate on a
positive cash basis;
|
|
|
•
|
closing
offices that were unprofitable;
|
|
|
•
|
exiting
business lines that are subject to greater than normal revenue and profit
volatility; and
|
|
|
•
|
acquiring
wealth management businesses that enhance or complement our existing
franchise value.
|
Components
of Revenue and Expenses
Revenue. Our revenue is
comprised primarily of (1) fees from asset-based advisory services, wealth
management, and financial planning services, (2) commission revenue from wealth
advisory, prime and institutional brokerage transactions, and (3) principal
transactions. We also earn interest on cash held and receive
dividends from the equity and fixed income securities held in our corporate
capital accounts, receive sales credits from third party placement agreements,
earn fees through the sale of insurance products, and have realized and
unrealized gains (or losses) on securities in our inventory
account.
Expenses. Our expenses
consist of (1) compensation and benefits, (2) floor brokerage, exchange, and
clearance fees, and (3) other expenses. Compensation and benefits have both a
variable component, based on revenue production, and a fixed component. The
variable component includes institutional and retail sales commissions, bonuses,
overrides, and other incentives. Wealth advisory and institutional commissions
are based on competitive commission schedules. The fixed component includes
administrative and executive salaries, payroll taxes, employee benefits, and
temporary employee costs. Compensation and benefits is our largest expense item
and includes wages, salaries, and benefits. During 2009, compensation and
benefits represented 59.3% of total expenses and 60.7% of total revenue,
compared to 49.5% of total expenses and 61.1% of total revenue during
2008. The increase in compensation and benefits as a percentage of
expenses is principally due to a $56.7 million goodwill and other intangible
assets impairment charge recognized in 2008. The decrease in
compensation and benefits as a percentage of total revenue is principally due to
a decrease in revenue in our prime brokerage services division which has a
higher payout than our other business lines.
26
Floor
brokerage, exchange, and clearance fees include clearing and trade execution
costs associated with the retail, prime, and institutional brokerage business at
SMH. SMH clears its transactions through several clearing firms, including
Pershing, an affiliate of The Bank of New York Mellon, Goldman Sachs Execution
& Clearing, L.P., Ridge Clearing & Outsourcing Solutions, Inc., First
Clearing Corporation, and J.P. Morgan Clearing Corp.
Other
expenses include (1) communications and data processing expenses, such as
third-party systems, data, and software providers, (2) occupancy expenses, such
as rent and utility charges for facilities, (3) interest expense, (4) goodwill
and other intangible assets impairment charges, (5) amortization of intangible
assets, and (6) other general and administrative expenses.
Results
of Operations
Year
Ended December 31, 2009 Compared to Year Ended December 31, 2008
Total
revenue increased $3.5 million to $175.4 million in 2009 from $171.9 million in
2008, while total expenses decreased $32.8 million to $179.5 million in 2009
from $212.3 million in 2008. The Company recognized goodwill and
other intangible assets impairment charges of $14.6 million in 2009 and $56.7
million in 2008. Equity in income (loss) of limited partnerships
decreased to a loss of $1.3 million in 2009 from income of $38.6 million in
2008, primarily due to the sale of our interests in Salient Partners, L.P. and
Endowment Advisers, L.P. in 2008. The Company recognized a $3.0
million gain on step acquisition in 2009 related to the Company’s
previously-held noncontrolling interest in Edelman Financial Advisors, LLC
(“EFA”). Loss from continuing operations was $5.2 million, or $0.18
per diluted common share, in 2009 compared to $20.3 million, or $0.75 per
diluted common share, in 2008.
Revenue
from investment advisory and related services decreased from $73.8 million
during 2008 to $72.0 million in 2009 as a result of a decrease in average client
assets. Commission revenue decreased to $44.0 million in 2009 from
$48.9 million during 2008 as a result of a decrease in trading volume in the
Wealth Management segment. Investment banking revenue increased to
$2.5 million in 2009 from $2.3 million in 2008 due to an increase in selling
concessions earned, partially offset by a decrease in sales credits received in
investment banking transactions. Principal transactions revenue
increased from $29.0 million in 2008 to $36.4 million in 2009 as the result of
an increase in the sale of fixed income products. Interest and
dividend income increased from $6.7 million in 2008 to $10.7 million in 2009 as
a result of interest earned on notes receivable received in connection with the
sale of our interests in Salient Partners, L.P. and Endowment Advisors,
L.P.
Employee
compensation and benefits increased to $106.4 million in 2009 from $105.0
million in 2008 due to higher employee commission costs in the prime brokerage
services division. Floor brokerage, exchange, and clearance fees
decreased to $5.9 million in 2009 from $6.5 million in 2008 due to a decrease of
$440,000 in clearance fees in the prime brokerage services division reflecting
lower trading volume. Communications and data processing decreased to
$9.9 million in 2009 from $10.0 million in 2008 due to a $79,000 decrease in
clearing firm service fees in the prime brokerage services division. Occupancy
costs increased to $11.5 million in 2009 from $10.0 million in 2008 due to the
acquisition of an additional 66% membership interest in EFA on April 1, 2009 and
the acquisitions of Leonetti and Miller-Green in 2008. Interest
expense increased to $2.7 million in 2009 from $147,000 in 2008 due to (i) $1.1
million of imputed interest associated with an incentive compensation
payable resulting from the sale of our interests in Salient Partners, L.P. and
Endowment Advisers, L.P., (ii) $717,000 of interest related to the credit
facility funded in 2009, and (iii) $786,000 of interest associated with the
acquisition of an additional 66% membership interest in EFA on April 1,
2009. The Company recognized goodwill and other intangible assets
impairment charges of $14.6 million in 2009 and $56.7 million in
2008. Amortization of intangible assets increased to $1.6 million in
2009 from $777,000 in 2008 due to the acquisition of an additional 66%
membership interest in EFA on April 1, 2009. Other general and
administrative expenses increased to $27.0 million in 2009 from $23.1 million in
2008 due to increases of $2.4 million in advertising expense at Edelman and $2.4
million in the provision for uncollectible accounts partially offset by a
decrease in outside sales commissions.
27
Our
effective tax rate from continuing operations was 31.3% in 2009 compared to
(135.7)% in 2008. The effective tax rate for 2008 was impacted by
nondeductible goodwill impairment charges and state income taxes recognized for
book purposes.
During
the first quarter of 2009, the Company closed three retail
offices. The decision was made due to the offices’ inability to
achieve sufficient revenue to offset their costs. During the fourth
quarter of 2009, the Company completed its sale of the Capital Markets
Business. The Company recorded a net loss from discontinued
operations of $277,000 in 2009 compared to $5.0 million in 2008 related to the
closed offices and sold Capital Markets Business. The Company
recognized a gain on the sale of the Capital Markets Business of $5.9 million,
net of income taxes, that is included in net loss from discontinued operations
in 2009.
Results
by Segment
Wealth
Management
|
Year Ended December 31,
|
||||||||
|
2009
|
2008
|
|||||||
|
(in
thousands)
|
||||||||
|
Revenue
|
$ | 100,941 | $ | 101,950 | ||||
|
Income
from continuing operations before income taxes
|
$ | 25,785 | $ | 87,177 | ||||
The
turmoil in the global financial markets over the past year has caused equity
prices to decline to levels not seen in many years. That
market-driven value decline has carried over to our client
portfolios. As the fees and commissions that we charge for managing
client assets is based, to a large degree, on the size of our client portfolios,
we have seen a significant drop in commissions revenue from 2008 to
2009. Revenue from wealth management decreased to $100.9 million in
2009 from $102.0 million in 2008 and income from continuing operations before
income taxes decreased to $25.8 million in 2009 from $87.2 million in
2008. Investment advisory and related services revenue decreased to
$71.9 million from $73.6 million as a result of a decrease in assets under
management or advisement. Commission revenue decreased to $11.6
million from $16.6 million reflecting a decline in shares traded by the firm’s
wealth advisor clients due to uncertainty in the financial
markets. Interest income increased to $8.2 million from $3.4 million
as a result of interest earned on notes receivable received in connection with
the sale of our interests in Salient Partners, L.P. and Endowment Advisers, L.P.
on August 29, 2008. Total expenses increased to $74.3 million in 2009
from $66.7 million in 2008 primarily due to increases of $2.3 million in
advertising expense and $1.6 million in occupancy expense at Edelman resulting
from the Company’s acquisition of 66% of EFA in April 1, 2009. Equity
in income (loss) of limited partnerships decreased to $(898,000) from $51.9
million. The decrease in equity in income (loss) of limited partnerships is
attributable to the sale of our interests in Salient Partners, L.P. and
Endowment Advisers, L.P. in 2008.
Institutional
Services
Institutional
Brokerage
|
Year Ended December 31,
|
||||||||
|
2009
|
2008
|
|||||||
|
(in
thousands)
|
||||||||
|
Revenue
|
$ | 4,814 | $ | 6,574 | ||||
|
Loss
from continuing operations before income taxes
|
$ | (638 | ) | $ | (1,823 | ) | ||
Revenue
from institutional brokerage decreased to $4.8 million in 2009 from $6.6 million
in 2008 and loss from continuing operations before income taxes decreased
to $638,000 in 2009 from $1.8 million in 2008. Commission
revenue decreased by $3.1 million to $4.6 million in 2009 from $7.7 million in
2008 reflecting a decline in the number of shares traded in our
institutional brokerage division. Principal transactions revenue
increased $1.6 million in 2009 compared to 2008 reflecting a decline in losses
from market making activities. Total expenses decreased to $5.5
million in 2009 from $8.4 million in 2008 due to decreased employee compensation
related to the lower commission revenue.
28
Prime Brokerage
Services
|
Year Ended December 31,
|
||||||||
|
2009
|
2008
|
|||||||
|
(in thousands)
|
||||||||
|
Revenue
|
$ | 60,961 | $ | 61,658 | ||||
|
Income
from continuing operations before income taxes
|
$ | 277 | $ | 2,851 | ||||
Revenue
from prime brokerage services decreased to $61.0 million in 2009 from $61.7
million in 2008 and income from continuing operations before income taxes
decreased to $277,000 in 2009 from $2.9 million in 2008. Commission
revenue and third-party marketing fees increased to $31.8 million in 2009 from
$29.6 million in 2008 reflecting growth in hedge fund servicing
revenue. Principal transactions revenue decreased to $28.9 million in
2009 from $30.6 million in 2008 reflecting a decline in proprietary trading
revenue. Total expenses increased to $60.7 million during 2009 from
$58.8 million during 2008 reflecting an increase in employee commission
expense.
Corporate
Support and Other
|
Year Ended December 31,
|
||||||||
|
2009
|
2008
|
|||||||
|
(in thousands)
|
||||||||
|
Revenue
|
$ | 8,648 | $ | 1,759 | ||||
|
Loss
from continuing operations before income taxes
|
$ | (27,888 | ) | $ | (89,929 | ) | ||
Revenue
from corporate support and other increased to $8.6 million in 2009 from $1.8
million in 2008 and the loss from continuing operations before income taxes
decreased to $27.9 million in 2009 from $89.9 million in
2008. Revenue from principal transactions, which consists principally
of changes in the values of our investment portfolios, increased to a gain of
$5.7 million from a loss of $1.7 million. Total expenses decreased to
$39.1 million in 2009 from $78.4 million in 2008. This decrease is
due to a decline in goodwill and other intangible assets impairment charges to
$14.6 million in 2009 compared to $56.7 million in 2008. Equity in
loss of limited partnerships decreased to a loss of $450,000 in 2009 from a loss
of $13.3 million in 2008. The 2008 loss was primarily due to the decrease
in the value of our direct investment in one limited partnership. The
Company recognized a $3.0 million gain on step acquisition in 2009 related to
the Company’s previously-held noncontrolling interest in EFA.
Year
Ended December 31, 2008 Compared to Year Ended December 31, 2007
Total
revenue increased $16.9 million to $171.9 million in 2008 from $155.1 million in
2007, while total expenses increased $76.4 million to $212.3 million in 2008
from $135.9 million in 2007. Equity in income of limited partnerships
increased to $38.6 million in 2008 from $3.8 million in 2007, primarily due to
the sale of our interests in Salient Partners, L.P. and Endowment Advisers,
L.P. Income (loss) from continuing operations was $(20.3) million, or
$(0.75) per diluted common share, in 2008 compared to $4.6 million, or $0.18 per
diluted common share, in 2007.
Revenue
from investment advisory and related services increased from $71.2 million
during 2007 to $73.8 million in 2008, primarily due to the acquisitions of
Rikoon, Leonetti, and Miller-Green. Commission revenue decreased to
$48.9 million in 2008 from $51.9 million during 2007 as a result of a decrease
in trading volume in the Wealth Management segment. Investment
banking revenue decreased to $2.3 million in 2008 from $10.7 million in 2007,
principally due to a decrease in sales credits earned on investment banking
transactions. Principal transactions revenue increased from $7.6
million in 2007 to $29.0 million in 2008, primarily as the result of an increase
in proprietary trading revenue. Interest and dividends was constant
at $6.7 million in 2008 and 2007. A decrease in the amount of
money in the firm’s accounts that earned interest income and a decline in
interest rates in 2008 was offset by interest earned on notes receivable
received in connection with the sale of our interests in Salient Partners, L.P.
and Endowment Advisers, L.P. Other income increased to $11.4 million
in 2008 from $7.0 million in 2007 reflecting growth in hedge fund servicing
revenue and third-party marketing fees.
29
Employee
compensation and benefits increased to $105.0 million in 2008 from $86.9 million
in 2007 due to revenue growth in the prime brokerage services
division. Expenses increased at a disproportionate rate to increased
revenue due to a shift in a portion of revenue from lower compensation
components (wealth management) to higher compensation components (prime
brokerage services). Floor brokerage, exchange, and clearance fees
increased to $6.5 million in 2008 from $5.9 million in 2007 reflecting the
increase in trading volume. Communications and data processing
increased to $10.0 million in 2008 from $8.9 million in 2007 primarily due to
higher clearing firm service fees resulting from the increase in trading volume.
Occupancy costs increased to $10.0 million in 2008 from $9.1 million in 2007 due
to the increase in the amount of rental space occupied by SMH and the addition
of Rikoon, Dickenson, Leonetti, and Miller-Green. Interest expense
increased to $147,000 in 2008 from $34,000 in 2007 due to the imputed interest
associated with an incentive compensation payable resulting from the sale of our
interests in Salient Partners, L.P. and Endowment Advisers, L.P. The
Company recognized goodwill and other intangible assets impairment charges of
$56.7 million in 2008. No such charge was recognized in
2007. Amortization of intangible assets increased to $777,000 in 2008
from $349,000 in 2007 due to the addition of Rikoon, Dickenson, Leonetti, and
Miller-Green. Other general and administrative expenses decreased to
$23.1 million in 2008 from $24.8 million in 2007 primarily due to a decrease in
the provision for bad debts which was partially offset by an increase in outside
sales commissions.
Our
effective tax rate from continuing operations was (135.7)% in 2008 compared to
36.0% in 2007. The effective tax rate for 2008 was impacted by
nondeductible goodwill impairment charges and state income taxes recognized for
book purposes.
During
the first quarter of 2009, the Company closed three retail
offices. The decision was made due to the offices’ inability to
achieve sufficient revenue to offset their costs. During the fourth
quarter of 2009, the Company completed its sale of the Capital Markets
Business. The Company recorded a net loss from discontinued
operations of $5.0 million in 2008 and net income from discontinued operations
of $499,000 in 2007 related to the closed offices and sold Capital Markets
Business.
Results
by Segment
Wealth
Management
|
Year Ended December 31,
|
||||||||
|
2008
|
2007
|
|||||||
|
(in thousands)
|
||||||||
|
Revenue
|
$ | 101,950 | $ | 103,461 | ||||
|
Income
from continuing operations before income taxes
|
$ | 87,177 | $ | 42,354 | ||||
Revenue
from wealth management decreased to $102.0 million in 2008 from $103.5 million
in 2007 and income from continuing operations before income taxes increased to
$87.2 million in 2008 from $42.4 million in 2007. Sales credits from
investment banking transactions decreased to $801,000 in 2008 from $6.3 million
in 2007. This decrease was partially offset by an increase in
investment advisory and related services revenue to $73.6 million in 2008 from
$71.0 million in 2007, primarily due to the acquisitions of Rikoon, Dickenson,
Leonetti, and Miller-Green. Additionally, the conversion of Edelman’s
assets under management from a commission-based to a fee-based compensation
structure contributed to the growth in investment advisory fee
revenue. Total expenses decreased to $66.7 million in 2008 from $69.6
million in 2007, due to decreased employee compensation related to the lower
revenue. This decrease was partially offset by an increase in
intangible amortization costs associated with the acquisition of
Dickenson. Equity in income of limited partnerships increased to
$51.9 million in 2008 from $8.5 million in 2007. The increase in
equity in income of limited partnerships is attributable to the sale of our
interests in Salient Partners, L.P. and Endowment Advisers, L.P. in
2008.
30
Institutional
Services
Institutional
Brokerage
|
Year Ended December 31,
|
||||||||
|
2008
|
2007
|
|||||||
|
(in
thousands)
|
||||||||
|
Revenue
|
$ | 6,574 | $ | 11,723 | ||||
|
Income
(loss) from continuing operations
|
||||||||
|
before
income taxes
|
$ | (1,823 | ) | $ | 822 | |||
Revenue
from institutional brokerage decreased to $6.6 million in 2008 from $11.7
million in 2007 and income (loss) from continuing operations before income taxes
decreased to a loss of $1.8 million in 2008 from income of $822,000 in
2007. Commission revenue decreased to $7.7 million in 2008 from $8.7
million in 2007 reflecting a decline in the number of shares traded in our
institutional brokerage division. In addition, sales credits
from syndicate and investment banking activities declined to $353,000 in 2008
from $2.9 million in 2007 reflecting a lower volume of offerings sold by the
institutional division. Total expenses decreased to $8.4 million in
2008 from $10.9 million in 2007 due to decreased employee compensation related
to the lower commission revenue.
Prime Brokerage
Services
|
Year Ended December 31,
|
||||||||
|
2008
|
2007
|
|||||||
|
(in thousands)
|
||||||||
|
Revenue
|
$ | 61,658 | $ | 36,583 | ||||
|
Income
from continuing operations before income taxes
|
$ | 2,851 | $ | 2,750 | ||||
Revenue
from prime brokerage services increased to $61.7 million in 2008 from $36.6
million in 2007 and income from continuing operations before income taxes
increased to $2.9 million in 2008 from $2.8 million in
2007. Commission revenue and third-party marketing fees increased to
$29.6 million in 2008 from $25.3 million in 2007 reflecting growth in hedge fund
servicing revenue. In addition, principal transactions revenue
increased to $30.6 million in 2008 from $7.8 million in 2007 reflecting an
increase in revenue earned from the sale of fixed income products and trading
activities. Total expenses increased to $58.8 million during 2008
from $33.8 million during 2007 reflecting increased compensation and outside
sales commissions related to increased revenue. Our profit sharing
arrangement in effect for 2008 and 2007 for prime brokerage services provides
generally that we retain $2.75 million of the first $3.25 million of income and
that we do not share in additional income until book profit of the division
exceeds $5.5 million.
Corporate
Support and Other
|
Year Ended December 31,
|
||||||||
|
2008
|
2007
|
|||||||
|
(in thousands)
|
||||||||
|
Revenue
|
$ | 1,759 | $ | 3,304 | ||||
|
Loss
from continuing operations before income taxes
|
$ | (89,929 | ) | $ | (22,912 | ) | ||
31
Revenue
from corporate support and other decreased to $1.8 million in 2008 from $3.3
million in 2007 and the loss from continuing operations before income taxes
increased to a loss of $89.9 million in 2008 from a loss of $22.9 million in
2007. Interest and dividend income decreased to $2.3 million in 2008
from $3.8 million in 2007 due to a decrease in the amount of money in the firm’s
accounts that are earning interest income and a decline in interest rates in
2008. Total expenses increased to $78.4 million in 2008 from $21.6
million in 2007 primarily due to $56.7 million of goodwill and other intangible
assets impairment charges recognized in 2008. Equity in loss of
limited partnerships increased to a loss of $13.3 million in 2008 from a loss of
$4.6 million in 2007, due to the decrease in the value of our direct investment
in one limited partnership.
Liquidity
and Capital Resources
Cash
Requirements
The
Company’s funding needs consist of (1) funds necessary to maintain current
operations, (2) capital expenditure requirements, including funds needed for the
Edelman expansion, (3) debt repayment, and (4) funds used for
acquisitions.
Payments
due by period for the Company’s contractual obligations at December 31, 2009 are
as described in the following table:
|
Payment due by period
|
||||||||||||||||||||
|
After 1 but
|
After 3 but
|
|||||||||||||||||||
|
Within
|
within
|
within
|
After
|
|||||||||||||||||
|
Total
|
1 year
|
3 years
|
5 years
|
5 years
|
||||||||||||||||
|
(in
thousands)
|
||||||||||||||||||||
|
Operating
lease obligations
|
$ | 53,783 | $ | 10,567 | $ | 19,731 | $ | 12,363 | $ | 11,122 | ||||||||||
|
Repayment
of borrowings
|
20,238 | 7,143 | 13,095 | - | - | |||||||||||||||
|
Consideration
for additional interest in Rikoon
|
4,000 | - | 4,000 | - | - | |||||||||||||||
|
Total
|
$ | 78,021 | $ | 17,710 | $ | 36,826 | $ | 12,363 | $ | 11,122 | ||||||||||
Operating
expenses consist of compensation and benefits, floor brokerage, exchange, and
clearing costs, and other expenses. These expenses are primarily dependent on
revenue and, with the exception of obligations for office rentals, should
require a limited amount of capital in addition to that provided by revenue
during 2010. Currently, obligations for non-cancelable office leases
total $10.6 million during 2010. Funds required for other working
capital items such as receivables, securities owned, and accounts payable, along
with expenditures to repurchase stock, are expected to total between $2.0
million and $4.0 million during 2010. Capital expenditure
requirements are expected to total between $4.0 million and $6.0 million during
2010, mainly consisting of leasehold improvements, furniture, and computer
equipment and software. Funds needed for acquisitions will depend on the
completion of transactions that may not be identifiable until such time as the
acquisition is completed.
We intend
to satisfy our funding needs with our own capital resources, consisting largely
of internally generated earnings and liquid assets, and with borrowings from
outside parties. At December 31, 2009, we had approximately $41.9
million in cash and cash equivalents, which together with liquid assets,
consisting of receivables from broker-dealers, deposits with clearing
organizations, and marketable securities owned totaled $62.1
million.
Receivables
turnover, calculated as total revenue divided by average receivables, was two
for each of the years ended December 31, 2009 and 2008. The allowance
for doubtful accounts as a percentage of receivables was 2.2% at December 31,
2009 compared to 1.3% at December 31, 2008. The increase in the
allowance for doubtful accounts as a percentage of receivables was the result of
an increase in the allowance for employee notes receivables from the three
offices closed in the first quarter of 2009.
Sources
and Uses of Cash
On
December 16, 2009, we completed a sale of $7.5 million of shares and warrants to
Fletcher International, Ltd. at a price of $7.00 per share. The
proceeds were used to repay the subordinated promissory note issued in
connection with the EFA acquisition.
32
For the
year ended December 31, 2009, net cash provided by operations totaled $21.9
million compared to $27.0 million during 2008. Receivables decreased
by $7.7 million during the year ended December 31, 2009, due to payments
received on the notes receivable issued in exchange for the sale of our
interests in Salient Partners, L.P. and Endowment Advisers, L.P.
Marketable
securities owned decreased by $11.0 million during the year ended December 31,
2009, while securities sold, not yet purchased decreased by $4.5 million and
payables to broker-dealers and clearing organizations decreased by $2.0
million. The change in marketable securities owned, securities
sold, not yet purchased, and payables to broker-dealers and clearing
organizations is primarily due to the portfolios in accounts managed by third
party managers. The Company’s accounts managed by third parties
carry both long and short fixed income and equity securities. These
accounts are managed to generate profits based on trading spreads, rather than
through speculation on the direction of the market. We employ hedging
strategies designed to insulate the net value of our trading inventories from
fluctuations in the general level of interest rates and equity price
variances. We finance a portion of our trading positions through our
clearing broker-dealers.
Not
readily marketable securities owned, primarily investments in limited
partnerships, were $22.8 million at December 31, 2009 compared to $32.7 million
at December 31, 2008. This decrease is the result of net dispositions
of investment positions as well as changes in the values of our investment
portfolios. These limited partnerships typically have a ten-year
life.
Capital
expenditures for the year ended December 31, 2009 were $2.7 million mainly for
the purchase of leasehold improvements, furniture, and computer equipment and
software necessary for our growth.
At
December 31, 2009, SMH, our registered broker-dealer subsidiary, was in
compliance with the net capital requirements of the SEC's Uniform Net Capital
Rules and had capital in excess of the required minimum.
Critical
Accounting Policies/Estimates
Valuation of Not Readily Marketable
Securities. Securities not readily marketable include
investment securities (1) for which there is no market on a securities exchange
or no independent publicly quoted market, (2) that cannot be publicly offered or
sold unless registration has been effected under the Securities Act of 1933 or
other applicable securities acts, or (3) that cannot be offered or sold because
of other arrangements, restrictions, or conditions applicable to the securities
or to the company. Securities not readily marketable consist
primarily of investments in private companies, limited partnerships, equities,
options, and warrants.
Generally,
investments in shares of public companies are valued at a discount of up to 30%
to the closing market price on the balance sheet date if the shares are not
readily marketable. Investments in unregistered shares of public
companies are valued at up to a 30% discount from the most recent sales price of
registered shares, except in cases where the securities may be sold pursuant to
a currently effective registration statement or an exemption from registration
and there exists sufficient trading volume in the securities, in which case the
market price is used. The discounts reflect liquidity risk and
contractual or statutory restrictions on transfer. Investments in limited
partnerships are accounted for using the equity method, which approximates fair
value.
Investments
in not readily marketable securities, marketable securities with insufficient
trading volumes, and restricted securities are carried at their estimated fair
value by the Company in the absence of readily ascertainable market
values. These estimated values may differ significantly from the
values that would have been used had a readily available market existed for
these investments. Such differences could be material to the
financial statements. At December 31, 2009 and 2008, the
Company’s investment portfolios included investments totaling $22.8 million and
$32.7 million, respectively, whose values had been estimated by the Company in
the absence of readily ascertainable market values.
33
Goodwill. Goodwill
represents the excess of the aggregate purchase price over the fair value of the
net assets acquired in a business combination. Goodwill is reviewed
for impairment at least annually in accordance with the provisions of the
Financial Accounting Standards Board’s (“FASB”) Accounting Standards
Codification (“ASC”) Topic 350, Intangibles – Goodwill and
Other. ASC Topic 350 requires that goodwill be tested for
impairment between annual test dates if an event or changing circumstances
indicate that it is more likely than not that the fair value of the reporting
unit is below its carrying amount. The goodwill impairment test is a
two-step test. Under the first step, the fair value of the reporting
unit is compared with its carrying value (including goodwill and other
intangible assets). If the fair value of the reporting unit is less
than its carrying value, an indication of goodwill impairment exists for the
reporting unit and the enterprise must perform step two of the impairment test
(measurement). Under step two, an impairment loss is recognized for
any excess of the carrying amount of the reporting unit’s goodwill over the
implied fair value of that goodwill. The implied fair value of
goodwill is determined by allocating the fair value of the reporting unit in a
manner similar to a purchase price allocation, in accordance with FASB ASC Topic
805, Business
Combinations. The residual fair value after this allocation is
the implied fair value of the reporting unit goodwill.
Factors
considered in determining fair value include, among other things, the Company’s
market capitalization as determined by quoted market prices for its common stock
and the value of the Company’s reporting units. The Company uses
several methods to value its reporting units, including discounted cash flows,
comparisons with valuations of public companies in the same industry, and
multiples of assets under management. If the fair value of the
reporting unit exceeds its carrying value, step two does not need to be
performed.
In
performing the first step of the goodwill impairment test, the estimated fair
values of the reporting units were developed using the methods listed
above. When performing the discounted cash flow analysis, the Company
utilized observable market data to the extent available. Future cash
flow projections are based primarily on actual results and, at April 30, 2009,
include negative future cash flows for one reporting unit. This
reporting unit has no recorded goodwill. Due to the downturn in the
market and the economic recession that began during the second half of 2008,
client assets have decreased resulting in, among other things, lower revenue at
our wealth management businesses. As a result, growth projections
used in the April 30, 2008 cash flow projections have not been
realized. For the February 28, 2009 and April 30, 2009 goodwill
analyses, the cash flow estimates reflect zero growth for all projected future
periods. The discount rates utilized in this analysis ranged from 11%
to 20%. The Company also calculates estimated fair values of the
reporting units utilizing multiples of earnings, book value, and, when
applicable, assets under management of the reporting unit. The
estimated fair value using these techniques is compared with the carrying value
of the reporting unit to determine if there is an indication of
impairment.
The
Company performed an update of its April 30, 2008 review for goodwill impairment
as of February 28, 2009 due to deterioration in overall macroeconomic conditions
and the extended decline in the Company’s stock price. This review
was performed using the methodology described above. Future cash flow
projections were based primarily on actual results with budgeted cash flow
projections used for one reporting unit. When performing the February
28, 2009 discounted cash flow analysis, no future negative cash flows were
projected. This assessment resulted in the recognition of a goodwill
impairment charge of $13.8 million at two reporting units: Edelman -
$13.0 million and Kissinger - $837,000.
The
Company performed its annual review for goodwill impairment as of April 30,
2009. The first step of the April 30, 2009 goodwill impairment test
resulted in no indication of impairment.
Goodwill
is evaluated for impairment at the reporting unit level, which is defined as the
operating subsidiaries of the Company. The Company has four reporting
units with recorded goodwill that were evaluated for impairment. At
April 30, 2009, the estimated fair values of three of the four reporting units
were well in excess of the carrying values of these businesses resulting in no
impairment. For one reporting unit, Leonetti, the excess was
significantly impacted due to a reduction in earnings at this reporting
unit.
With the
Company’s common stock price at extraordinary lows, management analyzed the
estimated fair values of the reporting units in relation to our market
capitalization. The sum of the estimated fair values of the Company’s
reporting units was greater than the market value of the Company’s common
stock. Based upon an analysis of historical acquisitions of financial
services companies similar to ours, we believe the excess of approximately 40%
represents a reasonable control premium in a hypothetical acquisition of the
Company.
Remaining
amounts of goodwill at December 31, 2009 were as follows: Edelman -
$67.2 million, Kissinger - $2.4 million, Dickenson - $2.1 million, SMH Colorado
- $1.5 million, and Leonetti - $225,000. Future goodwill impairment
tests may result in a future charge to earnings.
34
Effects
of Inflation
Historically,
inflation has not had a material effect on our consolidated financial position,
results of operations or cash flows; however, the rate of inflation can be
expected to affect our expenses, such as employee compensation, occupancy, and
equipment. Increases in these expenses may not be readily recoverable in the
prices that we charge for our services. Inflation can have significant effects
on interest rates that in turn can affect prices and activities in the financial
services market. These fluctuations could have an adverse impact on our
financial services operations.
Recent
Accounting Pronouncements
See “Note
1 — Nature of Operations and
Summary of Significant Accounting Policies” in the accompanying notes to
consolidated financial statements included elsewhere in this Annual Report on
Form 10-K for details of recent accounting pronouncements and their expected
impact on the Company’s financial statements.
Item
7A. Quantitative and Qualitative Disclosures About Market
Risk
Market
Risk
The
following discussion relates to our market risk sensitive instruments as of
December 31, 2009.
Our
trading equity and debt securities are marked to market on a daily
basis. At December 31, 2009, our marketable securities
owned were recorded at a fair value of $16.6
million. Additionally, marketable securities sold, not yet purchased
were recorded at a fair value of $8.3 million. These trading equity and debt
securities are subject to equity price risk.
Our
market making and investing activities often involve the purchase, sale, or
short sale of securities and expose our capital to significant risks, including
market risk, equity price risk, and credit risk. Market risk
represents the potential loss we may incur as a result of absolute and relative
price movements, price volatility, and changes in liquidity in financial
instruments due to many factors over which we have no control. Our primary
market risk arises from the fact that we own a variety of investments that are
subject to changes in value and could result in material gains or
losses. We also engage in proprietary trading and make dealer markets
in equity securities. In doing this, we are required to maintain certain amounts
of inventories in order to facilitate customer order flow. We are
exposed to equity price risk due to changes in the level and volatility of
equity prices primarily in Nasdaq and over-the-counter markets. Changes in
market conditions could limit our ability to resell securities purchased or to
purchase securities sold short. Direct market risk exposure to changes in
foreign exchange rates is not material. We do not use derivatives for
speculative purposes.
We seek
to cover our exposure to market and equity price risk by limiting our net long
and short positions and by selling or buying similar instruments. In addition,
trading and inventory accounts are monitored on an ongoing basis, and we have
established position limits. Position and exposure reports are prepared at the
end of each trading day and are reviewed by traders, trading managers, and
management personnel. These reports show the amount of capital committed to
various issuers and industry segments. Securities held in our investment
portfolio are guided by an investment policy and are reviewed on a regular
basis.
Credit
risk represents the potential loss due to a client or counterparty failing to
perform its contractual obligations, such as delivery of securities or payment
of funds, or the value of collateral held to secure obligations proving to be
inadequate as related to our margin lending activities. This risk
depends primarily on the creditworthiness of the counterparty. We
seek to control credit risk by following an established credit approval process,
monitoring credit limits, and requiring collateral where
appropriate.
We
monitor our market and counterparty risk on a daily basis through a number of
control procedures designed to identify and evaluate the various risks to which
we are exposed. We have established various committees to assess and
to manage risk associated with our activities. The committees review, among
other things, business and transactional risks associated with potential clients
and products to be sold.
Our
financial services business is affected by general economic
conditions. Our revenue relating to asset-based advisory services and
managed accounts is typically from fees based on the market value of assets
under management or advisement. The decline in assets under our
management due to the instability in the overall stock market resulted in lower
management fees for us as well as lower trading volume and reduced commission
rates which have had a negative impact on our commission revenue.
35
At
December 31, 2009, securities owned by the Company were recorded at a fair value
of $39.4 million, including $16.6 million in marketable securities, $20.0
million representing our investments in limited partnerships, and $2.8 million
representing other not readily marketable securities.
We do not
act as dealer, trader, or end-user of complex derivative contracts such as
swaps, collars, and caps. However, SMH does act as a dealer and
trader of mortgage-derivative securities, called collateralized mortgage
obligations (CMOs or REMICs). Mortgage-derivative securities
redistribute the risks associated with their underlying mortgage collateral by
redirecting cash flows according to specific formulas or algorithms to various
tranches or classes designed to meet specific investor objectives.
Operational
Risk
Operational
risk generally refers to the risk of loss resulting from our operations,
including, but not limited to, improper or unauthorized execution and processing
of transactions, deficiencies in our operating systems, business disruptions,
and inadequacies or breaches in our internal control processes. Our businesses
are highly dependent on our and our third party providers’ ability to process,
on a daily basis, a large number of transactions across numerous and diverse
markets. In addition, the transactions we process have become increasingly
complex. If any of our or our third party providers’ financial, accounting, or
other data processing systems do not operate properly or are disabled or if
there are other shortcomings or failures in our internal processes, people, or
systems, we could suffer an impairment to our liquidity, financial loss, a
disruption of our businesses, liability to clients, regulatory intervention, or
reputational damage. These systems may fail to operate properly or become
disabled as a result of events that are wholly or partially beyond our control,
including a disruption of electrical or communications services or our inability
to occupy one or more of our buildings. The inability of our systems to
accommodate an increasing volume of transactions could also constrain our
ability to expand our businesses.
We also
face the risk of operational failure or termination of any of the clearing
agents, exchanges, clearing houses or other financial intermediaries we use to
facilitate our securities transactions. Any such failure or termination could
adversely affect our ability to effect transactions and manage our exposure to
risk.
In
addition, despite the contingency plans we have in place, our ability to conduct
business may be adversely impacted by a disruption in the infrastructure that
supports our businesses and the communities in which they are located. This may
include a disruption involving electrical, communications, transportation, or
other services used by us or third parties with which we conduct
business.
Our
operations rely on the secure processing, storage, and transmission of
confidential and other information in our computer systems and networks.
Although we take protective measures and endeavor to modify them as
circumstances warrant, our computer systems, software, and networks may be
vulnerable to unauthorized access, computer viruses, or other malicious code,
and other events that could have a security impact. If one or more of such
events occur, this potentially could jeopardize our or our clients’ or
counterparties’ confidential and other information processed and stored in, and
transmitted through, our computer systems and networks, or otherwise cause
interruptions or malfunctions in our, our clients’, our counterparties’ or third
parties’ operations. We may be required to expend significant additional
resources to modify our protective measures or to investigate and remediate
vulnerabilities or other exposures, and we may be subject to litigation and
financial losses that are either not insured or not fully covered through any
insurance maintained by us.
Legal
and Compliance Risk
Legal and
compliance risk includes the risk of non-compliance with applicable legal and
regulatory requirements. We are subject to extensive regulation in the different
jurisdictions in which we conduct our business. We have various procedures
addressing issues such as regulatory capital requirements, sales and trading
practices, use of and safekeeping of customer funds, credit granting, collection
activities, anti-money laundering, and record keeping.
36
New
Business Risk
New
business risk refers to the risk of entering into a new line of business or
offering a new product. By entering a new line of business or offering a new
product, we may face risks that we are unaccustomed to dealing with and may
increase the magnitude of the risks we currently face. We review proposals for
new businesses and new products to determine if we are prepared to handle the
additional or increased risks associated with entering into such
activities.
Other
Risks
Other
risks encountered by us include political, regulatory, and tax risks. These
risks reflect the potential impact that changes in national, state, and local
laws and tax statutes have on the economics and viability of current or future
transactions. In an effort to mitigate these risks, we continuously review new
and pending regulations and legislation and participate in various industry
interest groups.
37
Item
8. Financial Statements and Supplementary Data
SANDERS
MORRIS HARRIS GROUP INC. AND SUBSIDIARIES
INDEX
TO CONSOLIDATED FINANCIAL STATEMENTS
|
Page
|
|
|
Report
of Independent Registered Public Accounting Firm
|
39
|
|
Report
of Independent Registered Public Accounting Firm
|
40
|
|
Consolidated
Balance Sheets as of December 31, 2009 and 2008
|
41
|
|
Consolidated
Statements of Operations for each of the years in the three-year period
ended
|
|
|
December
31, 2009
|
42
|
|
Consolidated
Statements of Changes in Equity for each of the years in
the
|
|
|
three-year
period ended December 31, 2009
|
43
|
|
Consolidated
Statements of Cash Flows for each of the years in the three-year period
ended
|
|
|
December
31, 2009
|
44
|
|
Notes
to Consolidated Financial Statements
|
45
|
38
Report
of Independent Registered Public Accounting Firm
The Board
of Directors and Shareholders
Sanders
Morris Harris Group Inc.
We have
audited the accompanying consolidated balance sheet of Sanders Morris Harris
Group Inc. (a Texas Corporation) and subsidiaries (the Company) as of December
31, 2009, and the related consolidated statements of operations, changes in
equity, and cash flows for the year then ended. These financial
statements are the responsibility of the Company’s management. Our
responsibility is to express an opinion on these financial statements based on
our audit.
We
conducted our audit in accordance with the standards of the Public Company
Accounting Oversight Board (United States). Those standards require
that we plan and perform the audit to obtain reasonable assurance about whether
the financial statements are free of material misstatement. An audit
includes examining, on a test basis, evidence supporting the amounts and
disclosures in the financial statements. An audit also includes
assessing the accounting principles used and significant estimates made by
management, as well as evaluating the overall financial statement
presentation. We believe that our audit provides a reasonable basis
for our opinion.
In our
opinion, the consolidated financial statements referred to above present fairly,
in all material respects, the financial position of Sanders Morris Harris Group
Inc. and subsidiaries as of December 31, 2009, and the results of their
operations and their cash flows for the year then ended in conformity with
accounting principles generally accepted in the United States of
America.
As
discussed in Note 1 to the consolidated financial statements, the Company
adopted new accounting guidance on January 1, 2009 related to the accounting and
reporting of non-controlling interest in the consolidated financial statements.
As discussed in Note 1 to the consolidated financial statements, the Company
adopted new accounting guidance on January 1, 2009 related to accounting for
business combinations.
We also
have audited, in accordance with the standards of the Public Company Accounting
Oversight Board (United States), Sanders Morris Harris Group Inc.’s internal
control over financial reporting as of December 31, 2009, based on criteria
established in Internal
Control – Integrated Framework issued by the Committee of Sponsoring
Organizations of the Treadway Commission (COSO) and our report dated March 16,
2010 expressed an unqualified opinion.
/s/ GRANT
THORNTON LLP
Houston,
Texas
March 16,
2010
39
Report
of Independent Registered Public Accounting Firm
The Board
of Directors and Shareholders
Sanders
Morris Harris Group Inc.
We have
audited the accompanying consolidated balance sheet of Sanders Morris Harris
Group Inc. and subsidiaries (the Company) as of December 31, 2008, and
the related consolidated statements of operations, changes in equity, and cash
flows for each of the years in the two-year period ended December 31, 2008.
These consolidated financial statements are the responsibility of the Company’s
management. Our responsibility is to express an opinion on these consolidated
financial statements based on our audits.
We
conducted our audits in accordance with the standards of the Public Company
Accounting Oversight Board (United States). Those standards require that we plan
and perform the audit to obtain reasonable assurance about whether the financial
statements are free of material misstatement. An audit includes examining, on a
test basis, evidence supporting the amounts and disclosures in the financial
statements. An audit also includes assessing the accounting principles used and
significant estimates made by management, as well as evaluating the overall
financial statement presentation. We believe that our audits provide a
reasonable basis for our opinion.
In our
opinion, the consolidated financial statements referred to above present fairly,
in all material respects, the financial position of Sanders Morris Harris Group
Inc. and subsidiaries as of December 31, 2008, and the results of their
operations and their cash flows for each of the years in the two-year period
ended December 31, 2008, in conformity with U.S. generally accepted
accounting principles.
As
discussed in the consolidated financial statements, the Company changed its
method of accounting for certain securities owned in 2008 due to the adoption of
FASB Statement No. 157, Fair Value Measurements,
(included in FASB ASC Topic 820, Fair Value Measurements and
Disclosures).
We also
have audited, in accordance with the standards of the Public Company Accounting
Oversight Board (United States), Sanders Morris Harris Group Inc. and
subsidiaries’ internal control over financial reporting as of December 31,
2008, based on criteria established in Internal Control – Integrated
Framework issued by the Committee of Sponsoring Organizations of the
Treadway Commission (COSO), and our report dated March 16, 2009 expressed
an unqualified opinion on the effectiveness of the Company’s internal control
over financial reporting.
/s/
KPMG LLP
Houston,
Texas
March 16,
2009, except as to note 1, which is as of December 10, 2009 and note 23, which
is as of March 16, 2010
40
SANDERS
MORRIS HARRIS GROUP INC. AND SUBSIDIARIES
CONSOLIDATED
BALANCE SHEETS
(in
thousands, except share and per share amounts)
|
December 31,
|
||||||||
|
2009
|
2008
|
|||||||
|
ASSETS
|
||||||||
|
Cash
and cash equivalents
|
$ | 41,926 | $ | 30,224 | ||||
|
Receivables,
net
|
113,072 | 114,862 | ||||||
|
Deposits
with clearing organizations
|
2,527 | 1,062 | ||||||
|
Securities
owned
|
39,380 | 54,559 | ||||||
|
Furniture,
equipment, and leasehold improvements, net
|
14,617 | 18,859 | ||||||
|
Other
assets and prepaid expenses
|
2,863 | 2,261 | ||||||
|
Goodwill,
net
|
73,455 | 63,078 | ||||||
|
Other
intangible assets, net
|
32,198 | 12,565 | ||||||
|
Total
assets
|
$ | 320,038 | $ | 297,470 | ||||
|
LIABILITIES
AND EQUITY
|
||||||||
|
Liabilities:
|
||||||||
|
Accounts
payable and accrued liabilities
|
$ | 35,357 | $ | 36,644 | ||||
|
Borrowings
|
20,238 | - | ||||||
|
Deferred
tax liability, net
|
15,455 | 14,532 | ||||||
|
Securities
sold, not yet purchased
|
8,339 | 12,884 | ||||||
|
Payable
to broker-dealers and clearing organizations
|
22 | 2,051 | ||||||
|
Total
liabilities
|
79,411 | 66,111 | ||||||
|
Commitments
and contingencies
|
||||||||
|
Equity:
|
||||||||
|
Preferred
stock, $0.10 par value; 10,000,000 shares
|
||||||||
|
authorized; no shares issued and outstanding
|
- | - | ||||||
|
Common
stock, $0.01 par value; 100,000,000 shares
|
||||||||
|
authorized; 29,882,238 and 29,207,962 shares issued,
|
||||||||
|
respectively
|
299 | 292 | ||||||
|
Additional
paid-in capital
|
240,450 | 234,578 | ||||||
|
Accumulated
deficit
|
(16,555 | ) | (5,895 | ) | ||||
|
Treasury
stock, at cost, 0 shares and 1,049,085 shares,
|
||||||||
|
respectively
|
- | (6,421 | ) | |||||
|
Total
Sanders Morris Harris Group Inc. shareholders' equity
|
224,194 | 222,554 | ||||||
|
Noncontrolling
interest
|
16,433 | 8,805 | ||||||
|
Total
equity
|
240,627 | 231,359 | ||||||
|
Total
liabilities and equity
|
$ | 320,038 | $ | 297,470 | ||||
The
accompanying notes are an integral part of these consolidated financial
statements.
41
SANDERS
MORRIS HARRIS GROUP INC. AND SUBSIDIARIES
CONSOLIDATED
STATEMENTS OF OPERATIONS
(in
thousands, except per share amounts)
|
Year Ended December 31,
|
||||||||||||
|
2009
|
2008
|
2007
|
||||||||||
|
Revenue:
|
||||||||||||
|
Investment
advisory and related services
|
$ | 72,006 | $ | 73,759 | $ | 71,178 | ||||||
|
Commissions
|
43,971 | 48,876 | 51,916 | |||||||||
|
Investment
banking
|
2,455 | 2,251 | 10,708 | |||||||||
|
Principal
transactions
|
36,371 | 28,958 | 7,620 | |||||||||
|
Interest
and dividends
|
10,702 | 6,726 | 6,692 | |||||||||
|
Other
income
|
9,859 | 11,371 | 6,957 | |||||||||
|
Total
revenue
|
175,364 | 171,941 | 155,071 | |||||||||
|
Expenses:
|
||||||||||||
|
Employee
compensation and benefits
|
106,380 | 104,995 | 86,893 | |||||||||
|
Floor
brokerage, exchange, and clearance fees
|
5,945 | 6,469 | 5,898 | |||||||||
|
Communications
and data processing
|
9,882 | 10,027 | 8,892 | |||||||||
|
Occupancy
|
11,451 | 10,041 | 9,063 | |||||||||
|
Interest
|
2,691 | 147 | 34 | |||||||||
|
Goodwill
and other intangible assets impairment charges
|
14,575 | 56,698 | - | |||||||||
|
Amortization
of intangible assets
|
1,563 | 777 | 349 | |||||||||
|
Other
general and administrative
|
26,993 | 23,142 | 24,768 | |||||||||
|
Total
expenses
|
179,480 | 212,296 | 135,897 | |||||||||
|
Income
(loss) from continuing operations before equity in income
(loss)
|
||||||||||||
|
of
limited partnerships and income taxes
|
(4,116 | ) | (40,355 | ) | 19,174 | |||||||
|
Equity
in income (loss) of limited partnerships
|
(1,348 | ) | 38,631 | 3,840 | ||||||||
|
Gain
on step acquisition
|
3,000 | - | - | |||||||||
|
Income
(loss) from continuing operations before
|
||||||||||||
|
income
taxes
|
(2,464 | ) | (1,724 | ) | 23,014 | |||||||
|
Provision
(benefit) for income taxes
|
(2,371 | ) | 11,699 | 2,583 | ||||||||
|
Income
(loss) from continuing operations, net of income taxes
|
(93 | ) | (13,423 | ) | 20,431 | |||||||
|
Income
(loss) from discontinued operations, net of income taxes
of
|
||||||||||||
|
$(289),
$(3,007), and $440, respectively
|
(277 | ) | (4,974 | ) | 499 | |||||||
|
Net
income (loss)
|
(370 | ) | (18,397 | ) | 20,930 | |||||||
|
Less: Net
income attributable to the noncontrolling interest
|
(5,112 | ) | (6,896 | ) | (15,837 | ) | ||||||
|
Net
income (loss) attributable to Sanders Morris Harris Group
Inc.
|
$ | (5,482 | ) | $ | (25,293 | ) | $ | 5,093 | ||||
|
Basic
earnings (loss) per common share:
|
||||||||||||
|
Continuing
operations
|
$ | (0.18 | ) | $ | (0.75 | ) | $ | 0.19 | ||||
|
Discontinued
operations
|
(0.01 | ) | (0.19 | ) | 0.02 | |||||||
|
Net
earnings (loss)
|
$ | (0.19 | ) | $ | (0.94 | ) | $ | 0.21 | ||||
|
Diluted
earnings (loss) per common share:
|
||||||||||||
|
Continuing
operations
|
$ | (0.18 | ) | $ | (0.75 | ) | $ | 0.18 | ||||
|
Discontinued
operations
|
(0.01 | ) | (0.19 | ) | 0.02 | |||||||
|
Net
earnings (loss)
|
$ | (0.19 | ) | $ | (0.94 | ) | $ | 0.20 | ||||
|
Weighted
average common shares outstanding:
|
||||||||||||
|
Basic
|
28,402 | 26,972 | 24,777 | |||||||||
|
Diluted
|
28,402 | 26,972 | 25,086 | |||||||||
|
Amounts
attributable to Sanders Morris Harris Group Inc. common
|
||||||||||||
|
shareholders:
|
||||||||||||
|
Income
(loss) from continuing operations, net of income taxes
|
$ | (5,205 | ) | $ | (20,319 | ) | $ | 4,594 | ||||
|
Discontinued
operations, net of income taxes
|
(277 | ) | (4,974 | ) | 499 | |||||||
|
Net
income (loss)
|
$ | (5,482 | ) | $ | (25,293 | ) | $ | 5,093 | ||||
The
accompanying notes are an integral part of these consolidated financial
statements.
42
SANDERS
MORRIS HARRIS GROUP INC. AND SUBSIDIARIES
CONSOLIDATED
STATEMENTS OF CHANGES IN EQUITY
(in
thousands, except shares and per share amounts)
|
Amounts
|
Shares
|
|||||||||||||||||||||||||||||||||||
|
Year
Ended December 31,
|
Year
Ended December 31,
|
|||||||||||||||||||||||||||||||||||
|
2009
|
2008
|
2007
|
2009
|
2008
|
2007
|
|||||||||||||||||||||||||||||||
|
Common
stock
|
||||||||||||||||||||||||||||||||||||
|
Balance,
beginning of year
|
$ | 292 | $ | 258 | $ | 253 | 29,207,962 | 25,765,806 | 25,273,437 | |||||||||||||||||||||||||||
|
Sale
of stock and warrants
|
3 | - | - | 277,715 | - | - | ||||||||||||||||||||||||||||||
|
Stock
issued for acquisition
|
1 | 28 | 2 | 52,901 | 2,859,996 | 242,927 | ||||||||||||||||||||||||||||||
|
Stock
issued pursuant to employee benefit plan
|
3 | 6 | 3 | 343,660 | 582,160 | 249,442 | ||||||||||||||||||||||||||||||
|
Balance,
end of year
|
299 | 292 | 258 | 29,882,238 | 29,207,962 | 25,765,806 | ||||||||||||||||||||||||||||||
|
Additional
paid-in capital
|
||||||||||||||||||||||||||||||||||||
|
Balance,
beginning of year
|
234,578 | 204,596 | 199,176 | |||||||||||||||||||||||||||||||||
|
Sale
of stock and warrants
|
2,649 | - | - | |||||||||||||||||||||||||||||||||
|
Stock
issued for acquisition
|
(96 | ) | 23,905 | 2,398 | ||||||||||||||||||||||||||||||||
|
Unearned
stock-based compensation related to the Capital Markets
Business
|
336 | - | - | |||||||||||||||||||||||||||||||||
|
Stock
issued pursuant to employee benefit plan; including tax
benefit
|
239 | 3,171 | 599 | |||||||||||||||||||||||||||||||||
|
Tax
adjustment related to employee benefit plan
|
(999 | ) | - | - | ||||||||||||||||||||||||||||||||
|
Stock-based
compensation expense
|
3,743 | 2,906 | 2,423 | |||||||||||||||||||||||||||||||||
|
Balance,
end of year
|
240,450 | 234,578 | 204,596 | |||||||||||||||||||||||||||||||||
|
Retained
earnings (accumulated deficit)
|
||||||||||||||||||||||||||||||||||||
|
Balance,
beginning of year
|
(5,895 | ) | 23,422 | 23,902 | ||||||||||||||||||||||||||||||||
|
Cumulative
effect of adoption of a new accounting principle
|
- | 893 | - | |||||||||||||||||||||||||||||||||
|
Cash
dividends declared ($0.18 per share in 2009; 2008; and
2007)
|
(5,178 | ) | (4,917 | ) | (5,573 | ) | ||||||||||||||||||||||||||||||
|
Net
income (loss) attributable to Sanders Morris Harris Group
Inc.
|
(5,482 | ) | (5,482 | ) | (25,293 | ) | (25,293 | ) | 5,093 | 5,093 | ||||||||||||||||||||||||||
|
Balance,
end of year
|
(16,555 | ) | (5,482 | ) | (5,895 | ) | (25,293 | ) | 23,422 | 5,093 | ||||||||||||||||||||||||||
|
Accumulated
other comprehensive income (loss)
|
||||||||||||||||||||||||||||||||||||
|
Balance,
beginning of year
|
- | 161 | 86 | |||||||||||||||||||||||||||||||||
|
Net
change in unrealized appreciation on securities available for
sale
|
- | - | (267 | ) | (267 | ) | 125 | 125 | ||||||||||||||||||||||||||||
|
Income
tax benefit (expense) on change in unrealized appreciation on securities
available for sale
|
- | - | 106 | 106 | (50 | ) | (50 | ) | ||||||||||||||||||||||||||||
|
Balance,
end of year
|
- | - | - | (161 | ) | 161 | 75 | |||||||||||||||||||||||||||||
|
Comprehensive
income (loss)
|
(5,482 | ) | (25,454 | ) | 5,168 | |||||||||||||||||||||||||||||||
|
Treasury
stock
|
||||||||||||||||||||||||||||||||||||
|
Balance,
beginning of year
|
(6,421 | ) | (5,259 | ) | (3,481 | ) | (1,049,085 | ) | (929,285 | ) | (739,411 | ) | ||||||||||||||||||||||||
|
Sale
of stock
|
4,848 | - | - | 793,714 | - | - | ||||||||||||||||||||||||||||||
|
Stock
issued for acquisition
|
1,601 | - | - | 262,180 | - | - | ||||||||||||||||||||||||||||||
|
Acquisition
of treasury stock
|
(28 | ) | (1,162 | ) | (1,778 | ) | (6,809 | ) | (119,800 | ) | (189,874 | ) | ||||||||||||||||||||||||
|
Balance,
end of year
|
- | (6,421 | ) | (5,259 | ) | - | (1,049,085 | ) | (929,285 | ) | ||||||||||||||||||||||||||
|
Noncontrolling
interest
|
||||||||||||||||||||||||||||||||||||
|
Balance,
beginning of year
|
8,805 | 20,105 | 12,124 | |||||||||||||||||||||||||||||||||
|
Purchase
of membership interest from noncontrolling interest
|
7,200 | (77 | ) | 101 | ||||||||||||||||||||||||||||||||
|
Sale
of membership interest to noncontrolling interest
|
- | (1,614 | ) | - | ||||||||||||||||||||||||||||||||
|
Contributions
|
40 | - | 80 | |||||||||||||||||||||||||||||||||
|
Distributions
|
(4,724 | ) | (16,505 | ) | (8,037 | ) | ||||||||||||||||||||||||||||||
|
Net
income attributable to the noncontrolling interest
|
5,112 | 6,896 | 15,837 | |||||||||||||||||||||||||||||||||
|
Balance,
end of year
|
16,433 | 8,805 | 20,105 | |||||||||||||||||||||||||||||||||
|
Total
equity and common shares outstanding
|
$ | 240,627 | $ | 231,359 | $ | 243,283 | 29,882,238 | 28,158,877 | 24,836,521 | |||||||||||||||||||||||||||
The
accompanying notes are an integral part of these consolidated financial
statements.
43
CONSOLIDATED
STATEMENTS OF CASH FLOWS
(in
thousands)
|
Year Ended December 31,
|
||||||||||||
|
2009
|
2008
|
2007
|
||||||||||
|
CASH
FLOWS FROM OPERATING ACTIVITIES:
|
||||||||||||
|
Net
income (loss)
|
$ | (370 | ) | $ | (18,397 | ) | $ | 20,930 | ||||
|
Adjustments
to reconcile net income (loss) to net cash provided by operating
activities:
|
||||||||||||
|
Realized
gain on securities available for sale
|
- | (205 | ) | (1 | ) | |||||||
|
(Gain)
loss on sales of assets
|
(8,770 | ) | 88 | 74 | ||||||||
|
Depreciation
|
4,378 | 3,931 | 3,333 | |||||||||
|
Provision
for bad debts
|
2,642 | 1,180 | 5,308 | |||||||||
|
Stock-based
compensation expense
|
3,743 | 2,906 | 2,423 | |||||||||
|
Goodwill
and other intangible assets impairment charges
|
14,575 | 56,471 | - | |||||||||
|
Amortization
of intangible assets
|
1,563 | 1,004 | 349 | |||||||||
|
Deferred
income taxes
|
922 | 14,501 | (2,950 | ) | ||||||||
|
Equity
in (income) loss of limited partnerships
|
1,348 | (38,631 | ) | (3,840 | ) | |||||||
|
Gain
on step acquisition
|
(3,000 | ) | - | - | ||||||||
|
Unrealized
and realized (gains) losses on not readily marketable securities owned,
net
|
(1,402 | ) | 6,180 | 3,358 | ||||||||
|
Not
readily marketable securities owned received for payment of investment
banking fees
|
(21 | ) | (581 | ) | (1,182 | ) | ||||||
|
Net
change in:
|
||||||||||||
|
Receivables
|
7,741 | 3,142 | (20,348 | ) | ||||||||
|
Deposits
with clearing organizations
|
(1,465 | ) | 33 | (11 | ) | |||||||
|
Marketable
securities owned
|
10,950 | (3,433 | ) | 16,888 | ||||||||
|
Other
assets and prepaid expenses
|
(704 | ) | (740 | ) | (293 | ) | ||||||
|
Accounts
payable and accrued liabilities
|
(3,691 | ) | 3,007 | 2,794 | ||||||||
|
Securities
sold, not yet purchased
|
(4,545 | ) | (2,548 | ) | (4,675 | ) | ||||||
|
Payable
to broker-dealers and clearing organizations
|
(2,029 | ) | (922 | ) | 2,240 | |||||||
|
Net
cash provided by operating activities
|
21,865 | 26,986 | 24,397 | |||||||||
|
CASH
FLOWS FROM INVESTING ACTIVITIES:
|
||||||||||||
|
Capital
expenditures
|
(2,676 | ) | (7,939 | ) | (7,737 | ) | ||||||
|
Acquisitions,
net of cash acquired of $210, $0, and $0, respectively
|
(33,972 | ) | (29,080 | ) | (8,292 | ) | ||||||
|
Proceeds
from sales and maturities of securities available for sale
|
- | 697 | 834 | |||||||||
|
Purchases
of not readily marketable securities owned
|
(2,352 | ) | (1,369 | ) | (24,201 | ) | ||||||
|
Proceeds
from sales of not readily marketable securities owned
|
10,858 | 12,477 | 6,541 | |||||||||
|
Proceeds
from sales of assets
|
806 | 289 | 40 | |||||||||
|
Net
cash used in investing activities
|
(27,336 | ) | (24,925 | ) | (32,815 | ) | ||||||
|
CASH
FLOWS FROM FINANCING ACTIVITIES:
|
||||||||||||
|
Purchases
of treasury stock
|
(28 | ) | (1,162 | ) | (1,778 | ) | ||||||
|
Proceeds
from sale of stock and warrants
|
7,500 | - | - | |||||||||
|
Proceeds
from stock issued pursuant to employee benefit plan
|
225 | 2,795 | 483 | |||||||||
|
Tax
benefit of stock options exercised
|
17 | 382 | 119 | |||||||||
|
Tax
adjustment related to employee benefit plan
|
(999 | ) | - | - | ||||||||
|
Proceeds
from borrowings
|
25,000 | 250 | 145 | |||||||||
|
Repayment
of borrowings
|
(4,762 | ) | (450 | ) | (500 | ) | ||||||
|
Contributions
by noncontrolling interest
|
40 | - | 80 | |||||||||
|
Distributions
to noncontrolling interest
|
(4,724 | ) | (16,505 | ) | (8,037 | ) | ||||||
|
Payments
of cash dividends
|
(5,096 | ) | (3,650 | ) | (4,452 | ) | ||||||
|
Net
cash provided by (used in) financing activities
|
17,173 | (18,340 | ) | (13,940 | ) | |||||||
|
Net
increase (decrease) in cash and cash equivalents
|
11,702 | (16,279 | ) | (22,358 | ) | |||||||
|
CASH
AND CASH EQUIVALENTS AT BEGINNING OF YEAR
|
30,224 | 46,503 | 68,861 | |||||||||
|
CASH
AND CASH EQUIVALENTS AT END OF YEAR
|
$ | 41,926 | $ | 30,224 | $ | 46,503 | ||||||
The
accompanying notes are an integral part of these consolidated financial
statements.
44
SANDERS
MORRIS HARRIS GROUP INC. AND SUBSIDIARIES
NOTES
TO CONSOLIDATED FINANCIAL STATEMENTS
1. NATURE
OF OPERATIONS AND SUMMARY OF SIGNIFICANT ACCOUNTING POLICIES
Nature
of Operations
Sanders
Morris Harris Group Inc. (“SMHG” or “the Company”) provides a broad range of
financial and other professional services, including wealth management
(including investment advice and management, financial planning, sports
representation and management), investment and merchant banking, and
institutional services (including institutional sales and trading, prime
brokerage services, and research). The Company’s operating
subsidiaries include Sanders Morris Harris Inc. (formerly SMH Capital Inc.)
(“SMH”), SMH Capital Advisors, Inc. (“SMH Capital Advisors”), The Edelman
Financial Center, LLC (“Edelman”), The Dickenson Group, LLC (“Dickenson”), The
Rikoon Group, LLC (“Rikoon”), Leonetti & Associates, LLC (“Leonetti”),
Miller-Green Financial Services, Inc. (“Miller-Green”), Kissinger Financial
Services, a division of SMH, (“Kissinger”), and Select Sports Group, Ltd.
(“SSG”). The Company serves a diverse group of institutional,
corporate, and individual clients.
The
Company merged with and acquired its operating subsidiaries from 1999 through
2009. The acquisitions were accounted for using the purchase method
through 2008 and the acquisition method beginning in 2009 and, accordingly,
results of an acquired entity are included in the Company’s consolidated
financial statements from the date of acquisition. As a result, the
current period results are not comparable to the prior periods. See
“Note 2 — Acquisitions and
Dispositions.”
During
the first quarter of 2009, the Company closed three retail
offices. The operating results for these offices are included in
income (loss) from discontinued operations, net of income taxes, and are
excluded from the segment disclosures for all periods
presented. During the fourth quarter of 2009, SMH contributed to
Madison Williams Capital, LLC (“Madison Williams”) the assets, properties,
working capital, and rights related and/or pertaining to its investment banking,
institutional trading (including equity sales and fixed income sales), New York
trading, and research businesses (excluding The Juda Group and the Concept
Capital divisions) (the “Capital Markets Business”) in exchange for a 17.5%
Class A membership interest in Madison Williams, cash, and a note issued by
Madison Williams to the Company. The operating results for the
Capital Markets Business are included in income (loss) from discontinued
operations, net of income taxes, and are excluded from the segment disclosures
for all periods presented.
Principles
of Consolidation
The
consolidated financial statements of the Company include the accounts of its
subsidiaries. All material intercompany transactions and balances
have been eliminated in consolidation.
Management's
Estimates
The
preparation of the consolidated financial statements in conformity with U.S.
generally accepted accounting principles requires management to make estimates
and assumptions that affect the reported amounts of consolidated assets and
liabilities and the disclosure of contingent assets and liabilities at the dates
of the consolidated financial statements and the amounts of revenue and expenses
during the reporting periods. Actual results could differ from those
estimates.
Cash
Equivalents
Highly
liquid debt instruments with original maturities of three months or less when
purchased are considered to be cash equivalents. SMH, the Company’s
broker-dealer subsidiary, is subject to the regulations of the Securities and
Exchange Commission that, among other things, may restrict the withdrawal of
cash held at SMH’s clearing firms that is used to collateralize SMH’s trading
accounts.
Receivables
Receivables
are stated at their net realizable value. Interest income is
recognized using the effective interest method over the life of the related
receivable. If a receivable is noninterest-bearing or carries an
unreasonable rate of interest and is not due within one year, the Company will
impute interest at an appropriate market rate for comparable instruments and
record a corresponding discount.
45
We offer
transition pay, principally in the form of upfront notes receivable (“broker
notes”), to financial advisors and certain key revenue producers as part of our
Company’s overall growth strategy. These broker notes are generally
forgiven by a charge to employee compensation and benefits over a one- to
six-year period if the individual satisfies certain conditions, usually based on
continued employment and certain performance standards. If the
individual leaves before the term of the broker note expires or fails to meet
certain performance standards, the individual is required to repay the
balance. In determining the allowance for doubtful accounts from
former employees, management considers the facts and circumstances surrounding
each receivable, including the amount of the unforgiven balance, the reasons for
the terminated employment relationship, and the former employee’s overall
financial position.
Management
monitors receivables for any collectability issues. The Company does
not typically require collateral. Receivables are considered past due
when payment is not received in accordance with the contractual terms on the
invoice or agreement. The accrual of interest on receivables is
discontinued when, in management’s opinion, the borrower may be unable to meet
payments as they become due. When the interest accrual is
discontinued, all uncollected accrued interest is reversed. Interest income is
subsequently recognized only to the extent cash payments are received in excess
of the remaining past-due principal balance. Receivables are returned
to accrual status when payments are brought current and, in management’s
judgment, the receivable will continue to pay as agreed. An allowance
for doubtful accounts is established based on reviews of individual customer
accounts, recent loss experience, current economic conditions, and other
pertinent factors. Accounts deemed uncollectible are charged to the
allowance.
Securities
Owned
Marketable
securities are carried at fair value based on quoted market
prices. Not readily marketable securities are valued at fair value
based on either internal valuation models or management’s estimate of amounts
that could be realized under current market conditions assuming an orderly
liquidation over a reasonable period of time. Unrealized gains or
losses from marking securities owned to market value are included in revenue
under the caption “Principal transactions” and in “Equity in income (loss) of
limited partnerships.” Securities not readily marketable include
securities (1) for which there is no market on a securities exchange or no
independent publicly quoted market, (2) that cannot be publicly offered or sold
unless registration is effected under the Securities Act of 1933 or other
applicable securities acts, or (3) that cannot be offered or sold because of
other arrangements, restrictions, or conditions applicable to the securities or
to the company. Proprietary transactions in regular-way
trades and the related income/expense are recorded on the trade
date. Realized gains and losses from sales of securities owned are
computed using the average cost method and are also included in revenue under
the caption “Principal transactions.”
Investments
in not readily marketable securities, marketable securities with insufficient
trading volumes, and restricted securities are carried at their estimated fair
value by the Company in the absence of readily ascertainable market
values. These estimated values may differ significantly from the
values that would have been used had a readily available market existed for
these investments. Such differences could be material to the
financial statements. At December 31, 2009 and 2008, the
Company’s investment portfolios included investments totaling $22.8 million and
$32.7 million, respectively, whose values had been estimated by the Company in
the absence of readily ascertainable market values.
Investments
in companies and partnerships in which we have significant influence are
accounted for by the equity method, which approximates fair
value. Investments in companies and partnerships in which we do not
have significant influence are accounted for at cost and evaluated for
impairment when impairment indicators are present. No such indicators
were present at December 31, 2009 and 2008.
Furniture,
Equipment, and Leasehold Improvements
Furniture,
equipment, and leasehold improvements are carried at cost, net of accumulated
depreciation. Depreciation of furniture and equipment is computed on a straight
line basis over a three to seven year period. Amortization of
leasehold improvements is computed on a straight line basis over the term of the
lease. When assets are retired or otherwise disposed
of, the cost and related accumulated depreciation or amortization are removed
from the accounts and any resulting gain or loss is reflected in income for the
period. The cost of maintenance and repairs is charged to expense as incurred;
significant renewals and betterments are capitalized.
46
Goodwill
and Other Intangible Assets
Goodwill
represents the excess of the aggregate purchase price over the fair value of the
net assets acquired in a business combination. Goodwill is reviewed
for impairment at least annually in accordance with the provisions of the
Financial Accounting Standards Board’s (“FASB”) Accounting Standards
Codification (“ASC”) Topic 350, Intangibles – Goodwill and
Other. ASC Topic 350 requires that goodwill be tested for
impairment between annual test dates if an event or changing circumstances
indicate that it is more likely than not that the fair value of the reporting
unit is below its carrying amount. The goodwill impairment test
is a two-step test. Under the first step, the fair value of the
reporting unit is compared with its carrying value (including goodwill and other
intangible assets). If the fair value of the reporting unit is less
than its carrying value, an indication of goodwill impairment exists for the
reporting unit and the enterprise must perform step two of the impairment test
(measurement). Under step two, an impairment loss is recognized for
any excess of the carrying amount of the reporting unit’s goodwill over the
implied fair value of that goodwill. The implied fair value of
goodwill is determined by allocating the fair value of the reporting unit in a
manner similar to a purchase price allocation, in accordance FASB ASC Topic 805,
Business
Combinations. The residual fair value after this allocation is
the implied fair value of the reporting unit goodwill.
Factors
considered in determining fair value include, among other things, the Company’s
market capitalization as determined by quoted market prices for its common stock
and the value of the Company’s reporting units. The Company uses
several methods to value its reporting units, including discounted cash flows,
comparisons with valuations of public companies in the same industry, and
multiples of assets under management. If the fair value of the
reporting unit exceeds its carrying value, step two does not need to be
performed.
Other
intangible assets consist primarily of customer relationships and trade names
acquired in business combinations. Other intangible assets acquired
that have indefinite lives (trade names) are not amortized but are tested for
impairment annually, or if certain circumstances indicate a possible impairment
may exist. Certain other intangible assets acquired (customer
relationships and covenants not to compete) are amortized on a straight line
basis over their estimated useful lives and tested for impairment if certain
circumstances indicate an impairment may exist.
Stock-Based
Compensation
Stock-based
awards are measured based on the grant-date fair value of the award and
recognized over the period from the service inception date through the date the
employee is no longer required to provide service to earn the
award. Expected forfeitures are included in determining stock-based
compensation expense.
Income
Taxes
The
Company utilizes the asset and liability method for deferred income taxes. This
method requires recognition of deferred tax assets and liabilities for the
expected future tax consequences of events recognized in the Company's financial
statements or tax returns. All expected future events other than changes in the
law or tax rates are considered in estimating future tax
consequences.
The
Company utilizes a two-step approach to evaluate uncertain tax positions.
Recognition, step one, requires evaluation of the tax position to determine if
based solely on technical merits it is more likely than not to be sustained upon
examination. Measurement, step two, is addressed only if a position is more
likely than not to be sustained. In step two, the tax benefit is measured as the
largest amount of benefit, determined on a cumulative probability basis, which
is more likely than not to be realized upon ultimate settlement with tax
authorities. If a position does not meet the more likely than not threshold for
recognition in step one, no benefit is recorded until the first subsequent
period in which the more likely than not standard is met, the issue is resolved
with the taxing authority, or the statute of limitations expires. Positions
previously recognized are derecognized when we subsequently determine the
position no longer is more likely than not to be sustained. Evaluation of tax
positions, their technical merits, and measurement using cumulative probability
are highly subjective management estimates. Actual results could differ
materially from these estimates.
The
provision for income taxes includes federal, state, and local income taxes
currently payable and those deferred because of temporary differences between
the financial statements and tax bases of assets and liabilities. The
Company recognizes interest accrued related to unrecognized tax benefits in
interest expense. Penalties and related interest, if any, are
recognized in other general and administrative expense.
The
Company recognizes and measures tax positions based on the individual tax
position’s amount expected to be sustained upon settlement with the tax
authority.
Commissions
Commissions
and related clearing expenses are recorded on the trade date as securities
transactions occur.
Investment
Banking
Investment
banking revenue includes sales credits earned on investment banking transactions
including participation in syndicates. Investment banking sales
concessions are recorded on settlement date.
47
Investment
Advisory and Related Services
Revenue
from investment advisory and related services consists primarily of portfolio
and partnership management fees. Portfolio management fees are
received quarterly and are recognized as earned when payments are
due. Partnership management fees are received quarterly and are
recognized as earned on a monthly basis.
Fair
Values of Financial Instruments
The fair
values of cash and cash equivalents, receivables, accounts payable and accrued
liabilities, and payables to broker-dealers approximate cost due to the short
period of time to maturity. Securities owned, and securities sold,
not yet purchased are carried at their fair values. The carrying
amount of our borrowings approximates fair value because the interest rate is
variable and, accordingly, approximates current market rates.
Sale
of Stock and Warrants
On
December 16, 2009, the Company sold, for a purchase price of $7.5 million,
1,071,429 shares of common stock and a warrant to purchase common shares in an
aggregate value of up to $7.5 million to Fletcher International,
Ltd. The warrant entitles the holder to purchase shares of the
Company’s common stock for a period of ten years from the date of issuance at an
exercise price of $5.75 per share. The proceeds from this sale were
used to repay the subordinated promissory note issued in connection with the
acquisition of Edelman Financial Advisors, LLC (“EFA”).
New
Authoritative Accounting Guidance
On July
1, 2009, the ASC became the FASB’s officially recognized source of authoritative
U.S. generally accepted accounting principles (“GAAP”) applicable to all
non-governmental entities in the preparation of financial
statements. Rules and interpretive releases of the Securities and
Exchange Commission (“SEC”) under the authority of federal securities laws are
also sources of authoritative GAAP for SEC registrants. All guidance
contained in the ASC carries an equal level of authority. All
non-grandfathered, non-SEC accounting literature not included in the ASC is
superseded and deemed non-authoritative. The switch to the ASC
affects the way companies refer to U.S. GAAP in financial statements and
accounting policies. Citing particular content in the ASC involves
specifying the unique numeric path to the content through the Topic, Subtopic,
Section, and Paragraph structure.
FASB ASC Topic 260, Earnings Per
Share. On January 1, 2009, the Company adopted new authoritative
accounting guidance under ASC Topic 260, Earnings Per Share, which provides that
unvested share-based payment awards that contain nonforfeitable rights to
dividends or dividend equivalents (whether paid or unpaid) are participating
securities and shall be included in the computation of earnings per share
pursuant to the two-class method. The Company has determined that its
outstanding non-vested stock awards are participating securities that should be
included in the basic earnings (loss) per share calculation. Accordingly,
effective January 1, 2009, earnings per common share is computed using the
two-class method prescribed under FASB ASC Topic 260. All previously reported
earnings per common share data has been retrospectively adjusted to conform to
the new computation method.
FASB ASC Topic 320, Investments –
Debt and Equity Securities. New authoritative accounting
guidance under ASC Topic 320, Investments – Debt and Equity
Securities, (i) changes existing guidance for determining whether an
impairment is other than temporary to debt securities and (ii) replaces the
existing requirement that the entity’s management assert it has both the intent
and ability to hold an impaired security until recovery with a requirement that
management assert: (a) it does not have the intent to sell the security; and (b)
it is more likely than not it will not have to sell the security before recovery
of its cost basis. Under ASC Topic 320, declines in the fair value of
held-to-maturity and available-for-sale securities below their cost that are
deemed to be other than temporary are reflected in earnings as realized losses
to the extent the impairment is related to credit losses. The amount
of the impairment related to other factors is recognized in other comprehensive
income. The Company adopted the provisions of the new authoritative
accounting guidance under ASC Topic 320 for the interim period ending June 30,
2009. Adoption of the new guidance did not have a material impact on
the Company’s consolidated financial statements.
FASB ASC Topic 805, Business
Combinations. On January 1, 2009, new authoritative guidance
under ASC Topic 805, Business
Combinations, became applicable to
the Company’s accounting for business combinations closing on or after January
1, 2009. ASC Topic 805 applies to all transactions and other events
in which one entity obtains control over one or more other businesses. ASC Topic
805 requires an acquirer, upon initially obtaining control of another entity, to
recognize the assets, liabilities, and any non-controlling interest in the
acquiree at fair value as of the acquisition date. Contingent consideration is
required to be recognized and measured at fair value on the date of acquisition
rather than at a later date when the amount of that consideration may be
determinable beyond a reasonable doubt. This fair value approach replaces the
cost-allocation process required under previous accounting guidance whereby the
cost of an acquisition was allocated to the individual assets acquired and
liabilities assumed based on their estimated fair value. ASC Topic 805 requires
acquirers to expense acquisition-related costs as incurred rather than
allocating such costs to the assets acquired and liabilities assumed, as was
previously the case under prior accounting guidance. Assets acquired and
liabilities assumed in a business combination that arise from contingencies are
to be recognized at fair value if fair value can be reasonably
estimated. If fair value of such an asset or liability cannot be
reasonably estimated, the asset or liability would generally be recognized in
accordance with ASC Topic 450, Contingencies. Under
ASC Topic 805, the requirements of ASC Topic 420, Exit or Disposal Cost
Obligations, would have to be met in order to accrue for a restructuring
plan in acquisition method accounting. Pre-acquisition contingencies
are to be recognized at fair value, unless it is a non-contractual contingency
that is not likely to materialize, in which case, nothing should be recognized
in acquisition method accounting and, instead, that contingency would be subject
to the probable and estimable recognition criteria of ASC Topic 450, Contingencies. Adoption of
the new guidance had a material impact on the Company’s consolidated financial
statements. See “Note 2 — Acquisitions and Dispositions.”
48
FASB ASC Topic 810,
Consolidation. New authoritative guidance under ASC Topic
810, Consolidation,
amended prior guidance to establish accounting and reporting standards for the
non-controlling interest in a subsidiary and for the deconsolidation of a
subsidiary. Under ASC Topic 810, a non-controlling interest in a
subsidiary, which is sometimes referred to as minority interest, is an ownership
interest in the consolidated entity that should be reported as a component of
equity in the consolidated financial statements. Among other requirements, ASC
Topic 810 requires consolidated net income to be reported at amounts that
include the amounts attributable to both the parent and the non-controlling
interest in subsidiaries. It also requires disclosure, on the face of the
consolidated income statement, of the amounts of consolidated net income
attributable to the parent and to the non-controlling interest in subsidiaries.
The new authoritative accounting guidance under ASC Topic 810 was effective for
the Company on January 1, 2009 and was applied retrospectively for all
periods presented. Shareholders’ equity changed due to the
application of the new authoritative accounting
guidance. Noncontrolling interest, formerly presented as minority
interests outside of shareholders’ equity, is now included in
equity.
Further
new authoritative accounting guidance under ASC Topic 810 amends prior guidance
to change how a company determines when an entity that is insufficiently
capitalized or is not controlled through voting (or similar rights) should be
consolidated. The determination of whether a company is required to
consolidate an entity is based on, among other things, an entity’s purpose,
design, and a company’s ability to direct the activities of the entity that most
significantly impact the entity’s economic performance. The new
authoritative accounting guidance requires additional disclosures about the
reporting entity’s involvement with variable-interest entities and any
significant changes in risk exposure due to that involvement as well as its
affect on the entity’s financial statements. The new authoritative
accounting guidance under ASC Topic 810 will be effective January 1, 2010.
Management is evaluating the impact of the new guidance on the Company’s
consolidated financial statements.
FASB ASC Topic 820, Fair Value
Measurements and Disclosures. New authoritative accounting
guidance under ASC Topic 820, Fair Value Measurements and
Disclosures, affirms that the objective of fair value when the market for
an asset is not active is the price that would be received to sell the asset in
an orderly transaction, and clarifies and includes additional factors for
determining whether there has been a significant decrease in market activity for
an asset when the market for that asset is not active. ASC Topic 820
requires an entity to base its conclusions about whether a transaction was not
orderly on the weight of the evidence. The new accounting guidance
amended prior guidance to expand certain disclosure requirements. The
new authoritative accounting guidance under ASC Topic 820 was effective for the
Company for the interim period ending June 30, 2009 and did not have a material
impact on the Company’s consolidated financial statements.
Further
new authoritative accounting guidance (Accounting Standards Update No. 2009-5)
under ASC Topic 820 provides guidance for measuring the fair value of a
liability in circumstances in which a quoted price in an active market for the
identical liability is not available. In such instances, a reporting
entity is required to measure fair value utilizing a valuation technique that
uses (i) the quoted price of the identical liability when traded as an asset,
(ii) quoted prices for similar liabilities or similar liabilities when traded as
assets, or (iii) another valuation technique that is consistent with the
existing principles of ASC Topic 820, such as an income approach or market
approach. The new authoritative accounting guidance also clarifies
that when estimating the fair value of a liability, a reporting entity is not
required to include a separate input or adjustment or other inputs relating to
the existence of a restriction that prevents the transfer of the
liability. This new authoritative accounting guidance under ASC Topic
820 was effective for the Company on October 1, 2009 and did not have a material
impact on the Company’s consolidated financial statements.
FASB ASC Topic 825, Financial
Instruments. New authoritative accounting guidance under ASC
Topic 825, Financial
Instruments, requires an entity to provide disclosures about the fair
value of financial instruments in interim financial information and amends prior
guidance to require those disclosures in summarized financial information at
interim reporting periods. The new authoritative accounting
guidance under ASC Topic 825 was effective for the Company for the interim
period ending June 30, 2009 and did not have a material impact on the Company’s
consolidated financial statements.
49
FASB ASC Topic 860, Transfers and
Servicing. New authoritative accounting guidance under ASC
Topic 860, Transfers and
Servicing, amends prior accounting guidance to enhance reporting about
transfers of financial assets, including securitizations, and where companies
have continuing exposure to the risks related to transferred financial
assets. The new authoritative accounting guidance eliminates the
concept of a “qualifying special-purpose entity” and changes the requirements
for derecognizing financial assets. The new authoritative accounting
guidance also requires additional disclosures about all continuing involvements
with transferred financial assets including information about gains and losses
resulting from transfers during the period. The new authoritative
accounting guidance under ASC Topic 860 will be effective January 1, 2010 and is
not expected to have a material impact on the Company’s consolidated financial
statements.
2.
ACQUISITIONS AND DISPOSITIONS
On April
1, 2008, the Company acquired 100% of Miller-Green for cash consideration of
$3.0 million. At acquisition, Miller-Green, based in The Woodlands,
Texas, managed approximately $400 million in assets. The acquisition
was accounted for as a purchase and, accordingly, the financial information of
Miller-Green has been included in the Company’s consolidated financial
statements from April 1, 2008. The consideration exceeded the fair
market value of identifiable net tangible assets by $3.0 million, which has been
recorded as other intangible assets.
On
February 29, 2008, the Company acquired a 50.1% membership interest in Leonetti
for consideration of $5.75 million paid in a combination of cash and shares of
the Company’s common stock. The Company agreed to purchase additional
10% membership interests in March 2013, 2014, and 2015, payable in a combination
of cash and shares of the Company’s common stock. The purchase price
for the additional membership interests will be based on a multiple of the net
income of Leonetti for the previous year. At acquisition, Leonetti,
based in Buffalo Grove, Illinois, managed approximately $400 million in
assets. The acquisition was accounted for as a purchase and,
accordingly, the financial information of Leonetti has been included in the
Company’s consolidated financial statements from February 29,
2008. The consideration exceeded the fair market value of
identifiable net tangible assets by $6.1 million, $2.0 million of which has been
recorded as goodwill and $4.1 million of which has been recorded as other
intangible assets.
On
September 14, 2007, the Company acquired a 50.1% interest in Dickenson, an
insurance agency with four registered agents based in Solon,
Ohio. The acquisition was accounted for as a purchase and,
accordingly, the financial information of Dickenson has been included in the
Company’s consolidated financial statements from September 14,
2007. The consideration of $6.0 million, consisting of a combination
of cash and shares of the Company’s common stock, exceeded the fair market value
of identifiable net tangible assets by $6.0 million, $4.6 million of which has
been recorded as goodwill and $1.4 million of which has been recorded as other
intangible assets.
On May
24, 2007, the Company acquired a 75% interest in Rikoon for cash consideration
of $6.0 million of which $1.3 million was recorded as compensation
expense. The Company agreed to purchase an additional 5% interest in
February 2011 for cash consideration ranging from a minimum of $3.0 million to a
maximum of $5.0 million based on the amount by which Rikoon’s average earnings
before interest, taxes, depreciation, and amortization (“EBITDA”) varies from
the threshold EBITDA specified in the purchase agreement. At
acquisition, Rikoon, based in Santa Fe, New Mexico, managed approximately $400
million in assets. The acquisition was accounted for as a purchase
and, accordingly, the financial information of Rikoon has been included in the
Company’s consolidated financial statements from May 24, 2007. The
consideration exceeded the fair market value of identifiable net tangible assets
by $4.4 million, which has been recorded as other intangible
assets.
On May
10, 2005, the Company acquired a 51% interest in Edelman, one of the leading
financial planning firms in the country. Edelman, based in Fairfax,
Virginia, manages approximately $4.5 billion in assets. On May 12,
2008, the Company purchased an additional 25% membership interest in
Edelman. The Company paid an amount determined based upon Edelman’s
2007 pretax income (the “Second Tranche Consideration”). The Second
Tranche Consideration of $44.4 million, which was paid in a combination of cash
and the Company’s common stock, has been recorded as goodwill.
50
In
December 2006, Ric Edelman organized a new entity, EFA, to expand the Edelman
financial platform into additional markets outside the Washington, D.C.
metropolitan area. In exchange for a 10% membership interest in EFA,
we initially committed to loan EFA up to $20.0 million to cover its start-up
expenses of which $10.0 million was advanced and subsequently
repaid. On April 1, 2009, the Company acquired an additional 66%
membership interest in EFA for aggregate consideration of $25.5 million in cash
and a subordinated promissory note in the principal amount of $10.0
million. Under the terms of the EFA acquisition agreement, the
earlier loan agreement was terminated. The fair value of the
Company’s previously-held noncontrolling interest in EFA on April 1, 2009 was
$3.0 million. The consideration exceeded the fair market value of
identifiable net tangible assets by $36.3 million, $24.2 million of which has
been recorded as goodwill, $22.3 million of which has been recorded as other
intangible assets, $7.2 million of which has been recorded as noncontrolling
interest, and $3.0 million of which has been recorded as a gain on step
acquisition. All of the goodwill associated with the EFA acquisition
is expected to be deductible for tax purposes. On August 24, 2009,
EFA was merged with and into another Edelman subsidiary, Edelman Financial
Services, LLC (“EFS”). From the acquisition date to the date of the
merger with EFS, the Company recorded $3.4 million of revenue and a pretax loss
of $841,000 associated with EFA which is included in the accompanying
Consolidated Statements of Operations.
The EFA
acquisition was accounted for using the acquisition method and, accordingly, the
financial information of EFA has been included in the Company’s Consolidated
Financial Statements from April 1, 2009. The pro forma combined
historical results as if the EFA acquisition had been included in operations
commencing January 1, 2007 are as follows (unaudited):
|
Year Ended December 31,
|
||||||||||||
|
2009
|
2008
|
2007
|
||||||||||
|
(in
thousands, except per share amounts)
|
||||||||||||
|
Total
revenue
|
$ | 176,901 | $ | 174,217 | $ | 155,271 | ||||||
|
Net
income (loss) attributable to
|
||||||||||||
|
Sanders
Morris Harris Group Inc.
|
(6,303 | ) | (31,547 | ) | 1,765 | |||||||
|
Earnings
(loss) per common share:
|
||||||||||||
|
Basic
|
$ | (0.22 | ) | $ | (1.17 | ) | $ | 0.07 | ||||
|
Diluted
|
$ | (0.22 | ) | $ | (1.17 | ) | $ | 0.07 | ||||
In
January 2009, the Company and SMH entered into a Contribution Agreement with Pan
Asia China Commerce Corp. (“PAC3”), Madison Williams, and Madison Williams and
Company, LLC (“New BD”), pursuant to which (a) PAC3 agreed to subscribe for
and purchase a 40% Class A membership interest in Madison Williams in
exchange for a cash payment and note and (b) SMH agreed to contribute to
New BD the Capital Markets Business, including a specified amount of working
capital (as adjusted for any profits or losses incurred in the Capital Markets
Business between January 1, 2009, and the date of closing) less
(i) the value of the accounts receivable contributed to Madison Williams,
(ii) the value of the certain assets in SMH’s New Orleans, Louisiana
office, (iii) the value of certain money security deposits and any advance
payments, and (iv) the value of certain securities to be mutually agreed
upon by the parties in exchange for a 20% Class A membership interest in
Madison Williams, cash, and a note issued by Madison Williams to SMH. Current
members of management of the Capital Markets Business will retain the remaining
40% membership interest in Madison Williams.
On
November 9, 2009, the Company, SMH, PAC3, and Madison Williams entered into an
Amended and Restated Contribution Agreement with Fletcher Asset Management, Inc.
(“Fletcher”), with respect to the formation of the New BD. Pursuant to the
Amended and Restated Contribution Agreement, (a) PAC3’s membership interest in
Madison Williams was reduced to a 3.1% Class A membership interest and 28.0%
Class B membership interest, (b) SMH’s interest in Madison Williams was reduced
to a 17.5% Class A membership interest, (c) Fletcher agreed to subscribe for and
purchase a 40.5% Class A membership interest in Madison Williams in exchange for
a cash contribution, and (d) the interest of management of Madison Williams was
reduced to a 6.5% Class B membership interest. SMH’s membership
interest is subject to call for $4.0 million through December 31,
2010. The Class A membership interests have a distribution preference
over the Class B membership interests until a total of $8.5 million of
distributions to the Class A membership interests have been made, and no
distributions may be made to any class of Class B membership interests until the
SMH note for $8.0 million has been repaid. This transaction closed on
December 9, 2009. The Company recognized a gain of $8.3 million from
the sale of the Capital Markets Business which is included in “Income (loss)
from discontinued operations, net of income taxes” in the Consolidated
Statements of Operations. The Company expects to receive its share of
profits if and when distributions are made by Madison Williams.
51
3. ALLOWANCE
FOR DOUBTFUL ACCOUNTS
The
following table sets forth pertinent information regarding the allowance for
doubtful accounts (in thousands):
|
Balance
at January 1, 2007
|
$ | 227 | ||
|
Additions
charged to cost and expenses
|
5,308 | |||
|
Charge
off of receivables
|
(3,205 | ) | ||
|
Balance
at December 31, 2007
|
2,330 | |||
|
Additions
charged to cost and expenses
|
1,180 | |||
|
Charge
off of receivables
|
(2,040 | ) | ||
|
Balance
at December 31, 2008
|
1,470 | |||
|
Additions
charged to cost and expenses
|
2,642 | |||
|
Charge
off of receivables
|
(1,568 | ) | ||
|
Balance
at December 31, 2009
|
$ | 2,544 |
4. SECURITIES
OWNED AND SECURITIES SOLD, NOT YET PURCHASED
Securities
owned and securities sold, not yet purchased at December 31, 2009 and 2008 were
as follows:
|
December 31,
|
||||||||||||||||
|
2009
|
2008
|
|||||||||||||||
|
Sold,
Not Yet
|
Sold,
Not Yet
|
|||||||||||||||
|
Owned
|
Purchased
|
Owned
|
Purchased
|
|||||||||||||
|
(in
thousands)
|
||||||||||||||||
|
Marketable:
|
||||||||||||||||
|
Corporate
stocks and options
|
$ | 12,695 | $ | 8,339 | $ | 21,877 | $ | 12,803 | ||||||||
|
Corporate
bond
|
3,861 | - | - | 81 | ||||||||||||
| 16,556 | 8,339 | 21,877 | 12,884 | |||||||||||||
|
Not
readily marketable:
|
||||||||||||||||
|
Limited
partnerships
|
19,969 | - | 29,356 | - | ||||||||||||
|
Warrants
|
2,429 | - | 2,316 | - | ||||||||||||
|
Equities
and options
|
426 | - | 1,010 | - | ||||||||||||
| 22,824 | - | 32,682 | - | |||||||||||||
| $ | 39,380 | $ | 8,339 | $ | 54,559 | $ | 12,884 | |||||||||
Securities
not readily marketable include investment securities (a) for which there is no
market on a securities exchange or no independent publicly quoted market, (b)
that cannot be publicly offered or sold unless registration has been effected
under the Securities Act of 1933 or other applicable securities acts, or (c)
that cannot be offered or sold because of other arrangements, restrictions, or
conditions applicable to the securities or to the company. Not
readily marketable securities consist of investments in limited partnerships,
equities, options, and warrants. In accordance with FASB ASC Topic 323, Investments – Equity Method and
Joint Ventures, direct investments in limited partnerships are accounted
for using the equity method which approximates fair
value. Proprietary investments in limited partnerships held by the
Company’s broker-dealer subsidiary are accounted for at fair
value.
52
Investments
in limited partnerships are accounted for at fair value, and principally consist
of ownership in the following private investment
partnerships: Corporate Opportunities Fund, L.P., Corporate
Opportunities Fund (Institutional), L.P., Sanders Opportunity Fund, L.P.,
Sanders Opportunity Fund (Institutional), L.P., Life Sciences Opportunity Fund,
L.P., Life Sciences Opportunity Fund (Institutional), L.P., Life Sciences
Opportunity Fund II, L.P., Life Sciences Opportunity Fund (Institutional) II,
L.P., 2003 Houston Energy Partners, L.P., 2005 Houston Energy Partners, L.P.,
Select Sports Group, Ltd., SMH Private Equity Group I, L.P., SMH Private Equity
Group II, L.P., and SMH NuPhysicia, LLC. The Company expects to
receive its interests in the limited partnerships over the remaining one to ten
year life of the limited partnerships. A summary of the results of
operations and partners’ capital of the limited partnerships is as follows as of
and for the years ended December 31, 2009, 2008, and 2007
(unaudited):
|
Year Ended December 31,
|
||||||||||||
|
2009
|
2008
|
2007
|
||||||||||
|
(in
thousands)
|
||||||||||||
|
Net
investment income (loss)
|
$ | (684 | ) | $ | 32,107 | $ | 30,751 | |||||
|
Unrealized
gain (loss) on investments
|
43,036 | (46,949 | ) | (6,803 | ) | |||||||
|
Realized
gain (loss) on investments
|
(7,892 | ) | (4,706 | ) | 28,308 | |||||||
|
Increase
(decrease) in partners' capital resulting from operations
|
$ | 34,460 | $ | (19,548 | ) | $ | 52,256 | |||||
|
Total
assets
|
$ | 259,400 | $ | 286,121 | $ | 612,868 | ||||||
|
Total
liabilities
|
(5,171 | ) | (115,014 | ) | (60,764 | ) | ||||||
|
Partners'
capital
|
$ | 254,229 | $ | 171,107 | $ | 552,104 | ||||||
FASB ASC
Topic 820, Fair Value
Measurements and Disclosures, establishes a fair value hierarchy that
prioritizes the inputs to valuation techniques used to measure fair
value. The hierarchy gives the highest priority to unadjusted quoted
prices in active markets for identical assets or liabilities (level 1
measurements) and the lowest priority to unobservable inputs (level 3
measurements). The three levels of the fair value hierarchy are as
follows:
|
Level 1
|
Unadjusted
quoted prices in active markets that are accessible at the measurement
date for identical, unrestricted assets or
liabilities;
|
|
Level 2
|
Quoted
prices in markets that are not considered to be active or financial
instruments for which all significant inputs are observable, either
directly or indirectly;
|
|
Level 3
|
Prices
or valuations that require inputs that are both significant to the fair
value measurement and
unobservable.
|
A
description of the valuation methodologies used for securities measured at fair
value, as well as the general classification of such securities pursuant to the
valuation hierarchy, is set forth below.
In
general, fair value is based upon quoted market prices, where
available. If such quoted market prices are not available, fair value
is based upon industry-standard pricing methodologies, models, or other
valuation methodologies that primarily use, as inputs, observable market-based
parameters. Valuation adjustments may be made to ensure that
securities are recorded at fair value. The Company’s valuation
methodologies may produce a fair value calculation that may not be indicative of
net realizable value or reflective of future fair values.
Level 1
consists of unrestricted publicly traded equity securities traded on an active
market whose values are based on quoted market prices.
Level 2
includes securities that are valued using industry-standard pricing
methodologies, models, or other valuation methodologies. Level 2
inputs are other than quoted market prices that are observable for the asset,
either directly or indirectly. Level 2 inputs include quoted prices
for similar assets or liabilities in active markets; quoted prices for identical
or similar assets or liabilities in markets that are not active; inputs other
than quoted market prices that are observable for the asset, such as interest
rates and yield curves observable at commonly quoted intervals, volatilities,
credit risks, prepayment speeds, loss severities, and default rates; and inputs
that are derived principally from observable market data by correlation or other
means. Securities in this category include restricted publicly traded
equity securities, publicly traded equity securities traded on an inactive
market, publicly traded debt securities, warrants whose underlying stock is
publicly traded on an active market, and options that are not publicly traded or
whose pricing is uncertain.
53
Level 3
includes securities whose fair value is estimated based on industry-standard
pricing methodologies and internally developed models utilizing significant
inputs not based on, nor corroborated by, readily available market
information. This category primarily consists of investments in
limited partnerships and equity securities that are not publicly
traded.
A
financial instrument’s level within the fair value hierarchy is based on the
lowest level of any input that is significant to the fair value
measurement.
The
following table sets forth by level within the fair value hierarchy securities
owned and securities sold, not yet purchased as of December 31,
2009:
|
Level 1
|
Level 2
|
Level 3
|
Total
|
|||||||||||||
|
(in
thousands)
|
||||||||||||||||
|
Securities
owned
|
$ | 12,049 | $ | 6,930 | $ | 13,684 | $ | 32,663 | ||||||||
|
Securities
sold, not yet purchased
|
8,228 | 111 | - | 8,339 | ||||||||||||
The
following table sets forth a summary of changes in the fair value of the
Company’s level 3 securities owned for the year ended December 31,
2009:
|
Limited
|
Equities
and
|
|||||||||||||||
|
Partnerships
|
Warrants
|
Options
|
Total
|
|||||||||||||
|
(in
thousands)
|
||||||||||||||||
|
Balance,
beginning of year
|
$ | 12,729 | $ | 10 | $ | 684 | $ | 13,423 | ||||||||
|
Realized
gains
|
20 | - | - | 20 | ||||||||||||
|
Unrealized
gains (losses) relating to securities still held at the reporting
date
|
444 | (5 | ) | (258 | ) | 181 | ||||||||||
|
Purchases,
issuances, and settlements
|
60 | - | - | 60 | ||||||||||||
|
Balance,
end of year
|
$ | 13,253 | $ | 5 | $ | 426 | $ | 13,684 | ||||||||
Net
unrealized gains (losses) for level 3 securities owned are a component of
“Principal transactions” and “Equity in income (loss) of limited partnerships”
in the Consolidated Statements of Operations as follows:
|
Year
Ended
|
||||||||
|
December 31, 2009
|
||||||||
|
Equity
in Income
|
||||||||
|
Principal
|
(Loss)
of Limited
|
|||||||
|
Transactions
|
Partnerships
|
|||||||
|
(in
thousands)
|
||||||||
|
Unrealized
gains (losses) relating to securities still held at the reporting
date
|
$ | (100 | ) | $ | 281 | |||
At
December 31, 2009, the Company had $5.5 million and $1.2 million in securities
owned that are valued using the equity method and at cost,
respectively.
54
5. RECEIVABLES
Receivables
at December 31, 2009 and 2008 were as follows:
|
December
31,
|
||||||||
|
2009
|
2008
|
|||||||
|
(in
thousands)
|
||||||||
|
Notes
Receivable:
|
||||||||
|
Nonaffiliates
|
$ | 6,127 | $ | 9,002 | ||||
|
Employees
and executives
|
2,670 | 3,269 | ||||||
|
Other
affiliates
|
8,556 | 38 | ||||||
|
Receivables
from affiliated limited partnerships
|
337 | 471 | ||||||
|
Receivables
from other affiliates
|
2,946 | 4,636 | ||||||
|
Receivable
from Endowment Advisers
|
65,398 | 70,259 | ||||||
|
Receivables
from broker-dealers
|
1,112 | 254 | ||||||
|
Receivables
from customers
|
22,569 | 16,344 | ||||||
|
Current
tax receivable
|
5,901 | 12,059 | ||||||
|
Allowances
for bad debts
|
(2,544 | ) | (1,470 | ) | ||||
|
Receivables,
net
|
$ | 113,072 | $ | 114,862 | ||||
In August
2008, we entered into agreements with Salient Partners and Endowment Advisers to
repurchase the Company’s interests in such entities for a total of $95.3
million. The terms of the agreements provide that Endowment Advisers
will pay the Company annually the greater of $12.0 million in priority to other
distributions, or 23.15% of total distributions, until the Company has received
a total of $86.0 million plus 6% per annum. The Company received an
additional $9.3 million note for its 50% interest in Salient Partners, payable
with interest over a five-year period. In May 2009, the principal
amount of the Salient note was reduced by $2.25 million to reflect an offset of
certain liabilities that the Company agreed to pay under the
agreements. In connection with such transactions, the Company
recorded receivables in the amount of $76.7 million representing the net present
value of the expected receipts using a weighted average imputed interest rate of
11.8%. The Salient note is included in “Notes receivable:
Nonaffiliates” in the above table.
6. DEPOSITS
WITH CLEARING ORGANIZATIONS
Under its
clearing agreements, SMH is required to maintain a certain level of cash or
securities on deposit with clearing organizations. Should the
clearing organizations suffer a loss due to the failure of a customer of the
Company to complete a transaction, the Company is required to indemnify the
clearing organizations. The Company had $2.5 million and $1.1 million
on deposit as of December 31, 2009 and 2008, respectively, with clearing
organizations to meet this requirement.
7. FURNITURE,
EQUIPMENT, AND LEASEHOLD IMPROVEMENTS
Furniture,
equipment, and leasehold improvements at December 31, 2009 and 2008 were as
follows:
|
December 31,
|
||||||||
|
2009
|
2008
|
|||||||
|
(in
thousands)
|
||||||||
|
Furniture
and fixtures
|
$ | 4,627 | $ | 5,209 | ||||
|
Equipment
|
10,514 | 9,539 | ||||||
|
Leasehold
improvements
|
15,785 | 17,277 | ||||||
|
Accumulated
depreciation and amortization
|
(16,309 | ) | (13,166 | ) | ||||
|
Furniture, equipment,
and leasehold improvements, net
|
$ | 14,617 | $ | 18,859 | ||||
55
8. BORROWINGS
In May
2009, the Company borrowed $25.0 million under a credit agreement with a bank,
the proceeds of which were used to complete the EFA acquisition. The
credit agreement matures on October 31, 2012 and bears interest at the greater
of the prime rate or 5%. Principal of $595,000 plus interest is
payable monthly. The credit agreement is secured by substantially all
of the assets of the Company. The credit agreement contains various
covenants customary for transactions of this type including the requirement that
the Company maintain minimum financial ratios, net worth, liquid assets, and
cash balances, as well as minimum assets under management, and meet monthly,
quarterly, and annual reporting requirements. The credit agreement
also contains covenants that restrict the ability of the Company, among other
things, to incur indebtedness, pay dividends or distributions, make capital
expenditures and other restricted payments, including investments, and
consummate asset sales. At December 31, 2009, the Company was in
compliance with all covenants.
The
following table shows future maturities related to this credit agreement (in
thousands):
|
2010
|
$ | 7,143 | ||
|
2011
|
7,143 | |||
|
2012
|
5,952 |
9. ACCOUNTS
PAYABLE AND ACCRUED LIABILITIES
Accounts
payable and accrued liabilities at December 31, 2009 and 2008 were as
follows:
|
December 31,
|
||||||||
|
2009
|
2008
|
|||||||
|
(in
thousands)
|
||||||||
|
Accounts
payable
|
$ | 7,661 | $ | 4,898 | ||||
|
Compensation
|
17,841 | 19,221 | ||||||
|
Other
|
9,855 | 12,525 | ||||||
|
Total
accounts payable and accrued liabilities
|
$ | 35,357 | $ | 36,644 | ||||
In
conjunction with the sale of the Company’s interests in Salient Partners and
Endowment Advisers, the Company recorded a payable in the amount of $4.1 million
representing the net present value of future incentive compensation
payments. The payable for these incentive compensation payments will
be satisfied through deductions in payments received in connection with the sale
of our interest in Endowment Advisers. This payable is included in
“Other” in the above table. The balance of this payable was $2.0 million at
December 31, 2009.
10. INCOME
TAXES
The
components of the income tax provision (benefit) for the years ended December
31, 2009, 2008, and 2007 were as follows:
|
Year Ended December 31,
|
||||||||||||
|
2009
|
2008
|
2007
|
||||||||||
|
(in
thousands)
|
||||||||||||
|
From
continuing operations:
|
||||||||||||
|
Current
|
$ | (2,249 | ) | $ | (3,246 | ) | $ | 5,533 | ||||
|
Deferred
|
(122 | ) | 14,945 | (2,950 | ) | |||||||
|
Income
tax provision from continuing operations
|
(2,371 | ) | 11,699 | 2,583 | ||||||||
|
From
discontinued operations
|
(289 | ) | (3,007 | ) | 440 | |||||||
|
Income
tax provision (benefit)
|
$ | (2,660 | ) | $ | 8,692 | $ | 3,023 | |||||
56
The
difference between the effective tax rate reflected in the income tax provision
from continuing operations and the statutory federal rate is analyzed as
follows:
|
Year Ended December 31,
|
||||||||||||
|
2009
|
2008
|
2007
|
||||||||||
|
(in
thousands)
|
||||||||||||
|
Expected
federal tax at statutory rate of 34%
|
$ | (2,576 | ) | $ | (2,931 | ) | $ | 2,440 | ||||
|
Goodwill
impairment
|
285 | 13,175 | - | |||||||||
|
State
income taxes
|
(455 | ) | (517 | ) | 431 | |||||||
|
Other
|
375 | 1,972 | (288 | ) | ||||||||
|
Total
|
$ | (2,371 | ) | $ | 11,699 | $ | 2,583 | |||||
The
effective tax rates from continuing operations for the years ended December 31,
2009, 2008, and 2007 were 31.3%, (135.7)%, and 36.0%, respectively.
The
components of the deferred income tax assets and liabilities were as
follows:
|
December 31,
|
||||||||
|
2009
|
2008
|
|||||||
|
(in
thousands)
|
||||||||
|
Deferred
income tax assets:
|
||||||||
|
Unrealized
loss on securities owned
|
$ | - | $ | 733 | ||||
|
Capital
loss carryforward
|
2,319 | - | ||||||
|
Charitable
contributions
|
25 | - | ||||||
|
Accumulated
depreciation
|
- | 294 | ||||||
|
Accrued
liabilities
|
16 | 16 | ||||||
|
Allowance
for doubtful accounts
|
965 | 558 | ||||||
|
Deferred
compensation
|
350 | 350 | ||||||
|
Restricted
stock compensation
|
708 | 1,208 | ||||||
|
Stock
option compensation
|
255 | 247 | ||||||
|
Goodwill
and other intangible assets amortization/impairment
|
8,545 | 5,158 | ||||||
|
Total
deferred tax assets
|
13,183 | 8,564 | ||||||
|
Deferred
income tax liabilities:
|
||||||||
|
Unrealized
gain on securities owned
|
(1,154 | ) | - | |||||
|
Accumulated
depreciation
|
(132 | ) | - | |||||
|
Unrealized
gains on securities available for sale
|
(101 | ) | (101 | ) | ||||
|
Prepaid
expenses
|
(134 | ) | (136 | ) | ||||
|
Imputed
interest expense
|
(186 | ) | (186 | ) | ||||
|
State
franchise tax
|
(319 | ) | - | |||||
|
Section
141R step up
|
(1,139 | ) | - | |||||
|
Gain
on sale of business
|
(25,473 | ) | (22,673 | ) | ||||
|
Total
deferred tax liabilities
|
(28,638 | ) | (23,096 | ) | ||||
|
Net
deferred tax liability
|
$ | (15,455 | ) | $ | (14,532 | ) | ||
In
assessing the realizability of deferred tax assets, management considers whether
it is more likely than not that some portion or all of the deferred tax assets
will not be realized. The ultimate realization of deferred tax assets
is dependent upon the generation of future taxable income during the periods in
which those temporary differences become deductible. Management
considers the scheduled reversal of deferred tax liabilities, projected future
taxable income, and tax planning strategies in making this
assessment. Based upon the level of historical taxable income and
projections for future taxable income over the periods which the deferred tax
assets are deductible, management believes it is more likely than not that the
Company will realize the benefits of these deductible differences.
The
current tax receivable at December 31, 2009 and 2008 was $5.9 million and $12.1
million, respectively.
The
Company files income tax returns in the U.S. federal
jurisdiction. The Company is no longer subject to U.S. federal income
tax examination by the taxing authorities for years before 2006. The
Company files in several state tax jurisdictions. The Company is no
longer subject to state income tax examination by the taxing authorities with
limited exceptions for years before 2006.
57
11. ACCOUNTING
FOR STOCK-BASED COMPENSATION PLANS
Substantially
all employees are eligible to participate in the Sanders Morris Harris Group
Inc. 401(k) defined contribution plan. The Company made no
contributions to this plan in 2009, 2008, and 2007.
The
Company has two types of stock-based compensation awards: (1) stock
options, and (2) restricted common stock.
The
Company’s 1998 Incentive Plan specifies that the number of shares of its common
stock available for incentive awards or incentive stock options may not exceed
the greater of 4,000,000 shares or 25% of the total number of shares of common
stock outstanding.
Stock
Options
The 1998
Incentive Plan provides for the issuance to eligible employees of, among other
things, incentive and non-qualified stock options that may expire up to 10 years
from the date of grant. The outstanding options vest over one
to five year service periods and have an exercise price equal to the closing
price of the Company’s stock on the date of the grant. Unvested
options on the date of termination of employment are forfeited within 90 days of
termination. Typically, new shares are issued upon the exercise of
stock options.
During
the years ended December 31, 2009, 2008, and 2007, 42,500, 246,078, and 55,200
options were exercised for which the Company received proceeds of $195,000, $1.2
million, and $257,000, respectively, and the tax benefit realized from stock
option exercises was $17,000, $373,000, and $119,000,
respectively. The Company recognized pretax compensation cost of
$21,000, or $13,000 net of tax, for the year ended December 31, 2009; $166,000,
or $100,000 net of tax, for the year ended December 31, 2008; and $144,000, or
$88,000 net of tax, for the year ended December 31, 2007. There was
no unrecognized stock-based compensation expense related to stock options at
December 31, 2009.
The
following table sets forth information regarding the Company’s stock options for
each of the three years in the period ended December 31, 2009:
|
Weighted
|
||||||||||||||||
|
Weighted
|
Average
|
Aggregate
|
||||||||||||||
|
Number
|
Average
|
Remaining
|
Intrinsic
|
|||||||||||||
|
of Shares
|
Exercise Price
|
Life
|
Value
|
|||||||||||||
|
(in
years)
|
(in
thousands)
|
|||||||||||||||
|
Outstanding
at January 1, 2007
|
911,585 | $ | 8.08 | |||||||||||||
|
Exercised
|
(55,200 | ) | 4.66 | $ | 340 | |||||||||||
|
Oustanding
at December 31, 2007
|
856,385 | 8.30 | ||||||||||||||
|
Granted
|
50,000 | 8.17 | ||||||||||||||
|
Exercised
|
(246,078 | ) | 4.89 | 1,085 | ||||||||||||
|
Oustanding
at December 31, 2008
|
660,307 | 9.56 | ||||||||||||||
|
Exercised
|
(42,500 | ) | 4.59 | 49 | ||||||||||||
|
Cancelled/Forfeited
|
(16,666 | ) | 8.17 | |||||||||||||
|
Oustanding
at December 31, 2009
|
601,141 | 9.95 | 3.63 | – | ||||||||||||
|
Options
exercisable at December 31, 2009
|
601,141 | 9.95 | 3.63 | – | ||||||||||||
|
Options
available for grant at December 31, 2009
|
2,797,240 | |||||||||||||||
58
The
following table summarizes information related to stock options outstanding and
exercisable at December 31, 2009:
|
Options Outstanding
|
Options Exercisable
|
|||||||||||||||||||
|
Number
|
Wgtd.
Avg.
|
Number
|
||||||||||||||||||
|
Range
of
|
Outstanding
at
|
Remaining
|
Wgtd.
Avg.
|
Exercisable
at
|
Wgtd.
Avg.
|
|||||||||||||||
|
Exercise Prices
|
12/31/2009
|
Contr. Life
|
Exercise Price
|
12/31/2009
|
Exercise Price
|
|||||||||||||||
|
(in
years)
|
||||||||||||||||||||
| $4.44-$6.04 | 237,807 | 0.67 | $ | 4.86 | 237,807 | $ | 4.86 | |||||||||||||
| $7.91-$9.15 | 58,334 | 6.12 | 8.16 | 58,334 | 8.16 | |||||||||||||||
| $12.02-$17.20 | 305,000 | 5.46 | 14.27 | 305,000 | 14.27 | |||||||||||||||
| $4.44-$17.20 | 601,141 | 3.63 | 9.95 | 601,141 | 9.95 | |||||||||||||||
The fair
value of options at date of grant was estimated using the Black-Scholes option
pricing model. There were no stock options granted during 2009 and
2007. During 2008, stock options were granted with the following
weighted-average assumptions:
|
2008
|
||||
|
Expected
life in years
|
10.00 | |||
|
Interest
rate
|
3.17 | % | ||
|
Volatility
|
28.33 | % | ||
|
Dividend
yield
|
2.20 | % | ||
|
Weighted
average fair value of options granted during the
period
|
$ | 2.47 | ||
Restricted
Stock
The 1998
Incentive Plan permits the Company to grant restricted common stock to its
employees. Additionally, eligible employees and consultants are
allowed to purchase, in lieu of salary, commission, or bonus, shares of the
Company’s restricted common stock at a price equal to 66.66% of the 20-day
average of the closing sales price of the Company’s common stock, ending on the
day prior to the date the shares are issued. All shares are valued at
the closing price on the date the shares are issued. The value of
restricted shares granted, less consideration paid, if any, is amortized to
compensation expense over a one to five year vesting period.
Employees
deferred compensation of $40,000, $151,000, and $225,000 during the years ended
December 31, 2009, 2008, and 2007, respectively, that was used to purchase
restricted common stock. The Company recognized pretax compensation
expense of $3.7 million, $2.7 million, and $2.3 million, or $2.2 million, $1.6
million, and $1.4 million net of tax, during the years ended December 31, 2009,
2008, and 2007, respectively, related to its restricted common stock
plan.
59
The
following table summarizes certain information related to restricted common
stock grants at December 31, 2009:
|
Number
of
|
Weighted
Average
|
|||||||
|
Shares
|
Grant Date Fair Value
|
|||||||
|
Nonvested
at January 1, 2009
|
683,116 | $ | 11.06 | |||||
|
Nonvested
at December 31, 2009
|
490,076 | 8.17 | ||||||
|
For
the year ended December 31, 2009:
|
||||||||
|
Granted
|
322,680 | 4.72 | ||||||
|
Vested
|
494,200 | 9.91 | ||||||
|
Forfeited
|
21,520 | 8.27 | ||||||
At
December 31, 2009, total unrecognized compensation cost, net of estimated
forfeitures, related to nonvested restricted stock totaled $2.4 million and is
expected to be recognized over the next 3.0 years. The fair value of
restricted stock vested during the years ended December 31, 2009, 2008, and 2007
was $2.4 million, $1.5 million, and $2.2 million, respectively.
12. PREFERRED
STOCK
The
Company is authorized to issue 10,000,000 shares of preferred stock, par value
$0.10 per share. Shares of preferred stock may be issued from time to time by
the board of directors, without action by the shareholders, in one or more
series with such designations, preferences, special rights, qualifications,
limitations, and restrictions as may be designated by the board of directors
prior to the issuance of such series. No shares of preferred stock
have been issued as of December 31, 2009.
13. TREASURY
STOCK
On
November 6, 2007, the Company’s board of directors approved a program to
repurchase up to 1,000,000 shares of the Company’s common
stock. Under the program, shares are repurchased in the open market
or privately negotiated transactions from time to time at prevailing market
prices. Such repurchases are accounted for using the cost
method. The Company repurchased 6,809, 119,800, and 189,874 shares of
its common stock at an average price of $4.16, $9.70, and $9.37 per share during
the years ended December 31, 2009, 2008, and 2007, respectively, related to this
program. During 2009, the Company issued 262,180 treasury shares at
an aggregate cost of $1.6 million in connection with the acquisition of EFA and
793,714 treasury shares at an aggregate cost of $4.8 million in connection with
the sale of stock and warrants to Fletcher International, Ltd.
60
14. EARNINGS
(LOSS) PER COMMON SHARE
Basic and
diluted earnings (loss) per common share computations were as
follows:
|
Year Ended December 31,
|
||||||||||||
|
2009
|
2008
|
2007
|
||||||||||
|
(in
thousands, except per share amounts)
|
||||||||||||
|
Income
(loss) from continuing operations
|
$ | (5,205 | ) | $ | (20,319 | ) | $ | 4,594 | ||||
|
Income
(loss) from discontinued operations, net of tax
|
(277 | ) | (4,974 | ) | 499 | |||||||
|
Net
income (loss) attributable to the Company
|
$ | (5,482 | ) | $ | (25,293 | ) | $ | 5,093 | ||||
|
Basic
earnings (loss) per common share:
|
||||||||||||
|
Continuing
operations
|
$ | (0.18 | ) | $ | (0.75 | ) | $ | 0.19 | ||||
|
Discontinued
operations
|
(0.01 | ) | (0.19 | ) | 0.02 | |||||||
|
Net
earnings (loss)
|
$ | (0.19 | ) | $ | (0.94 | ) | $ | 0.21 | ||||
|
Diluted
earnings (loss) per common share:
|
||||||||||||
|
Continuing
operations
|
$ | (0.18 | ) | $ | (0.75 | ) | $ | 0.18 | ||||
|
Discontinued
operations
|
(0.01 | ) | (0.19 | ) | 0.02 | |||||||
|
Net
earnings (loss)
|
$ | (0.19 | ) | $ | (0.94 | ) | $ | 0.20 | ||||
|
Weighted
average number of common shares outstanding:
|
||||||||||||
|
Basic
|
28,402 | 26,972 | 24,777 | |||||||||
|
Incremental
common shares issuable under stock option plan, net
|
- | - | 309 | |||||||||
|
Diluted
|
28,402 | 26,972 | 25,086 | |||||||||
Outstanding
stock options of 601,000, 511,000, and 305,000 at December 31, 2009, 2008, and
2007, respectively, have not been included in diluted earnings (loss) per common
share because to do so would have been antidilutive for the years
presented. Warrants outstanding at December 31, 2009 to purchase
shares of common stock in an aggregate value of up to $7.5 million at an
exercise price of $5.75 per common share have also not been included in diluted
earnings (loss) per common share because to do so would have been antidilutive
for the year. There were no warrants outstanding at December 31, 2008
or 2007.
61
15. GOODWILL
AND OTHER INTANGIBLE ASSETS
Changes
in the carrying amount of the Company’s goodwill and other intangible assets for
the years ended December 31, 2009 and 2008 were as follows:
|
Year
Ended December 31, 2009
|
||||||||||||||||||||||||
|
Amortizable
Intangible Assets:
|
Total
Other
|
|||||||||||||||||||||||
|
Covenants
Not
|
Customer
|
Intangible
|
||||||||||||||||||||||
|
Goodwill
|
Trade
Names
|
To
Compete
|
Relationships
|
Subtotal
|
Assets
|
|||||||||||||||||||
|
(in
thousands)
|
||||||||||||||||||||||||
|
Balance,
beginning of year
|
$ | 63,078 | $ | 4,526 | $ | 450 | $ | 7,589 | $ | 8,039 | $ | 12,565 | ||||||||||||
|
Acquisition
of EFA
|
24,167 | 15,000 | 4,000 | 3,300 | 7,300 | 22,300 | ||||||||||||||||||
|
Leonetti
purchase price adjustment
|
(319 | ) | - | - | - | - | - | |||||||||||||||||
|
Impairment
charges
|
(13,471 | ) | (1,104 | ) | - | - | - | (1,104 | ) | |||||||||||||||
|
Amortization
of other intangible assets
|
- | - | (767 | ) | (796 | ) | (1,563 | ) | (1,563 | ) | ||||||||||||||
|
Balance,
end of year
|
$ | 73,455 | $ | 18,422 | $ | 3,683 | $ | 10,093 | $ | 13,776 | $ | 32,198 | ||||||||||||
|
Year
Ended December 31, 2008
|
||||||||||||||||||||||||
|
Amortizable
Intangible Assets:
|
Total
Other
|
|||||||||||||||||||||||
|
Covenants
Not
|
Customer
|
Intangible
|
||||||||||||||||||||||
|
Goodwill
|
Trade
Names
|
To
Compete
|
Relationships
|
Subtotal
|
Assets
|
|||||||||||||||||||
|
(in
thousands)
|
||||||||||||||||||||||||
|
Balance,
beginning of year
|
$ | 88,461 | $ | 2,246 | $ | 527 | $ | 3,654 | $ | 4,181 | $ | 6,427 | ||||||||||||
|
Edelman
Second Tranche Consideration
|
44,367 | - | - | - | - | - | ||||||||||||||||||
|
Acquisition
of Miller-Green
|
- | 1,104 | 57 | 1,862 | 1,919 | 3,023 | ||||||||||||||||||
|
Acquisition
of Leonetti
|
2,057 | 1,403 | 64 | 2,652 | 2,716 | 4,119 | ||||||||||||||||||
|
Sale
of Salient and Endowment Advisers
|
(15,336 | ) | - | - | - | - | - | |||||||||||||||||
|
Impairment
charges
|
(56,471 | ) | (227 | ) | - | - | - | (227 | ) | |||||||||||||||
|
Amortization
of other intangible assets
|
- | - | (198 | ) | (579 | ) | (777 | ) | (777 | ) | ||||||||||||||
|
Balance,
end of year
|
$ | 63,078 | $ | 4,526 | $ | 450 | $ | 7,589 | $ | 8,039 | $ | 12,565 | ||||||||||||
All of
the Company’s goodwill and other intangible assets, net, are related to the
Wealth Management business segment.
The
goodwill impairment charges recognized reflect impairment due to market
deterioration experienced in 2008 and during the first quarter of
2009. The amount of the impairment losses was determined based on the
calculation process specified in FASB ASC Topic 350, Intangibles – Goodwill and
Other, which compared carrying value to the estimated fair value of
assets and liabilities. Factors considered in determining fair value
include, among other things, the Company’s market capitalization as determined
by quoted market prices for its common stock and the value of the Company’s
reporting units. The Company uses several methods to value its
reporting units, including discounted cash flows, comparisons with valuations of
public companies in the same industry, and multiples of assets under
management.
Other
intangible assets consist primarily of customer relationships and trade names
acquired in business combinations. Other intangible assets acquired
that have indefinite lives (trade names) are not amortized but are tested for
impairment annually, or if certain circumstances indicate a possible impairment
may exist. Certain other intangible assets acquired (customer
relationships and covenants not to compete) are amortized on a straight line
basis over their estimated useful lives and tested for impairment if certain
circumstances indicate an impairment may exist. Other intangible
assets are tested for impairment by comparing expected future cash flows to the
carrying amount of the intangible assets. The Company recognized
trade name impairments of $1.1 million and $227,000 during the years ended
December 31, 2009 and 2008, respectively.
Goodwill
and other intangible assets, net, are classified as level 3 within the fair
value hierarchy.
As of
December 31, 2009, the remaining weighted-average amortization period is 4.33
years for covenants not to compete and 12.13 years for customer relationships
included in the table above.
62
The
following table shows estimated future amortization expense related to these
intangible assets (in thousands):
|
2010
|
$ | 1,710 | ||
|
2011
|
1,710 | |||
|
2012
|
1,699 | |||
|
2013
|
1,696 | |||
|
2014
|
1,096 | |||
|
Thereafter
|
5,865 |
16. COMMITMENTS
AND CONTINGENCIES
The
Company has issued letters of credit in the amounts of $420,000, $250,000,
$245,000, $230,000, and $96,000 to the owners of five of the offices that we
lease to secure payment of our lease obligations for those
facilities.
The
Company has uncommitted financing arrangements with clearing brokers that
finance our customer accounts, certain broker-dealer balances, and firm trading
positions. Although these customer accounts and broker-dealer
balances are not reflected on the consolidated balance sheet for financial
reporting purposes, the Company has generally agreed to indemnify these clearing
brokers for losses they may sustain in connection with the accounts, and
therefore, retains risk on these accounts. The Company is required to
maintain certain cash or securities on deposit with our clearing
brokers.
In the
normal course of business, the Company may enter into underwriting
commitments. There were no firm underwriting commitments open at
December 31, 2009.
Many
aspects of our business involve substantial risks of liability. In the normal
course of business, we have been and in the future may be named as defendant or
co-defendant in lawsuits and arbitration proceedings involving primarily claims
for damages. We are also involved in a number of regulatory matters arising out
of the conduct of our business. There can be no assurance that these matters
will not have a material adverse effect on our results of operations in any
future period and a significant judgment could have a material adverse impact on
our consolidated financial position, results of operations, and cash flows. In
addition to claims for damages and monetary sanctions that may be made against
us, we incur substantial costs in investigating and defending claims and
regulatory matters.
In July
2008, the Dallas regional office of the Financial Industry Regulatory Authority
(“FINRA”) conducted a routine examination of SMH’s broker-dealer
activities. SMH received an examination report on December 31, 2008,
which identified a number of deficiencies in SMH’s operations. In
April 2009, SMH resolved half of the deficiencies noted through a compliance
conference procedure. The remaining deficiencies are subject to possible
enforcement action by FINRA. SMH has not received a Wells notice from FINRA with
respect to the deficiencies, which is a formal notice from FINRA that it intends
to take enforcement action. SMH is in communication with the FINRA staff to
resolve the matter. However, there is no assurance that a prompt
resolution can be reached or that the ultimate impact on SMH and the Company
will not be material.
In May
2005, SMH acted as placement agent for a private placement of $50.0 million in
convertible preferred stock of Ronco Corporation, a company involved in direct
response marketing. Subsequent to the offering, Ronco experienced financial
difficulties and ultimately filed a voluntary petition under Chapter 11 of the
Bankruptcy Code on June 14, 2007. The bankruptcy court approved the sale
of substantially all of Ronco’s assets in August 2007, and the case was
converted to a liquidation under Chapter 7.
In May
2007, two purchasers of Ronco convertible preferred stock filed a complaint
against SMH alleging common law fraud, statutory fraud in a stock transaction,
violations of the Texas Securities Act, and negligent misrepresentation in
connection with the plaintiffs’ purchase of $2.0 million in Ronco convertible
preferred stock. On March 17, 2009, a third purchaser of Ronco convertible
preferred stock filed a complaint against SMH. The claims are similar to the
above referenced case. The third purchaser invested $1.9 million in Ronco
convertible preferred stock. In addition, in July 2009, the
Bankruptcy Trustee filed a derivative action on behalf of the shareholders of
Ronco against two former directors of Ronco (who were employees of SMH) for
negligently authorizing the closing of the purchase of the assets of Ronco
Marketing Corp. in breach of their fiduciary duties of care and loyalty and
against SMH for negligent misrepresentation, breach of fiduciary duties, breach
of contract, and violation of the Texas Fraudulent Transfer Act. No amount of
damages is alleged. SMH believes it has valid defenses to all claims made by the
plaintiffs. However, there is no assurance that SMH will successfully
defend such claims.
In view
of the inherent difficulty of predicting the outcome of legal proceedings,
particularly where the plaintiffs seek substantial or indeterminate damages or
where novel legal theories or a large number of parties are involved, we cannot
state with confidence what the eventual outcome of currently pending matters
will be, what the timing of the ultimate resolution of these matters will be, or
what the eventual result in each pending matter will be. Based on
currently available information, we have established reserves for certain
litigation matters and our management does not believe that resolution of any
matter will have a material adverse effect on our liquidity or financial
position although, depending on our results for a particular period, an adverse
determination could have a material effect on quarterly or annual operating
results in the period in which it is resolved.
63
Total
rental expense for operating leases was $6.1 million, $5.3 million, and $4.7
million for the years ended December 31, 2009, 2008, and 2007,
respectively. Certain leases contain provisions for renewal options
and escalation clauses based on increases in certain costs incurred by the
lessor. We amortize office lease incentives and rent escalations on a
straight line basis over the life of the respective leases. The
Company and its subsidiaries have obligations under operating leases that expire
by 2018 with initial noncancelable terms in excess of one
year. Future minimum commitments under these operating leases are as
follows (in thousands):
|
2010
|
$ | 10,567 | ||
|
2011
|
10,367 | |||
|
2012
|
9,364 | |||
|
2013
|
7,810 | |||
|
2014
|
4,553 | |||
|
Thereafter
|
11,122 | |||
|
Total
minimum rental payments
|
53,783 | |||
|
Minimum
sublease rentals
|
(6,837 | ) | ||
|
Net
minimum rental payments
|
$ | 46,946 |
17. CONCENTRATIONS
OF RISK
Financial
investments that potentially subject the Company to concentrations of credit
risk primarily consist of securities owned, and all receivables. The
Company’s securities portfolio has a concentration in companies in the energy
and life sciences sectors. Risks and uncertainties associated with
financial investments include credit exposure, interest rate volatility,
regulatory changes, and changes in market values of equity
securities. Future changes in market trends and conditions may occur
that could cause actual results to differ materially from the estimates used in
preparing the accompanying consolidated financial statements.
The
Company executes, as agent, securities transactions on behalf of its
customers. If either the customer or a counterparty fails to perform,
the Company may be required to discharge the obligations of the nonperforming
party. In such circumstances, the Company may sustain a loss if the
market value of the security is different from the contract value of the
transaction. The Company’s customer security transactions are
transacted on either a cash or margin basis. In margin transactions,
the customer is extended credit by the clearing broker, subject to various
regulatory margin requirements, collateralized by cash and securities in the
customer’s account. In connection with these activities, the Company
executes customer transactions with the clearing broker involving the sale of
securities not yet purchased (short sales). In the event the customer
fails to satisfy its obligation, the Company may be required to purchase
financial instruments at prevailing market prices in order to fulfill the
customer’s obligations.
The
Company and its subsidiaries are engaged in various trading and brokerage
activities with counterparties that primarily include broker-dealers, banks, and
other financial institutions. If counterparties do not fulfill their
obligations, the Company may be exposed to risk. The risk of default
depends on the creditworthiness of the counterparty or issuer of the
instrument. It is the Company's policy to review, as necessary, the
credit standing of each counterparty.
The
Company is subject to credit risk to the extent that its deposits with
commercial banks exceed the Federal Deposit Insurance Corporation insurable
limit of $250,000. Management does not consider this risk to be
significant.
18. NET
CAPITAL REQUIREMENTS OF SUBSIDIARY
SMH is
subject to the Securities and Exchange Commission Uniform Net Capital Rule (SEC
rule 15c3-1), which requires the maintenance of minimum net capital and requires
that the ratio of aggregate indebtedness to net capital, both as defined, shall
not exceed 15 to 1 (and the rule of the “applicable” exchange also provides that
equity capital may not be withdrawn or cash dividends paid if the resulting net
capital ratio would exceed 10 to 1). At December 31, 2009, SMH had
net capital, as defined, of $10.8 million, which was $9.8 million in excess of
its required net capital of $1.0 million. At December 31, 2009, SMH
had aggregate indebtedness of $14.8 million. SMH’s aggregate
indebtedness to net capital ratio was 1.37 to 1 at December 31,
2009.
64
19. BUSINESS
SEGMENT INFORMATION
The
Company has two operating segments, Wealth Management and Institutional
Services, and one non-operating segment, Corporate Support and Other. The
business segments are based upon factors such as the services provided and
distribution channels served. Certain services are provided to customers through
more than one of our business segments.
In
December 2009, the Company completed the sale of its Capital Markets Business
which consisted of our investment banking, and most of our New York
institutional trading, sales, and research businesses (excluding The Juda Group
and the Concept Capital division). As a result of this transaction,
management realigned its reportable segments to reflect its remaining operations
and the Capital Markets segment was renamed the Institutional Services
segment. Prior period amounts were reclassified to reflect the new
reportable segments.
The
Wealth Management segment provides investment advisory, wealth and investment
management, and financial planning services to institutional and individual
clients. It earns an advisory fee based on such factors as the amount of assets
under management and the type of services provided. The Wealth Management
segment may also earn commission revenue from the sale of equity, fixed income,
mutual fund, and annuity products; and sales credits from the distribution of
investment banking issues. In addition, performance fees may be earned for
exceeding performance benchmarks for the investment portfolios in the limited
partnerships that we manage. The Wealth Management segment also earns
revenue from net interest on customers’ margin loan and credit account balances
and sales credits from the distribution of investment banking
products.
The
Institutional Services segment generally provides corporate financing services
to its institutional client base. These services are provided through
two divisions: (i) institutional brokerage and (ii) prime brokerage
services.
|
|
·
|
The
Institutional Brokerage division distributes equity and fixed income
products through its distribution network to its institutional clients.
Institutional revenue consists of commissions and principal credits earned
on transactions in customer brokerage accounts, net interest on customers’
margin loan and credit account balances, and sales credits from the
distribution of investment banking
products.
|
|
|
·
|
The
Prime Brokerage Services division provides trade execution, clearing and
custody services mainly through Goldman Sachs, and other back-office
services to hedge funds and other professional traders. Prime broker
revenue consists of commissions and principal credits earned on equity and
fixed income transactions, interest income from securities lending
services to customers, and net interest on customers’ margin loan and
credit account balances.
|
The
Corporate Support and Other segment includes realized and unrealized gains and
losses on the Company’s investment portfolios, and interest and dividends earned
on our cash and securities positions. Unallocated corporate revenue and expenses
are included in Corporate Support and Other. Gains and losses from
sports representation and management services performed by SSG are included in
Corporate Support and Other.
65
The
following summarizes certain financial information of each reportable business
segment for the years ended December 31, 2009, 2008, and 2007. The
Company does not analyze asset information in all business
segments.
|
Year Ended December 31,
|
||||||||||||
|
2009
|
2008
|
2007
|
||||||||||
|
(in
thousands)
|
||||||||||||
|
Revenue:
|
||||||||||||
|
Wealth
Management
|
$ | 100,941 | $ | 101,950 | $ | 103,461 | ||||||
|
Institutional
Services:
|
||||||||||||
|
Institutional
brokerage
|
4,814 | 6,574 | 11,723 | |||||||||
|
Prime
brokerage services
|
60,961 | 61,658 | 36,583 | |||||||||
|
Institutional
Services Total
|
65,775 | 68,232 | 48,306 | |||||||||
|
Corporate
Support and Other
|
8,648 | 1,759 | 3,304 | |||||||||
|
Total
|
$ | 175,364 | $ | 171,941 | $ | 155,071 | ||||||
|
Income
(loss) from continuing operations before equity in income
(loss) of limited partnerships and income taxes:
|
||||||||||||
|
Wealth
Management
|
$ | 26,683 | $ | 35,276 | $ | 33,875 | ||||||
|
Institutional
Services:
|
||||||||||||
|
Institutional
brokerage
|
(638 | ) | (1,823 | ) | 822 | |||||||
|
Prime
brokerage services
|
277 | 2,851 | 2,750 | |||||||||
|
Institutional
Services Total
|
(361 | ) | 1,028 | 3,572 | ||||||||
|
Corporate
Support and Other
|
(30,438 | ) | (76,659 | ) | (18,273 | ) | ||||||
|
Total
|
$ | (4,116 | ) | $ | (40,355 | ) | $ | 19,174 | ||||
|
Equity
in income (loss) of limited partnerships:
|
||||||||||||
|
Wealth
Management
|
$ | (898 | ) | $ | 51,901 | $ | 8,479 | |||||
|
Institutional
Services:
|
||||||||||||
|
Institutional
brokerage
|
- | - | - | |||||||||
|
Prime
brokerage services
|
- | - | - | |||||||||
|
Institutional
Services Total
|
- | - | - | |||||||||
|
Corporate
Support and Other
|
(450 | ) | (13,270 | ) | (4,639 | ) | ||||||
|
Total
|
$ | (1,348 | ) | $ | 38,631 | $ | 3,840 | |||||
|
Gain
on step acquisition:
|
||||||||||||
|
Wealth
Management
|
$ | - | $ | - | $ | - | ||||||
|
Institutional
Services:
|
||||||||||||
|
Institutional
brokerage
|
- | - | - | |||||||||
|
Prime
brokerage services
|
- | - | - | |||||||||
|
Institutional
Services Total
|
- | - | - | |||||||||
|
Corporate
Support and Other
|
3,000 | - | - | |||||||||
|
Total
|
$ | 3,000 | $ | - | $ | - | ||||||
|
Income
(loss) from continuing operations before income
taxes:
|
||||||||||||
|
Wealth
Management
|
$ | 25,785 | $ | 87,177 | $ | 42,354 | ||||||
|
Institutional
Services:
|
||||||||||||
|
Institutional
brokerage
|
(638 | ) | (1,823 | ) | 822 | |||||||
|
Prime
brokerage services
|
277 | 2,851 | 2,750 | |||||||||
|
Institutional
Services Total
|
(361 | ) | 1,028 | 3,572 | ||||||||
|
Corporate
Support and Other
|
(27,888 | ) | (89,929 | ) | (22,912 | ) | ||||||
|
Total
|
$ | (2,464 | ) | $ | (1,724 | ) | $ | 23,014 | ||||
|
Net
income attributable to the noncontrolling interest:
|
||||||||||||
|
Wealth
Management
|
$ | (5,112 | ) | $ | (6,896 | ) | $ | (15,837 | ) | |||
|
Institutional
Services:
|
||||||||||||
|
Institutional
brokerage
|
- | - | - | |||||||||
|
Prime
brokerage services
|
- | - | - | |||||||||
|
Institutional
Services Total
|
- | - | - | |||||||||
|
Corporate
Support and Other
|
- | - | - | |||||||||
|
Total
|
$ | (5,112 | ) | $ | (6,896 | ) | $ | (15,837 | ) | |||
66
20. SUPPLEMENTAL
CASH FLOW INFORMATION
|
Year Ended December 31,
|
||||||||||||
|
2009
|
2008
|
2007
|
||||||||||
|
(in
thousands)
|
||||||||||||
|
Cash
payment (refund) for income taxes, net
|
$ | (8,774 | ) | $ | 2,320 | $ | 5,742 | |||||
|
Cash
paid for interest
|
1,503 | 9 | 23 | |||||||||
|
Non-cash
investing activities:
|
||||||||||||
|
Acquisitions:
|
||||||||||||
|
Receivables
|
- | 10 | - | |||||||||
|
Goodwill
|
1,859 | 24,136 | 2,400 | |||||||||
|
Accounts
payable and accrued liabilities
|
- | (290 | ) | - | ||||||||
|
Noncontrolling
interest
|
- | 77 | - | |||||||||
|
Common
stock
|
(1,859 | ) | (23,933 | ) | (2,400 | ) | ||||||
|
Dispositions:
|
||||||||||||
|
Receivables
|
7,850 | - | - | |||||||||
|
Securities
owned
|
1,200 | - | - | |||||||||
|
Furniture,
equipment, and leasehold improvements, net
|
(2,729 | ) | - | - | ||||||||
|
Other
assets and prepaid expenses
|
(133 | ) | - | - | ||||||||
|
Accounts
payable and accrued liabilities
|
2,440 | - | - | |||||||||
|
Additional
paid-in capital
|
(336 | ) | - | - | ||||||||
|
Sale
of nonmarketable securities:
|
||||||||||||
|
Receivables
|
(1,824 | ) | 76,727 | - | ||||||||
|
Sale
of limited partnerships
|
- | (72,583 | ) | - | ||||||||
|
Accounts
payable and accrued liabilities
|
1,824 | (4,144 | ) | - | ||||||||
|
Non-cash
financing activities:
|
||||||||||||
|
Dividends
declared not yet paid
|
1,345 | 1,267 | 1,121 | |||||||||
21. RELATED
PARTY TRANSACTIONS
The
Company had receivables from related parties totaling $14.5 million and $8.4
million at December 31, 2009 and 2008, respectively, primarily consisting of
$2.3 million and $4.4 million, respectively, of advances to unconsolidated
related entities to fund operating expenses and $2.7 million and $3.3 million,
respectively, of notes receivable from employees and consultants representing
loans made to induce the employees and consultants to affiliate with the
Company. The notes receivable from employees and consultants
typically are forgiven over a one to six-year period and have tiered maturities
from 2010 through 2016. The December 31, 2009 balance also includes
the $8.0 million note issued by Madison Williams to the Company in connection
with the Capital Markets transaction.
SMH
earned fees of $768,000, $2.6 million, and $3.4 million in 2009, 2008, and 2007,
respectively, through the sale of annuity products from HWG Insurance Agency,
Inc. (“HWG”). The sole shareholder of HWG was an employee of
SMH. Ownership of HWG was transferred to SMH during
2009.
The
Company owns controlling interests in several limited liability companies that
act as the general partners in several limited partnerships (the
“Partnerships”). The Partnerships pay management fees to the general partners.
Certain officers of SMH serve on the boards of directors of entities in which
the Partnerships invest. In addition, SMH has served, and may in the
future serve, as the placement agent advisor, offering manager, or underwriter
for companies in which the Partnerships invest.
During
2001, the Company formed PTC – Houston Management, L.P. (“PTC”) to secure
financing for a new proton beam therapy cancer treatment center to be
constructed in Houston. A former advisory director of the Company and
his family are the principal owners of an entity that is a 50% owner of
PTC. Net operating income recognized by PTC totaled $2.3 million,
$1.4 million, and $248,000 in 2009, 2008, and 2007, respectively, of which
$974,000, $643,000, and $118,000, respectively, was attributable to the Company
and $1.1 million, $716,000, and $124,000, respectively, was attributable to the
advisory director-owned entity. The Company has granted a 7.5%
ownership interest in PTC to an employee who serves as a manager of
PTC.
67
22.
UNAUDITED QUARTERLY FINANCIAL INFORMATION
|
Three Months Ended,
|
||||||||||||||||
|
March
31,
|
June
30,
|
Sept.
30,
|
Dec.
31,
|
|||||||||||||
|
2009
|
2009
|
2009
|
2009
|
|||||||||||||
|
(in
thousands, except per share amounts)
|
||||||||||||||||
|
Total
revenue
|
$ | 35,857 | $ | 48,071 | $ | 41,413 | $ | 50,023 | ||||||||
|
Income
(loss) from continuing operations, net of tax
|
$ | (9,435 | ) | $ | 3,474 | $ | 4,954 | $ | 914 | |||||||
|
Income
(loss) from discontinued operations, net of tax
|
(2,357 | ) | (737 | ) | (841 | ) | 3,658 | |||||||||
|
Net
income (loss)
|
(11,792 | ) | 2,737 | 4,113 | 4,572 | |||||||||||
|
Less: Net
(income) loss attributable to the noncontrolling interest
|
(1,052 | ) | (1,204 | ) | (1,409 | ) | (1,447 | ) | ||||||||
|
Net
income (loss) attributable to Sanders Morris Harris Group
Inc.
|
$ | (12,844 | ) | $ | 1,533 | $ | 2,704 | $ | 3,125 | |||||||
|
Basic
earnings (loss) per common share:
|
||||||||||||||||
|
Continuing
operations
|
$ | (0.38 | ) | $ | 0.08 | $ | 0.13 | $ | (0.02 | ) | ||||||
|
Discontinued
operations
|
(0.09 | ) | (0.03 | ) | (0.03 | ) | 0.13 | |||||||||
|
Net
earnings (loss)
|
$ | (0.47 | ) | $ | 0.05 | $ | 0.10 | $ | 0.11 | |||||||
|
Diluted
earnings (loss) per common share:
|
||||||||||||||||
|
Continuing
operations
|
$ | (0.38 | ) | $ | 0.08 | $ | 0.12 | $ | (0.02 | ) | ||||||
|
Discontinued
operations
|
(0.09 | ) | (0.03 | ) | (0.03 | ) | 0.13 | |||||||||
|
Net
earnings (loss)
|
$ | (0.47 | ) | $ | 0.05 | $ | 0.09 | $ | 0.11 | |||||||
|
Weighted
average common shares oustanding - basic
|
27,567 | 27,733 | 27,797 | 28,676 | ||||||||||||
|
Weighted
average common shares outstanding - diluted
|
27,567 | 28,338 | 28,497 | 28,676 | ||||||||||||
68
|
Three Months Ended,
|
||||||||||||||||
|
March
31,
|
June
30,
|
Sept.
30,
|
Dec.
31,
|
|||||||||||||
|
2008
|
2008
|
2008
|
2008
|
|||||||||||||
|
(in
thousands, except per share amounts)
|
||||||||||||||||
|
Total
revenue
|
$ | 38,089 | $ | 44,792 | $ | 40,564 | $ | 48,496 | ||||||||
|
Income
(loss) from continuing operations, net of tax
|
$ | 3,319 | $ | 11,342 | $ | 29,081 | $ | (57,165 | ) | |||||||
|
Loss
from discontinued operations, net of tax
|
(2,538 | ) | (85 | ) | (1,063 | ) | (1,288 | ) | ||||||||
|
Net
income (loss)
|
781 | 11,257 | 28,018 | (58,453 | ) | |||||||||||
|
Less:
Net (income) loss attributable to the noncontrolling
interest
|
(2,888 | ) | (5,065 | ) | 942 | 115 | ||||||||||
|
Net
income (loss) attributable to Sanders Morris Harris Group
Inc.
|
$ | (2,107 | ) | $ | 6,192 | $ | 28,960 | $ | (58,338 | ) | ||||||
|
Basic
earnings (loss) per common share:
|
||||||||||||||||
|
Continuing
operations
|
$ | 0.02 | $ | 0.23 | $ | 1.07 | $ | (2.03 | ) | |||||||
|
Discontinued
operations
|
(0.10 | ) | - | (0.04 | ) | (0.04 | ) | |||||||||
|
Net
earnings (loss)
|
$ | (0.08 | ) | $ | 0.23 | $ | 1.03 | $ | (2.07 | ) | ||||||
|
Diluted
earnings (loss) per common share:
|
||||||||||||||||
|
Continuing
operations
|
$ | 0.02 | $ | 0.23 | $ | 1.07 | $ | (2.03 | ) | |||||||
|
Discontinued
operations
|
(0.10 | ) | - | (0.04 | ) | (0.04 | ) | |||||||||
|
Net
earnings (loss)
|
$ | (0.08 | ) | $ | 0.23 | $ | 1.03 | $ | (2.07 | ) | ||||||
|
Weighted
average common shares oustanding - basic
|
24,940 | 26,760 | 28,033 | 28,129 | ||||||||||||
|
Weighted
average common shares outstanding - diluted
|
25,165 | 26,918 | 28,192 | 28,129 | ||||||||||||
69
23. DISCONTINUED
OPERATIONS
During
the first quarter of 2009, SMH closed three retail offices. This
decision was made due to the offices’ inability to achieve sufficient revenue to
offset their costs. The results of operations for these offices have
been reclassified as discontinued operations for all periods
presented.
During
the fourth quarter of 2009, SMH contributed to Madison Williams the Capital
Markets Business in exchange for a 17.5% Class A membership interest in Madison
Williams, cash, and a note issued by Madison Williams to the
Company. The results of operations for the Capital Markets Business
have been reclassified as discontinued operations for all periods
presented.
A summary
of selected financial information of discontinued operations is as follows for
the years ended December 31, 2009, 2008, and 2007:
|
Year Ended December 31,
|
||||||||||||
|
2009
|
2008
|
2007
|
||||||||||
|
(in
thousands)
|
||||||||||||
|
Operating
activities:
|
||||||||||||
|
Revenue
|
$ | 25,364 | $ | 24,389 | $ | 30,741 | ||||||
|
Expenses
|
34,904 | 32,370 | 29,802 | |||||||||
|
Income
(loss) from discontinued operations before noncontrolling interest and
income taxes
|
(9,540 | ) | (7,981 | ) | 939 | |||||||
|
Noncontrolling
interest in net loss of consolidated companies
|
192 | - | - | |||||||||
|
Income
(loss) from discontinued operations before income taxes
|
(9,348 | ) | (7,981 | ) | 939 | |||||||
|
Provision
(benefit) for income taxes
|
(3,158 | ) | (3,007 | ) | 440 | |||||||
|
Income
(loss) from operations of discontinued operations
|
(6,190 | ) | (4,974 | ) | 499 | |||||||
|
Gain
on sale of Capital Markets Business, net of income taxes
|
5,913 | - | - | |||||||||
|
Income
(loss) from discontinued operations
|
$ | (277 | ) | $ | (4,974 | ) | $ | 499 | ||||
Major
classes of assets and liabilities of the closed offices and the Capital Markets
Business accounted for as discontinued operations in the accompanying
consolidated balance sheets at December 31, 2009 and 2008 were as
follows:
|
December 31,
|
||||||||
|
2009
|
2008
|
|||||||
|
(in
thousands)
|
||||||||
|
Cash
and cash equivalents
|
$ | - | $ | 823 | ||||
|
Receivables,
net
|
- | 557 | ||||||
|
Deposits
with clearing organizations
|
- | 500 | ||||||
|
Furniture,
equipment, and leasehold improvements, net
|
179 | 1,058 | ||||||
|
Other
assets and prepaid expenses
|
- | 117 | ||||||
|
Total
assets of discontinued operations
|
$ | 179 | $ | 3,055 | ||||
|
Accounts
payable and accrued liabilities
|
$ | 89 | $ | 1,871 | ||||
|
Payable
to broker-dealers and clearing organizations
|
- | 8 | ||||||
|
Total
liabilities of discontinued operations
|
$ | 89 | $ | 1,879 | ||||
|
Noncontrolling
interest
|
$ | - | $ | 676 | ||||
24. SUBSEQUENT
EVENTS
On
January 1, 2010, the Company completed the acquisition of a 51% interest in
Investor Financial Solutions, a wealth management firm based in Huntington
Beach, California with approximately $110 million in assets under management for
$1.0 million, $750,000 of which was payable at acquisition with the remainder,
subject to adjustment based on gross revenue of Investor Financial Solutions,
payable in July 2011.
On
February 18, 2010, the Company’s board of directors declared a cash dividend for
the first quarter of 2010 in the amount of $0.045 per share of common
stock. The cash dividend will be payable on April 19, 2010, to
holders of record as of the close of business on April 5, 2010.
70
In
February 2010, we entered into an agreement with the principals of the Concept
Capital division pursuant to which we agreed to contribute certain of the
assets, properties, and other rights pertaining to the Concept Capital division,
including the prime brokerage, research and capital markets, fund accounting and
administration, and research library businesses, including the Washington
Research Group to Concept Capital Markets, LLC and Concept Capital
Administration, LLC, two new entities formed by the principals of the Concept
Capital division. We will retain a 24% capital interest and 43.48% profit and
loss interest in Concept Capital Markets, LLC and a 43.48% member interest in
Concept Capital Administration, LLC. The terms of the transaction provide
generally that we will retain 50% of the cash and cash equivalents held by the
division at closing. Current members of management of the division will retain
the remaining interests in the new entities. The transaction is expected to
close following approval by the Financial Industry Regulatory Authority
(“FINRA”) of a new member application by Concept Capital Markets, LLC and a
continuing membership application by Sanders Morris Harris Inc., which we
anticipate will be in the second half of 2010.
71
Item
9. Changes in and Disagreements with Accountants on Accounting
and Financial Disclosure
The
Company had no disagreements on accounting or financial disclosure matters with
its independent accountants to report under this Item 9.
Item
9A. Controls and Procedures
Our
management, including our Chief Executive Officer and Chief Financial Officer,
have conducted an evaluation of the effectiveness of our disclosure controls and
procedures (as defined in Rule 13a-15(e) promulgated under the Exchange Act), as
of December 31, 2009, the end of the fiscal period covered by this
report. Based upon that evaluation, our Chief Executive Officer and
Chief Financial Officer have concluded that our disclosure controls and
procedures are effective in ensuring that the information required to be
disclosed in the reports we file or submit under the Exchange Act is recorded,
processed, summarized, and reported within the time periods specified in the
rules and forms of the Securities and Exchange Commission and that such
information is accumulated and communicated to our management, including our
Chief Executive Officer and Chief Financial Officer, as appropriate to allow
timely decisions regarding required disclosure. In the fourth quarter
of 2009, the Company strengthened the review and interpretive capabilities of
the Company’s financial reporting process by engaging a technical consultant to
perform specific review and advisory procedures as needed.
Management’s
Annual Report on Internal Control over Financial Reporting
Management
of the Company is responsible for establishing and maintaining effective
internal control over financial reporting as defined in Rule 13a-15(f) under the
Securities Exchange Act of 1934.
The
Company’s internal control over financial reporting is a process designed to
provide reasonable assurance regarding the reliability of financial reporting
and the preparation of financial statements for external purposes in accordance
with generally accepted accounting principles. The Company’s internal
control over financial reporting includes those policies and procedures that (1)
pertain to the maintenance of records that, in reasonable detail, accurately and
fairly reflect the transactions and dispositions of the assets of the Company;
(2) provide reasonable assurance that transactions are recorded as necessary to
permit preparation of financial statements in accordance with generally accepted
accounting principles, and that receipts and expenditures of the Company are
being made only in accordance with authorizations of management and board of
directors of the Company; and (3) provide reasonable assurance regarding
prevention or timely detection of unauthorized acquisition, use, or disposition
of the Company’s assets that could have a material effect on the financial
statements.
Because
of its inherent limitations, internal control over financial reporting may not
prevent or detect misstatements. Therefore, even those systems
determined to be effective can provide only reasonable assurance with respect to
financial statement preparation and presentation. Also, projections
of any evaluation of effectiveness to future periods are subject to the risk
that controls may become inadequate because of changes in conditions, or that
the degree of compliance with the policies and procedures may
deteriorate.
Management
assessed the effectiveness of the Company’s internal control over financial
reporting as of December 31, 2009. In making this assessment,
management used the criteria set forth by the Committee of Sponsoring
Organizations of the Treadway Commission (COSO) in Internal Control – Integrated
Framework. Based on our assessment, we concluded that, as of
December 31, 2009, the Company’s internal control over financial reporting is
effective based on those criteria.
Grant
Thornton LLP, the independent registered public accounting firm that audited the
consolidated financial statements of the Company included in this annual report
on Form 10-K, has issued an attestation report on the effectiveness of the
Company’s internal control over financial reporting as of December 31,
2009. The report, which expresses an unqualified opinion on the
effectiveness of the Company’s internal control over financial reporting as of
December 31, 2009, is included in this Item under the heading “Report of
Independent Registered Public Accounting Firm.”
72
Report
of Independent Registered Public Accounting Firm
The Board
of Directors and Shareholders
Sanders
Morris Harris Group Inc.
We have
audited the Sanders Morris Harris Group Inc.’s (a Texas Corporation) internal
control over financial reporting as of December 31, 2009, based on criteria
established in Internal Control-Integrated
Framework issued by the Committee of Sponsoring Organizations of the
Treadway Commission (COSO). Sanders Morris Harris Group Inc.’s
management is responsible for maintaining effective internal control over
financial reporting and for its assessment of the effectiveness of internal
control over financial reporting, included in the accompanying Management’s
Annual Report on Internal Control over Financial Reporting. Our
responsibility is to express an opinion on Sanders Morris Harris Group Inc.’s
internal control over financial reporting based on our audit.
We
conducted our audit in accordance with the standards of the Public Company
Accounting Oversight Board (United States). Those standards require
that we plan and perform the audit to obtain reasonable assurance about whether
effective internal control over financial reporting was maintained in all
material respects. Our audit included obtaining an understanding of
internal control over financial reporting, assessing the risk that a material
weakness exists, testing and evaluating the design and operating effectiveness
of internal control based on the assessed risk, and performing such other
procedures as we considered necessary in the circumstances. We
believe that our audit provides a reasonable basis for our opinion.
A
company’s internal control over financial reporting is a process designed to
provide reasonable assurance regarding the reliability of financial reporting
and the preparation of financial statements for external purposes in accordance
with generally accepted accounting principles. A company’s internal
control over financial reporting includes those policies and procedures that (1)
pertain to the maintenance of records that, in reasonable detail, accurately and
fairly reflect the transactions and dispositions of the assets of the
company; (2) provide reasonable assurance that transactions are
recorded as necessary to permit preparation of financial statements in
accordance with generally accepted accounting principles, and that receipts and
expenditures of the company are being made only in accordance with
authorizations of management and directors of the company; and (3) provide
reasonable assurance regarding prevention or timely detection of unauthorized
acquisition, use, or disposition of the company’s assets that could have a
material effect on the financial statements.
Because
of its inherent limitations, internal control over financial reporting may not
prevent or detect misstatements. Also, projections of any evaluation
of effectiveness to future periods are subject to the risk that controls may
become inadequate because of changes in conditions, or that the degree of
compliance with the policies or procedures may deteriorate.
In our
opinion, Sanders Morris Harris Group Inc. maintained, in all material respects,
effective internal control over financial reporting as of December 31, 2009,
based on criteria established in Internal
Control – Integrated Framework issued by COSO.
We have
also audited, in accordance with the standards of the Public Company Accounting
Oversight Board (United States), the consolidated balance sheet of Sanders
Morris Harris Group Inc. and subsidiaries as of December 31, 2009, and the
related consolidated statements operations, changes in equity, and cash flows
for the year then ended and our report dated March 16, 2010 expressed an
unqualified opinion.
/s/ GRANT
THORNTON LLP
Houston,
Texas
March 16,
2010
73
Item
9B. Other Information
Not
applicable.
74
PART
III
Item
10. Directors, Executive Officers and Corporate
Governance
The
information required in response to this Item 10 is incorporated herein by
reference to the Company's definitive Proxy Statement to be filed with the
Securities and Exchange Commission pursuant to Regulation 14A, not later than
120 days after the end of the fiscal year covered by this report.
We have
adopted a Business Ethics Policy or code of ethics for our employees, which
applies to our principal executive officer, principal financial officer, and
principal accounting officer, pursuant to section 406 of the Sarbanes-Oxley
Act. A copy of our Business Ethics Policy is publicly available on
our internet website at www.smhgroup.com. The information
contained on our internet website is not incorporated by reference into this
Report on Form 10-K.
Item
11. Executive Compensation
The
information required in response to this Item 11 is incorporated herein by
reference to the Company's definitive Proxy Statement to be filed with the
Securities and Exchange Commission pursuant to Regulation 14A, not later than
120 days after the end of the fiscal year covered by this report.
Item
12. Security Ownership of Certain Beneficial Owners and Management
and Related Stockholder Matters
The
information required in response to this Item 12 is incorporated herein by
reference to the Company's definitive Proxy Statement to be filed with the
Securities and Exchange Commission pursuant to Regulation 14A, not later than
120 days after the end of the fiscal year covered by this report.
Item
13. Certain Relationships and Related Transactions, and Director
Independence
The
information, if any, required in response to this Item 13 is incorporated herein
by reference to the Company's definitive Proxy Statement to be filed with the
Securities and Exchange Commission pursuant to Regulation 14A, not later than
120 days after the end of the fiscal year covered by this report.
Item
14. Principal Accountant Fees and Services
The
information required in response to this Item 14 is incorporated herein by
reference to the Company’s definitive Proxy Statement to be filed with the
Securities and Exchange Commission pursuant to Regulation 14A, not later than
120 days after the end of the fiscal year covered by this
report.
75
PART
IV
Item
15. Exhibits, Financial Statement Schedules
1.
Financial
Statements
|
|
The
following financial statements of the Company and Reports of Independent
Registered Public Accounting Firm are included under Part II Item 8 of
this Form 10-K.
|
|
Page
|
||
|
Sanders
Morris Harris Group Inc.
|
||
|
Report
of Independent Registered Public Accounting Firm
|
39
|
|
|
Report
of Independent Registered Public Accounting Firm
|
40
|
|
|
Consolidated
Balance Sheets as of December 31, 2009 and 2008
|
41
|
|
|
Consolidated
Statements of Operations for each of the years in the three-year period
ended
|
||
|
December
31, 2009
|
42
|
|
|
Consolidated
Statements of Changes in Equity for each of the years in
the
|
||
|
three-year
period ended December 31, 2009
|
43
|
|
|
Consolidated
Statements of Cash Flows for each of the years in the three-year period
ended
|
||
|
December
31, 2009
|
44
|
|
|
Notes
to Consolidated Financial Statements
|
45
|
|
2.
Financial
Statement Schedules
All
schedules for which provision is made in the applicable accounting regulations
of the Securities and Exchange Commission are not required under the related
instructions, are inapplicable, or the required information is included
elsewhere in the consolidated financial statements.
3.
Exhibits
The
exhibits filed in response to Item 601 of Regulation S-K are listed in the Index
to Exhibits contained elsewhere herein.
76
SIGNATURES
Pursuant
to the requirements of Section 13 or 15(d) of the Securities Exchange Act of
1934, the registrant has duly caused this report to be signed on its behalf by
the undersigned, thereunto duly authorized, on March 16, 2010.
|
SANDERS
MORRIS HARRIS GROUP INC.
|
|||
|
By:
|
/s/ GEORGE L. BALL
|
||
|
George
L. Ball
|
|||
|
Chief
Executive Officer
|
|||
Pursuant to the requirements of the
Securities Exchange Act of 1934, this report has been signed by the following
persons on behalf of the registrant and in the capacities indicated on the 16th
day of March 2010.
|
Signature
|
Title
|
|
|
/s/ GEORGE L. BALL
|
Chief
Executive Officer and Chairman of the Board
|
|
|
George
L. Ball
|
(Principal
Executive Officer)
|
|
|
/s/ RIC EDELMAN
|
President
and Director
|
|
|
Ric
Edelman
|
||
|
/s/ BEN T. MORRIS
|
Vice
Chairman
|
|
|
Ben
T. Morris
|
||
|
/s/ DON A. SANDERS
|
Vice
Chairman
|
|
|
Don
A. Sanders
|
||
|
/s/ RICHARD E. BEAN
|
Director
|
|
|
Richard
E. Bean
|
||
|
/s/ CHARLES W. DUNCAN, III
|
Director
|
|
|
Charles
W. Duncan, III
|
||
|
/s/ SCOTT MCCLELLAND
|
Director
|
|
|
Scott
McClelland
|
||
|
/s/ ALBERT W. NIEMI, JR.,
PH.D.
|
Director
|
|
|
Albert
W. Niemi, Jr., Ph.D.
|
||
|
/s/ W. BLAIR WALTRIP
|
Director
|
|
|
W.
Blair Waltrip
|
||
|
/s/ RICK BERRY
|
Chief
Financial Officer
|
|
|
Rick
Berry
|
|
(Principal
Financial and Accounting
Officer)
|
77
INDEX
TO EXHIBITS
|
Exhibit
|
||
|
Number
|
Description
|
|
|
3.1
|
Articles
of Incorporation of the Company, as amended (Filed as Exhibit 3.1 to the
Company’s Annual Report on Form 10-K for the year ended December 31, 2001
(File No. 000-30066), and incorporated herein by
reference).
|
|
|
3.2
|
Amended
and Restated Bylaws of the Company (Filed as Exhibit 3.2 to the Company’s
Quarterly Report on Form 10-Q for the quarter ended September 30, 2007
(File No. 000-30066), and incorporated herein by
reference).
|
|
|
†10.01
|
Sanders
Morris Harris Group Inc. 1998 Incentive Plan as amended (Filed as Appendix
A to the Definitive Proxy Statement on Schedule 14A of the Company dated
May 3, 2002 (File No. 000-30066), and incorporated herein by
reference).
|
|
|
†10.02
|
Sanders
Morris Harris Group Inc. Capital Incentive Program (Filed as Exhibit 10.1
to the Company’s Form 10-Q for the quarter ended September 30, 2001 (File
No. 000-30066), and incorporated herein by reference).
|
|
|
†10.03
|
Form
of Option Agreement pursuant to 1998 Incentive Plan (Filed as Exhibit
10.03 to the Company’s Annual Report on Form 10-K for the year ended
December 31, 2005 (File No. 000-30066), and incorporated herein by
reference).
|
|
|
†10.04
|
Form
of Restricted Stock Agreement pursuant to 1998 Incentive Plan (Filed as
Exhibit 10.04 to the Company’s Annual Report on Form 10-K for the year
ended December 31, 2005 (File No. 000-30066), and incorporated herein by
reference).
|
|
|
†10.05
|
Employment
Agreement dated as of May 10, 2005, between The Edelman Financial Center,
LLC and Fredric M. Edelman (Filed as Exhibit 10.05 to the
Company’s Quarterly Report on Form 10-Q for the quarter ended June 30,
2009 (File No. 000-30066), and incorporated herein by
reference).
|
|
|
*†10.06
|
Sanders
Morris Harris Group Inc. 2009 Management Incentive
Program.
|
|
|
*†10.07
|
Sanders
Morris Harris Group Inc. 2009 Supplemental Bonus Plan.
|
|
|
10.08
|
Office
Lease Agreement and related amendments dated September 25, 1996, between
Texas Tower Limited and Sanders Morris Mundy Inc. (Filed as Exhibit 10.3
to the Company’s Quarterly Report on Form 10-Q for the quarter ended March
31, 2000 (File No. 000-30066), and incorporated herein by
reference).
|
|
|
10.09
|
Eleventh
Amendment to Lease Agreement dated as of December 21, 2006, between Texas
Tower Limited and Sanders Morris Harris Inc. (Filed as Exhibit 10.6 to the
Company’s Annual Report on Form 10-K for the year ended December 31, 2007
(File No. 000-30066), and incorporated herein by
reference).
|
|
|
10.10
|
Reorganization
and Purchase Agreement dated as of May 10, 2005, among Sanders Morris
Harris Group Inc., The Edelman Financial Center, Inc., The Edelman
Financial Center, LLC, and Fredric M. Edelman (Filed as Exhibit 2.1 to the
Company’s Current Report on Form 8-K dated May 10, 2005 (File No.
000-30066), and incorporated herein by reference).
|
|
|
10.11
|
Contribution
Agreement dated as of April 28, 2003, by and between Salient Partners,
L.P., a Texas limited partnership, Salient Advisors, L.P., a Texas limited
partnership, Salient Capital, L.P., a Texas limited partnership, Salient
Partners GP, LLC, a Texas limited liability company, John A. Blaisdell,
Andrew B. Linbeck, J. Matthew Newtown, Jeremy L. Radcliffe, A. Haag
Sherman, and Adam L. Thomas, and Sanders Morris Harris Group, Inc. (Filed
as Exhibit 10.10 to the Company’s Annual Report on Form 10-K for the year
ended December 31, 2007 (File No. 000-30066), and incorporated herein by
reference).
|
|
|
10.12
|
Agreement
to Retire Partnership Interest and Second Amendment to the Limited
Partnership Agreement of Endowment Advisers, L.P. dated as of August 29,
2008, among Sanders Morris Harris Group Inc. and Endowment Advisers, L.P.,
The Endowment Fund GP, L.P., and The Endowment Fund Management, LLC, and
their respective partners and members (Filed as Exhibit 99.2 to the
Company’s Current Report on Form 8-K dated August 29, 2008 (File No.
000-30066), and incorporated herein by reference).
|
|
|
10.13
|
Letter
agreement dated as of January 1, 2009, among Sanders Morris Harris Group,
Inc., Fredric M. Edelman, and Edward Moore (Filed as Exhibit
99.2 to the Company’s Current Report on Form 8-K dated January 29, 2009
(File No. 000-30066), and incorporated herein by
reference).
|
|
|
10.14
|
Credit
Agreement dated as of May 11, 2009, between Sanders Morris Harris Group
Inc. and Prosperity Bank. (Filed as Exhibit 10.08 to the
Company’s Quarterly Report on Form 10-Q for the quarter ended June 30,
2009 (File No. 000-30066), and incorporated herein by
reference).
|
78
|
10.15
|
First
Amendment to Credit Agreement dated as of June 23, 2009, between Sanders
Morris Harris Group Inc. and Prosperity Bank (Filed as Exhibit
10.09 to the Company’s Quarterly Report on Form 10-Q for the quarter ended
June 30, 2009 (File No. 000-30066), and incorporated herein by
reference).
|
|
|
10.16
|
Second
Amendment to Credit Agreement dated as of July 15, 2009, between Sanders
Morris Harris Group Inc. and Prosperity Bank (Filed as Exhibit
10.10 to the Company’s Quarterly Report on Form 10-Q for the quarter ended
June 30, 2009 (File No. 000-30066), and incorporated herein by
reference).
|
|
|
10.17
|
Third
Amendment to Credit Agreement dated as of September 15, 2009, between
Sanders Morris Harris Group Inc. and Prosperity Bank (Filed as
Exhibit 10.11 to the Company’s Quarterly Report on Form 10-Q for the
quarter ended September 30, 2009 (File No. 000-30066), and incorporated
herein by reference).
|
|
|
10.18
|
Fourth
Amendment to Credit Agreement dated as of September 30, 2009, between
Sanders Morris Harris Group Inc. and Prosperity Bank (Filed as
Exhibit 10.12 to the Company’s Quarterly Report on Form 10-Q for the
quarter ended September 30, 2009 (File No. 000-30066), and incorporated
herein by
reference).
|
|
*21.1
|
Subsidiaries
of Sanders Morris Harris Group Inc.
|
|
|
*23.1
|
Consent
of KPMG LLP.
|
|
|
*23.2
|
Consent
of Grant Thornton LLP.
|
|
|
*31.1
|
Rule
13a-14(a)/15d - 14(a) Certification of Chief Executive
Officer.
|
|
|
*31.2
|
Rule
13a-14(a)/15d - 14(a) Certification of Chief Financial
Officer.
|
|
|
*32.1
|
Certification
Pursuant to 18 U.S.C. 1350, as Adopted Pursuant to Section 906 of the
Sarbanes-Oxley Act of 2002.
|
|
|
*32.2
|
|
Certification
Pursuant to 18 U.S.C. 1350, as Adopted Pursuant to Section 906 of the
Sarbanes-Oxley Act of
2002.
|
*
Filed herewith.
† Management
contract or compensation plan or arrangement.
79