Attached files
UNITED STATES
SECURITIES AND EXCHANGE COMMISSION
Washington, D.C. 20549
FORM 10-K
| x | ANNUAL REPORT PURSUANT TO SECTION 13 OR 15(d) OF THE SECURITIES EXCHANGE ACT OF 1934 |
FOR THE FISCAL YEAR ENDED DECEMBER 31, 2009
OR
| ¨ | TRANSITION REPORT PURSUANT TO SECTION 13 OR 15 (d) OF THE SECURITIES EXCHANGE ACT OF 1934 |
For the transition period from to
OTIX GLOBAL, INC.
(Exact name of registrant as specified in its charter)
| Delaware | 87-0494518 | |
| (State or other jurisdiction of incorporation or organization) |
(I.R.S. Employer Identification No.) | |
| 4246 South Riverboat Road, Suite 300 Salt Lake City, UT |
84123 | |
| (Address of principal executive offices) | (Zip Code) | |
(801) 312-1700
(Registrant’s telephone number, including area code)
Securities registered pursuant to Section 12(b) of the Act:
| Title of Each Class |
Name of Each Exchange on Which Registered | |
| Common Stock, ($0.001 par value) Preferred Stock Purchase Rights |
The NASDAQ Stock Market L.L.C. The NASDAQ Stock Market L.L.C. |
Securities registered pursuant to Section 12(g) of the Act:
None
Indicate by check mark if the registrant is a well-known seasoned issuer as defined in Rule 405 of the Securities Act of 1933. ¨ Yes x No
Indicate by check mark if the registrant is not required to file reports pursuant to Section 13 or 15(d) of the Securities Exchange Act of 1934. ¨ Yes x No
Indicate by check mark whether the registrant: (1) has filed all reports required to be filed by Section 13 or 15(d) of the Securities Exchange Act of 1934 during the preceding 12 months (or for such shorter period that the registrant was required to file such reports), and (2) has been subject to such filing requirements for the past 90 days. x Yes ¨ No
Indicate by check mark whether the registrant has submitted electronically and posted on its corporate Website, if any, every Interactive Data File required to be submitted and posted pursuant to Rule 405 of Regulation S-T (§232.405 of this chapter) during the preceding 12 months (or for such shorter period that the registrant was required to submit and post such files). ¨ Yes ¨ No
Indicate by check mark if disclosure of delinquent filers pursuant to Item 405 of Regulation S-K is not contained herein, and will not be contained to the best of registrant’s knowledge, in definitive proxy or information statements incorporated by reference in Part III of this Form 10-K or any amendment to this Form 10-K. ¨
Indicate by check mark whether the registrant is a large accelerated filer, an accelerated filer, a non-accelerated filer, or a smaller reporting company. See the definitions of “large accelerated filer,” “accelerated filer” and “smaller reporting company” in Rule 12b-2 of the Exchange Act.
| Large accelerated filer | ¨ | Accelerated filer | ¨ | |||
| Non-accelerated filer | x | Smaller reporting company | ¨ | |||
Indicate by check mark whether the registrant is a shell company (as defined in Rule 12b-2 of the Securities Exchange Act of 1934). ¨ Yes x No
The aggregate market value of the common stock held by non-affiliates of the registrant as of June 30, 2009 was approximately $21 million. For purposes of this calculation, all executive officers and directors of the registrant and all beneficial owners of ten percent or more of the registrant’s common stock were considered affiliates.
As of March 8, 2010, the registrant had outstanding 27,858,806 shares of common stock.
DOCUMENTS INCORPORATED BY REFERENCE
Portions of the registrant’s Proxy Statement for the 2010 Annual Meeting of Stockholders are incorporated by reference in Part III of this Form 10-K.
PART I
This report contains “forward-looking statements” within the meaning of Section 27A of the Securities Act of 1933, as amended, and Rule 175 promulgated thereunder, and Section 21E of the Securities Exchange Act of 1934, as amended, and Rule 3b-6 promulgated thereunder, that involve inherent risks and uncertainties. Any statements about our plans, objectives, expectations, strategies, beliefs, or future performance or events constitute forward-looking statements. Such statements are identified as those that include words or phrases such as “believes,” “expects,” “anticipates,” “plans,” “trend,” “objective,” “continue” or similar expressions or future or conditional verbs such as “will,” “would,” “should,” “could,” “might,” “may” or similar expressions. Forward-looking statements involve known and unknown risks, uncertainties, assumptions, estimates and other important factors that could cause actual results to differ materially from any results, performance or events expressed or implied by such forward-looking statements. All forward-looking statements are qualified in their entirety by reference to the factors discussed more fully in Item 1A hereof: (i) deterioration of economic conditions; (ii) our continued losses; (iii) aggressive competitive factors; (iv) fluctuations in our financial results; (v) our common stock could be subject to delisting; (vi) negative impact of our recent acquisition activities; (vii) ineffective internal financial control systems; (viii) dependence on significant customers; (ix) dependence on critical suppliers and contractors; (x) high levels of product returns and repairs; (xi) inability to introduce new and innovative products; (xii) undiscovered product errors or defects; (xiii) potential infringement on the intellectual property rights of others; (xiv) uncertainty of intellectual property protection; (xv) dependence on international operations; (xvi) potential product liability; (xvii) failure to comply with FDA regulations; (xviii) our stock price could suffer due to sales of stock by our directors and officers; (xix) our charter documents and shareholder agreements may prevent certain acquisitions; and (xx) debt covenant default.
Because the foregoing factors could cause actual results or outcomes to differ materially from those expressed or implied in any forward-looking statements, undue reliance should not be placed on any forward-looking statements. Further, any forward-looking statement speaks only as of the date on which it is made, and we undertake no obligation to update any forward-looking statement to reflect events or circumstances after the date on which the statement is made or to reflect the occurrence of future events or developments.
Copyright © 2010 Otix Global, Inc. All rights reserved. Otix Global®, Sonic Innovations®, Sonic™, Touch®, ion®, Velocity®, Balance®, Applause®, Natura®, Tribute®, Quartet®, Altair®, EXPRESSfit®, EXPRESSlink®, DIRECTIONALfocus®, are either registered trademarks or trademarks of Otix Global, Inc. or its subsidiaries in the United States and/or other countries. Certain other product names, brand names, and company names may be trademarks or designations of their respective owners. Trademarks of Otix Global, Inc. are: Touch®, ion®, Velocity®, Balance®, Applause®, Natura®, Tribute®, Quartet®, Altair®, EXPRESSfit®, EXPRESSlink®, DIRECTIONALfocus®, and Otix Global®.
| ITEM 1. | BUSINESS |
Our Company
Otix Global, Inc. (“Otix” or “the Company”) was previously named Sonic Innovations, Inc. At the May 2009 annual meeting, the shareholders of Sonic Innovations, Inc. voted to change the name to Otix Global, Inc. The change created a holding company that allows the Sonic Innovations (“Sonic”) brand and Sonic’s other brands to operate independently from each other. Sonic continues as a company and brand, developing and distributing hearing instruments and services, and Otix is the parent company of Sonic and Sonic’s other legal entities.
Otix is a premier provider of technologically advanced hearing care solutions focused on the therapeutic aspects of hearing care. We design, develop, manufacture, market and distribute high-performance digital hearing aids intended to provide the highest levels of satisfaction for hearing impaired consumers. We have developed patented digital-signal-processing (“DSP”) technologies based on what we believe is an advanced understanding of human hearing. In countries where we have direct (owned) operations, we sell our products to hearing care professionals or directly to hearing impaired consumers. In other parts of the world, where we do not have direct operations, we sell primarily to distributors.
We have been acquisitive after raising capital in an initial public offering in 2000 and a Private Investment in a Public Equity (“PIPE”) offering in 2006. Product evolution continues, but the differentiation between product offerings by hearing aid companies has narrowed, and thus distribution and access to distribution continues to grow in importance. Accordingly, we acquired a number of our then distributors between the years 2000 to 2003. Thereafter, we acquired an operation in Germany with a unique distribution model using the Ear-nose-throat (“ENT”) physician. Then, from 2006 to 2008, we acquired a number of retail practices. This was all to strengthen our distribution network.
Our Touch, Velocity, ion, Balance, Innova, Applause, Natura Pro, Natura 2, Tribute, and Quartet hearing aid product lines, all of which incorporate our DSP technologies, can be purchased in the six common models for hearing aids (with the exception of the Touch and ion brand products which are available in BTE only): behind-the-ear (“BTE”); in-the-ear (“ITE”); half-shell (“HS”, which fills the entire bowl of the ear and is visible in the ear); in-the-canal (“ITC”); mini-canal (“MC”); and completely-in-the-canal (“CIC”).
2
BTE style hearing aids have seen continued growth in 2008; representing 55% of the units sold industry-wide in the United States, up from 51% in 2007, 44% in 2006 and 33% in 2005. BTE devices are offered in three broad categories; standard BTE (our Velocity product line), open ear thin tube devices (ion product family) and RIC products (our Touch product family).
Velocity was launched in July 2007, and we expanded the Velocity family of products in late 2008. Velocity combines a sophisticated set of breakthrough algorithms to provide the hearing-impaired customer with outstanding hands-free operation in a variety of listening environments. Using environmental sound cues, Velocity is able to automatically adjust the hearing aid settings to best meet the challenges of a particular listening situation without requiring the wearer to press a button.
Touch, our first receiver-in-the-canal (“RIC”) product family, was launched in March 2009. The RIC category is the fastest growing market segment for BTE’s. We believe Touch is the smallest and has the best moisture resistance of any RIC product on the market. Touch incorporates many of the sound processing technologies present in our Velocity series of hearing solutions.
Ion was launched in March 2006 as an “open ear” device, at the time a rapidly growing market segment of BTE’s. Today, the growth in the BTE category is in RIC products. Open-ear devices reduce the occlusion effect (the “plugged up” sensation that hearing aid wearers may encounter).
Our business is managed based on geographic regions. As such, we have three reportable operating segments: North America, which includes owned operations in the U.S. and Canada; Europe, which includes owned operations in Germany and Austria; and Rest-of-World, which includes an owned operation in Australia. Distributor sales are classified into one of the three reportable operating segments based on where the distributor has its place of business. Financial information for each segment is included in Note 16 to our consolidated financial statements.
Germany Legislation
Legislation passed by the Federal Council of Germany in November 2008 and which became effective on April 1, 2009, resulted in sweeping changes to the way doctors and healthcare providers interact and are reimbursed by insurance companies. A major change in regulation directly affecting our German subsidiary was the prohibition of direct fitting fee payments from hearing aid retailers to doctors. Under our German government approved business model, the new legislation requires that the fitting fee payments to the doctors come from the insurance companies rather than us. The direct payment to doctors for fitting services under our business model was one of the keys to success for our sales channel in Germany. The law changed the market by giving more power to the insurers by allowing discretion as to which business models they supply hearing aids and related services. Insurers are the sole gatekeepers for access to the reimbursement schemes for the end consumer. These changes required our German subsidiary to a) develop a new business process with the insurance companies to create a service company for invoicing, receiving and paying out the doctor’s honorarium; b) renegotiate contracts with insurance companies; and c) negotiate contracts between and with the insurance company and the ENT doctors. In the first three months of 2009, we believed our German subsidiary was making progress, having successfully renegotiated a number of contracts. However, on April 1, 2009, we were notified by one large insurance company representing approximately 25% of our 2008 German revenue that, despite several months of favorable negotiations, due to “political headwinds,” they were refusing to enter into a contract; therefore, our German subsidiary filed a lawsuit in the Social Court in Hamburg, Germany against this insurance company, requesting that the court compel the insurance company to enter into a contract with our German subsidiary. On April 28, 2009, the Court rejected these claims. We subsequently filed an appeal of this decision, which was rejected without review. In addition, a number of other insurance companies were unsure if they should sign a contract because there were rumors that the newly enacted law could potentially change again, thus requiring the need to renegotiate within a short period of time. Without renegotiated insurance contracts, and the ability to pay customary fitting fees to the ENT doctors, we expected revenue to decline substantially and cash flow of the operation would not be sufficient to support our intangibles balances. As a result, we recognized a $14,658 non-cash write-off of our goodwill and trade name associated with our German operation in the first quarter of 2009.
In June 2009, the German government passed additional amendments to the law that became effective July 23, 2009. The key implication of these amendments to our business model was to impose additional costs on the doctors and insurance companies that conduct business with our German operation and disrupt the normal flow of fitting hearing aids on the first visit to the doctor’s office.
We are currently renegotiating contracts in light of the new legislative requirements and are working to contract with other insurance companies as well. Although our German subsidiary is exploring and implementing alternative avenues for replacing the lost revenue, the lack of signed insurance contracts and the imposition of new and costly requirements on the ENT doctors and the insurance companies are expected to continue to impact sales in 2010. We are exploring other methods to sell our hearing aids through the existing distribution channel.
Germany represented 72% and 78% of Europe segment revenues and 75% and 95% of Europe segment operating profit (excluding current year impairment charges) for the years ended December 31, 2009 and 2008, respectively.
3
Industry Background
The market for hearing aids is very large and has substantial unmet needs. Industry researchers estimate that approximately 10% of the population suffers from hearing loss. There is no single, audited source of sales data for the worldwide hearing aid market, but U.S. data is maintained by the Hearing Industry Association and is generally adopted and used by the industry as a proxy for worldwide data. As depicted in the following table, less than 25% of the U.S. total population in 2008 that could benefit from a hearing aid actually owned a hearing aid:
| 2004 | 2008 | Change | |||||||
| Hearing Loss Population |
|||||||||
| U.S. households (millions) |
111.1 | 116.1 | 4.5 | % | |||||
| Hearing difficulty per 1,000 households |
283 | 295 | 4.2 | % | |||||
| Number of hearing impaired (millions) |
31.5 | 34.3 | 8.9 | % | |||||
| 2004 | 2008 | Change | |||||||
| Hearing Aid Population |
|||||||||
| Hearing aid adoption rate |
23.5 | % | 24.6 | % | 4.7 | % | |||
| Hearing aid owners (millions) |
7.4 | 8.4 | 13.5 | % | |||||
| Hearing impaired, non-owners (millions) |
24.1 | 25.8 | 7.1 | % | |||||
The hearing loss population has grown to 34.3 million. Over the last generation, the hearing loss population grew at the rate of 1.6 times the U.S. population growth, primarily due to the aging of America. Hearing aid adoption continues to increase slowly (now 1 in 4 people with hearing loss) as do binaural fittings (8 out of 10). While 4 in 10 people with moderate-to-severe hearing loss use amplification for their hearing loss, less than 1 in 10 people with mild hearing loss use amplification. Hearing impaired people in this segment, which comprise the majority of the hearing impaired population, often do not purchase hearing aids for a variety of reasons, including their belief that their hearing loss is not significant enough to warrant hearing aids, their concern regarding the stigma associated with wearing hearing aids and their perception that existing hearing aids are uncomfortable, do not perform well, cannot solve specific hearing problems and are too expensive.
Despite this low level of market penetration, annual worldwide retail sales of hearing aids are estimated to be over $6 billion and wholesale sales are estimated to be over $2 billion. We anticipate that demographic trends, such as the aging of the developed world’s population and increased purchasing power in developing nations, will accelerate the growth of the hearing impaired population, which should result in increasing hearing aid sales over time.
Hearing Impairment
The major causes of hearing loss are aging, noise exposure, disease and injury. Hearing loss is usually gradual and develops slowly. In most cases it goes unnoticed by the hearing impaired individual until the coping mechanisms they have developed (turning up the volume on the TV, moving closer in proximity to the speaker, asking for others to repeat themselves, etc.) are no longer effective. The impact of hearing loss on a person’s lifestyle can be dramatic. For adults, it can result in isolation from family and friends and a reluctance to participate in social events as well as impairment to productivity in the workplace. In children, it can negatively affect the ability to learn, the development of communication skills and the ability to interact with others.
Approximately 90% of all permanent hearing impairments are characterized as sensorineural losses (or having a sensorinueral component mixed with a conductive component), and the remaining 10% are characterized as conductive losses. Sensorineural losses, which stem from deterioration of or damage to the cochlea, typically cannot be corrected by medical or surgical means. Hearing aids offer the most effective means of rehabilitation for sensorineural losses. Conductive losses, which can be temporary or permanent, are generally corrected by medicine or surgery, and we do not compete in this market.
In the case of sensorineural hearing loss, all sounds are not affected equally. Typically, higher frequencies are more difficult to hear than lower frequencies. Accordingly, the first sounds to “disappear” are those that have the highest pitches, such as the voices of women and children. Furthermore, speech becomes much more difficult to comprehend since it is the softer, higher-pitched consonants that provide essential information to facilitate discrimination among words. Consider the following word list: cat, hat, fat, and sat. Without the ability to clearly hear the first letter of each of these words, a person is rendered helpless to comprehend what is being said. As a result, people with hearing losses often complain that they can hear others talking but do not understand what is being said.
Obtaining Hearing Aids
An individual who seeks help for a hearing loss is generally motivated by a family member or may be referred by a physician to a hearing care professional—an audiologist or a hearing instrument specialist in the U.S. During the 1990’s and into the early 2000’s, the majority of hearing aids sold in the U.S. have been in-the-ear products, custom-made to each individual’s ear, particularly for users
4
who have a mild to moderate hearing impairment. In Europe, BTE devices have been the predominant standard, with the U.S. market demonstrating a similar trend. The introduction of small, open-ear and RIC BTE products are having an effect on the worldwide mix of products. Most markets are shifting towards increased usage of BTE products, with many fit as ‘open’ or RIC products.
BTE products, because of their nature, can be inventoried at the hearing care professional’s location and generally do not require custom physical modification. Instead, these devices require software customization for each patient, even two patients with exactly the same hearing loss will likely wear different settings.
To fit a custom hearing aid or earmold, the hearing care professional first conducts a detailed measurement of hearing loss and performs a visual examination of the ear before taking an impression of the person’s ear canals with a liquid silicone material that hardens to the shape of the canal. This impression is sent either to the hearing aid manufacturer who then builds a hearing aid enclosed in a custom shell, or to an ear mold laboratory who builds an ear mold for a standard product, that matches the impression. This process usually requires about one week. There is considerable art and craftsmanship associated with creating custom hearing aids or ear molds that fit comfortably. A great deal of judgment is involved in shaping the final shell. If the aid does not fit the patient properly, the hearing care professional may make small modifications to the shell or send the hearing aid back to the manufacturer for a remake. It is not uncommon for a new hearing aid to require remaking, which often requires an additional week away from the patient.
Hearing Aids
Hearing aids are primarily fit to persons with sensorineural hearing loss, which results from damage to the hair cells in the inner ears (cochlea). This damage produces both frequency-specific hearing loss and frequency-specific loudness recruitment. The recruitment (sensitivity to loud sounds as hearing loss develops) problem associated with sensorineural loss is characterized by significant loss of sensitivity to low-intensity signals, mild loss of sensitivity to mid-intensity signals, and relatively normal sensitivity to high-intensity signals.
Early generation analog hearing aids focused on simply amplifying previously inaudible sounds to an audible level, which addressed the overall loss of hearing sensitivity, but not loss of sensitivity at specific frequencies or pitches. The result was under-amplification of certain sounds and over-amplification of other sounds. This problem severely limited improvements in speech intelligibility; so hearing was, in reality, only partially improved.
In the 1970’s, analog hearing aids emerged that amplified sounds at different frequencies by predetermined amounts providing “frequency shaping” for the loss of hearing sensitivity. This allowed little to no amplification at pitches where there was no hearing loss and greater amplification at pitches where there was a hearing loss. However, these devices did nothing to address the recruitment problem and continued to allow many soft sounds to be inaudible and loud sounds to be intolerable. The wearer was forced to constantly adjust the hearing aid volume control in an attempt to find an acceptable balance between making soft sounds audible and loud sounds tolerable. Although hearing aids employing this technology helped, these hearing aids generally did not improve speech intelligibility to a level that satisfied users.
Around 1990, multiband wide-dynamic-range compression (“WDRC”) was introduced into analog hearing aids. This technology enabled the hearing aid to automatically adjust the output of individual frequency bands based on the input levels to those bands, allowing the hearing aid to apply more amplification to low-intensity sounds than to high-intensity sounds by frequency band. The result was a hearing aid that more closely modeled the operation of the healthy ear. Many hearing aid companies now utilize multiband WDRC circuits that improve satisfaction from previous levels.
By the late 1990’s, technological advances based on DSP led to the first digital hearing aids. DSP hearing aids allow more effective sound processing algorithms to be built into smaller integrated circuits that consume less power. These circuits accomplish processing tasks that are impossible for analog systems and greatly enhance a hearing aid’s ability to adjust the incoming signal to match the acoustic needs of the hearing impaired individual.
In recent years, DSP algorithms have greatly improved the ability of hearing aids to meet specific needs of the listener.
Examples include:
| • | Automatic and adaptive directional microphones that preferentially amplify sounds coming from the front, as opposed to sounds from the sides and behind the listener, thereby improving speech understanding in background noise. |
| • | Digital noise-reduction algorithms that provide listening comfort in many noisy environments and in some situations can also improve speech understanding in background noise. |
| • | Automatic feedback suppression algorithms that minimize, and sometimes eliminate, the annoying acoustic squeal of a hearing aid in feedback. |
5
Our Technology
Our hearing aid technology strategy is to combine a number of distinct technologies, supported by 44 patents and patent applications in process to date, to produce premium performing digital hearing aids. We seek to protect our intellectual property through patents, licenses, trade secrets and nondisclosure agreements. We hold 33 U.S. patents, and have exclusive rights to three additional patents including licenses for hearing aid and hearing protection applications under two patents held by Brigham Young University (“BYU”). We have eight U.S. patent applications pending. We seek foreign patent protection for our more significant patents in our more significant markets. At the core of our technology are commercial and proprietary DSP platforms containing patented algorithms that are based on what we believe is an advanced understanding of human hearing. These algorithms process the incoming sound and present it to the impaired cochlea in a way that helps restore natural loudness perception and preserves the cues necessary for speech understanding.
Our Products
We have packaged our proprietary technologies into a broad line of digital hearing aids that we believe offer superior sound quality, smaller size, enhanced personalization and increased reliability at competitive prices. All of our products incorporate our proprietary sound processing and are programmable to address the hearing loss of the individual user. We currently sell our hearing aid products both as completed hearing aids and as hearing aid kits, or faceplates, to others who then market finished hearing aids generally under our brand names.
Otix launched Touch, our first receiver-in-the-canal (“RIC”) product family, in March 2009. RIC has become a very popular product type, representing approximately 35% of hearing aids sold in the United States. In addition to its sophisticated design, very small size and ease of use features, we believe Touch is the smallest and has the best moisture resistance of any RIC product on the market. Our Touch products incorporate many of the sound processing technologies present in our Velocity series of hearing solutions. Touch provides natural sound quality, superior noise-reduction, and excellent directionality, driven by our unique DIRECTIONALfocus® technology. Touch is offered at three price points and available in a choice of five base colors and 15 accent color clips. The three Touch products are readily identified by the number of processing channels. Touch 6 has six channels and two programs, Touch 12 has 12 channels and three programs, and Touch 24 has 24 channels, four programs and voice alerts.
In 2008, Otix launched four new products specifically designed to provide competitive features and additional price options for our customers. Velocity 24, our premium product, combines a superior set of algorithms to provide the consumer with hands-free operation in a variety of listening environments. Our new advanced-level product, Velocity 12, offers many sophisticated features, such as automatic and adaptive directionality, data logging, and auto telephone. With Velocity 6, we have added a highly competitive mid-level product line. Velocity 4, our newest entry-level offering, makes our patented and proven noise-reduction available at a price-point that is particularly attractive to cost-sensitive consumers. All Velocity products are available in a full line of custom models and feature a robust standard BTE that can accommodate a severe hearing loss. Velocity 24, Velocity 12, and Velocity 6 also offer a miniBTE model that provides both open-fit and standard fittings, a powerful fitting range and extendable functionality such as Bluetooth and direct audio import support.
Also in 2008, we added a new product offering in the microBTE class, ion 400. This style of BTE is very small (about 20 mm long, 7 mm wide and 9 mm high) and is nearly invisible behind the ear. Our Velocity and ion products are among the smallest custom and behind-the-ear products available today. Because our microBTEs are designed to be used with either a thin tube and open dome or a more conventional tubing and earmold configuration, they offer increased fitting flexibility. When paired with the thin tube and open dome, these products practically eliminate the dissatisfying affect of occlusion.
Our Balance, Applause, and Natura Pro product lines incorporate our third generation of DSP, a 16-channel, WDRC system that provides robust sound processing, exceptional noise-reduction, and feedback cancellation. All of these products offer directional technology to help minimize the presence of background noise. Balance and Applause also offer DIRECTIONALfocus, an adaptive directional system unique to Otix.
Our Natura 2SE product line incorporates our second generation of DSP. These hearing aids provide advanced sound processing through our patented digital-signal-processing, speech-weighted expansion, proprietary noise-reduction technology, and fixed directionality.
With the exception of our ion and Touch brand products, all of our hearing aids can be purchased in the six common models for hearing aids: BTE; ITE; HS; ITC; MC and CIC. We offer features such as the latest in advanced DSP algorithms and include: automatic noise-reduction, automatic directionality, adaptive directionality, feedback management, and our EXPRESSfit® programming system. These features are described in more detail below.
• Automatic Noise-reduction
Our automatic noise-reduction system actively seeks out steady-state background noise and adds the ability to adapt the amount of noise-reduction based on the input level of the noise. Many competitive noise-reduction algorithms only allow for a fixed
6
configuration that may or may not have optional levels for varying degrees of noise. This leaves hearing aid users challenged to locate the correct setting when their listening environment suddenly changes. In contrast, automatic noise-reduction removes the guesswork for the hearing aid user by automatically adjusting the amount of noise-reduction applied based on the level of the noise detected. No switches or adjustments are required.
• Automatic Directionality
Automatic directionality uses changes in the listener’s environment to seamlessly transition the directional response. In quiet, the directional response is “relaxed” to allow sounds from all directions to enter the hearing aid. In noisy situations, automatic directionality determines the location of the primary noise source and adapts the directional response to best reduce the sound coming from that direction.
• Adaptive Directionality
DIRECTIONALfocus is an adaptive directional technology that offers a unique directional approach through a focused, adaptive gain manipulation based on the direction of sound. Sounds in front of the listener are considered to be desirable; sounds originating from the sides and back of the listener are considered to be background noise and are therefore attenuated. The DIRECTIONALfocus system varies the amount of attenuation based on the location of the sound, with more attenuation applied as the sound moves out of focus.
• Feedback Management
Phase cancellation is the latest feedback management technology and is designed to remove feedback before it becomes audible. The Touch, Velocity, Balance, and ion product families offer both static phase-cancellation, as well as adaptive phase-cancellation, which eliminates transient feedback associated with changes in the feedback path. The result is squeal-free operation for the hearing aid user without having to sacrifice gain or amplification. Also available is an automatic gain adjuster which searches for feedback in each of the hearing aid’s channels and adjusts the gain automatically and appropriately so that feedback is removed. In addition, our feedback management technology can be engaged by the hearing aid user via the push button on the hearing aid, allowing the user to “train” the feedback canceller should feedback occur.
• EXPRESSfit
In order to ensure that our advanced digital hearing aids are properly programmed to the individual needs of the hearing aid wearer, we have developed a proprietary programming system, EXPRESSfit, which runs on standard personal computers and enables our hearing aids to be easily configured by the hearing care professional to the unique needs of each wearer.
Improving Speech Understanding in Noise
The primary enhancement sought by hearing aid wearers is improved speech understanding in noise. Our products have been clinically proven to enhance speech understanding in the presence of noise, offering hearing aid wearers a solution to the problem that challenges them the most. Clinically proven outcomes demonstrate that our Touch, Velocity, ion, Balance, Applause and Natura 2 products improve speech understanding in noise where speech and noise originate from the same source in front of the user, which is one of the most adverse conditions faced by the hearing aid wearer. We are able to defeat this frustration through our superior noise-reduction algorithm and our automatic and adaptive directional microphone system, as well as our feedback management.
Manufacturing
Our principal manufacturing facility is in Eagan, Minnesota (near Minneapolis), with smaller manufacturing facilities in Montreal, Canada, and Parkside, South Australia (near Adelaide). Our principal manufacturing facility was established in Eagan because the presence of many major medical device companies, including hearing aid manufacturers, has created a skilled labor pool in that area. Our manufacturing operations consist of the following activities:
| • | overseeing the production of the components of our DSP platforms used in our products; |
| • | assembling and testing electronic subsystems and non-custom hearing aid products; |
| • | fabricating custom hearing aid shells; |
| • | integrating the electronic components into the hearing aid shells; |
| • | testing and calibrating finished hearing aids; and |
| • | repairing and servicing our products. |
7
We assemble our custom products according to specifications received from hearing care professionals. We produce custom hearing aids from an impression of the wearer’s ear canal and programming requirements of the hearing aid which we receive from the hearing care professional, from which we produce a custom hearing aid. Our BTE products are assembled using a standard plastic housing and are not custom-molded for a wearer’s ear because they are placed on the back of the ear. We use our Eagan, Minnesota facility for limited manufacturing of BTE products. Once ready for full production, they are generally outsourced to a contract manufacturer.
Our three proprietary DSP chips are each manufactured by separate suppliers. Our relationship with these suppliers is critical to our business because proprietary DSP chips are integral to our products and only a small number of suppliers would be able or willing to produce our chips in the relatively small quantities and with the exacting specifications that we require. Additionally, the receivers and microphones used in all our products are available from only two suppliers. Therefore, should these manufacturers be unable to provide such components, our ability to produce its products would be materially impaired. We also rely on a limited number of contractors for certain development projects and assembly operations and are, therefore, subject to their performance, over which we have little control.
Product Returns, Remakes and Repairs
The hearing aid industry experiences high levels of product returns, remakes and repairs due to factors such as statutorily required liberal return policies and product performance that is inconsistent with hearing impaired consumers’ expectations. Our actual sales returns were $8,194, or 8.6% of sales in 2009, $11,118, or 8.9% of sales in 2008, and $14,958, or 12.6% of sales in 2007. The decrease in the sales returns in 2009 was driven by lower unit volumes and a higher mix of retail sales, as retail return rates are lower than wholesale return rates. Our actual warranty (remake and repair) costs were $3,831 in 2009, $5,028 in 2008, and $5,600 in 2007. Lower processed warranty costs in 2009 were driven primarily by lower unit volumes and improved product quality, partially offset by higher repair costs.
Restructuring
During 2009, we took actions to improve profitability by 1) reducing the total number of employees in North America; 2) closing three U.S. retail locations resulting in a restructuring charge of $98 and goodwill and definite-lived intangible write-off of $135; and 3) reducing headcount and selling two retail shops in Europe. The total restructuring charge from these actions was $769, which included $158 in sale proceeds from the two European shops.
During 2008 we restructured and eliminated certain operations in Europe with the goal of streamlining processes, eliminating non-performing business units, and focusing on profitable opportunities. As a result, we outsourced one Europe division’s sales and administration functions, closed another European office, discontinued an unprofitable domiciliary European business, and sold retail stores in one European country that did not fit into our long-term strategy. The surviving portion of these operations had lower sales in 2009, but was profitable. The 2008 goodwill impairments resulted from the decision to cease operations in one European country and write-off the associated goodwill of $690; and the decision to sell operations in another European country where the pending sales offer did not support the goodwill balance and we recorded an estimated impairment loss of $1,119. The sale agreement was finalized and the transaction closed during the third quarter 2008, resulting in a loss on sale of $85, which included a goodwill write-off of $455. We also recorded a $352 charge to expense a trade name in one of our affected European countries based on a decision in the second quarter 2008 to cease using the trade name. The operations subject to these intangible write-offs have been classified as discontinued operations in our Consolidated Statements of Operations for the years ended December 31, 2009, 2008, and 2007.
Sales and Marketing
Hearing aids have traditionally been dispensed (sold to the consumer) by hearing care professionals (audiologists and hearing instrument specialists) who are often referred to as hearing aid retailers or dispensers. Due to the hearing care professional’s influence over a consumer’s choice of a hearing aid brand, we believe that developing and maintaining strong relationships with hearing care professionals is a critical aspect of our sales and marketing strategy. As a result, we aim to deliver superior customer service and sales support to hearing care professionals.
In the U.S., we sell directly to the hearing impaired consumer through a chain of clinics and to the hearing care professional. There are more than 12,000 hearing care professionals in the U.S., of which over 8,000 sell hearing aids. Our direct sales force targets select hearing care professionals who are capable of and interested in dispensing advanced digital hearing aids. In addition to our direct sales force, we have trainers. We also make limited use of contract trainers, who both influence and train hearing care professionals in order to differentiate our products and to ensure proficiency with our hearing aid programming and fitting system. We advertise our products to hearing care professionals through major events, local training programs, promotional materials, trade publications and conventions. Our sales force is responsible for implementing loyalty and cooperative advertising programs with specific customers to generate demand for our products.
In Canada, Austria and the Netherlands, we sell to hearing aid retailers. In Australia, we principally sell directly to the hearing impaired consumer through retail clinics and on a wholesale basis to other hearing aid retailers to a limited extent. In
8
Germany, we principally sell directly to the hearing impaired consumer and the insurance companies pay the Ear-nose-throat (“ENT”) doctor to perform the hearing aid fitting on the consumer. Elsewhere in the world, we principally sell through established distributors, who in turn sell to hearing care professionals.
To further our marketing efforts, we use advertising, public relations and market research agencies. These agencies work in tandem with our internal marketing team to communicate the advantages of our brands to our customers.
Customers
We sell our hearing aid products principally to hearing care professionals or directly to hearing impaired consumers. We also sell our hearing aids to distributors. In many developed countries outside the U.S., there are varying degrees of public reimbursement for the purchase of hearing aids. While such reimbursement likely results in more hearing aids being sold, it also results in hearing impaired consumers buying lower priced hearing aids that are covered by reimbursement.
Our customers are not generally contractually obligated to purchase any fixed quantities of products, and they may stop placing orders with us at any time. We may be unable to retain our current customers, and we may be unable to recruit replacement or additional customers. We are selling hearing aids to a number of retail chains that have a large number of owned or franchised locations and buying groups that have a large number of locations under contract. We are subject to the risk of losing these customers, incurring significant reductions in sales to these customers, reducing prices in response to demands from these customers or incurring substantial marketing expenses in order to maintain their business. In addition, we are subject to the risk of being unable to collect receivable balances from these customers. For 2009, 2008 and 2007, the Australian Government’s Office of Hearing Services, a division of the Department of Health and Aging, accounted for approximately 16%, 12% and 12% of our total net sales, respectively. No other customer accounted for 10% or more of consolidated net sales.
Our net sales from continuing operations in 2009 of $95,814 by operating segment were as follows: North America—$33,687; Europe—$34,343; and Rest-of-World—$27,784.
Research and Development
We continue to work on both product improvements and new product development, and we expect to continue both activities in the future. We intend to use product improvements and new product development to enhance our competitive position in the market. Research and development includes auditory research, clinical testing, program management and engineering, software engineering, mechanical engineering, DSP engineering, and materials science. Outside contractors are used for some product or technology development activities. We will be utilizing additional third-parties in the future to improve the efficiency and effectiveness of our research and development expenditures.
Research and development expense was $6,487 in 2009, $8,266 in 2008 and $8,547 in 2007.
Competition
We encounter aggressive competition from a number of hearing aid competitors worldwide. We compete principally with six larger companies—Siemens GmbH, Starkey Laboratories, Inc., Widex A/S, William Demant Holdings A/S, Sonova Holding AG (formerly Phonak Holding AG), and Great Nordic A/S (GN Resound) —all of which have greater financial, sales, marketing, manufacturing and development resources than we currently possess. Competition is intense and new product offerings by our competitors are coming to market more quickly than in the past. We may not be able to compete effectively with these companies. The number of hearing aid companies who have a manufacturing and marketing presence in the hearing aid industry is approximately one-half of what it was in 1990. Consolidation in the hearing aid industry has occurred at the wholesale and retail levels in the past number of years, as evidenced by the acquisitions of Interton, Beltone, Dahlberg/Miracle Ear, Philips, Unitron and Sonus, and further consolidation could produce stronger competitors.
The digital segment of the hearing aid industry is characterized by increasing competition and new product introductions. The proliferation of digital hearing aids has lead to intense marketing campaigns as each company tries to differentiate its products and services from the others. We compete on the basis of sound quality, features, patient benefit, cosmetics, quality, ease of the fitting and programming system, marketing and sales support, customer service, and education and training. We believe we can currently compete effectively on each of these factors, but if we fail to compete effectively, our net sales and operating results could suffer.
Patents, Licenses and Trade Secrets
Our hearing aid technology strategy is to combine a number of distinct technologies, supported by 44 patents and patent applications in process to date, to produce premium performing digital hearing aids. We seek to protect our intellectual property through patents, licenses, trade secrets and nondisclosure agreements. We hold 33 U.S. patents, and have exclusive rights to three additional patents including licenses for hearing aid and hearing protection applications under two patents held by Brigham Young University (“BYU”). We have eight U.S. patent applications pending.
9
Under one of our license agreements with BYU, we have an exclusive worldwide license to utilize certain patents and patents pending involving hearing aid signal processing, audio signal processing and hearing compression, including the fundamental sound processing algorithm incorporated into our DSP platform. This agreement expires in 2013 or the expiration of the last claim of the patents. Under another license agreement with BYU, we have the perpetual right to use specified noise-suppression technologies owned by BYU. We have exclusive worldwide rights to use these technologies in hearing aid and hearing protection applications and a nonexclusive right to use them for other applications.
In addition to the above, we have the following licensing arrangements:
| • | A fully paid license agreement with a Danish partnership that owns approximately 200 patents considered essential for the sale of programmable hearing aids. |
| • | A license agreement that provides us with an exclusive worldwide right to utilize patents involving directional signal processing. |
| • | A license agreement that provides us with the thin-tube technology for our open-fit products. |
| • | A license agreement covering aspects of our programming system. |
| • | A license agreement covering aspects of hydrophobic coating technology. |
| • | A license agreement to allow for a delay in the activation of the hearing aid after it is powered on. |
| • | A license agreement to utilize technology incorporated in our Touch product line. |
Our success depends in large part on our proprietary technology. We rely on a combination of patents, copyrights, trademarks, trade secrets, confidentiality procedures and licensing arrangements to establish and protect our proprietary technology. If we fail to successfully enforce our intellectual property rights, our competitive position will suffer. We also rely on trade-secret information, technical know-how and innovation to expand our proprietary position. We maintain a policy of requiring our employees and consultants to execute non-disclosure and assignment of inventions agreements upon commencement of their employment or engagement.
We may be required to spend significant resources to monitor and police our intellectual property rights. We may not be able to detect infringement and may lose our competitive position in the market before we do so. In addition, competitors may design around our proprietary technology or develop competing technologies. Intellectual property rights may also be unavailable or limited in some foreign countries. Our pending patent and trademark registration applications may not be allowed or competitors may challenge the validity or scope of these registrations. In addition, our patents may not provide us with a significant competitive advantage.
Government Regulation
Our products are subject to regulation in the U.S. by the Food and Drug Administration (“FDA”), which may hamper the timing of our product introductions or subject us to costly penalties in the event we fail to comply. Generally, medical devices must receive pre-market clearance from the FDA through a 510(k) submission, a Pre-Market Approval (“PMA”), or be an exempt product. Our hearing aid products are exempt from the 510(k) and PMA requirements. We must comply with facility registration and product listing requirements of the FDA and adhere to its Quality System Regulations (“QSR”). If we or any third-party contract manufacturers of our products do not conform to the QSR, we will be required to find alternative manufacturers that do conform, which could be a long and costly process. Noncompliance with applicable FDA requirements can result in fines, injunctions, civil penalties, recall or seizure of products, total or partial suspension of production or criminal prosecution.
Sales of our products outside the U.S. are subject to foreign regulatory requirements that vary widely from country to country. The time required to obtain approvals required by other countries may negatively affect our ability to sell products in those countries. In order to market our products in the member countries of the European Economic Area (“EEA”), we are required to obtain the CE Mark certification, which we have accomplished for our hearing aid products by meeting the requirements of the Medical Device Directive 93/42/EEC and ISO 13485. Any failure to maintain our ISO 13485 certification or CE Mark for our hearing aid products could significantly reduce our net sales and operating results.
We must also maintain compliance with federal, state and foreign laws regarding sales incentives, techniques, referrals and other programs.
Employees
As of December 31, 2009, we had 541 employees: 292 employees in North America; 81 employees in Europe; and 168 employees in Rest-of-World. The majority of employees outside the U.S. are in operations, sales and marketing. None of our employees is represented by a labor union. We have never experienced any work stoppages and we consider relations with our employees to be good.
10
Executive Officers of the Registrant
The following table sets forth our officers and their ages as of December 31, 2009:
| Name |
Age | Position | ||
| Samuel L. Westover | 54 | Chairman and Chief Executive Officer | ||
| Paul R. Wennerholm | 43 | President and Chief Operating Officer | ||
| Jerry L. DaBell | 63 | Vice President Research and Development | ||
| Dale Fayerweather | 48 | Vice President Information Systems and Technology | ||
| Michael M. Halloran | 49 | Vice President and Chief Financial Officer | ||
| Scott O. Lindeman | 45 | Vice President and Corporate Controller | ||
| Christie R. Mitchell | 50 | Vice President Worldwide Manufacturing Operations | ||
| Michael Nilsson | 47 | Vice President Auditory Research | ||
| Brent H. Shimada | 49 | Vice President Administration and General Counsel | ||
| Kathy Schofield-Landon | 36 | Vice President Marketing | ||
| David R. Whittle | 60 | Vice President Worldwide Quality |
Samuel L. Westover joined Otix Global, Inc. as President and Chief Executive Officer in October 2005 and was appointed Chairman and CEO in May 2008. He has been a director since January 2002 and served as Chairman of the Audit Committee and a member of the Compensation and Governance and Nominating Committees until his appointment as President and CEO. From 2002 to 2004, Mr. Westover was President and CEO of CIGNA Dental and President of CIGNA HealthCare’s Small Business Segment. Mr. Westover was also CEO of two public companies and was the founding Chief Financial Officer of Wellpoint. In connection with the Salt Lake City 2002 Winter Olympics, Mr. Westover was Special Assistant to the Governor of Utah, and established an independent economic development task force. He also received a gubernatorial appointment to serve as Chairman of the Public Education Job Enhancement Committee, providing scholarships and financial assistance to facilitate advanced education of high school teachers in math and sciences. Mr. Westover received the Los Angeles, California Entrepreneur of the Year award in 2000 from Ernst & Young, CNN, Nasdaq and USA Today. In March 2008, he was named CEO of the Year in Utah Business Magazine. He is a director on the board of Galorath, a private company. Mr. Westover earned a bachelor’s degree in accounting from Brigham Young University.
Paul R. Wennerholm joined Otix Global, Inc. as President and Chief Operating Officer in August 2008. Prior to joining Otix Global, he spent 14 years with Patterson Companies, Inc., a $3 plus billion dental and rehabilitative health supply company with operations around the world. During his years with Patterson, Mr. Wennerholm earned the distinction of becoming the youngest-ever executive/division manager in the company’s 130-year history. At Patterson, he held a variety of positions of increasing responsibility beginning as a technology specialist and sales and marketing executive (from 1994 to 1996) followed by promotions to equipment manager (from 1996 to 1999), division manager in Salt Lake City (from 1999 to 2004) and most recently led one of Patterson’s most successful divisions in New England (from 2004 to 2008). From 1992 to 1994, he was the Western regional sales manager for PPI Group, a $3.8 million provider of software for medical and dental practices nationwide. Mr. Wennerholm received a B.A. degree in political science with minors in economics and Spanish from Brigham Young University in 1992.
Jerry L. DaBell joined Otix Global, Inc. in July 2000 as Vice President of Business Development and became Vice President of Research and Development in July 2005. He was Senior Vice President of Business Development of IMP, Inc., a semiconductor manufacturer, where he was employed from 1988 to 2000. He earned a bachelor’s degree and a master’s degree in electrical engineering from Brigham Young University.
Dale Fayerweather joined Otix Global, Inc. in February 2008 as Vice President of Information Systems and Technology. From 1996 to 2007, Mr. Fayerweather was Sr. Director of IT Solutions Development at Nu Skin Enterprises, a leading direct-selling company that distributes premium quality personal care and dietary supplement products. From 1985 to 1996, he was an Advanced Technology Specialist for 3M, a diversified manufacturing and technology company. Mr. Fayerweather earned a Bachelor’s Degree in Mathematics from Winona State University in Minnesota.
Michael M. Halloran joined Otix Global, Inc. in April 1999 as Corporate Controller, was promoted to Vice President in December 2002 and subsequently to Chief Financial Officer in July 2006. Mr. Halloran began his career at Ernst & Young, where he worked from 1985 to 1994, rising to Senior Audit Manager. From 1994 to 1999, he held various senior positions at C.R. Bard, a large medical device company, based in New Jersey. Mr. Halloran has earned a Certified Public Accountant licensure and a bachelor’s degree in Business Administration, with a concentration in Accounting, from State University of New York at Oswego.
Scott O. Lindeman joined Otix Global, Inc. in September 2006 as Vice President and Corporate Controller. Mr. Lindeman was previously with SIRVA, Inc., a global relocation services provider, where he served as a Director of Accounting from 2002 to 2006. From 1999 to 2002, Mr. Lindeman worked for Global Crossing LTD, as Director of U.S. Accounting Operations. He was previously employed by KPMG LLP for nine years, rising to Senior Audit Manager. He earned his MBA from the University of Rochester, a bachelor’s degree in accounting from Brigham Young University, and has earned a Certified Public Accountant licensure.
11
Christie R. Mitchell joined Otix Global, Inc. in 2000 as Materials Manager and became Director of Material Logistics in 2003 and Vice President of Worldwide Manufacturing Operations in December 2005. From 1981 to 2000, she held various positions in the procurement and materials management organization of the Baker Hughes Company, a provider of oil and gas drilling products.
Michael Nilsson joined Otix Global, Inc. in May of 1998 as a Researcher and became Director of the Center for Amplification and Hearing Research in January 2006, and then Vice President, Auditory Research in July 2008. He was a Researcher at the Hearing Aid Research lab at the House Ear Institute, Los Angeles, where he was employed from 1990 to 1998. He earned a bachelor’s degree, master’s degree, and Ph.D. in Cognitive Science from the University of California.
Brent H. Shimada joined Otix Global, Inc. in October 2004 as Vice President of Human Resources and Administration and was promoted to Vice President of Administration and General Counsel in October 2005. From May 1999 to October 2004, he was Human Resources Director for American Express’ Global Travelers Cheque Operations Group. Mr. Shimada served as Senior Corporate Counsel of American Stores Company a grocery and drug retail conglomerate from 1996 to 1999. He was Legal Counsel for Alliant Techsystems, Inc. (formerly Hercules Incorporated), a government contractor, from 1985 to 1996. Mr. Shimada earned a bachelor’s degree in finance, an MBA and a Juris Doctor degree from the University of Utah.
Kathy Schofield-Landon joined Otix Global, Inc. in 2000. Prior to being promoted to Vice President of Marketing in May 2009, she held various positions of increasing responsibility within the company, most recently having been Director of Products and Marketing. During her tenure with Otix Global, Inc., Ms. Schofield-Landon has been integral to the company’s software and hardware product development efforts, and has most recently spearheaded Otix’s new marketing strategies and initiatives. Before joining the Company, Ms. Schofield-Landon held a number of software and product development positions, having come to the Company from Network Multimedia, Inc., a spin-off company of Novell, Inc.
David R. Whittle joined Otix Global, Inc. in October 2007 as Vice President of Worldwide Quality. Prior to joining Otix, he was Vice President, General Manager of DEI Systems, Inc., a fiberglass, odor control manufacturing company, supplying products and systems to Water/Wastewater Municipal and Industrial markets. From 2002 to 2005, he was Plant Manager at Bosch Packaging. From 1982 to 2000, he held numerous senior management positions including Director of Worldwide Quality, and Director of Operations for Baker Hughes Company, a provider of oil and gas drilling products. Mr. Whittle earned a bachelor’s degree in Manufacturing Engineering from Weber State University and is an ASQC Certified Quality Auditor.
Officers are elected by the board of directors. There are no family relationships among any of our directors or officers.
Availability of SEC Reports
We maintain an internet website at www.otixglobal.com, where we make available our annual reports on Form 10-K, quarterly reports on Form 10-Q, current reports on Form 8-K, and amendments to those reports, each of which is filed or furnished pursuant to Section 13 or 15(d) of the Securities Exchange Act of 1934, as amended, as soon as reasonably practicable after such reports are electronically filed with, or furnished to, the SEC. The information contained on our website is not incorporated by reference in this Form 10-K and should not be considered a part of this report.
| ITEM 1-A. | RISK FACTORS |
Our future results, plans, objectives, expectations and intentions could be negatively affected by any of the following “risk factors.” Investors should understand that it is not possible to predict or identify all such factors, and we are under no obligation to update these factors. Investors should not consider the factors listed as a complete statement of all potential risks and uncertainties.
Deterioration of economic conditions could harm our business.
Current uncertainty in global economic conditions poses a risk to our business as consumers may defer discretionary purchases, such as our products, in response to tighter credit and negative financial news, which could negatively affect demand for and sales of our products. Weak economic conditions in our target markets, high unemployment, or a reduction in healthcare spending, even if economic conditions improve, would likely adversely impact our business, operating results, and financial condition in a number of ways, including longer sales cycles, lower prices for our products, and reduced sales.
We have a history of losses and negative cash flow.
We have a history of losses and negative cash flow and a significant accumulated deficit and have yet to become consistently profitable. We may incur net losses and negative cash flow in the future. Whether or not we achieve consistent profitability will depend in significant part on increasing our net sales, maintaining or improving our gross margin and maintaining or limiting increases in our operating expenses. Consequently, it is possible that we will not achieve consistent profitability on a quarterly or annual basis in the future.
12
We face aggressive competition in our business, and if we do not compete effectively our net sales and operating results will suffer.
We encounter aggressive competition from a number of competitors worldwide, six of which have far greater sales and more extensive financial and business resources than we have. We may not choose to, or be able to, match the type or the volume of incentives that our competitors provide to hearing aid retailers, which could put us at a competitive disadvantage. In addition, some competitors have purchased or established their own network of owned or franchised retail hearing aid operations or are adding to those networks, which could cause us to lose existing customers and make it difficult to recruit new customers. Competition is intense and new product offerings by our competitors are coming to market more quickly than in the past. If we fail to compete effectively, our net sales and operating results will suffer.
Our financial results may fluctuate significantly, which may cause our stock price to decline.
Our financial results have fluctuated significantly in the past and may fluctuate significantly in the future. These fluctuations could cause our stock price to vary considerably. Factors that may cause fluctuations in our operating results include the following: general economic conditions; hearing aid market conditions; the competitive performance of our products; delays or problems completing or introducing new products; expenses associated with increasing our sales, marketing or distribution capabilities; difficulties in integrating and managing acquired operations that could result in poor performance, additional expenses or write-downs of acquired intangible assets; changes in government healthcare systems, changes in reimbursement methodologies and reductions in reimbursement levels for hearing aids or diagnostic hearing testing; competitive pressures resulting in lower selling prices or significant promotional costs; difficulties in relationships with our customers, particularly large buying groups; demand for and market acceptance of our products, particularly new products where eventual market acceptance may not follow early indications; reductions in orders from larger customers or buying groups; high levels of returns, remakes and repairs; changes in our product or customer mix; changes in or additional regulatory requirements; difficulties in managing international operations; foreign currency fluctuations; the effect of past and future acquisitions; the effect of international conflicts and threats; inability to forecast revenue accurately; nonpayment of receivables; the announcement or introduction of new products or services by our competitors; manufacturing problems; component availability and pricing; unanticipated adverse decisions related to legal proceedings, claims and litigation; and other business factors beyond our control.
If net sales for a particular period were below our expectations, it is highly unlikely that we could proportionately reduce our operating expenses for that period. Therefore, any revenue shortfall would have a disproportionately negative effect on our operating results for the period. You should not rely on our results for any one quarter as an indication of our future performance. In future quarters, our operating results may be below the expectations of public market analysts or investors. If this occurs, our stock price would very likely decrease.
We recently received a letter from The Nasdaq Stock Market notifying us that the bid price for our common stock had closed below the minimum $1.00 per share listing requirement. If this continues in the future, our common stock could be subject to delisting by the Nasdaq Global Market.
On October 6, 2009, we received a letter from The Nasdaq Stock Market notifying us that for the last 30 consecutive business days the bid price of our common stock had closed below the minimum $1.00 per share requirement for continued inclusion under Listing Rule 5450(a)(1). The letter stated that Nasdaq will provide us a grace period of 180 calendar days, or until April 5, 2010, to regain compliance. To regain compliance, any time before April 5, 2010, the bid price of our common stock must close at $1.00 per share or more for a minimum of 10 consecutive business days. If we do not regain compliance with Rule 5450(a)(1) by April 5, 2010, we will be eligible for an additional 180 calendar day compliance period if we meet The Nasdaq Capital Market initial listing criteria except for the bid price requirement. To avail ourselves of this alternative, we would need to submit an application to transfer our securities to The Nasdaq Capital Market. If we are not eligible for an additional compliance period, Nasdaq will provide us with written notification that our common stock will be delisted. At that time, we may appeal Nasdaq’s determination to delist our common stock to the Listings Qualifications Panel. At our May 2009 annual shareholder meeting, our shareholders approved a one-for-five reverse stock split, which has yet to be implemented. We may implement this reverse stock split should we determine that such action is necessary.
If we were to be delisted from the Nasdaq Global Market and move to an alternative market, which may be less efficient and less broad-based, we may have difficulty accessing capital markets for additional funding, and our shareholders may experience reduced liquidity. Accordingly, the value of our common stock could decrease. There is no guarantee that an active trading market for our common stock will be maintained on the Nasdaq Global Market. If trading in our common stock is not active, shareholders may not be able to sell their shares of our common stock quickly, at the market price, or at all. Delisting could also have other negative results, including the potential loss of confidence by employees and customers, the loss of institutional investor interest, and fewer business development opportunities.
In March 2010, we announced the intent to implement the one-for-five reverse stock split but we cannot anticipate the impact of the reverse stock split on our stock price or our ability to regain compliance with the Nasdaq minimum bid requirements for continued listing.
13
We have made a number of acquisitions and could make additional acquisitions, which could be difficult to integrate, disrupt our existing business, dilute the equity of our shareholders and harm our operating results.
We may not be able to meet performance expectations for, or successfully integrate, businesses we have acquired or may acquire on a timely basis or at all. Acquisitions involve risks, including the inability to successfully integrate acquired businesses or to realize anticipated synergies, economies of scale or other expected value; difficulties in managing and coordinating operations at new locations; the loss or termination of key employees of acquired businesses; the loss of key customers of acquired businesses; diversion of management’s attention from other business concerns; risks of entering businesses and markets in which we have no direct or limited prior experience and risk of upsetting current customers through acquisitions. Acquisitions may result in the utilization of cash, dilutive issuances of equity securities and the incurrence of debt, any of which would weaken our financial position. In addition, acquisitions may result in the creation of certain definite-lived intangible assets that increase amortization expense, goodwill and other indefinite-lived intangible assets that subsequently may result in large write-downs should these assets become impaired and contingent consideration or other payments that may need to be expensed rather than recorded as additional goodwill.
If we fail to maintain an effective system of internal controls, we may not be able to accurately report our financial results or prevent fraud. As a result, current and potential stockholders could lose confidence in our financial reporting, which could harm our business and the trading price of our common stock.
Effective internal controls are necessary for us to provide reliable financial reports and effectively prevent fraud. We have in the past discovered, and may in the future discover, areas of our internal controls that need improvement. Although we have implemented enhanced procedures to properly prepare our financial statements, we cannot be certain that these measures will ensure that we will maintain adequate controls over our financial processes and reporting in the future. In addition, Section 404 of the Sarbanes-Oxley Act of 2002 requires us to evaluate and report on our internal controls over financial reporting and have our independent registered public accounting firm issue an opinion on our internal control over financial reporting. We prepared for compliance with Section 404 by strengthening, assessing and testing our system of internal controls to provide the basis for our report. However, the continuous process of strengthening our internal controls and complying with Section 404 is expensive and time consuming and requires significant management attention. We cannot be certain that these measures will ensure that we will maintain adequate controls over our financial processes and reporting in the future. Failure to implement required new or improved controls, or difficulties encountered in their implementation, could harm our operating results or cause us to fail to meet our reporting obligations. If we or our auditors discover a material weakness, the disclosure of that fact, even if quickly remedied, could reduce the market’s confidence in our financial statements and harm our stock price. In addition, future non-compliance with Section 404 could subject us to a variety of administrative sanctions, including the suspension or delisting of our common stock from the Nasdaq Global Market and the inability of registered broker-dealers to make a market in our common stock, which would further reduce our stock price.
The loss of any large customer or a reduction in orders from any large customer or buying groups could reduce our net sales and harm our operating results.
We anticipate that our operating results in any given period will depend in part upon revenues from a number of larger customers, including buying groups. Our customers and buying groups are not contractually obligated to purchase any fixed quantities of products, and they may stop placing orders with us at any time. We may be unable to retain our current customers, and we may be unable to recruit replacement or additional customers or buying groups. We are selling hearing aids to a number of retail chains that have a large number of owned or franchised locations and buying groups that have a large number of locations under contract. We are subject to the risk of losing large customers and buying groups, incurring significant reductions in sales to these customers and buying groups, reducing prices in response to demands from these customers and buying groups or incurring substantial marketing expenses in order to maintain their business. As an example, during late 2008, a buying group in our North America wholesale division added two other manufacturers to its line-up of products offered to its members. This buying group was 11.8% of North America sales in 2008 and carried a gross margin of approximately 30%.
In addition, we are subject to the risk of being unable to collect receivable balances from these customers.
We rely on several suppliers and contractors, and our business will be seriously harmed if these suppliers and contractors are not able to meet our requirements.
Certain critical components used in our products are currently available only from a single or limited number of suppliers. For example, each of our three proprietary digital-signal-processing chips is manufactured by a single separate supplier. These suppliers may not be willing or able to satisfy our requirements. We also rely on a limited number of contractors for certain hearing aid component assemblies and advanced integrated circuitry development and are therefore subject to their performance, over which we have little control. We may lose the services of these key suppliers or contractors. Finding a substitute part, process, supplier or contractor may be expensive and time-consuming, or may prove impossible in the near-term.
14
We have high levels of product returns, remakes and repairs, and our net sales and operating results will be lower if these levels increase.
We generally offer a 60 day return policy for wholesale and 30 days for retail hearing aid sales, and various warranties on our hearing aids. In general, the hearing aid industry has high levels of returns, remakes and repairs, and we believe our level of returns, remakes and repairs is comparable to that of the industry. We may not be able to attain lower levels of returns, remakes and repairs and, in fact, these levels may increase, which could reduce our net sales and operating results.
If we fail to develop new and innovative products, our competitive position will suffer, and if our new products are not well accepted, our net sales and operating results will suffer.
In order to be successful, we must develop new products. Technological innovation is expensive and unpredictable and among other things, requires hiring (i) expert personnel who are difficult to find and attract, or (ii) external contractors to perform complex tasks. Without the timely introduction of new products, our existing products are likely to become technologically obsolete over time, which would harm our business. We may not have the technical capabilities or expertise necessary to develop further technologically innovative products. In addition, any enhancements to, or new generations of, our products, even if successfully developed, may not generate significant revenues. Moreover, if we are unable to continue to introduce new products on a periodic basis, the overall average selling price of our products may decline, negatively impacting our gross margin and operating results. Our products may be rendered obsolete by changing consumer preferences or the introduction of products embodying new technologies or features by us or our competitors. Obsolescence of our products, a “breakthrough” new method of addressing hearing loss or the introduction of technologically superior products by new or existing competitors could cause us a rapid loss of sales or market share, which would have a significant adverse effect on our net sales, operating results and stock price.
Because of the complexity of our products, there may be undiscovered errors or defects that could harm our business or reputation.
Our products are complex and may contain undetected defects, errors or failures. Our customers may discover defects and errors after products have been introduced and sold. The occurrence of any defects, errors or failures could result in the loss of or delay in market acceptance of our products, or increased product returns and warranty expenses, any of which could harm our reputation and business and adversely affect our net sales and operating results.
If we are subject to litigation and infringement claims, they could be costly and disrupt our business.
There may be patents or patent applications in the U.S. or other countries that are pertinent to our business of which we are not aware. The technology that we incorporate into and use to develop and manufacture our current and future products may be subject to claims that they infringe the patents or proprietary rights of others. The success of our technology efforts will also depend on our ability to develop new technologies without infringing or misappropriating the proprietary rights of others.
We have in the past and may in the future receive notices from third parties alleging patent, trademark or copyright infringement. Whether or not we actually infringe a third party’s rights, receipt of these notices could result in significant costs and diversion of the attention of management from our business. If a successful claim were brought against us, we would have to attempt to license the intellectual property right from the claimant or spend time and money to design around or avoid the intellectual property. Any such license may not be available on reasonable terms, or at all. We may be involved in future lawsuits, arbitrations or other legal proceedings alleging patent infringement or other intellectual property rights violations. In addition, litigation, arbitration or other legal proceedings may be necessary to:
| • | assert claims of infringement of or otherwise enforce our intellectual property rights; |
| • | protect our trade secrets or know-how; or |
| • | determine the enforceability, scope and validity of our intellectual property rights or those of others. |
We may be unsuccessful in defending or pursuing these lawsuits or claims. Regardless of the outcome, litigation can be very costly and can divert management’s attention. An adverse determination may subject us to significant liabilities or require us to seek licenses to other parties’ intellectual property rights. We may also be restricted or prevented from manufacturing, marketing or selling a new product that we develop or that is successfully being sold in the marketplace. Further, we may not be able to obtain any necessary licenses on acceptable terms, if at all.
In addition, we may have to participate in proceedings before the U.S. Patent and Trademark Office, or before foreign patent and trademark offices, with respect to our patents and patent applications or those of others. These actions may result in substantial costs to us as well as a diversion of management attention. Furthermore, these actions could place our patents, trademarks and other intellectual property rights at risk and could result in the loss of patent, trademark or other intellectual property rights protection for the products and services on which our business strategy depends.
15
We may be unable to adequately protect or enforce our proprietary technology, which may result in its unauthorized use or reduced sales or otherwise reduce our ability to compete.
Our business and competitive position depend upon our ability to protect our proprietary technology. Despite our efforts to protect this information, unauthorized parties may attempt to obtain and use information that we regard as proprietary. Any patents issued in connection with our efforts to develop new technology for our products may not be broad enough to protect all of the potential uses of the technology.
In addition, when we do not control the prosecution, maintenance and enforcement of certain important intellectual property, such as a technology licensed to us, the protection of the intellectual property rights may not be in our hands. If the entity that controls the intellectual property rights does not adequately protect those rights, our rights may be impaired, which may affect our ability to develop, market and commercialize the related products. Our means of protecting our proprietary rights may not be adequate, and our competitors may:
| • | Independently develop substantially equivalent proprietary information, products and techniques; |
| • | Otherwise gain access to our proprietary information; or |
| • | Design around our patents or other intellectual property. |
We pursue a policy of having our employees, consultants and advisors execute proprietary information and assignment of invention agreements when they begin working for us. However, these agreements may not provide meaningful protection for our trade secrets or other proprietary information in the event of unauthorized use or disclosure.
We are dependent on international operations, which expose us to a variety of risks that could result in lower sales and operating results.
International sales account for a material portion of our net sales. Our reliance on international operations exposes us to related risks and uncertainties, which, if realized, could cause our sales and operating results to decrease. There is significant government or public hearing aid reimbursement in a number of countries outside the U.S., which if reduced or eliminated would likely have a negative effect on our sales. For example, reimbursement levels are trending downward in Germany and changes to our business model, as more fully explained below, impacted our sales in that country in 2009 and likely will continue into 2010. Other changes in the healthcare systems of countries outside the U.S., such as instituting co-payments or co-insurance or changes to reimbursement methodologies would likely have negative effects on our sales. In order to market our products in the EU, we are required to have the EEA’s CE mark certification. Any failure to maintain our CE mark certification would significantly reduce our net sales and operating results. We work under different legal, regulatory and governmental regimes in various countries, which could delay our ability to sell products or cause us additional expense in determining how to comply, and taking any actions necessary to comply, with local legal, regulatory and governmental requirements. In addition, we may need to adapt local practices to satisfy requirements applicable in the U.S. We face foreign currency risks primarily as a result of the revenues we derive from sales made outside the U.S., expenses incurred outside the U.S. and intercompany account balances between our U.S. parent company and our non-U.S. subsidiary companies. Fluctuations in the exchange rates between the U.S. dollar and other currencies could negatively affect the sales price of our products in international markets or lead to currency exchange losses. In general, our net sales and operating results benefit from a weakening U.S. dollar. If the U.S. dollar were to strengthen from current levels, our net sales and operating results would suffer.
Legislation passed by the Federal Council of Germany in November 2008 and which became effective on April 1, 2009, resulted in sweeping changes to the way doctors and healthcare providers interact and are reimbursed by insurance companies. A major change in regulation was the prohibition of direct fitting fee payments from hearing aid retailers to doctors. Under our German government approved business model, the new legislation requires that the fitting fee payments to the doctors come from the insurance companies rather than us. The direct payment to doctors for fitting services under our business model was one of the keys to success for our sales channel in Germany. The law changed the market by giving more power to the insurers by allowing discretion as to which business models they supply hearing aids and related services. Insurers are the sole gatekeepers for access to the reimbursement schemes for the end consumer. These changes required our German subsidiary to a) develop a new business process with the insurance companies to create a service company for invoicing, receiving and paying the doctor’s honorarium; b) renegotiate contracts with insurance companies; and c) negotiate contracts between and with the insurance companies and the ENT doctors. In the first three months of 2009, we believed our German subsidiary was making progress, having successfully renegotiated contracts representing approximately 27% of our 2008 German revenue. However, on April 1, 2009, we were notified by one large insurance company representing approximately 25% of our German revenue that, despite several months of favorable negotiations, due to “political headwinds,” they were refusing to enter into a contract; therefore, our German subsidiary filed a lawsuit in the Social Court in Hamburg, Germany against this insurance company, requesting that the court compel the insurance company to enter into a contract with our German subsidiary. On April 28, 2009, the Court rejected these claims. We subsequently filed an appeal of this decision, which was rejected without review. In addition, a number of other insurance companies were unsure if they should sign a contract because there were rumors that the newly enacted law could potentially change again, thus requiring the need to renegotiate again. Without renegotiated insurance contracts, and the ability to pay customary fitting fees to the ENT doctors, we expected revenue to decline substantially and cash flow of the operation would not be sufficient to support our intangibles balances. As a result, we recognized a $14,658 non-cash write-off of our goodwill and trade name associated with our German operation in the first quarter of 2009.
16
In June 2009, the German government passed additional amendments to the law that became effective July 23, 2009. The key implication of these amendments to our business model was to impose additional costs on the doctors and insurance companies that conduct business with our German operation.
We are currently renegotiating contracts in light of the new legislative requirements and are working to contract with other insurance companies as well. Although our German subsidiary is exploring and implementing alternative avenues for replacing the lost revenue, the lack of signed insurance contracts and the imposition of new and costly requirements on the ENT doctors and the insurance companies are expected to continue to put pressure on 2010 sales in Germany.
Complications may result from hearing aid use, and we may incur significant expense if we are sued for product liability.
Although we have not experienced any significant product liability issues to date, we may be held liable if any product we develop causes injury or is found otherwise unsuitable. If we are sued for an injury caused by our products, the resulting liability could result in significant expense beyond our products liability insurance limits, which would harm our operating results.
If we fail to comply with Food and Drug Administration regulations or various sales-related laws, we may suffer fines, injunctions or other penalties.
Our products are subject to regulation in the U.S. by the FDA and similar entities in other countries. We must comply with facility registration and product listing requirements of the FDA and similar entities and adhere to the FDA’s Quality System Regulations. Noncompliance with applicable FDA and similar entities’ requirements can result in fines, injunctions, civil penalties, recall or seizure of products, total or partial suspension of production or criminal prosecution. We must also maintain compliance with federal, state and foreign laws regarding sales incentives, techniques, referrals and other programs, some of which are unclear or may be read broadly enough to prohibit standard sales programs such as discounts, free training or “frequent buyer” awards. While we intend to comply with the law in each of these jurisdictions, if our practices, or those of a competitor, were to attract unfavorable press or governmental attention, our sales could be adversely affected or we could be subject to fines or governmental injunctions.
There may be sales of our stock by our directors and officers, and these sales could cause our stock price to fall.
Sales of our stock by our directors and officers, or the perception that such sales will occur, could adversely affect the market price of our stock. Some of our officers have adopted trading plans under SEC Rule 10b5-1 in order to dispose of a portion of their stock in an orderly manner. Other officers or directors may adopt such a trading plan in the future.
Provisions in our charter documents, our shareholders rights plan and Delaware law may deter takeover efforts that shareholders feel would be beneficial to shareholder value.
Our certificate of incorporation and bylaws, shareholder rights plan and Delaware law contain provisions that could make it harder for a third party to acquire us without the consent of our board of directors. While we believe these provisions provide for an opportunity to receive a higher bid by requiring potential acquirers to negotiate with our board of directors, these provisions apply even if the offer may be considered beneficial by some shareholders, and a takeover bid otherwise favored by a majority of our shareholders might be rejected by our board of directors.
If we trigger a debt covenant default, our bankers may call our line of credit or limit our borrowing ability under the line of credit, or call our German debt.
Our debt arrangements with Silicon Valley Bank and Commerzbank impose certain covenants which limit our ability to operate without restrictions. They also provide for certain events of default, including payment defaults, breaches of covenants and certain events of bankruptcy, insolvency and reorganization. For example, our Silicon Valley Bank arrangement requires the Company to achieve certain monthly earnings before taxes, interest, depreciation, and amortization targets, as defined, imposes reporting requirements, and requires us to provide monthly compliance certifications, among other requirements. A number of factors may limit our ability to borrow under the line of credit. We are, and expect to remain, in compliance with these covenants. However if any event of default occurs and is continuing, the principal amount of the notes, plus accrued and unpaid interest, which is assessed at a higher default rate, if any, may be declared immediately due and payable. The debt arrangements also provide that if a fundamental change occurs to our business, as defined, at any time prior to maturity of the obligations, the bank shall have the right to require us to redeem the debt, or any portion thereof plus accrued interest and liquidated damages. There can be no assurance that, if any of the foregoing events were to occur, we would have the ability to repay the principal amount and interest accrued under the arrangements and/or any additional amounts owed in connection with the acceleration of the debt.
| ITEM 1-B. | UNRESOLVED STAFF COMMENTS |
None.
17
| ITEM 2. | PROPERTIES |
We lease manufacturing and office space in support of our business. Total leased space as of December 31, 2009 was 169,398 square feet as follows:
| Location |
Square Footage |
Lease Expiration | ||
| Salt Lake City, Utah |
23,170 | February 2016 | ||
| Eagan, Minnesota |
22,748 | September 2011 | ||
| North America retail locations |
52,303 | Various through July 31, 2018 | ||
| Adelaide, Australia |
10,596 | December 2012 | ||
| Australia retail locations |
40,951 | Various through October 2015 | ||
| Leibnitz, Austria |
1,636 | June 2010 | ||
| Montreal, Canada |
3,387 | September 2014 | ||
| Hamburg, Germany |
14,607 | Various through October 2011 | ||
| Total |
169,398 | |||
We believe we have sufficient manufacturing capacity to satisfy current and forecasted demand for at least the next 12 months.
| ITEM 3. | LEGAL PROCEEDINGS |
In February 2006, the former owners of Sanomed, which we acquired in 2003, filed a lawsuit in German civil court claiming that certain deductions made by us against certain accounts receivable amounts and other payments remitted to the former owners were improper. The former owners sought damages in the amount of approximately €2,600 ($3,800). We filed our statement of defense and presented our position during oral arguments. The court asked the parties to attempt to settle the matter and on July 20, 2009, we and the former owners agreed to settle the claim. Under the terms of the settlement, we agreed to pay the former owners of Sanomed an aggregate sum of €1,050 ($1,471), approximately the amount reserved in our balance sheet at December 31, 2008 for this matter. We remitted the settlement payment in August 2009.
As part of the Sanomed purchase agreement, the former owners were entitled to contingent consideration based on the achievement of certain revenue milestones. In certain circumstances, the former owners were entitled to contingent consideration irrespective of the achievement of the revenue milestones. In addition to the above noted lawsuit, two of the former owners filed suits against us, one of which was settled in 2007, and the other former owner’s contingent consideration claim against us for approximately €1,100 ($1,577) plus interest was dismissed in July 2008, with the German court rendering its decision in our favor. The former owner has appealed. We continue to strongly deny the allegations contained in the former owner’s appeal and we intend to defend our position vigorously; however, litigation is inherently uncertain and an unfavorable result could have a material adverse effect. We establish reserves when a particular contingency is probable and estimable.
From time to time, we are subject to legal proceedings, claims and litigation arising in the ordinary course of its business. Most of these legal actions are brought against us by others and, when we feel it is necessary, we may bring legal actions against others. Actions can stem from disputes regarding the ownership of intellectual property, customer claims regarding the function or performance of our products, government regulation or employment issues, among other sources. Litigation is inherently uncertain, and therefore, we cannot predict the eventual outcome of any such lawsuits. However, we do not expect that the ultimate resolution of any known legal action, other than as identified above, will have a material adverse effect on our results of operations and financial position.
| ITEM 4. | [RESERVED] |
18
PART II
| ITEM 5. | MARKET FOR REGISTRANT’S COMMON EQUITY, RELATED STOCKHOLDER MATTERS AND ISSUER PURCHASES OF EQUITY SECURITIES |
Market Information
Our common stock trades on the National Association of Securities Dealers Automated Quotation System (“NASDAQ”) Global Market, under the symbol “OTIX.” The high and low sales prices of our common stock, as reported by the Nasdaq Global Market are set forth below for the periods indicated.
| Price Range | ||||||
| 2009 |
High | Low | ||||
| First quarter |
$ | 1.13 | $ | 0.79 | ||
| Second quarter |
1.10 | 0.61 | ||||
| Third quarter |
1.07 | 0.66 | ||||
| Fourth quarter |
0.95 | 0.75 | ||||
| Price Range | ||||||
| 2008 |
High | Low | ||||
| First quarter |
$ | 7.53 | $ | 3.59 | ||
| Second quarter |
4.66 | 2.84 | ||||
| Third quarter |
3.21 | 2.24 | ||||
| Fourth quarter |
2.35 | 0.94 | ||||
The closing price of our common stock as reported by the Nasdaq Global Market on March 8, 2010 was $0.85 per share. As of March 8, 2010, there were approximately 3,434 holders of record of our common stock.
Performance Graph
The following Performance Graph and related information shall not be deemed “soliciting material” or to be “filed” with the Securities and Exchange Commission, nor shall such information be incorporated by reference into any future filing under the Securities Act of 1933 or Securities Exchange Act of 1934, each as amended, except to the extent that the Company specifically incorporates it by reference into such filing.
The following table compares total shareholder returns for the Company over the last five years to the Standard and Poor’s 500 Stock Index and the Standard and Poor’s Health Care index assuming a $100 investment made on December 31, 2004. Each of the three measures of cumulative total return assumes reinvestment of dividends. The stock performance shown on the graph below is not necessarily indicative of future price performance.
19
COMPARISON OF 5 YEAR CUMULATIVE TOTAL RETURN*
Among Otix Global, Inc., The S&P 500 Index
And The S&P Health Care Index
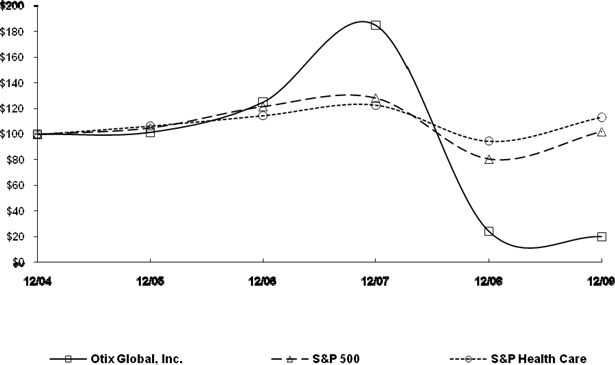
| * | $100 invested on 12/31/04 in stock or index, including reinvestment of dividends. |
Fiscal year ending December 31.
Copyright© 2010 S&P, a division of The McGraw-Hill Companies Inc. All rights reserved.
Dividends
We have never declared or paid cash dividends on our stock, and our board of directors has no present intention to declare or pay cash dividends.
Securities Authorized for Issuance under Equity Compensation Plans
The following table provides certain information concerning our equity compensation plans as of December 31, 2009:
| Number of securities to be issued upon exercise of outstanding options, warrants and rights (in thousands) |
Weighted-average exercise price of outstanding options, warrants and rights |
Number of securities remaining available for future issuance under equity compensation plans (excluding securities reflected in column (a)) (in thousands) | |||||
| Plan category |
(a) | (b) | (c) | ||||
| Equity compensation plans approved by security holders |
4,167 | $ | 4.65 | 3,018 | |||
| Equity compensation plans not approved by security holders |
— | — | — | ||||
| Total |
4,167 | $ | 4.65 | 3,018 | |||
20
| ITEM 6. | SELECTED FINANCIAL DATA |
The following tables indicate the trends in certain components of our consolidated statements of operations, balance sheets and other information for each of the last five years. On September 1, 2008, we sold one European operation and closed a second European operation. As of December 31, 2009, there are no material balances related to these operations remaining in the Consolidated Balance Sheet. On February 20, 2007, Tympany was sold to a group of private investors. The results of operations have been classified as discontinued operations in the Consolidated Statements of Operations for the five years ended December 31, 2009, as applicable.
Selected Five Year Data:
(in thousands, except per share and other data)
| 2009 | 2008 | 2007 | 2006 | 2005 | ||||||||||||||||
| Statements of Operations: |
||||||||||||||||||||
| Net Sales |
$ | 95,814 | $ | 124,878 | $ | 119,062 | $ | 101,119 | $ | 93,730 | ||||||||||
| Gross profit |
58,121 | 78,874 | 75,386 | 58,523 | 52,801 | |||||||||||||||
| Percent of net sales |
60.7 | % | 63.2 | % | 63.3 | % | 57.9 | % | 56.3 | % | ||||||||||
| Selling, general and administrative expense |
59,065 | 70,515 | 64,932 | 50,473 | 46,934 | |||||||||||||||
| Percent of net sales |
61.6 | % | 56.5 | % | 54.5 | % | 49.9 | % | 50.1 | % | ||||||||||
| Research and development expense |
6,487 | 8,266 | 8,547 | 7,759 | 7,785 | |||||||||||||||
| Restructuring and goodwill and definite-lived intangible impairment charges |
31,299 | 4,163 | — | — | 4,084 | |||||||||||||||
| Income (loss) from continuing operations |
(39,301 | ) | (3,720 | ) | 1,810 | 704 | (4,558 | ) | ||||||||||||
| Loss from discontinued operations, net of income taxes |
(51 | ) | (3,904 | ) | (1,093 | ) | (2,284 | ) | (15,050 | ) | ||||||||||
| Net income (loss) |
(39,352 | ) | (7,624 | ) | 717 | (1,580 | ) | (19,608 | ) | |||||||||||
| Basic and diluted earnings (loss) per common share: |
||||||||||||||||||||
| Continuing operations |
$ | (1.42 | ) | $ | (0.14 | ) | $ | 0.07 | $ | 0.03 | $ | (0.21 | ) | |||||||
| Discontinued operations |
— | (0.14 | ) | (0.04 | ) | (0.10 | ) | (0.71 | ) | |||||||||||
| Net income (loss) |
$ | (1.42 | ) | $ | (0.28 | ) | $ | 0.03 | $ | (0.07 | ) | $ | (0.92 | ) | ||||||
| Weighted average number of common shares outstanding: |
||||||||||||||||||||
| Basic |
27,682 | 27,305 | 26,518 | 23,408 | 21,382 | |||||||||||||||
| Diluted |
27,682 | 27,305 | 27,570 | 23,932 | 21,382 | |||||||||||||||
| Balance Sheets: |
||||||||||||||||||||
| Cash, cash equivalents and marketable securities - unrestricted |
$ | 12,154 | $ | 13,129 | $ | 15,214 | $ | 19,679 | $ | 7,342 | ||||||||||
| Cash, cash equivalents and marketable securities - restricted |
71 | 284 | 5,470 | 6,773 | 8,384 | |||||||||||||||
| Total Assets |
67,125 | 106,946 | 123,701 | 108,321 | 86,764 | |||||||||||||||
| Long-term obligations |
452 | 2,182 | 5,593 | 4,682 | 5,033 | |||||||||||||||
| Total Liabilities |
34,323 | 39,035 | 47,468 | 42,417 | 36,993 | |||||||||||||||
| Shareholders’ equity |
32,802 | 67,911 | 76,233 | 65,904 | 49,771 | |||||||||||||||
| Other: |
||||||||||||||||||||
| Countries with direct operations |
5 | 5 | 9 | 9 | 9 | |||||||||||||||
| Number of employees |
541 | 637 | 664 | 639 | 634 | |||||||||||||||
During 2009, we recorded restructuring and impairment charges totaling $31,299. With respect to restructuring, we took actions to improve profitability by 1) reducing the total number of employees in North America; 2) closing three U.S. retail locations resulting in a restructuring charge of $98 and goodwill and definite-lived intangible write-off of $135; and 3) reducing headcount and selling two retail shops in Europe. The total restructuring charge from these actions was $769, which included $158 in sale proceeds from the two European shop sales. With respect to impairment charges, we recorded a $3,440 charge to impair various customer databases and $12,432 of goodwill related to the U.S. retail reporting unit in our North America operating segment, and fully impaired Germany goodwill and trade name of $14,205 and $453, respectively, in our Europe operating segment.
During the second, third, and fourth quarters of 2008, we implemented restructuring actions, primarily in Europe, by consolidating operations, reducing headcount, closing facilities, selling off assets and impairing certain intangible assets, including
21
goodwill and a trade name, which resulted in a goodwill write-off of $2,264 and trade name write-off of $352, all of which related to discontinued operations. During the fourth quarter 2008, we recorded a goodwill impairment of $2,111 related to a reporting unit, largely based on declining sales and lower expected future profitability; as well as $2,052 in restructuring related charges. In 2008, we determined that it was more likely than not that it would be able to realize the future tax benefits of the deferred income tax assets of our Australian subsidiary and, accordingly, we reversed our valuation allowance of $1,305, which was recorded as a benefit to income taxes. For a further discussion see Notes 5, 6, 9 and 13 to our consolidated financial statements.
22
Unaudited Quarterly Results of Operations:
| First | Second | Third | Fourth | |||||||||||||
| 2009 |
||||||||||||||||
| Net sales |
$ | 24,432 | $ | 25,420 | $ | 23,139 | $ | 22,823 | ||||||||
| Cost of sales |
10,269 | 9,956 | 9,069 | 8,399 | ||||||||||||
| Gross profit |
14,163 | 15,464 | 14,070 | 14,424 | ||||||||||||
| Selling, general and administrative expense |
14,321 | 15,298 | 14,560 | 14,886 | ||||||||||||
| Research and development expense |
1,979 | 1,929 | 1,340 | 1,239 | ||||||||||||
| Goodwill and definite-lived impairment charges |
14,658 | — | 135 | 15,872 | ||||||||||||
| Restructuring charges |
— | 525 | 98 | 11 | ||||||||||||
| Operating loss |
(16,795 | ) | (2,288 | ) | (2,063 | ) | (17,584 | ) | ||||||||
| Interest expense |
(140 | ) | (137 | ) | (102 | ) | (102 | ) | ||||||||
| Other income (expense), net |
107 | (22 | ) | 218 | (69 | ) | ||||||||||
| Loss before income taxes |
(16,828 | ) | (2,447 | ) | (1,947 | ) | (17,755 | ) | ||||||||
| Provision (benefit) for income taxes |
95 | 180 | 115 | (66 | ) | |||||||||||
| Loss from continuing operations |
(16,923 | ) | (2,627 | ) | (2,062 | ) | (17,689 | ) | ||||||||
| Income (loss) from discontinued operations, net of income taxes |
(45 | ) | 35 | (2 | ) | (39 | ) | |||||||||
| Net loss |
$ | (16,968 | ) | $ | (2,592 | ) | $ | (2,064 | ) | $ | (17,728 | ) | ||||
| Basic and diluted loss per common share: |
||||||||||||||||
| Continuing operations |
$ | (0.62 | ) | $ | (0.09 | ) | $ | (0.07 | ) | $ | (0.64 | ) | ||||
| Discontinued operations |
— | — | — | — | ||||||||||||
| Net loss |
$ | (0.62 | ) | $ | (0.09 | ) | $ | (0.07 | ) | $ | (0.64 | ) | ||||
| Weighted average number of common shares outstanding: |
||||||||||||||||
| Basic |
27,584 | 27,667 | 27,703 | 27,774 | ||||||||||||
| Diluted |
27,584 | 27,667 | 27,703 | 27,774 | ||||||||||||
| First | Second | Third | Fourth | |||||||||||||
| 2008 |
||||||||||||||||
| Net sales |
$ | 31,450 | $ | 34,837 | $ | 31,311 | $ | 27,280 | ||||||||
| Cost of sales |
11,368 | 13,020 | 11,193 | 10,423 | ||||||||||||
| Gross profit |
20,082 | 21,817 | 20,118 | 16,857 | ||||||||||||
| Selling, general and administrative expense |
17,493 | 19,507 | 18,013 | 15,502 | ||||||||||||
| Research and development expense |
2,225 | 2,157 | 2,005 | 1,879 | ||||||||||||
| Goodwill impairment charge |
— | — | — | 2,111 | ||||||||||||
| Restructuring charges |
501 | 828 | 232 | 491 | ||||||||||||
| Operating loss |
(137 | ) | (675 | ) | (132 | ) | (3,126 | ) | ||||||||
| Interest expense |
(183 | ) | (182 | ) | (208 | ) | (182 | ) | ||||||||
| Other income, net |
514 | 98 | 71 | 484 | ||||||||||||
| Income (loss) before income taxes |
194 | (759 | ) | (269 | ) | (2,824 | ) | |||||||||
| Provision (benefit) for income taxes |
294 | 295 | (910 | ) | 383 | |||||||||||
| Income (loss) from continuing operations |
(100 | ) | (1,054 | ) | 641 | (3,207 | ) | |||||||||
| Loss from discontinued operations, net of income taxes |
(432 | ) | (2,948 | ) | (344 | ) | (180 | ) | ||||||||
| Net income (loss) |
$ | (532 | ) | $ | (4,002 | ) | $ | 297 | $ | (3,387 | ) | |||||
| Basic and diluted earnings (loss) per common share: |
||||||||||||||||
| Continuing operations |
$ | — | $ | (0.04 | ) | $ | 0.02 | $ | (0.12 | ) | ||||||
| Discontinued operations |
(0.02 | ) | (0.11 | ) | (0.01 | ) | — | |||||||||
| Net income (loss) |
$ | (0.02 | ) | $ | (0.15 | ) | $ | 0.01 | $ | (0.12 | ) | |||||
| Weighted average number of common shares outstanding: |
||||||||||||||||
| Basic |
26,849 | 27,336 | 27,489 | 27,540 | ||||||||||||
| Diluted |
26,849 | 27,336 | 27,541 | 27,540 | ||||||||||||
23
| ITEM 7. | MANAGEMENT’S DISCUSSION AND ANALYSIS OF FINANCIAL CONDITION AND RESULTS OF OPERATIONS (in thousands, except share data) |
This report contains “forward-looking statements” within the meaning of Section 27A of the Securities Act of 1933, as amended, and Rule 175 promulgated thereunder, and Section 21E of the Securities Exchange Act of 1934, as amended, and Rule 3b-6 promulgated thereunder, that involve inherent risks and uncertainties. Any statements about our plans, objectives, expectations, strategies, beliefs, or future performance or events constitute forward-looking statements. Such statements are identified as those that include words or phrases such as “believes,” “expects,” “anticipates,” “plans,” “trend,” “objective,” “continue” or similar expressions or future or conditional verbs such as “will,” “would,” “should,” “could,” “might,” “may” or similar expressions. Forward-looking statements involve known and unknown risks, uncertainties, assumptions, estimates and other important factors that could cause actual results to differ materially from any results, performance or events expressed or implied by such forward-looking statements. All forward-looking statements are qualified in their entirety by reference to the factors discussed more fully in Item 1A hereof: (i) deterioration of economic conditions; (ii) our continued losses; (iii) aggressive competitive factors; (iv) fluctuations in our financial results; (v) our common stock could be subject to delisting; (vi) negative impact of our recent acquisition activities; (vii) ineffective internal financial control systems; (viii) dependence on significant customers; (ix) dependence on critical suppliers and contractors; (x) high levels of product returns and repairs; (xi) inability to introduce new and innovative products; (xii) undiscovered product errors or defects; (xiii) potential infringement on the intellectual property rights of others; (xiv) uncertainty of intellectual property protection; (xv) dependence on international operations; (xvi) potential product liability; (xvii) failure to comply with FDA regulations; (xviii) our stock price could suffer due to sales of stock by our directors and officers; (xix) our charter documents and shareholder agreements may prevent certain acquisitions; and (xx) debt covenant default.
Because the foregoing factors could cause actual results or outcomes to differ materially from those expressed or implied in any forward-looking statements, undue reliance should not be placed on any forward-looking statements. Further, any forward-looking statement speaks only as of the date on which it is made, and we undertake no obligation to update any forward-looking statement to reflect events or circumstances after the date on which the statement is made or to reflect the occurrence of future events or developments.
OVERVIEW
Otix Global, Inc. (“Otix” or “the Company”) was previously named Sonic Innovations, Inc. At the May 2009 annual meeting, the shareholders of Sonic Innovations, Inc. voted to change the name to Otix Global, Inc. The change created a holding company that allows the Sonic Innovations (“Sonic”) brand and Sonic’s other brands to operate independently from each other. Sonic continues as a company and brand, developing and distributing hearing instruments and services, and Otix is the parent company of Sonic and Sonic’s other legal entities.
Otix is a premier provider of technologically advanced hearing care solutions focused on the therapeutic aspects of hearing care. We design, develop, manufacture and market high-performance digital hearing aids intended to provide the highest levels of satisfaction for hearing impaired consumers. We have developed patented digital-signal-processing (“DSP”) technologies based on what we believe is an advanced understanding of human hearing. In those countries where we have direct (owned) operations, we sell our products to hearing care professionals or directly to hearing impaired consumers. In other parts of the world where we do not have direct operations, we sell principally to distributors.
We were acquisitive after raising capital in an initial public offering in 2000 and a Private Investment in Public Equity (“PIPE”) offering in 2006. Product evolution continues, but the differentiation between product offerings by hearing aid companies has narrowed, and thus distribution and access to distribution continues to grow in importance. Accordingly, we acquired a number of our then distributors from 2000 to 2003. Thereafter, we acquired an operation in Germany with a unique distribution model using the Ear-nose-throat (“ENT”) physician. Then, from 2006 to 2008, we acquired a number of retail practices. This was all to strengthen our distribution network.
In 2008, we had a number of entities in Europe which lacked sufficient market share to effectively compete in today’s environment. Therefore, we restructured and eliminated certain operations in 2008 centered mostly in Europe with the goal of streamlining processes, eliminating non-performing business units and focusing on profitable opportunities. On September 1, 2008, we sold one European operation and closed a second European operation. In addition, we reduced headcount throughout the organization. We focused on expense control worldwide and the need to produce an operating profit.
In 2009, the impact of new Germany legislation passed in 2008 and 2009 had a negative impact on our business. These resulting changes added costs to our distribution model making it much less attractive for German insurance companies to do business with us. As a result, we expensed $14,658 in the first quarter of 2009, representing the remaining intangible assets from our 2003 acquisition
of the German business. In the fourth quarter of 2009, we expensed $15,872 of our investment in U.S. retail acquisitions due to reduced market valuations in the retail space and the difficulty of integrating these acquisitions.
24
Market
The hearing aid market is large at both the wholesale level (over $2 billion) and the retail level (over $6 billion). It is estimated that less than 24% of those who could benefit from a hearing aid actually own one. There are many factors that cause this low market penetration rate, such as the high cost of hearing aids, the stigma associated with wearing hearing aids, the discomfort of wearing hearing aids and the difficulty in adjusting to amplification. We believe that these negative factors will decrease in importance in the future because we expect the negative stigma to decrease as improvements in technology make the devices smaller, less conspicuous and more comfortable and as hearing loss becomes more prevalent in society. In addition, demographic trends and modern lifestyle choices should accelerate hearing aid adoption rates. We expect that more people who could benefit from hearing aids will buy them, and we believe that the growth rate of the hearing impaired population could be significant, particularly as the world population ages.
Offsetting this trend are the following market conditions affecting us in a negative way:
| • | Competition is intense and new product offerings by our competitors are coming to market more quickly than in the past. |
| • | Our competitors have begun acquiring other business/products that have a similar call point (Ear-nose-throat physician), retail, buying group arrangements, etc., in order to leverage each for increased volume. |
| • | The performance, features and quality of lower-priced products continue to improve. |
| • | Sales through the internet and lower cost alternatives for distribution are increasing |
| • | Many consumers feel that hearing aids are simply too expensive and they cannot justify the purchase on a cost-benefit basis. |
| • | Governments are reducing the reimbursement per device or are increasing the technology requirements for the same level of reimbursement. In a more specific circumstance to us, we have the German legislative changes mentioned below. |
| • | Our operations and performance depend on general economic conditions. The global economy today is difficult at best due to the economic downturn in the last two years as a result of the crisis in credit markets, slower economic activity, concerns about inflation, increased energy costs, decrease in consumer confidence, government spending and related debt levels and other adverse business conditions. Such fluctuations in the global economy could cause, among others, further deterioration and continued decline in consumer spending and increases in the cost of labor and materials. |
| • | The available wholesale market continues to shrink as our competitors implement forward integration strategies and buying groups limit the number of manufacturers with whom they do business. Therefore, we plan to continue to develop and potentially acquire additional distribution capacities. |
Product Developments
Our philosophy for product development is to not be first to market, but to be the best. We have focused on developing some of the smallest devices in the market. We spend a fraction of what some of our larger competitors spend, and therefore we need to be efficient with our spending. Accordingly, we invest less in research, and more in development. We are looking at partners to supplement and leverage our technology in order to compete more effectively against are larger competitors.
Product trends recently have been moving away from custom in the ear devices to those that fit behind the ear. Custom devices are made from a mold taken of each hearing aid user’s ear. Custom devices usually involve an iterative fitting process and therefore add to the cost and complexity of the device. The recent trend is towards standard production of a device which reduces the cost and improves ease of fitting and use. As a result, we launched devices in recent years with a focus on standard products and away from custom. Two examples of these product families are Touch and ion.
We launched Touch, our first receiver-in-the-canal (“RIC”) product family, in March 2009. RIC, which is a behind the ear device, has become a very popular product type since its introduction approximately four years ago, representing approximately 35% of hearing aids sold in the United States. In addition to its sophisticated design and ease of use features, we believe Touch to be the smallest, most moisture resistant RIC product on the market today. Our Touch products incorporate many of the sound processing technologies present in our other hearing instruments. Touch provides natural sound quality, superior noise-reduction, and excellent directionality, driven by our unique DIRECTIONALfocus technology.
The ion family of products was first launched in early 2006 and continues to be an important part of our strategy to provide outstanding products in every market segment. We offer ion at three price points. Ion 400 is our premium ion and the smallest open-fit product available in the market.
The market is using RIC and open-fit products to target the first-time hearing aid wearer. The market for RIC and open-fit products has grown rapidly, as illustrated by the Hearing Industries Association (“HIA”) data. The BTE category, into which open-fit and RIC products fall, continues to grow as a percentage of the hearing aid market, representing in excess of 55% of the units sold in the United States, up from 51% in 2007 and 44% in 2006.
25
The current global economic situation makes it more important than ever to provide our customers with pricing flexibility for selling to the hearing impaired consumer. In the second half of 2008, we launched four new products specifically designed to provide competitive features and additional price options for our customers. Velocity 24, our new premium product, combines a superior set of algorithms to provide the consumer with hands-free operation in a variety of listening environments. Our new advanced-level product, Velocity 12, offers many sophisticated features, such as automatic and adaptive directionality, data logging, and auto telephone. With Velocity 6, we have added a highly competitive mid-level product line. Velocity 4, our newest entry-level offering, makes our patented and proven noise-reduction available at a price-point that is particularly attractive to cost-sensitive consumers. All Velocity products are available in a full line of custom models and feature a robust standard behind-the-ear hearing aid (“BTE”) that can accommodate a severe hearing loss. Velocity 24, Velocity 12, and Velocity 6 also offer a miniBTE model that provides both open-fit and standard fittings, a powerful fitting range and extendable functionality such as Bluetooth and direct audio import support.
We now have eight active product families – Touch, Velocity, ion, Balance, Applause, Natura Pro, Natura 2SE and Quartet.
Distribution Developments
Hearing aids are generally sold through the following distribution channels:
| • | Independent retailers, |
| • | Purchasing groups, |
| • | Retail chains, |
| • | Governments, |
| • | Internet, and |
| • | Manufacturer-owned retail. |
The growth today is in retail chains, governments, internet (small but growing) and manufacturer-owned retail. Independent retailers are shrinking for a number of reasons, but foremost due to consolidation through acquisition by large retailers and manufacturers. We are competing in an industry that includes six much larger competitors who have significantly more resources and have established relationships and reputations. Our competitors continue to forward integrate by buying independent retailers and offering financial arrangements through loans and other lock-up agreements. Therefore, the market available for us in the wholesale business is shrinking, making it difficult for us to compete in the traditional distribution fashion. For this reason, we are interested in both new and existing distribution methods. In certain cases, we sell direct to the consumer utilizing the ENT doctor to perform the hearing aid fitting, while in other cases, we sell directly to the consumer through various retail stores. We believe a combination of wholesale and direct-to-consumer distribution will continue to be critical for us in certain geographies.
In parts of the world where we do not have direct operations, we sell principally to distributors with payment terms ranging from cash-in-advance to 120 days. Certain distributors are offered volume discounts that are earned upon meeting unit volume targets. Distributor agreements do not convey price protection or price concession rights.
Germany Legislation
Legislation passed by the Federal Council of Germany in November 2008 and which became effective on April 1, 2009, resulted in sweeping changes to the way doctors and healthcare providers interact and are reimbursed by insurance companies. A major change in regulation directly affecting our German subsidiary was the prohibition of direct fitting fee payments from hearing aid retailers to doctors. Under our German government approved business model, the new legislation requires that the fitting fee payments to the doctors come from the insurance companies rather than us. The direct payment to doctors for fitting services under our business model was one of the keys to success for our sales channel in Germany. The law changed the market by giving more power to the insurers by allowing discretion as to which business models they supply hearing aids and related services. Insurers are the sole gatekeepers for access to the reimbursement schemes for the end consumer. These changes required our German subsidiary to a) develop a new business process with the insurance companies to create a service company for invoicing, receiving and paying out the doctor’s honorarium; b) renegotiate contracts with insurance companies; and c) negotiate contracts between and with the insurance company and the ENT doctors. In the first three months of 2009, we believed our German subsidiary was making progress, having successfully renegotiated a number of contracts. However, on April 1, 2009, we were notified by one large insurance company representing approximately 25% of our 2008 German revenue that, despite several months of favorable negotiations, due to “political headwinds,” they were refusing to enter into a contract; therefore, our German subsidiary filed a lawsuit in the Social Court in Hamburg, Germany against this insurance company, requesting that the court compel the insurance company to enter into a contract with our German subsidiary. On April 28, 2009, the Court rejected these claims. We subsequently filed an appeal of this decision, which was rejected without review. In addition, a number of other insurance companies were unsure if they should sign a contract because there were rumors that the newly enacted law could potentially change again, thus requiring the need to renegotiate within a short period of time. Without renegotiated insurance contracts, and the ability to pay customary fitting fees to the ENT doctors, we expected revenue to decline substantially and cash flow of the operation would not be sufficient to support our intangibles balances. As a result, we recognized a $14,658 non-cash write-off of our goodwill and trade name associated with our German operation in the first quarter of 2009.
26
In June 2009, the German government passed additional amendments to the law that became effective July 23, 2009. The key implication of these amendments to our business model was to impose additional costs on the doctors and insurance companies that conduct business with our German operation and disrupt the normal flow of fitting hearing aids on the first visit to the doctor’s office.
We are currently renegotiating contracts in light of the new legislative requirements and are working to contract with other insurance companies as well. Although our German subsidiary is exploring and implementing alternative avenues for replacing the lost revenue, the lack of signed insurance contracts and the imposition of new and costly requirements on the ENT doctors and the insurance companies are expected to continue to impact sales in 2010. We are exploring other methods to sell our hearing aids through the existing distribution channel.
Germany represented 72% of Europe segment revenue as well as 75% of Europe segment operating profit for the year ended December 31, 2009 and 78% of Europe segment revenues and 95% of Europe segment operating profit for the year ended December 31, 2008.
Financial Results
Our operating loss of $38,730 for the year ended December 31, 2009, compared with the operating loss of $4,070 for the year ended December 31, 2008, was impacted mainly by the following items:
| • | First quarter and fourth quarter non-cash goodwill and definite-lived intangibles impairment charges of $14,658 and $15,872, respectively. These charges are for our operations in Germany and U.S. retail acquisitions completed from 2006 to 2008. |
| • | The legislative changes in Germany reduced our German sales and profitability. |
| • | A decline in North America sales as a result of customer and sales force attrition, a major buying group utilizing two additional manufacturers, the economic downturn, and modest market penetration of our RIC products. |
| • | The foreign exchange rate reduced profit as a result of the stronger dollar in 2009. |
Our sales and financial results for 2010 are expected to be driven by the following items:
| • | We launched the Touch product in all our major markets, including Germany, early in the fourth quarter 2009. Touch and ion are product types that are experiencing growing demand in the marketplace. |
| • | Launch of a power BTE product in early 2010. We currently do not have a featured product that fits the profound hearing loss, which is estimated to be 3 to 5% of the market. |
| • | Focus on improving the results of retail audiology practices we acquired from 2006 to 2008 by increasing marketing spending, implementing a new front end customer relationship management (“CRM”) system, and hiring new management with audiology and retail experience. |
| • | Continued cost savings initiatives. Reducing costs has been an ongoing company focus since early 2008, with the closure/restructuring or sale of four European operations and significant U.S. cost reductions. Manufacturing is expected to continue to lower purchased component costs, reduce headcount, outsource to lower cost geographies and improve manufacturing efficiencies. |
| • | Sales to the U.S. Veterans Administration (“VA”). We were awarded a contract with the VA to supply hearing aids to U.S. veterans beginning in November 2009. According to data from the Hearing Industry Association, the VA represents approximately 18% of the market for hearing aids and experienced unit growth of more than 25% annually this past year. We were successful in receiving an award in each of the categories in which we bid, allowing us to sell our custom, behind-the-ear and receiver-in-canal products through the VA. The contract award from the VA is a one-year contract with four one-year extensions, at the VA’s option. According to contract documents, the VA anticipates purchasing a total of approximately 430,000 hearing aids from all contract awardees in the first year, with steady growth in volume over the following four years. We currently expect to incur training and startup costs relating to the VA contract in the second quarter of 2010. |
| • | Foreign distributors added in late 2009 in large and key markets should begin selling products in 2010. |
Offsetting these developments will be the following factors:
| • | The likely continued decline of sales to insurance companies in our German operation and possible continued decline in North America wholesale. |
27
We will continue to review our strategic alternatives in light of the adverse events in Germany and focus on reducing costs, strengthening cash flow, expanding distribution channels, enhancing customer service, improving product quality, launching new products, sales programs, and improving operational efficiency.
RESULTS OF OPERATIONS
The following table sets forth selected statement of operations information for the periods indicated expressed as a percentage of net sales.
| For the years ended December 31, | |||||||||
| 2009 | 2008 | 2007 | |||||||
| Net sales |
100.0 | % | 100.0 | % | 100.0 | % | |||
| Cost of sales |
39.3 | 36.8 | 36.7 | ||||||
| Gross profit |
60.7 | 63.2 | 63.3 | ||||||
| Selling, general and administrative expense |
61.6 | 56.5 | 54.5 | ||||||
| Research and development expense |
6.8 | 6.6 | 7.2 | ||||||
| Goodwill and definite-lived intangible impairment charges |
32.0 | 1.7 | — | ||||||
| Restructuring charges |
0.7 | 1.6 | — | ||||||
| Operating income (loss) |
(40.4 | ) | (3.2 | ) | 1.6 | ||||
| Interest expense |
(0.5 | ) | (0.6 | ) | (0.5 | ) | |||
| Other income, net |
0.2 | 0.9 | 1.2 | ||||||
| Income (loss) before income taxes |
(40.7 | ) | (2.9 | ) | 2.3 | ||||
| Provision for income taxes |
0.3 | 0.1 | 0.8 | ||||||
| Income (loss) from continuing operations |
(41.0 | ) | (3.0 | ) | 1.5 | ||||
| Loss from discontinued operations, net of income taxes |
(0.1 | ) | (3.1 | ) | (0.9 | ) | |||
| Net income (loss) |
(41.1 | )% | (6.1 | )% | 0.6 | % | |||
Net Sales. Net sales consist of product sales less a provision for sales returns, which is made at the time of sale. Net sales by reportable operating segment by year were as follows:
| 2009 | 2008 | Change | 2007 | Change | |||||||||||
| North America |
$ | 33,687 | $ | 45,392 | (25.8 | )% | $ | 46,731 | (2.9 | )% | |||||
| Europe |
34,343 | 51,077 | (32.8 | )% | 47,092 | 8.5 | % | ||||||||
| Rest-of-World |
27,784 | 28,409 | (2.2 | )% | 25,239 | 12.6 | % | ||||||||
| Total net sales |
$ | 95,814 | $ | 124,878 | (23.3 | )% | $ | 119,062 | 4.9 | % | |||||
2009 Compared with 2008
The following chart reflects the significant components of sales activity in 2009 and 2008.
| North America | Europe | Rest-of-World | Total | |||||||||||||||||||||||||
| $ | % | $ | % | $ | % | $ | % | |||||||||||||||||||||
| Sales for the year ended December 31, 2008 |
$ | 45,392 | $ | 51,077 | $ | 28,409 | $ | 124,878 | ||||||||||||||||||||
| Organic growth (reduction) |
(11,404 | ) | (25.1 | )% | (14,917 | ) | (29.2 | )% | 1,383 | 4.9 | % | (24,938 | ) | (20.0 | )% | |||||||||||||
| Foreign currency |
(301 | ) | (0.7 | )% | (1,817 | ) | (3.6 | )% | (2,008 | ) | (7.1 | )% | (4,126 | ) | (3.3 | )% | ||||||||||||
| Sales for the year ended December 31, 2009 |
$ | 33,687 | (25.8 | )% | $ | 34,343 | (32.8 | )% | $ | 27,784 | (2.2 | )% | $ | 95,814 | (23.3 | )% | ||||||||||||
Net sales from continuing operations of $95,814 in 2009 decreased 23.3% from net sales of $124,878 in 2008. The decrease in sales was primarily due to legislative changes in Germany, the full effect of closing unprofitable European locations in 2008, difficulty in the North American market, retail acquisition integration issues, and the strengthening of the U.S. dollar for most of 2009. Organic decline in Europe was significantly impacted by locations which were subject to the 2008 restructuring initiative which reduced or eliminated certain operations, thereby resulting in reduced revenue but higher profitability, and Germany legislative changes. Organic growth in our Rest-of-World segment, which is primarily our Australian retail operation, was 4.9% for the year ended December 31, 2009.
28
North America net sales of $33,687 in 2009 decreased 25.8% from 2008 net sales of $45,392. The 2009 sales reduction was based primarily on lower volume ($10,700) and average selling prices represented the remaining difference. We have two types of sales in North America, wholesale and retail, each was down approximately 25%. The reduction in retail was primarily due to less money spent in marketing to bring in patients, turnover in selling personnel and integration difficulties. In wholesale, we had turnover in selling personnel, a major buying group representing approximately 11.8% of 2008 sales added two other manufacturers in late 2008, thereby reducing purchases from us, and competitor products which contain certain attractive features that are absent from our products. Otix was also impacted by wholesale customers reducing the number of manufacturers they utilize to obtain better pricing and to specialize and improve their fitting experience. The increase in the sophistication and complication of hearing aids makes it more difficult for customers to carry and be proficient in multiple lines. In 2010, we plan to focus on our previously acquired retail practices to optimize marketing spend and efficiency. We are not planning on acquiring business in 2010 for three reasons 1) most retail practices have lower profitability due to the current economic environment, resulting in lower selling prices, which generally is not agreeable to the owner; 2) to give us time to better assimilate previous acquisitions, drive efficiencies and improve profitability; and 3) to conserve capital.
Europe sales of $34,343 in 2009 decreased 32.8% from 2008 sales of $51,077. Europe sales were impacted by legislative/regulatory changes in Germany which significantly impacted our sales beginning in the second quarter of 2009 and the restructuring completed in the third quarter of 2008 in which we reduced or eliminated certain operations in Europe. The legislative changes in Germany and a small decrease in pricing caused an organic sales decline of approximately $13,234, or 79% of the decline in 2009 Europe sales. In the fourth quarter of 2009, organic sales in Germany were further reduced to 57.9% compared to the fourth quarter of 2008. In the 2008 restructuring, we outsourced one Europe division’s sales and administration functions, closed another Europe office, discontinued an unprofitable domiciliary European business, and sold retail stores in one European country that did not fit into our long-term strategy. These businesses had been generating operating losses of approximately $1,000 per quarter in 2008 when we announced this initiative, and in 2009 these operations generated a profit.
Rest-of-World sales of $27,784 in 2009 decreased 2.2% from 2008 sales of $28,409. Excluding the negative impact of 7.1% related to foreign currency, Rest-of-World organic sales grew by 4.9% over 2008. The primary increase in Rest-of-World sales was due to a pricing increase and a modest unit volume increase in our retail operation. The increase in pricing was due to the successful launch of Touch. Same store sales growth in our Australian retail was 7% in 2009. In 2010, to increase sales, we plan to add audiologists in offices in Australia where we have appointment backlogs.
We generally have a 60 day return policy for wholesale hearing aid sales and 30 days for retail sales. Provisions for sales returns for continuing operations were $7,396, or 7.2% of gross hearing aid sales in 2009 and $10,677, or 7.9% of gross hearing aid sales in 2008. The decrease was driven by a higher mix of retail sales. Retail sales are recognized after fitting and “acceptance,” which results in lower return rates, whereas in wholesale, revenue is recognized on shipment and a reserve is established for expected returns. We continue to increase retail sales as a percentage of our total sales resulting in a lower return rate. The return rates for retail and wholesale were essentially flat between 2009 and 2008. We believe that the hearing aid industry, particularly in the U.S., experiences a high level of product returns due to factors such as statutorily required liberal return policies and product performance that is inconsistent with hearing impaired consumers’ expectations.
2008 Compared with 2007
The following chart reflects the significant components of sales activity in 2008 and 2007.
| North America | Europe | Rest-of-World | Total | |||||||||||||||||||||||
| $ | % | $ | % | $ | % | $ | % | |||||||||||||||||||
| Sales for the year ended December 31, 2007 |
$ | 46,731 | $ | 47,092 | $ | 25,239 | $ | 119,062 | ||||||||||||||||||
| Organic growth (reduction) |
(9,844 | ) | (21.1 | )% | 897 | 1.9 | % | 2,975 | 11.8 | % | (5,972 | ) | (5.0 | )% | ||||||||||||
| Acquisitions |
8,320 | 17.8 | % | — | 0.0 | % | — | 0.0 | % | 8,320 | 7.0 | % | ||||||||||||||
| Foreign currency |
185 | 0.4 | % | 3,088 | 6.6 | % | 195 | 0.8 | % | 3,468 | 2.9 | % | ||||||||||||||
| Sales for the year ended December 31, 2008 |
$ | 45,392 | (2.9 | )% | $ | 51,077 | 8.5 | % | $ | 28,409 | 12.6 | % | $ | 124,878 | 4.9 | % | ||||||||||
29
Net sales from continuing operations of $124,878 in 2008 increased 4.9% from net sales of $119,062 in 2007. The increase in sales was primarily due to acquisitions and the weakening of the U.S. dollar for most of 2008. Organic changes in Europe were significantly impacted by locations which were subject to the restructuring initiative. Excluding these locations, organic growth in our Europe segment was 10.3% for the year ended December 31, 2008.
North America net sales of $45,392 in 2008 decreased 2.9% from 2007 net sales of $46,731. North America sales were positively impacted by our forward integration strategy as we acquired and opened retail audiology practices. However, offsetting this was the reduction in same-store-sales caused by the economy and integration issues. The organic reduction was also caused by lower sales in our North America wholesale division which was impacted by the shift in the hearing aid market to a RIC type product and lower average selling prices. The RIC product is very similar to our ion, but the receiver is placed in the tube going to the ear instead of in the body of the device. There is no industry data to support the size of the RIC market, but we estimate it was 25% or more of all products sold to independents in 2008. During late 2008, a buying group in our North America wholesale division added two other manufacturers to its line-up of products offered to its members. This buying group represented 11.8% of North America sales in 2008 and carried a gross margin of approximately 30%.
Europe sales of $51,077 in 2008 increased 8.5% from 2007 sales of $47,092. Europe sales were impacted by the restructuring announced in the second quarter 2008 in which we restructured and eliminated certain operations in Europe with the goal of streamlining processes, eliminating non-performing business units, and focusing on profitable opportunities. Excluding restructured operations in 2008, Europe sales would have increased 10.3%. Pricing in most major geographies in Europe was essentially flat year-over-year.
Rest-of-World sales of $28,409 in 2008 increased 12.6% from 2007 sales of $25,239, as a result of opening new retail stores coupled with a slight increase in average selling prices and a significant increase in volume in the equipment division, partially offset by lower prices in equipment to secure the business. Same store sales growth was 5%, which was higher than the market growth. We opened eight stores in 2007 and two stores in 2008.
We generally have a 60 day return policy for wholesale hearing aid sales and 30 days for retail sales. Provisions for sales returns for continuing operations were $10,677, or 7.9% of gross hearing aid sales, and $13,525, or 10.2% of gross hearing aid sales, in 2008 and 2007, respectively. The decrease was driven by a higher mix of retail sales. Retail sales are recognized after fitting and “acceptance,” which results in lower return rates, whereas in wholesale, revenue is recognized on shipment and a reserve is established for expected returns. We continue to increase retail sales as a percentage of our total sales resulting in a lower return rate. The return rates for retail and wholesale were essentially flat between 2008 and 2007.
Gross Profit. Cost of sales primarily consists of manufacturing costs, royalty expenses, quality costs, costs associated with product remakes and repairs (warranty) and amortization and depreciation expense. Gross profit and gross margin by reportable operating segment were as follows:
| 2009 | 2008 | 2007 | ||||||||||||||||
| Continuing operations |
||||||||||||||||||
| North America |
$ | 17,728 | 52.6 | % | $ | 27,105 | 59.7 | % | $ | 28,968 | 62.0 | % | ||||||
| Europe |
20,598 | 60.0 | % | 31,058 | 60.8 | % | 28,473 | 60.5 | % | |||||||||
| Rest-of-World |
19,795 | 71.2 | % | 20,711 | 72.9 | % | 17,945 | 71.1 | % | |||||||||
| Total gross profit |
$ | 58,121 | 60.7 | % | $ | 78,874 | 63.2 | % | $ | 75,386 | 63.3 | % | ||||||
2009 Compared with 2008
Gross profit from continuing operations of $58,121 in 2009 was down 26.3% from last year’s level of $78,874 primarily as a result of decreased net sales. Gross margin decreased from 63.2% in 2008 to 60.7% in 2009. The gross margin decreased due to lower volume in our manufacturing plant relative to fixed production costs, the stronger U.S. dollar, and higher warranty costs due to product mix.
North America gross margin decreased from 59.7% in 2008 to 52.6% in 2009 primarily as a result of lower volume in our manufacturing plant, mix of products sold and higher warranty costs per unit. Lower volume of approximately 18% in our North American operation impacted our costs per unit. Also, the RIC product line, which was launched in 2009, has higher material and warranty costs than our other products. The RIC product had an effect of cannibalizing ion, which is less expensive to manufacture. RIC is more expensive for a number of reasons, but foremost is the cost of the receiver unit which is situated outside the device.
Europe gross margin decreased slightly from 60.8% in 2008 to 60.0% in 2009 due primarily to mix. Sales to distributors are at a lower gross margin than that of our German retail sales. Partially offsetting this is our gross margin in Germany improved slightly due to the elimination of doctor and nurse fees for a significant portion of sales in 2009. We previously recorded the doctor and nurse fees as both revenue and cost of sales, but under the legislative changes we are not allowed to bill and collect this fee. Thus, sales and cost of sales are reduced an equal amount which improves our gross margin.
30
Rest-of-World gross margin also slightly decreased from 72.9% in 2008 to 71.2% in 2009 as a result of the strengthening of the U.S. dollar, partially offset by higher average selling prices driven by our Touch product. We source most of our cost of sales in U.S. dollars, so a strengthening U.S. dollar weakens our gross margins.
Provisions for warranty for continuing operations increased from $3,548 in 2008 to $4,005 in 2009 primarily due to higher expected material repair costs, and a higher overhead cost per unit due to lower volumes. In addition, the RIC warranty cost is expected to continue to be high as result of receiver replacements.
2008 Compared with 2007
Gross profit from continuing operations of $78,874 in 2008 was up 4.6% from last year’s level of $75,386 mainly as a result of increased net sales. Gross margin slightly decreased from 63.3% in 2007 to 63.2% in 2008. The gross margin decreased due to lower average selling prices in North America wholesale partially offset by a higher mix of retail sales and a weaker U.S. dollar and lower warranty costs.
North America gross margin decreased from 62.0% in 2007 to 59.7% in 2008 primarily as a result of lower selling prices in North America wholesale as a result of the economic environment, launching competitively-featured, low-priced products, and not having a RIC product which weakened our over-all product line, partially offset by a higher mix of retail sales. Retail sales carry a higher gross margin than our wholesale sales.
Europe gross margin increased from 60.5% in 2007 to 60.8% in 2008 due to a higher mix of retail sales and lower wholesale sales. The restructured operations that are continuing are wholesale operations with high volumes and low gross margins. The weaker U.S. dollar had a positive impact on reported sales and improving our gross margin in 2008.
Rest-of-World gross margin increased from 71.1% in 2007 to 72.9% in 2008 as a result of slightly higher average selling prices in retail. Gross margin was negatively impacted by lower gross margins in equipment sales as a result of a recently awarded government contract for the sale of equipment for which we are a distributor. Sales related to the contract are at a lower gross margin than our existing business.
Provisions for warranty for continuing operations decreased from $4,736 in 2007 to $3,548 in 2008 primarily due to a decrease in North America sales volume, a decline in the rate at which our products need repair in the warranty period, shortening of warranty periods, a stronger U.S. dollar, and product mix shift towards standard products which generally carry a lower warranty cost than custom devices.
Selling, General and Administrative. Selling, general and administrative expense primarily consists of wages and benefits for sales and marketing personnel, sales commissions, promotions and advertising, marketing support, distribution and administrative, stock compensation, and depreciation and amortization expenses.
Selling, general and administrative expense in dollars and as a percent of sales by reportable operating segment by year was as follows:
| Year ended December 31, | ||||||||||||||||||
| 2009 | 2008 | 2007 | ||||||||||||||||
| Continuing operations |
||||||||||||||||||
| North America |
$ | 28,992 | 86.1 | % | $ | 35,832 | 78.9 | % | $ | 32,439 | 69.4 | % | ||||||
| Europe |
13,966 | 40.7 | % | 17,560 | 34.4 | % | 17,088 | 36.3 | % | |||||||||
| Rest-of-World |
16,107 | 58.0 | % | 17,123 | 60.3 | % | 15,405 | 61.0 | % | |||||||||
| Total selling, general and administrative |
$ | 59,065 | 61.6 | % | $ | 70,515 | 56.5 | % | $ | 64,932 | 54.5 | % | ||||||
2009 Compared with 2008
The following chart reflects the components of the reductions in selling, general and administrative expense for the year ended December 31, 2009.
31
| North America | Europe | Rest-of-World | Total | |||||||||||||||||||||||||
| $ | % | $ | % | $ | % | $ | % | |||||||||||||||||||||
| Selling, general and administrative expense for the year ended December 31, 2008 |
$ | 35,832 | $ | 17,560 | $ | 17,123 | $ | 70,515 | ||||||||||||||||||||
| Organic growth (reduction) |
(6,754 | ) | (18.8 | %) | (3,188 | ) | (18.2 | %) | 205 | 1.2 | % | (9,737 | ) | (13.8 | %) | |||||||||||||
| Foreign currency |
(86 | ) | (0.3 | %) | (406 | ) | (2.3 | %) | (1,221 | ) | (7.1 | %) | (1,713 | ) | (2.4 | %) | ||||||||||||
| Selling, general and administrative expense for the year ended December 31, 2009 |
$ | 28,992 | (19.1 | %) | $ | 13,966 | (20.5 | %) | $ | 16,107 | (5.9 | %) | $ | 59,065 | (16.2 | %) | ||||||||||||
Selling, general and administrative expense from continuing operations was $59,065, in 2009, a decrease of $11,450, or 16.2%, from selling, general and administrative expense of $70,515 in 2008. Selling, general and administrative expense decreased due to cost reductions and improved efficiencies in operations. Translation of foreign currencies into the U.S. dollar also accounted for 2.4% of the reduction due to a stronger dollar.
North America selling, general and administrative expense of $28,992 decreased $6,840 or 19.1% for the year ended 2009 over the prior year amount of $35,832 as a result of cost cutting and headcount reductions. All divisions have been subject to cost cutting efforts. We have eliminated approximately 40% of our workforce over the last two years in the North American operations, excluding our U.S. retail operation. We moved our Salt Lake City corporate office in November 2009, which resulted in approximately $500 in annual savings. We reduced our advertising and convention costs in 2009, and plan to further reduce these costs in 2010. We launched Touch in 2009 at a major sales event for approximately 200 customers in Las Vegas at a cost of approximately $500. In 2010, we will be launching a number of new products, but the costs to do so will be significantly less compared to previous launches. We will increase our spending for the VA training and support in 2010, particularly in the second quarter. The contract started in November 2009 and we have training events scheduled in the first and second quarter of 2010. Also, we will increase our spending on advertising for our retail locations in an effort to drive more traffic into those locations.
Europe selling, general and administrative expense decreased $3,594 in the year ended December 31, 2009 compared with the same period in the prior year of $17,560, due to our restructuring efforts. We outsourced one operation, and combined another with existing operations. Two other operations affected by the restructuring plan were classified as discontinued operations. The German legislative changes had a dramatic impact on our sales, but not expenses in 2009. We retained our German employee base over the summer and into the fall 2009 with the expectation that we would be able to sign contracts with insurance companies and reestablish the business. However, based on our evolving assessment of the situation, and the timing of any potential return of the insurance business, we eliminated thirteen positions in the fourth quarter of 2009.
Rest-of-World selling, general and administrative expense decreased in the year ended December 31, 2009 from the year ended December 31, 2008 resulting from the translation of foreign currency into U.S. dollars. Selling, general and administration costs as a percentage of sales decreased from 60.3% to 58.0% from 2009 to 2008. Our Australian operation reduced overhead costs in 2009, and reallocated these reductions to marketing expenditures. As a result, operating profit as a percentage of sales improved approximately 2%.
2008 Compared with 2007
The following chart reflects the components of the growth in selling, general and administrative expense for the year ended December 31, 2008.
| North America | Europe | Rest-of-World | Total | ||||||||||||||||||||||||
| $ | % | $ | % | $ | % | $ | % | ||||||||||||||||||||
| Selling, general and administrative expense for the year ended December 31, 2007 |
$ | 32,439 | $ | 17,088 | $ | 15,405 | $ | 64,932 | |||||||||||||||||||
| Organic growth (reduction) |
(2,967 | ) | (9.1 | %) | (764 | ) | (4.5 | %) | 1,438 | 9.3 | % | (2,293 | ) | (3.5 | %) | ||||||||||||
| Acquisitions |
6,289 | 19.4 | % | — | 0.0 | % | — | 0.0 | % | 6,289 | 9.7 | % | |||||||||||||||
| Foreign currency |
71 | 0.2 | % | 1,236 | 7.3 | % | 280 | 1.9 | % | 1,587 | 2.4 | % | |||||||||||||||
| Selling, general and administrative expense for the year ended December 31, 2008 |
$ | 35,832 | 10.5 | % | $ | 17,560 | 2.8 | % | $ | 17,123 | 11.2 | % | $ | 70,515 | 8.6 | % | |||||||||||
32
Selling, general and administrative expense from continuing operations was $70,515, in 2008, an increase of $5,583, or 8.6%, from selling, general and administrative expense of $64,932 in 2007. Selling, general and administrative expense increased due to the expansion of our vertical integration strategy and the impact of translation of foreign currencies into the U.S. dollar. Partially offsetting this was the expense reduction initiative begun in early 2008.
Selling, general and administrative expense increased in North America in 2008 as a result of newly acquired retail operations. We did partially offset these increased costs with a reduction in marketing costs and headcount in our wholesale operation. We launched Velocity in 2007 at a major sales event for approximately 400 customers in Cancun, Mexico at a cost of approximately $1,300. In 2008, we launched eight new products, but the costs to do so were significantly lower compared to 2007 as a result of not having an event. We are launching our RIC product in the second quarter of 2009 at a cost in excess of $500.
Europe selling, general and administrative expense increased in the year ended December 31, 2008 compared with the same period in the prior year due to foreign currency movements partially offset by a reduction in costs in those operations we restructured.
Rest-of-World selling, general and administrative expense increased in the year ended December 31, 2008 from the year ended December 31, 2007 resulting from the full year 2008 impact of opening eight new stores in 2007, the opening of two new stores in 2008, and the translation of foreign currency into U.S. dollars.
Research and Development. Research and development expense primarily consists of wages and benefits for our North American based research and development, engineering, regulatory and clinical personnel and also includes consulting, intellectual property, clinical studies and engineering support costs.
2009 Compared with 2008
Research and development expense of $6,487, or 6.8% of net sales from continuing operations in 2009 decreased $1,779 or 21.5% when compared to the research and development expense of $8,266, or 6.6% of net sales from continuing operations in 2008. The decrease is a result of eliminating approximately 20 positions in the second quarter of 2009. We are outsourcing more of our research and development activities and therefore, we expect that our royalty costs, classified in cost of sales, will increase slightly to offset a portion of the reduced research and development expenditures. We anticipate that outsourcing some of our research and development will effectively expand our product offerings.
2008 Compared with 2007
Research and development expense of $8,266, or 6.6% of net sales from continuing operations in 2008 decreased 3.3% when compared to the research and development expense of $8,547, or 7.2% of net sales from continuing operations in 2007. The decrease is a result of timing and stage of development of new products. In 2007, we launched a number of products with new BTE case designs, which are costly to develop. In 2008, the number of new products developed and launched was higher, but the cost to do so was lower as a result of fewer developed BTE cases.
Asset Impairment and Restructuring Charges. During 2009 and 2008, we had a number of restructuring activities in our North America and Europe segments which included reducing the total number of employees, restructuring certain operations, eliminating excess facilities, and impairing certain intangible assets. We also recorded impairments of goodwill and definite-lived intangibles.
We recorded a goodwill and definite-lived intangible impairment charge of $15,872 for the quarter ended December 31, 2009. This impairment charge is not expected to result in future cash outlays. Our testing of (i) long-lived assets in accordance with Accounting Standards Codification (“ASC”) 360-10, “Property, Plant, and Equipment” (“ASC 360-10”) and (ii) goodwill in accordance with ASC 350, “Intangibles-Goodwill and Other”, indicated an impairment in the U.S. retail reporting unit of our North America operating segment. We determined that the definite-lived intangibles associated with our U.S. retail reporting unit were impaired and recorded a $3,440 charge related to customer relationships. In addition, based on ASC 350, subsequent to analyzing our long-lived assets for impairment, we are also required to analyze goodwill for impairment at least annually. As part of our annual review, performed in conjunction with our review of long-lived assets, we determined that the carrying amount of our U.S. retail reporting unit exceeded its fair value as a result of lower current and projected sales. Our impairment analyses for our U.S. retail reporting unit estimated fair value under the income approach valuation technique. The income approach included a discounted cash flow model, and we also considered current trends in retail sale transaction multiples (market approach). We then compared the implied fair value of the reporting unit with the carrying amount of that unit’s goodwill, and recorded a $12,432 goodwill impairment charge, resulting in a total impairment charge of $15,872.
During 2009, we implemented actions to improve profitability by 1) reducing the total number of employees in North America; 2) closing three U.S. retail locations resulting in a restructuring charge of $98 and goodwill and definite-lived intangible write-off of $135; and 3) reducing headcount and selling two retail shops in Europe. The total restructuring charges from these actions was $769, of which $634 is recorded in restructuring charges and $135 is recorded in goodwill and definite lived impairment charges in the Company’s Consolidated Statements of Operations. The $634 includes $158 in sale proceeds from the two European shop sales.
33
Legislation passed by the Federal Council of Germany in November 2008 and which became effective on April 1, 2009, resulted in changes that required our German subsidiary to renegotiate contracts with insurance companies and ENT doctors. In the first three months of 2009, we believed our German subsidiary was making progress, having successfully renegotiated contracts representing approximately 27% of our 2008 German revenue. However, on April 1, 2009, we were notified by one large insurance company representing approximately 25% of our German revenue that, despite several months of favorable negotiations they were refusing to enter into a contract; therefore, our German subsidiary filed a lawsuit in the Social Court in Hamburg, Germany against this insurance company, requesting that the court compel the insurance company to enter into a contract with our German subsidiary. On April 28, 2009, the Court rejected these claims. In addition, a number of other insurance companies were unsure if they should sign a contract because there were rumors that the newly enacted law could potentially change again, thus requiring the need to renegotiate again. Without renegotiated insurance contracts, and the ability to pay customary fitting fees to the ENT doctors, we expected revenue to decline substantially and cash flow of the operation would not be sufficient to support our intangibles balances. Accordingly, we recognized a $14,658 non-cash write-off of our goodwill and trade name associated with our German operation in the first quarter of 2009.
The 2008 goodwill impairments resulted from the decision to cease operations in one European country and write-off the associated goodwill of $690; and the decision to sell operations in another European country where the pending sales offer did not support the goodwill balance and we recorded an estimated impairment loss of $1,119. The sale agreement was finalized and the transaction closed during the third quarter 2008, resulting in a loss on sale of $85, which included a goodwill write-off of $455. We also recorded a $352 charge to expense a trade name in one of the affected European countries based on a decision in the second quarter 2008 to cease using the trade name.
The following is a breakdown of the restructuring charges and goodwill and definite-lived intangible impairments for the years ended December 31, 2009 and 2008:
| 2009 | 2008 | ||||||
| Personnel |
$ | 757 | $ | 1,409 | |||
| Facilities |
35 | 271 | |||||
| Impairment & Other |
(158 | ) | 372 | ||||
| Restructuring charge |
634 | 2,052 | |||||
| Goodwill and definite-lived intangible impairments |
30,665 | 2,111 | |||||
| Total |
$ | 31,299 | $ | 4,163 | |||
With the exception of $609 and $1,790 in 2009 and 2008, respectively, the remaining charges above were non-cash charges.
Other Income and Interest Expense. Other income primarily consists of foreign currency gains and losses and interest income and expense and other non-operating gains and losses. Details by year are as follows:
| 2009 | 2008 | 2007 | ||||||||||
| Interest income |
$ | 346 | $ | 606 | $ | 1,026 | ||||||
| Foreign currency exchange gain (loss) |
(157 | ) | (111 | ) | 378 | |||||||
| Other |
45 | 672 | 24 | |||||||||
| Total Other Income |
234 | 1,167 | 1,428 | |||||||||
| Interest expense |
(481 | ) | (755 | ) | (548 | ) | ||||||
| Total |
$ | (247 | ) | $ | 412 | $ | 880 | |||||
2009 Compared with 2008
Other income, net was a loss of $247 in 2009 compared to a gain of $412 in 2008. The difference is the result of a reduction in interest income caused by both a lower investment balance and a lower interest rate in 2009, higher foreign currency losses in 2009, and the sale of a patent in 2008 to the Bose Corporation, partially offset by lower interest expense as we pay down seller notes and enter into new revolver borrowings with lower interest rates.
34
2008 Compared with 2007
Other income was $412 in 2008 compared to $880 in 2007. The key differences in the year ended December 31, 2008 from December 31, 2007 are a reduction in interest income caused by both a lower investment balance and a lower interest rate, higher interest expense as a result of additional seller financing notes for the retail practices we purchased, a gain on revaluation of intercompany balances in 2007 whereas, in 2008, we had a small loss due to the strengthening of the U.S. dollar, and a sale of a patent to the Bose Corporation in 2008 included above in Other.
Provision (Benefit) for Income Taxes. Provision (benefit) is made for taxes on pre-tax income (loss). In some jurisdictions net operating loss carry-forwards reduce or offset tax provisions.
Tax expense from continuing operations of $324 in 2009 is primarily the result of taxable income generated in foreign locations, the settlement of an audit in Germany of $566 covering the period from 2004 to 2007, a credit of $304 related to a reversal of a deferred income tax liability established for the U.S. goodwill amortization, reversed coincident with the retail goodwill impairment, and partially offset by state tax expense in the U.S. In 2008, we had a valuation allowance reversal on certain tax assets in Australia of $1,305 based on a determination that this location would continue to generate operating profits which offset the income taxes in other locations.
Income taxes in the U.S. and various foreign locations have been largely negated by our net operating loss carryforwards. Net operating loss carryforwards available to offset future taxable income as of December 31, 2009 were $38,245 in the U.S. and $10,383 outside the U.S. We continue to maintain a full valuation allowance on our U.S. and all of our non-U.S. deferred income tax assets with the exception of Australia and Germany, and we periodically assess the realization of these deferred income tax assets in these countries. Income tax expense in each of our major geographies is based on transfer pricing studies. The pricing is based on sales, and an acceptable profit margin, therefore our income tax expense should be fairly consistent in each year.
2008 Compared with 2007
Tax expense from continuing operations of $62 in 2008 is primarily a result of taxable income generated in foreign locations, amortization of goodwill for tax purposes, and state taxes in the U.S., offset by the reversal of our valuation allowance on certain deferred tax assets in Australia of $1,305 in 2008. The foreign location improved operations over the past three years, and it became apparent that this location would continue to generate operating profits. The 2008 tax expense from continuing operations was $62 compared to a tax expense of $977 in 2007. In 2007, we reduced our net deferred tax liabilities and recorded an income tax benefit of $64 as a result of changes in German income tax rates which are effective for periods beginning January 1, 2008 The effective income tax rate from continuing operations in 2008 was (1.7%), a decrease of 36.7% from an effective tax rate from continuing operations in 2007 of 35.0%, due mainly to the reversal of the valuation allowance in a foreign location, the mix of profitability by country, and having valuation allowances recorded against our deferred tax assets in certain jurisdictions.
Discontinued operations. Discontinued operations in 2009 related primarily to sales returns from operations closed in 2008. In 2008, we had a number of entities in Europe which lacked sufficient market share to effectively compete. Therefore, we restructured and eliminated certain operations in Europe with the goal of streamlining processes, eliminating non-performing business units, and focusing on profitable opportunities. On September 1, 2008, we sold one European operation and closed a second European operation. These are classified as discontinued operations in the Statement of Operations.
On February 20, 2007, we sold Tympany to a group of private investors. Therefore, our Auditory Testing equipment division has been classified as a discontinued operation.
35
The following amounts related to discontinued operations (our two Europe divisions and Tympany) have been segregated from continuing operations:
| Years ended December 31, | ||||||||||||
| 2009 | 2008 | 2007 | ||||||||||
| Net sales |
$ | (50 | ) | $ | 1,266 | $ | 3,743 | |||||
| Loss from discontinued operations, net of zero taxes |
$ | (51 | ) | $ | (1,141 | ) | $ | (1,208 | ) | |||
| Restructuring charge, net of zero taxes |
— | (2,678 | ) | — | ||||||||
| Gain (loss) on sale of discontinued operations, net of zero taxes |
— | (85 | ) | 115 | ||||||||
| Loss from discontinued operations, net of zero taxes |
$ | (51 | ) | $ | (3,904 | ) | $ | (1,093 | ) | |||
LIQUIDITY AND CAPITAL RESOURCES
Our cash flows from operating, investing and financing activities, as reflected in the Consolidated Statement of Cash Flows for the years ended December 31, 2009, 2008 and 2007 are summarized as follows:
| For the year ended December 31, | ||||||||||||
| 2009 | 2008 | 2007 | ||||||||||
| Net cash provided by operating activities |
$ | 2,158 | $ | 6,681 | $ | 1,379 | ||||||
| Net cash used in investing activities |
(2,097 | ) | (8,173 | ) | (2,551 | ) | ||||||
| Net cash provided by (used in) financing activities |
(1,250 | ) | (189 | ) | 3,210 | |||||||
| Effect of exchange rate changes on cash and cash equivalents |
214 | (404 | ) | 486 | ||||||||
| Net increase (decrease) in cash and cash equivalents |
(975 | ) | (2,085 | ) | 2,524 | |||||||
| Cash and cash equivalents, beginning of the year |
13,129 | 15,214 | 12,690 | |||||||||
| Cash and cash equivalents, end of the year |
$ | 12,154 | $ | 13,129 | $ | 15,214 | ||||||
Net cash provided by operating activities from continuing operations was $2,224 in 2009. Loss from continuing operations of $39,301 was positively affected by certain non-cash expenses including depreciation and amortization of $4,059; stock-based compensation of $1,420; non-cash goodwill and definite-lived intangible impairment charges of $30,665; non-cash restructuring charge of $25; amortization of imputed interest on long-term debt of $89; non-cash loss on disposal of assets of $7 related to restructuring; and non-cash foreign currency losses of $314; partially offset by the reversal of a deferred tax liability $632. Positive cash flows resulted from changes in assets and liabilities, including a decrease in accounts receivable of $7,544 which resulted from lower sales and improved management of receivables during the year ended December 31, 2009; a decrease in inventory of $2,318, which was primarily the result of a focus on inventory management and a decrease in other assets of $423. Partially offsetting the positive cash flows is a decrease in accrued restructuring of $413; a decrease in accounts payable, accrued liabilities and deferred revenue of $4,226 as a result of cost cutting initiatives which lowered spending, and withholding taxes remitted on share-based awards of $68.
Net cash used in operating activities of discontinued operations was $66 in 2009.
Net cash provided by operating activities from continuing operations was $7,908 in 2008. Loss from continuing operations of $3,720 was positively affected by certain non-cash expenses including depreciation and amortization of $4,823; stock-based compensation of $1,867; non-cash goodwill impairment charge of $2,111; non-cash restructuring charge of $262; amortization of imputed interest on long-term debt of $322; non-cash loss on disposal of assets of $132 related to restructuring; and deferred income taxes of $37; partially offset by the reversal of a deferred tax valuation allowance of $1,305 and foreign currency gains of $10. Positive cash flows resulted from changes in assets and liabilities, including a decrease in accounts receivable of $3,294 which resulted from improved management of receivables during the year ended December 31, 2008; a decrease in inventory of $2,379, which was primarily the result of inventory management improvements; and an increase in accrued restructuring of $757. Partially offsetting the positive cash flows is a decrease in accounts payable, accrued liabilities and deferred revenue of $2,799 as a result of our 2008 restructuring, which lowered spending; withholding taxes remitted on share-based awards of $218, and an increase in other assets of $24.
Net cash used in operating activities of discontinued operations was $1,227 in 2008.
Net cash provided by operating activities from continuing operations was $1,953 in 2007. Positive cash flow resulted from income from continuing operations of $1,810 and was positively affected by certain non-cash expenses including depreciation and amortization of $4,256, stock-based compensation of $1,436, and amortization of imputed interest of $266, partially offset by foreign currency gains of $281 and deferred income taxes of $22. Positive cash flow also resulted from a decrease in other assets of $294. Partially offsetting these positive cash flow items was a decrease in accounts payable, accrued expenses and deferred revenue of
36
$1,513; an increase in inventory of $2,050 which was primarily the result of an inventory build for safety stock and new product launches; an increase in accounts receivable of $1,829 which was the result of increased sales in 2007 over 2006 and slower payments in Europe in 2007; and withholding taxes remitted on share-based awards of $414.
Net cash used in operating activities of discontinued operations was $574 in 2007.
Net cash used in investing activities of $2,097 in 2009 resulted from the purchase of property and equipment of $3,468 partially offset by net cash collections from customer loans of $1,371. Significant purchases in 2009 of property and equipment were for a retail CRM system, leasehold improvements and molds for standard products.
Net cash used in investing activities of $8,173 in 2008 resulted from payment relating to acquisitions of businesses of $4,779, the purchase of property and equipment of $3,057, net customer advances of $804, and the purchase of a technology license of $250, partially offset by proceeds from the sale of assets from a Europe division of $717.
Net cash used in investing activities of $2,551 in 2007 resulted from the purchase of property and equipment of $2,505, net customer advances of $741, and payments relating to acquisitions of businesses and contingent consideration of $7,342, partially offset by proceeds from the sale of marketable securities of $6,989 and proceeds from the sale of assets related to discontinued operations and cash provided by discontinued operations (Tympany and Europe division) of $1,048.
Net cash used in financing activities of $1,250 in 2009 resulted from principal loan payments of $4,670 partially offset by taxes collected on restricted stock awards of $43, a reduction of $261 in restricted cash, and net borrowings on our line of credit of $3,116.
Net cash used in financing activities of $189 in 2008 resulted from a decrease in restricted cash, cash equivalents and marketable securities of $5,124 in connection with a loan for a Europe division, and option exercises of $6. These positive cash flow items were offset by principal loan payments of $5,319.
Net cash provided by financing activities from continuing operations of $3,210 in 2007 resulted from stock option exercises of $3,710, and net proceeds from a decrease in restricted cash, cash equivalents and marketable securities of $1,318. These positive cash flow items were partially offset by principal loan payments of $1,818.
Our cash and cash equivalents, including restricted amounts, totaled $12,225 as of December 31, 2009. We anticipate that with the improvement of our Germany business will require working capital to fund the expected sales growth. We expect lower capital expenditures and debt repayments in 2010 than in 2009. Additionally, we expect to have incremental borrowing capacity on our line of credit based on the March 2010 amendment. As of December 31, 2009, our outstanding borrowings of $3,116 represented the maximum allowable borrowing under the terms of the then-existing agreement. While recent turmoil in the global financial markets has limited access to capital for many companies, we are not aware of any issues currently impacting our lender’s ability to honor their commitment to lend under the revolving credit facility. It is unclear the extent to which the credit crisis will persist and what overall impact it may have. We believe that our cash and cash equivalents balance, along with cash flows from operations, and our available revolving credit facility will be adequate to meet our operating, working capital and investment requirements for the next year.
Commitments. Our contractual obligations as of December 31, 2009 were as follows:
| For the years ending December 31, | |||||||||||||||
| Total | 2010 | 2011 – 2012 | 2013 – 2014 | After 2014 | |||||||||||
| Long-term debt including interest |
$ | 2,213 | $ | 1,838 | $ | 375 | $ | — | $ | — | |||||
| Line of credit |
3,116 | 3,116 | — | — | — | ||||||||||
| Operating leases |
10,056 | 3,463 | 4,296 | 1,585 | 712 | ||||||||||
| Payable to former owners of Tympany |
417 | 417 | — | — | — | ||||||||||
| Purchase commitments |
3,804 | 3,804 | — | — | — | ||||||||||
| Minimum royalty payments |
300 | 120 | 120 | 60 | — | ||||||||||
| Total |
$ | 19,906 | $ | 12,758 | $ | 4,791 | $ | 1,645 | $ | 712 | |||||
As of December 31, 2009, we had unrecognized tax benefits of $279 of which $249 is recorded as a liability and which could result in cash outlays in the event of unfavorable taxing authority rulings.
37
In connection with our retail acquisitions, we generally issue non-interest bearing promissory notes that provide for additional payments on the first and second anniversary dates following the closing date. In 2009, we did not have any retail acquisitions. In 2008, we issued $1,135 in non-interest bearing promissory notes relating to retail acquisitions of which $816 was due and paid in 2009 and $319 is due in 2010, of which we paid $250 on January 4, 2010.
Recent Accounting Pronouncements. ASC 805, “Business Combinations” became effective for fiscal years beginning after December 15, 2008. This standard requires the acquiring entity in a business combination to recognize all (and only) the assets acquired and liabilities assumed in the transaction, establishes the acquisition-date fair value as the measurement objective for all assets acquired and liabilities assumed, and requires the acquirer to disclose to investors and other users all of the information they need to evaluate and understand the nature and financial effect of the business combination. The adoption of ASC 805 did not have a material impact on the consolidated financial statements.
ASC 810, “Consolidation”, which is effective for fiscal years beginning after December 15, 2008, requires all entities to report non-controlling (minority) interests in subsidiaries in the same way as equity in the consolidated financial statements. The adoption of ASC 810, effective January 1, 2009, did not have a material impact on the consolidated financial statements.
ASC 855, “Subsequent Events”, which provides guidance to establish general standards of accounting for and disclosures of events that occur after the balance sheet date but before financial statements are issued or are available to be issued. ASC 855 is effective for interim or fiscal periods ending after June 15, 2009. The adoption of this standard did not have a material impact on our consolidated financial statements.
ASC 105, “Generally Accepted Accounting Principles”, which is effective for financial statements issued for interim and annual periods ending after September 15, 2009, establishes the Financial Accounting Standards Board (“FASB”) Accounting Standards Codification™ (“Codification”), which supersedes all existing accounting standard documents and became the single source of authoritative non-governmental U.S. generally accepted accounting principles. All other accounting literature not included in the Codification will be considered non-authoritative. We have conformed our financial statements and related notes to the new Codification for the year ended December 31, 2009.
ASU 2009-13, “Revenue Recognition (ASU Topic 605) – Multiple Deliverable Revenue Arrangements”, a consensus of the FASB Emerging Issues Task Force which is effective for us in the first quarter of fiscal year 2011, with early adoption permitted, modifies the fair value requirements of ASC subtopic 605-25, “Revenue Recognition-Multiple Element Arrangements”, by allowing the use of the “best estimate of selling price” in addition to vendor-specific objective evidence (“VSOE”) and verifiable objective evidence (“VOE”) (now referred to as “TPE” standing for third-party evidence) for determining the selling price of a deliverable. A vendor is now required to use its best estimate of the selling price when VSOE or TPE of the selling price cannot be determined. In addition, the residual method of allocating arrangement consideration is no longer permitted. In October 2009, the FASB also issued ASU 2009-14, “Software (ASC Topic 985) – Certain Revenue Arrangements That Include Software Elements”, a consensus of the FASB Emerging Issues Task Force. This guidance modifies the scope of ASC subtopic 965-605, “Software-Revenue Recognition”, to exclude from its requirements (a) non-software components of tangible products and (b) software components of tangible products that are sold, licensed, or leased with tangible products when the software components and non-software components of the tangible product function together to deliver the tangible product’s essential functionality. This update requires expanded qualitative and quantitative disclosures once adopted. We are currently evaluating the impact of adopting these pronouncements and do not expect the standard to have a material impact on our consolidated financial statements.
CRITICAL ACCOUNTING POLICIES
The methods, estimates and judgments we use in applying our most critical accounting policies have a significant impact on the results we report in our consolidated financial statements. The SEC has defined critical accounting policies as those that are most important to the portrayal of our operating results and financial condition and which require us to make our most difficult and subjective judgments, often based on matters that are highly uncertain at the time of estimation. Based on this definition, our most critical policies include: revenue recognition (including sales returns), warranty accruals, valuation of intangible assets and income taxes. Below, we discuss these policies further, as well as the estimates and judgments involved. We also have other key accounting policies and accounting estimates relating to uncollectible accounts receivable and valuation of inventory. We believe that these other key accounting policies and other accounting estimates either do not generally require us to make estimates and judgments that are as difficult or as subjective, or it is less likely that they would have a material impact on our results of operations and financial condition for a given period.
38
Revenue Recognition
Sales of hearing aids are recognized when (i) products are shipped, except for retail hearing aid sales, which are recognized upon acceptance by the consumer, (ii) persuasive evidence of an arrangement exists, (iii) title and risk of loss has transferred, (iv) the price is fixed or determinable, (v) contractual obligations have been satisfied, and (vi) collectability is reasonably assured. Revenues related to sales of separately priced extended service contracts are deferred and recognized on a straight-line basis over the contractual periods. Deferred revenue also includes cash received prior to all revenue recognition criteria being met (for example, customer acceptance). We generally have a 60 day return policy for wholesale and 30 days for retail hearing aid sales, and allowances for sales returns and rebates are reflected as a reduction of sales and accounts receivable at the time of sale. We analyze the rate of historical returns by geography, by product family and by model, as appropriate, when evaluating the adequacy of the provision for sales returns. If actual sales returns for any particular product or in any particular geography differ from our estimates, revisions to the sales returns and allowance reserve will be required.
The aforementioned revenue recognition discussion also applies to distributor sales. Distributor sales generally contain payment terms ranging from 30 to 90 days, provide a six month warranty, and assess a restocking fee of 25 percent of purchase price for returned units. We do not grant price protection or concession rights to distributors.
Warranty Accruals
Our products are sold with warranties that require us to remedy deficiencies in quality or performance over specified periods of time, typically one to three years depending upon product and geography. We analyze the amount of historical warranty by geography, by product family, by model, and by warranty period, as appropriate, when evaluating the adequacy of the accrual. Warranty costs are mainly affected by product failure rates, the cost of material and labor necessary to service the product and the cost of shipping the product to and from our customers. If actual product failure rates or repair and remake costs differ from our estimates, revisions to the warranty accrual will be required.
Valuation of Intangible Assets
We evaluate our goodwill and indefinite-lived intangible asset (arrangement with the Australian government to supply hearing aids) on an annual basis in the fourth quarter of each year or whenever a triggering event occurs, which may be an indicator of impairment. In conducting the evaluation, we apply various techniques to estimate fair values. These techniques are inherently subjective and the resulting values are not necessarily representative of the values we might obtain in a sale of a reporting unit or our indefinite-lived intangible asset to a willing third party. If this evaluation indicates that the value of the goodwill and indefinite-lived intangible asset may be impaired, we make an assessment of the amount of the impairment. Any such impairment charge could be significant and could have a material adverse effect on our results of operations and financial position. In addition, we evaluate the indefinite-lived intangible asset to determine if the life continues to be “indefinite.”
We evaluate our definite-lived intangible assets for indications of impairment whenever events or changes in circumstances indicate that the carrying value may not be recoverable. Definite-lived intangible assets include technology, brand names, distribution agreements, customer relationships and databases, trademarks, trade-names and covenants not to compete. Factors that could trigger an impairment review include significant under-performance relative to expected historical or projected future operating results, significant changes in the manner of our use of the acquired assets or the strategy for our overall business, or significant negative industry or economic trends. If this evaluation indicates that the value of an asset may be impaired, we make an assessment of the recoverability of the net carrying value of the asset over its remaining useful life. If the asset is not recoverable based on the estimated undiscounted future cash flows of the acquired entity or technology over the remaining amortization period, we will reduce the carrying value of the related asset to fair value and may adjust the remaining amortization period. Any such impairment charge could be significant and could have a material adverse effect on our results of operations and financial position.
In accordance with the ASC 360-10, “Property, Plant and Equipment”, long-lived assets such as property, plant, and equipment, and purchased intangible assets subject to amortization, are amortized over their respective estimated useful lives and are reviewed for impairment whenever events or changes in circumstances indicate that the carrying amount of an asset or asset group may not be recoverable. Recoverability of assets to be held and used is measured by a comparison of the carrying amount of an asset or asset group to estimated undiscounted future cash flows expected to be generated by the asset or asset group. If the carrying amount of an asset or asset group exceeds its estimated future cash flows, an impairment charge is recognized in the amount by which the carrying amount of the asset exceeds the fair value of the asset or asset group. As of December 31, 2009, we performed the aforementioned tests and recorded a $3,440 charge to impair various customer databases used in one of our reporting units in our North America operating segment.
Goodwill represents the excess of the cost of businesses acquired over the fair value of the assets acquired and liabilities assumed. In accordance with the provisions of ASC 350, “Intangibles- Goodwill and Other”, we do not amortize goodwill, but we test it for impairment annually using a fair value approach at the “reporting unit” level. In accordance with ASC 350, a reporting unit is the operating segment, or a business one level below that operating segment (the “component” level) if discrete financial information is prepared and regularly reviewed by our senior management. However, components are aggregated as a single reporting unit if they have similar economic characteristics.
39
Goodwill and intangible assets that have indefinite useful lives are tested annually for impairment at year end, or more frequently if impairment indicators are present. Such indicators of impairment include, but are not limited to, changes in our business climate, and operating or cash flow losses related to such assets. To measure the amount of an impairment loss, the standard prescribes a two-step method. The first step requires us to determine the fair value of the reporting unit and compare that fair value to the net book value of the reporting unit. The fair value of the reporting unit is determined using the income approach (discounted cash flow analysis). Under the income approach, the fair value of the asset is based on the value of the estimated cash flows that the asset can be expected to generate in the future. These estimated cash flows were discounted at a rate of 16.0 percent to arrive at the fair values in our 2009 calculations, and 14.5 percent in the 2008 calculations. We also consider market information (market approach) when such information is available to validate the more detailed discounted cash flow calculations. Market information typically includes our general knowledge of sale transaction multiples and/or previous discussions we have had with third parties regarding the value of a similar reporting unit or our specific reporting unit. We rely on the income approach because it reflects the reporting unit’s expected cash flows and incorporates our detailed knowledge of products, pricing, competitive environment, global economic conditions, industry conditions, interest rates, and management actions, whereas market information may not be available, or may be less precise due to a lack of comparability to our particular reporting unit. The second step requires us to determine the implied fair value of goodwill and measure the impairment loss as the difference between the book value of the goodwill and the implied fair value of the goodwill. The implied fair value of goodwill must be determined in the same manner as if we had acquired the reporting unit.
Legislation passed by the Federal Council of Germany in November 2008 and which became effective on April 1, 2009, resulted in sweeping changes to the way doctors and healthcare providers interact and are reimbursed from insurance companies. These changes require our German subsidiary to renegotiate contracts with insurance companies and ENT doctors on a new basis. In the first three months of 2009, we believed our German subsidiary was making progress, having successfully renegotiated contracts representing approximately 27% of our 2008 German revenue. However, on April 1, 2009, we were notified by one large insurance company representing approximately 25% of our German revenue that, despite several months of favorable negotiations, due to “political headwinds,” they were refusing to enter into a contract; therefore, our German subsidiary filed a lawsuit in the Social Court in Hamburg, Germany against this insurance company, requesting that the court compel the insurance company to enter into a contract with it. On April 28, 2009, the Court rejected these claims. Our German subsidiary subsequently filed an appeal of this decision, which was rejected without review. In addition, a number of other insurance companies were unsure if they should sign a contract because there were rumors that the newly enacted law could potentially change again, thus requiring the need to renegotiate again. Without renegotiated insurance contracts, and the ability to pay customary fitting fees to the ENT doctors, we expected revenue to decline substantially and cash flow of the operation would not be sufficient to support its intangibles balances.
We determined that an interim impairment test was necessary at the end of the first quarter of 2009 in this reporting unit. In the step one calculation, we assumed a full year revenue of approximately 45% of 2008 levels (which resulted from a full first quarter 2009 and approximately 27% of revenue thereafter) and operating expenses of approximately 90% of 2008 levels as we continued to attempt to renegotiate additional contracts and service existing contracts. However, renegotiation was expected to be difficult given the political pressures posed by local acousticians, our largest competitors, and the adverse result in the social court case. Accordingly, we could not reasonably expect revenue in excess of those contracts which had already been renegotiated for one year terms. In addition, there continued to be high risk that some or all of the insurance companies who had renegotiated their contracts would not renew their contracts with us upon expiration in April 2010 given the political climate and the social court decision. Accordingly, we estimated that we would maintain the 27% of revenue for one year and would be unable to successfully renegotiate with additional insurers. We used a discount rate of 14.5%. A sensitivity analysis was not performed given the significant disparity between the estimated fair value and carrying value. Reasonable changes to the assumptions used, based on then-existing facts and circumstances, would not have changed the outcome. After completing step one of the prescribed test, we determined that the estimated fair value of the reporting unit was less than its book value on March 31, 2009. We performed the step two test and concluded that the reporting unit’s goodwill and trade name were impaired. As a result, an impairment loss of $14,205 for goodwill and $453 for definite lived intangibles was recorded in the first quarter of 2009 in our Europe segment.
During the third quarter 2009, we closed three U.S. retail locations and wrote off goodwill of $89 and customer databases of $46 associated with those locations. Our goodwill and trade names were classified using level 3 inputs of the fair value hierarchy as defined in ASC 820, “Fair Value Measurements and Disclosures.”
As part of our annual review, performed in conjunction with our review of long-lived assets, we determined that the carrying amount of our U.S. retail reporting unit exceeded its fair value as a result of lower current and projected sales. Our impairment analysis for our U.S. retail reporting unit estimated fair value using the income approach. Our application of the income approach utilized a discounted cash flow model, with a discount rate of 16.0%. We utilized an 11.8% sales growth rate in 2010, which represented our board-approved budget, and five percent growth thereafter through 2014, at which time a three percent long term growth rate was utilized. Gross margin and operating expenses for 2010 through 2015 were generally consistent with 2009 levels. We assumed a future terminal value using an inflationary measure of 3%. We estimated capital expenditures based on recent operating results and capital requirements based on planned initiatives. We
40
ran sensitivity analyses using a seven percent revenue growth rate for 2011 through 2014 which would have resulted in an enterprise value 34% higher than the utilized value. Growth rates of less than five percent were not deemed reasonable given current expectations and our understanding of current retail sale transaction multiples. We believe the assumptions utilized represented the most likely scenario given the current circumstances. We also considered current trends in retail sale transaction multiples (market approach). If the carrying amount of a reporting unit exceeds its fair value, an impairment loss is recognized for any excess of the carrying amount of the reporting unit’s goodwill over the implied fair value of that goodwill. The implied fair value of goodwill is determined by allocating the fair value of the reporting unit to all the assets and liabilities of that unit as if the reporting unit had been acquired in a business combination and the fair value of the reporting unit was the price paid to acquire the reporting unit. The identified intangible assets included customer databases, non-compete agreements, and trade names. The fair values of the intangible assets were estimated using detailed cash flow-based models for each respective asset. Other assets and liabilities had carrying values that approximated fair values. The excess of the fair value of a reporting unit over the amounts assigned to assets and liabilities is the implied fair value of goodwill. We compared the implied fair value of the reporting unit‘s goodwill with the carrying value of the unit’s goodwill, as a result of these calculations, we recorded impairment charges of $12,432 for goodwill and $3,440 for definite-lived intangible assets in the fourth quarter of 2009 in our North America segment.
During the course of our testing we noted one reporting unit with a fair value that was $214 or 18% in excess of the carrying amount. This Europe reporting unit is supported by one primary customer. Deterioration in estimated future cash flows in this reporting unit could result in a goodwill impairment. The goodwill carrying value at December 31, 2009 of this reporting unit was $1,681. Other reporting units with goodwill were not at risk of failing the step one impairment test as of December 31, 2009.
Income Taxes
The relative proportions of our domestic and foreign income directly affect our effective income tax rate. We are also subject to changing tax laws in the multiple jurisdictions in which we operate. As of December 31, 2009, we had a valuation allowance of $27,866 recorded against certain deferred income tax assets of $29,360, a deferred income tax liability of $37, for a net deferred tax asset of $1,457. In accordance with our assessment of income taxes under ASC 740, we currently do not believe it is more likely than not that our results of future operations will generate sufficient taxable income to utilize our deferred income tax assets in certain tax jurisdictions. We consider future taxable income and ongoing prudent and feasible tax planning strategies in assessing the need for any valuation allowance, and if we determine we would be able to realize all or part of our net deferred income tax assets in the future, we would adjust the valuation allowance in the period we make that determination. We do not provide for U.S. income taxes on the earnings of our foreign subsidiaries because they are considered permanently invested outside of the U.S.
| ITEM 7A. | QUANTITATIVE AND QUALITATIVE DISCLOSURES ABOUT MARKET RISK (in thousands) |
Interest Rate Risk. We generally invest our cash in money market funds and corporate debt securities. These are subject to minimal credit and market risk considering that they are short-term (expected maturities of 18 months or less from date of purchase) and provided that we hold them to maturity, which is our intention. As of December 31, 2009, we had $4,860 held in commercial money market instruments that carry an effective fixed interest rate of 0.15%. The interest rates on our customer advances approximate the market rates for comparable instruments and are fixed.
As of December 31, 2009 we had $1,791 in long-term bank debt that bears interest at a rate of the EURIBOR rate plus four percent (the effective rate was 9.59%). The debt was amended on June 13, 2008 to release the requirement of a stand-by letter of credit which was supported by restricted cash of U.S. dollar $5,194 and to incorporate an interest rate swap agreement to fix the rate at 9.59%.
A hypothetical one percentage point change in interest rates would not have had a material effect on our results of operations and financial position. Given current interest rates, we believe the market risks associated with these financial instruments are minimal.
Derivative Instruments and Hedging Activities. We may employ derivative financial instruments to manage risks, including the short term impact of foreign currency fluctuations on certain intercompany balances, or variable interest rate exposures. We do not enter into these contracts for trading or speculation purposes. Gains and losses on the contracts are included in the results of operations and offset foreign exchange gains or losses recognized on the revaluation of certain intercompany balances, or interest expense due to movement in variable interest rates, as applicable.
Our foreign exchange forward contracts generally mature in three months or less from the contract date. At December 31, 2009, we held forward contract hedges on €1,200 ($1,718) and we recognized an unrealized gain of $93. The contracts will expire in the first quarter of 2010. At December 31, 2008, we held forward contract hedges on €4,300 ($6,061) and Australian $1,700 ($1,173) and we recognized an unrealized gain of $75. Unrealized gains were recorded in Other income, net in the Consolidated Statements of Operations, and in Prepaid expenses and other in the Consolidated Balance Sheets.
Effective in the second quarter 2008, we entered into an interest rate swap agreement. The contract effectively fixed the interest rate of the long term debt associated with the German acquisition at 9.59%.
41
Foreign Currency Risk. We face foreign currency risks primarily as a result of the revenues we derive from sales made outside the U.S., expenses incurred outside the U.S., and from intercompany account balances between our U.S. parent and our non-U.S. subsidiaries. In 2009, approximately 66.1% of our net sales and 45.1% of our operating expenses were denominated in currencies other than the U.S. dollar. Inventory purchases were transacted in U.S. dollars. The local currency of each foreign subsidiary is considered the functional currency, and revenue and expenses are translated at average exchange rates for the reported periods. Therefore, our foreign sales and expenses will be higher in a period in which there is a weakening of the U.S. dollar and will be lower in a period in which there is a strengthening of the U.S. dollar. The Australian dollar, Euro, and Canadian dollar are our most significant foreign currencies. Given the uncertainty of exchange rate fluctuations and the varying performance of our foreign subsidiaries, we cannot estimate the affect of these fluctuations on our future business, results of operations and financial condition. Fluctuations in the exchange rates between the U.S. dollar and other currencies could effectively increase or decrease the selling prices of our products in international markets where the prices of our products are denominated in U.S. dollars. We regularly monitor our foreign currency risks and may take measures to reduce the impact of foreign exchange fluctuations on our operating results. To date, we have not used derivative financial instruments for hedging, trading or speculating on foreign currency exchange, except to hedge intercompany balances in 2009.
Average currency exchange rates to convert one U.S. dollar into each local currency for which we had sales of over $5,000 by year were as follows:
| 2009 | 2008 | 2007 | ||||
| Euro |
0.72 | 0.68 | 0.73 | |||
| Australian dollar |
1.28 | 1.20 | 1.20 | |||
| Canadian dollar |
1.14 | 1.07 | 1.07 |
| ITEM 8. | FINANCIAL STATEMENTS AND SUPPLEMENTARY DATA |
Financial statement information is set forth in Item 15 of this Form 10-K. Supplementary data is set forth in Item 6 of this Form 10-K.
| ITEM 9. | CHANGES IN AND DISAGREEMENTS WITH ACCOUNTANTS ON ACCOUNTING AND FINANCIAL DISCLOSURE. |
None.
| ITEM 9A. | CONTROLS AND PROCEDURES. |
We maintain “disclosure controls and procedures” within the meaning of Rule 13a-15(e) of the Securities Exchange Act of 1934, as amended (the “Exchange Act”). Our disclosure controls and procedures are designed to ensure that information required to be disclosed in our reports filed under the Exchange Act, such as this Form 10-K, is recorded, processed, summarized and reported within the time periods specified in the Securities and Exchange Commission’s (“SEC’s”) rules and forms. Our disclosure controls and procedures are also designed to ensure that such information is accumulated and communicated to our management, including our Chief Executive Officer and Chief Financial Officer, to allow timely decisions regarding required disclosure. In designing and evaluating our disclosure controls and procedures, management recognizes that any controls and procedures, no matter how well designed and operated, can provide only reasonable assurance of achieving the desired control objectives, and management necessarily was required to apply its judgment in evaluating and implementing possible controls and procedures.
Evaluation of Disclosure Controls and Procedures. As of December 31, 2009, we evaluated the effectiveness of the design and operation of our disclosure controls and procedures, which was done under the supervision and with the participation of our management, including our Chief Executive Officer and our Chief Financial Officer. Exhibits 31.1 and 31.2 of this Form 10-K are certifications of our Chief Executive Officer and Chief Financial Officer, which are required in accordance with Rule 13a-15(e) and Rule 15d-15(e) of the Exchange Act. This Controls and Procedures section includes the information concerning the controls evaluation referred to in the certifications and it should be read in conjunction with the certifications for a more complete understanding of the topics presented. Based on the controls evaluation, our Chief Executive Officer and Chief Financial Officer have concluded that, as of the date of their evaluation, our disclosure controls and procedures were effective.
Change in Internal Control over Financial Reporting. There were no changes in our internal control over financial reporting during our most recent fiscal quarter that materially affected, or are reasonably likely to materially affect, our internal control over financial reporting.
Management’s Report on Internal Control over Financial Reporting. Our management is responsible for establishing and maintaining adequate internal control over financial reporting. Our system of internal control over financial reporting within the meaning of Rules 13a-15(f) and 15d-15(f) of the Exchange Act is designed to provide reasonable assurance to our management and
42
board of directors regarding the preparation and fair presentation of our published financial statements in accordance with U.S. generally accepted accounting principles. All internal control systems, no matter how well designed, have inherent limitations. Therefore, even those systems determined to be effective can provide only reasonable assurance with respect to financial statement preparation and presentation.
Our management assessed the effectiveness of our system of internal control over financial reporting as of December 31, 2009. In making this assessment, we used the criteria set forth by the Committee of Sponsoring Organizations of the Treadway Commission (COSO) in Internal Control-Integrated Framework. Based on our assessment we believe that, as of December 31, 2009, our system of internal control over financial reporting was effective to provide reasonable assurance regarding the reliability of our financial reporting and the preparation of our published financial statements in accordance with U.S. generally accepted accounting principles.
Our independent registered public accounting firm, PricewaterhouseCoopers LLP, has issued an attestation report on the Company’s Internal Control over Financial Reporting which is included in this annual report.
| ITEM 9B. | OTHER INFORMATION. |
None.
PART III
| ITEM 10. | DIRECTORS, EXECUTIVE OFFICERS AND CORPORATE GOVERNANCE |
The information required by this item regarding Section 16(a) compliance, the Audit Committee, the Company’s Code of Ethics for Principal Executive and Senior Financial Officers and background of the directors is set forth under the captions “Share Ownership by Certain Beneficial Owners and Management,” “Governance of the Company,” “Election of Directors” and “Section 16(a) Beneficial Ownership Reporting Compliance” in our definitive Proxy Statement for the May 6, 2010 Annual Meeting of Stockholders to be filed within 120 days after our fiscal year end of December 31, 2009 (“Proxy Statement”) and is incorporated herein by reference. Information concerning our executive officers is set forth in Item 1 hereof.
| ITEM 11. | EXECUTIVE COMPENSATION |
The information required by this item is set forth under the captions “Executive Compensation and Other Information” and “Director Compensation” in our Proxy Statement and is incorporated herein by reference.
| ITEM 12. | SECURITY OWNERSHIP OF CERTAIN BENEFICIAL OWNERS AND MANAGEMENT AND RELATED STOCKHOLDER MATTERS |
The information required by this item is set forth under the caption “Share Ownership by Certain Beneficial Owners and Management” in our Proxy Statement and is incorporated herein by reference.
| ITEM 13. | CERTAIN RELATIONSHIPS AND RELATED TRANSACTIONS, AND DIRECTOR INDEPENDENCE |
The information required by this item is set forth under the caption “Certain Relationships and Related Transactions and Director Independence” in our Proxy Statement and is incorporated herein by reference.
| ITEM 14. | PRINCIPAL ACCOUNTING FEES AND SERVICES |
The information required by this item is set forth under the caption “Ratification of Appointment of the Independent Auditors” in our Proxy Statement and is incorporated herein by reference.
43
PART IV
| ITEM 15. | EXHIBITS AND FINANCIAL STATEMENT SCHEDULES |
(a) LIST OF DOCUMENTS FILED AS PART OF THIS REPORT
1. FINANCIAL STATEMENTS
The following consolidated financial statements and reports of the independent registered public accounting firm are included herein as a separate section beginning on page F-1 of this report:
2. FINANCIAL STATEMENT SCHEDULE
The following financial statement schedule is filed as part of this Form 10-K:
| SCHEDULE NUMBER |
DESCRIPTION |
PAGE NUMBER | ||
| II | Valuation and Qualifying Accounts | 48 |
The reports of independent registered public accounting firms with respect to the Company’s financial statement schedule are on pages 49 and F-1. All other financial statement schedules not listed have been omitted because the required information is included in the consolidated financial statements or notes thereto, or is not applicable.
44
3. EXHIBITS
| Exhibit Number |
Exhibit Description | |
| 2.1(7) | Sale and Purchase Agreement Between the Selling Shareholders of Sanomed Handelsgesellschaft mbH and PALME Verwaltungsgesellschaft mbH and the registrant. | |
| 2.2(8) | Agreement and Plan of Reorganization By and Among the registrant, Saxophone Merger Sub, Inc., Saxophone Acquisition Corporation, Tympany, Inc., the Shareholders of Tympany, Inc. and the Shareholder Representative. | |
| 3.2(1) | Amended and Restated Bylaws and Articles of Incorporation of the registrant. | |
| 10.1(1) | Form of indemnification agreement entered into by the registrant with its directors and executive officers. | |
| 10.2(5) | 2000 Stock Plan and form of agreements thereunder. | |
| 10.3(4) | 2000 Employee Stock Purchase Plan. | |
| 10.4(3) | Preferred Stock Rights Agreement dated as of March 27, 2001 between the registrant and American Stock Transfer & Trust Company. | |
| 10.5(1) | Amended and Restated License Agreement dated March 21, 2000 between the registrant and Brigham Young University. | |
| 10.6(1) | Amended and Restated Exclusive License Agreement dated March 21, 2000 between the registrant and Brigham Young University. | |
| 10.7(2) | Subscription Agreement between K/S HIMPP and the registrant dated September 13, 2000. | |
| 10.8(2) | Patent License Agreement between K/S HIMPP and the registrant dated September 13, 2000. | |
| 10.9(11) | Employment Agreement dated as of October 27, 2005 between the registrant and Samuel L. Westover | |
| 10.10(12) | Letter Agreement dated July 6, 2000 between the registrant and Jerry L. DaBell | |
| 10.11 # | Management Bonus Program for 2009. | |
| 10.12 (13) | Management Continuity Agreement (Amended May 12, 2006). | |
| 10.13 (14) | Form of Securities Purchase Agreement (incorporated by reference to the current report on Form 8-K, filed on August 17, 2006). | |
| 10.14 (14) | Form of Registration Rights Agreement (incorporated by reference to the current report on Form 8-K, filed on August 17, 2006). | |
| 10.15 (14) | Sales Plan Termination and Lock-Up signed September 9, 2006 (incorporated by reference to the current report on Form 8-K, filed September 13, 2006). | |
| 10.16 (15) | Sale and Purchase Agreement between the Registrant and Tympany Holding, LLC, dated February 20, 2007. | |
| 10.17(16) | Loan and Security Agreement with Silicon Valley Bank (filed on our Form 8-K on April 18, 2007 and incorporated by reference herein). | |
| 10.18(17) | Asset Purchase Agreement with American Hearing, LLC and Digi-Tech, LLC (filed on our Form 8-K on June 7, 2007 and incorporated by reference herein). | |
| 10.19(18) | Completion of Acquisition with American Hearing, LLC and Digi-Tech, LLC (filed on our Form 8-K on August 10, 2007 and incorporated by reference herein). | |
| 10.20(19) | Asset Purchase Agreement with Hearing Associates of Pensacola, P.A. (filed on our Form 8-K on October 11, 2007 and incorporated by reference herein). | |
| 10.21(20) | Completion of Acquisition with Hearing Associates of Pensacola, P.A. (filed on our Form 8-K/A on December 19, 2007 and incorporated by reference herein). | |
| 10.22(21) | Settlement with Energy Transportation Group, Inc. (filed on our Form 8-K on October 17, 2007 and incorporated by reference herein). | |
| 10.23(9) | Otix Global, Inc. issued a statement to clarify confusion raised by a number of press releases related to an award for a patent infringement action with Energy Transportation Group, Inc. v. Otix Global, Inc. (filed on our Form 8-K on February 13, 2008 and incorporated by reference herein).
| |
| 10.24(10) | Otix Global, Inc. issued a press release announcing its financial results for the first quarter 2008 and also announced that it has begun to consolidate several of its European operations (filed on our Form 8-K on May 1, 2008 and incorporated by reference herein). | |
| 10.25(22) | Chairman of the Board steps down (filed on our Form 8-K on May 13, 2008 and incorporated by reference herein). | |
45
| Exhibit Number |
Exhibit Description | |
| 10.26(23) | Changes in Registrant’s Certifying Accountant (filed on our Form 8-K on June 3, 2008 and incorporated by reference herein). | |
| 10.27(24) | Second amendment to long-term loan with German bank (filed on our Form 8-K on June 17, 2008 and incorporated by reference herein). | |
| 10.28(25) | Departure of Directors or Certain Officers (filed on our Form 8-K on June 30, 2008 and incorporated by reference herein). | |
| 10.29(26) | Appointment of Certain Officers (filed on our Form 8-K on August 12, 2008 and incorporated by reference herein). | |
| 10.30(27) | Patent purchase agreement with Bose Corporation (filed on our Form 8-K on January 29, 2009 and incorporated by reference herein). | |
| 10.31(28) | Settlement with former owners of Sanomed GmbH (filed on our Form 8-K on July 24, 2009 and incorporated by reference herein). | |
| 10.32(29) | Sonic Innovations, Inc. Awarded Contract From U.S. Veterans Association (filed on our Form 8-K on August 19, 2009 and incorporated by reference herein). | |
| 10.33(30) | Third amendment to line of credit agreement with Silicon Valley Bank dated August 11, 2009. | |
| 10.34(30) | Lease agreement dated September 3, 2009 between the registrant and Mikami Brothers, an Oregon Limited Partnership. | |
| 10.35(#) | First amendment to the amended and restated line of credit agreement with Silicon Valley Bank dated February 10, 2010. | |
| 10.36(31) | Second amendment to the amended and restated line of credit agreement with Silicon Valley Bank (filed on our Form 8-K on March 15, 2010 and incorporated by reference herein). | |
| 10.37(32) | Reverse stock split (filed on our Form 8-K on March 12, 2010 and incorporated by reference herein). | |
| 21.1 | Subsidiaries of the registrant. | |
| 23.1 | Consent of independent registered public accounting firm PricewaterhouseCoopers. | |
| 23.2 | Consent of independent registered public accounting firm KPMG. | |
| 31.1 | Certification of Chief Executive Officer pursuant to Section 302 of the Sarbanes-Oxley Act of 2002. | |
| 31.2 | Certification of Chief Financial Officer pursuant to Section 302 of the Sarbanes-Oxley Act of 2002. | |
| 32 | Certification of Chief Executive Officer and Chief Financial Officer Pursuant to 18 U.S.C. 1350, as adopted pursuant to Section 906 of the Sarbanes-Oxley Act of 2002. | |
| (1) | Incorporated by reference from the registrant’s Registration Statement on Form S-1 (file no. 333-30566), as amended. |
| (2) | Incorporated by reference from the registrant’s Annual Report on Form 10-K for the year ended December 31, 2000. |
| (3) | Incorporated by reference from the registrant’s Registration Statement on Form 8-A filed on April 16, 2001. |
| (4) | Incorporated by reference from the registrant’s Registration Statement on Form S-8 filed on August 16, 2002. |
| (5) | Incorporated by reference from the registrant’s Registration Statement on Form S-8 filed on August 30, 2002. |
| (6) | Not used |
| (7) | Incorporated by reference from the registrant’s Form 8-K Current Report filed on May 29, 2003. |
| (8) | Incorporated by reference from the registrant’s Form 8-K Current Report filed on December 10, 2004. |
| (9) | Incorporated by reference from the registrant’s Form 8-K Current Report filed on February 13, 2008. |
| (10) | Incorporated by reference from the registrant’s Form 8-K Current Report filed on May 1, 2008. |
| (11) | Incorporated by reference from the registrant’s Form 8-K Current Report filed on November 2, 2005. |
| (12) | Incorporated by reference from the registrant’s Annual Report on Form 10-K for the year ended December 31, 2005. |
| (13) | Incorporated by reference from the registrant’s Quarterly Report on Form 10-Q for the quarter ended June 30, 2006. |
| (14) | Incorporated by reference from the registrant’s Quarterly Report on Form 10-Q for the quarter ended September 30, 2006. |
46
| (15) | Incorporated by reference from the registrant’s Form 8-K Current Report filed February 20, 2007. |
| (16) | Incorporated by reference from the registrant’s Form 8-K Current Report filed April 18, 2007. |
| (17) | Incorporated by reference from the registrant’s Form 8-K Current Report filed June 7, 2007. |
| (18) | Incorporated by reference from the registrant’s Form 8-K Current Report filed August 10, 2007. |
| (19) | Incorporated by reference from the registrant’s Form 8-K Current Report filed October 11, 2007. |
| (20) | Incorporated by reference from the registrant’s Form 8-K/A Current Report filed December 19, 2007. |
| (21) | Incorporated by reference from the registrant’s Form 8-K Current Report filed October 17, 2007. |
| (22) | Incorporated by reference from the registrant’s Form 8-K Current Report filed May 13, 2008. |
| (23) | Incorporated by reference from the registrant’s Form 8-K Current Report filed June 3, 2008. |
| (24) | Incorporated by reference from the registrant’s Form 8-K Current Report filed June 17, 2008. |
| (25) | Incorporated by reference from the registrant’s Form 8-K Current Report filed June 30, 2008. |
| (26) | Incorporated by reference from the registrant’s Form 8-K Current Report filed August 12, 2008. |
| (27) | Incorporated by reference from the registrant’s Form 8-K Current Report filed January 29, 2008. |
| (28) | Incorporated by reference from the registrant’s Form 8-K Current Report filed July 24, 2009. |
| (29) | Incorporated by reference from the registrant’s Form 8-K Current Report filed August 19, 2009. |
| (30) | Incorporated by reference from the registrant’s Annual Report on Form 10-Q for the quarter ended September 30, 2009. |
| (31) | Incorporated by reference from the registrant’s Form 8-K Current Report filed March 15, 2010. |
| (32) | Incorporated by reference from the registrant’s Form 8-K Current Report filed March 12, 2010. |
| # | Designates a management contract or compensatory plan or arrangement required to be filed as an exhibit. |
47
(b) EXHIBITS
See Item 15(a) 3.
(c) FINANCIAL STATEMENT SCHEDULE
See Item 15(a) 2.
Schedule II—Valuation and Qualifying Accounts
The following schedule depicts all valuation and qualifying accounts:
| Year | Beginning balance |
Additions | Deductions | Ending balance | ||||||
| Allowance for sales returns |
2009 | 1,994 | 7,396 | 8,194 | 1,196 | |||||
| 2008 | 2,389 | 10,723 | 11,118 | 1,994 | ||||||
| 2007 | 3,463 | 13,884 | 14,958 | 2,389 | ||||||
| Allowance for doubtful accounts |
2009 | 1,497 | 371 | 1,017 | 851 | |||||
| 2008 | 1,740 | 690 | 933 | 1,497 | ||||||
| 2007 | 1,211 | 989 | 460 | 1,740 | ||||||
| Accrued restructuring |
2009 | 848 | 769 | 1,261 | 356 | |||||
| 2008 | — | 4,730 | 3,882 | 848 | ||||||
| 2007 | 184 | — | 184 | — | ||||||
| Accrued warranty |
2009 | 3,727 | 4,005 | 3,831 | 3,901 | |||||
| 2008 | 5,249 | 3,506 | 5,028 | 3,727 | ||||||
| 2007 | 6,063 | 4,786 | 5,600 | 5,249 | ||||||
| Inventory reserves (1) |
2009 | 1,343 | 1,300 | 1,766 | 877 | |||||
| 2008 | 1,201 | 1,655 | 1,513 | 1,343 | ||||||
| 2007 | 1,201 | 1,198 | 1,198 | 1,201 | ||||||
| Deferred income tax asset valuation allowance |
2009 | 20,528 | 8,155 | 902 | 27,781 | |||||
| 2008 | 17,045 | 5,394 | 1,911 | 20,528 | ||||||
| 2007 | 16,639 | 977 | 571 | 17,045 | ||||||
| (1) | Includes reserves for excess and obsolete inventory and for product (inventory) returns. Provision is made to (i) reduce excess and obsolete inventories to their estimated net realizable values and (ii) for estimated product (inventory) returns in those countries that sell hearing aids on a retail basis and recognize a sale only upon acceptance by the consumer. |
48
Report of Independent Registered Public Accounting Firm
The Board of Directors and Shareholders
Otix Global, Inc.:
Under date of March 17, 2008 except as to Note 2 – subsection “Reclassifications”, and Note 5 which are dated March 16, 2009, we reported on the consolidated statements of operations, shareholders’ equity and comprehensive income (loss), and cash flows of Otix Global, Inc. and subsidiaries for the year ended December 31, 2007, which are included in the Otix Global, Inc. 2009 Annual Report on Form 10-K. In connection with our audits of the aforementioned consolidated financial statements, we also audited the related consolidated financial statement schedule for the year ended December 31, 2007, included in the 2009 Annual Report on Form 10-K. This financial statement schedule is the responsibility of the Company’s management. Our responsibility is to express an opinion on this financial statement schedule based on our audits.
In our opinion, such financial statement schedule, when considered in relation to the basic consolidated financial statements taken as a whole, present fairly, in all material respects, the information set forth therein.
KPMG LLP
Salt Lake City, Utah
March 17, 2008, except as to Note 2 - subsection “Reclassifications” and Note 5 which are dated March 16, 2009.
49
SIGNATURES
Pursuant to the requirements of Section 13 or 15(d) of the Securities Exchange Act of 1934, the registrant has duly caused this Report to be signed on its behalf by the undersigned, thereunto duly authorized.
| Date: March 15, 2010 | OTIX GLOBAL, INC. | |||
| By: | /S/ SAMUEL L. WESTOVER | |||
| Samuel L. Westover | ||||
| Chairman and Chief Executive Officer | ||||
| (Principal Executive Officer) | ||||
| By: | /S/ MICHAEL M. HALLORAN | |||
| Michael M. Halloran | ||||
| Vice President and Chief Financial Officer | ||||
| (Principal Financial Officer) | ||||
| By: | /S/ SCOTT O. LINDEMAN | |||
| Scott O. Lindeman | ||||
| Vice President and Corporate Controller | ||||
| (Principal Accounting Officer) | ||||
Pursuant to the requirements of the Securities Exchange Act of 1934, this report has been signed below by the following directors and officers on behalf of the registrant on March 15, 2010.
| By: | /S/ SAMUEL L. WESTOVER | |
| Samuel L. Westover | ||
| Chairman and Chief Executive Officer and Director | ||
| By: | /S/ MICHAEL M. HALLORAN | |
| Michael M. Halloran | ||
| Vice President and Chief Financial Officer | ||
| By: | /S/ SCOTT O. LINDEMAN | |
| Scott O. Lindeman | ||
| Vice President and Corporate Controller | ||
| By: | /S/ JAMES M. CALLAHAN | |
| James M. Callahan, Director | ||
| By: | /S/ CHERIE FUZZELL | |
| Cherie Fuzzell, Director | ||
| By: | /S/ CRAIG L. MCKNIGHT | |
| Craig L. McKnight, Director | ||
| By: | /S/ ROBERT W. MILLER | |
| Robert W. Miller, Director | ||
| By: | /S/ KEVIN J. RYAN | |
| Kevin J. Ryan, Director | ||
| By: | /S/ LAWRENCE C. WARD | |
| Lawrence C. Ward, Director | ||
50
Report of Independent Registered Public Accounting Firm
To the Board of Directors and Shareholders of
Otix Global, Inc.
In our opinion, the accompanying consolidated balance sheets and the related consolidated statements of operations, shareholders’ equity and comprehensive income (loss) and cash flows present fairly, in all material respects, the financial position of Otix Global, Inc. and its subsidiaries at December 31, 2009 and 2008, and the results of their operations and their cash flows for each of the two years in the period ended December 31, 2009 in conformity with accounting principles generally accepted in the United States of America. In addition, in our opinion, the 2009 and 2008 information in the financial statement schedule listed in the index appearing under Item 15(a)(2) presents fairly, in all material respects, the information set forth therein when read in conjunction with the related consolidated financial statements. Also in our opinion, the Company maintained, in all material respects, effective internal control over financial reporting as of December 31, 2009, based on criteria established in Internal Control—Integrated Framework issued by the Committee of Sponsoring Organizations of the Treadway Commission (COSO). The Company’s management is responsible for these financial statements, and the 2009 and 2008 information in the financial statement schedule, and for maintaining effective internal control over financial reporting and for its assessment of the effectiveness of internal control over financial reporting, included in Management’s Report on Internal Control over Financial Reporting appearing under Item 9A. Our responsibility is to express opinions on these financial statements, the 2009 and 2008 information in the financial statement schedule, and on the Company’s internal control over financial reporting based on our integrated audits. We conducted our audits in accordance with the standards of the Public Company Accounting Oversight Board (United States). Those standards require that we plan and perform the audits to obtain reasonable assurance about whether the financial statements are free of material misstatement and whether effective internal control over financial reporting was maintained in all material respects. Our audits of the financial statements included examining, on a test basis, evidence supporting the amounts and disclosures in the financial statements, assessing the accounting principles used and significant estimates made by management, and evaluating the overall financial statement presentation. Our audit of internal control over financial reporting included obtaining an understanding of internal control over financial reporting, assessing the risk that a material weakness exists, and testing and evaluating the design and operating effectiveness of internal control based on the assessed risk. Our audits also included performing such other procedures as we considered necessary in the circumstances. We believe that our audits provide a reasonable basis for our opinions.
A company’s internal control over financial reporting is a process designed to provide reasonable assurance regarding the reliability of financial reporting and the preparation of financial statements for external purposes in accordance with generally accepted accounting principles. A company’s internal control over financial reporting includes those policies and procedures that (i) pertain to the maintenance of records that, in reasonable detail, accurately and fairly reflect the transactions and dispositions of the assets of the company; (ii) provide reasonable assurance that transactions are recorded as necessary to permit preparation of financial statements in accordance with generally accepted accounting principles, and that receipts and expenditures of the company are being made only in accordance with authorizations of management and directors of the company; and (iii) provide reasonable assurance regarding prevention or timely detection of unauthorized acquisition, use, or disposition of the company’s assets that could have a material effect on the financial statements.
Because of its inherent limitations, internal control over financial reporting may not prevent or detect misstatements. Also, projections of any evaluation of effectiveness to future periods are subject to the risk that controls may become inadequate because of changes in conditions, or that the degree of compliance with the policies or procedures may deteriorate.
/s/ PricewaterhouseCoopers LLP
Salt Lake City, UT
March 15, 2010
F-1
Report of Independent Registered Public Accounting Firm
The Board of Directors and Stockholders
Otix Global, Inc.:
We have audited the accompanying consolidated statements of operations, shareholders’ equity and comprehensive income (loss), and cash flows of Otix Global, Inc., and subsidiaries for the year ended December 31, 2007. These consolidated financial statements and financial statement schedule are the responsibility of the Company’s management. Our responsibility is to express an opinion on these consolidated financial statements and financial statement schedule based on our audits.
We conducted our audits in accordance with the standards of the Public Company Accounting Oversight Board (United States). Those standards require that we plan and perform the audit to obtain reasonable assurance about whether the financial statements are free of material misstatement. An audit includes examining, on a test basis, evidence supporting the amounts and disclosures in the financial statements. An audit also includes assessing the accounting principles used and significant estimates made by management, as well as evaluating the overall financial statement presentation. We believe that our audits provide a reasonable basis for our opinion.
In our opinion, the consolidated financial statements referred to above present fairly, in all material respects, the results of operations and cash flows of Otix Global, Inc. and Subsidiaries for the year ended December 31, 2007, in conformity with U.S. generally accepted accounting principles.
As discussed in Notes 2 and 13 to the consolidated financial statements, effective January 1, 2007, Otix Global, Inc. adopted Financial Accounting Standards Board Interpretation No. 48 Accounting for Uncertainty in Income Taxes, included in ASC Subtopic 740-10, Income Taxes – Overall.
KPMG LLP
Salt Lake City, Utah
March 17, 2008, except as to Note 2 - subsection “Reclassifications” and Note 5 which are dated March 16, 2009.
F-2
CONSOLIDATED BALANCE SHEETS
(in thousands, except per share data)
| December 31, | December 31, | |||||||
| 2009 | 2008 | |||||||
| ASSETS |
||||||||
| Current assets: |
||||||||
| Cash and cash equivalents |
$ | 12,154 | $ | 13,129 | ||||
| Restricted cash |
71 | 284 | ||||||
| Accounts receivable, net |
10,625 | 17,524 | ||||||
| Inventories |
8,754 | 10,129 | ||||||
| Prepaid expenses and other |
4,315 | 4,114 | ||||||
| Total current assets |
35,919 | 45,180 | ||||||
| Property and equipment, net |
8,755 | 6,869 | ||||||
| Definite-lived intangible assets, net |
3,016 | 8,504 | ||||||
| Indefinite-lived intangible assets |
9,368 | 7,242 | ||||||
| Goodwill |
7,772 | 35,564 | ||||||
| Other assets |
2,295 | 3,587 | ||||||
| Total assets |
$ | 67,125 | $ | 106,946 | ||||
| LIABILITIES AND SHAREHOLDERS’ EQUITY |
||||||||
| Current liabilities: |
||||||||
| Current portion of long-term debt |
$ | 4,923 | $ | 4,673 | ||||
| Accounts payable |
6,426 | 7,562 | ||||||
| Accrued payroll and related expenses |
4,515 | 4,488 | ||||||
| Accrued restructuring |
356 | 848 | ||||||
| Accrued warranty |
3,901 | 3,727 | ||||||
| Deferred revenue |
4,602 | 4,158 | ||||||
| Other accrued liabilities |
3,602 | 4,828 | ||||||
| Total current liabilities |
28,325 | 30,284 | ||||||
| Long-term debt, net of current portion |
452 | 2,182 | ||||||
| Deferred revenue, net of current portion |
5,264 | 5,460 | ||||||
| Other liabilities |
282 | 1,109 | ||||||
| Total liabilities |
34,323 | 39,035 | ||||||
| Commitments and contingencies (Notes 2 and 12) |
||||||||
| Shareholders’ equity: |
||||||||
| Preferred stock, $0.001 par value; 5,000 shares authorized; zero issued and outstanding |
— | — | ||||||
| Common stock, $0.001 par value; 70,000 shares authorized; 28,810 and 28,518 shares issued and outstanding, respectively |
29 | 29 | ||||||
| Additional paid-in-capital |
145,359 | 143,965 | ||||||
| Accumulated deficit |
(118,244 | ) | (78,892 | ) | ||||
| Accumulated other comprehensive income |
9,431 | 6,582 | ||||||
| Treasury stock; 974 shares at cost |
(3,773 | ) | (3,773 | ) | ||||
| Total shareholders’ equity |
32,802 | 67,911 | ||||||
| Total liabilities and shareholders’ equity |
$ | 67,125 | $ | 106,946 | ||||
See accompanying notes to consolidated financial statements.
F-3
CONSOLIDATED STATEMENTS OF OPERATIONS
(in thousands, except per share data)
| Year ended December 31, | ||||||||||||
| 2009 | 2008 | 2007 | ||||||||||
| Net sales |
$ | 95,814 | $ | 124,878 | $ | 119,062 | ||||||
| Cost of sales |
37,693 | 46,004 | 43,676 | |||||||||
| Gross profit |
58,121 | 78,874 | 75,386 | |||||||||
| Selling, general and administrative expense |
59,065 | 70,515 | 64,932 | |||||||||
| Research and development expense |
6,487 | 8,266 | 8,547 | |||||||||
| Goodwill and definite-lived intangibles impairment charges |
30,665 | 2,111 | — | |||||||||
| Restructuring charges |
634 | 2,052 | — | |||||||||
| Operating income (loss) |
(38,730 | ) | (4,070 | ) | 1,907 | |||||||
| Interest expense |
(481 | ) | (755 | ) | (548 | ) | ||||||
| Other income, net |
234 | 1,167 | 1,428 | |||||||||
| Income (loss) before income taxes |
(38,977 | ) | (3,658 | ) | 2,787 | |||||||
| Provision for income taxes |
324 | 62 | 977 | |||||||||
| Income (loss) from continuing operations |
(39,301 | ) | (3,720 | ) | 1,810 | |||||||
| Loss from discontinued operations, net of income taxes |
(51 | ) | (3,904 | ) | (1,093 | ) | ||||||
| Net income (loss) |
$ | (39,352 | ) | $ | (7,624 | ) | $ | 717 | ||||
| Basic and diluted income (loss) per common share: |
||||||||||||
| Continuing operations |
$ | (1.42 | ) | $ | (0.14 | ) | $ | 0.07 | ||||
| Discontinued operations |
— | (0.14 | ) | (0.04 | ) | |||||||
| Net income (loss) |
$ | (1.42 | ) | $ | (0.28 | ) | $ | 0.03 | ||||
| Weighted average number of common shares outstanding: |
||||||||||||
| Basic |
27,682 | 27,305 | 26,518 | |||||||||
| Diluted |
27,682 | 27,305 | 27,570 | |||||||||
See accompanying notes to consolidated financial statements.
F-4
CONSOLIDATED STATEMENTS OF SHAREHOLDERS’
EQUITY AND COMPREHENSIVE INCOME (LOSS)
(in thousands)
| Accumulated | |||||||||||||||||||||||||
| Common Stock | Additional Paid-in |
Accumulated | Other Comprehensive |
Treasury | Total Shareholders’ |
||||||||||||||||||||
| Shares | Amount | Capital | Deficit | Income (Loss) | Stock | Equity | |||||||||||||||||||
| Balance, December 31, 2006 |
26,685 | $ | 27 | $ | 134,464 | $ | (71,985 | ) | $ | 7,171 | $ | (3,773 | ) | $ | 65,904 | ||||||||||
| Comprehensive income: |
|||||||||||||||||||||||||
| Net Income |
— | — | — | 717 | — | — | 717 | ||||||||||||||||||
| Foreign currency translation |
— | — | — | — | 4,222 | — | 4,222 | ||||||||||||||||||
| Comprehensive income |
— | — | — | — | — | — | 4,939 | ||||||||||||||||||
| Stock issuance in connection with an acquisition |
61 | — | 610 | — | — | — | 610 | ||||||||||||||||||
| Stock issuance for acquisition earn-out |
5 | — | 48 | — | — | — | 48 | ||||||||||||||||||
| Exercise of stock options and release of restricted stock awards, net of withholding taxes on share-based awards |
1,016 | 1 | 3,295 | — | — | — | 3,296 | ||||||||||||||||||
| Stock-based compensation |
— | — | 1,436 | — | — | — | 1,436 | ||||||||||||||||||
| Balance, December 31, 2007 |
27,767 | 28 | 139,853 | (71,268 | ) | 11,393 | (3,773 | ) | 76,233 | ||||||||||||||||
| Comprehensive loss: |
|||||||||||||||||||||||||
| Net loss |
— | — | — | (7,624 | ) | — | — | (7,624 | ) | ||||||||||||||||
| Foreign currency translation |
— | — | — | — | (4,811 | ) | — | (4,811 | ) | ||||||||||||||||
| Comprehensive loss |
— | — | — | — | — | — | (12,435 | ) | |||||||||||||||||
| Stock issuances in connection with acquisitions |
649 | 1 | 2,419 | — | — | — | 2,420 | ||||||||||||||||||
| Exercise of stock options and release of restricted stock awards, net of withholding taxes on share-based awards |
102 | — | (212 | ) | — | — | — | (212 | ) | ||||||||||||||||
| Stock-based compensation |
— | — | 1,905 | — | — | — | 1,905 | ||||||||||||||||||
| Balance, December 31, 2008 |
28,518 | 29 | 143,965 | (78,892 | ) | 6,582 | (3,773 | ) | 67,911 | ||||||||||||||||
| Comprehensive loss: |
|||||||||||||||||||||||||
| Net loss |
— | — | — | (39,352 | ) | — | — | (39,352 | ) | ||||||||||||||||
| Foreign currency translation |
— | — | — | — | 2,849 | — | 2,849 | ||||||||||||||||||
| Comprehensive loss |
— | — | — | — | — | — | (36,503 | ) | |||||||||||||||||
| Release of restricted stock awards, net of withholding taxes on share-based awards |
292 | — | (26 | ) | — | — | — | (26 | ) | ||||||||||||||||
| Stock-based compensation |
— | — | 1,420 | — | — | — | 1,420 | ||||||||||||||||||
| Balance, December 31, 2009 |
28,810 | $ | 29 | $ | 145,359 | $ | (118,244 | ) | $ | 9,431 | $ | (3,773 | ) | $ | 32,802 | ||||||||||
See accompanying notes to consolidated financial statements.
F-5
CONSOLIDATED STATEMENTS OF CASH FLOWS
(in thousands)
| For the year ended December 31, | ||||||||||||
| 2009 | 2008 | 2007 | ||||||||||
| Cash flows from operating activities: |
||||||||||||
| Net income (loss) |
$ | (39,352 | ) | $ | (7,624 | ) | $ | 717 | ||||
| Loss from discontinued operations, net of income taxes |
51 | 3,904 | 1,093 | |||||||||
| Adjustments to reconcile net income (loss) to net cash provided by operating activities: |
||||||||||||
| Depreciation and amortization |
4,059 | 4,823 | 4,256 | |||||||||
| Stock-based compensation |
1,420 | 1,867 | 1,436 | |||||||||
| Foreign currency (gain) loss, net |
314 | (10 | ) | (281 | ) | |||||||
| Deferred income taxes and reversal of deferred income tax valuation allowance |
(632 | ) | (1,268 | ) | (22 | ) | ||||||
| Amortization of interest on long-term debt |
89 | 322 | 266 | |||||||||
| Non-cash portion of restructuring charge |
25 | 262 | — | |||||||||
| Goodwill and definite-lived intangible impairment charges |
30,665 | 2,111 | — | |||||||||
| Loss on disposal of long-lived assets |
7 | 132 | — | |||||||||
| Changes in assets and liabilities, net of effect of acquisitions: |
||||||||||||
| Accounts receivable |
7,544 | 3,294 | (1,829 | ) | ||||||||
| Inventories |
2,318 | 2,379 | (2,050 | ) | ||||||||
| Other assets |
423 | (24 | ) | 294 | ||||||||
| Withholding taxes remitted on share-based awards |
(68 | ) | (218 | ) | (414 | ) | ||||||
| Accrued restructuring |
(413 | ) | 757 | — | ||||||||
| Accounts payable, accrued expenses and deferred revenue |
(4,226 | ) | (2,799 | ) | (1,513 | ) | ||||||
| Net cash provided by operating activities from continuing operations |
2,224 | 7,908 | 1,953 | |||||||||
| Net cash used in discontinued operations |
(66 | ) | (1,227 | ) | (574 | ) | ||||||
| Net cash provided by operating activities |
2,158 | 6,681 | 1,379 | |||||||||
| Cash flows from investing activities: |
||||||||||||
| Acquisitions of businesses and contingent consideration, net of cash acquired |
— | (4,779 | ) | (7,342 | ) | |||||||
| Purchase of property and equipment |
(3,468 | ) | (3,057 | ) | (2,505 | ) | ||||||
| Payment for technology license |
— | (250 | ) | — | ||||||||
| Customer loan repayments (advances), net |
1,371 | (804 | ) | (741 | ) | |||||||
| Proceeds from sale of marketable securities |
— | — | 6,989 | |||||||||
| Net cash used in investing activities from continuing operations |
(2,097 | ) | (8,890 | ) | (3,599 | ) | ||||||
| Net cash provided by discontinued operations in investing activities |
— | 717 | 1,048 | |||||||||
| Net cash used in investing activities |
(2,097 | ) | (8,173 | ) | (2,551 | ) | ||||||
| Cash flows from financing activities: |
||||||||||||
| Proceeds from exercise of stock options and tax collected on restricted stock |
43 | 6 | 3,710 | |||||||||
| Borrowings on line of credit |
3,775 | — | — | |||||||||
| Repayments on line of credit |
(659 | ) | — | — | ||||||||
| Proceeds from maturity of restricted cash, cash equivalents and marketable securities |
261 | 5,124 | 1,318 | |||||||||
| Principal payments on long-term debt |
(4,670 | ) | (5,319 | ) | (1,818 | ) | ||||||
| Net cash provided by (used in) financing activities |
(1,250 | ) | (189 | ) | 3,210 | |||||||
| Effect of exchange rate changes on cash and cash equivalents from continuing operations |
217 | (347 | ) | 478 | ||||||||
| Effect of exchange rate changes on cash and cash equivalents from discontinued operations |
(3 | ) | (57 | ) | 8 | |||||||
| Effect of exchange rate changes on cash and cash equivalents |
214 | (404 | ) | 486 | ||||||||
| Net increase (decrease) in cash and cash equivalents |
(975 | ) | (2,085 | ) | 2,524 | |||||||
| Cash and cash equivalents, beginning of the year |
13,129 | 15,214 | 12,690 | |||||||||
| Cash and cash equivalents, end of the year |
$ | 12,154 | $ | 13,129 | $ | 15,214 | ||||||
| Supplemental cash flow information: |
||||||||||||
| Cash paid for interest expense |
$ | 392 | $ | 361 | $ | 291 | ||||||
| Cash paid (refunded) for income taxes |
1,151 | 2,061 | (162 | ) | ||||||||
| Supplemental disclosure of acquisition related activity: |
||||||||||||
| Fair value of assets acquired |
$ | — | $ | 8,470 | $ | 14,109 | ||||||
| Liabilities assumed |
— | (229 | ) | (573 | ) | |||||||
| Purchase consideration |
— | 8,241 | 13,536 | |||||||||
| Common stock, notes payable and accrued consideration, net |
— | (3,462 | ) | (5,986 | ) | |||||||
| Cash acquired in acquisitions |
— | — | (208 | ) | ||||||||
| Acquisitions of businesses and contingent consideration, net of cash acquired |
$ | — | $ | 4,779 | $ | 7,342 | ||||||
See accompanying notes to consolidated financial statements.
F-6
NOTES TO CONSOLIDATED FINANCIAL STATEMENTS
(in thousands, except per share data)
NOTE 1. NATURE OF OPERATIONS
Otix Global, Inc. (“the Company” or “Otix”) was previously named Sonic Innovations, Inc. At the May 2009 annual meeting, the shareholders of Sonic Innovations, Inc. voted to change the name to Otix Global, Inc. The change created a holding company that allows the Sonic Innovations (“Sonic”) brand and Sonic’s other brands to operate independently from each other. Sonic continues as a company and brand, developing and distributing hearing instruments and services, and Otix is the parent company of Sonic and Sonic’s other legal entities.
Otix is a hearing aid company focused on the therapeutic aspects of hearing care. The Company designs, develops, manufactures and markets high-performance digital hearing aids intended to provide the highest levels of satisfaction for hearing impaired consumers. The Company has developed patented digital-signal-processing (“DSP”) technologies based on what the Company believes is an advanced understanding of human hearing. In those countries where the Company has direct (owned) operations, it sells products to hearing care professionals or directly to hearing impaired consumers. In other parts of the world where the Company does not have direct operations, it sells principally to distributors.
On September 1, 2008, the Company sold one European operation and closed a second European operation. As of December 31, 2009 and 2008, there are no material balances related to these operations remaining in the Consolidated Balance Sheet. On February 20, 2007, Tympany, Inc. (“Tympany” or the “Auditory Testing equipment division”) was sold to a group of private investors. These three operations have been classified as discontinued operations in the Consolidated Statements of Operations and Cash Flows for the years ended December 31, 2009, 2008 and 2007, as applicable.
As further discussed in Note 6, in June 2009, the German government passed a law that became effective April 1, 2009. The key implication to the Company’s business model was to impose additional costs on the doctors and insurance companies that conduct business with the Company’s German subsidiary. The Company is currently renegotiating contracts in light of the new legislative requirements and is working to contract with other insurance companies as well. The Company’s German subsidiary is exploring and implementing alternative avenues for replacing the lost revenue. The lack of signed insurance contracts and the imposition of new and costly requirements on the ENT doctors make the long term prospects for the Company’s German subsidiary uncertain. The German situation will continue to impact the Company’s liquidity.
The Company’s ability to make payments on and to refinance its indebtedness, and to fund planned capital expenditures and ongoing operations, will depend on its ability to generate cash in the future. This depends to a degree on general economic, financial, competitive, legislative, regulatory and other factors that are beyond the Company’s control. The Company plans to continue to manage its receivables and inventory to improve turns which is expected to free-up cash and, together with available cash balances; it is expected to be able to fund future debt service payments, ongoing operations, and capital expenditures through at least December 31, 2010. Considering its current level of operations, expected revenue growth and anticipated cost management and operating improvements, the Company plans on generating positive cash flow from operations over the next twelve months. The key to this assumption will be its German operating performance. In financing activities, the Company plans to continue to limit capital expenditures to key strategic projects with an anticipated high rate of return. It expects that total current debt service payments due over the next year of $4,923 will be repaid from available cash on hand, and anticipated cash flow from operations. The Company has negotiated an extension on its line of credit.
There can be no assurance, however, that the Company’s business will generate sufficient cash flow from operations, that currently anticipated cost savings and operating improvements will be realized on schedule or that future borrowings will be available in an amount sufficient to enable it to pay its indebtedness or to fund other liquidity needs. Furthermore, the Company cannot provide any assurances that ongoing adverse conditions in global capital markets and adverse general economic conditions will not have a material adverse impact on its future operations and cash flows. The Company may need to refinance all or a portion of its indebtedness on or before maturity and it cannot provide assurances that it will be able to refinance any of its indebtedness on commercially reasonable terms, or at all. Should the Company be unable to renegotiate its debt service payments, it may need to sell assets of the company, which will also be subject to market conditions existing at that time. Both the revolving credit facility and the German bank debt have a customary material adverse change clause that allows the banks to call the loans, if invoked. Neither bank has invoked this clause. The Company is in compliance with its debt covenants as of December 31, 2009. Additionally, the Company expects to have incremental borrowing capacity on its line of credit based on the March 2010 amendment. As of December 31, 2009, the Company’s outstanding borrowings of $3,116 represented the maximum allowable borrowing under the terms of the then-existing agreement.
F-7
OTIX GLOBAL, INC.
NOTES TO CONSOLIDATED FINANCIAL STATEMENTS—(Continued)
(in thousands, except per share data)
NOTE 2. SUMMARY OF SIGNIFICANT ACCOUNTING POLICIES
Principles of Consolidation. The consolidated financial statements include the accounts of Otix Global, Inc. and its wholly owned subsidiaries. Intercompany balances and transactions are eliminated in consolidation.
Use of Estimates. The preparation of financial statements in conformity with U.S. generally accepted accounting principles requires management to make estimates and assumptions that affect the reported amounts of assets and liabilities and disclosure of contingent assets and liabilities as of the date of the financial statements and the reported amounts of revenues and expenses during the reporting period. The most significant estimates affecting the financial statements are those related to allowance for doubtful accounts, sales returns, inventory obsolescence, goodwill, long-lived asset impairment, warranty accruals, legal contingency accruals and deferred income tax asset valuation allowances. Actual results could differ from those estimates.
Revenue Recognition. Sales of hearing aids are recognized when (i) products are shipped, except for retail hearing aid sales, which are recognized upon acceptance by the consumer, (ii) persuasive evidence of an arrangement exists, (iii) title and risk of loss has transferred, (iv) the price is fixed or determinable, (v) contractual obligations have been satisfied, and (vi) collectibility is reasonably assured. Revenues related to sales of separately priced extended service contracts are deferred and recognized on a straight-line basis over the contractual periods. Deferred revenue also includes cash received prior to revenue recognition criteria being met (for example, customer acceptance). Net sales consist of product sales less provisions for sales returns and rebates, which are made at the time of sale. The Company generally has a 60 day return policy for wholesale and 30 days for retail hearing aid sales, and allowances for sales returns are reflected as a reduction of sales and accounts receivable. If actual sales returns differ from the Company’s estimates, revisions to the allowance for sales returns will be required. Allowances for sales returns were as follows:
| Year ended December 31, | ||||||||||||
| 2009 | 2008 | 2007 | ||||||||||
| Balance, beginning of period |
$ | 1,994 | $ | 2,389 | $ | 3,463 | ||||||
| Provisions |
7,396 | 10,723 | 13,884 | |||||||||
| Returns processed |
(8,194 | ) | (11,118 | ) | (14,958 | ) | ||||||
| Balance, end of period |
$ | 1,196 | $ | 1,994 | $ | 2,389 | ||||||
The Company performs ongoing credit evaluations of its customers and provides for doubtful accounts. As of December 31, 2009 and 2008, allowances for doubtful accounts were $851 and $1,497, respectively. For 2009, 2008 and 2007, the Australian Government’s Office of Hearing Services, a division of the Department of Health and Aging, accounted for approximately 16%, 12% and 12% of the Company’s total net sales, respectively. No other customer accounted for 10% or more of consolidated sales. No single customer comprised more than 10% of accounts receivable as of December 31, 2009 and 2008.
Distributor Sales. The aforementioned revenue recognition discussion also applies to distributor sales. Distributor sales generally contain payment terms ranging from 30 to 90 days, provide a six month warranty, and assess a restocking fee of 25 percent of purchase price for returned units. The Company does not grant price protection or concession rights to distributors.
Taxes Collected from Customers and Remitted to Governmental Authorities. The Company recognizes taxes assessed by a governmental authority that is directly imposed on a revenue-producing transaction between a seller and a customer on a net basis (excluded from net sales).
Warranty Costs. The Company provides for the cost of remaking and repairing products under warranty at the time of sale, typically for periods of six months to three years depending upon customer, product and geography. These costs are included in cost of sales. When evaluating the adequacy of the warranty reserve, the Company analyzes the amount of historical and expected warranty costs by geography, by product family, by model and by warranty period as appropriate. If actual product failure rates or repair and remake costs differ from the Company’s estimates, revisions to the warranty accrual will be required.
F-8
OTIX GLOBAL, INC.
NOTES TO CONSOLIDATED FINANCIAL STATEMENTS—(Continued)
(in thousands, except per share data)
Accrued warranty costs were as follows:
| Year ended December 31, | ||||||||||||
| 2009 | 2008 | 2007 | ||||||||||
| Balance, beginning of period |
$ | 3,727 | $ | 5,249 | $ | 6,063 | ||||||
| Provisions |
4,005 | 3,755 | 4,786 | |||||||||
| Transferred to third party |
— | (249 | ) | — | ||||||||
| Costs incurred |
(3,831 | ) | (5,028 | ) | (5,600 | ) | ||||||
| Balance, end of period |
$ | 3,901 | $ | 3,727 | $ | 5,249 | ||||||
Cash Equivalents. The Company considers all short-term investments purchased with an original maturity of three months or less to be cash equivalents. As of December 31, 2009 and 2008, cash equivalents consisted of money market funds totaling $4,860 and $8,001, respectively. The Company has pledged $71 in 2009 and $284 in 2008 as a security deposit for a banking arrangement.
Inventories. Inventories are stated at the lower of cost or market using the first-in, first-out method. The Company includes material, labor and manufacturing overhead in the cost of inventories. Provision is made (i) to reduce excess and obsolete inventories to their estimated net realizable values and (ii) for estimated product (inventory) returns in those countries that sell on a retail basis and recognize a sale only upon acceptance by the consumer. Once the value is adjusted, the original cost less the inventory write-down represents the new cost basis. Amounts are written off and the associated reserve is reversed when the related inventory has been scrapped or sold. The net realizable value of inventories as of December 31 consisted of the following:
| 2009 | 2008 | |||||
| Raw materials and components |
$ | 3,410 | $ | 4,445 | ||
| Work in progress |
55 | 218 | ||||
| Finished goods |
5,289 | 5,466 | ||||
| Total |
$ | 8,754 | $ | 10,129 | ||
As of December 31, 2009 and 2008, inventory reserves were $877 and $1,343, respectively.
Purchase Commitments and Supplier Concentrations. The Company reviews its firm purchase commitments at each reporting date to determine if commitments are at prices in excess of net realizable value. To the extent such commitments exceed net realizable value, the Company’s policy is to recognize a loss in the period in which impairment in value becomes evident. There were no such losses recognized in 2009, 2008 and 2007.
A number of critical components used in the Company’s products are currently available from only a single or limited number of suppliers. As of December 31, 2009, the Company’s three proprietary DSP chips are each manufactured by a separate supplier. The Company’s relationship with these suppliers is critical to its business because proprietary DSP chips are integral to its products and only a small number of suppliers would be able or willing to produce the Company’s chips in the relatively small quantities and with the exacting specifications that the Company requires. Additionally, the receivers and microphones used in all the Company’s products are available from only two suppliers. Therefore, should these manufacturers be unable to provide such components, the Company’s ability to produce its products would be materially impaired. The Company also relies on a limited number of contractors for certain development projects and assembly operations.
Property and Equipment. Property and equipment are stated at cost. Depreciation is calculated using the straight-line method over the estimated useful lives. Leasehold improvements are amortized over the shorter of the estimated useful lives or the lease term. Upon the retirement or other disposition of property and equipment, the cost and related accumulated depreciation or amortization are removed from the accounts. The resulting gain or loss is included in net income. Major renewals and betterments are capitalized while minor expenditures for maintenance and repairs are charged to expense as incurred.
Impairment of Long-lived Assets. In accordance with the Accounting Standards Codification (“ASC”) 360-10, “Property, Plant and Equipment”, long-lived assets such as property, plant, and equipment, and purchased intangible assets subject to amortization, are amortized over their respective estimated useful lives and are reviewed for impairment whenever events or changes in circumstances indicate that the carrying amount of an asset or asset group may not be recoverable. Recoverability of assets to be held and used is measured by a comparison of the carrying amount of an asset or asset group to estimated undiscounted future cash flows expected to be generated by the asset or asset group. If the carrying amount of an asset or asset group exceeds its estimated future cash flows, an impairment charge is recognized in the amount by which the carrying amount of the asset exceeds the fair value of the asset or asset group. See Note 6 for further details on the Company’s current year assessment of long-lived assets.
Goodwill and Other Intangible Assets. Goodwill represents the excess of the cost of businesses acquired over the fair value of the assets acquired and liabilities assumed. In accordance with the provisions of ASC 350, “Intangibles- Goodwill and Other”, the Company does not amortize goodwill, but tests it for impairment annually using a fair value approach at the “reporting unit” level. In
F-9
OTIX GLOBAL, INC.
NOTES TO CONSOLIDATED FINANCIAL STATEMENTS—(Continued)
(in thousands, except per share data)
accordance with ASC 350, a reporting unit is the operating segment, or a business one level below that operating segment (the “component” level) if discrete financial information is prepared and regularly reviewed by senior management. However, components are aggregated as a single reporting unit if they have similar economic characteristics.
Goodwill and intangible assets that have indefinite useful lives are tested annually for impairment at year end, or more frequently if impairment indicators are present. Such indicators of impairment include, but are not limited to, changes in business climate, and operating or cash flow losses related to such assets. The Company’s goodwill and trade names were valued using level 3 inputs of the fair value hierarchy as defined in ASC 820, “Fair Value Measurements and Disclosures.” See Note 6 for further details on the Company’s current year assessment of goodwill and other intangible assets.
Customer Advances. The Company makes customer advances on a limited basis after reviewing and assessing the credit quality of the borrower. Customer advances are generally secured by the assets of the business and personal guarantees, generally bear market interest rates, are evidenced by promissory notes, and have maximum terms of eight years. The Company discontinues the accrual of interest income when payments are greater than 90 days past due. Advances are removed from non-accrual status when the customer advance is current. A loan loss allowance is recorded as necessary based on an individual assessment of loan collectability.
Shipping and Handling. Shipping and handling revenues are included in net sales and costs are included in cost of sales.
Research and Development. Research and development costs, which include basic research, development of useful ideas into new products, continuing support and enhancement of existing products and regulatory and clinical activities, are expensed as incurred.
Patents. In 2009, 2008 and 2007, the Company expensed direct costs associated with obtaining and filing patents of $162, $135, and $98, respectively.
Advertising. Advertising costs are expensed as incurred and were $6,779, $7,648, and $7,431 in 2009, 2008 and 2007, respectively.
Derivative Instruments. The Company may enter into readily marketable forward contracts with financial institutions to minimize the short-term impact of foreign currency fluctuations on certain intercompany balances. The Company does not enter into these contracts for trading or speculation purposes. Gains and losses on the contracts are included in the results of operations and offset foreign exchange gains or losses recognized on the revaluation of certain intercompany balances. The Company’s foreign exchange forward contracts generally mature in three months or less from the contract date. The Company held a forward contract hedge on €1,200 ($1,718) at December 31, 2009 which expired on January 4, 2010. The Company recognized an unrealized gain of $93 at December 31, 2009. The unrecognized gain is recorded in Other income, net in the 2009 Consolidated Statements of Operations, and in Prepaid expenses and other in the Consolidated Balance Sheets at December 31, 2009. Effective in the second quarter 2008, the Company entered into an interest rate swap agreement. The contract effectively fixes the interest rate of the long term debt associated with the German acquisition at 9.59% (see Note 8 for further details).
The Company held forward contract hedges on €4,300 ($6,061) and Australian $1,700 ($1,173) at December 31, 2008. The Company recognized an unrealized gain of $75 at December 31, 2008. The unrecognized gain was recorded in Other income, net in the Consolidated Statements of Operations, and in Prepaid expenses and other in the Consolidated Balance Sheets. The contracts expired in the first quarter of 2009.
Income Taxes. Income taxes are computed at current enacted tax rates, less tax credits using the asset and liability method. Under this method, deferred income tax assets and liabilities are determined based on the expected future income tax consequences of temporary differences between the carrying amounts of assets and liabilities for financial and income tax reporting purposes. A valuation allowance is provided to offset deferred income tax assets if, based upon the available evidence, it is more likely than not that some or all of the deferred income tax assets will not be realized.
ASC 740-10, “Income Taxes”, prescribes a recognition threshold and measurement attribute for the financial statement recognition and measurement of a tax position taken or expected to be taken in a tax return. It also provides guidance on derecognition of tax benefits, classification on the balance sheet, interest and penalties, accounting in interim periods, disclosure, and transition (see Note 13 for further details).
Earnings (Loss) Per Common Share. Basic income (loss) per common share is calculated based upon the weighted average shares of common stock outstanding during the period. Diluted earnings (loss) per common share is calculated based upon the weighted average number of shares of common stock outstanding, plus the dilutive effect of common stock equivalents calculated using the treasury stock method. Dilutive common stock equivalents for December 31, 2007 consisted of 1,041 shares pertaining to stock options and restricted stock awards and 11 shares related to an accrued earn-out in connection with Tympany. In 2009 and 2008, dilutive shares were considered anti-dilutive based on the Company’s loss from continuing operations and net loss. Anti-dilutive weighted common stock equivalents, consisting of stock options and restricted stock, of 3,978, 4,529, and 460 in 2009, 2008, and 2007, respectively, were excluded from diluted earnings per share calculations.
F-10
OTIX GLOBAL, INC.
NOTES TO CONSOLIDATED FINANCIAL STATEMENTS—(Continued)
(in thousands, except per share data)
Fair Value Measurements. The Company has adopted ASC 820, “Fair Value Measurements and Disclosures”, with respect to its financial assets and liabilities and for applicable non-financial assets and non-financial liabilities. ASC 820 defines fair value, establishes a framework for measuring fair value under generally accepted accounting principles and enhances disclosures about fair value measurements. Fair value is defined as the exchange price that would be received for an asset or paid to transfer a liability (an exit price) in the principal or most advantageous market for the asset or liability in an orderly transaction between market participants on the measurement date. Valuation techniques used to measure fair value must maximize the use of observable inputs and minimize the use of unobservable inputs. The standard describes a fair value hierarchy based on three levels of inputs, of which the first two are considered observable and the last unobservable, that may be used to measure fair value which are the following:
| • | Level 1 - Quoted prices in active markets for identical assets or liabilities. |
| • | Level 2 - Inputs other than Level 1 that are observable, either directly or indirectly, such as quoted prices for similar assets or liabilities; quoted prices in markets that are not active; or other inputs that are observable or can be corroborated by observable market data for substantially the full term of the assets or liabilities. |
| • | Level 3 - Unobservable inputs that are supported by little or no market activity and that are significant to the fair value of the assets or liabilities. |
The Company’s money market funds totaling $4,860 and hedging instrument on intercompany balances totaling $93 as of December 31, 2009 are recorded at fair value using Level 1 observable inputs.
ASC 825, “Financial Instruments”, effective January 1, 2008, allows an entity the irrevocable option to elect fair value for the initial and subsequent measurement for specified financial assets and liabilities on a contract-by-contract basis. The Company did not elect to adopt the fair value option as permitted under this Statement.
Foreign Currency Translation. The local currency of each foreign subsidiary is considered the functional currency. The accounts of the Company’s subsidiaries are translated into U.S dollars using the exchange rate at the balance sheet date for assets and liabilities and the weighted average exchange rate for the period for revenues, expenses, gains and losses. Translation adjustments are recorded as a separate component of comprehensive income (loss). Gains or losses resulting from foreign currency transactions are included in other income (expense).
Employee Stock Option Plans. The Company has stock-based compensation plans for employees and directors, which are described more fully in Note 14. The Company accounts for these stock option plans under the guidance found in ASC 718, “Compensation.”
Recent Accounting Pronouncements. ASC 805, “Business Combinations” became effective for fiscal years beginning after December 15, 2008. This standard requires the acquiring entity in a business combination to recognize all (and only) the assets acquired and liabilities assumed in the transaction, establishes the acquisition-date fair value as the measurement objective for all assets acquired and liabilities assumed, and requires the acquirer to disclose to investors and other users all of the information they need to evaluate and understand the nature and financial effect of the business combination. The adoption of ASC 805 did not have a material impact on the consolidated financial statements.
ASC 810, “Consolidation”, which is effective for fiscal years beginning after December 15, 2008, requires all entities to report non-controlling (minority) interests in subsidiaries in the same way as equity in the consolidated financial statements. The adoption of ASC 810, effective January 1, 2009, did not have a material impact on the consolidated financial statements.
ASC 855, “Subsequent Events”, which provides guidance to establish general standards of accounting for and disclosures of events that occur after the balance sheet date but before financial statements are issued or are available to be issued. ASC 855 is effective for interim or fiscal periods ending after June 15, 2009. The adoption of this standard did not have a material impact on the Company’s consolidated financial statements.
ASC 105, “Generally Accepted Accounting Principles”, which is effective for financial statements issued for interim and annual periods ending after September 15, 2009, establishes the Financial Accounting Standards Board (“FASB”) Accounting Standards Codification™ (“Codification”), which supersedes all existing accounting standard documents and became the single source of authoritative non-governmental U.S. generally accepted accounting principles. All other accounting literature not included in the Codification will be considered non-authoritative. The Company has conformed its financial statements and related notes to the new Codification for the year ended December 31, 2009.
ASU 2009-13, “Revenue Recognition (ASU Topic 605) – Multiple Deliverable Revenue Arrangements”, a consensus of the FASB Emerging Issues Task Force which is effective for the Company in the first quarter of fiscal year 2011, with early adoption permitted, modifies the fair value requirements of ASC subtopic 605-25, “Revenue Recognition-Multiple Element Arrangements”, by allowing the use of the “best estimate of selling price” in addition to vendor-specific objective evidence (“VSOE”) and verifiable objective evidence (“VOE”) (now referred to as “TPE” standing for third-party evidence) for determining the selling price of a deliverable. A vendor is now required to use its best estimate of the selling price when VSOE or TPE of the selling price cannot be
F-11
OTIX GLOBAL, INC.
NOTES TO CONSOLIDATED FINANCIAL STATEMENTS—(Continued)
(in thousands, except per share data)
determined. In addition, the residual method of allocating arrangement consideration is no longer permitted. In October 2009, the FASB also issued ASU 2009-14, “Software (ASC Topic 985) – Certain Revenue Arrangements That Include Software Elements”, a consensus of the FASB Emerging Issues Task Force. This guidance modifies the scope of ASC subtopic 965-605, “Software-Revenue Recognition”, to exclude from its requirements (a) non-software components of tangible products and (b) software components of tangible products that are sold, licensed, or leased with tangible products when the software components and non-software components of the tangible product function together to deliver the tangible product’s essential functionality. This update requires expanded qualitative and quantitative disclosures once adopted. The Company is currently evaluating the impact of adopting these pronouncements and does not expect the standard to have a material impact on its consolidated financial statements.
Reclassifications. It is the Company’s policy to reclassify prior year financial statement and footnote amounts to conform to current year presentation. In 2008, the Company discontinued operations that have been detailed in Note 5; in addition, Tympany has been classified as a discontinued operation in the consolidated statements of operations. Tympany was sold on February 20, 2007.
NOTE 3. PROPERTY AND EQUIPMENT
Property and equipment as of December 31 consisted of the following:
| Useful Lives | 2009 | 2008 | ||||||||
| Machinery and equipment |
3-10 years | $ | 11,705 | $ | 10,919 | |||||
| Computer equipment and software |
1-10 years | 7,792 | 7,255 | |||||||
| Furniture and fixtures |
5-10 years | 7,743 | 8,431 | |||||||
| Leasehold improvements |
2-5 years | 1,456 | 905 | |||||||
| 28,696 | 27,510 | |||||||||
| Less accumulated depreciation and amortization |
(19,941 | ) | (20,641 | ) | ||||||
| Total |
$ | 8,755 | $ | 6,869 | ||||||
NOTE 4. ACQUISITIONS
The Company acquired nine retail audiology practices in 2008 and six in 2007. These acquisitions are an expansion of the Company’s distribution activities. The operations of these acquisitions are included in the Company’s consolidated results effective with their closing dates. Purchase consideration is summarized as follows:
| 2008 | 2007 | |||||
| Cash |
$ | 4,741 | $ | 7,233 | ||
| Notes payable, net of imputed interest of $93 and $497, respectively |
1,042 | 5,376 | ||||
| Issued common stock at market value |
2,420 | 610 | ||||
| Closing costs |
38 | 317 | ||||
| Total costs |
$ | 8,241 | $ | 13,536 | ||
Purchase Price Allocation. The purchase prices of the acquired companies have been allocated to the tangible and identifiable intangible assets acquired and liabilities assumed based on their estimated fair values. Goodwill represents the excess of purchase price over the net identifiable assets acquired. Management considers projected future cash flows, the weighted average cost of capital, and market multiples, among other factors in determining the purchase price allocation. Critical estimates in valuing certain intangible assets included, but were not limited to, future expected cash flows from customer databases, non-compete agreements, and brand names, as well as the time period and amortization method over which the intangible assets will continue to have value. Management’s estimates of fair value have been based upon assumptions believed to be reasonable, but which are inherently uncertain and unpredictable.
F-12
OTIX GLOBAL, INC.
NOTES TO CONSOLIDATED FINANCIAL STATEMENTS—(Continued)
(in thousands, except per share data)
The following table sets forth the allocation of the aggregate purchase price of the acquired businesses:
| Year ended December 31, | ||||||||
| 2008 | 2007 | |||||||
| Current assets |
$ | 262 | $ | 573 | ||||
| Property and equipment and other assets |
126 | 225 | ||||||
| Customer databases |
2,092 | 4,661 | ||||||
| Non-compete agreements |
559 | 988 | ||||||
| Trademarks |
25 | 65 | ||||||
| Goodwill |
5,406 | 7,597 | ||||||
| Current liabilities |
(89 | ) | (312 | ) | ||||
| Deferred revenue |
(140 | ) | (247 | ) | ||||
| Other liabilities |
— | (14 | ) | |||||
| Total |
$ | 8,241 | $ | 13,536 | ||||
NOTE 5. DISCONTINUED OPERATIONS
The 2009 discontinued operations activity consisted primarily of sales returns. In the second quarter of 2008, a decision was made to restructure and divest certain operations. During the second, third, and fourth quarters of 2008, the Company implemented these restructuring actions, primarily in Europe, by consolidating operations, reducing headcount, closing facilities, selling off assets and impairing certain intangible assets. On September 1, 2008, the Company sold one European operation unit for $706 in cash and closed a second operation.
In December 2004, the Company acquired 100% of the stock of Tympany, Inc. Contingent consideration in a combination of cash (60%) and the Company’s common stock (40%) was to be paid based on a percentage of net revenue from the date of acquisition through December 31, 2007. In 2006, the Company and the former owners of Tympany agreed to the amount of contingent consideration for the periods through June 2006 whereby the Company paid $1,461 in cash and issued 224 shares of common stock with a value of $975. The contingent consideration payable for the six months ended December 31, 2006 and the six months ended December 31, 2007 is currently in dispute with the former owners of Tympany as a result of a claim filed against the former owners for sales taxes not paid or accrued during their ownership. As of December 31, 2009, the Company has $337 accrued related to the earn-out obligation for the six months ended December 31, 2006 pending the outcome of this dispute.
On February 20, 2007, the Company sold all issued and outstanding stock of Tympany to Tympany Holding, L.L.C for $2,000, consisting of $600 in cash and $1,400 in short-term, non-interest bearing notes receivable, of which $379 remains outstanding as of December 31, 2009. The Company recorded a gain of $115 as a result of the sale. As part of the sale agreement, the Company retained its obligations under the contingent consideration provisions; however, the agreement also included a provision that Tympany Holding, L.L.C. would reimburse the Company for contingent consideration payable to the former shareholders of Tympany for the period from the date of sale through December 31, 2007. The Company recorded contingent consideration payable of $65 for the period from January 1, 2007 through the sale date of February 20, 2007 and $134 for the period from the sale date through December 31, 2007. With respect to these amounts, $80 remains a payable to the former shareholders as of December 31, 2009. Therefore, as of December 31, 2009, the Company has $417 accrued pertaining to earn-out payments, $337 relating to the six months ended December 31, 2006 and $80 relating to six months ended December 31, 2007.
The following amounts related to discontinued operations (the Company’s two Europe divisions and Tympany) have been segregated from continuing operations:
| For the year ended December 31, | ||||||||||||
| 2009 | 2008 | 2007 | ||||||||||
| Net sales |
$ | (50 | ) | $ | 1,266 | $ | 3,743 | |||||
| Loss from discontinued operations before restructuring and loss on sale |
$ | (51 | ) | $ | (1,141 | ) | $ | (1,208 | ) | |||
| Restructuring charge, net of zero taxes |
— | (2,678 | ) | — | ||||||||
| Gain (loss) on sale of discontinued operations, net of zero taxes |
— | (85 | ) | 115 | ||||||||
| Loss from discontinued operations, net of zero taxes |
$ | (51 | ) | $ | (3,904 | ) | $ | (1,093 | ) | |||
F-13
OTIX GLOBAL, INC.
NOTES TO CONSOLIDATED FINANCIAL STATEMENTS—(Continued)
(in thousands, except per share data)
NOTE 6. INTANGIBLE ASSETS
In accordance with the ASC 360-10, “Property, Plant and Equipment”, long-lived assets such as property, plant, and equipment, and purchased intangible assets subject to amortization, are amortized over their respective estimated useful lives and are reviewed for impairment whenever events or changes in circumstances indicate that the carrying amount of an asset or asset group may not be recoverable. Recoverability of assets to be held and used is measured by a comparison of the carrying amount of an asset or asset group to estimated undiscounted future cash flows expected to be generated by the asset or asset group. If the carrying amount of an asset or asset group exceeds its estimated future cash flows, an impairment charge is recognized in the amount by which the carrying amount of the asset exceeds the fair value of the asset or asset group. As of December 31, 2009, the Company performed the aforementioned tests and recorded a $3,440 charge to impair various customer databases used in the U.S. retail reporting unit in its North America operating segment.
Goodwill represents the excess of the cost of businesses acquired over the fair value of the assets acquired and liabilities assumed. In accordance with the provisions of ASC 350, “Intangibles- Goodwill and Other”, the Company does not amortize goodwill, but tests it for impairment annually using a fair value approach at the “reporting unit” level. In accordance with ASC 350, a reporting unit is the operating segment, or a business one level below an operating segment (the “component” level) if discrete financial information is prepared and regularly reviewed by senior management. However, components are aggregated as a single reporting unit if they have similar economic characteristics.
Goodwill and intangible assets that have indefinite useful lives are tested annually for impairment at year end, or more frequently if impairment indicators are present. Such indicators of impairment include, but are not limited to, changes in business climate, and operating or cash flow losses related to such assets. To measure the amount of an impairment loss, the standard prescribes a two-step method. The first step requires the Company to determine the fair value of the reporting unit and compare that fair value to the net book value of the reporting unit. The fair value of the reporting unit is determined using the income approach (discounted cash flow analysis). Under the income approach, the fair value of the asset is based on the value of the estimated cash flows that the asset can be expected to generate in the future. These estimated cash flows were discounted at a rate of 16.0% to arrive at the fair values in the Company’s 2009 calculations, and 14.5% in the 2008 calculations. The Company also considers market information (market approach) when such information is available to validate the more detailed discounted cash flow calculations. Market information typically includes the Company’s general knowledge of sale transaction multiples and/or previous discussions the Company has had with third parties regarding the value of a similar reporting unit or the Company’s specific reporting unit. The Company relies principally on the income approach because it reflects the reporting unit’s expected cash flows and incorporates management’s detailed knowledge of products, pricing, competitive environment, global economic conditions, industry conditions, interest rates, and management actions, whereas market information may not be available, or may be less precise due to a lack of comparability to the Company’s particular reporting unit. The second step requires the Company to determine the implied fair value of goodwill and measure the impairment loss as the difference between the book value of the goodwill and the implied fair value of the goodwill. The implied fair value of goodwill must be determined in the same manner as if the Company had acquired those reporting units.
Legislation passed by the Federal Council of Germany in November 2008 and which became effective on April 1, 2009, resulted in sweeping changes to the way doctors and healthcare providers interact and are reimbursed from insurance companies. These changes require the Company’s German subsidiary to renegotiate contracts with insurance companies and ENT doctors on a new basis. In the first three months of 2009, the Company believed its German subsidiary was making progress, having successfully renegotiated contracts representing approximately 27% of its 2008 German revenue. However, on April 1, 2009, the Company was notified by one large insurance company representing approximately 25% of its German revenue that, despite several months of favorable negotiations, due to “political headwinds”, they were refusing to enter into a contract; therefore, the Company’s German subsidiary filed a lawsuit in the Social Court in Hamburg, Germany against this insurance company, requesting that the court compel the insurance company to enter into a contract with it. On April 28, 2009, the Court rejected these claims. The Company’s German subsidiary subsequently filed an appeal of this decision, which was rejected without review. In addition, a number of other insurance companies were unsure if they should sign a contract because there were rumors that the newly enacted law could potentially change again, thus requiring the need to renegotiate again. Without renegotiated insurance contracts, and the ability to pay customary fitting fees to the ENT doctors, the Company expected revenue to decline substantially and cash flow of the operation would not be sufficient to support its intangibles balances.
The Company determined that an interim impairment test was necessary at the end of the first quarter of 2009 in this reporting unit. In the step one calculation, the Company assumed a full year revenue of approximately 45% of 2008 levels (which resulted from a full first quarter 2009 and approximately 27% of revenue thereafter) and operating expenses of approximately 90% of 2008 levels as the Company continued to attempt to renegotiate additional contracts and service existing contracts. However, renegotiation was expected to be difficult given the political pressures posed by local acousticians, the Company’s largest competitors, and the adverse result in the social court case. Accordingly, the Company could not reasonably expect revenue in excess of those contracts which had already been renegotiated for one year terms. In addition, there continued to be high risk that some or all of the insurance companies who had renegotiated their contracts would not renew their contracts with the Company upon expiration in April 2010 given the
F-14
OTIX GLOBAL, INC.
NOTES TO CONSOLIDATED FINANCIAL STATEMENTS—(Continued)
(in thousands, except per share data)
political climate and the social court decision. Accordingly, the Company estimated that it would maintain the 27% of revenue for one year and would be unable to successfully renegotiate with additional insurers. The Company used a discount rate of 14.5%. A sensitivity analysis was not performed given the significant disparity between the estimated fair value and carrying value. Reasonable changes to the assumptions used, based on then-existing facts and circumstances, would not have changed the outcome. After completing step one of the prescribed test, the Company determined that the estimated fair value of the reporting unit was less than its book value on March 31, 2009. The Company performed the step two test and concluded that the reporting unit’s goodwill and trade name were impaired. As a result, an impairment loss of $14,205 for goodwill and $453 for definite lived intangibles was recorded in the first quarter of 2009 in the Company’s Europe segment.
During the third quarter 2009, the Company closed three U.S. retail locations and impaired goodwill of $89 and customer databases of $46 associated with those locations.
As part of its annual review, performed in conjunction with its review of long-lived assets, the Company determined that the carrying amount of its U.S. retail reporting unit exceeded its fair value as a result of lower current and projected sales. The Company’s impairment analysis for its U.S. retail reporting unit estimated fair value using principally the income approach. The Company’s application of the income approach utilized a discounted cash flow model, with a discount rate of 16.0%. The Company utilized an 11.8% sales growth rate in 2010, which represented the board-approved budget, and five percent growth thereafter through 2014, at which time a three percent long term growth rate was utilized. Gross margin and operating expenses for 2010 through 2015 were generally consistent with 2009 levels. The Company assumed a future terminal value using an inflationary measure of 3%. The Company estimated capital expenditures based on recent operating results and capital requirements based on planned initiatives. The Company ran sensitivity analyses using a seven percent revenue growth rate for 2011 through 2014 which would have resulted in an enterprise value 34% higher than the utilized value. Growth rates of less than five percent were not deemed reasonable given the Company’s current expectations and understanding of current retail sale transaction multiples. The Company believes the assumptions utilized represented the most likely scenario given the current circumstances. The Company also considered current trends in retail sale transaction multiples (market approach). If the carrying amount of a reporting unit exceeds its fair value, an impairment loss is recognized for any excess of the carrying amount of the reporting unit’s goodwill over the implied fair value of that goodwill. The implied fair value of goodwill is determined by allocating the fair value of the reporting unit to all the assets and liabilities of that unit as if the reporting unit had been acquired in a business combination and the fair value of the reporting unit was the price paid to acquire the reporting unit. The identified intangible assets included customer databases, non-compete agreements, and trade names. The fair values of the intangible assets were estimated using detailed cash flow-based models for each respective asset. Other assets and liabilities had carrying values that approximated fair values. The excess of the fair value of a reporting unit over the amounts assigned to assets and liabilities is the implied fair value of goodwill. The Company compared the implied fair value of the reporting unit‘s goodwill with the carrying value of the unit’s goodwill, as a result of these calculations, the Company recorded impairment charges of $12,432 for goodwill and $3,440 for definite-lived intangible assets in the fourth quarter of 2009 in the Company’s North America segment.
During the second, third, and fourth quarters of 2008, the Company implemented restructuring actions, primarily in Europe, by consolidating operations, reducing headcount, closing facilities, selling of assets and impairing certain intangible assets, including goodwill and a trade name which resulted in a goodwill write-off of $2,264 and trade name write-off of $352, all of which related to discontinued operations. During the fourth quarter 2008, the Company recorded a goodwill impairment of $2,111 in its North America reporting segment, which represented a full impairment of the goodwill carrying value, based largely on declining sales and lower expected future profitability. The Company prepared a five year projection of anticipated cash flows through 2013. The first year of the projection utilized the 2009 board-approved budget and the additional future years were forecast using the budget as a baseline. The Company assumed a future terminal value using an inflationary measure of 3%. Assumptions were made regarding gross margin and operating costs to support the revenue projections. The Company estimated capital expenditures based on recent operating results and capital requirements based on planned initiatives. Sales revenue had declined 29% in 2008 compared to 2007 and were projected to decline another 15% in 2009, and then grow at a rate of 3% thereafter. Despite past and future cost cutting initiatives to combat this decline, the Company concluded the estimated future cash flows did not support the continued carrying of goodwill.
For a further discussion on these restructuring actions see Notes 5 and 9.
F-15
OTIX GLOBAL, INC.
NOTES TO CONSOLIDATED FINANCIAL STATEMENTS—(Continued)
(in thousands, except per share data)
Goodwill and indefinite-lived intangible assets (arrangement with the Australian government to supply hearing aids) in 2009 and 2008 were as follows:
| 2009 | 2008 | ||||||||||||||||||||||||||||||
| North America |
Europe | Rest-of- World |
Total | North America |
Europe | Rest-of- World |
Total | ||||||||||||||||||||||||
| Balance as of January 1, | |||||||||||||||||||||||||||||||
| Goodwill |
$ | 16,033 | 23,451 | 7,242 | $ | 46,726 | 11,186 | 24,763 | 9,188 | $ | 45,137 | ||||||||||||||||||||
| Accumulated impairment charges |
(2,111 | ) | (1,809 | ) | — | (3,920 | ) | — | — | — | — | ||||||||||||||||||||
| 13,922 | 21,642 | 7,242 | 42,806 | 11,186 | 24,763 | 9,188 | 45,137 | ||||||||||||||||||||||||
| Goodwill acquired during the year |
— | — | — | — | 5,406 | — | — | 5,406 | |||||||||||||||||||||||
| Goodwill impairment |
(12,521 | ) | (14,205 | ) | — | (26,726 | ) | (2,111 | ) | (1,809 | ) | — | (3,920 | ) | |||||||||||||||||
| Goodwill included in loss on disposal |
— | — | — | — | — | (455 | ) | — | (455 | ) | |||||||||||||||||||||
| Effect of exchange rate changes |
— | (1,066 | ) | 2,126 | 1,060 | (559 | ) | (857 | ) | (1,946 | ) | (3,362 | ) | ||||||||||||||||||
| Balance as of December 31, |
|||||||||||||||||||||||||||||||
| Goodwill |
16,033 | 22,385 | 9,368 | 47,786 | 16,033 | 23,451 | 7,242 | 46,726 | |||||||||||||||||||||||
| Accumulated impairment charges |
(14,632 | ) | (16,014 | ) | — | (30,646 | ) | (2,111 | ) | (1,809 | ) | — | (3,920 | ) | |||||||||||||||||
| $ | 1,401 | $ | 6,371 | $ | 9,368 | $ | 17,140 | $ | 13,922 | $ | 21,642 | $ | 7,242 | $ | 42,806 | ||||||||||||||||
Definite-lived intangible assets as of December 31 consisted of the following:
| December 31, 2009 | December 31, 2008 | |||||||||||||
| Useful Lives |
Gross Carrying Value |
Accumulated Amortization |
Gross Carrying Value |
Accumulated Amortization | ||||||||||
| Purchased technology and licenses |
3-13 years | $ | 1,976 | $ | 1,357 | $ | 1,976 | $ | 1,214 | |||||
| Brand and trade names |
1-3 years | 129 | 129 | 1,948 | 1,368 | |||||||||
| Customer databases |
2-10 years | 7,433 | 5,940 | 7,445 | 1,527 | |||||||||
| Non-compete agreements |
1-5 years | 2,189 | 1,285 | 2,171 | 927 | |||||||||
| Total |
$ | 11,727 | $ | 8,711 | $ | 13,540 | $ | 5,036 | ||||||
Amortization of definite-lived intangible assets is calculated using the straight-line method over the estimated useful lives of the assets and totaled $1,530, $1,711, and $1,164 in 2009, 2008, and 2007, respectively from continuing operations. Estimated annual amortization expense for the years 2010 through 2014 and thereafter is as follows: 2010–$796; 2011–$782; 2012–$655; 2013- $419 and 2014 and thereafter–$364.
NOTE 7. OTHER ASSETS
Other assets as of December 31 consisted of the following:
| 2009 | 2008 | |||||
| Customer advances – long term |
$ | 1,602 | $ | 3,111 | ||
| Other |
693 | 476 | ||||
| Total |
$ | 2,295 | $ | 3,587 | ||
Customer advances totaled $2,488 and $3,960, including short term balances of $886 and $849 as of December 31, 2009 and 2008, respectively. As of December 31, 2009 and 2008, the Company has recorded customer advances on non-accrual status totaling $139 and $154, respectively, due to the fact that payments were greater than 90 days past due. The Company has recorded $133 and $22 as an allowance for loan losses as of December 31, 2009 and 2008.
NOTE 8. LONG-TERM DEBT
The Company obtained a loan from a German bank in 2003 to fund the acquisition of its German business. On June 13, 2008, Sonic Innovations GmbH, a German-subsidiary of Otix Global, Inc., entered into a Second Amendment to the long-term loan with a German bank. The Second Amendment released the requirement of a stand-by letter of credit which was supported by restricted cash at a U.S. bank of $5,194 at December 31, 2007. The restricted cash was released during the second quarter of 2008. Additionally, the Second Amendment states that all current loan utilization will bear interest at a rate of the EURIBOR rate plus 4.0%. As of December 31, 2009, the balance of the loan was €1,250 ($1,791). The loan payments are €250 ($358 as of December 31, 2009) per quarter. The effective interest rate on this loan for the years ended December 31, 2009 and 2008 was 9.59% and 8.54%, respectively.
F-16
OTIX GLOBAL, INC.
NOTES TO CONSOLIDATED FINANCIAL STATEMENTS—(Continued)
(in thousands, except per share data)
In June 2008, the Company entered into an interest rate swap agreement with an initial notional amount of €2,500 to be reduced €250 per quarter through January 2011. Under this agreement the Company receives a floating rate based on EURIBOR interest rate, and pays a fixed rate of 9.59% on the notional amount of €2,500 effectively fixing the interest rate on the Company’s German loan, which related liability is included as a component of Other accrued liabilities on the Consolidated Balance Sheets.
As of December 31, 2009, the current portion of long-term debt was $4,923 and the long-term portion was $452. Future payments on long-term debt consisted of the following as of December 31, 2009:
| Future Payments | |||||||||||||||||||
| Effective Interest Rate |
Total | 2010 | 2011 | 2012 | |||||||||||||||
| Foreign loan |
9.59 | % | $ | 1,791 | $ | 1,433 | $ | 358 | $ | — | |||||||||
| Line of credit |
6.92 | % | 3,116 | 3,116 | — | — | |||||||||||||
| Acquisition loans & other |
0.0-9.03 | % | 485 | 386 | 67 | 32 | |||||||||||||
| Total |
5,392 | 4,935 | 425 | 32 | |||||||||||||||
| Less imputed interest |
(17 | ) | (12 | ) | (4 | ) | (1 | ) | |||||||||||
| Total carrying amount |
$ | 5,375 | $ | 4,923 | $ | 421 | $ | 31 | |||||||||||
In April 2007, the Company entered into a Loan and Security Agreement with Silicon Valley Bank (“SVB”), providing for a revolving credit facility, under which borrowings of up to $6,000 were available. The credit facility is secured by substantially all tangible U.S. assets. The credit facility was amended in May 2008 to extend the term for one year to April 12, 2010, modify the adjusted quick ratio, and consent to a guarantee by the Company of the loan from a German bank. There is an annual fee of 0.375% on the average unused portion of the credit facility. During the second quarter of 2009 the Company borrowed $2,750 on this line of credit. The Company further amended the credit facility agreement in August 2009 to exclude first quarter 2009 intangible impairment charges (see Note 6 for further details). Borrowings under the credit facility are now subject to interest at the domestic prime rate. If the adjusted quick ratio is greater than or equal to 1.25 to 1.0, then the interest rate is the Prime Rate plus 0.25 percentage point; if the adjusted quick ratio is less than 1.25 to 1.0, then the interest rate is the Prime Rate plus 0.50 percentage point. The amendment further includes a covenant that the Company should not incur EBITDA losses greater than $3,000 on a cumulative basis for all quarterly or monthly periods, as applicable, in calendar year 2009. Beginning in 2010, this covenant will be calculated based on a rolling twelve-month period. The agreement was further amended in February 2010 to exclude the third and fourth quarter 2009 intangible impairment charges. As of December 31, 2009, the interest rate on the Company’s line of credit was 4.5% and the Company’s outstanding borrowings of $3,116 represented the maximum allowable borrowing under the terms of the then-existing agreement.
On March 10, 2010, the Company finalized the Second Amendment to the Amended and Restated Loan and Security Agreement with SVB to renew and extend the revolving credit facility to April 11, 2011. The amendment modifies the previous agreement to provide additional borrowing capacity of unrestricted cash held at SVB up to $2,000, no longer reduces borrowing capacity related to foreign currency hedging instruments, and modifies the EBITDA requirement, as follows:
| Period |
Calculation Method | Minimum Requirement | ||
| January 1 - March 31, 2010 |
Cumulative | $2,000 loss | ||
| April 1 - May 31, 2010 |
Trailing three months | $1,000 loss | ||
| June 1 - September 30, 2010 |
Trailing three months | $0.001 income | ||
| Thereafter |
Trailing three months | $500 income |
The fair value of the Company’s debt obligations approximates the carrying value as of December 31, 2009. The Company is in compliance with its debt covenants as of December 31, 2009. Both the revolving credit facility and the German bank debt have a customary material adverse change clause that allows the banks to call the loans, if invoked. Neither bank has invoked this clause. In accordance with ASC 470-10, the Company has classified the outstanding balance on the revolving credit facility as a short term liability as of December 31, 2009 due to the inability of the Company to determine the likelihood that any future events or circumstances affecting the Company may constitute a material adverse event under the terms of the revolving credit facility agreement causing SVB to exercise its right to accelerate payment of amounts due under the revolving credit facility agreement. At December 31, 2009, the Company’s net borrowings on this line of credit were $3,116. Subsequent to December 31, 2009, the Company repaid $971 due to reduced borrowing capacity. There were no outstanding borrowings on the credit facility as of December 31, 2008.
F-17
OTIX GLOBAL, INC.
NOTES TO CONSOLIDATED FINANCIAL STATEMENTS—(Continued)
(in thousands, except per share data)
NOTE 9. RESTRUCTURING CHARGES
Restructuring actions for the years ended December 31, 2009 and 2008 consisted of the following:
| 2009 |
Personnel | Facilities | Impairment and other |
Total | Cash | Non-cash | Total | |||||||||||||||
| Continuing operations |
$ | 757 | $ | 35 | $ | (23 | ) | $ | 769 | $ | 612 | $ | 157 | $ | 769 | |||||||
| Total 2009 |
$ | 757 | $ | 35 | $ | (23 | ) | $ | 769 | $ | 612 | $ | 157 | $ | 769 | |||||||
| 2008 |
||||||||||||||||||||||
| Continuing operations |
$ | 1,409 | $ | 271 | $ | 372 | $ | 2,052 | $ | 1,790 | $ | 262 | $ | 2,052 | ||||||||
| Discontinued operations |
184 | 100 | 2,394 | 2,678 | 464 | 2,214 | 2,678 | |||||||||||||||
| Total 2008 |
$ | 1,593 | $ | 371 | $ | 2,766 | $ | 4,730 | $ | 2,254 | $ | 2,476 | $ | 4,730 | ||||||||
During 2009, the Company took actions to improve profitability by 1) reducing the total number of employees in North America; 2) closing three U.S. retail locations resulting in a restructuring charge of $98 and goodwill and definite-lived intangible write-off of $135; and 3) reducing headcount and selling two retail shops in Europe. The total restructuring charge from these actions was $769, which included $158 in sale proceeds from the two European shops. The total restructuring charge from the 2009 actions was $769, of which $634 is recorded in restructuring charges and $135 is recorded in goodwill and definite lived impairment charges in the Company’s Consolidated Statements of Operations.
The 2008 goodwill impairments resulted from the decision to cease operations in one European country and write-off the associated goodwill of $690; and the decision to sell operations in another European country where the pending sales offer did not support the goodwill balance and the Company recorded an estimated impairment loss of $1,119. The sale agreement was finalized and the transaction closed during the third quarter 2008, resulting in a loss on sale of $85, which included a goodwill write-off of $455. The Company also recorded a $352 charge to impair a trade name in one of the affected European countries based on a decision in the second quarter 2008 to cease using the trade name. The operations subject to these intangible write-offs have been classified as discontinued operations in the Consolidated Statements of Operations for the years ended December 31, 2009, 2008, and 2007.
Restructuring activity for the three years ended December 31, 2009 consisted of the following:
| Employee Related |
Excess Facilities |
Impairment and Other |
Total | |||||||||||||
| Balance, December 31, 2006 |
$ | 72 | $ | 112 | $ | — | $ | 184 | ||||||||
| Payments |
(72 | ) | (112 | ) | — | (184 | ) | |||||||||
| Balance, December 31, 2007 |
— | — | — | — | ||||||||||||
| Restructuring charge |
$ | 1,593 | $ | 371 | $ | 2,766 | $ | 4,730 | ||||||||
| Payments |
(1,153 | ) | (88 | ) | (2,641 | ) | (3,882 | ) | ||||||||
| Balance, December 31, 2008 |
440 | 283 | 125 | 848 | ||||||||||||
| Restructuring charge |
757 | 35 | (23 | ) | 769 | |||||||||||
| Payments and foreign exchange |
(908 | ) | (296 | ) | (57 | ) | (1,261 | ) | ||||||||
| Balance, December 31, 2009 |
$ | 289 | $ | 22 | $ | 45 | $ | 356 | ||||||||
NOTE 10. CAPITAL STOCK
Preferred Stock. The Company’s certificate of incorporation authorizes the issuance of 5,000 shares of preferred stock with terms and preferences designated therein. As of December 31, 2009 and 2008, no preferred shares were outstanding.
Shareholder Rights Plan. The Company has a shareholder rights plan pursuant to which it declared a dividend of one preferred share purchase right for each outstanding share of common stock. Each right entitles the holder, under certain circumstances, to purchase common stock of the Company with a value of twice the exercise price of the right. The rights are redeemable by the Company and expire in 2011.
F-18
OTIX GLOBAL, INC.
NOTES TO CONSOLIDATED FINANCIAL STATEMENTS—(Continued)
(in thousands, except per share data)
NOTE 11. OTHER INCOME
Other income as of December 31 consisted of the following:
| 2009 | 2008 | 2007 | |||||||||
| Interest income |
$ | 346 | $ | 606 | $ | 1,026 | |||||
| Foreign currency exchange gain (loss) |
(157 | ) | (111 | ) | 378 | ||||||
| Other |
45 | 672 | 24 | ||||||||
| Total |
$ | 234 | $ | 1,167 | $ | 1,428 | |||||
Other income (loss) from discontinued operations for 2009, 2008 and 2007 was zero, $1 and ($27), respectively. In 2008, other is comprised primarily of a gain on a patent sale to the Bose Corporation.
NOTE 12. COMMITMENTS AND CONTINGENCIES
| For the years ending December 31, | |||||||||||||||
| Total | 2010 | 2011 – 2012 | 2013 – 2014 | After 2014 | |||||||||||
| Long-term debt including interest |
$ | 2,213 | $ | 1,838 | $ | 375 | $ | — | $ | — | |||||
| Line of credit |
3,116 | 3,116 | — | — | — | ||||||||||
| Operating leases |
10,056 | 3,463 | 4,296 | 1,585 | 712 | ||||||||||
| Payable to former owners of Tympany |
417 | 417 | — | — | — | ||||||||||
| Purchase commitments |
3,804 | 3,804 | — | — | — | ||||||||||
| Minimum royalty payments |
300 | 120 | 120 | 60 | — | ||||||||||
| Total |
$ | 19,906 | $ | 12,758 | $ | 4,791 | $ | 1,645 | $ | 712 | |||||
In connection with the Company’s retail acquisitions in 2008 and 2007, the remaining outstanding notes payable total $319 which is due in 2010, of which the Company paid $250 on January 4, 2010.
Operating Leases. The Company leases various equipment and office space under noncancelable operating leases that expire at various dates through 2018. Rental expense from continuing operations was $4,596, $4,968, and $3,754 in 2009, 2008 and 2007, respectively. Rental expense from discontinued operations was $0, $249, and $298 in 2009, 2008 and 2007. Sublease revenue of $10, $28 and $26 in 2009, 2008 and 2007, respectively, was netted against rental expense.
Brigham Young University Technology License Agreements. The Company has a paid-up license with Brigham Young University (“BYU”) to utilize certain patents involving hearing aid signal processing, audio signal processing, and hearing compression. The agreement remains in effect until the expiration of the last patent right in 2013 or the expiration of the last clause of the patents and can be terminated by BYU in the event of circumstances outlined in the agreement. During the term of the agreement, the Company is responsible for the payment of all fees and costs associated with filing and maintaining patent rights.
The Company also has a license agreement with BYU to utilize certain noise-suppression technologies owned by BYU. The agreement remains in effect indefinitely, unless terminated by BYU in the event of circumstances outlined in the agreement. Under the terms of this agreement, the Company is required to make royalty payments to BYU in the amount of 0.5% of the adjusted gross sales of the licensed products sold or otherwise transferred to an end user for as long as the Company uses this technology. This agreement may be terminated without cancellation fees. Royalty expense from continuing operations pertaining to this license was $303, $374 and $337 in 2009, 2008 and 2007, respectively.
Additionally, the Company signed a license agreement in 2007 with BYU to utilize hydrophobic coating technology with terms similar to the noise suppression license. Under the terms of this agreement, the Company is required to make royalty payments to BYU in the amount of 0.25% of the adjusted gross sales of the licensed products that use this technology. Royalty expense from continuing operations for 2009, 2008 and 2007 was $60, $50 and $0, respectively.
K/S HIMPP License Agreement. The Company has a paid-up license agreement with K/S HIMPP, a Danish partnership, to use technology covered by approximately 200 patents owned by K/S HIMPP that are considered essential for the sale of programmable hearing aids. The paid-up license is being amortized over the life of the technology through 2013. Amortization expense from continuing operations pertaining to this license was $99 in each of the three years ended December 31, 2009, 2008 and 2007.
Ear Tube License Agreement. The Company has a license agreement that provides a worldwide non-exclusive license to utilize patents involving ear tube technology for its open-ear product. Under the terms of this agreement, the Company paid an up-
F-19
OTIX GLOBAL, INC.
NOTES TO CONSOLIDATED FINANCIAL STATEMENTS—(Continued)
(in thousands, except per share data)
front royalty of $125 and must pay a royalty on each device sold and /or each ear tube if it manufacturers the item, or no royalty if it buys the item from the licensor. Under the terms of this agreement, the Company is required to make royalty payments in the amount of €0.20 per ear tube sold. This agreement remains in effect for seven years from the first product sale (March 2006). Amortization of the up-front payment began in March 2006 and will continue for a seven year period. Royalty expense from continuing operations pertaining to this license was $52, $61 and $79 in 2009, 2008 and 2007.
Programming System License Agreement. The Company has a license agreement that provides a non-exclusive worldwide license to utilize patents involving programming a hearing aid. Under the terms of this agreement, the Company paid an up-front royalty of $250, which was fully-amortized in 2008, and must pay a per-unit royalty fee on each item shipped after a set minimum. This agreement remains in effect until the expiration of the patents in 2012. Royalty expense from continuing operations pertaining to this license was $65, $65 and $63, in 2009, 2008 and 2007, respectively.
Directional License Agreement. The Company has a license agreement that provides an exclusive worldwide license to utilize patents involving directional signal processing. Under the terms of this agreement, the Company is required to pay a royalty equal to 0.5% of net sales of hearing aid products utilizing the technology or a minimum quarterly fee, whichever is greater. This agreement remains in effect until the expiration of the patents in 2020. Royalty expense from continuing operations pertaining to this license was $203, $275 and $223 in 2009, 2008 and 2007, respectively.
Receiver-in-canal License Agreement. The Company has an agreement, which began in the first quarter of 2009, related to its RIC product family, whereby the Company may owe royalty payments for products sold within the scope of the agreement. The Company made an initial payment of $250 related to this agreement. This agreement remains in effect until the expiration of the patents, unless terminated by the parties in the event of circumstances outlined in the agreement. Expense from continuing operations pertaining to this agreement was $209 in 2009.
Legal Matters. In June 2005, Energy Transportation Group, Inc. (“ETG”) filed a patent infringement lawsuit in the United States District Court for the District of Delaware against fourteen defendants, including the Company. ETG claimed the defendants infringed upon two of its patents. ETG sought damages resulting from defendants’ unauthorized manufacture, use, sale, offer to sell and/or importation into the U.S. products, methods, processes, services and/or systems that infringe the patents. On October 17, 2007, the Company and ETG agreed to settle this matter and the Company subsequently paid the agreed settlement in 2007.
In February 2006, the former owners of Sanomed, which the Company acquired in 2003, filed a lawsuit in German civil court claiming that certain deductions made by the Company against certain accounts receivable amounts and other payments remitted to the former owners were improper. The former owners sought damages in the amount of approximately €2,600 ($3,800). The Company filed its statement of defense and presented its position during oral arguments. The court asked the parties to attempt to settle the matter and on July 20, 2009, the Company and the former owners agreed to settle the claim. Under the terms of the settlement, the Company agreed to pay the former owners of Sanomed an aggregate sum of €1,050 ($1,471), approximately the amount reserved in the Company’s balance sheet at December 31, 2008 for this matter. The Company remitted the settlement payment in August 2009.
As part of the Sanomed purchase agreement, the former owners were entitled to contingent consideration based on the achievement of certain revenue milestones. In certain circumstances, the former owners were entitled to contingent consideration irrespective of the achievement of the revenue milestones. In addition to the above noted lawsuit, two of the former owners filed suits against the Company, one of which was settled in 2007, and the other former owner’s contingent consideration claim against the Company for approximately €1,100 ($1,577) plus interest was dismissed in July 2008, with the German court rendering its decision in favor of the Company. The former owner has appealed. The Company continues to strongly deny the allegations contained in the former owner’s appeal and intends to defend itself vigorously; however, litigation is inherently uncertain and an unfavorable result could have a material adverse effect on the Company. The Company establishes reserves when a particular contingency is probable and estimable.
From time to time the Company is subject to legal proceedings, claims and litigation arising in the ordinary course of its business. Most of these legal actions are brought against the Company by others and, when the Company feels it is necessary, it may bring legal actions against others. Actions can stem from disputes regarding the ownership of intellectual property, customer claims regarding the function or performance of the Company’s products, government regulation or employment issues, among other sources. Litigation is inherently uncertain, and therefore the Company cannot predict the eventual outcome of any such lawsuits. However, the Company does not expect that the ultimate resolution of any known legal action, other than as identified above, will have a material adverse effect on its results of operations and financial position.
F-20
OTIX GLOBAL, INC.
NOTES TO CONSOLIDATED FINANCIAL STATEMENTS—(Continued)
(in thousands, except per share data)
NOTE 13. INCOME TAXES
Income (loss) from continuing operations before income taxes consisted of the following:
| 2009 | 2008 | 2007 | |||||||||
| Domestic |
$ | (26,533 | ) | $ | (3,230 | ) | $ | 2,724 | |||
| Foreign |
(12,444 | ) | (428 | ) | 63 | ||||||
| Total |
$ | (38,977 | ) | $ | (3,658 | ) | $ | 2,787 | |||
Income tax provision (benefit) on continuing operations consisted of the following:
| 2009 | 2008 | 2007 | ||||||||||
| Current: |
||||||||||||
| Domestic |
$ | (100 | ) | $ | 10 | $ | 40 | |||||
| Foreign |
1,175 | 1,119 | 959 | |||||||||
| 1,075 | 1,129 | 999 | ||||||||||
| Deferred: |
||||||||||||
| Domestic |
(304 | ) | 229 | 67 | ||||||||
| Foreign |
(447 | ) | (1,296 | ) | (89 | ) | ||||||
| (751 | ) | (1,067 | ) | (22 | ) | |||||||
| Total |
$ | 324 | $ | 62 | $ | 977 | ||||||
The following table presents the principal components of the difference between the actual effective income tax rate and the U.S. federal statutory income tax rate of 34% on continuing operations:
| 2009 | 2008 | 2007 | ||||||||||
| U.S. federal statutory income tax rate |
$ | (13,252 | ) | $ | (1,244 | ) | $ | 948 | ||||
| State income tax rate, net of federal income tax effect |
(8 | ) | 39 | 16 | ||||||||
| Foreign earnings taxed at different rates |
(282 | ) | 25 | 190 | ||||||||
| Non-deductible items and other |
307 | (380 | ) | 341 | ||||||||
| Worthless stock deduction |
— | (1,632 | ) | — | ||||||||
| Stock based compensation expense |
159 | 172 | 128 | |||||||||
| Goodwill impairment |
6,093 | — | — | |||||||||
| Research and development credit |
(235 | ) | (373 | ) | (385 | ) | ||||||
| Foreign tax audit settlement |
566 | — | — | |||||||||
| Change in valuation allowance |
6,976 | 3,455 | (261 | ) | ||||||||
| Income tax expense |
$ | 324 | $ | 62 | $ | 977 | ||||||
F-21
OTIX GLOBAL, INC.
NOTES TO CONSOLIDATED FINANCIAL STATEMENTS—(Continued)
(in thousands, except per share data)
Deferred income taxes are determined based on the differences between the financial reporting and income tax bases of assets and liabilities using enacted income tax rates expected to apply when the differences are expected to be settled or realized. Significant components of the net deferred income tax assets consisted of the following as of December 31:
| 2009 | 2008 | |||||||
| Deferred income tax assets: |
||||||||
| Net operating loss carry-forwards |
$ | 14,886 | $ | 12,299 | ||||
| Allowance for sales returns and doubtful accounts |
504 | 839 | ||||||
| Inventory allowances and warranty accruals |
1,253 | 1,052 | ||||||
| Deferred revenue |
1,036 | 803 | ||||||
| Accumulated research and development credits |
3,409 | 3,320 | ||||||
| Capital loss carry-forward |
334 | 383 | ||||||
| Depreciation and amortization |
532 | 394 | ||||||
| Acquired intangible assets |
5,308 | — | ||||||
| Other, including AMT credits, accrued liabilities, stock based compensation, etc. |
2,013 | 2,033 | ||||||
| Sub-total |
29,275 | 21,123 | ||||||
| Valuation allowance |
(27,781 | ) | (20,528 | ) | ||||
| Deferred income tax assets |
1,494 | 595 | ||||||
| Deferred income tax liabilities: |
||||||||
| Acquired intangible assets |
— | (212 | ) | |||||
| Other, including AMT credits, accrued liabilities, stock based compensation, etc. |
(37 | ) | (198 | ) | ||||
| Deferred income tax liabilities |
(37 | ) | (410 | ) | ||||
| Net deferred income tax assets |
$ | 1,457 | $ | 185 | ||||
Deferred income tax assets and liabilities were netted by income tax jurisdiction and were reported in the consolidated balance sheets as of December 31 as follows:
| Income Tax Category |
Reported In |
2009 | 2008 | ||||||
| Current deferred income tax assets |
Prepaid expenses and other | $ | 983 | $ | 787 | ||||
| Non-current deferred income tax assets |
Other assets | 474 | 203 | ||||||
| Non-current deferred income tax liabilities |
Other liabilities | — | (805 | ) | |||||
| Net deferred income tax assets |
$ | 1,457 | $ | 185 | |||||
The Company has not provided for U.S. deferred income taxes or foreign withholding taxes on the undistributed earnings of its non-U.S. subsidiaries since these earnings are intended to be reinvested indefinitely and therefore, the foreign currency translation adjustment included in other comprehensive income has not been tax effected. It is not practical to estimate the amount of additional taxes that might be payable on such undistributed earnings.
The Company has a valuation allowance on all its deferred income tax assets in every tax jurisdiction with the exception of Australia and Germany. The valuation allowance increased by $7,253, $3,483, and $406 during 2009, 2008 and 2007, respectively. Subsequently recognized tax benefits related to the reversal of the valuation allowance for deferred tax assets as of December 31, 2009 will be recorded as an income tax benefit reported in the Consolidated Statements of Operations. The realization of deferred income tax assets depends upon the existence of sufficient taxable income within the carryback or carryforward periods under the tax laws of each tax jurisdiction. The Company has considered the following possible sources of taxable income when assuming the realization of the deferred income tax assets: future taxable income exclusive of reversing temporary differences and carryforwards; future reversals of existing taxable temporary differences; taxable income in prior carryback years; and tax planning strategies. In 2009, the Company recorded a credit of $304 related to a reversal of a deferred income tax liability established for the U.S. goodwill amortization, reversed coincident with the retail goodwill impairment. In 2008, the Company determined that it was more likely than not that it would be able to realize the future tax benefits of the deferred income tax assets of the Company’s Australian subsidiary and, accordingly, the Company reversed its valuation allowance of $1,305, which was recorded as a benefit to income taxes.
As of December 31, 2009, the Company had net operating loss carryforwards for U.S. federal income tax reporting purposes totaling $38,245 that will begin to expire in 2018 if not utilized. The Company has state net operating loss carryforwards of $28,982 which expire depending on the rules of the various states to which the net operating loss is allocated. The Company has non–U.S. net operating loss carryforwards of $10,383 which expire depending on the rules of the various countries in which the net operating losses were generated beginning in 2010. Approximately $6,303 of net operating loss carryforwards as of December 31, 2009 were attributable to deductions associated with the exercise of Company stock options, the benefit of which will be credited to additional paid-in capital when realized.
F-22
OTIX GLOBAL, INC.
NOTES TO CONSOLIDATED FINANCIAL STATEMENTS—(Continued)
(in thousands, except per share data)
The Company has federal research and development tax credit carry-forwards of $2,435 that begin to expire in 2018 and state research and development tax credit carryforwards of $974 that begin to expire in 2015. The Company also has alternative minimum tax credit carry-forwards of $110 that have no expiration date.
The Company adopted ASC 740 on January 1, 2007. This interpretation clarifies the accounting for uncertain tax positions and requires companies to recognize the impact of a tax position in their financial statements, if that position is more likely than not of being sustained on audit, based on the technical merits of the position. The adoption did not have an impact on the total liabilities or shareholders’ equity of the Company.
Although the Company believes its estimates are reasonable, it can make no assurance that the final tax outcome of these matters will not be different from that which it has reflected in its historical income tax provisions and accruals. Such difference could have a material impact on its income tax provision and operating results in the period in which it makes such determination.
A reconciliation of the beginning and ending amount of liabilities associated with uncertain tax positions is as follows:
| 2009 | 2008 | 2007 | ||||||||||
| Unrecognized tax benefits, opening balance |
$ | 174 | $ | 291 | $ | 369 | ||||||
| Gross increases in tax positions taken in a prior period |
21 | 18 | 20 | |||||||||
| Gross decreases in tax positions taken in a prior period |
— | (79 | ) | (104 | ) | |||||||
| Gross increases in tax positions taken in a current period |
87 | 37 | 37 | |||||||||
| Lapse of applicable statute of limitations |
(44 | ) | (93 | ) | (31 | ) | ||||||
| Unrecognized tax benefits, ending balance |
$ | 238 | $ | 174 | $ | 291 | ||||||
As of December 31, 2009, the Company has unrecognized tax benefits of $279 which includes interest expense, net of taxes, and penalties, of which $249 is recorded as a liability, which if recognized, would reduce the Company’s effective tax rate. The remaining $30 is netted against the Company’s deferred tax assets related to net operating losses. The Company estimates that approximately one fourth of the unrecognized tax benefits will lapse and result in a benefit within the next twelve months.
In accordance with ASC 740, the Company has elected to classify interest and penalties as a component of tax expense. Accrued interest and penalties at December 31, 2009 and 2008 were approximately $41 and $34, respectively.
The Company’s U.S. federal income tax returns for 2006 through 2009 are subject to examination. The Company also files in various state and foreign jurisdictions. With few exceptions, the Company is no longer subject to state or non-U.S. income tax examinations by tax authorities for years prior to 2006.
The Company’s subsidiary in Germany recently completed an audit of its 2004 through 2007 tax years. The audit resulted in additional taxes due of approximately $566. The accrued liability is recorded in accounts payable on the Consolidated Balance Sheets at December 31, 2009. The audit identified issues with certain training costs and non-deductible expenses for all years under audit and a transfer pricing issue for 2005.
NOTE 14. STOCK–BASED COMPENSATION
Stock-Based Compensation. The following table presents where share-based compensation expense is recorded in the Consolidated Statements of Operations for the three years ended December 31, 2009, 2008, and 2007:
| 2009 | 2008 | 2007 | |||||||
| Cost of sales |
$ | 220 | $ | 175 | $ | 106 | |||
| Operating expenses |
965 | 1,395 | 1,093 | ||||||
| Restructuring charge |
— | 38 | — | ||||||
| Research and development |
235 | 297 | 237 | ||||||
| Total |
$ | 1,420 | $ | 1,905 | $ | 1,436 | |||
As of December 31, 2009, the Company’s 2000 Stock Plan provides for the issuance of a maximum of 11,365 shares of common stock and contains an evergreen provision that allows the Board of Directors to annually increase the number of shares available by the lesser of (i) 5% of the total outstanding shares, (ii) 789 shares, or (iii) a lesser amount as determined by the Board. As of December 31, 2009, there were 3,018 shares available for grant under the plan. The plan allows for the grant of incentive or unqualified stock options, stock purchase rights and restricted stock and is administered by the Board who determines the type, quantity, terms and conditions of any award, including any vesting conditions. Restricted stock and stock options generally vest ratably over a four year service period, and stock options expire ten years from the date of grant. The exercise price of stock options granted is equivalent to the fair market value of the stock at the date of grant. New shares are issued upon exercise of stock options or upon vesting of restricted stock awards.
F-23
OTIX GLOBAL, INC.
NOTES TO CONSOLIDATED FINANCIAL STATEMENTS—(Continued)
(in thousands, except per share data)
Stock Options. Stock options have a maximum term of ten years and generally vest over a four-year period from the grant date. Under ASC 718, “Compensation- Stock Compensation”, the fair value of each stock option grant is estimated on the grant. Expected option lives and volatilities used in fair value calculations are based on historical Company data.
Valuation and Amortization Method. The Company uses the Black-Scholes option-pricing-model to estimate the fair value of each option grant on the date of grant or modification. The fair value is amortized on a straight-line method for recognizing stock compensation expense over the vesting period of the option, net of impact of estimated forfeitures.
Expected Term. The expected term is the period of time that granted options are expected to be outstanding. The Company estimates the expected term based on historical patterns of option exercises, which it believes reflect estimated future exercise behavior.
Expected Volatility. The volatility is calculated by using the historical stock prices going back over the expected term of the option.
Risk-Free Interest Rate. The Company bases the risk-free interest on the market yield in effect at the time of option grant obtained from the U.S. Department of the Treasury’s market yield index.
Dividend Yield. Dividend yield was zero as the Company does not pay dividends.
The following table presents the assumptions utilized in the Black-Scholes option pricing model to determine the fair value of options granted during the periods ended December 31, 2009, 2008 and 2007:
| 2009 | 2008 | 2007 | |||||||
| Risk free rate of return |
2.39 | % | 3.67 | % | 3.70 | % | |||
| Expected dividend yield |
0.00 | % | 0.00 | % | 0.00 | % | |||
| Volatility |
63 | % | 58 | % | 60 | % | |||
| Expected life |
5 years | 5 years | 4 years |
A summary of stock option activity for the years ended December 31, 2009, 2008 and 2007 was as follows:
| 2009 | 2008 | 2007 | ||||||||||||||||
| Shares | Weighted average exercise price |
Shares | Weighted average exercise price |
Shares | Weighted average exercise price | |||||||||||||
| Options outstanding, beginning of year: |
3,344 | $ | 5.02 | 2,766 | $ | 5.38 | 3,231 | $ | 4.71 | |||||||||
| Plus: Granted |
312 | 0.91 | 780 | 3.91 | 513 | 7.22 | ||||||||||||
| Less: Exercised |
— | — | (8 | ) | 1.35 | (920 | ) | 3.92 | ||||||||||
| Canceled or expired |
(638 | ) | 4.76 | (194 | ) | 5.76 | (58 | ) | 7.47 | |||||||||
| Options outstanding, end of year |
3,018 | $ | 4.65 | 3,344 | $ | 5.02 | 2,766 | $ | 5.38 | |||||||||
| Options vested and expected to vest |
2,969 | $ | 4.69 | 3,247 | $ | 5.03 | 2,701 | $ | 5.36 | |||||||||
| Options exercisable, end of year |
2,301 | $ | 5.09 | 2,352 | $ | 5.16 | 2,094 | $ | 5.07 | |||||||||
The options outstanding of 3,018 at December 31, 2009 had a weighted average remaining contractual term of 5.00 years and no aggregate intrinsic value due to the low market price at December 31, 2009. The options exercisable of 2,301 at December 31, 2009 had a weighted average remaining contractual term of 4.14 and no aggregate intrinsic value due to the low market price at December 31, 2009. The aggregate intrinsic value of options exercised during the years ended December 31, 2009, 2008 and 2007 were $0, $20, and $3,351, respectively. The weighted average grant date-fair value of options granted per share in 2009, 2008 and 2007 were $0.50, $2.09, and $3.56 per share, respectively. The aggregate intrinsic value of options vested and expected to vest for the years ended December 31, 2009, 2008, and 2007 were $0, $0, and $6,984, respectively. The weighted average remaining contractual term for options vested and expected to vest for the years ended December 31, 2009, 2008 and 2007 were 4.95 years, 5.13 years, and 5.23 years, respectively.
F-24
OTIX GLOBAL, INC.
NOTES TO CONSOLIDATED FINANCIAL STATEMENTS—(Continued)
(in thousands, except per share data)
Stock options outstanding and exercisable as of December 31, 2009 were as follows:
| Options Outstanding | Options Exercisable | |||||||||||
| Range of exercise prices |
Shares | Weighted average exercise price |
Weighted average remaining life (years) |
Shares | Weighted average exercise price | |||||||
| $0.84 — $1.33 |
333 | $ | 0.97 | 9.32 | 21 | $ | 1.20 | |||||
| 2.50 — 3.00 |
221 | 2.90 | 5.83 | 147 | 2.87 | |||||||
| 3.36 — 3.36 |
500 | 3.36 | 5.84 | 500 | 3.36 | |||||||
| 3.49 — 4.20 |
543 | 4.00 | 2.69 | 543 | 4.00 | |||||||
| 4.36 — 4.55 |
51 | 4.51 | 2.90 | 51 | 4.51 | |||||||
| 4.61 — 4.61 |
400 | 4.61 | 5.50 | 183 | 4.61 | |||||||
| 4.75 — 6.29 |
368 | 5.91 | 2.99 | 363 | 5.93 | |||||||
| 6.48 — 6.48 |
4 | 6.48 | 0.80 | 4 | 6.48 | |||||||
| 7.15 — 7.15 |
360 | 7.15 | 7.11 | 255 | 7.15 | |||||||
| 7.44 — 18.00 |
238 | 9.96 | 1.34 | 234 | 9.97 | |||||||
| Total |
3,018 | $ | 4.65 | 5.00 | 2,301 | $ | 5.09 | |||||
Share-based compensation expense pertaining to stock options of $735, $1,000, and $695 for the years ended December 31, 2009, 2008, and 2007, respectively, was recorded in cost of sales, selling, general and administrative expense and research and development expense. An annual forfeiture rate of 5.1%, as determined using historical data, was utilized in calculating stock option expense for the year ended December 31, 2009 and 4.3% for the years ended December 31, 2008 and 2007, respectively. As of December 31, 2009, there was $886 of unrecognized share-based compensation expense related to options that will be recognized over a weighted-average period of 2.58 years.
Restricted Stock. Restricted stock is issued on the date of grant. A summary of restricted stock activity for the years ended December 31, 2009, 2008, and 2007 was as follows:
| 2009 | 2008 | 2007 | ||||||||||||||||
| Shares | Weighted average grant date fair value |
Shares | Weighted average grant date fair value |
Shares | Weighted average grant date fair value | |||||||||||||
| Unvested, beginning of year: |
868 | $ | 2.83 | 390 | $ | 5.71 | 453 | $ | 4.61 | |||||||||
| Plus: Awards granted |
644 | 0.82 | 674 | 1.97 | 103 | 9.29 | ||||||||||||
| Less: Awards vested |
(325 | ) | 3.33 | (139 | ) | 5.70 | (137 | ) | 4.63 | |||||||||
| Awards canceled |
(38 | ) | 5.83 | (57 | ) | 5.34 | (29 | ) | 6.35 | |||||||||
| Unvested, end of year |
1,149 | $ | 1.44 | 868 | $ | 2.83 | 390 | $ | 5.71 | |||||||||
Share-based compensation expense pertaining to restricted stock of $685, $867, and $741 for the years ended December 31, 2009, 2008, and 2007, respectively, was recorded in cost of sales, selling, general and administrative expense and research and development expense. The fair market value of restricted stock on the date of grant is amortized to expense evenly over the restriction period. An annual forfeiture rate of 5.1%, as determined using historical data, was utilized in calculating restricted stock expense for the year ended December 31, 2009 and 4.3% for the years ended December 31, 2008 and 2007, respectively. As of December 31, 2009, there was $1,119 of unrecognized stock-based compensation expense related to unvested restricted stock that will be recognized over a weighted average period of 3.15 years. The vest date fair value of the 325, 139, and 137 restricted shares that vested during the years ended December 31, 2009, 2008, and 2007 was $266, $660, and $1,088, respectively.
In addition, share-based compensation expense pertaining to stock options and restricted stock awards of $38 was recognized in connection with the Company’s restructuring program which was recorded as a component of Restructuring charges in 2008.
F-25
OTIX GLOBAL, INC.
NOTES TO CONSOLIDATED FINANCIAL STATEMENTS—(Continued)
(in thousands, except per share data)
NOTE 15. EMPLOYEE BENEFIT PLANS
The Company has an employee savings and retirement plan that is a salary deferral plan under Section 401(k) of the Internal Revenue Code. The plan allows for matching contributions at the discretion of the Company. The Company matches 50% of each employee’s first 4% of salary deferral. The Company expensed $0, $247, and $272 in matching contributions in 2009, 2008 and 2007, respectively. Effective January 5, 2009, the Company temporarily discontinued this matching benefit.
NOTE 16. SEGMENT INFORMATION
As of December 31, 2009, the Company has three operating segments for which separate financial information is available and evaluated regularly by management in deciding how to allocate resources and assess performance. The Company evaluates performance principally based on net sales and operating income.
The Company’s three operating segments include North America, Europe and Rest-of-World. Two Europe divisions were classified as discontinued operations in 2008. Inter-segment sales are eliminated in consolidation. Manufacturing profit and distributors’ sales are recorded in the geographic location where the sale occurred. This information is used by the chief operating decision maker to assess the segments’ performance and in allocating the Company’s resources. The Company does not allocate research and development expenses to its operating segments.
| North America | Europe | Rest-of-World | Unallocated | Total | |||||||||||||||
| 2009 |
|||||||||||||||||||
| Net sales to external customers |
$ | 33,687 | $ | 34,343 | $ | 27,784 | $ | — | $ | 95,814 | |||||||||
| Operating income (loss) |
(28,552 | ) | (7,380 | ) | 3,689 | (6,487 | ) | (38,730 | ) | ||||||||||
| Income (loss) from continuing operations |
(28,125 | ) | (8,087 | ) | 3,398 | (6,487 | ) | (39,301 | ) | ||||||||||
| Identifiable segment assets |
30,237 | 16,431 | 20,457 | — | 67,125 | ||||||||||||||
| Goodwill and indefinite-lived intangible assets |
1,401 | 6,371 | 9,368 | — | 17,140 | ||||||||||||||
| Long-lived assets |
5,477 | 430 | 2,848 | — | 8,755 | ||||||||||||||
| 2008 |
|||||||||||||||||||
| Net sales to external customers |
$ | 45,392 | $ | 51,077 | $ | 28,409 | $ | — | $ | 124,878 | |||||||||
| Operating income (loss) |
(11,675 | ) | 12,283 | 3,588 | (8,266 | ) | (4,070 | ) | |||||||||||
| Income (loss) from continuing operations |
(11,423 | ) | 11,459 | 4,510 | (8,266 | ) | (3,720 | ) | |||||||||||
| Identifiable segment assets |
55,158 | 36,081 | 15,707 | — | 106,946 | ||||||||||||||
| Goodwill and indefinite-lived intangible assets |
13,922 | 21,642 | 7,242 | — | 42,806 | ||||||||||||||
| Long-lived assets |
3,704 | 528 | 2,637 | — | 6,869 | ||||||||||||||
| 2007 |
|||||||||||||||||||
| Net sales to external customers |
$ | 46,731 | $ | 47,092 | $ | 25,239 | $ | — | $ | 119,062 | |||||||||
| Operating income (loss) |
(3,471 | ) | 11,385 | 2,540 | (8,547 | ) | 1,907 | ||||||||||||
| Income (loss) from continuing operations |
(2,536 | ) | 10,520 | 2,373 | (8,547 | ) | 1,810 | ||||||||||||
| Identifiable segment assets |
60,151 | 45,295 | 18,255 | — | 123,701 | ||||||||||||||
| Goodwill and indefinite-lived intangible assets |
11,186 | 24,763 | 9,188 | — | 45,137 | ||||||||||||||
| Long-lived assets |
3,641 | 1,176 | 3,450 | — | 8,267 | ||||||||||||||
U.S. wholesale represented 55%, 58%, and 73% of revenues and 92%, 82% and 86% of long-lived assets of the Company’s North America segment for and as of the years ended December 31, 2009, 2008 and 2007, respectively. U.S. retail represented 35%, 33%, and 15% of revenues and 7%, 15%, and 8% of long-lived assets of the Company’s North America segment for and as of the years ended December 31, 2009, 2008 and 2007, respectively. Germany represented 72%, 78%, and 72% of revenues and 93%, 92%, and 46% of long-lived assets of the Company’s Europe segment for and as of the years ended December 31, 2009, 2008 and 2007, respectively. Australia represented 100% of both revenues and long-lived assets for the Company’s Rest-of-World segment for and as of the years ended December 31, 2009, 2008 and 2007, respectively. Long-lived assets consist of property and equipment. The majority of the Company’s assets as of December 31, 2009, 2008 and 2007 were attributable to its U.S. operations.
F-26
OTIX GLOBAL, INC.
NOTES TO CONSOLIDATED FINANCIAL STATEMENTS—(Continued)
(in thousands, except per share data)
NOTE 17. SUBSEQUENT EVENTS (UNAUDITED)
On March 12, 2010, the Company filed with Nasdaq and the SEC to implement a reverse stock split that was approved by both the shareholders and the Board of Directors. The shareholders had approved the reverse stock split on May 7, 2009. The reverse stock split is at a 1-for-5 ratio, and is expected to become effective on or about March 29, 2010. As a result of the reverse stock split, every 5 shares of the Company’s common stock that are issued as of March 29, 2010 will be automatically combined into one issued and outstanding share, with a change in the par value of such shares from $0.001 to $0.005 per share, subject to the elimination of fractional shares. The number of common stock shares issued and outstanding at December 31, 2009 would change from 28,810 to approximately 5,762.
The stock split will require retroactive restatement of all historical per share data in the first quarter ending March 31, 2010. All references to the number of shares outstanding in the Company’s 2009 consolidated financial statements are presented on a pre-split basis. The Company’s historical earnings per share on a pro-forma basis, assuming the stock split had occurred as of January 1, 2007, would be as follows:
| Pro-forma Post Split | ||||||||||||
| 2009 | 2008 | 2007 | ||||||||||
| Basic income (loss) per common share: |
||||||||||||
| Continuing operations |
$ | (7.10 | ) | $ | (0.68 | ) | $ | 0.34 | ||||
| Discontinued operations |
(0.01 | ) | (0.72 | ) | (0.20 | ) | ||||||
| Net income (loss) |
$ | (7.11 | ) | $ | (1.40 | ) | $ | 0.14 | ||||
| Diluted income (loss) per common share: |
||||||||||||
| Continuing operations |
$ | (7.10 | ) | $ | (0.68 | ) | $ | 0.33 | ||||
| Discontinued operations |
(0.01 | ) | (0.72 | ) | (0.20 | ) | ||||||
| Net income (loss) |
$ | (7.11 | ) | $ | (1.40 | ) | $ | 0.13 | ||||
| Weighted average number of common shares outstanding: |
||||||||||||
| Basic |
5,536 | 5,461 | 5,304 | |||||||||
| Diluted |
5,536 | 5,461 | 5,514 | |||||||||
F-27