Attached files
UNITED STATES
SECURITIES AND EXCHANGE COMMISSION
Washington, D.C. 20549
FORM 10-K
| x | Annual Report Pursuant to Section 13 or 15 (d) of the Securities Exchange Act of 1934 |
For the fiscal year ended December 31, 2009
or
| ¨ | Transition Report Pursuant to Section 13 or 15(d) of the Securities Exchange Act of 1934 |
For the transition period from to .
Commission File No. 1-11181
IRIS INTERNATIONAL, INC.
(Exact name of Registrant as Specified In Its Charter)
| Delaware | 94-2579751 | |
| (State or other jurisdiction of Incorporation or Organization) |
(I.R.S. Employer Identification No.) |
9172 Eton Avenue, Chatsworth, California 91311
(Address of principal executive offices) (Zip Code)
(818) 709-1244
(Registrant’s telephone number, including area code)
Securities registered pursuant to Section 12(b) of the Act:
| Title of each class |
Name of each exchange on which registered | |
| Common Stock, par value $0.01 per share | NASDAQ Global Market |
Securities registered pursuant to Section 12(g) of the Act:
None
Indicate by check mark if the registrant is a well-known seasoned issuer, as defined in Rule 405 of the Securities Act. Yes ¨ No x
Indicate by check mark if the registrant is not required to file reports pursuant to Section 13 or Section 15(d) of the Exchange Act. Yes ¨ No x
Indicate by check mark whether the registrant (1) has filed all reports required to be filed by Section 13 or 15(d) of the Securities Exchange Act of 1934 during the preceding 12 months (or for such shorter period that the registrant was required to file such reports), and (2) has been subject to such filing requirements for the past 90 days. Yes x No ¨
Indicate by check mark whether the registrant has submitted electronically and posted on its corporate Web site, if any, every Interactive Data File required to be submitted and posted pursuant to Rule 405 of Regulation S-T during the preceding 12 months (or for such shorter period that the registrant was required to submit and post such files). Yes ¨ No ¨
Indicate by check mark if disclosure of delinquent filers pursuant to Item 405 of Regulation S-K is not contained herein, and will not be contained, to the best of registrant’s knowledge, in definitive proxy or information statements incorporated by reference in Part III of this Form 10-K or any amendment to this Form 10-K. ¨
Indicate by check mark whether the registrant is a large accelerated filer, an accelerated filer a non-accelerated filer or a smaller reporting company. See definitions of “larger accelerated filer,” “accelerated filer” and “smaller reporting company” in Rule 12b-2 of the Exchange Act. (Check one):
Large accelerated filer ¨ Accelerated filer x Non accelerated filer ¨ Smaller reporting company ¨
(Do not check if smaller reporting company)
Indicate by check mark whether the registrant is a shell company (as defined in Rule 12b-2 of the Exchange Act. Yes ¨ No x
The aggregate market value of the shares of common stock held by non-affiliates of the Registrant on June 30, 2009 was approximately $212 million based upon the closing price of $11.80 per share of its common stock as reported on the NASDAQ Global Market on such date.
The registrant had 18,184,985 shares of common stock outstanding on March 5, 2010.
DOCUMENTS INCORPORATED BY REFERENCE
Portions of the registrant’s definitive Proxy Statement for the 2010 Annual Meeting of Stockholders to be filed with the Securities and Exchange Commission, or SEC, pursuant to Regulation 14A not later than 120 days after the end of the fiscal year covered on this Form 10-K are incorporated by reference into Part III, Items 10-14 of this Form 10-K.
IRIS INTERNATIONAL, INC.
ANNUAL REPORT ON FORM 10-K
Fiscal Year Ended December 31, 2009
i
PART I
Forward-Looking Statements
This report includes “forward-looking statements” within the meaning of Section 27A of the Securities Act of 1933, as amended, and Section 21E of the Securities and Exchange Act of 1934, as amended. All statements other than statements of historical facts are “forward-looking statements” for purposes of these provisions, including any projections of earnings, revenues or other financial items, any statement of the plans and objectives of management for future operations, any statements concerning proposed new products or strategic arrangements, any statements regarding future economic conditions or performance, and any statement of assumptions underlying any of the foregoing. In some cases, forward-looking statements can be identified by the use of terminology such as “may,” “will,” “expects,” “plans,” “anticipates,” “estimates,” “potential,” “intends”, or “continue” or the negative thereof or other comparable terminology. Although we believe that the expectations reflected in the forward-looking statements contained herein are reasonable, there can be no assurance that such expectations or any of the forward-looking statements will prove to be correct, and actual results could differ materially from those projected or assumed in the forward-looking statements. Our future financial condition and results of operations, as well as any forward-looking statements, are subject to inherent risks and uncertainties, including but not limited to the Risk Factors set forth under Item 1A, and for the reasons described elsewhere in this report. All forward-looking statements and reasons why results may differ included in this report are made as of the date hereof, and we assume no obligation to update these forward-looking statements or reasons why actual results might differ.
Company Overview
We are a leading global in vitro diagnostics company focused on products that analyze particles and living cell forms and structures, or morphology of a variety of body fluids. Our products leverage our strengths in flow imaging technology, particle recognition and automation to bring efficiency to the hospital and commercial laboratories, where a shortage of qualified laboratory technicians and labor-intensive processes result in significant cost and workflow challenges for our customers. The initial applications for our technology have been in the urinalysis market and we are the leading worldwide provider of automated urine microscopy systems, with approximately 2,600 systems sold in over 50 countries. In this market, we also provide integrated solutions comprising urine microscopy and urine chemistry products as well as consumable supplies, system support services and sample preparation products. We intend to expand into related market segments that can clearly benefit from automated morphology solutions, including developing the analysis of other body fluids such as blood (hematology applications). In addition, we have an active research and development platform in molecular diagnostics based on our Nucleic Acid Detection Immunoassay, or NADiA®, platform, which we are developing for various applications in personalized diagnostics for oncology and infectious disease.
Historically, we have predominantly focused on developing, manufacturing and commercializing in vitro diagnostics, or IVD, instruments and consumables for urinalysis, including our flagship iQ® analyzers, a family of fully-automated, image-based bench-top analyzers for urine microscopy. Urine microscopy is the visualization and identification of cells and other sediments in urine. The iQ analyzer uses proprietary flow microscope and image-analysis software that captures the morphology of cells and sediments in urine and serous fluids, and assists in their identification and classification. Our systems are designed to provide users with faster, more complete and more consistent results, while substantially reducing hands-on time spent by laboratory technicians and turnaround time, as compared to traditional manual methods.
The iQ analyzer can be seamlessly integrated with an automated urine chemistry analyzer to simultaneously perform urine microscopy and chemistry testing in a fully automated manner. In the United States, we have sold our family of iQ analyzers integrated with an automated chemistry analyzer, the AUTION MAX AX-4280, which we have sourced from a Japanese manufacturer since August 2003. In September 2008, we released our
1
proprietary iChem®VELOCITY™ automated urine chemistry analyzer and a fully integrated urine microscopy and urine chemistry work-cell, called the iRICELL in some international markets. Product registrations for iChem®VELOCITY™ and iRICELL are pending in some international countries including China, Japan and Mexico. In the United States, we expect to file a pre-market notification under Section 510(k) of the Food, Drug, and Cosmetics Act for the iChem VELOCITY in the second quarter of 2010. We have the ability integrate our iQ analyzer with the AUTION MAX AX-4280 through December 31, 2010. However, upon FDA clearance of our iChem VELOCITY, we plan to launch the iRICELL in the United States and to expand its distribution to other international markets requiring FDA 510(k) clearance in the second half of 2010.
We intend to solidify our leadership position in the urinalysis market, as well as enter into several adjacent markets with our product pipeline under development. To maintain our market position in urinalysis, we continue to implement improvements to our existing product lines, including enhancing our data analysis and productivity tools. In addition, we are developing an automated system to screen urine for urinary tract infection, or UTI. We believe this automated system will significantly reduce the number of urine cultures currently performed and will allow for faster results with less labor, potentially allowing physicians to reduce the frequency with which they preventively prescribe antibiotics for suspected urinary tract infections. We are also developing our 3GEMS (Third Generation Morphology) platform, which will serve as our next generation urinalysis platform and as the platform for our pipeline of hematology products. These 3GEMS hematology products, currently in feasibility testing, use image-based technology to automate the identification and characterization of blood cells, in particular, abnormal white blood cells. We believe an automated hematology analyzer using our proprietary imaging technology and software recognition capabilities will provide improvements in the identification of abnormal blood cells, including an automated, image-based nine-part white blood cell differential analysis. Like our urine microscopy products, these new hematology products by virtue of IRIS’ inherent capabilities to capture and analyze images are expected to significantly reduce the need for manual slide preparation and reviews, increasing the efficiency of what is currently a highly labor-intensive process.
The addition of molecular diagnostic products to our commercial IVD portfolio will be a key component of our future growth. In 2006, after the acquisition of Leucadia Technologies, Inc., a molecular diagnostics company, we organized a subsidiary known as Iris Molecular Diagnostics, to develop and commercialize our NADiA platform. NADiA has the ability to measure proteins below the detection thresholds of current immunoassay and molecular diagnostic methods. We believe our diagnostic products will address the need for increased sensitivity in the monitoring of disease enabling personalized treatment of cancer and infectious disease. Our first product under development, NADiA® ProsVue™, is an ultra-sensitive, blood-based test for the monitoring of residual amounts of prostate specific antigen, or PSA, in prostate cancer patients following radical prostatectomy. Upon completion of the clinical studies for NADiA® ProsVue™, we will file a 510(k) submission with the FDA expected in first half of 2010. In addition, we are designing an ultra-sensitive blood test for HIV viral load measurement and a blood-based test for identification of Her-2/neu, an important biological marker in determining the aggressiveness of breast cancer tumors.
We are exploring a number of strategies to rapidly commercialize our NADiA assays, including partnerships with clinical reference labs or other IVD companies, a direct sales outlet, or a combination of these alternatives. Our commercialization strategy must achieve the desired balance between the rate of test adoption, the demonstration of clinical value, and the attainment of high value reimbursement.
Market Overview and Opportunity
The global market for IVD in 2007 is estimated at approximately $38 billion and is expected to grow 7% annually. IVD manufacturers provide products and services to the clinical laboratory industry, which is confronted with significant challenges in the current market. Healthcare providers are demanding improved turnaround time for laboratories diagnostic tests, greater sensitivity and lower costs. To improve accuracy, productivity and efficiency, many laboratories are turning to automated methods to perform these tests. Moreover, automated testing better positions laboratories to cope with the declining number of certified medical technicians available to perform tests.
2
Currently, we participate primarily in what Boston Biomedical Consultants, Inc., or BBC, estimates as of 2007 to be the $569 million urinalysis segment of the IVD market.
Personalized medicine is expected to be one of the fastest growing markets over the next decade. The US News and World Report (July 6, 2009) estimates the market for personal health and wellness to grow to $452 billion by 2015 with most of this growth coming from advances in personalized cancer diagnostics. We believe the development of monitoring assays based on our NADiA platform should contribute to advancing personalized diagnostics for treatments of several types of cancers including prostate, breast, colon and lung.
Through the development and commercialization of new products, we expect to enter the urine culture, hematology and molecular diagnostics markets which, we believe, will expand our total addressable market to over $4 billion.
Urinalysis
Urinalysis is performed as part of most routine medical examinations and is necessary for the diagnosis and monitoring of conditions such as urinary tract infection, and kidney and bladder disease. Traditionally, urinalysis comprises urine chemistry and urine microscopy tests, while urine cultures are considered part of microbiology. We believe that the advancement of automated technologies will blur this distinction, with urine cultures being performed increasingly in the same laboratories as urine chemistry and urine microscopy tests and eventually becoming part of the urinalysis market.
Urine Chemistry and Microscopy Market Overview
Urine chemistry consists of a panel of tests that identifies various chemical analytes in urine, while urine microscopy analyzes the microscopic solid particles and cells suspended in urine. Urine chemistry comprises the majority of the urinalysis market and is broadly used with limited differentiation between products. Traditional urine microscopy is used less routinely because as a manual process it is time consuming and requires a trained medical technician to characterize particles and cells based on their morphology. In order to reduce costs, many laboratories perform manual urine microscopy only in response to results from an initial urine chemistry test despite evidence that urine microscopy can provide a more reliable clinical diagnosis. The commercial success of our iQ analyzer is attributable to its capability to image and automatically identify particles and cells suspended in urine in a time-efficient manner eliminating manual microscopic examination.
BBC estimates the urinalysis segment of the IVD market at $569 million in 2007. Urine chemistry representing approximately $449 million and automated urine microscopy representing approximately $120 million, but growing at a much faster rate than the other urinalysis sub-segments. We estimate that there is a global opportunity for 10,500 urine microscopy analyzers, with 6,600 at sites performing greater than 40 tests per day and 3,900 at sites performing less than 40 tests per day. These 6,600 sites represent a significant opportunity for us, because they will benefit from the automation and consolidation of their urine chemistry and microscopy processes. We believe the full automation and integration of results brought by the iQ product platform has accelerated the adoption of automated urine microscopy as a routine test. Of the 6,600 sites, we believe approximately half of the domestic sites continue to perform manual microscopy procedures. The penetration of automated urine microscopy analyzers varies significantly from country to country.
Limitations in Urine Chemistry and Microscopy
Current manual testing of urine and body fluids requires the clinical laboratory to split samples, perform automated and manual procedures and consolidate the separate results into one report. Moreover, the manual procedure for microscopy requires a qualified medical technician to accurately categorize particles and cells observed under the microscope. Therefore, these tests represent both time and cost intensive procedures for the clinical laboratory. Further, the inherent variability in sample preparation limits the quantitative and qualitative
3
accuracy of the diagnostic result. The manual nature of performing urine microscopy and the lack of qualified personnel represents a significant opportunity. However, the challenge remains to compete for capital for urinalysis automation versus other disciplines of the laboratory.
Laboratories typically perform microscopy and chemistry tests separately and generally perform microscopy only in the case of an abnormal chemistry result because urine microscopy is a very tedious process. If both tests are performed, the separate results must then be manually consolidated into one report or file. Without the automatic integration of both the microscopy and chemistry results, valuable clinical information may be overlooked. By reducing the amount of manual labor spent conducting these tests and by automatically integrating the chemistry and microscopy results, we believe we can improve the consistency, reliability and value of the combined results and improve specimen turnaround time.
Urine Culture Market Overview
Urinary tract infection, or UTI, is a common infection that usually occurs when bacteria enters the opening of the urethra and multiplies in the urinary tract. Urine culture tests monitor the propagation of microorganisms such as bacteria and yeast, by spreading a small sample of urine on a growth medium, such as agar, and observing microorganism growth usually over a 16 to 72-hour period. We believe the current urine culture screening market represents an opportunity of approximately $300 million for a reliable automated “negative predictor” system that tests to confirm in minutes that levels of bacteria are below accepted clinical cutoffs.
Limitations in Urine Cultures
A urine culture is primarily ordered when symptoms indicate the possibility of UTI. The completion of a urine culture is both time and labor intensive, with results taking up to 72 hours to receive. Because of this delay, physicians often prescribe antibiotics before receiving the urine culture results. However, we believe that approximately 70% of urine cultures are bacteria negative, resulting in over-prescription of antibiotics and increasing the potential for creating resistant strains of bacteria. In addition, without timely results from a urine culture, patients may experience complications, prolonged infections, increased hospitalization and, potentially, death.
In October 2008, the Centers for Medicare & Medicaid Services, or CMS, announced that it will no longer reimburse hospitals for costs related to patients that suffer from a number of identified and preventable adverse events acquired during a hospital stay, one of which was urinary tract infections. This change from CMS is likely to cause hospitals to begin performing screening tests prior to patient admissions, as the turnaround time for urine cultures results are too lengthy.
We believe that there is a significant need for an automated system that will provide results in a timely manner, improve patient care and reduce the amount of manual labor needed to perform such tests.
Hematology
Hematology Market Overview
The enumeration of the various cellular components of blood is an essential part of routine medical examinations. A complete blood count, or CBC, is the most common type of blood test performed and measures the number of specific types of blood cells, including red blood cells (RBC), white blood cells (WBC), platelets, and other blood components, such as hemoglobin. In most instances, a white cell differential count, which measures the percentage of five types of white blood cells, is added to the CBC test. Variations from concentration, size, or maturity of the blood cells can be used to indicate an infection or illness. CBC tests and differential WBC counts are performed primarily in hospitals and clinical reference laboratories.
4
According to BBC, the hematology market in 2005 was approximately $1.8 billion and grew approximately 4% from the prior year driven primarily by system replacement sales and a small increase in test volume. Over the past 15 years, innovation within this market has been limited to automation of slide making and staining and algorithmic improvements to aid in the interpretation of results.
Limitations in Hematology
Traditional CBC test instruments use indirect means to measure the type and number of blood cells rather than direct observation of the blood cells. Despite the high number of these automated CBC analyzers in use, a significant percentage of the samples require a manual cell differential count of the blood specimen under a microscope. Frequently, a manual count is required due to the inability of automated CBC and differential analyzers to discriminate the complex morphology, especially the shape of abnormal cells, such as immature white blood cells or the presence of diseased cells, as in the case of sickle-cell anemia. The presence of immature white blood cells is often associated with conditions such as leukemia, infection, inflammation or tissue injury. However, a manual differential count of a blood specimen must be performed by a medical technologist trained in cytology or a pathologist under a microscope – a time consuming and subjective process, resulting in longer specimen turnaround times and higher cost.
According to a 2006 study conducted by the College of American Pathologists, of the 263 laboratories surveyed, an average of 29% of automated CBCs required a manual review, scan or differential and this percentage dramatically increased depending on the pathology of the patient population. Since the hematology market is dominated by a few large companies that typically compete on their ability to marginally reduce manual review rates, we believe there is significant opportunity to offer an automated image-based instrument that has the ability to identify immature white blood cells and other anomalies in a systematic fashion and to reduce significantly the number of manual reviews performed.
Molecular Diagnostics
Molecular Diagnostics Market Overview
Molecular diagnostic tests examine nucleic acids, including DNA and RNA, and protein biomarkers, to identify a disease, monitor its progression and response to treatment, or predict individual predisposition to a disease. These biomarkers can also provide information in drug discovery, preclinical drug development and patient monitoring during clinical trials. Currently, the clinical market for molecular diagnostics is primarily nucleic acid testing performed on polymer chain reaction, or PCR, instruments for amplification and detection of target diseases or infections. These tests are performed in commercial reference laboratories and large academic and research hospital laboratories due to the high complexity and cost of the tests. It is expected that as automated solutions become available, these tests may migrate to smaller laboratories and potentially even to point-of-care sites.
The analysis of DNA expression, or the production of specific proteins in cells, provides the ability to characterize diseases, such as cancer and infectious diseases. As a result, the detection and identification of proteins can provide a means to monitor disease progression and detect relapse. We believe that the ultra-sensitive detection of proteins would provide the capability to measure concentrations hundreds of times below the limits of detection of currently available immunoassays, precisely and reliably and at an earlier stage of disease, all of which may result in improved patient care.
We estimate the worldwide molecular diagnostics market in 2007 was approximately $3.7 billion and is expected to increase at a rate of 11% annually. We believe growth in the market is being driven primarily by an increase in the number of personalized diagnostics tests available to treat cancers and infectious diseases.
Limitations with Current Methods
Proteins are critical to understanding several diseases and current testing methods lack the degree of sensitivity necessary to detect minute amounts of protein and the precision to monitor disease progression.
5
Traditional methods to detect proteins, including enzyme-linked immunosorbent assay, or ELISA, chemiluminescence and fluorescence excitation, are unable to detect protein biomarkers in extremely low concentrations. These methods become effective only after a disease has progressed to a more advanced stage and the concentration of the protein biomarker has increased to reach the lower limit of detection of those conventional methods. We believe there is a significant market opportunity for an ultra-sensitive detection technology that measures concentration as low as one femtogram per milliliter (10-15 gram/milliliter) compared to today’s technologies that are limited to measuring concentrations of greater than 50,000 femtograms per milliliter.
Sample Processing
Sample Processing Market Overview
Nearly every sample presented to a clinical laboratory for testing requires some sort of sample processing before analysis. These samples include blood, urine and other body fluids, tissue, stool and other materials which may need to be separated into its different constituents. In the United States, there are over 180,000 testing sites where sample processing occurs, including hospital laboratories, independent laboratories, doctor’s offices, health maintenance organizations and community clinics.
Although testing is performed on many different types of samples, most tests are performed on blood specimens that require separation in a centrifuge. The centrifuge market comprises five segments including non-refrigerated bench-top, refrigerated bench-top, floor, high-speed and ultra-centrifuges. According to Strategic Directions International, the worldwide market for sample processing centrifuges in 2010 is estimated at $660 million, of which the market for non-refrigerated bench-top centrifuges, the market segment we serve, is estimated at approximately $100 million. To improve laboratory productivity and sample turnaround time, the current trend is toward smaller and faster bench-top models and away from large capacity floor models which have longer processing time per batch. This represents a significant opportunity for our Express line of bench-top centrifuges.
Limitations with Current Sample Processing Methods
The time it takes to process a sample is critical for clinical laboratories as the volume of samples to be tested increases. Each day, laboratory technicians are expected to handle thousands of samples with minimal error in a defined amount of time with limited laboratory space. In most laboratories, sample processing occurs in a central location where blood specimens are sorted and centrifuged in batches. The entire process can take up to an hour and requires dedicated resources to manage the sample flow. Once processed, the samples are often split and then sent to the various stations within the laboratory for analysis. The centralized processing of samples is thus quite inefficient as samples wait to enter the floor model centrifuge in large batches followed by long centrifugation times. In fact, many sample processing procedures create significant delays in specimen turnaround time.
6
Our Products
Our commercialized products and product pipeline comprise three main categories: morphology, molecular diagnostics and sample processing. Our morphology category includes all urinalysis and hematology products consisting of our commercialized urine chemistry and microscopy products, as well as our development-stage products such as our 3GEMS urinalysis and hematology analyzers. Our molecular diagnostics category consists of our development-stage products that utilize our NADiA technology for ultra-sensitive detection of proteins for monitoring cancer and infectious disease applications. Our sample processing category develops and markets small centrifuges and other processing equipment and accessories for rapid specimen processing. The table below is a summary of our major commercialized and in-development products:
| Major Products |
Status |
Description | ||
| Morphology and Related Products |
||||
| iQ analyzer | Marketed | Fully-automated urine microscopy and body fluids analyzer | ||
| iChem VELOCITY and iRICELL | Launched internationally: 3Q2008 U.S: Pending 510(k) re-submission | Fully-automated urine chemistry analyzer | ||
| 3GEMS Urinalysis & Body Fluids | In feasibility | Next generation urine microscopy and body fluids analyzer | ||
| 3GEMS Hematology | In feasibility | Complete blood count, white blood cell count with nine-part differentials and red blood cell and platelet morphology | ||
| Molecular Diagnostics | ||||
| NADiA ProsVue | 510(k) submission 1H2010 | Prognosticate stable patients after radical retro-pubic prostatectomy | ||
| NADiA HIV | In development | Monitoring HIV viral load during anti-retroviral therapy | ||
| NADiA Her-2/neu | In feasibility | Monitoring of Her-2/neu levels after breast mastectomy/lumpectomy | ||
| Sample Processing |
||||
| Express centrifuge line | Marketed | Centrifuges for clinical diagnostic market | ||
| ThermoBrite | Marketed | DNA workstation for FISH procedures | ||
| Cytofuge 2 | Marketed | Centrifuge used for thin layer cell preparation | ||
| Cytofuge 12 | Expected launch 1H2010 | 12 placement centrifuge used for thin layer cell preparation | ||
| IDEXX Drive |
Marketed | For internal use in IDEXX chemistry analyzers | ||
| IDEXX whole blood separator | Manufacturing rights licensed to IDEXX | Consumable used in IDEXX chemistry analyzers | ||
| OvaTube | Launched 4Q2009 | Ova and parasite testing for veterinarian market | ||
7
Morphology and Related Products
Cell morphology is the science of cell form and structure. Our morphology segment utilizes our proprietary imaging technology to identify cells and particles in a fully automated manner. In the urinalysis market, we offer urine microscopy analyzers and related urine chemistry instruments. We are also developing an improved automated bacteria screening solution for our iQ analyzer to enhance our urinalysis offerings. As part of our 3GEMS Third Generation Morphology program, we are developing a next-generation urine microscopy analyzer and an image-based hematology analyzer.
Automated Urine Microscopy Analyzers
Our flagship product is the family of iQ urine microscopy analyzers, which was first launched in 2003. As of December 31, 2009, we have sold approximately 2,600 iQ analyzers. Our iQ technology platform utilizes proprietary image flow cytometry and software to achieve significant reductions in cost and processing time as compared to manual urine microscopy. Our technology enables high speed digital processing to classify and display images of microscopic particles in an easy-to-view graphical user interface. We believe our iQ product line has numerous benefits over competing products, including increased accuracy, digital imaging of particles and fully automated analysis of urine and body fluids and lower manual review rates of abnormal samples.
The iQ microscopy product line comprises the iQ SELECT, a fully-automated instrument capable of analyzing 40 samples an hour and enabling partial automation at laboratory sites with lower test volumes; the iQ ELITE, a fully-automated instrument capable of analyzing 70 samples an hour that is appropriate for mid-sized hospital laboratories; and the iQ SPRINT, a fully-automated instrument capable of analyzing 101 samples an hour that is appropriate for large volume hospital and commercial laboratories. By utilizing our urinalysis system, we believe the average laboratory, which we define as those laboratories that typically perform 60 microscopy tests per day, can re-assign one medical technician currently performing these tests to another function, with a payback period of approximately two years. We also offer the iQ Body Fluids Module as an addition to the iQ test menu, which enables the rapid diagnosis for the presence of nucleated cells, red blood cells, bacteria and crystals in body fluid samples.
Urine Chemistry Analyzers
We market our proprietary fully-automated urine chemistry analyzers, the iChem VELOCITY, in the international market and distribute fully-automated urine chemistry analyzers manufactured by ARKRAY, a Japanese IVD company, domestically. Both of these automated urine chemistry analyzers can seamlessly connect to our iQ ELITE and iQ SPRINT automated urine microscopy analyzers and provide laboratories with walk-away solutions for chemistry and microscopy urinalysis with results combined and displayed in a single report. An iQ analyzer, combined with our iChem VELOCITY chemistry analyzer, forms the new iRICELL urinalysis workstation.
Internationally, we began selling the iChem VELOCITY in September 2008 following CE Mark certification. Prior to the development and international launch of our iChem VELOCITY, we were not selling automated chemistry systems outside the United States as our agreement with ARKRAY for its automated chemistry products was only for the U.S. market. The iChem VELOCITY is designed for medium to high volume laboratories that typically process more than 100 urine chemistry samples per day. We offer the iChem VELOCITY as a stand-alone analyzer or as part of our integrated urinalysis workcell solution, the iRICELL.
In the United States, sales of our iChem VELOCITY chemistry analyzer and iRICELL workstations will be initiated upon clearance of our 510(k) application with the FDA, which we expect to submit in the second quarter 2010. We have amended our distribution agreement with ARKRAY beyond 2008 to have the ability to continue to distribute the AUTION MAX AX-4280 automated urine chemistry analyzer domestically until the end of 2010. Our agreement with ARKRAY also allows us to sell consumable strips for our existing installed base of AX-4280 analyzers through 2013, which we plan to continue to support and service through the life of the contract.
8
Consumables and Service
We generate significant revenue from the sale of consumables and service contracts for our urine microscopy and urine chemistry analyzers. For the year ended December 31, 2009, revenue derived from consumables and service contracts accounted for 56% of our total consolidated revenues and 67% of our diagnostics business unit’s revenue. Consumables include urine and body fluids reagents, calibrators and controls for our microscopy systems and test strips, calibrators, controls, and other solutions for the urine chemistry analyzers we manufacture and distribute. We offer annual service contracts for our domestic customers after the initial year of sale, which is covered by product warranty. On an international basis, we offer spare parts to our distributors who in turn service the end-use customer.
In January 2010, MD Buyline, a leading independent healthcare research and market intelligence organization, placed IRIS Diagnostics as number one in vendor satisfaction ratings among industry competitors for automated urinalysis systems in all six categories, including System Performance, System Reliability, Installation/Implementation, Applications Training, Service Response Time and Service Repair Quality.
Urine Bacteria Screening
In October 2008, the Centers for Medicare & Medicaid Services, or CMS, announced that it will no longer reimburse hospitals for costs related to patients that suffer from a number of identified and preventable adverse events acquired during a hospital stay, one of which was urinary tract infections. This change from CMS is likely to cause hospitals to begin performing screening tests prior to patient admissions and we believe could represent a significant opportunity to increase the frequency of urinalysis.
We are in the process of improving the iQ platform’s ability to detect the presence of bacteria. This would allow for a fully-automated solution for hospital laboratories to experience improved workflow management through increased sample throughput and reduced labor demand for complete urinalysis utilizing our system.
Our proprietary isolation separation technology has the ability to bind antibody-coated albumin micro-bubbles to target cells, isolating any bacteria present in the urine and concentrating the particles for identification and quantification. We believe our technology has the ability to provide a faster and more cost-effective alternative to traditional urine cultures and will allow clinicians to make more informed treatment decisions. Our development efforts to date have created a standardized method that allows identification of both Gram-positive and Gram-negative bacteria. This automated bacteria screening technology will be performed on a new instrument in the concept stage of development.
3GEMS Platform
Our 3GEMS platform combines our core imaging technology with improved software and sample processing to enhance the identification of various cell types and particles found in urine, blood and other body fluids. We believe the increased sensitivity and specificity, reliability, ease of use and improved imaging of our 3GEMS platform will increase the clinical utility of our diagnostic tests and allow physicians and other caregivers to make more informed treatment decisions. The 3GEMS Platform will be the basis for our next generation urine microscopy analyzer and improved body fluids module and a new hematology analyzer product line. The following describes our 3GEMS products under development:
| • | Next Generation Urine Microscopy Analyzers. Our next generation urine microscopy analyzer will include advances in electronics and optics, including very high speed color cameras with higher resolution. We anticipate these advances will improve the clinical utility of the instrument as a greater number of cell types will be able to be identified with greater precision. |
| • | Next Generation Body Fluids Module. We currently offer products that utilize our proprietary technology for morphology analysis of other body fluids, including cerebrospinal and serous fluids. We are developing a next generation body fluids module that we believe will possess improved diagnostic capabilities relative to our current product offering. |
9
| • | Hematology Analyzers. We are developing a portfolio of hematology analyzers to automate the identification and characterization of cells in blood. Our initial hematology analyzer will conduct a complete blood count, or CBC, the most common type of blood test, as well as automatically complete a nine-part white cell differential analysis. This differential analysis will identify the presence and quantity of immature white blood cells, whose presence is often associated with conditions such as leukemia, infection, inflammation or tissue injury. Importantly, the automation of the white cell differential will eliminate the need for a medical technologist trained in cytology or pathologist to manually identify and count cells under a microscope – a time consuming and subjective process. Finally, since our analyzer captures digital images of individual cells, the creation of slides to enable the review of a blood smear under a microscope and to retain physical evidence of a particular sample is unnecessary. Our virtual slides will be stored digitally and transmitted electronically between laboratories or healthcare providers. |
Molecular Diagnostics
Our molecular diagnostic category is leveraging our proprietary NADiA technology platform to develop ultra-sensitive diagnostic tests. NADiA technology has the ability to measure proteins in extremely low concentrations below the detection thresholds of current immunoassay and molecular diagnostic methods. NADiA combines immunoassay and PCR methodologies, or Immuno-PCR, with the potential to detect proteins with femtogram/milliliter sensitivity (10-15 gram/milliliter). The Immuno-PCR approach is similar to that of an enzyme immunoassay, which makes use of antibody binding reactions and washing steps. In the NADiA method, the enzyme label is replaced with a strand of DNA and is detected by PCR amplification. We believe diagnostic tests that utilize our NADiA technology will aid in the early detection of disease relapse and potentially provide better therapeutic outcomes for patients. Our molecular diagnostics pipeline includes the following products under development:
| • | Prostate Cancer: NADiA ProsVue. PSA, or prostate-specific antigen, is the most widely used cancer marker for the diagnosis and clinical management of prostate cancer in men. We are developing an ultra-sensitive blood-based diagnostic test, called NADiA ProsVue, to monitor levels of PSA that currently are undetectable with current testing methods, in men with prostate cancer who have undergone radical prostatectomy, or removal of the prostate gland. We met with the FDA on several occasions to review our NADiA ProsVue Pre-Investigational Device Exemption (Pre-IDE) submission and reached an agreement in principle on the product claim and clinical end points to be used in a large clinical study. In the first quarter of 2010, we commenced a multi-center retrospective clinical study consisting of approximately 300 patients with serially collected blood samples, retained over an eight year period. The results from the study are expected to validate the claim that NADiA ProsVue can be used to prognosticate post-radical prostatectomy patients with low risk of prostate cancer recurrence. As of March 1, 2010, over 200 patients’ samples have been tested and analyzed with encouraging results. Upon completion of the study, we will submit a 510(k) application expected in the first half of 2010. |
| • | HIV: Viral Load Test. Current HIV viral load tests measure the quantity of HIV RNA in the blood of an individual infected with HIV. The presence of RNA indicates that the virus is actively replicating and increasing levels of RNA can indicate more serious or advanced disease. Viral load testing is one of the most valuable measures for predicting HIV disease progression and gauging how well anti-retroviral treatment is working. Effective anti-retroviral treatment can often reduce RNA viral load to levels that are undetectable by current diagnostic tests, with the most sensitive test having a threshold of 40 copies of RNA virus per milliliter of blood. Unlike current tests measuring HIV RNA, our NADiA technology measures a specific HIV viral protein, p24, which is present in greater numbers relative to HIV RNA. Specifically, per unit of sample, there are 3,000 p24 molecules while only two copies of HIV RNA. We are developing a blood-based HIV viral load test utilizing NADiA technology that we believe is 20 times more sensitive than current diagnostic tests by detecting down to the equivalent of two copies of HIV RNA |
10
| • | Breast Cancer: Her-2/neu Test. Her-2/neu is a validated cancer marker used as a prognostic indicator of the aggressiveness of a breast cancer tumor and a guide for appropriate treatment. We are developing a blood-based diagnostic test utilizing NADiA technology to identify and quantify the levels of Her-2/neu in women with breast cancer. We believe our technology will be able to isolate and characterize circulating breast cancer cells and to determine the Her-2/neu concentration per cell with a higher sensitivity than traditional detection methods that use tissue from a tumor biopsy. |
Sample Processing
Our sample processing group markets and develops centrifuges, semi-automated DNA processing workstations and sample processing consumables. Our StatSpin brand bench-top centrifuges are used for specimen preparation in coagulation, cytology, chemistry and urinalysis. Our worldwide markets include medical institutions, commercial laboratories, clinics, doctors’ offices, veterinary laboratories and research facilities.
With our sample processing products, we believe we offer laboratories the ability to increase their efficiency by processing samples as they arrive rather than in a batch mode. Our bench-top centrifuges offer a significant advantage with two to three minute cycles compared to conventional centrifuges taking up to 15-30 minutes cycle, depending on batch size. Further, our bench-top models are small enough to sit along side an analyzer eliminating the need for a separate central sample processing area.
We launched the Express 4 centrifuge in 2007, an instrument that employs a unique high speed horizontal rotor for separating samples and replaces larger and slower batch centrifuges by reducing sample preparation time and streamlining laboratory workflow. This new product platform enabled us to enter into the high volume chemistry market. In December 2009, we voluntarily recalled approximately 1,565 Express 4 centrifuges requiring a product retrofit in an estimated amount of $250,000.
In November of 2009, we initiated shipments of our new StatSpin Ovatube System for use in veterinary hospitals, clinics and reference laboratories to process fecal samples for the detection of ova and parasites. Based on our research, there are some 20 million ova parasite tests performed on animals each year in the U.S. alone, with some 15 million of these tests being performed in 25,000 veterinary clinics.
We have been collaborating with Becton Dickinson, or BD, in their Lean-Six Sigma initiatives with our Express 3 centrifuge utilizing BD’s blood collection tubes. Our collaboration study showed numerous benefits from utilizing our combined products in the laboratory including decreased turn-around time, increased productivity and decreased costs. As a result in 2008, our sample processing group and BD entered into a three-year distribution agreement. The agreement provides for BD distributing Express 3 centrifuges on a co-branded basis for use with its tubes in certain international markets.
We are focusing our research and development efforts in expanding our current centrifuge product lines, in addition to entering new applications. In addition, our strategy is to expand our focus on high value applications such as molecular sample preparation. We believe there is significant demand for automated solutions that increase efficiencies in this area.
Our Strategy
Our goal is to maintain our leadership position in automated in vitro diagnostics for urinalysis and sample processing while becoming a global leader in hematology and molecular diagnostics by offering products and solutions that increase laboratory productivity and efficiency and diagnostic tests that improve patient care. To achieve this goal, we intend to:
Increase the market adoption of the automated urinalysis platform in the in vitro diagnostics market. We strive to develop automated diagnostic instrumentation and solutions that enable increased laboratory productivity and efficiency. With the expansion of the iQ urine microscopy product line and the release of our current and future urine chemistry products, we believe we will be able to address the needs of a much broader
11
market. As we continue to market the clinical value of urinalysis, specifically in microscopy, we expect to increase market awareness and demand for our automated urinalysis products. In addition, we continue to pursue large multi-unit, multi-site contracts with large volume laboratories and to invest in emerging markets to increase our installed base of instruments.
Broaden our product offerings in the urinalysis IVD market. We intend to broaden our offerings in the urinalysis IVD market by developing and commercializing new products and solutions that improve laboratory efficiency and provide healthcare providers with more timely and more valuable information. The iChem VELOCITY, an automated urine chemistry analyzer, represents a key new product offering that we launched in the international market and expect to launch domestically in 2010. The iChem VELOCITY, when linked with our iQ microscopy analyzer, allows us to offer an integrated system, called the iRICELL. In addition, we are leveraging our 3GEMS imaging technology to develop next-generation urinalysis instruments to provide our customers with innovative products. Another key new product feature under development is our improved urine bacteria screening for the iQ. This would allow for a fully-automated solution for hospital laboratories to experience improved workflow management through increased sample throughput and reduced labor demand.
Use our imaging technology expertise to enter the automated hematology in vitro diagnostics market. We intend to leverage our imaging technology, which forms the basis of our market-leading urinalysis products, into other IVD markets where customers will value automation and increased efficiency. We are developing a hematology product portfolio that utilizes our next-generation 3GEMS imaging technology to reduce the need to prepare manual slides and perform subjective assessments of those slides under a microscope. We believe our product, by using a digitally-imaged virtual slide, will significantly decrease labor spent in laboratories by reducing the manual examination of abnormal blood samples while improving standardization.
Expand our addressable markets by developing molecular diagnostic tests. We believe that application of NADiA, our proprietary molecular diagnostic technology, has the potential to improve patient care management by allowing for earlier detection of disease relapse and to improve patient outcomes due to its ultra-sensitive detection of proteins. Our portfolio of emerging molecular diagnostic tests for cancer and infectious disease is designed to provide physicians and patients with more valuable information that may impact the treatment decision in managing the course of disease. As a result, we believe our NADiA platform is well-positioned for growth with the advent of personalized medicine utilizing genomic and molecular data to better determine targeted therapies for patients. We continue to evaluate commercialization strategies for our NADiA applications to maximize our penetration in the marketplace including partnerships with clinical reference labs or other IVD companies, a direct sales channel, or a combination of these alternatives.
Pursue selective acquisitions and technology in-licensing. We will continue to pursue selective acquisitions to augment our organic growth. Our acquisition strategy is to target companies and product lines that complement our business and provide additional infrastructure necessary for the commercialization of our pipeline. In January 2010, we acquired from our European distributor assets relating to its distribution of IRIS products in Germany and the UK to provide for an expanded international direct sales channel for current and future products.
Competition
Competition in the IVD industry is intense. Many of our competitors are substantially larger than we are and have greater financial, research, manufacturing, marketing, sales and other resources than we do. As a result, our competitors may develop technologies or products that could render our products or products under development obsolete or noncompetitive.
Urinalysis
The principal competitive factors in the urinalysis market are cost-per-test, ease of use and quality of results. In the automated urine microscopy segment, Sysmex Corporation markets its automated non-imaging urine
12
sediment analyzers globally and remains our principal competitor in the urine microscopy segment. Elektronika 77, a Hungarian company, offers a slide-based automated microscopy analyzer that can be run as stand-alone or in combination with a urine chemistry system. In the urine chemistry segment, Siemens Healthcare Diagnostics, ARKRAY and Roche Diagnostics are our principal competitors selling urine analyzers and test strips used in determining the concentration of various chemical substances found in urine. We believe our systems provide the highest level of integration of urine chemistry and microscopy and the broadest menu available to provide digital images of urine and other body fluids particles, which provides significant competitive advantages.
We are experiencing increased domestic and international pricing pressures in the urinalysis market due to the ongoing consolidation of both hospitals and medical device suppliers. Competitors are attempting to offer one-stop shopping for a variety of laboratory instruments, supplies and service with annual rebates based on the hospital’s total volume of business. We have been successful in preventing this type of “product bundling” by negotiating contracts with group purchasing organizations, or GPOs, in the United States allowing GPO members to purchase our products at competitive pricing.
Hematology
Hematology is a mature segment of the in vitro market in which there are a number of large competitors who already have an established market presence and significantly greater resources than we have. The major competitors in the hematology market include Abbott Laboratories, Beckman Coulter, Inc., Siemens Healthcare Diagnostics, Sysmex Corporation and Horiba ABX. Our hematology analyzer currently under development represents a significant advancement in this market by combining an automated instrument with image-based nine part white cell differential with complete blood counts. We believe this differentiates us from currently existing products, and will allow us to make a strong entry into the hematology testing market.
Molecular Diagnostics
In the ultra-sensitive protein detection market, we may experience competition from companies that utilize enzyme-linked immunosorbent assay, or ELISA, chemiluminescence and fluorescence technologies, including Abbott Diagnostics, Beckman Coulter, Inc., Ortho-Clinical Diagnostics, Inc., Roche Diagnostics and Siemens Healthcare Diagnostics. Our technology detects proteins at lower concentrations, which we believe will enable earlier detection of relapse of disease. Many of these companies market instruments and reagents for measuring serum markers in concentrations greater than 50,000 femtograms per milliliter, while we believe our technology will eventually detect concentrations as low as one femtogram per milliliter.
We plan to develop products to better manage infectious diseases based on ultra-sensitive protein detection associated with the infectious organisms. These products will compete with products that detect nucleic acids of the infectious organisms. We will compete with companies such as Abbott Diagnostics, Roche Diagnostics, Gen-Probe, BD Bioscience and bioMerieux that market products utilizing amplification techniques for analyzing molecular nucleic acid sequences in the infectious disease market.
Sample Processing
The primary competitive factors in the centrifuge market include speed, ease of use, size and cost. The major competitors in the bench-top centrifuge market include the Drucker Company, LW Scientific and Hettich. With the industry trend moving away from bulky floor models to smaller, faster, more efficient bench-top models, we are facing competition from companies such as Beckman Coulter and ThermoFisher. We believe our products are differentiated due to innovative design, single push button operation, small footprint, quiet cycle and rapid separation time.
Intellectual Property
We have a long history of innovation. Our diversified core technology spans through a number of scientific endeavors, which include IVD, immuno-assay, rare cell separation technology, specimen processing and handling, pattern recognition and image analysis. Our commercial success depends on our ability to protect and
13
maintain our proprietary rights. We protect our proprietary technology by filing various patent applications domestically and in many foreign countries. We own various active patents and have pending patent applications for our technologies domestically and internationally.
These patents cover developments in imaging analysis and processing software, blood processing, digital refractometers, fluidics, centrifuges, immuno-PCR processes, rare cell separation, automated slide handling and disposable urinalysis products sold by us. In addition, we have various patents related to products of our sample processing business segment. These patents have various useful lives ranging from five to 15 years with expirations ranging from one to 15 years. Our core IVD patents in the United States will start to expire in 2017.
For our molecular platform technologies, we have a license for three patents from the University of California that cover the use of nucleic acid labeled antibodies in immunoassays. In addition, we filed a patent on the improved use of DNA labeled antibodies and obtained patents covering NADiA and our bubble isolation technology methods.
We have trade secrets, unpatented technology and proprietary knowledge about the sale, promotion, operation, development and manufacturing of our products. We have confidentiality agreements with our employees and consultants to protect these rights.
We claim copyright in our source code and have a patent in the ways in which our software displays images, and have filed copyright registrations with the United States Copyright Office. We also own various federally registered trademarks, including “IRIS”, “iChem”, “VELOCITY”, “iQ”, “ThermoBrite”, and “StatSpin.” We own other registered and unregistered trademarks, and have certain trademark rights in foreign jurisdictions. We intend to aggressively protect our patents, copyrights and trademarks.
Third-Party Payor Reimbursements
Successful sales of our products in the United States and other countries will depend on the availability of reimbursement from third-party payors such as private insurance plans, managed care organizations, and Medicare and Medicaid. In the United States, the American Medical Association assigns specific Current Procedural Terminology, or CPT, codes, which are necessary for reimbursement of diagnostic tests. Once the CPT code is established, the CMS establish reimbursement payment levels and coverage rules under Medicaid and Medicare, and private payors establish rates and coverage rules independently. Our urinalysis tests are covered by established CPT codes and are therefore approved for reimbursement by Medicare and Medicaid as well as most third-party payors. However, we may develop tests in the future that do not relate to previously established CPT codes and we may need to obtain new CPT codes in order to obtain reimbursement. Reimbursement by a third-party payor depends on a number of factors, including the level of demand by health care providers and the payor’s determination that the use of the product represents a clinical advance or a reduction in the overall cost of treatment. In addition, in the United States, third-party payors and state governments routinely review reimbursement coverage for diagnostic tests considering budgetary constrains vis-à-vis demonstrated clinical efficacy. Also, outside of the United States, health care reimbursement systems vary from country to country, and to the extent we sell our products outside the United States, we may not be able to obtain adequate reimbursement coverage, if any, for our products.
Government Regulations
Our products are subject to stringent government regulation in the United States and other countries. These laws and regulations govern product testing, manufacture, labeling, storage, record keeping, distribution, sale, marketing, advertising and promotion. The regulatory process can be lengthy, expensive and uncertain, and securing clearances or approvals often requires the submission of extensive testing and other supporting information. If we do not comply with regulatory requirements, we may be subject to fines, recall or seizure of products, total or partial suspension of production, withdrawal of existing product approvals or clearances,
14
refusal to approve or clear new applications or notices and criminal prosecution. Further, any change in existing federal, state or foreign laws or regulations, or in their interpretation or enforcement, or the enactment of any additional laws or regulations, could affect us both materially and adversely.
In the United States, the FDA regulates medical devices under the Food, Drug, and Cosmetics Act. Before a new medical device can be commercially introduced in the United States, the manufacturer usually must obtain FDA clearance by filing a pre-market notification under Section 510(k) of the Food, Drug, and Cosmetics Act, or obtain FDA approval by filing a PMA application. The PMA application process is significantly more complex, expensive, time-consuming and uncertain than the 510(k) notification process. To date, we have cleared all of our regulated products with the FDA through the 510(k) notification process. We cannot guarantee that we will be able to use the 510(k) notification process for future products. Furthermore, FDA clearance of a 510(k) notification or approval of a PMA application is subject to continual review, and the subsequent discovery of previously unknown facts may result in restrictions on a product’s marketing or withdrawal of the product from the market.
We are also required to register as a medical device manufacturer with the FDA and comply with FDA regulations concerning good manufacturing practices for medical devices, or GMP Standards. In 1997, the FDA expanded the scope of the GMP Standards with new regulations requiring medical device manufacturers to maintain control procedures for the design process, component purchases and instrument servicing (Quality System Regulation or QSR). The FDA biannually inspects our manufacturing facilities for compliance with GMP Standards. We believe that we are in substantial compliance with the QSR.
Labeling, advertising and promotional activities for medical devices are subject to scrutiny by the FDA and, in certain instances, by the U.S. Federal Trade Commission. The FDA also enforces statutory and policy prohibitions against promoting or marketing medical devices for unapproved uses.
Many states have also enacted statutory provisions regulating medical devices. The State of California’s requirements in this area, in particular, are extensive, and require registration with the state and compliance with regulations identical to the GMP Standards established by the FDA. While the impact of such laws and regulations has not been significant to date, it is possible that future developments in this area could affect us both materially and adversely.
In addition to domestic regulation of medical devices, many of our products are subject to regulations in foreign jurisdictions. The requirements for the sale of medical devices in foreign markets vary widely from country to country, ranging from simple product registrations to detailed submissions similar to those required by the FDA. Our business strategy includes expanding the geographic distribution of these and other products, and we cannot guarantee that we will be able to secure the necessary clearances and approvals in the relevant foreign jurisdictions. Furthermore, the regulations in certain foreign jurisdictions continue to develop and we cannot be sure that new laws or regulations will not have a material adverse effect on our existing business or future plans. Among other things, CE Mark certifications are required for the sale of many products in certain international markets such as the European Community. We have secured CE Mark certification for our existing product lines.
We have obtained European Norm ISO 13485:2003 certification for our manufacturing facilities and are subject to surveillance by European notified bodies. In addition, our Chatsworth manufacturing facility is certified to ISO 13485:2003 with the Canadian Medical Devices Conformity Assessment System, or CMDCAS, which is the regulatory protocol used by Health Canada to certify manufacturers.
Our products are also subject to regulation by the U.S. Department of Commerce export controls, primarily as they relate to the associated computers and peripherals. We have not experienced any material difficulties in obtaining necessary export licenses to date.
15
Summary of Revenues by Product Line
| Year ended December 31, | ||||||||||||||||||
| 2009 | 2008 | 2007 | ||||||||||||||||
| ($ in thousands) | ||||||||||||||||||
| Revenues |
||||||||||||||||||
| IVD instruments |
$ | 26,018 | 28 | % | $ | 35,128 | 37 | % | $ | 33,492 | 40 | % | ||||||
| IVD consumables and service |
52,213 | 56 | % | 46,643 | 49 | % | 38,533 | 45 | % | |||||||||
| Sample Processing instruments and supplies |
14,335 | 16 | % | 13,731 | 14 | % | 12,281 | 15 | % | |||||||||
| Total revenues |
$ | 92,566 | 100 | % | $ | 95,502 | 100 | % | $ | 84,306 | 100 | % | ||||||
See Note 18 to the Consolidated Financial Statements, “Segment and Geographic Information,” for financial information regarding our operating segments and geographic areas.
Backlog
We did not have a material amount of backlog as of December 31, 2009. Our products usually ship within 30 to 60 days of receipt of sales orders. We do not believe that backlog is necessarily indicative of sales for any succeeding period.
Employees
At March 1, 2010, we had 326 full-time employees, including 290 in the United States and 36 internationally. We also use outside consultants and part-time and temporary employees in production, administration, marketing, research and development and engineering. None of our employees are covered by collective bargaining agreements. We consider our relations with our employees to be satisfactory.
Corporate Information
We incorporated in California in 1979 and reincorporated in Delaware in 1987. We currently have nine facilities, two in California, one in Massachusetts, and one in Marburg, Germany, and sales offices in France, Germany, the United Kingdom, Japan and Hong Kong.
Available Information
We make available our annual reports on Form 10-K, quarterly reports on Form 10-Q, current reports on Form 8-K, along with any related amendments and supplements on our website as soon as reasonably practicable after we electronically file or furnish such materials with or to the Securities and Exchange Commission, or the SEC. These reports are available, free of charge, at www.proiris.com. Our website and the information contained in it and connected to it do not constitute part of this annual report or any other report we file with, or furnish, to the SEC.
16
We have identified the following additional risks and uncertainties that may have a material adverse effect on our business, financial condition or results of operations. Investors should carefully consider the risks described below before making an investment decision. The risks described below are not the only ones we face. Additional risks not presently known to us or that we currently believe are immaterial may also significantly impair our business operations. Our business could be harmed by any of these risks. The trading price of our common stock could decline due to any of these risks, and investors may lose all or part of their investment.
Risks Related to Our Business
Adverse conditions in the global economy and disruption of financial markets could negatively impact our customers and therefore our results of operations.
An economic downturn in the businesses or geographic areas in which we sell our products could reduce demand for these products and result in a decrease in sales volume that could have a negative impact on our results of operations. Volatility and disruption of financial markets could limit our customers’ ability to obtain adequate financing or credit to purchase and pay for our products in a timely manner, or to maintain operations, and result in a decrease in sales volume that could have a negative impact on our results of operations.
Adverse macro economic forces have been impacting our selling markets and the credit markets of our customers. Although the impact thus far has been relatively mild, we continue to face the following challenges: deferrals of purchases due to decreases in capital budgets of our customers, delays in the purchasing cycle due to greater scrutiny of deals and increased internal competition for limited capital dollars, and a significant increase in requests for quotes for operating leases. The aforementioned factors may lead to a decrease in revenue, an increase of deferred revenue, or could lead to installment cash collection.
Our success depends largely on the continued acceptance of our iQ and iChem product lines.
Our current strategy assumes that our instrument platforms will be adopted by a large number of end-users. We have invested and continue to invest a substantial amount of our resources in promotion and marketing of the iQ and iChem product lines in order to increase their market penetration, expand sales into new geographic areas and enhance and expand the system features. Failure of our instrument operating platforms to achieve and maintain a significant market presence, or the failure to successfully implement our promotion and marketing strategy, will have a material adverse effect on our financial condition and results of operations.
If we fail to obtain, or experience significant delays in obtaining, regulatory clearances or approvals for our products or product enhancements, our ability to commercially distribute and market our products could suffer.
Our products are subject to rigorous regulation by the U.S. Food and Drug Administration, or FDA, and numerous other Federal, state and foreign governmental authorities. Our failure to comply with such regulations could lead to the imposition of injunctions, suspensions or loss of regulatory clearances or approvals, product recalls, termination of distribution, product seizures or civil penalties. In the most egregious cases, criminal sanctions or closure of our manufacturing facilities are possible. The process of obtaining regulatory authorizations to market a medical device, particularly from the FDA, can be costly and time consuming, and there can be no assurance that such authorizations will be granted on a timely basis, if at all. In particular, the FDA permits commercial distribution of a new class II or III medical device only after the device has received 510(k) clearance or is the subject of an approved pre-market approval, or PMA, application. The FDA will clear marketing of a medical device through the 510(k) process if it is demonstrated that the new product is substantially equivalent to other 510(k)-cleared products. The PMA approval process is more costly, lengthy and uncertain than the 510(k) clearance process. Introduction to the market of products we develop that require regulatory clearance or approval may be delayed. In addition, because we cannot assure you that any new
17
products or any product enhancements we develop will be subject to the shorter 510(k) clearance process, the regulatory approval process for our products or product enhancements may take significantly longer than anticipated. There is no assurance that the FDA will not require that a new product or product enhancement go through the lengthy and expensive PMA approval process. To date, all of our class II or III products have been cleared through the 510(k) process. We anticipate several of our molecular diagnostics products under development will be reviewed by the FDA under a PMA filing.
Foreign governmental authorities that regulate the manufacture and sale of medical devices have become increasingly stringent, and to the extent we continue to market and sell our products in foreign countries, we will be subject to rigorous regulation in the future. In such circumstances, we would rely significantly on our distributors to comply with the varying regulations, and any failures on their part could result in restrictions on the sale of our products in foreign countries.
There is no assurance that U.S. or foreign regulatory bodies will ultimately allow market clearance or approval for these products. Regulatory delays or failures to obtain clearances and approvals could disrupt our business, harm our reputation and adversely affect our sales.
Modifications to our products may require new regulatory clearances or approvals or may require us to recall or cease marketing our products until clearances are obtained.
Modifications to our products may require new 510(k) clearances or PMA approvals or require us to recall or cease marketing the modified devices until these clearances or approvals are obtained. The FDA requires device manufacturers to initially make and document a determination of whether or not a modification requires a new approval, supplement or clearance. A manufacturer may determine that a modification could not significantly affect safety or efficacy and does not represent a major change in its intended use, so that no new 510(k) is necessary. However, the FDA can review a manufacturer’s decision and may disagree. The FDA may also on its own initiative determine that a new clearance or approval is required. We have made modifications to our products in the past and may make additional modifications in the future that we believe do not or will not require additional clearances or approvals. If the FDA disagrees and requires new clearances or approvals for the modifications, we may be required to recall and to stop marketing our products as modified, which could require us to redesign our products and harm our operating results. In these circumstances, we may be subject to significant enforcement actions.
If a manufacturer determines that a modification to an FDA-cleared device could significantly affect its safety or efficacy, or would constitute a major change in its intended use, then the manufacturer must file for a new 510(k) clearance or possibly a PMA approval. Where we determine that modifications to our products require a new 510(k) clearance or PMA approval, we may not be able to obtain those additional clearances or approvals for the modifications or additional indications in a timely manner, or at all. For those products sold in the European Union, we must notify our E.U. competent authority by means of revision of our technical file, if significant changes are made to the products or if there are substantial changes to our quality assurance systems affecting those products. Delays in obtaining required future clearances or approvals would adversely affect our ability to introduce new or enhanced products in a timely manner, which in turn would harm our future growth.
Any failure to introduce our future products and systems successfully into the market could adversely affect our business.
Our commercial success depends on the timely development of new products that are needed for future growth. These new products depend on our success in demonstrating technical feasibility and achieving cost targets and functionality demanded by the market. Even if our product development efforts are successful and even if the requisite regulatory approvals are obtained, our products may not gain market acceptance among physicians, healthcare payers and the medical community. A number of additional factors may limit the market acceptance of products including the following:
| • | rate of adoption by healthcare providers; |
18
| • | rate of our products’ acceptance by the target market; |
| • | timing of market entry relative to competitive products; |
| • | availability of alternative products; |
| • | price of our product relative to alternative products; |
| • | availability of third-party reimbursement; and |
| • | extent of marketing efforts by us and third-party distributors or agents retained by us. |
Failure to achieve clinical acceptance will adversely impact our financial condition and results of operations.
If we choose to acquire new businesses, products or technologies, we may experience difficulty in the identification or integration of any such acquisition, and our business may suffer.
Our commercial success depends on our ability to continually enhance and broaden our product offerings in response to changing customer demands, competitive pressures and technologies. Accordingly, we may in the future pursue the acquisition of complementary businesses, products or technologies instead of developing them ourselves. We do not know if we will be able to identify or complete any acquisitions, or whether we will be able to successfully integrate any acquired business, product or technology or retain key employees. Integrating any business, product or technology we acquire could be expensive and time consuming, disrupt our ongoing business and distract our management. Moreover, we may fail to realize the anticipated benefits of any acquisition. If we are unable to integrate any acquired businesses, products or technologies effectively, our business will suffer. In addition, any amortization or charges resulting from acquisitions could adversely affect our operating results.
If we do not establish strategic partnerships to commercialize our products under development, we will have to undertake commercialization efforts on our own, which could be costly and may ultimately be unsuccessful.
We may selectively partner with other companies to obtain assistance for the commercialization of certain of our products. We may enter into strategic partnerships with third parties to develop and commercialize some of our products that are intended for larger markets or that otherwise require a large, specialized sales and marketing organization, and we may enter into strategic partnerships for products that are targeted beyond our selected target markets. We face competition in seeking appropriate strategic partners, and these strategic partnerships can be intricate and time consuming to negotiate and document. We may not be able to negotiate strategic partnerships on acceptable terms, or at all. We are unable to predict when, if ever, we will enter into any strategic partnerships because of the numerous risks and uncertainties associated with establishing strategic partnerships. If we are unable to negotiate strategic partnerships for our products under development, we may be forced to reduce the scope of our sales or marketing activities or undertake commercialization activities at our own expense. In addition, we will bear the entire risk related to the commercialization of these products. If we elect to increase our expenditures to fund commercialization activities on our own, we may need to obtain additional capital, which may not be available to us on acceptable terms, or at all.
Changes in reimbursement fees or lower than anticipated reimbursement for diagnostics tests could reduce demand and the price at which we can sell our products.
Successful sales of our products will depend on the availability of adequate coverage and reimbursement from third-party payors both domestically and internationally. Healthcare providers that purchase medical devices generally rely on third-party payors to reimburse all or part of the costs and fees associated with the procedures performed with these devices. Both public and private insurance coverage and reimbursement plans are central to new product acceptance. Customers are unlikely to use our products if they do not receive reimbursement adequate to cover the cost of our products.
19
To date, reimbursement has generally been available for the diagnostic tests that our products perform. However, all third-party coverage and reimbursement programs, whether government funded or insured commercially, whether inside the United States or outside, are developing increasingly sophisticated methods of controlling healthcare costs through limitations on covered items and services, prospective reimbursement and capitation programs, group purchasing, redesign of benefits, second opinions required prior to major surgery, careful review of bills, encouragement of healthier lifestyles and exploration of more cost-effective methods of delivering healthcare. These types of programs and legislative changes to coverage and reimbursement policies could potentially limit the amount which healthcare providers may be willing to pay for medical devices.
We believe that future coverage and reimbursement may be subject to increased restrictions both in the United States and in international markets. Third-party reimbursement and coverage for our products may not be available or adequate in either the United States or international markets. Future legislation, regulation, coverage or reimbursement policies of third-party payors may adversely affect the demand for our existing products or our products currently under development, and limit our ability to sell our products on a profitable basis.
If we fail to meet changing demands of technology, we may not continue to be able to compete successfully with our competitors.
The market for our products and systems is characterized by rapid technological advances, changes in customer requirements, and frequent new product introductions and enhancements. Our future success depends upon our ability to introduce new products that keep pace with technological developments, enhance current product lines and respond to evolving customer requirements. Our failure to meet these demands could result in a loss of our market share and competitiveness and could harm our revenues and results of operations.
Our ability to protect our intellectual property and proprietary technology through patents and other means is uncertain.
Our success depends significantly on our ability to protect our intellectual property and proprietary technologies. We rely on patent protection, as well as a combination of copyright, trade secret and trademark laws, and nondisclosure, confidentiality and other contractual restrictions to protect our proprietary technology. However, these legal means afford only limited protection and may not adequately protect our rights or permit us to gain or keep any competitive advantage.
Our pending U.S. and foreign patent applications may not issue as patents or may not issue in a form that will be advantageous to us. Any patents we have obtained or do obtain may be challenged by re-examination, opposition or other administrative proceeding, or may be challenged in litigation, and such challenges could result in a determination that the patent is invalid. In addition, competitors may be able to design alternative methods or devices that avoid infringement of our patents. To the extent our intellectual property protection offers inadequate protection, or is found to be invalid, we are exposed to a greater risk of direct competition. If our intellectual property does not provide adequate protection against our competitors’ products, our competitive position could be adversely affected, as could our business. Both the patent application process and the process of managing patent disputes can be time consuming and expensive. Furthermore, the laws of some foreign countries may not protect our intellectual property rights to the same extent as do the laws of the United States.
In addition to pursuing patents on our technology, we have taken steps to protect our intellectual property and proprietary technology by entering into confidentiality agreements and intellectual property assignment agreements with our employees, consultants, corporate partners and, when needed, our advisors. Such agreements may not be enforceable or may not provide meaningful protection for our trade secrets or other proprietary information in the event of unauthorized use or disclosure or other breaches of the agreements, and we may not be able to prevent such unauthorized disclosure. Monitoring unauthorized disclosure is difficult, and we do not know whether the steps we have taken to prevent such disclosure are, or will be, adequate.
20
In the event a competitor infringes upon our patents or other intellectual property rights, litigation to enforce our intellectual property rights or to defend our patents against challenge, even if successful, could be expensive and time consuming and could require significant time and attention from our management. We may not have sufficient resources to enforce our intellectual property rights or to defend our patents against challenges from others. Additionally, our earliest patents begin to expire in 2010, which may allow our competitors, many of which may have substantial resources and have made substantial investments in competing technologies, to develop technologies previously protected by these expiring patents.
The medical device industry is characterized by patent litigation, and we could become subject to litigation that could be costly, result in the diversion of our management’s time and efforts, require us to pay damages or prevent us from selling our products.
The medical device industry is characterized by extensive litigation and administrative proceedings over patent and other intellectual property rights. Whether or not a product infringes a patent involves complex legal and factual issues, the determination of which is often uncertain. Our competitors may assert that they own U.S. or foreign patents containing claims that cover our products, their components or the methods we employ in the manufacture or use of our products. In addition, we may become a party to an interference proceeding declared by the U.S. Patent and Trademark Office to determine the priority of invention. Because patent applications can take many years to issue and in many instances at least 18 months to publish, there may be applications now pending of which we are unaware, which may later result in issued patents that contain claims that cover our products. There could also be existing patents, of which we are unaware, that contain claims that cover one or more components of our products. As the number of participants in our industry increases, the possibility of patent infringement claims against us also increases.
Any interference proceeding, litigation or other assertion of claims against us may cause us to incur substantial costs, could place a significant strain on our financial resources, divert the attention of our management from our core business and harm our reputation. If the relevant patents were upheld as valid and enforceable and we were found to be infringing, we could be required to pay substantial damages and/or royalties and could be prevented from selling our products unless we could obtain a license or were able to redesign our products to avoid infringement. Any such license may not be available on reasonable terms, if at all. If we fail to obtain any required licenses or make any necessary changes to our products or technologies, we may be unable to make, use, sell or otherwise commercialize one or more of our products. In addition, if we are found to willfully infringe, we could be required to pay treble damages, among other penalties.
We operate in a consolidating industry that creates barriers to our market penetration.
The healthcare industry in recent years has been characterized by consolidation. Large hospital chains and groups of affiliated hospitals prefer to negotiate comprehensive supply contracts for all of their supply needs at once. Large suppliers can often equip an entire laboratory and offer hospital chains and groups one-stop shopping for laboratory instruments, supplies and service. Larger suppliers also typically offer annual rebates to their customers based on the customer’s total volume of business with the supplier. The convenience and rebates offered by these large suppliers are administrative and financial incentives that we do not offer our customers. Our plans for further market penetration in the urinalysis market and penetration into the hematology and molecular diagnostics markets will depend in part on our ability to overcome these and any new barriers resulting from continued consolidation in the healthcare industry. The failure to overcome such barriers could have a material adverse effect on our financial condition or results of operation.
Changes in government regulation of the healthcare industry could adversely affect our business.
Federal and state legislative proposals are periodically introduced or proposed that would affect major changes in the healthcare system, nationally, at the state level or both. Future legislation, regulation or payment policies of Medicare, Medicaid, private health insurance plans, health maintenance organizations and other third-
21
party payors could adversely affect the demand for our current or future products and our ability to sell our products on a profitable basis. Moreover, healthcare legislation is an area of extensive and dynamic change, and we cannot predict future legislative changes in the healthcare field or their impact on our industry or our business. Any impairment in our ability to market our products could have a material adverse effect on our financial condition and results of operation.
We may not be able to realize the deferred tax asset relating to our tax net operating loss carry forward.
As of December 31, 2009, we have deferred tax assets of approximately $6.1 million resulting from the differences between the financial statement and the tax bases of assets and liabilities using enacted tax rates in effect for the year in which the differences are expected to reverse. Management believes it is more likely than not that the deferred tax assets will be realized through future taxable income or alternative tax strategies. However, the net deferred tax assets could be reduced in the near term if management’s estimates of taxable income during the carryforward period are not realized or are significantly reduced or alternative tax strategies are not available. Although we believe that the deferred tax asset is recoverable, there is no assurance that we will be able to generate taxable income in the years that the differences reverse.
We rely on independent and some single-source suppliers for key components of our instruments. Any delay or disruption in the supply of components may prevent us from selling our products and negatively impact our operations.
Certain of our components are obtained from outside vendors, and the loss or breakdown of our relationships with these outside vendors could subject us to substantial delays in the delivery of our products to our customers. Furthermore, certain key components of our instruments and consumables are manufactured by only one supplier. Because this supplier is the only vendor with which we have a relationship for a particular component, we may be unable to sell products this supplier becomes unwilling or unable to deliver components meeting our specifications. Our inability to sell products to meet delivery schedules could have a material adverse effect on our reputation in the industry, as well as our financial condition and results of operation.
We face intense competition and our failure to compete effectively, particularly against larger, more established companies will cause our business to suffer.
The healthcare industry is highly competitive. We compete in this industry based primarily on product performance, service and price. Many of our competitors have substantially greater financial, technical and human resources than we do, and may also have substantially greater experience in developing products, obtaining regulatory approvals and manufacturing and marketing and distribution. As a result, they may be better able to compete for market share, even in areas in which our products may be superior. Further, our competitive position could be harmed by the establishment of patent protection by our competitors or other companies. The existing competitors or other companies may succeed in developing technologies and products that are more effective or affordable than those being developed by us or that would render our technology and products less competitive or obsolete. If we are unable to effectively compete in our market, our financial condition and results of operation will materially suffer.
We may not be able to maintain contracts with Group Purchasing Organizations, or GPOs.
A significant portion of our domestic sales are affected through agreements with participant members of GPOs. A failure to renew one or more GPO contracts may have a material effect on our domestic sales.
Our success depends on our ability to attract, retain and motivate management and other skilled employees.
Our success depends in significant part upon the continued services of key management and skilled personnel. Competition for qualified personnel is intense and there are a limited number of people with
22
knowledge of, and experience in, our industry. We do not have employment agreements with most of our key employees nor maintain life insurance policies on them. The loss of key personnel, especially without advance notice, or our inability to hire or retain qualified personnel, could have a material adverse effect on our ability to maintain our technological edge and ultimately our financial condition and results of operations. We cannot guarantee that we will continue to retain our key management and skilled personnel, or that we will be able to attract, assimilate and retain other highly qualified personnel in the future.
The expense and potential unavailability of insurance coverage for us, our customers or our products may have an adverse effect on our financial position and results of operations.
Our products are used to gather information for medical decisions and diagnosis. Accordingly, a defect in the design or manufacture of our products, or a failure of our products to perform for the use that we specify, could have a material adverse effect on our reputation in the industry and subject us to claims of liability arising from inaccurate or allegedly inaccurate test results. Misuse of our products by a technician that results in inaccurate or allegedly inaccurate test results could similarly subject us to claims of liability. While we currently have insurance for our business, property, directors and officers, and products, insurance is increasingly costly and the scope of coverage is more narrow, and we may be required to assume more risk in the future. If we are subject to claims or suffer a loss or damage in excess of our insurance coverage, we will be required to cover the amounts in excess of our insurance limits. If we are subject to claims or suffer a loss or damage that is outside of our insurance coverage, we may incur significant costs associated with loss or damage that would have a material adverse effect on our financial position and results of operations. Furthermore, any claims made on our insurance policies may impact our ability to obtain or maintain insurance coverage at reasonable costs, or at all. We do not have the financial resources to self-insure, and it is unlikely that we will have these financial resources in the foreseeable future.
We have product liability insurance that covers our products and business operation, but we may need to increase and expand this coverage commensurate with our expanding business.
Any product liability claims brought against us, with or without merit, could result in:
| • | substantial costs of related litigation or regulatory action; |
| • | substantial monetary penalties or awards; |
| • | decreased demand for our products; |
| • | reduced revenue or market penetration; |
| • | injury to our reputation; |
| • | an inability to establish new strategic relationships; |
| • | increased product liability insurance rates; and |
| • | an inability to secure continuing coverage. |
Furthermore, any impairment of our reputation could have a material adverse effect on our sales and prospects for future business. We have not received any indication that our insurance carrier will not renew our product liability insurance at or near current premiums; however, we cannot guarantee that this will continue to be the case. In addition, any failure to comply with FDA regulations governing manufacturing practices could hamper our ability to defend against product liability lawsuits.
Our facilities are located near known earthquake fault zones, and the occurrence of an earthquake or other catastrophic disaster could damage our facilities and equipment, which could cause us to curtail or cease operations.
Instruments for our diagnostics division are manufactured in a single facility in the San Fernando Valley and Iris Molecular Diagnostics is located in Carlsbad, California, both of which is near known earthquake fault zones
23
and, therefore, is vulnerable to damage from earthquakes. We are also vulnerable to damage from other types of disasters, such as power loss, fire, and similar events. If any disaster were to occur, our ability to operate our business could be seriously impaired. We currently may not have adequate insurance to cover our losses resulting from disasters or other similar significant business interruptions, and we do not plan to purchase additional insurance to cover such losses due to the cost of obtaining such coverage. Any significant losses that are not recoverable under our insurance policies could seriously impair our business, financial condition and prospects.
If we are unable to manage our growth, our results could suffer.
We have been experiencing significant growth in the scope of our operations. This growth has placed significant demands on our management, as well as operational resources. In order to achieve our business objectives, we anticipate that we will need to continue to grow. If this growth occurs, it will continue to place additional significant demands on our management and our operational resources, and will require that we continue to develop and improve our operational, financial and other internal controls both in the United States and internationally. In particular, if our growth continues, it will increase the challenges in implementing appropriate control systems, expanding our sales and marketing infrastructure capabilities, providing adequate training and supervision to maintain high quality standards, and preserving our cultural values. The main challenge associated with our growth has been the management of our expenses. Our inability to scale our business appropriately or otherwise adapt to growth, could cause our business, financial condition and results of operations to suffer.
To market and sell our products, we depend on third-party distributors, and they may not be successful.
We currently depend on third-party distributors to sell our IVD products in most markets outside of the United States as well as all Iris Sample Processing products. The quarterly and yearly demand from distributors depends on factors such as buying patterns, cash availability, currency exchange rates, etc. If these distributors are not successful in selling our products, we may be unable to increase or maintain our level of revenue. Our distributors may not commit the necessary resources to market and sell our products. If current or future distributors do not perform adequately or if we are unable to locate distributors in particular geographic areas, we may not realize revenue growth internationally. Over the long term, we intend to grow our business internationally, and to do so we will need to attract additional distributors to expand into new territories or to sell new products
Our sales in international markets are subject to a variety of laws and political and economic risks that may adversely impact our sales and results of operations in certain regions.
Our ability to capitalize on growth in international markets is subject to risks including:
| • | changes in currency exchange rates that impact the price to international consumers; |
| • | the burdens of complying with a variety of foreign laws and regulations; |
| • | unexpected changes in local regulatory requirements; and |
| • | the difficulties associated with promoting products in unfamiliar cultures; |
| • | subject to general, political and economic risks in connection with our international sales operations, including: |
| • | political instability; |
| • | changes in diplomatic and trade relationships; and |
| • | general economic fluctuations in specific countries or markets. |
Any of the above mentioned factors could adversely affect our sales and results of operations in international markets.
24
We are subject to currency fluctuations.
We are exposed to certain foreign currency risks in international markets where we source, produce, market or sell product. The line of automated urine chemistry analyzers that we currently sell in the United States, some assemblies for our iQ platform and related consumables strips and spare parts are sourced from ARKRAY, a supplier located in Kyoto, Japan. These components currently represent a significant portion of our material costs. Our purchases from this supplier are denominated in Japanese Yen and any fluctuations in the U.S. Dollar/Japanese Yen exchange rate could result in increased costs for these key components. Any increases over current levels would reduce our gross margins and would be likely to result in a material adverse effect on our profitability. We anticipate the exposure to the Japanese Yen to gradually decrease once we receive FDA clearance in the United States for our chemistry analyzer, the iChem VELOCITY.
We are also exposed to currency fluctuations with respect to the exportation of our products. With the exception of France where our operations are denominated in Euros, most of our sales are denominated in U.S. Dollars. Accordingly, any fluctuation in the exchange rate between the U.S. Dollar and the currency of the country with which we are exporting products could also affect our ability to sell internationally. To the extent we conduct operations abroad in non-local currency, fluctuations in the exchange rate between functional currency of those operations and the local currency may lead to significant increased costs and could negatively impact our profitability. Our chemistry strip manufacturing facility in Germany has the Euro as its functional currency.
Risks Related to Ownership of Our Common Stock
We have adopted a number of anti-takeover measures that may depress the price of our common stock.
Our stockholders rights plan, our ability to issue additional shares of preferred stock and some provisions of our certificate of incorporation and bylaws could make it more difficult for a third party to make an unsolicited takeover attempt of us. Additionally, we are subject to the anti-takeover provisions of Section 203 of the Delaware General Corporation Law, which regulates corporate acquisitions. These anti-takeover measures may depress the price of our common stock by making it more difficult for third parties to acquire us by offering to purchase shares of our stock at a premium to its market price without approval of our board of directors. They could also have the effect of preventing changes in our management.
Our quarterly sales and operating results may fluctuate in future periods, and if we fail to meet expectations the price of our common stock may decline.
Our quarterly sales and operating results have fluctuated significantly in the past and are likely to do so in the future due to a number of factors, many of which are not within our control. If our quarterly sales or operating results fall below the expectations of investors or securities analysts, the price of our common stock could decline substantially. Factors that might cause quarterly fluctuations in our sales and operating results include the following:
| • | variation in demand for our products, including seasonality; |
| • | our ability to develop, introduce, market and gain market acceptance of new products and product enhancements in a timely manner; |
| • | our ability to manage inventories, accounts receivable and cash flows; |
| • | our ability to control costs; |
| • | the size, timing, rescheduling or cancellation of orders from consumers and distributors; and |
| • | our ability to forecast future sales and operating results and subsequently attain them. |
The amount of expenses we incur depends, in part, on our expectations regarding future sales. In particular, we expect to continue incurring substantial expenses relating to the marketing and promotion of our products.
25
Since many of our costs are fixed in the short term, if we have a shortfall in sales, we may be unable to reduce expenses quickly enough to avoid losses. If this occurs, we will not be profitable. Accordingly, you should not rely on quarter-to-quarter comparisons of our operating results as an indication of our future performance.
Item 1B. Unresolved Staff Comments.
None.
We lease all of our facilities. Our headquarters are located at 9172 Eton Avenue, Chatsworth, California 91311. The table below sets forth certain information regarding our leased properties as of March 1, 2010.
| Location |
Approximate Floor Space (Sq. Ft.) |
Monthly Rent |
Use | ||||
| Chatsworth, CA |
98,446 | $ | 70,162 | Corporate headquarters and manufacturing | |||
| Westwood, MA |
29,220 | $ | 34,967 | Sample Processing division | |||
| Carlsbad, CA |
14,941 | $ | 17,182 | Molecular Diagnostic research division | |||
| Marburg, Germany |
8,539 | $ | 18,066 | Urine chemistry strip manufacturing facility | |||
| Marburg, Germany |
4,844 | $ | 2,278 | Urine chemistry strip manufacturing warehouse | |||
| Paris, France |
2,684 | $ | 3,017 | Sales office | |||
| Causeway Bay, HK |
120 | $ | 1,744 | Sales office | |||
| Cologne, Germany |
130 | $ | 2,520 | Sales office | |||
| Cambridge, UK |
323 | $ | 1,452 | Sales office | |||
We believe our facilities are adequate to meet our current and near-term needs.
From time to time, we are party to certain litigation arising in the normal course of business. Management believes that the resolution of such matters will not have a material adverse effect on our financial position, results of operations or cash flows. We are not currently involved in any litigation that requires disclosure in this report.
26
PART II
| Item 5. | Market for Registrant’s Common Equity, Related Stockholder Matters and Issuer Purchases of Equity Securities. |
Our common stock is listed on the NASDAQ Global Market under the symbol “IRIS.” The closing price of our common stock on March 5, 2010 was $10.73 per share. The table below sets forth the high and low closing prices of our common stock on the NASDAQ Global Market for the periods ended:
| Price per share | |||||
| Low | High | ||||
| Fiscal 2009: |
|||||
| First Fiscal Quarter |
$ | 8.60 | 13.33 | ||
| Second Fiscal Quarter |
10.03 | 12.94 | |||
| Third Fiscal Quarter |
9.50 | 11.81 | |||
| Fourth Fiscal Quarter |
9.99 | 12.62 | |||
| Fiscal 2008: |
|||||
| First Fiscal Quarter |
$ | 10.36 | 22.13 | ||
| Second Fiscal Quarter |
12.85 | 16.89 | |||
| Third Fiscal Quarter |
15.00 | 19.08 | |||
| Fourth Fiscal Quarter |
8.89 | 17.25 | |||
As of March 5, 2010 we had approximately 2,119 holders of record of our common stock.
Dividend Policy
We have never paid any cash dividends on our common stock. We currently expect to retain any future earnings for use in the operation and expansion of our business and do not anticipate paying any cash dividends on our common stock in the foreseeable future. Furthermore, we may not pay any cash dividends on the common stock without the written consent of our lender.
27
FIVE-YEAR STOCK PRICE PERFORMANCE COMPARISON (1)
The following graph and table compare the cumulative total return on our common stock with the cumulative total return (including reinvested dividends) of the Standard & Poor’s 500 Index (S&P 500), the NASDAQ Medical Devices, Instruments and Supplies, Manufacturers and Distributors Stocks Index and the Standard & Poor’s HealthCare Equipment Index for the five years ending December 31, 2009, assuming that the relative value of the common stock and each index was $100 on December 31, 2004. Amounts below have been rounded to the nearest dollar. The stock price performance on the following graph is not necessarily indicative of future stock price performance.
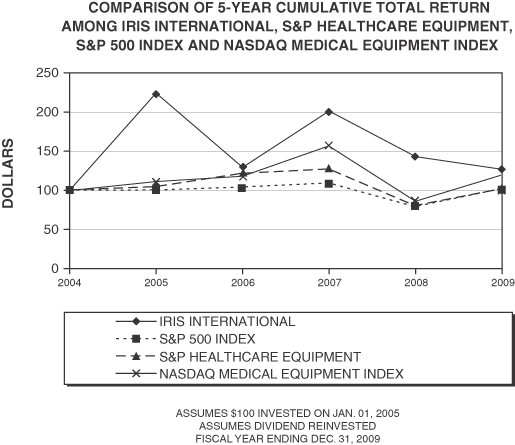
| (1) | This section is not “soliciting material,” is not deemed “filed” with the SEC and is not to be incorporated by reference into any filing of IRIS International, Inc. under the Securities Act of 1933, as amended, or the Securities Exchange Act of 1934, as amended, whether made before or after the date hereof and irrespective of any general incorporation language in any such filing. |
28
Item 6. Selected Financial Data.
The following selected financial data should be read in conjunction with our consolidated financial statements. The information set forth below is not necessarily indicative of results of future operations, and should be read in conjunction with Item 7, “Management’s Discussion and Analysis of Financial Condition and Results of Operations” and the consolidated financial statements and notes thereto included in Item 8, “Financial Statements and Supplementary Data” of this Form 10-K in order to understand fully factors that may affect the comparability of the financial data presented below.
| Year Ended December 31, | ||||||||||||||||
| 2009 | 2008 | 2007 | 2006 | 2005 | ||||||||||||
| (in thousands, except per share data) | ||||||||||||||||
| Statement of Operations Data: |
||||||||||||||||
| Revenues |
$ | 92,566 | $ | 95,502 | $ | 84,306 | $ | 72,067 | $ | 64,585 | ||||||
| Operating income |
7,811 | 10,967 | 8,953 | 1,049 | 8,941 | |||||||||||
| Other income (expense) |
894 | 2,409 | 1,440 | 1,089 | 605 | |||||||||||
| Net income (loss) |
6,251 | 9,013 | 7,549 | (175 | ) | 6,131 | ||||||||||
| Basic net income (loss) per share |
0.35 | 0.49 | 0.42 | (0.01 | ) | 0.37 | ||||||||||
| Diluted net income (loss) per share |
0.35 | 0.48 | 0.40 | (0.01 | ) | 0.35 | ||||||||||
| Balance Sheet Data: |
||||||||||||||||
| Working capital |
58,988 | 51,553 | 49,685 | 37,283 | 33,879 | |||||||||||
| Total assets |
97,790 | 90,638 | 86,390 | 74,317 | 63,929 | |||||||||||
| Total debt |
— | — | — | — | — | |||||||||||
| Total liabilities |
12,568 | 14,728 | 11,456 | 11,751 | 10,160 | |||||||||||
| Stockholders’ equity |
85,222 | 75,910 | 74,934 | 62,566 | 53,769 | |||||||||||
Our financial results for certain of the years set forth above were impacted by the following events:
| 1. | 2009 results include the following expenses totaling $1.1 million; an accrual of $475,000 for payroll taxes attributable to the exercise of stock options, $350,000 in start-up expenses for the initiation of direct sales operations in the UK and Germany and $250,000 for product retrofit costs related to the voluntary recall of approximately 1,565 StatSpin Express 4 Centrifuges. |
| 2. | 2008 results include the non recurring other income related to the $1.2 million net payment to us as part of the manufacturing transition rights agreement signed with IDEXX Laboratories in December 2008. |
| 3. | 2007 results include the effects of closing our Advanced Digital Imaging Research subsidiary’s operations which resulted in a $163,000 write-off. |
| 4. | 2006 results include the effect of the acquisition in April 2006 of Leucadia Technologies, Inc. We recorded a $5.2 million charge for purchased in-process research and development. In addition we incurred additional research and development expenses of $1.8 million as a result of the acquisition. |
29
Item 7. Management’s Discussion and Analysis of Financial Condition and Results of Operations.
Overview
IRIS International, Inc. consists of three operating units in two business segments as determined in accordance with FASB ASC Topic 280 “Segment Reporting”. Our in-vitro diagnostics, or IVD, segment also called Iris Diagnostics Division, designs, manufactures and markets IVD systems, consumables and supplies for urinalysis and body fluids. With the acquisition of Leucadia Technologies, Inc., or Leucadia, in 2006 we created our Iris Molecular Diagnostics, or IMD, subsidiary whose operations are included as part of the Iris Diagnostics Division. Our Sample Processing segment markets small centrifuges and other processing equipment and accessories for rapid specimen processing.
The initial applications for our technology have been in the urinalysis market and we are the leading worldwide provider of automated urine microscopy systems, with more than 2,600 iQ microscopy analyzers in over 50 countries. We generate revenues primarily from sales of IVD instruments, IVD consumables and service and sample processing instruments and supplies. Revenues from IVD instruments include sales of urine microscopy and chemistry analyzers manufactured by us and a urine chemistry analyzer, the AUTION MAX AX-4280, sourced from a Japanese manufacturer. We sell our urine microscopy analyzers worldwide. We initiated sales of the iChem VELOCITY, our fully-automated chemistry analyzer internationally in September 2008. Sales of this instrument in the United States will be initiated upon us obtaining FDA clearance. We currently distribute the AUTION MAX AX-4280 in the United States, and have secured sufficient inventory of this product to cover all domestic sales of fully automated chemistry analyzers through the second half of 2010. Consumables include products such as chemical reagents and urine test strips. Service revenues are derived primarily from annual service contracts purchased by our domestic customers after the initial year of sale, which is covered by product warranty and spare parts purchased by international customers. Once the analyzers are installed, we generate recurring revenue from sales of consumables. Consumable and service revenue are expected to continue to expand as the installed base of related instruments increases. Revenue is also generated from sales of sample processing instruments and related supplies, which primarily consists of centrifuge systems, DNA processing workstations and blood analysis products.
Domestic sales of our urinalysis systems are direct to the customer through our sales force. International sales, with the exception of France and Puerto Rico where sales are direct to end use customers, are through independent distributors. Effective January 2010, we completed the purchase of certain European distributor assets relating to the distribution of IRIS products in the United Kingdom, Ireland and Germany. We purchased the assets, which consist primarily of installed IRIS instruments leased to customers, the related lease agreements, and service contracts, for $841,000. This purchase will increase our direct sales presence within our international sales channels, and will serve as a template for further potential transactions in territories that represent new business opportunities for us. We estimate that in 2010, we will incur additional expense of approximately $2.5 million to fund our new direct sales initiatives in the United Kingdom, Ireland and Germany. International sales represented 33% of consolidated revenues for the years ended December 31, 2009 and 2008. Since the substantial majority of international sales are made through independent distributors, gross profit margin is lower than for domestic sales of the same products, but we incur minimal sales and marketing costs for such sales. Our Sample Processing products are sold worldwide primarily through distributors.
As our Company did not meet its revenue and earnings thresholds for the year ended December 31, 2009, the employee bonus expenses were significantly reduced by $1.4 million as compared to the prior year. The consolidated employee bonus expense for the years ended December 31, 2009 and 2008 amounted to $362,000 and $1.7 million, respectively.
In February 2010, after receiving reports of two incidents of uncontained rotor ruptures, we initiated a voluntary recall of 1,565 Express 4 Centrifuge with a safety defect that could expose the user to personal injury or the biological sample being processed. A retrofit program has been initiated to upgrade all units shipped since November 2007 at an estimated cost of $250,000. The installed base of approximately 60,000 centrifuges of all
30
other models is not affected and we expect all units upgraded within the second quarter of 2010. We do not expect a material revenue impact from this incident.
In June 2009, we initiated a reduction in force of 19 full time equivalent personnel which resulted in a charge of $325,000 during the second quarter of 2009. The reduction in force generated approximately $1.4 million in annualized savings.
In 2008, we entered into a manufacturing and supply agreement with IDEXX Laboratories, Inc., or IDEXX, for internal centrifugal drive systems and related whole blood separators developed by us for use in the new IDEXX Catalyst Dx™ Chemistry Analyzer for the veterinary market launched globally by IDEXX in 2008. Under the terms of the agreement, in exchange for a $1.5 million cash payment and future royalties starting in 2014, we granted IDEXX exclusive rights to manufacture the whole blood separator technology. In addition, we will exclusively manufacture and sell to IDEXX the internal centrifugal drive system we developed. Shipments of this drive system commenced in 2008.
We have invested significant capital to acquire technologies and to increase our investment in research and development both to sustain our technological leadership in our existing core product lines in urinalysis and sample processing and as part of our growth strategy to broaden our product pipeline into new high value platforms in hematology and molecular diagnostics. The decision to diversify into IVD market segments in which we do not presently participate has adversely affected our earnings growth over the last four years, as we have invested significantly in research and development without any corresponding revenues from new products still in development. Our investment in new product platforms, however, is of strategic importance and is necessary to position the company for significant revenue and earnings acceleration in future years. Research and development expense increased to $11.4 million, or 12% of revenue, in 2009 compared to $10.4 million, or 11% of revenue, in 2008. Of these expenditures, approximately $6.0 million and $5.0 million was invested in 2009 and 2008, respectively, in our NADiA and hematology platforms. The expected release of our NADiA ProsVue in 2010 represents the first product offering resulting from our product line expansion initiative, and we are expecting significant revenue realization from this product starting in 2011. For 2010, we anticipate that research and development expense will increase to approximately 13% of revenue.
The following table summarizes product technology expenditures for the periods indicated:
| 2009 | 2008 | 2007 | ||||||||||
| (in thousands) | ||||||||||||
| Total product technology expenditures during year |
$ | 12,331 | $ | 11,699 | $ | 11,331 | ||||||
| Less: amounts capitalized during year to software development costs as reported in the consolidated statements of cash flow |
(835 | ) | (1,178 | ) | (970 | ) | ||||||
| Less: amounts reimbursed through grants for government sponsored research and development |
(85 | ) | (164 | ) | (135 | ) | ||||||
| Research and development expense as reported in the consolidated statements of income |
$ | 11,411 | $ | 10,357 | $ | 10,226 | ||||||
Critical Accounting Policies
The preparation of financial statements and related disclosures in conformity with U.S. generally accepted accounting principles and our discussion and analysis of our financial condition and results of operations require us to make judgments, assumptions, and estimates that affect the amounts reported in our consolidated financial statements and accompanying notes. Note 2 of the Notes to Consolidated Financial Statements of this Form 10-K describes the significant accounting policies and methods used in the preparation of our consolidated financial statements. We base our estimates on historical experience and on various other assumptions we believe to be reasonable under the circumstances, the results of which form the basis for making judgments about the carrying values of assets and liabilities. We regularly discuss with our audit committee the basis of our estimates. Actual results may differ from these estimates and such differences may be material.
31
We believe the following critical accounting policies, among others, affect our more significant judgments and estimates used in the preparation of our consolidated financial statements:
Revenue recognition – Revenues are primarily derived from the sale of IVD instruments, sales of consumable supplies and services for IVD systems as well as sales of sample processing instruments and related supplies. Revenue is recognized once all of the following conditions have been met: (i) an authorized purchase order has been received in writing with a fixed and determinable sales price; (ii) customer credit worthiness has been established; and (iii) delivery of the product based on shipping terms.
Revenue is recorded in accordance with the provisions of FASB ASC Topic 605 “Revenue Recognition”, which generally require revenue earned on product sales involving multiple-elements to be allocated to each element based on the relative fair values of those elements if sold separately. Multiple elements of certain domestic product sales include IVD instruments, training, consumables and service.
Accordingly, we allocate revenue to each element in a multiple element arrangement based on the element’s respective fair value, with the fair value determined by the price charged when that element is sold separately and specifically defined in a quotation or contract.
A portion of our revenues are derived from sales-type leases as we provide lease financing to certain customers that purchase our diagnostic instruments. Leases under these arrangements are classified as investment in sales-type leases. These leases typically have terms of five years. Revenue from sales-type leases is recognized when collectibility of the minimum lease payments is reasonably predictable and no important uncertainties surround the amount of unreimbursable costs yet to be incurred by us as lessor under the lease. The minimum lease payments that accrue to our benefit as lessor are recorded as the gross investment in the lease. The difference between the gross investment in the lease and the sum of the present value of the minimum lease payments and unguaranteed residual value, accruing to our benefit as lessor, are recorded as unearned income.
We have certain government contracts with cancellation clauses or renewal provisions that are generally required by law, such as (i) those dependant on fiscal funding outside of a governmental unit’s control; (ii) those that can be cancelled if deemed in the tax payers’ best interest; and (iii) those that must be renewed each fiscal year, given limitations that may exist on multi-year contracts that are imposed by statute. Under these circumstances and in accordance with the relevant accounting literature, as well as considering our historical experience, a thorough evaluation of these contracts is performed to assess whether cancellation is remote or whether exercise of the renewal option is reasonably assured.
We recognize revenues from service contracts ratably over the term of the service period, which typically ranges from twelve to sixty months. Payments for service contracts are generally received in advance. Deferred revenue represents the revenues to be recognized over the remaining term of the service contracts.
Inventory valuation – We value inventories at the lower of cost or market value on a first-in, first-out basis. Provision for potentially obsolete or slow-moving inventory is made based on management’s analysis of inventory levels and future sales forecasts.
Since the introduction of our iQ product line, the installed base of our legacy analyzers have been steadily declining and less than 20 units internationally and 6 units domestically remain in the field as of December 31, 2009. We maintain a base supply of service parts for these products. Management will periodically review the carrying value of such parts to ensure that they continue to exceed net realizable value.
Goodwill and Core Technology – Our intangible assets consist of goodwill, which is not being amortized and core technology, which is being amortized over its useful life of 20 years. All intangible assets are subject to impairment tests on an annual or periodic basis. Goodwill is evaluated in accordance with FASB ASC Topic 350, “The Intangibles- Goodwill and Other”, based on various analyses, including a comparison of the carrying value
32
of the reporting unit to its estimated fair value and discounted cash flow. The analysis necessarily involves significant management judgment to evaluate the capacity of an acquired business to perform within projections. Core technology is evaluated for impairment using the methodology set forth in FASB ASC Topic 360, “Property, Plant and Equipment.” Recoverability of these assets is assessed only when events have occurred that may give rise to a potential impairment. When a potential impairment has been identified, forecasted undiscounted net cash flows of the operations to which the asset relates are compared to the current carrying value of the long-lived assets present in that operation. If such cash flows are less than such carrying amounts, long-lived assets, including such intangibles, are written down to their respective fair values.
At December 31, 2009, we evaluated goodwill and determined that fair value had not decreased below carrying value and no adjustment to impair goodwill was necessary in accordance with ASC Topic 350. Substantially all of the goodwill resides in the IVD reporting unit.
Capitalized software – We capitalize certain software development costs in connection with our development of our urine analyzers in accordance with FASB ASC Topic 985, “Software.” We capitalize software development costs once technological feasibility is established and such costs are determined to be recoverable against future revenues.
Capitalized software development costs are expensed to cost of sales over periods up to five years. When, in management’s estimate, future revenues will not be sufficient to recover previously capitalized software development costs, we will expense such items as additional software development amortization in the period the impairment is identified. Such adjustments are normally attributable to changes in market conditions or product quality considerations.
Income taxes – We account for income taxes in accordance with FASB ASC Topic 740, “Income Taxes,” which requires recognition of deferred tax liabilities and assets for the expected future tax consequences of events that have been included in the financial statements or tax returns. Under this method, deferred tax liabilities and assets are determined based on the differences between the financial statement and the tax bases of assets and liabilities using enacted tax rates in effect for the year in which the differences are expected to reverse. Valuation allowances are established when necessary to reduce deferred tax assets to the amount expected to be realized. Income tax expense represents the tax payable for the period and the change during the period in deferred tax assets and liabilities.
We account for uncertain tax positions in accordance with FASB ASC Topic 740-10 which prescribes a recognition threshold and measurement attribute for financial statement recognition and measurement of a tax position taken or expected to be taken in a tax return and also provides guidance on various related matters such as derecognition, interest, penalties and disclosures required. We recognize interest and penalties, if any, related to unrecognized tax benefits in income tax expense.
Stock based compensation – The Company accounts for stock based compensation under FASB ASC Topic 718, Compensation- Stock Compensation (“ASC 718”) which requires compensation costs related to share-based transactions, including employee stock options, to be recognized in the financial statements based on fair value.
33
Results of Operations
The following table summarizes results of operations data for the periods indicated. The percentages in the table are based on total revenues with the exception of percentages for gross profit margins which are computed on related revenue.
| Years ended December 31, | ||||||||||||||||||
| 2009 | 2008 | 2007 | ||||||||||||||||
| (in thousands) | ||||||||||||||||||
| Revenues |
||||||||||||||||||
| IVD instruments |
$ | 26,018 | 28 | % | $ | 35,128 | 37 | % | $ | 33,492 | 40 | % | ||||||
| IVD consumables and service |
52,213 | 56 | % | 46,643 | 49 | % | 38,533 | 45 | % | |||||||||
| Sample Processing instruments and supplies |
14,335 | 16 | % | 13,731 | 14 | % | 12,281 | 15 | % | |||||||||
| Total revenues |
92,566 | 100 | % | 95,502 | 100 | % | 84,306 | 100 | % | |||||||||
| Gross Profit(1) |
||||||||||||||||||
| IVD instruments |
9,240 | 36 | % | 15,523 | 44 | % | 15,543 | 46 | % | |||||||||
| IVD consumable and service |
32,055 | 61 | % | 26,648 | 57 | % | 20,673 | 54 | % | |||||||||
| Sample Processing instruments and supplies |
7,370 | 51 | % | 6,868 | 50 | % | 6,138 | 50 | % | |||||||||
| Gross profit |
48,665 | 53 | % | 49,039 | 51 | % | 42,354 | 50 | % | |||||||||
| Operating expenses |
||||||||||||||||||
| Marketing and selling |
16,122 | 17 | % | 15,706 | 16 | % | 13,041 | 16 | % | |||||||||
| General and administrative |
13,321 | 14 | % | 12,009 | 13 | % | 10,134 | 12 | % | |||||||||
| Research and development, net |
11,411 | 12 | % | 10,357 | 11 | % | 10,226 | 12 | % | |||||||||
| Total operating expenses |
40,854 | 44 | % | 38,072 | 40 | % | 33,401 | 40 | % | |||||||||
| Operating income |
7,811 | 9 | % | 10,967 | 11 | % | 8,953 | 11 | % | |||||||||
| Other income |
894 | 2,409 | 1,440 | |||||||||||||||
| Income before provision for income taxes |
8,705 | 9 | % | 13,376 | 14 | % | 10,393 | 12 | % | |||||||||
| Provision for income taxes(2) |
2,454 | 28 | % | 4,363 | 33 | % | 2,844 | 27 | % | |||||||||
| Net income |
$ | 6,251 | 7 | % | $ | 9,013 | 9 | % | $ | 7,549 | 9 | % | ||||||
| (1) | Gross profit margin percentages are based on the related sales of each category. |
| (2) | Income tax percentage is computed based on the relationship of income taxes to pre-tax income. |
Comparison of Year Ended December 31, 2009 to 2008
Revenues for the year ended December 31, 2009 decreased by 3% over the prior year to $92.6 million from $95.5 million in 2008. Revenues in the IVD urinalysis segment decreased 4% to $78.2 million in 2009, from $81.8 million in the prior year. Sales of IVD instruments decreased 26% to $26.0 million from $35.1 million in the prior year as a result of a significant shortage of capital in the global markets. Our unit volume of iQ analyzers sold during 2009 decreased approximately 21% compared to 2008, with domestic units decreasing 25% and internationally units decreasing 19%. International revenues accounted for approximately 33% of consolidated revenue for both 2009 and 2008. Sales of IVD consumables and service increased during the year to $52.2 million from $46.6 million, an increase of 12% over 2008, primarily due to the larger installed base of instruments and the success of converting expiring warranty agreements to service agreements. Revenues derived from Sample Processing instruments and supplies increased to $14.3 million, a 4% increase over 2008 revenues of $13.7 million. This growth was driven by continued strong sales of our new Express 4 centrifuge along with an increase in orders from our international distributors, most notably our distributor in the United Kingdom.
Overall gross profit margins increased to 53% in 2009 compared to 51% in 2008. The gross profit margin of our IVD instruments was 36% in 2009 versus 44% in 2008. As compared to the prior year period, IVD
34
instrument gross margin in 2009 was impacted by $368,000 in sales promotions, $1,193,000 in costs related to the iChem VELOCITY, which included Velocity retrofit costs of $373,000, volume and other costs of $320,000, severance costs of approximately $40,000 with an offset of a reduction in employee bonuses of $76,000. In addition, our gross margins on IVD instruments were negatively impacted by foreign currency fluctuations on our purchases of AUTION MAX AX-4280 chemistry analyzers which are denominated in Japanese Yen. The gross margin of our IVD consumables and service increased to 61% during 2009 compared to 57% in 2008, respectively, and included $501,000 in international sales discounts. The consumable gross margin improvement primarily resulted from economies of scale generated by our increasing volume of urine microscopy consumables and spare parts, improved efficiencies in our domestic service business, a reduction in unfavorable foreign currency fluctuations on purchases of dry chemistry strips denominated in Japanese Yen and a reduction of employee bonuses of $160,000. Our chemistry strip manufacturing operation in Germany continues to operate below capacity, but we expect to improve its utilization with increased demand for our proprietary urine chemistry test strips as a result of an increasing installed base our new iChem VELOCITY automated urine chemistry analyzers in the mid to high volume segment of the urinalysis market. Gross profit margin for our Sample Processing instruments and supplies segment increased to 51% in 2009 from 50% in 2008 as a result of product mix, price increases and reduced headcount related to the reduction in force in the second quarter of 2009. In addition, the gross margin was affected by our Sample Processing division’s voluntarily recall of approximately 1,565 centrifuges, requiring a $250,000 accrual to cover the product retrofit costs during the fourth quarter of 2009.
Marketing and selling expenses totaled $16.1 million, or 17% of revenues, in 2009 as compared to $15.7 million, or 16% of revenues in 2008. The increase includes personnel and related costs of $967,000, partially offset by lower commission and GPO fees of $319,000, travel and entertainment of $198,000, a reduction of employee bonuses of $134,000 and professional fees of $151,000. Our $967,000 increase in personnel and related costs includes $350,000 in start-up expenses relating to the initiation of direct sales in the United Kingdom, Ireland and Germany.
General and administrative expenses increased to $13.3 million, or 14% of revenues, in 2009, from $12.0 million or 13% of revenues in 2008. This increase includes additional personnel and related costs of $619,000, stock-based compensation expense of $804,000, professional fees of $108,000, board compensation expense of $64,000, an accrual of $475,000 for payroll taxes attributable to the exercise of stock options, other corporate related expenses of approximately $300,000 and an offset of $541,000 for a reduction in employee bonuses.
Research and development expense increased to $11.4 million, or 12% of revenues, in 2009 from $10.4 million, or 11% of revenues in 2008. The increase includes research materials, consulting, clinical development expenses and software capitalization of $1.1 million as we continue to invest heavily in research and development for the continued development of our diagnostics product pipeline, including our NADiA platform and 3GEMS urinalysis and hematology programs. These costs were partially offset by a reduction in employee bonuses of $431,000.
Interest income during 2009 amounted to $857,000, a $323,000 decrease over 2008 mainly due to a lower interest rate environment on our cash balances, and in spite of a higher cash balance.
Income tax expense during the year amounted to 28% of pre-tax income as compared to 33% during the prior year. The decrease in the income tax provision resulted from an increase in research and development tax credits. We have federal and state research and development and other tax credit carryovers totaling $5.3 million.
Comparison of Year Ended December 31, 2008 to 2007
Revenues for the year ended December 31, 2008 increased by 13% over the prior year to $95.5 million from $84.3 million in 2007. Revenues in the IVD urinalysis segment increased 14% to $81.8 million in 2008, from
35
$72.0 million in the prior year. Sales of IVD instruments increased 5% to $35.1 million in 2008 from $33.5 million in the prior year. Our unit volume of iQ analyzers sold during 2008 increased approximately 2% with the number of units sold domestically remaining constant whereas the number of units sold internationally increased 3%. Total international revenues accounted for approximately 33% of consolidated revenue during 2008 compared to 30% during 2007. Sales of IVD consumables and service increased during 2008 to $46.6 million from $38.5 million, an increase of 21% over 2007, primarily due to the larger installed base of instruments and the success of converting expiring warranty agreements to service agreements. Revenues from the Sample Processing instruments and supplies increased during 2008 to $13.7 million up from $12.3 million, a 12% increase over 2007. This growth was primarily driven by the new Express 4 centrifuge partially offset by declining sales of more mature products, such as the Express 2 centrifuge.
Overall gross profit margins increased from 50% in 2007 to 51% in 2008. The gross profit margin of our IVD instruments was 44% in 2008 versus 46% in 2007, as the launch in 2008 of the iChem VELOCITY carried higher start-up manufacturing costs such as manufacturing learning curve, training and higher material costs due to small lot procurement in the initial stages. In addition, our gross margins on IVD instruments were negatively impacted by foreign currency fluctuations on purchases of AUTION MAX AX-4280 chemistry analyzers which are denominated in Japanese Yen. The gross margin of our IVD consumables and service increased to 57% during 2008 compared to 54% in 2007. The consumable gross margin improvement primarily resulted from economies of scale generated by our increasing volume of urine microscopy consumables partially offset by unfavorable foreign currency fluctuations on purchases of dry chemistry strips denominated in Japanese Yen. Our chemistry strip manufacturing operation continued to operate at below capacity during 2008, which adversely affected margins. In addition, during 2008 we experienced gross profit margin improvement in our domestic instrument service as a result of economies of scale and cost containments even with an increasing domestic installed base. Gross profit margin for our Sample Processing laboratory instruments and supplies segment remained constant at 50% in 2007 and 2008.
Marketing and selling expenses totaled $15.7 million, or 16% of revenues, in 2008 as compared to $13.0 million, or 16% of revenues in 2007. The increase includes additional personnel and related costs of $2.3 million, primarily relating to new product introductions, and professional and GPO fees of $354,000 and other expenses of $194,000.
General and administrative expenses amounted to $12.0 million, or 13% of revenues, in 2008, as compared to $10.1 million or 12% of revenues in 2007. This increase includes additional personnel and related costs of $1.43 million most of which is attributed to a significant investment in information technology staff needed to improve our business systems. In addition, our board compensation expense and corporate insurance increased in 2008 by $97,000 and other corporate expenses increased by $215,000 partially offset by a reduction in professional fees for audit and SOX 404 services of $100,000.
Research and development expense for the year ended 2008 amounted to $10.4 million and the year ended 2007 amounted to $10.2 million. The increase includes $1.3 million in personnel and related expenses, and an increase in clinical development related expenses of $290,000. These costs were partially offset by a reduction in iChem VELOCITY prototype and research materials totaling $503,000, a decrease in consultants, patent prosecution and other miscellaneous expenses, primarily related to the iChem VELOCITY development of $441,000 and cost reductions as a result of the shutdown of our Advanced Digital Imaging Research subsidiary of $380,000.
Interest income during 2008 amounted to $1.2 million, a $300,000 decrease over 2007 mainly due to a lower interest rate environment on our cash balances, and lower cash balances due to the use of cash to repurchase of our common stock during 2008.
Income tax expense during 2008 amounted to 33% of pre-tax income as compared to 27% during the prior year. The increase in the income tax provision resulted from a reduction in research and development tax credits.
36
Other income from non recurring manufacturing transition rights of $1.2 million during 2008 related to an agreement entered with IDEXX Operations, Inc. (IDEXX), in December 2008. This manufacturing, supply and transition agreement allows IDEXX to manufacture and distribute rotors compatible with the drives of IDEXX machines, and in exchange for the manufacturing transition rights, we received $1.5 million with an offset of $268,000 related to research and development cost associated with the manufacturing transition rights.
Contractual Obligations and Commercial Commitments
The following table aggregates our expected minimum contractual obligations and commitments subsequent to December 31, 2009:
| Contractual Obligations |
Total | Less than 1 year |
1-3 years |
3-5 years |
More than 5 years | ||||||||||
| (in thousands)* | |||||||||||||||
| Operating lease commitments |
$ | 6,312 | $ | 2,013 | $ | 2,149 | $ | 1,544 | $ | 606 | |||||
| * | Not included in the table above are normal recurring accounts payable or accrued expenses which are presented on the accompanying consolidated financial statements. |
Off-Balance Sheet Arrangements
At December 31, 2009 and 2008, we did not have any relationships with unconsolidated entities or financial partnerships, such as entities often referred to as structured finance or special purpose entities, which would have been established for the purpose of facilitating off-balance sheet arrangements or other contractually narrow or limited purposes. As such, we are not exposed to any financing, liquidity, market or credit risk that could arise if we had engaged in such relationships.
Liquidity and Capital Resources
Our primary source of liquidity is cash from operations, which depends heavily on sales of our IVD instruments, consumables and service, as well as sales of sample processing instruments and supplies. At December 31, 2009, our cash and cash equivalents amounted to $34.3 million compared to $24.4 million at December 31, 2008.
Adverse macro economic forces have been impacting our selling markets and the credit markets of our customers. Although the impact thus far has been relatively mild, we continue to face the following challenges: deferrals of purchases due to decreases in capital budgets of our customers, delays in the purchasing cycle due to greater scrutiny of deals and increased internal competition for limited capital dollars, and a significant increase in requests for quotes for operating leases. The aforementioned factors may lead to a decrease in revenue, an increase of deferred revenue, or could lead to installment cash collections that will affect our liquidity and capital resources.
Operating Cash Flows. Cash provided by operations for the year ended December 31, 2009 decreased to $12.1 million compared to cash provided by operations of $13.4 million during the prior year. In addition to the decrease in net income of $2.8 million, we experienced a $5.3 million decrease in accounts payable and accrued expenses, a $1.8 million increase in investment in sales-type leases and a $838,000 increase in inventories, which contributed to the reduced cash flow when compared to the prior year. Offsetting these reductions in cash flow were non-cash items consisting of higher depreciation and amortization of $398,000, stock-based compensation expense of $1.3 million, and tax benefits from stock options exercises of $344,000. In addition, we experienced a $6.7 million reduction in accounts receivable and a $3.2 million reduction in prepaid expenses and other current assets primarily due to a nonrecurring $1.5 million payment from IDEXX Labs, Inc. under the December 31, 2008 manufacturing, supply and transition agreement as compared to the prior year period.
37
The number of days sales in accounts receivable decreased to 70 days at the end of 2009 compared to 77 days for the prior year end. The number of days sales in accounts receivable varies and extends due to extended payment terms for our international customers and the granting of an increased volume of extended payment terms for certain customers of our instrument sales and instrument, consumables and service mix.
Our cash flow has been favorably affected by tax credit carryforwards. As of December 31, 2009, we had federal and state tax credit carryforwards of approximately $2.2 million and $3.1 million, respectively. We continue to realize tax deductions from the exercise of certain stock options. During the year ended December 31, 2009, we realized tax deductions of approximately $707,000 relating to this item. During the year ended December 31, 2009, we paid federal and state taxes of $1.9 million and $869,000, respectively.
Investing Activities. Cash used in investing activities totaled $1.6 million in 2009, a $5.0 million decrease from the prior year period primarily as a result of the sale of short-term marketable securities of $2.2 million, offset by a $1.9 million reduction in purchases of short-term marketable securities, a decrease in the purchase of property and equipment of $683,000, and a reduction in the capitalization of software development costs of $341,000 as compared to the prior year period.
Financing Activities. Cash used in financing activities totaled $813,000 during the year ended December 31, 2009, an $9.8 million decrease from the prior year period primarily as a result of the reduction in the repurchase of common stock for retirement amounting to $10.5 million, partially offset by a reduction in tax deduction benefits from the exercise of stock option of $344,000 and a $362,000 reduction in the issuance of common stock over the prior year.
We currently have a credit facility with a commercial bank consisting of a $6.5 million revolving line of credit for working capital and a $10.0 million line of credit for acquisitions and product opportunities. The credit facility has variable interest rates, which will change from time to time based on changes to either the LIBOR rate or the lender’s prime rate. As of December 31, 2009, there were no borrowings under the new credit facility. We are subject to certain financial and non-financial covenants under the credit facility with the bank and as of December 31, 2009, we were in compliance with these covenants.
In 2008, our board of directors authorized two stock repurchase plans, which resulted in our purchase of an aggregate of 983,579 shares of our common stock for approximately $11.9 million during 2008, and an additional 250,800 shares of our common stock for approximately $2.5 million during 2009.
On September 11, 2008, our Chief Executive Officer exercised a stock option to purchase an aggregate of 130,000 shares of common with an exercise price of $4.34 per share, on a net issue basis, in a transaction approved by the compensation committee of our board of directors. We issued 62,081 shares of common stock to our Chief Executive Officer, and retained 67,919 shares of common stock with an aggregate market value of $1,219,000 based on the last closing price of our common stock immediately prior to exercise of $17.95 per share. Of this amount, $564,000 was applied in payment of the aggregate exercise price of the stock options and $655,000 was applied in payment of payroll taxes arising from the option exercise. These options had a term expiring on November 18, 2008.
We believe that our current cash on hand, together with cash generated from operations and cash available under the credit facility with the bank will be sufficient to fund normal operations for the foreseeable future. However, additional funding may be required to fund expansion of our business. There is no assurance that such funding will be available on terms acceptable to us.
Recent Accounting Pronouncements
In October 2009, the FASB issued Accounting Standards Update (“ASU”) ASU 2009-14, Certain Revenue Arrangements That Include Software Elements, now codified under FASB ASC Topic 985, Software.
38
ASU 2009-14, removes tangible products from the scope of software revenue guidance and provides guidance on determining whether software deliverables in an arrangement that includes a tangible product are covered by the scope of the software revenue guidance. ASU 2009-14 is to be applied on a prospective basis for revenue arrangements entered into or materially modified in fiscal years beginning on or after June 15, 2010, with early adoption permitted. We are currently evaluating both the timing and the impact of the adoption of the ASU on our consolidated financial statements.
In October 2009, the FASB issued Accounting Standards Update (“ASU”) 2009-13, Multiple-Deliverable Revenue Arrangements, which amends ASC Topic 605, Revenue Recognition, to require companies to allocate revenue in multiple-element arrangements based on an element’s estimated selling price if vendor-specific or other third-party evidence of value is not available. ASU 2009-13 is effective beginning June 15, 2010. Earlier application is permitted. We are currently evaluating both the timing and the impact of the adoption of the ASU on our consolidated financial statements.
In June 2009, the FASB issued Accounting Standards Codification (“ASC”) Topic 105, The FASB Accounting Standard Codification and the Hierarchy of Generally Accepted Accounting Principle, establishes the source of authoritative U.S. generally accepted accounting principles (GAAP) recognized by the FASB to be applied by nongovernmental entities in the preparation of financial statements in accordance with GAAP. All existing accounting standard documents are superseded by the Codification and any accounting literature not included in the Codification will not be authoritative. However, rules and interpretive releases of the Securities and Exchange Commission (“SEC”) issued under the authority of federal securities laws will continue to be sources of authoritative GAAP for SEC registrants. ASC Topic 105 is effective for financial statements issued for interim and annual periods ending after September 15, 2009. Therefore, beginning with our quarter ended September 30, 2009, all references made by it to GAAP in its consolidated financial statements now use the new Codification numbering system. The Codification does not change or alter existing GAAP and, therefore, did not have any impact on our consolidated financial statements.
In June 2009, the FASB issued ASC Topic 810, Consolidation, which establishes how a company determines when an entity that is insufficiently capitalized or not controlled through voting should be consolidated. This statement improves financial reporting by enterprises involved with variable interest entities as a result of the elimination of the qualifying special-purpose entity concept in ASC Topic 860, Transfers and Servicing,. ASC Topic 810 is effective after November 15, 2009. The adoption of ASC Topic 810 did not have a material impact on our consolidated financial statements.
In June 2009, the FASB issued ASC Topic 860, Transfers and Servicing, which requires entities to provide more information about sales of securitized financial assets and similar transactions, particularly if the seller retains some risk to the assets. This statement will improve the relevance, representation faithfulness, and comparability of the information that a reporting entity provides in its financial statements about a transfer of financial assets. It will also take into account the effects of a transfer on its financial position, financial performance, and cash flows, and a transferor’s continuing involvement. ASC Topic 860 is effective after November 15, 2009. The adoption of ASC Topic 860 did not have a material impact on our consolidated financial statements.
In May 2009, the FASB issued ASC Topic 855, Subsequent Events, which sets forth the period after the balance sheet date during which management of an SEC filer should evaluate events or transactions that may occur for potential recognition or disclosure in the financial statements, the circumstances under which an entity should recognize events or transactions occurring after the balance sheet date in its financial statements, and disclosures that an entity should make about events or transactions that occurred after the balance sheet date. In February 2010, the FASB issued ASU 2010-09, Subsequent Events, which amends ASC Topic 855 so that an SEC filer entity is required to evaluate subsequent events through the date that the financial statements are issued. ASU 2010-09 also states that the SEC filer entity is not required to disclose the date through which subsequent events have been evaluated. ASC Topic 855 is effective for interim or annual financial periods ending after June 15, 2009, and shall be applied prospectively. The adoption of ASC Topic 855 did not have any impact on our consolidated financial statements.
39
In September 2006, the FASB issued ASC Topic 820, Fair Value Measurements and Disclosures, which establishes a framework for measuring fair value in accordance with generally accepted accounting principles, clarifies the definition of fair value within that framework and expands disclosures about fair value measurements. ASC Topic 820 applies whenever other standards require (or permit) assets or liabilities to be measured at fair value, except for the measurement of share-based payments. ASC Topic 820 was effective for the Company on January 1, 2008. In October 2008, the FASB issued FASB Staff Position (FSP) SFAS No. 157-3, Determining the Fair Value of a Financial Asset When the Market for That Asset Is Not Active, which clarifies the application of SFAS No. 157 in a market that is not active and provides guidance in key considerations in determining the fair value of a financial asset when the market for that financial asset is not active. FASB FSPs apply to financial assets within the scope of accounting pronouncements that require or permit fair value measurements in accordance with FASB No. 157. In April 2009, the FASB issued FASB Staff Position (FSP) SFAS No. 157-4, Determining the Fair Value When the Volume and Level of Activity for the Asset or Liability Have Significantly Decreased and Identifying Transactions That Are Not Orderly, which provides additional guidance for estimating fair value in accordance with SFAS No. 157, when the volume and level of activity for the asset or liability have significantly decreased. FSP No. 157-4 also provides guidance on identifying circumstances that indicate a transaction is not orderly. FSP SFAS No. 157-4 is effective for interim and periods ending after June 15, 2009, and shall be applied prospectively. The adoption of ASC Topic 820 for financial assets and liabilities did not have a material impact on our consolidated financial statements, other than presentation of the disclosures required by ASC Topic 825-10-50, Financial Instruments Disclosure. The adoption of ASC Topic 820 for nonfinancial assets and nonfinancial liabilities effective January 1, 2009 did not have a material impact on our consolidated financial statements.
In April 2009, the FASB issued ASC Topic 825-10-50, Financial Instruments Disclosure, which requires disclosures about fair value of financial instruments for interim reporting periods of publicly traded companies, as well as in annual financial statements. ASC Topic 825-10-50 also requires those disclosures in summarized financial information at interim reporting. ASC Topic 825-10-50 is effective for interim reporting periods ending after June 15, 2009. The adoption of ASC Topic 825-10-50 did not have a material impact on our consolidated financial statements.
In December 2007, the FASB issued ASC Topic 805, Business Combinations. The statement retains the purchase method of accounting for acquisitions, but requires a number of changes, including changes in the way assets and liabilities are recognized in the purchase accounting. It also changes the recognition of assets acquired and liabilities assumed arising from contingencies, requires the capitalization of in-process research and development at fair value, and requires the expensing of acquisition-related costs as incurred. ASC Topic 805 is effective for us beginning January 1, 2009, and will apply prospectively to business combinations completed on or after that date. ASC Topic 805 addresses issues raised by preparers, auditors and members of the legal profession on initial recognition and measurement, subsequent measurement and accounting, and disclosure of assets and liabilities arising from contingencies in a business combination. ASC Topic 805 is effective for assets or liabilities arising from contingencies in business combinations for which the acquisition date is on or after the beginning of the first reporting period beginning on or after December 15, 2008. The adoption of ASC Topic 805 did not have a material impact on our consolidated financial statements.
40
Item 7A. Quantitative and Qualitative Disclosures About Market Risk.
Market Risk
Our business is exposed to various market risks, including changes in interest rates and foreign currency exchange rates. Market risk is the potential loss arising from adverse changes in market rates and prices, such as interest rates and foreign currency exchange rates. We do not invest in derivatives, foreign currency forward contracts or other financial instruments for trading or speculative purposes. We had no debt at December 31, 2009, thus were not subject to market risk for changes in interest rates on debt obligations. We are subject to market risk for changes in interest rates on our short-term investment portfolio. We invest our excess cash in certificates of deposit and the market value of these investments fluctuate based on changes in interest rates.
Foreign Currencies
We conduct business in certain foreign markets, primarily in the European Union and Asia. Our primary exposure to foreign currency risk relates to investments in foreign subsidiaries that transact business in a functional currency other than the U.S. Dollar, primarily the Euro. We are subject to certain foreign currency risks in the importation of goods from Japan and as a result of commercial operations in Europe and Asia. Our purchases from a major Japanese IVD supplier are denominated in Japanese Yen. These components represent a significant portion of our material costs. All of our sales are denominated in U.S. Dollars with the exception of France, where sales are denominated in Euros. Fluctuations in the U.S. Dollar exchange rate for Japanese Yen and Euros could result in increased costs for our key components and increased costs for commercial operations in Europe.
To mitigate the potential impact of adverse fluctuations in the U.S. Dollar exchange rate for these currencies, we periodically purchase foreign currency forward contracts. During the year ended December 31, 2008, we entered into such contracts for Euros and Japanese Yen totaling $404,000 and $7.6 million, respectively. As of December 31, 2009, we do not have any remaining foreign currency forward contracts in Japanese Yen or Euros.
41
Item 8. Financial Statements and Supplementary Data.
42
Report of Independent Registered Public Accounting Firm
Board of Directors and Stockholders
of IRIS International, Inc.
Chatsworth, California
We have audited the accompanying consolidated balance sheets of IRIS International, Inc.’s (the “Company”) as of December 31, 2009 and 2008 and the related consolidated statements of income, stockholders’ equity, cash flows and other comprehensive income for each of the three years in the period ended December 31, 2009. These financial statements are the responsibility of the Company’s management. Our responsibility is to express an opinion on these financial statements based on our audits.
We conducted our audits in accordance with the standards of the Public Company Accounting Oversight Board (United States). Those standards require that we plan and perform the audit to obtain reasonable assurance about whether the financial statements are free of material misstatement. An audit includes examining, on a test basis, evidence supporting the amounts and disclosures in the financial statements, assessing the accounting principles used and significant estimates made by management, as well as evaluating the overall financial statement presentation. We believe that our audits provide a reasonable basis for our opinion.
In our opinion, the consolidated financial statements referred to above present fairly, in all material respects, the financial position of IRIS International, Inc. at December 31, 2009 and 2008, and the results of its operations and cash flows for each of the three years in the period ended December 31, 2009, in conformity with accounting principles generally accepted in the United States of America.
We also have audited, in accordance with the standards of the Public Company Accounting Oversight Board (United States), IRIS International Inc.’s internal control over financial reporting as of December 31, 2009, based on criteria established in Internal Control – Integrated Framework issued by the Committee of Sponsoring Organizations of the Treadway Commission (COSO) and our report dated March 15, 2010, expressed an unqualified opinion thereon.
/s/ BDO Seidman LLP
Los Angeles, California
March 15, 2010
43
Report of Independent Registered Public Accounting Firm
To the Board of Directors and Stockholders
of IRIS International, Inc.
Chatsworth, California
We have audited IRIS International, Inc.’s (the “Company”) internal control over financial reporting as of December 31, 2009, based on criteria established in Internal Control – Integrated Framework issued by the Committee of Sponsoring Organizations of the Treadway Commission (the COSO criteria). IRIS International, Inc.’s management is responsible for maintaining effective internal control over financial reporting and for its assessment of the effectiveness of internal control over financial reporting, included in the accompanying “Item 9A, Management’s Report on Internal Control over Financial Reporting”. Our responsibility is to express an opinion on the company’s internal control over financial reporting based on our audit.
We conducted our audit in accordance with the standards of the Public Company Accounting Oversight Board (United States). Those standards require that we plan and perform the audit to obtain reasonable assurance about whether effective internal control over financial reporting was maintained in all material respects. Our audit included obtaining an understanding of internal control over financial reporting, assessing the risk that a material weakness exists, and testing and evaluating the design and operating effectiveness of internal control based on the assessed risk. Our audit also included performing such other procedures as we considered necessary in the circumstances. We believe that our audit provides a reasonable basis for our opinion.
A company’s internal control over financial reporting is a process designed to provide reasonable assurance regarding the reliability of financial reporting and the preparation of financial statements for external purposes in accordance with generally accepted accounting principles. A company’s internal control over financial reporting includes those policies and procedures that (1) pertain to the maintenance of records that, in reasonable detail, accurately and fairly reflect the transactions and dispositions of the assets of the company; (2) provide reasonable assurance that transactions are recorded as necessary to permit preparation of financial statements in accordance with generally accepted accounting principles, and that receipts and expenditures of the company are being made only in accordance with authorizations of management and directors of the company; and (3) provide reasonable assurance regarding prevention or timely detection of unauthorized acquisition, use, or disposition of the company’s assets that could have a material effect on the financial statements.
Because of its inherent limitations, internal control over financial reporting may not prevent or detect misstatements. Also, projections of any evaluation of effectiveness to future periods are subject to the risk that controls may become inadequate because of changes in conditions, or that the degree of compliance with the policies or procedures may deteriorate.
In our opinion, the Company maintained, in all material respects, effective internal control over financial reporting as of December 31, 2009, based on the COSO criteria.
We also have audited, in accordance with the standards of the Public Company Accounting Oversight Board (United States), the consolidated balance sheets of IRIS International Inc. as of December 31, 2009 and 2008, and the related consolidated statements of income, stockholders’ equity, cash flows and other comprehensive income for each of the three years in the period ended December 31, 2009 and our report dated March 15, 2010 expressed an unqualified opinion thereon.
/s/ BDO Seidman LLP
Los Angeles, California
March 15, 2010
44
CONSOLIDATED BALANCE SHEETS
(In thousands)
| At December 31, | ||||||||
| 2009 | 2008 | |||||||
| Assets |
||||||||
| Current assets: |
||||||||
| Cash and cash equivalents |
$ | 34,253 | $ | 24,445 | ||||
| Short-term investments in marketable securities |
— | 2,157 | ||||||
| Accounts receivable, net of allowance for doubtful accounts and sales returns of $391 and $445 at December 31, 2009 and 2008, respectively |
17,715 | 20,261 | ||||||
| Inventories |
10,866 | 9,957 | ||||||
| Prepaid expenses and other current assets |
1,045 | 2,512 | ||||||
| Investment in sales-type leases, current portion |
3,397 | 3,204 | ||||||
| Deferred tax asset |
4,238 | 3,727 | ||||||
| Total current assets |
71,514 | 66,263 | ||||||
| Property and equipment, net of accumulated depreciation of $11,713 and $8,923 at December 31, 2009 and 2008, respectively |
9,667 | 9,678 | ||||||
| Goodwill |
2,450 | 2,450 | ||||||
| Core technology, net of accumulated amortization of $336 and $254 at December 31, 2009 and 2008, respectively |
1,454 | 1,544 | ||||||
| Software development costs, net of accumulated amortization of $3,365 and $2,773 at December 31, 2009 and 2008, respectively |
2,534 | 2,291 | ||||||
| Deferred tax asset |
1,898 | 1,811 | ||||||
| Investment in sales-type leases, non-current portion |
7,441 | 5,957 | ||||||
| Other assets |
832 | 644 | ||||||
| Total assets |
$ | 97,790 | $ | 90,638 | ||||
| Liabilities and Stockholders’ Equity |
||||||||
| Current liabilities: |
||||||||
| Accounts payable |
$ | 4,479 | $ | 6,299 | ||||
| Accrued expenses |
5,761 | 6,475 | ||||||
| Deferred service contract revenue, current portion |
2,286 | 1,936 | ||||||
| Total current liabilities |
12,526 | 14,710 | ||||||
| Deferred service contract revenue, non-current portion |
42 | 18 | ||||||
| Total liabilities |
12,568 | 14,728 | ||||||
| Commitments and contingencies |
||||||||
| Stockholders’ equity: |
||||||||
| Common stock, $0.01 par value |
||||||||
| Authorized: 50 million shares; Issued and outstanding: 18,147 shares and 18,036 shares at December 31, 2009 and 2008, respectively |
181 | 180 | ||||||
| Preferred Stock, $0.01 par value; Authorized 1.0 million shares: |
||||||||
| Callable Series C shares issued and outstanding: none |
— | — | ||||||
| Additional paid-in capital |
87,692 | 83,646 | ||||||
| Other comprehensive income |
560 | 415 | ||||||
| Accumulated deficit |
(3,211 | ) | (8,331 | ) | ||||
| Total stockholders’ equity |
85,222 | 75,910 | ||||||
| Total liabilities and stockholders’ equity |
$ | 97,790 | $ | 90,638 | ||||
The accompanying notes are an integral part of these consolidated financial statements.
45
CONSOLIDATED STATEMENTS OF INCOME
(In thousands, except per share data)
| For the Years ended December 31, |
||||||||||||
| 2009 | 2008 | 2007 | ||||||||||
| Sales of IVD instruments |
$ | 26,018 | $ | 35,128 | $ | 33,492 | ||||||
| Sales of IVD consumables and service |
52,213 | 46,643 | 38,533 | |||||||||
| Sales of sample processing instruments and supplies |
14,335 | 13,731 | 12,281 | |||||||||
| Total revenues |
92,566 | 95,502 | 84,306 | |||||||||
| Cost of goods – IVD instruments |
16,778 | 19,605 | 17,949 | |||||||||
| Cost of goods – IVD consumables and service |
20,158 | 19,995 | 17,860 | |||||||||
| Cost of goods – sample processing instruments and supplies |
6,965 | 6,863 | 6,143 | |||||||||
| Total cost of goods sold |
43,901 | 46,463 | 41,952 | |||||||||
| Gross profit |
48,665 | 49,039 | 42,354 | |||||||||
| Marketing and selling |
16,122 | 15,706 | 13,041 | |||||||||
| General and administrative |
13,321 | 12,009 | 10,134 | |||||||||
| Research and development, net |
11,411 | 10,357 | 10,226 | |||||||||
| Total operating expenses |
40,854 | 38,072 | 33,401 | |||||||||
| Operating income |
7,811 | 10,967 | 8,953 | |||||||||
| Other income (expense): |
||||||||||||
| Interest income |
857 | 1,180 | 1,498 | |||||||||
| Interest expense |
(21 | ) | (11 | ) | (10 | ) | ||||||
| Manufacturing transition rights |
— | 1,232 | — | |||||||||
| Other income (expense) |
58 | 8 | (48 | ) | ||||||||
| Income before provision for income taxes |
8,705 | 13,376 | 10,393 | |||||||||
| Provision for income taxes |
2,454 | 4,363 | 2,844 | |||||||||
| Net income |
$ | 6,251 | $ | 9,013 | $ | 7,549 | ||||||
| Net income per share – basic |
$ | 0.35 | $ | 0.49 | $ | 0.42 | ||||||
| Net income per share – diluted |
$ | 0.35 | $ | 0.48 | $ | 0.40 | ||||||
| Weighted average common shares outstanding – basic |
17,727 | 18,246 | 18,187 | |||||||||
| Weighted average common shares outstanding – diluted |
17,874 | 18,728 | 18,749 | |||||||||
The accompanying notes are an integral part of these consolidated financial statements.
46
CONSOLIDATED STATEMENTS OF STOCKHOLDERS’ EQUITY
(In thousands)
| Common Stock | Additional Paid-In Capital |
Accumulated Other Comprehensive Income |
Accumulated Deficit |
Total | ||||||||||||||||||
| Shares | Amount | |||||||||||||||||||||
| Balance, January 1, 2007 |
18,046 | $ | 180 | $ | 79,226 | $ | 48 | $ | (16,888 | ) | $ | 62,566 | ||||||||||
| Cumulative effect of accounting change – adjustment to retained earnings upon adoption of ASC 740-10 |
— | — | — | — | (547 | ) | (547 | ) | ||||||||||||||
| Common stock issued on exercise of options |
437 | 4 | 2,068 | — | — | 2,072 | ||||||||||||||||
| Tax benefit from stock option exercises |
— | — | 1,496 | — | — | 1,496 | ||||||||||||||||
| Restricted stock grants to employees |
64 | 1 | (1 | ) | — | — | — | |||||||||||||||
| Common stock issued under employee stock purchase plan for cash |
2 | — | 26 | — | — | 26 | ||||||||||||||||
| Stock issued in acquisition of business |
52 | 1 | — | — | — | 1 | ||||||||||||||||
| Translation adjustment, net of tax |
— | — | — | 297 | — | 297 | ||||||||||||||||
| Stock based compensation expense |
— | — | 1,474 | — | — | 1,474 | ||||||||||||||||
| Net income for year |
— | — | — | — | 7,549 | 7,549 | ||||||||||||||||
| Balance, December 31, 2007 |
18,601 | 186 | 84,289 | 345 | (9,886 | ) | 74,934 | |||||||||||||||
| Common stock issued on exercise of options |
369 | 4 | 1,808 | — | — | 1,812 | ||||||||||||||||
| Restricted stock grants to employees |
119 | 1 | (1 | ) | — | — | — | |||||||||||||||
| Tax benefit from stock option exercises |
— | — | 760 | — | — | 760 | ||||||||||||||||
| Translation adjustment, net of tax |
— | — | — | 70 | 70 | |||||||||||||||||
| Stock based compensation expense |
— | — | 2,467 | — | 2,467 | |||||||||||||||||
| Purchase of common stock for retirement |
(1,053 | ) | (11 | ) | (5,677 | ) | (7,458 | ) | (13,146 | ) | ||||||||||||
| Net income for year |
— | — | — | — | 9,013 | 9,013 | ||||||||||||||||
| Balance, December 31, 2008 |
18,036 | $ | 180 | $ | 83,646 | $ | 415 | $ | (8,331 | ) | $ | 75,910 | ||||||||||
47
IRIS INTERNATIONAL, INC.
CONSOLIDATED STATEMENTS OF STOCKHOLDERS’ EQUITY (continued)
(In thousands)
| Common Stock | Additional Paid-In Capital |
Accumulated Other Comprehensive Income |
Accumulated Deficit |
Total | |||||||||||||||||||
| Shares | Amount | ||||||||||||||||||||||
| Balance, December 31, 2008 |
18,036 | $ | 180 | $ | 83,646 | $ | 415 | $ | (8,331 | ) | $ | 75,910 | |||||||||||
| Common stock issued on exercise of options |
221 | 2 | 1,448 | — | — | 1,450 | |||||||||||||||||
| Restricted stock grants to employees |
167 | 2 | (2 | ) | — | — | — | ||||||||||||||||
| Tax benefit from stock option exercises |
— | — | 416 | — | — | 416 | |||||||||||||||||
| Translation adjustment, net of tax |
— | — | — | 145 | — | 145 | |||||||||||||||||
| Stock based compensation expense |
— | — | 3,729 | — | — | 3,729 | |||||||||||||||||
| Purchase of common stock for retirement |
(277 | ) | (3 | ) | (1,545 | ) | — | (1,131 | ) | (2,679 | ) | ||||||||||||
| Net income for year |
— | — | — | — | 6,251 | 6,251 | |||||||||||||||||
| Balance, December 31, 2009 |
$ | 18,147 | $ | 181 | $ | 87,692 | $ | 560 | $ | (3,211 | ) | $ | 85,222 | ||||||||||
The accompanying notes are an integral part of these consolidated financial statements
48
CONSOLIDATED STATEMENTS OF CASH FLOWS
(In thousands)
| For the Year ended December 31, |
||||||||||||
| 2009 | 2008 | 2007 | ||||||||||
| Cash flows from operating activities: |
||||||||||||
| Net income |
$ | 6,251 | $ | 9,013 | $ | 7,549 | ||||||
| Adjustments to reconcile net income to net cash provided by operating activities: |
||||||||||||
| Loss on disposal of fixed assets |
74 | 185 | — | |||||||||
| Deferred taxes |
(182 | ) | 2,158 | 2,394 | ||||||||
| Tax benefit from stock option exercises |
(416 | ) | (760 | ) | (1,496 | ) | ||||||
| Depreciation and amortization |
3,523 | 3,127 | 2,621 | |||||||||
| Common stock and stock based compensation |
3,729 | 2,467 | 2,440 | |||||||||
| Changes in operating assets and liabilities: |
||||||||||||
| Accounts receivable |
2,546 | (4,186 | ) | (2,909 | ) | |||||||
| Inventories |
(909 | ) | (71 | ) | (2,528 | ) | ||||||
| Prepaid expenses and other assets |
1,280 | (1,890 | ) | (241 | ) | |||||||
| Investment in sales-type leases |
(1,677 | ) | 112 | (400 | ) | |||||||
| Accounts payable |
(1,820 | ) | 2,010 | 493 | ||||||||
| Accrued expenses |
(713 | ) | 762 | (701 | ) | |||||||
| Deferred service contract revenue |
373 | 500 | (86 | ) | ||||||||
| Net cash provided by operating activities |
12,059 | 13,427 | 7,136 | |||||||||
| Cash flows from investing activities: |
||||||||||||
| Acquisition of property and equipment |
(2,905 | ) | (3,588 | ) | (3,938 | ) | ||||||
| Software development costs capitalized |
(835 | ) | (1,178 | ) | (970 | ) | ||||||
| Purchase of short-term investments in marketable securities |
— | (1,857 | ) | (300 | ) | |||||||
| Sale of short-term investments in marketable securities |
2,157 | — | 132 | |||||||||
| Net cash used in investing activities |
(1,583 | ) | (6,623 | ) | (5,076 | ) | ||||||
| Cash flows from financing activities: |
||||||||||||
| Issuance of common stock and warrants for cash |
1,450 | 1,812 | 1,133 | |||||||||
| Repurchase of common stock |
(2,679 | ) | (13,146 | ) | — | |||||||
| Tax benefit from stock option exercises |
416 | 760 | 1,496 | |||||||||
| Net cash (used in) provided by financing activities |
(813 | ) | (10,574 | ) | 2,629 | |||||||
| Effect of exchange rate changes on cash and cash equivalents |
145 | 70 | 297 | |||||||||
| Net increase (decrease) in cash and cash equivalents |
9,808 | (3,700 | ) | 4,986 | ||||||||
| Cash and cash equivalents at beginning of year |
24,445 | 28,145 | 23,159 | |||||||||
| Cash and cash equivalents at end of year |
$ | 34,253 | $ | 24,445 | $ | 28,145 | ||||||
| Supplemental schedule of non-cash investing and financing activities: |
||||||||||||
| During the year ended December 31, 2009, the Company disposed of property and equipment with a cost and accumulated depreciation of $122,000 and $48,000, respectively. |
||||||||||||
| During the year ended December 31, 2008, the Company disposed of property and equipment with a cost and accumulated depreciation of $957,000 and $773,000, respectively. |
||||||||||||
| In September 2008, stock options for 130,000 shares of common stock were exercised pursuant to a net cashless exercise and therefore no cash was received, resulting in the issuance of 62,081 shares of common stock. |
||||||||||||
| Supplemental disclosure of cash flow information: |
||||||||||||
| Cash paid for income taxes |
$ | 2,729 | $ | 2,200 | $ | 948 | ||||||
| Cash paid for interest |
$ | 21 | $ | 11 | $ | 10 | ||||||
The accompanying notes are an integral part of these consolidated financial statements.
49
CONSOLIDATED STATEMENTS OF COMPREHENSIVE INCOME
(In thousands)
| For the Year ended December 31, | |||||||||
| 2009 | 2008 | 2007 | |||||||
| Net income |
$ | 6,251 | $ | 9,013 | $ | 7,549 | |||
| Foreign currency translation, net of tax |
145 | 70 | 297 | ||||||
| Comprehensive income |
$ | 6,396 | $ | 9,083 | $ | 7,846 | |||
The accompanying notes are an integral part of these consolidated financial statements.
50
NOTES TO CONSOLIDATED FINANCIAL STATEMENTS
1. Company History
IRIS International, Inc. was incorporated in California in 1979 and reincorporated during 1987 in Delaware. The Company designs, develops, manufactures and markets in vitro diagnostic (“IVD”) products, including IVD imaging systems based on patented and proprietary neural network-based Automated Particle Recognition (APR™) software to enable high-speed digital processing to classify and display images and describe the morphology of microscopic particles, urine chemistry analyzer and related chemistry test strips and accessories, molecular diagnostics assays based on our Nucleic Acid Detection Immuno-Assay (NADiA) technology, as well as special purpose centrifuges and other small instruments for automating microscopic procedures and DNA processing performed in clinical laboratories.
2. Summary of Significant Accounting Policies
Use of Estimates
The preparation of financial statements in conformity with accounting principles generally accepted in the United States of America requires management to make estimates and assumptions that affect the reported amounts of assets and liabilities and disclosure of contingent assets and liabilities at the date of the financial statements and the reported amounts of revenues and expenses during the reporting periods. The significant estimates in the preparation of the consolidated financial statements relate to the assessment of the carrying allowance for doubtful accounts, inventory reserves, the useful lives, fair value and recoverability of carrying value of long-lived and intangible assets, including goodwill, unearned income on sales-type-leases, estimated provisions for warranty costs, laboratory information system implementations, currency hedges for foreign purchases and deferred tax assets. Actual results and outcomes may differ from management’s estimates and assumptions.
Principles of Consolidation
The Company’s consolidated financial statements include the accounts of IRIS International, Inc. and its wholly-owned subsidiaries. Inter-company accounts and transactions have been eliminated in the consolidated financial statements.
Cash Equivalents
The Company considers highly liquid investments with maturities of three months or less from the date of purchase to be cash equivalents. These investments are carried at cost, which approximates fair value.
Investments in Marketable Securities
In 2008, the Company adopted FASB ASC Topic 820, “Fair Value Measurement and Disclosures” (“ASC 820”), for assets and liabilities measured at fair value on a recurring basis. ASC 820 defines fair values as the price that would be received to sell an asset or paid to transfer a liability in an orderly transaction between market participants at the measurement date. ASC 820 establishes a fair value hierarchy, which prioritizes the inputs used in measuring fair value into three broad levels as follows:
| • | Level 1 inputs are quoted prices (unadjusted) in active markets for identical assets or liabilities that the reporting entity has the ability to access at the measurement date. |
| • | Level 2 inputs include quoted prices for similar assets or liabilities in active markets, quoted prices for identical or similar assets or liabilities in markets that are not active, inputs other than quoted prices that are observable for the asset or liability and inputs that are derived principally from or corroborated by observable market data by correlation or other means. |
| • | Level 3 inputs are unobservable inputs for the asset or liability |
51
IRIS INTERNATIONAL, INC.
NOTES TO CONSOLIDATED FINANCIAL STATEMENTS—(Continued)
Accounts Receivable
The Company sells predominantly to entities in the health care industry. The Company grants uncollateralized credit to customers, primarily hospitals, clinical and research laboratories, and distributors. The Company performs ongoing credit evaluations of customers’ financial conditions before granting uncollateralized credit. Although the Company generally does not require collateral, letters of credit may be required from its customers in certain circumstances. No single customer accounts for 10% or more of the Company’s consolidated revenues or 10% or more of the Company’s accounts receivable at the balance sheet date.
Accounts receivable are carried at original invoice amount less allowances made for sales markdowns, returns and doubtful accounts. Accounts receivables are customer obligations due under normal trade terms. Despite the Company’s stated trade terms, several customers are subject to reimbursement delays attributed to government and third party payer compliance and regulation issues. Management determines the allowance for doubtful accounts by identifying troubled accounts and by using historical experience applied to an aging of accounts. Receivables are written off when deemed uncollectible.
Inventories
Inventories are carried at the lower of cost or market on a first in, first out basis. Provision for potentially obsolete or slow-moving inventory is made based on management’s analysis of inventory levels and future sales forecasts. Other inventory that is considered excess inventory is fully reserved.
Property and Equipment
Property and equipment are recorded at cost, less accumulated depreciation and amortization. Depreciation is generally computed using the straight-line method over three to seven years, the estimated useful lives of the assets. Leasehold improvements are amortized over the lesser of their useful life or the remaining term of the lease.
Goodwill and Core Technology
The Company’s intangible assets consist of goodwill, which is not being amortized, and core technology, which is being amortized over its useful life of 20 years. All intangible assets are subject to impairment tests on an annual or periodic basis. Goodwill is evaluated in accordance with FASB ASC Topic 350, Intangibles – Goodwill and Other (“ASC 350”), based on various analyses, including a comparison of the carrying value of the reporting unit to its estimated fair value and discounted cash flows. The analysis necessarily involves significant management judgment to evaluate the capacity of an acquired business to perform within projections. Core technology is evaluated for impairment using the methodology set forth in FASB ASC Topic 360, Property, Plant and Equipment. Recoverability of these assets is assessed only when events have occurred that may give rise to a potential impairment. When a potential impairment has been identified, forecasted undiscounted net cash flows of the operations to which the asset relates are compared to the current carrying value of the long-lived assets present in that operation. If such cash flows are less than such carrying amounts, long-lived assets, including such intangibles, are written down to their respective fair values.
At December 31, 2009 and 2008, the Company had goodwill of approximately $2.5 million and core technology intangible assets of $1.5 million. During the years ended December 31, 2009 and 2008, no goodwill or other intangible asset impairment was recorded.
52
IRIS INTERNATIONAL, INC.
NOTES TO CONSOLIDATED FINANCIAL STATEMENTS—(Continued)
Amortization expense of the core technology intangible asset totaled $89,000, $90,000 and $89,000 for the years ended December 31, 2009, 2008 and 2007, respectively.
Software Development Costs
The Company capitalizes certain software development costs for new products and product enhancements once all planning, designing, coding and testing activities necessary to establish that the product can be produced to meet our design specifications are completed, and concludes capitalization when the product is ready for general release. Research and development costs relating to software development are expensed as incurred. Amortization of capitalized software development costs is provided on a product-by-product basis at the greater of the amount computed using (i) the ratio of current revenues for a product to the total of current and anticipated future revenues or (ii) the straight-line method over the remaining estimated economic life of the product up to five years.
Total software development costs capitalized totaled $835,000, $1,178,000 and $970,000 for the years ended December 31, 2009, 2008 and 2007, respectively. Amortization expense of software development costs totaled $592,000, $651,000 and $593,000 for the years ended December 31, 2009, 2008 and 2007, respectively.
Impairment of Long-Lived Assets
The Company will identify and record impairment losses for long-lived assets whenever events or changes in circumstances indicate that the carrying amount of an asset may not be recoverable. Recoverability of assets to be held and used is measured by a comparison of the carrying amount of an asset to future undiscounted net cash flows expected to be generated by the asset. If such assets are considered to be impaired, the impairment to be recognized is measured by the amount by which the carrying amount of the assets exceeds the fair value of the assets. Assets to be disposed of are reported at the lower of the carrying amount or fair value less costs to sell. There were no impairments of long-lived assets at December 31, 2009, 2008 and 2007.
Revenue recognition
For products, revenue is recognized when risk of loss transfers, when persuasive evidence of an arrangement exists, the price to the buyer is fixed and determinable and collectability is reasonably assured. When a customer enters into an operating-type lease agreement, hardware revenue is recognized on a straight-line basis over the life of the lease, while the cost of the leased equipment is carried in customer leased equipment within property, plant and equipment and amortized over its estimated useful life. Under a sales-type lease agreement, hardware revenue is generally recognized at the time of shipment based on the present value of the minimum lease payments with interest income recognized over the life of the lease using the interest method. Instrument costs under a sales-type lease agreement are recognized at the time of shipment. Service revenues on maintenance contracts are recognized ratably over the life of the service agreement or as service is performed, if not under a contract. For those instrument sales that include multiple deliverables, such as instruments, training, consumables and service, the Company allocated revenue based on the relative fair values of the individual component sold separately, as determined in accordance with FASB ASC Topic 605, Revenue Recognition.
The Company’s accounting for leases involves specific determinations under FASB ASC Topic 840 Leases (“ASC 840”), which often involve complex provisions and significant judgments. The four criteria of ASC 840 that the Company uses in the determination of a sales-type lease or operating-type lease are: (i) a review of the lease term to determine if it is equal to or greater than 75 percent of the economic life of the equipment; (ii) a review of the minimum lease payments to determine if they are equal to or greater than 90 percent of the fair
53
IRIS INTERNATIONAL, INC.
NOTES TO CONSOLIDATED FINANCIAL STATEMENTS—(Continued)
market value of the equipment; (iii) a determination of whether or not the lease transfers ownership to the lessee at the end of the lease term; and (iv) determination of whether or not the lease contains a bargain purchase option.
Additionally, before classifying a lease as a sales-type lease, the Company assesses whether collectability of the lease payments is reasonably assured and whether there are any significant uncertainties related to costs that the Company has yet to incur with respect to the lease. Generally, the Company’s leases that qualify as sales-type lease are non-cancelable leases with a term of 75 percent or more of the economic life of the equipment. Certain of the Company’s lease contracts are customized for larger customers and often result in complex terms and conditions that typically require judgment in applying the lease accounting criteria.
The economic life of the Company’s leased instrument and its fair value require significant accounting estimates and judgment. These estimates are based on the Company’s historical experience. The most objective measure of the economic life of the Company’s leased instrument is the original term of a lease, which is typically five years, since a majority of the instruments are returned by the lessee at or near the end of the lease term and there is not a significant after-market for our used instruments without substantial remanufacturing. The Company believes that this is representative of the period during which the instrument is expected to be economically usable, with normal service, for the purpose for which it is intended. The Company regularly evaluates the economic life of existing and new products for purposes of this determination.
The fair value of the Company’s leased instruments is determined by a range of cash selling prices which the Company deemed to be verifiable objective evidence. The Company regularly evaluates available objective evidence of instrument fair values using historical data.
The Company has certain government contracts with cancellation clauses or renewal provisions that are generally required by law, such as: (i) those dependant on fiscal funding outside of a governmental unit’s control; (ii) those that can be cancelled if deemed in the tax payers’ best interest; or (iii) those that must be renewed each fiscal year, given limitations that may exist on multi-year contracts that are imposed by statute. Under these circumstances and in accordance with the relevant accounting literature, as well as considering the Company’s historical experience, a thorough evaluation of these contracts is performed to assess whether cancellation is remote or whether exercise of the renewal option is reasonably assured.
The Company recognizes revenues from service contracts ratably over the term of the service period, which typically ranges from twelve to sixty months. Payments for service contracts are generally received in advance. Deferred revenue represents the revenues to be recognized over the remaining term of the service contracts.
Shipping and Handling Costs
The Company records shipping and handling costs billed to customers as a component of revenue. Costs to distribute products to customers, including inbound and outbound freight, and other shipping and handling activities are included in cost of goods sold in accordance with FASB ASC Topic 605-45-45-20, Revenue Recognition – Shipping and Handling Fees and Costs.
Total shipping and handling costs included as a component of revenue for the years ended December 31, 2009, 2008 and 2007 amounted to approximately $707,000, $964,000 and $1,453,000, respectively. Total shipping and handling costs included as a component of cost of sales amounted to $1,871,000, $2,343,000 and $2,310,000 for years ended December 31, 2009, 2008 and 2007, respectively.
54
IRIS INTERNATIONAL, INC.
NOTES TO CONSOLIDATED FINANCIAL STATEMENTS—(Continued)
Warranties
The Company recognizes warranty expense, based on management’s estimate of expected cost, as an accrued liability at the time of sale. The Company regularly reevaluates its estimates to assess the adequacy of the recorded warranty liabilities and adjust the amounts as necessary. Warranty expense was approximately $1,137,000, $921,000 and $1,262,000 during the years ended December 31, 2009, 2008 and 2007, respectively.
Advertising Expenditures
Advertising costs are charged to expense as incurred. Advertising expense for the years ended December 31, 2009, 2008 and 2007 amounted to $244,000, $234,000 and $264,000, respectively.
Research and Development Expenditures
Except for certain software development costs capitalized as described above, research and development expenditures are charged to operations as incurred. Net research and development expense includes total research and development costs incurred, including costs incurred under research and development grants and contracts, less costs reimbursed under research and development contracts.
From time to time the Company receives grants from agencies of the U.S. Government. The Company does not recognize any revenue from such grants since they are cost reimbursement grants whereby the Company submits requests for reimbursement for certain costs incurred. There are no ongoing obligations or requirements with respect to the grants received, the Company retains ownership of any intellectual property that results from the research and development, and the U.S. Government agency receives a right to use the results of the research for government projects. The Company received cost reimbursements of $85,000, $164,000 and $135,000 during the years ended December 31, 2009, 2008 and 2007, respectively.
Income Taxes
The Company accounts for income taxes in accordance with FASB ASC Topic 740-10, Income Taxes, (“ASC 740”) which requires recognition of deferred tax liabilities and assets for the expected future tax consequences of events that have been included in the financial statements or tax returns. Under this method, deferred tax liabilities and assets are determined based on the differences between the financial statement and the tax bases of assets and liabilities using enacted tax rates in effect for the year in which the differences are expected to reverse. Valuation allowances are established when necessary to reduce deferred tax assets to the amount expected to be realized. Income tax expense represents the tax payable for the period and the change during the period in deferred tax assets and liabilities.
The Company accounts for uncertain tax positions in accordance with ASC 740, which prescribes a recognition threshold and measurement attribute for financial statement recognition and measurement of a tax position taken or expected to be taken in a tax return and also provides guidance on various related matters such as derecognition, interest, penalties and disclosures required. The Company recognizes interest and penalties, if any, related to unrecognized tax benefits in income tax expense.
Foreign Currency Translation
The statements of operations of foreign operations are translated into U.S. dollars at rates of exchange in effect each month. The balance sheets of these operations are translated at period-end exchange rates, and the differences from historical exchange rates are reflected in stockholders’ equity as other comprehensive income (loss).
55
IRIS INTERNATIONAL, INC.
NOTES TO CONSOLIDATED FINANCIAL STATEMENTS—(Continued)
Fair Value of Financial Instruments
The carrying amounts of financial instruments including cash and cash equivalents, short term investments in marketable securities, accounts receivable, investment in sales-type leases, accounts payable, accrued expenses and deferred service contract revenues approximate fair value due to their short maturity. The carrying amount of our long-term liabilities also approximates fair value based on interest rates currently available to us for debt of similar terms and remaining maturities.
Earnings Per Share
The Company computes and presents earnings per share in accordance with FASB ASC Topic 260, Earnings Per Share. Basic earnings per share are computed by dividing net income or loss by the weighted average number of common shares outstanding. Diluted earnings per share is computed by dividing net income by the weighted average number of common shares and common stock equivalents outstanding, calculated on the treasury stock method for options and warrants using the average market prices during the period. The weighted average number of outstanding antidilutive common stock options and warrants excluded from the computation of diluted net income per common share for the years ended December 31, 2009, 2008 and 2007 were 1,479,000, 715,000 and 419,000, respectively. A reconciliation of the shares used in the calculation of basic and diluted earnings per common share is as follows:
| For the Years Ended December 31, | ||||||
| 2009 | 2008 | 2007 | ||||
| (In thousands) | ||||||
| Weighted average common shares outstanding – basic |
17,727 | 18,246 | 18,187 | |||
| Effect of dilutive securities |
||||||
| Stock options |
111 | 366 | 494 | |||
| Restricted common shares |
36 | 80 | 31 | |||
| Warrants |
— | 36 | 37 | |||
| Weighted average common shares outstanding – diluted |
17,874 | 18,728 | 18,749 | |||
Stock Based Compensation
The Company accounts for stock based compensation under FASB ASC Topic 718, Compensation – Stock Compensation (“ASC 718”) which requires compensation costs related to share-based transactions, including employee stock options, to be recognized in the financial statements based on fair value.
Due to the adoption of ASC 718, the Company’s results for the years ended December 31, 2009, 2008 and 2007 include share-based compensation expense totaling $3,729,000, $2,464,000 and $1,457,000, respectively. In addition the Company’s results include stock based compensation expense of $0, $3,000 and $17,000 relating to stock issuances under our Employee Stock Purchase Plan for the years ended December 31, 2009, 2008 and 2007, respectively. Accordingly, the Company’s stock based compensation expense totaled $3,729,000, $2,467,000 and $1,474,000 for the years ended December 31, 2009, 2008 and 2007, respectively. The total income tax benefit recognized in the income statement for stock based compensation arrangements amounted to $1,489,000, $987,000 and $590,000 for the years ended December 31, 2009, 2008, and 2007, respectively.
Foreign Currency Hedge
The Company conducts business in certain foreign markets, primarily in the European Union and Asia. To mitigate the potential impact of adverse fluctuations in the U.S. Dollar exchange rate for these currencies, the
56
IRIS INTERNATIONAL, INC.
NOTES TO CONSOLIDATED FINANCIAL STATEMENTS—(Continued)
Company periodically purchases foreign currency forward contracts. The Company does not speculate in these hedging instruments in order to profit from foreign currency exchanges; nor does it enter into trades for which there are no underlying exposures.
Under FASB ASC Topic 815, Accounting for Derivatives Instruments and Hedging Activities, the Company documents all relationships between hedging instruments and hedged items, as well as its risk management objective for undertaking these hedging transactions. This process includes relating the forward contracts that are designated as fair value or cash flow hedges to specific assets and liabilities on the balance sheet or to specific firm commitments or forecasted transactions. The Company also formally assesses, both at the inception of the hedge and on an ongoing basis, whether each derivative is highly effective in offsetting changes in fair values or cash flows of the hedged of the hedged items.
At December 31, 2009, the Company did not have any foreign currency forward contracts outstanding in Japanese Yen or Euros. During the year ended December 31, 2008, the Company entered into such contracts for Euros and Japanese Yen totaling $404,000 and $7.6 million, respectively. At December 31, 2008, the Company did not have any remaining foreign currency forward contracts in Japanese Yen or Euros. The contracts were to hedge purchases of product in those countries and the results of these forwards are included in cost of sales.
Segment Reporting
The Company determines and discloses industry segments in accordance with FASB ASC Topic 280: Segment Reporting (“ASC 280”) which uses a “management” approach for determining business segments. The management approach designates the internal organization that is used by management for making operating decisions and assessing performance as the source of the Company’s reportable segments. ASC 280 also requires disclosures about products and services, geographic areas, and major customers. See Note 18 – “Segment and Geographic Information”.
Reclassifications
The Company reclassified employee bonus expenses between cost of goods and operating expense categories in the consolidated statement of income to conform to the presentation used in the current year. The accompanying 2008 and 2007 consolidated statements of income contain these reclassification adjustments.
These reclassifications had no impact on the Company’s previously reported consolidated operating income, net income or basic or diluted earnings per share.
Certain Risks and Uncertainties
Financial instruments, which potentially expose the Company to concentration of credit risk, consist primarily of cash and cash equivalents, accounts receivable and investment in sales-type leases. Concentration of credit risk with respect to accounts receivable and investment in sales-type leases is mitigated by the Company’s performance of on-going credit evaluations of its customers and the Company maintains an allowance for doubtful accounts. Investments in sales-type leases are secured by the underlying instruments.
Approximately 1/3 of the Company’s cash is deposited in DDA accounts which are fully guaranteed by the Federal Deposit Insurance Corporation. This amount was $8.8M at December 31, 2009. The rest of the cash balances on deposit with banks are guaranteed by the Federal Deposit Insurance Corporation up to $250,000. The Company may be exposed to risk for the amount of funds held in one bank in excess of the insurance limit. In assessing the risk, the Company’s policy is to maintain cash balances with high quality financial institutions.
57
IRIS INTERNATIONAL, INC.
NOTES TO CONSOLIDATED FINANCIAL STATEMENTS—(Continued)
The Company derives most of its revenues from the sale of the urinalysis analyzers, and related supplies and services. Relatively modest declines in unit sales or gross margins could have a material adverse effect on the Company’s revenues and profits, respectively.
Certain of the Company’s components are obtained from outside vendors, and the loss or breakdown of the Company’s relationships with these outside vendors could subject us to substantial delays in the delivery of its products to its customers. Furthermore, certain key components of the Company’s instruments and certain consumables are manufactured by only one supplier. The Company’s inability to sell products to meet delivery schedules could have a material adverse effect on its reputation in the industry, as well as its financial condition and results of operation.
Recent Accounting Pronouncements
In October 2009, the FASB issued Accounting Standards Update (“ASU”) ASU 2009-14, Certain Revenue Arrangements That Include Software Elements, now codified under FASB ASC Topic 985, Software. ASU 2009-14, removes tangible products from the scope of software revenue guidance and provides guidance on determining whether software deliverables in an arrangement that includes a tangible product are covered by the scope of the software revenue guidance. ASU 2009-14 is to be applied on a prospective basis for revenue arrangements entered into or materially modified in fiscal years beginning on or after June 15, 2010, with early adoption permitted. We are currently evaluating both the timing and the impact of the adoption of the ASU on our consolidated financial statements.
In October 2009, the FASB issued Accounting Standards Update (“ASU”) 2009-13, Multiple-Deliverable Revenue Arrangements, which amends ASC Topic 605, Revenue Recognition, to require companies to allocate revenue in multiple-element arrangements based on an element’s estimated selling price if vendor-specific or other third-party evidence of value is not available. ASU 2009-13 is effective beginning June 15, 2010. Earlier application is permitted. We are currently evaluating both the timing and the impact of the adoption of the ASU on our consolidated financial statements.
In June 2009, the FASB issued Accounting Standards Codification (“ASC”) Topic 105, The FASB Accounting Standard Codification and the Hierarchy of Generally Accepted Accounting Principle, establishes the source of authoritative U.S. generally accepted accounting principles (GAAP) recognized by the FASB to be applied by nongovernmental entities in the preparation of financial statements in accordance with GAAP. All existing accounting standard documents are superseded by the Codification and any accounting literature not included in the Codification will not be authoritative. However, rules and interpretive releases of the Securities and Exchange Commission (“SEC”) issued under the authority of federal securities laws will continue to be sources of authoritative GAAP for SEC registrants. ASC Topic 105 is effective for financial statements issued for interim and annual periods ending after September 15, 2009. Therefore, beginning with our quarter ended September 30, 2009, all references made by it to GAAP in its consolidated financial statements now use the new Codification numbering system. The Codification does not change or alter existing GAAP and, therefore, did not have any impact on our consolidated financial statements.
In June 2009, the FASB issued ASC Topic 810, Consolidation, which establishes how a company determines when an entity that is insufficiently capitalized or not controlled through voting should be consolidated. This statement improves financial reporting by enterprises involved with variable interest entities as a result of the elimination of the qualifying special-purpose entity concept in ASC Topic 860, Transfers and Servicing,. ASC Topic 810 is effective after November 15, 2009. The adoption of ASC Topic 810 did not have a material impact on our consolidated financial statements.
58
IRIS INTERNATIONAL, INC.
NOTES TO CONSOLIDATED FINANCIAL STATEMENTS—(Continued)
In June 2009, the FASB issued ASC Topic 860, Transfers and Servicing, which requires entities to provide more information about sales of securitized financial assets and similar transactions, particularly if the seller retains some risk to the assets. This statement will improve the relevance, representation faithfulness, and comparability of the information that a reporting entity provides in its financial statements about a transfer of financial assets. It will also take into account the effects of a transfer on its financial position, financial performance, and cash flows, and a transferor’s continuing involvement. ASC Topic 860 is effective after November 15, 2009. The adoption of ASC Topic 860 did not have a material impact on our consolidated financial statements.
In May 2009, the FASB issued ASC Topic 855, Subsequent Events, which sets forth the period after the balance sheet date during which management of an SEC filer should evaluate events or transactions that may occur for potential recognition or disclosure in the financial statements, the circumstances under which an entity should recognize events or transactions occurring after the balance sheet date in its financial statements, and disclosures that an entity should make about events or transactions that occurred after the balance sheet date. In February 2010, the FASB issued ASU 2010-09, Subsequent Events, which amends ASC Topic 855 so that an SEC filer entity is required to evaluate subsequent events through the date that the financial statements are issued. ASU 2010-09 also states that the SEC filer entity is not required to disclose the date through which subsequent events have been evaluated. ASC Topic 855 is effective for interim or annual financial periods ending after June 15, 2009, and shall be applied prospectively. The adoption of ASC Topic 855 did not have any impact on our consolidated financial statements.
In September 2006, the FASB issued ASC Topic 820, Fair Value Measurements and Disclosures, which establishes a framework for measuring fair value in accordance with generally accepted accounting principles, clarifies the definition of fair value within that framework and expands disclosures about fair value measurements. ASC Topic 820 applies whenever other standards require (or permit) assets or liabilities to be measured at fair value, except for the measurement of share-based payments. ASC Topic 820 was effective for the Company on January 1, 2008. In October 2008, the FASB issued FASB Staff Position (FSP) SFAS No. 157-3, Determining the Fair Value of a Financial Asset When the Market for That Asset Is Not Active, which clarifies the application of SFAS No. 157 in a market that is not active and provides guidance in key considerations in determining the fair value of a financial asset when the market for that financial asset is not active. FASB FSPs apply to financial assets within the scope of accounting pronouncements that require or permit fair value measurements in accordance with FASB No. 157. In April 2009, the FASB issued FASB Staff Position (FSP) SFAS No. 157-4, Determining the Fair Value When the Volume and Level of Activity for the Asset or Liability Have Significantly Decreased and Identifying Transactions That Are Not Orderly, which provides additional guidance for estimating fair value in accordance with SFAS No. 157, when the volume and level of activity for the asset or liability have significantly decreased. FSP No. 157-4 also provides guidance on identifying circumstances that indicate a transaction is not orderly. FSP SFAS No. 157-4 is effective for interim and periods ending after June 15, 2009, and shall be applied prospectively. The adoption of ASC Topic 820 for financial assets and liabilities did not have a material impact on our consolidated financial statements, other than presentation of the disclosures required by ASC Topic 825-10-50, Financial Instruments Disclosure. The adoption of ASC Topic 820 for nonfinancial assets and nonfinancial liabilities effective January 1, 2009 did not have a material impact on our consolidated financial statements.
In April 2009, the FASB issued ASC Topic 825-10-50, Financial Instruments Disclosure, which requires disclosures about fair value of financial instruments for interim reporting periods of publicly traded companies, as well as in annual financial statements. ASC Topic 825-10-50 also requires those disclosures in summarized financial information at interim reporting. ASC Topic 825-10-50 is effective for interim reporting periods ending after June 15, 2009. The adoption of ASC Topic 825-10-50 did not have a material impact on our consolidated financial statements.
59
IRIS INTERNATIONAL, INC.
NOTES TO CONSOLIDATED FINANCIAL STATEMENTS—(Continued)
In December 2007, the FASB issued ASC Topic 805, Business Combinations. The statement retains the purchase method of accounting for acquisitions, but requires a number of changes, including changes in the way assets and liabilities are recognized in the purchase accounting. It also changes the recognition of assets acquired and liabilities assumed arising from contingencies, requires the capitalization of in-process research and development at fair value, and requires the expensing of acquisition-related costs as incurred. ASC Topic 805 is effective for us beginning July 1, 2009, and will apply prospectively to business combinations completed on or after that date. ASC Topic 805 addresses issues raised by preparers, auditors and members of the legal profession on initial recognition and measurement, subsequent measurement and accounting, and disclosure of assets and liabilities arising from contingencies in a business combination. ASC Topic 805 is effective for assets or liabilities arising from contingencies in business combinations for which the acquisition date is on or after the beginning of the first reporting period beginning on or after December 15, 2008. The adoption of ASC Topic 805 did not have a material impact on our consolidated financial statements.
3. Investments in Marketable Securities
In 2008, the Company adopted FASB ASC Topic 820, Fair Value Measurement (“ASC 820”), for assets and liabilities measured at fair value on a recurring basis. ASC 820, defines fair values as the price that would be received to sell an asset or paid to transfer a liability in an orderly transaction between market participants at the measurement date. ASC 820 establishes a fair value hierarchy, which prioritizes the inputs used in measuring fair value into three broad levels as follows:
| • | Level 1 inputs are quoted prices (unadjusted) in active markets for identical assets or liabilities that the reporting entity has the ability to access at the measurement date. |
| • | Level 2 inputs include quoted prices for similar assets or liabilities in active markets, quoted prices for identical or similar assets or liabilities in markets that are not active, inputs other than quoted prices that are observable for the asset or liability and inputs that are derived principally from or corroborated by observable market data by correlation or other means. |
| • | Level 3 inputs are unobservable inputs for the asset or liability |
At December 31, 2009, the Company did not hold any investments in marketable securities.
At December 31, 2008, the Company’s investments in marketable securities primarily included highly liquid government securities and an auction rate security. These securities were carried at cost which approximated fair value due to their highly liquid nature. Of the $2,157,000 carrying value of investments at December 31, 2008, and in accordance with the fair value hierarchy contained in ASC 820, $1,857,000 were valued using quoted prices in active markets for identical assets or liabilities (Level 1) and approximately $300,000 were valued using significant unobservable inputs (Level 3) such as current results, trends and future prospects, capital market conditions, and other economic factors.
The Company sold the investments in market securities during first quarter of 2009, and did not recognize a gain or loss in the transaction.
60
IRIS INTERNATIONAL, INC.
NOTES TO CONSOLIDATED FINANCIAL STATEMENTS—(Continued)
The following table presents the estimated fair value of the Company’s investment in marketable securities at December 31, 2008.
| Cost | Unrealized Gains |
Unrealized Losses |
Fair Value | |||||||||
| (In thousands) | ||||||||||||
| Auction rate security |
$ | 300 | $ | — | $ | — | $ | 300 | ||||
| Government securities |
1,857 | — | — | 1,857 | ||||||||
| $ | 2,157 | $ | — | $ | — | $ | 2,157 | |||||
For the years end December 31, 2009 and 2008, there were no impairment losses on the Company’s available for sale marketable securities. Based on the Company’s assessment of the credit quality of the underlying collateral and credit support available to each of the securities in which it invested, the Company believes that nothing other than temporary impairment had occurred, as the Company has the ability to hold these investments long enough to avoid realizing any significant loss.
4. Inventories
Inventories consist of the following:
| At December 31, | ||||||
| 2009 | 2008 | |||||
| (In thousands) | ||||||
| Finished goods |
$ | 2,595 | $ | 2,234 | ||
| Work-in-process |
214 | 270 | ||||
| Raw materials, parts and sub-assemblies |
8,057 | 7,453 | ||||
| Inventories |
$ | 10,866 | $ | 9,957 | ||
5. Properties and Equipment
Property and equipment consist of the following:
| At December 31, | ||||||||
| 2009 | 2008 | |||||||
| (In thousands) | ||||||||
| Machinery and equipment |
$ | 11,145 | $ | 9,002 | ||||
| Leasehold improvements |
6,385 | 6,003 | ||||||
| Tooling, dies and molds |
2,158 | 1,985 | ||||||
| Furniture and fixtures |
1,152 | 1,147 | ||||||
| Rental units |
540 | 459 | ||||||
| 21,380 | 18,597 | |||||||
| Less: accumulated depreciation and amortization |
(11,713 | ) | (8,918 | ) | ||||
| $ | 9,667 | $ | 9,678 | |||||
Depreciation and amortization expense for the years ended December 31, 2009, 2008 and 2007 was $2.8 million, $2.4 million, and $1.9 million, respectively.
61
IRIS INTERNATIONAL, INC.
NOTES TO CONSOLIDATED FINANCIAL STATEMENTS—(Continued)
6. Sales-type Leases
The components of net investment in sales-type leases consist of the following:
| At December 31, | ||||||||
| 2009 | 2008 | |||||||
| (In thousands) | ||||||||
| Total minimum lease payments |
$ | 12,735 | $ | 10,380 | ||||
| Less: unearned income |
(1,897 | ) | (1,219 | ) | ||||
| Net investment in sales-type leases |
10,838 | 9,161 | ||||||
| Less: current portion |
(3,397 | ) | (3,204 | ) | ||||
| Net investment in sales-type leases, non-current portion |
$ | 7,441 | $ | 5,957 | ||||
Future minimum lease payments due from customers under sales-type leases for each of the five succeeding years:
| (In thousands) | |||
| Year Ending December 31, |
|||
| 2010 |
$ | 3,397 | |
| 2011 |
2,573 | ||
| 2012 |
2,089 | ||
| 2013 |
1,566 | ||
| 2014 |
1,046 | ||
| Thereafter |
167 | ||
| $ | 10,838 | ||
7. Bank Credit Facility
The Company has a credit facility with a commercial bank. The credit facility consists of a $6.5 million revolving line of credit for working capital and a $10.0 million line of credit for acquisitions and product opportunities. The credit facility has variable interest rates, which will change from time to time based on changes to either the LIBOR rate or the lender’s prime rate. Borrowings under the credit facility are secured by all of the Company’s assets and mature in June 2010 and June 2015, respectively.
As of December 31, 2009 and 2008, there were no borrowings under the credit facility. However, the Company is subject to certain financial and non financial covenants under the credit facility with the bank and as of December 31, 2009, the Company was in compliance with these covenants.
62
IRIS INTERNATIONAL, INC.
NOTES TO CONSOLIDATED FINANCIAL STATEMENTS—(Continued)
8. Accrued Expenses
Accrued expenses consist of the following:
| At December 31, | ||||||
| 2009 | 2008 | |||||
| (In thousands) | ||||||
| Accrued bonuses |
$ | 197 | $ | 1,460 | ||
| Accrued commissions |
607 | 490 | ||||
| Accrued payroll |
1,334 | 1,034 | ||||
| Accrued vacation |
1,234 | 1,080 | ||||
| Accrued professional fees |
416 | 502 | ||||
| Accrued warranty |
946 | 808 | ||||
| Accrued laboratory information system implementations |
335 | 614 | ||||
| Accrued – other |
692 | 487 | ||||
| $ | 5,761 | $ | 6,475 | |||
Changes in accrued warranty were as follows:
| At December 31, | ||||||||
| 2009 | 2008 | |||||||
| (In thousands) | ||||||||
| Balance – beginning of year |
$ | 808 | $ | 800 | ||||
| Additions for provisions during year |
1,137 | 921 | ||||||
| Reductions during year |
(999 | ) | (913 | ) | ||||
| Balance – end of year |
$ | 946 | $ | 808 | ||||
9. Income Taxes
The provision for income taxes from operations consists of the following:
| For the Years Ended December 31, |
||||||||||||
| 2009 | 2008 | 2007 | ||||||||||
| (In thousands) | ||||||||||||
| Current: |
||||||||||||
| Federal |
$ | 1,879 | $ | 2,323 | $ | 1,399 | ||||||
| State |
757 | 644 | 488 | |||||||||
| 2,636 | 2,967 | 1,887 | ||||||||||
| Deferred: |
||||||||||||
| Federal |
364 | 1,182 | 1,514 | |||||||||
| Foreign |
(32 | ) | (55 | ) | (11 | ) | ||||||
| State |
(514 | ) | 269 | (546 | ) | |||||||
| (182 | ) | 1,396 | 957 | |||||||||
| $ | 2,454 | $ | 4,363 | $ | 2,844 | |||||||
63
IRIS INTERNATIONAL, INC.
NOTES TO CONSOLIDATED FINANCIAL STATEMENTS—(Continued)
Income taxes have been based on the following components of pre-tax income (loss):
| For the Years Ended December 31, |
||||||||||||
| 2009 | 2008 | 2007 | ||||||||||
| (In thousands) | ||||||||||||
| Domestic |
$ | 8,821 | $ | 13,557 | $ | 10,428 | ||||||
| Foreign |
(116 | ) | (181 | ) | (35 | ) | ||||||
| $ | 8,705 | $ | 13,376 | $ | 10,393 | |||||||
The provision for income taxes differs from the amount obtained by applying the federal statutory income tax rate to income before provision for income taxes as follows:
| For the Years Ended December 31, |
||||||||||||
| 2009 | 2008 | 2007 | ||||||||||
| (In thousands) | ||||||||||||
| Tax provision computed at Federal statutory rate |
$ | 2,960 | $ | 4,549 | $ | 3,533 | ||||||
| State taxes, net of federal benefit |
544 | 499 | 402 | |||||||||
| R&D tax credits |
(258 | ) | (507 | ) | (677 | ) | ||||||
| Nondeductible expenses |
220 | (130 | ) | 151 | ||||||||
| Change in valuation allowance |
(269 | ) | (260 | ) | (654 | ) | ||||||
| Foreign branch losses |
(32 | ) | (55 | ) | (11 | ) | ||||||
| Prior year return to provision adjustment |
(772 | ) | — | — | ||||||||
| Other |
61 | 267 | 100 | |||||||||
| $ | 2,454 | $ | 4,363 | $ | 2,844 | |||||||
At December 31, 2009, the Company has tax effected foreign net operating loss carryforwards of approximately $849,000. The Company also has tax credit carryforwards of $2.2 million for federal and $3.0 million for state purposes, net of valuation allowances.
The primary components of temporary differences, which give rise to the Company’s net deferred tax asset at December 31, 2009 and 2008, are as follows:
| At December 31, | ||||||||
| 2009 | 2008 | |||||||
| (In thousands) | ||||||||
| Depreciation and amortization |
$ | (998 | ) | $ | (818 | ) | ||
| Allowance for doubtful accounts |
166 | 176 | ||||||
| Accrued liabilities |
1,569 | 1,726 | ||||||
| Stock compensation |
1,449 | 474 | ||||||
| Deferred revenue-service contracts |
189 | 14 | ||||||
| Net operating loss carryforward |
1,264 | 1,232 | ||||||
| Tax credits |
3,585 | 3,931 | ||||||
| Valuation allowance |
(335 | ) | (596 | ) | ||||
| State deferred taxes |
(753 | ) | (601 | ) | ||||
| $ | 6,136 | $ | 5,538 | |||||
64
IRIS INTERNATIONAL, INC.
NOTES TO CONSOLIDATED FINANCIAL STATEMENTS—(Continued)
Realization of deferred tax assets associated with foreign net operating losses (“NOL”) and tax credit carryforwards is dependent upon the Company’s ability to generate sufficient taxable income prior to their expiration. Management believes it is more likely than not that the deferred tax assets will be realized through future taxable income or alternative tax strategies. However, the net deferred tax assets could be reduced in the near term if management’s estimates of taxable income during the carryforward period are not realized or are significantly reduced or alternative tax strategies are not available. However, the Company has established a valuation allowance for foreign losses based on its estimate of future utilization. The Company will continue to review estimates of taxable income and will adjust the valuation allowance, when necessary.
The Company adopted the provisions of FASB ASC Topic 740-10, Income Taxes, which requires that the Company recognize the impact of a tax position in its financial statements if that position is more likely than not of being sustained upon audit, based on the technical merits of the position. The Company’s consolidated financial statements for 2007 reflect the impact of ASC 740-10, but the consolidated financial statements for 2006 have not been restated to reflect, and do not include, the impact of ASC 740-10.
As a result of the initial adoption of ASC 740-10, the Company recognized a $547,000 reduction in its deferred tax benefit relating to federal and California tax credits for which the Company could not conclude that it is more likely than not that such tax credits will be sustainable on audit by the respective taxing authorities. As a result, the Company reduced the deferred tax asset by $547,000 and recorded a charge to retained earnings as of January 1, 2007, by a like amount.
As of December 31, 2009, the total amount of unrecognized tax benefits, including related interest and penalties, was $1,282,000. The unrecognized tax benefits primarily related to uncertainties from the deductibility of certain operating expenses in various jurisdictions and the expiration of the statute of limitations in several jurisdictions.
The following changes occurred in the amount of unrecognized tax benefits (including related interest and penalties) during the years ended December 31, 2009, 2008 and 2007 as follows:
| For the Years Ended December 31, | |||||||||
| 2009 | 2008 | 2007 | |||||||
| (In thousands) | |||||||||
| Balance at January 31 |
$ | 998 | $ | 616 | $ | 547 | |||
| Additions for current year tax positions |
284 | 382 | 69 | ||||||
| Balance at December 31 |
$ | 1,282 | $ | 998 | $ | 616 | |||
The Company will recognize potential interest and penalties related to income tax positions as a component of the provision for income taxes on the consolidated statements of income in any future periods in which the Company must record a liability.
65
IRIS INTERNATIONAL, INC.
NOTES TO CONSOLIDATED FINANCIAL STATEMENTS—(Continued)
10. Stock-Based Compensation
The Company accounts for stock-based compensation pursuant to FASB ASC Topic 505, Share-Based Payment, which requires compensation costs related to share-based transactions, including employee stock options, to be recognized in the financial statements based on fair value. Share-based compensation expense for the years ended December 31, 2009, 2008 and 2007 is as follows:
| For the Years Ended December 31, | |||||||||
| 2009 | 2008 | 2007 | |||||||
| (In thousands) | |||||||||
| Cost of sales |
$ | 417 | $ | 341 | $ | 273 | |||
| Marketing and selling |
631 | 398 | 162 | ||||||
| General and administrative |
2,026 | 1,210 | 628 | ||||||
| Research and development |
655 | 518 | 411 | ||||||
| Stock-based compensation |
3,729 | 2,467 | 1,474 | ||||||
Stock Options
As of December 31, 2009, the Company had stock option plans under which the Company may grant future non-qualified stock options, incentive stock options and stock appreciation rights. No stock appreciation rights have been granted under the stock option plans. On July 13, 2007, the Company’s stockholders approved the adoption of the IRIS International, Inc. 2007 Stock Incentive Plan, which authorizes the issuance of up to 1,750,000 shares of common stock pursuant to equity awards granted under the plan. On May 22, 2009, the Company’s stockholders approved an increase of 1,550,000 shares to the 2007 Stock Incentive Plan for a total of 3,300,000 authorized shares.
The following schedule sets forth options authorized, exercised, outstanding and available for grant under the Company’s existing stock option plans as of December 31, 2009:
| Number of Option Shares | ||||||||
| Plan |
Authorized | Exercised | Outstanding | Available for Grant | ||||
| (In thousands) | ||||||||
| 1994 Plan |
700 | 680 | 20 | — | ||||
| 1998 Plan |
4,100 | 2,695 | 980 | — | ||||
| 2007 Plan |
3,300 | — | 1,204 | 1,681 | ||||
| 8,100 | 3,375 | 2,204 | 1,681 | |||||
66
IRIS INTERNATIONAL, INC.
NOTES TO CONSOLIDATED FINANCIAL STATEMENTS—(Continued)
The following table sets forth certain information relative to stock options during the three years ended December 31, 2009.
| Shares | Weighted Average Exercise Price |
Average Intrinsic Value | |||||||
| (In thousands, except for per share) | |||||||||
| Outstanding at January 1, 2007 |
1,973 | $ | 9.98 | ||||||
| Granted |
558 | $ | 13.19 | ||||||
| Exercised |
(437 | ) | $ | 4.74 | |||||
| Canceled or expired |
(233 | ) | $ | 14.12 | |||||
| Outstanding at December 31, 2007 |
1,861 | $ | 11.62 | ||||||
| Granted |
502 | $ | 13.03 | ||||||
| Exercised |
(369 | ) | $ | 4.90 | |||||
| Canceled or expired |
(20 | ) | $ | 11.47 | |||||
| Outstanding at December 31, 2008 |
1,974 | $ | 13.24 | ||||||
| Granted |
571 | $ | 9.02 | ||||||
| Exercised |
(197 | ) | $ | 7.34 | |||||
| Canceled or expired |
(143 | ) | $ | 13.10 | |||||
| Outstanding at December 31, 2009 average remaining life – 3.7 years |
2,205 | $ | 12.97 | $ | 3,445 | ||||
| Exercisable at December 31, 2009, average remaining life – 2.7 years |
1,271 | $ | 14.22 | $ | 2,044 | ||||
The weighted average grant-date fair value of options granted during the years ended December 31, 2009, 2008 and 2007 was $4.91, $4.48, and $4.29, respectively. The intrinsic value of options exercised during the years ended December 31, 2009, 2008 and 2007 was $729,000, $4,073,000 and $4,994,000, respectively.
The aggregate intrinsic value in the table above represents the total pretax intrinsic value (the difference between the Company’s closing stock price on December 31, 2009 and the exercise price, multiplied by the number of in-the-money options) that would have been received by the option holders, had all option holders exercised their options on December 31, 2009. Total intrinsic value of options exercised for the year ended December 31, 2009 amounted to $729,000. As of December 31, 2009, total unrecognized stock-based compensation expense related to nonvested stock options was $2,807,000, which is expected to be recognized over the remaining weighted average period of approximately 2.4 years.
The Compensation Committee of the board of directors determines the total value of the stock based compensation grants. The exercise price of options is the closing price on the date the options are granted. Payment of the exercise price may be made either in cash or with shares of common stock that have been held at least six months. The options generally vest over four years and expire between five or ten years from the date of grant. The fair value of each option grant is estimated on the date of the grant using the Black-Scholes option-pricing model with the following weighted average assumptions:
| For the Years Ended December 31, |
|||||||||
| 2009 | 2008 | 2007 | |||||||
| (In thousands) | |||||||||
| Risk free interest rate |
2.0 | % | 2.4 | % | 4.4 | % | |||
| Expected lives (years) |
4.0 | 3.0 | 3.0 | ||||||
| Expected volatility |
60.5 | % | 48 | % | 46 | % | |||
| Expected dividend yield |
— | — | — | ||||||
67
IRIS INTERNATIONAL, INC.
NOTES TO CONSOLIDATED FINANCIAL STATEMENTS—(Continued)
The expected volatilities are based on the historical volatility of the Company’s stock. The observation is made on a weekly basis. The expected terms of the stock options are based on the average vesting period on a basis consistent with the historical experience for similar option grants. The risk-free interest rate is consistent with the expected terms of the stock options and based on the U.S. Treasury yield curve in effect at the time of grant. The Company estimates forfeiture rates based on historical data.
A summary of the Company’s non-vested stock options during the year ended December 31, 2009 is presented below:
| Shares | Weighted Average Grant Date Fair Value | |||||
| (In thousands) | ||||||
| Non-vested options at January 1, 2009 |
856 | $ | 13.48 | |||
| Granted |
571 | $ | 10.11 | |||
| Vested |
(432 | ) | $ | 13.91 | ||
| Forfeited or expired |
(62 | ) | $ | 12.59 | ||
| Non-vested options at December 31, 2009 |
933 | $ | 11.26 | |||
As of December 31, 2009, there was approximately $2,807,000 of accumulated unrecognized stock compensation based on fair value on the grant date related to non-vested options granted under the stock option plans. That cost is expected to be recognized during the weighted average service period of 2.7 years. The share-based compensation will be amortized based on the straight line method over the vesting period and the expense includes an estimate of the awards that will be forfeited. The total fair value of shares vested during the year ended December 31, 2009 was $432,000.
Restricted Shares
The Company began awarding restricted shares of its common stock in 2006. In March 2009, the Company began to grant restricted stock units to its non-employee directors and to certain employees. Such awards generally require that certain performance conditions and service conditions be met before the awards vest. Restricted shares currently vest 25% after one year and 6 1/4% quarterly thereafter. However, non employee directors vest 90 days after grant date. Unvested restricted shares are forfeited if the recipient’s employment terminates for any reason other than death, disability, or special circumstances as determined by the Compensation Committee of the Company’s board of directors. Restricted share activity during the year ended December 31, 2009 is as follows:
| Shares | Weighted Average Grant Date Fair Value Per Share | |||||
| (In thousands, except for per share) | ||||||
| Unvested at January 1, 2009 |
202 | $ | 13.81 | |||
| Granted |
171 | $ | 10.20 | |||
| Vested during period |
(112 | ) | $ | 13.58 | ||
| Cancelled during period |
(13 | ) | $ | 13.54 | ||
| Unvested at December 31, 2009 |
248 | $ | 11.44 | |||
68
IRIS INTERNATIONAL, INC.
NOTES TO CONSOLIDATED FINANCIAL STATEMENTS—(Continued)
Fair value of the Company’s restricted shares is based on the Company’s closing stock price on the date of grant. As of December 31, 2009, total unrecognized stock-based compensation expense related to nonvested restricted share grants was $2,233,000 which is expected to be recognized over the remaining weighted average period of approximately 2.65 years.
11. Capital Stock
At December 31, 2009, there were no warrants outstanding. During the year ended December 31, 2009, 24,016 warrants were exercised prior to their expiration. At December 31, 2008, there were warrants outstanding to purchase 74,300 shares of common stock at $7.80 per share, which expired on April 23, 2009. During the years ended December 31, 2008 and 2007, no warrants were issued, exercised, cancelled or expired.
The Company has 1,000,000 shares of Callable Series C preferred stock authorized, none of which has been issued.
12. Common Stock Repurchase Plan
In 2008, the Company’s board of directors authorized two stock repurchase plans. On March 3, 2008, the Company’s board of directors authorized the first share repurchase and retirement plan of up to $15 million of the Company’s common stock over a 12-month period. Under this first plan the Company repurchased 492,068 shares of common stock for approximately $5.7 million. On July 25, 2008, the Company’s board of directors terminated the first share repurchase and retirement plan.
On November 21, 2008, the Company’s board of directors authorized a second share repurchase and retirement plan of up to $10 million of the Company’s common stock over a 12-month period. During the year ended December 31, 2008, the Company repurchased 491,511 shares of common stock for approximately $6.2 million against this second authorization. During the year ended December 31, 2009, the Company repurchased an additional 250,800 shares of common stock for approximately $2.5 million. As of December 31, 2009, under this second repurchase plan, the Company had repurchased a cumulative total of 742,311 shares of common stock for approximately $8.7 million.
Cumulatively between both plans mentioned above, the Company purchased a total of 1,234,379 shares of common stock for approximately $14.4 million in 2008 and 2009.
13. Employee Benefits
All employees are also eligible to participate in a 401(k) Plan at the beginning of the first quarter following their employment start date. The Company’s contributions are discretionary. Effective January 1, 2006 the Company commenced matching $0.50 per $1.00 contributed by the employees up to 4% of the employee’s annual salary; prior to 2006, the Company’s practice was to match $0.25 per $1.00 contributed by the employees up to 4% of the employee’s annual salary. Employees vest in amounts contributed by the Company immediately. The Company contributed $362,000, $312,000 and $256,000 to the 401(k) Plan for the years ended December 31, 2009, 2008, and 2007, respectively.
14. Manufacturing Transition Rights
On December 30, 2008, the Company entered into a manufacturing, supply and transition agreement (“manufacturing transition rights”) with IDEXX Operations, Inc. Under this agreement, the Company sold its exclusive rights to manufacture and distribute rotors compatible with the drives of IDEXX machines to IDEXX. The Company received a nonrecurring $1.5 million payment, which was offset by $268,000 related to costs
69
IRIS INTERNATIONAL, INC.
NOTES TO CONSOLIDATED FINANCIAL STATEMENTS—(Continued)
associated with the manufacturing transition rights. The $1.5 million payment was classified as other income and did not impact revenue from operations, as this payment was not contingent upon any significant action by the Company.
During the transition period, the Company will provide IDEXX with its know-how related to the manufacturing of the rotors and will manufacture any rotors needed by IDEXX. Prices for these transition services and rotors are exclusive of the aforementioned nonrecurring payment. As of December 31, 2009, the Company has continued to manufacture and sell the rotors to IDEXX at a set price.
In addition, IDEXX owns the rights to manufacture the rotors without any further involvement or commitment from the Company. Commencing January 2014 and continuing through December 2020, if IDEXX uses this manufacturing technology, a royalty fee for each rotor unit sold will be assessed and paid to the Company.
15. Shelf Registration
In November 2007, the Company filed a Form S-3 shelf registration statement (“$125 million shelf”) to provide for financial flexibility. The $125 million shelf allows the Company to issue common stock, preferred stock and debt securities of the Company. Under the $125 million shelf, all of the securities available for issuance may be offered from time to time with terms to be determined at the time of issuance. In December 2007, the Form S-3 registration statement was declared effective. As of December 31, 2009, no securities had been issued under the $125 million shelf which will expire in November 2010.
16. Commitments and Contingencies
Leases
The Company leases real property, automobiles and equipment under operating lease agreements, which expire at various times through 2018. Certain leases contain renewal options and generally require us to pay utilities, insurance, taxes and other operating expenses.
Future minimum rental payments required under operating lease agreements that have an initial term in excess of one year as of December 31, 2009, are as follows:
| Operating Leases | |||
| (In thousands) | |||
| Year Ended December 31, |
|||
| 2010 |
$ | 2,013 | |
| 2011 |
1,228 | ||
| 2012 |
921 | ||
| 2013 |
886 | ||
| 2014 |
658 | ||
| Thereafter |
606 | ||
| $ | 6,312 | ||
Consolidated rental expense under all operating leases during the years ended December 31, 2009, 2008 and 2007 was $1,997,000, $1,787,000 and $1,553,000, respectively.
70
IRIS INTERNATIONAL, INC.
NOTES TO CONSOLIDATED FINANCIAL STATEMENTS—(Continued)
Litigation
From time to time, the Company is party to certain litigation arising in the normal course of business. Management believes that the resolution of such matters will not have a material adverse effect on the Company’s financial position, results of operations or cash flows.
Guarantees
The Company enters into indemnification provisions under (i) agreements with other companies in its ordinary course of business, typically with business partners, contractors, and customers, landlords and (ii) agreements with investors. Under these provisions, the Company generally indemnifies and holds harmless the indemnified party for losses suffered or incurred by the indemnified party as a result of its activities or, in some cases, as a result of the indemnified party’s activities under the agreement. These indemnification provisions often include indemnifications relating to representations made by the Company with regard to intellectual property rights. These indemnification provisions generally survive termination of the underlying agreement. In addition, in some cases, the Company has agreed to reimburse employees for certain expenses and to provide salary continuation during short-term disability. The maximum potential amount of future payments the Company could be required to make under these indemnification provisions is unlimited. The Company reviews its exposure under these agreements no less than annually, or more frequently when events indicate. The Company has not incurred material costs to defend lawsuits or settle claims related to these indemnification agreements. As a result, the Company believes the estimated fair value of its obligations under these agreements is minimal. Accordingly, the Company has not recorded any liabilities for these agreements as of December 31, 2009 and 2008.
17. Supplier Concentration
One supplier comprised greater that 10% of the Company’s consolidated purchases. Consolidated purchases from this supplier amounted to 12%, 15% and 16% for the years end December 31, 2009, 2008, and 2007, respectively.
18. Segments and Geographic Information
The Company’s operations are organized on the basis of products and related services, and under FASB ASC Topic 280, Segment Reporting, the Company operates in two segments: (i) IVD and (ii) sample processing.
The IVD segment designs, develops, manufactures, markets and distributes in-vitro diagnostic systems based on patented and proprietary technology for automating microscopic and clinical chemistry procedures for urinalysis. The segment also provides ongoing sales of consumables and service necessary for the operation of installed urinalysis workstations. In the United States, these products are mostly sold through a direct sales and service force. Internationally, these products are sold and serviced through distributors, with the exception of France and Puerto Rico. The segment also includes the operations of the Iris Molecular Diagnostics, or IMD, subsidiary.
The sample processing segment designs, develops, manufactures and markets a variety of benchtop centrifuges, small instruments and supplies. These products are used primarily for manual specimen preparation and dedicated applications in coagulation, cytology, hematology urinalysis and DNA processing. These products are sold worldwide through distributors.
The accounting policies of the segments are the same as those described in the “Summary of Significant Accounting Policies”. The Company evaluates the performance of its segments and allocates resources to them based on earnings before income taxes, excluding corporate charges.
71
IRIS INTERNATIONAL, INC.
NOTES TO CONSOLIDATED FINANCIAL STATEMENTS—(Continued)
The tables below present information about reported segments for the three years ended December 31, 2009:
| IVD | Sample Processing |
Unallocated Corporate Expenses |
Total | ||||||||||
| (In thousands) | |||||||||||||
| For the Year Ended December 31, 2009 |
|||||||||||||
| Revenues |
$ | 78,231 | $ | 14,335 | $ | — | $ | 92,566 | |||||
| Interest income |
857 | — | — | 857 | |||||||||
| Interest expense |
21 | — | — | 21 | |||||||||
| Depreciation and amortization |
3,277 | 230 | 16 | 3,523 | |||||||||
| Other non-cash items |
— | — | — | — | |||||||||
| Segment pre-tax profit |
10,653 | 4,014 | (5,962 | ) | 8,705 | ||||||||
| Segment assets |
64,046 | 27,608 | 6,136 | 97,790 | |||||||||
| Investment in long-lived assets |
23,979 | 399 | — | 24,378 | |||||||||
| For the Year Ended December 31, 2008 |
|||||||||||||
| Revenues |
$ | 81,771 | $ | 13,731 | $ | — | $ | 95,502 | |||||
| Interest income |
1,180 | — | — | 1,180 | |||||||||
| Interest expense |
11 | — | — | 11 | |||||||||
| Depreciation and amortization |
2,893 | 218 | 16 | 3,127 | |||||||||
| Other non-cash items |
— | — | — | — | |||||||||
| Segment pre-tax profit |
12,223 | 5,113 | (3,960 | ) | 13,376 | ||||||||
| Segment assets |
61,092 | 24,008 | 5,538 | 90,638 | |||||||||
| Investment in long-lived assets |
25,349 | 419 | — | 25,768 | |||||||||
| For the Year Ended December 31, 2007 |
|||||||||||||
| Revenues |
72,025 | $ | 12,281 | $ | — | $ | 84,306 | ||||||
| Interest income |
1,498 | — | — | 1,498 | |||||||||
| Interest expense |
10 | — | — | 10 | |||||||||
| Depreciation and amortization |
2,394 | 212 | 15 | 2, 621 | |||||||||
| Other non-cash items |
— | — | — | — | |||||||||
| Segment pre-tax profit |
12,114 | 3,027 | (4,748 | ) | 10,393 | ||||||||
| Segment assets |
60,446 | 19,008 | 6,936 | 86,390 | |||||||||
| Investment in long-lived assets |
21,188 | 493 | — | 21,681 | |||||||||
The Company ships products from two locations in the United States and one location in Germany. Substantially all long-lived assets are located in the United States. Sales to international customers amounted to approximately $30.2 million in 2009, $31.6 million in 2008 and $25.4 million in 2007. For the year ended December 31, 2009, three customers represented 19%, 12% and 12% of international sales, respectively. For the year ended December 31, 2008, two customers represented 21% and 10% of international sales, respectively. For the year ended December 31, 2007, two customers represented 22% and 11% of international sales, respectively.
Segment assets attributed to corporate unallocated expenses are deferred taxes. Long-lived assets include property and equipment, intangible assets, long-term portion of inventory and other long-term assets. Deferred income taxes are excluded from long-lived assets.
72
IRIS INTERNATIONAL, INC.
NOTES TO CONSOLIDATED FINANCIAL STATEMENTS—(Continued)
19. Valuation and Qualifying Accounts
| Beginning Balance |
Charged to Costs and Expenses |
Additions Charged to Other Accounts |
Deductions | Ending Balance | |||||||||||||
| (In thousands) | |||||||||||||||||
| Year Ended December 31, 2009 |
|||||||||||||||||
| Allowance for doubtful accounts |
$ | 410 | $ | — | $ | (20 | ) | $ | (21 | )(1) | $ | 369 | |||||
| Allowance for sales returns |
35 | — | — | (13 | )(1) | 22 | |||||||||||
| Reserve for inventory obsolescence |
846 | 140 | — | (118 | )(1) | 868 | |||||||||||
| Valuation of deferred tax assets |
596 | — | — | (269 | )(2) | 327 | |||||||||||
| Year Ended December 31, 2008 |
|||||||||||||||||
| Allowance for doubtful accounts |
$ | 401 | $ | 26 | — | $ | (17 | )(1) | $ | 410 | |||||||
| Allowance for sales returns |
35 | — | — | — | (1) | 35 | |||||||||||
| Reserve for inventory obsolescence |
623 | 462 | — | (239 | )(1) | 846 | |||||||||||
| Valuation of deferred tax assets |
856 | — | — | (260 | )(2) | 596 | |||||||||||
| Year Ended December 31, 2007 |
|||||||||||||||||
| Allowance for doubtful accounts |
$ | 483 | $ | 14 | — | $ | (96 | )(1) | $ | 401 | |||||||
| Allowance for sales returns |
205 | 6 | — | (176 | )(1) | 35 | |||||||||||
| Reserve for inventory obsolescence |
881 | 250 | — | (508 | )(1) | 623 | |||||||||||
| Valuation of deferred tax assets |
1,510 | — | — | (654 | )(2) | 856 | |||||||||||
| (1) | Relates to the write-off of accounts receivable, return of merchandise, disposal of obsolete inventory or specific portion of the accounts receivable reserve or reserve for sales returns no longer needed. |
| (2) | Valuation adjustment relating to realization of deferred tax assets. |
20. Selected Quarterly Data (Unaudited)
The following table summarizes certain financial information by quarter:
| 2009 Quarter Ended | ||||||||||||
| March 31 | June 30 | September 30 | December 31 | |||||||||
| (In thousands, except per share) | ||||||||||||
| Net revenues |
$ | 21,575 | $ | 22,342 | $ | 22,186 | $ | 26,463 | ||||
| Gross profit |
11,695 | 11,332 | 12,182 | 13,456 | ||||||||
| Net income |
1,392 | 1,012 | 1,916 | 1,931 | ||||||||
| Net income per share – basic |
0.08 | 0.06 | 0.11 | 0.11 | ||||||||
| Net income per share – diluted |
0.08 | 0.06 | 0.11 | 0.11 | ||||||||
| 2008 Quarter Ended | ||||||||||||
| March 31 | June 30 | September 30 | December 31 | |||||||||
| (In thousands, except per share) | ||||||||||||
| Net revenues |
$ | 21,607 | $ | 23,783 | $ | 23,424 | $ | 26,688 | ||||
| Gross profit(2) |
11,663 | 12,384 | 11,889 | 13,103 | ||||||||
| Net income(1) |
1,821 | 2,205 | 1,618 | 3,369 | ||||||||
| Net income per share – basic |
0.10 | 0.12 | 0.09 | 0.19 | ||||||||
| Net income per share – diluted |
0.10 | 0.12 | 0.09 | 0.18 | ||||||||
| (1) | 2008 results include the one-time gain related to the $1.2 million net payment to IRIS as part of the manufacturing transition rights agreement signed with IDEXX Laboratories in December 2008. |
| (2) | 2008 results include reclassified employee bonus expenses between cost of goods and operating expense categories in the consolidated statement of income to conform to the presentation used in the current year. |
73
IRIS INTERNATIONAL, INC.
NOTES TO CONSOLIDATED FINANCIAL STATEMENTS—(Continued)
21. Subsequent Events
Effective January 1, 2010, the Company purchased certain assets relating to its current distribution of IRIS products in the United Kingdom, Ireland and Germany from one of the Company’s European distributors for a cash payment of $841,000. The assets purchased consist primarily of customer leases for installed IRIS instruments and service contracts valued at inventory book value. This purchase will increase the Company’s direct sales presence within its international sales channels, and will serve as a template for further potential transactions in territories that represent new business opportunities for the Company.
74
Item 9. Changes in and Disagreements with Accountants on Accounting and Financial Disclosure.
None.
Item 9A. Controls and Procedures.
Disclosure Controls and Procedures.
Based on their evaluation as of December 31, 2009, our Chief Executive Officer and Chief Financial Officer, with the participation of management, have concluded that our disclosure controls and procedures (as defined in Rules 13a–15(e) and 15d–15(e) of the Securities Exchange Act of 1934) were effective.
Management’s Annual Report on Internal Control over Financial Reporting.
Our management is responsible for establishing and maintaining adequate internal control over financial reporting, as defined in Rules 13a-15(f) and 15d-15(f) under the Securities and Exchange Act of 1934. Internal control over financial reporting is a process designed to provide reasonable assurance regarding the reliability of financial reporting and the preparation of financial statements for external purposes in accordance with generally accepted accounting principles in the United States.
Under the supervision and with the participation of our management, including our Chief Executive Officer and Chief Financial Officer, we conducted an evaluation of the effectiveness of our internal control over financial reporting as of December 31, 2009 using the criteria set forth by the Committee of Sponsoring Organizations of the Treadway Commission (COSO) in Internal Control – Integrated Framework. Based on this evaluation, our management concluded that as of December 31, 2009, our internal control over financial reporting was effective.
Attestation Report of the Registered Public Accounting Firm.
BDO Seidman LLP, our independent registered public accounting firm that has audited our financial statements included herein, has issued an attestation report on our internal control over financial reporting, which report is included under Item 8 of this Annual Report on Form 10-K.
Changes in Internal Control over Financial Reporting.
There were no changes in our internal control over financial reporting during the quarter ended December 31, 2009 that have materially affected, or are reasonably likely to materially affect, our internal control over financial reporting.
Limitations on the Effectiveness of Controls.
Our disclosure controls and procedures provide our Chief Executive Officer and Chief Financial Officer reasonable assurances that our disclosure controls and procedures will achieve their objectives. However, company management, including our Chief Executive Officer and Chief Financial Officer, does not expect that our disclosure controls and procedures or our internal control over financial reporting can or will prevent all human error. A control system, no matter how well designed and implemented, can provide only reasonable, not absolute, assurance that the objectives of the control system are met. Furthermore, the design of a control system must reflect the fact that there are internal resource constraints, and the benefit of controls must be weighed relative to their corresponding costs. Because of the limitations in all control systems, no evaluation of controls can provide complete assurance that all control issues and instances of error, if any, within our company are detected. These inherent limitations include the realities that judgments in decision-making can be faulty, and
75
that breakdowns can occur due to human error or mistake. Additionally, controls, no matter how well designed, could be circumvented by the individual acts of specific persons within the organization. The design of any system of controls is also based in part upon certain assumptions about the likelihood of future events, and there can be no assurance that any design will succeed in achieving its stated objectives under all potential future conditions.
None.
76
PART III
Certain information required by Part III is omitted from this Annual Report on Form 10-K because the registrant will file with the U.S. Securities and Exchange Commission a definitive proxy statement pursuant to Regulation 14A in connection with the solicitation of proxies for our Annual Meeting of Stockholders expected to be held in May 2010 (the “Proxy Statement”) not later than 120 days after the end of the fiscal year covered by this Annual Report on Form 10-K, and certain information included therein is incorporated herein by reference.
Item 10. Directors, Executive Officers and Corporate Governance.
The information required by this item with respect to directors and executive officers may be found in the section “Election of Directors” appearing in the Proxy Statement. Such information is incorporated herein by reference.
The information required by this Item with respect to our audit committee and audit committee financial expert may be found in the section entitled “Election of Directors – Audit Committee” appearing in the Proxy Statement. Such information is incorporated herein by reference.
The information required by this Item with respect to compliance with Section 16(a) of the Securities Exchange Act of 1934 and our code of ethics may be found in the sections entitled “Section 16(a) Beneficial Ownership Reporting Compliance” and “Election of Directors – Code of Business Conduct and Ethics,” respectively, appearing in the Proxy Statement. Such information is incorporated herein by reference.
Item 11. Executive Compensation.
The information required by this Item with respect to director and executive officer compensation is incorporated herein by reference to the information from the Proxy Statement under the section entitled “Executive Compensation.”
The information required by this Item with respect to Compensation Committee interlocks and insider participation is incorporated herein by reference to the information from the Proxy Statement under the section entitled “Election of Directors – Compensation Committee Interlocks and Insider Participation.”
The information required by this Item with respect to our Compensation Committee’s review and discussion of the Compensation Discussion and Analysis included in the Proxy Statement is incorporate herein by reference to the information from the Proxy Statement under the section entitled “Election of Directors – Compensation Committee Report.”
| Item 12. | Security Ownership of Certain Beneficial Owners and Management and Related Stockholder Matters. |
The information required by this Item with respect to security ownership of certain beneficial owners and management is incorporated herein by reference to the information from the Proxy Statement under the section entitled “Security Ownership of Certain Beneficial Owners and Management.”
The information required by this Item with respect to securities authorized for issuance under our equity compensation plans is incorporated herein by reference to the information from the Proxy Statement under the section entitled “Equity Compensation Plan Information.”
Item 13. Certain Relationships and Related Transactions, and Director Independence.
The information required by this Item with respect to related party transactions is incorporated herein by reference to the information from the Proxy Statement under the section entitled “Certain Relationships and Related Transactions.”
77
The information required by this Item with respect to director independence is incorporated herein by reference to the information from the Proxy Statement under the section entitled “Election of Directors – Independence of the Board of Directors.”
Item 14. Principal Accounting Fees and Services.
The information required by this Item is incorporated herein by reference to the information from the Proxy Statement under the section entitled “Ratification of Selection of Independent Registered Public Accounting Firm.”
78
PART IV
Item 15. Exhibits, Financial Statement Schedules.
(a) Documents filed as part of this report
1. Financial Statements
See Index to Financial Statements in Item 8 of this Annual Report on Form 10-K, which is incorporated herein by reference.
2. Financial Statement Schedules
All financial statement schedules are omitted because the information is inapplicable or presented in the Notes to Financial Statements.
3. The following exhibits are included herein or incorporated herein by reference:
| Exhibit Number |
Description |
Incorporated by Reference | Filed Herewith | |||||||||
| Form | File Number | Exhibit | Filing Date |
|||||||||
| 3.1(a) | Certificate of Incorporation, as amended. | 8-K | 001-11181 | n/a | August 13, 1987 | — | ||||||
| 3.1(b) | Certificate of Designations, Preferences and Rights of Series C Preferred. | 8-K | 001-11181 | 99.2 | January 26, 2000 | — | ||||||
| 3.1(c) | Certificate of Ownership and Merger. | 10-K | 001-11181 | 3.1(d) | March 26, 2004 | — | ||||||
| 3.2(a) | Amended and Restated Bylaws. | 8-K | 001-11181 | 3.2 | July 18, 2007 | — | ||||||
| 3.2(b) | Amendment to Amended and Restated Bylaws. | 8-K | 001-11181 | 3.3 | January 20, 2010 | |||||||
| 4.1(a) | Rights Agreement, dated as of January 21, 2000, between the Registrant and Continental Stock Transfer & Trust Company, as Rights Agent, with related exhibits. | 8-K | 001-11181 | 99.1 | January 26, 2000 | — | ||||||
| 4.1(b) | Rights Agreement Amendment, dated as of September 20, 2006, between the Registrant and Continental Stock Transfer & Trust Company, as Rights Agent, including an amended Rights Certificate. | 8-K | 001-11181 | 4.1 | September 22, 2006 | — | ||||||
| 10.1(a) | Lease for Property Located at 9172 Eton Avenue, Chatsworth, California (Headquarters), dated November 29, 2001. | 10-K | 001-11181 | 10.1(a) | April 1, 2002 | — | ||||||
| 10.1(b) | Amendment No. 1, dated October 17, 2005, to the Lease for Property Located at 9172 Eton Avenue, Chatsworth, California (Headquarters), dated November 28, 2001. | 8-K | 001-11181 | 10.2 | November 18, 2005 | — | ||||||
| 10.2 | Lease for Property Located at 9158-9162 Eton Avenue, Chatsworth, California, dated October 17, 2005. | 8-K | 001-11181 | 10.1 | November 18, 2005 | — | ||||||
| 10.3(a)† | 1994 Stock Option Plan and forms of Stock Option Agreements. | S-8 | 33-82560 | n/a | — | |||||||
| 10.4† | 1997 Stock Option Plan and form of Stock Option Agreement. | S-8 | 333-31393 | 4.2(a),4.2(b) | July 16, 1997 | — | ||||||
79
| Exhibit Number |
Description |
Incorporated by Reference | Filed Herewith | |||||||||
| Form | File Number | Exhibit | Filing Date |
|||||||||
| 10.5† | Amended and Restated 1998 Stock Option Plan. | 10-K | 001-11181 | 10.6 | March 23, 2007 | — | ||||||
| 10.6(a) | Business Loan Agreement dated May 25, 2004 by and between the Registrant and California Bank & Trust. | 10-K | 001-11181 | 10.3(b) | March 16, 2005 | — | ||||||
| 10.6(b) | Change in Terms Agreement dated March 24, 2006 by and between the Registrant and California Bank & Trust. | * | ||||||||||
| 10.6(c) | Change in Terms Agreement dated May 1, 2008 by and between the Registrant and California Bank & Trust. | 8-K/A | 001-11181 | 10.2 | July 14, 2008 | — | ||||||
| 10.6(d) | Commercial Security Agreements dated May 25, 2004 by and between the Registrant and California Bank & Trust. | 10-K | 001-11181 | 10.3(d) | March 16, 2005 | — | ||||||
| 10.7 | Landlord’s Consent dated February 7, 2002 by and between the Registrant, the Registrant’s Landlord and California Bank & Trust. | 10-K | 001-11181 | 11.1(d) | April 1, 2002 | — | ||||||
| 10.8(a) | Commercial Guaranty Agreement dated May 25, 2004 by and between the Registrant, StatSpin, Inc (the Registrant’s affiliate) and California Bank & Trust. | 10-K | 001-11181 | 10.3(f) | March 16, 2005 | — | ||||||
| 10.8(b) | Business Loan Agreement dated March 24, 2006 by and between the Registrant and California Bank & Trust. | * | ||||||||||
| 10.8(c) | Change in Terms Agreement dated March 24, 2006 by and between the Registrant and California Bank & Trust. | * | ||||||||||
| 10.8(d) | Change in Terms Agreement dated May 1, 2008 by and between the Registrant and California Bank & Trust. | 8-K/A | 001-11181 | 10.1 | July 14, 2008 | — | ||||||
| 10.9(a)† | Key Employee Agreement, dated February 13, 2004, between the Registrant and Cesar M Garcia. | 10-K | 001-11181 | 10.8(i) | March 26, 2004 | — | ||||||
| 10.9(b)† | First Amendment to Key Employee Agreement, dated December 21, 2006, between the Registrant and Cesar M Garcia. | 10-K | 001-11181 | 10.9(b) | March 23, 2007 | — | ||||||
| 10.10† | Key Employee Agreement, dated April 3, 2006, between the Registrant and Dr. Thomas H. Adams. | 8-K | 001-11181 | 10.1 | April 7, 2006 | — | ||||||
| 10.11† | Key Employee Agreement, dated March 1, 2007, between the Registrant and Thomas E. Warekois. | 10-K | 001-11181 | 10.12 | March 14, 2008 | — | ||||||
| 10.12† | Key Employee Agreement, dated August 6, 2007, between the Registrant and Peter L. Donato. | 8-K | 001-11181 | 10.1 | August 8, 2007 | — | ||||||
| 10.13(a)† | 2007 Stock Incentive Plan. | S-8 | 333-145635 | 4.3 | August 22, 2007 | — | ||||||
| 10.13(b)† | Amendment No. 1 to 2007 Stock Incentive Plan | 8-K | 001-11181 | 10.1 | May 29, 2009 | — | ||||||
80
| Exhibit Number |
Description |
Incorporated by Reference | Filed Herewith | |||||||||
| Form | File Number | Exhibit | Filing Date |
|||||||||
| 10.14† | Second Amendment to Key Employee Agreement, dated November 14, 2007, between the Registrant and Cesar M. Garcia. | 8-K | 001-11181 | 10.1 | November 14, 2007 | |||||||
| 10.15† | Key Employee Agreement, dated November 7, 2007, between the Registrant and Robert Mello. | 8-K | 001-11181 | 10.2 | November 14, 2007 | |||||||
| 10.16† | Key Employee Agreement, dated November 7, 2007, between the Registrant and John Yi. | 8-K | 001-11181 | 10.3 | November 14, 2007 | |||||||
| 10.17 | Lease for Property Located at 9232 Eton Avenue, Chatsworth, California, dated February 8, 2010. | * | ||||||||||
| 10.18† | Form of Restricted Stock Unit Agreement. | * | ||||||||||
| 10.19† | Form of Non-Qualified Stock Option Agreement. | * | ||||||||||
| 10.20† | Form of Incentive Stock Option Agreement. | * | ||||||||||
| 10.21† | Form of Restricted Stock Unit Deferral Election. | * | ||||||||||
| 21 | List of Subsidiaries. | * | ||||||||||
| 23.1 | Consent of BDO Seidman, LLP. | * | ||||||||||
| 24.1 | Power of Attorney (included on signature page) | * | ||||||||||
| 31.1 | Certification of Principal Executive officer pursuant to Securities Exchange Act Rules 13a-14 and 15d-14 as adopted pursuant to Section 302 of the Sarbanes-Oxley Act of 2002. | * | ||||||||||
| 31.2 | Certification of Principal Financial officer pursuant to Securities Exchange Act Rules 13a-14 and 15d-14 as adopted pursuant to Section 302 of the Sarbanes-Oxley Act of 2002. | * | ||||||||||
| 32.1 | Certification of Principal Executive officer pursuant to Securities Exchange Act Rules 13a-14(b) of the Exchange Act and 18 U.S.C. Section 1350 as adopted pursuant to Section 906 of the Sarbanes-Oxley Act of 2002. | * | ||||||||||
| 32.2 | Certification of Principal Financial officer pursuant to Securities Exchange Act Rules 13a-14(b) of the Exchange Act and 18 U.S.C. Section 1350 as adopted pursuant to Section 906 of the Sarbanes-Oxley Act of 2002. | * | ||||||||||
| † | Each a management contract or compensatory plan or arrangement required to be filed as an exhibit to this annual report on Form 10-K. |
| n/a | means not available. |
81
Pursuant to Section 13 or 15(d) of the Securities Exchange Act of 1934, the Registrant has duly caused this report on Form 10-K to be signed on its behalf by the undersigned, thereunto duly authorized, in Chatsworth, California, on March 15, 2010.
| IRIS INTERNATIONAL, INC. | ||
| By: | /s/ CESAR M. GARCÍA | |
| Cesar M. García, | ||
| President and Chief Executive Officer | ||
POWER OF ATTORNEY
KNOW ALL PERSONS BY THESE PRESENTS, that each person whose signature appears below constitutes and appoints Cesar M. Garcia and Peter L. Donato, and each of them, as his true and lawful attorneys-in-fact and agents, with full power of substitution for him, and in his name in any and all capacities, to sign any and all amendments to this Annual Report on Form 10-K, and to file the same, with exhibits thereto and other documents in connection therewith, with the Securities and Exchange Commission, granting unto said attorneys-in-fact and agents, and each of them, full power and authority to do and perform each and every act and thing requisite and necessary to be done therewith, as fully to all intents and purposes as he might or could do in person, hereby ratifying and confirming all that said attorneys-in-fact and agents, and any of them or his or her substitute or substitutes, may lawfully do or cause to be done by virtue hereof.
Pursuant to the requirements of the Securities Act of 1934, this report has been signed by the following persons on behalf of the Registrant in the capacities indicated and on the date indicated:
| Signature |
Title |
Date | ||
| /s/ CESAR M. GARCIA Cesar M. Garcia |
President, Chief Executive Officer and Chairman of the Board (Principal Executive Officer) |
March 15, 2010 | ||
| /s/ PETER L. DONATO Peter L. Donato |
Chief Financial Officer and Secretary (Principal Financial and Accounting Officer) |
March 15, 2010 | ||
| /s/ THOMAS H. ADAMS Thomas H. Adams |
Director |
March 15, 2010 | ||
| /s/ STEVEN M. BESBECK Steven M. Besbeck |
Director |
March 15, 2010 | ||
| /s/ BETH Y. KARLAN Beth Y. Karlan |
Director |
March 15, 2010 | ||
| /s/ MICHAEL D. MATTE Michael D. Matte |
Director |
March 15, 2010 | ||
| /s/ RICHARD G. NADEAU Richard G. Nadeau |
Director |
March 15, 2010 | ||
| /s/ RICK TIMMINS Rick Timmins |
Director |
March 15, 2010 | ||
| /s/ EDWARD F. VOBORIL Edward F. Voboril |
Director |
March 15, 2010 | ||
| /s/ STEPHEN E. WASSERMAN Stephen E. Wasserman |
Director |
March 15, 2010 | ||
82