Attached files
Table of Contents
UNITED STATES
SECURITIES AND EXCHANGE COMMISSION
Washington, D.C. 20549
FORM 10-K
(Mark one)
| x | ANNUAL REPORT PURSUANT TO SECTION 13 OR 15(d) OF THE SECURITIES EXCHANGE ACT OF 1934 |
For the fiscal year ended January 3, 2010
or
| ¨ | TRANSITION REPORT PURSUANT TO SECTION 13 OR 15(d) OF THE SECURITIES EXCHANGE ACT OF 1934 |
For the transition period from to
Commission File Number: 0-26137
drugstore.com, inc.
(Exact Name of Registrant as Specified in its Charter)
| Delaware | 04-3416255 | |
| (State or Other Jurisdiction of Incorporation or Organization) | (I.R.S. Employer Identification No.) | |
| 411 108th Avenue NE, Suite 1400 Bellevue, Washington 98004 |
(425) 372-3200 | |
| (Address of Principal Executive Offices) | (Registrant’s telephone number, including area code) | |
Securities registered pursuant to Section 12(b) of the Act:
| Title of Each Class |
Name of Each Market on Which Listed | |
| Common Stock, par value $0.0001 per share | NASDAQ Stock Market LLC (NASDAQ Global Market) |
Securities registered pursuant to Section 12(g) of the Act:
None
Indicate by check mark if the registrant is a well-known seasoned issuer, as defined in Rule 405 of the Securities Act. Yes ¨ No x
Indicate by check mark if the registrant is not required to file reports pursuant to Section 13 or Section 15(d) of the Act. Yes ¨ No x
Indicate by check mark whether the registrant: (1) has filed all reports required to be filed by Section 13 or 15(d) of the Securities Exchange Act of 1934 during the preceding 12 months (or for such shorter period that registrant was required to file such reports), and (2) has been subject to such filing requirements for the past 90 days. Yes x No ¨
Indicate by check mark whether the registrant has submitted electronically and posted on its corporate Web site, if any, every Interactive Data File required to be submitted and posted pursuant to Rule 405 of Regulation S-T (§ 232.405 of this chapter) during the preceding 12 months (or for such shorter period that the registrant was required to submit and post such files). Yes ¨ No ¨
Indicate by check mark if disclosure of delinquent filers pursuant to Item 405 of Regulation S-K is not contained herein, and will not be contained, to the best of registrant’s knowledge, in definitive proxy or information statements incorporated by reference in part III of this Form 10-K or any amendment to this Form 10-K. x
Indicate by check mark whether the registrant is a large accelerated filer, an accelerated filer, a non-accelerated filer, or a smaller reporting company. See the definitions of “large accelerated filer,” “accelerated filer,” and “smaller reporting company in Rule 12b-2 of the Exchange Act. (Check one):
| Large Accelerated filer ¨ | Accelerated filer x | |
| Non-accelerated filer ¨ | Smaller reporting company ¨ |
Indicate by check mark whether the registrant is a shell company (as defined in Rule 12b-2 of the Exchange Act). Yes ¨ No x
The aggregate market value of common stock held by non-affiliates of the registrant was $188,259,730 as of June 27, 2009, the last business day of the registrant’s most recently completed second fiscal quarter.
As of March 5, 2010, the number of shares of the registrant’s common stock outstanding was 105,784,049.
DOCUMENTS INCORPORATED BY REFERENCE
The information required by Part III of this annual report, to the extent not set forth in this annual report, is incorporated by reference from the registrant’s definitive proxy statement relating to the registrant’s annual meeting of stockholders to be held on June 8, 2010, which definitive proxy statement will be filed with the Securities and Exchange Commission within 120 days after the end of the fiscal year to which this annual report relates.
Table of Contents
ANNUAL REPORT ON FORM 10-K
For the Fiscal Year Ended January 3, 2010
Table of Contents
| Page | ||||
| PART I | ||||
| ITEM 1. |
BUSINESS | 1 | ||
| ITEM 1A. |
RISK FACTORS | 9 | ||
| ITEM 1B. |
UNRESOLVED STAFF COMMENTS | 27 | ||
| ITEM 2. |
PROPERTIES | 28 | ||
| ITEM 3. |
LEGAL PROCEEDINGS | 28 | ||
| ITEM 4. |
RESERVED | 28 | ||
| PART II | ||||
| ITEM 5. |
29 | |||
| ITEM 6. |
31 | |||
| ITEM 7. |
MANAGEMENT’S DISCUSSION AND ANALYSIS OF FINANCIAL CONDITION AND RESULTS OF OPERATIONS |
32 | ||
| ITEM 7A. |
50 | |||
| ITEM 8. |
50 | |||
| ITEM 9. |
CHANGES IN AND DISAGREEMENTS WITH ACCOUNTANTS ON ACCOUNTING AND FINANCIAL DISCLOSURE |
50 | ||
| ITEM 9A. |
50 | |||
| ITEM 9B. |
53 | |||
| PART III | ||||
| ITEM 10. |
54 | |||
| ITEM 11. |
54 | |||
| ITEM 12. |
SECURITY OWNERSHIP OF CERTAIN BENEFICIAL OWNERS AND MANAGEMENT AND RELATED STOCKHOLDER MATTERS |
54 | ||
| ITEM 13. |
CERTAIN RELATIONSHIPS AND RELATED TRANSACTIONS, AND DIRECTOR INDEPENDENCE |
54 | ||
| ITEM 14. |
54 | |||
| PART IV | ||||
| ITEM 15. |
EXHIBITS, FINANCIAL STATEMENT SCHEDULES | 55 | ||
| F-38 | ||||
i
Table of Contents
| ITEM 1. | BUSINESS |
Special Note Regarding Forward-Looking Statements
This annual report on Form 10-K and the documents incorporated into this annual report by reference contain forward-looking statements within the meaning of the Private Securities Litigation Reform Act of 1995 based on our expectations, estimates and projections as of the date of this filing. Actual results may differ materially from those expressed in forward-looking statements. All statements made in this annual report other than statements of historical fact, including statements regarding our future financial and operational performance, sources of liquidity and future liquidity needs, are forward-looking. Words such as “anticipates,” “believes,” “continues,” “could,” “expects,” “focus,” “intends,” “may,” “outlook,” “plan,” “project,” “remains,” “should,” “targets,” “will,” “would,” and similar expressions or any variation of such expressions, are intended to identify forward-looking statements. Forward-looking statements are based on current expectations, and are not guarantees of future performance and involve assumptions, risks, and uncertainties. Actual performance may differ materially from those contained or implied in such forward-looking statements. Risks and uncertainties that could lead to such differences could include, among other things:
| • | effects of changes in the economy; |
| • | changes in consumer spending and consumer trends; |
| • | fluctuations in the stock market; |
| • | changes affecting the Internet, online retailing, and advertising; |
| • | difficulties establishing our brand and building a critical mass of customers; |
| • | the unpredictability of future revenues, expenses, and potential fluctuations in revenues and operating results; |
| • | risks related to business combinations and strategic alliances; |
| • | possible tax liabilities relating to the collection of sales tax; |
| • | the level of competition; |
| • | seasonality; |
| • | the timing and success of expansion efforts; |
| • | changes in senior management; |
| • | risks related to systems interruptions and disruptions in service by shipping carriers; |
| • | possible changes in governmental regulation; |
| • | changes in price of fuel or other energy products; |
| • | the ability to manage a growing business; |
| • | the risk that anticipated synergies and opportunities as a result of our recent acquisition of Salu, Inc. (Salu) will not be realized or that the acquired business does not perform as planned. |
These and other risks and uncertainties that could cause our actual results to differ significantly from management’s expectations are described in the following discussion and in the section entitled “Risk Factors” in Part I, Item 1A of this annual report. You should not rely on a forward-looking statement as representing our views as of any date other than the date on which we made the statement. We expressly disclaim any intent or obligation to update any forward-looking statement after the date on which we make it.
1
Table of Contents
Overview
drugstore.com, inc. is a leading online provider of health, beauty, vision, and pharmacy products. We believe that we offer a better way for consumers to shop for these products through our web stores, including those located on the Internet at www.drugstore.com, www.beauty.com, www.sexualwellbeing.com, www.athisbest.com, www.thenaturalstore.com, www.allergysuperstore.com, www.riteaidonlinestore.com, www.medcohealthstore.com, www.visiondirect.com, www.lensmart.com, www.lensworld.com, and www.lensquest.com. Effective February 19, 2010, through our acquisition of Salu, Inc., a Delaware corporation, we acquired www.skinstore.com and operate www.spalook.com. As of January 3, 2010, our lifetime customer base was 11.7 million customers.
We operate our business in three segments: over-the-counter, or OTC; vision; and mail-order pharmacy. Additional information regarding our business segments can be found in the section entitled “Management’s Discussion and Analysis of Financial Condition and Results of Operations” in Part II, Item 7 of this annual report and in Note 12 of our consolidated financial statements included in Part IV, Item 15 of this annual report. In 2009, 98% of our sales were made, and over 99% of our assets were located, in the United States, and 2% of our sales were made internationally. In 2008, and 2007, approximately 99% of our net sales were made, and over 99% of our assets were located, in the United States.
drugstore.com, inc. was incorporated in April 1998 in the state of Delaware. We launched our web store at www.drugstore.com in February 1999 and completed our initial public offering in July 1999. Our common stock is listed on the NASDAQ Global Market under the symbol “DSCM.” Our principal corporate offices are located in Bellevue, Washington. As used in this annual report, “drugstore.com,” “we,” “our,” and similar terms refer to drugstore.com, inc. and its subsidiaries, unless the context indicates otherwise.
Business Strategy
Our business strategy is to offer our customers a wide selection of products at competitive prices and to provide a superior online shopping experience.
Convenience. Our online stores are available to consumers 24 hours a day, seven days a week. All of our products are also available for purchase by phone. We offer additional convenience to our customers through easy-to-use websites, robust search technology, and a variety of features such as: Your List, a personal shopping list of the customer’s previous purchases that allows for quick and easy re-ordering, even without browsing the site; Auto Delivery, which enables customers to set up automatic shipments of frequently ordered products; the ability to schedule e-mail reminders about previously purchased products that are scheduled to run out or are on sale; and an automated flexible spending account, or FSA, manager that keeps track of FSA-eligible purchases and provides customers with downloadable receipts to submit to their FSA administrator.
Selection. We are able to offer a significantly broader assortment of products, with greater depth in each product category, because we do not have the shelf display space limitations of brick-and-mortar drugstores. With a single check-out, our customers are able to buy health, beauty and personal care products, prestige beauty brands, salon hair care, natural products, and other specialty items. In addition, we offer contact lenses and customized nutritional supplement programs through our subsidiary websites.
Information. We provide a broad array of interactive tools and information on our websites to help consumers make informed purchasing decisions. Our information services include detailed product information pages; personalized product recommendations; customer reviews and other editorial content; the eMedAlert program, which alerts customers to safety issues such as FDA and product manufacturer recalls; and extensive health- and pharmacy-related information, including a drug information database, a drug price index, information on generic drug alternatives, a drug interaction checker; and Ask Your Pharmacist, which is a database of our pharmacists’ responses to over 800 frequently-asked questions. Our customer care representatives and in-house pharmacists are available by phone or e-mail to provide personal guidance and answer customers’ questions.
2
Table of Contents
Privacy. When shopping at a brick-and-mortar drugstore, many consumers may feel embarrassed or uncomfortable about buying items or asking questions that may reveal personally sensitive aspects of their health or lifestyle to pharmacists, store personnel, or other shoppers. Our customers avoid these problems by shopping from the privacy of their home or office.
Value. Our goal is to offer shoppers a broad assortment of health, beauty, vision, and pharmacy products with competitive pricing. We strive to improve our operating efficiencies and to leverage our fixed costs so that we can pass along the savings to our customers in the form of lower prices and exclusive deals. We also seek to inform customers of additional cost-saving opportunities when they become available. For example, in our pharmacy, we inform our customers of quantity price breaks for buying 90-day supplies of medication rather than 30-day supplies.
Business Segments
In 2009, our OTC segment accounted for 74% of our net sales, our vision segment accounted for 17%, and our mail-order pharmacy segment accounted for 9%. See Note 12 of our consolidated financial statements included in Part IV, Item 15 of this annual report.
OTC
We stock approximately 35,000 non-prescription health, beauty, personal care, household, and other products. We also offer approximately 10,000 products through our arrangements with drop-ship vendors. We offer OTC products in a variety of categories, including:
| • Personal Care |
• Diet and Fitness | |
| • Makeup and Accessories |
• Household | |
| • Hair Care |
• Pets | |
| • Skin Care |
• Baby and Mom | |
| • Men’s |
• Food and Gourmet | |
| • Medicine Cabinet |
• FSA | |
| • Vitamins |
• Sexual Well-Being | |
| • Gifts |
• Toys and Games | |
| • Oral Care • GNC |
• Beauty.com (prestige beauty products, also accessible through www.beauty.com ) | |
| • Green and Natural |
• SkinStore.com (clinical skin care and beauty products, accessible through www.skinstore.com and spalook.com) |
Through our subsidiary Custom Nutrition Services, Inc. (CNS), we also provide personalized nutrition services to consumers in the form of an online assessment of an individual’s specific nutritional supplement needs, and deliver the personalized vitamins, minerals, herbs, and supplements in pharmaceutical-grade, daily dose packages. We are the exclusive online distributor of nutritional supplement programs for Dr. Barry Sears at www.ZoneDiet.com and The Pritikin Longevity Center & Spa at www.Pritikin.com. In addition, we act as the exclusive fulfillment provider for customized nutritional supplements sold through www.DrWeilVitaminAdvisor.com, www.DrWeil.com, and other Dr. Weil-related websites.
In addition, through our newly acquired subsidiary Salu, we offer on www.skinstore.com and through www.spalook.com, which we operate on behalf of a third party, over 200 premium brands of clinical skin care and beauty products typically found only in luxury spas, fine stores, and dermatologists’ offices.
3
Table of Contents
Vision
Through our subsidiary Vision Direct, we offer a broad assortment of contact lenses, in addition to reading glasses, contact lens cases, and other contact lens supplies. We believe that we offer these products at a substantial price savings over eye care practitioners, national optical chains, and many online competitors.
Our contact lens business is subject to the U.S. Fairness to Contact Lens Consumers Act, or FTCLCA, and the related regulations of the Federal Trade Commission, or FTC, which establish a national uniform standard for eye care practitioners and direct marketers with respect to the sale of contact lenses, including verification of contact lens prescriptions. In accordance with these guidelines, we ask the patient’s eye care professional to verify the prescription before we ship an order and allow eight business hours for the eye care professional to reply to our verification request. If the eye care professional approves the prescription, or does not respond to our verification request within eight business hours, we ship the order to the customer as expressly permitted by the FTCLCA.
In 2009, we entered into a strategic multi-year e-commerce partnership with Luxottica Group, S.p.A. (Luxottica), a global leader in the design, manufacturing and distribution of fashion, luxury, and sport eyewear. Through this partnership, we will develop branded contact lens e-commerce sites for Luxottica’s North American businesses such as LensCrafters, Pearle Vision, Target Optical, and Sears Optical, which we expect to begin to launch in the second half of 2010. We are also purchasing contact lenses and related products through our joint venture with Luxottica.
Mail-Order Pharmacy
Our mail-order pharmacy segment includes prescription drugs and supplies, other than prescription contact lenses, sold online through the pharmacy section of the drugstore.com web store or over the telephone and delivered to customers through our mail-order facility.
We are a full-service pharmacy stocking over 5,500 prescription drugs. We employ licensed pharmacists and are licensed to ship prescriptions to all 50 states in the United States. We have received Verified Internet Pharmacy Practices Sites, or VIPPS, certification from the National Association of Boards of Pharmacy, or NABP. The voluntary VIPPS program sets standards for Internet pharmacies and certifies those online pharmacies that are licensed and in compliance with state pharmacy laws and the NABP’s stringent pharmacy practice standards.
We serve both cash-paying pharmacy customers and customers with insurance coverage.
Marketing and Promotions
Our marketing and promotion strategy is designed to build brand recognition, increase customer traffic to our store, add new customers, build strong customer loyalty, maximize repeat purchases, and develop incremental revenue opportunities. Our online advertising campaigns are focused on search engines, frequently visited Internet portals, health- and beauty-related websites, and direct-to-consumer e-mail marketing programs. We further extend our online market presence through our affiliate program, through which we permit certain websites to make our products and services available to their audiences through links to our websites.
We also employ a variety of marketing programs and promotions, such as discounted and free shipping promotions, dollar off and percentage discounts, free gifts with purchase, and the drugstore.com dollars™ program, a loyalty program in which customers automatically earn a five percent rebate to be used for future non-prescription purchases.
4
Table of Contents
Fulfillment and Customer Care
Order Fulfillment
We process most OTC orders and all mail-order pharmacy orders from our primary distribution center in Swedesboro, New Jersey, and in January 2010, we moved the processing of all vision orders from our distribution center in Ferndale, Washington to our primary distribution center in Swedesboro, New Jersey. We also process drop-ship orders for certain OTC products and arrange for our drop-ship vendor partners to ship these products directly from the vendor’s warehouse. Due to the relatively short lead time required to fill orders for our products, usually 24 to 48 hours, order backlog is not material to our business.
We ship OTC and pharmacy products to U.S., U.S. Territory, and APO/FPO military addresses. In addition, through an agreement with E4X, Inc., we offer international shipment of select OTC health, beauty, and wellness products to 34 countries, and expect to expand to more countries over time. Vision Direct ships contact lenses and other vision products worldwide, primarily to the United States and Canada.
We use a third-party fulfillment partner in Columbus, Ohio, to process and ship Salu orders.
Customer Care
Our customer care representatives operate from our call center in Halifax, Nova Scotia, Canada and from our Bellevue, Washington headquarters. Our customer care specialists are available 24 hours a day, seven days a week via e-mail or telephone to handle customer inquiries and assist customers in finding desired products. The Help sections of our websites outline store policies and provide answers to customers’ frequently asked questions. In addition, our pharmacists provide advice to customers about medications and other health-related issues.
Technology
We have implemented a broad array of services and systems for site management, product searching, customer interaction, transaction processing, and order fulfillment functions. These services and systems use a combination of our own proprietary technologies and commercially available, licensed technologies. We focus our internal development efforts on creating and enhancing the specialized, proprietary software that is unique to our business. For example, our core merchandise catalog, customer interaction, order collection, fulfillment, and back-end systems are proprietary to drugstore.com. Our systems are designed to provide real-time connectivity to the distribution center systems for both pharmacy and OTC products. They include an inventory-tracking system, a real-time order tracking system, an executive information system, and an inventory replenishment system.
To enhance the online and offline experience for our pharmacy customers, we have integrated some of our information and pharmacy systems with Rite Aid’s systems. Rite Aid has granted us a nonexclusive, fully paid license to the Rite Aid systems that are integrated with our systems, subject to third-party rights to such technology. We license database, operating system, and hardware components from third parties.
Relationship with Rite Aid
Through our agreements with Rite Aid, we have access to Rite Aid customers through the RiteAid.com website and the Rite Aid online store, which is powered by the drugstore.com website. Customers of the RiteAid.com website can purchase pharmacy products either from the drugstore.com mail-order pharmacy, which ships to the customer from our distribution center. Rite Aid adjudicates and collects insurance reimbursement payments for prescription medications on our behalf.
Rite Aid also pays us ongoing marketing service fees for the continued marketing of Rite Aid’s local pick-up offering on the drugstore.com site. As part of our relationship with Rite Aid, we agreed to certain exclusivity provisions that limit our ability to promote, or to affiliate with, any service that would be competitive to the Rite Aid LPU pharmacy service.
5
Table of Contents
We purchase most of our pharmaceutical inventory and our supply of Rite Aid private label products through Rite Aid or its wholesale partners. This arrangement enables us to take advantage of Rite Aid’s volume discounts and favorable credit terms. As a result of this agreement, Rite Aid is one of our largest suppliers. We also benefit from access to many of Rite Aid’s relationships with insurance companies and PBMs, which enables us to meet the needs of more customers because of the availability of insurance coverage to those customers.
We license certain Rite Aid information technology and pharmacy systems, which we currently use to adjudicate and process pharmacy orders.
In September 2008, we entered into an agreement to build, host, and process and fulfill all orders for Rite Aid’s online store for non-prescription, over-the-counter products, for which we receive a portion of the contribution margin, defined as net sales, less direct costs of these sales and the incremental cost of fulfilling, processing and delivering the orders, for each order. Under the terms of the agreement, Rite Aid will market the Rite Aid online store to its customer base through in-store, email, direct mail and other marketing vehicles to generate and maintain traffic to the Rite Aid online store.
Competition
The market for health, beauty, wellness, vision, and pharmacy products is intensely competitive and highly fragmented. Our competitors in the OTC segment include chain drugstores, mass market retailers, warehouse clubs, supermarkets, and, with respect to prestige beauty, health, and spa products, specialty retailers and major department stores. In our mail-order pharmacy segment, we compete with chain drugstores, PBMs, insurers and other health care providers, mail-order prescription drug providers, and other online pharmacies, both domestic and foreign. Foreign online pharmacies and “rogue” online pharmacies can often sell drugs to U.S. residents at a lower price because they do not comply with U.S. pharmacy regulations, are not subject to U.S. regulatory oversight, or both. Our competitors in the vision segment include other online providers of contact lenses, national optical chains, eye care professionals, and mass-market retailers and warehouse clubs that provide prescription vision services. In addition, we compete with Internet portals and online service providers that feature shopping services and with other online or mail-order retailers that offer products within one or more of our business segments.
During the recent economic downturn, we have seen and expect to see continued price competition and elevated response rates to coupons and other promotional offers by increasingly price-conscious customers. That said, we have found that overall orders are less affected by the economic slowdown, due in part to our value-pricing and the non-discretionary nature of many of our products.
We believe that the principal competitive factors in our market segments include: brand awareness and preference, company credibility, product selection and availability, convenience, price, actual or perceived value, website features, functionality and performance, ease of purchasing, customer service, privacy, quality and quantity of information supporting purchase decisions (such as product information and reviews), and reliability and speed of order shipment.
Intellectual Property
We regard our intellectual property as critical to our future success, and we rely on a combination of patent, copyright, trademark, service mark, and trade secret laws, as well as contractual restrictions to establish and protect our proprietary rights in products and services. We own a number of domain names, hold three patents and have applied for seven others, have registered several trademarks, and have filed applications for the registration of a number of our other trademarks and service marks in the United States as well as several other countries. We have licensed in the past, and expect to license in the future, some of our proprietary rights to third parties.
6
Table of Contents
Seasonality
Our OTC business is subject to seasonal variations in demand. Historically, the fourth quarter of each year has been our strongest OTC sales quarter, primarily because of increased online shopping and our greater marketing efforts during the holiday season as well as increased purchases by customers using funds from flexible spending accounts. We do not believe that our vision or mail-order pharmacy business segments are substantially affected by seasonality.
Employees
As of January 3, 2010, we had approximately 855 full-time employees. However, employment levels fluctuate due to seasonal variations in our OTC business, and we hire independent contractors and temporary employees as needed to address demand. None of our employees is represented by a labor union, and we consider our employee relations to be good.
Available Information
We file with, and furnish to, the Securities and Exchange Commission, or SEC, periodic reports, proxy statements, and other information. We make these documents available, free of charge, on our website at www.investor.drugstore.com as soon as reasonably practicable after we electronically file them with, or furnish them to, the SEC.
Directors and Officers
The following tables provide information regarding our directors and officers as of the date of this annual report:
Directors
| Name |
Age | Position | ||
| Dawn G. Lepore |
55 | President, Chief Executive Officer and Chairman of the Board, drugstore.com, inc. | ||
| Richard W. Bennet III |
57 | President and CEO, Direct Holdings Worldwide | ||
| Geoffrey R. Entress |
46 | Venture Partner, Voyager Capital | ||
| Jeffrey M. Killeen |
56 | Chairman and CEO, GlobalSpec, Inc. | ||
| William D. Savoy |
45 | Consultant | ||
| Gregory S. Stanger |
45 | Private Investor |
Executive Officers
| Name |
Age | Position | ||
| Dawn G. Lepore |
55 | President, Chief Executive Officer, and Chairman of the Board | ||
| Yukio Morikubo |
50 | Vice President, Strategy, General Counsel and Secretary | ||
| Robert Potter |
44 | Vice President, Chief Accounting Officer | ||
| Tracy Wright |
38 | Vice President, Chief Finance Officer |
Dawn G. Lepore has served as President, Chief Executive Officer and Chairman of the Board of drugstore.com since October 2004. Ms. Lepore served as Vice Chairman—Active Trader, Technology, Operations, Administration and Business Strategy of The Charles Schwab Corporation, or CSC, from August 2003 to October 2004. CSC, through Charles Schwab & Co., Inc., or Schwab, and its other operating subsidiaries, is a financial services firm. Ms. Lepore served as Vice Chairman—Technology, Active Trader,
7
Table of Contents
Operations, and Administration of CSC and Schwab from May 2003 until August 2003, as Vice Chairman—Technology, Operations and Administration of CSC and Schwab from July 2002 until May 2003, as Vice Chairman—Technology and Administration of CSC and Schwab from 2001 to 2002, as Vice Chairman and Chief Information Officer of CSC and Schwab from 1999 to 2001 and as Executive Vice President and Chief Information Officer of CSC and Schwab from 1993 to 1999. She joined Schwab in 1983. Ms. Lepore serves as a director of eBay Inc. and The New York Times Company.
Yukio Morikubo has served as Vice President, General Counsel and Secretary of drugstore.com since November 2006 and as Vice President, Strategy since April 2007. From April 2005 to September 2006, Mr. Morikubo was Vice President, General Counsel and Corporate Secretary of Advanced Digital Information Corporation, a provider of intelligent data storage hardware and software solutions that was acquired in August 2006 by Quantum Corporation. He served as Chief Counsel, International of Cingular Wireless, LLC, formerly AT&T Wireless Services, Inc., a wireless service provider, from 1996 to 1999 and again from 2000 until April 2005. Mr. Morikubo previously practiced with the law firm of Perkins Coie LLP and served as an auditor and tax consultant with KPMG LLP.
Robert Potter has served as Vice President, Chief Accounting Officer of drugstore.com since May 2008, Chief Accountant since December 2006, and as Senior Director and Corporate Controller for drugstore.com from 2004 to 2006. Prior to joining drugstore.com, he served as Corporate Controller for Midstream Technologies, Inc., a technology company, from 2000 to 2004. Mr. Potter previously held senior positions with Mosaix, Inc., PHAMIS, Inc., Aldus Corporation and Ernst & Young LLP.
Tracy Wright has served as Vice President, Chief Finance Officer of drugstore.com since May 2008, Vice President of Financial Planning and Analysis since August 2007, and as Senior Director of Financial Planning and Analysis from 2003 to July 2007. Prior to joining drugstore.com, Ms. Wright held financial leadership roles at Western Wireless International, Freeinternet.com, and PriceWaterhouseCoopers LLP.
Non-Executive Officers
Jon Axelsson was appointed Vice President of Operations in June 2009. He joined drugstore.com in 2008. Axelsson previously held management positions with Wawa, Inc., QVC, Inc., May Department Stores, and UPS.
Perry Evoniuk was appointed Vice President, Enterprise Architecture in January 2009. Mr. Evoniuk joined drugstore.com in 1999 and has held several positions managing development and implementation of our web store infrastructure. Prior to joining drugstore.com, Mr. Evoniuk served in research and development positions at Attachmate Corporation, a host connectivity provider, and at Hughes Aircraft, an aerospace and defense company.
Luke Friang has served as Vice President and Chief Information Officer of drugstore.com since January 2006. From 2001 to 2005, Mr. Friang was senior director of e-commerce technologies at Costco Wholesale Corporation, a membership warehouse retailer. Mr. Friang held a variety of positions from 1997 to 2001 in the e-commerce technology operations groups at The Spiegel Group, an apparel and home furnishings retailer.
Robert Hargadon has served as Vice President, Human Resources of drugstore.com since November 2006. Mr. Hargadon served as the General Manager, Corporate Learning and Development for Microsoft Corporation, a software company, from 2005 to 2006. Mr. Hargadon was at Boston Scientific, a medical device developer and manufacturer, from 1997 to 2005, initially as the Vice President, International Human Resources and later as the Vice President, U.S. Human Resources. From 1993 to 1997, Mr. Hargadon was the Vice President, Training and Development, Retail for Fidelity Investments, a financial services company. He has also worked as a consultant on a wide range of leadership, human resource and organization development assignments.
Julie Johnston has served as Vice President, OTC Merchandising of drugstore.com since December 2006 and as the Senior Category Manager for Personal Care with drugstore.com from 2000 to 2006. From 1992 to
8
Table of Contents
1999, Ms. Johnston served in a number of positions at Sears, Roebuck and Co., an international department store company, including Senior Buyer from 1996 to 1999.
Ronald E. Kelly has served as Vice President, Customer Care and Logistics of drugstore.com since June 2006, and as Senior Director of Site Development and Customer Care and Logistics for drugstore.com from 2003 to 2006. From 2001 to 2003, he served as Director of Customer Care with drugstore.com. From 1999 to 2001, Mr. Kelly served as a Senior Financial Analyst and later as Director of Procurement for drugstore.com.
David Lonczak was named as our Chief Marketing Officer in March 2007 and has served as our Vice President, Marketing since December 2006. In early 2006, Mr. Lonczak began serving as Senior Director of Marketing in Pharmacy for drugstore.com, and served as General Manager of Vision for drugstore.com from 2005 to 2006. From 2002 to 2005, Mr. Lonczak served in a number of positions with Cingular Wireless, LLC, formerly AT&T Wireless Services, Inc., a wireless service provider, including Vice President, eCommerce from 2004 to 2005.
Kathleen McNeill has served as our Vice President of Beauty since December 2006. Ms. McNeill joined drugstore.com in June 2006 as our General Manager, Beauty. From 2005 to June 2006, Ms. McNeill served as Vice President of Flagship Stores with Bath and Body Works, a division of Limited Brands, Inc., a specialty retail company. From 2000 to 2005, Ms. McNeill served in a number of positions, including Skincare Merchandise manager with Sephora, USA, Inc., the cosmetic retailer division of Moët Hennessy Louis Vuitton, an international luxury products retailer.
Stan Pavlovsky was appointed Vice President, Vision Direct, in January 2009. Mr. Pavlovsky joined drugstore.com in 2004, in our financial planning and analysis group before moving over to our vision business. Prior to joining the company, Mr. Pavlovsky held positions in financial and business analysis at Microsoft Corporation, a software company, and The Boeing Company, an aerospace company and aircraft manufacturer.
| ITEM 1A. | RISK FACTORS |
You should carefully consider the following risks and uncertainties associated with our company and ownership of our securities. If any of the following risks actually occurs, our business, financial condition, or operating results could be materially adversely affected. This could cause the trading price of our common stock to decline, and you could lose all or part of your investment. Some statements in this annual report (including some of the following risk factors) are forward-looking statements. See the section entitled “Special Note Regarding Forward-Looking Statements” in Part I, Item 1 of this annual report.
Our revenue growth and profitability depends on the continued growth of demand for the products we offer.
Demand for many of our products, and, therefore, our business, is affected by changes in consumer preferences, general economic and business conditions, and world events. For example, macro-economic trends in the United States and abroad, threatened or actual terrorist attacks or armed hostilities (or the resulting security concerns), or natural disasters could create economic and consumer uncertainty and delays in and increased costs of product shipments to and from us, which may decrease demand. A softening of demand, for whatever reason, may result in decreased revenue or growth, which could prevent us from achieving or sustaining profitability. Revenue growth or profitability may not be sustainable and our company-wide and by-segment percentage growth rates may decrease in the future.
Our revenues and operating results may vary significantly from quarter to quarter due to a number of factors, including:
| • | our ability to retain and increase sales to existing customers, attract new customers, and satisfy our customers’ demands; |
| • | the frequency and size of customer orders and the quantity and mix of products our customers purchase; |
9
Table of Contents
| • | changes in consumer acceptance and usage of the Internet, online services, and e-commerce; |
| • | the price we charge for our products and for shipping those products, or changes in our pricing policies or the pricing policies of our competitors; |
| • | the extent to which we offer free shipping or other promotional discounts to our customers; |
| • | our ability to acquire merchandise, manage inventory, and fulfill orders; |
| • | technical difficulties, system downtime, or interruptions; |
| • | timing and costs of upgrades and developments in our systems and infrastructure; |
| • | timing and costs of marketing and other investments; |
| • | disruptions in service by shipping carriers; |
| • | the introduction by our competitors of websites, products, or services; |
| • | the extent of reimbursements available from third-party payors; |
| • | an increase in the price of fuel used in the transportation of packages, or an increase in the prices of other energy products, primarily natural gas and electricity, which are used in our operating facilities; |
| • | changes in the mix of products purchased by our customers. (for example, if customers purchase a higher proportion of generic prescription drugs than we anticipate, which generic prescription drugs have lower prices and higher margins than branded drugs, our net sales may decrease while our product margins increase; moreover, if our OTC net sales do not grow as much as we anticipate or the proportion of OTC net sales compared to net sales in other segments is lower than we anticipate, our margins will be lower than we currently plan); |
| • | the effects of strategic alliances, potential acquisitions, and other business combinations, and our ability to successfully and timely integrate them into our business; and |
| • | changes in government regulation. |
In addition, our operating expenses are largely based on anticipated revenue trends and a high percentage of our expenses are fixed in the short term. As a result, a delay in generating or recognizing revenue for any reason could result in substantial additional operating losses.
A portion of our revenues is also seasonal in nature. Traditional retail seasonality affects our OTC business, resulting in higher revenues in the fourth quarter of each year as compared to other quarters. We may be unable to manage the increased sales effectively, and increases in inventory in anticipation of holiday sales could negatively affect our cash flow. In addition, sales of some health and beauty products are driven, to some extent, by seasonal purchasing patterns and seasonal product changes, such as diet products, cold and flu medications, and products with holiday-specific varieties. Consumer fads and other changes in consumer trends may also cause shifts in purchasing patterns, resulting in significant fluctuations in our operating results from one quarter to the next.
Our evolving business model and the unpredictability of our industry make it difficult for us to forecast accurately the level or source of our revenues and our rate of growth. We believe that, because of these factors, historical trends and quarter-to-quarter comparisons of our operating results are not necessarily meaningful and should not be relied on as an indicator of our future performance. In the past, our operating results have sometimes been, and it is likely that in some future quarter or quarters they will be, below the expectations of investors and securities analysts. In that event, the price of our common stock may fall substantially, and stockholders may lose all or a part of their investment.
10
Table of Contents
If our marketing efforts are not effective at attracting and retaining customers at an acceptable cost, we will be unable to achieve consistent profitability.
If we do not maintain our brand and continue to increase awareness of our products and services, we may not build a critical mass of customers. Promoting and positioning our brand depends largely on the success of our marketing efforts and our ability to provide consistent, high quality customer experiences. We believe that, because we are a small company with low public brand awareness, achieving significant market awareness will require significant marketing expense. To promote our brand and our products and services, we have incurred and expect to continue to incur substantial expense in our marketing efforts both to attract and to retain customers. Our promotional activities may not be effective at building our brand awareness and customer base to the extent necessary to generate sufficient revenue to become consistently profitable. Search engine and other online marketing initiatives comprise a substantial part of our marketing efforts, and our success depends in part on our ability to manage costs associated with these initiatives, or to find other channels to acquire and retain customers cost-effectively. The demand for and cost of online advertising has been increasing and may continue to increase. An inability to acquire and retain customers at a reasonable cost would increase our operating costs and prevent us from maintaining profitability.
If we fail to integrate, maintain or enhance our strategic relationships to help promote our website and expand our product offerings, our development could be hindered.
We have entered into a number of strategic partnerships to build, host, and process and fulfill orders, most recently, with Rite Aid Corporation (Rite Aid), Medco Health Solutions, Inc. (Medco), and Luxottica Group S.p.A. (Luxottica). We believe that our relationships and other strategic partners, Internet portals, third-party distributors, and manufacturers are critical to attract customers, to facilitate broad market acceptance of our products and the drugstore.com brands, and to enhance our sales and marketing capabilities. We expect to continue to evaluate and consider a wide array of potential strategic partnerships as part of our growth strategy. At any given time we may be engaged in discussions or negotiations with respect to one or more of these types of transactions. Any of these transactions could be material to our financial condition and results of operations. If we are unable to develop or maintain key relationships, our ability to attract customers would suffer and our business would be adversely affected. The process of integrating and maintaining strategic partnerships may create unforeseen operating difficulties and expenditures and is itself risky. Such risks include a diversion of management time, as well as a shift of focus from operating the businesses to issues related to integration and administration of the strategic partnerships, partners having interest, strategies or goals inconsistent with ours, business decisions or other actions of our partners may result in harm to our reputation or adversely affect the value of our investment in the partnership, and such partnerships require a significant investment of time and resources, and we may not generate sufficient revenues to offset this investment. We may incur additional operating losses and expenses as a result of the operations of the strategic partnerships. In addition, we are subject to many risks beyond our control that influence the success or failure of our strategic partners. Our business could be harmed if any of our strategic partners were to experience financial or operational difficulties or if other corporate developments adversely affect their performance under their agreements with us.
Our future growth strategy may depend in part on our ability to acquire complementary or strategic businesses. Any such acquisitions could result in dilution, operating difficulties, difficulties in integrating acquired businesses, and other harmful consequences.
We have acquired, and may in the future acquire, complementary or strategic businesses, technologies, services, and products as part of our strategy to increase our net sales and customer base. The process of integrating acquisitions into our business and operations has resulted in, and may in the future result in:
| • | unforeseen operating difficulties and expenditures; |
| • | disruption of our ongoing business, including loss of management focus on existing businesses and resources that would otherwise be available for operation, ongoing development and expansion of our business; |
11
Table of Contents
| • | problems retaining key personnel of the businesses that we acquire; |
| • | additional operating losses and expenses of the businesses we acquired or in which we invested; |
| • | the potential impairment of tangible assets, such as inventory, and intangible assets and goodwill acquired in the acquisitions; |
| • | the potential impairment of customer and other relationships of the business that we acquired or in which we invested or our own customers as a result of any integration of operations; |
| • | the difficulty of incorporating acquired technology and rights into our offerings and unanticipated expenses related to such integration; |
| • | the difficulty of integrating a new company’s accounting, financial reporting, management, information, human resource and other administrative systems to permit effective management, and the lack of control if such integration is delayed or not implemented; |
| • | the difficulty of implementing at companies we acquire the controls, procedures and policies appropriate for a larger public company; and |
| • | for foreign transactions, additional risks related to the integration of operations across different cultures and languages, and the economic, political, and regulatory risks associated with specific countries. |
To the extent we miscalculate our ability to integrate and properly manage acquired businesses, technologies, services, and products, or we depend on the continued service of acquired personnel who choose to leave, we may have difficulty in achieving our operating and strategic objectives. In addition, we may not realize the anticipated benefits of any acquisition.
We may be subject to unanticipated problems and liabilities of acquired companies. While we attempt in our acquisitions to determine the nature and extent of any pre-existing liabilities, and to obtain indemnification rights from the previous owners for acts or omissions arising prior to the date of acquisition, resolving issues of liability between the parties could involve a significant amount of time, manpower and expense. If we or any of our subsidiaries were to be unsuccessful in a claim for indemnity from the seller of a business that we acquire, the liability imposed on us or our subsidiary could have a material adverse effect on us. We may not be able to assimilate successfully the additional personnel, operations, acquired technology or products or services into our business. Further, the physical expansion in facilities that could occur as a result of any acquisition may result in disruptions that could seriously impair our business. In addition, due to the recent disruptions in the global financial markets, valuations supporting our acquisitions could change rapidly, and we could determine that such valuations have experienced impairments which could adversely impact our financial results.
We may be unable to identify suitable acquisition opportunities or to negotiate and complete acquisitions on favorable terms, or at all. In addition, any future acquisitions may require substantial capital resources, and, to the extent it is available, we may need to obtain additional capital or financing, from time to time, to fund these activities. This could result in potentially dilutive issuances of equity securities or the incurrence of debt, contingent liabilities, or amortization or impairment expenses related to goodwill and other intangible assets, any of which could harm our business, financial condition, and results of operation. Sufficient capital or financing may not be available to us on satisfactory terms, or at all.
In connection with our acquisition of Salu, Inc., we will enter a new line of business – clinical skin care and spa products – with greater targeted international operations. We cannot assure you that our expansion into this business line will succeed.
We will enter the clinical skin care and spa products business with our acquisition of Salu. We cannot assure that our expansion into this businesses will succeed. We have limited experience in the sale of clinical skin care and spa products, particularly to targeted international markets. While we have operations in Canada, we have not previously had operations outside of North America. Our entry into this area will require us to devote substantial financial, technical, managerial and other resources. As noted above, international expansion comes
12
Table of Contents
with substantial risks. We may not be able to successfully integrate the additional personnel, operations, acquired technology or products or services of Salu, Inc. into our business and there is no guarantee that key personnel of Salu will continue to work for us.
In addition, in connection with the acquisition, certain senior management employees of Salu will be eligible to receive performance incentive payments in cash for each of the 2010 and 2011 fiscal years with an aggregate value of up to $2.5 million if certain financial performance targets are achieved. These bonuses may limit our cash available to make future acquisitions and operate our business, and may affect our ability to obtain alternative financing. It is uncertain whether we will benefit financially from this acquisition.
We are expanding into international markets, causing our business to be increasingly susceptible to international business risks and challenges that could affect our profitability.
Through our contract with E4X, Inc. and certain operations of our newly acquired subsidiary, Salu, Inc., we sell certain OTC products in international markets and expect to expand into international markets more aggressively in the future. To date, our international business activities have been limited. Our lack of a track record outside the United States increases the risks described below. In addition, our experience in the United States may not be relevant to establishing a business outside the United States. Accordingly, our international expansion strategy is subject to significant execution risk, and we cannot assure that our strategy will be successful. International sales are subject to inherent risks that could adversely affect our operating results, including:
| • | the risk that our marketing strategies will not translate well to international markets and that we will need to expend resources to adapt those strategies for a variety of new markets; |
| • | the need to develop new supplier and manufacturer relationships; |
| • | the need to comply with additional U.S. and foreign laws and regulations to the extent applicable, including but not limited to, restrictions on advertising practices, regulations governing online services, restrictions on importation of specified or proscribed items, importation quotas, consumer protection laws, enforcement of intellectual property rights, laws dealing with consumer and data protection, privacy, encryption, and restrictions on pricing or discounts; |
| • | unexpected changes in international regulatory requirements and tariffs, and geopolitical events such as war and terrorist attacks; |
| • | managing fluctuations in currency exchange rates; |
| • | difficulties in staffing and managing foreign operations; |
| • | greater difficulty in accounts receivable collection from overseas customers; |
| • | potential adverse tax consequences in the U.S. and in foreign jurisdictions; and |
| • | uncertain political and economic climates. |
To the extent we generate significant international sales, any negative impact on our international operations could negatively affect our revenues and operating results. In addition, it is costly to establish, develop, and maintain international operations and websites that promote our brand internationally, which could further harm our revenues and operating results.
If the recent global economic crisis has a disproportionate impact on our business or that of our significant partners and suppliers, our business and results of operations would be harmed.
The recent deterioration in the U.S. and global credit markets and the financial services industry could negatively affect our business or that of our significant partners and suppliers. Tightening of credit and the recent decline in the housing market has led to a lack of consumer confidence and a reduction in business activity
13
Table of Contents
generally, which could significantly harm our revenues and operating results. In addition, our vendors could experience serious cash flow or other financial or operational problems due to the current economic conditions. As a result, our vendors may attempt to increase prices, alter payment terms, or seek other relief in order to offset these problems. Vendors may further be forced to reduce production, shut down operations or file for bankruptcy protection, which in some cases could have a significant impact on our ability to serve the market’s needs. In addition, access to credit from financial institutions may not be available. We do not expect the current economic conditions to improve significantly in the near future, and any continuation and/or worsening of the economic environment could intensify the adverse affects of these difficult market conditions.
We may be unable to obtain the additional capital we need in the future to support our growth.
Our available funds may not be sufficient to meet all of our long-term business development requirements, and we may seek to raise additional funds through public or private debt or equity financings. Due to the recent tightening of the credit and equity markets, any additional financing that we may need may not be available on terms favorable to us, or at all. If adequate funds are not available or are not available on acceptable terms, our strategic flexibility or ability to develop and grow our business may be significantly limited.
We face significant competition from both traditional and online retailers.
The market segments in which we compete are rapidly evolving and intensely competitive, and we have many competitors in different industries, including both the retail and e-commerce services industries. These competitors include chain drugstores, mass-market retailers, warehouse clubs, supermarkets, specialty retailers, major department stores, PBMs, insurers and health care providers, mail-order pharmacies (legitimate and illegitimate), national optical chains, eye care professionals, Internet portals and online service providers that feature shopping services, and various online stores that offer products within one or more of our product categories. Many of our current and potential competitors have longer operating histories, larger customer bases, greater brand recognition, and significantly greater financial, marketing, and other resources than we have. They may be able to secure merchandise from vendors on more favorable terms, operate with a lower cost structure, adopt more aggressive pricing policies, or devote more resources to technology development and marketing than we do. In addition, other companies in the retail and e-commerce service industries may enter into business combinations or alliances that would strengthen their competitive positions and prevent them, their affiliated companies, or their strategic partners from entering into relationships with us. An inability to enter into or maintain relationships with major PBMs, insurance companies, or managed care organizations could be a major competitive disadvantage to us.
As various Internet market segments obtain large, loyal customer bases, participants in those segments may expand into the market segments in which we operate. In addition, new and expanded Web technologies may further intensify the competitive nature of online retail and allow our competitors to duplicate many of the products, services, and content offered on our site. We believe that the Internet facilitates entry into the retail market and comparison shopping and renders it inherently more competitive than conventional retailing formats. We expect competition in the e-commerce channel to intensify, and this increased competition may reduce our ability to grow and, as a result, reduce our revenue, increase our operating expenses, or both, and harm our business.
In addition, we face competition from online pharmacies outside the United States. Although it is currently illegal to re-import prescription drugs into the United States from any foreign country, a growing number of U.S. consumers seek to fill their prescriptions through Canadian and other foreign online pharmacies, and a number of state and local governments have set up websites directing their constituents to Canadian pharmacies. The U.S. Food and Drug Administration, or FDA, has taken only limited action to date, and may not take aggressive action in the future, against those who illegally re-import prescription drugs or support or facilitate illegal re-importation. The U.S. Congress has enacted legislation governing online pharmacies that imposes restrictions on operations and other regulatory requirements on online pharmacies that do not apply to our brick-and-mortar or foreign-based online counterparts. In addition, legislation allowing for re-importation of prescription drugs by individuals for personal
14
Table of Contents
use has repeatedly been introduced. If such legislation were to be enacted, or if consumers increasingly use foreign-based online prescription drug websites instead of U.S.-based online pharmacies, such as ours, to fill their prescription needs, our business and operating results could be harmed.
If people or property are harmed by the products we sell, product liability claims could damage our business and reputation.
Some of the products we sell may expose us to product liability claims relating to personal injury, death, or property damage caused by these products and may require us to take actions such as product recalls. Any such product liability claim or product recall may result in adverse publicity regarding us and the products we sell, which may harm our reputation. If we are found liable under product liability claims, we could be required to pay substantial monetary damages. Further, even if we successfully defend ourselves against this type of claim, we could be forced to spend a substantial amount of money in litigation expenses, our management could be required to spend valuable time in the defense against these claims, and our reputation could suffer, any of which could harm our business. Some of our vendors do not indemnify us against product liability. Further, our liability insurance may not be adequate to protect us from all liability that may be imposed as a result of these claims, and we cannot be certain that insurance will continue to be available to us on economically reasonable terms, or at all. Any imposition of product liability that is not covered by vendor indemnification or our insurance could harm our business, financial condition, and operating results.
Most of our fulfillment operations and all of our owned inventory are located in our distribution facilities, and any significant disruption of these centers’ operations would hurt our ability to make timely delivery of our products.
We conduct most of our fulfillment operations from our distribution facilities in Swedesboro, New Jersey. Our primary distribution center in Swedesboro and our inventory storage facility in Logan Township, New Jersey house our entire product inventory. In January 2010, we closed our Ferndale, Washington facility and transferred our vision inventory to our distribution facility in Swedesboro, New Jersey. Additionally, our newly acquired subsidiary, Salu, Inc., has a third-party fulfillment partner in Columbus, Ohio. A natural disaster or other catastrophic event, such as an earthquake, fire, flood, severe storm, break-in, server or systems failure, terrorist attack, or other comparable event at our New Jersey facilities or the fulfillment partner’s Ohio facilities would cause interruptions or delays in our business and loss of inventory and could render us unable to process or fulfill customer orders in a timely manner, or at all. Further, we have no formal disaster recovery plan, and our business interruption insurance may not adequately compensate us for losses that may occur. In the event that a significant part of our New Jersey facilities or the fulfillment partner’s Ohio facilities were destroyed or our operations were interrupted for any extended period of time, our business, financial condition, and operating results would be harmed.
We are dependent on a limited number of fulfillment and distribution partners. If we are unable to obtain shipments of product from our vendors and deliver merchandise to our customers in a timely and cost-effective manner, our business and results of operations would be harmed.
We purchase most of our pharmaceutical inventory and our supply of Rite Aid private label products through Rite Aid or its wholesale partners. Our business could be significantly disrupted if Rite Aid were to breach its contract or suffer adverse developments that affect its ability to supply products to us. If for any reason Rite Aid is unable or unwilling to supply products to us in sufficient quantities and in a timely manner, we may not be able to secure alternative fulfillment partners on acceptable terms in a timely manner, or at all.
We cannot control all of the various factors that might affect our timely and cost-effective procurement of products from our vendors and delivery of products to our customers. We use a third-party fulfillment partner in Columbus, Ohio to fulfill all Salu orders. We also rely on a limited number of third-party carriers for shipments of products to and from our and our distribution facilities and those of our third-party fulfillment partner and to customers. We are therefore subject to the risks, including increased fuel costs, security concerns, labor disputes,
15
Table of Contents
union organizing activity, and inclement weather, associated with our carriers’ ability to provide product fulfillment and delivery services to meet our distribution and shipping needs. Failure to procure and deliver merchandise, either to us or our fulfillment partner(s) or to our customers, in a timely and accurate manner would harm our reputation, the drugstore.com brands, our business, and our results of operations. In addition, any increase in fulfillment costs and expenses could adversely affect our business and operating results.
If we are unable to optimize management of our distribution centers, we may be unable to meet customer demand.
Our ability to meet customer demand may be significantly limited if we do not successfully operate our distribution centers, including in connection with any plans to move our Salu fulfillment operations to our own distribution centers. Because it is difficult to predict sales volume, we may be unable to manage our facilities in an optimal way, which may result in excess or insufficient inventory, warehousing, fulfillment, or distribution capacity. In addition, failure to control product damage and shrinkage effectively through security measures and inventory management practices could adversely affect our operating margins. Our margins and revenues may also be affected if we are unable to obtain products from manufacturers and wholesalers timely and on favorable terms. In addition, if we need to increase our distribution capacity sooner than anticipated, including in connection with any plans to move our Salu fulfillment operations, that expansion would require additional financing that may not be available to us on favorable terms when required, or at all.
Under our distribution agreement with GNC, and consignment arrangements with other partners, we maintain inventory of third parties’ products in our primary distribution center, thereby increasing the complexity of tracking inventory in, and the operation of, our distribution center. Our failure to properly handle third party inventory that we hold would result in unexpected costs and other harm to our business and reputation.
We need to manage changing and expanding operations.
Over the past several years, we have significantly expanded our operations, including through Salu, and we anticipate that we will continue to expand. Our past growth has placed, and we expect that our anticipated future operations and expansion will continue to place, a significant strain on our managerial, operational, financial, and other resources. Some of the administrative and operational challenges we have faced in the past as a result of our expansion and seasonal growth include the management of an expanded number of product offerings; the assimilation of systems and technologies of acquired companies; increased pressure on our senior management; and increased demand on our systems and internal controls. Our ability to manage our operations and expansion effectively depends on the continued development and implementation of plans, systems, and controls that meet our operational, financial, and management needs. If we are unable to develop or implement these plans, systems, or controls or otherwise manage our operations and growth effectively, we will be unable to increase gross margins or achieve consistent profitability, and our business will be harmed.
The seasonality of our business places increased strain on our operations.
We expect the largest amount of our net sales to occur during our fourth quarter. If we do not stock or restock popular products in sufficient amounts such that we fail to meet customer demand, it could significantly affect our revenue and our future revenue. If we overstock products, we may be required to take significant inventory markdowns or write-offs, which could reduce our gross margins. We may experience an increase in our shipping cost due to complimentary upgrades, split-shipments, and additional long-zone shipments necessary to ensure timely delivery for the holiday season. If our systems and processes are not prepared to address peak volumes during high demand seasons, holidays, and events, we may experience system interruptions that make our websites unavailable or prevent us from efficiently fulfilling orders, which may reduce the volume of goods we sell and the attractiveness of our products and services. In addition, we may be unable to staff our distribution centers adequately during these peak periods, and delivery companies may be unable to meet the seasonal demand.
16
Table of Contents
A disruption in our operations could materially and adversely affect our business, results of operations and financial condition.
Any disruption to our operations, including system, network, telecommunications, software or hardware failures, and any damage to our physical locations, could materially and adversely affect our business, results of operations and financial condition.
Our operations are subject to the risk of damage or interruption from:
| • | fire, flood, earthquake or other natural disasters; |
| • | power losses and interruptions; |
| • | Internet, telecommunications or data network failures; |
| • | physical and electronic break-ins or security breaches; |
| • | computer viruses; |
| • | acts of terrorism; and |
| • | other similar events. |
If any of these events occur, it could result in interruptions, delays or cessations in service to customers of our partners’ e-commerce businesses and adversely impact our partners’ e-commerce businesses. These events could also prevent us from fulfilling orders for our partners’ e-commerce businesses. Our partners might seek significant compensation from us for their losses. Even if unsuccessful, this type of claim likely would be time-consuming and costly for us to address and damaging to our reputation.
Our primary data center is located at the facilities of a third-party hosting company. We do not control the security, maintenance or operation of these facilities, which are also susceptible to similar disasters and problems. Further, we have no formal disaster recovery plan, and our insurance policies may not cover us for losses related to these events, and even if they do, they may not adequately compensate us for any losses that we or our partners’ may incur. Any system failure that causes an interruption of the availability of our partners’ e-commerce businesses could reduce the attractiveness of our partners’ e-commerce businesses to consumers and result in reduced revenues, which could materially and adversely affect our business, results of operations and financial condition.
We have significant inventory risk.
We must maintain sufficient inventory levels to operate our business successfully and to meet our customers’ expectations that we will have the products they order in stock. However, we must also guard against the risk of accumulating excess inventory. We are exposed to significant inventory risks as a result of rapid changes in product cycles, changes in consumer tastes, uncertainty of success of product launches, seasonality, manufacturer backorders, and other vendor-related problems. In order to be successful, we must accurately predict these trends and events, which we may be unable to do, and avoid over- or under-stocking products. In addition, demand for products can change significantly between the time product inventory is ordered and the time it is available for sale. When we begin selling a new product, it is particularly difficult to forecast product demand accurately. A failure to optimize inventory would increase our expenses if we have too much inventory, and would harm our margins by requiring us to make split shipments for backordered items or pay for expedited delivery from the manufacturer if we had insufficient inventory. In addition, we may be unable to obtain certain products for sale on our websites as a result of general shortages (for example, in the case of some prescription drugs), manufacturer policies (for example, in the case of some contact lenses and prestige beauty items), manufacturer or distributor problems, or popular demand. Failure to have inventory in stock when a customer orders it could cause us to lose that order or that customer. The acquisition of some types of inventory, or inventory from some of our sources, may require significant lead time or prepayment, and this inventory may not be returnable. We carry a broad selection of products and significant inventory levels of a substantial number of
17
Table of Contents
products, and we may be unable to sell this inventory in sufficient quantities or during the relevant selling seasons. The occurrence of one or more of these inventory risks may adversely affect our business and operating results.
Our vendor relationships subject us to a number of risks.
We have significant vendors that are important to our sourcing of merchandise. We do not have long-term arrangements with most of our vendors to guarantee availability of merchandise, particular payment terms, or extension of credit limits. If our current vendors were to stop selling merchandise to us on acceptable terms, we may not be able to acquire merchandise from other vendors in a timely and efficient manner and on acceptable terms, or at all.
Our relationship with Rite Aid involves many risks and restricts our ability to promote, contract with, or operate traditional retail stores.
We have entered into a series of agreements with Rite Aid that involve many aspects of our respective businesses and the operation of our respective websites, the fulfillment of orders, and the extension of Rite Aid’s insurance relationships to cover prescriptions processed by us. We currently use Rite Aid’s systems to process prescription orders in our mail-order pharmacy segment. If we were unable to maintain our relationship with Rite Aid and could not implement an alternative method for processing prescriptions, through either our own systems or those of a third party, we would be unable to maintain our pharmacy operations. The loss of our pharmacy sales, which comprised approximately 9% of our net sales in fiscal 2009, would greatly reduce our revenue and harm our business.
Our arrangement with Rite Aid is complex and requires substantial effort and attention to operate and manage successfully. We may not be able to accommodate changes that Rite Aid may make to its systems that we use, which may limit our ability to operate our business.
While Rite Aid has committed to promoting the Rite Aid online store in its stores and in its advertising, we do not control the choice of ads, and this form of advertising may not generate traffic to or orders from the Rite Aid online store. In addition, a substantial alteration of Rite Aid’s marketing efforts, or a breach by Rite Aid of its marketing obligations, could adversely affect revenues generated by the Rite Aid online store. Our relationship with Rite Aid also substantially broadens our ability to provide prescription medications to consumers with insurance reimbursement plans, it may not allow all of our potential customers to purchase these medications from drugstore.com and receive insurance reimbursement, which could adversely affect consumer perceptions of us and our revenues. In addition, our relationship with Rite Aid contains limitations on the scope of our marketing activities, including restrictions on our ability to promote, or to affiliate with, any service that would be competitive to the Rite Aid LPU pharmacy service or Rite Aid online store. These restrictions could limit our flexibility and ability to grow our business if our relationship with Rite Aid is not successful.
We face uncertainty related to pharmaceutical costs and pricing, which could affect our revenues and profitability.
Pharmacy sales accounted for approximately 9% of our total revenue in fiscal year 2009. Sales of our pharmacy products depend in part on the availability of reimbursement from third-party payors such as government health administration authorities, private health insurers, managed care organizations, PBMs, and other organizations. These organizations are increasingly challenging the price and cost-effectiveness of medical products and services. The efforts of third-party payors to contain costs often place downward pressures on profitability from sales of prescription drugs. In addition, our products or services may not be considered cost- effective, and adequate third-party reimbursement may not be available to enable us to maintain price levels sufficient to realize a profit.
In 2006, the Medicare Part D prescription drug benefit under the Medicare Prescription Drug Improvement and Modernization Act of 2003, or DIMA, became effective. As we expected, the Medicare Part D prescription
18
Table of Contents
drug benefit has negatively affected, and is likely to continue to have a negative impact on, our business. Medicare Part D prescription drug coverage will likely increase the number of senior citizens with prescription drug coverage and reduce the number of customers who pay for their prescription drugs themselves. Customers who choose to obtain coverage under a Medicare Part D plan will likely purchase fewer drugs, or no longer purchase drugs, from us. Because we are not currently processing claims for Medicare Part D, we will be able to serve Medicare D customers only when those customers elect to purchase outside of their Medicare Part D plan and purchase their prescriptions out-of-pocket, such as when the particular medication is not covered by the customer’s Medicare plans or when the customer’s purchase is not covered because of a deductible, co-payment, or other exclusion. Moreover, the DIMA calls for significant changes to the formulas the Medicare program uses to calculate its payments for prescription drugs, as well as introduction of managed care elements and changes to the administration of the drug benefit program. When fully implemented, these changes could exert downward pressure on prescription drug prices and payments by the government, even as the number of people who use the Medicare benefits to pay for prescription drugs increases. All of these factors could adversely affect our drug prices and dispensing fees, and ultimately could reduce our profit margins.
In addition, our revenues from prescription drug sales may also be affected by health care reform initiatives of federal and state governments, including proposals designed to address other government programs, prescription drug discount card programs, changes in programs providing for reimbursement for the cost of prescription drugs by third-party payors, and regulatory changes related to the approval process for prescription drugs. These initiatives could lead to the enactment of additional federal and state regulations that may adversely affect our prescription drug sales.
If we are unable to obtain insurance reimbursement coverage for our customers, our ability to sell pharmacy products online could decrease, which would harm our revenues.
To obtain reimbursement on behalf of our customers for the prescription products that they purchase on our website, we must maintain relationships with insurance companies, managed health organizations, and PBMs, either directly or through our relationship with Rite Aid. Many of our direct agreements with insurance companies, PBMs, and third-party benefits companies are short-term, may be terminated with less than 30 days’ prior notice, and are subject to unilateral amendment by the other party. If we are unable to establish, maintain, and leverage our direct relationships with insurers, PBMs, and third-party benefit companies, and to the extent Rite Aid is unable to maintain its relationships or if these relationships do not extend to cover the prescriptions we process, our ability to obtain reimbursement coverage for our customers would be reduced. This would reduce the number of customers that fill prescriptions through our website, which would harm our business, financial condition, and results of operations.
In addition, we must process each customer’s insurance application, which raises the costs of processing prescription orders and may delay the customer’s initial prescription order. Customers may not embrace our online insurance coverage procedure.
Any errors in filling or packaging the prescription drugs or contact lenses we dispense may expose us to liability and negative publicity.
Errors relating to prescriptions, dosage, and other aspects of the prescription medication and contact lens dispensing process may result in liability for us that our insurance may not cover. Because we distribute pharmaceutical products and contact lenses directly to the consumer, we are one of the most visible participants in the distribution chain and therefore have increased exposure to liability claims.
Our pharmacists are required by law to offer counseling, without additional charge, to our customers about medication, dosage, delivery systems, common side effects, and other information deemed significant by the pharmacists. Our pharmacists may have a duty to warn customers regarding any potential adverse effects of a prescription drug if the warning could reduce or negate those effects. In addition, our pharmacists provide
19
Table of Contents
information and respond to user inquiries on our websites and those of certain of our partners. This counseling is in part accomplished through e-mails to our customers, inserts included with the prescription, and in some circumstances, online postings, which may increase the risk of miscommunication because the customer is not personally present to receive the counseling or advice or may not have provided us with all relevant information. Although we also post product information on our website, customers may not read this information. Providing information on pharmaceutical and other products creates the potential for claims to be made against us for negligence, personal injury, wrongful death, product liability, malpractice, invasion of privacy, or other legal theories based on our product or service offerings. Our general liability, product liability, and professional liability insurance may not cover potential claims of this type or may not be adequate to protect us from all liabilities that may be imposed if any such claims were to be successful.
Errors by either us or our competitors may also produce significant adverse publicity either for us or for the online pharmacy or vision industries in general. Because of the significant amount of press coverage on Internet retailing and online pharmacies, we believe that we are subject to a higher level of media scrutiny than other pharmacy product channels. The amount of negative publicity that we or the online pharmacy or vision industries receive as a result of pharmacy or prescription processing errors could be disproportionate in relation to the negative publicity received by other pharmacies or eye care professionals making similar mistakes. We have no control over the pharmacy practices of our competitors, and we cannot ensure that our pharmacists or our prescription processing operate completely without error. We believe customer acceptance of our online shopping experience is based in large part on consumer trust, and errors by us or our competitors and related negative publicity could erode this trust or prevent it from growing. This could result in an immediate reduction in the amount of orders we receive, adversely affect our revenue growth, and harm our business and operating results.
Governmental regulation of our business could require significant expenditures, and failure to comply with regulations could result in civil and criminal penalties.
Our business is subject to extensive federal, state and local regulations. For example:
| • | entities such as drugstore.com engaging in the practice of pharmacy are subject to numerous federal and state regulatory requirements, including those relating to traditional pharmacy licensing and registration, the dispensing of prescription drugs, pharmacy record keeping and reporting, and the confidentiality, security, storage, and release of patient records, as well as additional online pharmacy requirements, including the Ryan Haight Online Pharmacy Consumer Protection Act of 2008 and related regulations; |
| • | the sale, advertisement, and promotion of, among other things, prescription, OTC and homeopathic medications, dietary supplements, medical devices, cosmetics, foods, and other consumer products that we sell are subject to regulation by the Food and Drug Administration, or FDA, the Federal Trade Commission, or FTC, the Consumer Product Safety Commission, and state regulatory authorities, as the case may be; and |
| • | our vision business is subject to the Fairness to Contact Lens Consumers Act and related regulations of the FTC, which requires all patients to renew their contact lens prescriptions annually and requires third-party contact lens sellers, like Vision Direct, to verify these prescriptions in accordance with specified procedures. |
As we expand our product and service offerings and more non-pharmaceutical products become subject to FDA, FTC, and other regulation, more of our products and services may become subject to regulation. In addition, regulatory requirements to which our business is subject may expand over time, and some of these requirements may have a disproportionately negative effect on Internet retailers. For example, the federal government and a majority of states now regulate the retail sale of OTC products containing pseudoephedrine that might be used as precursors in the manufacture of illegal drugs. As a result, we are currently unable to sell these products to customers residing in states that require retailers to obtain a physical form of identification or
20
Table of Contents
maintain a signature log. Some members of Congress have proposed additional regulation of Internet pharmacies in an effort to combat the illegal sale of prescription drugs over the Internet, and state legislatures could add or amend legislation related to the regulation of nonresident pharmacies. In addition to regulating the claims made for specific types of products, the FDA and the FTC may attempt to regulate the content included on websites that market products to consumers. Complying with regulations is time-consuming, burdensome, and expensive and could delay our introduction of new products or services.
As our website is accessible over the Internet in multiple states and other countries, and if and when we expand our marketing strategies to other countries, we may be subject to their laws and regulations or may be required to qualify to do business in those locations. Our failure to qualify in a state or country in which we are required to do so could subject us to taxes and penalties and we could be subject to legal actions and liability in those jurisdictions. The restrictions or penalties imposed by, and costs of complying with, these laws and regulations could harm our business, operating results, and financial condition. Our ability to enforce contracts and other obligations in states and countries in which we are not qualified to do business could be hampered, which could harm our business.
The laws and regulations applicable to our business often require subjective interpretation, and we cannot be certain that our efforts to comply with these regulations will be deemed sufficient by the appropriate regulatory agencies. Violations of any regulations could result in various civil and criminal penalties, including suspension or revocation of our licenses or registrations, seizure of our inventory, or monetary fines, any of which could harm our business, financial condition, or operating results. Compliance with new laws or regulations could increase our expenses or lead to delays as we adjust our websites and operations.
Restrictions imposed by, and costs of complying with, governmental regulation of the Internet and data transmission over the Internet could harm our business.
We are subject to the same federal, state, and local laws generally applicable to businesses, as well as those directly applicable to companies conducting business online, including consumer protection laws, user privacy laws, and regulations prohibiting unfair and deceptive trade practices. In particular, many government agencies and consumers are focused on the privacy and security of medical and pharmaceutical records. Further, the growth of online commerce could result in more stringent consumer protection laws that impose additional compliance burdens on us. Today there are an increasing number of laws specifically directed at the conduct of business on the Internet. Moreover, due to the increasing use of the Internet, many additional laws and regulations relating to the Internet are being debated at the state and federal levels. These laws and regulations could cover issues such as freedom of expression, pricing, user privacy, fraud, quality of products and services, taxation, advertising, intellectual property rights, and information security. Applicability of existing laws to the Internet relating to issues such as property ownership, copyrights and other intellectual property issues, taxation, libel, obscenity, and personal privacy could also harm our business. For example, U.S. and international laws regulate our ability to use customer information and to develop, buy, and sell mailing lists. The vast majority of these laws were adopted before the advent of the Internet, and do not contemplate or address the unique issues raised by the Internet. Those laws that do reference the Internet, such as the Digital Millennium Copyright Act, are only beginning to be interpreted by the courts, and their applicability and reach are therefore uncertain. The restrictions imposed by, and the costs of complying with, current and possible future laws and regulations related to businesses conducted on the Internet could harm our business, operating results, and financial condition.
Healthcare reform measures and related changes in applicable federal and state laws could adversely affect our business.
The efforts of governmental and third-party payers to contain or reduce the costs of healthcare may adversely affect our business, operating results, and financial condition. Recently, there have been, and we expect that there will continue to be, a number of legislative and regulatory proposals aimed at changing the healthcare system, including for example, restructuring the tax benefits available through flexible spending accounts and/or health savings accounts by excluding non-prescription products, introducing regulation of prescription drug
21
Table of Contents
pricing or limiting enforcement of laws prohibiting drug importation from Canada. Under current law, importation of drugs into the United States is generally not permitted unless the drugs are approved in the United States and the entity that holds that approval consents to the importation. Various proposals have been advanced to permit the importation of drugs from other countries to provide lower cost alternatives to the products available in the United States. If the laws or regulations are changed to permit more widespread importation of drugs into the United States than is currently permitted, such a change could have an adverse effect on our business by reducing revenues and eroding our margins.
We are subject to a number of risks related to payments we accept.
We accept payments by a variety of methods, including credit cards, gift certificates, and third-party payors such as Pay Pal, Google Checkout, and Bill Me Later. As we offer new payment options to our customers, we may be subject to additional regulations, compliance requirements, and fraud. For credit card payments and other third-party payors, we pay interchange and other fees, which may increase over time, raising our operating costs and lowering our profit margins. We are also subject to payment card association operating rules and certification requirements, which could change or be reinterpreted to make compliance difficult or impractical. If we fail to comply with these rules or requirements, we may be subject to fines and higher transaction fees and lose our ability to accept credit card payments from our customers or facilitate other types of online payments, and our business and operating results could be adversely affected.
If we are required to collect sales and use taxes on the products we sell in additional jurisdictions, we may be subject to liability for past sales and our future sales may decrease.
Currently, decisions of the U.S. Supreme Court restrict the ability of states to collect state and local sales and use taxes with respect to sales made by companies lacking a physical presence in the state. Based on this case law, we have historically only collected and remitted sales and use taxes in the states of Washington and New Jersey where our corporate offices and distribution centers have been located. However, a number of states have passed or are considering passing initiatives that could test the Supreme Court’s position regarding sales and use taxes on Internet sales. The operation of our distribution centers, the operations of any future distribution centers, our drop-shipping agreements with vendors, our arrangements with marketing affiliates, and other aspects of our evolving business, however, may result in additional sales and use tax collection obligations. In addition, one or more other states may successfully assert that we should collect and remit sales and use or other taxes on the sale of our products in that state. One or more states or the federal government may seek, either through unilateral action or through federal legislation, to impose sales or other tax collection obligations on out-of-jurisdiction companies that engage in electronic commerce as we do.
Effective July 2008, New York imposed such a sales tax obligation requirement on on-line retailers that use New York residents to directly or indirectly refer potential customers, via a link on an Internet Website or otherwise, to the online retailer. As a result, we began collecting and remitting sales tax in New York in July 2008. Since then, other states have enacted legislation similar to New York’s, including Rhode Island in June 2009 and North Carolina in August 2009. In response, we have suspended certain marketing affiliate relationships with persons and entities residing in Rhode Island and North Carolina, which may cause our sales to decline. Other states are considering similar laws, and if such laws become effective, we may have to change or limit our marketing activities in those states or face additional sales tax collection and remittance obligations, either of which could have a negative effect on our sales.
In addition, one or more states could begin to impose sales taxes on sales of prescription products, which are not generally taxed at this time. While we believe we are in compliance with existing laws and regulations, we could be subject to significant fines or other payments for any unintentional past failure to comply with tax regulations. This could result in substantial tax liabilities for our past sales, decrease our ability to compete with traditional retailers, and otherwise harm our business, financial condition, and operating results.
22
Table of Contents
Pending an authoritative reconciliation of these initiatives with the common law, and potentially for years into the future if any challenge to these initiatives resulted in a reversal by the courts of the long-standing restriction on states’ ability to tax out of state sellers, we could be required to collect and remit sales and use taxes in states other than Washington, New York and New Jersey. In addition, applicable law in most states does not currently require us to collect sales tax on the sales of prescription medications. If the applicable law were to change, we would be required to collect and remit sales and use taxes for prescription products. The imposition of additional tax obligations on our business by state and local governments could create significant administrative burdens for us, decrease our future sales, and harm our cash flow and operating results.
We may be unable to increase the migration of consumers of health, beauty, vision, and pharmacy products from brick-and-mortar stores to our online solution, which would harm our revenues and prevent us from becoming profitable.
If we do not continue to attract and retain higher volumes of online customers to our Internet stores at a reasonable cost, we will not be able to increase our revenues or achieve consistent profitability. Our success depends on our ability to continue to convert a large number of customers from traditional shopping methods to online shopping for health, beauty, wellness, vision, and pharmacy products. Specific factors that could prevent widespread customer acceptance of our online solution include:
| • | shipping charges, which do not apply to purchases made at a brick-and-mortar store; |
| • | delivery time associated with Internet orders, as compared to the immediate receipt of products at a brick-and-mortar store; |
| • | delays in deliveries to customers, particularly our West Coast customers; |
| • | lack of consumer awareness of our websites; |
| • | additional steps and delays in verifying prescriptions and ensuring insurance coverage for prescription products; |
| • | non-participation in the networks of some insurance carriers and PBMs; |
| • | regulatory restrictions or reform at the state and federal levels that could affect our ability to serve our customers; |
| • | the general acceptance or legalization of prescription drug re-importation; |
| • | customer concerns about the security of online transactions, identity theft, or the privacy of their personal information; |
| • | product damage from shipping or shipments of wrong or expired products from us or other vendors, resulting in a failure to establish, or loss of, customers’ trust in buying drugstore items online; |
| • | inability to serve the acute care needs of customers, including emergency prescription drugs and other urgently needed products; |
| • | delays in responses to customer inquiries; |
| • | difficulties or delays in returning or exchanging orders; and |
| • | activity that diminishes a user’s online experience or subjects online shoppers to security risks, such as viruses, spam, spyware, phishing (spoofing e-mails directed at Internet users), “denial of service” attacks directed at Internet service providers and online businesses, and breaches of data security. |
Expanding the breadth and depth of our product and service offerings is expensive and difficult, and we may receive no benefit from our expansion.
We intend to continue to expand the breadth and depth of our product and service offerings by promoting new or complementary products or sales formats. Expansion of our offerings in this manner could require
23
Table of Contents
significant additional expenditures and could strain our management, financial, and operational resources. For example, in August, 2009 we launched our first microsite in an initiative to design separate web stores dedicated to specific categories of products. Additionally, we may need to incur significant marketing expenses, develop relationships with new fulfillment partners or manufacturers, or comply with new regulations. We may be unable to expand our product and service offerings or sales formats in a cost-effective or timely manner, and any new offerings or formats may not generate satisfactory revenues to offset the costs involved. Furthermore, any new product or service offering or sales format that is not favorably received by consumers could damage the reputation of our brand. A lack of market acceptance of our efforts or our inability to generate sufficient revenues to offset the cost of expanded offerings could harm our business.
Increasing concern about privacy, spam, and the use and security of customer information could restrict our marketing efforts and harm our business.
Internet retailers are also subject to increasing regulation and scrutiny relating to privacy, spam, and the use and security of personal user information. These regulations, along with increased governmental or private enforcement (for example, by Internet service providers), may increase the cost of growing our business. Current and proposed regulations and enforcement efforts may restrict our ability to collect and use demographic and personal information from users and send promotional e-mails, which could be costly or harm our marketing efforts. For example, if one or more Internet service providers were to block our promotional e-mails to customers, our ability to generate orders and revenue could be harmed. Further, any violation of privacy, anti-spam, or data protection laws or regulations may subject us to fines, penalties, and damages and may otherwise have a material adverse effect on our business, results of operations, and financial condition.
Our network and communications systems are vulnerable to system interruption and damage, which could harm our operations and reputation.
Our ability to receive and fulfill orders promptly and accurately is critical to our success and largely depends on the efficient and uninterrupted operation of our computer and communications hardware and software systems. We experience periodic system interruptions that impair the performance of our transaction systems or make our websites inaccessible to our customers. These systems interruptions may prevent us from efficiently accepting and fulfilling orders, sending out promotional e-mails and other customer communications in a timely manner, introducing new products and features on our website, promptly responding to customers, or providing services to third parties. Frequent or persistent interruptions in our services could cause current or potential customers to believe that our systems are unreliable, which could cause them to avoid our websites, drive them to our competitors, and harm our reputation. To minimize future system interruptions, we need to continue to add software and hardware and to improve our systems and network infrastructure to accommodate increases in website traffic and sales volume, to replace aging hardware and software, and to make up for several years of underinvestment in technology. We may be unable to promptly and effectively upgrade and expand our systems and integrate additional functionality into our existing systems. Any unscheduled interruption in our services, especially during the holiday shopping season, could result in fewer orders, additional operating expenses, or reduced customer satisfaction, any of which would harm our revenues and operating results and could delay or prevent our becoming consistently profitable. In addition, the timing and cost of upgrades to our systems and infrastructure may substantially affect our ability to maintain profitability.
Our systems and operations, and those of our suppliers and Internet service providers, are vulnerable to damage or interruption from fire, flood, earthquakes, power loss, server failure, telecommunications and Internet service failure, acts of war or terrorism, computer viruses and denial-of-service attacks, physical or electronic break-ins, sabotage, and similar events. Any of these events could lead to system interruptions, service delays, and loss of critical data for us, our suppliers, or our Internet service providers, and could prevent us from accepting and fulfilling customer orders. For example, our Internet service provider recently experienced network outages that caused our website to be unavailable for several hours. Any significant interruption in the availability or functionality of our websites or our customer processing, distribution, or communications systems,
24
Table of Contents
for any reason, could seriously harm our business, financial condition, and operating results. While we do have backup systems for some aspects of our operations, we do not have fully redundant backup systems or a formal disaster recovery plan. Our business interruption insurance may be inadequate to compensate for all losses that may occur.
Security breaches could damage our reputation, expose us to liability, or otherwise harm our business.
Our security measures may not prevent security breaches that could harm our business. To succeed, we must provide a secure transmission of confidential information over the Internet and protect the confidential customer and patient information we retain, such as credit card numbers and prescription records. A third party who compromises or breaches the physical and electronic security measures we use to protect transaction data and customer records could misappropriate proprietary information, cause interruptions in our operations, damage our computers or those of our customers, or otherwise harm our business. Any of these could harm our reputation and expose us to a risk of loss or litigation and possible liability. We may need to expend significant resources to protect against security breaches or to address problems caused by breaches, and our insurance may not be adequate to reimburse us for losses caused by security breaches.
If we do not respond to rapid technological changes, our services could become obsolete and our business would be seriously harmed.
As the Internet and online commerce industry evolve, we must license technologies useful in our business, enhance our existing services, develop new services and technologies that address the increasingly sophisticated and varied needs of our prospective customers and respond to technological advances and emerging industry standards and practices on a cost-effective and timely basis. We may not be able to successfully implement new technologies or adapt our web stores, proprietary technology, and transaction-processing systems to meet customer requirements or emerging industry standards. Failure to successfully and timely do so could adversely affect our ability to build the drugstore.com brand and attract and retain customers.
We may be unable to protect our intellectual property, and we may be found to infringe proprietary rights of others, which could harm our business, brand, and reputation.
Our success depends in substantial part on our proprietary rights, including our technology, copyrights, trademarks, service marks, trade dress, trade secrets, and similar intellectual property. We rely on a combination of patent, trademark, trade secret, and copyright law, as well as contractual restrictions to protect our proprietary rights. Despite our efforts to protect our proprietary rights, however, unauthorized parties may attempt to copy, obtain, and use technology or information that we regard as proprietary, such as our sales formats, the technology used to operate our website, our website content, and our trademarks. In addition, the laws of many countries do not protect our proprietary rights to the same extent as the laws of the United States.
We own a number of domain names, hold three patents and have filed applications for seven others, and have registered several trademarks and filed applications for a number of other trademarks in the United States and several other countries. We may be unable to secure the trademark registrations or patents for which we have applied, which could negatively affect our business. Our competitors or others may adopt marks or service names similar to ours, which could impede our ability to build brand identity and lead to customer confusion, and owners of other registered trademarks or trademarks that incorporate variations of our marks could bring potential trade name or trademark infringement claims against us. In addition, the laws of some foreign countries do not protect our proprietary rights to the same extent as do the laws of the United States, and effective patent, copyright, trademark, and trade secret protection may not be available in such jurisdictions. Our business could be harmed if we are unable to protect or preserve the value of our trademarks, patents, copyrights, trade secrets, or other proprietary rights for any reason, or if we are subject to any claims or customer confusion related to our intellectual property or any failure or inability to protect our proprietary rights.
25
Table of Contents
Litigation or proceedings before the U.S. Patent and Trademark Office or the World Intellectual Property Organization may be necessary in the future to enforce our intellectual property rights, to protect our trade secrets and domain names, or to determine the validity and scope of the proprietary rights of others. Any litigation or adverse priority proceeding or other efforts to protect our intellectual property could result in substantial costs and diversion of resources and could seriously harm our business and operating results. Third parties have in the past, and may in the future, also assert claims against us alleging infringement, misappropriation, or other violations of patent, trademark, or other proprietary rights held by them, whether or not their claims have merit. For example, one of our subsidiaries was sued over alleged copyright and trademark violations based on use of “pop-up” advertising, although this action was settled in June 2004 without any material adverse effects to us. We expect that participants in our markets will be increasingly subject to infringement claims as the number of services and competitors in our industry segment grows. Any such claims, whether they are with or without merit or are determined in our favor, could be time-consuming, result in costly litigation, divert the attention of our management, cause service upgrade delays, and harm our business or operating results. Furthermore, as a result of infringement claims we may be required to enter into costly royalty or licensing agreements, which may not be available on terms that are acceptable to us, or at all. If a third party successfully asserts an infringement claim against us and we are required to pay monetary damages or royalties or we are unable to obtain suitable non-infringing alternatives or license the infringed or similar intellectual property on reasonable terms on a timely basis, our business could be adversely affected.
The third-party licenses on which we rely may not continue to be available to us on commercially reasonable terms. The loss of such licenses could require us to incur greater cost or change our business plans, either of which could harm our business.
We have a history of generating significant losses, and may not be able to sustain profitability.
We have an accumulated deficit of $771.2 million through January 3, 2010. To date, we have had only three profitable quarters, and we may never achieve profitability on a full-year or consistent basis. We expect to continue to incur net losses in the first quarter of 2010, and possibly longer. As a result, our stock price may decline and stockholders may lose all or a part of their investment in our common stock.
Our stock price is likely to continue to fluctuate, which could result in substantial losses for stockholders.
The market price of our common stock has been, and is likely to continue to be, extremely volatile. Our stock price could be subject to wide fluctuations in response to a number of factors, including those described in this annual report, some of which are beyond our control, and these fluctuations could result in substantial losses for stockholders.
In the past, securities class action and derivative litigation has often been brought against a company following periods of volatility in the market price of its securities. We have been named in such lawsuits in the past, including certain putative class action and derivative suits filed against us and certain of our current and former officers and directors in 2004. Although the courts dismissed these lawsuits, we may be the target of similar litigation in the future. Securities litigation could result in substantial costs and divert management’s attention and resources, which could seriously harm our business and operating results and cause the trading price of our stock to decline.
Certain stockholders own a significant amount of our common stock, which could discourage an acquisition of drugstore.com or make removal of incumbent management more difficult.
Amazon.com beneficially owns approximately 12% of our outstanding stock, and is entitled to designate a director to serve on our board of directors, currently Geoffrey R. Entress. Kleiner Perkins Caufield and Byers, or KPCB, owns approximately 9% of our outstanding stock, Samana Capital, L.P (formerly Ziff Asset Management, L.P.)., or Samana, owns approximately 9% of our outstanding stock, Discovery Group I, LLC
26
Table of Contents
owns approximately 7% of our outstanding stock, and T. Rowe Price Associates, Inc. owns approximately 6% of our outstanding stock. Because each owns a significant percentage of our capital stock, any of these stockholders, or more than one of them, could significantly influence all matters requiring approval by our stockholders, including the election of directors and the approval of mergers or other business combination transactions. Furthermore, because of these substantial equity stakes in drugstore.com, competitors of these stockholders, or other potential acquirers could decide not to merge with, or acquire, us. In addition, in the case of a potential acquisition of drugstore.com by another party, a substantial equity stake in drugstore.com could prevent the tax-free treatment of an acquisition, making drugstore.com a less attractive acquisition candidate. In addition, if any of our significant stockholders were to sell a substantial quantity of their holdings in a short period of time, our stock price could decline.
We failed to comply with one of the applicable listing requirements of the NASDAQ Global Market when we granted certain equity awards to certain of our employees and directors, and our business and stock price could be materially harmed if we are unable to restore these awards in a timely manner.
Our common stock is listed on the NASDAQ Global Market. In order to maintain that listing, we must satisfy minimum financial and other continued listing requirements and standards. On March 10, 2010, we notified NASDAQ that we were not in compliance with Rule 5635(c) of the Corporate Governance Requirements with respect to certain equity awards granted under our 2008 Equity Incentive Plan (the “2008 Plan”). The 2008 Plan requires that any award of restricted stock, among other securities, be counted against the 2008 Plan share reserve as three shares to every one share subject to the award (the “Full Value Award Provision”). Recently, we discovered that the share limit set forth in the 2008 Plan was exceeded as a result of the inadvertent and incorrect application of the Full Value Award Provision. Because the grant of certain awards exceeded the share reserve limit after proper application of the Full Value Award Provision, we may be deemed to have issued securities pursuant to the 2008 Plan without stockholder approval. Accordingly, we may be deemed not to have complied with Rule 5635(c) of the Corporate Governance Requirements.
In our March 10th letter to NASDAQ, we submitted our plan to regain compliance with Rule 5635(c). Our compliance plan would condition the release and delivery of certain restricted stock awards and unvested options and stock appreciation rights on approval by our stockholders of an amendment to the 2008 Plan. We intend to include that amendment in our 2010 proxy statement as a proposal to be presented at our upcoming annual meeting of stockholders, expected to be held on or before June 10, 2010. We provided notice to affected award recipients on March 15, 2010. On March 16, 2010, NASDAQ informed us that by providing the foregoing notice to affected award recipients the Company had regained compliance with Rule 5635(c).
However, there can be no assurance that we will obtain stockholder approval of the 2008 Plan amendment. In the event that our stockholders do not approve our proposed amendment to the 2008 Plan, the affected awards would be deemed forfeited pursuant to their terms and conditions. This forfeiture could reduce the morale of the affected recipients and could hinder our ability to award equity securities to our employees pursuant to the 2008 Plan in the immediate future, which could cause a more widespread reduction in employee morale. In addition, recipients of forfeited awards could bring contract claims against us for failing to deliver the awards. Any of these events could harm our business and the trading price of our common stock.
| ITEM 1B. | UNRESOLVED STAFF COMMENTS |
None.
27
Table of Contents
| ITEM 2. | PROPERTIES |
Our principal executive offices are located in Bellevue, Washington, where we lease approximately 53,000 square feet under a lease that expires in July 2013, with two separate five-year renewal options that, if exercised, would extend the lease expiration to July 2023. Our primary distribution facility for our OTC, vision and mail-order pharmacy segments is located in Swedesboro, New Jersey, where we lease approximately 270,000 square feet under a lease that expires in December 2020, with options to renew for two additional five-year periods. We also lease an inventory storage facility in Logan Township, New Jersey for 85,000 square feet through February 2011. The distribution facility for our vision segment was previously located in Ferndale, Washington, where we leased approximately 16,600 square feet under a lease that ended after we moved our vision fulfillment operations to our Swedesboro, New Jersey facility in January 2010. We lease approximately 11,500 square feet under a lease that expires in March 2011 for our principal customer care center, which is located in Halifax, Nova Scotia, Canada.
We continue to make improvements to our existing New Jersey distribution center to improve capacity and increase efficiency, and in December 2009 we entered into a new 10-year lease agreement for this facility. Our overall goal is to leverage our existing distribution center as much as possible, and in 2010 we plan to make technology investments in supply chain infrastructure to support fulfillment capabilities from multiple distribution centers. Management regularly reviews our anticipated requirements for all of our facilities and the costs and benefits associated with new facilities, and, based on that review, may adjust other of our facilities needs, as well.
Our subsidiary Salu leases approximately 10,000 square feet under a lease that expires in January 2011 for its principal corporate offices located in Gold River, California. Skincarestore Australia Pty Ltd., a subsidiary of Salu, leases approximately 2,000 square feet in Roselle, New South Wales, Australia, under a sublease that expires in November 2014, for retail space used for a salon and spa and related business purposes.
| ITEM 3. | LEGAL PROCEEDINGS |
See Note 8 of our consolidated financial statements, “Commitments and Contingencies—Legal Proceedings,” included in Part IV, Item 15 of this annual report.
| ITEM 4. | RESERVED |
28
Table of Contents
PART II
| ITEM 5. | MARKET FOR REGISTRANT’S COMMON EQUITY, RELATED STOCKHOLDER MATTERS, AND ISSUER PURCHASES OF EQUITY SECURITIES |
Market Information
Our common stock is traded on the NASDAQ Global Market under the symbol “DSCM.” The following table sets forth, for the periods indicated, the high and low sales prices of our common stock, as reported by the NASDAQ Global Market.
| High | Low | |||||
| Fiscal Year Ended January 3, 2010 |
||||||
| First Quarter |
$ | 1.47 | $ | 0.65 | ||
| Second Quarter |
$ | 2.09 | $ | 1.07 | ||
| Third Quarter |
$ | 2.72 | $ | 1.54 | ||
| Fourth Quarter |
$ | 3.59 | $ | 2.19 | ||
| High | Low | |||||
| Fiscal Year Ended December 28, 2008 |
||||||
| First Quarter |
$ | 3.38 | $ | 2.03 | ||
| Second Quarter |
$ | 2.50 | $ | 0.95 | ||
| Third Quarter |
$ | 2.89 | $ | 1.66 | ||
| Fourth Quarter |
$ | 2.75 | $ | 0.74 | ||
Holders of Record
As of March 5, 2010, there were approximately 750 holders of record of our common stock, and a much larger number of beneficial owners.
Dividends
We have never declared or paid cash or stock dividends on our capital stock. We currently intend to retain all available funds and any future earnings for use in the operation and expansion of our business and do not anticipate paying any dividends in the foreseeable future.
Recent Sales of Unregistered Securities
None.
Issuer Purchases of Equity Securities
None.
29
Table of Contents
Stock Performance Graph
The graph below shows the relative investment performance of our common stock, the NASDAQ Stock Market Index and the Morgan Stanley High-Technology Index for the last five years. The following graph is presented pursuant to SEC rules and is not meant to be an indication of our future performance.
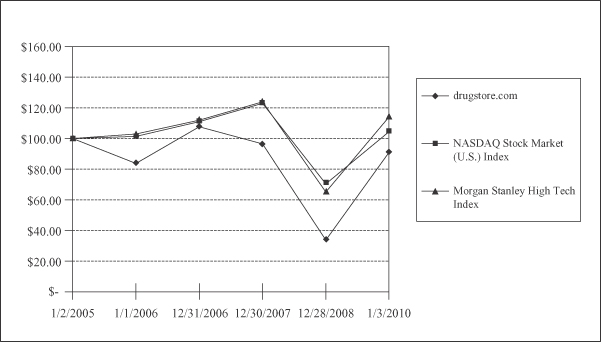
| 1/2/2005 | 1/1/2006 | 12/31/2006 | 12/30/2007 | 12/28/2008 | 1/3/2010 | |||||||||||||
| drugstore.com |
$ | 100.00 | $ | 83.82 | $ | 107.65 | $ | 96.47 | $ | 33.82 | $ | 90.88 | ||||||
| NASDAQ Stock Market (U.S.) Index |
$ | 100.00 | $ | 101.37 | $ | 111.03 | $ | 122.94 | $ | 70.34 | $ | 104.31 | ||||||
| Morgan Stanley High Tech Index |
$ | 100.00 | $ | 102.86 | $ | 111.92 | $ | 123.96 | $ | 65.11 | $ | 113.87 | ||||||
30
Table of Contents
| ITEM 6. | SELECTED FINANCIAL DATA |
| Fiscal Year | ||||||||||||||||||||
| 2009(2) | 2008 | 2007 | 2006 | 2005 | ||||||||||||||||
| (in thousands, except share and per share data) | ||||||||||||||||||||
| Consolidated Statements of Operations Data: |
||||||||||||||||||||
| Net sales |
$ | 412,832 | $ | 366,579 | $ | 339,331 | $ | 315,123 | $ | 303,304 | ||||||||||
| Loss from continuing operations |
(7,323 | ) | (16,367 | ) | (17,619 | ) | (17,608 | ) | (26,045 | ) | ||||||||||
| Gain from discontinued operations, net of tax (1) |
5,946 | 8,080 | 6,108 | 4,582 | 5,146 | |||||||||||||||
| Net loss |
$ | (1,377 | ) | $ | (8,287 | ) | $ | (11,511 | ) | $ | (13,026 | ) | $ | (20,899 | ) | |||||
| Basic and diluted loss from continuing operations per share |
$ | (0.07 | ) | $ | (0.17 | ) | $ | (0.18 | ) | $ | (0.19 | ) | $ | (0.29 | ) | |||||
| Basic and diluted gain from discontinued operations per share |
$ | 0.06 | $ | 0.08 | $ | 0.06 | $ | 0.05 | $ | 0.06 | ||||||||||
| Basic and diluted net loss per share |
$ | (0.01 | ) | $ | (0.09 | ) | $ | (0.12 | ) | $ | (0.14 | ) | $ | (0.23 | ) | |||||
| Weighted average shares outstanding |
96,950,189 | 96,481,787 | 95,350,046 | 93,405,405 | 90,808,817 | |||||||||||||||
| Consolidated Balance Sheet Data: |
||||||||||||||||||||
| Cash, cash equivalents and marketable securities |
$ | 36,853 | $ | 38,194 | $ | 36,249 | $ | 40,639 | $ | 46,463 | ||||||||||
| Cash dividends declared per common share |
— | — | — | — | — | |||||||||||||||
| Working capital |
42,925 | 34,330 | 35,340 | 40,886 | 46,075 | |||||||||||||||
| Total assets |
154,529 | 152,549 | 175,408 | 168,322 | 170,563 | |||||||||||||||
| Long-term debt obligations, less current portion |
3,011 | 2,567 | 1,221 | 1,839 | 2,685 | |||||||||||||||
| Total stockholders’ equity |
$ | 97,666 | $ | 94,200 | $ | 94,368 | $ | 92,678 | $ | 96,271 | ||||||||||
| (1) | The results of operations of our local pick-up pharmacy segment have been classified as discontinued operations in all periods presented. |
| (2) | Fiscal year 2009 was a 53-week year, and fiscal years 2008 through 2005 were 52-week years. |
31
Table of Contents
| ITEM 7. | MANAGEMENT’S DISCUSSION AND ANALYSIS OF FINANCIAL CONDITION AND RESULTS OF OPERATIONS |
The following discussion should be read in conjunction with our consolidated financial statements and accompanying notes included in Part IV, Item 15 of this annual report.
Overview
drugstore.com, inc. is a leading online provider of health, beauty, vision, and pharmacy products. We provide a convenient, private, and informative shopping experience while offering a wide assortment of products through our web stores located on the Internet as follows:
| Health, Beauty & Pharmacy |
Vision | |
| www.drugstore.com | www.VisionDirect.com | |
| www.Beauty.com | www.LensMart.com | |
| www.SkinStore.com (1) | www.Lensworld.com | |
| www.spalook.com (1) | www.LensQuest.com | |
| Microsites |
Partnerships | |
| www.thenaturalstore.com | www.riteaidonlinestore.com | |
| www.athisbest.com | www.medcohealthstore.com | |
| www.sexualwellbeing.com | www.DrWeilVitaminAdvisor.com (2) | |
| www.allergysuperstore.com | ||
| (1) | On February 19, 2010, we completed the acquisition of Salu, Inc., owner of SkinStore.com and operator and fulfillment partner for the spalook.com web store. |
| (2) | We act as the exclusive fulfillment provider for customized nutritional supplements sold through www.DrWeilVitaminAdvisor.com, www.DrWeil.com, and other Dr. Weil-related websites. |
Business Segments; Growth Strategies. We operate our business in three business segments: over-the-counter or OTC; vision; and mail-order pharmacy.
| • | OTC. Our OTC segment includes all non-prescription products sold online through our health and beauty web stores, microsites, and our partnership web stores. We source our OTC products from various manufacturers and distributors. We also sell advertising on our primary OTC site www.drugstore.com. Our business strategy is to offer our customers a wide selection of health, beauty, personal care, household, and other products at competitive prices and provide a superior online shopping experience. We are able to offer a significantly broader assortment of products, with greater depth in each product category, than brick-and-mortar drugstores, and provide a broad array of interactive tools and information on our websites to help consumers make informed purchasing decisions. We believe leveraging our strong capabilities in Internet marketing, merchandising, fulfillment, and customer care in the health, beauty, and wellness arena will be a key growth driver for our OTC segment. In 2010, to accelerate growth, we plan to continue to deliver on our strategic growth initiatives, including the ramp up of our partnerships with Medco Health Services, Inc. (Medco) and Rite Aid Corporation (Rite Aid) as they continue to drive improved awareness and conversion; launch additional microsites that allow us to better target specific customers with tailored marketing programs, by offering a larger assortment of niche specific SKUs and product content; integrate our recently acquired business, Salu, which, combined with our beauty business, will create one of the largest online beauty retailers offering mass beauty products, prestige brands, and clinical skincare products; expand our international market presence, and; continue to add new prestige beauty brands. |
| • | Vision. Our vision segment includes contact lenses and eye accessories sold through our vision web stores. We purchase our contact lens inventory directly from various manufacturers and other distributors. In 2010, we will leverage our platform and our core strengths in marketing, fulfillment, |
32
Table of Contents
| and customer care to drive growth through our strategic multi-year e-commerce partnership with Luxottica Group, S.p.A., a global leader in the design, manufacturing and distribution of fashion, luxury, and sport eyewear. Through this partnership, we will develop branded contact lens e-commerce sites for Luxottica’s North American businesses such as LensCrafters, Pearle Vision, Target Optical, and Sears Optical, which we expect to begin to launch in the second half of 2010. We are also jointly purchasing contact lenses and related products with Luxottica, providing us with sourcing benefits that are expected to improve the profitability of our vision segment by expanding our gross margins. |
| • | Mail-Order Pharmacy. Our mail-order pharmacy segment includes prescription drugs and supplies, other than prescription contact lenses, sold online through the pharmacy section of the drugstore.com web store or over the telephone, and delivered to customers through our mail-order facility. We procure our prescription inventory primarily through Rite Aid as part of our ongoing relationship. We market to both cash-paying and insurance-covered individuals. We sell over 5,500 prescription drugs, including many specialty drugs for the treatment of chronic conditions such as cancer, HIV, and multiple sclerosis, which are not carried by brick-and-mortar pharmacies and require special handling or service. In this segment, we focus our marketing efforts directly on consumers online and through doctors to maximize growth in our cash prescription and specialty pharmacy business. In addition to the sale of prescription drugs, we sell advertising on our website to monetize the large volume of unique visitors per month researching drugs and other healthcare content provided on the site. In 2010, we will continue to focus on improving profitability in our mail-order pharmacy business while balancing customer acquisition with contribution margin improvement in order to maximize our profits. |
Business Acquisition. On February 19, 2010, we completed the acquisition of Salu, a Delaware corporation. The acquisition was made pursuant to an Agreement and Plan of Merger, dated as of December 27, 2009, by and among drugstore.com, Silk Acquisition Corporation, a Delaware corporation and a wholly owned subsidiary of drugstore.com, Salu, certain of the stockholders of Salu, and a representative of all stockholders’ of Salu. On February 19, 2010, Silk Acquisition Corporation merged with and into Salu, with Salu surviving as a wholly owned subsidiary of drugstore.com pursuant to the merger agreement. As consideration for their shares of Salu capital stock, the stockholders of Salu received an aggregate payment of approximately $36.8 million, consisting of $19.4 million in cash (less certain of Salu’s transaction expenses of approximately $1.9 million paid out of the merger consideration) and approximately 5,425,693 shares of drugstore.com common stock with a value of $17.4 million. Of this aggregate consideration, drugstore.com paid approximately $2.7 million in cash and 816,450 shares of drugstore.com common stock into escrow to secure certain post-closing indemnification obligations of Salu’s stockholders. Additionally, certain employees of Salu are made eligible to receive a performance incentive payment payable in cash over a two-year period commencing in fiscal year 2010, with an aggregate value of $2.5 million if the surviving entity achieves certain financial and other performance targets. Because the acquisition of Salu closed after our fiscal year end 2009, our consolidated financial statements and Management’s Discussion and Analysis of Financial Condition and Results of Operations for fiscal year 2009 do not include the operations of Salu. The operations of Salu will be reflected in our results beginning in the first quarter of 2010.
We operate using a 52/53-week retail calendar year with each of the fiscal quarters in a 52-week year representing a 13-week period. Fiscal year 2009 is a 53-week year, with the fourth quarter of 2009 representing a 14-week period, and fiscal years 2008 and 2007 were 52-week years.
Results of Operations
Customer and Order Data
Orders from new customers, inclusive of our strategic partnerships, increased year-over-year by 28% to 1.8 million orders in 2009, increasing our total customer base to approximately 11.7 million customers since inception. Orders from repeat customers as a percentage of total orders decreased year-over-year to 70% in 2009 from 72% in 2008, primarily as a result of our partnerships orders becoming an increasing mix of our total
33
Table of Contents
orders, and a decrease in our mail-order pharmacy repeat customer base. Mixed orders across one or more of our business segments are reported to each individual segment, but are included as one order in the number of total customer orders shipped. The number of active customers in 2009 increased to approximately 3.0 million, an increase of 18% from approximately 2.6 million active customers at the end of 2008. Active customer base includes those customers who have purchased at least once within the last 12 months, and the number of customer orders includes new and repeat orders made through the drugstore.com web store and the web stores of our subsidiaries, orders generated through the Rite Aid and Medco online stores, orders generated through the Amazon.com marketplace, and orders generated through our fulfillment agreement with Weil Lifestyle, LLC (Weil).
Net Sales
| Fiscal Year 2009 |
% Change | Fiscal Year 2008 |
% Change | Fiscal Year 2007 | |||||||||||
| (in thousands, except per order data) | |||||||||||||||
| Total net sales |
$ | 412,832 | 12.6 | % | $ | 366,579 | 8.0 | % | $ | 339,331 | |||||
| Total customer orders shipped |
6,154 | 15.6 | % | 5,325 | 7.3 | % | 4,964 | ||||||||
| Total average net sales per order |
$ | 67 | -2.9 | % | $ | 69 | 1.5 | % | $ | 68 | |||||
Net sales include gross revenues from sales of product, shipping fees, service fees, and advertising revenues, net of discounts, and provision for sales returns, and other allowances. Net sales also include consignment service fees earned from our arrangements with certain partners, under which we do not take title to the inventory and do not establish pricing. We record on a net basis consignment service fees, which constitute approximately 1% of total net sales in each period presented. We bill orders to the customer’s credit card or, in the case of prescriptions covered by insurance, we bill the co-payment to the customer’s credit card and the remainder of the prescription price to insurance. We record sales of pharmaceutical products covered by insurance as the sum of the amounts received from the customer and the third party insurer.
Total net sales increased 13% in 2009 compared to the prior year, as a result of an increase in order volume and the 53-week year in 2009 compared to the 52-week year in 2008, partially offset by a decrease in average net sales per order. Net sales, excluding the 53rd week in the year, increased 11% in 2009, compared to the prior year. Our net sales benefited from strong growth in our OTC and vision segments of 18% and 12%, respectively, partially offset by a decrease in net sales in our mail-order pharmacy segment of 16%. Our total order volume increased year-over-year primarily from a 19% and 6% increase in orders in our OTC and vision segments in 2009, respectively, partially offset by a 21% decrease in orders in our mail-order pharmacy segment. The total average net sales per order decreased year-over-year in 2009 resulting primarily from a higher mix of OTC orders and a lower mix of mail-order pharmacy orders and a slight decrease in the average net sales per order in our OTC segment, partially offset by an increase in the average net sales per order in our vision segment. Revenues from repeat customers decreased year-over-year to 76% of net sales in 2009, compared to 78% in 2008, as a result of our new partnerships becoming an increasing mix of our total net sales, a decrease in the percentage of repeat orders to new orders, and to a lesser extent, a decrease in our average net sales per order from repeat customers driven by a lower percentage of net sales from our mail-order pharmacy segment.
Total net sales increased 8% in 2008 compared to the prior year, as a result of an increase in order volume and average net sales per order. Our net sales benefited from strong growth in our OTC and vision segments of 11% and 12%, respectively, partially offset by a decrease in net sales in our mail-order pharmacy segment of 12%. Our total order volume increased year-over-year primarily from a 10% increase in orders in our OTC segment in 2008, partially offset by a 12% decrease in orders from our mail-order pharmacy segment. The year-over-year increase in average net sales per order in 2008 resulted from improvements in all of our segments’ net sales per order. Revenues from repeat customers decreased to 78% of net sales in 2008, compared to 79% in 2007, primarily as a result of a decrease in revenue from repeat customers in our mail-order pharmacy and vision segments.
34
Table of Contents
OTC Net Sales
| Fiscal Year 2009 |
% Change | Fiscal Year 2008 |
% Change | Fiscal Year 2007 |
||||||||||||||
| (in thousands, except per order data) | ||||||||||||||||||
| OTC net sales |
$ | 306,854 | 17.7 | % | $ | 260,794 | 11.3 | % | $ | 234,282 | ||||||||
| Percentage of total net sales from OTC |
74.3 | % | 71.1 | % | 69.0 | % | ||||||||||||
| OTC customer orders shipped |
5,358 | 19.1 | % | 4,498 | 9.8 | % | 4,096 | |||||||||||
| OTC average net sales per order |
$ | 57 | -1.7 | % | $ | 58 | 1.8 | % | $ | 57 | ||||||||
Net sales in our OTC segment increased 18% in 2009 compared to the prior year, as a result of an increase in order volume and the 53-week year in 2009 compared to the 52-week year in 2008, partially offset by a decrease in average net sales per order. OTC net sales, excluding the 53rd week in the year, increased 15% in 2009, compared to the prior year. The number of orders in our OTC segment grew year-over-year by 19% in 2009 driven by increased orders from both new and repeat customers as a result of our increasing active customer base and our continued efforts to improve customer retention and conversion by adding website enhancements and offering a broad selection of basic necessity items and hard-to-find specialty items through the addition of new SKUs, which encourages customers to return to our websites and make repeat, replenishment, and impulse purchases, and to a lesser extent, orders driven by our partnerships with Rite Aid and Medco. The slight year-over-year decrease in average net sales per order in 2009 resulted from a decrease in shipping revenue as customers are taking advantage of free shipping offers and not choosing expedited shipping methods, increased discounts driven by promotional activity, and a slight decrease in the number of units per order, partially offset by a shift in product mix to higher priced items.
Net sales in our OTC segment increased 11% in 2008 compared to the prior year, as a result of an increase in order volume and average net sales per order. The number of orders in our OTC segment in 2008 grew year-over-year by 10% driven by increased orders from both new and repeat customers as a result of our increasing active customer base and our continued efforts to improve customer retention and conversion. The slight year-over-year increase in average net sales per order in 2008 resulted from selling higher-priced items, partially offset by a decrease in the number of items per order.
Vision Net Sales
| Fiscal Year 2009 |
% Change | Fiscal Year 2008 |
% Change | Fiscal Year 2007 |
||||||||||||||
| (in thousands, except per order data) | ||||||||||||||||||
| Vision net sales |
$ | 68,720 | 11.9 | % | $ | 61,420 | 11.9 | % | $ | 54,906 | ||||||||
| Percentage of total net sales from vision |
16.7 | % | 16.8 | % | 16.2 | % | ||||||||||||
| Vision customer orders shipped |
588 | 6.3 | % | 553 | — | 553 | ||||||||||||
| Vision average net sales per order |
$ | 117 | 5.4 | % | $ | 111 | 12.1 | % | $ | 99 | ||||||||
Net sales in our vision segment increased 12% in 2009 compared to the prior year, as a result of an increase in order volume, an increase in average net sales per order, and the 53-week year in 2009 compared to the 52-week year in 2008. Vision net sales, excluding the 53rd week in the year, increased 10% in 2009, compared to the prior year. The number of orders in our vision segment grew year-over-year by 6% in 2009 as a result of increased orders from both new and repeat customers driven primarily from increased promotional offers. The year-over-year increase in average net sales per order was driven primarily by customers making larger quantity purchases, price increases for certain SKUs (none of which were individually material), and selling higher-priced newer technology contact lenses, partially offset by increased use of discount and promotional offers by our customers.
Net sales in our vision segment also increased 12% in 2008 compared to the prior year, as a result of an increase in average net sales per order driven primarily by offering volume discounts, which resulted in an
35
Table of Contents
increase in the average number of items sold per order, selling higher priced, newer technology contact lenses, and price increases for certain SKUs, partially offset by increased discount and promotional offers (none of which were individually material). The number of orders, both new and repeat, in this segment in 2008 remained flat, compared to the prior year.
Mail-Order Pharmacy Net Sales
| Fiscal Year 2009 |
% Change | Fiscal Year 2008 |
% Change | Fiscal Year 2007 |
||||||||||||||
| (in thousands, except per order data) | ||||||||||||||||||
| Mail-order pharmacy net sales |
$ | 37,258 | -16.0 | % | $ | 44,365 | -11.5 | % | $ | 50,143 | ||||||||
| Percentage of total net sales from mail-order pharmacy |
9.0 | % | 12.1 | % | 14.8 | % | ||||||||||||
| Mail-order pharmacy customer orders shipped |
217 | -21.4 | % | 276 | -12.4 | % | 315 | |||||||||||
| Mail-order pharmacy average net sales per order |
$ | 172 | 6.8 | % | $ | 161 | 1.3 | % | $ | 159 | ||||||||
Net sales in our mail-order pharmacy segment decreased 16% in 2009 and 12% in 2008 compared to the prior years, as a result of a decrease in order volume, partially offset by an increase in average net sales per order and the 53-week year in 2009, compared to the 52-week year in 2008. Mail-order pharmacy net sales, excluding the 53rd week in the year, decreased 18% in 2009, compared to the prior year. Included in net sales of our mail-order pharmacy segment in 2009 were wholesale orders to three different parties totaling $4.8 million, which increased our average net sales per order by $22; included in net sales of our mail-order pharmacy segment in 2008 were wholesale orders to three parties totaling $1.8 million, which increased our average net sales per order by $7; and, included in net sales of our mail-order pharmacy segment in 2007 were wholesale orders to two parties totaling $2.4 million, which increased our average net sales per order by $8. Excluding the wholesale orders, average net sales per order decreased by $5 in this segment in 2009 compared to the prior year, as a result of the loss of a PBM partner in the fourth quarter of 2008, which had a higher average net sales per order, a decrease in the number of prescriptions per order, and an increase in the number of customers purchasing a lower priced 30-day supply compared to a 90-day supply. Excluding the wholesale orders, average net sales per order increased by $3 in this segment in 2008 compared to the prior year, as a result of a price increases on certain brand and generic products as part of our profitability initiatives. The number of orders in our pharmacy segment decreased year-over-year by 21% in 2009 and 12% in 2008 as a result of a decrease in orders from new and repeat customers driven by our declining active customer base and the loss of a PBM partner in 2008.
Cost of Sales and Gross Margin
| Fiscal Year 2009 |
% Change | Fiscal Year 2008 |
% Change | Fiscal Year 2007 |
||||||||||||||
| ($ in thousands) | ||||||||||||||||||
| Total cost of sales |
$ | 293,545 | 11.3 | % | $ | 263,697 | 6.2 | % | $ | 248,308 | ||||||||
| Total gross profit dollars |
$ | 119,287 | 15.9 | % | $ | 102,882 | 13.0 | % | $ | 91,023 | ||||||||
| Total gross margin percentage |
28.9 | % | 28.1 | % | 26.8 | % | ||||||||||||
Cost of sales consists primarily of the cost of products sold to our customers, including allowances for shrinkage and damaged, slow-moving, and expired inventory, outbound and inbound shipping costs, and expenses related to promotional inventory included in shipments to customers. We net against cost of sales payments that we receive from vendors in connection with volume purchases or rebate allowances and payment discount terms.
Total cost of sales increased year-over-year in absolute dollars in 2009 and 2008, as a result of growth in order volume and net sales. Gross margin percentage increased year-over-year in 2009 and 2008 primarily as a result of a larger proportion of net sales in our OTC segment, which is our highest-margin segment, and improved gross margins in our OTC and RX mail segments.
36
Table of Contents
Shipping
| Fiscal Year 2009 |
% Change | Fiscal Year 2008 |
% Change | Fiscal Year 2007 |
||||||||||||||
| ($ in thousands) | ||||||||||||||||||
| Shipping activity: |
||||||||||||||||||
| Shipping revenue |
$ | 14,330 | -3.2 | % | $ | 14,799 | -3.9 | % | $ | 15,403 | ||||||||
| Shipping costs |
29,030 | 8.3 | % | 26,803 | 8.1 | % | 24,802 | |||||||||||
| Net shipping loss |
$ | 14,700 | 22.5 | % | $ | 12,004 | 27.7 | % | $ | 9,399 | ||||||||
| Percentage of net sales: |
||||||||||||||||||
| Shipping revenue |
3.5 | % | 4.0 | % | 4.5 | % | ||||||||||||
| Shipping costs |
7.0 | % | 7.3 | % | 7.3 | % | ||||||||||||
| Net shipping loss |
3.5 | % | 3.3 | % | 2.8 | % | ||||||||||||
We include in net sales our revenues from shipping charges to customers, and we include in cost of sales outbound shipping costs. Our net shipping loss increased year-over-year in absolute dollars and as a percentage of net sales in 2009 and 2008, as a result of a decrease in shipping revenue resulting from an increase in the number of customers using free shipping offers, a reduced number of customers choosing expedited shipping methods for their orders, and the elimination of surcharges for APO/FPO and Alaska and Hawaii orders in the fourth quarter of 2008, combined with an increase in shipping costs resulting from a greater proportion of OTC orders, which have a higher shipping cost than orders in our other business segments. The net shipping loss was partially offset by a decrease in our cost per order resulting from a decrease in fuel surcharges from our largest shipping carrier, and technology improvements made at our primary distribution center in 2009, and renegotiated lower contractual rates from our largest shipping carrier in late 2007, which had a favorable impact on our net shipping loss in 2008, but was partially offset by increasing fuel surcharges. We expect to continue to subsidize a portion of customers’ shipping costs for the foreseeable future, through certain free shipping options, as a strategy to attract and retain customers.
OTC Cost of Sales and Gross Margin
| Fiscal Year 2009 |
% Change | Fiscal Year 2008 |
% Change | Fiscal Year 2007 |
||||||||||||||
| ($ in thousands) | ||||||||||||||||||
| OTC cost of sales |
$ | 210,456 | 16.8 | % | $ | 180,252 | 9.6 | % | $ | 164,469 | ||||||||
| OTC gross profit dollars |
$ | 96,398 | $ | 80,542 | $ | 69,813 | ||||||||||||
| OTC gross margin percentage |
31.4 | % | 30.9 | % | 29.8 | % | ||||||||||||
Cost of sales in our OTC segment increased year-over-year in absolute dollars in 2009 and 2008, as a result of growth in order volume and net sales. The year-over-year increase in gross margin percentage in this segment in 2009 and 2008 resulted primarily from improvements in product margins in a majority of our product categories as a result of our ongoing pricing and sourcing initiatives and better targeted promotional efforts, partially offset by higher customer use of discount offers.
Vision Cost of Sales and Gross Margin
| Fiscal Year 2009 |
% Change | Fiscal Year 2008 |
% Change | Fiscal Year 2007 |
||||||||||||||
| ($ in thousands) | ||||||||||||||||||
| Vision cost of sales |
$ | 52,894 | 11.9 | % | $ | 47,279 | 12.8 | % | $ | 41,904 | ||||||||
| Vision gross profit dollars |
$ | 15,826 | $ | 14,141 | $ | 13,002 | ||||||||||||
| Vision gross margin percentage |
23.0 | % | 23.0 | % | 23.7 | % | ||||||||||||
37
Table of Contents
Cost of sales in our vision segment increased year-over-year in absolute dollars in 2009 and 2008, as a result of an increase in net sales. The gross margin percentage in this segment in 2009 remained consistent compared to the prior year, and the year-over-year decrease in gross margin percentage in this segment in 2008 resulted primarily from increased promotional offers, which increase the average net sales per order, but have an unfavorable impact on gross margin percentage
Mail-Order Pharmacy Cost of Sales and Gross Margin
| Fiscal Year 2009 |
% Change | Fiscal Year 2008 |
% Change | Fiscal Year 2007 |
||||||||||||||
| ($ in thousands) | ||||||||||||||||||
| Mail-order pharmacy cost of sales |
$ | 30,195 | -16.5 | % | $ | 36,166 | -13.8 | % | $ | 41,935 | ||||||||
| Mail-order pharmacy gross profit dollars |
$ | 7,063 | $ | 8,199 | $ | 8,208 | ||||||||||||
| Mail-order pharmacy gross margin percentage |
19.0 | % | 18.5 | % | 16.4 | % | ||||||||||||
Cost of sales in our mail-order pharmacy segment decreased year-over-year in absolute dollars in 2009 and 2008, primarily as a result of decreased order volume and net sales. The year-over-year increase in gross margin percentage in this segment resulted primarily from improved margins as a result of our ongoing review of pricing and profitability of pharmaceutical products, services performed in 2009 with no associated cost of sales provided to a wholesale customer, and the loss of lower margin orders from a PBM partner in late 2008, partially offset by the impact of lower margin wholesale orders.
Fulfillment and Order Processing Expense
| Fiscal Year 2009 |
% Change | Fiscal Year 2008 |
% Change | Fiscal Year 2007 |
||||||||||||||
| ($ in thousands) | ||||||||||||||||||
| Fulfillment and order processing expense |
$ | 45,759 | 5.5 | % | $ | 43,377 | 8.9 | % | $ | 39,817 | ||||||||
| Percentage of net sales |
11.1 | % | 11.8 | % | 11.7 | % | ||||||||||||
| Fixed and variable cost information: |
||||||||||||||||||
| Variable costs |
$ | 32,510 | 9.3 | % | $ | 29,754 | 3.2 | % | $ | 28,829 | ||||||||
| Fixed costs |
$ | 13,249 | -2.7 | % | $ | 13,623 | 24.0 | % | $ | 10,988 | ||||||||
Fulfillment and order processing expenses include payroll and related expenses for personnel engaged in purchasing, fulfillment, distribution, and customer care activities (including warehouse personnel and pharmacists engaged in prescription verification activities), distribution center equipment and packaging supplies, credit card processing fees, and bad debt expenses. These expenses also include rent and depreciation related to equipment and fixtures in our distribution centers and call center facility. Variable fulfillment costs represent the incremental (variable) costs of fulfilling, processing, and delivering the order that are variable based on sales volume. Royalty expenses, related to certain of our partnerships, are included in marketing and sales expense on the statement of operations and are not reported in variable costs in the table provided above, but are reported as a variable costs in our contribution margin in Note 12 of our consolidated financial statements, “Segment Information,” included in Part IV, Item 15 of this annual report.
Variable fulfillment and order processing expenses increased by $2.8 million in 2009 compared to the prior year, primarily as a result of a 19% increase in order volume in our OTC segment, partially offset by a reduction in per order labor fulfillment costs resulting from process improvements made in our primary distribution center and efficiencies gained as a result of increased order volume. Fixed fulfillment and order processing expenses decreased by $374,000 in 2009 compared to the prior year, primarily as a result of a decrease in consulting fees of approximately $940,000 related to process improvement projects, partially offset by increased depreciation expense of $273,000 related to equipment and software purchases, increased employee related expenses of $175,000, and increased facility expenses of $135,000. Fulfillment and order processing expenses as a percentage of net sales decreased in 2009 as a result of a 20 basis point improvement in variable costs as a
38
Table of Contents
percentage of net sales, due to increased efficiencies in our primary distribution facility, and a 50 basis improvement in fixed costs as a percentage of sales, due to fixed costs spread across a higher revenue base, and to a lesser extent, a reduction in consulting expenses.
Variable fulfillment and order processing expenses increased by $925,000 in 2008 compared to the prior year, primarily as a result of a 10% increase in order volume in our OTC segment. Fixed fulfillment and order processing expenses increased by $2.6 million in 2008 compared to the prior year, primarily as a result of increased costs in our distribution facilities, including facility related costs of $832,000 resulting from the addition of our inventory storage facility in the second half of 2007 and increased routine repairs and maintenance, increased depreciation expense of $827,000 related to equipment and software purchases, increased professional fees of $779,000, related to process improvement projects, and increased employee related costs of $198,000. Fulfillment and order processing expenses as a percentage of net sales increased in 2008 as a result of a 50 basis point increase in fixed costs as a percentage of net sales, partially offset by a year-over-year 40 basis point improvement in variable costs as a percentage of net sales, due to increased efficiencies in our primary distribution facility.
Marketing and Sales Expense
| Fiscal Year 2009 |
% Change | Fiscal Year 2008 |
% Change | Fiscal Year 2007 |
||||||||||||||
| ($ in thousands) | ||||||||||||||||||
| Marketing and sales expense |
$ | 38,293 | 14.0 | % | $ | 33,591 | 11.7 | % | $ | 30,080 | ||||||||
| Percentage of net sales |
9.3 | % | 9.2 | % | 8.9 | % | ||||||||||||
Marketing and sales expenses include advertising expenses, promotional expenditures, web analytic tools, web design, and payroll and related expenses for personnel engaged in marketing and merchandising activities. Advertising expenses include our obligations under various advertising contracts. In addition, marketing and sales expense include royalty expenses related to certain of our partnerships of $1.2 million in 2009, $91,000 in 2008, and $105,000 in 2007. Advertising and promotional costs were $27.5 million in 2009, $23.2 million in 2008, and $20.7 million in 2007.
Marketing and sales expenses increased both in absolute dollars and as a percentage of net sales in 2009 compared to the prior year. The year-over-year increase of $4.7 million in 2009 resulted primarily from an increase of $3.3 million in paid search, affiliate, and portal costs, driven primarily by order volume and growth in new customer orders, an increase in royalty expenses of $1.1 million generated from our partnerships, and a $437,000 increase in employee related costs.
Marketing and sales expenses increased both in absolute dollars and as a percentage of net sales in 2008 compared to the prior year. The year-over-year increase of $3.5 million in 2008 resulted primarily from an increase of $2.5 million in paid search, affiliate, and portal costs, driven primarily by an increase in order volume in our OTC segment, an increase in the percentage of paid orders to total orders in both our OTC and vision segments, and an increase in cost per order in our vision segment, increased employee related costs of $832,000 driven by an increase in headcount and stock-based compensation, and an increase in other operating costs of $174,000.
Marketing and sales expense per new customer decreased in 2009 to $21 compared to $23 in 2008, as a result of an increase in new customers primarily driven by our lower cost customer acquisition partnership channel. Marketing and sales expense per new customer remained consistent between 2008 and 2007 at $23.
39
Table of Contents
Technology and Content Expense
| Fiscal Year 2009 |
% Change | Fiscal Year 2008 |
% Change | Fiscal Year 2007 |
||||||||||||||
| ($ in thousands) | ||||||||||||||||||
| Technology and content expense |
$ | 24,880 | 8.1 | % | $ | 23,011 | 26.0 | % | $ | 18,258 | ||||||||
| Percentage of net sales |
6.0 | % | 6.3 | % | 5.4 | % | ||||||||||||
Technology and content expenses consist primarily of payroll and related expenses for personnel engaged in developing, maintaining, and making routine upgrades and improvements to our websites. Technology and content expenses also include Internet access and hosting charges, depreciation on hardware and IT structures, utilities, and website content and design expenses.
Technology and content expenses increased in absolute dollars but decreased as a percentage of net sales in 2009 compared to the prior year. The year-over-year increase of $1.9 million resulted primarily from increases in depreciation costs of $1.5 million related to the completion of internally developed software projects and the acquisition of software and computer equipment to enhance our websites and IT infrastructure, and an increase in employee related expenses of $370,000, primarily driven by a slight increase in headcount and other compensation, partially offset by a reduction in stock compensation expense. Technology and content expenses as a percentage of net sales decreased in 2009 as a result of fixed costs spread across a higher revenue base.
Technology and content expenses increased both in absolute dollars and as a percentage of net sales in 2008 compared to the prior year. The year-over-year increase of $4.8 million resulted primarily from increases in depreciation costs of $2.5 million and increases in software license and maintenance costs of $460,000, resulting from the completion of internally developed software projects and the acquisition of software and computer equipment to enhance our websites and IT infrastructure, and an increase in employee related costs of $1.7 million driven primarily by headcount and increased utilization of external IT contractors.
General and Administrative Expense
| Fiscal Year 2009 |
% Change | Fiscal Year 2008 |
% Change | Fiscal Year 2007 |
||||||||||||||
| ($ in thousands) | ||||||||||||||||||
| General and administrative expense |
$ | 17,247 | -9.4 | % | $ | 19,034 | -9.1 | % | $ | 20,928 | ||||||||
| Percentage of net sales |
4.2 | % | 5.2 | % | 6.2 | % | ||||||||||||
General and administrative expenses consist of payroll and related expenses for executive and administrative personnel, corporate facility expenses, professional service expenses, and other general corporate expenses.
General and administrative expenses decreased in both absolute dollars and as a percentage of net sales in 2009 compared to the prior year. The year-over-year decrease of $1.8 million resulted primarily from a decrease in stock-based compensation of $1.9 million primarily due to option grants becoming fully vested in 2008, a decrease in professional fees of $1.6 million primarily related to pricing and sourcing initiatives that were incurred in the prior year, and to a lesser extent, in the first half of 2009, a decrease of $1.6 million related to the settlement of our New Jersey (NJ) sales tax litigation, and reduced insurance costs of $400,000, partially offset by the settlement paid to 1-800 Contacts of $475,000, a $1.0 million advisory fee related to our strategic alliance with Luxottica Group S.p.A., increased employee related expenses of $1.5 million, and $400,000 of expenses related to our acquisition of Salu. General and administrative expenses as a percentage of net sales decreased in 2009 as a result of fixed costs spread across a higher revenue base.
General and administrative expenses decreased in both absolute dollars and as a percentage of net sales in 2008 compared to the prior year. The year-over-year decrease of $1.9 million resulted primarily from a $2.5
40
Table of Contents
million expense in 2007 related to an estimate recorded for sales taxes and interest on an unfavorable ruling on our NJ sales tax case, and a decrease in stock-based compensation of $1.3 million, partially offset by a $1.6 million increase in professional fees, primarily related to a consulting project focused on our profitability initiatives and increased legal and tax and accounting fees, and an increase of $380,000 resulting from sales taxes and interest on the NJ sales tax case.
Amortization of Intangible Assets
| Fiscal Year 2009 |
% Change | Fiscal Year 2008 |
% Change | Fiscal Year 2007 | |||||||||||
| ($ in thousands) | |||||||||||||||
| Amortization of intangible assets |
$ | 477 | -45.0 | % | $ | 867 | -29.7 | % | $ | 1,234 | |||||
Amortization of intangible assets includes the amortization expense associated with assets acquired in connection with our acquisitions of CNS and assets acquired in connection with our agreement with GNC, and other intangible assets, including a technology license agreement, domain names, and trademarks.
Amortization expense decreased in 2009 and 2008 compared to the prior year, as a result of certain intangible assets being fully amortized in each of the three years.
Interest Income and Expense
| Fiscal Year 2009 |
% Change | Fiscal Year 2008 |
% Change | Fiscal Year 2007 | |||||||||||
| ($ in thousands) | |||||||||||||||
| Interest income, net |
$ | 46 | -92.7 | % | $ | 631 | -62.3 | % | $ | 1,675 | |||||
Interest income consists of earnings on our cash, cash equivalents, and marketable securities, and interest expense consists primarily of interest associated with capital lease and debt obligations. The year-over-year decrease in net interest income in 2009 and 2008 was primarily a result of receiving lower returns on cash, cash equivalents, and marketable securities balances, partially offset by a decrease in interest expense as we decreased our outstanding debt obligations.
Gain from Discontinued Operations
| Fiscal Year 2009 |
% Change | Fiscal Year 2008 |
% Change | Fiscal Year 2007 | |||||||||||
| ($ in thousands) | |||||||||||||||
| Gain from discontinued operations |
$ | 5,946 | -26.4 | % | $ | 8,080 | 32.3 | % | $ | 6,108 | |||||
The gain from discontinued operations in 2009 represents six monthly payments of $991,000 made by Rite Aid for the sale of the LPU business, which concluded in the second quarter of 2009. This compares to the gains of $5.7 million in 2008 generated by discontinued operations prior to the sale of the LPU business to Rite Aid in September 2008, and $2.3 million of gains from the sale of discontinued operations, which includes $4.0 million or four monthly payments of $991,000, the gain on the sale of inventory of $276,000, partially offset by the acceleration of $1.9 million of prepaid marketing costs. In 2007, the gain from discontinued operations represents the income generated from our LPU segment for a full year, prior to the sale to Rite Aid.
41
Table of Contents
Non-GAAP Measure
Adjusted EBITDA
The following table provides information regarding our adjusted EBITDA, including a reconciliation of net loss to adjusted EBITDA, for the last three fiscal years (in thousands):
| Fiscal Year | ||||||||||||
| 2009 | 2008 | 2007 | ||||||||||
| Net loss |
$ | (1,377 | ) | $ | (8,287 | ) | $ | (11,511 | ) | |||
| Amortization of intangible assets |
477 | 867 | 1,234 | |||||||||
| Amortization of non-cash marketing |
— | 3,435 | 2,290 | |||||||||
| Stock-based compensation |
5,400 | 7,564 | 8,801 | |||||||||
| Depreciation |
12,682 | 10,912 | 7,504 | |||||||||
| Interest income, net |
(46 | ) | (631 | ) | (1,675 | ) | ||||||
| Adjusted EBITDA |
$ | 17,136 | $ | 13,860 | $ | 6,643 | ||||||
To supplement the consolidated financial statements presented accordance with U.S. generally accepted accounting principles (GAAP), we use the non-GAAP measure of adjusted EBITDA, defined as earnings before interest, taxes, depreciation, and amortization of intangible assets and non-cash marketing expenses, adjusted to exclude the impact of stock-based compensation expense. This non-GAAP measure is provided to enhance the user’s overall understanding of the company’s current financial performance. Management believes that adjusted EBITDA, as defined, provides useful information to the company and to investors by excluding certain items that may not be indicative of the company’s core operating results. In addition, because we have historically provided adjusted EBITDA measures to investors, management believes that including adjusted EBITDA measures provides consistency in the our financial reporting. However, adjusted EBITDA should not be considered in isolation, or as a substitute for, or as superior to, net income/loss, cash flows, or other consolidated income/loss or cash flow data prepared in accordance with GAAP, or as a measure of our profitability or liquidity. Although adjusted EBITDA is frequently used as a measure of operating performance, it is not necessarily comparable to other similarly titled captions of other companies due to differences in methods of calculation. Net income/loss is the closest financial measure prepared by us in accordance with GAAP in terms of comparability to adjusted EBITDA.
Significant Accounting Judgments
The preparation of financial statements in conformity with GAAP requires estimates and assumptions that affect the reported amounts of assets and liabilities, revenues and expenses, and related disclosures of contingent assets and liabilities in the consolidated financial statements and accompanying notes. The Securities and Exchange Commission has defined a company’s critical accounting policies as the ones that are most important to the portrayal of the company’s financial condition and results of operations and that require the company to make its most difficult and subjective judgments, often as a result of the need to make estimates of matters that are inherently uncertain. Significant accounting policies are included in Note 1 of our consolidated financial statements included in Part IV, Item 15 of this annual report. Although we believe that our estimates, assumptions, and judgments are reasonable, they are based on information presently available. Actual results may differ significantly from these estimates under different assumptions, judgments, or conditions. In addition, any significant unanticipated changes in any of our assumptions could have a material adverse effect on our business, financial condition, and results of operations.
Revenue Recognition
We recognize revenue from product sales or services rendered (including advertising revenues), net of sales tax, when the following revenue recognition criteria are met: (1) persuasive evidence of an arrangement exists; (2) delivery has occurred or services have been rendered; (3) the selling price or fee earned is fixed or determinable; and (4) collection of the resulting receivable is reasonably assured.
42
Table of Contents
OTC¸ Vision, and Mail-Order. We record revenues from sales of OTC, vision, and mail-order pharmacy when the products are shipped and title passes to customers, net of promotional discounts, cancellations, rebates, and returns allowances. We generally require payment by credit card at the point of sale. We estimate return allowances, which reduce product sales by our estimate of expected product returns, based on our historical experience. Historically, product returns have not been significant and have not differed significantly from our estimates.
Prescription Sales. For insured prescriptions in our mail-order segment, the co-payment and the insurance reimbursement (which together make up the amount due to drugstore.com) constitute the full value of the prescription drug sale, and we receive this entire amount as cash. We therefore recognize the entire amount as revenue when we ship the order to the customer.
From time to time, we provide incentive offers to our customers to encourage purchases. Such offers include discounts on specific current purchases, or future rebates based on a percentage of the current purchase, as well as other offers. We treat discounts, when our customers accept them, as a reduction in the sales price of the related transaction, and we present them as a net amount in net sales. We treat rebates as a reduction in the sales price based on estimated redemption rates. We estimate redemption rates using our historical experience for similar offers. Historically, our redemption rates have not differed materially from our estimates, which we adjust quarterly.
Generally, when we are the primary party obligated in a transaction, are subject to inventory risk, have latitude in establishing prices and selecting suppliers, or have several but not all of these indicators, we record revenue on a gross basis. If we are not primarily obligated and amounts earned are determined using a fixed percentage, a fixed-payment schedule, or a combination of the two, we record revenue on a net basis.
Consignment and Drop-ship Arrangements. We record revenues generated by consignment arrangements with GNC, Rite Aid and Medco in our OTC segment on a net basis because we do not take title to the inventory and do not establish pricing. We record revenues generated from our drop-ship arrangements with vendors in our OTC segment on a gross basis when we are the primary party obligated in a transaction, are subject to inventory risk, have latitude in establishing prices and selecting suppliers, or have several but not all of these indicators.
Strategic Partnerships. We record revenues generated from the Amazon.com Marketplace in our OTC segment on a gross basis, because we act as a principal, based on the fact that we are subject to inventory risk, have latitude in establishing prices and selecting suppliers. We record revenues generated by the Weil agreement in our OTC segment on a net basis, because we act as an agent, based on the fact that we earn a fixed dollar amount per customer transaction regardless of the amount billed to the customer, and we do not bear general inventory risk associated with these sales. We record revenues generated from the Medco and Rite Aid online stores in our OTC segment on a gross basis, because we act as a principal, based on the fact that we are subject to inventory and credit risk, have latitude in establishing prices and selecting suppliers. Medco and Rite Aid earn a percentage of the contribution margin, defined as net sales, less direct costs of these sales and the incremental cost of fulfilling, processing and delivering the order, from the Medco and Rite Aid online stores, respectively, which we record in marketing and sales expense in the consolidated statements of operations.
Revenue Arrangements with Multiple Deliverables. When we enter into arrangements with multiple deliverables we evaluate the following criteria that must be met in order for the deliverables in the arrangement to be treated as separate units of accounting; (1) the delivered item has value on a stand-alone basis; (2) there is objective and reliable evidence of the fair value of the undelivered item; and (3) delivery or performance of the undelivered item is considered probable and substantially in the control of the vendor. When the separation criteria are not met, the delivered item is accounted for as a combined unit of accounting with the undelivered item. Therefore, revenue for the delivered and undelivered items are recognized over the service period of the last delivered item or if it is not a service, when the last item is delivered.
43
Table of Contents
Inventories
We value our inventories at the lower of cost (using the weighted-average cost method) or the current estimated market value. We regularly review inventory quantities on hand and adjust our inventories for shrinkage and slow-moving, damaged, and expired inventory, which we record as the difference between the cost of the inventory and the estimated market value based on management’s assumptions about future demand for the products we offer and market conditions. We use a variety of methods to reduce the quantity of slow-moving inventory, including reducing sales prices on our websites, negotiating returns to vendors, and liquidating inventory through third parties. If our estimates of future product demand or our assumptions about market conditions are inaccurate, we could understate or overstate the write down required for excess and obsolete inventory. Historically, inventory write downs have not differed materially from our estimates.
Goodwill, Indefinite lived and Other Intangible Assets
We test for impairment of goodwill and indefinite lived assets during the fourth quarter of each year and whenever indicators of impairment occur. The first phase of the test screens for impairment, while the second phase of the test (if necessary) measures the amount of impairment. The first phase is performed by comparing the implied fair value of the applicable reporting unit to its carrying value. Fair value is determined using either a discounted cash flow methodology or methodology based on comparable market prices. The second step of the asset impairment test compares the implied fair value of reporting unit asset with the carrying amount of that asset. If the carrying amount of the reporting unit asset exceeds the implied fair value of that asset, an impairment loss is recognized in an amount equal to the excess.
During fiscal 2009, we estimated the fair value of our reporting units by preparing a discounted cash flow analysis using forward looking projections of our estimated future operating results. Based on the results of the discounted cash flow analysis, we concluded that the fair value exceeds the carrying value, and therefore goodwill is not impaired. We also considered as an indicator of market value the market value of our common stock during the fourth quarter.
The significant assumptions used in our discounted cash flow analysis included: projected operating results, the discount rate used to present value future cash flows, and capital expenditures. Projected operating results assumptions include sales growth assumptions which are based on historical trends, and to a lesser extent, future sales growth from new strategic partnerships or initiatives. Also included in projected operating results are gross margin and operating cost growth assumptions which are based on historical relationship of those measures compared to sales. Our discount rate is a “market participant” weighted average cost of capital (WACC). Our capital expenditure assumptions are based on our planned capital expenditures for existing and new projects. Sensitivity tests were performed on our significant assumptions and determined that a reasonable, negative change in assumptions would not impact our conclusions.
We review the carrying values of our amortized long-lived assets, including definite-lived intangible assets, whenever an indicator of impairment exists. When facts and circumstances indicate that the carrying values of long-lived assets may be impaired, we perform an evaluation of recoverability. The determination of whether impairment exists is based on any excess of the carrying value over the expected future cash flows, as estimated through undiscounted cash flows, excluding interest charges. Any resulting impairment charge would be measured based on the difference between the carrying value of the asset and its fair value, as estimated through expected future discounted cash flows, discounted at a rate of return for an alternate investment.
Stock-Based Compensation
We measure compensation cost for all stock-based awards at fair value on the date of grant and recognize compensation cost over the service period for awards expected to vest. We calculate the fair value of our stock options and stock appreciation rights granted to employees using the Black-Scholes option pricing model using
44
Table of Contents
the single-option approach. The fair value of restricted stock is determined based on the number of shares granted and the quoted price of our common stock. The fair value is recognized as expense over the service period, net of estimated forfeitures, using the straight-line method. We base our computation of expected volatility on our historical volatility, adjusted for changes in capital structure and corporate changes, information available that may indicate future volatility, and observable mean reversion tendencies of historical volatility. Our expected term estimates are based on a comprehensive weighted average life (WAL) analysis. The WAL analysis provides a historical based platform for use in developing expected term estimates for the future based on the historically observed time periods from grant date through post-vesting activities, such as exercise and cancellation. We base the risk-free interest rate on the implied yield currently available on U.S. Treasury zero-coupon issues with an equivalent remaining term. Where the expected term of our stock-based awards does not correspond with the terms for which interest rates are quoted, we average the rates quoted for the closest available term maturities. A dividend yield of 0% is considered appropriate as we have not issued and do not anticipate issuing any dividends in the near future. When estimating forfeitures, we consider historical voluntary termination behavior in addition to actual option forfeitures. In conjunction with this analysis, we identified distinct subgroups: non-management employees, management employees, our chief executive officer, board members, and other non-employees. We apply an estimated forfeiture rate to employee subgroups, based on the weighted average termination behavior of those subgroups. If our estimated forfeiture rate changes, we retrospectively increase or decrease stock-based compensation in the period of change. Any such revisions to the estimates we use to calculate the fair value of our stock-based awards could have a material impact on our results of operations and financial position. See Note 11 of our consolidated financial statements, “Employee Benefit Plans,” included in Part IV, Item 15 of this annual report.
Legal Proceedings
We are currently involved in various claims and legal proceedings. Periodically, we review the status of each significant matter and assess our potential financial exposure. If the potential loss from any claim or legal proceeding is considered probable and the amount can be estimated, we accrue a liability for the estimated loss. Because of uncertainties related to these matters, accruals are based only on the best information available at the time. As additional information becomes available, we reassess the potential liability related to our pending claims and legal proceedings and may revise our estimates. Any such revisions in the estimates of the potential liabilities could have a material impact on our future results of operations and financial position. For example, in April 2009, we reached a resolution with the State of New Jersey, regarding sales and use taxes owed by us for the years 2000 to 2008, pursuant to which we paid an aggregate of approximately $1.7 million in full satisfaction of our obligations for those years. We recognized an expense of $2.5 million in 2007 and a benefit of $1.2 million in 2009 in the statements of operations related to this obligation. In addition, in May 2009, we reached an agreement with 1-800 Contacts to resolve, without admission of wrongdoing or liability, certain claims brought against us by 1-800 Contacts for a one-time payment of $475,000, which settlement was included in the statement of operations in 2009. For a description of our material legal proceedings, see Note 8 of our consolidated financial statements, “Commitments and Contingencies,” included in Part IV, Item 15 of this annual report.
Recent Accounting Pronouncements
See Note 1 of our consolidated financial statements, “The Company and Summary of Significant Accounting Policies—New Accounting Pronouncements,” included in Part IV, Item 15 of this annual report.
Liquidity and Capital Resources
We have an accumulated deficit of $771.2 million through January 3, 2010. To date, we have had only three profitable quarters, and we may never achieve profitability on a full-year or consistent basis. We expect to incur net losses in the first quarter of 2010, and possibly longer. From our inception through January 3, 2010, we have financed our operations primarily through the sale of equity securities, including common and preferred stock, yielding net cash proceeds of $421.5 million.
45
Table of Contents
Our primary source of cash is sales made through our websites, for which we collect cash from credit card settlements, or insurance reimbursements. Our primary uses of cash are purchases of inventory, salaries, marketing expenses, and overhead and fixed costs. Any projections of our future cash needs and cash flows are subject to substantial uncertainty for the reasons discussed in this section and in the section entitled “Risk Factors,” in Part I, Item 1A of this annual report.
Our principal sources of liquidity are our cash, cash equivalents, and marketable securities. Historically, our principal liquidity requirements have been to meet our working capital and capital expenditure needs. Until required for other purposes, our cash and cash equivalents are maintained in deposit accounts or highly liquid investments with remaining maturities of 90 days or less at the time of purchase. Our marketable securities, which include commercial paper, U.S. government agency obligations, and corporate notes and bonds, are considered short-term as they are available to fund current operations. In addition, we have a revolving two-year line of credit allowing for borrowings of up to $25.0 million in the aggregate through March 2011, which is available to fund operations, capital expenditures, or finance acquisitions, as needed. As of January 3, 2010, the aggregate available borrowings under the line of credit were approximately $21.5 million.
On February 19, 2010, we completed our acquisition of Salu. See Note 14 “Subsequent Events,” included in Part IV, Item 15 of this annual report. In connection with this acquisition, we financed a portion of the cash payable at the closing of the merger and therefore borrowed $10.0 million under our revolving two-year line of credit, which accrues interest at the higher of the prime rate plus 0.50% (3.75% at February 19, 2010), or 4.50%, effectively reducing the available borrowings under our line of credit to $11.5 million.
We believe that our cash and marketable securities on hand plus our sources of cash will be sufficient to fund our operations and anticipated capital expenditures. However, any projections about our future cash needs and cash flows are subject to substantial uncertainty. As a result, we may need to raise additional monies to fund our operating activities or for strategic flexibility (if, for example, we decide to pursue business or technology acquisitions) or if our expectations regarding our operations and anticipated capital expenditures change. We have assessed in the past, and will continue to assess, opportunities for raising additional funds by selling equity, equity-related or debt securities, obtaining additional credit facilities, or obtaining other means of financing for strategic reasons or to further strengthen our financial position. We cannot be certain that additional financing will be available to us on acceptable terms when required, or at all. Furthermore, if we were to raise additional funds through the issuance of securities, such securities may have rights, preferences, or privileges senior to those of the rights of our common stock and our stockholders may experience additional dilution.
Discussion of Cash Flows
The following table provides information regarding our cash flows for the last three fiscal years (in thousands):
| Fiscal Year | ||||||||||||
| 2009 | 2008 | 2007 | ||||||||||
| Net cash provided by (used in): |
||||||||||||
| Continuing operating activities |
$ | 3,800 | $ | 10 | $ | (128 | ) | |||||
| Discontinued operating activities |
$ | — | $ | 9,903 | $ | 7,906 | ||||||
| Investing activities |
$ | (4,302 | ) | $ | (4,454 | ) | $ | (5,108 | ) | |||
| Financing activities |
$ | (2,520 | ) | $ | 1,166 | $ | 2,509 | |||||
| Net increase (decrease) in cash and cash equivalents |
$ | (3,022 | ) | $ | 6,625 | $ | 5,179 | |||||
Cash provided by (used in) operating activities. Our operating cash flows result primarily from cash received from our customers, fulfillment partners, and advertising and other service revenue, offset by cash payments we make for products and services, employee compensation, payment processing and related transaction costs, and interest payments on our long-term debt obligations. Cash received from customers and
46
Table of Contents
other activities generally corresponds to our net sales, and because our customers primarily use credit cards to buy from us, our receivables from customers settle quickly. Working capital at any specific point in time is subject to many variables, including seasonality, inventory management and category expansion, the timing of cash receipts and payments, vendor payment terms, and valuation of cash equivalents and marketable securities.
In 2009, net cash provided by continuing operations reflects non-cash expenses of $18.5 million, partially offset by a loss from continuing operations of $7.3 million, and uses of working capital of $7.4 million primarily due to increased inventories of $7.5 million to support growth in net sales and increased receivables of $6.0 million due to timing of receipts, partially offset by the timing of payments to our vendors of $6.3 million. In 2008, net cash provided by continuing operations reflects non-cash expenses of $19.3 million, offset by a loss from continuing operations of $16.4 million, and uses of working capital of $2.9 million primarily due the timing of payments to vendors and slight increase in inventory, partially offset by a decrease in receivables and other assets. In 2007, net cash used by continuing operations reflects a loss from continuing operations of $17.6 million and uses of working capital of $0.1 million, offset by non-cash expenses of $17.6 million.
Net cash provided by continuing operations in the 2009 increased $3.8 million compared 2008, primarily from a $9.0 million decrease in the loss from continuing operations, partially offset by an increase of $4.5 million in cash used for working capital purposes and lower non-cash expenses of $0.8 million resulting from lower stock-based compensation, partially offset by higher depreciation expense. Net cash provided by continuing operations in the 2008 increased $0.1 million compared 2007, primarily from a $1.2 million decrease in the loss from continuing operations and a $1.7 million increase in non-cash expenses, partially offset by an increase of $2.8 million in cash used for working capital purposes. Non-cash expenses increased year-over-year in 2008 as a result of an increase in depreciation and amortization expense, partially offset by a decrease in stock-based compensation.
Net cash provided by discontinued operations in 2009 decreased by $9.9 million compared to 2008, as a result of the final settlement of assets and liabilities held by our discontinued LPU business in 2008 upon the sale to Rite Aid. Net cash provided by discontinued operations in 2008 increased $2.0 million compared to 2007 as a result of the timing of payments and collections of accounts receivable of our assets and liabilities held by our discontinued LPU business.
Cash used in investing activities. Our net cash flows from investing activities include the purchase of marketable securities and the acquisition of fixed assets and intangible assets, partially offset by the net proceeds received from the sales and maturities of marketable securities and proceeds from the sale of discontinued operations.
In 2009, net cash used in investing activities reflects the purchase of marketable securities of $15.9 million and the purchase of fixed assets and intangible assets of $8.5 million, partially offset by the $5.9 million of cash proceeds received from the sale of the LPU business and $14.1 million from sales and maturities of marketable securities. In 2008, net cash used in investing activities reflects the purchase of marketable securities of $46.9 million and the purchase of fixed assets of $13.2 million, partially offset by the $4.0 million of cash proceeds received from the sale of the LPU business and $51.7 million from sales and maturities of marketable securities. In 2007, net cash used in investing activities reflects the purchase of marketable securities of $27.5 million and the purchase of fixed assets and intangible assets of $14.7 million, partially offset by $37.1 million from sales and maturities of marketable securities. Net cash used in investing activities has decreased slightly year-over-year in 2009 and 2008, compared to the prior years, primarily as a result of a decrease in the purchase of fixed assets and intangible assets each year, offset by the proceeds received from the sale of discontinued operations. In 2010, we anticipate our capital expenditures to be in the range of $11.0 million to $14.0 million.
Cash provided by (used in) financing activities. Our net cash flows from financing activities represent cash provided from borrowings under our revolving bank line of credit to fund capital expenditures and operations, and the exercise of options and warrants, and shares purchased under our employee stock purchase plan, partially offset by payments on our debt obligations.
47
Table of Contents
Net cash used in financing activities increased by $3.7 million in 2009 compared to cash provided by financing activities in 2008, primarily due to a decrease in proceeds received from borrowings under our revolving line of credit of $2.0 million, an increase in payments on debt obligations of $1.2 million, and a decrease in proceeds received from the exercise of stock options and employee stock purchase plan of $0.3 million primarily due to the expiring of the employee stock purchase plan in June 2009. Net cash provided by financing activities decreased by $1.3 million in 2008 compared to 2007, due to a decrease in proceeds received from the exercise of stock options of $3.8 million due to our lower average stock price, partially offset by an increase in borrowings under our revolving line of credit of $1.0 million used to fund operations and capital expenditures, and a decrease in payments on debt obligations of $1.5 million.
Contractual Obligations and Commitments
In March 2009, we entered into a loan and security agreement with our existing bank. This agreement includes a revolving two-year line of credit allowing for borrowings up to $25.0 million, which accrue interest at the higher of prime rate plus 0.50% (3.75% at January 3, 2010), or 4.50% for general corporate purposes, including short-term working capital needs, and to finance certain potential acquisitions, should we elect to pursue any in the future. The agreement allows for the conversion of up to $15.0 million of the outstanding balance into a term loan, payable in 36 monthly installments of principal and interest at a rate equal to the greater of (a) the prime rate plus 0.50% or (b) 4.50%. Advances available under the revolving line of credit are limited, based on eligible inventory, accounts receivable, and cash and investment balances, and balances outstanding under our existing term loan. In the third quarter of 2009, we paid off the existing term loan and borrowed approximately $3.0 million on the revolving line of credit under this facility, which was outstanding as of January 3, 2010. In addition, availability under the line of credit was reduced by a $541,000 letter of credit we provided to our landlord. Accordingly, the available borrowings under the line of credit were approximately $21.5 million at January 3, 2010. In February 2010, we financed a portion of the cash payable at the closing of the merger of Salu and therefore borrowed $10.0 million under our revolving two-year line of credit, effectively reducing the available borrowings under our line of credit to $11.5 million. The agreement contains certain covenants that are customary in transactions of this nature, including a prohibition on other debt and liens, requirements regarding the payment of taxes, and certain restrictions on mergers and acquisitions, investments, and transactions with our affiliates, as well as certain financial covenants related to our cash and cash equivalents and our free cash flow, which we were in compliance with as of January 3, 2010. The agreement identifies certain events of default that are customary for transactions of this nature and subject to materiality provisions and grace periods where appropriate, including failure to pay any principal or interest under this facility or other instruments when due, the occurrence of a material adverse change, violations of any covenants, a material cross-default to our other debt, or a change of control. As of January 3, 2010, none of these events had occurred.
The balance outstanding on our term loan under our previous agreement with our existing bank, which was replaced by the agreement above, totaled $5.5 million as of December 28, 2008, and there was no balance outstanding under the line of credit as of December 28, 2008.
We also lease computer equipment under non-cancelable capital leases. Capital lease obligations bear interest at approximately 8% and mature 24 months from the date of funding. We secured additional funds of $226,000 during 2009 and $524,000 during 2008, through capital lease financing agreements, through which we financed certain computer equipment and software for periods of two years. We are in compliance with all covenants required by these agreements.
We lease office, distribution center, and call center facilities under non-cancelable operating leases, which include fixed rental payments ending between 2010 and 2020. We have the option to extend some of these leases for one or two additional terms of five years. In addition, we lease various office and IT equipment under operating leases. In December 2009, we entered into an agreement to extend our operating lease for our primary distribution facility located in Swedesboro, New Jersey, where we lease approximately 270,000 square feet. Under the terms of the amended agreement, the lease will expire in December 2020, with options to renew for
48
Table of Contents
two additional five-year periods, if exercised, would extend the lease expiration to December 2030. In August 2004, we entered into an operating lease for approximately 53,000 square feet for our corporate headquarters. The lease expires on July 31, 2013, with two separate five-year renewal options that, if exercised, would extend the lease expiration to July 2023.
As of January 3, 2010, our principal commitments consisted of obligations outstanding under capital and operating leases and our line of credit, as follows (in thousands):
| Payment Due by Period | |||||||||||||||
| Total | < 1 year | 1-3 years | 3-5 years | > 5 years | |||||||||||
| Capital leases (1) |
$ | 231 | $ | 205 | $ | 26 | $ | — | $ | — | |||||
| Line of credit (2) |
2,986 | — | 2,986 | — | — | ||||||||||
| Operating leases (3) |
17,676 | 2,895 | 6,737 | 3,285 | 4,759 | ||||||||||
| $ | 20,893 | $ | 3,100 | $ | 9,749 | $ | 3,285 | $ | 4,759 | ||||||
| (1) | Capital lease obligations consist primarily of technology and operations assets. |
| (2) | Line of credit includes our borrowings on our line of credit with our bank due in March 2011 and excludes approximately $10.0 million that we borrowed in connection with our acquisition of Salu, Inc. on February 19, 2010. |
| (3) | Operating lease obligations consist of office building, distribution center, and call center leases. |
We do not have any future material noncancelable commitments to purchase goods or services.
Off-Balance Sheet Arrangements
We have no material off-balance sheet arrangements.
Management Outlook
For the first quarter of fiscal year 2010, we are targeting net sales in the range of $117.0 million to $121.0 million. We anticipate net loss for the first quarter in the range of $2.4 million to $3.5 million, and adjusted EBITDA in the range of $2.15 million to $3.25 million. This outlook assumes an estimated $4.0 million to $5.0 million of net sales generated by Salu after the closing of the acquisition, as well as $1.9 million of transaction and integration related expenses.
These projections are subject to substantial uncertainty. See “Risk Factors,” in Part I, Item 1A of this annual report and “Special Note Regarding Forward-Looking Statements” above.
49
Table of Contents
| ITEM 7A. | QUANTITATIVE AND QUALITATIVE DISCLOSURE ABOUT MARKET RISK |
We have assessed our vulnerability to certain market risks, including interest rate risk associated with marketable securities, accounts receivable, accounts payable, capital lease obligations, and cash and cash equivalents. Due to the short-term nature of these investments and our investment policies and procedures, we have determined that the risk associated with interest rate fluctuations related to these financial instruments is not material to us.
Our financing facilities expose our net earnings to changes in short-term interest rates because interest rates on the underlying obligations are variable. Borrowings outstanding under the variable interest-bearing financing facilities totaled $3.0 million at January 3, 2010, excluding approximately $10.0 million that we borrowed in connection with our acquisition of Salu, Inc. on February 19, 2010, and the highest interest rate attributable to this outstanding balance was 4.5% at January 3, 2010. A change in net earnings resulting from a hypothetical 10% increase or decrease in interest rates would not be material.
We have investment risk exposure arising from our investments in marketable securities due to volatility of the bond market in general, company-specific circumstances, and changes in general economic conditions. As of January 3, 2010, we had $14.7 million of securities classified as “marketable securities.” We regularly review the carrying value of our investments and identify and record losses when events and circumstances indicate that declines in the fair value of such assets below our accounting basis are other-than-temporary.
| ITEM 8. | FINANCIAL STATEMENTS AND SUPPLEMENTARY DATA |
The financial statements required pursuant to this item are filed under Part IV, Item 15(a)(1) of this annual report. The financial statement schedule required under Regulation S-X is filed under Part IV, Item 15(a)(2) of this annual report.
| ITEM 9. | CHANGES IN AND DISAGREEMENTS WITH ACCOUNTANTS ON ACCOUNTING AND FINANCIAL DISCLOSURE |
None.
| ITEM 9A. | CONTROLS AND PROCEDURES |
Evaluation of Disclosure Controls and Procedures
Under the supervision of and with the participation of our management, including our chief executive officer, chief accounting officer, and general counsel, we performed an evaluation of the effectiveness of our disclosure controls and procedures (as defined in Rules 13a-15(e) and 15d-15(e) under the Securities Exchange Act of 1934, as amended, or the Exchange Act). Based on that evaluation, our management, including our chief executive officer, chief accounting officer, and general counsel, concluded that, as of January 3, 2010, our disclosure controls and procedures were effective to provide reasonable assurance that all material information required to be disclosed in reports filed or submitted by us under the Exchange Act is made known to management in a timely fashion.
The certifications required by Section 302 of the Sarbanes-Oxley Act of 2002 are filed as exhibits 31.1 and 31.2, respectively, in this Form 10-K.
Management’s Report on Internal Control over Financial Reporting
Management is responsible for establishing and maintaining an adequate system of internal control over financial reporting (as defined in Rules 13a-15(f) and 15d-15(f)) under the Exchange Act). Management evaluated the effectiveness of our internal control over financial reporting based on criteria established in
50
Table of Contents
Internal Control—Integrated Framework issued by the Committee of Sponsoring Organizations of the Treadway Commission, or COSO. Based on its evaluation, management concluded that, as of January 3, 2010, our system of internal control over financial reporting was effective. Ernst & Young LLP, an independent registered public accounting firm, has issued an attestation report on the effectiveness of our internal control over financial reporting as of January 3, 2010, which is included below.
Changes in Internal Control over Financial Reporting
There were no changes in our internal control over financial reporting during the most recently completed fiscal quarter that have materially affected, or are reasonably likely to materially affect, our internal controls over financial reporting.
Limitations on Controls
Management does not expect that our disclosure controls and procedures or our internal control over financial reporting will prevent or detect all error and fraud. Any control system, no matter how well designed and operated, is based on certain assumptions and can provide only reasonable, not absolute, assurance that its objectives will be met. In addition, no evaluation of controls can provide absolute assurance that misstatements due to error or fraud will not occur or that all control issues and instances of fraud, if any, within drugstore.com have been detected.
51
Table of Contents
Report of Independent Registered Public Accounting Firm
The Board of Directors and Stockholders
drugstore.com, inc.
We have audited drugstore.com, inc.’s internal control over financial reporting as of January 3, 2010, based on criteria established in Internal Control—Integrated Framework issued by the Committee of Sponsoring Organizations of the Treadway Commission (the COSO criteria). drugstore.com, inc.’s management is responsible for maintaining effective internal control over financial reporting, and for its assessment of the effectiveness of internal control over financial reporting included in the accompanying Management’s Report on Internal Control over Financial Reporting. Our responsibility is to express an opinion on the company’s internal control over financial reporting based on our audit.
We conducted our audit in accordance with the standards of the Public Company Accounting Oversight Board (United States). Those standards require that we plan and perform the audit to obtain reasonable assurance about whether effective internal control over financial reporting was maintained in all material respects. Our audit included obtaining an understanding of internal control over financial reporting, assessing the risk that a material weakness exists, testing and evaluating the design and operating effectiveness of internal control based on the assessed risk, and performing such other procedures as we considered necessary in the circumstances. We believe that our audit provides a reasonable basis for our opinion.
A company’s internal control over financial reporting is a process designed to provide reasonable assurance regarding the reliability of financial reporting and the preparation of financial statements for external purposes in accordance with generally accepted accounting principles. A company’s internal control over financial reporting includes those policies and procedures that (1) pertain to the maintenance of records that, in reasonable detail, accurately and fairly reflect the transactions and dispositions of the assets of the company; (2) provide reasonable assurance that transactions are recorded as necessary to permit preparation of financial statements in accordance with generally accepted accounting principles, and that receipts and expenditures of the company are being made only in accordance with authorizations of management and directors of the company; and (3) provide reasonable assurance regarding prevention or timely detection of unauthorized acquisition, use, or disposition of the company’s assets that could have a material effect on the financial statements.
Because of its inherent limitations, internal control over financial reporting may not prevent or detect misstatements. Also, projections of any evaluation of effectiveness to future periods are subject to the risk that controls may become inadequate because of changes in conditions, or that the degree of compliance with the policies or procedures may deteriorate.
In our opinion, drugstore.com, inc. maintained, in all material respects, effective internal control over financial reporting as of January 3, 2010, based on the COSO criteria.
We also have audited, in accordance with the standards of the Public Company Accounting Oversight Board (United States), the consolidated balance sheets of drugstore.com, inc. as of January 3, 2010 and December 28, 2008, and the related consolidated statements of operations, stockholders’ equity, and cash flows for each of the three years in the period ended January 3, 2010 of drugstore.com, inc., and our report dated March 16, 2010 expressed an unqualified opinion thereon.
/s/ Ernst & Young LLP
Seattle, Washington
March 16, 2010
52
Table of Contents
| ITEM 9B. | OTHER INFORMATION |
Amendment to Lease Agreement
On December 1, 2009, DS Distribution, Inc., a subsidiary of drugstore.com, inc., which subsequently merged with and into drugstore.com, inc., entered into a second amendment to the lease agreement with Liberty Vendor I, L.P (as successor in interest to the Northwestern Mutual Life Insurance Company). This amendment extends the term of our operating lease for our primary distribution facility located in Swedesboro, New Jersey, where we lease approximately 270,000 square feet. Under the terms of the amended agreement, the lease will expire in December 2020, with options to renew for two additional five-year periods, which if exercised, would extend the lease expiration to December 2030.
The foregoing description of the amendment is qualified in its entirety by reference to the full text of such amendment, filed herewith as Exhibit 10.15 and incorporated herein by reference.
Failure to Satisfy NASDAQ Listing Requirement
On March 10, 2010, the Company notified the staff of the NASDAQ Stock Market that it was in material noncompliance with Rule 5635(c) of the Corporate Governance Requirements of the NASDAQ listing requirements with respect to certain equity awards granted under its 2008 Equity Incentive Plan (the “2008 Plan”). The 2008 Plan requires that any award of restricted stock, among other securities, be counted against the 2008 Plan share reserve as three shares to every one share subject to the award (the “Full Value Award Provision”). Recently, our management became aware that the share limit set forth in the 2008 Plan was exceeded as a result of the inadvertent and incorrect application of the Full Value Award Provision. Because the grant of certain awards exceeded the share reserve limit after proper application of the Full Value Award Provision, the Company may be deemed to have issued securities pursuant to the 2008 Plan without stockholder approval. Accordingly, the Company may be deemed not to have complied with Rule 5635(c) of the Corporate Governance Requirements.
The Company submitted its plan to regain compliance with Rule 5635(c) to NASDAQ on March 10, 2010. Such compliance plan would condition the release and delivery of certain restricted stock awards and unvested options and stock appreciation rights on approval by the Company’s stockholders of an amendment to the 2008 Plan. The Company intends to include that amendment in its 2010 proxy statement as a proposal to be presented at the upcoming annual meeting of stockholders, expected to be held on or before June 10, 2010. In the event that stockholder approval is not obtained, these restricted stock awards and unvested options and stock appreciation rights will be forfeited pursuant to their terms and conditions. The Company provided notice to affected award recipients on March 15, 2010.
On March 16, 2010, NASDAQ informed the Company that by providing the foregoing notice to affected award recipients the Company had regained compliance with Rule 5635(c).
53
Table of Contents
PART III
| ITEM 10. | DIRECTORS, EXECUTIVE OFFICERS, AND CORPORATE GOVERNANCE |
Directors and Executive Officers
Information regarding our executive officers required by Part III, Item 10 is set forth in the section entitled “Business—Directors and Officers,” in Part I, Item 1 of this annual report. Information regarding our directors required by Part III, Item 10 is incorporated into this annual report by reference to the section entitled “Proposal No. 1—Election of Directors” in our proxy statement for our annual meeting of stockholders to be held on June 10, 2010, or the 2010 Proxy Statement.
Information relating to compliance with Section 16(a) of the Securities Exchange Act of 1934, as amended, required by Part III, Item 10 is incorporated into this annual report by reference to the section entitled “Section 16 Beneficial Ownership Reporting Compliance” in the 2010 Proxy Statement.
Code of Business Conduct and Ethics
Our board of directors has adopted a code of business conduct and ethics, or Code, applicable to all directors, officers and employees of drugstore.com, including our chief executive officer, chief finance officer, chief accounting officer, and controller. You may obtain a copy of the Code, without charge, on written request to Investor Relations, drugstore.com, inc., 411 108th Avenue NE, Suite 1400, Bellevue, Washington 98004, or by calling (425) 372-3200.
| ITEM 11. | EXECUTIVE COMPENSATION |
Information regarding executive compensation required by Part III, Item 11 is incorporated into this annual report by reference to the section entitled “Executive Compensation” in the 2010 Proxy Statement.
| ITEM 12. | SECURITY OWNERSHIP OF CERTAIN BENEFICIAL OWNERS AND MANAGEMENT AND RELATED STOCKHOLDER MATTERS |
Information regarding our equity compensation plans required by Part III, Item 12 is incorporated into this annual report by reference to in the section entitled “Securities Authorized for Issuance under Equity Compensation Plan” in the 2010 Proxy Statement.
Information regarding security ownership of certain beneficial owners and management and related stockholder matters required by Part III, Item 12 is incorporated into this annual report by reference to the section entitled “Security Ownership of Certain Beneficial Owners and Management” in the 2010 Proxy Statement.
| ITEM 13. | CERTAIN RELATIONSHIPS AND RELATED TRANSACTIONS, AND DIRECTOR INDEPENDENCE |
Information regarding certain relationships and related transactions required by Part III, Item 13 is incorporated into this annual report by reference to the section entitled “Transactions with Related Persons” in the 2010 Proxy Statement.
| ITEM 14. | PRINCIPAL ACCOUNTANT FEES AND SERVICES |
Information regarding principal accountant fees and services required by Part III, Item 14 is incorporated into this annual report by reference to the section entitled “Proposal No. 3—Ratification of Appointment of Independent Public Accounting Firm” in the 2010 Proxy Statement.
54
Table of Contents
PART IV
| ITEM 15. | EXHIBITS, FINANCIAL STATEMENT SCHEDULES. |
| (a) | The following documents are filed as a part of this annual report on Form 10-K: |
1. Index to Consolidated Financial Statements:
| Page | ||
| F-1 | ||
| F-2 | ||
| F-3 | ||
| F-4 | ||
| F-5 | ||
| F-6 |
2. Index to Financial Statement Schedules:
| F-37 |
All other schedules have been omitted because the required information is shown in the consolidated financial statements or the accompanying notes, or is not applicable or required.
3. Index of Exhibits:
| Exhibit No. |
Exhibit Description | |
| 2.1 | Definitive Agreement and Plan of Merger with Salu, Inc. (incorporated by reference to Exhibit 2.1 to drugstore.com, inc.’s Current Report on Form 8-K dated February 19, 2010 (SEC File No. 000-26137)). | |
| 3.1 | Amended and Restated Certificate of Incorporation of drugstore.com, inc. (incorporated by reference to Exhibit 3.2 to drugstore.com, inc.’s Registration Statement on Form S-1 filed February 9, 2000 (Registration No. 333-96441)). | |
| 3.1a | Certificate of Designation of Series 1 Preferred Stock of drugstore.com, inc. (incorporated by reference to Exhibit 3.1a to drugstore.com, inc.’s Quarterly Report on Form 10-Q for the Quarter Ended July 2, 2000 (SEC File No. 000-26137)). | |
| 3.2 | Amended and Restated Bylaws of drugstore.com, inc. dated January 26, 2009 (incorporated by reference to Exhibit 3.1 to drugstore.com inc.’s Current Report on Form 8-K dated January 26, 2009 (SEC File No. 000-26137)). | |
| 4.1 | Warrant issued to Highbridge International LLC on December 8, 2003, on the cancellation of the warrant issued to Tel-Drug, Inc. on June 26, 2000 (incorporated by reference to Exhibit 4.1 to drugstore.com inc.’s Annual Report on Form 10-K for the Fiscal Year Ended January 2, 2005 (SEC File No. 000-26137)). | |
| 4.2 | Warrant issued to Lehman Brothers, Inc. on November 16, 2006, on the cancellation of the warrant issued to Heidrick & Struggles, Inc. on February 14, 2005 (incorporated by reference to Exhibit 4.2 to drugstore.com inc.’s Annual Report on Form 10-K for the Fiscal Year Ended December 31, 2006 (SEC File No. 000-26137)). | |
| 4.3 | Form of Warrant (incorporated by reference to Exhibit 4.1 to drugstore.com inc.’s Quarterly Report on Form 10-Q for the Quarter Ended July 1, 2007 (SEC File No. 000-26137)). | |
| 4.4 | Form of Warrant (incorporated by reference to Exhibit 4.1 to drugstore.com inc.’s Quarterly Report on Form 10-Q for the Quarter Ended September 30, 2007 (SEC File No. 000-26137)). | |
55
Table of Contents
| Exhibit No. |
Exhibit Description | |
| 4.5 | 1998 Stock Plan, as amended June 21, 2000 (incorporated by reference to Exhibit 10.2 to drugstore.com, inc.’s Quarterly Report on Form 10-Q for the Quarter Ended July 2, 2000) (SEC File No. 000-26137)). | |
| 4.6 | 2008 Equity Incentive Plan (incorporated by reference to Appendix A to the registrant’s proxy statement dated February 23, 2009). | |
| 4.7 | Restricted Stock Agreement between the Company and Dawn G. Lepore dated October 3, 2008 (incorporated by reference to Exhibit 10.1 to drugstore.com, inc.’s Current Report on Form 8-K dated October 2, 2008 (SEC File No. 000-26137)). | |
| 4.8 | Form of Restricted Stock Agreement (under the 2008 Equity Incentive Plan) (incorporated by reference to Exhibit 10.2 to drugstore.com, inc.’s Current Report on Form 8-K dated October 2, 2008 (SEC File No. 000-26137)). | |
| 4.9 | Form of Stock Option Agreement (under the 2008 Equity Incentive Plan) (incorporated by reference to Exhibit 10.3 to drugstore.com, inc.’s Current Report on Form 8-K dated October 2, 2008 (SEC File No. 000-26137)) | |
| 4.10 | Form of Stock-Settled Stock Appreciation Right Agreement (incorporated by reference to Exhibit 10.1 to drugstore.com, inc.’s Quarterly Report on Form 10-Q for the quarter ended September 27, 2009 (Registration No. 000-26137)). | |
| 4.11 | Form of Stock-Settled Stock Appreciation Right Agreement between the Company and Dawn Lepore (incorporated by reference to Exhibit 10.2 to drugstore.com, inc.’s Quarterly Report on Form 10-Q for the quarter ended September 27, 2009 (Registration No. 000-26137)). | |
| 10.1 | Form of Indemnification Agreement between drugstore.com, inc. and each of its officers and directors (incorporated by reference to Exhibit 10.1 to drugstore.com, inc.’s Registration Statement on Form S-1 filed May 19, 1999 (Registration No. 333-78813)). | |
| 10.2 | Fourth Amended and Restated Investors’ Rights Agreement dated May 19, 1999, among drugstore.com, inc. and certain investors (incorporated by reference to Exhibit 10.12 to drugstore.com, inc.’s Registration Statement on Form S-1/A filed July 8, 1999 (Registration No. 333-78813)). | |
| 10.3 | Addendum dated June 17, 1999, to Fourth Amended and Restated Investors’ Rights Agreement dated May 19, 1999, among drugstore.com, inc. and certain investors (incorporated by reference to Exhibit 10.25 to drugstore.com, inc.’s Registration Statement on Form S-1/A filed June 28, 1999 (Registration No. 333-78813)). | |
| 10.4 | Form of Second Addendum to Fourth Amended and Restated Investors’ Rights Agreement dated May 19, 1999, among drugstore.com, inc. and certain investors (incorporated by reference to Exhibit 10.32 to drugstore.com, inc.’s Registration Statement on Form S-1/A filed July 20, 1999 (Registration No. 333-78813)). | |
| 10.5 | Third Addendum dated January 24, 2000, to Fourth Amended and Restated Investors’ Rights Agreement dated May 19, 1999, among drugstore.com, inc. and certain investors (incorporated by reference to Exhibit 10.38 to drugstore.com, inc.’s Registration Statement on Form S-1 filed February 9, 2000 (Registration No. 333-96441)). | |
| 10.6 | Fourth Addendum dated September 29, 2000, to Fourth Amended and Restated Investors’ Rights Agreement dated May 19, 1999, among drugstore.com, inc. and certain investors (incorporated by reference to Exhibit 10.7 to drugstore.com, inc.’s Registration Statement on Form S-3/A filed October 2, 2000 (Registration No. 333-45266)). | |
56
Table of Contents
| Exhibit No. |
Exhibit Description | |
| 10.7 | Fifth Amended and Restated Voting Agreement dated December 23, 1999, among drugstore.com, inc. and certain founders and investors (incorporated by reference to Exhibit 10.20 to drugstore.com, inc.’s Registration Statement on Form S-1 filed February 9, 2000 (Registration No. 333-96441)). | |
| 10.8 | Amended and Restated Main Agreement by and between DS Pharmacy, Inc., a subsidiary of drugstore.com, inc., and Rite Aid Hdqtrs. Corp., a subsidiary of Rite Aid Corporation, dated September 3, 2008 (incorporated by reference to Exhibit 10.1 to drugstore.com, inc.’s Current Report on Form 8-K dated September 3, 2008 (SEC File No. 000-26137)). | |
| 10.9 | Amended and Restated Pharmacy and Private Label Supply and Services Agreement by and between DS Pharmacy, inc., a subsidiary of the Registrant, and Rite Aid Hdqtrs. Corp., a subsidiary of Rite Aid, dated September 3, 2008 (incorporated by reference to Exhibit 10.2 to drugstore.com, inc.’s Current Report on Form 8-K dated September 3, 2008 (SEC File No. 000-26137)). | |
| 10.10 | Main Agreement dated June 17, 1999, between drugstore.com, inc. and General Nutrition Corporation (incorporated by reference to Exhibit 10.28 to drugstore.com, inc.’s Registration Statement on Form S-1/A filed June 28, 1999 (Registration No. 333-78813)). | |
| 10.11 | Governance Agreement dated June 17, 1999, among drugstore.com, inc., General Nutrition Corporation and General Nutrition Investment Company (incorporated by reference to Exhibit 10.30 to drugstore.com, inc.’s Registration Statement on Form S-1/A filed June 28, 1999 (Registration No. 333-78813)). | |
| 10.12 | Registration Rights Agreement dated as of December 8, 2003 by and among drugstore.com, inc. and the other signatories thereto (incorporated by reference to Exhibit 10.1 to drugstore.com, inc.’s Current Report on Form 8-K filed December 23, 2003 (SEC File No. 000-26137)). | |
| 10.13 | Lease Agreement dated August 30, 1999, between DS Distribution, Inc. and the Northwestern Mutual Life Insurance Company (incorporated by reference to Exhibit 10.1 to drugstore.com, inc.’s Quarterly Report on Form 10-Q for the quarter ended October 3, 1999 (SEC File No. 000-26137)). | |
| 10.14 | Amendment No. 1 to Lease Agreement dated December 10, 2003, between DS Distribution, Inc. and Liberty Vendor I, L.P (as successor in interest to the Northwestern Mutual Life Insurance Company) (incorporated by reference to Exhibit 10.23 to drugstore.com inc.’s Annual Report on Form 10-K for the Fiscal Year Ended December 28, 2003 (SEC File No. 000-26137)). | |
| 10.15 | Amendment No. 2 to Lease Agreement dated December 1, 2009, between DS Distribution, Inc. and Liberty Vendor I, L.P (as successor in interest to the Northwestern Mutual Life Insurance Company). | |
| 10.16 | Standard Industrial Lease—Multi-Tenant dated May 2, 2003 between Sam-Cher Holdings, Inc. and International Vision Direct, Inc. (incorporated by reference to Exhibit 10.24 to drugstore.com inc.’s Annual Report on Form 10-K for the Fiscal Year Ended December 28, 2003 (SEC File No. 000-26137)). | |
| 10.17 | First Amendment to Lease dated August 1, 2008 between Sam-Cher Holdings, Inc. and Vision Direct, Inc., successor to International Vision Direct, Inc. (incorporated by reference to Exhibit 10.16 to drugstore.com, inc.’s Annual Report on Form 10-K for the Fiscal Year Ended December 28, 2008 (SEC File No. 000-26137)). | |
| 10.18 | Industrial Building Lease dated June 20, 2007 between DS Distribution, Inc. and U.S. Industrial REIT II (incorporated by reference to Exhibit 10.17 to drugstore.com, inc.’s Annual Report on Form 10-K for the Fiscal Year Ended December 28, 2008 (SEC File No. 000-26137)). | |
| 10.19 | First Amendment to Industrial Building Lease dated October 10, 2007 between DS Distribution, Inc. and U.S. Industrial REIT II (incorporated by reference to Exhibit 10.18 to drugstore.com, inc.’s Annual Report on Form 10-K for the Fiscal Year Ended December 28, 2008 (SEC File No. 000-26137)). | |
57
Table of Contents
| Exhibit No. |
Exhibit Description | |
| 10.20 | Sublease effective as of June 1, 2003 between Nova Scotia Power Incorporated and International Vision Direct Ltd. (incorporated by reference to Exhibit 10.25 to drugstore.com inc.’s Annual Report on Form 10-K for the Fiscal Year Ended December 28, 2003 (SEC File No. 000-26137)). | |
| 10.21 | Office Lease Agreement dated August 16, 2004, between EOP-Northwest Properties, L.L.C. and drugstore.com, inc. (incorporated by reference to Exhibit 10.2 to drugstore.com, inc.’s Quarterly Report on Form 10-Q for the quarter ended September 26, 2004 (SEC File No. 000-26137)). | |
| 10.22 | Sublease Agreement dated December 10, 2007 between Rod Asher and Associates, Ltd. and drugstore.com, inc. (incorporated by reference to Exhibit 10.21 to drugstore.com, inc.’s Annual Report on Form 10-K for the Fiscal Year Ended December 28, 2008 (SEC File No. 000-26137)). | |
| 10.23 | Amended and Restated Loan and Security Agreement dated December 29, 2004 (incorporated by reference to Exhibit 10.2 to drugstore.com, inc.’s Quarterly Report on Form 10-Q for the quarter ended April 2, 2006 (SEC File No. 000-26137)). | |
| 10.24 | Third Amendment to Loan and Security Agreement dated March 16, 2006 (incorporated by reference to Exhibit 10.1 to drugstore.com, inc.’s Quarterly Report on Form 10-Q for the quarter ended April 2, 2006 (SEC File No. 000-26137)). | |
| 10.25 | Loan and Security Agreement dated March 5, 2009 (incorporated by reference to Exhibit 10.24 to drugstore.com, inc.’s Annual Report on Form 10-K for the fiscal year ended December 28, 2008 (SEC File No. 000-26137)). | |
| 10.26 | Settlement Agreement dated May 8, 2009 (incorporated by reference to Exhibit 10.1 to drugstore.com, inc.’s Quarterly Report on Form 10-Q for the quarter ended June 28, 2009 (SEC File No. 000-26137)). | |
| 10.27 | Offer letter of Dawn Lepore dated September 21, 2004 (incorporated by reference to Exhibit 10.1 to drugstore.com, inc.’s Current Report on Form 8-K/A filed November 3, 2004 (SEC File No. 000-26137)). | |
| 10.28 | Letter agreement with Dawn Lepore dated December 28, 2006 (incorporated by reference to Exhibit 10.1 to drugstore.com, inc.’s Current Report on Form 8-K filed December 29, 2006 (SEC File No. 000-26137)). | |
| 10.29 | Letter agreement with Dawn Lepore dated December 31, 2008 (incorporated by reference to Exhibit 10.27 to drugstore.com, inc.’s Annual Report on Form 10-K for the Fiscal Year Ended December 28, 2008 (SEC File No. 000-26137)). | |
| 10.30 | Letter agreement with Dawn Lepore dated January 26, 2009 (incorporated by reference to Exhibit 10.1 to drugstore.com, inc.’s Current Report on Form 8-K dated January 26, 2009)(SEC File No. 000-26137)). | |
| 10.31 | Offer letter of Yukio Morikubo dated November 10, 2006 (incorporated by reference to Exhibit 10.2 to drugstore.com, inc.’s Current Report on Form 8-K filed December 4, 2006 (SEC File No. 000-26137)). | |
| 21.1 | List of Subsidiaries. | |
| 23.1 | Consent of Independent Registered Public Accounting Firm. | |
| 24.1 | Powers of Attorney (included on the signature page of this Annual Report on Form 10-K). | |
| 31.1 | Certification of Dawn G. Lepore, Chairman of Board, President and Chief Executive Officer of drugstore.com, inc., pursuant to Section 302 of the Sarbanes-Oxley Act of 2002. | |
| 31.2 | Certification of Robert P. Potter, Vice President, Chief Accounting Officer of drugstore.com, inc., pursuant to Section 302 of the Sarbanes-Oxley Act of 2002. | |
58
Table of Contents
| Exhibit No. |
Exhibit Description | |
| 32.1 | Certification of Dawn G. Lepore, Chairman of Board, President and Chief Executive Officer of drugstore.com, inc., pursuant to 18 U.S.C. Section 1350, as adopted pursuant to Section 906 of the Sarbanes-Oxley Act of 2002. | |
| 32.2 | Certification of Robert P. Potter, Vice President, Chief Accounting Officer of drugstore.com, inc., pursuant to 18 U.S.C. Section 1350, as adopted pursuant to Section 906 of the Sarbanes-Oxley Act of 2002. | |
59
Table of Contents
Report of Independent Registered Public Accounting Firm
The Board of Directors and Stockholders
drugstore.com, inc.
We have audited the accompanying consolidated balance sheets of drugstore.com, inc. as of January 3, 2010 and December 28, 2008, and the related consolidated statements of operations, stockholders’ equity, and cash flows for each of the three years in the period ended January 3, 2010. Our audits also included the financial statement schedule listed in the Index at Item 15(a). These financial statements and schedule are the responsibility of the Company’s management. Our responsibility is to express an opinion on these financial statements and schedule based on our audits.
We conducted our audits in accordance with the standards of the Public Company Accounting Oversight Board (United States). Those standards require that we plan and perform the audit to obtain reasonable assurance about whether the financial statements are free of material misstatement. An audit includes examining, on a test basis, evidence supporting the amounts and disclosures in the financial statements. An audit also includes assessing the accounting principles used and significant estimates made by management, as well as evaluating the overall financial statement presentation. We believe that our audits provide a reasonable basis for our opinion.
In our opinion, the financial statements referred to above present fairly, in all material respects, the consolidated financial position of drugstore.com, inc. at January 3, 2010 and December 28, 2008, and the consolidated results of its operations and its cash flows for each of the three years in the period ended January 3, 2010, in conformity with U.S. generally accepted accounting principles. Also, in our opinion, the related financial statement schedule, when considered in relation to the basic financial statements taken as a whole, presents fairly in all material respects the information set forth therein.
As discussed in Note 1 to the consolidated financial statements, in 2009, the Company changed its method of accounting for instruments indexed to an entity’s own stock and its method of accounting for unvested share-based payments with nonforfeitable rights to dividends.
We also have audited, in accordance with the standards of the Public Company Accounting Oversight Board (United States), drugstore.com, inc.’s internal control over financial reporting as of January 3, 2010, based on criteria established in Internal Control—Integrated Framework issued by the Committee of Sponsoring Organizations of the Treadway Commission and our report dated March 16, 2010 expressed an unqualified opinion thereon.
/s/ Ernst & Young LLP
Seattle, Washington
March 16, 2010
F-1
Table of Contents
CONSOLIDATED BALANCE SHEETS
(in thousands, except share data)
| January 3, 2010 |
December 28, 2008 |
|||||||
| Assets | ||||||||
| Current assets: |
||||||||
| Cash and cash equivalents |
$ | 22,175 | $ | 25,197 | ||||
| Marketable securities |
14,678 | 12,997 | ||||||
| Accounts receivable, net of allowances |
15,073 | 9,108 | ||||||
| Inventories |
40,212 | 32,704 | ||||||
| Other current assets |
2,467 | 2,128 | ||||||
| Assets of discontinued operations |
— | 5,954 | ||||||
| Total current assets |
94,605 | 88,088 | ||||||
| Fixed assets, net |
24,165 | 28,306 | ||||||
| Other intangible assets, net |
3,398 | 3,731 | ||||||
| Goodwill |
32,202 | 32,202 | ||||||
| Other long-term assets |
159 | 222 | ||||||
| Total assets |
$ | 154,529 | $ | 152,549 | ||||
| Liabilities and Stockholders’ Equity | ||||||||
| Current liabilities: |
||||||||
| Accounts payable |
$ | 38,628 | $ | 31,208 | ||||
| Accrued compensation |
6,047 | 4,416 | ||||||
| Accrued marketing expenses |
5,247 | 4,630 | ||||||
| Other current liabilities |
1,563 | 4,560 | ||||||
| Current portion of long-term debt obligations |
195 | 2,998 | ||||||
| Liabilities of discontinued operations |
— | 5,946 | ||||||
| Total current liabilities |
51,680 | 53,758 | ||||||
| Long-term debt obligations, less current portion |
3,011 | 2,567 | ||||||
| Deferred income taxes |
959 | 953 | ||||||
| Other long-term liabilities |
1,213 | 1,071 | ||||||
| Commitments and contingencies |
||||||||
| Stockholders’ equity: |
||||||||
| Preferred stock, $.0001 par value, 10,000,000 shares authorized, no shares issued and outstanding |
— | — | ||||||
| Common stock, $.0001 par value, stated at amounts paid in: 250,000,000 shares authorized, 100,362,285 and 96,547,079 shares issued, and 100,256,729 and 96,547,079 shares outstanding |
869,146 | 864,282 | ||||||
| Treasury stock, at cost, 105,556 shares |
(151 | ) | — | |||||
| Accumulated other comprehensive income (loss) |
(98 | ) | 57 | |||||
| Accumulated deficit |
(771,231 | ) | (770,139 | ) | ||||
| Total stockholders’ equity |
97,666 | 94,200 | ||||||
| Total liabilities and stockholders’ equity |
$ | 154,529 | $ | 152,549 | ||||
See accompanying notes to consolidated financial statements.
F-2
Table of Contents
CONSOLIDATED STATEMENTS OF OPERATIONS
(in thousands, except share and per share data)
| For the year ended | ||||||||||||
| January 3, 2010 |
December 28, 2008 |
December 30, 2007 |
||||||||||
| Net sales |
$ | 412,832 | $ | 366,579 | $ | 339,331 | ||||||
| Costs and expenses: |
||||||||||||
| Cost of sales |
293,545 | 263,697 | 248,308 | |||||||||
| Fulfillment and order processing |
45,759 | 43,377 | 39,817 | |||||||||
| Marketing and sales |
38,293 | 33,591 | 30,080 | |||||||||
| Technology and content |
24,880 | 23,011 | 18,258 | |||||||||
| General and administrative |
17,247 | 19,034 | 20,928 | |||||||||
| Amortization of intangible assets |
477 | 867 | 1,234 | |||||||||
| Total costs and expenses |
420,201 | 383,577 | 358,625 | |||||||||
| Operating loss |
(7,369 | ) | (16,998 | ) | (19,294 | ) | ||||||
| Interest income, net |
46 | 631 | 1,675 | |||||||||
| Loss from continuing operations |
(7,323 | ) | (16,367 | ) | (17,619 | ) | ||||||
| Gain from discontinued operations, net of tax |
5,946 | 8,080 | 6,108 | |||||||||
| Net loss |
$ | (1,377 | ) | $ | (8,287 | ) | $ | (11,511 | ) | |||
| Basic and diluted loss from continuing operations per share |
$ | (0.07 | ) | $ | (0.17 | ) | $ | (0.18 | ) | |||
| Basic and diluted gain from discontinued operations per share |
$ | 0.06 | $ | 0.08 | $ | 0.06 | ||||||
| Basic and diluted net loss per share |
$ | (0.01 | ) | $ | (0.09 | ) | $ | (0.12 | ) | |||
| Weighted average shares outstanding |
96,950,189 | 96,481,787 | 95,350,046 | |||||||||
See accompanying notes to consolidated financial statements.
F-3
Table of Contents
DRUGSTORE.COM, INC.
CONSOLIDATED STATEMENTS OF STOCKHOLDERS’ EQUITY
(in thousands, except share data)
| Common Stock | Treasury Stock | Accumulated other comprehensive income (loss) |
Accumulated deficit |
Total | ||||||||||||||||||||
| Shares | Amount | Shares | Amount | |||||||||||||||||||||
| Balance at December 31, 2006 |
94,335,027 | $ | 843,026 | — | $ | — | $ | (7 | ) | $ | (750,341 | ) | $ | 92,678 | ||||||||||
| Exercise of stock options |
1,869,075 | 4,142 | — | — | — | — | 4,142 | |||||||||||||||||
| Employee stock purchase plan |
92,585 | 224 | — | — | — | — | 224 | |||||||||||||||||
| Stock-based compensation |
— | 8,801 | — | — | — | — | 8,801 | |||||||||||||||||
| Net loss and comprehensive income |
— | — | — | — | 34 | (11,511 | ) | (11,477 | ) | |||||||||||||||
| Balance at December 30, 2007 |
96,296,687 | 856,193 | — | — | 27 | (761,852 | ) | 94,368 | ||||||||||||||||
| Exercise of stock options and warrants |
158,345 | 336 | — | — | — | — | 336 | |||||||||||||||||
| Employee stock purchase plan |
92,047 | 189 | — | — | — | — | 189 | |||||||||||||||||
| Stock-based compensation |
— | 7,564 | — | — | — | — | 7,564 | |||||||||||||||||
| Net loss and comprehensive income |
— | — | — | — | 30 | (8,287 | ) | (8,257 | ) | |||||||||||||||
| Balance at December 28, 2008 |
96,547,079 | 864,282 | — | — | 57 | (770,139 | ) | 94,200 | ||||||||||||||||
| Exercise of stock options and warrants |
55,546 | 122 | — | — | — | — | 122 | |||||||||||||||||
| Employee stock purchase plan |
106,500 | 94 | — | — | — | — | 94 | |||||||||||||||||
| Restricted stock issued, net of 5,262 cancelled shares |
3,547,604 | — | — | — | — | — | — | |||||||||||||||||
| Treasury stock purchases |
— | — | 105,556 | (151 | ) | — | — | (151 | ) | |||||||||||||||
| Stock-based compensation |
— | 5,055 | — | — | — | — | 5,055 | |||||||||||||||||
| Cumulative effect of change in accounting principle |
— | (407 | ) | — | — | — | 285 | (122 | ) | |||||||||||||||
| Net loss and comprehensive loss |
— | — | — | — | (155 | ) | (1,377 | ) | (1,532 | ) | ||||||||||||||
| Balance at January 3, 2010 |
100,256,729 | $ | 869,146 | 105,556 | $ | (151 | ) | $ | (98 | ) | $ | (771,231 | ) | $ | 97,666 | |||||||||
See accompanying notes to consolidated financial statements.
F-4
Table of Contents
DRUGSTORE.COM, INC.
CONSOLIDATED STATEMENTS OF CASH FLOWS
(in thousands)
| For the year ended | ||||||||||||
| January 3, 2010 |
December 28, 2008 |
December 30, 2007 |
||||||||||
| Operating Activities: |
||||||||||||
| Net loss |
$ | (1,377 | ) | $ | (8,287 | ) | $ | (11,511 | ) | |||
| Less gain from discontinued operations |
5,946 | 8,080 | 6,108 | |||||||||
| Loss from continuing operations |
(7,323 | ) | (16,367 | ) | (17,619 | ) | ||||||
| Adjustments to reconcile loss from continuing operations to net cash provided by operating activities: |
||||||||||||
| Depreciation |
12,682 | 10,912 | 7,504 | |||||||||
| Amortization of intangible assets |
477 | 867 | 1,234 | |||||||||
| Stock-based compensation |
5,400 | 7,564 | 8,801 | |||||||||
| Other |
(33 | ) | (59 | ) | 14 | |||||||
| Changes in: |
||||||||||||
| Accounts receivable |
(5,965 | ) | 1,891 | (337 | ) | |||||||
| Inventories |
(7,508 | ) | (1,467 | ) | (5,155 | ) | ||||||
| Other assets |
(276 | ) | 1,514 | (929 | ) | |||||||
| Accounts payable, accrued expenses and other liabilities |
6,346 | (4,845 | ) | 6,359 | ||||||||
| Net cash provided by (used in) continuing operations |
3,800 | 10 | (128 | ) | ||||||||
| Net cash provided by discontinued operations |
— | 9,903 | 7,906 | |||||||||
| Net cash provided by operating activities |
3,800 | 9,913 | 7,778 | |||||||||
| Investing Activities: |
||||||||||||
| Purchases of marketable securities |
(15,910 | ) | (46,926 | ) | (27,544 | ) | ||||||
| Sales and maturities of marketable securities |
14,130 | 51,705 | 37,141 | |||||||||
| Purchases of fixed assets |
(8,323 | ) | (13,197 | ) | (14,249 | ) | ||||||
| Proceeds from the sale of discontinued operations |
5,946 | 3,964 | — | |||||||||
| Purchases of intangible assets |
(145 | ) | — | (456 | ) | |||||||
| Net cash used in investing activities |
(4,302 | ) | (4,454 | ) | (5,108 | ) | ||||||
| Financing Activities: |
||||||||||||
| Proceeds from exercise of stock options, warrants, and employee stock purchase plan |
216 | 525 | 4,366 | |||||||||
| Proceeds from term loan and line of credit |
2,986 | 5,000 | 4,000 | |||||||||
| Principal payments on capital leases, line of credit and term loan obligations |
(5,571 | ) | (4,359 | ) | (5,857 | ) | ||||||
| Purchase of treasury stock |
(151 | ) | — | — | ||||||||
| Net cash provided by (used in) financing activities |
(2,520 | ) | 1,166 | 2,509 | ||||||||
| Net increase (decrease) in cash and cash equivalents |
(3,022 | ) | 6,625 | 5,179 | ||||||||
| Cash and cash equivalents at beginning of year |
25,197 | 18,572 | 13,393 | |||||||||
| Cash and cash equivalents at end of year |
$ | 22,175 | $ | 25,197 | $ | 18,572 | ||||||
| Supplemental Cash Flow Information: |
||||||||||||
| Cash paid for interest |
$ | 215 | $ | 360 | $ | 402 | ||||||
| Equipment acquired in capital lease agreements |
226 | 524 | 469 | |||||||||
See accompanying notes to consolidated financial statements.
F-5
Table of Contents
NOTES TO CONSOLIDATED FINANCIAL STATEMENTS
1. The Company and Summary of Significant Accounting Policies
The Company
drugstore.com, inc. (drugstore.com) is a leading online provider of health, beauty, vision, and pharmacy products. We offer health, beauty, household, and other non-prescription products and prescription medications through our web store located at www.drugstore.com. We also offer prestige beauty products through our web store located at www.beauty.com (which is also accessible through the drugstore.com website); contact lenses through our wholly owned subsidiary Vision Direct Inc. (Vision Direct), through web stores located at www.visiondirect.com, www.lensmart.com, www.lensworld.com, and www.lensquest.com (which are also accessible through the drugstore.com website); customized nutritional supplement programs through our wholly owned subsidiary, Custom Nutrition Services, Inc. (CNS); and offer category specific products through our microsites located at www.sexualwellbeing.com, www.thenaturalstore.com, www.allergysuperstore.com and www.athisbest.com. We also offer health and beauty products through www.riteaidonlinestore.com; and non-prescription products offered through Medco Health Solutions, Inc.’s (Medco) web store located at www.medcohealthstore.com. Our products are also available toll-free by telephone at 1-800-DRUGSTORE and 1-800-VISIONDIRECT.
On February 19, 2010, we completed our acquisition of Salu, Inc., the owner of the web store www.skinstore.com and operator and fulfillment partner for www.spalook.com. Through these web stores, we will offer clinical skin care and spa products and combined with our beauty business we will be one of the largest online beauty retailers offering mass beauty products, prestige brands, and clinical skincare products. Because the transaction occurred after our 2009 fiscal year end, our fiscal year 2009 consolidated financial statements do not include the results of operations or financial position of Salu. See Note 14 for additional information.
On September 3, 2008, we entered into an amended and restated main agreement with Rite Aid Corporation and certain of its affiliates (Rite Aid) whereby we transferred to Rite Aid the rights to our local pick-up pharmacy business, which includes prescription refills sold online through the drugstore.com web store or the Rite Aid online store and picked up by customers at Rite Aid stores. As a result of this agreement, our local pick-up pharmacy segment is reported as discontinued operations in the consolidated financial statements for all periods presented. See Note 2 for additional information.
Principles of Consolidation and Basis of Presentation
The accompanying consolidated financial statements include those of drugstore.com, inc. and our subsidiaries. All material intercompany transactions and balances have been eliminated.
We operate using a 52/53-week retail calendar year with each of the fiscal quarters in a 52-week year representing a 13-week period. Fiscal year 2009 is a 53-week year, with the fourth quarter of 2009 representing a 14-week period, and fiscal years 2008 and 2007 were 52-week years.
Estimates and Assumptions
The preparation of financial statements in conformity with U.S. generally accepted accounting principles, or GAAP, requires management to make estimates and assumptions that affect the amounts of assets and liabilities, revenues and expenses, and disclosure of contingent assets and liabilities at the date of the financial statements. These estimates include, but are not limited to, revenue recognition, inventories, goodwill and intangible assets, stock-based compensation, deferred taxes, and commitments and contingencies. Actual results could differ from our estimates, and these differences could be material.
F-6
Table of Contents
DRUGSTORE.COM, INC.
NOTES TO CONSOLIDATED FINANCIAL STATEMENTS (Continued)
Cash Equivalents
We consider all highly liquid investments with a maturity of three months or less from the date of purchase to be cash equivalents. Cash equivalents include money market funds and commercial paper.
Marketable Securities
Management determines the appropriate classification of marketable securities at the time of purchase and reevaluates such designation as of each balance sheet date. The evaluation includes our view that our investments in debt securities are available to support current operations and therefore classified as a current asset. At January 3, 2010 and December 28, 2008, marketable securities, which are considered available-for-sale, consisted primarily of government bonds, corporate notes, and commercial paper. Marketable securities are carried at fair value. Net unrealized holding gains were $35,000 at January 3, 2010 and $133,000 at December 28, 2008. Cost of securities sold is determined using the specific identification method.
We regularly monitor and evaluate the realizable value of our marketable securities. When assessing marketable securities for other-than-temporary declines in value, we consider such factors as, among other things, how significant the decline in value is as a percentage of the original cost, how long the market value of the investment has been less than its original cost, the performance of the issuer’s price in relation to the price of its competitors within the industry and the market in general, analyst recommendations, any news that has been released specific to the issuer, and the outlook for the overall industry in which the issuer operates. If events and circumstances indicate that a decline in the value of these assets has occurred and is other than temporary, we record a charge against net earnings. No such charges have been recorded in fiscal years 2009, 2008, and 2007.
Fair Value of Financial Instruments
GAAP has established a fair value hierarchy that prioritizes the inputs used to measure fair value. The hierarchy gives the highest priority to unadjusted quoted prices in active markets for identical assets or liabilities (Level 1 measurement) and the lowest priority to unobservable inputs (Level 3 measurement). This hierarchy requires entities to maximize the use of observable inputs and minimize the use of unobservable inputs. The three levels of inputs used to measure fair value are as follows:
Level 1—Inputs are unadjusted quoted prices in active markets for identical assets or liabilities that we have the ability to access at the measurement date.
Level 2—Inputs include unadjusted quoted prices in active markets for similar assets or liabilities, unadjusted quoted prices for identical or similar assets or liabilities in markets that are not active, or inputs other than quoted prices that are observable for the asset or liability.
Level 3—Inputs for the asset or liability are unobservable but reflect our assumptions that we believe market participants would use in pricing the asset or liability.
The carrying value approximates the fair value for all financial instruments that we do not measure at fair value on the balance sheet, including accounts receivable and debt, due to the short-maturities of the instruments. See Note 4 for a summary of our assets that we measure at fair value.
Concentration of Credit Risk
Financial instruments, which potentially subject us to concentrations of credit risk, consist principally of our holdings of cash, cash equivalents, marketable securities, and accounts receivable. Our credit risk is managed by investing our cash equivalents and marketable securities in high-quality money market instruments and securities
F-7
Table of Contents
DRUGSTORE.COM, INC.
NOTES TO CONSOLIDATED FINANCIAL STATEMENTS (Continued)
of the U.S. government agencies, and high-quality corporate issuers. Our credit risk is managed through monitoring the stability of the United States-based financial institutions we use and the diversification of our financial resources by limiting the investment in any one issuer of not more than 10% of the total portfolio at the time of purchase, except for investments in U.S. treasuries and agencies and investment advisors’ money market funds.
Sales subject to reimbursements collected from insurance companies, pharmacy benefit managers (PBMs), and managed care organizations through our relationship with Rite Aid currently represent 17% of our mail-order pharmacy sales.
Accounts Receivable
Accounts receivable consists primarily of the net amounts to be collected from third parties, including amounts collectible related to credit card purchases, vendor volume purchase and rebate allowances, amounts collectible from advertising agreements, amounts due from Rite Aid for co-payment and insurance reimbursement payments collected on our behalf, amounts due from Medco related to the Medco web store, OTC fulfillment fees related to our agreement with Weil Lifestyle, LLC (Weil), and product revenue generated through our merchant agreements with Amazon.com, Inc. (Amazon.com). Accounts receivable are recorded net of allowances for doubtful accounts, which were $69,000 as of January 3, 2010 and $16,000 as of December 28, 2008. We determine our allowance for doubtful accounts by considering a number of factors, including the length of time receivables are past due, previous loss history, our ability to offset our obligations, and the customer’s ability to pay its obligation. We write off accounts receivable when they become uncollectible, and any payments subsequently received are applied to the allowance for doubtful accounts.
Inventories
Inventories consist of finished goods and are stated at the lower of cost (using the weighted average cost method) or the current estimated market value and adjusted for shrinkage, slow moving, damaged, and expired inventory. We currently purchase our non-pharmaceutical inventory directly from manufacturers and distributors. Through our agreement with Rite Aid, have the right to purchase its pharmaceutical inventory and Rite Aid private label over-the-counter products through Rite Aid. As a result of this relationship, Rite Aid remains one of our largest suppliers.
Fixed Assets
Fixed assets are stated at cost less accumulated depreciation and amortization, which includes the depreciation of assets recorded under capital leases. Depreciation and amortization is determined using the straight-line method over the estimated useful lives of the related assets, which range from two to ten years. Fixed assets purchased under capital leases and leasehold improvements are depreciated over the shorter of the lease term or the estimated useful life. Repairs and maintenance costs are expensed as incurred.
Included in fixed assets is the cost of internally developed software and website development, including software used to upgrade and enhance our websites. We expense all costs related to internally developed software other than those costs incurred during the application development stage. Costs incurred during the application development stage are capitalized and amortized over the estimated useful life of the software, generally three years. Internal labor costs, including benefit costs, and third-party consulting costs totaling $6.6 million, $12.0 million, and $10.8 million, were capitalized during the fiscal years ended January 3, 2010, December 28, 2008, and December 30, 2007, respectively.
F-8
Table of Contents
DRUGSTORE.COM, INC.
NOTES TO CONSOLIDATED FINANCIAL STATEMENTS (Continued)
Leases
We categorize leases at their inception as either operating or capital leases depending on certain defined criteria. We recognize operating lease costs on a straight-line basis without regard to deferred payment terms and lease incentives are treated as a reduction of our costs over the term of the agreement.
Other Intangible Assets
Other intangible assets consist of trade names, domain names, patents and customer lists acquired in connection with the purchase of Vision Direct, CNS and our private label de~luxe™ brand of natural, spa quality personal care products. All definite-lived intangible assets are being amortized over their expected useful lives, which range from two to ten years.
Goodwill
We test for impairment of goodwill during the fourth quarter of each year and whenever indicators of impairment occur. The first phase of the test screens for impairment, while the second phase of the test (if necessary) measures the amount of impairment. The first phase is performed by comparing the implied fair value of the applicable reporting unit to its carrying value. Fair value is determined using either a discounted cash flow methodology or methodology based on comparable market prices. The second step of the goodwill impairment test compares the implied fair value of reporting unit goodwill with the carrying amount of that goodwill. If the carrying amount of the reporting unit goodwill exceeds the implied fair value of that goodwill, an impairment loss is recognized in an amount equal to the excess.
During fiscal 2009, we estimated the fair value of our reporting units by preparing a discounted cash flow analysis using forward looking projections of our estimated future operating results. Based on the results of the discounted cash flow analysis, we concluded that the fair value of our reporting units exceeds the carrying value, and therefore goodwill is not impaired. We also considered as an indicator of market value the market value of our common stock during the fourth quarter.
The significant assumptions used in our discounted cash flow analysis included: projected operating results, the discount rate used to present value future cash flows, and capital expenditures. Projected operating results assumptions include sales growth assumptions which are based on historical trends, and to a lesser extent, future sales growth from new strategic partnerships or initiatives. Also included in projected operating results are gross margin and operating cost growth assumptions which are based on historical relationship of those measures compared to sales. Our discount rate is a “market participant” weighted average cost of capital (WACC). Our capital expenditure assumptions are based on our planned capital expenditures for existing and new projects. Sensitivity tests were performed on our significant assumptions and determined that a reasonable, negative change in assumptions would not impact our conclusions.
During fiscal years 2008 and 2007, we also performed our annual goodwill impairment review and determined that the fair value of each of our reporting units was greater than the carrying value and, accordingly, no impairment charges were recorded.
Long-Lived Assets
We review the carrying values of our amortized long-lived assets, including definite-lived intangible assets, whenever an indicator of impairment exists. When facts and circumstances indicate that the carrying values of long-lived assets may be impaired, we perform an evaluation of recoverability. The determination of whether
F-9
Table of Contents
DRUGSTORE.COM, INC.
NOTES TO CONSOLIDATED FINANCIAL STATEMENTS (Continued)
impairment exists is based on any excess of the carrying value over the expected future cash flows, as estimated through undiscounted cash flows, excluding interest charges. Any resulting impairment charge would be measured based on the difference between the carrying value of the asset and its fair value, as estimated through expected future discounted cash flows, discounted at a rate of return for an alternate investment.
We review our indefinite-lived intangible assets, other than goodwill, for impairment annually during the fourth quarter or when an indicator of impairment exists. We compare the carrying value of the asset to its estimated fair value and record an impairment charge when the carrying value of the asset exceeds the estimated fair value. Based upon our review, we recorded no impairment for amortized or unamortized long-lived assets in fiscal 2009, 2008, or 2007.
Net Sales
We recognize revenue from product sales or services rendered (including advertising revenues), net of sales tax, when the following revenue recognition criteria are met: (1) persuasive evidence of an arrangement exists; (2) delivery has occurred or services have been rendered; (3) the selling price or fee earned is fixed or determinable; and (4) collection of the resulting receivable is reasonably assured.
OTC¸ Vision, and Mail-Order Pharmacy. We record revenues from sales of OTC, vision, and mail-order pharmacy when the products are shipped and title passes to customers, net of promotional discounts, cancellations, rebates, and returns allowances. We generally require payment by credit card at the point of sale. We estimate return allowances, which reduce product sales by our estimate of expected product returns, based on our historical experience. Historically, product returns have not been significant and have not differed significantly from our estimates.
Prescription Sales. For insured prescriptions in our mail-order segment, the co-payment and the insurance reimbursement (which together make up the amount due to drugstore.com) constitute the full value of the prescription drug sale, and we receive this entire amount as cash. We therefore recognize the entire amount as revenue when we ship the order to the customer.
From time to time, we provide incentive offers to our customers to encourage purchases. Such offers include discounts on specific current purchases, or future rebates based on a percentage of the current purchase, as well as other offers. We treat discounts, when our customers accept them, as a reduction in the sales price of the related transaction and we present them as a net amount in net sales. We treat rebates as a reduction in the sales price based on estimated redemption rates. We estimate redemption rates using our historical experience for similar offers. Historically, our redemption rates have not differed materially from our estimates, which we adjust quarterly.
Generally, when we are the primary party obligated in a transaction, are subject to inventory risk, have latitude in establishing prices and selecting suppliers, or have several but not all of these indicators, we record revenue on a gross basis. If we are not primarily obligated and amounts earned are determined using a fixed percentage, a fixed-payment schedule, or a combination of the two, we record revenue on a net basis.
Consignment and Drop-ship Arrangements. We record revenues generated by consignment arrangements with GNC, Rite Aid and Medco in our OTC segment on a net basis because we do not take title to the inventory and do not establish pricing. We record revenues generated from our drop-ship arrangements with vendors in our OTC segment on a gross basis when we are the primary party obligated in a transaction, are subject to inventory risk, have latitude in establishing prices and selecting suppliers, or have several but not all of these indicators.
F-10
Table of Contents
DRUGSTORE.COM, INC.
NOTES TO CONSOLIDATED FINANCIAL STATEMENTS (Continued)
Strategic Partnerships. We record revenues generated from the Amazon.com Marketplace in our OTC segment on a gross basis, because we act as a principal, based on the fact that we are subject to inventory risk, have latitude in establishing prices and selecting suppliers. We record revenues generated by the Weil agreement in our OTC segment on a net basis, because we act as an agent, based on the fact that we earn a fixed dollar amount per customer transaction regardless of the amount billed to the customer, and we do not bear general inventory risk associated with these sales. We record revenues generated from the Medco and Rite Aid online stores (excluding consignment sales) in our OTC segment on a gross basis, because we act as a principal, based on the fact that we are subject to inventory and credit risk, have latitude in establishing prices and selecting suppliers. Medco and Rite Aid earn a percentage of the contribution margin, defined as net sales, less direct costs of these sales and the incremental cost of fulfilling, processing and delivering the order, from the Medco and Rite Aid online stores, respectively, which we record in marketing and sales expense in the consolidated statements of operations.
Revenue Arrangements with Multiple Deliverables. When we enter into arrangements with multiple deliverables we evaluate the following criteria that must be met in order for the deliverables in the arrangement to be treated as separate units of accounting; (1) the delivered item has value on a stand-alone basis; (2) there is objective and reliable evidence of the fair value of the undelivered item; and (3) delivery or performance of the undelivered item is considered probable and substantially in the control of the vendor. When the separation criteria are not met, the delivered item is accounted for as a combined unit of accounting with the undelivered item. Therefore, revenue for the delivered and undelivered items are recognized over the service period of the last delivered item or if it is not a service, when the last item is delivered.
Cost of Sales
Cost of sales consists primarily of the cost of products sold to our customers, including allowances for shrinkage and damaged, slow-moving, and expired inventory, outbound and inbound shipping costs, and expenses related to promotional inventory included in shipments to customers. Payments that we receive from vendors in connection with volume purchase or rebate allowances and payment discount terms are netted against cost of sales.
Shipping Activities
Our revenues from shipping charges to customers are included in net sales and were $14.3 million, $14.8 million, and $15.4 million for the years ended January 3, 2010, December 28, 2008, and December 30, 2007. Outbound shipping costs are included in cost of sales and were $29.0 million, $26.8 million, and $24.8 million for the years ended January 3, 2010, December 28, 2008, and December 30, 2007. The net cost to us of shipping activities was $14.7 million, $12.0 million, and $9.4 million for the years ended January 3, 2010, December 28, 2008, and December 30, 2007.
Fulfillment and Order Processing
Fulfillment and order processing expenses include payroll and related expenses for personnel engaged in purchasing, fulfillment, distribution, and customer care activities (including warehouse personnel and pharmacists engaged in prescription verification activities), distribution center equipment and packaging supplies, credit card processing fees, drop-ship processing fees, and bad debt expenses. These expenses also include rent and depreciation related to equipment and fixtures in our distribution center and call center facilities.
Marketing and Sales
Marketing and sales expenses include advertising expenses, promotional expenditures, public relations expenditures, web analytical tools, web design, and payroll and related expenses for personnel engaged in
F-11
Table of Contents
DRUGSTORE.COM, INC.
NOTES TO CONSOLIDATED FINANCIAL STATEMENTS (Continued)
marketing and merchandising activities. In addition, marketing and sales expense include royalty expenses related to certain of our partnerships of $1.2 million, $91,000, and $105,000 for the years ended January 3, 2010, December 28, 2008, and December 30, 2007.
Advertising and other promotional costs, which consist primarily of online advertising, and to a lesser extent, royalty and public relations expenditures, are expensed as incurred, and were $27.5 million, $23.2 million, and $20.7 million for the years ended January 3, 2010, December 28, 2008, and December 30, 2007.
Technology and Content
Technology and content expenses consist primarily of payroll and related expenses for personnel engaged in developing, maintaining, and making routine upgrades and enhancements to our websites. Technology and content expenses also include internet access and hosting charges, depreciation on hardware and IT structures, utilities, and website content and design expenses.
Technology and content costs are expensed as incurred, except for certain costs relating to the development of internal-use software and website development, including upgrades and enhancements to our websites, which are capitalized and depreciated over their estimated useful life.
General and Administrative
General and administrative expenses consist of payroll and related expenses for employees involved in general corporate functions, including accounting, finance, tax, legal, and human resources, among others; corporate facility expenses, professional service expenses, and other general corporate expenses.
Interest Income and Expense
Interest income consists of earnings on our cash, cash equivalents, and marketable securities, and interest expense consists primarily of interest associated with capital leases and debt obligations. Interest income for the years ended January 3, 2010, December 28, 2008, and December 30, 2007, totaled $0.3 million, $1.1 million, and $2.1 million, respectively. Interest expense was $0.2 million, $0.5 million, and $0.4 million for the years ended January 3, 2010, December 28, 2008, and December 30, 2007, respectively.
Accumulated Other Comprehensive Income/Loss
Accumulated other comprehensive income/loss consists of the accumulated net unrealized gains and losses on available-for-sale securities (see note 4) and cumulative translation adjustments from the translation of assets and liabilities of our Canadian subsidiary into U.S. dollars. Our currency translation adjustment included in accumulated other comprehensive income/loss as of January 3, 2010, December 28, 2008, and December 30, 2007 was an unrealized loss of $133,000, $76,000 and $7,000, respectively.
Income Taxes
We account for income taxes under the liability method. Under the liability method, deferred tax assets and liabilities are determined based on differences between the financial reporting and tax basis of assets and liabilities and are measured using the enacted tax rates and laws that are expected to be in effect when the differences are expected to be recovered. Deferred tax assets are evaluated for future realization and reduced by a valuation allowance to the extent we believe a portion will not be realized. We consider many factors when assessing the likelihood of future realization of our deferred tax assets, including our recent cumulative earnings
F-12
Table of Contents
DRUGSTORE.COM, INC.
NOTES TO CONSOLIDATED FINANCIAL STATEMENTS (Continued)
experience and expectations of future taxable income and capital gains by taxing jurisdiction, the carry-forward periods available to us for tax reporting purposes, and other relevant factors. We allocate our valuation allowance to current and long-term deferred tax assets on a pro-rata basis.
We utilize a two-step approach to recognizing and measuring uncertain tax positions. The first step is to evaluate the tax position for recognition by determining if the weight of available evidence indicates it is more likely than not that the position will be sustained on audit, including resolution of related appeals or litigation processes, if any. The second step is to measure the tax benefit as the largest amount which is more than 50% likely of being realized upon ultimate settlement. We consider many factors when evaluating and estimating our tax positions and tax benefits, which may require periodic adjustments and which may not accurately forecast actual outcomes. We did not have any unrecognized tax benefits. Our policy is to recognize interest and penalties related to the underpayment of income taxes as a component of income tax expense. To date, we have not incurred charges for interest or penalties in relation to the underpayment of income taxes. The tax years 1998 through the present remain open to examination by the major taxing jurisdictions to which we are subject.
Stock-Based Compensation
Compensation cost for all stock-based awards is measured at fair value on date of grant and recognized over the service period for awards expected to vest. The fair value of stock options and stock appreciation rights is based on the estimated grant date fair value method using the Black-Scholes valuation model. The fair value of restricted stock is determined based on the number of shares granted and the quoted price of our common stock. Such value is recognized as expense over the service period, net of estimated forfeitures, using the straight-line method. The estimation of stock awards that will ultimately vest requires judgment, and to the extent actual results or updated estimates differ from our current estimates, such amounts will be recorded as a cumulative adjustment in the period estimates are revised. We consider many factors when estimating expected forfeitures, including types of awards, employee class, and historical experience. Actual results and future estimates may differ substantially from our current estimates.
Net Loss per Share
We compute net loss per share using the two-class method. We compute basic net loss per share by dividing net loss by the weighted-average number of shares outstanding during the applicable period, including outstanding participating securities. Participating securities include restricted stock awards as holders of these securities are entitled to receive non-forfeitable dividends prior to vesting at the same rate as holders of our common stock. Because we had a net loss for the year ended January 3, 2010, none of the loss was allocated to the participating securities. Prior to 2009, we did not have any participating securities. We compute diluted earnings per share using the weighted-average number of shares determined for the basic net loss per share computation plus the dilutive effect of common stock equivalents using the treasury stock method.
F-13
Table of Contents
DRUGSTORE.COM, INC.
NOTES TO CONSOLIDATED FINANCIAL STATEMENTS (Continued)
We excluded the following shares from the calculation of diluted net loss per share because their inclusion would have been anti-dilutive:
| For the year ended | ||||||
| January 3, 2010 |
December 28, 2008 |
December 30, 2007 | ||||
| Stock options and stock appreciation rights (1) |
16,635,725 | 16,706,547 | 16,742,358 | |||
| Warrants |
400,000 | 400,000 | 865,000 | |||
| Non-released restricted stock (2) |
2,124,738 | — | — | |||
| 19,160,463 | 17,106,547 | 17,607,358 | ||||
| (1) | Fiscal year 2009 excludes approximately 3.4 million shares subject to stock options and stock appreciation rights that are subject to stockholder approval. |
| (2) | Fiscal year 2009 excludes approximately 700,000 shares of restricted stock that are subject to stockholder approval. |
Recently Issued Accounting Standards
From time to time, new accounting pronouncements are issued by the Financial Accounting Standards Board (FASB) or other standard setting bodies that are adopted by us as of the specified effective date. Unless otherwise discussed, our management believes that the impact of recently issued standards that are not yet effective will not have a material impact on our consolidated financial statements upon adoption.
In October 2009, the FASB issued Accounting Standards Update (ASU), 2009-13, Revenue Recognition: Multiple Deliverable Revenue Arrangements – A Consensus of the FASB Emerging Issues Task Force. This update provides application guidance on whether multiple deliverables exist, how the deliverables should be separated and how the consideration should be allocated to one or more units of accounting. This update establishes a selling price hierarchy for determining the selling price of a deliverable. The selling price used for each deliverable will be based on vendor-specific objective evidence, if available, third-party evidence if vendor-specific objective evidence is not available, or estimated selling price if neither vendor-specific or third-party evidence is available. This guidance will be effective prospectively for revenue arrangements entered into or materially modified in fiscal years beginning on or after June 15, 2010; however, earlier application is permitted. We do not anticipate that this update will have a material impact on our consolidated financial statements.
In January 2010, the FASB issued ASU 2010-6, Improving Disclosures About Fair Value Measurements, which requires reporting entities to make new disclosures about recurring or nonrecurring fair-value measurements including significant transfers into and out of Level 1 and Level 2 fair-value measurements and information on purchases, sales, issuances, and settlements on a gross basis in the reconciliation of Level 3 fair- value measurements. ASU 2010-6 is effective for annual reporting periods beginning after December 15, 2009, except for Level 3 reconciliation disclosures which are effective for annual periods beginning after December 15, 2010. We do not anticipate that this update will have a material impact on our consolidated financial statements.
Recently Adopted New Accounting Standards
In June 2008, the FASB issued new guidance that clarifies the determination of whether an instrument (or an embedded feature) is indexed to an entity’s own stock, which would qualify as a scope exception under guidance related to certain contracts involving an entity’s own equity. We adopted the provisions of this guidance on the first day of our fiscal year 2009 and upon adoption, we recorded a cumulative change in accounting principle, which resulted in a reduction to common stock of $407,000 and a reduction in our
F-14
Table of Contents
DRUGSTORE.COM, INC.
NOTES TO CONSOLIDATED FINANCIAL STATEMENTS (Continued)
accumulated deficit of $285,000, as well as, we reclassified $285,000 to a long-term liability. Additionally, we adjust the fair value of the warrants subject to this guidance to fair market value at the end of each reporting period. For the year ended January 3, 2010, we recorded additional stock-based compensation of $345,000 related to the increase in the fair value of these warrants.
In June 2008, the FASB issued new guidance which states that unvested share-based payment awards that contain nonforfeitable rights to dividends or dividend equivalents (whether paid or unpaid) are participating securities and shall be included in the computation of basic earnings per share (EPS) pursuant to the two-class method. All prior-period EPS data presented shall be adjusted retrospectively (including interim financial statements, summaries of earnings, and selected financial data) to conform to the provisions of this guidance. We adopted the provisions of this guidance on the first day of our fiscal year 2009, which affects our basic EPS calculations beginning in the first quarter of 2009, but does not affect prior period financial statements, as no restricted stock awards were outstanding prior to our fiscal year 2009.
In December 2007, the FASB issued SFAS No. 141 (R), Business Combinations, codified as Accounting Standards Codification (ASC) 805, Business Combinations and SFAS No. 160, Noncontrolling Interests in Consolidated Financial Statements, codified as ASC 810, Consolidations. SFAS No. 141 (R) requires an acquirer to measure the identifiable assets acquired, the liabilities assumed and any noncontrolling interest in the acquiree at their fair values on the acquisition date, with goodwill being the excess value over the net identifiable assets acquired. SFAS No. 160 clarifies that a noncontrolling interest in a subsidiary should be reported as equity in the consolidated financial statements. The calculation of earnings per share will continue to be based on income amounts attributable to the parent. SFAS No. 141 (R) and SFAS No. 160 are effective for financial statements issued for fiscal years beginning after December 15, 2008. The adoption of SFAS No. 141 (R) and SFAS No. 160 did not have a material impact on our consolidated financial statements upon adoption but will have an impact on future business combinations consummated beginning in 2009.
2. Discontinued Operations
On September 3, 2008, we entered into an amended and restated main agreement with Rite Aid whereby we transferred to Rite Aid the rights to our local pick-up pharmacy business (LPU), which includes prescription refills sold online through the drugstore.com web store or the Rite Aid online store and picked up by customers at Rite Aid stores, in exchange for $9.9 million, paid in ten monthly installments beginning in September 2008. We recorded the purchase price as a deferred gain that we recognized over the ten-month contractual payment period ending in June 2009. Additionally, Rite Aid pays drugstore.com ongoing marketing service fees for the continued marketing of Rite Aid’s LPU offering on the drugstore.com site during the term of the agreement, which continues for two years unless extended for another year by either party. We consider the marketing service fees to be indirect cash inflows of our discontinued LPU segment, as the fees earned are not a significant source of ongoing future revenue.
The gain from the sale of the discontinued operations was $8.3 million of which $2.3 million was recognized in fiscal 2008 and $5.9 million was recognized in fiscal 2009. We have classified the results of operations of our LPU segment as discontinued operations in the accompanying consolidated statements of operations for all periods presented.
F-15
Table of Contents
DRUGSTORE.COM, INC.
NOTES TO CONSOLIDATED FINANCIAL STATEMENTS (Continued)
The following table summarizes the results of operations of our LPU segment that we have classified as discontinued operations.
| For the year ended | |||||||||
| January 3, 2010 |
December 28, 2008 |
December 30, 2007 | |||||||
| (in thousands) | |||||||||
| Net sales |
$ | — | $ | 80,943 | $ | 106,392 | |||
| Cost of sales |
— | 70,383 | 93,611 | ||||||
| Fulfillment and order processing |
— | 3,285 | 4,383 | ||||||
| Marketing and sales |
— | 1,527 | 2,290 | ||||||
| Income from discontinued operations |
— | 5,748 | 6,108 | ||||||
| Net gain from sale of discontinued operations |
5,946 | 2,332 | — | ||||||
| Gain from discontinued operations (taxes $0, $0, and $0) |
$ | 5,946 | $ | 8,080 | $ | 6,108 | |||
3. Strategic Agreements
Agreements with Medco
In November 2008, we entered into a five year web store hosting and fulfillment agreement with Medco whereby drugstore.com provides technical development and operation services, consumer health products and OTC merchandising, fulfillment capabilities and customer care for the non-prescription-drug offerings in the Medco branded online store. The agreement allows for termination at the end of 2011 by either party and will automatically renew for additional one-year terms thereafter unless written notice of intent to terminate is delivered by either party at least 90 days prior to expiration of the then current term. In June 2009, we launched the Medco branded online store. Under the terms of this agreement, we retain the gross revenues collected from the Medco branded online store, and Medco earns a percentage of the contribution margin generated by the Medco branded online store. We record the amount paid to Medco as a marketing and sales expense in our consolidated statements of operations.
Agreements with Rite Aid
In June 1999, we entered into a ten-year strategic relationship with Rite Aid. On September 3, 2008, we amended and restated both the main agreement (see note 2) and the pharmacy supply and services agreement dated June 17, 1999 between Rite Aid and drugstore.com. Through our agreements with Rite Aid, we have access to Rite Aid customers through the RiteAid.com website and the Rite Aid online store, which is powered by the drugstore.com website.
Under the amended and restated pharmacy and private label supply and services agreement, Rite Aid has granted drugstore.com, during the two-year term of the agreement, a nonexclusive, fully paid license to the Rite Aid information and pharmacy systems that are integrated with our systems, subject to third-party rights to such technology. Through this technology integration, Rite Aid will continue to adjudicate and collect insurance reimbursement payments for prescription medications in our mail-order pharmacy segment on behalf of drugstore.com. In addition, we will continue to have the right to purchase pharmaceutical inventory and Rite Aid private label over-the counter products through Rite Aid. As a result of this continued relationship, Rite Aid remains one of our largest suppliers, and we will maintain our access to many of Rite Aid’s relationships with insurance companies and PBMs, allowing us to continue to facilitate insurance coverage to those customers.
F-16
Table of Contents
DRUGSTORE.COM, INC.
NOTES TO CONSOLIDATED FINANCIAL STATEMENTS (Continued)
Also on September 3, 2008, we entered into a two year web store and fulfillment agreement with Rite Aid whereby drugstore.com provided site design, development, hosting, customer service, and fulfillment for the Rite Aid online store. In December 2008, we launched the Rite Aid online store. Under the terms of this agreement, we retain the gross revenues collected from the Rite Aid online store, and Rite Aid earns a percentage of the contribution margin generated by the Rite Aid online store. We record the amount paid to Rite Aid as a marketing and sales expense in our consolidated statements of operations.
Agreement with GNC
We have an agreement with GNC under which we are an online provider of GNC-branded products. In June 2009, our 10-year agreement, which gave us the nonexclusive right to sell these products, was automatically extended under the terms of the agreement until such time notice is given by either party to terminate. As part of this relationship, we created the GNC Store within the drugstore.com website, which is dedicated to selling GNC products on a consignment basis. We retain a percentage of the gross revenues that we collect from sales of GNC products and recognize only the net amount we retain as revenues. We have also agreed with GNC to co-promote each other’s products and services in both traditional and online marketing efforts, including GNC’s placement of a link to our website on the GNC website.
A portion of the non-cash consideration relating to the agreements with GNC was allocated to vendor agreements and classified within other intangible assets. The assets were amortized on a straight-line basis over their contractual life of 10 years, ending in June 2009.
Agreements with Amazon.com
In June 2009, we entered into a three-year merchant agreement with Amazon.com, a related party, to sell OTC products through the marketplace on the Amazon.com website. In September 2007, we entered into a three-year merchant agreement with Amazon.com to sell prestige beauty products through the Beauty.com marketplace on the Amazon.com website. We ship the Amazon.com orders from our distribution facility in exchange for an agreed-upon product price less a referral fee. Product revenue generated by the merchant agreements totaled $3.6 million in 2009, $1.3 million in 2008 and $124,000 in 2007, and referral fees paid totaled $602,000 in 2009, $221,000 in 2008 and $20,000 in 2007. As of January 3, 2010, December 28, 2008, and December 30, 2007, amounts due from Amazon.com totaled $284,000, $49,000 and $21,000, respectively.
Agreement with Weil Lifestyle
In November 2008, we entered into an amended and restated fulfillment agreement with Weil whereby we provide fulfillment and customer service operations in exchange for an agreed-upon fulfillment fee through December 31, 2011. This agreement replaces our previous three-year fulfillment agreement with Weil entered into on December 31, 2005.
F-17
Table of Contents
DRUGSTORE.COM, INC.
NOTES TO CONSOLIDATED FINANCIAL STATEMENTS (Continued)
4. Cash, Cash Equivalents and Marketable Securities
Cash, cash equivalents, and marketable securities consist of the following:
| January 3, 2010 | ||||||||||||
| Amortized Cost |
Gross Unrealized Holding Gains |
Gross Unrealized Holding Losses (1) |
Fair Value | |||||||||
| (in thousands) | ||||||||||||
| Cash and money market funds |
$ | 19,375 | $ | — | $ | — | $ | 19,375 | ||||
| Commercial paper |
2,800 | — | — | 2,800 | ||||||||
| Cash and cash equivalents |
22,175 | — | — | 22,175 | ||||||||
| U.S. government agency obligations |
9,365 | 35 | — | 9,400 | ||||||||
| Corporate notes and bonds (2) |
1,680 | — | — | 1,680 | ||||||||
| Commercial paper |
3,598 | — | — | 3,598 | ||||||||
| Marketable securities (3) |
14,643 | 35 | — | 14,678 | ||||||||
| Total cash, cash equivalents and marketable securities |
$ | 36,818 | $ | 35 | $ | — | $ | 36,853 | ||||
| December 28, 2008 | ||||||||||||
| Amortized Cost |
Gross Unrealized Holding Gains |
Gross Unrealized Holding Losses (1) |
Fair Value | |||||||||
| (in thousands) | ||||||||||||
| Cash and money market funds |
$ | 21,601 | $ | — | $ | — | $ | 21,601 | ||||
| Commercial paper |
3,595 | 1 | — | 3,596 | ||||||||
| Cash and cash equivalents |
25,196 | 1 | — | 25,197 | ||||||||
| U.S. government agency obligations |
9,462 | 118 | — | 9,580 | ||||||||
| Corporate notes and bonds (2) |
2,505 | 12 | — | 2,517 | ||||||||
| Commercial paper |
898 | 2 | — | 900 | ||||||||
| Marketable securities |
12,865 | 132 | — | 12,997 | ||||||||
| Total cash, cash equivalents and marketable securities |
$ | 38,061 | $ | 133 | $ | — | $ | 38,194 | ||||
| (1) | As of January 3, 2010 and December 28, 2008, there were no investments where the cost and fair value had loss positions. We evaluated the nature of our investments, credit worthiness of the issuer, and the duration of any impairments to determine if an other-than-temporary decline in fair value had occurred. |
| (2) | Corporate notes and bonds include investments in corporate institutions. No single issuer represents a significant portion of the total corporate notes and bonds portfolio. |
| (3) | We consider marketable securities to be available-for-sale, and as of January 3, 2010 they have contractual maturity dates that are within one year. |
F-18
Table of Contents
DRUGSTORE.COM, INC.
NOTES TO CONSOLIDATED FINANCIAL STATEMENTS (Continued)
The following table summarizes, by major security type, our assets that are measured at fair value on a recurring basis and are categorized using the fair value hierarchy (in thousands):
| January 3, 2010 | |||||||||||||||
| Cash | Level 1 Estimated Fair Value |
Level 2 Estimated Fair Value |
Level 3 Estimated Fair Value |
Total Estimated Fair Value | |||||||||||
| (in thousands) | |||||||||||||||
| Cash |
$ | 12,316 | $ | — | $ | — | $ | — | $ | 12,316 | |||||
| Money market funds (1) |
— | 7,059 | — | — | 7,059 | ||||||||||
| Commercial paper (2) |
— | — | 6,398 | — | 6,398 | ||||||||||
| U.S. government agency obligations (3) |
— | — | 9,400 | — | 9,400 | ||||||||||
| Corporate notes and bonds (3) |
— | — | 1,680 | — | 1,680 | ||||||||||
| $ | 12,316 | $ | 7,059 | $ | 17,478 | $ | — | $ | 36,853 | ||||||
| December 28, 2008 | |||||||||||||||
| Cash | Level 1 Estimated Fair Value |
Level 2 Estimated Fair Value |
Level 3 Estimated Fair Value |
Total Estimated Fair Value | |||||||||||
| (in thousands) | |||||||||||||||
| Cash |
$ | 18,807 | $ | — | $ | — | $ | — | $ | 18,807 | |||||
| Money market funds (1) |
— | 2,794 | — | — | 2,794 | ||||||||||
| Commercial paper (2) |
— | — | 4,496 | — | 4,496 | ||||||||||
| U.S. government agency obligations (3) |
— | — | 9,580 | — | 9,580 | ||||||||||
| Corporate notes and bonds (3) |
— | — | 2,517 | — | 2,517 | ||||||||||
| $ | 18,807 | $ | 2,794 | $ | 16,593 | $ | — | $ | 38,194 | ||||||
| (1) | Included in cash and cash equivalents in the consolidated balance sheets. We determined fair values based on quoted market prices. |
| (2) | Included in cash and cash equivalents in the consolidated balance sheets if the investment has a maturity of three months or less from the date of purchase or included in marketable securities if the investment has a maturity in excess of three months from the date of purchase. We determined fair values based on observable market prices in less active markets or quoted market prices for similar instruments. |
| (3) | Included in marketable securities in the consolidated balance sheets. We determined fair value based on observable market prices in less active markets or quoted market prices for similar instruments. |
F-19
Table of Contents
DRUGSTORE.COM, INC.
NOTES TO CONSOLIDATED FINANCIAL STATEMENTS (Continued)
5. Fixed Assets
Fixed assets consist of the following:
| January 3, 2010 |
December 28, 2008 |
|||||||
| (in thousands) | ||||||||
| Computers and equipment |
$ | 25,711 | $ | 26,421 | ||||
| Purchased and internally developed software |
45,000 | 37,576 | ||||||
| Furniture and fixtures |
2,653 | 2,638 | ||||||
| Leased assets |
6,121 | 6,022 | ||||||
| Leasehold improvements |
10,838 | 10,967 | ||||||
| 90,323 | 83,624 | |||||||
| Less accumulated depreciation and amortization |
(69,725 | ) | (58,881 | ) | ||||
| 20,598 | 24,743 | |||||||
| Construction in progress |
3,567 | 3,563 | ||||||
| Total |
$ | 24,165 | $ | 28,306 | ||||
Depreciation expense on fixed assets was $12.7 million in 2009, $10.9 million in 2008, and $7.5 million in 2007. Accumulated amortization on leased assets was $5.8 million and $5.0 million as of January 3, 2010 and December 28, 2008. Amortization on leased assets is included in depreciation expense.
6. Other Intangible Assets and Goodwill
Intangible Assets
The other intangible assets balances as of January 3, 2010 were as follows (in thousands):
| Weighted Average Years Useful Life |
Gross Carrying Amount (1) |
Acquisitions | Accumulated Amortization (1) |
Net Balance | |||||||||||
| Vision Direct trade name |
indefinite | $ | 2,700 | $ | — | $ | — | $ | 2,700 | ||||||
| Trademarks |
indefinite | 252 | 40 | — | 292 | ||||||||||
| Technology license, domain names and other |
8.4 | 709 | 105 | (408 | ) | 406 | |||||||||
| Total other intangible assets |
8.4 | $ | 3,661 | $ | 145 | $ | (408 | ) | $ | 3,398 | |||||
| (1) | During 2009, we wrote off $12.3 million of fully amortized intangible assets related to our GNC vendor agreement with a net book value of $0. |
F-20
Table of Contents
DRUGSTORE.COM, INC.
NOTES TO CONSOLIDATED FINANCIAL STATEMENTS (Continued)
The other intangible assets balances as of December 28, 2008 were as follows (in thousands):
| Weighted Average Years Useful Life |
Gross Carrying Amount (1) |
Acquisitions | Accumulated Amortization (1) |
Net Balance | |||||||||||
| Vision Direct trade name |
indefinite | $ | 2,700 | $ | — | $ | — | $ | 2,700 | ||||||
| Truescents trademark |
indefinite | 252 | — | — | 252 | ||||||||||
| GNC vendor agreement |
10 | 12,265 | — | (11,893 | ) | 372 | |||||||||
| Technology license, domain names and other |
9 | 709 | — | (302 | ) | 407 | |||||||||
| Total other intangible assets |
9.9 | $ | 15,926 | $ | — | $ | (12,195 | ) | $ | 3,731 | |||||
| (1) | During 2008, we wrote-off $8.3 million of fully amortized intangible assets related to our vision business with a net book value of $0. |
The following table summarizes our estimated amortization expense for each of the next five fiscal years (in thousands):
| Fiscal year |
|||
| 2010 |
$ | 118 | |
| 2011 |
114 | ||
| 2012 |
86 | ||
| 2013 |
67 | ||
| 2014 |
21 | ||
| Total |
$ | 406 | |
Goodwill
Goodwill in our OTC segment includes $2.7 million related to the acquisition of CNS in 2003 and $5.7 million related to our acquisition of Beauty.com in 2000. Goodwill in our vision segment includes $23.8 million related to the acquisition of Vision Direct in 2003. There were no changes to goodwill in fiscal years 2009 or 2008.
7. Long-Term Obligations
Line of Credit and Term Loans
In March 2009, we entered into a loan and security agreement with our existing bank. This agreement includes a revolving two-year line of credit allowing for borrowings up to $25.0 million, which accrue interest at the higher of prime rate plus 0.50% (3.75% at January 3, 2010), or 4.50% for general corporate purposes, including short-term working capital needs, and to finance certain potential acquisitions, should we elect to pursue any in the future. The agreement allows for the conversion of up to $15.0 million of the outstanding balance into a term loan, payable in 36 monthly installments of principal and interest at a rate equal to the greater of (a) the prime rate plus 0.50% or (b) 4.50%. Advances available under the revolving line of credit are limited, based on eligible inventory, accounts receivable, and cash and investment balances, and balances outstanding under our existing term loan. In the third quarter of 2009, we paid off the existing term loan and borrowed approximately $3.0 million on the revolving line of credit under this facility, which was outstanding as of January 3, 2010. In addition, availability under the line of credit was reduced by a $541,000 letter of credit we
F-21
Table of Contents
DRUGSTORE.COM, INC.
NOTES TO CONSOLIDATED FINANCIAL STATEMENTS (Continued)
provided to our landlord. Accordingly, the available borrowings under the line of credit were approximately $21.5 million at January 3, 2010. In February 2010, we financed a portion of the cash payable at the closing of the acquisition of Salu and therefore borrowed $10.0 million under our revolving two-year line of credit, effectively reducing the available borrowings under our line of credit. The agreement contains certain covenants that are customary in transactions of this nature, including a prohibition on other debt and liens, requirements regarding the payment of taxes, and certain restrictions on mergers and acquisitions, investments, and transactions with our affiliates, as well as certain financial covenants related to our cash and cash equivalents and our free cash flow, which we were in compliance with as of January 3, 2010. The agreement identifies certain events of default that are customary for transactions of this nature and subject to materiality provisions and grace periods where appropriate, including failure to pay any principal or interest under this facility or other instruments when due, the occurrence of a material adverse change, violations of any covenants, a material cross-default to our other debt, or a change of control. As of January 3, 2010, none of these events had occurred.
The balance outstanding on our term loan under our previous agreement with our existing bank, which was replaced by the agreement above, totaled $5.5 million as of December 28, 2008, and there was no balance outstanding under the line of credit as of December 28, 2008.
Capital Leases
In July 2006, we entered into an agreement to finance equipment in our distribution center totaling $1.9 million under a non-cancelable capital lease. The lease was payable in 36 monthly installments of approximately $60,000 beginning January 2007 and ending December 2009, and accrued interest at a rate of 8%. As of January 3, 2010 and December 28, 2008, the amount due under the agreement was $0 and $690,000, respectively.
We also lease computer equipment under non-cancelable capital leases. Capital lease obligations bear interest at approximately 8% and mature 24 months from the date of funding. We secured additional funds of $226,000 during 2009 and $524,000 during 2008, through capital lease financing agreements, through which we financed certain computer equipment and software for periods of two years. We are in compliance with all covenants required by these agreements. These amounts are included in the table below within the category of capital leases.
Maturities of long-term obligations at January 3, 2010 are as follows (in thousands):
| Fiscal Year |
Line of Credit |
Capital Leases |
Total | ||||||||
| 2010 |
$ | — | $ | 205 | $ | 205 | |||||
| 2011 |
2,986 | 26 | 3,012 | ||||||||
| Total minimum payments |
2,986 | 231 | 3,217 | ||||||||
| Less amounts representing interest |
— | (11 | ) | (11 | ) | ||||||
| Present value of minimum payments |
2,986 | 220 | 3,206 | ||||||||
| Less current portion of long-term obligations |
— | (195 | ) | (195 | ) | ||||||
| Non-current portion of long-term obligations |
$ | 2,986 | $ | 25 | $ | 3,011 | |||||
F-22
Table of Contents
DRUGSTORE.COM, INC.
NOTES TO CONSOLIDATED FINANCIAL STATEMENTS (Continued)
8. Commitments and Contingencies
Operating Leases
We lease office, distribution center, and call center facilities under non-cancelable operating leases, which include fixed rental payments ending between 2010 and 2020. We have the option to extend some of these leases for one or two additional terms of five years. In addition, we lease various office and IT equipment under operating leases. Total rent expense under operating leases was $3.6 million in 2009, $3.7 million in 2008, and $3.4 million in 2007.
In December 2009, we entered into an agreement to extend our operating lease for our primary distribution facility located in Swedesboro, New Jersey, where we lease approximately 270,000 square feet. Under the terms of the amended agreement, the lease will expire in December 2020, with options to renew for two additional five-year periods, which if exercised, would extend the lease expiration to December 2030.
In August 2004, we entered into an operating lease for approximately 53,000 square feet for our corporate headquarters. The lease expires on July 31, 2013, with two separate five-year renewal options that, if exercised, would extend the lease expiration to July 2023. In connection with the lease, we received landlord-provided incentives of approximately $2.3 million in the form of tenant improvements, which have been recorded as additions to fixed assets and other current and long-term liabilities and are being amortized over the term of the lease. As of January 3, 2010 and December 28, 2008, our long-term deferred rent liability totaled $0.7 million and $1.0 million, respectively, and our current deferred rent liability totaled $0.3 million.
In connection with the lease arrangements for our corporate headquarters, we are required to provide a standby letter of credit to our landlord as a security deposit, which will be renewed annually until the end of the lease term. The standby letter of credit is funded under our revolving line of credit and is not required to be secured with cash.
Future minimum commitments at January 3, 2010 are as follows (in thousands):
| Fiscal Year |
Operating Leases | ||
| 2010 |
$ | 2,895 | |
| 2011 |
2,482 | ||
| 2012 |
2,419 | ||
| 2013 |
1,836 | ||
| 2014 |
1,068 | ||
| Thereafter |
6,976 | ||
| Total minimum payments |
$ | 17,676 | |
Legal Proceedings
Class Action Laddering Litigation. A consolidated amended complaint, which is now the operative complaint, was filed on April 19, 2002 in the U.S. District Court for the Southern District of New York. It names drugstore.com as a defendant, along with the underwriters and certain of our present and former officers and directors (the Individual Defendants), in connection with our July 27, 1999 initial public offering and March 15, 2000 secondary offering (together, the Offerings). The suit purports to be a class action filed on behalf of purchasers of our common stock during the period July 28, 1999 to December 6, 2000.
F-23
Table of Contents
DRUGSTORE.COM, INC.
NOTES TO CONSOLIDATED FINANCIAL STATEMENTS (Continued)
In general, the complaint alleges that the prospectuses through which we conducted the Offerings were materially false and misleading because they failed to disclose, among other things, that (i) the underwriters of the Offerings allegedly had solicited and received excessive and undisclosed commissions from certain investors in exchange for which the underwriters allocated to those investors material portions of the restricted number of shares issued in connection with the Offerings and (ii) the underwriters allegedly entered into agreements with customers whereby the underwriters agreed to allocate drugstore.com shares to customers in the Offerings in exchange for which customers agreed to purchase additional drugstore.com shares in the after-market at predetermined prices. The complaint asserts violations of various sections of the Securities Act of 1933, as amended, and the Securities Exchange Act of 1934, as amended. The action seeks damages in an unspecified amount and other relief. The action is being coordinated with approximately 300 other nearly identical actions filed against other companies or their present and former officers and directors.
On October 9, 2002, the District Court dismissed the Individual Defendants from the case without prejudice. On December 5, 2006, the U.S. Court of Appeals for the Second Circuit vacated a decision by the District Court granting class certification in six of the coordinated cases, which are intended to serve as test, or “focus,” cases. The plaintiffs selected these six cases, which do not include us. On April 6, 2007, the Second Circuit denied a petition for rehearing filed by plaintiffs, but noted that plaintiffs could ask the District Court to certify more narrow classes than those that were rejected.
The parties in the approximately 300 coordinated cases, including the parties in drugstore.com’s case, reached a settlement. The insurers for the issuer defendants in the coordinated cases will make the settlement payment on behalf of the issuers, including drugstore.com. A group of three objectors has filed a petition to the Second Circuit seeking permission to appeal the District Court’s final approval order on the basis that the settlement class is broader than the class previously rejected by the Second Circuit in its December 5, 2006 order vacating the District Court’s order certifying classes in the focus cases. Judgment was entered on December 3, 2009. Plaintiffs have filed an opposition to the petition. Six notices of appeal to the Second Circuit have been filed by different groups of objectors, including one notice filed by the objectors who filed the petition to appeal. The time to file additional notices of appeal has run.
Due to the inherent uncertainties of litigation, we cannot accurately predict the ultimate outcome of this matter. We are unable to estimate the potential damages that might be awarded if the appeal is successful and we were found liable, there arose a material limitation with respect to our insurance coverage, or the amount awarded were to exceed our insurance coverage. Because our liability, if any, cannot be reasonably estimated, no amounts have been accrued for this matter. An adverse outcome in this matter could have a material adverse effect on our financial position and results of operations.
1-800 Contacts Litigation. On February 26, 2008, 1-800 Contacts, Inc. (1-800 Contacts) filed an action in the U.S. District Court for the District of Utah, Central Division against us and our subsidiary Vision Direct alleging direct and contributory trademark infringement and dilution under federal and state law, unfair competition, intentional interference with economic relations, and unjust enrichment. One day later, on February 27, 2008, 1-800 Contacts filed a separate action in the U.S. District Court for the Southern District of New York against Vision Direct alleging breach of a 2004 settlement agreement between Vision Direct and 1-800 Contacts. In both actions, 1-800 Contacts was seeking monetary damages as well as injunctive relief. We agreed to mediate the dispute with 1-800 Contacts and on May 8, 2009, we reached an agreement with 1-800 Contacts that provides, without admission of wrongdoing or liability, for a one-time payment of $475,000 from Vision Direct, Inc. to 1-800 Contacts and mutual releases of all claims that have been or could have been brought. The settlement was included in the consolidated statements of operations in the first quarter of 2009.
F-24
Table of Contents
DRUGSTORE.COM, INC.
NOTES TO CONSOLIDATED FINANCIAL STATEMENTS (Continued)
State Sales Tax Claims. In 2002, we received an arbitrary assessment notice from the state of New Jersey for past sales tax due from fiscal years 2000 and 2001, based on its best estimate of sales revenue numbers during those periods. In March 2003, we filed an appeal with the Tax Court of New Jersey, based on the fact that the state of New Jersey was pursuing its claim specifically against one of our consolidated subsidiaries that was not a retailing entity in that state. On February 19, 2008, we were informed of the decision by the Tax Court of New Jersey against us. On April 23, 2009, we reached a resolution with the State of New Jersey, regarding sales and use taxes owed by us for the years 2000 to 2008. We paid an aggregate of approximately $1.7 million based on two assessments for sales and use tax, interest, and penalties for 2000 through February 22, 2008, in full satisfaction of our obligations for use taxes for those years. We recognized an expense of $2.5 million in 2007 and a benefit of $1.2 million in 2009 in the consolidated statements of operations related to the assessments.
Other. From time to time, we are subject to other legal proceedings and claims in the ordinary course of business. We are not currently aware of any such legal proceedings or claims that we believe will have, individually or in the aggregate, a material adverse effect on our business prospects, financial condition, or operating results, other than those listed above.
9. Income Taxes
No federal tax benefit or expense was recorded in 2009, 2008, or 2007 due to our ongoing operating losses. In addition, no tax benefit or expense related to discontinued operations has been recorded due to the continuing and historical tax losses related to the LPU business. Our deferred tax assets consist primarily of net operating loss carry-forwards and amortization and impairment of intangible assets. We have provided a valuation allowance for our deferred tax assets to an amount expected to be realized. The decrease in the valuation allowance on the deferred tax assets was $6.6 million in 2009, and the increase in the valuation allowance was $4.0 million in 2008.
At January 3, 2010, we had approximately $579.6 million of federal net operating loss carry-forwards that will expire beginning in 2018. Internal Revenue Code Section 382 imposes limitations on our ability to utilize net operating losses if we experience an ownership change. An ownership change may result from transactions increasing the ownership of certain stockholders in the stock of a corporation by more than 50 percentage points over a three-year period. The value of the stock at the time of an ownership change is multiplied by the applicable long-term tax exempt interest rate to calculate the annual limitation. Any unused annual limitation may be carried over to later years. As of January 3, 2010, there were no significant limitations on the use of our existing net operating loss under Internal Revenue Code Section 382.
At January 3, 2010, we had approximately $62.8 million of state net operating loss carry-forwards that expire beginning in 2010.
Approximately $10.7 million of our net loss carry-forwards are related to tax-deductible stock-based compensation in excess of amounts recognized for financial reporting purposes. To the extent that net operating loss carry-forwards, if realized, relate to stock-based compensation, the resulting tax benefits will be recorded to stockholders’ equity, rather than to results of operations.
F-25
Table of Contents
DRUGSTORE.COM, INC.
NOTES TO CONSOLIDATED FINANCIAL STATEMENTS (Continued)
Deferred income tax balances reflect the effects of temporary differences between the carrying amount of assets and liabilities and their tax bases and are stated at the enacted tax rates expected to be in effect when taxes are actually paid or recovered. Significant components of our deferred tax assets and liabilities are as follows:
| January 3, 2010 |
December 28, 2008 |
|||||||
| (in thousands) | ||||||||
| Deferred tax assets: |
||||||||
| Net operating loss carry-forward (federal) |
$ | 201,837 | $ | 198,529 | ||||
| Net operating loss carry-forward (state) |
3,822 | 10,730 | ||||||
| Depreciation, amortization and impairment of intangible assets |
27,537 | 32,006 | ||||||
| Tax credit carry-forwards |
1,414 | 1,323 | ||||||
| Stock based compensation |
10,451 | 8,799 | ||||||
| Other temporary differences |
2,749 | 3,027 | ||||||
| Total gross deferred tax assets |
247,810 | 254,414 | ||||||
| Less valuation allowance |
(247,810 | ) | (254,414 | ) | ||||
| Net deferred tax assets, net of valuation allowance |
— | — | ||||||
| Deferred tax liabilities: |
||||||||
| Indefinite-lived intangible asset |
(959 | ) | (953 | ) | ||||
| Net deferred tax liability |
$ | (959 | ) | $ | (953 | ) | ||
A reconciliation of income taxes from continuing operations computed at the statutory rate to the income tax amount recorded is as follows:
| January 3, 2010 |
December 28, 2008 |
December 30, 2007 |
||||||||||
| Income tax benefit at statutory rate |
$ | 481 | $ | 2,899 | $ | 4,028 | ||||||
| State taxes, net of federal impact |
242 | 2,093 | 1,427 | |||||||||
| State net operating loss expiration |
(7,569 | ) | (597 | ) | — | |||||||
| Other |
(188 | ) | (190 | ) | 56 | |||||||
| Impact of rate change—State |
430 | (172 | ) | 4,756 | ||||||||
| Impact of rate change—Federal |
— | — | 2,369 | |||||||||
| Decrease (increase) in valuation allowance |
6,604 | (4,033 | ) | (12,636 | ) | |||||||
| Total income tax benefit |
$ | — | $ | — | $ | — | ||||||
F-26
Table of Contents
DRUGSTORE.COM, INC.
NOTES TO CONSOLIDATED FINANCIAL STATEMENTS (Continued)
10. Stockholders’ Equity
Outstanding Warrants
We have the following outstanding warrants as of January 3, 2010, issued in connection with various consulting agreements. The fair value of the warrants was determined using the Black-Scholes option pricing model and recorded in general and administrative expenses in the consolidated statements of operations as follows:
| Shares | Exercise Price |
Expiration Date | Stock-compensation expense (in thousands) | |||||||||||||
| Issue Date |
FY 2009 | FY 2008 | FY 2007 | |||||||||||||
| June 2008 |
50,000 | $ | 2.53 | June 2018 | $ | — | $ | 69 | $ | — | ||||||
| March 2008 |
100,000 | $ | 2.53 | March 2018 | — | 163 | — | |||||||||
| June 2007 (2) |
200,000 | $ | 2.50 | June 2017 | 345 | — | 407 | |||||||||
| July 2007 |
50,000 | $ | 2.53 | July 2017 | — | — | 121 | |||||||||
| 400,000 | $ | 345 | $ | 232 | $ | 528 | ||||||||||
| (1) | In February 2010, we issued a fully vested warrant to purchase 300,000 shares of our common stock at $2.00 per share, expiring in February 2020, in connection with a three-year advisory agreement. The fair value of the warrant, determined using the Black-Scholes option pricing model, was $727,000 and will be recorded in general and administrative expenses in the consolidated statements of operations in the first quarter of 2010. |
| (2) | At the end of each reporting period, we adjust the fair value of the June 2007 warrants as they are considered liability instruments. |
Common Stock Reserved for Future Issuance
The following table represents the number of shares of common stock reserved for future issuance as of January 3, 2010:
| Stock option plans (1) |
16,635,725 | |
| Warrants to purchase common stock (2) |
400,000 | |
| 17,035,725 | ||
| (1) | Excludes approximately 3.4 million shares subject to stock options and stock appreciation rights that are subject to stockholder approval. |
| (2) | We issued an additional warrant to purchase 300,000 shares of common stock at $2.00 per share in February 2010. |
11. Employee Benefit Plans
Defined Contribution Plan
We have adopted a defined contribution retirement plan under Section 401(k) of the Internal Revenue Code, which covers substantially all of our employees (401(k) Plan). Eligible employees may contribute amounts to the 401(k) Plan via payroll withholding, subject to certain limitations. Under the 401(k) Plan, employees may elect to reduce their current compensation by up to the statutorily prescribed annual limit and to have the amount of such reduction contributed to the 401(k) Plan. The 401(k) Plan permits us but does not require us to make additional matching contributions to the 401(k) Plan on behalf of all participants in the 401(k) Plan. Beginning in
F-27
Table of Contents
DRUGSTORE.COM, INC.
NOTES TO CONSOLIDATED FINANCIAL STATEMENTS (Continued)
2008, we began matching 25% of the employee contributions up to $1,000. We made matching contributions under our 401(k) Plan of approximately $200,000 in 2009 and $180,000 in 2008 and no matching contributions in 2007.
Stock-Based Benefit Plans
1998 Stock Plan—Under the terms of our 1998 Stock Plan, as amended (1998 Stock Plan), our board of directors could grant incentive and nonqualified stock options to employees, officers, directors, agents, consultants, and independent contractors of drugstore.com. Options under this plan generally vest over four years, as follows: 20% of the shares vest after six months, and the remaining 80% vest quarterly over the subsequent 42 months. Option grants generally had exercise prices equal to the fair market value of the common stock on the date of grant and expire ten years from the date of grant. The 1998 Stock Plan expired in June 2008 and was replaced with the 2008 Equity Incentive Plan (2008 Equity Plan) and no further awards have been or will be granted under the 1998 Stock Plan. The 1998 Stock Plan, however, will continue to govern awards previously granted under that plan and any outstanding options will continue to vest and will remain outstanding until they are exercised, are forfeited, or expire.
2008 Equity Incentive Plan—Under the terms of the 2008 Equity Plan, which replaced the 1998 Stock Plan, our board of directors may grant stock options, stock appreciation rights, restricted stock, restricted stock units, performance shares and performance units, and other stock or cash awards to employees, directors, and consultants who provide services to drugstore.com. The board of directors has reserved 8,000,000 shares of our common stock for issuance under the 2008 Equity Plan, as well as up to 15,000,000 shares from stock options or similar awards granted under the 1998 Stock Plan that expire or otherwise terminate without having been exercised in full and shares issued pursuant to awards granted under the 1998 Stock Plan that are forfeited or that we repurchase. The shares may be authorized, but unissued, or reacquired common stock.
On March 10, 2010, the Company notified the staff of the Nasdaq Stock Market that it was in material noncompliance with Rule 5635(c) of the Corporate Governance Requirements of the NASDAQ listing requirements with respect to certain equity awards granted under the 2008 Plan. The 2008 Plan requires that any award of restricted stock, among other securities, be counted against the 2008 Plan share reserve as three shares to every one share subject to the award (the “Full Value Award Provision”). Recently, our management became aware that the share limit set forth in the 2008 Plan was exceeded as a result of the inadvertent and incorrect application of the Full Value Award Provision. Because the grant of approximately 700,000 shares of restricted stock and awards of options and stock appreciation rights with respect to approximately 3.4 million shares of common stock exceeded the share reserve limit after proper application of the Full Value Award Provision, the Company may be deemed to have issued securities pursuant to the 2008 Plan without stockholder approval. Accordingly, the Company may be deemed not to have complied with Rule 5635(c) of the Corporate Governance Requirements.
The Company submitted its plan to regain compliance with Rule 5635(c) to NASDAQ on March 10, 2010. Such compliance plan would condition the release and delivery of certain restricted stock awards and unvested options and stock appreciation rights on approval by the Company’s stockholders of an amendment to the 2008 Plan. The Company intends to include that amendment in its 2010 proxy statement as a proposal to be presented at the upcoming annual meeting of stockholders, expected to be held on or before June 10, 2010. In the event that stockholder approval is not obtained, these restricted stock awards and unvested options and stock appreciation rights will be forfeited pursuant to their terms and conditions. The Company provided notice to affected award recipients on March 15, 2010.
On March 16, 2010, Nasdaq informed the Company that by providing the foregoing notice to affected equity award recipients the Company had regained compliance with Rule 5635(c).
F-28
Table of Contents
DRUGSTORE.COM, INC.
NOTES TO CONSOLIDATED FINANCIAL STATEMENTS (Continued)
Under the codification guidance for stock compensation, a grant date cannot occur before all necessary approvals have been obtained, including stockholder approval of the reservation of sufficient additional shares under the plan. Accordingly, the restricted stock awards, stock options, and stock appreciation rights to purchase common stock granted under the 2008 Equity Plan beginning on March 6, 2009 are not considered valid grants as of January 3, 2010, and are therefore excluded from the activity presented in the stock option. Stock appreciation rights, and restricted stock tables below.
Under the 2008 Equity Plan, options generally vest over four years, as follows: 20% of the shares vest after six months, and the remaining 80% vest quarterly over the subsequent 42 months. The exercise price of options granted under the 2008 Equity Plan must be at least equal to the fair market value of our common stock on the date of grant. In addition, the exercise price of an incentive stock option granted to any participant who owns more than 10% of the total voting power of all classes of our outstanding stock must be at least 110% of the fair market value of the common stock on the grant date. The term of an option may not exceed ten years, except that, with respect to any participant who owns 10% of the voting power of all classes of our outstanding capital stock, the term of an incentive stock option may not exceed five years.
Under the 2008 Equity Plan, stock appreciation rights, which are the rights to receive the appreciation in fair market value of common stock between the exercise date and the date of grant, become exercisable at the times and on the terms established by the plan administrator. The plan administrator has complete discretion to determine the terms and conditions of stock appreciation rights granted under the 2008 Equity Plan; provided, however, that the exercise price may not be less than 100% of the fair market value of a share on the date of grant. The term of a stock appreciation right may not exceed ten years. Under the 2008 Equity Plan, the plan administrator may issue awards of restricted stock, restricted stock units, and performance units and performance shares at its sole discretion. Restricted stock awards generally vest every six-months over a period of four years.
1999 Employee Stock Purchase Plan—Under the terms of our 1999 Employee Stock Purchase Plan, as amended (1999 ESPP), eligible employees could purchase common stock for a purchase price equal to 85% of the fair market value of our common stock on the first or last day, whichever is less, of the applicable six-month purchase period, which periods end in January and July of each year, except in 2009, when the period ended in June upon the expiration of the 1999 ESPP. For the years ended January 3, 2010, December 28, 2008, and December 30, 2007 employees purchased 106,500, 92,047, and 92,585 shares, respectively, of our common stock under the 1999 ESPP in exchange for $94,000, $189,000, and $224,000, respectively.
Determining Fair Value
We calculate the fair value of our stock options and stock appreciation rights granted to employees using the Black-Scholes option pricing model using the single option award approach. This fair value is then amortized on a straight-line basis over the requisite service periods of the awards, which is generally the vesting period. The following weighted-average assumptions were used in arriving at the fair value of each option grant:
| Year ended January 3, 2010 |
Year ended December 28, 2008 |
Year ended December 30, 2007 |
||||||||||
| Expected volatility |
70 | % | 65 | % | 74 | % | ||||||
| Expected term (in years) |
4.7 | 4.3 | 5.8 | |||||||||
| Risk-free interest rate |
1.8 | % | 2.5 | % | 4.4 | % | ||||||
| Expected dividend |
0 | % | 0 | % | 0 | % | ||||||
| Weighted-average fair value |
$ | 0.28 | $ | 1.40 | $ | 1.89 | ||||||
F-29
Table of Contents
DRUGSTORE.COM, INC.
NOTES TO CONSOLIDATED FINANCIAL STATEMENTS (Continued)
Volatility
Our computation of expected volatility is based on our historical volatility, adjusted for changes in capital structure and corporate changes, information available that may indicate future volatility, and observable mean reversion tendencies of historical volatility.
Expected Term
Our expected term estimates are based on a comprehensive weighted average life (WAL) analysis. The WAL analysis provides a historical based platform for use in developing expected term estimates for the future based on the historically observed time periods from grant date through post-vesting activities, such as exercise and cancellation. The historical grant data is segregated into pre-vesting forfeitures, post-vesting forfeitures, outstanding and unvested grants, and outstanding and vested grants and then data is included or excluded in the WAL depending on the applicable contractual or vesting provisions, differences in other option terms and insufficient elapsed time from grant date or from vesting dates. We also analyze by homogenous group, which includes employees, executives, our chief executive officer, board members, and other non-employees, the weighted average time from grant date to post-vesting activity. For those grants still outstanding, we developed a reasonable assumption regarding the expected time of settlement. This analysis resulted in an expected term ranging from 4.3 years to 6.3 years, depending on the homogenous group.
Risk-Free Interest Rate and Dividend Yield
We base the risk-free interest rate on the implied yield currently available on U.S. Treasury zero-coupon issues with an equivalent remaining term. Where the expected term of our stock-based awards do not correspond with the terms for which interest rates are quoted, we average the periods to determine the rate from the available term maturities. A dividend yield of 0% was considered appropriate as we have not issued and do not anticipate issuing any dividends in the near future.
Forfeitures
We are required to recognize stock-based compensation expense based on the number of options, stock appreciation rights, and restricted shares expected to vest. Accordingly, we apply a forfeiture rate of 35% to employee options and stock appreciation rights, a 15% forfeiture rate to employee restricted stock awards, except that we use a forfeiture rate of 0% for our chief executive officer and board members. When estimating forfeitures, we considered historical voluntary termination behavior and turnover, in addition to analyzing actual option forfeitures.
F-30
Table of Contents
DRUGSTORE.COM, INC.
NOTES TO CONSOLIDATED FINANCIAL STATEMENTS (Continued)
Stock Option and Stock Appreciation Rights Activity
The following table summarizes our stock option and stock appreciation rights activity:
| Outstanding | Weighted- Average Remaining Contractual Term |
Aggregate Intrinsic Value (in thousands) | |||||||||
| Number of Shares |
Weighted- Average Exercise Price per Share |
||||||||||
| Outstanding at December 28, 2008 |
16,706,547 | $ | 3.29 | ||||||||
| Options granted (1) |
559,600 | $ | 0.79 | ||||||||
| Options exercised |
(55,546 | ) | $ | 2.21 | |||||||
| Options expired |
(442,447 | ) | $ | 6.92 | |||||||
| Options forfeited |
(132,429 | ) | $ | 2.56 | |||||||
| Outstanding at January 3, 2010 |
16,635,725 | $ | 2.95 | ||||||||
| Vested and expected to vest at January 3, 2010 |
14,677,727 | $ | 3.20 | 5.90 | $ | 3,409 | |||||
| Exercisable at January 3, 2010 |
13,963,105 | $ | 3.22 | 5.80 | $ | 3,116 | |||||
| (1) | Excludes approximately 3.4 million shares subject to stock options and stock appreciation rights that are subject to stockholder approval. |
The aggregate intrinsic value is calculated as the difference between the exercise price of the underlying awards and the market price of our common stock for the 9.8 million shares subject to options that were in-the-money at January 3, 2010 (i.e., with an exercise price of $3.09 or less). As of January 3, 2010, the total compensation cost related to unvested options granted totaled $1.4 million, net of estimated forfeitures of approximately $4.6 million. This cost will be amortized on a straight-line basis over a weighted-average period of 1.7 years and will be adjusted for subsequent changes in estimated forfeitures.
The aggregate intrinsic value of options exercised was $41,000, $32,000, and $1.4 million as of January 3, 2010, December 28, 2008, and December 30, 2007.
Restricted Stock Activity
The following table summarizes our restricted stock activity:
| Number of Shares |
Weighted-Average Grant Date Fair Value | |||||
| Outstanding at December 28, 2008 |
— | $ | — | |||
| Awards granted (1) |
2,959,657 | $ | 0.78 | |||
| Awards released |
(829,657 | ) | $ | 0.82 | ||
| Awards forfeited |
(5,262 | ) | $ | 1.43 | ||
| Outstanding at January 3, 2010 |
2,124,738 | $ | 0.76 | |||
| (1) | Excludes approximately 700,000 restricted shares that are subject to stockholder approval. |
F-31
Table of Contents
DRUGSTORE.COM, INC.
NOTES TO CONSOLIDATED FINANCIAL STATEMENTS (Continued)
Stock Compensation Expense
The following table summarizes stock-based compensation by operating function recorded in the Statements of Operations:
| Year ended January 3, 2010 |
Year ended December 28, 2008 |
Year ended December 30, 2007 | |||||||
| (in thousands) | |||||||||
| Fulfillment and order processing |
$ | 512 | $ | 576 | $ | 784 | |||
| Marketing and sales |
1,576 | 1,619 | 1,381 | ||||||
| Technology and content |
1,102 | 1,265 | 1,224 | ||||||
| General and administrative |
2,210 | 4,104 | 5,412 | ||||||
| Total |
$ | 5,400 | $ | 7,564 | $ | 8,801 | |||
12. Segment Information
We have three reporting segments: over-the-counter (OTC), vision, and mail-order pharmacy. The OTC segment is comprised of the sales and related costs of selling all non-prescription health, beauty, personal care, household, and other products. Our vision segment is comprised of sales and the related costs of selling contact lenses and other contact lens supplies through Vision Direct. The mail-order pharmacy segment is comprised of sales and the related costs of selling prescription drugs and supplies through the drugstore.com web store for mail-order delivery. On February 19, 2010, we completed the acquisition of Salu, the owner of the web store www.skinstore.com and operator and fulfillment partner for www.spalook.com. Through these web stores, we will offer clinical skin care products and combined with our beauty business we will be one of the largest online beauty retailers offering mass beauty products, prestige brands, and clinical skincare products. The operations of Salu will be included in our OTC segment beginning in the first quarter of 2010. We operate and evaluate our business segments based on contribution margin results. We define contribution margin as net sales attributable to a segment, less the direct cost of these sales and the incremental (variable) costs of fulfilling, processing, and delivering the order (labor, packaging supplies, credit card fees, and royalty costs that are variable based on sales volume).
F-32
Table of Contents
DRUGSTORE.COM, INC.
NOTES TO CONSOLIDATED FINANCIAL STATEMENTS (Continued)
The information presented below for these segments is information used by our chief operating decision makers in evaluating operating performance.
| Fiscal Year 2009 |
Fiscal Year 2008 |
Fiscal Year 2007 | |||||||
| (in thousands) | |||||||||
| OTC: |
|||||||||
| Net sales |
$ | 306,854 | $ | 260,794 | $ | 234,282 | |||
| Cost of sales |
210,456 | 180,252 | 164,469 | ||||||
| Variable order costs (a) |
27,729 | 23,499 | 22,259 | ||||||
| Contribution margin (b) |
$ | 68,669 | $ | 57,043 | $ | 47,554 | |||
| Vision: |
|||||||||
| Net sales |
$ | 68,720 | $ | 61,420 | $ | 54,906 | |||
| Cost of sales |
52,894 | 47,279 | 41,904 | ||||||
| Variable order costs (a) |
3,172 | 2,899 | 2,708 | ||||||
| Contribution margin (b) |
$ | 12,654 | $ | 11,242 | $ | 10,294 | |||
| Mail-Order Pharmacy: |
|||||||||
| Net sales |
$ | 37,258 | $ | 44,365 | $ | 50,143 | |||
| Cost of sales |
30,195 | 36,166 | 41,935 | ||||||
| Variable order costs (a) |
2,811 | 3,447 | 3,967 | ||||||
| Contribution margin (b) |
$ | 4,252 | $ | 4,752 | $ | 4,241 | |||
| Consolidated: |
|||||||||
| Net sales (c) |
$ | 412,832 | $ | 366,579 | $ | 339,331 | |||
| Cost of sales |
293,545 | 263,697 | 248,308 | ||||||
| Variable order costs (a) |
33,712 | 29,845 | 28,934 | ||||||
| Contribution margin (b) |
$ | 85,575 | $ | 73,037 | $ | 62,089 | |||
| (a) | These amounts include all variable costs of fulfillment and order processing, including labor, packaging supplies, and credit card fees, and royalty expenses related to certain of our partnerships that are variable based on sales volume. These amounts exclude depreciation, fixed overhead costs, and stock-based compensation. |
| (b) | Contribution margin represents a measure of how well each segment is contributing to our operating goals. It is calculated as net sales less the direct cost of these sales and the incremental (variable) fulfillment and order processing costs of delivering orders to our customers and royalty costs. |
| (c) | Net sales in 2009 were comprised of 98% of sales in the United States of America and 2% of sales internationally, and net sales in 2008 and 2007 were comprised of 99% of sales in the United States of America and 1% of sales internationally. |
F-33
Table of Contents
DRUGSTORE.COM, INC.
NOTES TO CONSOLIDATED FINANCIAL STATEMENTS (Continued)
| Consolidated contribution margin for reportable segments |
$ | 85,575 | $ | 73,037 | $ | 62,089 | ||||||
| Less: |
||||||||||||
| Fixed fulfillment and order processing (d) |
13,249 | 13,623 | 10,988 | |||||||||
| Marketing and sales (e) |
37,091 | 33,500 | 29,975 | |||||||||
| Technology and content |
24,880 | 23,011 | 18,258 | |||||||||
| General and administrative |
17,247 | 19,034 | 20,928 | |||||||||
| Amortization of intangible assets |
477 | 867 | 1,234 | |||||||||
| Operating loss |
$ | (7,369 | ) | $ | (16,998 | ) | $ | (19,294 | ) | |||
| (d) | These amounts include all fixed costs of fulfillment and order processing that are not discernable by business segment. |
| (e) | These amounts exclude royalty expenses of $1.2 million in 2009, $91,000 in 2008, and $105,000 in 2007 that are included in variable costs in the contribution margin. |
The following table presents assets by segment and geographic asset information:
| January 3, 2010 |
December 28, 2008 | |||||
| (in thousands) | ||||||
| Total Assets: |
||||||
| OTC |
$ | 58,270 | $ | 49,085 | ||
| Vision |
36,542 | 32,507 | ||||
| Mail-Order Pharmacy |
3,306 | 2,773 | ||||
| Discontinued operations |
— | 5,954 | ||||
| Corporate |
56,411 | 62,230 | ||||
| Consolidated |
$ | 154,529 | $ | 152,549 | ||
| Property and Equipment, Net: |
||||||
| United States of America |
$ | 24,132 | $ | 28,222 | ||
| Canada |
33 | 84 | ||||
| $ | 24,165 | $ | 28,306 | |||
F-34
Table of Contents
DRUGSTORE.COM, INC.
NOTES TO CONSOLIDATED FINANCIAL STATEMENTS (Continued)
13. Quarterly Results of Operations (unaudited)
The following tables contain selected unaudited consolidated statement of operations information for each quarter of fiscal years 2009 and 2008. We believe that the following information reflects all normal recurring adjustments necessary for a fair presentation of the information for the periods presented. The operating results for any quarter are not necessarily indicative of results for any future period.
| Fiscal Year Ended January 3, 2010 | Fiscal Year Ended December 28, 2008 | |||||||||||||||||||||||||||||||
| First Quarter |
Second Quarter |
Third Quarter |
Fourth Quarter(2) |
First Quarter |
Second Quarter |
Third Quarter |
Fourth Quarter |
|||||||||||||||||||||||||
| ($ in thousands, except per share data) | ||||||||||||||||||||||||||||||||
| Net sales |
$ | 98,315 | $ | 100,341 | $ | 96,815 | $ | 117,361 | $ | 92,568 | $ | 92,248 | $ | 87,823 | $ | 93,940 | ||||||||||||||||
| Cost of sales |
70,552 | 71,762 | 68,408 | 82,823 | 67,183 | 66,679 | 62,708 | 67,127 | ||||||||||||||||||||||||
| Loss from continued operations |
(2,131 | ) | (1,935 | ) | (1,634 | ) | (1,623 | ) | (4,492 | ) | (4,371 | ) | (4,722 | ) | (2,782 | ) | ||||||||||||||||
| Gain from discontinued operations |
2,985 | 2,961 | — | — | 1,807 | 2,099 | 1,103 | 3,071 | ||||||||||||||||||||||||
| Net income (loss) |
854 | 1,026 | (1,634 | ) | (1,623 | ) | (2,685 | ) | (2,272 | ) | (3,619 | ) | 289 | |||||||||||||||||||
| Basic and diluted: |
||||||||||||||||||||||||||||||||
| Loss from continuing operations per share |
$ | (0.02 | ) | $ | (0.02 | ) | $ | (0.02 | ) | $ | (0.02 | ) | $ | (0.04 | ) | $ | (0.05 | ) | $ | (0.05 | ) | $ | (0.03 | ) | ||||||||
| Gain from discontinued operations per share |
$ | 0.03 | $ | 0.03 | $ | 0.00 | $ | 0.00 | $ | 0.02 | $ | 0.02 | $ | 0.01 | $ | 0.03 | ||||||||||||||||
| Net income (loss) per share (3) |
$ | 0.01 | $ | 0.01 | $ | (0.02 | ) | $ | (0.02 | ) | $ | (0.03 | ) | $ | (0.02 | ) | $ | (0.04 | ) | $ | 0.00 | |||||||||||
| Weighted average shares used in computation of: |
||||||||||||||||||||||||||||||||
| Basic net income (loss) per share |
97,355,613 | 99,727,521 | 96,932,740 | 97,390,984 | 96,392,737 | 96,478,573 | 96,515,737 | 96,540,101 | ||||||||||||||||||||||||
| Diluted net income (loss) per share (1) |
97,355,613 | 99,727,521 | 96,932,740 | 97,390,984 | 96,392,737 | 96,478,573 | 96,515,737 | 96,643,524 | ||||||||||||||||||||||||
| (1) | The calculation of fourth quarter 2008 weighted average shares includes 103,423 shares of dilutive stock options. |
| (2) | The fourth quarter of 2009 is a 14-week quarter. |
| (3) | Net income (loss) per share on a quarterly basis for fiscal 2009 does not sum to the annual net loss per share as a result of the impact of participating securities on the weighted average number of shares used in the computation in the periods with net income. |
14. Subsequent Events
On February 19, 2010, we completed our previously announced acquisition of Salu, Inc. The acquisition was made pursuant to an Agreement and Plan of Merger, dated as of December 27, 2009, by and among drugstore.com, Silk Acquisition Corporation, a Delaware corporation and a wholly owned subsidiary of drugstore.com, Salu, certain stockholders of Salu, and a representative of all stockholders of Salu. On February 19, 2010, Silk Acquisition Corporation merged with and into Salu, with Salu surviving as a wholly owned subsidiary of drugstore.com pursuant to the merger agreement. As consideration for their shares of Salu, the stockholders of Salu received an aggregate payment of approximately $36.8 million, consisting of $19.4 million cash (less approximately $1.9 million of Salu’s transaction expenses paid out of the merger consideration) and approximately 5,425,693 shares of drugstore.com common stock with a value of $17.4 million. Of this initial consideration, drugstore.com paid approximately $2.7 million in cash and 816,450 shares of our common stock into escrow to secure post-closing indemnification obligations of Salu’s stockholders. Additionally, certain employees of Salu are eligible to receive a performance incentive payment payable in cash over a two-year period commencing in fiscal year 2010 with an aggregate value of $2.5 million if the surviving entity achieves certain financial and other performance targets.
F-35
Table of Contents
DRUGSTORE.COM, INC.
NOTES TO CONSOLIDATED FINANCIAL STATEMENTS (Continued)
We financed a portion of the cash payable at the closing of the merger described above and borrowed $10.0 million under our revolving two-year line of credit pursuant to our March 2009 loan and security agreement with our existing bank. In conjunction with the acquisition, we also paid $1.4 million in transaction fees, which was recorded to general and administrative expense in our statements of operations in the first quarter of 2010.
The purchase price of approximately $36.8 million will be allocated to the tangible assets and intangible assets acquired and liabilities assumed based on their estimated fair values on the acquisition date, which are estimated to range between $15.0 million and $18.0 million with the remaining unallocated purchase price recorded as goodwill estimated to range between $19.0 million and $22.0 million. The fair value assigned to identifiable intangible assets acquired will be determined primarily by using the income approach. Purchased identifiable intangible assets will be amortized on a straight-line basis over their respective useful lives.
F-36
Table of Contents
SCHEDULE II—VALUATION AND QUALIFYING ACCOUNTS
(in thousands)
| Description |
Balance at beginning of fiscal period |
Charges to revenue, costs and expenses, and additions |
Deductions | Balance at end of fiscal period | ||||||||||
| Year Ended January 3, 2010 |
||||||||||||||
| Allowance for doubtful accounts |
$ | 16 | $ | 310 | $ | 257 | (a) | $ | 69 | |||||
| Allowance for sales returns |
320 | 4,642 | 4,544 | (b) | 418 | |||||||||
| Deferred tax asset valuation allowance |
254,414 | 0 | 6,604 | (c) | 247,810 | |||||||||
| Year Ended December 28, 2008 |
||||||||||||||
| Allowance for doubtful accounts |
$ | 41 | $ | 183 | $ | 208 | (a) | $ | 16 | |||||
| Allowance for sales returns |
493 | 3,633 | 3,806 | (b) | 320 | |||||||||
| Deferred tax asset valuation allowance |
250,381 | 4,033 | (c) | 8,603 | 254,414 | |||||||||
| Year Ended December 30, 2007 |
||||||||||||||
| Allowance for doubtful accounts |
$ | 38 | $ | 85 | $ | 82 | (a) | $ | 41 | |||||
| Allowance for sales returns |
339 | 3,491 | 3,337 | (b) | 493 | |||||||||
| Deferred tax asset valuation allowance |
237,745 | 12,636 | (c) | 0 | 250,381 | |||||||||
| (a) | Deductions consist of write-offs of uncollectible accounts, net of recoveries. |
| (b) | Deductions consist of sales credits to customers for product returns. |
| (c) | Additions and deductions are the result of changes in our net deferred assets. |
F-37
Table of Contents
Pursuant to the requirements of Section 13 or 15(d) of the Securities Exchange Act of 1934, the registrant has duly caused this report to be signed on its behalf by the undersigned, thereunto duly authorized, on March 16, 2010.
| DRUGSTORE.COM, INC. | ||
| By: | /S/ DAWN G. LEPORE | |
| Dawn G. Lepore President, Chief Executive Officer and Chairman of the Board | ||
POWER OF ATTORNEY
Each person whose individual signature appears below hereby authorizes and appoints Dawn G. Lepore and Robert P. Potter, and each of them, with full power of substitution and resubstitution and full power to act without the other, as his or her true and lawful attorney-in-fact and agent to act in his or her name, place and stead and to execute in the name and on behalf of each person, individually and in each capacity stated below, and to file, any and all amendments to this report, and to file the same, with all exhibits thereto, and other documents in connection therewith, with the Securities and Exchange Commission, granting unto such attorneys-in-fact and agents, and each of them, full power and authority to do and perform each and every act and thing, ratifying and confirming all that said attorneys-in-fact and agents or any of them or their or his or her substitute or substitutes may lawfully do or cause to be done by virtue thereof.
Pursuant to the requirements of the Securities Exchange Act of 1934, this Report has been signed below by the following persons on behalf of the registrant and in the capacities indicated as of March 16, 2010.
| Signature |
Title | |
| /S/ DAWN G. LEPORE Dawn G. Lepore |
President, Chief Executive Officer and Chairman of the Board (Principal Executive Officer) | |
| /S/ ROBERT P. POTTER Robert P. Potter |
Vice President, Chief Accounting Officer (Principal Financial and Accounting Officer) | |
| /S/ RICHARD W. BENNET III Richard W. Bennet III |
Director | |
| /S/ GEOFFREY R. ENTRESS Geoffrey R. Entress |
Director | |
| /S/ JEFFREY M. KILLEEN Jeffrey M. Killeen |
Director | |
| /S/ WILLIAM D. SAVOY William D. Savoy |
Director | |
| /S/ GREGORY S. STANGER Gregory S. Stanger |
Director | |
F-38