Attached files
Table of Contents
UNITED STATES
SECURITIES AND EXCHANGE COMMISSION
Washington, D.C. 20549
Form 10-K
| þ | ANNUAL REPORT PURSUANT TO SECTION 13 OR 15(d) OF THE SECURITIES EXCHANGE ACT OF 1934 |
For the Fiscal Year Ended December 31, 2009
or
| ¨ | TRANSITION REPORT PURSUANT TO SECTION 13 OR 15(d) OF THE SECURITIES EXCHANGE ACT OF 1934 |
For the Transition Period From to
Commission file number 1-13317
DOT HILL SYSTEMS CORP.
(Exact name of registrant as specified in its charter)
| Delaware | 13-3460176 | |
| (State of Incorporation) | (I.R.S. Employer Identification No.) | |
| 1351 S. Sunset Street, Longmont, CO |
80501 | |
| (Address of principal executive offices) | (Zip Code) | |
Registrant’s telephone number, including area code:
(303) 845-3200
Securities registered pursuant to Section 12(b) of the Act:
| Title of Each Class |
Name of Each Exchange on Which Registered | |
| Common stock, $0.001 par value | The Nasdaq Stock Market |
Securities registered pursuant to Section 12(g) of the Act:
None
Indicate by check mark if the registrant is a well-known seasoned issuer, as defined in Rule 405 of the Securities Act. Yes ¨ No þ
Indicate by check mark if the registrant is not required to file reports pursuant to Section 13 or Section 15(d) of the Act. Yes ¨ No þ
Indicate by check mark whether the registrant (1) has filed all reports required to be filed by Section 13 or 15(d) of the Securities Exchange Act of 1934 during the preceding 12 months (or for such shorter period that the registrant was required to file such reports), and (2) has been subject to such filing requirements for the past 90 days. Yes þ No ¨
Indicate by check mark whether the registrant has submitted electronically and posted on its corporate Web site, if any, every Interactive Data File required to be submitted and posted pursuant to Rule 405 of Regulation S-T (§ 232.405 of this chapter) during the preceding 12 months (or for such shorter period that the registrant was required to submit and post such files). Yes ¨ No ¨
Indicate by check mark if disclosure of delinquent filers pursuant to Item 405 of Regulation S-K is not contained herein, and will not be contained, to the best of registrant’s knowledge, in definitive proxy or information statements incorporated by reference in Part III of this Form 10-K or any amendment to this Form 10-K. þ
Indicate by check mark whether the registrant is a large accelerated filer, an accelerated filer, a non-accelerated filer, or a smaller reporting company. See the definitions of “large accelerated filer,” “accelerated filer” and “smaller reporting company” in Rule 12b-2 of the Exchange Act:
| Large accelerated filer ¨ | Accelerated filer ¨ | Non-accelerated filer ¨ | Smaller reporting company | þ | |||
| (Do not check if a smaller reporting company) | |||||||
Indicate by check mark whether the registrant is a shell company (as defined in Rule 12b-2 of the Act). Yes ¨ No þ
The aggregate market value of the voting and non-voting common equity held by non-affiliates computed by reference to the price at which the common equity was last sold as of June 30, 2009 was $37,967,112.
The number of shares of the registrant’s common stock outstanding as of March 8, 2010 was 54,367,653.
Documents Incorporated by Reference
Portions of the registrant’s definitive proxy statement for its 2010 annual meeting of stockholders are incorporated by reference into Part III of this Form 10-K.
Table of Contents
DOT HILL SYSTEMS CORP.
INDEX TO ANNUAL REPORT ON FORM 10-K
FOR THE YEAR ENDED DECEMBER 31, 2009
| Page | ||||
| PART I | ||||
| Item 1. |
1 | |||
| Item 1A. |
22 | |||
| Item 1B. |
34 | |||
| Item 2. |
34 | |||
| Item 3. |
35 | |||
| Item 4. |
36 | |||
| PART II | ||||
| Item 5. |
37 | |||
| Item 6. |
39 | |||
| Item 7. |
Management’s Discussion and Analysis of Financial Condition and Results of Operations |
41 | ||
| Item 7A. |
59 | |||
| Item 8. |
59 | |||
| Item 9. |
Changes in and Disagreements With Accountants on Accounting and Financial Disclosure |
59 | ||
| Item 9A. |
59 | |||
| Item 9B. |
62 | |||
| PART III | ||||
| Item 10. |
62 | |||
| Item 11. |
62 | |||
| Item 12. |
Security Ownership of Certain Beneficial Owners and Management and Related Stockholder Matters |
62 | ||
| Item 13. |
Certain Relationships and Related Transactions, and Director Independence |
63 | ||
| Item 14. |
63 | |||
| PART IV | ||||
| Item 15. |
64 | |||
Table of Contents
Forward-Looking Statements
Certain statements contained in this annual report on Form 10-K, including, but not limited to, statements regarding the development, growth and expansion of our business, our intent, belief or current expectations, primarily with respect to our future operating performance and the products we expect to offer, and other statements regarding matters that are not historical facts, are “forward-looking statements” within the meaning of Section 27A of the Securities Act of 1933, as amended, or the Securities Act, and Section 21E of the Securities Exchange Act of 1934, as amended, or the Exchange Act, and are subject to the “safe harbor” created by these sections. Future filings with the Securities and Exchange Commission, or SEC, future press releases and future oral or written statements made by us or with our approval, which are not statements of historical fact, may also contain forward-looking statements. Because such statements include risks and uncertainties, many of which are beyond our control, actual results may differ materially from those expressed or implied by such forward-looking statements. Some of the factors that could cause actual results to differ materially from those expressed or implied by such forward-looking statements are set forth in the section entitled “Risk Factors” and in the section entitled “Management’s Discussion and Analysis of Financial Condition and Results of Operations” and elsewhere throughout this annual report on Form 10-K.
Readers are cautioned not to place undue reliance on these forward-looking statements. The forward-looking statements speak only as of the date on which they are made, and, except as required by applicable law, we undertake no obligation to update any forward-looking statement to reflect events or circumstances after the date on which the statement is made or to reflect the occurrence of unanticipated events.
In this annual report on Form 10-K, “Dot Hill,” “Dot Hill Systems Corp.,” “we,” “us” and “our” refer to Dot Hill Systems Corporation, and our wholly owned subsidiaries on a consolidated basis, unless the context otherwise provides.
| Item 1. | Business |
We are a provider of entry-level and midrange storage systems and enterprise server software for organizations requiring high reliability, high performance networked storage and data management solutions in an open systems architecture. Our storage solutions consist of integrated hardware, firmware and software products employing a modular system that allows end-users to add various capacity or data protection schemes as needed. Our broad range of products, from medium capacity stand-alone storage units to complete multi-terabyte storage area networks, or SANs, provide end-users with a cost-effective means of addressing increasing storage demands without sacrificing performance. Our current product family based on our Rapid Evolution, or R/Evolution, architecture provides high performance and large disk array capacities for a broad variety of environments, employing Fibre Channel, or FC, Internet Small Computer Systems Interface, or iSCSI or Serial Attached SCSI, or SAS, interconnects to switches and/or hosts. In addition, our Assured family of data protection software products provides additional layers of data protection options to complement our line of storage disk arrays. Our current mainstream 2000 series of entry-level storage products and Just a Bunch of Disks, or JBOD, arrays have significantly increased in market share during 2009 and are targeted primarily at mainstream enterprise and small-to-medium business, or SMB, applications. Our new replacement products for the legacy SANnet II products, the 2000 series, have been distinguished by certification as Network Equipment Building System, or NEBS, Level 3 (a telecommunications standard for equipment used in central offices) and are MIL-STD-810F (a military standard created by the U.S. government) compliant based on their ruggedness and reliability. In January 2009, we launched a new line of products to address the growing need for smaller form factor, highly dense storage utilizing SAS or serial ATA, or SATA, disks, as well as the newest generation of solid state disks, or SSDs.
As a result of our ongoing strategic development, planning and evaluation, we have identified some potential higher margin business that we believe will complement our current product offerings. Accordingly, we have decided to expand our software offerings. We plan to leverage our current products and technology to
1
Table of Contents
pursue selling through distributors and open storage partners, or OSPs. Our investment in software will require significant investment and development on our part, which will impact our cash and operating results until we generate sufficient revenues to recover our investment.
In September 2008, we acquired certain assets, namely RAIDCore and Network Attached Storage, or NAS, from Ciprico Inc., or Ciprico. We believe this acquisition will open up new markets for us in the enterprise server and workstation markets for data protection internal to the servers and workstations. In particular, the RAIDCore acquisition will allow us to broaden our product portfolio in the redundant array of independent disks, or RAID, market while allowing us to sell into the Band 1 market, and to pursue opportunities at current and target OEM customers. The Ciprico acquisition also provided us with a team of software development professionals located in Minneapolis, Minnesota. We signed our first customer agreement relating to RAIDCore products in May 2009 and began selling to this customer during the third quarter of 2009. Sales in 2009 were not significant. Additionally, we do not anticipate significant sales in 2010.
In December 2009 we announced that TYAN, an industry-leading server platform provider which is part of Mitac International Corporation had selected our RAIDCore Virtual RAID Adapter technology to be featured in its newest server platforms. Also in December 2009, we announced that Advanced Micro Devices or AMD will embed our RAIDCore Virtual RAID Adapter technology into select platforms based on the recently announced AMD SR5690/SP5100 server chipset.
In January 2010, we acquired Cloverleaf Communications Inc., or Cloverleaf, a privately held software company focused on heterogeneous storage virtualization and unified storage technologies. The acquisition of Cloverleaf could broaden our market opportunities and help accelerate our transition from a provider of storage arrays to a provider of storage solutions and software. The Cloverleaf acquisition also provided us with a new team of software developers and other professionals located in Israel. The Cloverleaf Intelligent Storage Networking System, or iSN™, is an intelligent, network resident, storage network management system that provides a combination of benefits, features and capabilities qualified to meet the demands of mid to large-sized data centers. The iSN™ incorporates architecture that delivers linear scalability, strong fault tolerance and high levels of availability. The iSN™’s open software is integrated with off the shelf hardware components and provides interoperability and networking technology flexibility.
We have decided to expand our routes to market beyond our focus on OEMs, and in October of 2009, we launched a Dot Hill channel program targeted at selling through distributors and OSPs. We believe this will provide Dot Hill with additional sales channels for all of our products.
Our agreements with our customers do not contain any minimum purchase commitments and may be terminated at any time upon notice from the applicable customer. Our ability to achieve profitability will depend on, among other things, the level and mix of orders we actually receive from such customers, the actual amounts we spend on marketing support, the actual amounts we spend for inventory support and incremental internal investment, our ability to reduce product cost, our product lead time, our ability to meet delivery schedules required by our customers and the economic environment.
Our products and services are sold worldwide to facilitate server and SAN storage implementations, primarily through original equipment manufacturers, or OEMs, and supplemented by system integrators, or SIs, distributors and value added resellers, or VARs. Our OEM channel partners currently include, among others, Hewlett-Packard, or HP, NetApp, Inc., or NetApp, Motorola, Inc., or Motorola, General Dynamics Government Systems Corporation, or General Dynamics, Lockheed Martin Corporation, or Lockheed Martin, Fujitsu Technology Solutions GmbH, or FTS, and Sun Microsystems, or Sun. Although our products and services are sold worldwide, the majority of our net revenue is derived from our U.S. operations. See Note 14 of the Notes to Consolidated Financial Statements for a breakout of our net revenue by geographical regions.
We began shipping products to HP in the fourth quarter of 2007. In January 2008, we amended our agreement with HP to allow for sales to additional divisions within HP. Our products are primarily sold within HP’s MSA 2000 product family. Sales to HP increased significantly during 2008 and increased again in 2009
2
Table of Contents
primarily as a result of the successful launch and market acceptance of the HP MSA 2000 product in 2008 as well as the successful launch of follow-on products in 2009. The agreement with HP does not contain any minimum purchase commitments and the term of the agreement was extended from one to five years. Net revenue from HP approximated 51% of our total net revenue in 2009.
Pursuant to our Development and OEM Supply Agreement with NetApp, we are designing and developing general purpose disk arrays for a variety of products to be sold under private label by NetApp. We began shipping products to NetApp under the agreement for general availability in the third quarter of 2007, and net revenue from NetApp increased significantly during 2008. Net revenue from NetApp decreased slightly in 2009 primarily as a result of general economic conditions. Net revenue from NetApp approximated 25% of our total net revenue in 2009.
We have experienced a decline in net revenue from Sun primarily due to the products nearing the end of their lifecycle. Net revenue from Sun approximated 4% of our total net revenue in 2009. We do not expect to generate significant net revenue from Sun in future periods.
We have also experienced a decline in net revenue from FTS as a result of its decision to internally source the products we sell to them. Net revenue from FTS approximated 5% of our total net revenues in 2009. We expect net revenue from FTS to continue to decline in future periods as a result of this transition.
In addition, the demand for our products has been affected in the past, and may continue to be affected in the future, by various factors, including, but not limited to, the following:
| • | general economic and political conditions and specific conditions in the markets we address, including the continuing volatility in the technology sector, current general economic volatility and trends in the data storage markets in various geographic regions; |
| • | the inability of certain of our customers who depend on credit to have access to their traditional sources of credit to finance the purchase of products from us, particularly in the current global economic environment, which may lead them to reduce their level of purchases or to seek credit or other accommodations from us; and |
| • | the timing, rescheduling or cancellation of significant customer orders and our ability, as well as the ability of our customers, to manage inventory. |
For these and other reasons, our net revenue and results of operations in 2009 and prior periods may not necessarily be indicative of future net revenue and results of operations.
Our strategy includes outsourcing substantially all of our manufacturing to third-party manufacturers in order to reduce sales cycle times and manufacturing infrastructure, enhance working capital and improve margins by taking advantage of the third parties’ manufacturing and procurement economies of scale. We have historically outsourced substantially all of our manufacturing operations to Flextronics International Limited, or Flextronics. In February 2007, we entered into a manufacturing agreement with MiTAC International Corporation, or MiTAC, a leading provider of contract manufacturing and original design manufacturing services, and SYNNEX Corporation, or SYNNEX, a leading global information technology, or IT, supply chain services company. We began shipping products for general availability under the MiTAC and SYNNEX agreement in 2007.
In September 2008, we entered into a manufacturing agreement with Foxconn Technology Group, or Foxconn. Under the terms of the agreement, Foxconn supplies us with manufacturing, assembly and test services from its facilities in China and final integration services including final assembly, testing and configure-to-order services, through its worldwide facilities. The agreement provides for an initial three-year term that is automatically renewed at the end of such three-year term for additional one-year terms unless and until the agreement is terminated by either party. Foxconn began manufacturing products for us in July 2009 and we began shipping products for general availability under the Foxconn agreement during the second half of 2009. We expect Foxconn to manufacture a larger percentage of our products in 2010.
3
Table of Contents
In December 2008, our management approved, committed to, and initiated plans to restructure and improve efficiencies in our operations. The restructuring was due to a combination of factors, primarily driven by the economic downturn, but also driven by our plan to consolidate our facilities in Carlsbad, California into the Longmont, Colorado facility. The consolidation is currently in process and we anticipate it will be completed by June 30, 2010.
We were formed in 1999 by the combination of Box Hill Systems Corp., or Box Hill, and Artecon, Inc., or Artecon. We reincorporated in Delaware in 2001. Our website address is http://www.dothill.com. Information contained on our website does not constitute a part of this annual report on Form 10-K. Our annual reports on Form 10-K, our quarterly reports on Form 10-Q, our current reports on Form 8-K and all amendments to those reports that we file with the SEC are currently available free of charge to the general public through our website promptly after being filed with the SEC and are also accessible through the SEC’s website which may be found at http://www.sec.gov. In addition, you may read and copy the materials we file with the SEC at the SEC’s Public Reference Room at 100 F Street, N.E., Washington, DC 20549. You may obtain information on the operation of the Public Reference Room by calling the SEC at 1-800-SEC-0330.
Industry Background
Growth of Data Storage
The efficient generation, storage, management and retrieval of digital data and content has become increasingly strategic and mission-critical to organizations. The volume of this data continues to grow rapidly, driven by several factors, including, among others:
| • | the proliferation of different types of data and data forms such as digital graphics, video, text and audio; |
| • | the emergence of Internet-based communication protocols which enable users to rapidly duplicate, change and re-communicate data; |
| • | new regulations and corporate policies requiring additional storage requirements imposed on healthcare companies and evolving regulatory requirements for financial services companies; |
| • | the implementation of enterprise-wide databases containing business management information; |
| • | gains in network bandwidth and the technology for managing and classifying large volumes of data; and |
| • | the development of the information lifecycle management and the growing use of RAID systems in the backup market in place of, or in addition to, automated tape libraries, due to new applications of technologies that offer improved alternatives in the trade-off between performance and cost of ownership. |
While visibility of worldwide external disk storage systems shipped was poor throughout 2009, the industry continued to report an overall capacity growth in 2009 despite economic conditions. A further trend that is expected to benefit us is a shift in spending toward the entry-level storage market as IT budgets are adjusted downwards. We expect this trend to continue well into 2010 and potentially beyond as entry level storage starts to offer an increasing number of traditional mid-range level features.
Traditionally, storage vendors have designed products for markets differentiated by capacity, performance, price and feature set. These storage markets are typically identified as:
| • | Entry-level. Entry-level storage products are designed for lower capacity, stand-alone data storage needs. OEMs and server companies address this market primarily through an indirect sales channel approach employing distributors, retailers and VARs that assist IT managers in identifying, purchasing and installing the product. |
4
Table of Contents
| • | Midrange. Midrange or departmental/workgroup storage products are designed for higher capacity and performance than entry-level products, but still feature ease of use and manageability, and are attached to a local server or a network of servers tailored to the needs of the local users. In this market, storage providers, OEMs and server companies primarily sell their products to local IT managers either direct or through distributors, VARs and regional SIs. |
| • | High-end. High-end or data center storage products are designed for use by larger organizations where data storage and management is critical. These organizations require large capacity storage systems that feature high performance, automation, extreme reliability, continuous availability, operating systems interoperability and global service and support. In this market, storage providers, OEMs and server companies sell their products with a combination of a direct sales force and indirect channels, including OEMs, large SIs, VARs and managed services providers. |
In addition to dramatic increases in the overall volume of data, the storage market has been influenced by the following major trends:
Migration to Networked, Clustered Computing and Unified Storage. Computing processes and architectures have evolved from mainframe computing systems toward a centrally managed network computing environment characterized by multiple operating systems and server platforms that must share information both locally and remotely. In addition, virtual server environments enabled by vendors such as VMware and Microsoft/s Hyper-V have led to a marked increase in the trend toward Unified Storage solutions that offer both NAS and SAN attach capabilities in a single storage solution. Organizations require large-scale data storage solutions offering, among other things:
| • | increased connectivity capabilities; |
| • | greater capacity; |
| • | higher performance; |
| • | the ability to share data among different platforms; |
| • | greater reliability; and |
| • | greater protection. |
Organizations have responded by implementing tailored networks, optimized for data storage functions that facilitate data access and protection.
Increasing Focus on Total Cost of Ownership and Return on Investment. IT managers are increasingly focused on lowering the total cost of ownership and increasing their return on investment on each technology purchase. IT managers evaluate total cost of ownership and return on investment based upon several metrics, including initial purchase price, ease of provisioning, scalability, reliability and redundancy, ease of management, IT staff productivity, operating costs and after-sale service and support.
Storage Area Networks
End users require storage systems that enable them to capture, protect, manage and archive data across a variety of storage platforms and applications without sacrificing performance or reliability. Historically, SCSI was the primary method of connecting storage to servers, based on a direct attached storage, or DAS, model. SAS has been adopted to replace parallel SCSI. Subsequently, the FC protocol was developed, which enables storage devices to connect to servers over a networked architecture, allowing end-users to connect multiple storage devices with high bandwidth throughput over long distances and centrally manage their storage environment. More recently, the iSCSI protocol has emerged in entry-level and midrange systems for storage connected via standard local area networks, or LANs, and wide area networks, or WANs, and leverages the significant investments and existing deployments of Ethernet technology. On-going developments in the industry
5
Table of Contents
have also led to preliminary proposed standards for FC over Ethernet, or FCoE, which are expected to deploy in 2010. Centrally managed network storage systems are designed to provide connectivity across multiple operating systems and devices and may be based on either open or proprietary technology standards.
SANs, whether FC or iSCSI based, apply the benefits of a networked approach to data storage applications, allowing large blocks of data to move efficiently and reliably between multiple storage devices and servers without interrupting normal network traffic. SANs provide high scalability, connectivity and fault-tolerance, which permit IT managers to create and manage centralized pools of storage and backup devices with redundant data paths. With the addition of file-sharing software, SANs also allow multiple hosts to share consolidated data, dramatically reducing the need to duplicate, move and manage multiple files in a wide variety of data-intensive applications. SANs primarily employ FC technology, although more recently iSCSI is increasingly being employed to provide storage access over Internet Protocol, or IP SANs.
Direct Attached Storage
A significant portion of storage systems that do not require the benefits of a scalable networked storage infrastructure are based on a DAS architecture attached directly to a server. Such storage is typically used to create a large data storage attached to a single server that is then shared or accessed over a general purpose LAN as opposed to a dedicated storage network. Newer clustered file systems for example are often based on large arrays of networked servers that each have a local set of disks, or a RAID disk set, as their local data storage. These local DAS RAID arrays can range from several disks housed inside the server housing and controlled by a local RAID controller adapter installed inside the server, up to larger RAID arrays connected to the server via a local high speed dedicated storage link. RAID arrays inside the servers typically require a dedicated RAID host bus adapter that interfaces multiple disk drives to the host computer bus to provide a high performance disk array with RAID level data protection. More recent server implementations are commonly replacing the dedicated RAID host bus adapter with a lower cost built in disk input/output, or I/O, controller function built into the server motherboard, and implementing the RAID software on the host server operating system. This same RAID controller or software is also capable of connecting to external JBOD or SAS RAID arrays via an external SAS cable to provide extremely cost effective, local storage for servers. We intend to serve this market with our acquired RAIDCore product.
Demand for High Performance, Affordable Network Storage Solutions
Customers increasingly demand higher performing, affordable solutions to address expanding storage requirements, interoperability across disparate systems, the need for improved connectivity and rising data management costs. Customers are also demanding open standards architecture and modular systems that allow them to add capacity as needed. These demands have created significant opportunities for network storage system solutions that are affordable and provide high performance. In general, features that were historically only available in high-end storage systems are increasingly required in entry-level and midrange systems.
Reliability
One of the most important requirements for many customers is that their stored data is available, and that the systems upon which they are stored be reliable. For example, Internet-related customers can lose significant revenue for every minute their sites are inoperable and users cannot access data from the website. Similarly, the operations of corporate customers can grind to a halt if important data is lost or unavailable. For these reasons, a storage system’s reliability is often a very critical factor in making a choice among storage systems.
Our Solutions
Hardware Based Storage Solutions
We offer a flexible broad line of networked data storage solutions composed of standards-based hardware and embedded software for open systems environments including SAS, FC and iSCSI storage markets. We
6
Table of Contents
incorporate many of the performance attributes and other features demanded by high-end/data center end-users into our products, at prices that are suitable for the entry-level or midrange markets. Our end-users consist of entry-level and midrange users, requiring cost-effective, easily managed, high-performance, reliable storage systems. Our product lines range from approximately 146 gigabyte, or GB, to complete 108 terabyte, or TB, storage systems. These offerings allow our products to be integrated in a modular building block fashion or configured into a complete storage solution, increasing OEM flexibility in creating differentiated products. Modular products also allow our OEM partners to customize solutions, bundling our products with value-added hardware, software and services.
These products and services are intended to provide users with the following benefits:
| • | Low Total Cost of Ownership and High Return on Investment. Our products combine reliability, flexibility, scalability and manageability into one of the smallest form factors in today’s market. Our product set provides end-users with a low total cost of ownership due to our products’ high reliability, the simplicity of our “plug-and-play” technology, decreased service and support costs and modular system approach that allow end-users to add capacity as needed. The modular nature of our products addresses our end-users’ desire for a storage solution that does not require a large, upfront investment in a monolithic structure with unused capacity. In addition, we believe that our R/Evolution and SANnet II storage systems are among the most space-efficient in the storage industry, maximizing the utilization of our customers’ limited space and significantly reducing their costs. By extending and leveraging our customers’ installed storage system and architecture, we are able to provide solutions that offer both a lower total cost of ownership and a higher return on investment. |
| • | Modular Scalability. Our products are designed using a single cohesive modular architecture that allows customers to size and configure storage systems to meet their specific requirements or storage network type. This modular architecture also allows customers to easily expand and, in some cases, reconfigure a system as their needs change, permitting them to extend the useful life of, and better utilize, their existing systems. |
| • | Reliability. We believe that high reliability is essential to our customers due to the critical nature of the data being stored. We offer high reliability in our product lines and integrate the latest in technological advances to meet expanding market opportunities. We design redundancy, high reliability, high performance and ruggedness into our R/Evolution and SANnet II storage systems. Redundant components have the ability to be replaced while the system is online without interrupting network activity. All of our SANnet II and 5730 disk array products currently offered are certified to operate under extreme climatic and other harsh operating conditions without degradation in reliability or performance, as attested to with the NEBS Level 3 and MIL-STD-810F certifications. Our R/Evolution product family is targeted at the general purpose market without compromising our high reliability standards. |
| • | High-end performance attributes and features. Our R/Evolution products are enclosed in a compact two unit high chassis which accommodates up to 12 3.5” disk drives or 24 2.5” disk drives in the array. Arrays can be configured from 876 GB for entry-level Series 2000 products to 108 TB for the Series 5000 midrange products. Customers can intermix SAS and SATA II drives in the same enclosure offering a multitude of configuration options that provide greater flexibility to end users that wish to store different performance profiles of data in the same physical array. Additionally, our R/Evolution products currently feature the industry’s only unified product architecture which utilizes a common RAID controller architecture from the entry-level to the midrange. |
| • | Open Systems, Multi-Platform Support. As an independent provider of storage products, we are well positioned to provide storage solutions on a variety of platforms and operating systems, including Linux, HP-UX, Solaris and Windows. Our product lines support access to data by multiple servers using different operating systems simultaneously. This multi-platform compatibility allows customers to standardize on a single storage system that can readily be reconfigured and redeployed at minimal cost as the customer’s storage architecture changes. |
7
Table of Contents
| • | Manageability. The ability to manage storage systems, particularly through software, is a key differentiator among storage vendors. RAIDar (TM) and SANscape(R), our storage management software for R/Evolution and SANnet II products, respectively, enable customers to more easily manage and configure their storage systems and respond to their changing system requirements. |
| • | Data Management Software. We introduced our AssuredFamily of data management services, or DMS, in 2007 in conjunction with the launch of our R/Evolution product family. As part of our AssuredFamily, AssuredSnap(TM) enables point in time snapshots of data for usage in realtime backups, data mining and disaster avoidance. AssuredCopy(TM) enables users to create a clone copy of data at any point in time. We expect to continue to expand our portfolio of DMS available for our R/Evolution based products. |
Stand Alone Storage Software
Through our acquisition of Ciprico’s RAIDCore assets in September 2008, we now offer a high performance, feature rich, host-based RAID stack that can be included as a key ingredient of an entry-level or mid-level enterprise class server built by OEMs or SIs. RAIDCore provides a cost effective solution for standard Windows and Linux servers that utilizes existing built in SATA or SAS I/O capabilities of motherboards or simple storage I/O adapters to replace expensive dedicated hardware RAID adapter solutions.
Through our acquisition of Cloverleaf Communications, we believe we will be able to address some substantial storage management issues facing systems administrators in corporations and governments worldwide. The Cloverleaf family of Intelligent Storage Networking (iSN™) products deliver the following:
| • | Simplified Heterogeneous Storage Management. The iSN™ provides complete storage ecosystem management using a unified set of management tools so IT personnel can do more with the same resources. |
| • | Business Continuity. The iSN™ delivers data protection through snapshots, virtual replicas and mirroring. Our long-haul communications layer supports policy-based Recovery Point Objective (RPO) and Recovery Time Objective (RTO) quality of service at the globally distributed geographical scale. |
| • | Scaling and Maximizing Assets. The iSN™ offers virtualization and thin provisioning, any-to-any, non-disruptive data migration and tiered storage. |
Ultimately, we believe the iSN™ can simplify data center management, eliminate downtime and cut storage costs, enabling companies to work faster, smarter and more cost effectively.
Our Strategy
Our first objective is to return to profitability through our core business of selling entry and mid level storage arrays through OEMs and more recently through OSPs. Second, we want to scale this core storage hardware business, taking advantage of the operating leverage it affords as a lot of the cost structure is relatively fixed, and capture an increasing share of the open systems storage solution market while maintaining reasonable profit margins. Third, we want to leverage the foundation and customer and channel relationships provided by this core storage hardware business and build a higher margin software business. Our strategy for the storage hardware business includes the following:
| • | Utilize indirect sales channels. We have adopted an indirect sales model to access end-user markets primarily through our OEM, OSP, VAR and SI partners. This allows us to benefit from our channel partners’ extensive direct and indirect distribution networks, installed customer bases and greater sales, marketing and global service and support infrastructures. The costs associated with a direct worldwide sales force are extensive. By leveraging the sales networks of our partners, we can manage our sales and marketing costs at much lower levels. In addition, we encourage our partners to provide direct support and service to end-users. |
8
Table of Contents
| • | Outsource manufacturing and service operations. We outsource substantially all of our manufacturing operations, which we believe allows us to reduce our manufacturing infrastructure, enhance working capital and improve margins. |
| • | Focus on existing customers and develop new customer relationships. We have entered into OEM agreements with HP, NetApp, Motorola, General Dynamics, Lockheed Martin, FTS, Sun, NEC, Sepaton, Inc., or Sepaton, and Stratus Technologies, or Stratus. We intend to focus on expanding our relationships with our existing channel partners and to continue seeking additional OEM relationships with other industry leaders to sell current products and expand the number of products offered to existing OEM partners to enable them to address new markets. |
| • | Grow and extend technology leadership. We view our core competencies as the research, design and engineering of modular open storage systems and data protection for enterprise servers. We believe that focused research and development on advanced, cost effective storage technologies is critical to our ongoing success. We intend to continue to develop and integrate high-end features into our products in order to offer more complete storage solutions and enhance our existing products to benefit our channel partners’ efforts to increase sales. |
| • | Leverage our R/Evolution architecture. We developed our R/Evolution architecture as a foundational element of our R/Evolution modular storage arrays. This modular architecture allows us to quickly develop and bring to market new products based on this foundation. We intend to focus and unify our development efforts on this approach, which we believe offers a competitive time to market advantage to us. In particular, we intend to utilize R/Evolution to continually extend the feature sets of both our entry-level and midrange solutions and build a comprehensive set of software based features that offer our customers increased levels of value and differentiation. |
| • | Quickly adopt new standards. We strive to introduce products that are first to market. For example, in January 2009 we introduced the first two unit high, 24 drive 2.5” small form factor disk RAID array that supported mainstream SAS, SATA and SSD drives. We believe our highly modular architecture will allow us to quickly adopt newer standards such as 8G FC, 10G iSCSI and FCoE. In addition, our RAIDCore enterprise RAID stack for Windows and Linux servers allow us to quickly adopt and migrate to next generation Intel and AMD class server architectures due to its highly modular architecture and approach. |
| • | Pursue strategic alliances, partnerships and acquisitions. We plan to continue to evaluate and selectively pursue strategic acquisitions, alliances and partnerships and other strategic alternatives that are complementary to our business. We believe that growth of the network storage market will create additional opportunities to expand our business. In some cases, we believe the most efficient pursuit of these opportunities may be through partnerships and relationships that allow us to leverage our existing products, core competencies and channels while capitalizing on products, technologies and channels that may be available through potential strategic partners. |
Our storage software business is in its nascent phase. Our strategy includes the following:
| • | Expand our total available market. With our acquisitions of both RAIDCore and NAS assets in September 2008 and Cloverleaf in 2010, we intend to expand our available market by extending our reach into server internal storage and entry-level NAS, as well as storage software opportunities. We expect the recent acquisition of Cloverleaf could significantly increase our target market. |
| • | Leverage existing customer relationships and sales channels described above. We plan to sell our standalone software solutions through the same channels as we do our hardware storage products e.g. OEMs and OSPs. |
| • | Introduce heterogeneous storage virtualization features currently available for very large and complex environments to less complex operating environments. The iSN™ product purchased through the acquisition of Cloverleaf currently has a robust set of features that includes thin provisioning, automated tiered provisioning and extensive data replication capabilities including snapshots, volume |
9
Table of Contents
| copy, split mirroring, continuous data protection as well as asynchronous and synchronous replication. We believe that we can introduce many of these software features to entry-level and mid-market customers and compete effectively on a feature and total cost of ownership basis with our competitors in this market. |
Our Products
We design our family of open systems storage hardware and software products with the reliability, flexibility and performance necessary to meet IT managers’ needs for easily scalable cost effective solutions. We currently offer storage systems in FC, SCSI, iSCSI, SAS and SATA technologies with DAS and SAN configurations. We also offer enterprise class RAID software for industry standard Windows and Linux servers, as well as storage management applications, which can manage any one or all of our storage system configurations. In addition, performance enhancing and DMS software is sold bundled with our storage systems or licensed separately to OEM customers, including AssuredSnap and AssuredCopy.
Our 5730 product is NEBS Level 3 certified and meets carrier class standards for telecommunications equipment, including storage products. There are three levels of NEBS specifications. The most rugged and reliable equipment is rated carrier-class NEBS Level 3. The NEBS standards mandate a battery of tests designed to simulate the extreme conditions resulting from natural or man-made disasters and cover a range of product requirements for operational continuity. MIL-STD-810F is a military standard created by the United States Government. It involves a range of tests used to measure the reliability of equipment in extreme conditions, including physical impact, moisture, vibration and high and low temperatures. These standards address system ruggedness and reliability, which are important requirements for end-users, particularly those in these telecommunications and government sectors.
Our primary products include the following:
Storage Systems Hardware
| Product Line |
Description |
General Availability |
Capacity |
Target |
Features | |||||
| 2730 |
2 unit high, 12-56 SAS or SATA drives, 4 Gb FC DAS and SAN storage |
3Q06 | Up to 56 TB using 1 TB SATA drives | Entry-level | Complete SAN solution in a single enclosure, scalable performance and capacity for general purpose applications. | |||||
| 2730T |
2 unit high, 12-56 SAS or SATA drives, 4 Gb FC DAS and SAN storage |
2Q07 | Up to 56 TB using 1 TB SATA drives | Entry-level | Complete SAN solution with enhanced performance in a single enclosure, scalable performance and capacity for general purpose applications. | |||||
| 2722 |
2 unit high, 24-96 SAS, SATA or SSD drives, 4 Gb FC DAS and SAN storage |
1Q09 | Up to 48TB using 500 GB drives | Enhanced entry-level small form factor storage |
Complete SAN solution in a single enclosure, scalable performance and capacity for high density and low power applications. | |||||
| 2732 |
2 unit high, 12-96 SAS, SATA or SSD drives, 4 Gb FC DAS and SAN storage |
3Q09 | Up to 192TB using 2TB SATA drives | Enhanced entry-level |
Complete SAN solution in a single enclosure, scalable performance and capacity for high density and low power applications. | |||||
10
Table of Contents
| Product Line |
Description |
General Availability |
Capacity |
Target |
Features | |||||
| 2530 |
2 unit high, 12-56 SAS or SATA drives, 3 Gb SAS DAS and SAN storage |
3Q08 | Up to 56 TB using 1 TB SATA drives | Entry-level | Complete DAS solution with enhanced performance in a single enclosure, scalable performance and capacity for general purpose applications. | |||||
| 2522 |
2 unit high, 24-96 SAS or SSD drives, 3 Gb SAS DAS storage |
1Q09 | Up to 48GB using 500GB drives | Entry-level small form factor storage | Complete DAS solution in a single enclosure, scalable performance and capacity for high density and low power applications. | |||||
| 2532 |
2 unit high, 24-96 SAS, SATA or SSD drives, 3 Gb SAS DAS storage |
3Q09 | Up to 192TB using 2TB drives | Enhanced entry-level |
Complete DAS solution in a single enclosure, scalable performance and capacity for high density and low power applications. | |||||
| 2330 |
2 unit high, 12-56 SAS or SATA drives, 1 Gb iSCSI SAN storage |
4Q07 | Up to 56 TB using 1 TB SATA drives | Entry-level storage | Complete SAN solution in a single enclosure, scalable performance and capacity for general purpose applications. | |||||
| 2322 |
2 unit high, 24-96 SAS or SSD drives, 3 Gb SAS DAS storage |
3Q09 | Up to 48GB using 500GB Drives | Entry-level storage | Complete SAN solution in a single enclosure, scalable performance and capacity for high density and low power applications. | |||||
| 2332 |
2 unit high, 24 SAS, SATA or SSD drives, 1 Gb iSCSI SAN storage |
3Q09 | Up to 192TB using 2TB drives | Enhanced entry-level |
SAS expansion unit for 2722 or 2522. | |||||
| 2122 |
2 unit high, 24 SAS, SATA or SSD drives, 3 Gb SAS JBOD interface | 1Q09 | Up to 48TB using 500GB drives | Entry-level small form factor storage | SAS expansion unit for 2722 or 2522. | |||||
| 2130 |
2 unit high, 12 SAS, or SATA drives, 3 Gb SAS JBOD interface | 1Q09 | Up to 192TB using 2 TB SATA drives | Entry-level small form factor storage | SAS expansion unit for 2330, 2332, 2530, 2532, 2730, 2730T and 2732. | |||||
| 5730 |
2 unit high, 12-108 SAS or SATA drives, 4 Gb FC DAS and SAN storage |
4Q07 | Up to 108 TB using 1 TB SATA drives | Midrange storage | Complete SAN solution in a single enclosure, scalable performance and capacity for general purpose applications. | |||||
| 3720 |
2 unit high, 24-144 SAS or SSD drives, 8 Gb FC SAN storage |
1Q10 | Up to 72TB using 500GB drives | Entry-level small form factor storage | Complete SAN solution in a single enclosure, scalable performance supporting rapid data access and replication. | |||||
11
Table of Contents
| Product Line |
Description |
General Availability |
Capacity |
Target |
Features | |||||
| 3730 |
2 unit high, 12-144 SAS, SATA or SSD drives, 8 Gb FC SAN storage |
1Q10 | Up to 288TB using 2TB drives | Enhanced entry-level |
Complete SAN solution in a single enclosure, scalable performance supporting rapid data access and replication. | |||||
| 3920 |
2 unit high, 24-144 SAS or SSD drives, 8 Gb FC plus 1Gb iSCSI Hybrid SAN storage |
1Q10 | Up to 72TB using 500GB drives | Entry-level small form factor storage | Complete SAN solution in a single enclosure, scalable performance supporting rapid data access and offsite replication. | |||||
| 3930 |
2 unit high, 24-144 SAS or SSD drives, 8 Gb FC plus 1Gb iSCSI Hybrid SAN storage |
1Q10 | Up to 288TB using 2TB drives | Enhanced entry-level |
Complete SAN solution in a single enclosure, scalable performance supporting rapid data access and offsite replication. | |||||
| 3120 |
2 unit high, 24 SAS, or SSD drives, 6 Gb SAS JBOD interface | 1Q10 | Up to 72TB using 500GB drives | Entry-level small form factor storage | SAS expansion unit for the 3720 and 3920. | |||||
| 3130 |
2 unit high, 12 SAS, SATA, or SSD drives, 6 Gb SAS JBOD interface | 1Q10 | Up to 288TB using 2TB drives | Enhanced entry-level |
SAS expansion unit for the 3730 and 3930. | |||||
Storage Software
| Product |
Description |
General Availability |
Capacity |
Target |
Features | |||||
| Embedded Software and Tools |
||||||||||
| AssuredSnap |
DMS | 3Q06 | N/A | Entry-level and midrange storage |
Snapshot technology for backup, data mining and disaster recovery. | |||||
| AssuredCopy |
DMS | 3Q06 | N/A | Entry-level and midrange storage |
Create volume copies or backups of disk volumes to prevent data loss or corruption. | |||||
| AssuredRemote |
DMS | 1Q10 | N/A | Entry-level | Array-based remote replication software for data protection and disaster recovery. | |||||
| RAIDar |
Storage management software |
1Q00 | N/A | Entry-level and midrange storage |
Graphical and command line consoles with diagnostics, monitoring and reporting. | |||||
| RAIDar 2.0 |
Enhanced Storage management software |
1Q09 | N/A | Entry-level and midrange storage |
Enhanced wizard based graphical and command line consoles with diagnostics, monitoring and reporting. | |||||
12
Table of Contents
| Product Line |
Description |
General Availability |
Capacity |
Target |
Features | |||||
| Standalone Software |
||||||||||
| RAIDCore |
Enterprise server RAID software stack |
1Q09 | N/A | Entry level and midrange servers | Enterprise class host RAID stack for Windows and Linux. | |||||
| iSN™ |
Enterprise heterogeneous storage virtualization software |
1Q10 | N/A | Enterprise | Heterogeneous storage virtualization platform which provides management of up to 2PB of storage using advanced data migration, thin provisioning and tiered storage capabilities. | |||||
R/Evolution Modular Storage Architecture. This family of new offerings focuses on the incorporation of SAS/SATA drive technology with a variety of front-end host interfaces. These products are focused on the general purpose market initially and introduce several technological advancements including EcoStor™ (elimination of batteries in a RAID cache management system) and SimulCache™ (high-speed mirrored cache coherency). We believe we were the first RAID vendor to offer mixed SAS, SATA or SSD disk drives in the same two unit high, 12 (2U/12) drive enclosure in a highly reliable storage system. With the introduction of the new 24 drive small form factor drive products (2U/24), we believe we are also the first to offer such systems with full embedded RAID and data protection capability.
| • | 2730. Our 2730 product, our first R/Evolution architecture product, is a general purpose high performance 2U/12 storage array offering up to four 4 Gb FC ports host connectivity and any combination of up to 56 SAS and SATA disk drives. It can be deployed in both a SAN and DAS environment. |
| • | 2730T. Our 2730 Turbo product, based on our R/Evolution architecture, is a general purpose high performance 2U/12 storage array offering up to four 4 Gb FC ports host connectivity and any combination of up to 56 SAS and SATA disk drives. It can be deployed in both a SAN and DAS environment. |
| • | 2722. Our 2722 product, based on our R/Evolution architecture product, is a general purpose high performance 2U/24 storage array offering up to four 4 Gb FC ports host connectivity and any combination of up to 96 SAS and SATA disk drives. It can be deployed in both a SAN and DAS environment. |
| • | 2732. Our 2732 product, based on our R/Evolution architecture product, is a general purpose high performance 2U/12 storage array offering up to four 4 Gb FC ports host connectivity and any combination of up to 96 SAS, SATA and SSD disk drives. It can be deployed in both a SAN and DAS environment. |
| • | 2530. Our 2530 product, based on our R/Evolution architecture product, is a general purpose high performance storage array offering up to four 3 Gb SAS ports host connectivity and any combination of up to 56 SAS and SATA disk drives. It can be deployed in a DAS environment. |
| • | 2522. Our 2522 product, based on our R/Evolution architecture product, is a general purpose high performance storage array offering up to four 3 Gb SAS ports host connectivity and any combination of up to 96 SAS and SATA disk drives. It can be deployed in a DAS environment. |
| • | 2532. Our 2532 product, based on our R/Evolution architecture product, is a general purpose high performance 2U/12 storage array offering up to four 3 Gb SAS ports host connectivity and any combination of up to 96 SAS, SATA and SSD disk drives. It can be deployed in a DAS environment. |
13
Table of Contents
| • | 2332. Our 2332 product, based on our R/Evolution architecture product, is a general purpose high performance 2U/12 storage array offering up to four 1 Gb iSCSI ports host connectivity and any combination of up to 96 SAS, SATA and SSD disk drives. It can be deployed in IP SAN environments. |
| • | 2112. Our 2122 product, based on our R/Evolution architecture product, is a general purpose high performance 2U/24 JBOD expansion array which can connect via 3 Gb SAS cables to the 2522 or 2722 RAID arrays. |
| • | 2330. Our 2330 product, based on our R/Evolution architecture product, is a general purpose high performance storage array offering up to four 1 Gb iSCSI ports host connectivity and any combination of up to 56 SAS and SATA disk drives. It can be deployed in IP SAN environments. |
| • | 2332. Our 2332 product, based on our R/Evolution architecture product, is a general purpose high performance 2U/12 storage array offering up to four 1 Gb iSCSI ports host connectivity and any combination of up to 96 SAS, SATA and SSD disk drives. It can be deployed in IP SAN environments. |
| • | 2130. Our 2130 product, based on our R/Evolution architecture product, is a general purpose high performance 2U/12 JBOD expansion array which can connect via 3 Gb SAS cables to the 2330, 2332, 2530, 2532, 2730,2 730T or 2732 RAID arrays. |
| • | 3720. Our 3720 product, based on our R/Evolution architecture product, is a general purpose high performance 2U/24 storage array offering up to four 4 Gb fibre channel ports host connectivity and any combination of up to 144 SAS and SSD disk drives. It can be deployed in both a SAN and DAS environment. |
| • | 3730. Our 3730 product, based on our R/Evolution architecture product, is a general purpose high performance 2U/12 storage array offering up to four 4 Gb fibre channel ports host connectivity and any combination of up to 144 SAS, SATA and SSD disk drives. It can be deployed in IP SAN environment. |
| • | 3920. Our 3920 product, based on our R/Evolution architecture product, is a general purpose high performance 2U/24 storage array offering up to four 4 Gb fibre channel and an additional 4 iSCSI ports for flexible host connectivity and any combination of up to 144 SAS and SSD disk drives. It can be deployed in both a SAN and DAS environment. |
| • | 3930. Our 3930 product, based on our R/Evolution architecture product, is a general purpose high performance 2U/12 storage array offering up to four 4 Gb fibre channel and an additional 4 iSCSI ports for flexible host connectivity and any combination of up to 144 SAS, SATA and SSD disk drives. It can be deployed in both a SAN and DAS environment. |
| • | 3120. Our 3120 product, based on our R/Evolution architecture product, is a general purpose high performance 2U/24 JBOD expansion array which can connect via 6Gb SAS cables to the 3720 or 3920 RAID arrays. |
| • | 3130. Our 3130 product, based on our R/Evolution architecture product, is a general purpose high performance 2U/12 JBOD expansion array which can connect via 6Gb SAS cables to the 3730 or 3930 RAID arrays. |
| • | 5730. Our 5730 product, our first midrange based R/Evolution architecture product, is a general purpose high performance storage array offering up to eight 4 Gb FC ports host connectivity and any combination of up to 108 SAS and SATA disk drives. It can be deployed in both a SAN and DAS environment. |
14
Table of Contents
Software. We develop application software technologies and products that are complementary to our overall storage solutions. Our software supports widely used open systems platforms, including Linux, Unix and Windows. We also offer a web-based graphical user interface, or GUI, (RAIDar) for our R/Evolution modular storage products for array management for our Series 2000 and 5000 products. AssuredSnap and AssuredCopy are data management services offerings providing rollback and roll forward manipulation of point in time data snapshots and volume clone or copy of data, respectively.
| • | AssuredSnap. AssuredSnap is our DMS software that introduces point in time snapshot technology into the R/Evolution product family. AssuredSnap provides the ability to create point-in-time copies or backups of disk volumes with instant restoration of data to any captured point in time snapshot. Since AssuredSnap only copies data that has changed to disk it can virtually eliminate backup windows. The AssuredSnap implementation is not only fast, but also reduces the size of snapshots by storing only a single instance of changed blocks. This technology is unique in the market and allows IT managers increased backup efficiency and flexibility. |
| • | AssuredCopy. AssuredCopy is our DMS software that introduces data cloning or volume copy services into the R/Evolution product family. AssuredCopy leverages snapshot technology to create complete, physically independent copies of master or snapshot volumes. Once complete, volume copies can be mounted to any host system for read-only or read-write access. As both a data protection and a data management technology, AssuredCopy can be used to support applications such as backup and data recovery, data mining, decision support, data distribution and migration, application development and test. AssuredCopy protects against accidental or malicious loss or corruption of data, and provides additional protection against complete volume failure. |
| • | AssuredRemote. AssuredRemote is our DMS software that introduces remote replication into the R/Evolution product family. AssuredRemote leverages snapshot technology and then transfers them to a paired array over either Fiber Channel or Ethernet to for enhanced data protection and disaster recovery. |
| • | RAIDar. RAIDar is a GUI used for configuring, monitoring, error reporting and running diagnostics for our 2730 RAID systems. Our OEM customers have the option of customizing their own GUI with the purchase of a customization tool kit. This tool kit enables our OEM customers to private label the GUI quickly and cost efficiently. RAIDar 2.0 adds greater end user ease of use capability in the form of simple configuration wizards. |
| • | RAIDCore. RAIDCore is a high performance, feature rich, host based RAID stack for Windows and Linux based enterprise servers. Our OEM and SI customers typically integrate RAIDCore as an ingredient of their entry-level Intel or AMD based server products. It has the ability to replace a dedicated hardware RAID adapter in many applications by utilizing the built in disk I/O ports built into modern server hardware. In most instances, RAIDCore is private labeled and branded with the OEM’s own brand. |
| • | iSN™. iSN™ is a heterogeneous storage virtualization product that provides a multi-vendor storage solution for growing enterprise and high performance computing needs. Providing both unified storage and advanced storage virtualization features, up to 2PB of storage can be managed and protected both locally and remotely, supporting both network attach server file and SAN under one integrated storage management interface. |
Sales and Marketing
Our products and services are sold worldwide to facilitate server and SAN storage implementations, primarily through OEMs and supplemented by SIs, distributors and OSPs. We rely on multiple channels to reach end-user customers that range in size from small businesses to government agencies and large multinational corporations. We maintain a sales and marketing organization operating out of our office in Longmont, Colorado, with regional offices in Germany, Japan and the United Kingdom as well as several smaller localized field sales offices throughout North America. Generally, our customers have no minimum purchase requirements and have certain rights to extend, delay or cancel shipment of their orders without penalty.
15
Table of Contents
OEMs
Our primary distribution channel is through OEMs. We have several OEM relationships and are actively developing new ones. Currently our significant OEM partners include, among others, HP, NetApp and Sun. OEMs generally resell our products under their own brand name and typically assume responsibility for marketing, sales, service and support. Our OEM relationships allow us to sell into geographic or vertical markets where each OEM has significant presence. For the years ended December 31, 2007, 2008 and 2009 OEM sales represented 86.9%, 90.6% and 89.3% of our net revenue, respectively. Sales to HP accounted for 0.8%, 32.6% and 51.4% of our net revenue for the years ended December 31, 2007, 2008 and 2009, respectively. Sales to NetApp accounted for 12.5%, 23.2% and 24.7% of our net revenue for the years ended December 31, 2007, 2008 and 2009, respectively. Sales to Sun accounted for 63.2%, 24.6% and 4.4% of our net revenue for the years ended December 31, 2007, 2008 and 2009, respectively. We do not expect to generate a significant amount of net revenue from Sun in future periods.
Indirect Channels
Most of our non-customized products are sold in conjunction with smaller OEMs, distributors, VARs and SIs, who work closely with our sales force to sell our products to end-users. Our indirect channel partners resell our products either under the Dot Hill brand or under their own or generic R/Evolution brand name, and share responsibility with us for marketing, sales, service and support. We believe indirect channel sales represent an attractive growth opportunity and intend to expand the scope of our indirect channel sales efforts by continuing to actively pursue additional indirect channel partners, both domestically and internationally.
Marketing
We support our OEM and other indirect channels with a broad array of marketing programs designed to promote our products and technology leadership, attract additional channel partners and generate end-user demand. Our product marketing team focuses on product strategy, product development roadmaps, the new product introduction process, product lifecycle management, demand assessment and competitive analysis. The product marketing team also ensures that product development activities, product launches, channel marketing program activities and ongoing demand and supply planning occur on a well-managed, timely basis in coordination with our development, manufacturing and sales groups, as well as our sales channel partners. The groups work closely with our sales and research and development groups to align our product development roadmap to meet key customer and channel technology requirements.
Our Relationships with Key OEMs
Our OEM channel partners currently include, among others, HP, NetApp, Motorola, Lockheed Martin, FTS, Sun, NEC, Sepaton and Stratus. We believe that our product sales through these market leaders strengthen our credibility in the marketplace, validate our technology and enable us to sell our products to a much broader customer base. In addition to expanding and enhancing our relationships with certain of our OEM customers and other channel partners, we intend to seek additional OEM customers as a part of our overall strategy.
In January 2008, we amended our agreement with HP to allow for sales to additional divisions within HP. Our products are primarily sold within HP’s MSA 2000 product family. Sales to HP increased significantly during 2008 and increased again in 2009 primarily as a result of the successful launch and market acceptance of the HP MSA 2000 product in 2008 as well as the successful launch of follow-on products in 2009. The agreement with HP does not contain any minimum purchase commitments and the term of the agreement was extended from one to five years.
Pursuant to our Development and OEM Supply Agreement with NetApp, we are designing and developing general purpose disk arrays for a variety of products to be sold under private label by NetApp. The initial term of the agreement is three years after first general availability customer shipment and after this initial period the
16
Table of Contents
agreement renews automatically for a subsequent 12 months unless terminated by either party. We started shipping products for general availability to NetApp in September 2007 and net revenue from NetApp increased significantly during 2008. Net revenues from NetApp decreased slightly in 2009 primarily as a result of economic conditions.
In 2002, we entered into a three-year OEM agreement with an annual renewal to provide our SANnet II and SANscape products for private label sales by Sun. This agreement was extended until January 2011. Sun has announced that the products we sell to them will no longer be available after specific periods in 2009. Consequently, we experienced a significant decline in sales to Sun in 2009 and we do not expect to generate significant net revenue from Sun in future periods.
In 2006, we entered into a Master Purchase Agreement with FTS. Under the agreement, we co-develop storage solutions utilizing key components and patented technologies from Dot Hill. The initial agreement term is five years and does not include a minimum purchase requirement. We have experienced a decline in net revenue from FTS as a result of its decision to internally source the products we sell to them. Net revenues from FTS approximated 5% of our total net revenues in 2009. We expect net revenue from FTS to continue to decline in future periods as a result of this transition.
Our agreements with our OEM partners do not contain any minimum purchase commitments, do not obligate our OEM partners to purchase their storage solutions exclusively from us and may be terminated at any time upon notice from the applicable partner.
Customer Service and Support
We recognize that providing comprehensive, proactive and responsive support is essential to maintaining and growing customer satisfaction, fostering customer loyalty and securing repeat business. We provide comprehensive 24 hours a day, seven days a week, 365 days a year global customer service and support, either directly or through third-party service providers, aimed at simplifying installation, minimizing usage problems, maximizing system availability and streamlining administration. Through direct and third-party service providers, we maintain a global network of professional engineers and technicians who provide telephonic technical support in various languages from strategically located global response centers on a 24-hour, seven-day basis. In addition, we have the ability to provide four hour on-site service response as required on a global basis. We also offer all of our customers’ access to SANsolve, our web-hosted interactive support knowledge base that gives our customers the ability to find answers to technical questions through our Customer Resource Center as well as initiate and track all support requests.
We have also taken steps to better align our service and support structure with our indirect sales model, including the following:
| • | Encouraged OEMs to provide support and service directly to end-users. For example, HP, Sun, FTS and NetApp provide all but the final level of support and service to their end-users. |
| • | Identified key areas for further development such as product certification/recertification training for our partners. In addition, we offered expanded array support services for a fee through our professional services offering. |
| • | Established authorized service providers. |
We plan to expand our service offerings, including onsite support contracts and professional services. These services will be performed either directly by us, or through the increased use of third-party service providers. We also are capitalizing on a growing population of product whose initial warranty expired by providing cost effective extended warranty and out-of-warranty repair services.
17
Table of Contents
Research and Development
Our research and development team has been focused on developing innovative storage products, storage management software, storage management application software for the open systems market and the integration of our storage controller technology into our designed storage systems. In addition we have been working on the integration of our newly acquired software RAIDCore technology in open system servers to allow us to address segments of the market that we did not previously have access to. We have a history of industry firsts, including the first successfully commercialized hot-swappable SCSI disk array and RAID storage system for the UNIX environment and the first NEBS Level 3 certified and MIL-STD-810F tested line of storage systems. We were first to market and have patented SimulCache which increases the write performance in a dual controller array. We were first to market and have patented EcoStor into our R/Evolution products, which eliminate batteries in the storage system, hence decreasing service costs while ensuring permanent data integrity in the event of power failure. We also believe that we were one of the first in the industry to be able to reliably intermix SAS and SATA drives in the same storage system without caveat. This has enabled us to build products that can optimize capacity and performance applications within the same storage array. We recently launched the first external RAID product using 24 2.5” drives in a two unit high chassis form factor. We are focused on continuously developing products that meet changing customer needs and anticipating and proactively responding to highly evolving technology in a timely and cost-effective manner. We also generally design and develop our products to have a modular architecture that can be scaled to meet customer needs and modified to respond to technological developments in the open systems computing environment across product lines. We are actively working on next generation technologies in both storage hardware protocols and storage software applications.
Our areas of expertise include Linux, Unix and Windows driver and system software design, SAN storage resource management software design, storage system design and integration, RAID controller design and technology, RAID firmware development, data management software development, storage enclosure design and high-speed data interface design. We are currently focusing development efforts on our next-generation family of storage systems and on our software products. Projects include the launch of additional members of the R/Evolution family of systems, improvements to our storage software offerings and next generation high-speed solutions that will take advantage of the latest transports and technologies.
Our research and development activities are directed by individuals with significant expertise and industry experience. Our total research and development expenses were $22.6 million, $28.7 million and $28.1 million for the years ended December 31, 2007, 2008 and 2009, respectively. We have five worldwide technology development centers located in Longmont, Colorado, Minneapolis, Minnesota, Carlsbad, California, Hyderabad, India, and Petach Tiqwa, Israel due to our recent acquisition of Cloverleaf in 2010. The Minneapolis development center focuses on RAIDCore development and the Petach Tiqwa development center focuses on iSN™.
Manufacturing and Suppliers
We outsource substantially all of our manufacturing to third-party manufacturers in order to reduce sales cycle times and manufacturing infrastructure, enhance working capital and improve margins by taking advantage of the third parties’ manufacturing and procurement economies of scale. We have historically outsourced substantially all of our manufacturing operations to Flextronics International Limited, or Flextronics. In February 2007, we entered into a manufacturing agreement with MiTAC, a leading provider of contract manufacturing and original design manufacturing services, and SYNNEX, a leading global IT supply chain services company. Under the terms of the agreement, MiTAC supplies us with manufacturing, assembly and test services from its facilities in China and SYNNEX provides us with final assembly, testing and configure-to-order services through its facilities in Fremont, California. We believe that the agreement with MiTAC and SYNNEX facilitates our strategic product initiatives, helps to expand our global capabilities and reduces our manufacturing costs. We began shipping products under the MiTAC and SYNNEX agreement in 2007. All of our Series 2000 and Series 5000 R/Evolution products are shipping from these manufacturing partners.
18
Table of Contents
In September 2008, we entered into a manufacturing agreement with Foxconn. Under the terms of the agreement, Foxconn supplies us with manufacturing, assembly and test services from its facilities in China and final integration services including final assembly, testing and configure-to-order services, through its worldwide facilities. The agreement provides for an initial three-year term that is automatically renewed at the end of such three-year term for additional one-year terms unless and until the agreement is terminated by either party. Foxconn began manufacturing products for us in July 2009 and we began shipping products for general availability under the Foxconn agreement during the second half of 2009. We expect Foxconn to manufacture a larger percentage of our products in 2010.
Intellectual Property
Our success depends significantly upon our proprietary technology. We have received registered trademark protection for the marks SANnet(R), SANpath(R), SANscape(R), Stratis(R), Dot Hill(R), Dot Hill Systems(R) and the Dot Hill logo. We have attempted to protect our intellectual property rights primarily through copyrights, trade secrets, employee and third party nondisclosure agreements and other measures. We have registered trademarks and will continue to evaluate the registration of additional trademarks as appropriate. We claim common law protection for, and may seek to register, other trademarks. In addition, we generally enter into confidentiality agreements with our employees and with key vendors and suppliers.
As of December 31, 2009, we had been awarded a total of 57 United States patents, 16 of which were awarded in 2009. 49 of these patents generally cover RAID controller and SAM-related technology. In addition, as of December 31, 2009 we had four allowed United States patents, and 37 filed United States patent applications. The patents covering our core technologies expire from 2010 to 2030. If we are unable to protect our intellectual property or infringe intellectual property of a third party, our operating results could be harmed.
In June 2006, we entered into a settlement and license agreement with Crossroads Systems Inc., or Crossroads, which was amended in October 2006 and settled the patent action brought by Crossroads against us and licensed to us the family of patents from which it stemmed. We concurrently entered into an agreement with Infortrend Technology Inc., or Infortrend, under which Infortrend paid for most of the settlement charges as well as most of the royalties on products that we ship that incorporate Crossroads’ controller technology. On products that do not incorporate Infortrend’s controller technology we are solely responsible for payment of royalties to Crossroads.
Competition
The storage market is intensely competitive and is characterized by rapidly changing technology. For storage hardware solutions, we compete primarily against independent storage system suppliers, including EMC Corp., or EMC, Hitachi Data Systems Corp., or Hitachi, Engenio Information Technologies, Inc., a subsidiary of LSI Logic Corp., or LSI, Infortrend, and Xyratex Ltd., or Xyratex. We also compete with traditional suppliers of computer systems, including IBM, Sun and HP, which market storage systems as well as other computer products. For our RAIDCore product we compete primarily with LSI and Adaptec Inc., or Adaptec, and for our iSN™ products we compete primarily with Falconstor Software Inc., or Falconstor, Compellent Technologies Inc., or Compellent, and LSI.
Many of our existing and potential competitors have longer operating histories, greater name recognition and substantially greater financial, technical, sales, marketing and other resources. As a result, they may have more advanced technology, larger distribution channels, stronger brand names, better customer service and access to more customers than we do. Other large companies with significant resources could become direct competitors, either through acquiring a competitor or through internal efforts. Additionally, a number of public and privately held companies are currently attempting to enter the storage market, some of which may become significant competitors in the future. In the future, it is conceivable that we could compete with some of the original design manufacturers, one of whom is our manufacturing partner today as they develop expertise in chassis design and power and cooling technologies.
19
Table of Contents
We believe the principal competitive factors in the hardware storage systems and software storage solutions markets are:
| • | product performance, features, scalability and reliability; |
| • | price; |
| • | product breadth; |
| • | timeliness of new product introductions; |
| • | interoperability and ease of management; and |
| • | responsiveness to OEMs and customer support. |
We believe that we compete favorably in several of these categories. To remain competitive, we believe we must invest significant resources in developing new products, enhancing our current products and maintaining high quality standards and customer satisfaction.
Employees
As of December 31, 2009, we had 285 full-time employees, of whom 46 were engaged in sales and marketing, 137 in research and development, 50 in manufacturing, 35 in general management and administration and 17 in customer service and support. We have not had a work stoppage among our employees and none of our employees are represented under collective bargaining agreements. We consider our relations with our employees to be good.
Named Executive Officers and Key Employees of the Registrant
| Name |
Age | Position |
Officer or Key Employee Since | |||
| Dana W. Kammersgard(2) |
54 | Chief Executive Officer and President | August 1984(1) | |||
| Hanif I. Jamal(2) |
49 | Senior Vice President, Chief Financial Officer, Treasurer and Corporate Secretary | July 2006 | |||
| James Kuenzel(3) |
56 | Senior Vice President of Engineering | February 2006 | |||
| Ernest Hafersat(3) |
60 | Senior Vice President of Worldwide Manufacturing, Operations and Supply Base Management | March 2008 |
| (1) | In 1999, Artecon and Box Hill merged to form Dot Hill. Artecon was founded in 1984 and Mr. Kammersgard was an officer of Artecon from its inception until the merger, and has been an officer of Dot Hill since that date. |
| (2) | Named Executive Officers. |
| (3) | Key employees. |
All officers are elected by our board of directors and serve at the pleasure of our board of directors as provided in our bylaws.
Dana W. Kammersgard has served as our President since August 2004. In March 2006, Mr. Kammersgard was appointed as our Chief Executive Officer and President. From August 1999 to August 2004, Mr. Kammersgard served as our Chief Technical Officer. Mr. Kammersgard was a founder of Artecon and served as a director from its inception in 1984 until the merger of Box Hill and Artecon in August 1999. At Artecon, Mr. Kammersgard served in various positions since 1984, including Secretary and Senior Vice
20
Table of Contents
President of Engineering from March 1998 until August 1999 and as Vice President of Sales and Marketing from March 1997 until March 1998. Prior to co-founding Artecon, Mr. Kammersgard was the director of software development at CALMA, a division of General Electric Company. Mr. Kammersgard holds a B.A. in Chemistry from the University of California, San Diego.
Hanif I. Jamal has served as our Senior Vice President, Chief Financial Officer and Corporate Secretary since July 2006. Prior to joining Dot Hill, Mr. Jamal served as Vice President and Corporate Treasurer for Gateway Inc. from 2004 to 2006. Prior to joining Gateway in 2002, Mr. Jamal served in a number of leadership positions over 17 years within Hewlett- Packard Company in the customer financing division, HP Technology Finance. Mr. Jamal led HP’s customer financing operations in North America, Latin America and Europe and was also Vice President and General Manager for HP’s Commercial and Consumer Financing Division. In 1998, he established Hewlett-Packard International Bank in Dublin, Ireland, and served as Managing Director through 2000. Jamal holds an MBA from Stanford Graduate School of Business and a Bachelor of Science degree, with Honors, in Management Sciences from the University of Manchester Institute of Science and Technology in the United Kingdom.
James Kuenzel has served as our Senior Vice President of Engineering since February 2006. Mr. Kuenzel joined Dot Hill after leaving Maranti Networks Inc. where he began his tenure in 2002 as Vice President of Engineering and then was appointed to President and Chief Operating Officer. Kuenzel has also held Vice President of Engineering positions at McData Corporation, Cabletron Systems, Inc. and Digital Equipment Corporation. Mr. Kuenzel attended Georgetown University Extension, University of Wisconsin Extension, and holds an A.A. in Electronics from Philco Ford Technical Institute.
Ernest Hafersat has served as our Senior Vice President of Worldwide Manufacturing, Operations and Supply Base Management since November 2008 and previously served as our Vice President of Worldwide Manufacturing Operations and Supply Base Management since March 31, 2008. Mr. Hafersat joined Dot Hill after leaving Western Digital Corporation where he held senior level positions in operations and engineering from 2005 to 2008. Prior to Western Digital, Mr. Hafersat was Vice President, Manufacturing Operations & Program Management for Carrier Access Corp. Previous positions include Vice President, Operations for Vari-l Corp., Vice President/ GM at Read-Rite Corp.- Philippines, Senior Director, Engineering/ NPI at Maxtor Corp. and Director of Engineering at Hyundai Semiconductor-Korea. Mr. Hafersat has overseen operations, supply base management, global supplier quality and engineering for both domestic and international multi-site facilities. His international experience includes China, Pacific Rim countries, Mexico and Costa Rica. Mr. Hafersat has a BSIE/BSEE from Waterbury State Technical University, and attended University of Hartford and Rennsslaer Polytechnic Institute with credits toward an MBA.
21
Table of Contents
| Item 1A. | Risk Factors |
The following sets forth risk factors that may affect our future results. Our business, results of operations and financial condition may be materially and adversely affected due to any of the following risks. We face risks described but not limited to those detailed below. Additional risks we are not presently aware of or that we currently believe are immaterial may also impair our business operations. The trading price of our common stock could decline due to any of these risks. In assessing these risks, you should also refer to the other information contained or incorporated by reference in this annual report on Form 10-K, including our financial statements and related notes.
Recent turmoil in the global economy, credit markets and the financial services industry may negatively impact our revenues, access to capital, our customers’ access to capital and ability to pay for their purchases in a timely manner, and our suppliers’ access to capital and ability to provide us with goods and timely delivery, or willingness to provide credit terms to us.
The current global economic condition could reduce the demand for our products and negatively impact net revenues and operating profit. We are unable to predict changes in general macroeconomic conditions and when, or if, global IT spending rates will be affected and to what degree they will be impacted. Furthermore, even if IT spending rates increase, we cannot be certain that the market for external storage solutions will be positively impacted. If there are future reductions in either domestic or international IT spending rates, or if IT spending rates do not increase, our net revenues, operating results and financial condition may be adversely affected. In addition, the recent economic crisis could also adversely impact our customers, and/or their customers, ability to finance the purchase of storage systems from us or our suppliers’ ability to provide us with product, any of which may negatively impact our business, financial condition and results of operations.
Our smaller OEM customers may not be as well capitalized as, nor do they have the financial resources of, our larger customers. In addition, our sales to all our customers are typically made on credit without collateral. There is a risk that customers will not pay, or that payment may be delayed, because of their liquidity constraints, or because they are awaiting payment from their customers, or other factors beyond our control, which could increase our exposure to losses from bad debts, or increase accounts receivable, and thus reduce cash.
Our third-party manufacturers rely on other third parties to supply key components of our storage products. Some of these components are available only from one or limited sources in the quantities and quality we require. Should any of the component suppliers cease to operate due to the current economic conditions or otherwise, we would have to qualify and locate alternative suppliers. We estimate that replacing key components we currently use in our products with those of another supplier could involve several months of hardware and software modification, which could significantly harm our ability to meet our customers’ orders for our products, damage our customer relationships and result in a loss of sales.
Our manufacturing suppliers provide us with credit terms that have in some cases been negotiated and documented in our manufacturing agreements. The credit terms we receive from these suppliers vary amongst our manufacturing partners but they all provide for adequate credit limits and credit terms. Should any of our manufacturing partners reduce our credit limits or shorten payment terms, due to their inability to purchase credit insurance or due to uncertainty regarding our financial position, our cash resources and working capital could be significantly impacted.
We are dependent on sales to a relatively small number of customers and a disruption in sales to any one of these customers could materially harm our financial results.
Our business is highly dependent on a limited number of OEM customers. For example, sales to HP accounted for 32.6% and 51.4% of our net revenues for the years ended December 31, 2008 and 2009, respectively. In addition, sales to NetApp accounted for 23.2% and 24.7% of our net revenues for the years ended December 31, 2008 and 2009, respectively. Furthermore, sales to Sun accounted for 24.6% and 4.4% of net revenues for the years ended December 31, 2008 and 2009, respectively. We expect HP and NetApp will each
22
Table of Contents
represent greater than 10% of our overall revenues for the year ending December 31, 2010. If our relationships with HP and NetApp or certain of our other OEM customers were disrupted or significantly cut back, we would lose a significant portion of our anticipated net revenue and our business could be materially harmed. We cannot guarantee that our relationship with HP, NetApp or our other OEM customers will expand or not otherwise be disrupted. Factors that could influence our relationship with our significant OEM customers, including HP and NetApp, include:
| • | our ability to maintain our products at prices that are competitive with those of other hardware storage system suppliers; |
| • | our ability to maintain quality levels for our products sufficient to meet the expectations of our OEM customers; |
| • | our ability to produce, ship and deliver a sufficient quantity of our hardware products in a timely manner to meet the needs of our OEM customers; |
| • | our ability to continue to develop and launch new products that our OEM customers feel meet their needs and requirements, with respect to cost, timeliness, features, performance and other factors; |
| • | our ability to provide timely, responsive and accurate customer support to our OEM customers; and |
| • | the ability of our OEM customers to effectively launch, ramp, ship, sell and market their own solutions based on our products. |
Our contracts with our OEM customers do not include minimum purchase requirements and are not exclusive, and we cannot assure you that our relationship with these major customers will not be terminated or will generate significant sales.
None of our contracts with our existing customers, including HP and NetApp, contain any minimum purchasing commitments and our customers may cancel purchase orders at any time, cease making purchases or elect not to renew the applicable contract upon the expiration of the current term. Consequently, our customers generally order only through written purchase orders. Further, we do not expect that future contracts with customers, if any, will include any minimum purchase commitments. Changes in the timing, or volume of purchases by our major customers, could result in lower net revenue. For example, we cannot be certain that our sales to any of our OEM customers will continue at historical levels or will ramp to expected levels. In addition, our existing contracts do not require our OEM customers to purchase our products exclusively or on a preferential basis over the products of any of our competitors. Consequently, to the extent they are not sole sourced, our OEM customers may sell the products of our competitors. The decision by any of our OEM customers to cancel purchase orders, cease making purchases or terminate their respective contracts could cause our net revenues to decline substantially, and our business, financial condition and results of operations could be significantly harmed.
We sell on a purchase order basis, making us subject to uncertainties and variability in demand by our customers, and our component suppliers may make obsolete certain components we incorporate into our products, either of which could decrease revenue and adversely affect our operating results.
We sell to our customers on a purchase order basis rather than pursuant to long-term contracts or contracts with minimum purchase requirements. Consequently, our sales are subject to demand variability by our customers. The level and timing of orders placed by our customers vary for a variety of reasons, including seasonal buying by end-users, the introduction of new technologies and general economic conditions. Customers submitting a purchase order may cancel, reduce or delay their orders. If we are unable to anticipate and respond to the demands of our customers, we may lose customers because we have an inadequate supply of products, or we may have excess inventory, either of which may harm our business, financial position and operating results.
In addition, there are occasions when some of our component suppliers make obsolete certain components that we incorporate into our products. In these situations we may be required to purchase such components on a “last time buy” basis, based on our forecasts of customer demand. If we incorrectly forecast customer demand or
23
Table of Contents
if our OEMs over or under forecast demand, we may have an inadequate supply of products, or we may have excess inventory which may have to be sold in the open market at a deep discount, if at all possible, either of which may harm our business, financial position and operating results.
Our sales cycle varies substantially from customer to customer and future net revenue in any period may be lower than our historical revenues or forecasts.
Our sales are difficult to forecast because the open systems storage market is rapidly evolving and our sales cycle varies substantially from customer to customer. Customer orders for our products can range in value from a few thousand dollars to over a million dollars. The length of time between initial contact with a potential customer and the sale of our product may last from 6 to 36 months. This is particularly true during times of economic slowdown for sales to OEM customers and for the sale and installation of complex solutions.
Additional factors that may extend our sales cycle, particularly orders for new products, include:
| • | the amount of time needed for technical evaluations by customers; |
| • | customers’ budget constraints and changes to customers’ budgets during the course of the sales cycle; |
| • | customers’ internal review and testing procedures; |
| • | our engineering work necessary to integrate a storage solution with a customer’s system; |
| • | the complexity of technical challenges that need to be overcome during the development, testing and/or qualification process for new products and/or new customers; |
| • | meeting unique customer specifications and requirements; and |
| • | difficulties by our customers in integrating our products and technologies into their own products. |
Our net revenue is difficult for us to predict since it is directly affected by the timing of large orders. We may ship products representing a significant portion of our net sales for a quarter during the last month of that quarter. In addition, our expense levels are based, in part, on our expectations as to future sales. As a result, if sales levels are below expectations, our operating results may be disproportionately affected. We cannot assure you that our sales will not decline in future periods.
Our recent acquisition of Cloverleaf may not be successfully integrated or produce the results we anticipate.
In January 2010, we acquired Cloverleaf, a privately held software company. The Cloverleaf acquisition also provided us with a new team of software development and other professionals, primarily based primarily in Israel. Cloverleaf was our first acquisition involving significant international operations. We expect that the integration of Cloverleaf’s operations with our own will be a complex, time-consuming and costly process involving typical acquisition risks and related challenges, some of which are discussed below:
| • | operating as a larger combined company with operations in Israel, where we have limited operational experience; |
| • | managing geographically dispersed personnel with diverse cultural backgrounds and organizational structures; |
| • | the greater cash management, exchange rate, legal and income taxation risks associated with the combined company’s new multinational character and the movement of cash between Dot Hill and its domestic and foreign subsidiaries; |
| • | assessing and maintaining the combined company’s internal control over financial reporting and disclosure controls and procedures as required by U.S. securities laws; |
| • | diversion of management’s attention from normal daily operations of our business; |
| • | potential incompatibility of business cultures and/or loss of key personnel; |
24
Table of Contents
| • | difficulties in integrating the personnel, operations, technology or products and service offerings of Cloverleaf; |
| • | products derived from this acquisition may not meet the needs of customers or their expectations with respect to reliability; |
| • | insufficient net revenues to offset increased expenses associated with the Cloverleaf acquisition; |
| • | increased professional advisor fees related to the new profile of the combined company; |
| • | the costs and effects of the purchase accounting associated with this acquisition; |
| • | the possibility that we may incur unanticipated expenses in connection with this transaction or be required to expend material sums on potential contingent intellectual property, tax, environmental or other liabilities associated with Cloverleaf’s prior operations or facilities; and |
| • | increased difficulty in financial forecasting due to our limited familiarity with Cloverleaf’s operations, customers and markets or their impact on the overall results of operations of the combined company. |
In addition, the accounting treatment for the Cloverleaf acquisition may result in significant amortizable intangible assets, which when amortized will negatively affect our consolidated results of operations. The accounting treatment for the Cloverleaf acquisition may also result in significant goodwill, which, if impaired, will negatively affect our consolidated results of operations.
Failure to successfully address one or more of the above risks may result in unanticipated liabilities and cash outlays, lower than expected net revenue, losses from operations, failure to realize any of the expected benefits of the acquisition, and related declines in our stock price.
Our inability to further develop and increase sales from our RAIDCore software may significantly impact our ability to increase net revenue, gross margin and operating income.
In September 2008, we bought certain assets from Cirprico including RAIDCore. While we have agreements with several technology partners to market or integrate RAIDCore into their solutions, we cannot be certain that revenue from these customer relationships will exceed the costs of developing, manufacturing and marketing these products. The initial license fees from these software products are low. We intend to grow RAIDCore revenue by selling products with increased functionality to end user customers. If customers are unwilling to pay enough for these additional features to cover our development costs or if we are unable to generate incremental revenue from these newly developed features to cover development and marketing costs, our financial results may be negatively impacted.
The common stock we issued in the acquisition of Cloverleaf in 2010 and charges associated with this acquisition may negatively impact our earnings per share.
Based on the increase in our number of common shares outstanding in connection with our Cloverleaf acquisition, projected amortization charges and the potential for additional costs associated with integrating the company, the acquisition may result in lower earnings per share than would have been earned by us in the absence of the transaction. We expect that over time this acquisition will yield benefits to the combined company such that it will ultimately be accretive to earnings per share. However, there can be no assurance that an increase in earnings per share will be achieved. In order to achieve increases in earnings per share as a result of this acquisition, management will, among other things, need to successfully manage the combined company’s operations, increase revenue and compete effectively in its end-markets. Failure to achieve any of these objectives could cause our stock price to decline.
25
Table of Contents
The open systems storage market is rapidly changing and we may be unable to keep pace with or properly prepare for the effects of those changes. In addition, if we fail to develop and market new software and hardware products that meet customer requirements, our business will be harmed.
The open systems data storage market in which we operate is characterized by rapid technological change, frequent new product introductions, new interface protocol, evolving industry standards and consolidation among our competitors, suppliers and customers. Customer preferences in this market are difficult to predict and changes in those preferences and the introduction of new products by our competitors or us could render our existing products obsolete or uncompetitive. Our success will depend upon our ability to address the increasingly sophisticated needs of customers, to enhance existing products, and to develop and introduce on a timely basis, new competitive products, including new software and hardware, and enhancements to existing software and hardware that keep pace with technological developments and emerging industry standards. If we cannot successfully identify, manage, develop, manufacture or market product enhancements or new products, our business will be harmed. In addition, consolidation among our competitors, suppliers and customers may harm our business by increasing the resources of our competitors, reducing the number of suppliers available to us for our product components and increasing competition for customers by reducing the number of customer-purchasing decisions.
We believe that to remain competitive, we will need to continue to develop new hardware and software products, which will require a significant investment in new product development. Our competitors may be developing alternative technologies, which may adversely affect the market acceptance of our products. If alternative technologies and interface protocols are adopted by the industry that we have not incorporated into our products, we may become uncompetitive and not have product offerings for select market segments. Even if our new products are developed on time, we may not be able to manufacture them at competitive prices or in sufficient volumes.
The market for storage products is intensely competitive and subject to substantial pricing pressure that may harm our net revenues, gross margins and operating results.
The storage market is intensely competitive and is characterized by rapidly changing technology. We compete primarily against independent storage system suppliers, including EMC, NetApp, Hitachi, LSI, Infortrend and Xyratex, but also against server companies such as HP, IBM and Sun, some of whom are our customers. We also compete with smaller storage software and hardware companies such as Nexsan Corporation, or Nexsan, Compellent and Falconstor. The server companies and independent storage systems suppliers are also potential customers as well and as indicated we have established a relationship with HP and NetApp. Future competitors could include original design manufacturers and contract manufacturers, some of whom we partner with today.
Many of our existing and potential competitors have longer operating histories, greater name recognition and substantially greater financial, technical, sales, marketing and other resources than us. As a result, they may have more advanced technology, larger distribution channels, stronger brand names, better customer service and access to more customers than we do. Other large companies with significant resources could become direct competitors, either through acquiring a competitor or through internal efforts. Additionally, a number of new, privately held companies are currently attempting to enter the storage market, some of which may become significant competitors in the future. Any of these existing or potential competitors may be able to respond more quickly to new or emerging technologies and changes in customer requirements, devote greater resources to the development, promotion and sale of products or deliver competitive products at lower prices than us.
We could also lose current or future business to certain of our suppliers or manufacturers, some of which directly and indirectly compete with us. Currently, we leverage our supply and manufacturing relationships to provide a significant share of our products. Our suppliers and manufacturers are very familiar with the specific attributes of our products and may be able to provide our customers with similar products.
26
Table of Contents
We also expect that competition will increase as a result of industry consolidation and the creation of companies with new, innovative product offerings. Current and potential competitors have established or may establish cooperative relationships among themselves or with third parties to increase the ability of their products to address the needs of our prospective customers.
Accordingly, it is possible that new competitors, or alliances among competitors, may emerge and rapidly acquire significant market share. Increased competition is likely to result in price reductions, and may reduce operating margins and create a potential loss of market share, any of which could harm our business. We believe that the principal competitive factors affecting the storage systems market include: performance, features, scalability and reliability; price; product breadth; product availability and quality; timeliness of new product introductions; and interoperability and ease of management.
We cannot assure you that we will be able to successfully incorporate these factors into our products and compete against current or future competitors or that competitive pressures we face will not harm our business. If we are unable to cost effectively develop and market products to compete with the products of competitors, our business will be materially and adversely affected. In addition, if major OEM customers who are also competitors cease purchasing our products in order to concentrate on sales of their own products, our business will be harmed.
Additional pricing pressures are due, in part, to continuing decreases in component prices, such as those of disks, memory, semiconductors and RAID controllers. Decreases in component prices are typically passed on to customers by storage companies through a continuing decrease in the price of storage hardware systems.
Pricing pressures could also result when we cannot pass increased material costs onto our customers. For example, if fuel prices were to increase significantly again, this could result in higher steel and freight costs which we may not be able to pass onto our customers.
Pricing pressures also exist from our significant OEM customers that may attempt to change the terms, including pricing and payment terms of their agreements, with us. As our OEM customers are pressured to reduce prices as a result of competitive factors, we may be required to contractually, or otherwise, commit to price reductions for our products prior to determining if we can implement corresponding cost reductions. If we are unable to achieve such cost reductions, or are unable to pass along cost increases to our customers, and have to reduce the pricing of our products, our gross margins may be negatively impacted which could have a material adverse effect on our business, financial condition and results of operations.
Our inability to lower product costs or changes in the mix of products we sell may significantly impact our gross margins and results of operations.
Our gross margins are determined in large part based on our manufacturing costs, our component costs, our timing and magnitude of product cost reductions, and our ability to include RAID controllers and value added features into our products, such as DMS, as well as the prices at which we sell our products. The amount of revenue recognized from software and service sales and the relative mix of such sales in comparison to sales of our other products will also impact our gross margins, as the gross margin on sales of software and services is higher than that of our other products. If we are unable to lower production costs to be consistent with our projections or any decline in selling prices, our gross margins and results of operations may suffer. Several of the new products we are currently shipping or expect to begin shipping are in the early stages of their lifecycle. Our historical experience indicates that gross margins on new products are low initially and increase over time as a result of maturing manufacturing processes, component cost reductions and re-engineering the products to reduce costs. If we fail to achieve these improvements, our gross margins will be negatively impacted and our business, financial condition and results of operations could be significantly harmed.
In addition, we typically plan our production and inventory levels based on internal forecasts of customer demand, which is highly unpredictable and can fluctuate substantially. Our customer’s forecasts have not historically demonstrated a high degree of accuracy. From time to time, in response to anticipated long lead times
27
Table of Contents
to obtain inventory and materials from our outside suppliers, we may order materials in advance of anticipated customer demand. This advance ordering may result in excess inventory levels or unanticipated inventory write-downs due to expected orders that fail to materialize.
Additional factors which could adversely impact gross margin dollars and gross margin percentage include:
| • | changes in the mix of products we sell to our customers; |
| • | increased price competition; |
| • | introduction of new products by us or our competitors, including products with price performance advantages; |
| • | our inability to reduce production or component costs; |
| • | entry into new markets or the acquisition of new customers; |
| • | sales discounts and marketing development funds; |
| • | increases in material or labor costs; |
| • | excess inventory, inventory shrinkages and losses and inventory holding charges; |
| • | purchase price variances resulting from reductions in component costs purchased on our behalf by our contract manufacturers or owned by us in inventory versus the original cost of those components; |
| • | increased warranty costs and costs associated with any potential future product quality and product defect issues; |
| • | our inability to sell our higher performance Series 5000 and Series 2000 products, our DMS software and our RAIDCore software; |
| • | component shortages which can result in expedite fees, overtime or increased use of air freight; and |
| • | increased freight costs resulting from higher fuel prices, or from the need to expedite shipments of components to our contract manufacturer or finished goods to some of our customers and their hub locations. |
Our OEM customers may have very aggressive product launch and ramp schedules and our efforts to accommodate these schedules may divert our management’s attention, cause component shortages and force us to allocate products across many customers, all of which could harm our customer relations.
Our efforts to accommodate our customers’ aggressive launch and ramp schedules can divert management’s attention from the rest of our business and force us to allocate product volumes across many customers due to component shortages, all of which could harm our relations with customers. In addition, we could incur overtime, expedite charges, and other charges such as shipping products by air as opposed to by ocean as a result of efforts to meet such schedules. Any of these factors could result in lower net revenue and gross margin as well as increased operating expenses which could have an impact on our business, financial condition and results of operations.
Our inability to grow and manage our indirect sales channel may significantly impact our ability to increase net revenue, gross margin and operating income.
We have recently expanded our indirect sales model to access end-user markets primarily through our distributors and OSPs and are investing significant monetary and human resources in order to grow this indirect sales channel. If we cannot successfully identify, manage, develop, and generate sufficient net revenue through our indirect sales channel, our business could be harmed. In addition, even if we are able to grow our indirect sales channel, managing the interaction of our OEMs’, distributors’, and OSPs’ efforts to reach various potential customer segments for our products and services is a complex process. Moreover, since each channel method has distinct risks and gross margins, our failure to implement the most advantageous balance in the delivery model for our products and services could adversely affect our net revenue and gross margin and our profitability.
28
Table of Contents
Manufacturing and supplier disruptions could harm our business.
We rely on third parties to manufacture substantially all of our products. If our agreements with Foxconn, Flextronics, MiTAC or SYNNEX are terminated, or if they do not perform their obligations under our agreement, or if we otherwise determine to transition manufacturing of our products to another third party manufacturer, it could take several months to establish and qualify alternative manufacturing for our products and we may not be able to fulfill our customers’ orders in a timely manner. If our agreements with Foxconn, Flextronics, MiTAC or SYNNEX terminate, we cannot be certain that we will be able to identify a suitable alternative manufacturing partner that meets the requirements of our OEM customers and one that is cost competitive. Failure to identify a suitable alternative manufacturing partner could impact our customer relationships and our financial condition.
Due to our use of third-party manufacturers, our ability to control the timing of shipments could decrease. Delayed shipment could result in the deferral or cancellation of purchases of our products. Any significant deferral or cancellation of these sales would harm our results of operations in any particular quarter. Net revenue for a period may be lower than predicted if large orders forecasted for that period are delayed or are not realized, which could also impact cash flow or result in a decline in our stock price. To the extent we establish a relationship with an alternative manufacturer for our products, we may be able to partially mitigate potential disruptions to our business. We may also suffer manufacturing disruptions as we ramp up manufacturing processes for our new integrated storage systems, which could result in delays in delivery of these products to our OEM customers and adversely affect our results of operations. Additionally, production of our products could be disrupted as a result of geo-political events in Asia and other manufacturing locations.
We also generally extend to our customers the warranties provided to us by our suppliers and, accordingly, the majority of our warranty obligations to customers are covered by supplier warranties. For warranty costs not covered by our suppliers, we reserve for estimated warranty costs in the period the net revenue is recognized. There can be no assurance that our suppliers will continue to provide such warranties to us in the future, or that we have estimated these costs correctly, which could have a material adverse effect on our business, financial condition and results of operations.
Any shortage of disk drives, memory or other components could increase our costs or harm our ability to manufacture and deliver our storage products to our customers in a timely manner.
From time to time there is significant market demand for disk drives, semiconductors, memory and other components, and we may experience component shortages, selective supply allocations and increased prices of such components. In such event, we may be required to purchase our components from alternative suppliers, and we cannot be certain that alternative sources of supplies will be available at competitive terms. Even if alternative sources of supply for critical components such as disk drives and memory become available, incorporating substitute components into our products could delay our ability to deliver our products in a timely manner.
Demand for disk drives and memory has at times surpassed supply, forcing drive, memory and component suppliers, including those who supply the components that are integrated into many of our storage products, to manage allocation of their inventory. If such a shortage were prolonged, we may be forced to pay higher prices for disk drives, memory or components or may be unable to purchase sufficient quantities of these components to meet our customers’ demand for our storage products in a timely manner or at all. Similar circumstances could occur with respect to other necessary components.
A significant percentage of our expenses are fixed, and if we fail to generate targeted net revenues or gross margins in associated periods, our operating results will be harmed.
We have taken and may have to take further measures to reduce expenses if net revenues or gross margins decline and we experience greater operating losses or do not achieve profitable results. A number of factors could preclude us from successfully bringing costs and expenses in line with our net revenue, such as the fact that our
29
Table of Contents
expense levels are based in part on our expectations as to future sales, and that a significant percentage of our expenses are fixed, which limits our ability to reduce expenses quickly in response to any shortfalls in net revenue or gross margin. As a result, if net revenue, product margin or gross margin does not meet our projections, operating results may be negatively affected.
We may continue to experience losses in the future, and may have difficulty forecasting future operating results, (which could result in revenue and earnings volatility), which could cause our stock price to decline.
For the year ended December 31, 2009, we incurred a net loss of $13.6 million. For 2010, we expect our business to remain volatile as we are often unable to reliably predict net revenues from our major customers including NetApp, HP and our other customers. Our ability to reliably predict net revenues is likely to be more challenging in 2010 as a result of our recent acquisition of Cloverleaf. Net revenue levels achieved from NetApp, HP and our other customers, the mix of products sold to our customers, our ability to introduce new products as planned and our ability to reduce product costs and manage our operating expenses and manufacturing variances will affect our financial results for 2010. Consequently, we cannot assure you that we will be profitable in any future period.
Our future operating results and profitability will depend on, and could vary substantially as a result of many factors, including:
| • | our ability to implement and achieve targeted gross margin cost reduction objectives and; |
| • | our ability to contain operating expenses and manufacturing variances; |
| • | our ability to meet product delivery schedules for HP and other customers which could result in increased air freight, expedite and overtime charges; |
| • | the extent to which we invest in new initiatives such as channel sales and software development; |
| • | our plans to maintain and enhance our engineering, research, development and product testing programs; |
| • | the extent to which we consolidate our facilities and relocate employees and assets; |
| • | the success of our manufacturing strategy and the move of the manufacturing of some of our products to a newer contract manufacturing partner; |
| • | the success of our sales and marketing efforts; |
| • | the amount of field failures resulting in product replacements or recalls; |
| • | the extent and terms of any development, marketing or other arrangements; |
| • | changes in economic, regulatory or competitive conditions, including the current worldwide economic crisis; |
| • | increased intangible amortization and other costs associated with our recent acquisition of Cloverleaf; |
| • | costs of filing, prosecuting, defending and enforcing intellectual property rights; and |
| • | costs of litigating and defending law suits. |
Product recalls, epidemic failures, post-manufacture repairs of our products liability claims, absence or cost of insurance, and associated costs could harm our reputation, divert resources, reduce sales and increase costs and could have a material adverse effect on our financial condition.
Our new integrated storage systems, as well as our legacy products, may contain undetected errors, or failures that become epidemic failure, which may be discovered after shipment, resulting in a loss of net revenue, or a loss or delay in market acceptance, which could harm our business. The product failure or recall could be the
30
Table of Contents
result of components purchased from our suppliers not meeting the required specifications, manufacturing defects or from our own design deficiencies. For example, during the first half of 2007, we experienced several product quality issues associated with our then recently introduced Series 2000 products. The cost of rectifying these issues had a negative impact on gross margins during the first half of 2007.
Even if the errors are detected before shipment, such errors could result in the halting of production, the delay of shipments, recovery costs, loss of goodwill, tarnishment of reputation and/or a substantial decrease in net revenue. Our standard warranty provides that if our systems do not function to published specifications, we will repair or replace the defective component or system without charge generally for a period of about three years. Significant warranty costs, particularly those that exceed reserves, could decrease our gross margin and negatively impact our business, financial condition and results of operations. In addition, defects in our products could result in our customers claiming property damages, consequential damages, or bodily injury, which could also result in our loss of customers and goodwill. None of our customers have thus far asserted claims, but may in the future assert claims, that our products have failed to meet agreed-to specifications or that they have sustained injuries from our products, and we may be subject to lawsuits relating to these claims. There is a risk that these claims or liabilities may exceed, or fall outside of the scope of our insurance coverage. Any such claim could distract management’s attention from operating our business and, if successful, result in damage claims against us that might not be covered by our insurance.
Our success depends significantly upon our ability to protect our intellectual property and to avoid infringing the intellectual property of third parties, which has already resulted in costly, time-consuming litigation and could result in the inability to offer certain products.
We rely primarily on patents, copyrights, trademarks, trade secrets, nondisclosure agreements and common law to protect our intellectual property. Despite our efforts to protect our intellectual property, unauthorized parties may attempt to copy aspects of our products or obtain and use information that we regard as proprietary. In addition, the laws of foreign countries may not adequately protect our intellectual property rights. Our efforts to protect our intellectual property from third party discovery and infringement may be insufficient and third parties may independently develop technologies similar to ours, duplicate our products or design around our patents.
In addition, third parties may assert infringement claims against us, which would require us to incur substantial license fees, legal fees and other expenses, and distract management from the operations of our business. For example, in 2003, Crossroads filed a lawsuit against us alleging that our products infringe two United States patents assigned to Crossroads. In 2006, we entered into a Settlement and License Agreement with Crossroads that settled the lawsuit and licensed to us the family of patents from which it stemmed. We incurred significant legal expenses in connection with these matters. Other third parties may assert additional infringement claims against us in the future, which would similarly require us to incur substantial license fees, legal fees and other expenses, and distract management from the operations of our business.
We expect that providers of storage products will increasingly be subject to infringement claims as the number of products and competitors increases. We receive, from time to time, letters from third parties suggesting that we may require a license from such third parties to manufacture or sell our products. We evaluate all such communications to assess whether to seek a license from the patent owner. We may be required to purchase licenses that could have a material impact on our business, or, we may not be able to obtain the necessary license from a third party on commercially reasonable terms, or at all. Consequently, we could be prohibited from marketing products that incorporate the protected technology or incur substantial costs to redesign our products in a manner to avoid infringement of third party intellectual property rights.
Our success depends on our ability to attract and retain key personnel.
Our performance depends in significant part on our ability to attract and retain talented senior management and other key personnel. Our key personnel include Dana Kammersgard, our Chief Executive Officer and President, Hanif Jamal, our Senior Vice President and Chief Financial Officer, James Kuenzel, our Senior Vice
31
Table of Contents
President of Engineering and Ernest Hafersat, our Senior Vice President of WorldWide Manufacturing, Operations, and Supply Base Management. If any of these individuals were to terminate his employment with us, we would be required to locate and hire a suitable replacement. Competition for attracting talented employees in the technology industry can be intense. We may be unable to identify suitable replacements for any employees that we lose. In addition, even if we are successful in locating suitable replacements, the time and cost involved in recruiting, hiring, training and integrating new employees, particularly key employees responsible for significant portions of our operations, could harm our business by delaying our production schedule, our research and development efforts, our ability to execute on our business strategy and our client development and marketing efforts.
Many of our customer relationships are based on personal relationships between the customer and our executives or sales representatives. If these representatives terminate their employment with us, we may be forced to expend substantial resources to attempt to retain the customers that the sales representatives serviced. Ultimately, if we were unsuccessful in retaining these customers, our net revenue would decline.
We may face difficulties retaining key employees and attracting new employees in connection with our consolidation of operations and facilities in Longmont, Colorado.
We have decided to consolidate our Longmont, Colorado and our Carlsbad, California operations and facilities into a single facility in Longmont, Colorado. We may face difficulties retaining key employees in Carlsbad, California and Longmont, Colorado and attracting new employees in Longmont, Colorado in connection with the consolidation, which may adversely affect our operations and the transfer of knowledge and processes to the consolidated facility in a timely manner.
Protective provisions in our charter and bylaws and the existence of our stockholder rights plan could prevent a takeover which could harm our stockholders.
Our certificate of incorporation and bylaws contain a number of provisions that could impede a takeover or prevent us from being acquired, including, but not limited to, a classified board of directors, the elimination of our stockholders’ ability to take action by written consent and limitations on the ability of our stockholders to remove a director from office without cause. Our board of directors may issue additional shares of common stock or establish one or more classes or series of preferred stock with such designations, relative voting rights, dividend rates, liquidation and other rights, preferences and limitations as determined by our board of directors without stockholder approval. In addition, we adopted a stockholder rights plan in May 2003 that is designed to impede takeover transactions that are not supported by our board of directors. Each of these charter and bylaw provisions and the stockholder rights plan gives our board of directors, acting without stockholder approval, the ability to prevent, or render more difficult or costly, the completion of a takeover transaction that our stockholders might view as being in their best interests.
Unanticipated changes in our tax provisions or adverse outcomes resulting from examination of our income tax returns could adversely affect our results of operations.
We are subject to income taxes in the United States and various foreign jurisdictions. Our effective income tax rates have recently been and could in the future be adversely affected by changes in tax laws or interpretations of those tax laws, by changes in the mix of earnings in countries with differing statutory tax rates, by discovery of new information in the course of our tax return preparation process, or by changes in the valuation of our deferred tax assets and liabilities. Our effective income tax rates are also affected by intercompany transactions for licenses, services, funding and other items. Additionally, we are subject to the continuous examination of our income tax returns by the Internal Revenue Service and other tax authorities which may result in the assessment of additional income taxes. We regularly assess the likelihood of adverse outcomes resulting from these examinations to determine the adequacy of our provision for income taxes. However, there can be no assurance that the outcomes from these continuous examinations will not have a material adverse effect on our business, financial condition and results of operations.
32
Table of Contents
The exercise of outstanding warrants may result in dilution to our stockholders.
Dilution of the per share value of our common stock could result from the exercise of outstanding warrants. As of December 31, 2009 there was an outstanding warrant to purchase 1,602,489 shares of our common stock. The warrant has an exercise price of $2.40 per share, which at December 31, 2009 exceeded the trading price of our common stock. The warrant is exercisable for a period of five years from the date of issuance, or five years from January 2008. When the exercise price of the warrant is less than the trading price of our common stock, exercise of the warrant would have a dilutive effect on our stockholders. The possibility of the issuance of shares of our common stock upon exercise of the warrant could cause the trading price of our common stock to decline.
Furthermore, it is also possible that future large customers or suppliers, make our relationship with them contingent on receiving warrants to purchase shares of our common stock. The impact of potentially issuing additional warrants can have a dilutive effect on our stockholders.
Our stock price may be highly volatile and could decline substantially and unexpectedly, which can and has in some cases resulted in litigation.
The market price of our common stock has fluctuated substantially, and there can be no assurance that such volatility will not continue. Several factors could impact our stock price including, but not limited to:
| • | differences between our actual operating results and the published expectations of analysts; |
| • | quarterly fluctuations in our operating results; |
| • | introduction of new products or changes in product pricing policies by our competitors or us; |
| • | conditions in the markets in which we operate; |
| • | changes in market projections by industry forecasters; |
| • | changes in estimates of our earnings by industry analysts; |
| • | overall market conditions for high technology equities; |
| • | rumors or dissemination of false information; and |
| • | general economic and geopolitical conditions. |
It is often the case that securities class action litigation is brought against a company following periods of volatility in the market price of its securities. Securities litigation could result in the expenditure of substantial funds, divert management’s attention and resources, harm our reputation in the industry and the securities markets and reduce our profitability.
Future sales of our common stock may hurt our market price.
As of December 31, 2009, 32% of our common stock was owned by five institutional stockholders. As a result, a substantial number of shares of our common stock may become available for resale. If these or other of our stockholders sell substantial amounts of our common stock in the public market, the market price of our common stock could decline. These sales might also make it more difficult for us to sell equity securities in the future at times and prices that we deem appropriate.
Our system of internal controls may be inadequate.
We maintain a system of internal controls in order to ensure we are able to collect, process, summarize, and disclose the information required by the Securities and Exchange Commission within the time periods specified. Any system of controls, however well designed and operated, can provide only reasonable, and not absolute, assurance that the objectives of the system are met. In addition, the design of any control system is based in part upon certain assumptions about the likelihood of future events. Due to these and other inherent limitations of
33
Table of Contents
control systems, there can be no assurance that any design will succeed in achieving its stated goals under all potential future conditions, regardless of how remote. Additionally, public companies in the United States are required to review their internal controls under the Sarbanes-Oxley Act of 2002. If the internal controls put in place by us are not adequate or fail to perform as anticipated, errors could occur that would not be detected, which could require us to restate our consolidated financial statements, receive an adverse audit opinion on the effectiveness of our internal controls, and/or take other actions that will divert significant financial and managerial resources, as well as be subject to fines and/or other government enforcement actions. Furthermore, the price of our stock could be adversely affected.
Environmental compliance costs could adversely affect our results of operations.
Many of our products are subject to various laws governing chemical substances in products, including those regulating the manufacture and distribution of chemical substances and those restricting the presence of certain substances in electronic products. We could incur substantial costs, or our products could be restricted from entering certain countries, if our products become non-compliant with environmental laws.
We face increasing complexity in our product design and procurement operations as we adjust to new and future requirements relating to the materials composition of our products, including the restrictions on lead and certain other substances that apply to specified electronic products put on the market in the European Union as of July 1, 2006 (Restriction of Hazardous Substances Directive, or RoHS). We design our products to ensure that they comply with these requirements as well as related requirements imposed by our OEM customers. We are also working with our suppliers to provide us with compliant materials, parts and components. If our products do not comply with the European substance restrictions, we could become subject to fines, civil or criminal sanctions, and contract damage claims. In addition, we could be prohibited from shipping non-compliant products into the European Union, and required to recall and replace any products already shipped, if such products were found to be non-compliant, which would disrupt our ability to ship products and result in reduced net revenue, increased obsolete or excess inventories and harm to our business and customer relationships. Various other countries and states in the United States have issued, or are in the process of issuing, other environmental regulations that may impose additional restrictions or obligations and require further changes to our products. These regulations could impose a significant cost of doing business in those countries and states.
The European Union has enacted the Waste Electrical and Electronic Equipment Directive, which makes producers of electrical goods financially responsible for specified collection, recycling, treatment and disposal of past and future covered products. The deadline for the individual member states of the European Union to enact the directive in their respective countries was August 13, 2004. Producers participating in the market became financially responsible for implementing these responsibilities beginning in August 2005. Similar legislation has been or may be enacted in other jurisdictions, including in the United States, Canada, Mexico, China and Japan, the cumulative impact of which could be significant.
| Item 1B. | Unresolved Staff Comments |
None.
| Item 2. | Properties |
Our corporate headquarters currently occupy approximately 58,000 square feet that includes office and laboratory space located in Longmont, Colorado. This facility includes administration, research and development, sales and marketing and operations functions. The expiration date of the lease is January 2013.
We also lease approximately 58,500 square feet in Carlsbad, California, under a lease that expires in April 2013. This facility includes administration, research and development and operations functions. As part of our restructuring activities, we have consolidated a portion of our Carlsbad, California facility into our Longmont,
34
Table of Contents
Colorado facility. As of December 31, 2009, we were not utilizing approximately 76% of the Carlsbad facility. For additional information regarding our restructuring activities see Note 6 of the Notes to Consolidated Financial Statements.
We lease approximately 7,300 square feet of office space located in Plymouth, Minnesota, under a lease that expires October 2011. We use this office space as a research and development facility for our RAIDCore software.
In addition, we lease other international office space in countries such as: Israel, Germany, Japan, China, Singapore and the United Kingdom primarily for research and development and sales and marketing functions.
Our existing leased facilities are appropriate for our current needs, although additional office space may be needed in the Longmont, Colorado area in the near future. We do not own any real estate.
| Item 3. | Legal Proceedings |
Dot Hill Securities Class Actions, Derivative Suits and Direct State Securities Action
In late January and early February 2006, numerous purported class action complaints were filed against us in the United States District Court for the Southern District of California. The complaints allege violations of federal securities laws related to alleged inflation in our stock price in connection with various statements and alleged omissions to the public and to the securities markets and declines in our stock price in connection with the restatement of certain of our quarterly financial statements for fiscal year 2004, and seeking damages therefore. The complaints were consolidated into a single action, and the Court appointed as lead plaintiff a group comprised of the Detroit Police and Fire Retirement System and the General Retirement System of the City of Detroit. The consolidated complaint was filed on August 25, 2006, and we filed a motion to dismiss on October 5, 2006. The Court granted our motion to dismiss on March 15, 2007. Plaintiffs filed their Second Amended Consolidated Complaint on April 20, 2007. We filed a motion to dismiss the Second Amended Consolidated Complaint on May 1, 2008, which the Court granted on September 2, 2008. The plaintiffs subsequently filed a Third Amended Consolidated Complaint on October 10, 2008, and on November 24, 2008 we filed a motion to dismiss. On March 18, 2009, the Court dismissed the Third Amended Consolidated Complaint, but granted plaintiffs leave to amend one more time. On April 17, 2009, plaintiffs filed a Notice of Appeal regarding the Court’s September 2, 2008 and March 18, 2009 orders. On May 19, 2009, the Court entered final judgment and dismissed the action with prejudice. The plaintiffs subsequently filed an Amended Notice of Appeal on June 8, 2009. On October 29, 2009, the parties filed a Stipulation of Dismissal of Appeal. On October 30, 2009, the appeal was dismissed.
In addition, three complaints purporting to be derivative actions were filed in California state court against certain of our directors and executive officers. These complaints are based on the same facts and circumstances described in the federal class action complaints and generally allege that the named directors and officers breached their fiduciary duties by failing to oversee adequately our financial reporting. Each of the complaints generally seeks an unspecified amount of damages. Our demurrers to two of those cases, in which we sought dismissal, were overruled (i.e., denied). We formed a Special Litigation Committee, or SLC, of disinterested directors to investigate the alleged wrongdoing. On January 12, 2007, another derivative action similar to the previous derivative actions with the addition of allegations regarding purported stock option backdating was served on us. In April 2007, the SLC concluded its investigation and based on its findings directed us to file a motion to dismiss the derivative matters. On July 13, 2007, all of the derivative actions were consolidated for pre-trial proceedings. We filed a motion to dismiss the consolidated matters pursuant to the SLC’s directive on May 30, 2008. The hearing on this motion is set for May 14, 2010. The outcome of this action is uncertain, and no amounts have been accrued as of December 31, 2009.
The pending proceedings involve complex questions of fact and law and will require the expenditure of significant funds and the diversion of other resources to prosecute and defend. The results of legal proceedings
35
Table of Contents
are inherently uncertain and material adverse outcomes are possible. From time to time we may enter into confidential discussions regarding the potential settlement of pending litigation or other proceedings. However, there can be no assurance that any such discussions will occur or will result in a settlement. The settlement of any pending litigation or other proceedings could require us to incur substantial settlement payments and costs.
Other Litigation
We may be involved in certain other legal actions and claims from time to time arising in the ordinary course of business. Management believes that the outcome of such other litigation and claims will likely not have a material adverse effect on our financial condition or results of operations.
| Item 4. | (Removed and Reserved) |
36
Table of Contents
| Item 5. | Market for Registrant’s Common Equity, Related Stockholder Matters and Issuer Purchases of Equity Securities |
Our common stock is currently included for quotation on the Nasdaq Global Market and is currently traded under the symbol “HILL.”
The following table sets forth for the periods indicated the per share range of the high and low sales prices of our common stock as reported on the Nasdaq Global Market.
| Low | High | |||||
| Year Ended December 31, 2008 |
||||||
| First Quarter |
$ | 2.38 | $ | 4.05 | ||
| Second Quarter |
2.39 | 3.48 | ||||
| Third Quarter |
1.84 | 2.89 | ||||
| Fourth Quarter |
0.46 | 2.05 | ||||
| Year Ended December 31, 2009 |
||||||
| First Quarter |
0.40 | 1.00 | ||||
| Second Quarter |
0.56 | 1.50 | ||||
| Third Quarter |
0.63 | 1.90 | ||||
| Fourth Quarter |
1.48 | 2.83 | ||||
On March 8, 2010 the last reported sale price for our common stock on the Nasdaq Global Market was $1.42 per share. As of March 8, 2010 there were 54,367,653 shares of our common stock outstanding held by approximately 110 holders of record. We have never paid any cash dividends on our common stock, and currently intend to retain future earnings, if any, to the extent possible to fund the development and growth of our business. We do not anticipate paying any cash dividends on our common stock in the foreseeable future.
The information required to be disclosed by item 201(d) of Regulation S-K, “Securities Authorized for Issuance Under Equity Compensation Plans,” is included under Item 12 of Part III of this annual report on Form 10-K.
37
Table of Contents
PERFORMANCE MEASUREMENT COMPARISON
The following graph compares the cumulative 5-year total return provided stockholders on our common stock relative to the cumulative total returns of the S&P 500 Index, the Nasdaq Composite Index and the Nasdaq Computer Index. An investment of $100 (with reinvestment of all dividends) is assumed to have been made in our common stock and in each index on December 31, 2004 and its relative performance is tracked through December 31, 2009.
COMPARISON OF CUMULATIVE TOTAL RETURN FOR
THE FIVE YEAR PERIOD ENDED DECEMBER 31, 2009
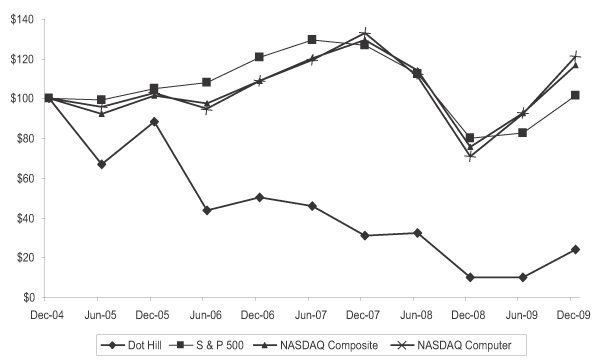
38
Table of Contents
| Item 6. | Selected Financial Data |
We derived the selected consolidated financial data presented below from our audited consolidated financial statements for the years ended December 31, 2007, 2008 and 2009, which are included elsewhere in this annual report on Form 10-K. Statement of operations data for the years ended December 31, 2005 and 2006 and balance sheet data as of December 31, 2005, 2006 and 2007 have been derived from our audited consolidated financial statements not included herein. All data are in thousands except per share data. You should read the selected consolidated financial data together with our consolidated financial statements and related disclosures thereto and with “Management’s Discussion and Analysis of Financial Condition and Results of Operations” included elsewhere in this annual report on Form 10-K.
| 2005 | 2006 | 2007 | 2008 | 2009 | ||||||||||||||||
| Statement of Operations Data: |
||||||||||||||||||||
| Net revenue |
$ | 233,799 | $ | 239,217 | $ | 207,095 | $ | 272,879 | $ | 234,383 | ||||||||||
| Cost of goods sold |
180,196 | 202,561 | 180,662 | 242,491 | 196,556 | |||||||||||||||
| Gross profit |
53,603 | 36,656 | 26,433 | 30,388 | 37,827 | |||||||||||||||
| Operating expenses: |
||||||||||||||||||||
| Sales and marketing |
19,120 | 15,996 | 15,939 | 13,878 | 10,970 | |||||||||||||||
| Research and development |
23,628 | 36,529 | 22,564 | 28,709 | 28,120 | |||||||||||||||
| General and administrative |
12,933 | 18,119 | 12,606 | 12,779 | 10,139 | |||||||||||||||
| Legal settlement |
— | 3,395 | — | (4,036 | ) | — | ||||||||||||||
| Goodwill and long-lived asset impairment charge(1)(5) |
40,725 | 5,432 | — | |||||||||||||||||
| Restructuring charge(4) |
— | — | — | 813 | 2,430 | |||||||||||||||
| Operating loss |
(2,078 | ) | (37,383 | ) | (65,401 | ) | (27,187 | ) | (13,832 | ) | ||||||||||
| Other income, net |
3,478 | 5,496 | 4,996 | 1,612 | 167 | |||||||||||||||
| Income tax (benefit) expense(2) |
(25,197 | ) | 48,885 | (177 | ) | 190 | (40 | ) | ||||||||||||
| Net income (loss) |
$ | 26,597 | $ | (80,772 | ) | $ | (60,228 | ) | $ | (25,765 | ) | $ | (13,625 | ) | ||||||
| Net income (loss) attributable to common stockholders |
$ | 26,597 | $ | (80,772 | ) | $ | (60,228 | ) | $ | (25,765 | ) | $ | (13,625 | ) | ||||||
| Net income (loss) per share: |
||||||||||||||||||||
| Basic(3) |
$ | 0.61 | $ | (1.80 | ) | $ | (1.32 | ) | $ | (0.56 | ) | $ | (0.29 | ) | ||||||
| Diluted(3) |
$ | 0.58 | $ | (1.80 | ) | $ | (1.32 | ) | $ | (0.56 | ) | $ | (0.29 | ) | ||||||
| Weighted average shares outstanding: |
||||||||||||||||||||
| Basic |
43,903 | 44,757 | 45,534 | 46,136 | 47,094 | |||||||||||||||
| Diluted |
45,639 | 44,757 | 45,534 | 46,136 | 47,094 | |||||||||||||||
| 2005 | 2006 | 2007 | 2008 | 2009 | ||||||||||||||||
| Balance Sheet Data: |
||||||||||||||||||||
| Cash, cash equivalents, and short-term investments |
$ | 122,234 | $ | 99,663 | $ | 82,358 | $ | 56,850 | $ | 57,574 | ||||||||||
| Working capital |
135,293 | 102,941 | 88,418 | 75,261 | 62,010 | |||||||||||||||
| Total assets |
267,294 | 201,651 | 139,927 | 123,897 | 108,280 | |||||||||||||||
| Total long-term debt |
— | — | — | 607 | 346 | |||||||||||||||
| Total stockholders’ equity |
232,051 | 155,912 | 96,429 | 76,652 | 66,351 | |||||||||||||||
| (1) | During the fourth quarter of 2007 the market value of our common stock substantially declined. As a result of this decline we determined that the goodwill related to our SANnet reporting unit was impaired and recognized an impairment to goodwill of $40.7 million. |
39
Table of Contents
| (2) | As of December 31, 2005, we reversed the valuation allowance on our United States deferred tax assets totaling $47.1 million. The reversal of the valuation allowance resulted in a net income tax benefit of $25.2 million. As of December 31, 2006, we reestablished our valuation allowance related to our United States deferred tax assets in the amount of $47.1 million. |
| (3) | See Note 1 of Notes to Consolidated Financial Statements for an explanation of the calculation of net income (loss) per share. |
| (4) | See Note 6 of Notes to Consolidated Financial Statements for an explanation of our restructuring charges. |
| (5) | During the fourth quarter of 2008, we performed an impairment analysis over our long-lived and intangible assets. The impairment analysis identified $5.4 million of impaired long-lived assets consisting of $4.4 million of property and equipment and $1.0 million of intangible assets. See further discussion of our long-lived asset impairment in Note 1 of Notes to Consolidated Financial Statements. |
40
Table of Contents
| Item 7. | Management’s Discussion and Analysis of Financial Condition and Results of Operations |
Cautionary Statement for Forward-Looking Information
Certain statements contained in this report, including, statements regarding the development, growth and expansion of our business, our intent, belief or current expectations, primarily with respect to our future operating performance and the products we expect to offer, and other statements regarding matters that are not historical facts, are “forward-looking statements” within the meaning of Section 27A of the Securities Act of 1933, as amended and Section 21E of the Securities Exchange Act of 1934, as amended, or the Exchange Act, and are subject to the “safe harbor” created by these sections. Because such forward-looking statements are subject to risks and uncertainties, many of which are beyond our control, actual results may differ materially from those expressed or implied by such forward-looking statements. Some of the factors that could cause actual results to differ materially from those expressed or implied by such forward-looking statements can be found in Item 1A “Risk Factors” and elsewhere in this annual report on Form 10-K. Readers are cautioned not to place undue reliance on forward-looking statements. The forward-looking statements speak only as of the date on which they are made, and we undertake no obligation to update such statements to reflect events that occur or circumstances that exist after the date on which they are made.
The following discussion of our financial condition and results of operations should be read in conjunction with our consolidated financial statements and notes thereto included elsewhere in this annual report on Form 10-K.
Overview
We are a provider of entry-level and midrange storage systems and enterprise server software for organizations requiring high reliability, high performance networked storage and data management solutions in an open systems architecture. Our storage solutions consist of integrated hardware, firmware and software products employing a modular system that allows end-users to add various capacity or data protection schemes as needed. Our broad range of products, from medium capacity stand-alone storage units to complete multi-terabyte storage area networks, or SANs, provide end-users with a cost-effective means of addressing increasing storage demands without sacrificing performance. Our current product family based on our Rapid Evolution, or R/Evolution, architecture provides high performance and large disk array capacities for a broad variety of environments, employing Fibre Channel, or FC, Internet Small Computer Systems Interface, or iSCSI or Serial Attached SCSI, or SAS interconnects to switches and/or hosts. In addition, our Assured family of data protection software products provides additional layers of data protection options to complement our line of storage disk arrays. Our current mainstream 2000 series of entry-level storage products and Just a Bunch of Disks, or JBOD arrays have significantly increased in market share during 2009 and are targeted primarily at mainstream enterprise and small-to-medium business, or SMB, applications. Our new replacement products for the legacy SANnet II products, the 2000 series, have been distinguished by certification as Network Equipment Building System, or NEBS, Level 3 (a telecommunications standard for equipment used in central offices) and are MIL-STD-810F (a military standard created by the U.S. government) compliant based on their ruggedness and reliability, and this legacy is continued in a number of next generation products that we brought to market in 2009. In January 2009, we launched a new line of products to address the growing need for smaller form factor, highly dense storage utilizing SAS or serial ATA, or SATA disks, as well as the newest generation of solid state disks, or SSDs.
As a result of our ongoing strategic development, planning and evaluation, we have identified some potential higher margin business that we believe will complement our current product offerings. Accordingly, we have decided to expand our software offerings. We plan to leverage our current products and technology to pursue selling through distributors and open storage partners, or OSPs. Our investment in software will require significant investment and development on our part, which will impact our cash and operating results until we generate sufficient revenues to recover our investment.
41
Table of Contents
In September 2008, we acquired certain assets, namely RAIDCore and Network Attached Storage, or NAS, from Ciprico Inc., or Ciprico. We believe this acquisition will open up new markets for us in the enterprise server and workstation markets for data protection internal to the servers and workstations. In particular, the RAIDCore acquisition will allow us to broaden our product portfolio in the redundant array of independent disks, or RAID, market while allowing us to sell into the Band 1 market, and to pursue opportunities at current and target OEM customers. The Ciprico acquisition also provided us with a team of software development professionals located in Minneapolis, Minnesota. We signed our first customer agreement relating to RAIDCore products in May 2009, and began selling to this customer during the third quarter of 2009. Sales in 2009 were not significant. Additionally, we do not anticipate significant sales in 2010.
In December 2009 we announced that TYAN, an industry-leading server platform provider which is part of Mitac International Corporation had selected our RAIDCore Virtual RAID Adapter technology to be featured in its newest server platforms. Also in December 2009, we announced that Advanced Micro Devices or AMD will embed our RAIDCore Virtual RAID Adapter technology into select platforms based on the recently announced AMD SR5690/SP5100 server chipset.
In January 2010, we acquired Cloverleaf Communications Inc., or Cloverleaf, a privately held software company focused on heterogeneous storage virtualization and unified storage technologies. The acquisition of Cloverleaf could broaden our market opportunities and help accelerate our transition from a provider of storage arrays to a provider of storage solutions and software. The Cloverleaf acquisition also provided us with a new team of software developers and other professionals located in Israel. The Cloverleaf Intelligent Storage Networking System, or iSN™, is an intelligent, network resident, storage network management system that provides a combination of benefits, features and capabilities qualified to meet the demands of mid to large-sized data centers. The iSN™ incorporates architecture that delivers linear scalability, strong fault tolerance and high levels of availability. The iSN™’s open software is integrated with off the shelf hardware components and provides interoperability and networking technology flexibility.
We have decided to expand our routes to market beyond our focus on OEMs, and in October of 2009, we launched a Dot Hill channel program targeted at selling through distributors and OSPs. We believe this will provide Dot Hill with additional sales channels for all of our products.
Our agreements with our customers do not contain any minimum purchase commitments and may be terminated at any time upon notice from the applicable customer. Our ability to achieve profitability will depend on, among other things, the level and mix of orders we actually receive from such customers, the actual amounts we spend on marketing support, the actual amounts we spend for inventory support and incremental internal investment, our ability to reduce product cost, our product lead time, our ability to meet delivery schedules required by our customers and the economic environment.
Our products and services are sold worldwide to facilitate server and SAN storage implementations, primarily through original equipment manufacturers, or OEMs, and supplemented by system integrators, or SIs, distributors and value added resellers, or VARs. Our OEM channel partners currently include, among others, Hewlett-Packard, or HP, NetApp, Inc., or NetApp, Motorola, Inc., or Motorola, General Dynamics Government Systems Corporation, or General Dynamics, Lockheed Martin Corporation, or Lockheed Martin, Fujitsu Technology Solutions GmbH, or FTS, and Sun Microsystems, or Sun.
We began shipping products to HP in the fourth quarter of 2007. In January 2008, we amended our agreement with HP to allow for sales to additional divisions within HP. Our products are primarily sold within HP’s MSA 2000 product family. Sales to HP increased significantly during 2008 and increased again in 2009 primarily as a result of the successful launch and market acceptance of the HP MSA 2000 product in 2008 as well as the successful launch of follow-on products in 2009. The agreement with HP does not contain any minimum purchase commitments and the term of the agreement was extended from one to five years. Net revenue from HP approximated 51% of our total net revenue in 2009.
42
Table of Contents
Pursuant to our Development and OEM Supply Agreement with NetApp, we are designing and developing general purpose disk arrays for a variety of products to be sold under private label by NetApp. We began shipping products to NetApp under the agreement for general availability in the third quarter of 2007, and net revenue from NetApp increased significantly during 2008. Net revenue from NetApp decreased slightly in 2009 primarily as a result of general economic conditions. Net revenue from NetApp approximated 25% of our total net revenue in 2009.
We have experienced a decline in net revenue from Sun primarily due to the products nearing the end of their lifecycle. Net revenues from Sun approximated 4% of our total net revenue in 2009. We do not expect to generate significant net revenue from Sun in future periods.
We have also experienced a decline in net revenue from FTS as a result of its decision to internally source the products we sell to them. Net revenue from FTS approximated 5% of our total net revenues in 2009. We expect net revenue from FTS to continue to decline in future periods as a result of this transition.
In addition, the demand for our products has been affected in the past, and may continue to be affected in the future, by various factors, including, but not limited to, the following:
| • | general economic and political conditions and specific conditions in the markets we address, including the continuing volatility in the technology sector, current general economic volatility and trends in the data storage markets in various geographic regions; |
| • | the inability of certain of our customers who depend on credit to have access to their traditional sources of credit to finance the purchase of products from us, particularly in the current global economic environment, which may lead them to reduce their level of purchases or to seek credit or other accommodations from us; and |
| • | the timing, rescheduling or cancellation of significant customer orders and our ability, as well as the ability of our customers, to manage inventory. |
For these and other reasons, our net revenue and results of operations in 2009 and prior periods may not necessarily be indicative of future net revenue and results of operations.
Our strategy includes outsourcing substantially all of our manufacturing to third-party manufacturers in order to reduce sales cycle times and manufacturing infrastructure, enhance working capital and improve margins by taking advantage of the third parties’ manufacturing and procurement economies of scale. We have historically outsourced substantially all of our manufacturing operations to Flextronics International Limited, or Flextronics. In February 2007, we entered into a manufacturing agreement with MiTAC International Corporation, or MiTAC, a leading provider of contract manufacturing and original design manufacturing services, and SYNNEX Corporation, or SYNNEX, a leading global information technology, or IT, supply chain services company. We began shipping products for general availability under the MiTAC and SYNNEX agreement in 2007.
In September 2008, we entered into a manufacturing agreement with Foxconn Technology Group, or Foxconn. Under the terms of the agreement, Foxconn supplies us with manufacturing, assembly and test services from its facilities in China and final integration services including final assembly, testing and configure-to-order services, through its worldwide facilities. The agreement provides for an initial three-year term that is automatically renewed at the end of such three-year term for additional one-year terms unless and until the agreement is terminated by either party. Foxconn began manufacturing products for us in July 2009 and we began shipping products for general availability under the Foxconn agreement during the second half of 2009. We expect Foxconn to manufacture a larger percentage of our products in 2010.
We derive the majority of our net revenues primarily from sales of our Series 2000 family of products and we are continuing to transition SANnet II customers to our Series 2000 and Series 5000 family of products.
43
Table of Contents
Cost of goods sold includes costs of materials, subcontractor costs, salary and related benefits for the production and service departments, depreciation of equipment used in the production and service departments, production facility rent and allocation of overhead as well as manufacturing variances and freight.
Sales and marketing expenses consist primarily of salaries and commissions, advertising and promotional costs and travel expenses. Research and development expenses consist primarily of project-related expenses and salaries for employees directly engaged in research and development. General and administrative expenses consist primarily of compensation to officers and employees performing administrative functions, expenditures for administrative facilities as well as expenditures for legal and accounting services and fluctuations in currency valuations.
Other income is comprised primarily of interest income earned on our cash and cash equivalents and other miscellaneous income and expense items.
In December 2008, our management approved, committed to, and initiated plans to restructure and improve efficiencies in our operations. The restructuring was due to a combination of factors, primarily driven by the economic downturn, but also driven by our plan to consolidate our facilities in Carlsbad, California into the Longmont, Colorado facility. The consolidation is currently in process and we anticipate it will be completed by June 30, 2010.
Critical Accounting Policies and Estimates
Our discussion and analysis of our financial condition and results of operations are based upon our consolidated financial statements, which have been prepared in accordance with accounting principles generally accepted in the United States of America. The preparation of these financial statements requires management to make estimates and assumptions that affect the reported amounts of assets and liabilities at the dates of the financial statements and the reported amounts of net revenue and expenses in the reporting periods. We base our estimates on current facts, historical experience and on various other assumptions that are believed to be reasonable under the circumstances, the results of which form the basis for making judgments about the carrying values of assets and liabilities and the accrual of costs and expenses that are not readily apparent from other sources. We evaluate these estimates on an ongoing basis. Actual results may differ from these estimates under different assumptions or conditions. To the extent there are material differences between the estimates and the actual results, future results of operations will be affected.
We have many accounting policies that require us to make estimates and assumptions; the determination of useful lives of long-lived assets, warranty reserves, accruals for estimated restructuring, tax and legal liabilities and valuation allowance for deferred tax assets. The items listed below are not inclusive of all of our accounting policies but is a listing, identified by management, of those policies which require the most significant judgments and estimates to be made in the preparation of the consolidated financial statements.
Revenue Recognition
We recognize product revenue when the following fundamental criteria are met: (i) persuasive evidence of an arrangement exists; (ii) delivery has occurred; (iii) the price is fixed or determinable; and (iv) collectability is reasonably assured. Revenue is recognized for product sales upon transfer of title and risk of loss to the customer. We record reductions to revenue for estimated product returns and pricing adjustments in the same period that the related revenue is recorded. These estimates are based on historical sales returns, analysis of credit memo data and other factors known at the time. If actual future returns and pricing adjustments differ from past experience and our estimates, additional revenue reserves may be required. Our out-of warranty repairs primarily consist of product repair services performed by our contract manufacturers for those customers that allowed their original product warranty to expire without purchasing one of our higher level support service plans. Revenue from these out-of-warranty repairs, and the associated cost of sales, is recognized in the period these services are
44
Table of Contents
provided and represent the majority of service revenue. To a lesser degree, service revenue consists of product maintenance contracts. Revenue from our product maintenance contracts is deferred and recognized ratably over the contract term, generally 12 to 36 months. We defer revenue on upfront nonrefundable payments from our customers and recognize it ratably over the term of the agreement, unless the payment is in exchange for products delivered that represent the culmination of a separate earnings process. When we provide consideration to a customer we recognize the value of that consideration as a reduction in net revenue. We may be required to maintain inventory, or hubbing, arrangements with certain of our largest OEM customers. Pursuant to these arrangements we deliver products to a customer or a designated third-party warehouse based upon the customer’s projected needs, but do not recognize product revenue unless and until the customer has removed our product from the warehouse to incorporate into its end products.
Valuation of Inventories
Inventories are comprised of finished goods and purchased parts and assemblies, which include direct labor and overhead, and are valued at the lower of cost (first-in, first-out method) or market value. The valuation of inventory requires us to estimate excess or obsolete inventory. The determination of excess or obsolete inventory requires us to estimate the future demand for our products. Because our markets are volatile, are subject to technological risks, price changes and inventory reduction programs by our customers, and as we are required to make last-time buys of certain components on occasion, there is a risk that we will forecast incorrectly and produce excess inventories of particular products or have commitments to purchase excess inventory components from our suppliers. As a result, actual demand will differ from forecasts, and such a difference has in the past and may in the future have a material adverse effect on our gross margin and our results of operations. Any write downs to inventory due to the existence of excess quantities, physical obsolescence, changes in pricing, damage, or other causes establish a new cost basis for the inventory. When we sell or dispose of reserved inventory the new cost basis is charged to cost of sales. The largest factor affecting the accuracy of our provisions for excess inventories is the accuracy of our production and service forecasts of end-customer demand. The accuracy of our estimates depends in part on the accuracy of the non-binding forecasts we get from our end customers, the accuracy of our own forecast of warranty requirements of our customers, the demand for storage systems in our market segments and the speed at which our products are designed in or out of our customers’ products.
Share-Based Compensation
We account for share-based compensation by measuring and recognizing share-based compensation expense for equity based awards granted, including stock options, restricted stock awards, performance-based restricted stock awards and employee stock purchase plan shares, for which expense will be recognized over the service period of the equity based award based on the fair value of the award, at the date of grant. The estimation of stock option and employee stock purchase plan fair value requires management to make complex estimates and judgments about, among other things, employee exercise behavior, forfeiture rates and the volatility of our common stock. These judgments directly affect the amount of compensation expense that will ultimately be recognized. Compensation expense for restricted stock awards is measured based on the fair-value of the award on the grant date (fair-value is calculated based on the closing price of our common stock on the date of grant) multiplied by the number of shares granted, and is recognized as expense over the respective vesting period. Compensation expense for performance-based restricted stock awards is measured similarly to restricted stock, however, compensation expense is only recorded for awards that ultimately vest, which is contingent upon employees achieving various performance criteria. We currently use the Black-Scholes option pricing model to estimate the fair value of our stock options and employee stock purchase plan shares. The fair values generated by the Black-Scholes model may not be indicative of the actual fair values of our stock options and employee stock purchase plan shares as it does not consider certain factors important to those awards to employees, such as continued employment and periodic vesting requirements as well as limited transferability. The determination of the fair value of share-based payment awards utilizing the Black-Scholes model is affected by our stock price and a number of assumptions, including expected volatility, expected life, risk-free interest rate and expected dividends. We use historical volatility of our stock for the expected life of the grant as the expected volatility
45
Table of Contents
assumption required in the Black-Scholes model. Our selection of the historical volatility approach is due to the limited availability of data regarding actively traded options on our stock. The expected life of the stock options is based on historical and other economic data trended into the future. The risk-free interest rate assumption is based on observed interest rates appropriate for the terms of our stock options and employee stock purchase plan shares. The dividend yield assumption is based on our history and expectation of dividend payouts. We evaluate the assumptions used to value stock options on a quarterly basis. If factors change and we employ different assumptions, share-based compensation expense may differ significantly from what we have recorded in the past. If there are any modifications or cancellations of the underlying unvested securities, we may be required to accelerate, increase or cancel any remaining unearned share-based compensation expense.
Valuation of Long-Lived Assets
Long-lived assets consist primarily of intangible assets with finite lives and property and equipment. We evaluate long-lived assets for impairment whenever events or changes in circumstances indicate that their carrying value may not be recoverable. We assess the recoverability of the assets based on the undiscounted future cash flows the assets are expected to generate and recognize an impairment loss when estimated undiscounted future cash flows expected to result from the use of the assets plus net proceeds expected from disposition of the assets, if any, are less than the carrying value of the assets. If an asset is deemed to be impaired, the amount of the impairment loss represents the excess of the asset’s carrying value compared to its estimated fair value. Fair value estimates are based on assumptions concerning the amount and timing of estimated future cash flows and assumed discount rates, reflecting varying degrees of perceived risk. As of December 31, 2008, we identified a change in circumstances that indicated the carrying amount of our long-lived assets may not be recoverable due to the significant economic downturn at that time, which caused a substantial decline in our market capitalization. As of December 31, 2008, the carrying value of our equity significantly exceeded our market capitalization. Our long-lived assets at that time consisted of our identifiable intangible assets associated with our recent acquisition of certain identified Ciprico assets acquired in September 2008 with a carrying value of $4.2 million, our licensed patent portfolio of $1.0 million and property and equipment of $6.6 million. Based upon management’s estimates of undiscounted cash flows, coupled with the recent acquisition of the Ciprico assets which established fair value for the assets, we determined that the carrying value of the acquired Ciprico assets approximates fair value and therefore no impairment was identified. The remaining long-lived assets with a carrying value of $7.6 million were tested for impairment at the lowest level for which identifiable cash flows that are largely independent of the cash flows of other groups of assets were available. We determined the fair value of the impaired assets by discounting the forecasted future net cash flows from the operations to which the assets relate, based on management’s best estimates using appropriate assumptions and projections. Our impairment analysis as of December 31, 2008 identified $5.4 million of impaired long-lived assets consisting of $4.4 million of property and equipment and our $1.0 million licensed patent portfolio. The long-lived asset impairment is recorded as a separate component of operating expenses for the year ended December 31, 2008. No impairments of long-lived assets were recognized for the years ended December 31, 2007 or 2009.
46
Table of Contents
Results of Operations
The following table sets forth certain items from our statements of operations as a percentage of net revenue for the periods indicated (percentages may not add due to rounding):
| Years Ended December 31, | |||||||||
| 2007 | 2008 | 2009 | |||||||
| Net revenue |
100.0 | % | 100.0 | % | 100.0 | % | |||
| Cost of goods sold |
87.2 | 88.9 | 83.9 | ||||||
| Gross profit |
12.8 | 11.1 | 16.1 | ||||||
| Operating expenses: |
|||||||||
| Sales and marketing |
7.7 | 5.1 | 4.7 | ||||||
| Research and development |
10.9 | 10.5 | 12.0 | ||||||
| General and administrative |
6.1 | 4.7 | 4.3 | ||||||
| Restructuring charge |
— | 0.3 | 1.0 | ||||||
| Legal settlement |
— | (1.5 | ) | — | |||||
| Goodwill and long-lived asset impairment charge |
19.7 | 2.0 | — | ||||||
| Total operating expenses |
44.4 | 21.1 | 22.0 | ||||||
| Operating loss |
(31.6 | ) | (10.0 | ) | (5.9 | ) | |||
| Other income, net |
2.4 | 0.6 | 0.1 | ||||||
| Loss before income taxes |
(29.2 | ) | (9.4 | ) | (5.8 | ) | |||
| Income tax expense (benefit) |
(0.1 | ) | 0.1 | 0.0 | |||||
| Net loss |
(29.1 | )% | (9.5 | )% | (5.8 | )% | |||
Year Ended December 31, 2008 Compared to Year Ended December 31, 2009
Net Revenue
| 2008 | 2009 | (Decrease) | % Change | ||||||||||
| (in thousands, except percentages) | |||||||||||||
| Net Revenue |
$ | 272,879 | $ | 234,383 | $ | (38,496 | ) | (14.1 | )% | ||||
The reduction in net revenue was substantially due to a decrease in sales volume and was primarily attributable to a decrease in net revenue from Sun, which sells our SANnet II family of products under the ST-3000 brand product line. Our net revenue from Sun decreased 85% in 2009 compared to 2008 and totaled 24.6% of our total net revenue in 2008 and 4.4% of our total net revenue in 2009. The decline in Sun net revenue is primarily due to the products we sell Sun nearing the end of their lifecycle. We do not expect to generate a significant amount of net revenue from Sun in future periods. We also experienced a reduction in net revenue from NetApp in 2009 compared to 2008 primarily as a result of general economic conditions. In addition, net revenue from FTS decreased in 2009 compared to 2008 as a result of its decision to internally source the product we sell to FTS. We expect net revenue from FTS to continue to decline in future periods as a result of this transition. We also believe that the economic recession had a negative impact on our revenue. These reductions in net revenue were partially offset by an increase in net revenue from HP who sells a version of our Series 2000 family of products within their MSA 2000 product family. Our net revenue from HP totaled 32.6% of our total net revenue in 2008 compared to 51.4% of our total net revenue in 2009. The increase in HP net revenue is primarily due to the successful launch and market acceptance of the HP MSA 2000 product in 2008 as well as the successful launch of follow-on products in 2009.
47
Table of Contents
Cost of Goods Sold and Gross Profit
| 2008 | % of Net Revenue | 2009 | % of Net Revenue | (Decrease) Increase |
% Change | ||||||||||||||
| (in thousands, except percentages) | |||||||||||||||||||
| Cost of Goods Sold |
$ | 242,491 | 88.9 | % | $ | 196,556 | 83.9 | % | $ | (45,935 | ) | (18.9 | )% | ||||||
| Gross Profit |
$ | 30,388 | 11.1 | % | $ | 37,827 | 16.1 | % | $ | 7,439 | 24.5 | % | |||||||
The decrease in cost of goods sold and increase in gross profit as percentages of net revenue were primarily attributable to the success of our product cost reduction and value engineering initiatives over the past year which has significantly reduced our costs for both our Series 2000 products that we sell to HP and other customers as well as the products we sell to NetApp. Another factor that contributed to the reduction in cost of goods sold was the $38.5 million decrease in net revenue. Additionally, gross profit was positively impacted by $1.1 million as a result of the recognition of revenue and costs of goods sold associated with the completion of our long-term contract accounted for under the completed contract method. Also contributing to the decrease in cost of goods sold and increase in gross profit were lower manufacturing variances and overhead, which declined by $5.9 million in 2009 compared to 2008. This decrease was due to a reduction in payroll related costs and efficiencies gained in our manufacturing and supply chain activities, offset by a $1.5 million inventory reserve charge primarily associated with Sun end of life inventory and to a lesser degree certain excess component parts of our Series 2000 products. In addition, depreciation and amortization declined in 2009 by $1.6 million due to the fourth quarter 2008 impairment and write off of certain long-lived assets, as well as an intangible asset fully amortizing in the third quarter of 2008. Partially offsetting the increase in gross profit was a decrease in net revenue from our higher margin products sold to SANnet II customers; primarily Sun.
Sales and Marketing Expenses
| 2008 | % of Net Revenue | 2009 | % of Net Revenue | (Decrease) | % Change | ||||||||||||||
| (in thousands, except percentages) | |||||||||||||||||||
| Sales and Marketing Expenses |
$ | 13,878 | 5.1 | % | $ | 10,970 | 4.7 | % | $ | (2,908 | ) | (21.0 | )% | ||||||
The majority of the decrease in sales and marketing expenses in both absolute dollars and as a percentage of net revenue was primarily attributable to lower salaries, bonuses, commissions and other employee related expenses of approximately $1.2 million, a reduction in various marketing expenses of $0.7 million, a decline in other professional fees of $0.1 million, a decrease in allocated common costs of $0.4 million, a reduction in depreciation expense of $0.2 million and a decrease in severance of $0.3 million. Lower overall headcount contributed to the decline in salaries, commissions and other employee-related expenses including travel. The reduction in allocated common costs was a direct result of our 2008 restructuring activities, as well as our 2008 long-lived asset impairment charge, which resulted in lower facility costs and depreciation expense in 2009. The decrease in marketing expenses is due to our cost containment initiatives. Other professional fees were reduced as lower net revenue resulted in lower outside commissions. Severance decreased due to our Executive Vice President of Sales and Operations leaving the company in 2008.
Research and Development Expenses
| 2008 | % of Net Revenue | 2009 | % of Net Revenue | (Decrease) | % Change | ||||||||||||||
| (in thousands, except percentages) | |||||||||||||||||||
| Research and Development Expenses |
$ | 28,709 | 10.5 | % | $ | 28,120 | 12.0 | % | $ | (589 | ) | (2.1 | )% | ||||||
The majority of the decrease in research and development expense in 2009 compared to 2008 was primarily the result of a decrease in project materials, tooling, outside testing, test equipment and non-recurring engineering of $2.1 million in the aggregate. We incurred a significant amount of development costs associated with the ramp up of the HP product line in 2008. This development activity resulted in significant project
48
Table of Contents
materials, tooling, outside testing, test equipment and non-recurring engineering. These costs were not incurred to the same degree in 2009. In addition, during the fourth quarter of 2009, we determined it probable that the amount of contingent consideration due to Ciprico would be considerably lower than initially expected based on lower actual and projected sales of products eligible for the contingent consideration through the end of the contingent consideration period. Accordingly, we reduced the contingent consideration liability and research and development expense in the statement of operations to reflect the $0.6 million reduction in estimated contingent consideration liability. See Note 3 of the Notes to Consolidated Financial Statements for more details. We also experienced a reduction in depreciation of $0.2 million and a decrease in allocated common costs of $0.5 million. The reduction in allocated common costs was a direct result of our 2008 restructuring activities, as well as our 2008 long-lived asset impairment charge, which resulted in lower facility costs and depreciation expense during the twelve months ended December 31, 2009. The remainder of the decline in costs of $0.5 million related to declines in routine costs related to research and development activities, none of which were individually significant. These decreases were partially offset by higher salaries and other payroll related expenses of $1.9 million in the aggregate, an increase in intangible asset amortization of $0.8 million and growth in consultant expenses of $0.6 million. The increase in salaries and other payroll related expenses was a direct result of hiring engineers to support HP as well as other development projects related to our strategic initiatives. Additionally, we hired new employees to support development activities related to the September 2008 acquisition of assets from Ciprico. The increase in intangible amortization is due to the amortization of certain intangible assets acquired from Ciprico, which were only outstanding for a portion of the prior year. The increase in consultant expenses are directly related to our ongoing development activities.
General and Administrative Expenses
| 2008 | % of Net Revenue | 2009 | % of Net Revenue | (Decrease) | % Change | ||||||||||||||
| (in thousands, except percentages) | |||||||||||||||||||
| General and Administrative Expenses |
$ | 12,779 | 4.7 | % | $ | 10,139 | 4.3 | % | $ | (2,640 | ) | (20.7 | )% | ||||||
The majority of the reduction in general and administrative expenses in absolute dollars and as a percentage of net revenue is primarily due to a decrease in professional fees of $1.5 million, recruiting fees of $0.4 million, IT and other consulting costs of $0.7 million, allocated common costs of $0.4 million, payroll related expenses of $0.2 million, insurance fees of $0.2 million and building rent of $0.1 million. The decreases in professional fees, consultant fees, and insurance fees are a result of lower negotiated fees with our service providers. Recruiting costs declined as we had limited recruiting activity in 2009. IT consulting costs decreased as consultants were replaced with full-time employees. Payroll related costs declined as a result of a reduction in headcount. The reduction in allocated common costs was a direct result of our 2008 restructuring activities, as well as our 2008 long-lived asset impairment charge, which resulted in lower facility costs and depreciation expense in 2009. Building rent was lower as a direct result of closing our Netherlands office during the first quarter of 2008. These decreases were offset by increases in board of director fees of $0.2 million and an unfavorable foreign current exchange fluctuation of $0.7 million.
Restructuring Charge
| 2008 | % of Net Revenue | 2009 | % of Net Revenue | Increase | % Change | |||||||||||||
| (in thousands, except percentages) | ||||||||||||||||||
| Restructuring Charge |
$ | 813 | 0.3 | % | $ | 2,430 | 1.0 | % | $ | 1,617 | 198.9 | % | ||||||
In December 2008, our management approved, committed to, and initiated a restructuring plan to improve efficiencies in our operations, which was largely driven by our plan to consolidate our facility in Carlsbad, California into the Longmont, Colorado facility. The increase in restructuring charges incurred is primarily the result of additional contract termination costs as we exited an additional portion of our Carlsbad facility in 2009.
49
Table of Contents
Also contributing to the increase were higher severance related costs, which are recognized ratably over the continuing service period, and certain facility relocation costs incurred in 2009. See Note 6 of the Notes to Consolidated Financial Statements for more details.
Legal Settlement
| 2008 | % of Net Revenue | 2009 | % of Net Revenue | (Decrease) | % Change | |||||||||||||||
| (in thousands, except percentages) | ||||||||||||||||||||
| Legal Settlement |
$ | (4,036 | ) | (1.5 | )% | $ | — | 0.0 | % | $ | (4,036 | ) | (100.0 | )% | ||||||
We received legal settlement proceeds in 2008 from two cases. The proceeds from the first legal settlement of $3.8 million reflects a claim we filed in February 2007 for arbitration in Denver, Colorado alleging that the representative of the Chaparral shareholders was wrongfully withholding escrow funds due to us as a result of damages incurred by us relating to a completed patent infringement lawsuit filed by Crossroads. The proceeds from the second legal settlement of $0.2 million reflects a claim we filed in December 2006 against Infortrend for breach of the settlement agreement with Crossroads whereby Infortrend withheld $1.475 million for Taiwanese taxes. Such amounts are reported as a reduction in operating expenses for 2008.
Goodwill and Long-lived Asset Impairment Charge
| 2008 | % of Net Revenue | 2009 | % of Net Revenue | (Decrease) | % Change | ||||||||||||||
| (in thousands, except percentages) | |||||||||||||||||||
| Long-lived Asset Impairment Charge |
$ | 5,432 | 2.0 | % | $ | — | 0.0 | % | $ | (5,432 | ) | (100.0 | )% | ||||||
At December 31, 2008, we identified a change in circumstances that indicated the carrying amount of certain of our long-lived assets may not be recoverable due to the significant economic downturn at that time and resulting decrease in our market capitalization. As a result, we incurred an impairment charge of $5.4 million, consisting of $4.4 million of property and equipment and $1.0 million related to our licensed patent portfolio, which represents the difference between the carrying value and our estimate of the fair value of those assets. See Note 1 of the Notes to Consolidated Financial Statements for more details.
Other Income
| 2008 | % of Net Revenue | 2009 | % of Net Revenue | (Decrease) | % Change | ||||||||||||||
| (in thousands, except percentages) | |||||||||||||||||||
| Other Income, net |
$ | 1,612 | 0.6 | % | $ | 167 | 0.1 | % | $ | (1,445 | ) | (89.6 | )% | ||||||
The decrease in other income, net is primarily attributable to a decrease in interest income of $1.4 million. The decrease in interest income is primarily attributable to declining interest rates and a more conservative investment strategy in 2009.
Income Taxes
We recorded income tax expense of $0.2 million for the year ended December 31, 2008 compared to an income tax benefit of $0.1 million for the year ended December 31, 2009. Our effective income tax rate of 0.3% for the year ended December 31, 2009 differs from the United States federal statutory rate due to our United States and foreign deferred tax asset valuation allowance position, foreign taxes and state taxes.
50
Table of Contents
Year Ended December 31, 2008 Compared to Year Ended December 31, 2007
Net Revenue
| 2007 | 2008 | Increase | % Change | |||||||||
| (in thousands, except percentages) | ||||||||||||
| Net Revenue |
$ | 207,095 | $ | 272,879 | $ | 65,784 | 31.8 | % | ||||
The increase in net revenue is primarily attributable to the growth in net revenue from HP, who sells a version of our Series 2000 family of products, and from NetApp, partially offset by a decrease in net revenue from Sun who sells our SANnet II family of products under the ST-3000 brand product line. Our net revenue from HP for the year ended December 31, 2008 totaled 32.6% of total net revenue and is net of a $2.3 million reduction in net revenues, representing the fair value of the warrant issued to HP to induce them to enter into an amended manufacturing agreement with us in January 2008. There was no significant net revenue from HP for the year ended December 31, 2007. The substantial increase in HP net revenue is due to the launch and market acceptance of the HP MSA 2000 product line in March 2008, which is based on our supplied products. Additionally, the HP net revenue included a $3.0 million reimbursement from HP which was negotiated to effectively defer the price reductions provided to HP effective July 1, 2008 to January 1, 2009. We achieved certain unit shipment quantities for the three months ended September 30, 2008 and December 31, 2008 to earn the reimbursement. The entire amount is also reflected in gross profit. Our net revenue from NetApp increased 144% from the year ended December 31, 2007 as compared to the year ended December 31, 2008. For the year ended December 31, 2007, net revenue from NetApp totaled 12.5% of our total net revenue, compared to 23.2% of our total net revenue for the year ended December 31, 2008. The rapid growth in net revenue from NetApp was driven by NetApp’s product launch during the third quarter of 2007, while 2008 net revenues consisted of a full year of NetApp net revenue. Our net revenues from Sun decreased 49%, from the year ended December 31, 2007 as compared to the year ended December 31, 2008. For the year ended December 31, 2007, net revenue from Sun totaled 63.2%, of our total net revenue, compared to 24.6% of our total net revenue for the year ended December 31, 2008. The decline in Sun net revenue is primarily due to the products nearing the end of their lifecycle and the lack of development of follow-on products for the ST-3000 line having been developed to date. We expect net revenue from Sun to continue to decline over future periods.
Cost of Goods Sold
| 2007 | % of Net Revenue | 2008 | % of Net Revenue | Increase | % Change | |||||||||||||
| (in thousands, except percentages) | ||||||||||||||||||
| Cost of Goods Sold |
$ | 180,662 | 87.2 | % | $ | 242,491 | 88.9 | % | $ | 61,829 | 34.2 | % | ||||||
The increase in cost of goods sold in absolute dollars was primarily due to a 31.8% growth in net revenue. The slight increase in cost of goods sold as a percentage of net revenue was attributable to a change in product and customer sales mix. Net revenue from our highest margin product, sold to Sun and other SANnet II customers, declined as a percentage of total net revenue. Sun net revenue decreased from 63.2% of total net revenue for the year ended December 31, 2007 to 24.6% of total net revenue for the year ended December 31, 2008. This was replaced by lower margin net revenue from our Series 2000 products, primarily sold to HP and to a lesser extent to FTS, as well as net revenue from product sold to NetApp. Cost of goods sold as a percentage of net revenue associated with our Series 2000 products, improved significantly from the year ended December 31, 2007 as compared to the year ended December 31, 2008 as the Series 2000 product first started shipping in the third quarter of 2006 and was initially manufactured in a mostly soft tooled environment resulting in higher cost of goods sold. Also, we substantially completed the transition of the manufacturing of our Series 2000 products from Flextronics to MiTAC and SYNNEX and have been able to take advantage of their lower manufacturing costs. This transition was largely completed during the fourth quarter of 2007. In September 2008, we entered into a manufacturing agreement with Foxconn. Under the agreement, Foxconn will supply us with manufacturing, assembly and test services from its facilities in China and final integration services including
51
Table of Contents
final assembly, testing and configure-to-order services through its worldwide facilities. Additionally, the Series 2000 product cost of goods sold has declined as a percentage of revenue due to our ability to leverage the higher volumes from HP to negotiate lower component costs. In addition, we initiated several value engineering projects to lower product costs. Our historical experience indicates that gross profits on new products sold to new customers start out low initially and increase over the first several quarters. Thereafter the gross profit improvements are generally more modest. The cost of goods sold as a percentage of net revenue on our business with NetApp improved from the year ended December 31, 2007 as compared to the year ended December 31, 2008 primarily for the same reasons as for the Series 2000 products. The product we sell to NetApp does not include higher margin value added features such as RAID controllers. We anticipate that cost of goods sold, as a percentage of revenue, could decline due to the success of our continued efforts to reduce product costs, primarily through component cost reduction and reengineering efforts, as well as the potential to increase revenue from higher margin products, such as our series 5000 products and sales of our DMS software and RAIDCore software.
Gross Profit
| 2007 | % of Net Revenue | 2008 | % of Net Revenue | Increase | % Change | |||||||||||||
| (in thousands, except percentages) | ||||||||||||||||||
| Gross Profit |
$ | 26,433 | 12.8 | % | $ | 30,388 | 11.1 | % | $ | 3,955 | 15.0 | % | ||||||
The increase in gross profit in absolute dollars from the year ended December 31, 2007 compared to the year ended December 31, 2008 was primarily attributable to an increase in net revenue of $65.8 million, or 31.8%, and a change in product and customer mix. Net revenue on our highest margin product, sold to Sun, declined as a percentage of total net revenue from 63.2% of net revenue for the year ended December 31, 2007 to 24.6% of net revenue for the year ended December 31, 2008. This was replaced by lower margin net revenue from our Series 2000 products and net revenue from NetApp. Net revenue from our Series 2000 products and net revenue from NetApp represented 26% of our net revenue for the year ended December 31, 2007 compared to 68% of our net revenue for the year ended December 31, 2008. Additionally, the increase in gross profit is due to the $3.0 million reimbursement from HP further discussed in net revenue above, as well as $0.3 million related to a legal settlement.
Sales and Marketing Expenses
| 2007 | % of Net Revenue | 2008 | % of Net Revenue | (Decrease) | % Change | ||||||||||||||
| (in thousands, except percentages) | |||||||||||||||||||
| Sales and Marketing Expenses |
$ | 15,939 | 7.7 | % | $ | 13,878 | 5.1 | % | $ | (2,061 | ) | (12.9 | )% | ||||||
The majority of the decrease in sales and marketing expenses in both absolute dollars and as a percentage of net revenues was primarily attributable to lower salaries, commissions and other employee related expenses of $1.3 million in the aggregate. Additionally, amortization of intangibles decreased by $0.5 million and severance declined by approximately $0.4 million. These decreases were offset by an increase in allocated costs of $0.3 million. Lower overall headcount contributed to the reduction in salaries, commissions and other employee-related expenses. Amortization decreased due to our customer relationship intangible asset becoming fully amortized in 2007. The decrease in severance was due to the termination of a key employee in one of our international offices in 2007 of $0.7 million offset by severance costs of several sales employees in 2008 of $0.3 million. Allocated costs increased due to an increase in the expenses that are allocable, primarily related to IT consultant costs.
52
Table of Contents
Research and Development Expenses
| 2007 | % of Net Revenue | 2008 | % of Net Revenue | Increase | % Change | |||||||||||||
| (in thousands, except percentages) | ||||||||||||||||||
| Research and Development Expenses |
$ | 22,564 | 10.9 | % | $ | 28,709 | 10.5 | % | $ | 6,145 | 27.2 | % | ||||||
The majority of the increase in research and development expense in absolute dollars was primarily due to higher project materials and tooling costs, employee-related costs, allocated costs, consultants and amortization of intangibles. Project materials and tooling increased by $2.4 million, and primarily consisted of work on HP specific projects. Employee-related costs grew by $1.7 million, due to increased headcount to support HP and other development projects as well as the hiring of new employees to support development activities related to our recent acquisition of assets from Ciprico. Allocated costs grew by $1.2 million due to an increase in the expenses that are allocable, primarily related to an increase in IT consultant costs, as well as engineering becoming a larger part of the allocation in 2008. Intangible amortization increased by $0.3 million due to the amortization of certain intangible assets acquired from Ciprico in September 2008. Additionally, consultant costs grew by approximately $0.3 million, primarily driven by an increase in project development to support HP.
General and Administrative Expenses
| 2007 | % of Net Revenue | 2008 | % of Net Revenue | Increase | % Change | |||||||||||||
| (in thousands, except percentages) | ||||||||||||||||||
| General and Administrative Expenses |
$ | 12,606 | 6.1 | % | $ | 12,779 | 4.7 | % | $ | 173 | 1.4 | % | ||||||
The majority of the increase in general and administrative expenses was primarily due to a $2.2 million foreign currency gain for the year ended December 31, 2007, compared to a $0.6 million gain for the year ended December 31, 2008. This difference is primarily due to the change in functional currency for our operation in the Netherlands from the Euro to the United States dollar effective January 1, 2008. Other general and administrative expenses decreased $1.5 million primarily due to lower overall legal costs of $1.6 million, Oracle implementation costs of $0.3 million and salaries and insurance of $0.5 million. These decreases were offset by an increase in share-based compensation of $0.5 million and accounting and other professional fees of $0.6 million. Legal fees decreased as a result of our Special Litigation Committee completing the majority of its work in 2007. Salaries decreased due to lower overall headcount, and insurance costs declined as a result of lower negotiated premiums based on our claims experience. Share-based compensation increased due to the granting of a larger number of stock options in the first half of 2008 relative to 2007. Accounting and other professional fees were higher due to the outsourcing of our internal audit and Sarbanes-Oxley work as well as IT consulting fees.
Restructuring Charge
| 2007 | % of Net Revenue | 2008 | % of Net Revenue | Increase | % Change | |||||||||||||
| (in thousands, except percentages) | ||||||||||||||||||
| Restructuring Charge |
$ | 0 | 0 | % | $ | 813 | 0.3 | % | $ | 813 | 100 | % | ||||||
In December 2008, our management approved, committed to and initiated a restructuring plan to improve efficiencies in our operations, which was largely driven by our plan to consolidate our facility in Carlsbad, California into the Longmont Colorado facility. The majority of restructuring charges incurred in 2008 is primarily the result of contract termination costs as we exited a portion of our Carlsbad facility in 2008 and, to a lesser extent, severance related costs. See Note 6 of the Notes to Consolidated Financial Statements for more details.
53
Table of Contents
Legal Settlement
| 2007 | % of Net Revenue | 2008 | % of Net Revenue | (Decrease) | % Change | |||||||||||||||
| (in thousands, except percentages) | ||||||||||||||||||||
| Legal Settlement |
$ | 0 | 0 | % | $ | (4,036 | ) | (1.5 | )% | $ | (4,036 | ) | (100 | )% | ||||||
Legal settlement proceeds were received from two cases. The proceeds from the first legal settlement of $3.8 million reflects a claim we filed in February 2007 for arbitration in Denver, Colorado alleging that the representative of the Chaparral shareholders was wrongfully withholding escrow funds due to us as a result of damages incurred by us relating to a completed patent infringement lawsuit filed by Crossroads. The proceeds from the second legal settlement of $0.2 million reflects a claim we filed in December 2006 against Infortrend for breach of the settlement agreement with Crossroads whereby Infortrend withheld $1.475 million for Taiwanese taxes. Such amounts are reported as a reduction in operating expenses for the year ended December 31, 2008.
Goodwill and Long-lived Asset Impairment Charge
| 2007 | % of Net Revenue | 2008 | % of Net Revenue | (Decrease) | % Change | ||||||||||||||
| (in thousands, except percentages) | |||||||||||||||||||
| Goodwill and Long-lived Asset Impairment Charge |
$ | 40,725 | 19.7 | % | $ | 5,432 | 2.0 | % | $ | (35,293 | ) | (86.7 | )% | ||||||
For the year ended December 31, 2007, we performed an impairment test of the goodwill related to our SANnet reporting unit for each quarter through September 30, 2007. Based upon the results of our impairment tests, management concluded that the fair value of the reporting unit exceeded the carrying value, and therefore the second step of the goodwill impairment test was not required for any quarters through September 30, 2007. During the fourth quarter of 2007 the market value of our common stock substantially declined. As a result of this decline we determined that the goodwill related to our SANnet reporting unit was impaired and the second step of the goodwill impairment test was performed to measure the amount of the impairment resulting in the recognition of an impairment to goodwill of $40.7 million.
At December 31, 2008, we identified a change in circumstances that indicated the carrying amount of certain of our long-lived assets may not be recoverable due to the significant economic downturn at that time. As a result, we incurred an impairment charge of $5.4 million, consisting of $4.4 million of property and equipment and $1.0 million related to our licensed patent portfolio, which represents the difference between the carrying value and our estimate of the fair value of those assets. See Note 1 of the Notes to Consolidated Financial Statements for more details.
Other Income
| 2007 | % of Net Revenue | 2008 | % of Net Revenue | (Decrease) | % Change | ||||||||||||||
| (in thousands, except percentages) | |||||||||||||||||||
| Other Income, net |
$ | 4,996 | 2.4 | % | $ | 1,612 | 0.6 | % | $ | (3,384 | ) | (67.7 | )% | ||||||
The majority of the decrease is due to a decrease in interest income of $3.2 million. The decrease in interest income is primarily attributable to a lower overall cash balance and declining interest rates. Cash and cash equivalents decreased from $82.4 million as of December 31, 2007 to $56.9 million as of December 31, 2008.
Income Taxes
We recorded income tax expense of $0.2 million for the year ended December 31, 2008 compared to an income tax benefit of $0.2 million for the year ended December 31, 2007. Our effective income tax rate of
54
Table of Contents
(0.7)% for the year ended December 31, 2008 differs from the United States federal statutory rate due to our United States and foreign deferred tax asset valuation allowance position, foreign taxes and state taxes.
Liquidity and Capital Resources
The primary drivers affecting cash and liquidity are working capital requirements, net losses, and capital expenditures. Historically, the payment terms we have had to offer our customers have been relatively similar to the terms received from our creditors and suppliers. We typically bill customers on an open account basis subject to our standard credit quality and payment terms ranging between net 30 and net 45 days. If our net revenue increases, it is likely that our accounts receivable balance will also increase. Our accounts receivable could further increase if customers delay their payments or if we grant extended payment terms to customers.
As of December 31, 2009, we had $57.6 million of cash and cash equivalents and $62.0 million of working capital. Cash equivalents include highly liquid investments purchased with an original maturity of 90 days or less and consist principally of money market funds. In addition, we had $0.3 million in short-term debt and $0.3 million in long-term debt at December 31, 2009, consisting of a note payable issued in connection with the acquisition of certain intangible assets from Ciprico.
Operating Activities
Net cash provided by operating activities was $3.4 million in 2009 compared to net cash used in operating activities of $22.4 million in 2008. Operating activities that affected cash consisted primarily of higher gross profit of $7.5 million, resulting largely from lower contract manufacturing costs and an overall decrease in operating expenses, primarily resulting from various cost reduction initiatives implemented in 2008 and 2009. These cost reductions were offset by lower interest income of $1.4 million, resulting from lower interest rates and a more conservative investing strategy in 2009. More specifically, operating activities included a net loss of $13.6 million in 2009, which was partially offset by the following non-cash items: depreciation and amortization of $2.9 million; share-based compensation expense of $2.8 million; a contingent consideration reduction of $0.6 million; and a reduction in bad debt reserve of $0.1 million. Cash flows from operations includes sources of cash of $6.9 million related to an overall decrease in accounts receivables, which was primarily due to lower net revenues in the fourth quarter of 2009 compared to the fourth quarter of 2008 and improved cash collections, a $9.8 million decrease in inventory, which was the direct result of a 2009 management initiative to negotiate to reduce or eliminate the hubbing of finished goods inventory with certain of our customers, and an increase in our restructuring accrual primarily as an increase in accrued contract termination costs and severance costs related to our 2008 restructuring initiative. The severance portion relates to severance costs that were expensed in 2009 but are not going to be paid out until 2010 as well as accrued contract termination costs which were expensed in 2009 but will be paid out over the remainder of the lease term ending in April 2013. Cash flows from operations include uses of cash of $2.6 million related to a decrease in accounts payable due to the timing of payments to our vendors. Additionally, a significant amount of accounts payable was outstanding as of December 31, 2008 due to higher net revenue during the fourth quarter of 2008 compared to lower net revenue during the fourth quarter of 2009, resulting in lower inventory purchases. Additional uses of cash include a $0.4 million increase in prepaid expenses and other assets which was primarily due to a $0.4 million increase in other receivables representing component parts procured by us and sold to our contract manufacturers; a $1.7 million decrease in deferred revenue that was primarily attributable to our recognizing $1.5 million of deferred revenue due to the completion of our long-term firm fixed price contract during 2009; a $0.4 million decrease in accrued compensation and other expenses which was primarily due to a $1.1 million decrease in accrued manufacturing costs related to our obligation to purchase excess inventory from our contract manufacturers, offset by a $0.5 million increase in accrued payroll primarily due to timing of payroll as well as an accrual for bonuses at year end; and a $0.5 million decrease in other long-term liabilities due to the amortization of our deferred rent, amortization of our NetApp deferred revenue and a reduction of our Ciprico contingent consideration liability.
As a result of our ongoing strategic development, planning and evaluation, we have identified a potential higher margin business that we believe will complement our current product offerings. Accordingly, we have
55
Table of Contents
decided to expand our software offerings. We plan to leverage our current products and technology to pursue selling through distributors and OSPs. Our investment in software will require significant investment and development on our part, which will impact our cash and operating results until we generate sufficient revenues to recover our investment.
Investing Activities
Cash used in investing activities in 2009 was $2.9 million, compared to $4.4 million for in 2008. Cash used in investing activities in 2009 was primarily for the addition of data center equipment, leasehold improvements and furniture associated with the expansion of our Longmont, Colorado facility and tooling and equipment at our contract manufacturer locations. Cash used in investing activities in 2008 was primarily due to the purchase of certain indentified intangible assets from Ciprico in the amount of $2.5 million and $1.9 million for the addition of computer hardware and software assets as well as equipment, tooling and leasehold improvements.
Financing Activities
Cash provided by financing activities in 2009 was $0.2 million compared to $1.2 million in 2008. Cash provided by financing activities in 2009 is attributable to the proceeds received from the sale of common stock to employees under our employee stock purchase plan of $0.5 million, partially offset by a decrease of $0.3 million due to the ongoing pay-down of our note payable which is associated with our 2008 acquisition of certain intangible assets from Ciprico. Cash provided by financing activities in 2008 is attributable to the proceeds received from the exercises of stock options under our equity incentive plans of $0.3 million, and the proceeds received from the sale of common stock to employees under our employee stock purchase plan of $0.9 million.
Based on current macro-economic conditions and conditions in the state of the data storage systems markets, our own organizational structure and our current outlook for 2010, we presently expect our cash and cash equivalents will be sufficient to fund our operations, working capital and capital requirements for at least the next 12 months and for operating periods in excess of 12 months.
On January 26, 2010, we acquired 100% of the voting equity interests of Cloverleaf. Our preliminary estimate of the consideration transferred in connection with the acquisition of Cloverleaf approximates $8.8 million, consisting of $0.7 million of cash and 4,758,530 shares of our common stock valued at $8.1 million, or $1.71 per share, which represents the closing price of our common stock on the acquisition date. We paid approximately $1.7 million of assumed Cloverleaf liabilities at the acquisition date and expect to make additional payments during the remainder of the first quarter of 2010, although not to the extent of the amount paid at the acquisition date. We also incurred direct transaction costs of approximately $0.8 million, most of which is expected to be paid in the first half of 2010. As a result, we expect our cash and cash equivalents balance will decrease in the first quarter of 2010. In addition, we agreed to issue 327,977 shares of restricted stock to the employees of Cloverleaf who became employees of Dot Hill on the acquisition date. These shares vest as follows: 1/3 of such shares vest upon issuance, which is expected to be on or about 30 days following the acquisition date; 1/3 of such shares vest one year from the date of issuance; and 1/3 of such shares vest two years from the date of issuance. We are currently evaluating the accounting treatment for this acquisition.
In addition, Cloverleaf’s historical expenses have exceeded their net revenue, which is a trend we expect to continue in 2010. For example, Cloverleaf generated net revenue of $1.2 million and incurred a net loss of $3.9 million in 2009. As a result, we expect that the acquisition of Cloverleaf will be dilutive to our results of operations and also result in a significant net cash outflow in 2010. The amount of cash needed to support the business we acquired from Cloverleaf in 2010 will depend primarily on the timing of capital expenditures, product development costs and additional headcount needed to support customer requirements and improving the existing infrastructure of Cloverleaf’s operations.
The actual amount and timing of working capital and capital expenditures that we may incur in future periods may vary significantly and will depend upon numerous factors, including the timing and extent of net revenue and expenditures from our core business and strategic investments, including the acquisition of
56
Table of Contents
Cloverleaf, the overall level of net profits or losses, our ability to manage our relationships with our contract manufacturers, the potential growth or decline in inventory to support our customers, the status of our relationships with key customers, partners and suppliers, the timing and extent of the introduction of new products and services, growth in operations and the economic environment.
In August 2008, we entered into a credit agreement with Silicon Valley Bank to provide for a revolving credit facility for cash advances and letters of credit of up to an aggregate of $30 million based upon an advance rate of 85% of eligible accounts receivable. The credit agreement expires three years from its effective date. Borrowings under the credit facility bear interest at the prime rate and are secured by substantially all of our accounts receivable, deposit and securities accounts. The agreement provides for a negative pledge on our inventory and intellectual property, subject to certain exceptions, and contains usual and customary covenants for an arrangement of its type, including an obligation for us to maintain at all times a net worth of $55 million (subject to certain increases). The agreement also includes provisions to increase the financing facility by $20 million subject to our meeting certain requirements, including $40 million in borrowing base for the immediately preceding 90 days, and Silicon Valley Bank locating a lender willing to finance the additional facility. In addition, if our cash and cash equivalents net of the total amount outstanding under the credit facility fall below $20 million (measured on a rolling three-month basis), the interest rate will increase to prime plus 1% and additional restrictions will apply. In March 2009, we issued a letter of credit to our contract manufacturer in China in the amount of $5.0 million. This letter of credit was renewed in December 2009.
In July 2009, we amended our credit agreement with Silicon Valley Bank. The amendment reduces our obligation to maintain at all times a net worth of $55 million to $50 million (subject to certain increases) and revises the definition of net worth to add back restructuring expenses and goodwill and long-lived asset impairment charges, subject to certain limitations. The amendment also provides for a cash management services sublimit under the revolving credit line of up to $300,000. All other terms of the credit agreement remain unchanged.
As of December 31, 2009, there were no amounts outstanding under the Silicon Valley Bank line of credit.
The following table summarizes our contractual obligations as of December 31, 2009 (in thousands).
| Contractual Obligations |
Total | 2010 | 2011 | 2012 | 2013 | 2014 + | ||||||||||||
| Operating lease obligations |
$ | 5,589 | $ | 1,753 | $ | 1,758 | $ | 1,687 | $ | 391 | $ | — | ||||||
| Inventory related purchase obligations |
15,806 | 15,806 | — | — | — | — | ||||||||||||
| Other purchase obligations |
1,738 | 1,738 | ||||||||||||||||
| Restructuring obligations |
864 | 864 | — | |||||||||||||||
| Note payable |
607 | 261 | 275 | 71 | — | — | ||||||||||||
| Total |
$ | 24,604 | $ | 20,422 | $ | 2,033 | $ | 1,758 | $ | 391 | $ | — | ||||||
For purposes of the table above, the operating lease obligations exclude common area maintenance, real estate taxes and insurance expenses.
Inventory related purchase obligations represent contractual purchase commitments to our suppliers for certain components in order to ensure supply of select key components at the most favorable pricing.
Other purchase obligations represent purchase commitments made in the ordinary course of business.
Our restructuring obligations represent estimated future severance payments as part of our December 2008 restructuring plan.
In addition to the amounts shown in the table above, $0.2 million of unrecognized tax benefits have been recorded as liabilities in accordance with FIN 48, and we are uncertain as to if or when such amounts may be settled.
Off-Balance Sheet Arrangements
At December 31, 2009, we did not have any relationship with unconsolidated entities or financial partnerships, such as entities often referred to as structured finance variable interest, or special purpose entities,
57
Table of Contents
which would have been established for the purpose of facilitating off-balance sheet arrangements or other contractually narrow or limited purposes. In addition, we did not engage in trading activities involving non-exchange traded contracts. As a result, we are not exposed to any financing, liquidity, market or credit risk that could arise if we had engaged in such relationships. We do not have relationships and transactions with persons and entities that derive benefits from their non-independent relationship with us or our related parties except as disclosed herein.
Recent Accounting Pronouncements
In October 2009, the Financial Accounting Standards Board, or FASB, reached a consensus on Accounting Standards Update, or ASU, No. 2009-13, Revenue Recognition (Topic 605) — Multiple-Deliverable Revenue Arrangements, or ASU 2009-13 and ASU No. 2009-14, Software (Topic 985) — Certain Revenue Arrangements That Include Software Elements, or ASU 2009-14. ASU 2009-13 modifies the requirements that must be met for an entity to recognize revenue from the sale of a delivered item that is part of a multiple-element arrangement when other items have not yet been delivered. ASU 2009-13 eliminates the requirement that all undelivered elements must have either: i) vendor specific objective evidence, or VSOE, or ii) third-party evidence, or TPE, before an entity can recognize the portion of an overall arrangement consideration that is attributable to items that already have been delivered. In the absence of VSOE or TPE of the standalone selling price for one or more delivered or undelivered elements in a multiple-element arrangement, entities will be required to estimate the selling prices of those elements. Overall arrangement consideration will be allocated to each element (both delivered and undelivered items) based on their relative selling prices, regardless of whether those selling prices are evidenced by VSOE or TPE or are based on the entity’s estimated selling price. The residual method of allocating arrangement consideration has been eliminated. ASU 2009-14 modifies the software revenue recognition guidance to exclude from its scope tangible products that contain both software and non-software components that function together to deliver a product’s essential functionality. These new updates are effective for revenue arrangements entered into or materially modified in fiscal years beginning on or after June 15, 2010. Early adoption is permitted. We are currently evaluating the impact that the adoption of these ASUs will have on our future consolidated financial statements.
In June 2009, the FASB issued Accounting Standards Codification, or ASC, No. 810-10-05 which changes the approach to determining the primary beneficiary of a variable interest entity, or VIE, and requires companies to more frequently assess whether they must consolidate VIEs. ASC No. 810-10-05 is effective for annual periods beginning after November 15, 2009. Based on the current nature of our operations, we do not expect the adoption of this requirement will have a material impact on our consolidated financial statements.
In December 2007, the FASB issued FASB Statement No. 141(R), Business Combinations, which has been codified into ASC Topic No. 805. ASC Topic No. 805 establishes principles and requirements for how the acquirer of a business recognizes and measures in its financial statements the identifiable assets acquired, the liabilities assumed, and any noncontrolling interest in the acquiree. The statement also provides guidance for recognizing and measuring the goodwill acquired in the business combination and determines what information to disclose to enable users of the financial statement to evaluate the nature and financial effects of the business combination. This statement also requires that acquisition-related costs are to be recognized separately from the acquisition and expensed as incurred. We are currently evaluating the impact of the revised guidance on business combinations to our acquisition of Cloverleaf in January 2010. See Note 15 of the Notes to Consolidated Financial Statements for further discussion of our acquisition of Cloverleaf.
In April 2008, the FASB issued FASB Staff Position FAS 142-3, Determination of the Useful Life of Intangible Assets, which has been codified into ASC Topic No. 350. ASC Topic No. 350 requires that the useful life of a recognized intangible asset be determined based upon the period of expected cash flows used to measure the fair value of the asset under ASC Topic 805. The guidance for determining the useful life of a recognized intangible asset is to be applied prospectively; therefore, we are currently determining the impact of this guidance on our acquisition of Cloverleaf in January 2010. See Note 15 of the Notes to Consolidated Financial Statements for further discussion of our acquisition of Cloverleaf.
58
Table of Contents
| Item 7A. | Quantitative and Qualitative Disclosures About Market Risk |
Interest Rate Risk
We place our cash equivalents with high-credit-quality financial institutions, investing primarily in money market accounts. We have established guidelines relative to credit ratings, diversification and maturities that seek to maintain safety and liquidity. Our investment strategy generally results in lower yields on investments but reduces the risk to principal in the short term prior to these funds being invested in our business. Our interest income is sensitive to changes in the general level of interest rates. In this regard, changes in interest rates can affect the interest earned on our cash equivalents. As of December 31, 2009 we had a weighted average interest rate of 0.05% on our cash equivalents balance. A 10% unfavorable change in the interest rate would not materially impact our December 31, 2009 balance sheet.
We have a line of credit agreement, which accrues interest on any outstanding balances at the prime rate. As of December 31, 2009, there were no amounts outstanding under this line. If we make borrowings under this line, we will be exposed to interest rate risk on such debt.
Indicated changes in interest rates are based on hypothetical movements and are not necessarily indicative of the actual results that may occur. Future earnings and losses will be affected by actual fluctuations in interest rates.
Foreign Currency Exchange Rate Risk
We conduct a portion of our business in currencies other than the U.S. dollar, the currency in which our consolidated financial statements are reported. The most significant foreign currency to our operations that subject us to foreign currency exchange rate risk for 2009 was the Japanese yen. Correspondingly, our operating results could be adversely affected by foreign currency exchange rate volatility relative to the U.S. dollar. Although we continue to evaluate strategies to mitigate risks related to the effect of fluctuations in currency exchange rates, we will likely continue to recognize gains or losses from international transactions. Although foreign currency transaction gains and losses have not historically been material, future changes in foreign currency rates could adversely impact our operating results. A 10% unfavorable change in the exchange rate would not materially impact our December 31, 2009 balance sheet.
| Item 8. | Financial Statements and Supplementary Data |
The information required by this Item is incorporated by reference from the financial statements beginning on page F-1 of this annual report on Form 10-K.
| Item 9. | Changes In and Disagreements With Accountants On Accounting and Financial Disclosure |
None.
| Item 9A. | Controls and Procedures |
Evaluation of Disclosure Controls and Procedures
Under the supervision and with the participation of our management, including our principal executive officer and principal financial officer, we evaluated the design and operation of our disclosure controls and procedures (as defined in Rules 13a-15(e) and 15d-15(e) of the Securities Exchange Act of 1934, as amended, or the “Exchange Act”) as of December 31, 2009. On the basis of this review, our management, including our principal executive officer and principal financial officer, concluded that our disclosure controls and procedures are designed, and are effective, to give reasonable assurance that the information required to be disclosed by us in reports that we file under the Exchange Act is recorded, processed, summarized and reported within the time periods specified in the rules and forms of the SEC and to ensure that information required to be disclosed in the
59
Table of Contents
reports filed or submitted under the Exchange Act is accumulated and communicated to our management, including our Chief Executive Officer and Chief Financial Officer, in a manner that allows timely decisions regarding required disclosure.
Changes in Internal Control over Financial Reporting
There were no changes in our internal control over financial reporting that occurred in the fourth quarter of 2009 that materially affected, or are reasonably likely to materially affect, our internal control over financial reporting.
Management’s Report on Internal Control Over Financial Reporting
Our management is responsible for establishing and maintaining effective internal control over financial reporting, as such term is defined in the Exchange Act Rules 13a-15(f) and 15d-15(f). Under the supervision and with the participation of our management, including our principal executive officer and principal financial officer, we conducted an evaluation of the effectiveness of our internal control over financial reporting based on the framework in Internal Control — Integrated Framework issued by the Committee of Sponsoring Organizations of the Treadway Commission. Based on our evaluation under the framework in Internal Control — Integrated Framework, our management concluded that our internal control over financial reporting was effective as of December 31, 2009.
The effectiveness of our internal control over financial reporting as of December 31, 2009 has been audited by Deloitte & Touche LLP, an independent registered public accounting firm, as stated in their report, which is included herein.
60
Table of Contents
REPORT OF INDEPENDENT REGISTERED PUBLIC ACCOUNTING FIRM
To the Board of Directors and Stockholders of
Dot Hill Systems Corp. and subsidiaries
Longmont, Colorado
We have audited the internal control over financial reporting of Dot Hill Systems Corp. and subsidiaries (the “Company”) as of December 31, 2009, based on criteria established in Internal Control — Integrated Framework issued by the Committee of Sponsoring Organizations of the Treadway Commission. The Company’s management is responsible for maintaining effective internal control over financial reporting and for its assessment of the effectiveness of internal control over financial reporting. Our responsibility is to express an opinion on the Company’s internal control over financial reporting based on our audit.
We conducted our audit in accordance with the standards of the Public Company Accounting Oversight Board (United States). Those standards require that we plan and perform the audit to obtain reasonable assurance about whether effective internal control over financial reporting was maintained in all material respects. Our audit included obtaining an understanding of internal control over financial reporting, assessing the risk that a material weakness exists, testing and evaluating the design and operating effectiveness of internal control based on the assessed risk, and performing such other procedures as we considered necessary in the circumstances. We believe that our audit provides a reasonable basis for our opinion.
A company’s internal control over financial reporting is a process designed by, or under the supervision of, the company’s principal executive and principal financial officers, or persons performing similar functions, and effected by the company’s board of directors, management, and other personnel to provide reasonable assurance regarding the reliability of financial reporting and the preparation of financial statements for external purposes in accordance with generally accepted accounting principles. A company’s internal control over financial reporting includes those policies and procedures that (1) pertain to the maintenance of records that, in reasonable detail, accurately and fairly reflect the transactions and dispositions of the assets of the company; (2) provide reasonable assurance that transactions are recorded as necessary to permit preparation of financial statements in accordance with generally accepted accounting principles, and that receipts and expenditures of the company are being made only in accordance with authorizations of management and directors of the company; and (3) provide reasonable assurance regarding prevention or timely detection of unauthorized acquisition, use, or disposition of the company’s assets that could have a material effect on the financial statements.
Because of the inherent limitations of internal control over financial reporting, including the possibility of collusion or improper management override of controls, material misstatements due to error or fraud may not be prevented or detected on a timely basis. Also, projections of any evaluation of the effectiveness of the internal control over financial reporting to future periods are subject to the risk that the controls may become inadequate because of changes in conditions, or that the degree of compliance with the policies or procedures may deteriorate.
In our opinion, the Company maintained, in all material respects, effective internal control over financial reporting as of December 31, 2009, based on the criteria established in Internal Control — Integrated Framework issued by the Committee of Sponsoring Organizations of the Treadway Commission.
We have also audited, in accordance with the standards of the Public Company Accounting Oversight Board (United States), the consolidated financial statements as of and for the year ended December 31, 2009 of the Company and our report dated March 16, 2010 expressed an unqualified opinion on those financial statements, and included an explanatory paragraph relating to the adoption of the provisions of accounting guidance now codified as Financial Accounting Standards Board (FASB) Accounting Standards Codification (ASC) Topic 740, Income Taxes, effective January 1, 2007.
/s/ DELOITTE & TOUCHE LLP
San Diego, California
March 16, 2010
61
Table of Contents
| Item 9B. | Other Information |
None.
| Item 10. | Directors, Executive Officers and Corporate Governance |
Some of the information required by this item is incorporated by reference to our Definitive Proxy Statement to be filed with the SEC pursuant to Regulation 14A in connection with our 2010 annual meeting of stockholders under the headings “Election of Directors” and “Section 16(a) Beneficial Ownership Reporting Compliance.” Other information required by this item is incorporated by reference to Item 1 of Part I of this annual report on Form 10-K under the heading “Executive Officers and Key Employees of the Registrant.”
We have adopted a code of ethics that applies to our principal executive officer and principal financial officer, who is also our principal accounting officer. This code of ethics is incorporated in our code of business conduct and ethics that applies to all of our officers, directors and employees. A copy of our code of business conduct and ethics is available on our web site at www.dothill.com. We intend to satisfy the SEC’s disclosure requirements regarding amendments to, or waivers of, the code of business conduct and ethics by posting such information on our web site. A paper copy of our code of business conduct and ethics may be obtained free of charge by writing to our Investor Relations Department at our principal executive office.
| Item 11. | Executive Compensation |
The information required by this item is incorporated by reference to our Definitive Proxy Statement to be filed with the SEC pursuant to Regulation 14A in connection with our 2010 annual meeting of stockholders under the headings “Executive Compensation,” “Compensation Committee Report” and “Compensation Committee Interlocks and Insider Participation.”
| Item 12. | Security Ownership of Certain Beneficial Owners and Management and Related Stockholder Matters |
The information under the heading “Security Ownership of Certain Beneficial Owners and Management” in our Definitive Proxy Statement to be filed with the SEC pursuant to Regulation 14A in connection with our 2010 annual meeting of stockholders is incorporated by reference.
Securities Authorized for Issuance Under Equity Compensation Plans
The following table sets forth our equity securities authorized for issuance under equity compensation plans as of December 31, 2009.
| Stock Plan |
Number of Securities to be Issued Upon Exercise of Outstanding Options and Rights |
Weighted Average Exercise Price of Outstanding Options and Rights |
Number of Securities Remaining Available for Future Issuance | ||||
| 2000 EIP(1) |
5,502,901 | $ | 3.99 | — | |||
| 2009 EIP(1) |
— | $ | — | 5,450,628 | |||
| 2000 ESPP(2) |
Not Applicable | Not Applicable | 4,104,966 | ||||
| 2000 NEDSOP |
640,000 | $ | 4.45 | 273,124 | |||
| Total |
6,142,901 | $ | 4.04 | 9,828,718 | |||
| (1) | Our stockholders approved the 2009 EIP at our Annual Meeting of Stockholders held on June 15, 2009. Following the approval of the 2009 EIP by our stockholders, no additional stock awards may be granted under the 2000 EIP. All outstanding stock awards granted under the 2000 EIP will remain subject to the |
62
Table of Contents
| terms of the 2000 EIP provided, however, that any shares subject to outstanding stock awards granted under the 2000 EIP that expire or terminate for any reason prior to exercise or settlement shall become available for issuance pursuant to awards granted under the 2009 EIP. |
| (2) | Our stockholders approved an amendment to our 2000 ESPP at our Annual Meeting of Stockholders held on June 15, 2009, primarily to increase the share reserve under the 2000 ESPP by 4,000,000 shares. |
All of our equity compensation plans have been approved by our stockholders.
| Item 13. | Certain Relationships and Related Transactions, and Director Independence |
The information required by this item is incorporated by reference to our Definitive Proxy Statement to be filed with the SEC pursuant to Regulation 14A in connection with our 2010 annual meeting of stockholders under the headings “Election of Directors” and “Certain Transactions.”
| Item 14. | Principal Accounting Fees and Services |
The information required by this item is incorporated by reference to our Definitive Proxy Statement to be filed with the SEC pursuant to Regulation 14A in connection with our 2010 annual meeting of stockholders under the heading “Ratification of Selection of Independent Auditors.”
63
Table of Contents
| Item 15. | Exhibits and Financial Statement Schedules |
(a) The following documents are filed as part of this report:
(1) Financial statements:
The consolidated balance sheets as of December 31, 2008 and 2009, and the consolidated statements of operations and comprehensive loss, stockholders’ equity and cash flows for the years ended December 31, 2007, 2008 and 2009, together with notes thereto included elsewhere in this annual report on Form 10-K are incorporated herein by reference.
(2) All other schedules have been omitted from this annual report on Form 10-K because they are not applicable or because the information required by any applicable schedule is included in the consolidated financial statements or the notes thereto.
64
Table of Contents
(3) Exhibits:
| Exhibit Number |
Description | |
| 2.1 | Agreement and Plan of Merger dated as of February 23, 2004, by and among Dot Hill Systems Corp., DHSA Corp., Chaparral Network Storage, Inc., and C. Timothy Smoot, as Stockholders’ Representative.(1) | |
| 2.2 | Amended and Restated Asset Purchase and Technology License Agreement dated September 17, 2008 by and between Dot Hill Systems Corp. and Ciprico Inc.(2) | |
| 3.1 | Certificate of Incorporation of Dot Hill Systems Corp.(3) | |
| 3.2 | Amended and Restated By-laws of Dot Hill Systems Corp.(4) | |
| 4.1 | Certificate of Incorporation Dot Hill Systems Corp.(3) | |
| 4.2 | Amended and Restated By-laws of Dot Hill Systems Corp.(4) | |
| 4.3 | Form of Common Stock Certificate.(5) | |
| 4.4 | Certificate of Designation of Series A Junior Participating Preferred Stock, as filed with the Secretary of State of Delaware on May 19, 2003.(6) | |
| 4.5 | Form of Rights Certificate.(6) | |
| 4.6 | Warrant to Purchase Shares of Common Stock dated January 4, 2008.(9) | |
| 10.1 | Rights Agreement dated as of May 19, 2003 by and between Dot Hill Systems Corp. and American Stock Transfer and Trust Company.(6) | |
| 10.2 | 2000 Amended and Restated Equity Incentive Plan.(10)† | |
| 10.3 | 2009 Equity Incentive Plan.(11)† | |
| 10.4 | Form of Stock Option Agreement (Incentive and Non-statutory Stock Options) used in connection with the 2000 Amended and Restated Equity Incentive Plan.(10)† | |
| 10.5 | Form of Stock Option Grant Notice used in connection with the 2000 Amended and Restated Equity Incentive Plan.(10)† | |
| 10.6 | Amended and Restated 2000 Employee Stock Purchase Plan.(11)† | |
| 10.7 | Amended and Restated 2000 Non-Employee Directors’ Stock Option Plan.(12)† | |
| 10.8 | Form of Stock Option Agreement used in connection with the 2000 Non-Employee Directors’ Stock Option Plan.(13)† | |
| 10.9 | Amended and Restated Employment Agreement between Dot Hill Systems Corp. and Dana Kammersgard, effective as of December 18, 2008.(14)† | |
| 10.10 | Amended and Restated Employment Agreement between Dot Hill Systems Corp. and Hanif I. Jamal, effective as of March 16, 2009.(32)† | |
| 10.11 | Description of 2008 Executive Compensation Plan.(15)† | |
| 10.12 | Description of Amended and Restated Policy for Director Compensation.(16)† | |
| 10.13 | Form of Indemnity Agreement.(17) | |
| 10.14 | Lease Agreement by and between Dot Hill Systems Corp. and Equastone 2200 Faraday, LLC effective as of September 1, 2005 and dated as of September 16, 2005.(18) | |
| 10.15 | Lease Agreement by and between Dot Hill Systems Corp. and Circle Capital Longmont LLC as of April 12, 2007.(19) | |
65
Table of Contents
| Exhibit Number |
Description | |
| 10.16 | Loan and Security Agreement dated August 1, 2008 by and between Dot Hill Systems Corp. and Silicon Valley Bank.(20) | |
| 10.17 | Manufacturing Agreement between Dot Hill Systems Corp. and Flextronics Corporation dated May 20, 2002.(21)* | |
| 10.18 | Amendment to Manufacturing Agreement between Dot Hill Systems Corp. and Solectron Corporation dated April 5, 2005.(22)* | |
| 10.19 | Second Amendment to Manufacturing Agreement dated September 16, 2005 between Dot Hill Systems Corp. and Solectron Corporation.(23)* | |
| 10.20 | Second Award Letter dated September 16, 2005 between Dot Hill Systems Corp. and Solectron Corporation.(23)* | |
| 10.21 | Manufacturing Agreement by and among Dot Hill Systems Corp., MiTAC International Corporation and SYNNEX Corporation dated February 20, 2007.(24)* | |
| 10.22 | Manufacturing and Purchase Agreement dated September 24, 2008 by and between Dot Hill Systems Corp. and Hon Hai Precision Industry LTD.(2)* | |
| 10.23 | Product Purchase Agreement between Dot Hill Systems Corp. and Sun Microsystems, Inc. dated May 24, 2002.(25) | |
| 10.24 | Second Amendment to Product Purchase Agreement, dated as of January 26, 2004 by and among Sun Microsystems, Inc., Sun Microsystems International B.V., Dot Hill Systems Corp. and Dot Hill Systems B.V.(26)* | |
| 10.25 | Third Amendment to Product Purchase Agreement, dated as of March 22, 2004, by and among Sun Microsystems, Inc., Sun Microsystems International B.V., Dot Hill Systems Corp. and Dot Hill Systems B.V.(26)* | |
| 10.26 | Fourth Amendment to Product Purchase Agreement dated September 26, 2005 by and among Sun Microsystems, Inc., Sun Microsystems International B.V., Dot Hill Systems Corp. and Dot Hill Systems B.V.(23)* | |
| 10.27 | Product Supplement/Award Letter for Blade Product under agreement with Sun Microsystems, Inc. dated May 24, 2002.(25)* | |
| 10.28 | Product Supplement/Award Letter for SCSI Product under agreement with Sun Microsystems, Inc. dated May 24, 2002.(25)* | |
| 10.29 | Product Supplement/Award Letter for FC Product under agreement with Sun Microsystems, Inc. dated May 24, 2002.(25)* | |
| 10.30 | Product Supplement/Award Letter (SATA) by and between Sun Microsystems, Inc. and Dot Hill Systems Corp. dated as of March 22, 2004.(26)* | |
| 10.31 | Product Supplement/Award Letter dated September 27, 2005 by and among Sun Microsystems, Inc., Sun Microsystems International B.V., Dot Hill Systems Corp. and Dot Hill Systems B.V.(23)* | |
| 10.32 | Product Supplement/Award Letter dated October 20, 2005 by and among Sun Microsystems, Inc., Sun Microsystems International B.V., Dot Hill Systems Corp. and Dot Hill Systems B.V.(27)* | |
| 10.33 | Development and OEM Supply Agreement dated July 26, 2005 by and among Dot Hill Systems Corp., Dot Hill Systems B.V., Network Appliance, Inc. and Network Appliance B.V.(23)* | |
| 10.34 | First Amendment dated August 3, 2006 to Development and OEM Supply Agreement dated July 26, 2005 by and among Dot Hill Systems Corp., Dot Hill Systems B.V., Network Appliance, Inc., Network Appliance Holding and Manufacturing B.V.(8)* | |
66
Table of Contents
| Exhibit Number |
Description | |
| 10.35 | Second Amendment to the Development and OEM Supply Agreement, dated as of October 1, 2007, between Network Appliance, Inc. and Network Appliance Holding and Manufacturing, B.V., formerly known as Network Appliance B.V., Dot Hill Systems Corp. and Dot Hill Systems B.V.(28)* | |
| 10.36 | Third Amendment to the Development and OEM Supply Agreement, dated as of November 2, 2007, between Network Appliance, Inc. and Network Appliance Holding and Manufacturing, B.V., formerly known as Network Appliance B.V., Dot Hill Systems Corp. and Dot Hill Systems B.V.(28)* | |
| 10.37 | Technology License Agreement, dated as of October 1, 2007 between Network Appliance, Inc. and the Dot Hill Systems Corp.(28)* | |
| 10.38 | Master Purchase Agreement effective January 13, 2006 by and among Dot Hill Systems Corp., Dot Hill Systems B.V., Fujitsu Siemens Computers GmbH and Fujitsu Siemens Computers (Holding) B.V.(29)* | |
| 10.39 | Product Purchase Agreement dated September 10, 2007 by and between Dot Hill Systems Corp. and Hewlett-Packard Company.(30)* | |
| 10.40 | Amendment One to Product Purchase Agreement dated January 4, 2008, by and between Dot Hill Systems Corp. and Hewlett-Packard Company.(30)* | |
| 10.41 | Amendment Eight to Product Purchase Agreement dated September 30, 2008 by and between Dot Hill Systems Corp. and Hewlett Packard Company.(2)* | |
| 10.42 | Patent Cross License dated December 29, 2005 between Dot Hill Systems Corp. and International Business Machines Corporation.(27)* | |
| 10.43 | Amended Settlement and License Agreement dated October 5, 2006 by and between Dot Hill Systems Corp. and Crossroads, Inc.(31)* | |
| 10.44 | Amendment One to Manufacturing and Purchase Agreement dated January 28, 2009 by and between Dot Hill Systems Corp. and Hon Hai Precision Industry LTD.(33)* | |
| 10.45 | Amendment to Loan and Security Agreement dated July 30, 2009 by and between Dot Hill Systems Corp. and Silicon Valley Bank.(34) | |
| 10.46 | Israeli Appendix to the 2009 Equity Incentive Plan. | |
| 21.1 | Subsidiaries of Dot Hill Systems Corp.(7) | |
| 23.1 | Consent of Deloitte & Touche LLP. | |
| 24.1 | Power of Attorney. Reference is made to the signature page hereto. | |
| 31.1 | Certification pursuant to 17 CFR 240.13a-14(a) or 17 CFR 240.15d-14(a), as adopted pursuant to Section 302 of the Sarbanes-Oxley Act of 2002. | |
| 31.2 | Certification pursuant to 17 CFR 240.13a-14(a) or 17 CFR 240.15d-14(a), as adopted pursuant to Section 302 of the Sarbanes-Oxley Act of 2002. | |
| 32.1 | Certification pursuant to 18 U.S.C. Section 1350, as adopted pursuant to Section 906 of the Sarbanes-Oxley Act of 2002. | |
| † | Indicates management or compensatory plan or arrangement. |
| * | Confidential treatment has been granted by, or requested from, the SEC. |
Dot Hill’s Annual Reports on Form 10-K, Quarterly Reports on Form 10-Q and Current Reports on Form 8-K have a Commission File Number of 001-13317.
67
Table of Contents
| (1) | Filed as an exhibit to our Current Report on Form 8-K filed with the SEC on February 24, 2004 and incorporated herein by reference. |
| (2) | Filed as an exhibit to our Quarterly Report on Form 10-Q for the quarter ended September 30, 2008 and incorporated herein by reference. |
| (3) | Filed as an exhibit to our Current Report on Form 8-K filed with the SEC on September 19, 2001 and incorporated herein by reference. |
| (4) | Filed as an exhibit to our Current Report on Form 8-K filed with the SEC on December 26, 2007 and incorporated herein by reference. |
| (5) | Filed as an exhibit to our Current Report on Form 8-K filed with the SEC on January 14, 2003 and incorporated herein by reference. |
| (6) | Filed as an exhibit to our Current Report on Form 8-K filed with the SEC on May 19, 2003 and incorporated herein by reference. |
| (7) | Filed as an exhibit to our Annual Report on Form 10-K for the year ended December 31, 2002 and incorporated herein by reference. |
| (8) | Filed as an exhibit to our Quarterly Report on Form 10-Q for the quarter ended September 30, 2006 and incorporated herein by reference. |
| (9) | Filed as an exhibit to our Current Report on Form 8-K filed with the SEC on January 7, 2008 and incorporated herein by reference. |
| (10) | Filed as an exhibit to our Current Report on Form 8-K filed with the SEC on August 23, 2000 and incorporated herein by reference. |
| (11) | Filed as an exhibit to our Current Report on Form 8-K filed with the SEC on June 19, 2009 and incorporated herein by reference. |
| (12) | Filed as an exhibit to our Quarterly Report on Form 10-Q for the quarter ended June 30, 2009 and incorporated herein by reference. |
| (13) | Filed as an exhibit to our Registration Statement on Form S-8 (No. 333-43834) and incorporated herein by reference. |
| (14) | Filed as an exhibit to our Current Report on Form 8-K filed with the SEC on December 24, 2008 and incorporated herein by reference. |
| (15) | Filed as item 5.02(e) of our Current Report on Form 8-K filed with the SEC on April 3, 2008 and incorporated herein by reference. |
| (16) | Incorporated herein by reference to the description contained in our Current Report on Form 8-K filed with the SEC on July 29, 2005. |
| (17) | Filed as an exhibit to our Current Report on Form 8-K filed with the SEC on December 13, 2005 and incorporated herein by reference. |
| (18) | Filed as an exhibit to our Current Report on Form 8-K filed with the SEC on September 21, 2005 and incorporated herein by reference. |
| (19) | Filed as an exhibit to our Current Report on Form 8-K filed with the SEC on April 16, 2007 and incorporated herein by reference. |
| (20) | Filed as an exhibit to our Current Report on Form 8-K filed with the SEC on August 5, 2008 and incorporated herein by reference. |
| (21) | Filed as an exhibit to our Quarterly Report on Form 10-Q for the quarter ended June 30, 2002 and incorporated herein by reference. |
68
Table of Contents
| (22) | Filed as an exhibit to our Quarterly Report on Form 10-Q for the quarter ended June 30, 2005 and incorporated herein by reference. |
| (23) | Filed as an exhibit to our Quarterly Report on Form 10-Q for the quarter ended September 30, 2005 and incorporated herein by reference. |
| (24) | Filed as an exhibit to our Quarterly Report on Form 10-Q for the quarter ended March 31, 2007 and incorporated herein by reference. |
| (25) | Filed as an exhibit to our Quarterly Report on Form 10-Q for the quarter ended June 30, 2002 and incorporated herein by reference. |
| (26) | Filed as an exhibit to our Quarterly Report on Form 10-Q for the quarter ended March 31, 2004 and incorporated herein by reference. |
| (27) | Filed as an exhibit to our Annual Report on Form 10-K for the year ended December 31, 2005 and incorporated herein by reference. |
| (28) | Filed as an exhibit to our Annual Report on Form 10-K for the year ended December 31, 2007 and incorporated herein by reference. |
| (29) | Filed as an exhibit to our Quarterly Report on Form 10-Q for the quarter ended March 31, 2006 and incorporated herein by reference. |
| (30) | Filed as an exhibit to our Quarterly Report on Form 10-Q for the quarter ended March 31, 2008 and incorporated herein by reference. |
| (31) | Filed as an exhibit to our Quarterly Report on Form 10-Q for the quarter ended June 30, 2006 and incorporated herein by reference. |
| (32) | Filed as an exhibit to our Current Report on Form 8-K filed with the SEC on March 20, 2009 and incorporated herein by reference. |
| (33) | Filed as an exhibit to our Quarterly Report on Form 10-Q for the quarter ended March 31, 2009 and incorporated herein by reference. |
| (34) | Filed as an exhibit to our Current Report on Form 8-K filed with the SEC on August 4, 2009 and incorporated herein by reference. |
69
Table of Contents
SIGNATURES
Pursuant to the requirements of Section 13 or 15(d) of the Securities Exchange Act of 1934, as amended, the registrant has duly caused this report to be signed on its behalf by the undersigned, thereunto duly authorized.
| DOT HILL SYSTEMS CORP. | ||
| By: | /S/ DANA W. KAMMERSGARD | |
| Dana W. Kammersgard | ||
| Chief Executive Officer and President | ||
Date: March 16, 2010
KNOW ALL PERSONS BY THESE PRESENTS, that each person whose signature appears below constitutes and appoints Dana W. Kammersgard and Hanif I. Jamal, and each of them, as his true and lawful attorneys-in-fact and agents, with full power of substitution and resubstitution, for him and in his name, place, and stead, in any and all capacities, to sign any and all amendments to this Report, and to file the same, with all exhibits thereto, and other documents in connection therewith, with the Securities and Exchange Commission, granting unto said attorneys-in-fact and agents, and each of them, full power and authority to do and perform each and every act and thing requisite and necessary to be done in connection therewith, as fully to all intents and purposes as he might or could do in person, hereby ratifying and confirming that all said attorneys-in-fact and agents, or any of them or their or his substitute or substituted, may lawfully do or cause to be done by virtue hereof.
Pursuant to the requirements of the Securities Exchange Act of 1934, as amended, this report has been signed below by the following persons on behalf of the registrant and in the capacities and on the dates indicated.
| Name |
Title |
Date | ||
| /S/ DANA W. KAMMERSGARD Dana W. Kammersgard |
Chief Executive Officer, President and Director (Principal Executive Officer) | March 16, 2010 | ||
| /S/ HANIF I. JAMAL Hanif I. Jamal |
Chief Financial Officer, and Treasurer (Principal Financial and Accounting Officer) |
March 16, 2010 | ||
| /S/ CHARLES CHRIST Charles Christ |
Chairman of the Board of Directors | March 16, 2010 | ||
| /S/ KIMBERLY ALEXY Kimberly Alexy |
Director | March 16, 2010 | ||
| /S/ JOSEPH D. MARKEE Joseph D. Markee |
Director | March 16, 2010 | ||
| /S/ TOM MARMEN Tom Marmen |
Director | March 16, 2010 | ||
|
Richard Mejia, Jr. |
Director | March 16, 2010 | ||
| /S/ RODERICK M. SHERWOOD III Roderick M. Sherwood III |
Director | March 16, 2010 | ||
70
Table of Contents
F-1
Table of Contents
REPORT OF INDEPENDENT REGISTERED PUBLIC ACCOUNTING FIRM
To the Board of Directors and Stockholders of
Dot Hill Systems Corp. and subsidiaries
Longmont, Colorado
We have audited the accompanying consolidated balance sheets of Dot Hill Systems Corp. and subsidiaries (the “Company”) as of December 31, 2008 and 2009, and the related consolidated statements of operations and comprehensive loss, stockholders’ equity, and cash flows for each of the three years in the period ended December 31, 2009. These consolidated financial statements are the responsibility of the Company’s management. Our responsibility is to express an opinion on these consolidated financial statements based on our audits.
We conducted our audits in accordance with the standards of the Public Company Accounting Oversight Board (United States). Those standards require that we plan and perform the audit to obtain reasonable assurance about whether the financial statements are free of material misstatement. An audit includes examining, on a test basis, evidence supporting the amounts and disclosures in the financial statements. An audit also includes assessing the accounting principles used and significant estimates made by management, as well as evaluating the overall financial statement presentation. We believe that our audits provide a reasonable basis for our opinion.
In our opinion, such consolidated financial statements present fairly, in all material respects, the financial position of Dot Hill Systems Corp. and subsidiaries as of December 31, 2008 and 2009, and the results of their operations and their cash flows for each of the three years in the period ended December 31, 2009, in conformity with accounting principles generally accepted in the United States of America.
As discussed in Note 1 to the consolidated financial statements, the Company adopted the provisions of accounting guidance now codified as Financial Accounting Standards Board (FASB) Accounting Standards Codification (ASC) Topic 740, Income Taxes, effective January 1, 2007.
We have also audited, in accordance with the standards of the Public Company Accounting Oversight Board (United States), the Company’s internal control over financial reporting as of December 31, 2009, based on the criteria established in Internal Control — Integrated Framework issued by the Committee of Sponsoring Organizations of the Treadway Commission and our report dated March 16, 2010 expressed an unqualified opinion on the Company’s internal control over financial reporting.
/s/ DELOITTE & TOUCHE LLP
San Diego, California
March 16, 2010
F-2
Table of Contents
DOT HILL SYSTEMS CORP. AND SUBSIDIARIES
CONSOLIDATED BALANCE SHEETS
AS OF DECEMBER 31, 2008 AND 2009
(In thousands, except par value data)
| 2008 | 2009 | |||||||
| ASSETS | ||||||||
| Current Assets: |
||||||||
| Cash and cash equivalents |
$ | 56,850 | $ | 57,574 | ||||
| Accounts receivable, net |
41,035 | 34,197 | ||||||
| Inventories |
14,127 | 4,333 | ||||||
| Prepaid expenses and other assets |
4,796 | 5,314 | ||||||
| Total current assets |
116,808 | 101,418 | ||||||
| Property and equipment, net |
2,410 | 3,616 | ||||||
| Intangible assets, net |
4,164 | 3,029 | ||||||
| Other assets |
515 | 217 | ||||||
| Total assets |
$ | 123,897 | $ | 108,280 | ||||
| LIABILITIES AND STOCKHOLDERS’ EQUITY | ||||||||
| Current Liabilities: |
||||||||
| Accounts payable |
$ | 31,050 | $ | 28,411 | ||||
| Accrued compensation |
3,217 | 3,602 | ||||||
| Accrued expenses |
5,229 | 4,220 | ||||||
| Deferred revenue |
1,121 | 1,217 | ||||||
| Restructuring accrual |
681 | 1,697 | ||||||
| Current portion of long-term note payable |
249 | 261 | ||||||
| Total current liabilities |
41,547 | 39,408 | ||||||
| Long-term note payable |
607 | 346 | ||||||
| Other long-term liabilities |
5,091 | 2,175 | ||||||
| Total liabilities |
47,245 | 41,929 | ||||||
| Commitments and Contingencies (Note 13) |
||||||||
| Stockholders’ Equity: |
||||||||
| Preferred stock, $.001 par value, 10,000 shares authorized, no shares issued and outstanding at December 31, 2008 and 2009, respectively |
— | — | ||||||
| Common stock, $.001 par value, 100,000 shares authorized, 46,308 and 48,952 shares issued and outstanding at December 31, 2008 and 2009, respectively |
46 | 49 | ||||||
| Additional paid-in capital |
300,555 | 303,841 | ||||||
| Accumulated other comprehensive loss |
(3,474 | ) | (3,439 | ) | ||||
| Accumulated deficit |
(220,475 | ) | (234,100 | ) | ||||
| Total stockholders’ equity |
76,652 | 66,351 | ||||||
| Total liabilities and stockholders’ equity |
$ | 123,897 | $ | 108,280 | ||||
See accompanying notes to consolidated financial statements.
F-3
Table of Contents
DOT HILL SYSTEMS CORP. AND SUBSIDIARIES
CONSOLIDATED STATEMENTS OF OPERATIONS AND COMPREHENSIVE LOSS
FOR THE YEARS ENDED DECEMBER 31, 2007, 2008 AND 2009
(In thousands, except per share amounts)
| 2007 | 2008 | 2009 | ||||||||||
| NET REVENUE |
$ | 207,095 | $ | 272,879 | $ | 234,383 | ||||||
| COST OF GOODS SOLD |
180,662 | 242,491 | 196,556 | |||||||||
| GROSS PROFIT |
26,433 | 30,388 | 37,827 | |||||||||
| OPERATING EXPENSES: |
||||||||||||
| Sales and marketing |
15,939 | 13,878 | 10,970 | |||||||||
| Research and development |
22,564 | 28,709 | 28,120 | |||||||||
| General and administrative |
12,606 | 12,779 | 10,139 | |||||||||
| Restructuring charge |
— | 813 | 2,430 | |||||||||
| Legal settlement |
— | (4,036 | ) | — | ||||||||
| Goodwill and long-lived asset impairment charge |
40,725 | 5,432 | — | |||||||||
| Total operating expenses |
91,834 | 57,575 | 51,659 | |||||||||
| OPERATING LOSS |
(65,401 | ) | (27,187 | ) | (13,832 | ) | ||||||
| OTHER INCOME: |
||||||||||||
| Interest income, net |
4,787 | 1,538 | 161 | |||||||||
| Other income, net |
209 | 74 | 6 | |||||||||
| Total other income, net |
4,996 | 1,612 | 167 | |||||||||
| LOSS BEFORE INCOME TAXES |
(60,405 | ) | (25,575 | ) | (13,665 | ) | ||||||
| INCOME TAX (BENEFIT) EXPENSE |
(177 | ) | 190 | (40 | ) | |||||||
| NET LOSS |
$ | (60,228 | ) | $ | (25,765 | ) | $ | (13,625 | ) | |||
| NET LOSS PER SHARE: |
||||||||||||
| Basic and diluted |
$ | (1.32 | ) | $ | (0.56 | ) | $ | (0.29 | ) | |||
| WEIGHTED AVERAGE SHARES USED TO CALCULATE NET LOSS PER SHARE: |
||||||||||||
| Basic and diluted |
45,534 | 46,136 | 47,094 | |||||||||
| COMPREHENSIVE LOSS: |
||||||||||||
| Net loss |
$ | (60,228 | ) | $ | (25,765 | ) | $ | (13,625 | ) | |||
| Foreign currency translation adjustments |
(2,286 | ) | (374 | ) | 35 | |||||||
| Comprehensive loss |
$ | (62,514 | ) | $ | (26,139 | ) | $ | (13,590 | ) | |||
See accompanying notes to consolidated financial statements.
F-4
Table of Contents
DOT HILL SYSTEMS CORP. AND SUBSIDIARIES
CONSOLIDATED STATEMENTS OF STOCKHOLDERS’ EQUITY
FOR THE YEARS ENDED DECEMBER 31, 2007, 2008 AND 2009
(In thousands)
| Preferred Stock | Common Stock | Additional Paid-In Capital |
Accumulated Other Comprehensive Loss |
Accumulated Deficit |
Total Stockholders’ Equity |
|||||||||||||||||||||
| Shares | Amount | Shares | Amount | |||||||||||||||||||||||
| Balance, January 1, 2007 |
— | $ | — | 45,009 | $ | 45 | $ | 290,705 | $ | (814 | ) | $ | (134,024 | ) | $ | 155,912 | ||||||||||
| Cumulative effect to prior year accumulated deficit related to the adoption of FIN 48 |
(458 | ) | (458 | ) | ||||||||||||||||||||||
| Exercise of stock options and warrants |
414 | 170 | 170 | |||||||||||||||||||||||
| Sale of common stock under ESPP |
362 | 1 | 967 | 968 | ||||||||||||||||||||||
| Share-based compensation expense from stock options |
1,938 | 1,938 | ||||||||||||||||||||||||
| Share-based compensation expense from ESPP |
413 | 413 | ||||||||||||||||||||||||
| Foreign currency translation adjustment |
(2,286 | ) | (2,286 | ) | ||||||||||||||||||||||
| Net loss |
(60,228 | ) | (60,228 | ) | ||||||||||||||||||||||
| Balance, December 31, 2007 |
— | — | 45,785 | 46 | 294,193 | (3,100 | ) | (194,710 | ) | 96,429 | ||||||||||||||||
| Issuance of warrant to customer |
2,282 | 2,282 | ||||||||||||||||||||||||
| Exercise of stock options and warrants |
155 | 284 | 284 | |||||||||||||||||||||||
| Sale of common stock under ESPP |
368 | 912 | 912 | |||||||||||||||||||||||
| Share-based compensation expense from stock options |
2,563 | 2,563 | ||||||||||||||||||||||||
| Share-based compensation expense from ESPP |
321 | 321 | ||||||||||||||||||||||||
| Foreign currency translation adjustment |
(374 | ) | (374 | ) | ||||||||||||||||||||||
| Net loss |
(25,765 | ) | (25,765 | ) | ||||||||||||||||||||||
| Balance, December 31, 2008 |
— | — | 46,308 | 46 | 300,555 | (3,474 | ) | (220,475 | ) | 76,652 | ||||||||||||||||
| Net issuances of unvested restricted common stock |
1,567 | 2 | (2 | ) | — | |||||||||||||||||||||
| Sale of common stock under ESPP |
1,077 | 1 | 466 | 467 | ||||||||||||||||||||||
| Share-based compensation expense from stock options |
2,237 | 2,237 | ||||||||||||||||||||||||
| Share-based compensation expense from restricted stock awards |
310 | 310 | ||||||||||||||||||||||||
| Share-based compensation expense from ESPP |
275 | 275 | ||||||||||||||||||||||||
| Foreign currency translation adjustment |
35 | 35 | ||||||||||||||||||||||||
| Net loss |
(13,625 | ) | (13,625 | ) | ||||||||||||||||||||||
| Balance, December 31, 2009 |
— | $ | — | 48,952 | $ | 49 | $ | 303,841 | $ | (3,439 | ) | $ | (234,100 | ) | $ | 66,351 | ||||||||||
See accompanying notes to consolidated financial statements.
F-5
Table of Contents
DOT HILL SYSTEMS CORP. AND SUBSIDIARIES
CONSOLIDATED STATEMENTS OF CASH FLOWS
FOR THE YEARS ENDED DECEMBER 31, 2007, 2008 AND 2009
(In thousands)
| 2007 | 2008 | 2009 | ||||||||||
| Cash Flows From Operating Activities: |
||||||||||||
| Net loss |
$ | (60,228 | ) | $ | (25,765 | ) | $ | (13,625 | ) | |||
| Adjustments to reconcile net loss to net cash provided by (used in) operating activities: |
||||||||||||
| Depreciation and amortization |
6,573 | 5,833 | 2,871 | |||||||||
| Goodwill and long-lived asset impairment charge |
40,725 | 5,432 | — | |||||||||
| Loss on disposal of property and equipment |
268 | 11 | — | |||||||||
| Adjustment to contingent consideration |
— | — | (649 | ) | ||||||||
| Provision for (reduction in) bad debt reserve |
(216 | ) | 25 | (63 | ) | |||||||
| Share-based compensation expense |
2,351 | 2,884 | 2,822 | |||||||||
| Issuance of warrant to customer |
— | 2,282 | — | |||||||||
| Changes in operating assets and liabilities: |
||||||||||||
| Accounts receivable |
5,745 | (8,484 | ) | 6,888 | ||||||||
| Inventories |
(6,777 | ) | (5,077 | ) | 9,794 | |||||||
| Prepaid expenses and other assets |
1,005 | (1,021 | ) | (445 | ) | |||||||
| Accounts payable |
(5,890 | ) | 2,332 | (2,564 | ) | |||||||
| Accrued compensation and other expenses |
(361 | ) | (1,391 | ) | (415 | ) | ||||||
| Deferred revenue |
802 | (311 | ) | (1,658 | ) | |||||||
| Restructuring accrual |
— | 672 | 1,016 | |||||||||
| Other long-term liabilities |
1,723 | 190 | (539 | ) | ||||||||
| Net cash (used in) provided by operating activities |
(14,280 | ) | (22,388 | ) | 3,433 | |||||||
| Cash Flows From Investing Activities: |
||||||||||||
| Purchases of property and equipment |
(4,447 | ) | (1,891 | ) | (2,939 | ) | ||||||
| Sales of short-term investments |
5,425 | — | — | |||||||||
| Purchases of short-term investments |
(5,425 | ) | — | — | ||||||||
| Purchase of intangible assets |
— | (2,545 | ) | — | ||||||||
| Net cash used in investing activities |
(4,447 | ) | (4,436 | ) | (2,939 | ) | ||||||
| Cash Flows From Financing Activities: |
||||||||||||
| Principal payment of note payable |
— | — | (249 | ) | ||||||||
| Proceeds from exercise of stock options and warrants |
170 | 284 | — | |||||||||
| Proceeds from sale of stock to employees |
968 | 912 | 467 | |||||||||
| Net cash provided by financing activities |
1,138 | 1,196 | 218 | |||||||||
| Effect of Exchange Rate Changes on Cash and Cash Equivalents |
284 | 120 | 12 | |||||||||
| Net (Decrease) Increase in Cash and Cash Equivalents |
(17,305 | ) | (25,508 | ) | 724 | |||||||
| Cash and Cash Equivalents, beginning of year |
99,663 | 82,358 | 56,850 | |||||||||
| Cash and Cash Equivalents, end of year |
$ | 82,358 | $ | 56,850 | $ | 57,574 | ||||||
| Supplemental Disclosures of Cash Flow Information: |
||||||||||||
| Cash paid for income taxes |
$ | 245 | $ | 67 | $ | 78 | ||||||
| Supplemental Disclosures of Non-Cash Investing and Financing Activities: |
||||||||||||
| Capital assets acquired but not paid |
$ | 563 | $ | 168 | $ | 170 | ||||||
| Promissory note for intangible assets purchase |
$ | — | $ | 918 | $ | — | ||||||
| Contingent payment for intangible assets purchase |
$ | — | $ | 1,070 | $ | — | ||||||
See accompanying notes to consolidated financial statements.
F-6
Table of Contents
NOTES TO CONSOLIDATED FINANCIAL STATEMENTS
FOR THE YEARS ENDED DECEMBER 31, 2007, 2008 and 2009
1. Organization and Summary of Significant Accounting Policies
Description of Business
Dot Hill Systems Corp (referred to herein as Dot Hill, we, our or us) is a provider of entry level and midrange storage systems for organizations requiring high reliability, high performance networked storage and data management solutions in an open systems architecture. Our storage solutions consist of integrated hardware, firmware and software products employing a modular system that allows end-users to add various capacity or data protection schemes as needed. Our broad range of products, from medium capacity stand-alone storage units to complete multi-terabyte storage area networks, or SANs, provide end-users with a cost-effective means of addressing increasing storage demands without sacrificing performance.
Basis of Presentation
The accompanying consolidated financial statements have been prepared in accordance with accounting principles generally accepted in the United States of America, or GAAP.
Principles of Consolidation
The accompanying consolidated financial statements include our accounts and the accounts of our wholly-owned subsidiaries. Intercompany transactions and balances have been eliminated in consolidation.
Foreign Currency Translation
For our foreign subsidiaries whose functional currency is the local currency, assets and liabilities are translated into United States dollars at period-end exchange rates. Revenues and expenses, and gains and losses, are translated at rates of exchange that approximate the rates in effect on the transaction date. Resulting translation gains and losses are recognized as a component of other comprehensive loss. For our foreign subsidiaries that maintain their books of record in a currency other than the functional currency, the subsidiaries remeasure monetary assets and liabilities using current rates of exchange at the balance sheet date and remeasure non-monetary assets and liabilities using historical rates of exchange. Gains and losses from remeasurement for such subsidiaries are recognized currently in income as a component of general and administrative expenses.
Foreign currency translation adjustments comprise the entire amount of our accumulated other comprehensive loss at December 31, 2008 and 2009. Transaction gains and losses resulting from the process of remeasurement are included as a component of general and administrative expense. Transactions gains or losses were not material for any period presented.
Use of Accounting Estimates
The preparation of our financial statements in accordance with GAAP requires management to make estimates and assumptions that affect the reported amounts of assets and liabilities at the dates of the financial statements and the reported amounts of net revenue and expenses in the reporting periods. The accounting estimates that require management’s most significant and subjective judgments include revenue recognition, inventory valuation, the valuation and recognition of stock-based compensation expense and the valuation on long-lived assets. In addition, we have other accounting policies that involve estimates such as the determination of useful lives of long-lived assets, warranty reserves, accruals for estimated restructuring and valuation allowance for deferred tax assets. Actual results may differ from these estimates under different assumptions or conditions and such differences could be material.
F-7
Table of Contents
Revenue Recognition
We recognize product revenue when the following fundamental criteria are met: (i) persuasive evidence of an arrangement exists; (ii) delivery has occurred; (iii) the price is fixed or determinable; and (iv) collectability is reasonably assured. Revenue is recognized for product sales upon transfer of title and risk of loss to the customer. We record reductions to revenue for estimated product returns and pricing adjustments in the same period that the related revenue is recorded. These estimates are based on historical sales returns, analysis of credit memo data and other factors known at the time. If actual future returns and pricing adjustments differ from past experience and our estimates, additional revenue reserves may be required. Our out-of warranty repairs primarily consist of product repair services performed by our contract manufacturers for those customers that allowed their original product warranty to expire without purchasing one of our higher level support service plans. Revenue from these out-of-warranty repairs, and the associated cost of sales, is recognized in the period these services are provided and represent the majority of service revenue. To a lesser degree, service revenue consists of product maintenance contracts. Revenue from our product maintenance contracts is deferred and recognized ratably over the contract term, generally 12 to 36 months. We defer revenue on upfront nonrefundable payments from our customers and recognize it ratably over the term of the agreement, unless the payment is in exchange for products delivered that represent the culmination of a separate earnings process. When we provide consideration to a customer we recognize the value of that consideration as a reduction in net revenue. We may be required to maintain inventory, or hubbing, arrangements with certain of our largest OEM customers. Pursuant to these arrangements we deliver products to a customer or a designated third-party warehouse based upon the customer’s projected needs, but do not recognize product revenue unless and until the customer has removed our product from the warehouse to incorporate into its end products.
Advertising Costs
We expense advertising costs in the period incurred. Advertising expense is included as a component of sales and marketing expense. Advertising expense was $0.5 million, $0.5 million and $0.4 million for the years ended December 31, 2007, 2008 and 2009, respectively.
Shipping and Handling
Cost related to the shipping and handling of our products is included in cost of goods sold for all periods presented.
Research and Development
Research and development costs are expensed as incurred. In conjunction with the development of our products, we incur certain software development costs. No costs have been capitalized because the period between achieving technological feasibility and completion of such software is relatively short and software development costs qualifying for capitalization have been insignificant.
Stock-Based Compensation
Stock-based compensation expense for all share-based payment awards granted is determined based on the grant-date fair value. We recognize these compensation costs net of an estimated forfeiture rate, and recognize compensation cost only for those shares expected to vest on a straight-line basis over the requisite service period of the award, which is generally the vesting term of the share-based payment awards. We estimate forfeiture rates based on our historical experience.
Income Taxes
We recognize deferred tax assets and liabilities for the expected tax consequences of temporary differences between the tax bases of assets and liabilities and their reported amounts using enacted tax rates in effect for the year the differences are expected to reverse. We record a valuation allowance to reduce the deferred tax assets to the amount that is more likely than not to be realized.
F-8
Table of Contents
On January 1, 2007, Dot Hill adopted the guidance now codified in Accounting Standards Codification, or ASC, Topic No. 740, Income Taxes, for the financial statement recognition, measurement and disclosure of uncertain tax positions recognized in an enterprise’s financial statements. Income tax positions must meet a more-likely-than-not recognition threshold at the effective date to be recognized upon the adoption of the revised guidance and in subsequent periods. The provisions of the guidance have been applied to all income tax positions commencing from that date. We recognize potential accrued interest and penalties related to unrecognized tax benefits within income tax expense. The cumulative effect of applying the provisions of the revised guidance has been reported as a $458,000 adjustment to the opening balance of our accumulated deficit as of January 1, 2007.
Cash and Cash Equivalents
We classify investments as cash equivalents if they are readily convertible to cash and have original maturities of three months or less at the time of acquisition. Cash and cash equivalents consist primarily of money market funds issued or managed in the United States. At December 31, 2008 and 2009, the carrying value of cash and cash equivalents approximates fair value due to the short period of time to maturity.
Allowance for Doubtful Accounts
We establish an allowance for doubtful accounts for accounts receivable amounts that may not be collectible. We determine the allowance for doubtful accounts based on the aging of our accounts receivable balances and an analysis of our historical experience of bad debt write-offs. Our allowance for doubtful accounts and our bad debt expense was not significant for any period presented.
Inventories
Inventories are valued at the lower of cost (first-in, first-out method) or market value. The valuation of inventory requires us to estimate excess or obsolete inventory. The determination of excess or obsolete inventory requires us to estimate the future demand for our products. Because our markets are volatile, and are subject to technological risks and price changes and inventory reduction programs by our customers and as we are required to make last time buys of certain components on occasion, there is a risk that we will forecast incorrectly and produce excess inventories of particular products or have commitments to purchase excess inventory components from our suppliers. As a result, actual demand will differ from forecasts, and such a difference has in the past and may in the future have a material adverse effect on our gross margin and our results of operations. Any write downs to inventory due to the existence of excess quantities, physical obsolescence, changes in pricing, damage, or other causes establish a new cost basis for the inventory. When we sell or dispose of reserved inventory the new cost basis is charged to cost of sales.
The components of inventories consist of the following as of December 31, (in thousands):
| 2008 | 2009 | |||||
| Purchased parts and materials |
$ | 2,637 | $ | 2,095 | ||
| Finished goods |
11,490 | 2,238 | ||||
| Total inventories |
$ | 14,127 | $ | 4,333 | ||
Property and Equipment
Property and equipment are recorded at cost less accumulated depreciation. Property and equipment are depreciated for financial reporting purposes using the straight-line method over the following estimated useful lives: machinery and equipment, furniture, fixtures and computer software, 3-5 years; leasehold improvements are amortized using the straight-line method over the shorter of the useful lives of the assets or the terms of the leases. Significant improvements to our property and equipment are capitalized while expenditures for maintenance and repairs are charged to expense in the period incurred.
F-9
Table of Contents
The components of property and equipment consist of the following as of December 31, (in thousands):
| 2008 | 2009 | |||||||
| Machinery and equipment |
$ | 4,958 | $ | 7,164 | ||||
| Furniture, fixtures, and computer software |
— | 200 | ||||||
| Leasehold improvements |
— | 798 | ||||||
| Construction in progress |
287 | 24 | ||||||
| Total property and equipment, at cost |
5,245 | 8,186 | ||||||
| Less accumulated depreciation |
(2,835 | ) | (4,570 | ) | ||||
| Total property and equipment, net |
$ | 2,410 | $ | 3,616 | ||||
Depreciation expense was $4.3 million, $4.3 million and $1.7 million for the years ended December 31, 2007, 2008 and 2009, respectively.
In the fourth quarter of 2008, we recorded an impairment charge related to our property and equipment in the amount of $4.4 million. See our Long-Lived Assets discussion immediately below.
Long-Lived Assets
Long-lived assets consist primarily of identifiable intangible assets with finite lives and property and equipment. We amortize our identifiable intangible assets with finite lives over the estimated economic lives of the assets, ranging from 3 to 4 years.
We evaluate long-lived assets for impairment whenever events or changes in circumstances indicate that their carrying value may not be recoverable. We assess the recoverability of the assets based on the undiscounted future cash flows the assets are expected to generate and recognize an impairment loss when estimated undiscounted future cash flows expected to result from the use of the assets plus net proceeds expected from disposition of the assets, if any, are less than the carrying value of the assets. If an asset is deemed to be impaired, the amount of the impairment loss represents the excess of the asset’s carrying value compared to its estimated fair value. Fair value estimates are based on assumptions concerning the amount and timing of estimated future cash flows and assumed discount rates, reflecting varying degrees of perceived risk. At December 31, 2008, we identified a change in circumstances that indicated the carrying amount of our long-lived assets may not be recoverable due to the significant economic downturn at that time, which caused a substantial decline in our market capitalization. At December 31, 2008, the carrying value of our equity significantly exceeded our market capitalization. Our long-lived assets at that time consisted of our identifiable intangible assets associated with our recent acquisition of certain identified Ciprico assets acquired in September 2008 with a carrying value of $4.2 million, our licensed patent portfolio of $1.0 million and property and equipment of $6.6 million. Based upon management’s estimates of undiscounted cash flows, coupled with the recent acquisition of the Ciprico assets which established fair value for the assets, we determined that the carrying value of the acquired Ciprico assets approximates fair value and therefore no impairment was identified. The remaining long-lived assets with a carrying value of $7.6 million were tested for impairment at the lowest level for which identifiable cash flows, that are largely independent of the cash flows of other groups of assets, were available. We determined the fair value of the impaired assets by discounting the forecasted future net cash flows from the operations to which the assets relate, based on management’s best estimates using appropriate assumptions and projections. Our impairment analysis at December 31, 2008 identified $5.4 million of impaired long-lived assets consisting of $4.4 million of property and equipment and our $1.0 million licensed patent portfolio. The long-lived asset impairment is recorded as a separate component of operating expense for the year ended December 31, 2008. No impairments of long-lived assets were recognized for the years ended December 31, 2007 or 2009.
F-10
Table of Contents
Product Warranties
We generally extend to our customers the warranties provided to us by our suppliers and, accordingly, the majority of our warranty obligations to customers are covered by supplier warranties. For warranty costs not covered by our suppliers, we provide for estimated warranty costs in the period the revenue is recognized. There can be no assurance that our suppliers will continue to provide such warranties to us in the future, which could have a material adverse effect on our operating results and financial condition if these warranties are eliminated. Estimated liabilities for product warranties are included in accrued expenses. Our warranty cost activity is as follows for the years ended December 31 (in thousands):
| Accrued Warranty Costs |
2007 | 2008 | 2009 | |||||||||
| Balance, beginning of year |
$ | 663 | $ | 1,381 | $ | 1,560 | ||||||
| Charged to operations |
3,570 | 3,334 | 2,061 | |||||||||
| Deductions for costs incurred |
(2,852 | ) | (3,155 | ) | (2,628 | ) | ||||||
| Balance, end of year |
$ | 1,381 | $ | 1,560 | $ | 993 | ||||||
Deferred Revenue
In July 2008, we entered into a long-term fixed price contract with one of our customers. We account for this long-term contract under the completed-contract method due to our inability to forecast reasonably dependable estimates. Under the completed-contract method, during the period of contract performance, billings and costs are accumulated on the balance sheet, but no profit or income is recorded before completion or substantial completion of the work. During the third quarter of 2009, we executed a change order with our customer resulting in the completion of the contract. Both parties agreed to terminate the contract due to the significant changes in the overall scope of the program. As a result, we recognized $1.5 million in revenue and $0.4 million in associated costs of goods sold for 2009. The recorded costs of goods sold do not include pre-contract costs expensed prior to executing a contract with our customer.
Our deferred product maintenance revenue activity is as follows for the years ended December 31 (in thousands):
| Deferred Product Maintenance Revenue |
2007 | 2008 | 2009 | |||||||||
| Balance, beginning of year |
$ | 581 | $ | 694 | $ | 543 | ||||||
| New warranty revenue contracts |
7,093 | 1,181 | 988 | |||||||||
| Revenue recognized |
(6,980 | ) | (1,332 | ) | (1,136 | ) | ||||||
| Balance, end of year |
$ | 694 | $ | 543 | $ | 395 | ||||||
Concentrations of Credit Risk, Customers and Suppliers
Financial instruments that potentially subject us to concentrations of credit risk consist principally of cash equivalents and accounts receivable. We maintain our cash equivalents with various financial institutions, which are primarily located in the United States. We place our cash equivalents with high-credit-quality financial institutions, investing primarily in money market accounts. We have established guidelines relative to credit ratings, diversification and maturities that seek to maintain safety and liquidity. Our investment strategy generally results in lower yields on investments but reduces the risk to principal in the short term prior to these funds being used in our business. We have not experienced any material losses on financial instruments held at financial institutions.
Our products and services are sold worldwide to facilitate server and SAN storage implementations, primarily through original equipment manufacturers, or OEMs, and supplemented by system integrators, or SIs, distributors and value added resellers, or VARs. Our accounts receivable are primarily derived from revenue earned from customers located in the United States, Europe and Asia. Credit risk with respect to accounts
F-11
Table of Contents
receivable is generally concentrated due to the small number of entities comprising our overall customer base. We perform ongoing credit evaluations of our customers’ financial condition and generally require no collateral from our customers. We maintain an allowance for doubtful accounts based upon the expected collectability of accounts receivable. Due to our credit evaluation and collection process, bad debt expenses have not been significant. However, we are not able to predict changes in the financial stability of our customers. Any material change in the financial status of any one or a particular group of customers may cause us to adjust our estimate of the recoverability of accounts receivables and could have a material adverse effect on our results of operations. At December 31, 2008, our largest two customers with worldwide operations accounted for 43% and 24% of gross accounts receivable and our top five customers accounted for 92% of our gross accounts receivable. At December 31, 2009 our largest two customers with worldwide operations accounted for 57% and 31% of gross accounts receivable and our top five customers accounted for 91% of our gross accounts receivable.
A small number of customers account for a significant percentage of our net revenue. Net revenue by major customer for the years ended December 31 is as follows (as a percentage of total net revenue):
| 2007 | 2008 | 2009 | |||||||
| Sun Microsystems |
63.2 | % | 24.6 | % | 4.4 | % | |||
| Hewlett Packard |
0.8 | % | 32.6 | % | 51.4 | % | |||
| NetApp, Inc. |
12.5 | % | 23.2 | % | 24.7 | % | |||
| Other customers less than 10% |
23.5 | % | 19.6 | % | 19.5 | % | |||
| Total |
100.0 | % | 100.0 | % | 100.0 | % | |||
We expect that the sale of our products to a limited number of customers will continue to account for a high percentage of net revenue for the foreseeable future. Our agreements with our OEM partners do not contain any minimum purchase commitments, do not obligate our OEM partners to purchase their storage solutions exclusively from us and may be terminated at any time upon notice from the applicable partner.
We currently rely on a limited number of contract manufacturing partners to produce substantially all of our products. As a result, should our current manufacturing partners not produce and deliver inventory for us to sell on a timely basis, operating results may be adversely impacted.
Recent Accounting Pronouncements
In September 2009, the Financial Accounting Standards Board, or FASB, reached a consensus on Accounting Standards Update, or ASU, No. 2009-13, Revenue Recognition (Topic 605) — Multiple-Deliverable Revenue Arrangements, or ASU 2009-13 and ASU No. 2009-14, Software (Topic 985) — Certain Revenue Arrangements That Include Software Elements, or ASU 2009-14. ASU 2009-13 modifies the requirements that must be met for an entity to recognize revenue from the sale of a delivered item that is part of a multiple-element arrangement when other items have not yet been delivered. ASU 2009-13 eliminates the requirement that all undelivered elements must have either: i) vendor specific objective evidence, or VSOE, or ii) third-party evidence, or TPE, before an entity can recognize the portion of an overall arrangement consideration that is attributable to items that already have been delivered. In the absence of VSOE or TPE of the standalone selling price for one or more delivered or undelivered elements in a multiple-element arrangement, entities will be required to estimate the selling prices of those elements. Overall arrangement consideration will be allocated to each element (both delivered and undelivered items) based on their relative selling prices, regardless of whether those selling prices are evidenced by VSOE or TPE or are based on the entity’s estimated selling price. The residual method of allocating arrangement consideration has been eliminated. ASU 2009-14 modifies the software revenue recognition guidance to exclude from its scope tangible products that contain both software and non-software components that function together to deliver a product’s essential functionality. These new updates are effective for revenue arrangements entered into or materially modified in fiscal years beginning on or after June 15, 2010. Early adoption is permitted. We are currently evaluating the impact that the adoption of these ASUs will have on our future consolidated financial statements.
F-12
Table of Contents
In June 2009, the FASB issued ASC Topic No. 810-10-05 which changes the approach to determining the primary beneficiary of a variable interest entity, or VIE, and requires companies to more frequently assess whether they must consolidate VIEs. ASC No. 810-10-05 is effective for annual periods beginning after November 15, 2009. Based on the current nature of our operations, we do not expect the adoption of this requirement will have a material impact on our consolidated financial statements.
In December 2007, the FASB issued FASB Statement No. 141(R), Business Combinations, which has been codified into ASC Topic No. 805. ASC Topic No. 805 establishes principles and requirements for how the acquirer of a business recognizes and measures in its financial statements the identifiable assets acquired, the liabilities assumed, and any noncontrolling interest in the acquiree. The statement also provides guidance for recognizing and measuring the goodwill acquired in the business combination and determines what information to disclose to enable users of the financial statement to evaluate the nature and financial effects of the business combination. This statement also requires that acquisition-related costs are to be recognized separately from the acquisition and expensed as incurred. We are currently evaluating the impact of the revised guidance on business combinations to our acquisition of Cloverleaf in January 2010. See Note 15 of the Notes to Consolidated Financial Statements for further discussion of our acquisition of Cloverleaf.
In April 2008, the FASB issued FASB Staff Position FAS 142-3, Determination of the Useful Life of Intangible Assets, which has been codified into ASC Topic No. 350. ASC Topic No. 350 requires that the useful life of a recognized intangible asset be determined based upon the period of expected cash flows used to measure the fair value of the asset under ASC Topic 805. The guidance for determining the useful life of a recognized intangible asset is to be applied prospectively; therefore, we are currently determining the impact of this guidance on our acquisition of Cloverleaf in January 2010. See Note 15 of the Notes to Consolidated Financial Statements for further discussion of our acquisition of Cloverleaf.
2. Net Loss Per Share
Basic net loss per share is calculated by dividing net loss for the period by the weighted average number of common shares outstanding during the period. Diluted net loss per share is computed by dividing net loss for the period by the weighted average number of shares of common stock outstanding during the period and including the dilutive effect of common stock that would be issued assuming conversion or exercise of outstanding warrants, stock options, share based compensation awards and other dilutive securities. No such items were included in the computation of diluted loss per share in 2007, 2008 or 2009 because we incurred a net loss in each of these periods and the effect of inclusion would have been anti-dilutive.
As of December 31, 2007, options to purchase 6,672,095 shares of common stock with exercise prices ranging from $1.34 to $17.14 per share and warrants to purchase 337,742 shares of common stock with exercise prices ranging from $3.25 to $4.50 per share, were outstanding, but were not included in the calculation of diluted net loss per share because their effect was antidilutive.
As of December 31, 2008, options to purchase 6,912,141 shares of common stock with exercise prices ranging from $1.15 to $16.36 per share, 332,128 shares of unvested restricted stock awards and a warrant to purchase 1,602,489 shares of common stock at a price of $2.40 per share, were outstanding, but were not included in the calculation of diluted net loss per share because their effect was antidilutive.
As of December 31, 2009, options to purchase 6,142,901 shares of common stock with exercise prices ranging from $0.47 to $16.36 per share, 1,511,205 shares of unvested restricted stock awards and a warrant to purchase 1,602,489 shares of common stock at a price of $2.40 per share, were outstanding, but were not included in the calculation of diluted net loss per share because their effect was antidilutive.
F-13
Table of Contents
3. Acquisition
In September 2008 we acquired certain identified RAIDCore and Network Attached Storage, or NAS, assets of Ciprico, for approximately $4.5 million consisting of cash consideration of $2.3 million, an unsecured non-interest bearing promissory note in the amount of $0.9 million, and contingent consideration in the amount of $1.1 million. Additionally, we incurred $0.2 million in acquisition related costs, primarily consisting of legal fees. Payments under the promissory note are due in equal monthly installments over a 42-month period commencing October 1, 2008. We are also required to pay Ciprico earn-out payments of up to $2.0 million over the 42 months following the date of acquisition. The earn-out payments are payable on a quarterly basis and are equal to 6.67% of RaidCore and NAS net revenue for the quarterly period. The contingent consideration liability fair value, as of the acquisition date, was $1.1 million, of which $0.3 million was included in accrued expenses and $0.8 million was included in other long-term liabilities. The purchase price was allocated to the assets acquired based on estimated fair values on the transaction date, resulting in the recording of RaidCore technology of $4.3 million and NAS technology of $0.2 million. The RaidCore and NAS assets are being amortized on a straight-line basis over four years and three years, respectively. Our primary reasons for the acquisition were to allow us to broaden our product portfolio in the redundant array of independent disks, or RAID, market while allowing us to sell into the Band 1 market, and to pursue opportunities at current and target OEM customers. As of December 31, 2009, we had $0.3 million in short-term debt and $0.3 million in long-term debt consisting of the note payable issued in connection with the acquisition of certain intangible assets from Ciprico.
During the fourth quarter of 2009, we revised our estimate of the probable amount of contingent consideration due to Ciprico based on lower projected sales of products eligible for the contingent consideration through the end of the contingent consideration period. Accordingly, we reduced the contingent consideration liability we had recorded to our best estimate of the liability as of December 31, 2009. As a result, we reduced research and development expense in the statement of operations by $0.6 million to reflect the reduction in estimated contingent consideration liability.
4. Identifiable Intangible Assets
Identifiable intangible assets are follows as of December 31 (in thousands):
| 2008 | ||||||||||
| Gross | Accumulated Amortization |
Net | ||||||||
| RaidCore Technology |
4,256 | (287 | ) | 3,969 | ||||||
| NAS Technology |
214 | (19 | ) | 195 | ||||||
| Total intangible assets |
$ | 4,470 | $ | (306 | ) | $ | 4,164 | |||
| 2009 | ||||||||||
| Gross | Accumulated Amortization |
Net | ||||||||
| RaidCore Technology |
4,256 | (1,350 | ) | 2,906 | ||||||
| NAS Technology |
214 | (91 | ) | 123 | ||||||
| Total intangible assets |
$ | 4,470 | $ | (1,441 | ) | $ | 3,029 | |||
Amortization expense related to identifiable intangible assets totaled $2.1 million, $1.6 million and $1.1 million, for the years ended December 31, 2007, 2008 and 2009, respectively.
F-14
Table of Contents
Estimated future amortization expense related to identifiable intangible assets is as follows as of December 31, 2009 (in thousands):
| 2010 |
$1,136 | ||
| 2011 |
1,116 | ||
| 2012 |
777 | ||
| Total |
$ | 3,029 | |
5. Goodwill
The changes in the carrying amount of goodwill are as follows during the years ended December 31 (in thousands):
| 2008 | 2009 | |||||||
| Balance as of January 1 |
||||||||
| Goodwill |
$ | 40.7 | $ | 40.7 | ||||
| Accumulated impairment losses |
(40.7 | ) | (40.7 | ) | ||||
| — | — | |||||||
| Goodwill acquired during year |
— | — | ||||||
| Impairment losses |
— | — | ||||||
| Balance as of December 31 |
||||||||
| Goodwill |
40.7 | 40.7 | ||||||
| Accumulated impairment losses |
(40.7 | ) | (40.7 | ) | ||||
| $ | — | $ | — | |||||
6. Restructuring Charge
In December 2008, our management approved, committed to, and initiated a restructuring plan to improve efficiencies in our operations, which was largely driven by our plan to consolidate our facility in Carlsbad, California into the Longmont, Colorado facility. As a result of this relocation, we intend to terminate approximately 70 California employees whose positions are being relocated to Colorado. We expect to incur approximately $1.7 million in severance-related costs, of which $0.3 million was recorded in 2008 and $1.0 million was recorded in 2009 as restructuring expense and is presented as a separate component within operating expenses. We expect to incur the remaining $0.4 million of severance-related costs in 2010. Accrued severance-related costs are recorded in restructuring accrual line on the consolidated balance sheets. We expect that approximately half of the severance-related costs will be paid out in the second and third quarters of 2010.
As part of the 2008 restructuring plan, we also incurred contract termination costs of $0.5 million in 2008 for facility lease costs that we continue to incur without economic benefit, as we exited a portion of our Carlsbad facility. In 2009, we incurred additional contract termination costs of $1.4 million for facility lease costs that we continue to incur without economic benefit, as we exited an additional portion of our Carlsbad facility as well as revised our original assumptions regarding our tenant sub-lease calculations. We have recorded charges for contract termination costs as restructuring expense, which is presented as a separate component within operating expenses. Accrued contract termination costs are recorded in the restructuring accrual line on the consolidated balance sheets. We expect to pay the majority of these contract lease termination costs over the remainder of the lease term ending in April 2013. To the extent that we are unable to find a tenant to sub-lease our unused space, we may incur additional restructuring charges.
F-15
Table of Contents
The following table summarizes our 2008 restructuring plan activities during the years ended December 31 (in thousands):
| Severance Related Costs |
Contract Termination Costs |
Total | ||||||||||
| Accrued restructuring balance as of December 31, 2007 |
$ | — | $ | — | $ | — | ||||||
| 2008 restructuring plan costs charged |
272 | 541 | 813 | |||||||||
| Cash payments |
(132 | ) | (132 | ) | ||||||||
| Accrued restructuring balance as of December 31, 2008 |
140 | 541 | 681 | |||||||||
| Additional 2008 restructuring plan costs charged |
1,042 | 1,388 | 2,430 | |||||||||
| Cash payments |
(743 | ) | (671 | ) | (1,414 | ) | ||||||
| Accrued restructuring balance as of December 31, 2009 |
$ | 439 | $ | 1,258 | $ | 1,697 | ||||||
7. Credit Facilities
In August 2008, we entered into a credit agreement with Silicon Valley Bank to provide for a revolving credit facility for cash advances and letters of credit of up to an aggregate of $30 million based upon an advance rate of 85% of eligible accounts receivable. The credit agreement expires three years from its effective date. Borrowings under the credit facility bear interest at the prime rate and are secured by substantially all of our accounts receivable, deposit and securities accounts. The agreement provides for a negative pledge on our inventory and intellectual property, subject to certain exceptions, and contains usual and customary covenants for an arrangement of its type, including an obligation that we maintain at all times a net worth of $55 million (subject to certain increases). The agreement also includes provisions to increase the financing facility by $20 million subject to our meeting certain requirements, including $40 million in borrowing base for the immediately preceding 90 days, and Silicon Valley Bank locating a lender willing to finance the additional facility. In addition, if our cash and cash equivalents net of the total amount outstanding under the credit facility fall below $20 million (measured on a rolling three-month basis), the interest rate will increase to prime plus 1% and additional restrictions will apply. As of December 31, 2009, we had an outstanding letter of credit issued to our contract manufacturer in China in the amount of $5.0 million.
In July 2009, we amended our credit agreement with Silicon Valley Bank. The amendment reduces our obligation to maintain at all times a net worth of $55 million to $50 million (subject to certain increases) and revises the definition of net worth to exclude certain changes such as restructuring expenses and goodwill and long-lived asset impairment charges, subject to certain limitations. The amendment also provides for a cash management services sublimit under the revolving credit line of up to $300,000. All other terms of the credit agreement remain unchanged. As of December 31, 2009, we were in compliance with all financial covenants under the credit agreement.
Under the credit agreement, we our required to pay certain fees, including a letter of credit fee of 100 basis points per annum of the face amount of each letter of credit issued, an unused revolving line facility fee of 37.5 basis points per annum of the average unused portion of the revolving line and an unused commitment fee of $45,000 per annum. In connection with these fees, we incurred $0.1 million in charges in 2009 that were expensed as incurred.
As of December 31, 2008 and 2009 there were no amounts outstanding under the Silicon Valley Bank line of credit.
F-16
Table of Contents
8. Fair Value of Financial Instruments
The carrying amounts and fair values of our financial instruments are as follows as of December 31 (in thousands):
| 2008 | 2009 | |||||||||||
| Carrying Value |
Fair Value |
Carrying Value |
Fair Value | |||||||||
| Liabilities: |
||||||||||||
| Other long-term liabilities |
$ | 1,070 | $ | 972 | $ | 421 | $ | 390 | ||||
For the years ended December 31, 2008 and 2009, the carrying values on our balance sheet of our cash and cash equivalents, accounts receivable, accounts payable and note payable approximate their fair values due to their short maturities. We exclude them from the table above accordingly.
We estimated the fair value of our other long-term liabilities using a discounted cash flows approach and incorporated our credit risk for the liability measurement.
9. Income Taxes
Components of the income tax provision (benefit) are as follows for the years ended December 31, (in thousands):
| 2007 | 2008 | 2009 | ||||||||||
| Current: |
||||||||||||
| Federal |
$ | — | $ | (101 | ) | $ | (205 | ) | ||||
| State, local and foreign |
(177 | ) | 295 | 145 | ||||||||
| (177 | ) | 194 | (60 | ) | ||||||||
| Deferred: |
||||||||||||
| Federal |
— | — | — | |||||||||
| State, local and foreign |
— | (4 | ) | 20 | ||||||||
| — | (4 | ) | 20 | |||||||||
| Total income tax provision (benefit) |
$ | (177 | ) | $ | 190 | $ | (40 | ) | ||||
The reconciliation of the income tax provision computed using the federal statutory income tax rate to the recognized income tax provision (benefit) is as follows for the years ended December 31, (in thousands):
| 2007 | 2008 | 2009 | ||||||||||
| Federal statutory rate |
$ | (21,142 | ) | $ | (8,695 | ) | $ | (4,646 | ) | |||
| State and local income taxes, net of federal benefit |
13 | 14 | 46 | |||||||||
| Increase in valuation allowance |
1,197 | 9,621 | 4,225 | |||||||||
| Foreign tax differential |
5,732 | 110 | (23 | ) | ||||||||
| Research and development credits |
(189 | ) | (273 | ) | (253 | ) | ||||||
| Goodwill impairment |
13,846 | — | — | |||||||||
| Chapparal acquisition legal settlement |
— | (1,292 | ) | — | ||||||||
| Share based compensation |
467 | 518 | 555 | |||||||||
| Other |
(101 | ) | 187 | 56 | ||||||||
| Income tax provision (benefit) |
$ | (177 | ) | $ | 190 | $ | (40 | ) | ||||
F-17
Table of Contents
The tax effect of temporary differences that give rise to deferred income taxes are as follows as of December 31 (in thousands):
| 2008 | 2009 | |||||||
| Deferred tax assets: |
||||||||
| Net operating loss and tax credit carry forwards |
$ | 70,560 | $ | 76,175 | ||||
| Inventory reserve and uniform capitalization |
999 | 1,292 | ||||||
| Stock options and warrants |
1,693 | 2,184 | ||||||
| In-process research and development |
282 | 227 | ||||||
| Allowance for bad debts |
121 | 94 | ||||||
| Vacation accrual |
375 | 437 | ||||||
| Deferred rent |
1,007 | 818 | ||||||
| Warranty accrual |
655 | 417 | ||||||
| Deferred revenue |
513 | — | ||||||
| Depreciation and amortization |
2,584 | 2,057 | ||||||
| Other accruals and reserves |
417 | 753 | ||||||
| Acquired intangibles |
926 | 1,041 | ||||||
| Total deferred tax assets |
80,132 | 85,495 | ||||||
| Deferred tax liabilities: |
||||||||
| State taxes |
(4,226 | ) | (4,433 | ) | ||||
| Total deferred income tax liabilities |
(4,226 | ) | (4,433 | ) | ||||
| Valuation allowance |
(75,886 | ) | (81,062 | ) | ||||
| Net deferred tax assets |
$ | 20 | $ | 0 | ||||
The following table summarizes the activity related to our unrecognized tax benefits (in thousands):
| 2007 | 2008 | 2009 | |||||||||
| Balance, January 1 |
$ | 11,235 | $ | 4,515 | $ | 4,756 | |||||
| Increase related to prior period positions |
1,300 | 23 | 167 | ||||||||
| Increase related to current year tax positions |
66 | 218 | — | ||||||||
| Settlements with foreign taxing authorities |
(7,986 | ) | — | — | |||||||
| Expiration of the statute of limitations for the assessment of taxes |
(100 | ) | — | — | |||||||
| Decrease related to change in prior year estimate |
— | — | (81 | ) | |||||||
| Balance, December 31 |
$ | 4,515 | $ | 4,756 | $ | 4,842 | |||||
The cumulative effects of adopting FIN 48 resulted in an increase of $0.5 million to accumulated deficit and an increase in other long-term liabilities of $0.5 million of tax benefits that, if recognized, would affect the effective tax rate. At December 31, 2007, December 31, 2008, and December 31, 2009 we had cumulative unrecognized tax benefits of approximately $4.52 million, $4.75 million, and $4.84 respectively, of which approximately $0.2 million, $0.3 million, and $0.2 million respectively, are included in other long term liabilities that, if recognized, would affect the effective tax rate. The remaining $4.3 million $4.5 million, and $4.6 million of unrecognized tax benefits will have no impact on the effective tax rate due to the existence of net operating loss carryforwards and a full valuation allowance. Consistent with previous periods, penalties and tax related interest expense are reported as a component of income tax expense. As of December 31, 2007, December 31, 2008, and December 31, 2009, the total amount of accrued income tax related interest and penalties included in the consolidated balance sheet was less than $0.1 million. We do not expect that our unrecognized tax benefit will change significantly within the next 12 months.
Due to net operating losses and other tax attributes carried forward, we are currently open to audit under the statute of limitations by the Internal Revenue Service for the years ending March 31, 1995 through December 31, 2009. With few exceptions, our state income tax returns are open to audit for the years ended December 31, 2000 through 2009.
F-18
Table of Contents
We periodically evaluate the likelihood of the realization of deferred tax assets, and adjust the carrying amount of the deferred tax assets by the valuation allowance to the extent the future realization of the deferred tax assets is not judged to be more likely than not. We consider many factors when assessing the likelihood of future realization of our deferred tax assets, including our recent cumulative earnings experience by taxing jurisdiction, expectations of future taxable income or loss, the carryforward periods available to us for tax reporting purposes, and other relevant factors.
At December 31, 2009, based on the weight of available evidence, including cumulative losses in recent years and expectations regarding future taxable income, we determined that it was not more likely than not that our United States deferred tax assets would be realized and have a $81.1 million valuation allowance associated with our United States deferred tax assets.
As of December 31, 2009, we had federal and state net operating losses of approximately $178.7 million and $105.6 million, respectively, which begin to expire in the tax years ending 2019 and 2009, respectively. In addition, we had federal tax credit carryforwards of $4.3 million, of which approximately $0.5 million can be carried forward indefinitely to offset future tax liability, and the remaining $3.8 million begin to expire in the tax year ending 2009. We also had state tax credit carryforwards of $2.9 million, of which $0.2 million will begin expiring in 2009, and the remaining $2.7 million have no expiration date.
As a result of our equity transactions, an ownership change, within the meaning of IRC Section 382, occurred on September 18, 2003. As a result, annual use of our federal net operating loss and credit carry forwards is limited to (i) the aggregate fair market value of Dot Hill immediately before the ownership change multiplied by (ii) the long-term tax-exempt rate (within the meaning of Section 382 (f) of the IRC) in effect at that time. The annual limitation is cumulative and, therefore, if not fully utilized in a year, can be utilized in future years in addition to the IRC Section 382 limitation for those years.
As a result of our acquisition of Chaparral Network Storage, Inc., or Chaparral, a second ownership change, within the meaning of IRC Section 382, occurred on February 23, 2004. As a result, annual use of Chaparral’s federal net operating loss and credit carry forwards may be limited. The annual limitation is cumulative and, therefore, if not fully utilized in a year, can be utilized in future years in addition to the Section 382 limitation for those years.
10. Stockholders’ Equity
Stockholders Rights Plan
On May 19, 2003 we adopted a plan to provide certain rights to our stockholders, or a rights plan. Terms of the rights plan provide for a dividend distribution of one preferred share purchase right for each outstanding share of our common stock. The dividend was paid on May 30, 2003 to our stockholders of record on that date. Each such purchase right entitles the registered holder to purchase one one-hundredth of a share of our Series A Junior Participating Preferred Stock at a price of $50.00, subject to adjustment. Each one one-hundredth of a share of this series of preferred stock has designations and powers, preferences and rights, and qualifications, limitations and restrictions that make its value approximately equal to the value of one share of our common stock.
11. Equity Incentive Plans and Warrants
Stock Incentive Plans
2009 EIP. Our stockholders approved the 2009 Equity Incentive Plan, or the 2009 EIP, at our Annual Meeting of Stockholders held on June 15, 2009. The 2009 EIP authorizes the issuance or grant of incentive stock options, non-statutory stock options, restricted stock awards, restricted stock unit awards, stock appreciation rights, performance awards, performance cash awards and other stock awards to our employees, directors and
F-19
Table of Contents
consultants and is intended as the successor to and continuation of our 2000 EIP. Following the approval of the 2009 EIP by our stockholders, no additional stock awards may be granted under the 2000 Amended and Restated Equity Incentive Plan, or the 2000 EIP. All outstanding stock awards granted under the 2000 EIP will remain subject to the terms of the 2000 EIP provided, however, that any shares subject to outstanding stock awards granted under the 2000 EIP that expire or terminate for any reason prior to exercise or settlement shall become available for issuance pursuant to awards granted under the 2009 EIP. As of June 15, 2009, the total number of shares of our common stock reserved for issuance under the 2009 EIP consisted of 4,500,000 shares plus 7,112,217 shares that are subject to outstanding stock awards under the 2000 EIP that may become available for grant under the 2009 EIP if they expire or terminate for any reason prior to exercise or settlement under the 2000 EIP. Unless sooner terminated by our Board of Directors, the 2009 EIP shall automatically terminate on April 26, 2019, the day before the tenth anniversary of the date the 2009 EIP was adopted by the Board. The Board of Directors may also amend the 2009 EIP at any time subject to applicable laws and regulations, including the rules and regulations of The NASDAQ Stock Market LLC. In general, no amendment or termination of the 2009 EIP may adversely affect any rights under awards already granted to a participant unless agreed to by the affected participant.
During 2008 and 2009, we granted restricted stock and options to purchase common stock. The restricted stock typically vests upon the completion of specific performance goals or over four years, with 25% of the shares vesting one year from the date of grant and the remaining shares vesting ratably thereafter on a monthly basis. The options vest over four years, with 25% of the shares subject to the option vesting one year from the date of grant and the remaining shares subject to the option vesting ratably thereafter on a monthly basis. As of December 31, 2009, 136,528 shares of restricted stock were outstanding under the 2009 EIP. Additionally, 1,374,677 shares of restricted stock were outstanding under the 2000 EIP, of which 800,000 shares were performance-based restricted stock awards. These performance–based awards were issued in February 2009 and vest in the first quarter of 2010 provided that the performance objectives are achieved. As of December 31, 2009, options to purchase 5,502,901 shares of common stock were outstanding under the 2000 EIP and 5,450,628 shares of common stock remained available for grant under the 2009 EIP.
2000 NEDSOP. Under our 2000 New Employee Directors Stock Option Plan, or 2000 NEDSOP, nonqualified stock options to purchase common stock are automatically granted to our non-employee directors upon appointment to our board of directors (initial grants) and upon each of our annual meeting of stockholders (annual grants). Options granted under the 2000 NEDSOP expire 10 years from the date of the grant. Initial grants vest over four years, with 25% of the shares subject to the option vesting one year from the date of grant and the remaining shares subject to the option vesting ratably thereafter on a monthly basis. Annual grants are fully vested on the date of grant. 1,000,000 shares of common stock are reserved for issuance under the 2000 NEDSOP. As of December 31, 2009, options to purchase 640,000 shares of common stock were outstanding under the 2000 NEDSOP and options to purchase 273,124 shares of common stock remained available for grant under the 2000 NEDSOP.
2000 ESPP. Our stockholders approved our Amended and Restated Employee Stock Purchase Plan, or 2000 ESPP, at our Annual Meeting of Stockholders held on June 15, 2009, primarily to increase the share reserve under the 2000 ESPP by 4,000,000 shares. The 2000 ESPP qualifies under the provisions of Section 423 of the Internal Revenue Code, or IRC, and provides our eligible employees, as defined in the 2000 ESPP, with an opportunity to purchase shares of our common stock at 85% of fair market value. There were 368,498 and 1,076,265 shares issued under the 2000 ESPP for the years ended December 31, 2008 and 2009, respectively. As of December 31, 2009, the 2000 ESPP had a total of 4,104,966 shares available for purchase.
F-20
Table of Contents
As of December 31, 2009, total unrecognized share-based compensation cost related to unvested stock options, restricted stock awards, and our 2000 ESPP was $2.7 million, which is expected to be recognized over a weighted-average period of approximately 2.1 years. The following table summarizes share-based compensation expense for the years ended December 31 (in thousands):
| 2007 | 2008 | 2009 | |||||||
| Cost of goods sold |
$ | 372 | $ | 377 | $ | 382 | |||
| Sales and marketing |
478 | 388 | 288 | ||||||
| Research and development |
819 | 952 | 1,112 | ||||||
| General and administrative |
682 | 1,167 | 1,040 | ||||||
| Share-based compensation expense before taxes |
2,351 | 2,884 | 2,822 | ||||||
| Related deferred income tax benefits |
— | — | — | ||||||
| Share-based compensation expense |
$ | 2,351 | $ | 2,884 | $ | 2,822 | |||
| Share-based compensation expense is derived from: |
|||||||||
| Stock options |
$ | 1,938 | $ | 2,563 | $ | 2,237 | |||
| Restricted stock awards |
— | — | 310 | ||||||
| 2000 ESPP |
413 | 321 | 275 | ||||||
| Total |
$ | 2,351 | $ | 2,884 | $ | 2,822 | |||
We estimate forfeitures at the time of grant and revise, if necessary, in subsequent periods if actual forfeitures differ from those estimates. We have historically and continue to estimate the fair value of share-based awards using the Black-Scholes option-pricing model.
A summary of stock option activity is as follows:
| Number of shares |
Weighted average exercise price |
Weighted average remaining contractual term (in years) |
Aggregate intrinsic value (in thousands) | ||||||||
| Outstanding at January 1, 2009 |
6,912,141 | 4.35 | |||||||||
| Granted |
189,500 | .75 | |||||||||
| Exercised |
— | — | |||||||||
| Forfeited |
(31,911 | ) | 2.93 | ||||||||
| Expired |
(926,829 | ) | 5.71 | ||||||||
| Outstanding at December 31, 2009 |
6,142,901 | $ | 4.04 | 6.6 | $ | 437 | |||||
| Vested and expected to vest at December 31, 2009 |
5,979,995 | $ | 4.10 | 6.5 | $ | 391 | |||||
| Exercisable at December 31, 2009 |
4,314,081 | $ | 4.74 | 5.9 | $ | 125 | |||||
A summary of restricted stock award activity for 2009 is as follows:
| Number of shares |
Weighted average grant date fair value | |||||
| Outstanding at January 1, 2009 |
332,128 | $ | 2.34 | |||
| Granted* |
1,522,128 | 0.55 | ||||
| Vested |
(55,801 | ) | 1.55 | |||
| Forfeited |
(287,250 | ) | 2.13 | |||
| Outstanding and unvested at December 31, 2009 |
1,511,205 | $ | 0.60 | |||
| * | Includes 800,000 performance-based restricted stock awards. These performance–based awards were issued in February 2009 and 439,105 shares vested on January 20, 2010. The remaining 360,895 shares did not vest as the performance objectives tied to these shares were not achieved. |
F-21
Table of Contents
The weighted average grant-date fair values of options granted during the years ended December 31, 2007, 2008 and 2009 were $2.06 per share, $1.35 per share and $0.45 per share, respectively. The total intrinsic value of options exercised during the years ended December 31, 2007 and 2008 were $0.1 million and $0.1 million, respectively. There were no options exercised during the year ended December 31, 2009.
There were no restricted stock award grants during the year ended December 31, 2007. The weighted average grant-date fair values of restricted stock awards granted during the years ended December 31, 2008 and 2009 were $2.34 and $0.55 per share, respectively.
Cash generated from options exercised under all share-based compensation arrangements for the years ended December 31, 2007 and 2008 were $0.2 million and $0.3 million, respectively. Cash generated from the purchase of shares through the 2000 ESPP for the years ended December 31, 2007, 2008, and 2009, was $1.0 million, $0.9 million and $0.5 million, respectively. We issue new shares from the respective plan share reserves upon exercise of options to purchase common stock and for purchases through the 2000 ESPP.
The aggregate intrinsic value in the stock option summary table above is based on our closing stock price of $1.90 per share as of the last business day of the fiscal year ended December 31, 2009, which value would have been realized by the optionees had all options been exercised on that date. The total fair value of options to purchase common stock that vested during the years ended December 31, 2007, 2008 and 2009 was $2.9 million, $2.5 million and $2.4 million, respectively.
To estimate compensation expense for the years ended December 31, 2007, 2008 and 2009, we use the Black-Scholes option-pricing model with the following weighted-average assumptions for equity awards granted:
| EIP and NEDSOP | ESPP | |||||||||||||||||
| Years Ended December 31, |
Years Ended December 31, |
|||||||||||||||||
| 2007 | 2008 | 2009 | 2007 | 2008 | 2009 | |||||||||||||
| Risk-free interest rate |
4.48 | % | 2.74 | % | 2.01 | % | 4.75 | % | 1.96 | % | 0.32 | % | ||||||
| Expected dividend yield |
— | % | — | % | — | % | — | % | — | % | — | % | ||||||
| Volatility |
68 | % | 67 | % | 69 | % | 68 | % | 82 | % | 120 | % | ||||||
| Expected term |
5.2 years | 5.6 years | 5.5 years | 0.5 years | 0.5 years | 0.5 years | ||||||||||||
| Forfeiture rate |
11.9 | % | 12.34%-12.9 | % | 11.47%-12.37 | % | — | % | — | % | — | % | ||||||
The risk-free interest rate is based on the implied yield available on United States Treasury issues with an equivalent remaining term. We have not paid dividends in the past and do not plan to pay any dividends in the future.
The expected volatility is based on historical volatility of our stock for the related vesting period. The expected life of the equity award is based on historical experience.
The forfeiture rate is estimated when awards are granted and updated if information becomes available indicating that actual forfeitures will differ. The eventual consolidation of our Carlsbad, California facility to Longmont, Colorado may impact our forfeiture rate. We will analyze the impact once this consolidation concludes and disclose any impact to share-based compensation expense.
Warrants
In January 2008, we amended our Product Purchase Agreement, or Agreement, originally entered into with HP in September 2007, to allow for sales to additional divisions within HP. In connection with the Agreement, we issued a warrant to HP to purchase 1,602,489 shares of our common stock (approximately 3.5% of our outstanding shares prior to the issuance of the warrant) at an exercise price of $2.40 per share. The warrant was
F-22
Table of Contents
fully vested and exercisable at signing. The fair value of the warrant, determined using the Black-Scholes option-pricing model, was approximately $2.3 million. The Black-Scholes option-pricing model utilized the following assumptions; a risk-free interest rate of 3.18%, expected volatility of 59.5% and a contractual life of five years. The warrant was issued to induce the customer to enter into the Agreement with us. The fair value of the warrant was recorded as a reduction in revenue for the three months ended March 31, 2008, the period in which the Agreement was signed. At December 31, 2009, there was a warrant outstanding to purchase 1,602,489 shares of our common stock at an exercise price of $2.40 per share. This warrant expires on January 3, 2013.
12. Employee Retirement Benefit Plans
Dot Hill Retirement Savings Plan
The Dot Hill Retirement Savings Plan, which qualifies under Section 401(k) of the IRC, is open to eligible employees over 21 years of age. Under the plan, participating United States employees may defer up to 100% of their pretax salary, but not more than statutory limits. At our discretion we may make contributions to this plan for plan participants. Our matching contributions vest to employees as a percentage based on years of employment from one to five years, and matching contributions are fully vested to employees after five years of employment. Our matching contributions to the retirement savings plan for the years ended December 31, 2007, 2008 and 2009 were $0.2 million, $0.1 million and $0.2 million, respectively.
13. Commitments and Contingencies
Operating Leases
We lease office space and equipment under non-cancelable operating leases, which expire at various dates through June 2013. Rent expense for the years ended December 31, 2007, 2008 and 2009 was $1.7 million, $1.7 million and $1.4 million, respectively. We record rent expense on a straight–line basis based on contractual lease payments.
Future minimum lease payments due under all non-cancelable operating leases as of December 31, 2009 are as follows (in thousands):
| 2010 |
$ | 1,753 | |
| 2011 |
1,758 | ||
| 2012 |
1,687 | ||
| 2013 |
391 | ||
| Total minimum lease payments |
$ | 5,589 | |
For purposes of the table above, the operating lease obligations exclude common area maintenance, real estate taxes and insurance expenses.
Unconditional Purchase Obligations
We have unconditional inventory related purchase obligations to certain suppliers for certain commodities in order to ensure supply of select key components at the most favorable pricing. Additionally, we have non-inventory related purchase obligations that represent purchase commitments made in the ordinary course of business. At December 31, 2009 we had approximately $17.5 million of unconditional purchase obligations.
Dot Hill Securities Class Actions, Derivative Suits and Direct State Securities Action
In late January and early February 2006, numerous purported class action complaints were filed against us in the United States District Court for the Southern District of California. The complaints allege violations of
F-23
Table of Contents
federal securities laws related to alleged inflation in our stock price in connection with various statements and alleged omissions to the public and to the securities markets and declines in our stock price in connection with the restatement of certain of our quarterly financial statements for fiscal year 2004, and seeking damages therefore. The complaints were consolidated into a single action, and the Court appointed as lead plaintiff a group comprised of the Detroit Police and Fire Retirement System and the General Retirement System of the City of Detroit. The consolidated complaint was filed on August 25, 2006, and we filed a motion to dismiss on October 5, 2006. The Court granted our motion to dismiss on March 15, 2007. Plaintiffs filed their Second Amended Consolidated Complaint on April 20, 2007. We filed a motion to dismiss the Second Amended Consolidated Complaint on May 1, 2008, which the Court granted on September 2, 2008. The plaintiffs subsequently filed a Third Amended Consolidated Complaint on October 10, 2008, and on November 24, 2008 we filed a motion to dismiss. On March 18, 2009, the Court dismissed the Third Amended Consolidated Complaint, but granted plaintiffs leave to amend one more time. On April 17, 2009, plaintiffs filed a Notice of Appeal regarding the Court’s September 2, 2008 and March 18, 2009 orders. On May 19, 2009, the Court entered final judgment and dismissed the action with prejudice; the plaintiffs subsequently filed an Amended Notice of Appeal on June 8, 2009. On October 29, 2009, the parties filed a Stipulation of Dismissal of Appeal. On October 30, 2009, the appeal was dismissed.
In addition, three complaints purporting to be derivative actions were filed in California state court against certain of our directors and executive officers. These complaints are based on the same facts and circumstances described in the federal class action complaints and generally allege that the named directors and officers breached their fiduciary duties by failing to oversee adequately our financial reporting. Each of the complaints generally seeks an unspecified amount of damages. Our demurrers to two of those cases, in which we sought dismissal, were overruled (i.e., denied). We formed a Special Litigation Committee, or SLC, of disinterested directors to investigate the alleged wrongdoing. On January 12, 2007, another derivative action similar to the previous derivative actions with the addition of allegations regarding purported stock option backdating was served on us. In April 2007, the SLC concluded its investigation and based on its findings directed us to file a motion to dismiss the derivative matters. On July 13, 2007, all of the derivative actions were consolidated for pre-trial proceedings. We filed a motion to dismiss the consolidated matters pursuant to the SLC’s directive on May 30, 2008. The hearing on this motion is set for May 14, 2010. The outcome of this action is uncertain, and no amounts have been accrued as of December 31, 2009.
The pending proceedings involve complex questions of fact and law and will require the expenditure of significant funds and the diversion of other resources to prosecute and defend. The results of legal proceedings are inherently uncertain and material adverse outcomes are possible. From time to time Dot Hill may enter into confidential discussions regarding the potential settlement of pending litigation or other proceedings. However, there can be no assurance that any such discussions will occur or will result in a settlement. The settlement of any pending litigation or other proceedings could require Dot Hill to incur substantial settlement payments and costs.
Other Litigation
We may be involved in certain other legal actions and claims from time to time arising in the ordinary course of business. Management believes that the outcome of such other litigation and claims will likely not have a material adverse effect on our financial condition or results of operations.
14. Segment Information
Operating segments are components of an enterprise for which separate financial information is available and is evaluated regularly by the chief operating decision maker in deciding how to allocate resources and in assessing performance. We operate our business in one reportable operating segment.
For the years ended December 31, 2007, 2008 and 2009, the overall majority of our net revenue was derived from the sales of hardware products.
F-24
Table of Contents
The following is a summary of geographical information (in thousands):
| For the Year Ended December 31, | |||||||||
| 2007 | 2008 | 2009 | |||||||
| Net revenue: |
|||||||||
| United States |
$ | 181,312 | $ | 245,489 | $ | 215,093 | |||
| Europe |
20,538 | 23,951 | 16,813 | ||||||
| Asia |
5,245 | 3,439 | 2,477 | ||||||
| $ | 207,095 | $ | 272,879 | $ | 234,383 | ||||
| Long-Lived Assets: |
|||||||||
| United States |
$ | 11,969 | $ | 7,079 | $ | 6,851 | |||
| Europe |
59 | 10 | 11 | ||||||
| Asia |
115 | 0 | 0 | ||||||
| $ | 12,143 | $ | 7,089 | $ | 6,862 | ||||
Net revenue is recorded in the geographic area in which the sale is originated.
We include in our long-lived assets net, property and equipment and identifiable intangible assets.
As a result of our recent acquisition of Cloverleaf Communications Inc. subsequent to the end of 2009 and based upon how our chief operating decision maker intends to manage our business, we expect that the number of our operating segments will be modified in 2010.
15. Subsequent Event
In January 2010, we acquired 100% of the voting equity interests of Cloverleaf Communications Inc., or Cloverleaf, a privately held software company. Cloverleaf products are sold under the iSN™ or Intelligent Storage Network brand. The acquisition of Cloverleaf could broaden market opportunities and accelerate our expansion from being solely a provider of storage arrays to also being a provider of storage software. The Cloverleaf acquisition also provided us with a new team of software developers and other professionals located in Israel. The acquisition will be reflected in our consolidated financial results beginning in the first quarter of 2010.
In accordance with the requirements of ASC Topic No. 805, our preliminary estimate of the consideration transferred in connection with the acquisition of Cloverleaf approximates $8.8 million, consisting of $0.7 million of cash and 4,758,530 shares of our common stock valued at $8.1 million, or $1.71 per share, which represents the closing price of our common stock on the acquisition date, or January 26, 2010. We paid approximately $1.7 million of assumed Cloverleaf liabilities at the acquisition date and expect to make additional payments during the remainder of the first quarter of 2010, although not to the extent of the amount paid at the acquisition date. We also incurred direct transaction costs of approximately $0.8 million most of which is expected to be paid in the first half of 2010. In addition, we agreed to issue 327,977 shares of restricted stock to the employees of Cloverleaf who became employees of Dot Hill on the acquisition date. These shares vest as follows: 1/3 of such shares vest upon issuance, which is expected to be on or about 30 days following the acquisition date; 1/3 of such shares vest one year from the date of issuance; and 1/3 of such shares vest two years from the date of issuance. We are currently evaluating the accounting treatment for this acquisition.
We are currently in the process of completing the closing of the balance sheet of Cloverleaf and our preliminary valuation of the intangible assets acquired in connection with the acquisition of Cloverleaf. The results of these efforts will be reported in our first quarterly report on Form 10-Q for the period ending March 31, 2010.
F-25
Table of Contents
16. Quarterly Financial Information (Unaudited)
The information presented below reflects all adjustments, which, in the opinion of management, are of a normal and recurring nature necessary to present fairly the results of operations for the periods presented (in thousands, except per share amounts).
| First Quarter |
Second Quarter |
Third Quarter |
Fourth Quarter |
|||||||||||||
| Year Ended December 31, 2008: |
||||||||||||||||
| Net revenue |
$ | 52,826 | $ | 71,027 | $ | 76,641 | $ | 72,385 | ||||||||
| Gross profit |
4,166 | 7,222 | 8,941 | 10,059 | ||||||||||||
| Loss before income taxes |
(5,950 | ) | (7,131 | ) | (3,808 | ) | (8,686 | ) | ||||||||
| Net loss |
(6,110 | ) | (7,370 | ) | (3,691 | ) | (8,594 | ) | ||||||||
| Basic and diluted net loss per share |
(0.13 | ) | (0.16 | ) | (0.08 | ) | (0.19 | ) | ||||||||
| Year Ended December 31, 2009: |
||||||||||||||||
| Net revenue |
$ | 53,889 | $ | 54,328 | $ | 63,600 | $ | 62,566 | ||||||||
| Gross profit |
9,260 | 7,970 | 11,631 | 8,966 | ||||||||||||
| Loss before income taxes |
(3,259 | ) | (4,227 | ) | (1,225 | ) | (4,954 | ) | ||||||||
| Net loss |
(3,292 | ) | (4,188 | ) | (1,137 | ) | (5,008 | ) | ||||||||
| Basic and diluted net loss per share |
(0.07 | ) | (0.09 | ) | (0.02 | ) | (0.11 | ) | ||||||||
During the fourth quarter of 2008, we performed an impairment analysis over our long-lived and intangible assets. The impairment analysis identified $5.4 million of impaired long-lived assets consisting of $4.4 million of property and equipment and $1.0 million of intangible assets. See further discussion of our long-lived asset impairment in Note 1.
During the fourth quarter of 2008, we incurred approximately $0.8 million of restructuring charges related to our 2008 restructuring plan. During the first, second, third and fourth quarters of 2009, we incurred approximately $0.1 million, $0.4 million, $0.4 million and $1.5 million, respectively, of restructuring charges related to our 2008 restructuring plan. See further discussion of our restructuring activities in Note 6.
F-26