Attached files
| file | filename |
|---|---|
| EX-32.1 - CHINA SKY ONE MEDICAL, INC. | v177513_ex32-1.htm |
| EX-31.1 - CHINA SKY ONE MEDICAL, INC. | v177513_ex31-1.htm |
| EX-32.2 - CHINA SKY ONE MEDICAL, INC. | v177513_ex32-2.htm |
| EX-31.2 - CHINA SKY ONE MEDICAL, INC. | v177513_ex31-2.htm |
| EX-21.1 - CHINA SKY ONE MEDICAL, INC. | v177513_ex21-1.htm |
UNITED
STATES
SECURITIES
AND EXCHANGE COMMISSION
Washington,
D.C. 20549
FORM
10-K
(Mark
One)
|
x
|
ANNUAL REPORT PURSUANT TO
SECTION 13 OR 15(d) OF THE SECURITIES EXCHANGE ACT OF
1934
|
For the
fiscal year ended: December
31, 2009
|
x
|
TRANSITION REPORT PURSUANT TO
SECTION 13 OR 15(d) OF THE SECURITIES EXCHANGE ACT OF
1934
|
For the
transition period from ____________ to ____________
Commission
file number: 001-34080
CHINA
SKY ONE MEDICAL, INC.
(Exact
name of registrant as specified in its charter)
|
Nevada
|
87-0430322
|
|
|
(State
or other jurisdiction of
|
(I.R.S.
Employer
|
|
|
incorporation
or organization)
|
Identification
No.)
|
|
No.
2158, North Xiang An Road, Song Bei District,
Harbin,
People’s
Republic of China
|
150028
|
|
|
(Address
of principal executive offices)
|
(Zip
Code)
|
Registrant’s
telephone number, including area code: 86-451-87032617
(China)
Securities
registered pursuant to Section 12(b) of the Act:
|
Title
of each class
None
|
Name
of each exchange on which registered
Not
Applicable
|
Securities
registered pursuant to Section 12(g) of the Act:
|
Common
Stock
|
|
(Title
of Class)
|
Indicate
by check mark if the registrant is a well-known seasonal issuer, as defined in
Rule 405 of the Securities Act.
Yes o No
x
Indicate
by check mark if the registrant is not required to file reports pursuant to
Section 13 or Section 15(d) of the Act.
Yes o No
x
Indicate
by check mark whether the registrant (1) has filed all reports required to be
filed by Section 13 or 15(d) of the Securities Exchange Act of 1934 during the
preceding 12 months (or for such shorter period that the registrant was required
to file such reports), and (2) has been subject to such filing requirements for
the past 90 days.
Yes x No
o
Indicate by check mark whether the
registrant has submitted electronically and posted on its corporate Website, if any, every
Interactive Data File required to be submitted and posted pursuant to Rule 405 of Regulation S-T
(§232.405 of this chapter)
during the preceding 12 months (or for such shorter
period that the registrant was required to submit and post such
files).
Yes o No o
Indicate
by check mark if disclosure of delinquent filers pursuant to Item 405 of
Regulation S-K (§229.405 of this chapter) is not contained herein, and will not
be contained, to the best of registrant’s knowledge, in definitive proxy or
information statements incorporated by reference in Part III of this Form 10-K
or any amendment to this Form
10-K.
o
Indicate
by check mark whether the registrant is a large accelerated filer, an
accelerated filer, a non-accelerated filer, or a small reporting
company. See the definitions of “large accelerated filer,”
“accelerated filer” and “smaller reporting company” in Rule 12b-2 of the
Exchange Act.
|
Large
accelerated filer o
|
Accelerated
filer x
|
|
|
Non-accelerated
filer o
(Do
not check if a smaller reporting company)
|
Smaller
reporting company o
|
Indicate
by check mark whether the registrant is a shell company (as defined in Rule
12b-2 of the Exchange Act).
Yes o No
x
As of
June 30, 2009, the aggregate market value of the voting and non-voting common
equity held by non-affiliates was approximately $135,214,631, based on the last
closing price of $13.48 per share, as quoted on the Nasdaq Global
Market.
As of
March 15, 2010, the registrant had 16,790,851 shares of common stock issued and
outstanding.
DOCUMENTS
INCORPORATED BY REFERENCE
None
CHINA
SKY ONE MEDICAL, INC.
ANNUAL
REPORT ON FORM 10-K
TABLE
OF CONTENTS
|
PAGE
|
||||
|
Special
Note Regarding Forward-Looking Statements
|
1
|
|||
|
|
||||
|
PART
I
|
2
|
|||
|
Item
1.
|
Business
|
2
|
||
|
Item
1A.
|
Risk
Factors
|
16
|
||
|
Item.
1B.
|
Unresolved
Staff Comments
|
30
|
||
|
Item
2.
|
Properties
|
30
|
||
|
Item
3.
|
Legal
Proceedings
|
30
|
||
|
Item
4.
|
Reserved
|
30
|
||
|
PART
II
|
31
|
|||
|
Item
5.
|
Market
for Registrant’s Common Equity, Related Stockholder Matters and Issuer
Purchases of Equity Securities
|
31
|
||
|
Item
6.
|
Selected
Financial Data
|
33
|
||
|
Item
7.
|
Management’s
Discussion and Analysis of Financial Condition and Results of
Operations
|
34
|
||
|
Item
7A.
|
Quantitative
and Qualitative Disclosures About Market Risk
|
49
|
||
|
Item
8.
|
Financial
Statements and Supplementary Data
|
F-1
|
||
|
Item
9.
|
Changes
in and Disagreements With Accountants on Accounting and Financial
Disclosure
|
50
|
||
|
Item
9A.
|
Controls
and Procedures
|
50
|
||
|
Item
9B.
|
Other
Information
|
51
|
||
|
PART
III
|
52
|
|||
|
Item10.
|
Directors,
Executive Officers and Corporate Governance
|
52
|
||
|
Item
11.
|
Executive
Compensation
|
57
|
||
|
Item
12.
|
Security
Ownership of Certain Beneficial Owners and Management and Related
Stockholder Matters
|
62
|
||
|
Item
13.
|
Certain
Relationships and Related Transactions, and Director
Independence
|
64
|
||
|
Item
14.
|
Principal
Accounting Fees and Services
|
64
|
||
|
Item
15.
|
Exhibits,
Financial Statement Schedules
|
65
|
||
|
Signatures
|
67
|
|||
- i
-
SPECIAL NOTE REGARDING FORWARD-LOOKING
STATEMENTS
This Annual Report on Form 10-K,
together with other statements and information we publicly
disseminate, contains certain forward-looking statements within the meaning of Section
27A of the Securities Act of 1933, as
amended, and Section 21E of the Securities
Exchange Act of 1934, as amended. We intend such
forward-looking statements to be covered by the safe harbor provisions for
forward-looking statements contained in the Private Securities Litigation
Reform Act of 1995, and include this statement for purposes of complying with
these safe harbor provisions.
Forward-looking statements, which are based on certain assumptions
and describe our future plans, strategies and expectations, are generally
identifiable by use of the words “believe,” “expect,” “intend,” “anticipate,” “estimate,” “project” or similar expressions. You should not rely on
forward-looking statements since they involve known and unknown
risks, uncertainties and other factors that are, in some cases, beyond our
control and which could materially affect actual results, performances or achievements.
Factors that may cause actual
results to differ materially from current
expectations include, but are not limited to the “Risk Factors” discussed in Part 1, Item 1A of this Annual Report on Form
10-K. Accordingly, there is no assurance that our expectations will
be realized. Except as otherwise
required by the federal securities laws, we disclaim any
obligations or undertaking to publicly release any updates or revisions to any
forward-looking statement contained herein (or elsewhere) to reflect any
change our expectations with regard thereto, or any change in events, conditions or circumstances on which
any such statement is based.
The terms
“the Company,” “we,” “us” and “our” refer to China Sky One Medical, Inc.,
together with our consolidated subsidiaries.
1
PART
I
Item 1. Business.
General
We are engaged, through our
China-based indirect subsidiaries described
below, in the development, manufacture, marketing and sale of over-the-counter,
branded nutritional supplements and over-the-counter plant and herb-based pharmaceutical and medicinal
products. Our principal products are external use Traditional Chinese
Herbal Remedies/Medicines, commonly referred to in the industry as “TCM.” We have evolved into an integrated manufacturer, marketer and distributor of
external-use TCM products sold primarily in the People’s Republic of China (“China” or “PRC” ) and through Chinese domestic pharmaceutical chains. Recently, we have been expanding our worldwide sales
effort as well. Prior
to 2009, we sold both our own manufactured products, as well as medicinal and pharmaceutical
products manufactured by others (the sale of third party products is referred to herein as “Contract Sales”). Commencing in 2009, we
discontinued all of our Contract Sales as part of our revised strategic plan.
Corporate History
We are a
Nevada corporation formed on February 7, 1986, formerly known as Comet
Technologies, Inc. On July 26, 2006, after our acquisition of a
China-based nutritional supplements business, we changed our name to “China Sky
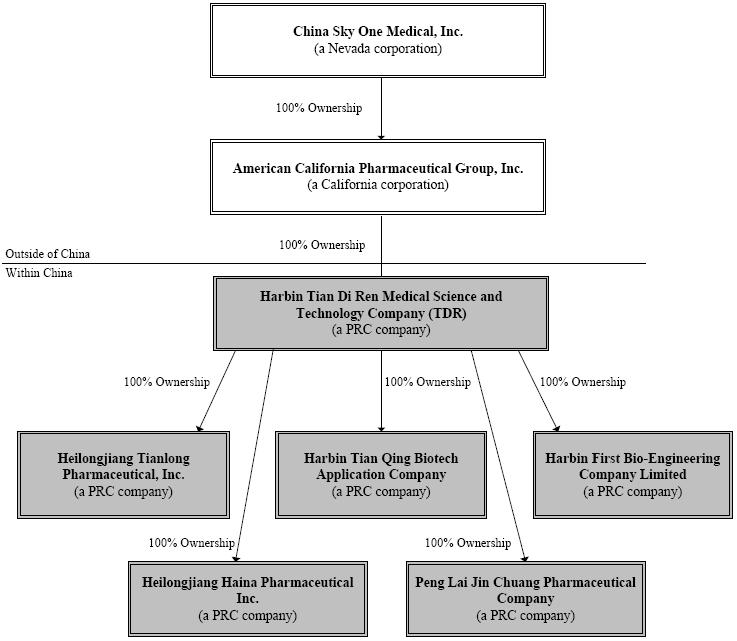
One Medical, Inc.” We are a holding company doing business through
American California Pharmaceutical Group, Inc., a California corporation
(“ACPG”), our non-operating
United States (“U.S.”) holding company subsidiary, and ACPG’s direct and indirect
subsidiaries located in the People’s Republic of China (the “PRC”).
ACPG, was incorporated on December 16, 2003, under the name “QQ Group, Inc.” QQ Group changed its name to “American California Pharmaceutical
Group, Inc.” in anticipation of the stock exchange
transactions with our predecessor filer (then known as “Comet Technologies, Inc.”) and Harbin City Tian Di Ren
Medical Co., a company organized under the laws of the PRC (“TDR”), as further described below. On December 8, 2005, ACPG
completed a stock exchange transaction with
TDR and TDR’s subsidiaries, each of which was a
fully operating company in the PRC. In connection with this
transaction, ACPG
exchanged 100% of its issued and outstanding common stock for 100% of the
capital stock of TDR and
its subsidiaries.
Thereafter, on May 11, 2006, ACPG
entered into a Stock Exchange Agreement (the “Exchange Agreement”) with our shareholders. The transaction acquisition contemplated under the Exchange Agreement
was consummated on May 30, 2006. As a result of this transaction, we issued a total of 10,193,377 shares of our
common voting stock to the stockholders of ACPG, in exchange for
100% of the capital stock
of ACPG. As a result, ACPG became our wholly-owned subsidiary.
TDR was originally formed in 1994 and
its principal executive office is located in Harbin City, Heilongjiang Province, PRC. On December 29, 2000, TDR was reorganized and incorporated as a limited liability company under the
“Corporation Laws and
Regulations” of the PRC.
At the time of TDR’s acquisition by ACPG, in December of 2005, TDR had two
wholly-owned subsidiaries, Harbin First
Bio-Engineering Company Limited (“First”) and Kangxi Medical Care Product Factory (“Kangxi”). In July, 2006, First and
Kangxi merged, with First as the surviving subsidiary of
TDR.
As of October 16, 2006, we organized
Harbin Tian Qing Biotech Application Company as a wholly-owned PRC subsidiary of
TDR (“Tian Qing”), to conduct research and development in
the areas of tissue and stem cell banks, which is described in further detail below. As of December 31, 2009,
Tiang Qing had no operating activities.
On April 3, 2008, TDR completed
its acquisition of Heilongjiang Tianlong
Pharmaceutical, Inc., a
company organized under the laws of the PRC
(“Tianlong”), that has a variety of medicines approved by the PRC’s State Food and Drug Administration
(the “SFDA”) and new medicine applications, and which is in the business of
manufacturing external-use
pharmaceuticals. TDR previously acquired the Beijing sales office of Tianlong in mid-2006.
In connection with this
transaction, TDR
acquired 100% of the issued and outstanding capital stock of Tianlong from
its sole stockholder, in consideration for
an aggregate purchase price of approximately $8,300,000, consisting of $8,000,000 in cash, and 23,850 shares of our common
stock (valued at $12.00 per share).
2
On April 18, 2008, TDR consummated
its acquisition of Heilongjiang Haina
Pharmaceutical Inc., a
company organized under the laws of the PRC
(“Haina”), licensed as a wholesaler of TCM, bio-products, medicinal devices, antibiotics and chemical
medicines. Haina did not have an
established sales network and was
acquired for its primary asset, a Good Supply Practice
(“GSP”) license (License No. A-HLJ03-010), issued by the Heilongjiang Province office of the SFDA as of December 21, 2006. The SFDA only issues such licenses to pharmaceutical resellers that maintain certain quality
control standards. The GSP license will be up for renewal on January 29, 2012. In
connection with this transaction, TDR acquired 100% of the issued and outstanding capital stock of Haina from
its three stockholders in consideration for
payment of approximately $437,000.
On
September 5, 2008, TDR acquired Peng Lai Jin Chuang Pharmaceutical Company, a
company organized under the laws of the PRC (“Peng Lai ”), from its sole
stockholder. Peng Lai, which has received Good Manufacturing Practice
(“GMP”) certification from the SFDA, was organized to develop, manufacture and
distribute pharmaceutical, medicinal and diagnostic products in the
PRC. In connection with this transaction, TDR acquired all of Peng
Lai’s assets, including, without limitation, franchise, production and operating
rights to a portfolio of 20 medicines approved by the SFDA, for an aggregate
purchase price of approximately $7,000,000 million, consisting of approximately
$2,500,000 million in cash, and 381,606 shares of our common stock (valued at
$12.00 per share).
Principal
Products and Markets
We are engaged, through TDR, and its subsidiaries in the PRC, in the
development, manufacture, marketing and sale of over-the-counter,
branded nutritional supplements and over-the-counter plant and herb-based pharmaceutical and medicinal
products. We have evolved into an integrated manufacturer, marketer and distributor
of external use Chinese
medicine products sold primarily to and
through domestic
pharmaceutical chains in
the PRC. Historically, we handled sales of both our own manufactured products and Contract Sales of medicinal and pharmaceutical products manufactured by others. However, commencing in 2009, we discontinued all Contract Sales as part of our
revised sales strategy.
With the exception of Peng Lai, which is located in Shan Dong Province, PRC, all of our manufacturing
facilities are located in Heilongjiang Province, PRC. In addition, we have sales offices
located in 24 provinces across China.
Our principal products are external use TCMs. Using various formulas, we produce a
number of TCM products with several forms of delivery
including ointments, sprays, medicated skin patches, injections, capsules, suppositories,
tablets and granules. We also develop and sell bio-engineering products in the form of diagnostic
kits, which are used for testing for different diseases. Over the next few years, we intend to concentrate much of our efforts on the development, production and sales of TCM
products and testing kits, and antibiotic products.
Our principal operations are in
the PRC, where TDR and its subsidiaries have manufacturing
facilities and sales
distribution channels
covering most of the provinces in the PRC. Part of our sales strategy is to
expand our worldwide sales by locating
qualified distributors and sales agents outside of the PRC. Our overall revenues were approximately $130,092,000 in 2009, of which export overseas sales were approximately $10,121,000,
accounting for approximately 7.8% of our total revenue. Overseas sales were $7,570,000 in 2008, accounting for approximately 8.2% of our total revenues. Overseas sales were
$12,404,000 in 2007,
accounting for
approximately 25.2% of our
total revenue in
2007.
3
All of our significant operations and long lived assets are located in the PRC. Below is a chart depicting our corporate
organizational
structure:
SFDA Licenses
The SFDA issues the licenses to manufacture and
market pharmaceutical products in the PRC. Our licenses relate primarily to pharmaceutical production licenses, which are needed mainly for topical products, ointments and external test kits. TCM products also require a permit for sales, which
permits are generally granted on a non-exclusive basis for four to
five years depending on the product and subject to periodic review for renewal. For the year ended December 31, 2009, we commercialized 91 products through TDR and its subsidiaries. We have the necessary licenses and
permits for all of our products.
4
Our TDR Subsidiary Owns the Following
Subsidiaries in China
Harbin First
Bio-Engineering
On September 26, 2003, TDR formed First under the laws of the
PRC as its wholly owned subsidiary, with an
authorized capital of approximately $1,460,000 (10,000,000
RMB). First
focuses on research and development of the use of natural medicinal plants and biological technology products, such as our diagnostic kits. First, which officially commenced production on July 21, 2006, is one of
the first companies in Heilongjiang Province conducting research and development of
high technology
biological
products. First has two
product
lines:
|
·
|
an enzyme immunity reagent kit
product line;
and
|
|
·
|
a colloid gold product
line.
|
Harbin Tian Qing Biotech
Application
On October 16, 2006, TDR
organized Tian Qing under the laws of the
PRC as its wholly owned subsidiary, to conduct research and
development in the areas of tissue and stem cell banks, which is
described in more detail below. (See “Research and Development” below.) As of December 31, 2009, Tian Qing had
no significant operations.
Heilongjiang Tianlong
Pharmaceutical
On April 3, 2008, TDR
completed the acquisition of Tianlong, which is in the business of manufacturing
external-use pharmaceuticals. Tianlong’s assets included, among other things, GMP certified manufacturing facilities,
state-of-the-art
manufacturing equipment, a
research and development
center, and production and operating
rights to a portfolio of 69 medicines approved by the SFDA.
Heilongjiang Haina
Pharmaceutical
On April 18, 2008, TDR
consummated its acquisition of Haina, which is licensed as a wholesaler of TCM, bio-products, medicinal devices, antibiotics and chemical
medicines. At the time of the acquisition, Haina
did not have an established sales network and was
acquired for its primary asset, a GSP license issued by the Heilongjiang Province office of the SFDA as of December 21, 2006. The SFDA only issues such licenses to resellers of
medicines that maintain certain quality
control
standards. The GSP license will be up for renewal on January 29, 2012. Obtaining this license has enabled us to expand our sales of medicinal products without having to go through a
lengthy license application
process.
Peng Lai Jin Chuang
Pharmaceutical
On September 5, 2008, TDR acquired
Peng Lai, which received GMP certification from the SFDA,
and was organized to develop, manufacture
and distribute pharmaceutical products in the PRC. In connection with the acquisition of
Peng Lai , TDR acquired all of Peng Lai’s assets, including, without limitation,
franchise, production and operating rights to a portfolio of 20 medicines approved by the SFDA.
Product Line
In 2009, we manufactured and marketed 91 products. Our manufacturing operations are
conducted in our indirect
subsidiaries’ facilities located in Heilongjiang Province and Shan Dong Province in the PRC.
For the year ended December 31, 2009, we sold our products under five main categories:
|
·
|
Patches (7 products);
|
|
·
|
Ointments (18 products);
|
|
·
|
Sprays (15 products);
|
|
·
|
Diagnostic Kit (3 products);
|
|
·
|
Others (48 products)
|
5
A description of our principle products, which generated a majority of our sales revenue in
2009, is as follows:
Patch Category:
Sumei Slim Patch
The Sumei Slim Patch is
marketed and sold within and outside the PRC as a more natural
treatment to lose weight. The Sumei Slim Patch
uses Saponin as
its major ingredient, and is effective in regulating and restraining the excessive secretion of certain
hormones, while promoting others to foster weight loss as well as prevent weight gain.
Pain Relief Patch
A pain relief patch is designed to apply to the area of neck, shoulder, and waist. The patch is used for a number of ailments, including fever, headache,
heart dysentery, diarrhea, and stiffness and pain caused by hypertension.
Anti-Hypertension
Patch
The anti-hypertension patch is
based on five thousand years of Chinese
herbal vein therapy that has been adapted to a modern transdermal therapeutic system (“TTS”). The product utilizes a
Body-Yong-Guan point technique, which is believed to maximize the effectiveness of the
medicinal ingredients. The product is believed to stimulate blood capillaries and to be effective in
improving circulation and reducing blood
pressure.
Ointment Category:
Hemorrhoids Ointment
This product contains Acetate, Radix
Notoginseng, and Rhizoma Coptidis. It is made in soft ointment form that is effective in sterilizing and
relieving hemorrhoid symptoms, including itching, distending pain, burning, and
bleeding.
Compound Camphor
Cream
This product is made for the treatment of various pathogens on
the skin surface and subcutaneously, such as mycete, trichopytic, staphylococcal
bacteria aureus, bacillus coli, and candida albicans
(thrush).
Spray Category:
Stomatitis Spray
This spray is used for the treatment of dental ulcers, pharyngitis, and faucitis. It is made with pure herbal medicines and, thus, has minimum side effects to human bodies.
Diagnostic Kit Category:
Cardiac Arrest Early Examination
Kit
This product is used for early stage diagnosis of myocardial
infarction (heart attacks).
6
Kidney Disease Testing
Kit
The Urinate Micro Albumin Examination
Testing Kit is used in connection with early stage diagnosis for primary kidney
disease, hypertension and diabetes.
Other Product Category:
We include 48 of our products under the “Other” product category, because the categories of a pplications for these products do not separately represent a material
amount of our revenues.
The Other product category includes suppositories, eye drops,
nasal drops, capsules, granules, injections, tablets and wash fluids.
Naftopidil Dispersible
Tablet
This tablet is designed to treat benign enlargement of the prostate
among males in their middle age. It is effective in its treatment because its ingredients can be easily digested and absorbed by the human body.
Naphazoline Hydrochloride Eye Drop
Naphazoline is recommended for the temporary relief of eye
redness associated with minor irritations. This product can comfort the
eyes by lubricating them and relieving such
irritations.
Revenues
by Product Categories
We believe that the most meaningful presentation of
our products is by categories of method
of delivery. Our total revenues during fiscal
2009, 2008, and 2007 were approximately $130,092,000, $91,816,000, and $49,318,000, respectively. The following table sets forth our principal product categories
based on application type and the
approximate amount and
percentage of revenue from each of such product categories for the fiscal years ended December 31, 2009, 2008, and 2007:
|
For the Years Ended December
31
($ in
thousands)
|
||||||
|
2009
|
2008
|
2007
|
||||
|
Product
Category
|
Sales
|
%
of Sales
|
Sales
|
% of Sales
|
Sales
|
% of
Sales
|
|
Patches
|
$40,770
|
31.3%
|
$35,484
|
38.6%
|
$19,609
|
39.9%
|
|
Ointments
|
28,862
|
22.2%
|
23,068
|
25.1%
|
3,270
|
12.6%
|
|
Sprays
|
18,499
|
14.2%
|
10,613
|
11.6%
|
8,742
|
18.7%
|
|
Diagnostic Kits
|
10,239
|
7.9%
|
8,781
|
9.6%
|
2,994
|
6.1%
|
|
Contract
Sales
|
0
|
0.0%
|
5,655
|
6.2%
|
12,998
|
16.6%
|
|
Others
|
31,722
|
24.4%
|
8,215
|
8.9%
|
1,705
|
6.2%
|
|
Total
|
$130,092
|
100.0%
|
$91,816
|
100.0%
|
$49,318
|
100.0%
|
For a
narrative description of the reasons for the changes in our revenue by product
category over the past three years, see “Management’s Discussion and Analysis of
Financial Condition and Results of Operations” below.
Research and
Development
We conduct all of our research
and development
(“R&D”) activities either internally or through
collaborative arrangements with universities and research
institutions in the PRC. We have our own research,
development and laboratory
facilities located in the facilities of First and
Tianlong. Our internal R&D team currently
consists of 38 people. Many of our team members are professors
affiliated with universities in the
PRC.
7
Additionally, we have established several long-term partnerships with
well-known universities and enterprises in the PRC. We
have:
|
·
|
Established a gene medicine laboratory for Small RNA project with Harbin Medical University;
and
|
|
·
|
Established a laboratory for Antroquinonol from Antrodia Camphorata
with Taiwan Golden Biotechnology Corporation.
|
Under our partnership arrangements with universities and research institutions,
we will generally hold the intellectual property rights to any developed technology. For example, as a result of our
collaboration with
Harbin Medical University, a product known as “Endostatin” is currently under development as a
cancer suppressing product. Although this technology still
bears the name of
Harbin Medical University, we own the intellectual property
rights pertaining to this
technology. Additional information relating to this
product and other products being developed is set forth under “Products Under Development” below and under the general product
descriptions throughout this report.
We invested approximately $14,960,000,
$7,413,000, and $3,158,000 in R&D for the years ended December 31, 2009, 2008, and 2007,
respectively. Additional information about our R&D
investments is included in the financial statements in Item 8 of this report (and notes thereto) and our
“Management Discussion and
Analysis on Financial Condition and Results of Operations” section below.
Products Under Development
The projects which accounted for a majority of our 2009 research and development expenses,
grouped by subsidiary, are as follows:
TDR
Breast Cancer
Technology
Hyperplasie Globulaire is the early stage of
Hyperplasia of the Mammary Glands that has a high occurrence among
females between twenty-five and forty-five years of age. Medicines
with Endocrine can have significant side effects to the
patient. Our Breast
Cancer Technology is
designed to effectively treat the Hyperplasie Globulaire with Traditional Chinese Medicine and with minimum side effects. We spent approximately $2,272,000, or 15.2% of total R&D
expenditure in 2009, for efficacy testing, acute and long term
toxicity testing.
Monoclonal Antibody Research
Monoclonal
antibody is a bioactive substance produced when human cells identify and resist
pathogenic intrusion from outside. Monoclonal antibody technology
can produce large
amounts of pure antibodies with
desired substance. Tumor cells that can replicate endlessly
are fused with mammalian cells that produce an
antibody. The result of this cell fusion
will continually produce antibodies. These antibodies are
called monoclonal because they come from only one type of cell, the hybridoma
cell. We believe Monoclonal antibodies have tremendous
applications in the field of diagnostics, therapeutics, targeted drug delivery systems, not only for
infectious disease caused by bacteria, viruses and
protozoa, but also for cancer, metabolic and
hormonal disorders. We spent approximately $965,000, or 6.5% of total R&D expenditure
in 2009, for application and performance appraisal. As of December 31, 2009, we completed this project and are able to manufacture and commercialize
these antibody materials.
Endostatin Research
Endostatin is a cancer treatment drug that works by
“starving” cancer cells by restricting the
generation of blood vessels around cancer lesions, thereby inhibiting, to a
degree, the source of nutrients upon which the cancer cells
survive. We have already completed teratogenicity testing, and have
established quality standards for this
drug. Further
developments are underway to improve the product
quality of Endostatin. We spent approximately $439,000, or 2.9%
of total R&D expenditure in 2009, for acute and long term toxicity
testing.
8
Patch Products
We spent approximately $1,820,000, or 12.2% of
total R&D expenditure in 2009, for the optimization experiments of several patch products including slim patch, anti-hypertension patch, asthma patch, and pain relief patch. The optimization experiments are focusing on optimization of the extracted ingredients and
irritation tests.
First
Diagnostic Kits
In 2009, we had 6 diagnostic kits under clinical trials. We spent approximately $2,727,000, or 18.2% of total R&D expenditure in
2009, on clinical trials
for these 6 diagnostic kits.
Tianlong
Antroquinonol Extracted from Antrodia
Cinnamomea
Antrodia Cinnamomea is well known
in Taiwan as a traditional Chinese medicine. For several decades, it
has been used in the treatment of food and drug intoxication, diarrhea,
abdominal pain, hypertension, rashes, and liver and lung cancer. We have
obtained an exclusive right to develop this technology with Taiwan Golden
Biotechnology Corporation, which has completed pre-clinical research on
Antroquinonol in the United Kingdom. The compound has been approved
by the Food and Drug Administration in the U.S. to enter into first stage
clinical trial. We spent approximately $387,000, or 2.6% of total R&D expenditure
on this project in 2009.
Injections
In 2009, we had 3 injections under clinical trials.
We spent approximately $1,944,000, or 13.1% of total R&D expenditure
in clinical
trials for these
projects in 2009.
Peng Lai
We spent an aggregate of approximately $879,000, or 5.9% of
total R&D expenditure
in 2009, in optimizing effectiveness test for
Naftopidil
Dispersible tablets for prostate treatment, Sertraline Hydrochloride capsules for the treatment of mental
depression, and Radix Isatidis granules and syrup to treat Influenza (flu).
Set forth below is a table of
our major research and development projects, respective stage of development and applicable expenses for 2009:
|
Major Research and
Development Expenses
in Fiscal
2009
($ in thousands)
|
|||
|
Projects
|
Stage
|
Expenses
|
% of total
R&D
|
|
Diagnostic Kits - 6 products
|
Clinical
trial
|
$2,727
|
18.2
|
|
Injections - 6 projects
|
Clinical
trial
|
1,944
|
13.0
|
|
Breast Cancer
Technology
|
Efficacy testing, Acute and Long Term
Toxicity testing
|
2,272
|
15.2
|
|
Patches - 4 products
|
Extraction optimization
testing
|
1,820
|
12.2
|
|
Monoclonal
Antibody
|
Completed
|
965
|
6.5
|
|
Endostatin
|
Efficacy testing, Acute and Long Term
Toxicity testing
|
439
|
2.9
|
|
Antroquinonol
|
Clinical
trial
|
387
|
2.6
|
|
Radix Isatidis granule and
syrup
|
Production process
optimization
|
282
|
1.9
|
|
Naftopidil Dispersible
tablets
|
Production process
optimization
|
256
|
1.7
|
|
Sertraline Hydrochloride
capsules
|
Production process
optimization
|
249
|
1.7
|
|
Total
|
|
$11,341
|
75.8
|
|
|
(a)
|
In
fiscal 2009, we spent approximately $2,272,000 on our breast cancer
technology, which represented approximately 15.2% of our total R&D
expenditures. No other product represented 10% or more of our
R&D expenses in fiscal 2009.
|
9
Total research and development expenses in
fiscal 2009
were $14,960,000.
The above listed projects comprise 75.8% of our total research
and development expenses in fiscal 2009. The other projects and miscellaneous materials make up the remaining 24.2% of total research and development expenses for the
year.
Set forth
below is a table of our research and development expenses for fiscal 2008,
classified by product category and stage of development:
|
Stage
of Development by Number of Projects and U.S. Dollar Amount
($
in thousands)
|
||||||||
|
Category
|
Application
and
Efficacy
|
Acute
and Long Term Toxicity
|
Long
Term Stability
|
Pending
SFDA Approval
|
Supplemental
Documentation
|
SFDA
Approval
|
TOTAL
|
|
|
Bio-Engineering
(a)
|
#
|
1
(b)
|
1
(c)
|
13
|
2
|
-
|
1
|
18
|
|
$
|
$948
|
$1,192
|
$2,261
|
-
|
-
|
-
|
$4,401
|
|
|
Eye
Drops
|
#
|
-
|
-
|
-
|
-
|
-
|
2
|
2
|
|
$
|
-
|
-
|
-
|
-
|
-
|
$103
|
$103
|
|
|
Nasal
Drops
|
#
|
-
|
-
|
-
|
-
|
-
|
1
|
1
|
|
$
|
-
|
-
|
-
|
-
|
-
|
$61
|
$61
|
|
|
Injections
|
#
|
-
|
-
|
-
|
1
|
-
|
4
|
5
|
|
$
|
-
|
-
|
-
|
$104
|
-
|
$510
|
$614
|
|
|
Spray
|
#
|
-
|
-
|
-
|
1
|
-
|
-
|
1
|
|
$
|
-
|
-
|
-
|
$139
|
-
|
-
|
$139
|
|
|
Ointment
|
#
|
-
|
-
|
-
|
1
|
1
|
1
|
3
|
|
$
|
-
|
-
|
-
|
$112
|
$90
|
$115
|
$317
|
|
|
Suppository
|
#
|
-
|
-
|
-
|
3
|
4
|
2
|
9
|
|
$
|
-
|
-
|
-
|
$273
|
$352
|
$217
|
$842
|
|
|
Gel
|
#
|
-
|
-
|
-
|
-
|
2
|
2
|
4
|
|
$
|
-
|
-
|
-
|
-
|
$293
|
$136
|
$429
|
|
|
Liquid
|
#
|
-
|
-
|
-
|
2
|
2
|
-
|
4
|
|
$
|
-
|
-
|
-
|
$209
|
$210
|
-
|
$419
|
|
|
TOTAL
|
#
|
1
|
1
|
13
|
10
|
9
|
13
|
47
(d)
|
|
$
|
$948
|
$1,192
|
$2,261
|
$837
|
$944
|
$1,142
|
$7,324
(e)
|
|
|
|
(a)
|
Bio-engineering
projects include our Endostatin cancer treatment drug, breast cancer drug
and diagnostic kits. The diagnostic kits are designed for
testing for different cancers and viruses, such as prostate cancer,
stomach cancer, ovarian cancer, rectal cancer, liver cancer, Hepatitis B
and C, human papilloma virus and mycoplasma virus. Diagnostic
kits accounted for approximately 30.5% of total R&D expenditures in
2008.
|
|
|
(b)
|
In
fiscal 2008, we spent approximately $948,000 on research and development
related to Monoclonal antibodies, which represented approximately 12.8% of
our total R&D expenses. Monoclonal antibodies are a bioactive
substance produced naturally when human cells identify and resist
pathogenic intrusion from outside. Monoclonal antibody technology can produce
large amounts of pure
antibodies. Therefore, Monoclonal antibodies have
tremendous applications in the field of diagnostics,
therapeutics,
and
targeted drug delivery systems, not only
for infectious disease caused by bacteria, viruses and protozoa
but also for cancer, metabolic and hormonal
disorders.
|
|
|
(c)
|
In
fiscal 2008, we spent approximately $1,192,000 on our Endostatin cancer
treatment drug, which represented approximately 16.1% of our total R&D
expenses. Endostatin is a cancer treatment drug that works
by “starving” cancer cells by restricting the
generation of blood vessels around cancer lesions, thereby inhibiting, to
a degree, the source
of nutrients upon which the cancer cells
survive.
|
|
|
(d)
|
Except
as set forth in notes (b) and (c) above, no single project represented a
material portion of our total R&D expenditures in fiscal
2008.
|
|
|
(e)
|
Does
not include costs for materials used in our R&D projects. Our total
R&D expenditures for fiscal 2008 were approximately
$7,413,000.
|
10
Cord Blood Stem Cell
Bank
In 2006, we began implementing a plan to
establish a cord blood stem cell bank in the PRC, for the treatment of various
diseases such as leukemia,
lymphoma and rebirth anemia. On October 16, 2006, the Health
Department of Heilongjiang Province granted us, through Tian Qing, the exclusive right and license to
become engaged in tissue and stem cell bank activities in Heilongjiang Province, PRC, through December 2010. Since the development of this project
will require substantial managerial, technical and financial resources, and a
number of significant risks, management is still evaluating the proper timing and strategy in launching this
project.
Sales Approach
Over the past several years, we have
continuously expanded our distribution channels for our
products. As a result, we have
established a sales network covering 24 provinces of
mainland China, and have positioned sales managers and representatives in
each of these markets.
In fiscal 2007, our sales model was
focused on the creation of our own distribution
channels. Therefore, we sold products directly to many small distributors and
retail store locations. Commencing in fiscal 2008, we changed our business model and
entered into distribution agreements with larger regional sales
agents, who resell to smaller distributors and
retail store locations. In addition, we entered into contracts with nationwide chain pharmacies.
These changes to our product
distribution channels resulted in our direct customer base
decreasing from 943
customers at December 31,
2007 to 212 customers at December 31, 2009. Our change in sales
strategy is further described in “Customers and Distribution” below.
We also managed to establish a marketing network through independent agents to develop an international
market for our
products. At present, our primary initial growth focus remains
in the PRC. However, part of our sales strategy is to expand
our sales outside of the PRC. Overseas sales accounted
for approximately 7.8%, 8.2% and 25.2% of sales revenue for the fiscal years
ended December 31, 2009, 2008 and 2007, respectively.
Materials and
Suppliers
We employ
purchasing staff with extensive knowledge of our products, who work with our
marketing, product development, and formulations and quality control personnel
to source raw materials for our products and other items. Raw
materials are sourced principally in the PRC, and are generally available from a
variety of suppliers. Harbin Zhong Jia Medicine Company and
Heilongjiang Kangda Medicine Company accounted for approximately 16% and 42% of
our total inventory purchases for the year ended December 31, 2009,
respectively. Heilongjiang Kangda Medicine Company accounted for
approximately 33% of our total inventory purchases for the year ended December
31, 2008. Harbin Yong Heng accounted for 23% of our total inventory
purchases for the year ended December 31, 2007. No other suppliers accounted for 10% or more of our total
inventory purchases in 2009, 2008, and
2007.
We seek
to mitigate the risk of a shortage of raw materials, through identification of
alternative suppliers for the same or similar raw materials, where
available. We believe raw materials are available through alternative
suppliers in the market place, if necessary. We manufacture bulk
branded products to allow more extensive vertical integration and to improve the
quality and consistency of raw materials.
Historically,
we have signed agreements with suppliers that allowed us to hold extra raw
materials at the cost of the suppliers. As a result, we could
minimize our own inventory carrying costs, and improve our cash management, by
keeping the inventory at the minimum level required to support our short-term
sales. However, due to price increases for raw materials, and the
related overhead costs for storing such raw materials, we started to increase
our inventory levels toward the second half of 2009. In anticipation
of continued price increases, management may further increase our inventory
levels in fiscal 2010.
11
Customers and
Distribution
In fiscal
2007, our sales model was focused on the creation of our own distribution
channels. Therefore, we sold products directly to many small distributors and
retail store locations. In fiscal 2008, we changed our business model
and entered into distribution agreements with larger regional sales agents, who
resell to smaller distributors and retail store locations. In
addition, we entered into contracts with nationwide chain pharmacies. Through
the extensive sales networks, of these nationwide chains, we were able to reach
all major metropolitan areas throughout the PRC. These changes to our product
distribution channels resulted in our direct customer base decreasing from 943
customers at December 31, 2007 to 233 customers (not including branches of
retail and drug supply chains) at December 31, 2008. As of December
31, 2009, we had 212 customers, not including branches of retail and drug supply
chains.
The
change in our sales strategy, which began in fiscal 2008, was initiated to
improve product channel efficiencies, and to give us access to an increased
number of ultimate purchasers. We believe that these changes will
continue to lead to increased revenue by extending the reach of our distribution
network. By reducing the number of customers we sell to directly, we
have streamlined our accounts receivable management and collection and reduced
channel distribution costs. These favorable cost variances have been
partially offset by product price incentives we grant to the larger agents with
which we have contracted.
For the year ended December 31, 2009, sales to Harbin Shiji Baolong Medicine Company and Shanxi Xintai
Medicine Company accounted for approximately 16% and 11% of total
revenues, respectively. Harbin Bao Da Medicine Company and Harbin Shiji Baolong
Medicine Company accounted for approximately 16% and 14% of our accounts receivable in 2009, respectively. For the year ended December 31, 2008, sales to Shanxi Xintai and Harbin Shiji Baolong
accounted for 15% and 12% of our total revenues, respectively. Harbin Shiji Baolong and Shanxi Xintai accounted for approximately 29% and 11% of our accounts receivable in 2008, respectively. For the year ended December 31, 2007, sales to Ning BoYue Hua Trading
Company and Guang Zhou Xing
He Trading Company accounted for approximately 14% and 11% of our total revenues, respectively. Hua Li Jiu Zhou Company
accounted for approximately 11% of our accounts receivable in 2007. No other customers accounted for 10% or more of our total
revenues or
accounts receivable in 2009, 2008, and
2007.
In 2009, we implemented various initiatives
toward promoting and marketing our products. Our advertising costs for the fiscal years ended December 31, 2009, 2008, and 2007 were
approximately are $14,527,000, $7,299,000 and $4,385,000,
respectively.
We will
continue efforts to expand our markets into other provinces and larger cities in
the PRC, and to other markets worldwide. Currently, our products are
sold primarily in the PRC. In 2009, 2008 and 2007, approximately
92.2%, 91.8% and 74.8% of our revenues in were from the sale of products in
China, respectively. Part of our sales strategy is to expand
our worldwide sales. As a means of accelerating our
distribution into other countries, we will seek to enter into strategic
marketing arrangements with qualified firms that have distribution channels,
brand name recognition, or other unique marketing strengths.
Competition
Competition in the TCM, pharmaceutical,
and over-the-counter nutraceutical business is intense in China, and throughout the world. We compete with various firms, many of
which produce and market products similar to our products, and many of which have greater
resources than us in terms of manufacturing and marketing capabilities,
management expertise and breadth, and financial wherewithal. Some of these competitors are far
larger, have more resources then us and have stronger sales and distribution
networks.
Our direct competitors are other
domestic firms engaged in developing, manufacturing and
marketing TCM and
nutraceutical products. There are many of these companies in the
PRC, in Heilongjiang Province, and even in the city of Harbin.
We expect that the competition for
medicinal products in the PRC and other world markets will become more intense over the next
few years, both from existing
competitors, and new market entrants. We will also face
competition from foreign companies who may have established products, a strong proprietary pipeline
and strong financial
resources. Our management believes that we have
certain competitive advantages in introducing new products to market due to key focus areas for
development, our existing distribution channels, research and development
capabilities and our
relationship with certain universities and other research institutions.
However, there can be no assurance that
we will be able to compete and continue to grow in this highly competitive
environment. Additional information relating to
competition in the PRC can
be found in the “Risk
Factors” section
below.
12
Government
Regulation
Regulatory
Environment
Our principal sales market is in the
PRC. We are subject to the Pharmaceutical
Administrative Law of the
PRC, which governs the
licensing, manufacturing, marketing and distribution of pharmaceutical
products in the PRC, and sets penalties for violations. Our business is subject to various
regulations and permit systems of the government of the PRC. Additionally, we are subject to government
licensing rights and regulations, which relating to our
stem cell R&D license. Permits we attain for TCM products are granted on a non-exclusive basis
and are subject to periodical review for
renewal.
The governmental approval process in the
PRC for a newly developed health product can be lengthy and
difficult. A product sample is first sent to a clinical testing agent
designated by the Ministry of Health, which
conducts extensive clinical testing and
examination of the product
to verify if it has the specified functions as stated by the company producing the
product. A report will then be prepared and issued by the clinical testing agent confirming or negating such
functions. After submittal
to the agency, it generally
takes six months to one year for a report to be issued by the testing agent. The report must then be
submitted to a provincial Health
Management Commission for
approval. Following this submittal, a letter of
approval issued by such commission will be
submitted to the Ministry of Health for the
issuance of a certificate that authorizes sale and marketing of the product in
the PRC.
This entire process will generally take
between eighteen months and
two years. The approval process will depend to a
certain extent on whether a specified product is a plant based pharmaceutical (“PBP”), or a plant based nutraceutical (“PBN”). PBPs are
products composed of herbs, roots and plants that do not use synthetic chemicals,
with certain medicinal functions for treatment of one or
more illnesses. PBPs are generally
prescription-based but in some cases may be sold
over-the-counter. PBNs, also frequently known as
“dietary
supplements” or “nutritional supplements,” are also composed of herbs, roots and plants, but are essentially prophylactic or
preventive in nature.
All PBNs are available over-the-counter
without a prescription. In the PRC, PBPs require the approval of the SFDA,
while PBNs only require the
approval of state and local governments prior to manufacturing and sale.
Obtaining the approval from
the SFDA is generally more
complex and lengthy.
Because we and our subsidiaries are
wholly-owned enterprises, we are subject to the law
of foreign investment enterprises in the PRC, and the foreign company provisions
of the Company Law of
China, which governs the conduct of our wholly-owned subsidiaries and their officers and
directors, and also limits our ability to pay
dividends.
Compliance with Environmental
Law
We comply with the Environmental Protection Law of the PRC, as
well as applicable local regulations. In addition to compliance with the PRC
law and local regulations, we consistently undertake active efforts to ensure the environmental
sustainability of our operations. Because the manufacturing of herb and
plant-based products does not generally cause significant
damage or pollution to the environment, the cost of complying with applicable
environmental laws is not material. In the event we fail to comply
with applicable laws, we
may be subject to penalties.
Intellectual
Property
We own
certain SFDA licenses for drug batch numbers and other proprietary
technologies. Historically, we included our proprietary
technologies and SFDA licenses for drug batch numbers within the category of
patents. We now believe it is more accurate to categorize such
intellectual property as SFDA licenses for drug batch numbers and other
proprietary technologies.
13
As of
December 31, 2009, our intellectual property breakdown by SFDA licenses for drug
batch numbers and other proprietary technologies is as follows:
|
IPs
(Intangible Assets)
|
Year
Acquired
|
Acquisition
Cost
$
in thousands
|
Reflected
under Intangible Assets
|
Proprietary
Technologies
|
Drug
Batch Numbers
|
|
Endostatin
|
2006
|
$1,727
|
Yes
|
Yes
|
-
|
|
SFDA
licenses for drug batch numbers
|
2008
|
$6,848
|
Yes
|
-
|
Yes
|
|
Monoclonal
Antibody
|
2008
|
$5,106
|
Yes
|
Yes
|
-
|
|
Breast
Cancer Technology
|
2008
|
$1,459
|
Yes
|
Yes
|
-
|
|
Antroquinonol
|
2009
|
$5,119
|
Yes
|
Yes
|
-
|
|
Small
RNAs Technology
|
2009
|
$5,850
|
Yes
|
Yes
|
-
|
We
purchased the rights to the patents for Endostatin and Antroquinonol, which are
registered under the names of Harbin Medical University and Taiwan Golden
Biotechnology Corporation, respectively.
We have
acquired certain additional proprietary technologies from non-related third
parties. The fair value of these proprietary technologies recorded in
our financial statements are appraised periodically and amortized during its
useful life.
As of the
date of this filing, we own two registered patents for product
packaging. As of December 31, 2009, these patents have nominal
carrying values.
Under the
PRC’s State Protection Law, certain herbal medicine products, which have
received approval from the SFDA, have automatic protection. SFDA
licenses for drug batch numbers we acquired in connection with our acquisitions
of Tianlong and Peng Lai in fiscal 2008 have been recorded as part of our
intangible assets. We did not appraise or assign any value to the
SFDA licenses for drug batch numbers developed internally by TDR or
First.
We have
registered “Kang Xi” as our trademark, which is used for all of our TCM
products. The “Kang Xi” trademark was developed internally and
registered by TDR before we became a public company. Our cost basis
in the trademark is nominal.
Employees
The number of our employees has
increased due to growth, increased research and development activities and expanded marketing and distribution efforts for our products. Our employees generally fall into the
following categories:
By subsidiary
company:
|
Number of
Employees
|
||||||||
|
Company
|
2009
|
2008
|
||||||
|
TDR
|
1,315 | 1,515 | ||||||
|
Tian Qing
|
0 | 0 | ||||||
|
First
|
107 | 97 | ||||||
|
Tianlong
|
207 | 97 | ||||||
|
Haina
|
399 | 24 | ||||||
|
Peng Lai
|
126 | 71 | ||||||
|
TOTAL:
|
2,154 | 1,804 | ||||||
14
By nature of job:
|
Number of
Employees
|
||||||||
|
Type of Job
|
2009
|
2008
|
||||||
|
Executives and managers
|
201 | 146 | ||||||
|
Production and clerical
|
424 | 359 | ||||||
|
Sales and marketing
|
1,491 | 1,261 | ||||||
|
Research and development, technology
|
38 | 38 | ||||||
|
TOTAL:
|
2,154 | 1,804 | ||||||
As of December 31, 2008, we had 1,804
full-time employees. Our 2,154 employees, as of December 31, 2009, includes both 305 full time employees and 1,849 individuals hired on a contract basis
through agencies. In 2009, we began hiring certain employees on a
contract basis, in order to take advantage of cost
efficiencies.
We do not have any employment
agreements in place with our executive officers. None of the employees are
covered by a collective bargaining agreement,
however, we believe our relationship with employees is good.
Available
Information
We file various reports with the SEC, including Annual
Reports on Form 10-K, Quarterly
Reports on Form 10-Q and Current
Reports on From 8-K, which are available though
the SEC’s electronic data gathering, analysis
and retrieval system by accessing the SEC’s home page (http://www.sec.gov). The
documents are also available to be read or
copied at the SEC’s Public Reference Room
located at 100 F Street, NE, Washington, D.C., 20549. Information on the Public Reference
Room may be obtained by calling the SEC at
1-800-SEC-0330.
We also make available free of charge
through our website (www.cski.com.cn) our Annual Report on Form 10-K, Quarterly
Reports on Form 10-Q, Current Reports on Form 8-K, and, if applicable,
amendments to those reports filed or furnished pursuant to the Exchange Act as soon as
reasonably practicable after we electronically file such material with, or furnishes it
to, the SEC.
15
Item 1A. Risk Factors.
We are subject to certain risks and
uncertainties as
described below. These risks and
uncertainties may not be the only ones we face. There may be
additional risks that we do not presently know of, or that we currently consider
immaterial. All of these risks could adversely affect our
business, financial
condition, results of operations and cash
flows. Our business and operations may be adversely
affected if any of such risks are
realized. All investors should
consider the following risk factors before deciding to purchase or sell our
securities.
Risks Related to Our Business
Adverse economic conditions may harm our
business.
In 2008,
general worldwide economic conditions declined due to sequential effects of the
sub prime lending crisis, general credit market crisis, collateral effects on
the finance and banking industries, concerns about inflation, slower economic
activity, decreased consumer confidence, reduced corporate profits and capital
spending, adverse business conditions and liquidity concerns. This
global economic downturn poses a risk as consumers and businesses may postpone
spending, or seek new ways to eliminate spending, in response to these uncertain
and challenging economic conditions. In addition, there could be a
number of follow-on effects including foreign currency exchange rate
fluctuations, insolvency of key suppliers and customer
insolvencies. We cannot predict the timing or duration of any
economic slowdown or recession or the timing or strength of a subsequent
recovery, worldwide, or in the specific markets we serve. If the
markets for our products significantly deteriorate due to these economic
effects, our business, financial condition and results of operations may be
materially and adversely affected.
Certain officers and directors have
significant control over our company.
Liu Yan-qing and Han Xiao-yan, who are officers and
directors of ours, also
serve as officers and
directors of ACPG, TDR and its subsidiaries. As of the date hereof, Dr. Liu and Ms. Han own, in the aggregate, approximately 36.5% of the issued and outstanding shares of our common stock.
As a result, these shareholders are
effectively able to control certain corporate governance matters requiring
shareholders’ approval. Such matters may include transactions in
which they have an interest other than as a shareholder of ours, the approval
of significant corporate
transactions such as increasing the authorized number of our shares to complete
acquisitions or raise capital, if necessary, and any other transactions
requiring a majority vote without seeking other shareholders’ approval. These persons also have the ability to
control other matters requiring shareholder approval including our election of
directors which could result in the entrenchment of
management.
We depend on our key management
personnel and the loss of
their services could adversely affect our business.
We place substantial reliance upon the
efforts and abilities of our executive
officers, Liu Yan-qing, President, Chief Executive Officer and Chairman of the
Board, Han Xiao-yan, Vice Chairman, and Stanley Hao, Chief Financial Officer and Secretary.
We do not have employment
agreements with these members of management.
Accordingly, if any of these persons
should leave the company, we would have no remedy or protections in place and would not be able to
prevent them from competing with us or working for competitors. The loss of the services of any of these
executive officers could have a material adverse effect on our business,
operations, revenues or prospects. In addition, we do not maintain key man life
insurance on the lives of these individuals.
Our expansion plan may not be
successful.
Part of our strategy is to continue our growth through increasing the distribution and
sales of our
products by penetrating existing
markets in the PRC, and entering new geographic
markets in the PRC as well as Asia, the
United States and other countries. However, many
obstacles to entering such new markets exist, including, but not limited to, international trade and tariff
barriers, regulatory constraints, product liability concerns, shipping
and delivery costs, costs associated with marketing efforts abroad and maintaining attractive
foreign exchange
ratios. Moreover, our expansion strategy may be
based on incorrect assumptions and may be
flawed, and may even damage our performance,
competitive position in the market and, ultimately, even our ability to survive in the
marketplace. We cannot, therefore, assure
shareholders that we will be able to successfully overcome such obstacles and
establish our products in any additional markets. Our inability to implement this growth
strategy successfully may have a negative impact on our growth, future financial condition,
results of operations or cash
flows.
16
There are many safety risks
involved in our products and services that could expose us to
liability or inhibit our ability to secure insurance.
Our products and services involve direct or indirect
impact on human health and life. The products we manufacture and sell may be
flawed and cause dangerous side
effects, and even fatality in certain cases, leading to major business losses
and legal and other
liabilities and damages to our company. In the event that any of our
products are alleged to have adverse side effects, we could be subject to product
liability claims. In addition to the threat of liability,
there may be insurance
costs if we enter into certain
markets or may not be able to obtain insurance
for certain products in some countries. Some
distributors may refuse to sell our products in certain countries if they perceive
such products to have a high risk or to be
uninsurable.
We do not maintain any insurance and are
exposed to all risks of loss, including
resulting form product liability, property loss or damages, or other harm that we may cause to
customers, vendors, suppliers and other third parties,
or securities law
claims.
We do not
maintain liability or property insurance coverage or director and officer
insurance coverage and, therefore, we are self-insured for all risks of
loss. Although we seek to reduce potential liability through measures
such as contractual indemnification provisions with distributors and suppliers,
we cannot assure you that such measures will be enforced or
effective. Our policy is to record losses associated with our lack of
insurance coverage at such time as realized loss is incurred. Historically, we
have not had any material losses in connection with our lack of insurance
coverage and are not party to any material pending legal proceedings as of the
date of this report. Management’s intention is to use our working
capital to fund any such losses incurred due to our exposure to inadequate
insurance coverage. Our operating results could be materially and
adversely affected if we were to pay significant damages or incur significant
defense costs in connection with a claim.
We are highly dependent upon the public
perception and quality of our products. Additionally, anti-corruption measures
taken by the government to correct corruptive practices in the pharmaceutical
industry could adversely affect our sales and reputation.
We are highly dependent upon
consumers’ perception of the safety and quality of our products as well as similar products distributed by other companies. Thus, the mere publication of
reports asserting that such products may be harmful could have a material
adverse effect on our business, regardless of whether these reports are scientifically supported.
The PRC government has recently taken anti-corruption
measures to correct corrupt practices. In the pharmaceutical industry, such
practices include, among
other things, acceptance of
kickbacks, bribery or other
illegal gains or benefits by the hospitals and medical practitioners from pharmaceutical
distributors in connection with the prescription of a certain
drug. Substantially all of our sales to our ultimate customers are
conducted through third-party distributors.
We have no control over our third-party
distributors, who may engage in corrupt practices to promote our
products. While we maintain strict anti-corruption
policies applicable to our internal sales force and third-party distributors, these
policies may not be effective. If any of our third-party distributors
engage in such practices and the government takes enforcement action, our
products may be seized and our own practices, and involvement
in the
distributors’ practices may be investigated. If this occurs, our sales
and reputation may be materially and adversely affected.
Our success will depend on our research
and the ability to develop new products.
Our growth depends on our ability to
consistently discover, develop and commercialize new products, and find new and improve on existing
technologies, platforms and products. As such, if we fail to make sufficient
investments in research, to be attentive to consumer needs, or fail to focus on the most
advanced technologies, our current and future
products could be surpassed by more effective or advanced products of other companies.
We currently rely on third parties to supply
the key raw materials we use to produce our products.
Our business depends upon the
availability of key raw materials. We rely on only external suppliers for
these raw materials. In fiscal year 2009, Harbin Zhong Jia Medicine Company and Heilongjiang Kangda
Medicine Company accounted for approximately 16% and 42% of our total inventory purchases, respectively. Heilongjiang Kangda Medicine Company accounted for approximately 33% of our total inventory purchases for the year
ended December 31, 2008. For the 2010 fiscal year, we expect that our raw material
suppliers will be
substantially similar to last year and the amount of raw materials will
increase commensurate with the increase in the demand of our products. If any of our major suppliers were to default or become
unable to deliver the raw materials in sufficient quantities, we may be
unable to purchase these raw materials from alternative sources on the same or
similar terms, which could result in a significant decrease in our operating
costs. In addition, any disruption in the
supply of our raw materials
could cause delay in the delivery of our products which would be harmful to our sales
reputation and business. If supply is disrupted the increased amount we have to pay for raw materials
could negatively impact our margins, cause us to cease production if an
alternate supplier cannot be found. If we are unable to procure replacement
supplies, our ability to meet the production demands of our customers could
cause the loss of costumers and/or market share. Our financial results could be negatively impacted by the lost sales or
decreased margins.
17
We
are dependent on a limited number of customers for a significant portion of our
revenues and accounts receivable and this dependence is likely to
continue.
We have
been dependent on a limited number of customers for a significant portion of our
revenue. For the year
ended December 31, 2009, sales to Harbin Shiji Baolong Medicine Company and
Shanxi Xintai Medicine Company accounted for approximately 16% and 11% of total revenues, respectively. For the year
ended December 31, 2008, sales to Shanxi
Xintai and Harbin Shiji Baolong accounted for 15% and 12% of our total revenues, respectively. For the year ended December 31, 2007, sales to Ning BoYue Hua Trading Company and Guang
Zhou Xing He Trading Company accounted for approximately 14% and 11% of our total revenues, respectively. Dependence on a few
customers could make it difficult to negotiate attractive prices for our
products and could expose us to the risk of substantial losses if any such
customer stops purchasing our products. We expect that a limited
number of customers will continue to contribute to a significant portion of our
sales in the near future. Our ability to maintain close relationships with these
top customers is essential to the growth and profitability of our
business. If we fail to sell our products to one or more of these top
customers in any particular period, or if a large customer purchases fewer of
our products, defers orders or fails to place additional orders with us, or if
we fail to develop additional major customers, our revenue would likely decline
and our results of operations would be adversely affected.
In
addition, our accounts receivable are concentrated among a small number of our
customers. Harbin Bao Da Medicine Company and Harbin Shiji Baolong
Medicine Company accounted for approximately 16% and 14% of our
accounts receivable in 2009, respectively. Harbin Shiji Baolong and
Shanxi Xintai accounted for approximately 29% and 11% of our
accounts receivable in 2008, respectively. Hua Li Jiu Zhou Company
accounted for approximately
11% of our accounts receivable in 2007. If any our customers fail to pay us on a
timely basis, or do not pay us at all, our business, cash flow, financial
condition and results of operations may be materially and adversely
affected.
Significant competition from existing
and new entities could adversely affect revenues and
profitability.
We compete with other companies, many of
which are developing
and/or offering, or can be expected to develop and offer, products similar to ours. Our market is a large market with many
competitors. Many of our competitors are more
established than we are, and have significantly
greater financial, technical, marketing and other resources than us. Some of our competitors
have greater name recognition and a larger customer base.
These competitors may be able to respond
more quickly to new or changing opportunities and customer
requirements and may be able to undertake more
extensive promotional activities, offer more attractive terms
to customers, and adopt more aggressive pricing
policies. We cannot assure investors that we will
be able to compete effectively with current or future competitors or that the
competitive pressures we face will not harm our business.
We are subject to market and channel
risks.
In fiscal year 2009, over 92% of our sales were made in the PRC, where we primarily
sell our products through drug chain stores. Because of this, we are dependent to a large
degree upon the success of
our PRC-based distribution channel, as well as the success of specific
retailers in the distribution channel. We rely on these distribution channels
to purchase, market, and sell our products. Our success is dependent, to a large
degree, on the growth and success of the drug stores, which may be
outside our control. There can be no assurance that the drug
store distribution channels will be able to grow or prosper as
they faces price and
service pressure from other
channels, including the mass market. There can be no assurance that retailers
in the drug store distribution channel, in the aggregate, will respond or
continue to respond to our marketing commitment in these
channels.
18
We may have difficulty in defending
intellectual property rights from infringement.
Our TCM products are generally not protected by patents but by trade secrets. Certain TCM license agreements are made on a non-exclusive basis.
Our success depends, in large part, on
our ability to protect current and future technologies and products and to defend our intellectual property
rights. If we fail to protect our intellectual
property adequately,
competitors may manufacture and market similar products. We have filed patent applications seeking to protect
newly developed and/or technologies. Some patent applications in the PRC are
maintained in secrecy until the patent is
issued. Because the publication of
discoveries tends to follow their actual discovery by many months, we may not be
the first to invent, or file patent applications on any of its discoveries. Patents may not be issued with respect to any of our patent
applications and existing or future patents issued to or licensed by us may not provide competitive
advantages for its products. Patents that are issued may be challenged, invalidated or circumvented by competitors. Furthermore, our patent rights may not prevent our competitors from
developing, using or commercializing products that are similar or functionally
equivalent to our products.
To the extent that we market
products in other countries, we may have to take
additional action to protect our intellectual property. The measures we take to protect our
proprietary rights may be inadequate, and we cannot
provide any assurance that
our competitors will not independently develop formulations and processes that
are substantially equivalent or superior to our products or copy our products.
We also rely on trade secrets, non-patented proprietary expertise and continuing technological innovation that
we seek to protect, in part, by entering into confidentiality
agreements with licensees, suppliers, employees
and consultants. These agreements may be breached and there may not be adequate
remedies in the event of a
breach. Disputes may arise concerning the
ownership of intellectual property or the applicability of confidentiality
agreements. Moreover, trade secrets and proprietary
technologies may otherwise
become known or be independently developed by competitors. If
patents are not issued with respect to products arising from research, we may not be
able to maintain the confidentiality of information relating to these
products.
We will be subject to risks relating
to third parties that may
claim that we infringe on their proprietary rights and may prevent us from manufacturing
and selling certain of our products.
There has been substantial litigation in
the pharmaceutical and nutraceutical industries with respect to the manufacturing, use
and sale of new products. These lawsuits relate to the validity and infringement
of patents or proprietary rights of third parties. We may be required to commence or defend against charges
relating to the infringement of patent or proprietary
rights. Any such litigation could
involve or result in:
|
·
|
the incurrence of substantial
expense, even if we are successful in the
litigation;
|
|
·
|
a diversion of significant time
and effort of
technical and management
personnel;
|
|
·
|
the loss of our rights to develop or make certain
products;
and
|
|
·
|
the payment of substantial
monetary damages or royalties in order to license proprietary
rights from third parties.
|
Although patent and intellectual
property disputes within these industries have often been settled through licensing or similar
arrangements, costs associated with these arrangements may be substantial and could include
the long-term payment of royalties. These arrangements may be investigated by regulatory agencies and, if
improper, may be invalidated. Also, the required licenses may not be made available to us on acceptable terms. Accordingly, an adverse determination in
a judicial or administrative proceeding or a failure to obtain necessary
licenses could prevent our company from manufacturing and selling some of
our products or increase costs to market these products.
In addition, when seeking regulatory
approval for some of our products, we are required to certify to regulatory authorities,
including the SFDA that such products do not infringe upon third party patent
rights. Filing a certification against a patent
gives the patent holder the right to bring a patent infringement lawsuit against us. Any lawsuit would delay regulatory
approval by the SFDA. A claim of infringement and the
resulting delay could
result in substantial expenses and even prevent us from manufacturing and
selling certain of our products.
19
The launch of a product prior to a final
court decision or the expiration of a patent held by a third party may
result in substantial damages to us. Depending upon the
circumstances, a court may award the patent holder damages equal to three times
their loss of income. If we
are found to infringe a
patent held by a third party and become subject to such treble damages, these damages could have a material
adverse effect on our results of operations and financial
condition.
Our failure to comply with accounting
policies and regulations in making reasonable estimates and judgments could negatively impact our financial position and
results of operation.
We are subject to critical accounting policies
and actual results may vary from estimates. We have followed, and will continue to follow, generally
accepted accounting principles for the
United States in preparing financial statements. As part of this work, we must make many
estimates and judgments concerning future events. These affect the value of the
assets and liabilities, contingent assets and liabilities, and revenue and
expenses reported in such financial statements. We believe that these estimates and
judgments are reasonable, and we have made them
in accordance with accounting policies based on information available at the
time. However, actual results could differ from estimates, and this
could require us to record adjustments to expenses or revenues that could be
material to our financial position and results of operations in the
future.
Our business is subject to many
governmental regulatory and policy risks.
Our business must be conducted in compliance with various government
regulations and in particular, the SFDA’s regulations. Government regulations may have material impact on our
operations, increase costs and could prevent or delay the
manufacturing and selling
of our products. Research, development, testing,
manufacturing and marketing activities are subject to various governmental
regulations in China, including health and drug
regulations. Government regulations, among other
things, cover the inspection of and controls over testing, manufacturing, safety
and environmental considerations, efficacy, labeling, advertising,
promotion, record keeping
and sale and distribution
of pharmaceutical products. We will not be able to license,
manufacture, sell and distribute the vast majority of
our products without a proper approval from
government agencies and in
particular the SFDA. This approval process is lengthy, with
approvals for TCM products typically occurring 18-24 months after
the application is initially filed. There is no assurance that we will
obtain such approvals on a
timely basis, or at all. Delays in
obtaining approvals will
delay our ability to market products and denial of approval for a specific
product will result in our inability to market the product and recoup the
expenses incurred in that products development and
testing.
In addition, delays or rejections may be
encountered based upon additional government regulation
from future legislation, administrative action or changes in governmental policy
and interpretation during the period of product development and product assessment. Although we have, so far,
obtained the rights to sell our products in the PRC, we may not continue to
receive and maintain regulatory approvals for the sales of these products. Our marketing activities are also
subject to government
regulations with respect to the prices that it intends to charge or any other
marketing and promotional
related activities. Government regulations may substantially
increase the costs for developing, licensing,
manufacturing and selling
products, impacting negatively our operations,
revenue, income and cash
flow.
There could be changes in government
regulations towards the pharmaceutical and nutraceutical industries that may
adversely affect our business.
The manufacture and sale of
pharmaceutical and nutraceutical products in the PRC is heavily
regulated by many state, provincial and local authorities.
These regulations significantly
increased the difficulty and costs involved in obtaining and maintaining regulatory
approvals for marketing new
and existing products. Our future growth and profitability
depends to a large extent on our ability to obtain regulatory
approvals.
The SFDA has implemented new guidelines for licensing of
pharmaceutical products. All existing manufacturers with
licenses, which are currently valid under the previous guidelines, were
required to apply for the GMP certifications by June 30, 2004, and to
receive approvals by December 31, 2004. We received certifications for our current products. However, should we fail to maintain the
GMP certifications under the new guidelines in the future, or for new
products, our businesses would be materially and
adversely
affected.
Moreover, the laws and regulations
regarding acquisitions of the pharmaceutical and nutraceutical industries in the
PRC may also change and may significantly impact our ability to grow through
acquisitions.
20
We need to manage growth in operations to
maximize our potential growth and achieve our expected revenues.
Our success depends on our ability to
achieve continued growth. In order to maximize
potential growth in current
and potential markets, we believe that we must expand our
manufacturing and marketing
operations. This expansion will place a significant
strain on management and operational, accounting and information systems and
will require substantial
additional capital.
We will need to continue to improve financial
controls, operating procedures, and management
information systems if and
as we grow. We will also need to effectively train, motivate, and manage our employees. A failure to manage our growth could
disrupt operations and ultimately prevent us from generating the revenues we
expect.
International operations require our
company to comply with a number of U.S. and international regulations.
We are required to comply with a number of
international regulations in countries outside of the United States. In addition, we must comply
with the Foreign Corrupt Practices Act, or FCPA, which prohibits U.S. companies or their
agents and employees from providing anything
of value to a foreign official for the purposes of influencing any act or
decision of these individuals in their official capacity to help obtain or
retain business, direct business to any person or
corporate entity or obtain
any unfair advantage. Any failure to adopt appropriate
compliance procedures and ensure that our employees and
agents comply with the FCPA and applicable
laws and regulations in foreign jurisdictions could result in
substantial penalties and/or restrictions in our ability to conduct business in
certain foreign jurisdictions. The U.S. Department of The
Treasury’s Office of Foreign Asset Control, or
OFAC, administers and enforces economic and trade sanctions against
targeted foreign countries, entities and
individuals based on U.S. foreign policy and national security
goals. As a result, we are restricted from entering into transactions
with certain
targeted foreign countries, entities and
individuals except as permitted by OFAC which may reduce our future
growth.
We may incur significant costs to ensure compliance with U.S. corporate governance and accounting
requirements.
We are a public reporting company, and,
as such, we will incur significant costs associated with public company reporting
requirements, costs associated with newly applicable corporate governance requirements, including requirements under the Sarbanes-Oxley Act of 2002
and other rules implemented by the U.S. Securities and Exchange
Commission (“SEC”). All of these applicable rules and
regulations can be expected to increase legal and financial
compliance costs and to make some activities
more time consuming and
costly. Management also expects that these applicable rules and
regulations may make it more difficult and more expensive to obtain director
and officer liability
insurance and we may be required to accept reduced policy limits and coverage or incur substantially
higher costs to obtain the same or similar coverage.
As a result, it may be more difficult for us to attract and retain qualified individuals to serve on our board of
directors or as executive officers.
We may have difficulty raising necessary
capital to fund operations as a result of market price volatility for our shares
of common stock.
In recent years, the securities markets in the U.S. have experienced a high level of price and volume
volatility, and the market price of securities of many companies have
experienced wide fluctuations that have
not necessarily been
related to the operations, performances,
underlying asset values or
prospects of such companies. For these reasons, our shares of common
stock can also be expected to be subject to volatility resulting
from purely market forces
over which we will have no control. If our business development plans are
successful, we may require additional financing to continue to develop and
exploit existing and new technologies and to expand into new markets. The exploitation of existing and new technologies may,
therefore, be dependent upon our ability to obtain financing through debt and
equity or other means.
We are obligated to indemnify our officers and directors
for certain losses they suffer.
To the fullest extent
permitted by Chapter 78 of the Nevada
Revised Statues, we may, if and to the extent
authorized by our board of directors, indemnify
our officers and any other persons who we have power to indemnify against liability, reasonable expense
or other matter whatsoever. If we are required to indemnify any persons under this
policy, we may have to pay indemnity in a substantial amount which we may be
unable to recover at all.
21
Risks Related to Doing Business in China
Our business will be affected by the government regulation and
Chinese economic environment because most of our sales will be in the
China market.
In 2009, 2008, and 2007, approximately 92%, 92% and 75% of our total revenues,
respectively, were from sales in the
PRC. The
manufacture and sale of pharmaceutical products in China is heavily regulated by many state, provincial and local
authorities. The SFDA requires pharmaceutical manufacturers
to obtain GMP certifications. We currently have the certifications
needed for our current operations.
However, should we fail to receive or maintain the GMP
certifications in the future, we would no longer be able to manufacture
pharmaceuticals in China, and our businesses would be materially
and adversely affected. These regulations significantly increase the difficulty and
costs involved in obtaining and maintaining regulatory
approvals for marketing new
and existing products. Our future growth and profitability
depend to a large extent on our ability to obtain regulatory approvals. Additionally, the law could change so as
to prohibit the use of certain pharmaceuticals. If one of our products becomes prohibited, this change would cease
the productivity of that
product. The China National Development and Reform Commission (“CNDRC”), has recently implemented price
adjustments on many marketed pharmaceutical products. We have no control over such
governmental policies, which may impact the pricing and profitability of our
products.
Although we have started exporting products to other countries, most of our sales
are in the PRC. It is anticipated that our products in the PRC will continue to represent a
significant portion of sales in the near future. As a result of our reliance on the PRC markets, our operating results and financial performance could be
affected by any adverse changes in economic,
political and social conditions in the PRC.
The modernization of regulations for the
pharmaceutical industry is relatively new in the PRC, and the manner
and extent to which it is regulated will continue to evolve. As a pharmaceutical company, we are
subject to the Pharmaceutical Administrative Law, which governs the licensing,
manufacture, marketing and distribution of pharmaceutical
products in the PRC, and sets penalty provisions for violations of
provisions of the Pharmaceutical Administrative
Law. In addition as
a “Foreign
Owned Enterprise,” we will be subject to the Foreign
Company provisions of the
Company Law of the PRC. Changes in these laws or new interpretations
of existing laws may have a significant impact our methods and our cost of doing
business. For example, if legislative proposals for pharmaceutical
product pricing, reimbursement levels, approval criteria or
manufacturing requirements should be proposed and adopted, such new legislation or regulatory
requirements may have a material adverse effect on
our financial condition, results of operations or cash flows. In addition, we are subject to varying
degrees of regulation and licensing by governmental agencies in China. At this time, we are unaware of any
China legislative proposals that could
adversely affect our business. There can be no assurance that future
regulatory, judicial and legislative changes will not have a material adverse
effect on our operations, that regulators or third parties will not raise
material issues with regard to compliance or non-compliance with applicable laws or regulations, or
that any changes in applicable laws or regulations will not have a material
adverse effect on our business.
Certain political and economic
considerations relating to China could adversely affect us.
China is transitioning from a
planned economy to a market economy.
While the PRC government has
pursued economic reforms since its adoption of the open-door policy in
1978, a large portion of
the Chinese economy is still operating under five-year plans and annual state plans.
Through these plans and other economic
measures, such as control on foreign exchange, taxation and restrictions on
foreign participation in the domestic market of various industries, the PRC
government exerts considerable direct and indirect
influence on the economy. Many of the economic reforms
carried out by the PRC government are
unprecedented or experimental, and are
expected to be refined and improved. Other political, economic and social
factors can also lead to further readjustment of such reforms.
This refining and readjustment process
may not necessarily have a positive effect on our operations or future business development.
Our operating results may be adversely affected by changes in
China’s economic and social conditions as well
as by changes in the policies of the PRC government, such as changes in laws and
regulations, or the official interpretation thereof, which may
be introduced to control inflation, changes in the interest rate or method of
taxation, and the imposition of additional restrictions on currency
conversion.
Accordingly, government actions in the
future, including any
decision not to continue to support recent economic reforms and to return to a
more centrally planned economy or regional or local variations
in the implementation of economic policies, could have a significant effect on
economic conditions in
China or particular regions thereof, and could require us to divest ourselves of
any interest we then hold in Chinese properties or joint
ventures.
22
There are risks inherent in doing business in
China.
The PRC is a developing country with a
young market economic system overshadowed by the state under heavy regulation and
scrutiny. Its political and economic systems are very
different from the more
developed countries. China also faces many social, economic and
political challenges that may produce major shocks and instabilities and even
crises, in both its domestic arena and in its relationship with other countries,
including but not
limited to the United States. Such shocks, instabilities and crises
may in turn significantly and adversely affect our
performance.
The recent nature and uncertain
application of many PRC laws applicable to our company create an uncertain
environment for business operations and they could have a negative effect on our
business and operations.
The PRC
legal system is a civil law system. Unlike the common law system, the
civil law system is based on written statutes in which decided legal cases have
little value as precedents. In 1979, the PRC began to promulgate a
comprehensive system of laws and has since introduced many laws and regulations
to provide general guidance on economic and business practices in the PRC and to
regulate foreign investment. Progress has been made in the
promulgation of laws and regulations dealing with economic matters such as
corporate organization and governance, foreign investment, commerce, taxation
and trade. However, there are substantial uncertainties regarding the
interpretation and application of PRC laws and regulations, including, but not
limited to, the laws and regulations governing our business. In addition, the
effectiveness of newly-enacted laws, regulations or amendments may be delayed,
resulting in detrimental reliance by investors. New laws and
regulations that affect existing and proposed future businesses may also be
applied retroactively. The promulgation of new laws, changes of existing laws
and the abrogation of local regulations by national laws could have a negative
impact on our business, business prospects and operations. In
addition, as these laws, regulations and legal requirements are relatively
recent, their interpretation and enforcement involve significant
uncertainty.
Our business may be affected by unexpected changes in regulatory
requirements in the jurisdictions in which we
operate.
Our company, and its subsidiaries, are subject to many
general regulations governing business entities and their behavior in
China and in other jurisdictions in which we and
our subsidiaries have, or plan to have, operations and market products. In particular, we are
subject to laws and regulations covering food, dietary supplements and pharmaceutical products. Such regulations
typically deal with licensing, approvals and
permits. Any change in product
licensing may make our products more or less available on the
market. Such changes may have a positive or negative impact on the
sale of our products and may directly impact the
associated costs in compliance and our operational and
financial viability. Such regulatory environment also covers any
existing or potential trade barriers in the form of import tariff and taxes that
may make it difficult for us to import our products to certain countries and regions, such
as Hong Kong, which would limit its international
expansion.
A
slowdown or other adverse developments in the PRC economy may materially and
adversely affect our customers, demand for our services and our
business.
All of
our operations are conducted in the PRC and almost all of our revenues are
generated from sales in the PRC. Although the PRC economy has grown
significantly in recent years, we cannot assure you that such growth will
continue. According to the PRC National Bureau of Statistics, the
PRC’s economy expended 6.8% from a year earlier in the fourth quarter of 2008,
which means that a full-year growth for 2008 was 9.0%. It is the
first time since 2002 that the PRC has expanded by less than 10%
annually. A number of factors have contributed to this slow-down,
including appreciation of the RMB, which has adversely affected the PRC’s
exports. In addition, the slow-down has been exacerbated by the recent global
crisis in the financial services and credit markets, which has resulted in
significant volatility and dislocation in the global capital markets. It is
uncertain how long the global crisis in the financial services and credit
markets will continue and how much adverse impact it will have on the global
economy in general or the PRC economy in particular. We do not know
how sensitive we are to a slowdown in economic growth or other adverse changes
in the PRC economy which may affect demand for our products. A
slowdown in overall economic growth, an economic downturn or recession or other
adverse economic developments in the PRC may materially reduce the demand for
our products and materially and adversely affect our business.
23
Inflation
in the PRC could negatively affect our profitability and growth.
While the
PRC economy has experienced rapid growth, it has been uneven among various
sectors of the economy and in different geographical areas of the country. Rapid
economic growth can lead to growth in the money supply and rising inflation. If
prices for our products do not rise at a rate that is sufficient to fully
absorb inflation-driven increases in our costs of supplies, our profitability
can be adversely affected.
During
the past ten years, the rate of inflation in the PRC has been as high as 20.7%
and as low as 2.2%. These factors have led to the adoption by the Chinese
government, from time to time, of various corrective measures designed to
restrict the availability of credit or regulate growth and contain inflation. In
order to control inflation in the past, the PRC government has imposed controls
on bank credits, limits on loans for fixed assets and restrictions on state bank
lending. The implementation of these and other similar
policies can impede economic growth and thereby harm the market for
our products.
Substantially
all of our assets are located in the PRC and all of our revenues are derived
from our operations in the PRC. Accordingly, our results of
operations and prospects are subject, to a significant extent, to the economic,
political and legal developments in the PRC.
Substantially
all of our assets are located in the PRC and all of our revenues are derived
from our operations in the PRC. Accordingly, our results of
operations and prospects are subject, to a significant extent, on the economic,
political and legal developments in the PRC. The PRC economy differs
from the economies of most developed countries in many respects.
Since
1978, the PRC has been one of the world’s fastest-growing economies in terms of
gross domestic product, or GDP growth. We cannot assure you, however, that such
growth will be sustained in the future. If, in the future, the PRC’s economy
experiences a downturn or grows at a slower rate than expected, there may be
less demand for spending in certain industries.
Our
ability to implement our business plan is based on the assumption that the
Chinese economy will continue to grow. The PRC’s economic growth has been
uneven, both geographically and among various sectors of the economy. The PRC
government has implemented various measures to encourage economic growth and
guide the allocation of resources. Some of these measures benefit the overall
PRC economy, but may also have a negative effect on us.
The PRC
economy has been transitioning from a planned economy to a more market-oriented
economy. Although in recent years the PRC government has implemented measures
emphasizing the use of market forces for economic reform, the reduction of state
ownership of productive assets and the establishment of sound corporate
governance in business enterprises, a substantial portion of productive assets
in the PRC is still owned by the PRC government. In addition, the PRC government
continues to play a significant role in regulating industry development by
imposing industrial policies. It also exercises significant control over PRC
economic growth through the allocation of resources, controlling payment of
foreign currency-denominated obligations, setting monetary policy and providing
preferential treatment to particular industries or companies. We cannot assure
you that changes in the PRC’s economic, political or legal systems will not
detrimentally affect our business, prospects, financial conditions and results
of operations.
We may have difficulty attracting talent
in foreign countries.
Currently, over 92% of our sales are in the PRC. We are in the process of attempting to
establish marketing
and sales presence in the
U.S. and other countries. We expect to establish an office in the U.S. for investor relations. In the future, we may explore expanding
its operations in other countries throughout the world.
Upon effecting any such expansion, we
may not be able to identify and retain qualified personnel due to its lack of understanding of different
cultures and lack of local contacts. This may impede international expansion.
Currency conversion and exchange rate
volatility could adversely affect our financial condition, by making
acquisitions in China or of Chinese products more expensive.
The PRC government imposes control over the conversion of
Renminbi (“RMB”), the currency of China, into foreign currencies. Under the current unified floating exchange rate system, the
People’s Bank of China publishes an exchange
rate, referred to as the PBOC exchange rate,
based on the previous day’s dealings in the inter-bank foreign
exchange market. Financial institutions
authorized to deal in foreign currency may enter
into foreign exchange transactions at exchange rates within an authorized range above or below the PBOC exchange
rate according to market conditions.
24
Pursuant to the Foreign Exchange Control
Regulations of the PRC issued by the State Council which came into
effect on April 1, 1996,
and the Regulations on the Administration of Foreign Exchange Settlement, Sale
and Payment of the PRC which came into effect on July 1, 1996, regarding foreign
exchange control, conversion of RMB into foreign exchange by Foreign Investment Enterprises (“FIEs”), for use on current account items,
including the distribution of dividends and profits to foreign investors, is
permissible. FIEs are permitted to convert their after-tax dividends
and profits to foreign exchange and remit such foreign exchange to their
foreign exchange bank accounts in the PRC.
Conversion of RMB into foreign
currencies for capital account items, including direct investment, loans, and
security investment, is still subject to certain restrictions. On January 14, 1997, the State Council
amended the Foreign Exchange Control
Regulations and added, among other things, an important
provision, which provides that the PRC government shall not impose restrictions
on recurring international
payments and transfers under current account
items. These rules are subject to
change.
Enterprises in the PRC (including FIEs)
which require foreign exchange for transactions relating to current account
items, may, without approval of the State Administration of Foreign Exchange
(“SAFE”) effect payment from their foreign
exchange account or convert and pay at the designated foreign exchange banks by providing
valid receipts and proofs.
Convertibility of foreign exchange in
respect of capital account items, such as direct investment and capital
contribution, is still subject to certain restrictions, and prior approval from
the SAFE or its relevant branches must be
sought.
Our company is a FIE to which the
Foreign Exchange Control
Regulations are applicable. There can be no assurance that we will
be able to obtain sufficient foreign exchange to pay dividends or satisfy other
foreign exchange requirements in the future.
Since 1994, the exchange rate for RMB against the U.S.
dollar has
remained relatively stable, most of the time in
the region of approximately
RMB8.00 to U.S.$1.00. However, in 2005, the Chinese government
announced that would begin pegging the exchange rate of
the Chinese RMB against a number of currencies, rather than just the U.S.
dollar. Currently, exchange rates are approximately RMB 6.84 to U.S.$1.00 resulting in the increase in price
of Chinese products to U.S. purchasers. As our operations are primarily in
China, any significant revaluation of the
Chinese RMB may materially and adversely affect cash flows, revenues and
financial condition. For example, to the extent that we
need to convert United States dollars into Chinese RMB for
operations, appreciation of this currency against the
U.S. dollar could have a
material adverse effect on our business, financial condition and results of operations. Conversely, if we decide to convert Chinese RMB into
U.S. dollars for other
business purposes and the
U.S. dollar appreciates
against this currency, the
U.S. dollar equivalent of
the Chinese RMB that we convert would be reduced.
Restrictions
on currency exchange may limit our ability to utilize our revenues effectively
and the ability of the PRC entities to obtain financing.
Substantially
all of our revenues and operating expenses are denominated in Renminbi.
Restrictions on currency exchange imposed by the PRC government may limit our
ability to utilize revenues generated in Renminbi to fund our business
activities outside the PRC, if any, or expenditures denominated in foreign
currencies. Under current PRC regulations, Renminbi may be freely converted into
foreign currency for payments relating to “current account transactions,” which
include among other things dividend payments and payments for the import of
goods and services, by complying with certain procedural requirements. The PRC
entities may also retain foreign exchange in their respective current account
bank accounts, subject to a cap set by the State Administration for Foreign
Exchange, or SAFE, or its local counterpart, for use in payment of international
current account transactions. However, conversion of Renminbi into foreign
currencies, and of foreign currencies into Renminbi, for payments relating to
“capital account transactions,” which principally includes investments and
loans, generally requires the approval of SAFE and other relevant PRC
governmental authorities. Restrictions on the convertibility of the Renminbi for
capital account transactions could affect the ability of the PRC entities to
make investments overseas or to obtain foreign exchange through debt or equity
financing, including by means of loans or capital contributions from the parent
entity.
25
Any
existing and future restrictions on currency exchange may affect the ability of
the PRC entities or an affiliated entity to obtain foreign currencies, limit our
ability to utilize revenues generated in Renminbi to fund any business
activities outside the PRC that are denominated in foreign currencies, or
otherwise materially and adversely affect our business.
We are required to be in compliance with the
registered capital requirements of the PRC.
Under the
Company Law of the PRC, we are required to contribute a certain amount
of “registered capital” to our wholly owned subsidiary. By
law, our subsidiaries are required to contribute at least 10% of after tax net
income (as determined in accordance with Chinese GAAP) into a statutory surplus
reserve until the reserve is equal to 50% of our and our subsidiaries’
registered capital, and between 5% and 10% of its after tax net income, as
determined by our board of directors, into a public welfare
fund. These reserve funds are recorded as part of shareholders’
equity but are not available for distribution to shareholders other than in the
case of liquidation. As a result of this requirement, the amount of
net income available for distribution to shareholders will be
limited.
Dividends
we receive from our subsidiaries located in the PRC may be subject to PRC
withholding tax.
The PRC’s
Enterprise Income Tax Law (“EIT Law”) provides that an income tax rate of 10%
may be applicable to dividends payable to non-PRC investors that are
“non-resident enterprises.” Non-resident enterprises refer to enterprises which
do not have an establishment or place of business in the PRC, or which have such
establishment or place of business in the PRC but the relevant income is not
effectively connected with the establishment or place of business, to the extent
such dividends are derived from sources within the PRC. The income tax for the
non-resident enterprises shall be subject to withholding at income source with
the payer acting as the obligatory withholder under the EIT Law, and therefore,
such income tax is generally called “withholding tax” in practice. It
is currently unclear in what circumstances a source will be considered as
located within the PRC. As a U.S. holding company and substantially
all of our income will be derived from dividends we receive from our PRC
operating subsidiaries. Thus, if we are considered as a “non-resident
enterprise” under the EIT Law and the dividends paid to us by our PRC operating
subsidiaries are considered income sourced within the PRC, such dividends may be
subject to a 10% withholding tax. No dividends were paid to us by our
PRC operating subsidiaries in 2007, 2008 or 2009.
Deterioration
of the PRC’s political relations with the U.S., Europe, or other nations could
make Chinese businesses less attractive to Western investors.
The
relationship between the U.S. and the PRC is subject to sudden fluctuation and
periodic tension. Changes in political conditions in the PRC and changes in the
state of Sino-foreign relations are difficult to predict and could materially
adversely affect our operations or cause potential target businesses or services
to become less attractive. This could lead to a decline in our profitability.
Any weakening of relations between the U.S., Europe, or other nations and the
PRC could have a material adverse effect on our operations or our ability to
raise additional capital.
The
discontinuation of any of the preferential tax treatments currently available to
the PRC entities could materially increase our tax liabilities.
The rate
of income tax on companies in China may vary depending on the availability of
preferential tax treatment or subsidies based on their industry or location. The
current maximum corporate income tax rate is 33%. The new Enterprise Income Tax
Law became effective as of January 1, 2008, pursuant to which, an enterprise
income tax of 25% applies to any enterprise. Although we were approved by the
local tax authority to be exempted from the enterprise income tax for a
five-year period commencing in 2007 and ending in 2012, we do not know whether
such new law will change the preferential treatment that was granted to us. Any
loss or substantial reduction of the tax benefits enjoyed by us would reduce our
net profit.
Because
PRC law governs almost all of our operating subsidiaries’ material agreements,
we may not be able to enforce our rights within the PRC or elsewhere, which
could result in a significant loss of business, business opportunities or
capital.
PRC law
governs almost all of the material agreements of our subsidiaries. We cannot
assure you that we will be able to enforce any of our material agreements or
that remedies will be available outside of the PRC. The Chinese legal
system is similar to a civil law system based on written statutes. Unlike common
law systems, it is a system in which decided legal cases have little
precedential value. In 1979, the PRC government began to promulgate a
comprehensive system of laws and regulations governing economic matters in
general. The overall effect of legislation since then has been to
significantly enhance the protections afforded to various forms of foreign
investment in the PRC. Certain of our subsidiaries are wholly
foreign-owned enterprises, and are subject to laws and regulations applicable to
foreign investment in the PRC in general and laws and regulations applicable to
wholly foreign-owned enterprises in particular. Relevant PRC laws,
regulations and legal requirements may change frequently, and their
interpretation and enforcement involve uncertainties. For example, we
may have to resort to administrative and court proceedings to enforce the legal
protection that we enjoy either by law or contract. However, since PRC
administrative and court authorities have significant discretion in interpreting
and implementing statutory and contractual terms, it may be more difficult to
evaluate the outcome of administrative and court proceedings and the level of
legal protection we enjoy than under more developed legal
systems. Such uncertainties, including the inability to enforce our
contracts, could materially and adversely affect our business and
operations. In addition, confidentiality protections in the PRC may
not be as effective as in the U.S. or other countries. Accordingly,
we cannot predict the effect of future developments in the PRC legal system,
particularly with respect to financing sectors, including the promulgation of
new laws, changes to existing laws or the interpretation or enforcement thereof,
or the preemption of local regulations by national laws. These
uncertainties could limit the legal protections available to us and other
foreign investors.
26
Our
PRC subsidiaries are obligated to withhold and pay PRC individual income tax on
behalf of our employees who are subject to PRC individual income tax. If we fail
to withhold or pay such individual income tax in accordance with applicable PRC
regulations, we may be subject to certain sanctions and other penalties and may
become subject to liability under PRC laws.
Under PRC
laws, our PRC subsidiaries are obligated to withhold and pay individual income
tax on behalf of our employees who are subject to PRC individual income tax. If
we fail to withhold and/or pay such individual income tax in accordance with PRC
laws, we may be subject to certain sanctions and other penalties and may become
subject to liability under PRC laws.
In
addition, the State Administration of Taxation has issued several circulars
concerning employee stock options. Under these circulars, our employees working
in the PRC (which could include both PRC employees and expatriate employees
subject to PRC individual income tax) who exercise stock options will be subject
to PRC individual income tax. Our PRC subsidiaries have obligations to file
documents related to employee stock options with relevant tax authorities and
withhold and pay individual income taxes for those employees who exercise their
stock options. While tax authorities may advise us that our policy is compliant,
they may change their policy, and we could be subject to sanctions.
Failure
to comply with the U.S. Foreign Corrupt Practices Act could subject us to
penalties and other adverse consequences.
We are
required to comply with the U.S. Foreign Corrupt Practices Act, which generally
prohibits U.S. companies from engaging in bribery or other prohibited payments
to foreign officials for the purpose of obtaining or retaining business. Foreign
companies, including some that may compete with us, are not subject to these
prohibitions, and therefore may have a competitive advantage over us.
Corruption, extortion, bribery, pay-offs, theft and other fraudulent practices
may occur in the PRC. If our competitors engage in these practices
they may receive preferential treatment, giving our competitors an advantage in
securing business, which would put us at a disadvantage. We can make no
assurance that our employees or other agents will not engage in such conduct for
which we might be held responsible. If our employees or other agents are found
to have engaged in such practices, we could suffer severe penalties and other
consequences that may have a material adverse effect on our business, financial
condition and results of operations.
We
face risks related to health epidemics and outbreak of contagious
disease.
Our
business could be materially and adversely affected by the effects of H1N1 Flu,
Avian Flu, Severe Acute Respiratory Syndrome (“SARS”) or other epidemics or
outbreaks. In April 2009, an outbreak of H1N1 Flu first occurred in
Mexico and quickly spread to other countries, including the U.S. and the
PRC. In the last decade, the PRC has suffered health epidemics
related to the outbreak of Avian Flu and SARS. Any prolonged
occurrence or recurrence of H1N1 Flu , Avian Flu, SARS or other adverse public
health developments in the PRC may have a material adverse effect on our
business and operations. These health epidemics could result in
severe travel restrictions and closures that would restrict our ability to ship
our products. Potential outbreaks could also lead to temporary
closure of our manufacturing facilities, our suppliers’ facilities and/or our
end-user customers’ facilities, leading to reduced production, delayed or
cancelled orders, and decrease in demand for our products. Any future health
epidemic or outbreaks that could disrupt our operations and/or restrict our
shipping abilities may have a material adverse effect on our business and
results of operations.
27
Risks Relating to the Market for Our
Common Stock
Our stock price is likely to be highly
volatile.
The trading price of our common stock has been highly volatile.
Failure to meet market expectations in
our financial results could cause our stock price to decline.
Moreover, factors that are not
related to our operating performance could
cause our stock price to decline. The stock market has recently
experienced significant price and volume
fluctuations that have affected the market prices for securities of
technology and communications companies. Consequently, you may experience a
decrease in the market
value of your common stock, regardless of our operating performance or
prospects.
We do not plan to declare or pay any
dividends to our shareholders in the near future and would need regulatory approval to do
so.
We have not declared any dividends in the past, and we do
not intend to distribute dividends in the near future. The declaration, payment and amount of
any future dividends will be made at the discretion of the board of directors
and subject to PRC law, and
will depend upon, among other things, the results of operations, cash flows and financial
condition, operating and capital requirements, and other factors as the board of
directors considers relevant. There is no assurance that
future dividends will be
paid, and if dividends are paid, there is no assurance with respect to the
amount of any such dividend.
We have the right to issue up to
5,000,000 shares of "blank check" preferred stock, which may adversely
affect the voting power of
the holders of other of our securities and may deter hostile takeovers or delay
changes in management control.
Our articles of incorporation provides
that we may issue up to 5,000,000 shares of preferred stock from time to time in one or more
series, and with such rights, preferences and designations as our
board of directors may determinate from time to time. Our board of directors, without further
approval of our common stockholders, is authorized to fix the dividend rights and terms, conversion rights, voting rights, redemption rights, liquidation preferences and other
rights and restrictions relating to any series
of our preferred stock. Issuances of shares of
preferred stock could, among other things,
adversely affect the voting power of the holders of other of our securities and
may, under certain circumstances, have the effect of deterring hostile takeovers
or delaying changes in management control. Such an issuance would dilute existing
stockholders, and the securities issued could have rights, preferences and designations superior to our common
stock.
Sales of our common stock may have an
adverse effect on the market price of our common stock. Additionally, we
may issue shares upon exercise of outstanding warrants that are exercisable at prices that are
below current market prices
which will be dilutive to the common stock.
As of March 15, 2010, we had 16,790,851 shares of common stock outstanding, many of which are
freely transferable under
Rule 144. The sale of these shares may have an
adverse effect on the market price for our common stock.
In addition, as of March 15, 2010, we had issued and outstanding warrants to purchase an aggregate of
593,800 shares of our common stock, which are
exercisable at a price of
$12.50 per share. Our issuance of additional shares of
common stock upon exercise of our outstanding warrants will reduce the percentage equity ownership of
holders of shares of our common stock. Further, the exercise of a
significant number of warrants, and subsequent sale of shares of
common stock received upon such exercise, could cause a sharp
decline in the market price
of our common stock.
FORWARD-LOOKING
STATEMENTS
Some of the statements contained in this report are not statements of historical or current fact.
As such, they are "forward-looking
statements" based on our current expectations, which are subject to known and
unknown risks, uncertainties and assumptions. They include statements relating to:
|
·
|
future sales and
financings;
|
28
|
·
|
the future development of our
business;
|
|
·
|
our ability to execute our business
strategy;
|
|
·
|
projected expenditures;
and
|
|
·
|
the market for our
products.
|
You can identify forward-looking
statements by terminology such as "may," "will,"
"should," "could," "expects," "intends," "plans," "anticipates,"
"believes," "estimates," "predicts," "potential" or "continue" or the
negative of these terms or other comparable terminology. These statements are not predictions. Actual
events or results may differ materially from those
suggested by these forward-looking
statements. In evaluating these
statements and our prospects generally, you should carefully
consider the factors set forth below. All forward-looking
statements attributable to us or persons acting on
our behalf are expressly qualified in their entirety by these cautionary factors and to others
contained throughout this
prospectus. We are under no duty to update any of the forward-looking
statements after the date of this prospectus or to
conform these statements to actual results.
Although it is not possible to create a comprehensive
list of all factors that may cause actual results to differ from the results expressed or implied by our forward-looking
statements or that may affect our future
results, some of these factors are set forth under "Risk Factors" in
this
report.
29
Item.
1B. Unresolved Staff Comments.
None.
Item
2. Properties.
Under Chinese law, the government owns
all of the land in the PRC and companies and individuals are
authorized to use the land only through land use rights granted by the PRC government.
Our manufacturing facilities are located in the cities of Harbin and Peng Lai in the PRC. These facilities are operated in accordance with GMP. We own these facilities and are not subject to costs associated under rental or lease
obligations.
In
January 2010, we completed the construction of two office buildings and TDR and
Haina moved into these new facilities, located in Song Bei District of Harbin
City, Heilongjiang Province, PRC. It is anticipated that residual
work, including road construction, fire control equipment, amenity
improvement, and final acceptance, will be completed on these facilities in the
third quarter of 2010, at an additional cost of approximately $3.0 million. We
own these facilities and are not subject to costs associated under rental or
lease obligations.
A breakdown of our facilities by
subsidiary is as follows:
|
|
Subsidiaries
Facilities as of March 15, 2010, in Square Meters
|
|||
|
|
TDR
|
First
|
Tianlong
|
Peng
Lai
|
|
Land
Area
|
35,000
|
40,000
|
15,000
|
40,000
|
|
Expiration
Year
|
2058
|
2054
|
2051
|
2056
|
|
Production,
Warehouse, and Office
|
14,000
|
10,000
|
9,000
|
12,000
|
At this time, our subsidiaries Haina and Tian Qing use an insignificant portion
of our facilities.
Item 3. Legal
Proceedings.
We are not a party to any
material pending legal
proceedings.
Item 4. Reserved.
30
PART II
Item 5. Market for Common
Equity, Related Stockholder Matters and Small Business
Issuer Purchases of Equity Securities.
Market Information
Until May
28, 2008, our common stock was traded on FINRA’s Over-the-Counter Bulletin Board
under the trading symbol “CSKI.” On May 28, 2008, our common stock
commenced trading on the American Stock Exchange under the trading symbol
“CSY.” As of September 14, 2008, we terminated our listing on the
American Stock Exchange and became listed on the Nasdaq Global Market under the
trading symbol “CSKI.” Effective as of January 4, 2010, we
qualified to be listed on Nasdaq Global Select
Market. The high
and low sales prices for our common stock in
the fiscal years of 2009 and 2008 are as follows:
|
Year Ended December 31, 2009
|
Year Ended December 31, 2008
|
|||||||||||||||
|
High
|
Low
|
High
|
Low
|
|||||||||||||
|
1st Quarter
|
$ | 19.11 | $ | 10.03 | $ | 14.00 | $ | 9.40 | ||||||||
|
2nd Quarter
|
$ | 17.80 | $ | 10.21 | $ | 17.10 | $ | 9.50 | ||||||||
|
3rd Quarter
|
$ | 16.80 | $ | 12.00 | $ | 14.99 | $ | 9.00 | ||||||||
|
4th Quarter
|
$ | 25.45 | $ | 11.02 | $ | 16.28 | $ | 6.29 | ||||||||
On March 15, 2010, the closing price for our common stock was
$17.24.
Dividends
Since inception, no dividends have been
paid on our common stock. We intend to retain any earnings for use
in our business, so it is not expected that any dividends on the common stock
will be declared and paid in the foreseeable
future. We do not currently have any
restrictions that would limit our ability to pay dividends, and we are not
currently aware of any restrictions that are likely to limit our ability to pay
dividends in the future.
Holders
At March 15, 2010, there were 381 holders of record of our common stock,
with 16,790,851 shares issued and outstanding. Such number of record owners was
determined from our shareholder records and
does not include beneficial owners whose shares are held in
nominee accounts with brokers, dealers, banks and
clearing agencies.
Securities Authorized For Issuance Under Equity Compensation
Plan
As of
December 31, 2009, we had only one stock option, bonus, profit sharing, pension
or similar plan in place, which is our 2006 Stock Incentive Plan (the
“Plan”). The Plan reserves an aggregate of 1,500,000 shares of our
common stock for awards of stock options, stock appreciation rights, restricted
stock, performance stock and bonus stock granted thereunder. The
following table provides information as of December 31, 2009 with respect to the
shares of our common stock that may be issuable under our existing equity
compensation plans:
31
Equity Compensation Plan
Information
|
(a)
|
(b)
|
(c)
|
||||||||||
|
Plan
Category
|
Number
of securities
to
be issued upon
exercise
of
outstanding
options,
warrants
and rights
|
Weighted-
average
exercise
price
of
outstanding
options,
warrants
and
rights
|
Number
of
securities
remaining
available
for future
issuance
under
equity
compensation
plans
(excluding
securities
reflected
in
column (a))
|
|||||||||
|
Equity
compensation plans approved by security holders (1)
|
0 | $ | - | 1,273,593 | (3) | |||||||
|
Equity
compensation plans not approved by security holders (2)
|
0 | N/A | 0 | |||||||||
|
Total
|
0 | $ | - | 1,273,593 | ||||||||
|
|
(1)
|
Our
board of directors adopted the 2006 Stock Incentive Plan (the “Plan”), to
be effective on July 31, 2006. The Plan was approved by the
shareholders on July 31, 2006.
|
|
|
(2)
|
We
do not have any equity compensation plans not approved by the security
holders.
|
|
|
(3)
|
The
Plan reserves an aggregate of 1,500,000 shares of our common stock for
awards of stock options, stock appreciation rights, restricted stock,
performance stock and bonus stock granted thereunder. We have
issued the following securities under the
Plan:
|
(a) In
October 2006, we granted stock options to purchase an aggregate of 113,500
shares of common stock to a total of 36 participants under the
Plan. In May 2009, an aggregate of 101,000 of these stock options
were exercised on a “cashless” basis by 36 participants, resulting in our
issuance of an aggregate of 75,888 shares. In August 2009, the
remaining 12,500 of these stock options were exercised on a
“cashless” basis by 9 participants, resulting in our issuance of an aggregate of
9,407 shares.
(b) In
April 2007, we issued an aggregate of 30,000 shares of restricted stock to a
total of 200 individuals under the Plan.
(c) In
July 2008, we issued an aggregate of 30,063 shares of restricted stock to a
total of 27 individuals under the Plan.
(d) In
December 2009, we issued an aggregate of 52,844 shares of restricted stock to a
total of 11 individuals under the Plan.
Recent
Sales of Unregistered Securities
The following is a list of certain
securities we sold or issued during fiscal 2008. There were no underwriting
discounts or commissions paid in connection with
the sale of these securities, except as otherwise noted. Certain information previously included in prior Exchange Act reports we filed has not been furnished in this report.
As of December 26, 2009, we
issued 52,844 “restricted” shares of our common stock to certain
employees, executive
officers and directors of ours as consideration for services pursuant to our
2006 Stock Incentive Plan.
We
believe the issuance of these shares was exempt from registration under the
Securities Act of 1933, as amended, pursuant to Section 4(2) and/or Regulation D
promulgated thereunder, as a transaction by an issuer not involving a public
offering.
32
Item
6. Selected Financial Data.
Key financial data from the fiscal
years ended December 2005 to 2009 is set
forth in the following
table.
|
|
For
the Years Ended December 31,
($
in thousands, except per share data)
|
||||
|
|
2009
|
2008
|
2007
|
2006
(as restated)
|
2005
|
|
Operating
Data:
|
|
|
|
|
|
|
Revenues
|
$130,092
|
$91,816
|
$49,318
|
$19,882
|
$7,712
|
|
Cost
of Goods Sold
|
31,671
|
22,403
|
10,940
|
5,063
|
2,214
|
|
Gross
Profit
|
98,421
|
69,413
|
38,379
|
14,819
|
5,498
|
|
Selling
expense
|
30,763
|
22,968
|
14,784
|
9,894
|
2,540
|
|
General
and administrative expense
|
4,191
|
2,514
|
1,380
|
844
|
735
|
|
Research
and development
|
14,960
|
7,413
|
3,158
|
2,027
|
64
|
|
Income
from Operations
|
46,251
|
35,659
|
18,614
|
1,932
|
2,462
|
|
Other
Income (Expense)
|
(1,291)
|
814
|
38
|
(228)
|
(18)
|
|
Provision
for income taxes
|
10,503
|
7,616
|
3,319
|
1,080
|
356
|
|
Net
Income
|
$34,457
|
$28,857
|
$15,333
|
$624
|
$2,089
|
|
Basic
Earnings Per Share
|
$2.08
|
$1.91
|
$1.27
|
$0.05
|
$0.19
|
|
Diluted
Earnings Per Share
|
$2.07
|
$1.87
|
$1.15
|
$0.05
|
$0.19
|
|
Balance
Sheet Data:
|
|
|
|
|
|
|
Total
Assets
|
$140,363
|
$101,259
|
$37,285
|
$16,681
|
$8,992
|
|
Total
current liabilities
|
9,389
|
6,326
|
5,040
|
2,370
|
1,641
|
|
Working
Capital
|
67,000
|
49,509
|
15,447
|
7,798
|
2,858
|
|
Stockholder's
Equity
|
$130,974
|
$94,933
|
$32,245
|
$14,311
|
7,351
|
|
Other
Data:
|
|
|
|
|
|
|
Net
cash provided by operating activities
|
$33,449
|
$27,538
|
$11,601
|
$5,183
|
1,090
|
|
Net
Cash used in investing activities
|
($21,154)
|
($23,115)
|
($10,261)
|
($4,597)
|
(776)
|
|
Net
Cash provided by (used in) financing activities
|
$29
|
$25,355
|
($33)
|
($2,931)
|
591
|
33
Item
7. Management’s Discussion and Analysis of Financial
Condition and Results of Operation.
The financial and business analysis in
this Annual Report on Form 10-K (the “Report”) provides information we believe is
relevant to an assessment and understanding of our financial condition and
results of operations. The following discussion
should be read in conjunction with our consolidated financial statements and related notes included in Part II, Item 8 of this
Report.
FORWARD LOOKING
STATEMENTS
The following discussion should be read
in conjunction with the information contained in our consolidated financial statements and the notes thereto appearing
elsewhere herein and in the risk factors and “Forward Looking Statements” summary set forth in the forepart of
this Annual Report as well as the “Risk Factors” section above and are
afforded the safe harbor provisions of Section
27A of the Securities Act and Section 21E
of the Securities Exchange Act of 1934, as amended. Readers should carefully review the
risk factors
disclosed in this Annual Report and other
documents filed by us with the SEC.
DISCUSSION
We are engaged, through our China-based indirect subsidiaries
described below, in the development, manufacture,
marketing and sale of over-the-counter, branded nutritional supplements and over-the-counter plant and
herb-based pharmaceutical and medicinal products. Our principal
products are external use TCMs. We have
evolved into an integrated manufacturer, marketer and distributor
of external-use TCM products sold primarily in the PRC and through
Chinese domestic pharmaceutical chains. Recently, we have been
expanding our worldwide
sales effort as well. Prior to 2009, we sold both our own
manufactured products, as well as medicinal and pharmaceutical
products manufactured by others on a contract basis,
categorized by us as Contract Sales. Commencing in 2009, we
discontinued all of our Contract Sales as part of our revised strategic plan.
In 2009, we achieved continued growth on the sale of our own
product line through our
sustained efforts to expand our distribution channels and
promote our products. For the year ended December 31, 2009, total
revenues were $130,092,000, compared to $91,816,000 and $49,318,000 for the years ended December 31, 2008 and 2007, respectively. Net income was $34,457,000, or $2.07 per
share, in 2009, compared to net income of $28,857,000,
or $1.87 per
share, in the 2008, and net income of $15,333,000, or $1.15 per share, in 2007, as calculated on a diluted basis for all periods presented.
All of our business is
conducted through our wholly-owned subsidiary, ACPG which, in turn, wholly owns Harbin
TDR, and TDR’s subsidiaries.
Recent
Developments
On April 3, 2008, TDR
completed its acquisition of Tianlong, a company that had a variety of medicines approved by the SFDA and new medicine applications, and which
was in the business of manufacturing
external-use pharmaceuticals. TDR previously acquired the Beijing sales office of Tianlong in
mid-2006. In connection with this transaction, TDR acquired 100% of the issued and outstanding capital stock of Tianlong from
its sole stockholder, in consideration for
an aggregate purchase price of approximately $8,300,000, consisting of
$8,000,000 in cash, and 23,850 shares of our common stock
(valued at $12.00 per
share).
On April 18, 2008, TDR
consummated its acquisition of Haina,
licensed as a wholesaler of TCM,
bio-products, medicinal devices, antibiotics and chemical
medicines. Haina did not have an
established sales network and was
acquired for its primary asset, a GSP license
issued by the Heilongjiang Province office of the SFDA. The SFDA
only issues such licenses
to pharmaceutical resellers that maintain certain quality control
standards. The GSP license was issued as of December 21, 2006 and will expire
on January 29, 2012. This GSP license has enabled us to expand our sales of medicinal products without having to go through a lengthy
license application process. In connection with this transaction, TDR
acquired 100% of the issued and outstanding capital stock of Haina from
its three stockholders in consideration for payment of
approximately $437,000.
On
September 5, 2008, TDR acquired Peng Lai, from Peng Lai Jin Chuang Group
Corporation. Peng Lai, which has received Good Manufacturing Practice
(“GMP”) certification from the SFDA, was organized to develop, manufacture and
distribute pharmaceutical, medicinal and diagnostic products in the
PRC. In connection with this transaction, TDR acquired all of Peng
Lai’s assets, including, without limitation, franchise, production and operating
rights to a portfolio of twenty (20) medicines approved by the SFDA, for an
aggregate purchase price of approximately $7,000,000 million, consisting of
approximately $2,500,000 million in cash, and 381,606 shares of our common stock
(valued at $12.00 per share).
34
Trends
and Uncertainties
In 2008, general worldwide economic
conditions declined due to sequential effects of the sub prime lending crisis,
general credit market crisis, collateral
effects on the finance and banking industries,
concerns about inflation, slower economic activity, decreased consumer confidence, reduced corporate profits and capital spending, adverse business
conditions and liquidity concerns. However, since all of our business
operations, and most of our sales, are currently conducted in the PRC, we have not been greatly
affected by the economic
downtown.
We have benefited from the overall economic development
in the PRC in recent years and the increase in the number of elderly people in
China, which together have resulted in increased expenditures on medicine in the PRC, including
TCMs.
In fiscal 2007, our sales model was
focused on the creation of our own distribution
channels. Therefore, we sold products directly to many smaller distributors
and retail store locations. In fiscal 2008, we changed our business model and
entered into distribution agreements with larger regional sales
agents, who resell to smaller distributors and
retail store locations. In addition, we entered into contracts with nationwide chain
pharmacies, such as
Nepstar, Tong Ren Tang, Jin Xiang, and Ren Min Tong Tai. Through the extensive sales networks of
these nationwide chains, we are able to reach all major metropolitan areas
throughout the PRC. These changes to our product
distribution channels resulted in our direct customer base
decreasing from 943 customers at December 31, 2007 to 212 customers at
December 31, 2009.
Our change of sales strategy in fiscal
2008 was initiated to improve product channel
efficiencies, and to give us access to an increased number of ultimate purchasers.
We believe that these changes will lead
to further increased revenue by extending the reach of
its distribution network. We also believe that, by reducing the number of customers we sell to
directly, we will be able
to streamline our accounts receivable management and collection,
and reduce channel distribution costs. These favorable cost variances are
expected to be partially offset by product price
incentives we grant to the larger agents with which we have contracted.
In fiscal
2007, 26.4% of our total revenues, or $12,998,000, was attributable to sales of
other manufacturers’ products through Contract Sales. One of the main
manufacturers for which we resold products was Tianlong. On April 3,
2008, we acquired Tianlong and were able to fully integrated Tianlong’s
products, which we had been previously selling on a contract basis, into our
marketing and distribution channels. Following the acquisition of
Tianlong we continued to phase out our Contract Sales and, as of the end of
fiscal 2008, we no longer sell other company’s products on a contract
basis.
Historically,
we signed agreements with suppliers that allowed us to hold extra raw materials
at the cost of the suppliers. As a result, we were able to minimize
our own inventory carrying costs, and improve our cash management, by keeping
the inventory at the minimum level required to support the short-term
sales. However, due to the forecasts for certain cost increases of
raw materials in fiscal 2010, we began to increase our inventory levels toward
the second half of 2009.
35
Results of Operations
For
the years ended December 31, 2009, 2008 and 2007
Revenue, Cost of Goods Sold Gross
Profit and Gross Profit Margin
The following table sets forth our revenues, cost of goods sold,
gross profit and gross profit margin
during the fiscal
years ended December 31, 2009, 2008, and
2007:
|
For the Years Ended December
31,
($ in
thousands)
|
|||||
|
|
2009
|
Variance
|
2008
|
Variance
|
2007
|
|
Revenues
|
|
|
|
|
|
|
Product Sales (net of sales
allowance)
|
$130,092
|
51%
|
$86,161
|
137%
|
$36,320
|
|
Contract
Sales
|
0
|
-
|
5,655
|
(57%)
|
12,998
|
|
Total Revenues
|
$130,092
|
42%
|
$91,816
|
86%
|
$49,318
|
|
|
|
|
|
|
|
|
Cost of Goods
Sold
|
|
|
|
|
|
|
Cost of goods
sold
|
31,671
|
41%
|
22,403
|
105%
|
10,940
|
|
Gross
Profit
|
$98,422
|
42%
|
$69,413
|
81%
|
$38,378
|
|
Gross Profit
Margin
|
75.7%
|
75.6%
|
77.8%
|
||
Year over year – 2009 to 2008
Total
revenues increased by approximately $38,276,000, or 42%, from approximately
$91,816,000 in the fiscal year ended December 31, 2008, to approximately
$130,092,000 for the fiscal year ended December 31, 2008. The increase in our revenues is primarily attributable to increase in our product sales
related to:
|
·
|
strong performances from
our sales
distribution channels, obtained by our hiring of additional direct territory
managers and sales
agents;
|
|
·
|
our efforts to locate and cooperate with more
reputable
distributors for certain of our products;
|
|
·
|
the increase in marketing and
advertising expenditures of approximately $7,228,000, or
99%, from approximately $7,299,000 in fiscal 2008 to approximately
$14,527,000 in fiscal 2009;
and
|
|
·
|
the full-year effect of sales of
products of Tianlong, which generated
approximately
$43,138,000 and
approximately $13,803,000 in 2009 and 2008,
respectively, and Peng Lai, which generated approximately
$11,188,000 and
approximately
$2,164,000 in 2009
and 2008, respectively, two of the businesses we acquired in fiscal
2008.
|
The increase in our product sales
were partially offset by
our discontinuance of all Contract Sales in fiscal 2009, which we began to phase out in fiscal
2008.
Cost of goods sold increased by approximately $9,268,000, or 41%,
to approximately $31,671,000 in fiscal 2009 compared to
the prior year.
This increase
was directly related to an increase in sales.
Gross profit increased by
42%, from approximately $69,413,000 in 2008 to approximately $98,422,000 in 2009. Our gross margin remained constant at approximately
76%.
36
Year over year – 2008 to 2007
Total revenues increased by
approximately $42,498,000, or 86%, from approximately $49,318,000 in the fiscal
year ended December 31, 2007, to approximately $91,816,000 for the fiscal year
ended December 31, 2008. The increase in revenue is
primarily attributable to strong performances from our sales distribution
channels, and our sales of
products of Tianlong and Peng Lai, which we
acquired in fiscal 2008.
Product
sales increased by 137% in the year ended December 31, 2008, to approximately
$86,161,000 from approximately $36,320,000 in 2007. This growth in
sales is attributable to volume and our efforts to continue to develop our
distribution channels by hiring additional direct territory managers and sales
agents to assure that our products and their associated benefits are seen by
those making or influencing the purchasing decisions, and our sales of products of Tianlong and Peng Lai, which we
acquired in fiscal 2008.
Contract
sales of non-manufactured products amounted to approximately $5,655,000 in the
year ended December 31, 2008, or a significant decrease of approximately
$7,343,000 from sales of approximately $12,998,000 in 2007.
In 2007,
our sales model was focused on the creation of our own distribution
channels. Therefore, we sold products directly to many smaller
distributors and retail store locations. In 2008, we changed our
business model and entered into distribution agreements with larger regional
sales agents, which resell to smaller distributors and retail store
locations. In addition, we began entering into contracts with
nationwide chain pharmacies. In 2008, TDR began to discontinue
contract sales as part of its strategic goals.
Our
change of sales strategy in fiscal 2008 was initiated to improve product channel
efficiencies, and to give us access to an increased number of ultimate
purchasers. We believe that these changes will lead to further
increased revenue by extending the reach of our distribution
network. We also believe that, by reducing the number of customers we
sell to directly, we will be able to streamline our accounts receivable
management and collection, and reduce channel distribution
costs. These favorable cost variances are expected be partially
offset by product price incentives we grant to the larger agents with which we
have contracted.
Cost of
goods sold increased by approximately $11,464,000, or 105%, from approximately
$10,940,000 in the year ended December 31, 2007, to approximately $22,403,000
for the year ended December 31, 2008, as a direct result of increased sales
activities, partially offset by a higher gross margin on our sales of Tianlong
products following the acquisition in April 2008. Overall, our product gross
margins decreased slightly to 76% for the year ended December 31, 2008 from 78%
for the year ended December 31, 2007. From January 1, 2008 thought April 2,
2008, revenues from Tianlong contract sales were approximately $1,477,000, and
gross profit from these sales were approximately $1,173,000. The gross margin
from these sales were approximately 79.4%, After our acquisition of Tianlong,
revenues from sales of Tianlong products were approximately $13,803,000, and
gross profit from these sales were approximately $12,298,000. The gross margin
from these sales was approximately 89.1%. This increase in gross margin from
sales of Tianlong’s products following the acquisition was offset by the
decrease in gross margins related to sales of certain TDR’s products due to our
reduction in the sales prices of certain of our products to be competitive in
the PRC market.
37
Sales
by Product Line
We believe that the most meaningful presentation of our
products is by categories of method of
delivery. The following
table sets forth our principal product categories
based on application type, and the approximate amount and
percentage of revenue from each of such product categories, during each of the fiscal years ended December 31, 2009, 2008, and
2007:
|
For the Years Ended December
31,
($ in
thousands)
|
||||||
|
2009
|
2008
|
2007
|
||||
|
Product Category
|
Sales
|
% of Sales
|
Sales
|
% of Sales
|
Sales
|
% of Sales
|
|
Patches
|
$40,770
|
31.3%
|
$35,484
|
38.6%
|
$19,609
|
39.9%
|
|
Ointments
|
28,862
|
22.2%
|
23,068
|
25.1%
|
3,270
|
12.6%
|
|
Sprays
|
$18,499
|
14.2%
|
10,613
|
11.6%
|
8,742
|
18.7%
|
|
Diagnostic Kits
|
10,239
|
7.9%
|
8,781
|
9.6%
|
2,994
|
6.1%
|
|
Contract
Sales
|
$0
|
0.0%
|
5,655
|
6.2%
|
12,998
|
16.6%
|
|
Others
|
31,722
|
24.4%
|
8,215
|
8.9%
|
1,705
|
6.2%
|
|
Total
|
$130,092
|
100.0%
|
$91,816
|
100.0%
|
$49,318
|
100.0%
|
Year over year – 2009 to 2008
During the fiscal year ended December 31, 2008, we
acquired Tianlong (April 2008), Haina
(April 2008) and Peng Lai (September 2008). Our revenues
increased in 2009 compared to 2008, primarily due to our cooperation with more reputable
sales agents and distributors, which have been able
to put our products in more extensive sales
networks, and the full-year effect of sales of
products of Tianlong and Peng Lai, two of the
businesses we acquired in fiscal 2008. As a result of signing agreements with these distributors, the sales
revenues for
products in the patches, sprays, and diagnostic
kits categories increased 14.9%, 74.3%, and 16.6% year over year. The revenue increase of approximately $5,794,000 in the ointment category, and the revenue increase of
approximately $23,507,000 in other products category, are primarily due to our increased
spending in marketing and
advertising for certain
products in these categories. Tianlong’s products generated approximately $43,138,000 and $13,803,000 in 2009 and 2008,
respectively. Revenue generated by Tianlong’s products are included in the ointment, spray and
other product categories. Peng Lai’s products generated approximately $11,188,000 and $2,164,000 in 2009 and 2008,
respectively. Revenue generated by Peng Lai’s products are included in the other product category.
These
increases were partially offset by a decrease in our contract sales of
approximately $5,655,000, due to our discontinuance of all contract sales as of
January 1, 2009.
Out of the 91 products we commercialized in fiscal year 2009, 10 products accounted for approximately 68% of the total
revenue. Out of the 97 products we commercialized in fiscal year 2008, 10
products accounted for approximately 72% of total revenue.
Year over year – 2008 to 2007
Our increase in revenues in 2008 as compared to 2007 was due to a combination of our sale of
products of Tianlong and Peng Lai, two of the
businesses we acquired in fiscal 2008, as well as our internal growth driven by increases in the revenues of
TDR and First.
Our
internal growth was driven by increases in the revenues of TDR, which increased
from $33,326,000 in 2007 to $60,078,000 in 2008 and First, which increased from
approximately $2,994,000 in 2007 to approximately $8,781,000 in
2008. These increases were partially offset by a decrease in our
contract sales of approximately $7,358,000, or 57% from approximately
$12,998,000 in fiscal 2007 to approximately $5,640,000 in fiscal 2008, due
primarily to our discontinuance of contract sales of Tianlong products following
the acquisition of Tianlong as of April 3, 2008.
38
In 2008,
before TDR acquired Tianlong, the majority of our contracts sales consisted of
products purchased from Tianlong. In 2008, TDR began to discontinue contract
sales, and in 2009, TDR discontinued contract sales as part of its strategic
goals and, in 2009 TDR discontinued contact sales. Revenues derived from the
sale of a Tianlong product of approximately $4,805,000 and approximately
$1,477,000 for 2007 and 2008 respectively, have been reallocated to each of the
appropriate product categories to present a more appropriate measure of our
revenues by product line.
Following
the Tianlong acquisition, we were able to fully integrate Tianlong’s products
into our marketing and distribution channels and increase overall
sales. As a result, we derived an aggregate of approximately
$13,803,000 from the sale of Tianlong’s products for the remainder of 2008, in
addition to approximately $1,447,000 of contract sales of Tianlong’s products
from January 1, 2008 through the Tianlong acquisition.
Prior to
our acquisition of Peng Lai, as of September 5, 2008, Peng Lai had nominal
production and operations. Following the acquisition, Peng Lai
contributed revenue of approximately $2,164,000 to our total revenue in
2008.
Haina did not have an established sales network and was
acquired only for its GSP license.
Operating Expenses
The following table summarizes the changes in our operating
expenses for the
years ended December 31, 2009, 2008 and 2007:
|
For the Years ended December
31,
($ in
thousands)
|
|||||
|
|
2009
|
Variance
|
2008
|
Variance
|
2007
|
|
Operating
Expenses
|
|
|
|
|
|
|
Selling expense
|
$30,763
|
34%
|
$22,969
|
55%
|
$14,784
|
|
General and administrative expense
|
4,191
|
67%
|
2,514
|
82%
|
1,380
|
|
Depreciation and
amortization
|
2,255
|
163%
|
858
|
94%
|
443
|
|
Research and
development
|
14,960
|
102%
|
7,413
|
135%
|
3,158
|
|
Total operating
expenses
|
$52,170
|
55%
|
$33,754
|
71%
|
$19,765
|
|
Percentage of operating expenses
to revenue
|
40.1%
|
|
36.8%
|
|
40.1%
|
Year over year – 2009 to 2008
Total
operating expenses increased by approximately $18,416,000, or 55%, from
approximately $33,754,000 in the fiscal year ended December 31, 2008, to
approximately $52,170,000 for the fiscal year ended December 31,
2009.
Selling expenses increased by approximately $7,794,000 in 2009 compared with 2008. This increase was primarily related to increased costs of advertising from approximately $7,299,000 in 2008 to approximately $14,527,000 in 2009, resulting from our increased marketing
and sales efforts.
General and administrative expenses
for the year
ended December 31, 2009 increased approximately $1,677,000, or 67%, compared with 2008. This increase was primarily due to an expense for share based compensation, of approximately $1,242,000, for shares we issued in December
2009.
Depreciation and amortization expenses
in 2009 increased by approximately $1,397,000, or 163%, compared with 2008. This increase
was primarily due
to:
|
·
|
the amortization of certain
proprietary technologies we acquired in the fourth quarter
of fiscal 2008, in
the amount of approximately $6.6 million, which are amortized over a period of 10 years;
and
|
|
·
|
the full year effect of
depreciation and amortization of tangible and intangible
assets we acquired in the business
acquisitions we consummated in fiscal 2008, in the amount of approximately
$15.7 million.
|
39
Research
and development expenses were approximately $14,960,000 in the year ended
December 31, 2009, compared to approximately $7,413,000 for 2008. The
increased R&D expenses in 2009 were primarily due to our research and
development of certain proprietary technologies. Set forth below is a
table of our major research and development projects, respective stage of
development and applicable expenses for 2009:
|
Major Research and
Development Expenses
in Fiscal 2009
($ in thousands)
|
|||
|
Projects
|
Stage
|
Expenses
|
% of total
R&D
|
|
Diagnostic Kits - 6 products
|
Clinical
trial
|
$2,727
|
18.2
|
|
Injections - 6 projects
|
Clinical
trial
|
1,944
|
13
|
|
Breast Cancer
Technology
|
Efficacy testing, Acute and Long Term
Toxicity testing
|
2,272
|
15.2
|
|
Patches - 4 products
|
Extraction optimization
testing
|
1,820
|
12.2
|
|
Monoclonal
Antibody
|
Completed
|
965
|
6.5
|
|
Endostatin
|
Efficacy testing, Acute and Long Term
Toxicity testing
|
439
|
2.9
|
|
Antroquinonol
|
Clinical
trial
|
387
|
2.6
|
|
Radix Isatidis granule and
syrup
|
Production process
optimization
|
282
|
1.9
|
|
Naftopidil Dispersible
tablets
|
Production process
optimization
|
256
|
1.7
|
|
Sertraline Hydrochloride
capsules
|
Production process
optimization
|
$249
|
1.7
|
|
Total
|
|
$11,341
|
75.8
|
Year over year – 2008 to 2007
Total
operating expenses increased by approximately $13,989,000, or 71%, from
approximately $19,765,000 in the fiscal year ended
December 31, 2007, to approximately $33,754,000 for the fiscal year ended
December 31, 2008.
Selling expenses increased by approximately $8,185,000 in 2008 compared with 2007. The higher selling expenses are primarily related to
|
·
|
increased costs of advertising, from approximately $4,385,000 in 2007, to approximately $7,299,000 in 2008;
and
|
|
·
|
increased sales commissions resulting from
our
increased revenues.
|
General and administrative expenses
for the year
ended December 31, 2008 increased approximately $1,134,000, or 82%, over the 2007. The higher general and administrative
expenses are primarily due to the increases in salaries and other administrative
expenses resulting from the business acquisitions we made in
fiscal 2008. In 2008, we recorded share-based
compensation expense of $316,000, as compared to $235,000 in
2007
Depreciation and
amortization in
2008 increased by approximately $415,000 compared 2008. The higher depreciation and amortization
expenses are primarily due to the increased tangible and intangible
assets we acquired through the business acquisitions we consummated in 2008.
We
conduct our research and development activities both internally and through
collaborative arrangements with universities and research
institutions. Our research and development expenses were
approximately $7,413,000 in the year ended December 31, 2008, compared to
approximately $3,158,000 in the year ended December 31, 2007. The increased R&D expenses in 2008 were primarily due to our taking over of the ongoing research
and development
projects in Tianlong and Peng Lai because of
these two acquisitions.
40
Historically,
our internal research and development activities have been conducted at our
research, development and laboratory facilities located at the principal
business offices of its wholly-owned subsidiary, TDR. In 2007, our
research and development projects consisted of a total of eight diagnostic kits.
These bio-engineering projects were conducted by TDR’s wholly-owned subsidiary,
First. In 2008, we spent an immaterial amount on research and
development for these eight products, of which:
|
·
|
we
received approval by the SFDA of our Ovulation Diagnostic
Kit;
|
|
·
|
our
Prostate Cancer Diagnostic Kit and Urine Micro-Albumin Colloid Gold
Diagnostic Kit were submitted to the SFDA for approval;
and
|
|
·
|
the
remaining five products were undergoing long-term stability testing while
we provided supplemental documentation to the SFDA for these
projects.
|
As
previously discussed, in fiscal 2008 we acquired Tianlong and Peng
Lai. As a result, we had 47 projects in development in fiscal
2008. Set forth below is a table of our research and development
expenses for 2008, classified by product category and stage of
development:
|
Stage
of Development by Number of Projects and U.S. Dollar Amount
($
in thousands)
|
||||||||
|
Category
|
Application
and
Efficacy
|
Acute
and Long Term Toxicity
|
Long
Term Stability
|
Pending
SFDA Approval
|
Supplemental
Documentation
|
SFDA
Approval
|
TOTAL
|
|
|
Bio-Engineering
(a)
|
#
|
1
(b)
|
1
(c)
|
13
|
2
|
-
|
1
|
18
|
|
$
|
$948
|
$1,192
|
$2,261
|
-
|
-
|
-
|
$4,401
|
|
|
Eye
Drops
|
#
|
-
|
-
|
-
|
-
|
-
|
2
|
2
|
|
$
|
-
|
-
|
-
|
-
|
-
|
$103
|
$103
|
|
|
Nasal
Drops
|
#
|
-
|
-
|
-
|
-
|
-
|
1
|
1
|
|
$
|
-
|
-
|
-
|
-
|
-
|
$61
|
$61
|
|
|
Injections
|
#
|
-
|
-
|
-
|
1
|
-
|
4
|
5
|
|
$
|
-
|
-
|
-
|
$104
|
-
|
$510
|
$614
|
|
|
Spray
|
#
|
-
|
-
|
-
|
1
|
-
|
-
|
1
|
|
$
|
-
|
-
|
-
|
$139
|
-
|
-
|
$139
|
|
|
Ointment
|
#
|
-
|
-
|
-
|
1
|
1
|
1
|
3
|
|
$
|
-
|
-
|
-
|
$112
|
$90
|
$115
|
$317
|
|
|
Suppository
|
#
|
-
|
-
|
-
|
3
|
4
|
2
|
9
|
|
$
|
-
|
-
|
-
|
$273
|
$352
|
$217
|
$841
|
|
|
Gel
|
#
|
-
|
-
|
-
|
-
|
2
|
2
|
4
|
|
$
|
-
|
-
|
-
|
-
|
$293
|
$136
|
$429
|
|
|
Liquid
|
#
|
-
|
-
|
-
|
2
|
2
|
-
|
4
|
|
$
|
-
|
-
|
-
|
$209
|
$210
|
-
|
$419
|
|
|
TOTAL
|
#
|
1
|
1
|
13
|
10
|
9
|
13
|
47
(d)
|
|
$
|
$948
|
$1,192
|
$2,261
|
$837
|
$944
|
$1,142
|
$7,324
(e)
|
|
(a) Bio-engineering
projects include our Endostatin cancer treatment drug, breast cancer drug and
diagnostic kits. The diagnostic kits are designed for testing for
different cancers and viruses, such as prostate cancer, stomach cancer, ovarian
cancer, rectal cancer, liver cancer, Hepatitis B and C, human papilloma virus
and mycoplasma virus. Diagnostic kits accounted for approximately
30.5% of total R&D expenditures in 2008.
(b) In
fiscal 2008, we spent approximately $948,000 on research and development related
to Monoclonal antibodies, which represented approximately 12.8% of our total
R&D expenses. Monoclonal antibodies are a bioactive substance
produced naturally when human cells identify and resist pathogenic intrusion
from outside. Monoclonal antibody technology can produce large
amounts of pure
antibodies. Therefore, Monoclonal antibodies have tremendous
applications in the field of diagnostics, therapeutics, and targeted drug delivery systems, not only for
infectious disease caused by bacteria, viruses and protozoa but
also for cancer, metabolic and hormonal disorders.
41
(c) In
fiscal 2008, we spent approximately $1,192,000 on our Endostatin cancer
treatment drug, which represented approximately 16.1% of our total R&D
expenses. Endostatin is a cancer treatment drug that works by
“starving” cancer cells by restricting the
generation of blood vessels around cancer lesions, thereby inhibiting, to a
degree, the source of nutrients upon which the cancer cells
survive.
(d) Except
as set forth in notes (b) and (c) above, no single project represented a
material amount of our total R&D expenditures in fiscal 2008.
(e) Does
not include costs for materials used in our R&D projects. Our
total R&D expenditures for fiscal 2008 were approximately
$7,413,000.
Liquidity and Capital
Resources
The following table summarizes our cash
and cash equivalents position, our working capital, and our
cash flow activity as of
December 31, 2009 and 2008
and for each of the years then ended:
|
As of December
31,
($ in thousands, except ratio and
days)
|
||||||||
|
2009
|
2008
|
|||||||
|
Cash and cash
equivalents
|
$ | 52,756 | $ | 40,288 | ||||
|
Current
ratio
|
8.1 | 8.8 | ||||||
|
Quick ratio
|
7.9 | 8.8 | ||||||
|
Average accounts receivable
collection days
|
51.6 | 45.5 | ||||||
|
Average inventory turnover
days
|
21.6 | 18.2 | ||||||
|
Working
capital
|
$ | 67,000 | $ | 49,509 | ||||
|
Inventories
|
$ | 2,413 | $ | 462 | ||||
|
|
||||||||
|
Cash provided by (used
in):
|
|
|||||||
|
Operating
activities
|
$ | 33,449 | $ | 27,538 | ||||
|
Investing
activities
|
$ | (21,154 | ) | $ | (23,115 | ) | ||
|
Financing
activities
|
$ | 29 | $ | 25,355 | ||||
As of
December 31, 2008, cash and cash equivalents were approximately $52,756,000 as
compared to $40,288,000 at December 31, 2008. We had working capital at December 31,
2008 of approximately
$67,000,000, compared to $49,509,000 at December 31, 2008. Our
increase in working capital in 2009 was principally due to increased cash and
cash equivalents funded by the increased cash flows
generated from our operating activities of $33,449,000. We consider current
working capital and borrowing capabilities adequate to cover our current
operating and capital requirements for the full year
2010.
Cash flows provided by operating
activities was approximately $33,449,000 for the year ended December 31,
2009 compared to $27,538,000 in 2008. Cash
flows provided by operating activities were primarily attributable to net income
of approximately $34,457,000 and non-cash depreciation and amortization of
approximately $2,747,000, partially offset by accounts receivable of
approximately $6,204,000 and inventories of approximately
$1,948,000.
42
Cash flows used in investing activities was approximately
$21,154,000 for the year ended December 31, 2009
compared to approximately
$23,115,000 in 2008. Cash flows used in investing activities in 2008 was primarily related to our
purchase of properties and equipment in connection with the business
acquisitions we consummated
in 2008. Cash
flows used in investing
activities in 2009 was primarily related to our
expenditures in construction in progress of approximately $9.9 million, in connection with our construction of
our new corporate headquarters, as well as the purchase of proprietary technologies for Antroquinonol, a
drug used for treatment of lung and liver cancers in the amount of approximately
$5.1 million, and Small RNA diagnosing technology, used for detecting heart
diseases in its early stage, in the amount of approximately $5.8
million.
Cash flows provided from financing activities was approximately
$29,000 for the year ended December 31, 2009
compared to approximately
$25,355,000 for the same period in
2008. Our higher
cash flows provided from financing activities in 2008 were primarily due to the
private offering we completed in January 31, 2008, as well as cash generated
from the exercise of warrants by certain warrant holders of
ours.
In
January 2010, we completed the construction of two office buildings and moved
into these new facilities. It is anticipated that residual work,
including road construction, fire control equipment, amenity
improvement, and final acceptance, will be completed on these facilities in the
third quarter of 2010, at an additional cost of approximately $3.0
million.
Our current ratio was 8.1 at December 31, 2009 compared to 8.8 at December 31, 2008 and the quick ratio was 7.9 at December 31, 2009 compared to 8.8 at December 31, 2008. We endeavor to ensure that funds
are available to take
advantage of new investment opportunities and that funds are sufficient to meet
future liquidity and capital needs.
We calculate accounts receivable turnover by averaging the
opening and closing balances of out accounts receivable during that period and
dividing that amount by our average daily sales during that period. Since accounts receivables fluctuate over the course
of each quarter, in order to determine a more representative accountant
receivables collection
days, management calculates the turnover rate on a quarter-by-quarter basis.
In fiscal
2008, we implemented our new sales strategy to contract with regional sales
agents and large pharmacy chains rather than directly with smaller distributors
and individual retail stores. As a result, the number of customers we
sell to directly has dramatically decreased from 943 in 2007 to 212 in
2009. This lower number of customers has helped us to better manage
our accounts receivable. In addition, we are now selling directly to
more reputable local pharmacy chains, which pay earlier and more
consistently. Our average daily sales and turnover for each quarter
during 2008 and 2009 were as follows:
|
Quarter
Ended
|
Average Daily
Sales
($ in
thousands)
|
Average A/R
($ in
thousands)
|
Turnover
Days
|
|
March 31, 2008
|
$136
|
$10,157
|
74.5
|
|
June 30, 2008
|
$261
|
$9,377
|
35.9
|
|
September 30, 2008
|
$326
|
$9,298
|
28.5
|
|
December 31, 2008
|
$282
|
$12,134
|
43.0
|
|
2008
Annual Average
|
|
|
45.5
|
|
March 31, 2009
|
$276
|
$14,528
|
52.7
|
|
June 30, 2009
|
$354
|
$15,125
|
42.8
|
|
September 30, 2009
|
$475
|
$19,921
|
41.9
|
|
December 31, 2009
|
$324
|
$22,403
|
69.0
|
|
2009
Annual Average
|
|
|
51.6
|
Accounts
receivable turnover days fluctuate from quarter to quarter due to the
following:
|
·
|
Sales
revenue varies, which results in changing average daily
sales;
|
|
·
|
Accounts
receivable collections are slower during the fourth fiscal quarter and the
first fiscal quarter, partly due to the Chinese public holidays within
that period (about three weeks in
total).
|
|
·
|
During
the second and third quarter of each year, due to stronger sales volume,
the product turnover rate at the Company’s distributors and agents is
higher, resulting in their shorter accounts payable
periods.
|
43
During
2008 and 2009, our average inventory turnover was approximately 18 and 22 days,
respectively. Since sales and costs of goods sold fluctuate over the
course of each quarter, in order to determine a more representative inventory
rate, management calculates inventory rate on a quarter-by-quarter basis, and
then takes the average of the resulting numbers. Management calculates our
inventory turnover rate using total inventory rather than just finished goods,
because our production cycle is of an extremely short duration.
Our inventory turnover days for the
years ended December 31, 2009 and 2008 calculated by using average daily costs of goods sold and average inventory for
each quarter were as the following:
|
Quarter
Ended
|
Average Daily
COGS
($ in
thousands)
|
Average
Inventory
($ in
thousands)
|
Turnover
Days
|
|
March 31, 2008
|
$31
|
$583
|
18.6
|
|
June 30, 2008
|
$61
|
$1,109
|
18.3
|
|
September 30, 2008
|
$80
|
$1,614
|
20.2
|
|
December 31, 2008
|
$72
|
$1,133
|
15.7
|
|
2008
Annual Average
|
|
|
18.2
|
|
March 31, 2009
|
$67
|
$891
|
13.3
|
|
June 30, 2009
|
$85
|
$1,446
|
17.0
|
|
September 30, 2009
|
$118
|
$2,335
|
19.7
|
|
December 31, 2009
|
$76
|
$2,755
|
36.3
|
|
2009
Annual Average
|
|
|
21.6
|
One
reason for the quarterly fluctuations in our number of inventory turnover days
is that, historically, our inventory is at its lowest levels at the end of each
calendar year and in the first fiscal quarter. We draw down our
inventory levels in December of each year for two main
reasons. First, our customers want to receive goods prior to the
holiday season. In addition, the first calendar quarter is
traditionally our slowest sales period. Since a lower volume of sales
activity normally occurs during the first quarter of each calendar year, we
believe it is prudent to avoid incurring unnecessary inventory carrying
costs. At the appropriate time toward the end of the first calendar
quarter of each fiscal year, we begin to ramp up our inventory levels to prepare
for increased demand during the coming stronger selling periods.
Second,
the number of inventory turnover days in each fiscal quarter of 2009 was lower
than in the comparable quarter of 2008, due to an increase in our revenues for
each quarter in 2009 compared to the same quarter in the prior year. Inventory
did not increase at the same level as revenues, which resulted in varying
amounts of cost of goods sold, and a corresponding lower number of inventory
turnover days.
Historically,
we signed agreements with suppliers that allowed us to hold extra raw materials
at the cost of the suppliers. As a result, we could minimize our own
inventory carrying costs, and improve our cash management, by keeping the
inventory at the minimum level required to support the short-term
sales. However, due to the forecast of certain cost increases of raw
materials in 2010, management began to increase the inventory levels toward the
second half of 2009.
Private
Offering
On
January 31, 2008 (the “Closing Date”), we entered into a Securities Purchase
Agreement (the “Purchase Agreement”) with certain accredited investors (the
“Investors”), for the purchase and sale of 2,500,000 units of our securities
(“Units”) consisting of an aggregate of: (i) 2,500,000 shares of our common
stock (the “Purchased Shares”), and (ii) Class A Warrants to purchase 750,000
additional shares of our common stock, at an exercise price of $12.50 per share
(the “Purchased Warrants”), for a purchase price of $10.00 per unit (the “Unit
Purchase Price”), or aggregate of $25,000,000 (the “Offering”).
44
In
connection with the Offering, we paid a placement agent (the “Placement Agent”)
a fee of five percent (5%) of the Offering Proceeds. In addition, we paid the
Placement Agent’s legal fees and additional out-of-pocket expenses related to
the Offering.
We used
the net proceeds from the Offering primarily for: (a) acquisitions, (b) new
product marketing, (c) expenses related to the Offering and the Registration
Statement (defined below), and (d) general working capital
purposes.
As of the
Closing Date, we entered into a Registration Rights Agreement (the “Registration
Rights Agreement”) with the Investors, pursuant to which it agreed that within
sixty (60) calendar days of the Closing Date (the “Filing Date”), we would file
a registration statement (the “Registration Statement”) with the SEC, on the
appropriate form, covering the resale of (i) the Purchased Shares, and (ii) the
common stock issuable upon exercise of the Purchased Warrants (the “Warrant
Shares”) (collectively (i) and (ii), the “Registrable Securities”). Further, we
agreed to use our best efforts to (a) cause the Registration Statement to be
declared effective within one hundred twenty (120) calendar days from the Filing
Date, or, if reviewed by the SEC, within one hundred fifty (150) calendar days
after the Filing Date, and (b) keep the Registration Statement continuously
effective until all of the Registrable Securities have been sold, or may be sold
without volume restrictions pursuant to Rule 144 (the “Registration
Requirements”). We have not yet satisfied the Registration
Requirements. We engaged an independent third-party consultant to
calculate the derivative liability resulting from our failure to register the
Registrable Securities for resale. The calculation was made using the
Black-Scholes model. The liability was deemed to be immaterial as of
December 31, 2009.
Notwithstanding
anything to the contrary stated in the Registration Rights Agreement, the
Company shall be entitled to limit the Registrable Securities to the extent
necessary to avoid any issues arising from interpretations by the SEC of Rule
415 of the Securities Act of 1933, as amended.
The Class
A Warrants represent the right to purchase an aggregate of 750,000 shares of our
Common Stock, at an exercise price of $12.50 per share (the “Exercise Price”),
and have the following additional characteristics:
|
·
|
The
Class A Warrants shall be exercisable beginning on the six-month
anniversary of the Closing Date and will expire three years thereafter
(the “Expiration Date”); provided, however, if, among other things, we
fail to cause a Registration Statement covering the Warrant Shares to be
declared effective prior to the applicable dates set forth in the
Registration Rights Agreement (the “Effectiveness Deadlines”), the
Expiration Date of the Class A Warrants shall be extended one day for each
day beyond the Effectiveness
Deadlines.
|
|
·
|
Commencing
on one-year anniversary of the Closing Date, in the event the Warrant
Shares may not be freely sold by the holders (the “Warrantholders”) due to
our failure to satisfy our registration requirements, and an exemption for
such sale is not otherwise available to the Warrantholders under Rule 144,
the Class A Warrants will be exercisable on a cashless
basis.
|
|
·
|
The
Exercise Price and number of Warrant Shares will be subject to adjustment
for standard dilutive events, including the issuance of common stock, or
securities convertible into or exercisable for shares of common stock, at
a price per share, or conversion or exercise price per share less than the
Exercise Price.
|
|
·
|
At
anytime following the date a Registration Statement covering the Warrant
Shares is declared effective, we will have the ability to call the Class A
Warrants at a price of $0.01 per Class A Warrant, upon thirty (30) days
prior written notice to the holders of the Class A Warrants, provided (i)
the closing price of the common stock exceeded $18.75 for each of the ten
(10) consecutive trading days immediately preceding the date that the call
notice is given by us, and (ii) we have attained an Adjusted EPS of at
least $1.75 per share for the fiscal year ending December 31, 2008, as set
forth in our audited financial
statements.
|
|
·
|
The
Warrantholder shall not be entitled to exercise a number of Class A
Warrants in excess of the number of Class A Warrants upon exercise of
which would result in beneficial ownership by the Warrantholder and its
affiliates of more than 9.9% of the outstanding shares of our common
stock. This limitation on exercise may be waived by written agreement
between the Warrantholder and us; provided, however, such waiver may not
be effective less than sixty-one (61) days from the date
thereof.
|
45
As of
March 15, 2010, we have 593,800 Class A Warrants outstanding. If all of these
Class A Warrants were exercised for cash pursuant to their terms, we would
receive $7,422,500 in proceeds, although there can be no assurance that any of
these Class A Warrants or placement agent warrants will be exercised for
cash.
Significant
Accounting Policies
We have
established various accounting policies that govern the application of
accounting principles generally accepted in the U.S., which were utilized in the
preparation of our financial statements. Certain accounting policies
involve significant judgments and assumptions by management that have a material
impact on the carrying value of certain assets and
liabilities. Management considers such accounting policies to be
critical accounting policies. The judgments and assumptions used by
management are based on historical experience and other factors, which are
believed to be reasonable under the circumstances. Because of the
nature of the judgments and assumptions made by management, actual results could
differ from these judgments and estimates, which could have a material impact on
the carrying values of assets and liabilities and the results of
operations.
While our
significant accounting policies are more fully described in Note 3 to our
financial statements included in this Annual Report on Form 10-K for the year
ended December 31, 2009, we believe that the following accounting policies are
the most critical to aid you in fully understanding and evaluating our reported
financial results and affect the more significant judgments and estimates that
we use in the preparation of our financial statements.
Use
of estimates
The
preparation of the financial statements included in Item 8 of this Annual Report
on Form 10-K in conformity with U.S. GAAP, requires management to make estimates
and assumptions that affect the reported amounts of assets and liabilities,
disclosure of contingent assets and liabilities at the dates of the financial
statements, and the reported amounts of revenues and expenses during the
reported periods.
Significant
estimates include values and assigned lives to acquired tangible and intangible
assets, uncollectible accounts receivable, impairment testing of goodwill and
other long-lived assets. Actual results may differ from these
estimates.
Accounts
receivable
Accounts
receivable are stated at net realizable value, net of an allowance for doubtful
accounts. The allowance for estimated bad debts is based upon
the periodic analysis of individual customer balances including an
evaluation of days of sales outstanding, payment history, recent payment trends,
and perceived credit worthiness.
As of December 31, 2009 our allowance for doubtful
accounts was $56,000 and $50,000, respectively.
Inventories
Inventories
include finished goods, raw materials, freight-in, packing materials, labor, and
overhead costs and are valued at the lower of cost or market using the first-in,
first-out method. Inventory units are valued using the weighted
average method. Provisions are made for slow moving, obsolete and/or
damaged inventory based upon the periodic analysis of individual inventory items
including an evaluation of historical usage and/or movement, age, expiration
date, and general conditions. There are no inventory reserve
provision recorded at December
31, 2009 and 2008.
Property
and equipment
Property
and equipment are stated at historical cost less accumulated
depreciation. Depreciation on property and equipment is provided
using the straight-line method over the estimated useful lives of the
assets. We use an estimated residual value of 5% of cost, or
valuation for both financial and income tax reporting purposes. The
estimated lengths of the useful lives of our property and equipment are as
follows:
|
Building
and Improvements
|
30
years
|
|
Land
use rights
|
50
years
|
|
Furniture
& Equipment
|
5
to 7 years
|
|
Transportation
Equipment
|
5
to 15 years
|
|
Machinery
and Equipment
|
7
to 14 years
|
46
Expenditures
for renewals and betterments are capitalized while repairs and maintenance costs
are normally charged to the statement of operations in the year in which they
were incurred. In situations where it can be clearly demonstrated that the
expenditure has resulted in an increase in the future economic benefits expected
to be obtained from the use of the asset, the expenditure is capitalized as an
additional cost of the asset. Upon sale or disposal of an asset, the
historical cost and related accumulated depreciation or amortization of such
asset is removed from their respective accounts, and any gain or loss is
recorded in the consolidated statements of operations.
Property
and equipment are evaluated for impairment in value whenever an event or change
in circumstances indicates that the carrying values may not be
recoverable. If such an event or change in circumstances occurs and
potential impairment is indicated because the carrying values exceed the
estimated future undiscounted cash flows of the asset, we will measure the impairment loss as the
amount by which the carrying value of the asset exceeds its fair value. We did not record any impairment charges in
the years ended December 31, 2009, 2008 and 2007.
Intangible
assets
Intangible
assets are accounted for in accordance with ASC topic 350, “Intangibles – Goodwill and
Other.” Intangible assets with finite useful lives are
amortized while intangible assets with indefinite useful lives are not
amortized. We review our long-lived assets, including property and
equipment and finite-lived intangible assets for impairment on at least an
annual basis or whenever events or changes in circumstances indicate that the
carrying amount of the assets may not be fully recoverable. To
determine recoverability of its long-lived assets, we evaluate the probability
that future undiscounted net cash flows will be less than the carrying amount of
the assets. Impairment costs, if any, are measured by comparing the
carrying amount of the related assets to their fair value. We
recognize an impairment loss based on the excess of the carrying amount of the
assets over their respective fair values. Fair value is determined by
the use of undiscounted future cash flows, independent appraisals or other
approximate methods. We did not record any impairment charges
for the years ended December 31, 2009,2008 and 2007.
Intangible
assets consists of proprietary technologies, SFDA licenses for drug batch
numbers, and goodwill. We acquired proprietary technologies from a non-related
third party. The fair value of proprietary technologies recorded in
our financial statements is appraised periodically and amortized during its
estimated useful life. SFDA licenses for drug batch numbers were
acquired through business acquisitions of Tianlong and Peng
Lai. Goodwill consists the payments we made when we acquired
Tianlong’s Beijing sales office and Haina. We have registered “Kang
Xi” as our trademark, which is used for all of our TCM products. The
“Kang Xi” trademark was developed internally and registered by TDR before we
became a public company. Our cost basis in the trademark is
nominal. Therefore, we did
not have our “Kang Xi” trademark appraised, or record an intangible asset for
it. Additionally, none of the costs associated with the trademark
have been capitalized.
As of
December 31, 2009, the remaining weighted average life of our intangible assets
is approximately 8 years.
Revenue
recognition
Revenue
is recognized when the following criteria are met: (1) persuasive evidence
of an arrangement exists; (2) the product has been shipped and the customer
takes ownership and assumes the risk of loss; (3) the selling price is
fixed or determinable; and (4) collection of the resulting receivable is
reasonably assured. We believe that all of these criteria are
satisfied upon shipment from its facilities. Historically, we
estimated returns, allowances and claims have been deemed
immaterial. Our sale agreements only allow a return if the product
has quality related issues. In such event, we accept the return for
equivalent product exchange from inventory only.
We
occasionally apply to various government agencies for research
grants. Revenue from such research grants is recognized when
earned. In situations where we receive payment in advance for the
performance of research and development services, such amounts are deferred and
recognized as revenue as the related services are performed.
47
Research
and Development
Research
and development expenses include the costs associated with our internal research
and development, as well as research and development conducted by third
parties. These costs primarily consist of salaries, clinical trials,
outside consultants, and materials. All research and development
costs are expensed as incurred.
Third-party
expenses reimbursed under non-refundable research and development contracts are
recorded as a reduction to research and development expense in the consolidated
statement of operations.
We
recognize in-process research and development in accordance with ASC topic 730,
“Research and
Development.” Assets to be used in research and development activities,
specifically, compounds that have yet to receive new drug approval and would
have no alternative use, should approval not be given, are immediately charged
to expense when acquired. Certain assets and other technologies
acquired that has foreseeable future cash flows are capitalized as intangible
assets. Such intangible assets are amortized starting from the year
revenue is generated and amortized over an estimated period of 10 years. Should
these capitalized intangible assets have no future benefit, we will record an
immediate write-off for the remaining net carrying value within the consolidated
statement of operations.
We incurred research and development
expenses of approximately $14,960,000,
$7,413,000, and $3,158,000, for the years
ended December 31, 2009, 2008, and 2007,
respectively in research and development
costs.
Recent
Accounting Pronouncements
Refer to
Note 3 to the Financial Statements included in Item 8 of this Annual Report on
Form 10-K, which discusses new accounting pronouncements we adopted during 2009,
as well as accounting pronouncements recently issued or proposed but not yet
required to be adopted.
Contractual
Obligations and Commercial Commitments
As of
December 31, 2009, we have commitments and contractual obligations as
follows:
In
January 2010, we completed the construction of two office buildings and moved
into the new facilities located in Song Bei District of Harbin city,
PRC. We spent approximately $9.9 million, $730,000, and $2.1 million
in the year of 2009, 2008, and 2007 respectively for this construction in
progress. It is
anticipated that residual work, including road
construction, fire control equipment, amenity improvement, and final
acceptance, will be completed on
these facilities in the third quarter of 2010, at an additional cost of approximately $3.0
million.
The
continuing development of 8 research and development projects, which commenced
in the second half of fiscal 2009, have been carried over to the year of 2010
according to our contracts signed with various research institutions. The
expenditures for these 8 research and development projects in the year of 2010
is expected to be approximately $2.4 million.
Other
than the above contracts and commitments, we do not have any long-term debt
obligations, capital lease obligations, operating lease obligations, purchase
obligations, and other long term liabilities reflected on our balance sheet
under GAAP.
Currency Exchange
Fluctuations
All of our revenues and majority of the
expenses during the year ended December 31, 2008 were
denominated primarily in RMB, the currency of China, and were converted into U.S. dollars at the exchange rate of 6.96225
RMB to 1 U.S. Dollar. In the third quarter of 2005, the RMB began to rise against the U.S. dollar. There can be no
assurance that RMB-to-U.S. dollar exchange rates will remain stable.
A devaluation of RMB relative to the
U.S. dollar would adversely affect our business, financial condition and results of operations. We do not engage in
currency hedging.
Off-Balance Sheet Arrangements
We do not have any off-balance sheet
arrangements that are currently material or
reasonably likely to be material to our financial position or
results of operations.
48
Item 7A. Quantitative and
Qualitative Disclosures About Market Risk
As of
December 31, 2009, we do not invest or trade market risk sensitive instrument or
have any debt subject to interest rate fluctuations.
Substantially
all of our revenues and expenses are denominated in RMB. Since 1994,
the exchange rate for the RMB against the U.S. dollar has remained relatively
stable, most of the time in the region of approximately RMB8.00 to U.S.$1.00.
However, in 2005, the Chinese government announced that would begin pegging the
exchange rate of the RMB against a number of currencies, rather than just the
U.S. dollar. Currently, exchange rates are approximately RMB6.8 to U.S.$1.00
resulting in the increase in price of Chinese products to U.S.
purchasers. As our operations are primarily in China, any significant
revaluation of the Chinese RMB may materially and adversely affect cash flows,
revenues and financial condition. If we decide to convert RMB into
U.S. dollars and the U.S. dollar appreciates against the RMB, the U.S. dollar
equivalent of the RMB that we convert would be reduced.
Inflation
in China has not materially impacted our results of operations in recent years,
but we can provide no assurance that we will not be affected in the
future. According to the PRC National Bureau of Statistics, the
inflation rate in the consumer price index in China was 5.9%, 4.8%, and 1.9% in 2009, 2008, and 2007, respectively.
A
significant amount of our cash and cash equivalents are held in commercial bank
checking accounts in the PRC and earned an annual interest income yield of
approximately 0.36% for the year ended December 31, 2009. For all the
bank accounts in the PRC, we earned interest income of approximately $71,000,
$112,000 and $10,000 for the years ended December 31,
2009, 2008 and 2007, respectively.
49
Item 8. Financial
Statements and Supplementary
Data.
Index
to the Consolidated Financial Statements of China Sky One Medical,
Inc.
|
PAGE
|
||||
|
Reports
of Independent Registered Public Accounting Firms
|
F-2
|
|||
|
Financial
Statements
|
||||
|
Consolidated
Statements of Operations and Comprehensive Income for the Years
Ended
December 31, 2009, 2008 and 2007
|
F-4
|
|||
|
Consolidated
Balance Sheets at December 31, 2009 and 2008
|
F-5
|
|||
|
Consolidated
Statements of Stockholders’ Equity for the Years Ended December 31, 2009,
2008
and 2007
|
F-6
|
|||
|
Consolidated
Statements of Cash Flows for the Years Ended December 31, 2009, 2008
and
2007
|
F-7
|
|||
|
Notes
to Consolidated Financial Statements
|
F-8
– F-27
|
|||
F-1
To the
Board of Directors and Stockholders
China Sky
One Medical Inc. and Subsidiaries
We have
audited the accompanying consolidated balance sheets of China Sky One Medical
Inc. and subsidiaries (the “Company”) as of December 31, 2009 and 2008, and the
related consolidated statements of operations, stockholders’ equity, and cash
flows for each of the years in the two-year period ended December 31,
2009. We also have audited the Company’s internal control over financial
reporting as of December 31, 2009, based on criteria established in Internal Control - Integrated
Framework issued by the Committee of Sponsoring Organizations of the
Treadway Commission . The Company’s management is responsible for these
consolidated financial statements, for maintaining effective internal control
over financial reporting, and for its assessment of the effectiveness of
internal control over financial reporting, included in the accompanying Management’s Report on Internal
Control over Financial Reporting. Our responsibility is to express
an opinion on these consolidated financial statements and an opinion on the
Company’s internal control over financial reporting based on our
audits.
We
conducted our audits in accordance with the standards of the Public Company
Accounting Oversight Board (United States). Those standards require that
we plan and perform the audits to obtain reasonable assurance about whether the
financial statements are free of material misstatement and whether effective
internal control over financial reporting was maintained in all material
respects. Our audits of the consolidated financial statements included
examining, on a test basis, evidence supporting the amounts and disclosures in
the consolidated financial statements, assessing the accounting principles used
and significant estimates made by management, and evaluating the overall
consolidated financial statement presentation. Our audit of internal
control over financial reporting included obtaining an understanding of internal
control over financial reporting, assessing the risk that a material weakness
exists, and testing and evaluating the design and operating effectiveness of
internal control based on the assessed risk. Our audits also included
performing such other procedures as we considered necessary in the
circumstances. We believe that our audits provide a reasonable basis for
our opinions.
A
company’s internal control over financial reporting is a process designed to
provide reasonable assurance regarding the reliability of financial reporting
and the preparation of financial statements for external purposes in accordance
with generally accepted accounting principles. A company’s internal control
over financial reporting includes those policies and procedures that (a) pertain to the
maintenance of records that, in reasonable detail, accurately and fairly reflect
the transactions and dispositions of the assets of the company; (b) provide reasonable
assurance that transactions are recorded as necessary to permit preparation of
financial statements in accordance with generally accepted accounting
principles, and that receipts and expenditures of the company are being made
only in accordance with authorizations of management and directors of the
company; and (c) provide reasonable
assurance regarding prevention or timely detection of unauthorized acquisition,
use, or disposition of the company’s assets that could have a material effect on
the financial statements.
Because
of its inherent limitations, internal control over financial reporting may not
prevent or detect misstatements. Also, projections of any evaluation of
effectiveness to future periods are subject to the risk that controls may become
inadequate because of changes in conditions, or that the degree of compliance
with the policies or procedures may deteriorate.
In our
opinion, the consolidated financial statements referred to above present fairly,
in all material respects, the consolidated financial position of the Company as
of December 31, 2009 and 2008, and the consolidated results of their operations
and their cash flows for each of the years in the two-year period ended December
31, 2009, in conformity with accounting principles generally accepted in the
United States of America. Also in our opinion, the Company maintained, in
all material respects, effective internal control over financial reporting as of
December 31, 2009, based on criteria established in Internal Control - Integrated
Framework issued by the Committee of Sponsoring Organizations of the
Treadway Commission.
/s/
MSPC
MSPC
Certified
Public Accountants and Advisors,
A
Professional Corporation
New York,
New York
March 15, 2010
F-2
REPORT OF INDEPENDENT
REGISTERED PUBLIC
ACCOUNTING FIRM
[Letterhead of Sherb & Co.,
LLP]
To the Board of Directors and
Stockholders of
China Sky One Medical, Inc.
We have audited the accompanying consolidated balance sheets of China Sky One Medical, Inc. and its Subsidiaries as of December 31, 2007
and the related consolidated statements of operations, stockholders’ equity and cash flows for the year
ended December 31, 2007. China Sky One Medical, Inc. management is responsible for
these financial statements. Our responsibility is to express an
opinion on these consolidated financial statements based on our audit.
We conducted our audit in accordance with standards
of the Public Company
Accounting Oversight Board (United States). Those standards require that we plan
and perform the audit to obtain reasonable assurance about whether the financial
statements are free of material misstatement. The
Company is not
required to have, nor were we engaged to perform, and audit of its internal control over financial
reporting. Our audit included consideration of internal control over
financial reporting as a basis for designing audit procedures that are appropriate in the circumstances, but
not for the purposes of expressing an opinion on the effectiveness of the
Company’s internal control over financial
reporting. Accordingly, we express no such opinion. An audit also includes
examining, on a test basis, evidence supporting the
amounts and disclosures in the financial
statements, assessing the accounting principles
used and significant estimates made by
management, as well as evaluating the overall financial statement presentation.
We believe that our audit
provides a reasonable basis for our opinion.
In our opinion, the
consolidated financial statements referred to above present fairly, in all
material respects, the financial position of China Sky
One Medical, Inc. as of December 31, 2007 and the
results of its operations and its cash flows for the year ended December 31, 2007 in conformity with accounting principles
generally accepted in the United States.
/s/ Sherb
& Co.,
LLP
Certified Public Accountants
Boca Raton, Florida
March 25, 2008
F-3
China Sky One Medical, Inc. and
Subsidiaries
Consolidated Statements of Operations and Comprehensive
Income
$ in thousands,
except share and per share data
|
Years Ended December
31,
|
||||||||||||
|
2009
|
2008
|
2007
|
||||||||||
|
Revenues
|
$ | 130,092 | $ | 91,816 | $ | 49,318 | ||||||
|
Cost of Goods
Sold
|
31,671 | 22,403 | 10,940 | |||||||||
|
Gross
Profit
|
98,421 | 69,413 | 38,379 | |||||||||
|
Operating
Expenses
|
||||||||||||
|
Selling
expense
|
30,763 | 22,968 | 14,784 | |||||||||
|
General and administrative
expense
|
4,191 | 2,514 | 1,380 | |||||||||
|
Depreciation and
amortization
|
2,255 | 858 | 443 | |||||||||
|
Research and
development
|
14,960 | 7,413 | 3,158 | |||||||||
|
Total Operating
Expenses
|
52,170 | 33,753 | 19,765 | |||||||||
|
Income from
Operations
|
46,251 | 35,659 | 18,614 | |||||||||
|
Other Income
(Expenses)
|
||||||||||||
|
Interest
Income
|
71 | 112 | 10 | |||||||||
|
Miscellaneous income
(Expenses)
|
(32 | ) | 702 | 28 | ||||||||
|
Change in fair value of derivative
liability
|
(1,330 | ) | - | - | ||||||||
|
Total Other Income
(Expenses)
|
(1,291 | ) | 814 | 38 | ||||||||
|
Income Before Provision for Income
Tax
|
44,960 | 36,473 | 18,652 | |||||||||
|
Provision for income
taxes
|
10,503 | 7,616 | 3,319 | |||||||||
|
Net Income
|
$ | 34,457 | $ | 28,857 | $ | 15,333 | ||||||
|
Basic Earnings Per
Share
|
$ | 2.08 | $ | 1.91 | $ | 1.27 | ||||||
|
Basic Weighted Average Shares
Outstanding
|
16,575,885 | 15,101,833 | 12,094,949 | |||||||||
|
Diluted Earnings Per
Share
|
$ | 2.07 | $ | 1.87 | $ | 1.15 | ||||||
|
Diluted Weighted Average Shares
Outstanding
|
16,668,452 | 15,429,136 | 13,370,528 | |||||||||
|
Other Comprehensive
Income
|
||||||||||||
|
Foreign currency translation
adjustment
|
312 | 3,295 | 1,850 | |||||||||
|
Net income
|
$ | 34,457 | $ | 28,857 | $ | 15,333 | ||||||
|
Comprehensive
Income
|
$ | 34,769 | $ | 32,152 | $ | 17,183 | ||||||
See accompanying notes to the
consolidated financial statements.
F-4
China
Sky One Medical, Inc. and Subsidiaries
Consolidated
Balance Sheets
$ in thousands,
except share data
|
Year Ended December
31,
|
||||||||
|
2009
|
2008
|
|||||||
|
ASSETS
|
||||||||
|
Current
Assets
|
||||||||
|
Cash and cash
equivalents
|
$ | 52,756 | $ | 40,288 | ||||
|
Accounts receivable,
net
|
21,146 | 14,979 | ||||||
|
Inventories
|
2,413 | 462 | ||||||
|
Prepaid and other current
assets
|
74 | 106 | ||||||
|
Total current
assets
|
76,389 | 55,835 | ||||||
|
Property and equipment,
net
|
15,491 | 14,797 | ||||||
|
Intangible assets,
net
|
25,114 | 15,852 | ||||||
|
Construction in
progress
|
12,932 | 4,317 | ||||||
|
Land use rights,
net
|
4,586 | 1,945 | ||||||
|
Construction
deposit
|
5,851 | 8,513 | ||||||
|
Total
Assets
|
$ | 140,363 | $ | 101,259 | ||||
|
LIABILITIES AND STOCKHOLDERS'
EQUITY
|
||||||||
|
Current
Liabilities
|
||||||||
|
Accounts payable and accrued
expenses
|
$ | 4,186 | $ | 2,937 | ||||
|
Taxes
payable
|
3,873 | 3,363 | ||||||
|
Deferred
revenue
|
- | 26 | ||||||
|
Derivative
liability
|
1,330 | - | ||||||
|
Total current
liabilities
|
9,389 | 6,326 | ||||||
| Commitments and Contingencies | ||||||||
|
Stockholders'
Equity
|
||||||||
|
Preferred stock ($0.001 par value,
5,000,000 shares authorized,none issued and
outstanding)
|
- | - | ||||||
|
Common stock ($0.001 par value,
50,000,000 shares authorized,16,714,267 and 16,306,184 issued and
outstanding at December 31, 2009 and 2008,
respectively)
|
17 | 16 | ||||||
|
Additional paid-in
capital
|
41,376 | 40,105 | ||||||
|
Retained
earnings
|
5,879 | 5,567 | ||||||
|
Accumulated other comprehensive
income
|
130,974 | 94,933 | ||||||
|
Total stockholders'
equity
|
83,702 | 49,245 | ||||||
| $ | 140,363 | $ | 101,259 | |||||
See accompanying notes to the
consolidated financial statements.
F-5
China Sky One Medical, Inc. and
Subsidiaries
Consolidated Statements of Stockholders'
Equity
$ in thousands,
except share data
|
Accumulated
|
||||||||||||||||||||||||
|
Additional
|
Other
|
Total
|
||||||||||||||||||||||
|
Common
Stock
|
Paid-in
|
Retained
|
Comprehensive
|
Stockholders'
|
||||||||||||||||||||
|
Shares
|
Amount
|
Capital
|
Earnings
|
Income
|
Equity
|
|||||||||||||||||||
|
Balance at December 31,
2006
|
12,031,536 | $ | 12 | $ | 8,822 | $ | 5,055 | $ | 422 | $ | 14,311 | |||||||||||||
|
Issuance of common stock for
service
|
30,000 | - | 195 | 195 | ||||||||||||||||||||
|
Warrants
exercised
|
166,827 | - | 516 | 516 | ||||||||||||||||||||
|
Employee stock
options
|
40 | 40 | ||||||||||||||||||||||
|
Foreign currency translation
adjustment
|
1,850 | 1,850 | ||||||||||||||||||||||
|
Net income
|
15,333 | 15,333 | ||||||||||||||||||||||
|
Balance at December 31,
2007
|
12,228,363 | 12 | 9,573 | 20,388 | 2,272 | 32,245 | ||||||||||||||||||
|
Issuance of common stock through
private placement, net
|
2,500,000 | 3 | 23,485 | 23,488 | ||||||||||||||||||||
|
Warrants and options exercised
under cash and cashless
|
1,142,302 | 1 | 1,866 | 1,867 | ||||||||||||||||||||
|
Issuance of common stock under
business acquistions
|
405,456 | - | 4,865 | 4,865 | ||||||||||||||||||||
|
Share-based
compensation
|
30,063 | - | 316 | 316 | ||||||||||||||||||||
|
Foreign currency translation
adjustment
|
3,295 | 3,295 | ||||||||||||||||||||||
|
Net income
|
28,857 | 28,857 | ||||||||||||||||||||||
|
Balance at December 31,
2008
|
16,306,184 | 16 | 40,105 | 49,245 | 5,567 | 94,933 | ||||||||||||||||||
|
Warrants and options exercised
under cash and cashless
|
355,239 | - | 29 | 29 | ||||||||||||||||||||
|
Share-based
compensation
|
52,844 | - | 1,242 | 1,242 | ||||||||||||||||||||
|
Foreign currency translation
adjustment
|
312 | 312 | ||||||||||||||||||||||
|
Net income
|
34,457 | 34,457 | ||||||||||||||||||||||
|
Balance at December 31,
2009
|
16,714,267 | $ | 17 | $ | 41,376 | $ | 83,702 | $ | 5,879 | $ | 130,974 | |||||||||||||
See accompanying notes to the
consolidated financial statements.
F-6
China Sky One Medical, Inc. and
Subsidiaries
Consolidated Statements of Cash Flows
$ in
thousands
|
Years Ended December
31,
|
||||||||||||
|
2009
|
2008
|
2007
|
||||||||||
|
Cash Flows From Operating
Activities
|
||||||||||||
|
Net income
|
$ | 34,457 | $ | 28,857 | $ | 15,333 | ||||||
|
Adjustments to reconcile net
income to net cash provided (used) by operating
activities:
|
||||||||||||
|
Allowance for bad
debt
|
17 | 38 | - | |||||||||
|
Depreciation and
amortization
|
|
2,747 | 858 | 443 | ||||||||
|
Share-based
compensation
|
1,242 | 316 | 235 | |||||||||
|
Change in fair value of derivative
liability
|
1,330 | - | - | |||||||||
|
Decrease (increase) in operating
assets:
|
||||||||||||
|
Accounts receivable and other
receivables
|
(6,204 | ) | (3,398 | ) | (7,479 | ) | ||||||
|
Inventories
|
(1,948 | ) | (66 | ) | (73 | ) | ||||||
|
Prepaid expenses and
others
|
92 | (24 | ) | 93 | ||||||||
|
Increase (decrease) in operating
liabilities:
|
||||||||||||
|
Accounts payable and accrued
liabilities
|
1,215 | (678 | ) | 2,136 | ||||||||
|
Tax payable
|
501 | 1,660 | 960 | |||||||||
|
Deferred
revenue
|
- | (26 | ) | (48 | ) | |||||||
|
Net cash provided by operating
activities
|
33,449 | 27,538 | 11,601 | |||||||||
|
Cash Flows From Investing
Activities
|
||||||||||||
|
Purchase of property and
equipment
|
(254 | ) | (11,167 | ) | (2,222 | ) | ||||||
|
Land and construction
deposit
|
- | - | (8,003 | ) | ||||||||
|
Construction in
progress
|
(9,932 | ) | 4 | - | ||||||||
|
Purchase of intangible
assets
|
(10,968 | ) | (11,951 | ) | (35 | ) | ||||||
|
Net cash used in investing
activities
|
(21,154 | ) | (23,115 | ) | (10,261 | ) | ||||||
|
Cash Flows From Financing
Activities
|
||||||||||||
|
Sale of common stock for cash, net
of offering costs
|
- | 23,488 | - | |||||||||
|
Proceeds from warrants
conversion
|
29 | 1,868 | 516 | |||||||||
|
Repayment of short-term
loan
|
- | - | (548 | ) | ||||||||
|
Net cash provided by (used in)
financing activities
|
29 | 25,355 | (33 | ) | ||||||||
|
Effect of exchange rate changes on
cash
|
272 | 1,318 | 1,296 | |||||||||
|
Net Increase in Cash and Cash
Equivalents
|
$ | 12,468 | $ | 31,097 | $ | 2,604 | ||||||
|
Cash and Cash Equivalents at
Beginning of Year
|
40,288 | 9,191 | 6,587 | |||||||||
|
Cash and Cash Equivalents at End
of Year
|
$ | 52,756 | $ | 40,288 | $ | 9,191 | ||||||
|
Supplemental disclosure of cash
flow information
|
||||||||||||
|
Interest
paid
|
$ | - | $ | 135 | $ | 10 | ||||||
|
Taxes paid
|
|
$
|
10,164 | $ | 6,630 | $ | 2,359 | |||||
See accompanying notes to the
consolidated financial statements.
F-7
China Sky One Medical, Inc. and
Subsidiaries
Notes to Consolidated Financial Statements
|
1.
|
Description of
Business
|
China Sky One Medical Inc. ("China Sky One" or the “Company”), a Nevada corporation, was formed on February 7, 1986, and formerly known
as Comet Technologies, Inc. (“Comet”). On July 26, 2006, the Company
changed the name of the reporting company from
"Comet Technologies, Inc." to "China Sky One Medical, Inc."
China Sky One is a holding company whose
principal operations are through its wholly-owned subsidiaries; it has no
revenues separate from its subsidiaries, and has expenses related to its status as a public reporting company
and to its ownership interest in American California Pharmaceutical
Group, Inc. (“ACPG”) and Harbin City Tian Di Ren Medical Co. (“TDR”).
ACPG, our non operating United States holding company subsidiary, was
incorporated on December 16, 2003, in the State of California, under the name “QQ Group, Inc.” QQ Group, Inc. changed its name to “American California Pharmaceutical
Group, Inc.” in
anticipation of the Stock Exchange Agreement with China Sky One (then known as
“Comet Technologies,
Inc.”) and TDR, described herein. On December 8, 2005, ACPG
completed a stock exchange transaction with TDR a
People’s Republic of China (“China” or “PRC”) based operating company and TDR’s subsidiaries (the “TDR Acquisition”), each of which were fully operating
companies in the PRC. Under the terms of the agreement, ACPG exchanged 100% of its issued and outstanding common stock for 100% of the
capital stock of TDR and its subsidiaries, described below.
Thereafter, on May 11, 2006, ACPG
entered into a Stock Exchange Agreement (the
“Exchange
Agreement”) with the
shareholders of China Sky One. The terms of the Exchange Agreement were
consummated and the acquisition was
completed on May 30, 2006. As a result of the transaction,
the Company issued a total of 10,193,377 shares of
its common voting stock to the stockholders
of ACPG, in exchange for 100% of the capital stock of ACPG resulting in ACPG
becoming our wholly-owned subsidiary. The transaction is treated as a reverse merger for accounting
purposes.
TDR, formerly known as “Harbin City Tian Di Ren Medical Co.,” was originally formed in 1994 and maintained its principal executive office in
Harbin City of Heilongjiang Province, in the PRC. TDR was reorganized and incorporated as a limited liability company on December 29, 2000,
under the “Corporation Laws
and Regulations” of the
PRC. At the time of the TDR Acquisition by ACPG in December of 2005, TDR had
two wholly-owned subsidiaries, Harbin First
Bio-Engineering Company Limited and Kangxi Medical Care Product Factory, until July,
2006, when the two were merged, with Harbin First Bio-Engineering
Company Limited (“First”) as the surviving subsidiary of TDR.
The principal activities of TDR and First are the research, manufacture and sale
of over-the-counter non-prescription health care products. TDR commenced its business in the sale of
branded nutritional supplements and over-the-counter pharmaceutical
products in the Heilongjiang Province. TDR has subsequently evolved into an integrated manufacturer, marketer, and distributor
of external use natural Chinese medicine products sold primarily to and through
China’s various domestic pharmaceutical chain
stores.
As of October 16, 2006, the Company
organized Harbin Tian Qing Biotech Application Company as a wholly-owned PRC
subsidiary of TDR (“Tian
Qing”), to
conduct research and
development in the areas of tissue and stem cell banks. As of
December 31, 2010, Tian Qing had insignificant operation.
On September 30, 2008 (the “Record Date”), we obtained the written consent of
the holders of 8,158,251
shares of our common stock, which as of the Record Date, represented 51.3% of
our outstanding voting securities, to increase
our number of authorized shares of common stock from twenty million (20,000,000)
to fifty million (50,000,000) shares.
|
2.
|
Acquisition of
Businesses
|
On April 3, 2008, TDR
completed an acquisition pursuant to an Equity
Transfer Agreement dated February 22, 2008, between TDR and
Heilongjiang Tianlong Pharmaceutical, Inc., a corporation with a multitude of medicines approved by the PRC’s State Food and Drug Administration
(“SFDA”) and new medicine applications, organized
under the laws of the PRC (“Tianlong”), which is in the business of
manufacturing external-use pharmaceuticals. Our TDR subsidiary previously
acquired the Beijing sales office of Tianlong in mid 2006.
Pursuant to the Equity Transfer Agreement, TDR acquired 100% of the issued and
outstanding capital stock of Tianlong from Tianlong’s sole stockholder, in consideration for an aggregate purchase
price of approximately $8,300,000, consisting of (i) $8,000,000 in cash, and (ii) 23,850 shares of China
Sky One (at $12 per
share). The acquisition
received regulatory approval and
closed on April 3, 2008.
F-8
China Sky One Medical, Inc. and
Subsidiaries
Notes to Consolidated Financial Statements
|
2.
|
Acquisition of Businesses
(Continued)
|
The following table summarizes the
approximate estimated fair values of the assets acquired in the Tianlong
acquisition.
|
$ in
thousands
|
||||
|
Fixed assets
|
$ | 6,315 | ||
|
Intangible assets – SFDA licenses for
drug batch numbers
|
1,787 | |||
|
Other
|
170 | |||
|
Net assets acquired
|
$ | 8,272 | ||
On April
18, 2008, China Sky One through its subsidiary TDR consummated a share
acquisition pursuant to an Equity Transfer Agreement with the shareholders of
Heilongjiang Haina Pharmaceutical Inc., a recently formed corporation organized
under the laws of the PRC (“Haina”) licensed as a wholesaler of TCD,
bio-medicines, bio-products, medicinal devices, antibiotics and chemical
medicines. Haina does not have an established sales network and was acquired for
its primary asset, a Good Supply Practice (GSP) license (License No.
A-HLJ03-010) issued by the Heilongjiang office of the State Food and Drug
Administration (“SFDA”). The SFDA recently started issuing such licenses to
resellers of medicines that maintain certain quality controls. The GSP license
was issued as of December 21, 2006 and will expire on January 29, 2012 and will
enable the Company to expand its sales of medicinal products without having to
go through a lengthy license application process.
The
following table summarizes the approximate estimated fair values of the assets
acquired in the Haina acquisition.
|
$ in
thousands
|
||||
|
Cash
|
$ | 84 | ||
|
Intangible assets - Goodwill
|
353 | |||
|
Net assets acquired
|
$ | 437 | ||
Pursuant to the Equity Transfer
Agreement, TDR acquired 100% of the issued and outstanding capital stock of Haina from
its three stockholders in consideration for
payment of 3,000,000 RMB (approximately $437,000). TDR has been overseeing the
operations of Haina since January of 2008 as part of its due diligence prior to closing of this
acquisition.
On June 9, 2008, TDR entered into a Merger and Acquisition Agreement (the
“Acquisition
Agreement”) with Peng Lai
Jin Chuang Company, a corporation organized under the laws of the
People’s Republic of China (“Peng Lai”), which was organized to develop, manufacture and distribute
pharmaceutical,
medicinal and diagnostic products in the PRC. Pursuant to the Acquisition
Agreement, TDR acquired all of the assets of Peng Lai in consideration for an
aggregate of approximately (i) U.S.$2.5 million in cash, and (ii) 381,606
shares of the
Company’s common stock with a fair value of
approximately $4.6 million (at $12 per share). The acquisition of Peng Lai
closed on September 5,
2008.
The following table summarizes the
approximate estimated fair values of the assets acquired in the Peng Lai
acquisition.
|
$ in thousands
|
||||
|
Fixed assets
|
$ | 4,177 | ||
|
Intangible assets - SFDA licenses for drug
batch numbers
|
2,917 | |||
|
Net assets acquired
|
$ | 7,094 | ||
The following table contains pro
forma condensed
consolidated statement of operations information assuming the Tianlong, Haina
and Peng Lai transactions closed on January 1, 2007, for the years December 31,
2008 and 2007. Peng Lai had dormant operations until
October 2008.
| Years Ended December 31, | ||||||||
|
2008
|
2007
|
|||||||
|
($
in thousands)
|
||||||||
|
Revenue
|
$ | 92,378 | $ | 51,334 | ||||
|
Operating
income
|
$ | 35,747 | $ | 17,143 | ||||
|
Net
income
|
$ | 28,934 | $ | 13,822 | ||||
|
Basic
earnings per common share
|
$ | 1.92 | $ | 1.14 | ||||
|
Basic
weighted average shares outstanding
|
15,358,843 | 12,500,405 | ||||||
|
Diluted
earnings per common share
|
$ | 1.88 | $ | 1.03 | ||||
|
Diluted
weighted average shares outstanding
|
15,686,146 | 13,775,984 | ||||||
F-9
China Sky One Medical, Inc. and
Subsidiaries
Notes to Consolidated Financial Statements
|
3.
|
Summary of Significant Accounting Policies
|
We have
established various accounting policies that govern the application of
accounting principles generally accepted in the United States of America
(“U.S.”), which were utilized in the preparation of our financial statements.
Certain accounting policies involve significant judgments and assumptions by
management that have a material impact on the carrying value of certain assets
and liabilities. The judgments and assumptions used by management are
based on historical experience and other factors, which are believed to be
reasonable under the circumstances. Because of the nature of the judgments and
assumptions made by management, actual results could differ from these judgments
and estimates, which could have a material impact on the carrying values of
assets and liabilities and the results of operations.
Principles of
Consolidation – The accompanying consolidated financial
statements include the accounts of the Company and its wholly-owned subsidiaries, ACPG, TDR,
First, Tian Qing,
Tianlong, Haina and Peng Lai. All significant
inter-company transactions and balances were eliminated. The
These
financial statements are stated in U.S. Dollars and have been prepared in
accordance with accounting principles generally accepted in the U.S.. This basis
of accounting differs from that used under applicable accounting requirements in
the PRC. No material adjustment was required.
Certain
items in the 2008 and 2007 financial statements have been reclassified to
conform to the 2009 financial statements presentation.
Use of estimates – The
preparation of these financial statements in conformity with U.S. GAAP, requires
management to make estimates and assumptions that affect the reported amounts of
assets and liabilities, disclosure of contingent assets and liabilities at the
dates of the financial statements, and the reported amounts of revenues and
expenses during the reported periods.
Significant
estimates include values and assigned lives to acquired tangible and intangible
assets, uncollectible accounts receivable, impairment testing of goodwill and
other long-lived assets. Actual results may differ from these
estimates.
Earnings per share - Basic
earnings per common share is computed by dividing net earnings applicable to
common shareholders by the weighted-average number of common shares outstanding
during the period. When applicable, diluted earnings per common share is
determined using the weighted-average number of common shares outstanding during
the period, adjusted for the dilutive effect of common stock equivalents,
consisting of shares that might be issued upon exercise of common stock options
and warrants.
Potential
common shares issued are calculated using the treasury stock method, which
recognizes the use of proceeds that could be obtained upon the exercise of
options and warrants in computing diluted earnings per share. It assumes that
such proceeds would be used to purchase common stock at the average market price
of the common stock during the period.
Cash and cash equivalents –
The Company
considers all highly liquid instruments purchased with a maturity period of
three months or less to be cash equivalents. The carrying amounts reported in
the accompanying consolidated balance sheets for cash and cash equivalents
approximate their fair value.
A
significant amount of our cash and cash equivalents are held in commercial bank
checking accounts in the PRC and earn interest income
(annual yield of approximately 0.36% for the year ended December 31, 2009). For
all the bank accounts in the PRC, the Company earned interest income of approximately $71,000, $112,000 and $10,000 for the years ended December
31, 2009, 2008 and 2007, respectively.
Accounts receivable
– Accounts receivable are stated at net realizable value, net of an
allowance for doubtful accounts. The allowance for estimated bad debts is based
upon the periodic analysis of individual customer balances including an
evaluation of days of sales outstanding, payment history, recent payment trends,
and perceived credit worthiness.
As of December 31, 2009 and 2008,
the Company’s allowance for doubtful
accounts was $56,000 and $50,000, respectively.
F-10
China Sky One Medical, Inc. and
Subsidiaries
Notes to Consolidated Financial Statements
|
3.
|
Summary of Significant Accounting Policies (Continued)
|
Inventories – Inventories
include finished goods, raw materials, freight-in, packing materials, labor, and
overhead costs and are valued at the lower of cost or market using the first-in,
first-out method. Inventory units are valued using the weighted average method.
Provisions are made for slow moving, obsolete and/or damaged inventory based
upon the periodic analysis of individual inventory items including an evaluation
of historical usage and/or movement, age, expiration date, and general
conditions. The Company recorded no inventory reserve position as of December
31, 2009 and 2008.
Property and equipment –
Property and equipment are stated at historical cost less accumulated
depreciation. Depreciation on property and equipment is provided using the
straight-line method over the estimated useful lives of the assets. The Company
uses an estimated residual value of 5% of cost, or valuation for both financial
and income tax reporting purposes. The estimated lengths of the useful lives of
our property and equipment are as follows:
|
Building
and Improvements
|
30
years
|
|
Land
use rights
|
50
years
|
|
Furniture
& Equipment
|
5
to 7 years
|
|
Transportation
Equipment
|
5
to 15 years
|
|
Machinery
and Equipment
|
7
to 14 years
|
Expenditures
for renewals and betterments are capitalized while repairs and maintenance costs
are charged to the consolidated statement of operations in the year in which
they were incurred. In situations where it can be clearly demonstrated that the
expenditure has resulted in an increase in the future economic benefits expected
to be obtained from the use of the asset, the expenditure is capitalized as an
additional cost of the asset. Upon sale or disposal of an asset, the historical
cost and related accumulated depreciation or amortization of such asset is
removed from their respective accounts, and any gain or loss is recorded in the
consolidated statements of operations.
Property
and equipment are evaluated for impairment in value whenever an event or change
in circumstances indicates that the carrying values may not be recoverable. If
such an event or change in circumstances occurs and potential impairment is
indicated because the carrying value exceeds the estimated future undiscounted
cash flows of the asset, the
Company will measure the impairment loss as the amount by which the carrying
value of the asset exceeds its fair value. The Company did not record
any impairment charges of
property and equipment in
the years ended December
31, 2009, 2008 and 2007.
Construction-in-progress
– Properties
currently under development are accounted for as construction-in-progress.
Construction-in-progress includes the acquisition and land right cost,
development expenditures, professional fees, and capitalized interest costs
during the period of construction.
Upon
completion and readiness for use of the project, the cost of
construction-in-progress is transferred as part of property and equipment. In
the case of construction-in-progress, management takes into consideration the
estimated cost to complete the project when making the lower of cost or market
calculation.
Intangible assets – Intangible
assets are accounted for in accordance with ASC topic 350, “Intangibles –
Goodwill and Other.” Intangible assets with finite useful lives are amortized
while intangible assets with indefinite useful lives are not amortized. The
Company reviews its long-lived assets and finite-lived intangible assets for
impairment on at least an annual basis or whenever events or changes in
circumstances indicate that the carrying amount of the assets may not be fully
recoverable. To determine recoverability of its long-lived assets, the Company
evaluates the probability that future undiscounted net cash flows will be less
than the carrying amount of the assets. Impairment costs, if any, are measured
by comparing the carrying amount of the related assets to their fair value. The
Company recognizes an impairment loss based on the excess of the carrying amount
of the assets over their respective fair values. Fair value is determined by the
use of undiscounted future cash flows, independent appraisals or other
approximate methods. The Company
did not record any impairment charges for the years ended December 31, 2009,2008 and 2007.
F-11
China Sky One Medical, Inc. and
Subsidiaries
Notes to Consolidated Financial Statements
|
3.
|
Summary of Significant Accounting Policies (Continued)
|
Our
intangible assets consists of proprietary technologies, SFDA licenses for drug
batch numbers, and goodwill. Proprietary technologies are technologies that we
own. The SFDA licenses for drug batch numbers and goodwill were
acquired in the business acquisitions of Tianlong and Peng Lai. We
have registered “Kang Xi” as our trademark, which is used for all of the
Company’s Tradition Chinese Medicine (“TCM”) products. The “Kang Xi” trademark
was developed internally and registered by TDR before the Company became a
public company. The Company’s cost basis in the trademark is nominal. Therefore, the Company did
not have its “Kang Xi” trademark appraised, or recorded an intangible asset for
it. Additionally, none of the costs associated with the trademark have been
capitalized.
Derivative Instruments – The
fair value of the Company’s derivative warrants liability was provided by an
independent third party valuation expert. Certain derivatives with
limited activity are valued using externally developed models that consider
unobservable market parameters.
Foreign Currency - The
Company’s principal country of operations is in the PRC. The financial position
and results of operations of the Company are recorded in Renminbi (“RMB”) as the
functional currency. The results of operations denominated in foreign currency
are translated at the average rate of exchange during the reporting
period. Assets and liabilities denominated in foreign currencies at
the balance sheet date are translated at the market rate of exchange at that
date. The registered equity capital denominated in the functional currency is
translated at the historical rate of exchange at the time of the capital
contribution. All translation adjustments resulting from the translation of the
financial statements into U.S. Dollars are recorded as accumulated other
comprehensive income, a component of stockholders’ equity.
Revenue recognition - Revenue
is recognized when the following criteria are met: (1) persuasive evidence
of an arrangement exists; (2) the product has been shipped and the customer
takes ownership and assumes the risk of loss; (3) the selling price is
fixed or determinable; and (4) collection of the resulting receivable is
reasonably assured. The Company believes that all of these criteria are
satisfied upon shipment from its facilities. Historically, the Company’s
estimated returns, allowances and claims have been deemed immaterial. The
Company’s sale agreements only allow a return if the product has quality related
issues. In such event, the Company accepts the return for equivalent product
exchange from inventory only.
The
Company occasionally applies to various government agencies for research grants.
Revenue from such research grants is recognized when earned. In situations where
the Company receives payment in advance for the performance of research and
development services, such amounts are deferred and recognized as revenue as the
related services are performed.
Deferred revenues - The
Company recognizes revenues as earned. Amounts billed in advance of the period
in which goods are delivered are recorded as a liability under “Deferred
revenues.”
Research and development -
Research and development expenses include the costs associated with the
Company’s internal research and development as well as research and development
conducted by third parties. These costs primarily consist of salaries, clinical
trials, outside consultants, and materials. All research and development costs
are expensed as incurred.
Third-party
expenses reimbursed under non-refundable research and development contracts are
recorded as a reduction to research and development expense in the consolidated
statement of operations.
The
Company recognizes in-process research and development in accordance with ASC
topic 730, “Research and Development.” Assets to be used in research and
development activities, specifically, compounds that have yet to receive new
drug approval and would have no alternative use, should approval not be given,
are immediately charged to expense when acquired. Certain assets and other
technologies acquired that has foreseeable future cash flows are capitalized as
intangible assets. Such intangible assets are amortized starting from the year
revenue is generated and amortized over an estimated period of 10 years. Should
under any circumstances these capitalized intangible assets have no future
benefit; the Company will record an immediate write-off for the remaining net
carrying value within the consolidated statement of operations.
The Company incurred research and development
expenses of approximately $14,960,000,
$7,413,000, and $3,158,000, for the years
ended December 31, 2009, 2008, and 2007,
respectively.
F-12
China Sky One Medical, Inc. and
Subsidiaries
Notes to Consolidated Financial Statements
|
3.
|
Summary of Significant Accounting Policies (Continued)
|
Advertising – The Company signs contracts with agents who then place its advertising in the mediums of television, radio and internet.
Advertising expense is
incurred in the period the
advertisements take place. Thus, costs of advertising are expensed as incurred. Advertising costs for the years ended December 31, 2009, 2008, and 2007
were approximately $14,527,000, $7,299,000 and $4,385,000, respectively. An immaterial amount of the Company’s advertisement expenses in 2009, 2008 and 2007
were related to
advertising production costs. Advertising costs are reported as part of selling expenses in the
statements of operations.
Taxation – The Company uses
the asset and liability method of accounting for deferred income taxes. The
Company’s provision for income taxes includes income taxes currently payable and
those deferred because of temporary differences between the financial statement
and tax bases of assets and liabilities. The Company records liabilities
for income tax contingencies based on our best estimate of the underlying
exposures.
The
Company periodically estimates its tax obligations using historical experience
in tax jurisdictions and informed judgments. There are inherent uncertainties
related to the interpretation of tax regulations in the jurisdictions in which
the Company transacts business. The judgments and estimates made at a point in
time may change based on the outcome of tax audits, as well as changes to, or
further interpretations of, regulations. The Company adjusts income tax expense
in the period in which these events occur.
Provision
for the PRC enterprise income tax is calculated at the prevailing rate based on
the estimated assessable profits less available tax relief for losses brought
forward. The
Company does not accrue taxes on unremitted earnings from foreign operations as
it is the Company’s intention to invest these earnings in the foreign operations
indefinitely.
Enterprise income
tax
According to “Enterprise Income Tax and Certain
Preferential Policies Notice” published by the Ministry of Finance and the
National Tax Affairs Bureau, if the enterprise is authorized by the State Council as a special
entity, the enterprise income tax rate is reduced to 15%. The following table sets forth the Company’s income tax rate for TDR and its subsidiaries for the year
ended December 31, 2009, 2008 and 2007:
|
Income
Tax Rate
|
2009
|
2008
|
2007
|
|
TDR
|
15%
|
15%
|
15%
|
|
First
|
15%
|
25%
|
25%
|
|
Tianlong
|
15%
|
12%
|
-
|
|
Haina
|
25%
|
25%
|
-
|
|
Peng
Lai
|
2%
of Revenue
|
25%
|
-
|
Value added
tax
The
Provisional Regulations of PRC Concerning Value Added Tax promulgated by the
State Council came into effect on January 1, 1994. Under these regulations and
the Implementing Rules of the Provisional Regulations of the PRC Concerning
Value Added Tax, value added tax is imposed on goods sold in, or imported into,
the PRC and on processing, repair and replacement services provided within the
PRC.
Value
added tax payable in the PRC is charged on an aggregated basis at a rate of 13%
or 17% (depending on the type of goods involved) on the full price collected for
the goods sold or, in the case of taxable services provided, at a rate of 17% on
the charges for the taxable services provided, but excluding, in respect of both
goods and services, any amount paid in respect of value added tax included in
the price or charges, and less any deductible value added tax already paid by
the taxpayer on purchases of goods and services in the same financial
year.
F-13
China Sky One Medical, Inc. and
Subsidiaries
Notes to Consolidated Financial Statements
|
3.
|
Summary of Significant Accounting Policies (Continued)
|
According
to “Agriculture Product Value Added Tax Rate Adjustment and Certain Items’ Value
Added Tax Waiver” published by the Ministry of Finance and the National Tax
Affairs Bureau, the value added tax for agriculture related products is to be
taxed at 13%. Furthermore, traditional Chinese medicine and medicinal plant are
by definition agriculture related products.
We may
from time-to-time be assessed interest or penalties by major tax jurisdictions,
although such assessments historically have been minimal and immaterial to our
financial results. Our policy is to recognize interest and penalties accrued on
any unrecognized tax benefits as a component of income tax expense.
The
Company files corporate income tax returns in the United States (“U.S.”) for
China Sky One and ACPG. ACPG wholly owns 100% of TDR and subsidiaries in the
PRC. China Sky One and ACPG are holding companies and do not generate business
revenues and management’s intent is not to distribute dividend income from TDR
and subsidiaries to either China Sky One or ACPG. As such, management has
established a full valuation allowance for the net operating losses incurred by
China Sky One and ACPG. The Company files income tax returns in the PRC for TDR
and its subsidiaries.
Comprehensive income –
Comprehensive income consists of net income and other gains and losses
affecting stockholders’ equity that, under generally accepted accounting
principles are excluded from net income. For the Company, such items consist
entirely of foreign currency translation gains and losses.
Retirement benefit costs –
According to the PRC regulations on pension plans, the Company contributes to a
defined contribution retirement plan organized by municipal government in the
province in which the Company is registered and all qualified employees as
defined by statutory regulations are eligible to participate in the
plan.
Contributions
to the pension or retirement plan are calculated at 22% of the employees’
salaries above a fixed threshold amount. The employees contribute between 2% to
8% to the pension plan, and the Company contributes the balance. The Company has
no other material obligations for the payment of retirement benefits beyond the
annual contributions under this plan. The Company incurred costs of $209,000, $89,000, and
$22,000 for the
years ended December 31, 2009, 2008, and 2007, respectively.
Fair value of financial instruments
– The carrying amounts of certain financial instruments, including
cash and cash equivalents, accounts receivable, other receivables, accounts
payable, accrued expenses, and other payables approximate their fair values
at December 31, 2009 and 2008 because of the relatively short-term maturity
of these instruments. The fair
value of derivative instruments is provided by the use of an independent third
party valuation expert. Certain derivatives with limited market
activity are valued using externally developed models that consider unobservable
market parameters.
Subsequent
Events
The Company evaluated subsequent events through the date of filing of
this Form 10-K in accordance with the Subsequent Events Topic of the FASB
Accounting Standards Codification under ASC topic 855.
Recent
accounting pronouncements
The
Financial Accounting Standards Board (“FASB”) has codified a single source of
authoritative nongovernmental U.S. GAAP, the “Accounting Standards
Codification” (the “Codification” or “ASC”). While the Codification does
not change U.S. GAAP, it introduces a new structure that is organized in an
easily accessible, user-friendly on-line research system. The Codification
supersedes all existing accounting standards documents. All other accounting
literature not included in the Codification will be considered nonauthoritative.
Unless needed to clarify a point to readers, we will refrain from citing
specific section references when discussing application of accounting principles
or addressing new or pending accounting rule changes.
In December 2007, the FASB
issued new accounting guidance on business
combinations. The new guidance establishes principles and requirements for how an acquirer recognizes and
measures in its financial statements the identifiable assets acquired, the liabilities assumed, any noncontrolling interest in the acquiree and
the goodwill acquired. The new accounting guidance also
establishes disclosure requirements to enable the evaluation of the nature
and financial effects of the business combination. The new
guidance is effective as of
the beginning of an entity’s fiscal year that begins
after December 15,
2008, and was
adopted by the Company in the first quarter of Fiscal
2009.
F-14
China Sky One Medical, Inc. and
Subsidiaries
Notes to Consolidated Financial Statements
|
3.
|
Summary of Significant Accounting Policies (Continued)
|
In April 2009, the FASB issued new
accounting guidance
addressing the interim disclosures about the fair value of financial
instruments, which amended the previous disclosures
regarding the fair value of financial instruments, and interim financial reporting. This
new guidance requires disclosures about the fair value of
financial instruments in interim financial
statements, in addition to the annual financial
statements as already required. This new accounting guidance became
effective for interim periods ending after June 15, 2009, and was adopted by us in the third quarter of Fiscal
2009. The adoption of this new guidance had no material impact on our
consolidated financial statements.
In April 2009, the FASB issued new accounting guidance regarding the
determination of fair value
when the volume and level of activity for assets or liabilities have significantly
decreased, and identifying transactions that are
not orderly. This guidance requires an evaluation of whether there has been a
significant decrease in the volume and level of activity for the asset or
liability in relation to normal market activity for the asset or liability. If
there has, transactions or quoted prices may not be indicative of fair
value and a significant adjustment may need to be made to those prices to estimate fair value.
Additionally, an entity must consider whether the observed transaction was orderly (that is, not
distressed or forced). If the transaction was orderly, the
obtained price can be considered a relevant observable input for determining fair
value. If the transaction is not orderly, other valuation techniques must be
used when estimating fair value. This new
accounting guidance must be applied prospectively for interim periods ending
after June 15, 2009,
and was adopted by us effective June 30, 2009, but had no material impact on our consolidated financial statements.
In May 2009, the FASB issued new accounting guidance, “Subsequent Events”, which established general standards of accounting for and
disclosure of events that occur after the balance sheet date
but before the financial statements are issued or available to be issued. The guidance requires new disclosure
in financial statements of the date through which reporting entities have
evaluated events or transactions that occur after the
balance sheet date but before the financial statements are issued or available to be issued. The guidance requires public entities,
including the Company, to
evaluate subsequent events through the date that the financial
statements are issued. Financial statements are considered issued when they are widely
distributed to stockholders and other financial
statement users for general use and reliance in a form and format that
complies with U.S. GAAP. The guidance is effective for interim and annual
financial periods ending after June 15, 2009 and shall be applied on a prospective
basis.
In April 2008, the FASB issued new accounting guidance regarding the determination of
useful lives of intangible assets that amends the factors that should be
considered in developing renewal or extension
assumptions used for purposes of determining the useful
life of a recognized intangible asset. This guidance is
intended to improve the consistency between the
useful life of a recognized intangible asset under accounting
guidance related to goodwill and other intangible
assets and the period of expected cash flows used to measure the fair value of the asset
under accounting guidance related to business combinations and other
U.S. GAAP. This guidance is effective for fiscal years beginning after
December 15, 2008, and was adopted by us in the first quarter of
Fiscal 2009. The adoption of this guidance did not have a material effect on the
Company’s results of operations and financial
condition.
Standards Not Yet Adopted
In April
2009, the FASB issued new accounting guidance regarding the accounting for
assets acquired and liabilities assumed in a business combination due to
contingencies. This new guidance clarifies the initial and subsequent
recognition, subsequent accounting and disclosure of assets and liabilities
arising from contingencies in a business combination. This new guidance requires
that assets acquired and liabilities assumed in a business combination that
arise from contingencies be recognized at fair value, if the acquisition date
fair value can be reasonably estimated. If the acquisition-date fair value of an
asset or liability cannot be reasonably estimated, the asset or liability would
be measured at the amount that would be recognized using the accounting guidance
related to accounting for contingencies or the guidance for reasonably
estimating losses. This new accounting guidance becomes effective for us on
November 1, 2010; however, as the provision of the guidance will be applied
prospectively to business combinations with an acquisition date on or after the
guidance becomes effective, the impact to us cannot be determined until a
transaction occurs.
F-15
China Sky One Medical, Inc. and
Subsidiaries
Notes to Consolidated Financial Statements
4. Revenue
By Product Category and Geographic Region
In 2009, 2008 and 2007, overseas sales
were approximately $10,121,000, $7,570,000 and $12,404,000,
respectively.
Our total
revenues during fiscal 2009, 2008, and 2007 were approximately $130,092,000,
$91,816,000, and $49,318,000, respectively. The following table sets forth our
principal product categories based on application type and the approximate
amount and percentage of revenue from each of such product categories, during
the fiscal years ended December 31, 2009, 2008, and 2007:
|
For the Years Ended December
31,
($ in
thousands)
|
||||||
|
2009
|
2008
|
2007
|
||||
|
Product
Category
|
Sales
|
% of Sales
|
Sales
|
% of Sales
|
Sales
|
% of
Sales
|
|
Patches
|
$40,770
|
31.3%
|
$35,484
|
38.6%
|
$19,609
|
39.9%
|
|
Ointments
|
28,862
|
22.2%
|
23,068
|
25.1%
|
3,270
|
12.6%
|
|
Sprays
|
$18,499
|
14.2%
|
10,613
|
11.6%
|
8,742
|
18.7%
|
|
Diagnostic Kits
|
10,239
|
7.9%
|
8,781
|
9.6%
|
2,994
|
6.1%
|
|
Contract
Sales
|
$0
|
0.0%
|
5,655
|
6.2%
|
12,998
|
16.6%
|
|
Others
|
31,722
|
24.4%
|
8,215
|
8.9%
|
1,705
|
6.2%
|
|
Total
|
$130,092
|
100.0%
|
$91,816
|
100.0%
|
$49,318
|
100.0%
|
Year over year – 2009 to 2008
The
Company’s revenues increased in 2009 compared to 2008, primarily due to its cooperation with more reputable sales
agents and distributors, which have been able
to put the Company’s products in more extensive sales networks, and the full-year effect
of sales of products of Tianlong and Peng Lai, two of the
businesses the Company acquired in fiscal 2008. As a result of
signing agreements with these distributors, the sales
revenues for products in the patches, sprays, and diagnostic kits categories increased 14.9%, 74.3%, and
16.6% year over year. The revenue increase of approximately
$5,794,000 in the ointment category, and the
revenue increase of approximately $23,507,000 in other products category, are primarily due to the
Company’s increased spending in marketing and
advertising for certain products in these categories. Tianlong’s products generated approximately $43,138,000 and
$13,803,000 in 2009 and
2008, respectively. Revenue generated by Tianlong’s products are included in the ointment, spray and
other product categories. Peng Lai’s products generated approximately $11,188,000 and
$2,164,000 in 2009 and 2008, respectively. Revenue generated by Peng
Lai’s products are included in the other
product category.
Out of the 91 products the Company commercialized in fiscal
year 2009, 10 products accounted for approximately 68% of the
total revenue. Out of the 97 products the Company commercialized in fiscal
year 2008, 10 products accounted for approximately 72% of total
revenue.
Year over year – 2008 to 2007
During the fiscal year ended December 31, 2008, the Company
acquired Tianlong (April 2008), Haina
(April 2008) and Peng Lai (September 2008). The Company’s increase in revenues in 2008 as compared to 2007 was due to a combination of
these business
acquisitions, as well as the Company’s internal growth driven by increases in the revenues of
TDR and First.
The
Company’s internal growth was driven by increases in the revenues of TDR, which
increased from approximately $33,326,000 in 2007 to approximately $60,078,000 in
2008 and First, which increased from approximately $2,994,000 in 2007 to
approximately $8,781,000 in 2008. These increases were partially
offset by a decrease in the Company’s contract sales of approximately
$7,358,000, or 57%, from approximately $12,998,000 in fiscal 2007 to
approximately $5,640,000 in fiscal 2008, due primarily to our discontinuance of
contract sales of Tianlong products following the acquisition of Tianlong as of
April 3, 2008.
F-16
China Sky One Medical, Inc. and
Subsidiaries
Notes to Consolidated Financial Statements
|
4.
|
Revenue
By Product Category and Geographic Region
(Continued)
|
In 2008,
before TDR acquired Tianlong, the majority of the Company’s contract sales
consisted of products purchased from Tianlong. In 2008, TDR began to
discontinue contract sales, and in 2009, TDR discontinued contract sales as part
of its strategic goals and, in 2009 TDR discontinued contact sales. Revenues
derived from the sale of a Tianlong product of approximately $4,805,000 and
approximately $1,477,000 for 2007 and 2008 respectively, have been reallocated
to each of the appropriate product categories to present a more appropriate
measure of our revenues by product line.
Following
the Tianlong acquisition, the Company was able to fully integrate Tianlong’s
products into its marketing and distribution channels and increase overall
sales. As a result, the Company derived an aggregate of approximately
$13,803,000 from the sale of Tianlong’s products for the remainder of 2008, in
addition to approximately $1,447,000 of contract sales of Tianlong’s products
from January 1, 2008 through the Tianlong acquisition.
Prior to
the Company’s acquisition of Peng Lai, as of September 5, 2008, Peng Lai had
nominal production and operations. Following the acquisition, Peng
Lai contributed revenue of approximately $2,164,000 to the Company’s total
revenue in 2008.
Haina did not have an
established sales network and was
acquired only for its GSP license.
|
5.
|
Concentrations
of Business and Credit Risk
|
Substantially all of the Company's
long-lived assets and business operations are
located in the PRC.
The Company maintains certain bank
accounts in the PRC which are not
protected by FDIC insurance or other insurance.
As of December 31, 2009 the Company held approximately $1,960,000 of cash
balances within the
U.S. and all of the deposits were within the FDIC insurance
limits. At December 31, 2009, the Company had
approximately $50,796,000 in China bank deposits, which is not insured..
A significant amount of the
Company’s sales are concentrated in China. Accordingly, the Company is susceptible to
fluctuations in its business caused by adverse
economic conditions in
China. Difficult economic conditions in other
geographic areas into which the Company may expand may also adversely affect
its business, operations and
finances.
The Company provides credit in the normal course of business. The
Company performs ongoing credit evaluations of its customers and maintains allowances for
doubtful accounts based on factors surrounding the credit risk of specific customers,
historical trends, and other information.
The Company is self-insured for all risks and carries no liability
or property insurance coverage of any kind. The Company does not set aside any reserves for product
liability risks or other potential claims. The Company’s policy is to record losses
associated with its lack of insurance coverage at such time
as a realized loss is incurred. Historically, the Company has not
had any material losses in
connection with its lack of insurance coverage and was not
party to any material pending legal proceedings as of December 31, 2009. Management’s intention is to use the
Company’s working capital to fund any such losses incurred due to the Company’s exposure to inadequate insurance
coverage.
Payments
of dividends may be subject to some restrictions due to the Company’s operating
subsidiaries all being located in the PRC.
Major
Customers
For the year ended December 31, 2009, Harbin Shiji Baolong
Medicine Company and Shanxi Xintai
Medicine Company accounted for approximately 16% and 11% respectively of total
revenues. For the year ended December 31, 2009, Harbin Bao Da
Medicine Company and Harbin Shiji Baolong
Medicine Company accounted for approximately 16% and 14% respectively of all
accounts receivable. For the year
ended December 31, 2008, Shanxi Xintai and
Harbin Shiji Baolong
accounted for 15% and 12% respectively of total revenues. Harbin Shiji Baolong and
Shanxi Xintai accounted for approximately 29% and 11% respectively of all
accounts receivable. For the year
ended December 31, 2007, Ning BoYue Hua
Trading Company and Guang Zhou Xing He Trading Company accounted for approximately 14% and 11% of total revenues, respectively. Hua Li Jiu
Zhou Company
accounted for approximately 11% of all accounts receivable. No other customers accounted for 10% or more of our total revenues
or accounts receivable in 2009
and 2008.
F-17
China Sky One Medical, Inc. and
Subsidiaries
Notes to Consolidated Financial Statements
|
5.
|
Concentrations
of Business and Credit Risk
(Continued)
|
Major
Suppliers
Harbin Zhong Jia Medicine Company and Heilongjiang Kangda Medicine Company accounted for approximately 16% and
42% of the Company’s total inventory purchases for the year
ended December 31, 2009. Heilongjiang Kangda Medicine Company accounted for approximately 33% of the
Company’s total inventory purchases for the year
ended December 31, 2008. Harbin Yong Heng accounted for 23% of
the Company’s total inventory purchases for the year ended December 31, 2007. No other suppliers accounted for 10% or more of our total
inventory
purchases in 2009, 2008,
and 2007.
|
6.
|
Earnings per
Share
|
We have applied SFAS No. 128, “Earnings Per Share” in our calculation and presentation of
earnings per share - “basic” and “diluted”. Basic earnings per share are
computed by dividing net
earnings available to common shareholders (the numerator) by the
weighted average number of common shares (the denominator)
for the period presented. The computation of diluted earnings per share is similar to basic
earnings per share, except that the denominator is increased to include the number of additional
common shares that would
have been outstanding if the potentially dilutive
common shares had been issued.
Stock warrants to purchase 750,000 shares of common stock were
outstanding and exercisable as of December
31, 2009. Stock warrants and options to purchase 1,151,000 shares of common stock, all were
exercisable and outstanding during the year ended December 31, 2008. These common stock
equivalents were included in the computation of diluted earnings per share because the option
exercise prices were less
than the average market price of our common stock during these
periods. As of December 31,
2008, there were
12,500 options with
exercise price of $3.65 outstanding and remained unvested, These options were all cashless
exercised during the fiscal
year of 2009. Stock
warrants and options to purchase 1,617,483
shares of common stock were all exercisable and outstanding during the year ended December
31, 2007.
The dilutive potential common shares on
warrants and options is calculated in accordance with the treasury stock
method, which assumes that proceeds from the exercise of all
warrants and options are used to repurchase common stock at
the average market price of the common stock during the relevant
period. The amount of
shares remaining after the proceeds are exhausted represent s the potential dilutive
effect of the securities.
The following table sets forth our computation of basic and diluted net income per
share for the years ended
December 31, 2009, 2008 and 2007:
|
$ in
thousands,
except share and per share
data
|
||||||||||||
|
For the year ended December
31,
|
||||||||||||
|
Numerator:
|
2009
|
2008
|
2007
|
|||||||||
|
Net income used in calculation of
basic and diluted earnings per share
|
$ | 34,457 | $ | 28,857 | $ | 15,333 | ||||||
|
Denominator:
|
||||||||||||
|
Weighted-average common shares
outstanding used in calculation of
basic earnings per share
|
16,575,885 | 15,101,833 | 12,094,949 | |||||||||
|
Effect of dilutive
securities:
|
||||||||||||
|
Warrants and
Options
|
750,000 | 327,303 | 1,275,579 | |||||||||
|
Weighted-average common shares
used in calculation of diluted earnings per share
|
16,668,452 | 15,429,136 | 13,370,528 | |||||||||
|
|
|
|
|
|||||||||
|
Net income per
share:
|
||||||||||||
|
Basic
|
$ | 2.08 | $ | 1.91 | $ | 1.27 | ||||||
|
Diluted
|
$ | 2.07 | $ | 1.87 | $ | 1.15 | ||||||
F-18
China Sky One Medical, Inc. and
Subsidiaries
Notes to Consolidated Financial Statements
|
7.
|
Equity and Share-based
Compensation
|
Effective January 1, 2006, we
adopted the fair value recognition provisions
of SFAS No. 123R, Share-Based Payment (“SFAS No. 123R”), for options granted to employees and directors, using the
modified prospective transition method, and
therefore have not restated results from prior periods. Compensation cost
for all stock-based compensation awards granted is based on the grant date fair value
estimated in accordance with the provisions of
SFAS No. 123R. Under the fair value recognition provisions of SFAS No. 123R, we
recognize stock-based compensation net of an
estimated forfeiture rate and only
recognize compensation cost
for those shares expected to vest on a straight-line
prorated basis over the requisite service period
of the award. In March 2005, the SEC issued Staff Accounting Bulletin
(“SAB”) No. 107, Share-Based Payment (“SAB No. 107”), regarding the SEC’s guidance on SFAS No. 123R and the
valuation of share-based payments for public companies. We have
applied the provisions of SAB No. 107 in the adoption of SFAS No.
123R.
In July 2006, the Company’s stockholders approved the 2006 Stock Incentive Plan (the
“2006 Plan”). The 2006 Plan, provides for the grant
of stock options, restricted stock awards, and performance shares to
qualified employees, officers, directors,
consultants and other service providers. The 2006 Plan
originally
authorized the Company to grant options and/or
rights to purchase up to an aggregate of
1,500,000 shares of common stock. As of December 31, 2009, there have been a total of 198,202 common shares granted based on the 2006 Plan to Company employees and
consultants. These 198,202 common shares are
consisted as the following:
In 2006, non-qualified options to purchase a total of 113,500
shares were granted under the 2006 Stock Incentive
Plan to certain company employees and
consultants. All options had an exercise price of $3.65 per share. All these options were cashless exercised at various prices during
2009 in exchange for 85,295 common
shares.
In 2007, a total of 30,000 common shares
were granted to certain company employees at a fair value of $195,000.
In 2008, a total of 30,063 common shares
were granted to certain company employees, consultants, and independent directors at a fair value of $316,000.
In 2009, a total of 52,844 common shares
were granted to certain company employees,
consultants, and independent directors.
The fair value of these
shares is determined to be approximately $1,242,000
based on the stock closing price
at the date of the
grant.
In 2009, we issued an aggregate of 355,239
shares of our common stock
in connection with their exercise of outstanding warrants and stock options of ours, as
follows:
|
·
|
In January
2009, warrants to purchase an aggregate
of 8,334
shares of our common stock, which we issued to “accredited” investors in connection with the
private offering we completed in October 2006 (the
“2006
Offering”), were cash
exercised at a price of $3.50 per share,
for an aggregate proceeds of
$29,169.
|
|
·
|
In January and May 2009,
warrants to purchase an aggregate of
300,000 shares of our common stock at $2.00 per share, which we issued to
a consultant in consideration for services rendered in connection with the
share exchange transaction we
consummated in May
2006, were exercised
on a cashless basis
at various prices in
exchange for 261,610 common
shares.
|
|
·
|
In 2006, non-qualified options to
purchase a total of 113,500 shares were granted under the 2006
Stock Incentive Plan
to certain
Company employees and
consultants. All options had an exercise
price of $3.65 per share. All these options were cashless
exercised in various prices during
2009 in exchange for 85,295
common shares.
|
F-19
China Sky One Medical, Inc. and
Subsidiaries
Notes to Consolidated Financial Statements
|
8.
|
Securities Purchase Agreement and
Related
Transaction
|
On January 31, 2008 (the “Closing Date”), the Company entered into a Securities Purchase Agreement
(the “Purchase
Agreement”) with certain
accredited investors (the “Investors”), for the purchase and sale of
units consisting of an aggregate of: (i)
2,500,000 shares of the Company’s common stock, and (ii) Class A
Warrants to purchase 750,000
additional shares of the
Company’s common stock exercisable at $12.50 per
share, and expiring on July 31, 2011 (the “Class A Warrants”), for a purchase price of $10.00 per
unit (the “Unit Purchase
Price”), or gross offering
proceeds of $25.0 million (the “2008 Offering”). The Company
received net proceeds of approximately $23.5 million in
connection with the 2008 Offering.
Pursuant to the Purchase Agreement,
among other things, if, and whenever, within twelve (12) months of the Closing
Date, the Company issues or
sells, or is deemed to have issued or sold, any shares of common stock, or
securities convertible into or exercisable for shares of common stock, or
modifies any of the foregoing which may be outstanding (with the exception of
certain excluded securities), to any person
or entity at a price per share, or conversion or exercise price per share less
than the Unit Purchase Price, then the Company shall issue, for each such
occasion, additional shares of its common stock to the Investors in such number so that the average
per share purchase price of the shares of common stock purchased by the
Investors in the 2008 Offering shall automatically be reduced to such other
lower price per share. At December 31, 2009,
management deemed the estimated fair value of this derivative
warrant liability to be immaterial.
In addition, as of the Closing Date, the
Company entered into a Make Good Agreement (the
“Make Good
Agreement”) with Liu
Yan-Qing, its Chairman, Chief Executive Officer and President, and a principal
shareholder of the Company, (the “Principal Shareholder”) and the Investors (collectively, the
“Make Good
Parties”), pursuant to
which the Principal Shareholder deposited 3,000,000 shares of his common stock of
the Company (the
“Escrow Shares”) into escrow, to be released to the Investors in an amount pro rata
pro to their initial investments in the 2008 Offering, in the event the
Company failed to attain earnings per share, as
adjusted, of at least (i) $1.05 per share for the fiscal year
ending December 31, 2007 (based on an aggregate of 13,907,696 shares
outstanding), and/or (ii) $1.63 per share
for the fiscal year ending December 31, 2008 (based on 16,907,696 shares outstanding).
The Company deems the Escrow Shares
arrangement as analogous to the issuance of a fixed number of warrants in an equity transaction. Under the
Make Good Agreement these Escrow Shares would have
been reallocated on a pro rata basis to the Investors only if certain
earnings targets were not achieved in years 2007 and 2008. If the earnings
targets were met, the Escrow Shares would
automatically be released to the Principal Shareholder. As of
January 31, 2008, the date the common shares were placed into escrow, the Company
achieved the 2007 earnings target and,
based upon internal forecasts, was confident the 2008 target would
also be met. Based upon certain assumptions, including the
low probability that the Escrow Shares would be released to the Investors and not be
returned to the Principal Shareholder, the
Company considered the fair value of the right held by the
Investors through the Escrow Shares provision under the Make Good Agreement to
be immaterial. As of
December 31, 2008, the Company satisfied the earnings per common share
targets for each of fiscal 2007 and 2008 as
defined under the Make Good Agreement and, as
such, the Escrow Shares shall be released to the Principal Shareholder in 2009.
The Class A Warrants represent the right to purchase an
aggregate of 750,000 shares of common stock, at an exercise price of $12.50 per
share. Additional information relating to these Class A Warrants is provided in Note 9.
|
9.
|
Outstanding
Warrants and Options
|
|
Shares
Underlying Warrants
|
Weighted
average
Exercise
Price
Warrants
|
Shares
underlying
Options
|
Weighted
average
Exercise
Price
Options
|
|||||||||||||
|
Outstanding as of December 31,
2008
|
1,050,000 | $ | 9.50 | 113,500 | $ | 3.65 | ||||||||||
|
Exercised (See Note
7)
|
(300,000 | ) | (50,000 | ) | (113,500 | ) | (113,500 | ) | ||||||||
|
Outstanding as of December 31,
2009
|
750,000 | $ | 12.50 | - | - | |||||||||||
F-20
China Sky One Medical, Inc. and
Subsidiaries
Notes to Consolidated Financial Statements
|
9.
|
Outstanding
Warrants and Options (Continued)
|
The following table summarizes
information about stock warrants outstanding and exercisable as of December
31, 2009.
|
Exercise
Price
|
Outstanding
December 31,
2009
|
Weighted
Average
Remaining
Life in
Years
|
Number
exercisable
|
||||||||||
|
$ 12.50
|
750,000 | 3.0 | 750,000 | ||||||||||
| 750,000 | 750,000 | ||||||||||||
The remaining Class A Warrants represent the right to purchase an
aggregate of 750,000 shares
of Common Stock of the Company granted with the Securities Purchase Agreement,
at an exercise price of $12.50 per share, all were exercisable as of December 31, 2009, and have the following additional
characteristics:
The Class A Warrants issued in our January 2008 Offering
described in Note 8 above, represent the right to purchase
an aggregate of 750,000 shares of common stock, at an exercise price of $12.50
per share, and have the following additional
characteristics:
|
·
|
The Class A Warrants are exercisable beginning on the
six-month anniversary of the closing of the January 2008 Offering and will
expire July 31, 2011.
|
|
·
|
Commencing on one-year anniversary
of the Closing Date,
in the event the Warrant Shares may not be freely sold by the holders of
the Class A Warrants due to the Company’s failure to satisfy its registration
requirements, and an exemption for such sale
is not otherwise available to the Warrant-holders under Rule 144, the Class A
Warrants will be exercisable on a cashless
basis. The Company
accounts for this warrant derivative liability
in accordance with
ASC 815.
|
|
·
|
The Exercise Price and number of
Warrant Shares will be subject to adjustment for standard dilutive
events, including the issuance of common
stock, or securities convertible into or exercisable for shares of common
stock, at a price per share, or conversion or exercise price per share
less than the Class A Warrant exercise price of $12.50 per share.
There was no issuance
of securities during 2009 which would have
resulted in an adjustment to the Exercise
Price or number of Warrant Shares. At December 31, 2009, the Company
recorded an expense and related derivative liability
of $1,330,000. The Company’s significant assumptions to
calculate the derivative liability at December 31, 2009 included (i) life of warrants of 3.7 years; (ii)
expected volatility of 68%; (iii) a risk
free interest rate of 2.16% and a
(iv) a
risk-neutral probability that the
stock price will be below $12.50 at warrant expiration of
12%.
|
|
·
|
At anytime following the date a
Registration Statement covering the Warrant Shares is declared effective, we will have the ability to call
the Class A Warrants at a price of $0.01 per Class A
Warrant, upon thirty (30) days prior written notice to the holders of the
Class A Warrants, provided (i) the closing price of the
Common stock exceeded $18.75 for each of the ten (10)
consecutive trading days immediately preceding the date that the call notice
is given by the Company, and (ii) the Company has attained an Adjusted EPS of at least $1.75 per share
for the fiscal year ending December 31, 2008, as set forth in our
audited financial statements of the
Company.
|
|
·
|
If, among other things, we fail to
cause a Registration Statement covering the Warrant Shares to be
declared effective prior to the applicable
dates set forth in the Registration Rights Agreement, the expiration date of
the Class A Warrants shall be extended one day for each day beyond the
Effectiveness Deadlines. The Company engaged an independent third-party consultant to calculate
the derivative liability using the Black Scholes model
resulting from
its failure to register the Warrant
Shares. The estimated registration rights derivative liability was
determined to be immaterial as of
December 31,
2008.
|
F-21
China Sky One Medical, Inc. and
Subsidiaries
Notes to Consolidated Financial Statements
|
9.
|
Outstanding
Warrants and Options (Continued)
|
|
·
|
If a Warrant-holder exercises
its Put Right under the Put Agreement
(as previously defined above), such
Warrant-holder’s right to exercise the Class A
Warrants shall be suspended, pending the satisfaction of our
obligations to pay the Warrant-holder the applicable Repurchase Price.
Upon receipt of the Repurchase Price in full by the Warrant-holder, the
Warrant-holder’s right to exercise the Class A
Warrants shall automatically and
permanently terminate and expire, and
the Class A Warrants shall be immediately cancelled on the books of the
Company.
|
|
10.
|
Inventories
|
The Company values its inventories at the lower of
cost and market method.
Inventories are accounted for using the first-in, first-out
method. Inventories include packing materials, raw materials, supplemental
materials, work-in-process, and finished products.
As of December 31, 2009 and 2008, inventories consist of the
following:
|
$ in thousands
|
||||||||
|
December 31,
2009
|
December 31,
2008
|
|||||||
|
Raw
Material
|
$ | 1,192 | $ | 330 | ||||
|
Work-in-Process
|
578 | 76 | ||||||
|
Finished Products
|
642 | 56 | ||||||
|
Total
Inventories
|
$ | 2,413 | $ | 462 | ||||
The
increase in our inventory level at December 31, 2009 versus December 31, 2008 is
principally due to the 42% increase in our 2009 revenue compared to 2008. The
increased inventory level at December 31, 2009 is deemed sufficient to support
our estimated sales in the near term of 2010.
Historically,
our inventory is at its lowest levels at the end of each calendar year and in
the first fiscal quarter. We draw down our inventory levels in December of each
year for two main reasons. First, our customers want to receive goods prior to
the holiday season. In addition, the first calendar quarter is
traditionally our slowest sales period. Since a lower volume of sales activity
normally occurs during the first quarter of each calendar year, we believe it is
prudent to avoid incurring unnecessary inventory carrying costs. At the
appropriate time toward the end of the first calendar quarter of each fiscal
year, we begin to ramp up its inventory levels to prepare for increased demand
during the coming stronger selling periods.
Historically,
we signed agreements with suppliers that allowed us to hold extra raw materials
at the cost of the suppliers. As a result, we could minimize our own inventory
carrying costs, and improve our cash management, by keeping the inventory at the
minimum level required to support the short-term sales. However, due to price
increases of raw materials, in addition to overhead costs for storing such raw
materials, the Company started to increase the inventory levels at our own cost
at the end of year 2009.
F-22
China Sky One Medical, Inc. and
Subsidiaries
Notes to Consolidated Financial Statements
|
11.
|
Property and Equipment,
net
|
As of
December 31, 2009 and 2008, Property and Equipment, net consist of the
following:
|
$ in thousands
|
||||||||
|
December
31,
|
December 31,
|
|||||||
|
2009
|
2008
|
|||||||
|
Buildings and
improvements
|
$ | 10,570 | $ | 9,962 | ||||
|
Machinery and
equipment
|
5,868 | 4,946 | ||||||
|
Transportation
equipment
|
955 | 886 | ||||||
|
Furniture and
equipment
|
325 | 299 | ||||||
|
Total Property and
Equipment
|
17,718 | 16,093 | ||||||
|
Less: Accumulated
Depreciation
|
(2,227 | ) | (1,297 | ) | ||||
|
Property and Equipment,
Net
|
$ | 15,491 | $ | 14,796 | ||||
For the
years ended December 31, 2009, 2008 and 2007, annual depreciation expense
totaled $926,000, $584,000 and $187,000, respectively.
Depreciation
expense included with Cost of Goods Sold for 2009, 2008 and 2007, amounted to
$491,000, $226,000, and $68,000, respectively.
|
12.
|
Intangible
Assets, net
|
Intangible
assets consists of proprietary technologies that we purchased during our normal
course of business. The SFDA licenses for drug batch numbers and goodwill were
acquired in connection with our business acquisitions of Tianlong and Peng Lai
in 2008.
A breakdown of our intangible assets, net by subsidiaries as of December 31, 2009 is as follows::
|
Intangible
Assets as of December 31, 2009, net
($
in Thousands)
|
||||||
|
Item
|
TDR
|
Haina
|
Tianlong
|
First
|
Peng
Lai
|
Total
|
|
Proprietary
Technologies
|
$1,275
|
-
|
$5,034
|
$11,854
|
-
|
$18,163
|
|
SFDA
licenses for drug batch numbers
|
-
|
-
|
$1,751
|
-
|
$4,441
|
$6,192
|
|
Goodwill
|
$406
|
$353
|
-
|
-
|
-
|
$759
|
|
Total
|
$1,681
|
$353
|
$6,785
|
$11,854
|
$4,441
|
$25,114
|
Historically,
we included our proprietary technologies and SFDA licenses for drug batch
numbers under the category of patents. We now believe it is more
accurate to categorize such IP in separate categories.
As of December 31, 2009, the weighted
average amortization period
for our proprietary technologies and SFDA licenses for drug batch
numbers is approximately 8
years.
F-23
China Sky One Medical, Inc. and
Subsidiaries
Notes to Consolidated Financial Statements
|
12.
|
Intangible
Assets, net (Continued)
|
A breakdown of our intangible
assets, net by subsidiaries as of December 31, 2008
is as follows:
|
Intangible Assets as of December 31, 2008,
net
($ in
thousands)
|
||||||
|
Item
|
TDR
|
Haina
|
Tianlong
|
First
|
Peng Lai
|
Total
|
|
Proprietary
Technologies
|
$1,471
|
-
|
-
|
$6,739
|
-
|
$8,210
|
|
SFDA
licenses for drug batch numbers
|
-
|
-
|
$1,947
|
-
|
$4,936
|
$6,883
|
|
Goodwill
|
$406
|
$353
|
-
|
-
|
-
|
$759
|
|
Total
|
$1,877
|
$353
|
$1,947
|
$6,739
|
$4,936
|
$15,852
|
The
increase in intangible assets of approximately $9.3 million in 2009 compared to
2008 is primarily due to our acquisitions of proprietary technologies by
Tianlong and First during the fourth quarter of 2009. These proprietary
technologies include Antroquinonol for the treatment of lung and liver cancers
and Small RNA diagnosing technology used for detecting heart diseases in its
early stage.
Amortization expense of our intangible
assets with finite lives for each of the years
ended December 31, 2009, 2008 and 2007 was approximately $1,821,000, $274,000 and $256,000 respectively.
Future amortization for the next five years and thereafter is as
follows:
|
Years Ended December
31,
|
$ in
thousands
|
|||
|
2010
|
$ | 2,717 | ||
|
2011
|
$ | 2,717 | ||
|
2012
|
$ | 2,717 | ||
|
2013
|
$ | 2,715 | ||
|
2014
|
$ | 2,715 | ||
|
Thereafter
|
$ | 10,773 | ||
|
|
$ | 24,355 | ||
|
13.
|
Taxes
Payable
|
Taxes payable for the years ended December 31, 2009, 2008, and
2007 consists of the following:
|
December
31,
|
||||||||||||
|
($ in
thousands)
|
||||||||||||
|
2009
|
2008
|
2007
|
||||||||||
|
Value Added Tax,
net
|
$ | 1,291 | $ | 1,179 | $ | 612 | ||||||
|
Enterprise Income Tax
|
2,452
|
2,107 | 941 | |||||||||
|
City Tax
|
43 | 32 | 5 | |||||||||
|
Other Taxes and
additions
|
86
|
45 | 9 | |||||||||
|
Total Taxes
Payable
|
$ | 3,873 | $ | 3,363 | $ | 1,567 | ||||||
F-24
China Sky One Medical, Inc. and
Subsidiaries
Notes to Consolidated Financial Statements
|
14.
|
Income
Taxes
|
Under the Provisional Regulations of PRC
Concerning Income Tax on Enterprises promulgated by the PRC, income tax is payable by enterprises at
a rate of 25% of their taxable income. Preferential tax treatment may, however,
be granted pursuant to any law or regulations from
time to time promulgated by the State
Council.
According to “Enterprise Income Tax and Certain
Preferential Policies Notice” published by the Ministry of Finance and the
National Tax Affairs Bureau, if the enterprise is authorized by the State Council as a special
entity, the enterprise income tax rate is reduced to 15%. The following table sets force the income tax rate for TDR and its subsidiaries for the years ended December 31, 2009, 2008 and 2007:
|
Income
Tax Rate
|
2009
|
2008
|
2007
|
|
TDR
|
15%
|
15%
|
15%
|
|
First
|
15%
|
25%
|
25%
|
|
Tianlong
|
15%
|
12%
|
-
|
|
Haina
|
25%
|
25%
|
-
|
|
Peng
Lai
|
2%
of Revenue
|
25%
|
-
|
The Company’s effective tax rate was approximately
23.4% in fiscal 2009. If
the Company’s effective tax rate was 25% in 2009,
its net income will be $33,720,000, basic
earnings per share and diluted earnings per share would be $2.03 and
$2.02, respectively.
The Company’s effective tax rate was approximately
20.1% in fiscal 2008. If the Company’s effective tax rate was 25% in
2008, its net income will be $27,355,000, basic earnings per share and
diluted earnings per share would be
$1.81 and $1.77, respectively.
The Company’s effective tax rate was approximately
17.8% in fiscal 2007. If the Company’s effective tax rate was 25% in 2009,
its net income will be $13,989,000, basic earnings per
share and diluted earnings per share would be
$1.16 and $1.05, respectively.
We record a full valuation allowance to
reduce our deferred tax assets to the amount that is more likely than
not to be realized. While we have considered future taxable income and ongoing
prudent and feasible tax planning strategies in assessing the need for the valuation allowance, in the
event we were to determine that we would be able to realize our
deferred tax assets in the future in excess of its net recorded amount, an adjustment to the
deferred tax asset would increase income in the
period such determination was made.
Pursuant
to Sections 382 and 383 of the Internal Revenue Code (“IRC”), annual use of the
Company’s net operating losses and tax credit carryforwards may be limited
because of cumulative changes in ownership of more than 50% that have occurred.
As of December 31, 2009, the Company has US net operating loss carryforwards of
approximately $8.8 million which will begin to expire in
2029. Accordingly, as mentioned above, any deferred tax asset that
would result from these carryforwards have been fully reserved as of December
31, 2009.
Provision for the PRC enterprise income tax is
calculated at the prevailing rate based on the estimated assessable profits less available tax relief for losses
brought forward. The Company does not accrue taxes on unremitted earnings from foreign operations as it
is the Company’s intention to invest these earnings in
the foreign operations indefinitely.
F-25
China Sky One Medical, Inc. and
Subsidiaries
Notes to Consolidated Financial Statements
|
14.
|
Income Taxes
(Continued)
|
Net deferred tax assets consist of the following
components as of December 31, 2009 and 2008:
|
December 31,
($ in
thousands)
|
||||||||
|
2009
|
2008
|
|||||||
|
Deferred
tax
assets:
|
||||||||
|
NOL Carryover from China Sky One
(formerly known as Comet)
|
$ | 2,566 | $ | 1,646 | ||||
|
Share-based compensation expenses
based on SFAS 123R
|
422 | 121 | ||||||
| 2,988 | 1,767 | |||||||
|
Less valuation
allowance
|
(2,988 | ) | (1,767 | ) | ||||
|
Net deferred tax asset
|
$ | - | $ | - | ||||
The Company recognizes that virtually
all tax positions in the PRC are not free of some degree of uncertainty due to
tax law and policy changes by the state. However, the Company cannot reasonably
quantify political risk factors and thus must depend on guidance issued by current state
officials.
Based on all known facts and circumstances and current tax law,
the Company believes that the total amount of unrecognized tax benefits as of December 31, 2009, is not material to its results of operations, financial condition or cash
flows. The Company also believes that the total amount of unrecognized tax
benefits as of December 31, 2009, if recognized, would not have a
material effect on its effective tax rate. The Company further
believes that there are no
tax positions for which it is reasonably possible, based on current Chinese tax law and policy,
that the unrecognized tax benefits will significantly increase or decrease
over the next 12 months producing, individually or in the aggregate, a material effect on the
company’s results of operations, financial position or
cash flows.
The
Company’s corporate tax returns are subject to examination in both China and the
U.S. for the years 2006 through 2009.
|
15.
|
Land Use Rights and Construction in Progress
|
The Company considers the fact that, in the PRC, there is no land ownership but
rather the land use right
and it is more appropriate
to allocate land use rights under a separate category and amortize land use
rights based on 50 years of the land use rights, or the term of the lease. The land use rights are approximately $4,586,000
and $1,945,000 for the years ended December 31, 2009
and 2008, respectively.
During the second quarter in 2007 TDR
entered into an agreement with the Development and Construction Administration
Committee of Harbin Song Bei New Development district to purchase the land use
rights for 50 years for the development of a new biotech
engineering project.
We spent approximately
$9.9 million, $730,000, and $2.1 million in the years of 2009, 2008, and 2007 respectively for this construction in
progress. The
Company moved into its new facilities in January 2010 and anticipates the final
stage of construction will be completed during the third quarter of 2010 at an
additional cost of approximately $3.0 million.
|
16.
|
Commitments and
Contingencies
|
The formulation, manufacturing,
processing, packaging, labeling, advertising, distribution and sale of external
use Chinese medicine such as those sold by the
Company are subject to
regulations by one or more federal agencies. The principal
federal agencies include the State Food and
Drug Administration of the Government of the Peoples Republic of China, the Food
and Drug Administration (the “FDA”), Heilongjiang Provincial Food and Drug
Administration of the People's Republic of China (“PFDA”), National Biology
Products Inspection Institute (“NBPI”) and the
National Food and Drug Administration (“NFDA”) of the People's Republic of China
and, to a lesser extent, the Consumer Product Safety Commission.
These activities are also regulated by various governmental agencies for
the countries, states and localities in which the Company’s products are sold.
Although management believes that the
Company is in material
compliance with the statutes, laws, rules and regulations of every jurisdiction
in which it operates, no assurance can be given that the Company’s compliance with the applicable
statutes, laws, rules and regulations will not be challenged by governing authorities or private
parties, or that such
challenges will not have a material adverse effect on the Company’s financial position, results of operations, or cash
flows.
F-26
China Sky One Medical, Inc. and
Subsidiaries
Notes to Consolidated Financial Statements
|
16.
|
Commitments and Contingencies
(Continued)
|
The Company, like any other distributor
or manufacturer of products is exposed to the inherent risk of
product liability claims in the events of possible injuries caused by the use
of its products. The Company does not have liability
insurance with respect to product liability claims; the
insurance environment of China is neither sufficient nor mature.
Inadequate insurance or lack of contractual indemnification from parties
supplying raw materials or marketing its products, and product liabilities related to defective products could have a material adverse
effect on the consolidated financial
statements of the Company.
The Company is not involved in any legal matters arising in the
normal course of business. While incapable of estimation, in the opinion of the
management, the individual regulatory and legal matters in which the Company
might be involved in the future are not expected to have a material adverse
effect on the Company’s consolidated financial position, results of operations, or cash
flows.
|
17.
|
Quarterly Results (Unaudited)
|
The following table presents the Company’s selected unaudited quarterly operating
results for the eight quarters
ended December 31,
2009. The Company believes
that all adjustments of a normal recurring natural have been
made to present fairly the related quarterly results:
|
$ in thousands, except per share
data
|
||||||||||||||||||||
|
Year 2009
|
First
Quarter
|
Second
Quarter
|
Third
Quarter
|
Fourth
Quarter
|
Total
|
|||||||||||||||
|
|
|
|||||||||||||||||||
|
Revenues
|
$ | 24,834 | $ | 32,182 | $ | 43,227 | $ | 29,850 | $ | 130,092 | ||||||||||
|
Gross
profit
|
$ | 18,793 | $ | 24,429 | $ | 32,330 | $ | 22,870 | $ | 98,422 | ||||||||||
|
Income from
operations
|
$ | 9,051 | $ | 12,082 | $ | 16,030 | $ | 9,088 | $ | 46,251 | ||||||||||
|
Net income
|
$ | 7,243 | $ | 9,457 | $ | 12,459 | $ | 5,298 | $ | 34,457 | ||||||||||
|
Basic EPS
|
$ | 0.44 | $ | 0.57 | $ | 0.75 | $ | 0.32 | $ | 2.08 | ||||||||||
|
Diluted EPS
|
$ | 0.43 | $ | 0.57 | $ | 0.74 | $ | 0.32 | $ | 2.07 | ||||||||||
|
$ in thousands, except per share
data
|
||||||||||||||||||||
|
Year 2008
|
First
Quarter
|
Second
Quarter
|
Third
Quarter
|
Fourth
Quarter
|
Total
|
|||||||||||||||
|
|
|
|||||||||||||||||||
|
Revenues
|
$ | 12,413 | $ | 23,749 | $ | 29,699 | $ | 25,955 | $ | 91,816 | ||||||||||
|
Gross
profit
|
$ | 9,553 | $ | 18,226 | $ | 22,333 | $ | 19,300 | $ | 69,413 | ||||||||||
|
Income from
operations
|
$ | 4,850 | $ | 10,128 | $ | 11,751 | $ | 8,931 | $ | 35,659 | ||||||||||
|
Net income
|
$ | 3,865 | $ | 8,111 | $ | 9,943 | $ | 6,938 | $ | 28,857 | ||||||||||
|
Basic EPS
|
$ | 0.26 | $ | 0.54 | $ | 0.66 | $ | 0.45 | $ | 1.91 | ||||||||||
|
Diluted EPS
|
$ | 0.25 | $ | 0.53 | $ | 0.64 | $ | 0.45 | $ | 1.87 | ||||||||||
F-27
Item 9. Changes In and
Disagreements With Accountants on Accounting and Financial
Disclosure.
None.
Item 9A. Controls and
Procedures.
Management’s Evaluation of Disclosure Controls and
Procedures
Our management, with the
participation of our chief
executive officer and chief financial officer, evaluated the effectiveness of our disclosure
controls and procedures as of December 31, 2009. The term “disclosure controls and procedures,” as defined in Rules 13a-15(e) and 15d-15(e) under the
Securities Exchange Act, means controls and other procedures of a company that are
designed to ensure that information
required to be disclosed by a company in the reports that it files or submits under the Securities Exchange Act are
recorded, processed, summarized and reported within the time periods
specified in the SEC’s rules and forms. Disclosure
controls and procedures include, without limitation,
controls and procedures designed to ensure that information
required to be disclosed by a company in the reports that it files or submits under the Exchange Act are
accumulated and communicated to the company’s management, including its principal executive and principal financial officers, as
appropriate to allow timely decisions regarding required disclosure. Our management recognizes
that any controls and procedures, no matter how well
designed and operated, can provide only reasonable assurance
of achieving their
objectives and management necessarily applies its judgment in evaluating the
cost-benefit relationship of possible controls
and procedures. Our disclosure controls and
procedures are designed to provide reasonable assurance
of achieving their
objectives as described above. Based on this evaluation, our management,
including our chief executive officer and chief financial officer, concluded that as of December 31, 2009, our disclosure controls and procedures were effective at the reasonable assurance
level.
Management’s Annual Report on Internal Control over
Financial Reporting
Our management is responsible for
establishing and maintaining adequate internal control over our
financial reporting.
Internal control over financial reporting is defined in Rule 13a-15(f) or 15d-15(f) under the Securities
Exchange Act as a process designed by, or under the supervision of, a
company’s principal executive and principal
financial officers and
effected by a company’s board of directors, management and
other personnel to provide reasonable assurance regarding the reliability of
financial reporting and the preparation of financial statements in accordance with U.S. generally
accepted accounting principles and includes
those policies and procedures that:
|
·
|
pertain to the maintenance of
records that, in reasonable detail, accurately and fairly reflect the
transactions and dispositions of the assets of a company;
|
|
·
|
provide reasonable assurance that
transactions are recorded as necessary to permit
preparation of financial statements in accordance with U.S. generally
accepted accounting principles and that
receipts and expenditures of a
company are being
made only in accordance with authorizations of management and directors of
a company; and
|
|
·
|
provide reasonable assurance
regarding prevention or timely detection of unauthorized acquisition, use, or disposition
of a company’s assets that could have a material effect
on the financial statements.
|
Our internal control system was
designed to provide reasonable assurance to our
management and board of directors regarding the preparation and fair
presentation of
published financial statements. All internal control systems, no matter
how well designed, have inherent limitations which may
not prevent or detect misstatements. Therefore, even those systems
determined to be effective can provide
only reasonable assurance
with respect to financial statement preparation and presentation. Projections of any evaluation of
effectiveness to future periods are subject to the risk that controls may become
inadequate because of changes in conditions, or that the degree of compliance with the
policies or procedures may
deteriorate.
Our management assessed the effectiveness of our internal
control over financial reporting as of December 31, 2009. In
making this assessment, management used the criteria set forth by the Committee
of Sponsoring Organizations of the Treadway Commission in Internal
Control-Integrated Framework.
Based on
this assessment, management concluded that, as of December 31, 2009, our
internal control over financial reporting was effective based on those
criteria.
50
Attestation Report of the Registered
Public Accounting Firm
The
effectiveness of our internal control over financial reporting as of December
31, 2009 has been audited by MSPC
Certified
Public Accountants and Advisors, an independent registered public accounting
firm, as stated in their attestation report, which is included as apart of our
2009 Financial Statements filed as Item 8 of this report.
Changes in Internal Control Over
Financial Report
During our fourth fiscal quarter, there
was no change in our
internal control over financial reporting that has materially affected, or is reasonably likely to materially
affect, our internal controls over financial reporting.
Item 9B. Other
Information.
Except as
set forth below, there was no information we were required to disclose in a
report on Form 8-K during the fourth quarter of our fiscal year ended December
31, 2009, or subsequent period through the date hereof, which was not so
reported.
51
PART III
Item 10. Directors,
Executive Officers and Corporate Governance.
Directors and Executive Officers
The following table sets forth certain information regarding our
directors and executive officers during the fiscal year ended December 31, 2009, and the subsequent period through the
date hereof:
|
Name
|
Age
|
Position
|
||
|
Liu
Yan-qing
|
46
|
Chief
Executive Officer, President and Chairman of the Board of
Directors
|
||
|
Han
Xiao-yan
|
43
|
Vice
Chairman and Director
|
||
|
Stanley
Hao
|
39
|
Chief
Financial Officer, Secretary
and Director
|
||
|
Song
Chun-fang
|
70
|
Director
|
||
|
William
Wei Lee
|
55
|
Director
|
||
|
Zhao
Jie
|
47
|
Director
|
||
|
Qian
Xu-feng
|
42
|
Director
|
The following information
reflects the business background and
experience of each director
and executive officer:
Liu
Yan-qing has been our Chairman, Chief Executive Officer and
President since May
2006, a Director of TDR since September 2000, and General Manager of
First since April
2003. Mr. Liu graduated from Prophylactic Department of Harbin
Medicine University, where he
obtained his bachelor’s degree. In 2005, he studied at Tsing Hua University and earned an Executive Masters of
Business.
Han
Xiao-yan has
been our Vice Chairman and
Director since May
2006, a General Manager of TDR since September 2004, and Vice Director of First since April 2003. She also serves as our senior marketing
manager and administrative manager. Ms. Han received a master of business
administration at Harbin Industrial University.
Stanley Hao has been employed by us in various capacities since June 2008 and as Chief Financial Officer, Secretary and
a Director since
November 2008. From January 2006 through June 2008, Mr.
Hao served as President’s Assistant and Financial Officer for
Sumitomo Group Canadian Branch, an integrated trading company. Prior to this, commencing in September
2004, Mr. Hao served as Marketing Executive and Canadian
Market Analyst for MGM Mirage, an entertainment company which owns
and operates casino properties. From September 1997 through the time he
joined MGM Mirage, he was Chief Executive
Officer of SunnyZone Consulting Co. Ltd., a financial consulting company he
co-founded. Mr. Hao holds a Bachelor’s degrees in Economics and
Arts from Beijing Union University and an MBA from the University of Phoenix.
Song Chun-fang joined our board of directors on February 22,
2008. From 1964 to the present, Mr. Song has been
employed by the First Clinical College of Harbin
Medical University in Heilongjiang, China, where he has served as the Director of the Surgery Research
Room and the Director of graduate students of the Surgery Department since 1996.
From 1998 to the present, he has been
the acting Director of the Heilongjiang Professional Surgery Committee, the
Commissary of the Degree Commission of China, the Director of the Key Laboratory
of Cell Transplantation of
the Ministry of Public Health of China, the Vice-Chairman of the Heilongjiang
Medicine Association, the Vice-Chairman of
the Heilongjiang Physician Association, and the Director of Heilongjiang
(Special) Medical Treatment Application
Administration
Committee. Mr. Song received a Bachelor’s Degree in Medical Treatment from Harbin Medical University in 1964.
William Wei Lee joined our board of directors on August 4,
2009. He has been a Managing Director with
Transworld Capital Group, a U.S. investment service firm specializing in
cross-border M&A and fund raising between U.S. and China, since January
2007, with a break between April 2008 and November 2008, when he served as Chief
Operating Officer (on loan) for Legend Media Corporation, a U.S.-listed company
specializing in radio advertising in China. From April 2004 through
December 2006, he served as Director of Strategic Development at TNT N.V., an
Amsterdam-based provider of postal and logistics services, where he was
responsible for M&A and China business strategy. Prior to this,
between June 2003 and March 2004, he was a Project Manager at Roland Berger
Strategy Consultants Ltd. Mr. Lee earned a Master’s degree in
Political Science from North Illinois University in 1989 and a Ph.D.
in Political Science from Massachusetts Institute of Technology in 1994, where
he completed MBA course work at Sloan School. He completed
post-doctoral studies at the Fairbank Center for East Asia Studies, Harvard
University, in 1995.
52
Zhao Jie joined our board of directors on February 22,
2008. From 1999 to the present, Mr. Zhao has served as the Tissue Specialist of the Replant
Department of Capital Health Transplant Services in Alberta, Canada, responsible for various
aspects of tissue transplantation, including
determining donee acceptability, processing and preserving tissue,
performing surgical procedures, and quality control. In addition, he has written and
published several books and articles regarding
tissue transplantation. Mr. Zhao has received awards from Capital Health for Quality and Safety (2006),
Recognition of Excellence and Achievement (2002), and Teamwork
(2002). He received a Bachelor’s Degree in Medicine from Harbin Medical University in 1988.
Qian Xu-feng joined our board of directors on February 22,
2008. From March 2005 to the present,
Ms. Qian has been employed by Moody’s Investors
Service. From
May 2007 to the present, she has been the Vice President and Senior Analyst,
from May 2006 to May 2007,
she was as the Assistant Vice President and
Quantitative Analyst, and from March 2005 to April 2006, she was the Quantitative Analyst. Prior to that, from June 2004 until
February 2005, she was the Research Fellow of the
Furman Center for Real Estate and Urban Policy of New
York University, where she conducted empirical quantitative research in
various aspects of commercial and residential
properties. From September 1990 to July 1996,
Ms. Qian was an Assistant Professor of
Economics at the
Beijing Normal University. She received a Ph.D. in Economics from Rutgers University in 2004, a Masters Degree in Economics
from Rutgers University in 2001, a Masters Degree in Accounting from City University of
New York in 1999, and a Bachelor’s Degree in Economics from Beijing Normal University in 1990.
Director Qualifications, Experience and
Skills
All of our directors bring to
our Board a wealth of
executive leadership experience derived from their services as senior executives
in the medical industry or
knowledge specific consulting firms or operational
businesses. Each
of our Board members has demonstrated strong business acumen and an ability to
exercise sound judgment and has a reputation for integrity, honesty and
adherence to ethical standards. When considering whether directors and nominees have the
experience, qualifications,
attributes and skills, taken as a whole, to enable the Board to satisfy
its oversight responsibilities
effectively in light of our
business and structure, the Nominating and Governance Committee and the Board
focused primarily on the information discussed in each of the
director’s individual biographies set forth above
and the specific individual qualifications, experience and skills as described
below:
|
·
|
Liu Yan-qing has over 10 years of experience
in drug marketing, research and development of new drugs and enterprise
management in the
PRC. His
experience in these areas has been instrumental in establishing
our sales program and
sales network covering the PRC, and provides us with invaluable
insight into our customers’ needs and requirements.
|
|
·
|
Han Xiao-yan’s hygiene and medical media
experience
has been
integral in
developing and marketing TDR’s products and expanding its sales. In addition, she has over 10 years of financial
management experience.
|
|
·
|
Stanley Hao’s prior experiences as Financial
Officer for Sumitomo Group Canadian Branch, Marketing Executive and
Canadian Market Analyst for MGM Mirage, and Chief Executive Offer of
SunnyZone Consulting
Co. Ltd., a financial
consulting company he co-founded, give him extensive knowledge of accounting,
the capital markets, financial reporting and
financial strategies.
|
|
·
|
Song
Chun-fang has over four decades of experience working in high level
positions in the medical departments in universities in
China. His background and experience provides us with key
industry specific contacts and
information.
|
|
·
|
William
Wei Lee Lee’s experience in cross-border M&A, fund raising and
business strategy between the U.S. and China, including with public
companies, provides us with crucial understanding of relevant issues
related to our listing on the Nasdaq Global
Market.
|
|
·
|
Zhao Jie’s experience in the medical field,
specifically in the area of tissue transplantation, provides us with
valuable knowledge with respect to the needs of the medical
industry.
|
|
·
|
Qian Xu-feng’s depth of knowledge in investor
services and company
analysis, and general expertise in economics, provides us with valuable
understanding in these areas, which are vital to our
business.
|
53
Significant Employees
Zhang Wen-chao has been our Director of Scientific and
Technological Development
since March 2005. Mr. Zhang
graduated with a PhD in biology pharmaceuticals
from South China University of Technology in 1997. He has been employed in various R&D roles since his
graduation. Mr. Zhang completed our gene recombination medicine independently and has been
responsible for researching
and developing various products that have been launched by us since 2005.
Family Relationships
There are
no family relationships among our directors, executive officers, or persons
nominated to become directors of executive officers.
Board of Directors
We have seven (7) members serving on our Board of
Directors (the
“Board”). Each Board member is nominated for election at our annual meeting to
serve until the next annual
meeting of stockholders and until their successors are duly elected and qualified.
Board Committees
The Board has five standing committees: Audit
Committee, Compensation Committee, Nominating and Governance Committee,
Executive Committee and Finance Committee. Each of these committees,
other than the Executive Committee, operates under a written charter
adopted by the Board. Copies of these charters are available on our website at
www.cski.com.cn.
Audit Committee
The Audit Committee is responsible for
the annual engagement of a firm of independent accountants and reviews with the
independent
accountants the scope and results of audits, our internal accounting controls and
audit practices and professional services rendered to us by our independent
accountants. The Audit Committee also reviews and
discusses with management and the board of directors, such matters as accounting
policies, internal accounting controls and procedures for preparation of financial
statements. The Audit Committee is
required at all times to be composed exclusively of directors who, in the
opinion of our board of
directors, are free from any relationship that would interfere with the exercise
of independent judgment as a committee member and who posses an understanding of
financial statements and generally accepted accounting principles. The Audit
Committee is
comprised of solely independent directors,
Messrs. William Wei Lee and Zhao Jie and Ms. Qian Xu-feng. Management believes,
in good faith, that each of these members are considered “independent” under applicable Nasdaq rules, and that
William Wei Lee qualifies
as an “audit committee
financial expert” as
defined under Item 407(d)(5) of Regulation
S-K.
Compensation
Committee
The Compensation Committee is
responsible for (a) reviewing and recommending to the Board of Directors on
matters relating to employee compensation and benefit plans, and (b) determining the
compensation of the Chief Executive Officer and making recommendations to the
Board with respect to the compensation of the executive officers of the Company, other than
the Chief Executive Officer, and independent directors. In making a
determination, the Compensation Committee and the Board give material
consideration to China Sky’s results of operations, financial condition and
competitive factors. The
compensation may include grants of options under our stock option plan
to the named executive officers. Executive officers
may recommend the amount or form of compensation for consideration by the
Compensation Committee. The Compensation Committee may delegate
authority to one or more subcommittees consisting of one or more of
its members. The Compensation
Committee may also retain consultants to assist in the evaluation of
directors’, the Chief Executive
Officer’s or the executive officers’ compensation, however the Compensation
Committee has not hired such consultants. The Compensation Committee
is comprised of independent directors,
Messrs. William Wei Lee and Song Chun-fang and Ms. Qian
Xu-feng.
Nominating and Governance
Committee
The Nominating and Governance Committee
assists the Board of Directors in identifying
qualified individuals to become board members, in
determining the composition of the Board of Directors and in monitoring the
process to assess Board
effectiveness. The Nominating and Governance Committee also
selects director nominees for election at each
annual meeting of stockholders. The Nominating and Governance
Committee of the Board of Directors comprised of independent directors Zhao Jie, Qian Xu-feng and Song
Chun-fang.
54
Executive Committee
The Executive Committee may exercise all
the powers and authority of the Board in the management of the business and
affairs of the Company, including, without limitation, the power to authorize or take actions
relating to the issuance of securities of the Company, with certain
exceptions. The Executive Committee of the Board of Directors is
comprised solely of independent directors. Song
Chun-fang, Zhao Jie and William Wei Lee serve as members of the
Executive Committee.
Finance Committee
The Finance Committee reviews the
financial planning process, the financial structure and the investment outlook
of the Company and its subsidiaries. Qian Xu-feng, William Wei Lee and Song
Chun-fang, independent directors, serve as members of the Finance
Committee.
Director Independence
Our Board is composed of seven (7) directors. As
required under the Nasdaq Stock
Market, or Nasdaq listing
standards, a majority of the members of a listed company’s board of directors must qualify as
“independent,” as affirmatively determined by the listed company. Our Board consults with our counsel with respect to the
Board’s applications of relevant securities and
other laws and regulations regarding the definition of “independent,” including those set forth in pertinent
listing standards of the Nasdaq, as in effect from time to
time.
Under applicable Nasdaq rules, a
director will only qualify
as an “independent
director” if, in the
opinion of our Board, that person does not have a relationship which would
interfere with the exercise of independent judgment in carrying out the
responsibilities of a director. Our Board of Directors has determined that none of Song Chun-fang, William
Wei Lee, Zhao Jie and Qian Xu-feng has a relationship which would interfere with
the exercise of independent judgment in carrying out the responsibilities of a
director, and that each of these directors is an “independent director,” as defined under Rule 5605(a)(2) of the Nasdaq
Stock Market, Inc.
Marketplace Rules.
Indemnification
Under Chapter 78 of the Nevada
Revised Statutes, we have broad powers to
indemnify and insure our
directors and officers against liabilities they may incur in their capacities as
such. Article VII of our articles of incorporation provides, in part, that we
must indemnify our directors and officers, and their respective heirs,
administrators, successors and assigns
against any and all expenses, including amounts paid upon judgments, counsel fees and amounts paid in settlement by reason of their
being or having been directors of officers. This indemnification is
in addition to any rights to which those indemnified may be entitled under any law, by law, agreement, vote
of shareholder or otherwise.
This indemnification provisions may be
sufficiently broad to permit indemnification of our directors and officers
for liabilities (including
reimbursement of expenses incurred) arising under the Securities
Act. Insofar as indemnification for liabilities arising under the
Securities Act may be permitted to directors, officers, or persons
controlling the registrant
pursuant to the foregoing provisions, we have been informed that in the opinion of the SEC such
indemnification is against public policy as expressed in the Securities Act and is therefore
unenforceable.
The indemnity provisions may discourage stockholders from
bringing a lawsuit against our directors for breach of their fiduciary duty.
These provisions may also have the effect of reducing the likelihood of derivative
litigation against directors and officers, even though such an action, if successful, might
otherwise benefit us and our
stockholders. Furthermore, a stockholder’s investment may be adversely
affected to the extent we pay the
costs of settlement and damage awards against
directors and officers pursuant to these indemnification
provisions. We believe that these provisions, the indemnification
agreements and the insurance are necessary to
attract and retain talented and experienced directors and
officers.
At present, there is no pending
litigation or
proceeding involving any of our directors or
officers where indemnification will be required or permitted. We are not aware of any
threatened litigation or proceeding that might result in a claim for
such indemnification.
55
Anti-Takeover
Provisions
Provisions of Nevada law, our articles of incorporation, or
our bylaws could have the effect of delaying or preventing a third party from
acquiring us, even if the acquisition would benefit our stockholders. The provisions of
Nevada law and in our articles of incorporation and bylaws are
intended to enhance the likelihood of continuity
and stability in the composition of our Board of Directors and in the policies
formulated by the Board of Directors and to discourage
certain types of transactions that may involve an actual or threatened change of control of China Sky One.
These provisions are designed to reduce our vulnerability to an
unsolicited proposal for a takeover that does not contemplate the
acquisition of all of our outstanding shares, or an
unsolicited proposal for the restructuring or sale
of all or part of our company. See the Subsection titled “Anti-Takeover Provisions” in the “Description of Capital Stock” Section below.
Director Fiduciary Duty and Business
Judgment Provisions
Nevada has enacted several statutes governing
the fiduciary duty and business judgment of our directors and officers including
a provision that our
directors and officers must exercise their powers in good faith and with a view
to our interests. In the same section, the Nevada
Revised Statutes state that our directors and
officers, in deciding upon matters of business, are presumed to act in good faith, on an
informed basis and with a view to our
interests. They may rely on information,
opinions, reports, financial statements and other financial data, that are
prepared or presented by our directors, officers or
employees who are
reasonably believed to be reliable and
competent.
Limitation on
Liability
Section 78.138(7) of the Nevada
Revised Statutes provides that our directors
and officers will not be individually liable to us or our stockholders or our creditors for any damages as a result of any
act or failure to act in their capacity as a director or officer unless it is
proven that the act or failure to act breached fiduciary duties as a director or
officer and such breach
involved intentional misconduct, fraud or a
knowing violation of law. As a result, neither we nor our stockholders nor our
creditors have the right to recover damages
against a director or officer for any act or failure to act in his capacity as
a director or officer,
except in the situations described above and except under very
limited circumstances.
Compliance with Section 16(a) of the
Exchange Act
To our knowledge, based solely on a review of such materials as
are required by the SEC, none of our officers,
directors or beneficial holders of more than 10% of our
issued and outstanding shares of common stock
failed to timely file with the SEC any form or
report required to be so filed pursuant to Section 16(a) of the
Exchange Act, during the fiscal year ended December 31, 2009 except
that: (i) Song
Chun Fang filed a late Form 4 on January 26, 2010, to
report the grant of 831 shares of common stock under our 2006 Stock Incentive Plan as
of December 26, 2009, (ii)
Qian Xu-feng
filed a late Form 4 on January 26, 2010, to
report the grant of 831 shares of common stock under our 2006 Stock Incentive
Plan as of December 26,
2009, (iii) Zhao Jie
filed a late Form 4 on January 26, 2010, to
report the grant of 831 shares of common stock under our 2006 Stock Incentive
Plan as of December 26, 2009, (iv) William Wei Lee filed a late Form 3 on February 3, 2010, as
amended on February 11, 2010, to report his appointment to our Board
as of September 24, 2009, and (v) William Wei Lee filed a late Form 4 on February 3, 2010, as
amended on February 11, 2010, to report the
grant of 1,038 shares of common stock under our 2006 Stock Incentive
Plan as of December 26,
2009.
Code of Ethics
We have
adopted a Code of Ethics that applies to our principal chief executive officer,
principal financial officer, principal accounting officer or controller, or
persons performing similar functions, as well as other employees (the “Code of
Ethics”). A copy of the Code of Ethics is appended as an exhibit to our
Amended Report on Form 10-KSB for the year ended December 31,
2006. The Code of Ethics was designed with the intent to deter
wrongdoing, and to promote the following:
|
·
|
Honest
and ethical conduct, including the ethical handling of actual or apparent
conflicts of interest between personal and professional
relationships,
|
|
·
|
Full,
fair, accurate, timely and understandable disclosure in reports and
documents that a small business issuer files with, or submits to, the
Commission and in other public communications made by the small business
issuer,
|
|
·
|
Compliance
with applicable governmental laws, rules and
regulations,
|
|
·
|
The
prompt internal reporting of violations of the code to an appropriate
person or persons identified in the code,
and
|
|
·
|
Accountability
for adherence to the code.
|
56
Item 11. Executive
Compensation.
Compensation Discussion and
Analysis
Objectives
of our executive compensation program
We
provide a compensation package for our executive officers we refer to as our
“named executive officers” that we believe is designed to fairly compensate them
and to enhance shareholder value. We have disclosed the
compensation packages for our named executive officers in the summary
compensation table and related tables below. We have structured our
compensation packages to motivate our named officers to achieve our business
objectives and to align their interests with the interests of our
shareholders.
Specifically,
our compensation program is designed to achieve the following
objectives:
|
·
|
Attract
and retain excellent executives who are appropriate for the Company’s
needs;
|
|
·
|
Motivate
and reward executives whose knowledge, skills and performance are critical
to the Company’s success;
|
|
·
|
Motivate
the executives to increase shareholder value for both the Company and its
subsidiary operations through the use of
options;
|
|
·
|
Tie
compensation to corporate and individual performance;
and
|
|
·
|
Align
the interests of our executives with those of our
shareholders.
|
Elements
of Compensation
Base Salary. All of
our full time executives are paid a base salary. We do not have
employment agreements with any of our executives. Base salaries for
our executives are established based on the scope of their responsibilities,
taking into account competitive market compensation paid by other companies in
our industry for similar positions, professional qualifications, academic
background, and the other elements of the executive’s compensation, including
stock-based compensation. Our intent is to set our base salaries near
the median of the range of salaries for executives in similar positions with
similar responsibilities at comparable companies, in line with our compensation
philosophy. Base salaries are reviewed annually, and may be increased
to align salaries with market levels after taking into account the subjective
evaluation described previously.
Bonuses. Historically,
we have not paid cash bonuses to our executive
officers. Bonuses may be paid on an ad hoc basis to recognize
superior performance. If the Compensation Committee determines to
provide bonus compensation as a regular part of our executive compensation
package, it will establish performance goals for each of the executive officers
and maximum bonuses that may be earned upon attainment of such performance
goals.
Equity Incentive
Compensation. We believe that long-term performance is
achieved through an ownership culture participated in by our executive officers
through the use of stock-based awards. Currently, we do not maintain
any incentive compensation plans based on pre-defined performance
criteria. The Compensation Committee has the general authority,
however, to award equity incentive compensation to our executive officers in
such amounts and on such terms as the committee determines in its sole
discretion. The Committee does not have a determined formula for
determining the number of options available to be granted. Incentive
compensation is intended to compensate officers for accomplishing strategic
goals such as mergers and acquisitions and fund raising. The
Compensation Committee will review each executive’s individual performance and
his or her contribution to our strategic goals periodically and determine the
amount of incentive compensation towards the end of the fiscal
year. Our Compensation Committee grants equity incentive compensation
at times when we do not have material non-public information to avoid timing
issues and the appearance that such awards are made based on any such
information.
57
Retirement
Benefits. Currently, we do not provide any
company-sponsored retirement benefits or deferred compensation programs to any
employee, including the named executive officers (other than a mandatory state
pension scheme in which all of our employees in China participate) because it is
not customary to provide such benefits and programs in China.
Perquisites. At
this time, we do not provide, nor do we plan to provide, perquisites to our
named executive officers
Other Benefits. At
this time, we do not provide, nor do we plan to provide, deferred compensation,
life insurance, or other benefits to our executive officers.
Determination
of Compensation
Our Compensation Committee, which is comprised of independent directors, Mr.
William Wei Lee, Mr. Song Chun-fang and Ms. Qian Xu-feng, is responsible for reviewing and making recommendations to the Board on matters relating to employee
compensation and
benefit plans and determining the compensation of
our Chief Executive
Officer. In
addition, the Compensation Committee is responsible for making recommendations to the Board with
respect to the compensation of the executive officers of the Company, other than
the Chief Executive Officer, and independent directors.
In making determinations, the Compensation Committee and the
Board give material
consideration to
our results of operations, financial condition and
competitive factors. The Compensation Committee may delegate
authority to one or more subcommittees consisting of one or more of
its members. The
Compensation Committee may also accept recommendations and ideas from senior
management to determine the compensation to be paid to our executive officers.
In addition, our Chief Executive Officer regularly provides information and
recommendations to the committee on the performance of the executive officers,
appropriate levels and components of compensation, including equity grants, as
well as other information as the committee may request.
The Compensation Committee may also
retain consultants to assist in the evaluation of
compensation for
our directors, the Chief Executive Officer or the executive
officers, however the
Compensation Committee has not hired such consultants.
We do not
formally benchmark our compensation against any peer group. However
we informally consider competitive market practices with respect to the salaries
and total compensation of our named executive officers. We review the
market practices by reviewing publicly available information of other companies
in our sector and our geographical area. However while we review such market
information, it is only one factor we consider in establishing compensation, and
we did not make use of any formula incorporating such data.
Generally
in determining whether to increase or decrease compensation to our named
executive officers, we take into account any changes, of which we are aware, in
the market pay levels, the performance of the executive officer, any increase or
decrease in responsibilities and roles of the executive officer, the business
needs for the executive officer, the transferability of managerial skills to
another employer, the relevance of the executives officers experience to other
potential employers and the readiness of the executive officer to assume a more
significant role within the organization.
The base
salaries for our executives were established based on the scope of their
responsibilities, taking into account competitive market compensation paid by
other companies in our industry, and in Heilongjiang province, for similar
positions, professional qualifications, academic background, and the other
elements of the executive’s compensation, including stock-based
compensation. Base salaries are reviewed annually, and may be
increased to align salaries with market levels after taking into account the
subjective evaluation described previously.
Our practice is to periodically
consider awarding stock bonuses based upon, among other things, accomplishments
of key objectives and overall performance. In addition, from
time-to-time the committee may approve payment of stock bonuses to executives or
key contributors for special accomplishments or other reasons. In
2009, the Board determined to award our executive officers, independent
directors and certain employees in the form of stock grants valued in the
aggregate amount of approximately 1% of our total revenues. The Board
then considered each recipients performance and responsibilities in allocating
the stock grants among the participants.
Change
in Control and Employment Agreements
Through
2009 we had no change-in-control agreements, severance agreements or employment
agreements of any kind, nor are there plans to institute change-in-control
agreements, severance agreements or employment agreements in the near
future.
Stock
Ownership Guidelines
We have
not implemented any stock ownership requirements for our named executive
officers. We have issued stock options to our named executive
officers, which we believe allows management to own equity in our company and
accordingly align their interest with those of other shareholders.
58
Summary
Compensation Table
The
following table provides information regarding the compensation for each person
serving as a principal executive officer or a principal financial officer of the
Company during the year ended September 30, 2009, and the other most highly
compensated officers during that period whose compensation exceeded
$100,000.
|
Name
and Principal Position
|
Year
|
Salary
($)
|
Stock
Awards
($)(1)
|
Option
Awards
($)(2)
|
Total
($)
|
|||||||||||
|
Liu
Yan-qing,
Chairman,
Chief Executive Officer
and
President
|
2009
|
35,083
|
439,152
|
—
|
474,235
|
|||||||||||
|
2008
|
34,320
|
51,380
|
—
|
85,700
|
||||||||||||
|
2007
|
68,512
|
—
|
—
|
68,512
|
||||||||||||
|
Han
Xiao-Yan,
Vice
Chairman and Director
|
2009
|
27,774
|
336,683
|
—
|
364,457
|
|||||||||||
|
2008
|
25,680
|
40,120
|
—
|
65,800
|
||||||||||||
|
2007
|
54,810
|
—
|
—
|
54,810
|
||||||||||||
|
Stanley
Hao,
Chief
Financial Officer, Secretary
And
Director
|
2009
|
17,542
|
146,384
|
—
|
163,926
|
|||||||||||
|
2008
|
17,542
|
11,424
|
—
|
28,966
|
||||||||||||
|
2007
|
—
|
—
|
—
|
—
|
||||||||||||
|
|
(1)
|
In fiscal year 2009, we issued an aggregate of 52,844 shares of
restricted stock to certain
executives and
directors pursuant to our 2006 Stock Incentive Plan. In fiscal 2008, we issued an aggregate of 30,063 shares
of
restricted stock to certain
executives, directors
an advisors pursuant to our 2006 Stock Incentive Plan.
|
Employment Agreements and Arrangements
We do not
have formal employment agreements with any members of management.
Our Board of Directors adopted a 2006 Stock Incentive Plan (the
“Plan”), to be effective on July 31,
2006. The Plan was approved by our shareholders on July 31, 2006. The
Plan authorizes the granting of incentive stock options and
nonqualified stock options to purchase common stock,
stock appreciation rights (“SARs”), restricted stock, performance stock and bonus
stock, to key executives
and other key employees and consultants of ours, including officers of our
subsidiaries. The purpose of the Plan is to attract and retain key
employees, to motivate key employees to achieve long-range goals and to further
align the interests of key employees with those of the other
shareholders of ours. The Plan authorizes the award of 1,500,000
shares of common stock to be used for stock, SARs, restricted stock and performance and bonus
stock. If an award made under the Plan expires, terminates or is forfeited, canceled or settled in cash, without issuance of shares
covered by the award, those shares will be
available for future awards under the Plan. The Plan will terminate
on July 31, 2017. The Plan is intended to qualify for favorable treatment under Section
16 of the Exchange Act, as amended, pursuant to Rule 16b-3
promulgated thereunder (“Rule 16b-3”). The Plan provides for the
grant of “incentive stock
options,” as
defined in Section 422 of the
Internal Revenue Code
(“Code”) and nonqualified stock options.
The Plan designates a Stock Option
Committee appointed by the Board of Directors (which may be
the Compensation Committee) and authorizes the Stock Option Committee to grant
or award to eligible
participants stock options, SARs,
restricted stock performance stock awards and
bonus stock awards for up to 1,500,000 shares of our common
stock. The initial members of the Stock Option Committee are the
Board of Directors.
As of
December 31, 2009, there have been a total of 198,202 common shares granted
under on the Plan, as follows:
|
·
|
In
October 2006, we granted stock options to purchase an aggregate of 113,500
shares of common stock to a total of 36 participants under the
Plan. In May 2009, an aggregate of 101,000 of these stock
options were exercised on a “cashless” basis by 36 participants, resulting
in our issuance of an aggregate of 75,888 shares. In August
2009, the remaining 12,500 of these stock options were
exercised on a “cashless” basis by 9 participants, resulting in
our issuance of an aggregate of 9,407
shares.
|
59
|
·
|
In
April 2007, we issued an aggregate of 30,000 shares of restricted stock to
a total of 200 individuals under the
Plan.
|
|
·
|
In
July 2008, we issued an aggregate of 30,063 shares of restricted stock to
a total of 27 individuals under the
Plan.
|
|
·
|
In
December 2009, we issued an aggregate of 52,844 shares of restricted stock
to a total of 11 individuals under the
Plan.
|
Grants
of Plan-Based Awards For Fiscal Year 2009
The
following table sets forth information regarding grants of awards to named
executive officers during the year ended December 31, 2009:
|
Name
|
Grant
Date
|
All
Other
Stock
Awards:
Number
of
Shares
of
Stock
or
Units
(#)
|
All
Other
Option
Awards:
Number
of
Securities
Underlying
Options
(#)
|
Exercise
or
Base
Price
of
Option
Awards
($/share)
|
Grant
Date
Fair
Value of
Stock
and
Options
Awards
|
Closing
Price
on
Grant
Date
($/share)
|
|||||||||||||||||
|
Liu
Yan-qing
|
December
26, 2009
|
18,687 | — | — | $ | 439,152 | $ | 23.50 | |||||||||||||||
|
Han
Xiao-yan
|
December
26, 2009
|
14,327 | — | — | $ | 336,683 | $ | 23.50 | |||||||||||||||
|
Stanley
Hao
|
December
26, 2009
|
6,229 | — | — | $ | 146,384 | $ | 23.50 | |||||||||||||||
Outstanding Equity Awards At Fiscal Year Ended 2009
As of December 31, 2009, we did not have any
outstanding equity
awards.
Option
Exercises and Stock Vested
The
following table sets forth information regarding options exercised and stock
vested for each of our named executive officers during the year ended December
31, 2009:
|
Option
Awards
|
Stock
Awards
|
|||||||||||||||
|
Name
|
Number of
Shares
Acquired on
Exercise(#)
|
Value
Realized
on Exercise
($)
|
Number of
Shares
Acquired on
Vesting
(#)
|
Value
Realized
on Vesting
($)
|
||||||||||||
|
Liu
Yan-qing
|
12,773 | $ | 187,508 | 18,687 | $ | 439,152 | ||||||||||
|
Han
Xiao-yan
|
9,016 | $ | 132,355 | 14,327 | $ | 336,683 | ||||||||||
|
Stanley
Hao
|
-- | -- | 6,229 | $ | 146,384 | |||||||||||
Potential Payment Upon Termination or
Change in Control
We do not currently have payment
arrangements for our named executive officers upon termination or change in
control.
60
Pension Benefits
We do not
provide any company-sponsored retirement benefits to any employee, including the
named executive officers (other than a mandatory state pension scheme in which
all of our employees in China participate).
Nonqualified Deferred
Compensation
We do not
provide any deferred compensation programs to any employee, including the named
executive officers.
Director
Compensation
We do not currently pay any cash fees to
our independent directors. During 2009, there was no director compensation
paid other than the stock grants. The common stock is recorded at its fair value based on the date the stocks were
granted. The following table sets forth certain information regarding our independent
directors’ compensation for the year ended December 31, 2009:
|
Name
|
Fees Paid
|
Stock
Awards
|
Total
|
|||||||||
|
Song Chung-fang,
Director
|
$ | 0 | $ | 19,518 | $ | 19,518 | ||||||
|
William Wei Lee,
Director
|
$ | 0 | $ | 24,397 | $ | 24,397 | ||||||
|
Zhao Jie,
Director
|
$ | 0 | $ | 19,518 | $ | 19,518 | ||||||
|
Qian Xu-feng,
Director
|
$ | 0 | $ | 19,518 | $ | 19,518 | ||||||
61
Item 12. Security Ownership
of Certain Beneficial Owners and Management and Related Stockholder
Matters.
Security Ownership of Certain
Beneficial
Owners
The following table sets forth certain information regarding the
beneficial ownership of our common stock,
by (i) each person who, to our knowledge, owns more than 5% of our common
stock, (ii) each of our named executive officers and directors, and (iii) all of
our named executive officers and directors as a
group. Shares of our common stock subject to options, warrants, or other rights currently exercisable, or exercisable
within 60 days of the date hereof, are deemed to be beneficially owned and outstanding for computing the share
ownership and percentage of the person holding such options, warrants or other rights, but are not deemed outstanding for computing the percentage of
any other person. As of March 15, 2010, we had 16,790,851 shares of Common Stock issued and
outstanding.
|
Common Stock Beneficially
Owned
|
||||||||
|
Name, Title and
Address (1)
|
Number
(2)
|
Percent
|
||||||
|
5%
Stockholders
|
||||||||
|
Pope Investments II LLC(3)
5100 Poplar Avenue, Suite
805
Memphis, TN 38137
|
1,071,926 | 6.3 | % | |||||
|
Executive Officers and
Directors
|
||||||||
|
Liu Yan-qing
Chief Executive Officer, President
and
Chairman of the Board of
Directors
|
4,696,953 | 28.0 | % | |||||
|
Han Xiao-yan(4)
Vice Chairman of the Board of
Directors
|
1,430,060 | 8.5 | % | |||||
|
Stanley Hao
Chief Financial Officer and
Secretary
|
7,317 | * | ||||||
|
Song Chun-fang
Director
|
1,919 | * | ||||||
|
William Wei
Lee
Director
|
1,854 | * | ||||||
|
Zhao Jie
Director
|
1,919 | * | ||||||
|
Qian Xu-feng
Director
|
1,919 | * | ||||||
|
All Named Executive Officers and
Directors
as a Group (7
persons)
|
6,141,941 | 36.6 | % | |||||
*Less than 1%
(1) Unless
otherwise indicated, each person named in the table has sole voting and
investment power and that person’s address is c/o China Sky One Medical, Inc.,
No. 2158, North Xiang An Road, Song Bei District, Harbin, PRC,
150028
(2) All shares are held of
record and beneficially.
62
(3) Includes 321,000 shares
underlying currently exercisable warrants held by Pope Investments II LLC. William D. Wells is
the Managing Member of Pope Investments II LLC and has sole voting and investment power over the
shares owned by such entity. Mr. Wells
disclaims beneficial ownership of these shares,
except to the extent of his pecuniary interest therein.
(4) 4,560,963 of these shares are subject to a
Lock-up Agreement entered
into in connection with a private placement we consummated in January
2008. Pursuant to the Lock-up Agreement, these shares may not be sold
until 12 months from the effective date of a registration statement
filed to register for resale shares, and shares underlying
warrants, purchased in the private
placement.
(5) 1,371,437 of these shares are subject to a
Lock-up Agreement entered into in connection with a private placement we
consummated in January 2008. Pursuant to the Lock-up Agreement, these shares may not be
sold until 12 months from the effective date of a registration statement
filed to register for resale shares, and
shares underlying warrants, purchased in the private
placement. Does not include 19,989 shares held by Ms. Han’s
mother or 485,670 shares held by Ms. Han’s daughter, since each of Ms. Han’s
mother and daughter has sole voting and investment power over the shares held by
her. Ms. Han disclaims beneficial ownership of the shares held by her
mother and daughter.
Securities Authorized For Issuance Under Equity Compensation
Plan
As of
December 31, 2009, we had only one stock option, bonus, profit sharing, pension
or similar plan in place, which is our 2006 Stock Incentive Plan (the
“Plan”). The Plan reserves an aggregate of 1,500,000 shares of our
common stock for awards of stock options, stock appreciation rights, restricted
stock, performance stock and bonus stock granted thereunder. The
following table provides information as of December 31, 2009 with respect to the
shares of our common stock that may be issuable under our existing equity
compensation plans:
Equity Compensation Plan
Information
|
(a)
|
(b)
|
(c)
|
||||||||||
|
Plan
Category
|
Number
of securities
to
be issued upon
exercise
of
outstanding
options,
warrants
and rights
|
Weighted-
average
exercise
price
of
outstanding
options,
warrants
and
rights
|
Number
of
securities
remaining
available
for future
issuance
under
equity
compensation
plans
(excluding
securities
reflected
in
column (a))
|
|||||||||
|
Equity
compensation plans approved by security holders (1)
|
0 | $ | - | 1,273,593 | (3) | |||||||
|
Equity
compensation plans not approved by security holders (2)
|
0 | N/A | 0 | |||||||||
|
Total
|
0 | $ | - | 1,273,593 | ||||||||
|
|
(1)
|
Our
board of directors adopted the 2006 Stock Incentive Plan (the “Plan”), to
be effective on July 31, 2006. The Plan was approved by the
shareholders on July 31, 2006.
|
|
|
(2)
|
We
do not have any equity compensation plans not approved by the security
holders.
|
|
|
(3)
|
The
Plan reserves an aggregate of 1,500,000 shares of our common stock for
awards of stock options, stock appreciation rights, restricted stock,
performance stock and bonus stock granted thereunder. We have
issued the following securities under the
Plan:
|
(a) In
October 2006, we granted stock options to purchase an aggregate of 113,500
shares of common stock to a total of 36 participants under the
Plan. In May 2009, an aggregate of 101,000 of these stock options
were exercised on a “cashless” basis by 36 participants, resulting in our
issuance of an aggregate of 75,888 shares. In August 2009, the
remaining 12,500 of these stock options were exercised on a
“cashless” basis by 9 participants, resulting in our issuance of an aggregate of
9,407 shares.
63
(b) In
April 2007, we issued an aggregate of 30,000 shares of restricted stock to a
total of 200 individuals under the Plan.
(c) In
July 2008, we issued an aggregate of 30,063 shares of restricted stock to a
total of 27 individuals under the Plan.
(d) In
December 2009, we issued an aggregate of 52,844 shares of restricted stock to a
total of 11 individuals under the Plan.
Item 13. Certain
Relationships and Related Transactions, and Director Independence.
Since the beginning of our last fiscal
year, there have been no transactions between members of management,
five percent stockholders,
“affiliates,” promoters and
finders.
Review,
Approval or Ratification of Transactions with Related Parties
We have
adopted a Code of Ethics that applies to our principal chief executive officer,
principal financial officer, principal accounting officer or controller, or
persons performing similar functions, as well as other employees (the “Code of
Ethics”). A copy of the Code of Ethics is appended as an exhibit to our
Amended Report on Form 10-KSB for the year ended December 31,
2006. The Code of Ethics was designed with the intent to deter
wrongdoing, and to promote the following:
|
·
|
Honest
and ethical conduct, including the ethical handling of actual or apparent
conflicts of interest between personal and professional
relationships,
|
|
·
|
Full,
fair, accurate, timely and understandable disclosure in reports and
documents that a small business issuer files with, or submits to, the
Commission and in other public communications made by the small business
issuer,
|
|
·
|
Compliance
with applicable governmental laws, rules and
regulations,
|
|
·
|
The
prompt internal reporting of violations of the code to an appropriate
person or persons identified in the code,
and
|
|
·
|
Accountability
for adherence to the code.
|
Item 14. Principal Accounting
Fees and Services
Sherb & Co., LLP served as the principal accountant to audit
our financial statements through May 21, 2008, when they were
replaced by the firm of MSPC,
Certified Public Accountants and Advisors LLP.
The following is a summary of the
combined fees billed to us by Sherb & Co., LLP and MSPC,
Certified Public Accountants and Advisors LLP for professional
services rendered for the fiscal years ended December 31, 2009, 2008 and 2007:
Aggregate fees rendered for the fiscal years ended December 2009 and 2008 were as follows:
|
2009
|
2008
|
2007
|
||||||||||
|
Audit Fees
|
$ | 316,745 | $ | 161,106 | $ | 135,442 | ||||||
|
Audit Related Fees
|
$ | 3,810 | $ | 29,600 | $ | 21,500 | ||||||
|
Tax Fees
|
$ | 15,000 | - | - | ||||||||
|
Other Fees
|
- | - | - | |||||||||
|
Total Fees:
|
$ | 335,555 | $ | 190,706 | $ | 156,942 | ||||||
Audit
Fees. Consists of fees billed for professional services
rendered for the audit of our
consolidated financial statements and review of the interim
consolidated financial statements included in quarterly reports, services that are normally
provided by our independent registered public accounting firm in connection
with statutory and regulatory filings or engagements. Audit fees in fiscal 2009
included the costs for our internal control
evaluation.
Audit-Related Fees. Consists of fees billed for assurance and related services that are reasonably
related to the performance of the audit or
review of our consolidated financial statements and are not reported under "Audit Fees."
64
Tax Fees. Consists of fees billed for professional services for our
corporate tax returns and extensions, tax compliance, tax advice and tax
planning. No such fees were billed by our independent registered public accounting firm in fiscal
2008 or 2007.
All Other Fees. No
fees were billed to us by our independent registered public accounting firm for
products and services other than the services reported above. No such
fees were billed by our independent registered public accounting firm in fiscal
2009, 2008 or 2007.
The board of directors has the sole
authority to review in advance and grant any pre-approvals of (i) all auditing
services to be provided by the independent auditor, (ii) all
significant non-audit services to be provided by the independent auditors as
permitted by Section 10A of the Securities Exchange Act of 1934,
and (iii) all fees and the terms of engagement with respect to such services.
All audit and non-audit services
performed by Sherb & Co., LLP and MSPC, Certified Public Accountants and Advisors LLP during fiscal 2009 and 2008 were pre-approved pursuant to the procedures
outlined above.
Item 15. Exhibits, Financial Statement Schedules
|
3.1
|
Articles of Incorporation, as
amended
(1)
|
|
3.2
|
Restated Articles of Incorporation, as
filed with the Secretary of State of
Nevada on July 11, 2008 (8)
|
|
3.3
|
Certificate of Amendment to
Articles of
Incorporation (9)
|
|
3.4
|
By-Laws of the Company
(1)
|
|
3.3
|
Finance Committee Charter
(2)
|
|
3.4
|
Audit Committee Charter
(2)
|
|
3.5
|
Compensation Committee Charter
(2)
|
|
3.6
|
Nominating and Governance Committee
Charter (2)
|
|
3.7
|
Executive Committee Charter
(2)
|
|
4.1
|
Form of Class A Warrant
issued to investors in connection with
January 2008 private offering
(3)
|
|
10.1
|
Form of Securities Purchase Agreement between
Company and investors, dated as of January 31, 2008
(3)
|
|
10.2
|
Form of Registration
Rights Agreement between Company and
investors, dated as of January 31, 2008
(3)
|
|
10.3
|
Form of Make Good Agreement between Pope Asset
Management LLC, as the authorized agent of the investors, the
Company and Liu Yan-Qin, dated as of January 31, 2008
(3)
|
|
10.4
|
Form of Make Good Escrow Agreement
between Pope Asset Management LLC, as the authorized agent of the investors, the
Company, Liu Yan-Qing and Interwest Transfer, dated as of January 31, 2008
(3)
|
|
10.5
|
Form of Put Agreement between
Company and investors, dated as of January 31, 2008
(3)
|
|
10.6
|
Equity Transfer Agreement,
dated as of February 22, 2008, relating
to acquisition of Heilongjiang Tianlong Pharmaceutical, Inc.
(4)
|
|
10.7
|
Equity Transfer Agreement,
dated as of April 18, 2008, relating to
acquisition of Heilongjiang Haina Pharmaceutical
Inc. (5)
|
|
10.8
|
Acquisition Agreement,
dated as of June 9, 2008, relating to
acquisition of Peng Lai Jin Chuang Pharmaceutical Company
(7)
|
|
14.1
|
Code of Ethics
(2)
|
65
|
16.1
|
Letter from Sherb & Co., LLP
dated as of June 6, 2008
(6)
|
|
21.1
|
Subsidiaries of China Sky One
Medical, Inc.
|
|
31.1
|
Certification of Principal
Executive Officer pursuant to Section 302 of the Sarbanes-Oxley Act of
2002 (10)
|
|
31.2
|
Certification of Principal
Financial Officer pursuant to Section 302 of the
Sarbanes-Oxley Act of 2002
(10)
|
|
32.1
|
Certification of Chief Executive
Officer pursuant to Section 906 of the Sarbanes-Oxley Act of 2002
(10)
|
|
32.2
|
Certification of Chief Financial Officer pursuant to
Section 906 of Sarbanes-Oxley Act of 2002
(10)
|
|
|
(1)
|
Incorporated by reference to the
Registrant’s Registration Statement on Form
10-SB, as filed on May 13,
1999.
|
|
|
(2)
|
Incorporated by reference to the
Registrant’s Annual Report on Form 10-KSB,
for the fiscal year ended December 31,
2007.
|
|
|
(3)
|
Incorporated by reference from
exhibits filed with Current Report on Form 8-K, Date of Event
of January 31, 2008.
|
|
|
(4)
|
Incorporated by reference to the
Registrant’s Form 8-K/A, filed on April 9,
2008
|
|
|
(5)
|
Incorporated by reference to the
Registrant’s Form 8-K, filed on April 24,
2008
|
|
|
(6)
|
Incorporated by reference to the
Registrant’s Form 8-K/A, filed on June 10,
2008
|
|
|
(7)
|
Incorporated by reference to the
Registrant’s Form 8-K, filed on June 11,
2008
|
|
|
(8)
|
Incorporated by reference to the
Registrant’s Quarterly Report on Form 10-Q,
for the fiscal quarter ended June 30,
2008
|
|
|
(9)
|
Incorporated by reference to the
Registrant’s Form 8-K, filed on November 21,
2008
|
|
|
(10)
|
Filed
herewith
|
66
SIGNATURES
Pursuant to the requirements of Section 13 or 15(d) of the
Securities Exchange Act of 1934, the registrant has duly caused this report to be signed on its behalf by the undersigned, thereunto duly authorized.
| CHINA SKY ONE MEDICAL, INC. | |||
|
Dated: March 16, 2010
|
By:
|
/s/ Liu Yan-qing | |
| Liu Yan-qing | |||
| Chairman, Chief Executive Officer and | |||
| President (Authorized Representative) | |||
Pursuant to the requirements of the Securities Exchange Act of 1934,
this report has been signed below by the following persons on
behalf of the registrant and in the capacities and on the dates
indicated.
|
Name
|
Title
|
Date
|
||
| /s/ Liu Yan-qing |
President, Chief Executive
Officer
|
March 16, 2010
|
||
|
Liu Yan-qing
|
and Director (Principal Executive
Officer)
|
|||
|
/s/ Stanley
Hao
|
Chief Financial
Officer,
Secretary,
|
March 16, 2010
|
||
|
Stanley Hao
|
and Director (Principal Financial
Officer)
|
|||
| /s/ Han Xiao-yan |
Vice Chairman and
Director
|
March 16, 2010
|
||
|
Han Xiao-yan
|
(Principal Operating Officer)
|
|||
| /s/ Song Chun-fang |
Director
|
March 16, 2010
|
||
|
Song Chun-fang
|
||||
| /s/ William Wei Lee |
Director
|
March 16, 2010
|
||
|
William Wei
Lee
|
||||
| /s/ Zhao Jie |
Director
|
March 16, 2010
|
||
|
Zhao Jie
|
||||
|
/s/ Qian Xu-feng
|
Director
|
March 16, 2010
|
||
|
Qian Xu-feng
|
67