Attached files
| file | filename |
|---|---|
| EX-31.1 - Houston Wire & Cable CO | v176707_ex31-1.htm |
| EX-23.1 - Houston Wire & Cable CO | v176707_ex23-1.htm |
| EX-32.1 - Houston Wire & Cable CO | v176707_ex32-1.htm |
| EX-31.2 - Houston Wire & Cable CO | v176707_ex31-2.htm |
UNITED
STATES
SECURITIES
AND EXCHANGE COMMISSION
Washington,
D.C. 20549
FORM
10-K
|
x
|
ANNUAL
REPORT PURSUANT TO SECTION 13 OR 15(d) OF THE SECURITIES EXCHANGE ACT OF
1934
|
For the Fiscal Year ended December
31, 2009
or
|
¨
|
TRANSITION
REPORT PURSUANT TO SECTION 13 OR 15(d) OF THE SECURITIES EXCHANGE ACT OF
1934
|
For
the transition period from
to
Commission File Number:
000-52046
(Exact
name of registrant as specified in its charter)
|
Delaware
|
36-4151663
|
|
(State
or other jurisdiction of incorporation or organization)
|
(I.R.S.
Employer Identification No.)
|
|
10201
North Loop East
Houston,
Texas
|
77029
|
|
(Address
of principal executive offices)
|
(Zip
Code)
|
(713)
609-2100
(Registrant’s
telephone number, including area code)
Securities
registered pursuant to Section 12(b) of the Act:
|
Title
of Class
|
Name
of Each Exchange on Which Registered
|
|
|
Common
stock, par value $0.001 per share
|
The
Nasdaq Stock Market
|
Securities
registered pursuant to Section 12(g) of the Act: None
Indicate
by check mark if the registrant is a well-known seasoned issuer, as defined in
Rule 405 of the Securities Act.
YES ¨ NO x
Indicate
by check mark if the registrant is not required to file reports pursuant to
Section 13 or Section 15(d) of the Act.
YES ¨ NO x
Indicate by check mark whether the
registrant (1) has filed all reports required to be filed by
Section 13 or 15(d) of the Securities Exchange Act of 1934 during the
preceding 12 months (or for such shorter period that the Registrant was required
to file such reports), and (2) has been subject to such filing requirements
for the past 90 days. YES x NO ¨
Indicate
by check mark whether the registrant has submitted electronically and posted on
its corporate Web site, if any, every Interactive Data File required to be
submitted and posted pursuant to Rule 405 of Regulation S-T (§ 232.405 of this
chapter) during the preceding 12 months (or for such shorter period that the
registrant was required to submit and post such files).
YES x NO ¨
Indicate by check mark if disclosure of
delinquent filers pursuant to Item 405 of Regulations S-K is not contained
herein, and will not be contained, to the best of Registrant’s knowledge, in
definitive proxy or information statements incorporated by reference in Part III
of this Form 10-K or any amendment to this Form 10-K. x
Indicate by check mark whether the registrant is a large
accelerated filer, an accelerated filer, a non-accelerated filer or a smaller
reporting company. See definitions of “large accelerated filer”,
“accelerated filer” and “smaller reporting company” in Rule 12b-2 of the
Exchange Act.
|
Large Accelerated
Filer ¨
|
Accelerated Filer x
|
Non-Accelerated Filer ¨
|
Smaller reporting
company ¨
|
Indicate
by check mark whether the registrant is a shell company (as defined in Rule
12b-2 of the Exchange Act)
YES ¨ NO x
The
aggregate market value of the voting stock (common stock) held by non-affiliates
of the registrant as of June 30, 2009 was $191,423,284.
At March
1, 2010, there were 17,732,737 outstanding shares of the registrant’s common
stock, $.001 par value per share.
DOCUMENTS INCORPORATED BY
REFERENCE
Form
10-K
For
the Fiscal Year Ended December 31, 2009
INDEX
|
PART
I.
|
||
|
Item
1.
|
Business
|
2
|
|
Item
1A.
|
Risk
Factors
|
10
|
|
Item
1B.
|
Unresolved
Staff Comments
|
12
|
|
Item
2.
|
Properties
|
12
|
|
Item
3.
|
Legal
Proceedings
|
13
|
|
Item
4.
|
Reserved
|
13
|
|
Supplemental
Item. Executive Officers of the Registrant
|
13
|
|
|
PART
II.
|
||
|
Item
5.
|
Market
for Registrant’s Common Equity, Related Stockholder Matters and Issuer
Purchases of Equity Securities
|
14
|
|
Item
6.
|
Selected
Financial Data
|
16
|
|
Item
7.
|
Management’s
Discussion and Analysis of Financial Condition and Results of
Operations
|
18
|
|
Item
7A.
|
Quantitative
and Qualitative Disclosures About Market Risk
|
27
|
|
Item
8.
|
Consolidated
Financial Statements and Supplementary Data
|
28
|
|
Item
9.
|
Changes
in and Disagreements with Accountants on Accounting and Financial
Disclosure
|
45
|
|
Item
9A.
|
Controls
and Procedures
|
45
|
|
Item
9B.
|
Other
Information
|
48
|
|
PART
III.
|
||
|
Item
10.
|
Directors,
Executive Officers and Corporate Governance
|
48
|
|
Item
11.
|
Executive
Compensation
|
48
|
|
Item
12.
|
Security
Ownership of Certain Beneficial Owners and Management and Related
Stockholder Matters
|
48
|
|
Item
13.
|
Certain
Relationships and Related Transactions, and Director
Independence
|
48
|
|
Item
14.
|
Principal
Accountant Fees and Services
|
48
|
|
Part
IV.
|
||
|
Item
15.
|
Exhibits
and Financial Statement Schedules
|
49
|
1
PART
I
Overview
We are
one of the largest distributors of specialty wire and cable and related services
to the U.S. electrical distribution market. During 2009, we served approximately
3,000 customers, including virtually all of the top 200 electrical distributors
in the U.S. We have strong relationships with leading wire and cable
manufacturers and provide them with efficient access to the fragmented
electrical distribution market. During 2009, we distributed approximately 21,000
SKUs (stock-keeping units) to over 8,700 customer locations nationwide from
eleven strategically located distribution centers in ten states. We are focused
on providing our electrical distributor customers with a single-source solution
for specialty wire and cable and related services by offering a large selection
of in-stock items, exceptional customer service and high levels of product
expertise.
We offer
products in most categories of specialty wire and cable, including: continuous
and interlocked armor cable; control and power cable; electronic wire and cable;
flexible and portable cords; instrumentation and thermocouple cable; lead and
high temperature cable; medium voltage cable; and premise and category wire and
cable. We also offer private branded products, including our LifeGuard™
low-smoke, zero-halogen cable. Our specialty wire and cable is primarily used in
repair and replacement, also referred to as maintenance, repair and operations
("MRO"), and related projects and is increasingly purchased for larger-scale
projects in the utility, industrial and infrastructure markets. Our specialty
wire and cable is used within a diverse range of industries, including the
communications, energy, engineering and construction, general manufacturing,
infrastructure, petrochemical, transportation, utility and wastewater treatment
industries.
Our wide
product selection and specialized services support our position in the supply
chain between wire and cable manufacturers and electrical distributors and their
customers. Offering the breadth and depth of specialty wire and cable that we
do, requires significant warehousing resources and a large number of SKUs. An
electrical distributor, however, typically sells a wide variety of electrical
products ranging from lighting to MRO supplies, and only a small percentage of
these items represent specialty wire and cable. In addition, given their bulk
and weight, specialty wire and cable require a disproportionately high
percentage of warehouse space and materials handling capabilities compared to
the sales volume they generate for an electrical distributor. Instead of
dedicating larger amounts of warehouse space to inventory and making the
investments in employee training, same-day shipment capabilities for specialty
wire and cable, end-user support, and information technology needed to maintain
industry leading levels of service, our distributor customers rely on us to
supply much of their specialty wire and cable. At the other end of the supply
chain, while manufacturers may have the space and capabilities to maintain a
large supply of inventory, we do not believe that any single manufacturer has
the breadth of product that we offer. More importantly, manufacturers
historically have not offered the services that our customers need, such as
complimentary custom cutting and same day shipment, and do not have multiple
distribution centers across the nation. As a result, we believe that we serve an
important role in the supply chain for specialty wire and cable and that it
would be undesirable for manufacturers or electrical distributors to compete
with us, given our nationwide product and service capabilities.
Our Cable
Management Program addresses our customers’ growing demand for more
sophisticated and efficient processes for large quantities of product
procurement, in order to meet budgets and reduce expenses. This program entails
purchasing and storing dedicated inventory, so our customers have immediate
product availability for the duration of their projects. Some advantages of this
program are extra pre-allocated safety stock, firm pricing, zero cable surplus
and just-in-time delivery. Used on large construction and capital expansion
projects, our Cable Management Program combines the expertise of our cable
specialists with dedicated project inventory and superior logistics to finish
complex projects on time and within budget.
History
We were
founded in 1975 and have a long history of reliable customer service, broad
product selection and strong product expertise. In 1987, we completed our first
initial public offering and were subsequently purchased in 1989 by ALLTEL
Corporation. In 1997, we were purchased by investment funds affiliated with
Code, Hennessy & Simmons LLC. In June 2006, we completed our second
initial public offering. During our 34 year history, we have successfully
expanded our business from one original location in Houston, Texas to eleven
strategic locations nationwide, which includes two third-party logistic
providers.
In 2000,
we acquired our largest direct competitor, the Futronix division of
Kent Electronics Corporation. In 2003, we implemented a new sales and
marketing strategy to expand our sales force, to introduce new private branded
products and to work in concert with our distributor customers to generate
demand from end-users in our targeted markets, including the utility, industrial
and infrastructure markets. As part of this initiative, we are partnering with
our distributor customers and strengthening our relationships with project and
specifying engineers to generate demand for our specialty wire and cable. For
example, in the utility markets, we seek to capitalize on increased spending on
new power generation assets and environmental compliance initiatives. In
addition, in the engineering and construction market we work with specifying
engineers to drive specialty wire and cable specifications in large capital
projects and market our Cable Management Program as a tool to manage wire and
cable at those projects.
2
U.S. Industry
Overview
We
operate within the U.S. electrical distribution market, which Electrical Wholesaling
magazine estimates had industry-wide sales of $75.3 billion in 2009. Within
the electrical distribution industry, our business focuses on specialty wire and
cable. According to the U.S. Census Bureau, the total value of manufacturers'
shipments of specialty wire and cable totaled approximately $9.6 billion in 2008. The
products we sell are often highly engineered and require sophisticated knowledge
to insure proper application. Examples of primary end-markets for specialty wire
and cable include the communications, energy, engineering and construction,
general manufacturing, infrastructure, petrochemical, transportation, utility
and wastewater treatment industries.
The sales
channel for specialty wire and cable depends on a number of factors, including
order type, product selection, service level expectations, inventory management
and delivery requirements. The greater the need for customization and high
service levels, the more likely the transaction will involve a specialty wire
and cable distributor such as us.
In
certain circumstances, manufacturers of specialty wire and cable sell their
products directly to the end-user. These transactions typically consist of a
bulk volume of wire and cable, involve little or no customized services and may
require long lead times between order and delivery. An example of this type of
transaction would be the purchase of full reels of cable with manufacturing lead times ranging from 8 to 16 weeks after
receipt of the order. More frequently, an electrical distributor serves as the
sales channel directly between the manufacturer and the contractor or end-user.
The typical sale by an electrical distributor may involve a commonly purchased
item that is specifically designated by the end-user and shipped from stock
along with a variety of other electrical products. It is generally most
economical for electrical distributors to carry in their inventories only those
wire and cable SKUs that are commonly ordered and do not require high levels of
specialized knowledge or services.
For
customers requiring highly specialized wire and cable, custom cut lengths,
technical expertise, short lead times or additional services, electrical
distributors will generally source products from a specialty wire and cable
distributor. We believe that the increasing complexity of specialty wire and
cable specifications and the growing need for just-in-time delivery and
logistics support will drive further growth in purchases through specialty wire
and cable distributors.
Targeted
Markets
Our
business is driven, in part, by the strength, growth prospects and activity in
the end-markets in which our products are used. We have targeted three of these
markets—the utility, industrial and infrastructure markets—in our recent sales
and marketing initiatives.
Utility
Market. The utility market includes large
investor-owned utilities, rural cooperatives and municipal power authorities.
According to Industrial Information Resource’s 2010 Global Industrial Outlook,
the spending on the power market in 2010 is expected to be $58 billion. While we
do not distribute the power lines used for the transmission of electricity, we
sell many products used in the construction of a power plant and the related
pollution control equipment. As such we are positioned to benefit from
expenditures for new power generation needed to satisfy a growing population
with increasing energy demands and to comply with federal mandates to reduce
toxic outputs from power generating facilities. We expect to benefit from this
trend as our customers utilize our cable management services to support the
distribution of specialty wire and cable required for the construction of new
power plants and upgrading of existing power plants. These upgrades often
require the addition of highly-engineered and capital-intensive environmental
compliance devices such as selective catalytic reduction (SCR) and flue gas
desulfurization (FGD) systems to remove harmful emissions from these existing
power generation units. These projects require the specialty instrumentation,
power and control products that we distribute.
Industrial
Market. The industrial market is one of the
largest segments of the U.S. economy, comprised of a diverse base of
manufacturing and production companies. According to Industrial Information
Resource’s 2010 Global Industrial Outlook, the 2010 projected total industrial
spending within the United States is expected to be $168 billion. We help
our electrical distributor partners provide a wide variety of products
specifically designed for the petroleum refining, chemical processing,
metal/mineral, and manufacturing industries where there may be significant
exposure to caustic materials or extreme temperatures. As with the utilities
market, we are positioned to benefit from several environmental compliance
projects, for example benzine reductions at refineries and sulphur dioxide
reductions at chemical processing facilities.
3
Infrastructure
Market. We believe that significant infrastructure
improvements and additions to support population density and growth will be
needed over the next several years. Infrastructure
market opportunities include construction within the
transportation, water management, waste management, education and health care
industries. The American Recovery and Reinvestment Act (ARRA), passed
in February 2009, is providing $787 billion to support infrastructure projects
throughout the country. According to Electrical
Wholesaling magazine, $130 billion of the ARRA funds are earmarked
for the construction industry. We believe we are positioned to
benefit from this investment as capital projects associated
with multiple opportunities including waste water management,
mass transit, and newly emerging energy markets, require the products and
services offered by our company. We are assisting our customers
to further penetrate the engineering and construction market by working with
application engineers to drive specialty wire and cable specifications in these
large construction projects.
LifeGuard™
Opportunity
We
believe that demand for low-smoke, zero-halogen products is in its infancy in
the U.S. and represents a significant opportunity across our targeted markets.
Low-smoke, zero-halogen cables have been used extensively in Europe and Asia for
many years. We are leading the development of the market for low-smoke,
zero-halogen cable in the U.S. When traditional cable burns, the acid gases
produced are particularly destructive to electrical and electronic equipment,
which represents a significant investment for many businesses. In contrast,
low-smoke, zero-halogen compounds provide significant flame resistance, minimal
smoke production and substantially reduced toxicity and corrosiveness when
burned, as compared to traditional wire and cable. We sell our LifeGuard™
products across most of our end-user markets.
Products
Through
our relationships with many of the large wire and cable manufacturers, we have
access to a full spectrum of specialty wire and cable, allowing us to
consistently meet the needs of our customers. Our focus is on specialty wire and
cable that is engineered for specific usage and supplies critical power and data
to end-users across diverse markets. We custom cut our wire and cable to exact
specifications so that they can be installed as soon as they arrive at the
destination. Our product strategy is to carry an extensive array of specialty
wire and cable to meet the diverse, dynamic and time-sensitive needs of our
customers. In addition, our infrastructure is designed to respond to short lead
times with high levels of product availability and same day
shipment.
Product
Categories. We distribute a wide array of wire and
cable types for a host of applications, including:
|
|
•
|
Continuous Corrugated
Armor. Continuous armor cable is available in low voltage and
medium voltage constructions and is used in harsh environments where
maximum conductor protection is required. The corrugated seamless aluminum
armor sheath prevents the entrance of water, gas and corrosive elements
into the electrical core of the cable. Continuous armor cable is used in a
wide variety of applications including industrial power distribution,
pulp and paper, utility and petrochemical operations. This product can be
used indoors and outdoors, aerially, in conduits, ducts, cable trays and
direct burial applications.
|
|
|
•
|
Control &
Power. Control and power cable is 600 volt single or multiple
conductor cable used in a broad range of commercial, industrial and
utility applications. Applications include lighting, control and power
circuits in wet and dry locations in conduits, ducts and raceways.
Control and power cable is chemical, gasoline and oil resistant, and may
be directly buried or installed in cable
trays.
|
|
|
•
|
Electronic. Electronic
cable is primarily used in audio, control, instrumentation and computer
applications. It is highly engineered cable that provides specific
electrical performance characteristics for a broad range of data,
communications and industrial
applications.
|
|
|
•
|
Flexible & Portable
Cord.
Flexible and portable cord is a highly flexible and durable single or
multiple conductor cable used in heavy-duty industrial applications. These
cables are commonly used for energizing mobile mining equipment, diesel
electric locomotives, lifting magnets, cranes and loaders, as well as for
portable power distribution for tools, equipment, small motors and
machinery.
|
|
|
•
|
Instrumentation &
Thermocouple. Instrumentation and thermocouple cable is 300 volt or
600 volt, twisted pair or triad cable used to transmit signals for
instrument, process and control, or heat sensing instruments. It may be
used in wet and dry locations, indoors or outdoors, aerially, in conduits,
ducts, cable trays or 600 volt direct burial
applications.
|
|
|
•
|
Interlocked Armor.
Interlocked armor cable is available in low voltage and medium voltage
constructions and is used in harsh environments where maximum conductor
protection is required. The protective armor sheath is made from a thick
corrugated metal tape that locks together as it is wrapped around the
cable core. It is used in a wide variety of applications including
industrial power distribution, pulp and paper, utility and petrochemical
operations. This product can be used indoors and outdoors, aerially, in
conduits, ducts, cable trays and direct burial
applications.
|
4
|
|
•
|
Lead & High
Temperature. Lead and high temperature cable is 600 volt single
conductor cable used to create or complete electrical circuits. Many of
these cables are capable of withstanding flame temperatures in excess of
2,000°C or higher. This product is commonly used for power, control, and
instrumentation circuits in iron, steel, glass, aluminum and refining
applications, and in industrial heating and cooking
equipment.
|
|
|
•
|
Medium Voltage. Medium
voltage cable is a single or multi-conductor cable that is rated for 2,001
volts to 35,000 volts. This power cable can be used in open air, conduit,
duct, cable tray (when CT rated), wet and dry locations or be directly
buried in earth. It is commonly used in chemical plants, refineries, steel
mills, industrial plants, commercial buildings, utility substations and
generating stations.
|
|
•
|
Premise & Category
Wiring. Premise wiring is used for general purpose remote control
signaling and voice and data applications. Category cables are used for
high speed data transmission of voice, data and telephony
information.
|
Our Private
Branded Products. We also sell our own private
branded products, LifeGuard™, DataGuard® and Houwire®, across many of the
product categories identified above.
|
|
•
|
LifeGuard™
cable is a low-smoke, zero-halogen cable constructed with highly
engineered polymers. LifeGuard's™ properties exceed those of standard
cable construction, and have excellent electrical and mechanical
characteristics. The jacket on LifeGuard™ cable is highly flame-retardant,
produces very small amounts of smoke when burned and contains no halogens.
LifeGuard™ is used in harsh environments for power, control and lighting
circuits in a broad range of commercial, industrial and utility
applications. LifeGuard™ cable is ideal for applications where a high
degree of safety and equipment protection is required. Our LifeGuard™
cable has been accepted for use by several hundred end-users, including
leading engineering and construction firms. We are currently marketing
LifeGuard™ to the utility industry for use in power generation and
environmental control applications; to industrial plants for
petrochemical, pharmaceutical and wastewater treatment related uses; to
general industry for use in data centers, such as computer rooms,
switching centers and central offices; and to the engineering and
construction market for use in highly populated facilities, such as
multi-story buildings, schools, hotels, hospitals, sports centers,
airports and mass transit stations.
|
|
|
•
|
We
introduced our DataGuard® product line in 2006 to service the data and
communications wire and cable market. These expansive and performance
driven markets require cables with exacting electrical characteristics.
Our DataGuard® products are premium quality, highly engineered cables
specifically designed to meet these demanding requirements and are used in
a broad range of audio, control, instrumentation and computer
applications.
|
|
|
•
|
Our
Houwire® product line has been custom tailored for the sound, security and
fire alarm market. Houwire® products are low-voltage cables that have been
value engineered for multiple applications in both industrial plants and
commercial facilities. These competitively priced items have helped to
position us for additional penetration into the broad and expanding sound
and security market.
|
Services
In
addition to the broad selection of specialty wire and cable that we distribute,
we offer a wide array of value-added services to our customers to assist them
with their wire and cable requirements. These services allow customers to use
our industry expertise to efficiently manage their wire and cable requirements
with improved service and minimal waste and expense.
We
believe our inventory depth and breadth, distribution capabilities and
value-added services are critical to our customers' wire and cable procurement
needs and significantly reduce their cost by:
|
|
•
|
eliminating
long lead times typically required by
manufacturers;
|
|
|
•
|
reducing
on-site labor costs;
|
|
|
•
|
fulfilling
small orders without subjecting customers to purchase order minimums and
price premiums;
|
|
|
•
|
reducing
waste through our cut-to-length service
offering;
|
|
|
•
|
moderating
inventory carrying costs by offering next-day delivery for SKUs which take
up substantial warehouse space;
|
|
|
•
|
providing
access to restricted and exclusive
brands;
|
|
|
•
|
offering
technical resource capabilities through our product specialists'
24-hours-a-day, seven-days-a-week, 365-days-a-year service;
and
|
|
|
•
|
managing
large, intermittent product orders through our Cable Management
Program.
|
5
Our
value-added services include the following:
|
|
•
|
Application Engineering
Support. Our sales personnel have significant technical knowledge
of the specialty wire and cable we distribute and their applications and
specifications. Our sales staff assists customers with selecting the
appropriate wire and cable products based on the intended use, cost and
performance specifications.
|
|
|
•
|
Standard Same Day Shipment
from Our Extensive Inventory. Through our nine distribution centers
and two third-party logistics providers, it is our standard practice to
ship product the day it is ordered, and we generally have it delivered by
ground the next business day.
|
|
|
•
|
24-Hours, 7-Days-a-Week,
365-Days-a-Year Service Anywhere in the United States. Our sales
offices and distribution centers provide
customers with around-the-clock customer support and can deliver
customized orders on short notice from any of our
locations.
|
|
|
•
|
Custom Color Striping.
We provide custom striping services, including color-coding products for
circuit design applications.
|
|
|
•
|
Cut-to-Length Capabilities at
No Additional Charge. We estimate that approximately 90% of
our stock orders are cut-to-length, which eliminates excess labor costs
and remnants for our customers.
|
|
|
•
|
Wire & Cable Training
Programs. We are actively engaged in wire and cable training both
for our distributor customers and for their end-user customers. Typical
training activities include wire schools at both supplier facilities and
our own, plant and site tours at our facilities and our suppliers'
facilities and on-site product training with cable
engineers.
|
|
|
•
|
Full Extranet
Capabilities. We give our customers internet-based, password
protected access to select areas of our real-time ERP system, which allows
them to check product availability, obtain pricing, and confirm order
status—including detailed shipping information identifying the carrier
used and shipment tracking number.
|
|
|
•
|
Cable Management
Program. Our Cable Management Program is an inventory management
system that pre-allocates specialty wire and cable for a customer's
specific project and includes a custom program designed to manage all of
the wire and cable requirements for the project. The major benefits of our
Cable Management Program include guaranteed availability of materials,
plus safety stock; immediate shipment of material upon field release; firm
pricing and a dedicated project manager. As part of the program, wire and
cable stock is reserved in our distribution centers and identified with a
unique part number to ensure it is available for sale when requested by
the customer. In addition, customers can review a project's inventory
24 hours a day via a secure internet site and can obtain details on
items such as individual circuit cut history and shipment and order
tracking information. Our Cable Management Program allows customers to
better manage their large projects and helps to eliminate job site theft,
expenses associated with delayed shipments of materials and surplus
materials.
|
|
|
•
|
Cable Selection System.
As an added feature of our Cable Management Program, we offer customers
our cable selection system. This is an internet-accessible order release
site through our website, that allows customers to self-manage their cable
requirements and initiate cable releases such that the releases arrive
just-in-time at the job site. With our cable selection system, the
customer can request the exact circuit lengths to which cable is cut,
project inventory status is available for review at any time, and the
project engineer or field manager can submit changes to their orders from
the field.
|
Customers
During
2009, we served approximately 3,000 customers, including
virtually all of the top 200 U.S. electrical distributors, representing over
8,700 customer locations nationwide.
Our
customers' primary end-markets include the communications, energy, engineering
and construction, general manufacturing, infrastructure, petrochemical,
transportation, utility and wastewater treatment industries. While downturns or
cyclicality in the markets our distributor customers serve could affect our
business, we believe that the market and geographic diversity of our end-users
helps to mitigate risks associated with regional or sector-specific cycles. No
customer represented 10% or more of our 2009 sales.
Suppliers
We obtain
products from most of the leading wire and cable suppliers. We believe we have
strong relationships with our top suppliers. Although we believe that
alternative sources are available for the majority of our wire and cable
products, we have strategically concentrated our purchases with four leading
suppliers in order to maximize product quality, delivery dependability,
purchasing efficiencies, and vendor rebates. As a result, in 2009 approximately
64% of our annual
purchases came from four suppliers. We do not believe we are dependent on any
one supplier for any of our wire and cable products.
6
Our top
four suppliers in 2009 were Belden, General Cable Corp., Nexans Energy USA, Inc
and Southwire Company. Products we purchased from these
suppliers each generated more than 10% of our sales in 2009.
We
believe that our national distribution presence and value-added services make us
an essential partner in the supply chain for our suppliers. In addition, we
believe our role in the supply chain, through our national distribution channel
and value-added services, provides our suppliers cost savings by:
|
|
•
|
eliminating
the need to maintain their own asset intensive distribution system across
the U.S.;
|
|
|
•
|
placing
large orders, which allow suppliers to have efficient and cost-effective
production planning;
|
|
|
•
|
reducing
their marketing and sales functions and expenses;
and
|
|
|
•
|
allowing
them to rely on our technical specialists to provide technical support to
our customers and end-users.
|
Sales
and Marketing
Sales
Strategy
The
primary objectives of our sales process are (i) to continue to generate
market awareness, (ii) to identify profitable specialty wire and cable
markets and (iii) to penetrate targeted markets through cost benefit
analyses and customized service offerings. Our sales force is trained to
identify the needs of our customers and develop a single-source wire and cable
solution that meets their needs while creating a competitive advantage for
us.
Sales
Organization
In order
to meet our growth initiatives and manage the corresponding increased contact
with customers, we invested heavily in sales resources (including significantly
increasing the size of our field sales force from 2003 to 2008). During 2009, as
market conditions and demand declined, we reduced our field sales force by
8%.
We have
expanded our sales channels to support our electrical distributor customers as
"channel partners" to penetrate our targeted markets, including the utility,
industrial and infrastructure markets. In cooperation with these distributors,
we are implementing a pull-through sales strategy to increase demand for our
products and services among selected end-users.
As of
December 31, 2009, our sales and marketing staff consisted of approximately
148 employees, including 48 field sales personnel and 80 inside sales and
technical support personnel. We market our specialty wire and cable through an
inside sales force located throughout our regional offices and a field sales
force located in key geographic markets throughout the U.S. By operating under a
decentralized process, regional managers are able to adapt quickly to
market-specific occurrences, allowing us to compete effectively with local
competitors. We believe the breadth and depth of our sales force is critical to
serving our fragmented and diverse customer and end-user base.
Our field
sales force focuses on developing demand for our products. We have organized our
sales organization to service our customer base effectively and to penetrate new
and larger end-markets. Our sales force optimization plan includes:
|
|
•
|
driving
the specification of our private branded products such as
LifeGuard™;
|
|
|
•
|
developing
targeted account lists within regional sales
territories;
|
|
|
•
|
adding
sales managers in larger regions to assist regional
managers;
|
|
|
•
|
adding
support personnel for the development of our targeted
markets;
|
|
|
•
|
partnering
with leading electrical distributor marketing groups to target Fortune 100
companies;
|
|
|
•
|
revising
the sales commission plan to motivate and compensate personnel for
profitable incremental growth;
|
|
|
•
|
adding
national account managers to service our largest customers;
and
|
|
|
•
|
implementing
a customer relationship management platform to help target and develop new
accounts.
|
Our
inside sales force's primary objective is to maintain, service and develop
existing accounts. Our inside sales personnel assist customers and end-users
with selecting the appropriate wire and cable products based on intended use,
cost and performance specifications. With our national presence, the inside
sales force also has the ability to designate the distribution center that will
process a customer's order, which helps to reduce freight charges and
transportation time. In addition to assisting customers with proper product
selection, our inside sales personnel facilitate the designation of our products
in project specifications, increasing the utilization of our products. Part of
our inside sales force consists of our National Service Center
(“NSC”), an outbound call center located in Houston, Texas, that is focused on
developing smaller or less active accounts. The NSC cultivates our customers
using a cost effective and consistently applied sales and marketing
process.
7
Through
the NSC, we offer continuous in-depth training for our entry-level sales
personnel. In addition to our NSC training, we offer our sales force extensive
training and education, including training on ISO 9001:2008 standard
sales-related procedures, a hands-on multi-department orientation, an in-house
wire school facilitated by in-house experts and factory engineers, and in-depth
training at suppliers manufacturing facilities. All sales professionals are
educated on our regimented sales process with defined protocols, requirements
and controls.
Marketing
As a
result of initiatives we have adopted, we have augmented our marketing
activities and functions by:
|
|
•
|
creating
an executive marketing position responsible for continual strategic
analysis of our marketing channels, customers, products, and brand
awareness;
|
|
|
•
|
implementing
a sales and marketing organizational infrastructure driven by corporate
market managers and segmented by targeted
markets;
|
|
|
•
|
adding
marketing personnel to handle customer-specific marketing
programs;
|
|
|
•
|
adopting
pricing matrices and controls;
|
|
|
•
|
developing
marketing plans to target new markets and customers;
and
|
|
|
•
|
developing
new private branded products, such as LifeGuard™, DataGuard® and
Houwire®.
|
Our
marketing materials include a master catalog, targeted mini-catalogs, product
brochures, direct mail and an online presence that includes an e-catalog,
company overview and LifeGuard™ cable informational videos. The extranet access
we provide allows customers to obtain custom pricing, inventory availability and
information on shipping and order-tracking. We also regularly participate in
trade shows.
We employ
database mining techniques to identify new business development opportunities
and customers. We utilize our own data as well as third-party provided data. Our
database contains over 23,000 contacts from over 8,700 accounts at electrical
distributors nationwide. In addition, we have approximately another 23,400
contacts of engineering and procurement professionals. We believe we possess one
of the largest databases of contact information for electrical distributors in
the U.S.
We are
members of various national marketing groups that represent hundreds of
electrical distributors across the U.S. As a supplier member of these groups, we
are recognized as a preferred supplier to these customers. We believe that our
relationships with these groups are strong. We also maintain direct
relationships with all of our customers who are distributor members of these
groups.
Operations &
Facilities
Purchasing
To
maximize purchasing efficiencies, we utilize a centralized purchasing function
located at our corporate headquarters in Houston, Texas, which manages each
distribution center’s unique product profile and inventory levels. The
purchasing department is led by the Vice President of Sales and Marketing, who
oversees a Director of Supply Chain and Product Management, senior buyers who
are responsible for purchasing specific product groups, length allocation
specialists, who are responsible for efficient reel selection, and a logistics
and product analyst, who is responsible for inventory optimization initiatives.
Additionally, the corporate market managers and sales personnel provide feedback
on product lines to the Vice President of Sales and Marketing and the Director
of Supply Chain and Product Management. Our ability to consolidate demand and
purchase large quantities of wire and cable provides substantial manufacturing
scale for our suppliers and results in competitive prices including attractive
rebate programs.
Our
centralized purchasing function is supported by our ERP system, which notifies
the senior buyers of required inventory purchases through the use of a real-time
inventory forecasting system. Under this system all inventory items have a
classification based on sales frequency, which is customized for every SKU.
Based on a particular item's classification, demand analysis is developed from
usage history, minimum acceptable safety stock and projected manufacturing lead
times.
Logistics
Our
logistics process is highly automated through an ERP system that integrates our
operating functions. We also utilize a radio frequency bar-coded inventory
system in our distribution centers. This bar-coding system has facilitated our
length allocation process, which audits all customers' orders prior to their
release into the distribution centers and subsequently directs personnel to
particular reels for cut-to-length orders. This process reduces wire and cable
remnants, ensures accuracy and maintains our real-time inventory system for
sales personnel.
8
Our
standard practice is to process customers' orders the same day they are
received. Our strategically located distribution centers generally allow for
ground delivery nationwide within 24 hours of shipment. Orders are
delivered through a variety of distribution methods, including
less-than-truck-load, truck-load, air or parcel service providers, direct from
supplier and cross-dock shipments. Freight costs are typically borne by our
customers. Due to our shipment volume, we have preferred pricing relationships
with our contract carriers.
Information
Systems and Technology
We
utilize scalable information systems and technology to provide support for all
of our operations. We utilize a proprietary state-of-the-industry ERP system.
Over the years, the system has been upgraded and customized for our operations
and allows for the seamless integration of financial, operational and
administrative functions. We augmented our ERP system with the implementation of
a CRM platform for customer relationship and sales force management, which
allows for advanced customer management in a secure environment. Each of our
locations is connected to our computer networks through dedicated data lines.
These systems are protected by the support of recognized security systems, and
we maintain a disaster recovery system that provides for the back-up of our data
and continued systems operation.
Our
automated bar-coded inventory system allows us to track and manage our inventory
on a real-time basis. With approximately 47,000 reels across eleven distribution
centers at December 31, 2009, our information technology systems allows complete
traceability of our products through the entire supply chain from our suppliers
to delivery to our customers and provides the total history of activity on each
reel. We also developed a proprietary cable management system that allows our
customers to review online the wire and cable products designated for specific
projects, release orders for shipment and review previous
shipments.
We have
an experienced and dedicated information technology department, including
on-site programmers and other network professionals.
Employees
At
December 31, 2009, we had 268 employees, of which approximately 80% were
sales and warehouse personnel.
Our
employees are not represented by a labor union or covered by a collective
bargaining agreement. We believe that our employee relations are
good.
Competition
Like the
general U.S. electrical distribution market, the specialty wire and cable market
is highly competitive and fragmented, with over 200 specialty wire and cable
distributors serving this market. The product offerings and levels of service
provided by the other specialty wire and cable distributors with whom we compete
vary widely. We primarily compete with other specialty wire and cable
distributors on a regional and local basis. Most of our direct competitors are
smaller companies that focus on a specific geographical area or feature a select
product offering, such as surplus wire. In addition to the direct competition
with other specialty wire and cable distributors, we also face, on a much more
limited basis, competition with the hundreds of electrical distributors and
manufacturers that sell products directly or through multiple distribution
channels to end-users or other resellers. In the markets that we serve,
competition is primarily based on product line breadth, quality, product
availability, service capabilities and price.
Website
Access
We
maintain an internet website at www.houwire.com. We make available, free of
charge under the “Investor Relations” heading on our website, our annual report
on Form 10-K, quarterly reports on Form 10-Q, current reports on Form 8-K and
amendments to those reports, as well as proxy and information statements, as
soon as reasonably practicable after such documents are electronically filed
with or furnished to the Securities and Exchange Commission (the “SEC”).
Information contained on our website is not part of, and should not be construed
as being incorporated by reference into, this Annual Report on Form
10-K.
Government
Regulation
We are
subject to regulation by various federal, state and local agencies. We believe
we are in compliance in all material respects with existing applicable statutes
and regulations affecting environmental issues and our employment, workplace
health and workplace safety practices.
9
In
addition to other information in this Annual Report on Form 10-K, the following
risk factors should be carefully considered in evaluating our business, because
such factors may have a significant impact on our business, operating results,
cash flows and financial condition. As a result of the risks set forth below and
elsewhere in this annual report, actual results could differ materially from
those projected in any forward-looking statements.
Downturns
in capital spending and cyclicality in certain of the markets we serve could
have a material adverse effect on our financial condition and results of
operations.
The
majority of our products are used in the construction, maintenance and operation
of facilities, plants and projects in the communications, energy, engineering
and construction, general manufacturing, infrastructure, petrochemical,
transportation, utility and wastewater treatment industries. The demand for our
products and services depends to a large degree on the capital spending levels
of end-users in these markets. Many of these end-users defer capital
expenditures or cancel projects during economic downturns. In addition, certain
of the markets we serve are cyclical, which affects capital spending by
end-users in these industries. Until the U.S. economy has recovered from the
current downturn, the demand for our products and services will remain weak,
which could have a material adverse effect on our financial condition and
results of operations.
We
have risks associated with constrained credit.
The
current turmoil in global financial markets has not impaired our access to our
credit facility to finance our operations. However, poor credit market
conditions may adversely impact the availability of construction and other
project financing, upon which many of our customers depend, resulting in project
cancellations or delays. Our utility and industrial customers may also face
limitations when trying to access the credit markets to fund ongoing operations
or capital projects. Credit constraints experienced by our customers may result
in lost revenues and reduced gross margins for us and, in some cases, higher
than expected bad debt losses. Our suppliers’ ability to deliver products may
also be affected by financing constraints caused by current credit market
conditions, which could negatively impact our revenue and cost of products sold,
at least until alternate sources of supply are arranged.
We have risks
associated with inventory.
Our
business requires us to maintain substantial levels of inventory. We must
identify the right mix and quantity of products to keep in our inventory to meet
customer orders. Failure to do so could adversely affect our sales and earnings.
However, if our inventory levels are too high, we are at risk that unexpected
changes in circumstances, such as a shift in market demand, drop in prices or
default or loss of a customer, could have a material adverse impact on the net
realizable value of our inventory.
Our
operating results are affected by fluctuations in commodity prices.
Copper
and petrochemical products are components of the wire and cable we sell.
Fluctuations in the costs of these and other commodities have historically
affected our operating results. To the extent higher commodity prices result in
increases in the costs we pay for our products, we attempt to reflect the
increase in the prices we charge our customers. While we historically have been
able to pass most of these cost increases on to our customers, to the extent we
are unable to do so in the future, it could have a material adverse effect on
our operating results. In addition, as commodity costs increase, our customers
may delay or decrease their purchases of our wire and cable, which could
adversely affect the demand for our products. To the extent commodity prices
decline, the net realizable value of our existing inventory could be reduced,
and our gross profit could be adversely affected.
If
we are unable to maintain our relationships with our electrical distributor
customers, it could have a material adverse effect on our financial
results.
We rely
on electrical distributors to purchase our wire and cable. The number, size,
business strategy and operations of these electrical distributors vary widely
from market to market. The success of our sales and distribution channels
depends heavily on our successful cooperation with these electrical distributors
in each of our various markets.
In 2009,
our ten largest customers accounted for approximately 43% of our sales. If we
were to lose one or more of our large electrical distributor customers, or if
one or more of our large electrical distributor customers were to significantly
reduce the amount of specialty wire and cable they purchase from us, and we were
unable to replace the lost sales on similar terms, we could experience a
significant loss of revenue and profits. In addition, if one or more of our key
electrical distributor customers failed or were unable to pay, we could
experience a write-off or write-down of the related receivables, which could
adversely affect our earnings. We participate in a number of national marketing
groups and engage in joint promotional sales activities with the electrical
distributor members of those groups. Any permanent exclusion of us from, or
refusal to allow us to participate in, such national marketing groups could have
a material adverse effect on our sales and our results of
operations.
10
An
inability to obtain the products that we distribute could result in lost
revenues and reduced profits and damage our relationships with
customers.
In 2009,
we sourced products from approximately 160 suppliers. However, we have adopted a
strategy to concentrate our purchases with a small number of suppliers in order
to maximize product quality, delivery dependability, purchasing efficiencies and
supplier incentives. As a result, in 2009 approximately 64% of our purchases
came from four suppliers. If any of these suppliers changed its sales strategy
to reduce its reliance on distributors, or decided to terminate its business
relationship with us, our sales and earnings would be adversely affected unless
and until we were able to establish relationships with suppliers of comparable
products. In addition, if we are not able to obtain the products we distribute
from either our current suppliers or other competitive sources, we could
experience a loss of revenue, reduction in profits and damage to our
relationships with our customers. Supply shortages may occur as a result of
unanticipated demand or production cutbacks, shortages of raw materials, labor
disputes or weather conditions affecting products or shipments, transportation
disruptions or other reasons beyond our control. When shortages occur, specialty
wire and cable suppliers often allocate products among distributors, and our
allocations might not be adequate to meet our customers' needs.
Loss
of key personnel or our inability to attract and retain new qualified personnel
could hurt our ability to operate and grow successfully.
Our
success is highly dependent upon the services of Charles Sorrentino, our
President and Chief Executive Officer, Nicol Graham, our Chief Financial
Officer, and James Pokluda, our Vice President of Sales and Marketing. Our
success will continue to depend to a significant extent on our executive
officers and key management and sales personnel. We do not have key man life
insurance covering any of our executive officers. We may not be able to retain
our executive officers and key personnel or attract additional qualified
management and sales personnel. The loss of any of our executive officers or our
other key management and sales personnel or our inability to recruit and retain
qualified personnel could hurt our ability to operate and make it difficult to
maintain our market share and to execute our growth strategies.
A
change in vendor rebate programs could adversely affect our gross margins and
results of operations.
The terms
on which we purchase products from many of our suppliers entitle us to receive a
rebate based on the volume of our purchases. These rebates effectively reduce
our costs for products. If market conditions change, suppliers may adversely
change the terms of some or all of these programs. These changes may lower our
gross margins on products we sell and may have an adverse effect on our
operating income.
Our
private branded products might not gain market acceptance.
An
important element of our growth strategy is the continued development and market
acceptance of our LifeGuard™ line of low-smoke, zero-halogen cable and other
products sold under our private brands. Our success with our private branded
products, however, depends on our ability to market these products in the
appropriate channels and, ultimately, on the acceptance of these products in the
markets we serve. We have been selling LifeGuard™ cable since 2003, and our
efforts to develop and market new private branded products might not be
successful. Further, demand for our products could diminish as a result of a
competitor's introduction of higher quality, better performing or lower cost
products in the marketplace. In addition, the low-smoke, zero-halogen properties
of our LifeGuard™ line of cable products depend on a highly-engineered
petrochemical material. If there is not an adequate supply of this material, we
may be unable to have our LifeGuard™ products manufactured, or our LifeGuard™
products may be available only at a higher cost or after a long delay. If we
cannot sustain the growth in demand for our LifeGuard™ products, if we cannot
have those products manufactured on acceptable terms or if we do not develop
additional private branded products, we will be unable to realize fully our
growth strategy.
If
we encounter difficulties with our management information systems, we would
experience problems managing our business.
We
believe our management information systems are a competitive advantage in
maintaining our leadership position in the specialty wire and cable distribution
industry. We rely upon our management information systems to manage and
replenish inventory, fill and ship orders on a timely basis and coordinate our
sales and marketing activities. If we experience problems with our management
information systems, we could experience product shortages, diminished inventory
control or an increase in accounts receivable. Any failure by us to maintain our
management information systems could adversely impact our ability to attract and
serve customers and would cause us to incur higher operating costs and
experience reduced profitability.
11
An
increase in competition could decrease sales or earnings.
We
operate in a highly competitive industry. We compete directly with national,
regional and local providers of specialty wire and cable. Competition is
primarily focused in the local service area and is generally based on product
line breadth, product availability, service capabilities and price. Some of our
existing competitors have, and new market entrants may have, greater financial
and marketing resources than we do. To the extent existing or future competitors
seek to gain or retain market share by reducing prices, we may be required to
lower our prices, thereby adversely affecting our financial results. Existing or
future competitors also may seek to compete with us for acquisitions, which
could have the effect of increasing the price and reducing the number of
suitable acquisitions. Other companies, including our current electrical
distributor customers, could seek to compete directly with our private branded
products, which could adversely affect our sales of those products and
ultimately our financial results. Our existing electrical distributor customers,
as well as suppliers, could seek to compete with us by offering services similar
to ours, which could adversely affect our market share and our financial
results. In addition, competitive pressures resulting from the economic downturn
and the industry trend toward consolidation could adversely affect our growth
and profit margins.
We
may be subject to product liability claims that could be costly and time
consuming.
We sell
specialty wire and cable that has been manufactured by third parties. As a
result, from time to time we have been named as defendants in lawsuits alleging
that these products caused physical injury or injury to property. We rely on
product warranties and indemnities from the product manufacturers, as well as
insurance that we maintain, to protect us from these claims. However,
manufacturers' warranties and indemnities are typically limited in duration and
scope and may not cover all claims that might be asserted. Moreover, our
insurance coverage may not be available or may not be adequate to cover every
claim asserted or the entire amount of every claim.
We
may not be able to successfully identify acquisition candidates, effectively
integrate newly acquired businesses into our operations or achieve expected
profitability from our acquisitions.
To
supplement our growth, we intend to selectively pursue acquisition
opportunities. If we are not successful in finding attractive acquisition
candidates that we can acquire on satisfactory terms, or if we cannot complete
those acquisitions that we identify, we will not be able to realize the benefit
of this growth strategy.
Acquisitions
involve numerous possible risks, including unforeseen difficulties in
integrating operations, technologies, services, accounting and personnel; the
diversion of financial and management resources from existing operations;
unforeseen difficulties related to entering geographic regions or target markets
where we do not have prior experience; the potential loss of key employees; and
the inability to generate sufficient profits to offset acquisition or
investment-related expenses. If we finance acquisitions by issuing equity
securities or securities convertible into equity securities, our existing
stockholders could be diluted, which, in turn, could adversely affect the market
price of our stock. If we finance an acquisition with debt, it could result in
higher leverage and interest costs. As a result, if we fail to evaluate and
execute acquisitions properly, we might not achieve the anticipated benefits of
these acquisitions, and we may incur costs in excess of what we
anticipate.
None.
Facilities
The
following table sets forth information about our facilities and our distribution
centers as of December 31, 2009.
|
Location
|
Total
Space
|
Distribution
Center
|
Owned/Leased
|
|||||
|
(Sq
Ft)
|
(Sq
Ft)
|
|||||||
|
Houston,
TX
|
166,720 |
136,720
|
Owned
|
|||||
|
Chicago,
IL
|
86,705 |
81,635
|
Leased
|
|||||
|
Charlotte,
NC
|
76,159 |
68,892
|
Leased
|
|||||
|
Philadelphia,
PA
|
60,000 |
54,500
|
Leased
|
|||||
|
Los
Angeles, CA
|
52,901 |
47,036
|
Leased
|
|||||
|
Atlanta,
GA
|
50,733 |
47,483
|
Leased
|
|||||
|
Tampa,
FL
|
49,776 |
45,374
|
Leased
|
|||||
|
Seattle,
WA
|
30,363 |
28,275
|
Leased
|
|||||
|
Baton
Rouge, LA
|
22,200 |
19,700
|
Leased
|
|||||
|
Total
|
595,557 |
529,615
|
||||||
12
We own
our Houston, Texas facility, which serves as the national distribution center as
well as our corporate headquarters. Constructed in 1995 on 11.5 acres, the
facility houses all centralized and back office functions such as finance,
marketing, purchasing, human resources and information technology, as well as
our Houston sales force and the National Service Center. We believe that our
properties are in good operating condition and adequately serve our current
business operations.
As a test
of potential new markets and to augment our distribution network, we contract
with two third party logistics firms. The location of and services provided by
these third party logistics firms are as follows:
|
|
•
|
Denver,
Colorado—Inventory and ship pre-packaged and cut-to-order lengths
of specialty wire and cable for a monthly fixed fee plus a per
transaction charge; and
|
|
|
•
|
San Francisco,
California—Inventory and ship pre-packaged and cut-to-order lengths
of specialty wire and cable for a monthly fixed fee plus a per transaction
charge.
|
From time
to time, we are involved in lawsuits that are brought against us in the normal
course of business. We are not currently a party to any legal proceedings that
we expect, either individually or in the aggregate, to have a material adverse
effect on our business or financial condition. We, along with many other
defendants, have been named in a number of lawsuits in the state courts of
Minnesota, North Dakota, New Jersey, and South Dakota alleging that certain wire
and cable which may have contained asbestos caused injury to the plaintiffs who
were exposed to this wire and cable. These lawsuits are individual personal
injury suits that seek unspecified amounts of money damages as the sole remedy.
It is not clear whether the alleged injuries occurred as a result of the wire
and cable in question or whether we, in fact, distributed the wire and cable
alleged to have caused any injuries. We maintain general liability insurance
that has applied to these claims. To date, all costs associated with these
claims have been covered by the applicable insurance policies and all defense of
these claims has been handled by the applicable insurance companies. In
addition, we did not manufacture any of the wire and cable at issue, and we
would rely on any warranties from the manufacturers of such cable if it were
determined that any of the wire or cable that we distributed contained asbestos
which caused injury to any of these plaintiffs. In connection with ALLTEL's sale
of our company in 1997, ALLTEL provided indemnities with respect to costs and
damages associated with these claims that we believe we could enforce if our
insurance coverage proves inadequate.
|
Name/Office
|
Age
|
Served as an
Officer
Since
|
Business Experience
During Last 5 Years
|
|||
|
Charles
A. Sorrentino
President
and Chief Executive Officer
|
65
|
1998
|
President
and Chief Executive Officer of the Company.
|
|||
|
Nicol
G. Graham
Chief
Financial Officer, Treasurer and Secretary
|
57
|
1997
|
Chief
Financial Officer, Treasurer and Secretary of the
Company.
|
13
PART
II
Our
common stock has been traded on The Nasdaq Global Market under the symbol “HWCC”
since June 15, 2006. Prior to that time, there was no public market
for our stock. The following table lists quarterly information on the
price range of our common stock based on the high and low reported sale prices
for our common stock as reported by The Nasdaq Global Market for the periods
indicated below.
|
High
|
Low
|
|||||||
|
Year
ended December 31, 2009:
|
||||||||
|
First
quarter
|
$ | 9.34 | $ | 4.70 | ||||
|
Second
quarter
|
$ | 14.76 | $ | 7.45 | ||||
|
Third
quarter
|
$ | 12.66 | $ | 8.56 | ||||
|
Fourth
quarter
|
$ | 13.49 | $ | 10.51 | ||||
|
Year
ended December 31, 2008:
|
||||||||
|
First
quarter
|
$ | 17.97 | $ | 11.22 | ||||
|
Second
quarter
|
$ | 22.74 | $ | 15.90 | ||||
|
Third
quarter
|
$ | 22.00 | $ | 15.63 | ||||
|
Fourth
quarter
|
$ | 17.47 | $ | 5.61 | ||||
There
were 14 holders of record of our common stock as of December 31,
2009.
Purchases
of Equity Securities by the Issuer and Affiliated Purchasers
The
following table provides information about our purchases of common stock for the
quarter ended December 31, 2009. For further information regarding our stock
repurchase activity, see “Management’s Discussion and Analysis of Financial
Condition and Results of Operations – Liquidity and Capital
Resources.”
|
Period
|
Total number of
shares purchased
|
Average
price paid
per share
|
Total number of
shares purchased
as part of publicly
announced plans
or programs (1)
|
Maximum
dollar value
that may yet be
used for
purchases
under the plan
|
||||||||||||
|
October
1 – 31, 2009
|
— | $ | — | — | $ | 19,385,303 | ||||||||||
|
November
1 – 30, 2009
|
— | $ | — | — | $ | 19,385,303 | ||||||||||
|
December
1 – 31, 2009
|
— | $ | — | — | $ | 19,385,303 | ||||||||||
|
Total
|
— | $ | — | — | ||||||||||||
(1) The
board authorized a stock buyback in the amount of $30 million in August 2007.
This amount was increased to $50 million in September 2007 and to $75 million
effective January 2008.
There were no purchases made under the Company’s stock repurchase program in the
4th quarter of 2009.
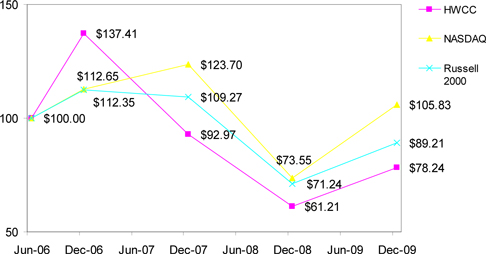
Stock
Performance Graph
The
following graph compares the total stockholder return on our common stock with
the total return on the NASDAQ US Index and the Russell 2000
Index. We believe the Russell 2000 Index includes companies with
capitalization comparable to ours. Houston Wire & Cable Company
has a unique niche in the marketplace and due to the size and scope of our
business platform, we are unable to identify peer issuers as the public
companies within our industry are substantially more diversified than we
are.
Total
return is based on an initial investment of $100 on June 15, 2006, the date of
our IPO and reinvestment of dividends.
14
Dividend
Policy
Since
February 1, 2008, we have paid a quarterly cash dividend of $0.085 per share, as
approved by our Board of Directors. In each of 2008 and 2009, the cash dividend
was $0.34 per share, resulting in total dividends paid of $6.0 million in both
years.
As a
holding company, our only source of funds to pay dividends is distributions from
our operating subsidiary. Our credit facility does not limit the amount of
dividends we may pay or stock we may repurchase, as long as we are not in
default under the loan agreement and we maintain defined levels of fixed charge
coverage and minimum levels of availability.
Securities
Authorized for Issuance under Equity Compensation Plans
The
information called for by this item and by Item 12 regarding securities
available for issuance is presented under Item 12.
15
You
should read the following selected financial information together with our
consolidated financial statements and the related notes and the "Management's
Discussion and Analysis of Financial Condition and Results of Operations"
appearing elsewhere in this Form 10-K. We have derived the consolidated
statement of income data for each of the years ended December 31, 2009,
2008 and 2007, and the consolidated balance sheet information at
December 31, 2009 and December 31, 2008 from our audited financial
statements, which are included in this Form 10-K. We have derived the
consolidated statement of income data for each of the years ended
December 31, 2006 and December 31, 2005, and the consolidated balance
sheet data at December 31, 2007, 2006 and 2005 from our audited financial
statements, which are not included in this Form 10-K.
|
Year Ended December 31,
|
||||||||||||||||||||
|
2009
|
2008
|
2007
|
2006
|
2005
|
||||||||||||||||
|
(Dollars in thousands, except share data)
|
||||||||||||||||||||
|
CONSOLIDATED
STATEMENT OF INCOME DATA:
|
||||||||||||||||||||
|
Sales
|
$ | 254,819 | $ | 360,939 | $ | 359,115 | $ | 323,467 | $ | 213,957 | ||||||||||
|
Cost
of sales
|
201,865 | 275,224 | 266,276 | 231,128 | 158,240 | |||||||||||||||
|
Gross
profit
|
52,954 | 85,715 | 92,839 | 92,339 | 55,717 | |||||||||||||||
|
Operating
expenses:
|
||||||||||||||||||||
|
Salaries
and commissions
|
20,596 | 24,080 | 23,861 | 22,706 | 18,707 | |||||||||||||||
|
Other
operating expenses
|
18,023 | 20,728 | 18,811 | 15,975 | 14,016 | |||||||||||||||
|
Management fee to stockholder (1)
|
— | — | — | 208 | 500 | |||||||||||||||
|
Litigation
settlements
|
— | — | — | — | (672 | ) | ||||||||||||||
|
Depreciation
and amortization
|
563 | 523 | 459 | 376 | 398 | |||||||||||||||
|
Total
operating expenses
|
39,182 | 45,331 | 43,131 | 39,265 | 32,949 | |||||||||||||||
|
Operating
income
|
13,772 | 40,384 | 49,708 | 53,074 | 22,768 | |||||||||||||||
|
Interest
expense
|
520 | 1,825 | 1,188 | 3,075 | 2,955 | |||||||||||||||
|
Income
before income taxes
|
13,252 | 38,559 | 48,520 | 49,999 | 19,813 | |||||||||||||||
|
Income
tax provision
|
5,220 | 14,822 | 18,295 | 19,325 | 7,299 | |||||||||||||||
|
Net
income
|
$ | 8,032 | $ | 23,737 | $ | 30,225 | $ | 30,674 | $ | 12,514 | ||||||||||
|
Earnings
per share (2):
|
||||||||||||||||||||
|
Basic
|
$ | 0.46 | $ | 1.33 | $ | 1.49 | $ | 1.63 | $ | 0.75 | ||||||||||
|
Diluted
|
$ | 0.45 | $ | 1.33 | $ | 1.48 | $ | 1.62 | $ | 0.75 | ||||||||||
|
Weighted
average common shares outstanding (2):
|
||||||||||||||||||||
|
Basic
|
17,648,696 | 17,789,739 | 20,328,182 | 18,875,192 | 16,606,672 | |||||||||||||||
|
Diluted
|
17,665,924 | 17,838,072 | 20,406,000 | 18,984,826 | 16,757,303 | |||||||||||||||
__________
|
(1)
|
The
management fee arrangement was terminated as of the completion of our
initial public offering in June
2006.
|
|
(2)
|
The
2005 and 2006 share information has been restated for the 1.875-for-1
stock split on May 16, 2006.
|
16
|
As of December 31,
|
||||||||||||||||||||
|
2009
|
2008
|
2007
|
2006
|
2005
|
||||||||||||||||
|
(Dollars
in thousands)
|
||||||||||||||||||||
|
CONSOLIDATED
BALANCE SHEET DATA:
|
||||||||||||||||||||
|
Cash
and cash equivalents
|
$ | — | $ | — | $ | — | $ | — | $ | — | ||||||||||
|
Accounts
receivable, net
|
$ | 46,859 | $ | 50,798 | $ | 58,202 | $ | 52,128 | $ | 41,309 | ||||||||||
|
Inventories,
net
|
$ | 61,325 | $ | 73,459 | $ | 69,299 | $ | 56,329 | $ | 31,306 | ||||||||||
|
Total
assets
|
$ | 122,014 | $ | 134,753 | $ | 139,091 | $ | 116,864 | $ | 81,241 | ||||||||||
|
Book overdraft (1)
|
$ | 907 | $ | 4,933 | $ | 3,854 | $ | 1,265 | $ | 2,119 | ||||||||||
|
Total debt (2)
(3)
|
$ | 17,479 | $ | 29,808 | $ | 34,507 | $ | 12,059 | $ | 61,406 | ||||||||||
|
Stockholders’
equity (2)
(3)
|
$ | 80,813 | $ | 76,595 | $ | 71,170 | $ | 81,674 | $ | 742 | ||||||||||
_______
|
(1)
|
Our
book overdraft is funded by our revolving credit facility as soon as the
related checks clear our disbursement
account.
|
|
(2)
|
On
December 30, 2005, we paid a special dividend of $20.0 million to our
common stockholders and funded the payment by borrowing under our existing
credit facility.
|
|
(3)
|
A
stock repurchase program was approved in 2007. During the years ended
December 31, 2008 and 2007, purchases of stock totaling $14,725 and
$40,890, respectively, were made, part of which was funded by debt. No
repurchases were made during the year ended December 31,
2009.
|
17
You
should read the following discussion in conjunction with our consolidated
financial statements and related notes appearing elsewhere in this Form 10-K. In
addition to historical information, this discussion contains forward-looking
statements that involve risks, uncertainties and assumptions that could cause
actual results to differ materially from our expectations. Factors that could
cause such differences include those described in “Risk Factors” and elsewhere
in this Form 10-K. Certain tabular information will not foot due to
rounding.
Overview
Since our
founding over 30 years ago, we have grown to be one of the largest
distributors of specialty wire and cable and related services to the U.S.
electrical distribution market. Today, we serve approximately 3,000 customers,
including virtually all of the top 200 electrical distributors in the U.S. Our
specialty wire and cable is primarily used in the repair and replacement sector,
also referred to as maintenance, repair and operations (“MRO”), and related
projects and is increasingly purchased for larger scale projects in the
communications, energy, engineering and construction, general manufacturing,
infrastructure, petrochemical, transportation, utility and wastewater treatment
industries.
In 2000,
we acquired our largest competitor, the Futronix division of Kent Electronics
Corporation. Since that time, we have pursued a number of initiatives designed
to improve our operating efficiencies and increase our share of the fragmented
market for specialty wire and cable. We integrated the Futronix business into
our own and rationalized inventory, facilities and low-margin customer
relationships. We have made substantial investments in our distribution centers
and information systems in order to enhance our ability to provide customers
with comprehensive value-added services, including application engineering
support, inventory management, custom cut capabilities and 24/7/365 customer
service, order fulfillment and shipping. During the years 2001 through 2003, the
U.S. electrical distribution market was adversely affected by the general
slowdown of the U.S. economy. In response to these economic conditions, we
increased our focus on achieving operating efficiencies by leveraging our
investments in our centralized back-office administration and purchasing,
investing in a scalable information technology platform and implementing
automated warehouse operations and electronic product tracking.
From 2003
until the latter part of 2008, the U.S. electrical distribution market
experienced increased demand, as large industrial and commercial companies
increased capital spending to “catch-up” on deferred maintenance and upgrade and
expand infrastructure. At the same time as the electrical distribution market
began to recover, we implemented a new sales and marketing strategy that focuses
on working in concert with our distributor customers to generate demand from
end-users in our targeted markets and to strengthen relationships with project
and specifying engineers to stimulate demand for our specialty wire and cable.
As of December 31, 2009 we had 148 sales and marketing employees. We also
introduced our LifeGuard™ line of low-smoke, zero-halogen cable products, which
due to their highly engineered specifications and safety benefits, typically
generate higher margins for us than traditional cable products.
Our
revenue is driven in part by the level of capital spending within the
end-markets we serve. Because many of these end-markets defer capital
expenditures during periods of economic downturns, our business has experienced
cyclicality from time to time. We believe that our revenue will continue to be
impacted by fluctuations in capital spending and by our ability to drive demand
through our sales and marketing initiatives and the continued development and
marketing of our private branded products, such as LifeGuard™. The recent
economic downturn and reduced commodity prices have adversely impacted sales and
the overall level of demand. This has had and will continue to have an impact on
our performance, until economic conditions improve.
Our
direct costs will continue to be influenced significantly by the prices we pay
our suppliers to procure the products we distribute to our customers. Changes in
these costs may result, for example, from increases or decreases in raw material
costs, changes in our relationships with suppliers or changes in vendor rebates.
Our operating expenses will continue to be affected by our investment in sales,
marketing and customer support personnel and commissions paid to our sales force
for revenue and profit generated. Some of our operating expenses are related to
our fixed infrastructure, including rent, utilities, administrative salaries,
maintenance, insurance and supplies. To meet our customers’ needs for an
extensive product offering and short delivery times, we will need to continue to
maintain adequate inventory levels. Our ability to obtain this inventory will
depend, in part, on our relationships with suppliers.
Critical
Accounting Policies and Estimates
Critical
accounting policies are those that both are important to the accurate portrayal
of a company’s financial condition and results, and require subjective or
complex judgments, often as a result of the need to make estimates about the
effect of matters that are inherently uncertain.
18
In order
to prepare financial statements that conform to accounting principles generally
accepted in the United States, commonly referred to as GAAP, we make estimates
and assumptions that affect the amounts reported in our financial statements and
accompanying notes. Certain estimates are particularly sensitive due to their
significance to the financial statements and the possibility that future events
may be significantly different from our expectations.
We have
identified the following accounting policies as those that require us to make
the most subjective or complex judgments in order to fairly present our
consolidated financial position and results of operations. Actual results in
these areas could differ materially from management’s estimates under different
assumptions and conditions.
Allowance
for Doubtful Accounts
We
maintain an allowance for doubtful accounts receivable for estimated losses
resulting from the inability of our customers to make required payments. We
perform periodic credit evaluations of our customers and typically do not
require collateral. Consistent with industry practices, we require payment from
most customers within 30 days of the invoice date. We have an estimation
procedure, based on historical data and recent changes in the aging of the
receivables, that we use to record reserves throughout the year. In the last
five years, write-offs against our allowance for doubtful accounts have averaged
$0.1 million per year. A 20% change in our estimate at December 31, 2009
would have resulted in a change in income before income taxes of $0.1 million
for the year ended December 31, 2009.
Reserve
for Returns and Allowances
We
estimate the gross profit impact of returns and allowances for previously
recorded sales. This reserve is calculated on historical and statistical returns
and allowances data and adjusted as trends in the variables change. A 20% change
in our estimate at December 31, 2009 would have resulted in a change in
income before income taxes of $0.1 million for the year ended December 31,
2009.
Inventories
Inventories
are valued at the lower of cost, using the average cost method, or market. We
continually monitor our inventory levels at each of our distribution centers.
Our reserve for inventory obsolescence is based on the age of the inventory,
movements of our inventory over the prior twelve months and the experience of
our purchasing and sales departments in estimating demand for the product in the
succeeding year. Our inventories are generally not susceptible to technological
obsolescence. A 20% change in our estimate at December 31, 2009 would have
resulted in a change in income before income taxes of $0.4 million for the year
ended December 31, 2009.
Vendor Rebates
Many of
our arrangements with our vendors entitle us to receive a rebate of a specified
amount when we achieve any of a number of measures, generally related to the
volume of purchases from the vendor. We account for such rebates as a reduction
of the prices of the vendor’s products and therefore as a reduction of inventory
until we sell the product, at which time such rebates reduce cost of sales.
Throughout the year, we estimate the amount of the rebate earned based on our
estimate of purchases to date relative to the purchase levels that mark our
progress toward earning the rebates. We continually revise these estimates to
reflect actual rebates earned based on actual purchase levels and all estimated
rebate amounts are reconciled. A 20% change in our estimate of total rebates
earned during 2009 would have resulted in a change in income before income taxes
of $1.1 million for the year ended December 31, 2009.
Goodwill
Goodwill
represents the excess of the amount we paid to acquire businesses over the
estimated fair value of tangible assets and identifiable intangible assets
acquired, less liabilities assumed. At December 31, 2009, our goodwill
balance was $2.4 million, representing 1.9% of our total assets.
We test
goodwill for impairment annually, or more frequently if indications of possible
impairment exist, by applying a fair value-based test. In October 2009, we
performed our annual goodwill impairment test and, as a result of this test, we
believe the goodwill on our balance sheet is not impaired. If circumstances
change or events occur to indicate that our fair market value has fallen below
book value, we will compare the estimated fair value of the goodwill to its
carrying value. If the carrying value of goodwill exceeds the estimated fair
value of goodwill, we will recognize the difference as an impairment loss in
operating income.
19
Adoption
of New Accounting Policies
FASB
Accounting Standards Codification
In June
2009, the Financial Accounting Standards Board (“FASB”) issued the FASB
Accounting Standards Codification (“ASC” or the “Codification”), the
authoritative guidance for GAAP. The Codification, which changes the referencing
of financial standards, became effective for interim and annual periods ended on
or after September 15, 2009. The Codification is now the single official
source of authoritative GAAP (other than guidance issued by the Securities and
Exchange Commission), superseding existing FASB, American Institute of Certified
Public Accountants, Emerging Issues Task Force, and related literature. Only one
level of authoritative GAAP now exists. All other literature is considered
non-authoritative. The Codification does not change GAAP. We adopted the
Codification during the quarter ended September 30, 2009. The adoption of
the Codification did not have any substantive impact on our consolidated
financial statements or related footnotes.
Subsequent
Events
In May
2009, the FASB issued authoritative guidance which establishes general standards
of accounting for and disclosure of events that occur after the balance sheet
date but before financial statements are issued or are available to be issued.
Specifically, this standard sets forth the period after the balance sheet date
during which management of a reporting entity should evaluate events or
transactions that may occur for potential recognition or disclosure in the
financial statements, the circumstances under which an entity should recognize
events or transactions occurring after the balance sheet date in its financial
statements, and the disclosures that an entity should make about events or
transactions that occurred after the balance sheet date. The guidance is
effective for fiscal years and interim periods ended after June 15, 2009. We
adopted this guidance effective June 15, 2009 and, in connection with the filing
of this Form 10-K, we have evaluated subsequent events through March 15, 2010.
We have disclosed these subsequent events in Note 10, to our consolidated
financial statements.
Business
Combinations
In
December 2007, the FASB issued authoritative guidance which establishes
principles and requirements for how an acquirer recognizes and measures in its
financial statements the identifiable assets acquired, the liabilities assumed,
any non-controlling interest in the acquiree and the goodwill acquired. The
guidance also requires transaction costs related to the business combination to
be expensed as incurred and establishes disclosure requirements to enable the
evaluation of the nature and financial effects of the business combination. The
guidance applies prospectively to business combinations for which the
acquisition date is on or after the beginning of the first annual reporting
period beginning on or after December 15, 2008. We adopted the guidance on
January 1, 2009. The adoption did not have an impact on our consolidated
financial statements.
Sales
We
generate most of our sales by providing specialty wire and cable to our
customers, as well as billing for freight charges. We recognize revenue upon
shipment of our products to customers from our distribution centers or directly
from our suppliers. Sales incentives earned by customers are accrued in the same
month as the shipment is invoiced.
Cost
of Sales
Cost of
sales consists primarily of the average cost of the specialty wire and cable
that we sell. We also incur shipping and handling costs in the normal course of
business. Cost of sales also reflects cash discounts for prompt payment to
vendors and vendor rebates generally related to annual purchase targets, as well
as inventory obsolescence charges.
Operating
Expenses
Operating
expenses include all expenses incurred to receive, sell and ship product and
administer the operations of the Company.
Salaries and
Commissions. Salary expense includes the base compensation, and any
overtime earned by hourly personnel, for all sales, administrative and warehouse
employees and stock compensation expense for options and restricted stock
granted to employees. Commission expense is earned by inside sales personnel
based on gross profit dollars generated, by field sales personnel from
generating sales and meeting various objectives, by sales, national and
marketing managers for driving the sales process, by regional managers based on
the profitability of their branches and by corporate managers based primarily on
our profitability and also on other operating metrics.
Other Operating
Expenses. Other operating expenses include all other expenses, except for
salaries and commissions and depreciation and amortization. This includes all
payroll taxes, health insurance, traveling expenses, public company expenses,
advertising, management information system expenses, facility rent and all
distribution expenses such as packaging, reels, and repair and maintenance of
equipment and facilities.
20
Depreciation and
Amortization. We incur depreciation and amortization expenses for costs
related to the capitalization of property and equipment on a straight-line basis
over the estimated useful lives of the assets, which range from three to
thirty years. We amortize leasehold improvements over the shorter of the
lease term or the life of the related asset.
Interest
Expense
Interest
expense consists primarily of interest we incur on our debt.
Results
of Operations
The
following discussion compares our results of operations for the years ended
December 31, 2009, 2008 and 2007.
The
following table shows, for the periods indicated, information derived from our
consolidated statements of income, expressed as a percentage of sales for the
period presented.
|
Year Ended December 31,
|
||||||||||||
|
2009
|
2008
|
2007
|
||||||||||
|
Sales
|
100.0 | % | 100.0 | % | 100.0 | % | ||||||
|
Cost
of sales
|
79.2 | % | 76.3 | % | 74.1 | % | ||||||
|
Gross
profit
|
20.8 | % | 23.7 | % | 25.9 | % | ||||||
|
Operating
expenses:
|
||||||||||||
|
Salaries
and commissions
|
8.1 | % | 6.7 | % | 6.6 | % | ||||||
|
Other
operating expenses
|
7.1 | % | 5.7 | % | 5.2 | % | ||||||
|
Depreciation
and amortization
|
0.2 | % | 0.1 | % | 0.1 | % | ||||||
|
Total
operating expenses
|
15.4 | % | 12.6 | % | 12.0 | % | ||||||
|
Operating
income
|
5.4 | % | 11.2 | % | 13.8 | % | ||||||
|
Interest
expense
|
0.2 | % | 0.5 | % | 0.3 | % | ||||||
|
Income
before income taxes
|
5.2 | % | 10.7 | % | 13.5 | % | ||||||
|
Income
tax provision
|
2.0 | % | 4.1 | % | 5.1 | % | ||||||
|
Net
income
|
3.2 | % | 6.6 | % | 8.4 | % | ||||||
Note: Due
to rounding, numbers may not add up to total operating expenses, operating
income or income before income taxes.
Comparison
of Years Ended December 31, 2009 and 2008
Sales
|
Year Ended
|
||||||||||||||||
|
December 31,
|
||||||||||||||||
|
(Dollars
in millions)
|
2009
|
2008
|
Change
|
|||||||||||||
|
Sales
|
$ | 254.8 | $ | 360.9 | $ | (106.1 | ) | (29.4 | ) % | |||||||
Our
sales for 2009 decreased 29.4% to $254.8 million from
$360.9 million in 2008. The two primary reasons for this decrease
were continued reduced demand for our products, as our customers sought to
conserve capital and minimize expenditures during a difficult economic
environment, and the reduction in the price of copper, which fell on
average by 24.9% during 2009. Since copper is a major component in
many of our products, a decrease in the market price of copper reduces the
prices at which we can sell those products. We estimate sales in our core
Repair and Replacement sector, also referred to as Maintenance, Repair and
Operations (“MRO”), were down as a result of the challenging economy which
we believe lowered overall demand and discretionary spending. Partially
offsetting this decrease in MRO sales was the increase in sales within
our five internal growth initiatives encompassing Utility Power Generation,
Environmental Compliance, Engineering & Construction, Industrials,
and LifeGuard™ (and other private branded products). Sales within
our growth initiatives remained more resilient to the overall market and
economy as projects in these areas were already in progress and had
been previously funded. Project
bookings and backlog for our growth initiatives in 2009 increased as a result of
our continued penetration into these markets.
21
Gross
Profit
|
Year Ended
|
||||||||||||||||
|
December 31,
|
||||||||||||||||
|
(Dollars
in millions)
|
2009
|
2008
|
Change
|
|||||||||||||
|
Gross
profit
|
$ | 53.0 | $ | 85.7 | $ | (32.8 | ) | (38.2 | ) % | |||||||
|
Gross
profit as a percent of sales
|
20.8 | % | 23.7 | % | (2.9 | ) % | ||||||||||
Gross
profit decreased $32.8 million or 38.2% to $53.0 million in 2009 from $85.7
million in 2008. This decrease was primarily attributable to lower sales volume.
Our gross profit as a percentage of sales (gross margin) decreased to 20.8% in
2009 from 23.7% in 2008. The gross margin compression resulted from competitive
pricing pressures throughout the year due to the prolonged economic slowdown. In
addition, the severe drop in copper prices in the fourth quarter of 2008
adversely impacted gross margin on sales from certain stock products with heavy
copper content, primarily in the first two quarters of 2009.
Operating
Expenses
|
Year Ended
|
||||||||||||||||
|
December 31,
|
||||||||||||||||
|
(Dollars
in millions)
|
2009
|
2008
|
Change
|
|||||||||||||
|
Operating
expenses:
|
||||||||||||||||
|
Salaries
and commissions
|
$ | 20.6 | $ | 24.1 | $ | (3.5 | ) | (14.5 | )% | |||||||
|
Other
operating expenses
|
18.0 | 20.7 | (2.7 | ) | (13.0 | )% | ||||||||||
|
Depreciation
and amortization
|
0.6 | 0.5 | 0.1 | 7.6 | % | |||||||||||
|
Total
operating expenses:
|
$ | 39.2 | $ | 45.3 | $ | (6.1 | ) | (13.6 | )% | |||||||
|
Operating
expenses as a percent of sales
|
15.4 | % | 12.6 | % | 2.8 | % | ||||||||||
Salaries and Commissions. The
decrease in salaries and commissions was a result of lower incentive
compensation due to the lower sales levels, gross margin, gross profit levels
and other financial metrics used in the various incentive programs and a lower
headcount which reduced salaries.
Other Operating
Expenses. Other operating expenses in 2009 decreased primarily due
to our cost control initiatives involving tighter management of discretionary
expenses, reduced warehouse supplies due to declining sales and decreased
expenses associated with a lower headcount.
Depreciation and
Amortization. Depreciation and amortization increased slightly to $0.6
million in 2009 from $0.5 million in 2008.
Operating
expenses as a percentage of sales increased to 15.4% in 2009 from 12.6% in 2008
due to the deleveraging of operating expenses from the reduction in
sales.
Interest
Expense
Interest
expense decreased $1.3 million or 71.5% to $0.5 million in 2009 from $1.8
million in 2008. The decrease in interest expense is due to a lower average
effective interest rate in 2009 resulting from market interest rate declines,
and lower debt levels due to the pay down of debt using cash from operations.
The average effective interest rate decreased to 1.8% in 2009 from 4.2% in 2008.
Average debt was $20.8 million in 2009 compared to $41.5 million in 2008. In
addition, during 2009 there were no treasury stock purchases, which we
historically have funded through borrowings, while there were $15.4 million of
funded treasury stock purchases in 2008.
Income
Tax Expense
Income
taxes decreased 64.8% or $9.6 million to $5.2 million in 2009 from $14.8 million
in 2008 as our income before taxes decreased 65.6%. Our effective income tax
rate was 39.4% in 2009 compared to 38.4% in 2008. The effective income tax rate
increased due primarily to a deferred tax adjustment recorded in 2009 relating
to prior periods and the effect of permanent differences over a lower pretax
income base.
22
Net
Income
We
achieved net income of $8.0 million in 2009 compared to $23.7 million in 2008, a
decrease of 66.2%.
Comparison
of Years Ended December 31, 2008 and 2007
Sales
|
Year Ended
|
||||||||||||||||
|
December 31,
|
||||||||||||||||
|
(Dollars in millions)
|
2008
|
2007
|
Change
|
|||||||||||||
|
Sales
|
$ | 360.9 | $ | 359.1 | $ | 1.8 | 0.5 | % | ||||||||
Our sales
for 2008 increased 0.5% to $360.9 million from $359.1 million in fiscal year
2008. The Company estimates that a major contributor of revenue
resulted from project activity in the five internal growth initiatives
encompassing Utility Power Generation,
Environmental Compliance, Engineering & Construction, Industrials,
and LifeGuard™ (and other private branded products). Although
beginning to slow in the latter half of the year, investment and capital
expansion within these initiatives was generally healthy as previously
established funding remained intact. Sales to our core Repair and
Replacement or MRO sector, were slightly down as a result of the challenging
economy which we believe lowered discretionary spending.
Gross
Profit
|
Year
Ended
|
||||||||||||||||
|
December 31,
|
||||||||||||||||
|
(Dollars
in millions)
|
2008
|
2007
|
Change
|
|||||||||||||
|
Gross
profit
|
$ | 85.7 | $ | 92.8 | $ | (7.1 | ) | (7.7 | ) % | |||||||
|
Gross
profit as a percent of sales
|
23.7 | % | 25.9 | % | (2.2 | ) % | ||||||||||
Gross
profit for 2008 decreased 7.7% to $85.7 million in 2008 from $92.8 million in
2007. Gross profit as a percentage of sales, commonly referred to as gross
margin, decreased to 23.7% in 2008 from 25.9% in 2007. The reduction in gross
margin was primarily attributable to competitive pricing pressures resulting
from the macro economic environment and the steep and rapid decline in copper
prices in the latter part of the year. Reduced vendor rebates were also a factor
in compressing the gross margin.
Operating
Expenses
|
Year Ended
|
||||||||||||||||
|
December 31,
|
||||||||||||||||
|
(Dollars in millions)
|
2008
|
2007
|
Change
|
|||||||||||||
|
Operating
expenses:
|
||||||||||||||||
|
Salaries
and commissions
|
$ | 24.1 | $ | 23.9 | $ | 0.2 | 0.9 | % | ||||||||
|
Other
operating expenses
|
20.7 | 18.8 | 1.9 | 10.2 | % | |||||||||||
|
Depreciation
and amortization
|
0.5 | 0.5 | 0.0 | 13.9 | % | |||||||||||
|
Total
operating expenses:
|
$ | 45.3 | $ | 43.1 | $ | 2.2 | 5.1 | % | ||||||||
|
Operating
expenses as a percent of sales
|
12.6 | % | 12.0 | % | 0.6 | % | ||||||||||
Note: Due
to rounding, numbers may not add up to total operating expenses.
Operating
expenses were $45.3 million in 2008, an increase of $2.2 million or 5.1%,
compared to operating expenses of $43.1 million in 2007. Operating expenses as a
percentage of sales were 12.6% in 2008, which was 60 basis points higher than
the 12.0% in 2007. The reduced sales volume in the fourth quarter created
additional operating expense deleveraging for the year. The increase in
operating expenses was attributable to the specific factors discussed
below.
Salaries and
Commissions. Salaries and commissions increased $0.2 million or
0.9%, to $24.1 million in 2008 from $23.9 million in 2007. The increase in
salaries was primarily attributable to additional employees, an increase in
stock compensation expense and annual pay increases. This increase in salaries
was partially offset by a $1.2 million reduction in commission expense resulting
from higher 2008 incentive compensation objectives that were not fully met and
changes to commission programs in 2008.
23
Other Operating
Expenses. Other operating expenses increased $1.9 million, or 10.2%,
to $20.7 million in 2008 from $18.8 million in 2007. The higher other operating
expenses were due to a general increase in business activities including
employee insurance costs and the reserve for bad debts, partially offset by
lower public company expenses primarily related to reduced professional fees for
Sarbanes Oxley compliance.
Depreciation and
Amortization. Depreciation and amortization remained flat at $0.5 million
for 2008 and 2007.
Interest
Expense
Interest
expense increased $0.6 million, or 53.6% from $1.2 million in 2007 to $1.8
million in 2008 due to a higher average debt of $41.5 million in 2008 compared
to $15.3 million in 2007. The increase in the average debt in 2008 was primarily
related to funded treasury stock purchases of $15.4 million and dividend
payments of $6.0 million. The reduction in the average interest rate, due to a
macro interest rate decline, to 4.2% in 2008 from 7.4% in 2007 partially
mitigated the impact of the increase in the average outstanding debt in
2008.
Income
Tax Expense
Income
taxes decreased $3.5 million or 19.0% as our income before taxes decreased $10.0
million or 20.5%. The effective income tax rate increased from 37.7% in 2007 to
38.4% in 2008 due to lower federal and state income taxes from over accrual
adjustments in 2007.
Net
Income
The
Company achieved net income of $23.7 million in 2008 compared to net income of
$30.2 million in 2007, a decrease of $6.5 million or 21.5% due to the factors
noted above.
Impact
of Inflation and Commodity Prices
Our
results of operations are affected by changes in the inflation rate and
commodity prices. Moreover, because copper and petrochemical products are
components of the wire and cable we sell, fluctuations in the costs of these and
other commodities have historically affected our operating results. In the
second half of 2008, average per pound copper prices declined precipitously.
From a high of $3.77 in July, copper fell to $3.15 in September and to $1.39 in
December, significantly impacting our gross margins in the fourth quarter of
2008 and the first two quarters of 2009. Our average cost price for some of our
products were higher than replacement cost and accordingly our gross margins
were adversely impacted until our average cost prices normalized to market in
the latter part of 2009 as new product was received. The impact of declining
copper prices on sales and net income during 2008 cannot be isolated, as
weakening economic demand also negatively impacted performance. To the extent
commodity prices further decline, the net realizable value of our existing
inventory could also decline, and our gross profit could be adversely affected
because of either reduced selling prices or lower of cost or market adjustments
in the carrying value of our inventory. If we turn our inventory approximately
four times a year, the impact of changes in copper prices in any particular
quarter would primarily affect the results of the succeeding calendar
quarter. If we are unable to pass on to our customers future cost increases
due to inflation or rising commodity prices, our operating results could be
adversely affected.
Liquidity
and Capital Resources
Our
primary capital needs are for working capital obligations, the stock repurchase
program, dividend payments and other general corporate purposes, including
acquisitions and capital expenditures. Our primary sources of working capital
are cash from operations supplemented by bank borrowings.
Liquidity
is defined as the ability to generate adequate amounts of cash to meet the
current need for cash. We assess our liquidity in terms of our ability to
generate cash to fund our operating activities. Significant factors which could
affect liquidity include the following:
|
|
·
|
the
adequacy of available bank lines of
credit;
|
|
|
·
|
the
ability to attract long-term capital with satisfactory
terms;
|
|
|
·
|
additional
stock repurchases;
|
|
|
·
|
cash
flows generated from operating
activities;
|
|
|
·
|
payment
of dividends;
|
|
|
·
|
capital
expenditures; and
|
|
|
·
|
acquisitions
|
24
Comparison
of Years Ended December 31, 2009 and 2008
Our net
cash provided by operating activities was $18.7 million in 2009, a decrease of
$7.7 million or 29.1% compared to cash provided by operating activities of $26.4
million in 2008. Our net income decreased by $15.7 million or 66.2% to $8.0
million in 2009 from $23.7 million in 2008.
Changes
in our operating assets and liabilities resulted in cash provided by operating
activities of $8.2 million which was primarily caused by a reduction in
inventory of $11.6 million. The inventory decrease more closely aligned
inventory levels with the lower sales activity caused by the economic recession.
Accounts receivable decreased $4.0 million due to lower sales in 2009. In
addition, at December 31, 2009, a customer is withholding payment on $4.8
million of accounts receivable in connection with a dispute. The book overdraft,
which is funded by our revolving credit facility as soon as the related vendor
checks clear our disbursement account, decreased $4.0 million. Prepaids
increased $2.8 million primarily related to a prepayment for inventory which was
subsequently received in January 2010. Accounts payable increased $1.5 million
due in part to our withholding payment of $4.9 million in connection with the
dispute mentioned above. Income taxes payable decreased $1.4 million due to a
$1.2 million dollar federal tax payment that was postponed from December 2008
until January 2009 as allowed by the Internal Revenue Service for businesses in
the Hurricane Ike disaster area.
Net cash
used in investing activities decreased to $0.4 million in 2009 from $0.6 million
in 2008 as the Company enacted a more stringent policy for capital expenditures
due to the slowing economic conditions during 2009.
Net cash
used in financing activities decreased $7.6 million or 29.3% to $18.3 million in
2009 from $25.9 million in 2008. Net repayments on the revolver of $12.3 million
and dividend payments of $6.0 million were the main components of financing
activities in 2009.
Comparison
of Years Ended December 31, 2008 and 2007
Our net
cash provided by operating activities was $26.4 million in 2008, an increase of
$6.3 million or 31.6% compared to cash provided by operating activities of $20.1
million in 2007. Our net income decreased from $30.2 million in 2007
to $23.7 million in 2008. Accounts receivable decreased $7.1 million in 2008
compared to an increase of $5.8 million in 2007. Accounts receivable decreased
in 2008 as sales decreased during the last two months of the year due to the
macro economic environment. Accrued liabilities decreased $4.9
million in 2008. This decrease was primarily due to a reduction in our
prepaid orders as these orders shipped faster than new prepayments were
received. Inventories increased $4.2 million in 2008 as the increase in our
cable management inventory increased more than the decrease of our regular stock
inventory. Income taxes were a payable of $1.6 million in 2008 compared to
a receivable balance of $2.0 million in 2007.
Net cash
used in investing activities of $0.6 million in 2008 was down slightly from $0.7
million in 2007.
Net cash
used in financing activities increased $6.5 million or 33.4% to $25.9 million in
2008 from $19.4 million in 2007. Treasury stock purchases of $15.4 million,
dividend payments of $6.0 million and net repayments on the revolver loan of
$4.7 million were the main components of financing activities in
2008.
Indebtedness
Our
principal source of liquidity at December 31, 2009 was working capital of
$89.9 million compared to $98.3 million at December 31, 2008. We
also had available borrowing capacity in the amount of $49.7 million at
December 31, 2009 and $45.2 million at December 31, 2008 under
our loan and security agreement.
We
believe that we have adequate availability of capital to fund our present
operations, meet our commitments on our existing debt, continue the stock
repurchase program, continue to fund our dividend payments, and fund anticipated
growth over the next twelve months, including expansion in existing and targeted
market areas. We continually seek potential acquisitions and from time to time
hold discussions with acquisition candidates. If suitable acquisition
opportunities or working capital needs arise that would require additional
financing, we believe that our financial position and earnings history provide a
solid base for obtaining additional financing resources at competitive rates and
terms. Additionally, based on market conditions, we may issue additional shares
of common or preferred stock to raise funds.
25
Loan
and Security Agreement
We have a
loan agreement with Bank of America, N.A., as agent and lender, that provides
for a $75 million revolving loan. We amended and restated the loan agreement in
September 2009 to extend the maturity through September 21, 2013. The loan
agreement does not limit the amount of dividends we may pay or stock we may
repurchase, as long as we are not in default under the loan agreement and we
maintain defined levels of fixed charge coverage and minimum levels of
availability. The lender has a security interest in all of our assets
except for the real property in Houston, Texas. The loan bears interest at the
agent’s base interest rate.
Portions
of the outstanding loan may be converted to LIBOR loans in minimum amounts of
$1.0 million and integral multiples of $0.1 million. Upon such conversion,
interest is payable at LIBOR plus a margin ranging from 1.25% to 1.75%,
depending on our debt-to-EBITDA ratio. We have entered into a series of
one-month LIBOR loans, which, upon maturity, are either rolled back into the
revolving loan or renewed under a new LIBOR contract.
Covenants
in the loan agreement require us to maintain certain minimum financial ratios
and restrict the level of capital expenditures. Repaid amounts can be
re-borrowed subject to the borrowing base. Additionally, we are obligated to pay
an unused facility fee on the unused portion of the loan commitment. As of
December 31, 2009, we were in compliance with all financial covenants. We
paid approximately $0.1 million in unused facility fees for the year ended
December 31, 2009.
Contractual
Obligations
The
following table describes our cash commitments to settle contractual obligations
as of December 31, 2009.
|
Total
|
Less than
1 year
|
1-3 years
|
3-5 years
|
More than
5 years
|
||||||||||||||||
|
(In thousands)
|
||||||||||||||||||||
|
Loans
payable
|
$ | 17,479 | $ | — | $ | — | $ | 17,479 | $ | — | ||||||||||
|
Operating
lease obligations
|
9,116 | 2,469 | 4,152 | 2,285 | 210 | |||||||||||||||
|
Non-cancellable purchase
obligations (1)
|
27,713 | 27,713 | — | — | — | |||||||||||||||
|
Total
|
$ | 54,308 | $ | 30,182 | $ | 4,152 | $ | 19,764 | $ | 210 | ||||||||||
__________
|
(1)
|
These
obligations reflect purchase orders outstanding with manufacturers as of
December 31, 2009. We believe that some of these obligations may be
cancellable upon negotiation with our vendors, but we are treating these
as non-cancellable for this disclosure due to the absence of an express
cancellation right.
|
Capital
Expenditures
We made
capital expenditures of $0.5 million, $0.6 million and
$0.7 million in the years ended December 31, 2009, 2008 and 2007,
respectively.
Off-Balance
Sheet Arrangements
We have
no off-balance sheet arrangements, other than operating leases.
Share
Repurchases
In 2007,
the Board of Directors approved a stock repurchase program, where the Company is
authorized to purchase up to $75 million of its outstanding shares of common
stock, depending on market conditions, trading activity, business conditions and
other factors. The program was initially scheduled to expire on December 31,
2009 but has been extended through December 31, 2011. Shares of stock
purchased under the program are currently being held as treasury stock and may
be used to satisfy the exercise of options and restricted stock, to fund
acquisitions, or for other uses as authorized by the Board of Directors. There
were no shares repurchased during 2009.
Financial
Derivatives
We have
no financial derivatives.
26
Market
Risk Management
We are
exposed to market risks arising from changes in market prices, including
movements in interest rates and commodity prices.
Interest
Rate Risk
Our
variable interest rate debt is sensitive to changes in the general level of
interest rates. At December 31, 2009, the weighted average interest rate on
our $17.5 million of variable interest debt was
approximately 2.1%.
While our
variable rate debt obligations expose us to the risk of rising interest rates,
management does not believe that the potential exposure is material to our
overall financial performance or results of operations. Based on
December 31, 2009 borrowing levels, a 1.0% increase or decrease in the
applicable interest rates would have a $0.2 million effect on our annual
interest expense.
Commodity
Risk
We are
subject to periodic fluctuations in copper prices as our products have varying
levels of copper content in their construction. Profitability is influenced by
these copper fluctuations as prices change between the time we buy and sell our
products.
Foreign
Currency Exchange Rate Risk
Our
products are purchased and invoiced in U.S. dollars. Accordingly, we do not
believe we are exposed to foreign exchange rate risk.
Climate
Risk
Our
operations are subject to inclement weather conditions including hurricanes,
earthquakes and abnormal weather events. Our previous experience from these
events has had a minimal effect on our operations and results.
Factors
Affecting Future Results
This
Annual Report on Form 10-K contains statements that may be considered
forward-looking. These statements can be identified by the fact that
they do not relate strictly to historical or current facts. They use words such
as "aim," "anticipate," "believe," "could," "estimate," "expect," "intend,"
"may," "plan," "project," "should," "will be," "will continue," "will likely
result," "would" and other words and terms of similar meaning in conjunction
with a discussion of future operating or financial performance. You should read
statements that contain these words carefully, because they discuss our future
expectations, contain projections of our future results of operations or of our
financial position or state other "forward-looking"
information. Actual results could differ materially from the results
indicated by these statements, because the realization of those results is
subject to many risks and uncertainties. Some of these risks and
uncertainties are discussed in greater detail under Item 1A, "Risk
Factors."
All
forward-looking statements are based on current management expectations. Except
as required under federal securities laws and the rules and regulations of the
SEC, we do not have any intention, and do not undertake, to update any
forward-looking statements
to reflect events or circumstances arising after the date of this Form 10-K. Any
forward looking statements speak only as of the date of this filing and the
Company undertakes no obligation to publicly update such
statements.
Quantitative
and Qualitative Disclosures about Market Risk are reported in Item 7,
“Management’s Discussion and Analysis of Financial Condition and Results of
Operations”, under the captions “Market Risk Management”, “Interest Rate Risk”,
“Commodity Risk”, and “Foreign Currency Exchange Rate
Risk”.
27
Houston
Wire & Cable Company
Index
to consolidated financial statements
|
Page
|
|
|
Report
of Independent Registered Public Accounting Firm
|
29
|
|
Consolidated
Balance Sheets as of December 31, 2009 and 2008
|
30
|
|
Consolidated
Statements of Income for the years ended December 31, 2009, 2008 and
2007
|
31
|
|
Consolidated
Statements of Stockholders’ Equity for the years ended December 31, 2009,
2008 and 2007
|
32
|
|
Consolidated
Statements of Cash Flows for the years ended December 31, 2009, 2008 and
2007
|
33
|
|
Notes
to Consolidated Financial Statements
|
34
|
28
Report
of Independent Registered Public Accounting Firm
The
Board of Directors and Stockholders of Houston Wire & Cable
Company
We have
audited the accompanying consolidated balance sheets of Houston Wire & Cable
Company as of December 31, 2009 and 2008, and the related consolidated
statements of income, stockholders’ equity, and cash flows for each of the three
years in the period ended December 31, 2009. These financial statements are the
responsibility of the Company's management. Our responsibility is to express an
opinion on these financial statements based on our audits.
We
conducted our audits in accordance with the standards of the Public Company
Accounting Oversight Board (United States). Those standards require that we plan
and perform the audit to obtain reasonable assurance about whether the financial
statements are free of material misstatement. An audit includes examining, on a
test basis, evidence supporting the amounts and disclosures in the financial
statements. An audit also includes assessing the accounting principles used and
significant estimates made by management, as well as evaluating the overall
financial statement presentation. We believe that our audits provide a
reasonable basis for our opinion.
In our
opinion, the financial statements referred to above present fairly, in all
material respects, the consolidated financial position of Houston Wire &
Cable Company at December 31, 2009 and 2008, and the consolidated results of its
operations and its cash flows for each of the three years in the period ended
December 31, 2009, in conformity with U.S. generally accepted accounting
principles.
We also
have audited, in accordance with the standards of the Public Company Accounting
Oversight Board (United States), Houston Wire & Cable Company’s internal
control over financial reporting as of December 31, 2009, based on criteria
established in Internal Control-Integrated Framework issued by the Committee of
Sponsoring Organizations of the Treadway Commission and our report dated March
15, 2010 expressed an unqualified opinion thereon.
/s/
Ernst & Young LLP
Houston,
Texas
March 15,
2010
29
Houston
Wire & Cable Company
Consolidated
Balance Sheets
|
December 31,
|
||||||||
|
2009
|
2008
|
|||||||
|
(In thousands, except
share data)
|
||||||||
|
Assets
|
||||||||
|
Current
assets:
|
||||||||
|
Accounts
receivable, net
|
$ | 46,859 | $ | 50,798 | ||||
|
Inventories,
net
|
61,325 | 73,459 | ||||||
|
Deferred
income taxes
|
1,776 | 1,591 | ||||||
|
Prepaids
|
3,649 | 829 | ||||||
|
Total
current assets
|
113,609 | 126,677 | ||||||
|
Property
and equipment, net
|
3,169 | 3,274 | ||||||
|
Goodwill
|
2,362 | 2,362 | ||||||
|
Deferred
income taxes
|
2,855 | 2,353 | ||||||
|
Other
assets
|
19 | 87 | ||||||
|
Total
assets
|
$ | 122,014 | $ | 134,753 | ||||
|
Liabilities
and stockholders’ equity
|
||||||||
|
Current
liabilities:
|
||||||||
|
Book
overdraft
|
$ | 907 | $ | 4,933 | ||||
|
Trade
accounts payable
|
11,610 | 10,091 | ||||||
|
Accrued
and other current liabilities
|
10,924 | 11,682 | ||||||
|
Income
taxes
|
281 | 1,644 | ||||||
|
Total
current liabilities
|
23,722 | 28,350 | ||||||
|
Long-term
obligations
|
17,479 | 29,808 | ||||||
|
Stockholders’
equity:
|
||||||||
|
Preferred
stock, $0.001 par value; 5,000,000 shares authorized, none issued and
outstanding
|
||||||||
|
Common
stock, $0.001 par value; 100,000,000 shares authorized: 20,988,952 shares
issued:
|
||||||||
|
17,732,737
and 17,642,552 shares outstanding at December 31, 2009 and 2008,
respectively
|
21 | 21 | ||||||
|
Additional
paid-in capital
|
56,609 | 55,901 | ||||||
|
Retained
earnings
|
77,571 | 75,540 | ||||||
|
Treasury
stock
|
(53,388 | ) | (54,867 | ) | ||||
|
Total
stockholders’ equity
|
80,813 | 76,595 | ||||||
|
Total
liabilities and stockholders’ equity
|
$ | 122,014 | $ | 134,753 | ||||
The
accompanying notes are an integral part of these consolidated financial
statements.
30
Houston
Wire & Cable Company
Consolidated
Statements of Income
|
Year Ended December 31,
|
||||||||||||
|
2009
|
2008
|
2007
|
||||||||||
|
(In thousands, except share and per share
data)
|
||||||||||||
|
Sales
|
$ | 254,819 | $ | 360,939 | $ | 359,115 | ||||||
|
Cost
of sales
|
201,865 | 275,224 | 266,276 | |||||||||
|
Gross
profit
|
52,954 | 85,715 | 92,839 | |||||||||
|
Operating
expenses:
|
||||||||||||
|
Salaries
and commissions
|
20,596 | 24,080 | 23,861 | |||||||||
|
Other
operating expenses
|
18,023 | 20,728 | 18,811 | |||||||||
|
Depreciation
and amortization
|
563 | 523 | 459 | |||||||||
|
Total
operating expenses
|
39,182 | 45,331 | 43,131 | |||||||||
|
Operating
income
|
13,772 | 40,384 | 49,708 | |||||||||
|
Interest
expense
|
520 | 1,825 | 1,188 | |||||||||
|
Income
before income taxes
|
13,252 | 38,559 | 48,520 | |||||||||
|
Income
tax provision
|
5,220 | 14,822 | 18,295 | |||||||||
|
Net
income
|
$ | 8,032 | $ | 23,737 | $ | 30,225 | ||||||
|
Earnings
per share:
|
||||||||||||
|
Basic
|
$ | 0.46 | $ | 1.33 | $ | 1.49 | ||||||
|
Diluted
|
$ | 0.45 | $ | 1.33 | $ | 1.48 | ||||||
|
Weighted
average common shares outstanding:
|
||||||||||||
|
Basic
|
17,648,696 | 17,789,739 | 20,328,182 | |||||||||
|
Diluted
|
17,665,924 | 17,838,072 | 20,406,000 | |||||||||
|
Dividends
declared per share
|
$ | 0.34 | $ | 0.34 | $ | 0.15 | ||||||
The
accompanying notes are an integral part of these consolidated financial
statements.
31
Houston
Wire & Cable Company
Consolidated
Statements of Stockholders' Equity
|
Additional
|
Total
|
|||||||||||||||||||||||||||
|
Common Stock
|
Paid-In
|
Retained
|
Treasury Stock
|
Stockholders'
|
||||||||||||||||||||||||
|
Shares
|
Amount
|
Capital
|
Earnings
|
Shares
|
Amount
|
Equity
|
||||||||||||||||||||||
|
(In
thousands, except share data)
|
||||||||||||||||||||||||||||
|
Balance
at December 31, 2006
|
20,867,172 | 21 | 50,979 | 30,674 | — | — | 81,674 | |||||||||||||||||||||
|
Net
income
|
— | — | — | 30,225 | — | — | 30,225 | |||||||||||||||||||||
|
Exercise
of stock options
|
121,780 | — | 91 | (56 | ) | 3,375 | 62 | 97 | ||||||||||||||||||||
|
Excess
tax benefit for stock options
|
— | — | 1,235 | — | — | — | 1,235 | |||||||||||||||||||||
|
Amortization
of unearned stock compensation
|
— | — | 1,826 | — | — | — | 1,826 | |||||||||||||||||||||
|
Purchase
of treasury stock, net
|
— | — | — | — | (2,414,600 | ) | (40,890 | ) | (40,890 | ) | ||||||||||||||||||
|
Dividends
paid
|
— | — | — | (2,997 | ) | — | — | (2,997 | ) | |||||||||||||||||||
|
Balance
at December 31, 2007
|
20,988,952 | 21 | 54,131 | 57,846 | (2,411,225 | ) | (40,828 | ) | 71,170 | |||||||||||||||||||
|
Net
income
|
— | — | — | 23,737 | — | — | 23,737 | |||||||||||||||||||||
|
Exercise
of stock options
|
— | — | (628 | ) | — | 42,079 | 686 | 58 | ||||||||||||||||||||
|
Excess
tax benefit for stock options
|
— | — | 264 | — | — | — | 264 | |||||||||||||||||||||
|
Amortization
of unearned stock compensation
|
— | — | 2,134 | — | — | — | 2,134 | |||||||||||||||||||||
|
Purchase
of treasury stock, net
|
— | — | — | — | (977,254 | ) | (14,725 | ) | (14,725 | ) | ||||||||||||||||||
|
Dividends
paid
|
— | — | — | (6,043 | ) | — | — | (6,043 | ) | |||||||||||||||||||
|
Balance
at December 31, 2008
|
20,988,952 | 21 | 55,901 | 75,540 | (3,346,400 | ) | (54,867 | ) | 76,595 | |||||||||||||||||||
|
Net
income
|
— | — | — | 8,032 | — | — | 8,032 | |||||||||||||||||||||
|
Exercise
of stock options
|
— | — | (145 | ) | — | 10,185 | 167 | 22 | ||||||||||||||||||||
|
Excess
tax benefit for stock options
|
— | — | 13 | — | — | — | 13 | |||||||||||||||||||||
|
Deferred
tax adjustment related to stock compensation
|
— | — | (53 | ) | — | — | — | (53 | ) | |||||||||||||||||||
|
Amortization
of unearned stock compensation
|
— | — | 2,205 | — | — | — | 2,205 | |||||||||||||||||||||
|
Issuance
of restricted stock awards
|
— | — | (1,312 | ) | — | 80,000 | 1,312 | — | ||||||||||||||||||||
|
Dividends
paid
|
— | — | — | (6,001 | ) | — | — | (6,001 | ) | |||||||||||||||||||
|
Balance
at December 31, 2009
|
20,988,952 | $ | 21 | $ | 56,609 | $ | 77,571 | (3,256,215 | ) | $ | (53,388 | ) | $ | 80,813 | ||||||||||||||
The
accompanying notes are an integral part of these consolidated financial
statements.
32
Houston
Wire & Cable Company
Consolidated
Statements of Cash Flows
|
Year Ended December 31,
|
||||||||||||
|
2009
|
2008
|
2007
|
||||||||||
|
(In
thousands)
|
||||||||||||
|
Operating
activities
|
||||||||||||
|
Net
income
|
$ | 8,032 | $ | 23,737 | $ | 30,225 | ||||||
|
Adjustments
to reconcile net income to net cash provided by operating
activities:
|
||||||||||||
|
Depreciation
and amortization
|
563 | 523 | 459 | |||||||||
|
Amortization
of capitalized loan costs
|
99 | 80 | 66 | |||||||||
|
Amortization
of unearned stock compensation
|
2,205 | 2,134 | 1,826 | |||||||||
|
Provision
for doubtful accounts
|
— | 214 | (238 | ) | ||||||||
|
Provision
for returns and allowances
|
(109 | ) | 70 | (37 | ) | |||||||
|
Provision
for inventory obsolescence
|
529 | 46 | 55 | |||||||||
|
(Gain)
loss on disposals of property and equipment
|
(15 | ) | 8 | (15 | ) | |||||||
|
Deferred
income taxes
|
(741 | ) | (900 | ) | (557 | ) | ||||||
|
Changes
in operating assets and liabilities:
|
||||||||||||
|
Accounts
receivable
|
4,048 | 7,120 | (5,799 | ) | ||||||||
|
Inventories
|
11,606 | (4,206 | ) | (13,025 | ) | |||||||
|
Prepaids
|
(2,820 | ) | 3 | (382 | ) | |||||||
|
Other
assets
|
(31 | ) | (53 | ) | (45 | ) | ||||||
|
Book
overdraft
|
(4,026 | ) | 1,079 | 2,589 | ||||||||
|
Trade
accounts payable
|
1,519 | (2,206 | ) | 1,309 | ||||||||
|
Accrued
and other current liabilities
|
(758 | ) | (4,861 | ) | 6,185 | |||||||
|
Income
taxes
|
(1,363 | ) | 3,648 | (2,524 | ) | |||||||
|
Net
cash provided by operating activities
|
18,738 | 26,436 | 20,092 | |||||||||
|
Investing
activities
|
||||||||||||
|
Expenditures
for property and equipment
|
(462 | ) | (572 | ) | (728 | ) | ||||||
|
Proceeds
from disposals of property and equipment
|
19 | 1 | 23 | |||||||||
|
Net
cash used in investing activities
|
(443 | ) | (571 | ) | (705 | ) | ||||||
|
Financing
activities
|
||||||||||||
|
Borrowings
on revolver
|
255,829 | 371,915 | 397,471 | |||||||||
|
Payments
on revolver
|
(268,158 | ) | (376,614 | ) | (375,023 | ) | ||||||
|
Proceeds
from exercise of stock options
|
22 | 58 | 97 | |||||||||
|
Payment
of dividends
|
(6,001 | ) | (6,043 | ) | (2,997 | ) | ||||||
|
Excess
tax benefit for options
|
13 | 264 | 1,235 | |||||||||
|
Purchase
of treasury stock
|
— | (15,445 | ) | (40,170 | ) | |||||||
|
Net
cash used in financing activities
|
(18,295 | ) | (25,865 | ) | (19,387 | ) | ||||||
|
Net
change in cash
|
— | — | — | |||||||||
|
Cash
at beginning of year
|
— | — | — | |||||||||
|
Cash
at end of year
|
$ | — | $ | — | $ | — | ||||||
|
Supplemental
disclosures
|
||||||||||||
|
Cash
paid during the year for interest
|
$ | 514 | $ | 1,920 | $ | 1,119 | ||||||
|
Cash
paid during the year for income taxes
|
$ | 7,352 | $ | 11,908 | $ | 20,148 | ||||||
The
accompanying notes are an integral part of these consolidated financial
statements.
33
Houston
Wire & Cable Company
Notes
to Consolidated Financial Statements
(in thousands, except
share data)
1. Organization
and Summary of Significant Accounting Policies
Description
of Business
Houston
Wire & Cable Company (the “Company”), through its wholly owned
subsidiaries, HWC Wire & Cable Company, Advantage Wire & Cable
and Cable Management Services Inc., distributes specialty electrical wire
and cable to the U.S. electrical distribution market through eleven locations in
ten states throughout the United States. The Company has no other business
activity.
Basis
of Presentation and Principles of Consolidation
The
consolidated financial statements include the accounts of the Company and its
subsidiaries and have been prepared following accounting principles generally
accepted in the United States (“GAAP”) and the requirements of the Securities
and Exchange Commission (“SEC”). The financial statements include all normal and
recurring adjustments that are necessary for a fair presentation of the
Company’s financial position and operating results. All significant
inter-company balances and transactions have been eliminated.
Reclassifications
Certain
prior period amounts have been reclassified to conform to the current period
presentation. The purchase accounting entries made at the time of the Company’s
acquisition of the Futronix division of Kent Electronics Corporation in 2000
improperly omitted the $634 deferred tax asset associated with the Company’s
book and tax basis differences in the net assets acquired. That omission was
corrected in 2009 by reducing goodwill in the amount of $634 with an offsetting
adjustment to deferred income taxes. The accounting for deferred income taxes
associated with subsequent reductions in the initial basis difference has been
properly recorded. At December 31, 2008, subsequent to the recording of this
adjustment, the deferred tax asset associated with the remaining basis
difference is properly stated at $61.
Use
of Estimates
The
preparation of the financial statements in conformity with GAAP requires
management to make estimates and assumptions that affect the amounts reported in
the financial statements and accompanying notes. The most significant estimates
are those relating to the allowance for doubtful accounts, the inventory
obsolescence reserve, the reserve for returns and allowances, and vendor
rebates. These estimates are continually reviewed and adjusted as necessary, but
actual results could differ from those estimates.
Earnings
per Share
Basic
earnings per share is calculated by dividing net income by the weighted average
number of common shares outstanding. Diluted earnings per share include the
dilutive effects of stock option and restricted stock awards.
The
following reconciles the denominator used in the calculation of earnings per
share:
|
Year Ended December 31,
|
||||||||||||
|
2009
|
2008
|
2007
|
||||||||||
|
Denominator:
|
||||||||||||
|
Weighted
average common shares for basic earnings per share
|
17,648,696 | 17,789,739 | 20,328,182 | |||||||||
|
Effect
of dilutive securities
|
17,228 | 48,333 | 77,818 | |||||||||
|
Denominator
for diluted earnings per share
|
17,665,924 | 17,838,072 | 20,406,000 | |||||||||
Options
to purchase 1,042,795, 829,822 and 586,075 shares of common stock were not
included in the diluted net income per share calculation for 2009, 2008 and
2007, respectively, as their inclusion would have been
anti-dilutive.
34
Accounts
Receivable
Accounts
receivable consists primarily of receivables from customers, less an allowance
for doubtful accounts of $282 and $262, and a reserve for returns and allowances
of $604 and $713 at December 31, 2009 and 2008, respectively. Consistent
with industry practices, the Company normally requires payment from its
customers within 30 days. The Company has no contractual repurchase
arrangements with its customers. Credit losses have been within management’s
expectations.
The
following table summarizes the changes in the allowance for doubtful accounts
for the past three years:
|
2009
|
2008
|
2007
|
||||||||||
|
Balance
at beginning of year
|
$ | 262 | $ | 130 | $ | 490 | ||||||
|
Bad
debt expense
|
— | 214 | (238 | ) | ||||||||
|
Write-offs,
net of recoveries
|
20 | (82 | ) | (122 | ) | |||||||
|
Balance
at end of year
|
$ | 282 | $ | 262 | $ | 130 | ||||||
Inventories
Inventories
are carried at the lower of cost, using the average cost method, or market and
consist primarily of goods purchased for resale, less a reserve for obsolescence
and unusable items and unamortized vendor rebates. The reserve for inventory is
based upon a number of factors, including the experience of the purchasing and
sales departments, age of the inventory, new product offerings, and other
factors. The reserve for inventory may periodically require adjustment as the
factors identified above change. The inventory reserve was $2,228 and $1,838 at
December 31, 2009 and 2008, respectively.
Vendor
Rebates
Under
many of the Company’s arrangements with its vendors, the Company receives a
rebate of a specified amount of consideration, payable when the Company achieves
any of a number of measures, generally related to the volume level of purchases
from the vendors. The Company accounts for such rebates as a reduction of the
prices of the vendors’ products and therefore as a reduction of inventory until
it sells the products, at which time such rebates reduce cost of sales in the
accompanying consolidated statements of income. Throughout the year, the Company
estimates the amount of the rebates earned based on its estimate of purchases to
date relative to the purchase levels that mark its progress toward earning the
rebates. The Company continually revises these estimates to reflect actual
rebates earned based on actual purchase levels.
Property
and Equipment
The
Company provides for depreciation on a straight-line method over the following
estimated useful lives:
|
Buildings
|
30
years
|
|
Machinery
and equipment
|
3
to 5 years
|
Leasehold
improvements are depreciated over their estimated life or the term of the lease,
whichever is shorter. Depreciation expense was approximately $563, $523, and $459 for the
years ended December 31, 2009, 2008 and 2007, respectively.
Goodwill
Goodwill
is not amortized but is reviewed annually for impairment, or more frequently if
indications of possible impairment exist, by applying a fair value-based test.
The Company completes the required annual assessment as of October 1 of
each year. The Company has performed the requisite impairment tests for goodwill
and has determined that goodwill was not impaired.
Other
Assets
Other
assets include deferred financing costs of $1,791. The capitalized loan costs
are amortized on a straight-line basis over the contractual life of the related
debt agreement, which approximates the effective interest method, and such
amortization expense is included in interest expense in the accompanying
consolidated statements of income. Accumulated amortization at December 31,
2009 and 2008 was approximately $1,779 and $1,715, respectively.
Estimated
future amortization expense for capitalized loan costs through the maturity of
the agreement is $12 and $0 for the years 2010 and 2011,
respectively.
35
Self
Insurance
The
Company retains certain self-insurance risks for both health benefits and
property and casualty insurance programs. The Company limits its exposure to
these self insurance risks by maintaining excess and aggregate liability
coverage. Self insurance reserves are established based on claims filed and
estimates of claims incurred but not reported. The estimates are based on
information provided to the Company by its claims administrators.
Segment
Reporting
The
Company operates in a single operating and reporting segment, sales of specialty
wire and cable.
Revenue
Recognition, Returns & Allowances
The
Company recognizes revenue when the following four
basic criteria have been met:
1. Persuasive
evidence of an arrangement exists;
2. Delivery
has occurred or services have been rendered;
3. The
seller’s price to the buyer is fixed or determinable; and
4. Collectibility
is reasonably assured.
The
Company records revenue when customers take delivery of products. Customers may
pick up products at any distribution center location, or products may be
delivered via third party carriers. Products shipped via third party carriers
are considered delivered based on the shipping terms, which are generally FOB
shipping point. Normal payment terms are net 30 days. Customers are permitted to
return product only on a case-by-case basis. Product exchanges are handled as a
credit, with any replacement items being re-invoiced to the customer. Customer
returns are recorded as an adjustment to net sales. In the past, customer
returns have not been material. The Company has no installation
obligations.
The
Company may offer volume rebates, which are accrued monthly as an adjustment to
net sales.
Shipping
and Handling
The
Company incurs shipping and handling costs in the normal course of business.
Freight amounts invoiced to customers are included as sales and freight charges
are included as a component of cost of sales.
Credit
Risk
The
Company’s customers are located primarily throughout the United States. No one
customer accounted for 10% or more of the Company’s sales in 2009 or 2008. In
2007, 12% of the Company’s sales were generated from one customer. The Company
performs periodic credit evaluations of its customers and generally does not
require collateral.
Advertising
Costs
Advertising
costs are expensed when incurred. Advertising expenses were $94, $722, and $947
for the years ended December 31, 2009, 2008, and 2007,
respectively.
Financial
Instruments
The
carrying values of the accounts receivable, trade accounts payable and accrued
and other current liabilities approximate fair value, due to the short maturity
of these instruments. The carrying amount of long term debt approximates fair
value as it bears interest at variable rates.
Stock-Based
Compensation
Stock
options issued under the Company’s stock plan have an exercise price equal to
the fair value of the Company’s stock on the grant date. Restricted stock is
issued at the closing price of the Company’s stock on the grant date. The
Company recognizes compensation expense ratably over the vesting period. The
Company’s compensation expense is included in salaries and commissions expense
in the accompanying consolidated statements of income.
36
The
Company receives a tax deduction for certain stock option exercises in the
period in which the options are exercised, generally for the excess of the
market price on the date of exercise over the exercise price of the options. The
Company reports excess tax benefits from the award of equity instruments as
financing cash flows. Excess tax benefits result when a deduction reported for
tax return purposes for an award of equity instruments exceeds the cumulative
compensation cost for the instruments recognized for financial reporting
purposes.
Income
Taxes
Deferred
tax assets and liabilities are determined based on differences between the
carrying amounts of assets and liabilities for financial reporting purposes and
the amounts used for income tax purposes and are measured using the enacted tax
rates and laws that will be in effect when the differences are expected to
reverse.
New
Accounting Pronouncements
FASB
Accounting Standards Codification
In June
2009, the Financial Accounting Standards Board (“FASB”) issued the FASB
Accounting Standards Codification (“ASC” or the “Codification”), the
authoritative guidance for GAAP. The Codification, which changes the referencing
of financial standards, became effective for interim and annual periods ended on
or after September 15, 2009. The Codification is now the single official source
of authoritative GAAP (other than guidance issued by the SEC), superseding
existing FASB, American Institute of Certified Public Accountants, Emerging
Issues Task Force (“EITF”), and related literature. Only one level of
authoritative GAAP now exists. All other literature is considered
non-authoritative. The Codification does not change GAAP. The Company adopted
the Codification during the quarter ended September 30, 2009. The adoption of
the Codification did not have any substantive impact on the consolidated
financial statements or related footnotes.
Subsequent
Events
In May
2009, the FASB issued authoritative guidance which establishes general standards
of accounting for and disclosure of events that occur after the balance sheet
date but before financial statements are issued or are available to be issued.
Specifically, this standard sets forth the period after the balance sheet date
during which management of a reporting entity should evaluate events or
transactions that may occur for potential recognition or disclosure in the
financial statements, the circumstances under which an entity should recognize
events or transactions occurring after the balance sheet date in its financial
statements, and the disclosures that an entity should make about events or
transactions that occurred after the balance sheet date. The guidance is
effective for fiscal years and interim periods ended after June 15, 2009. The
Company adopted this guidance effective June 15, 2009 and in connection with the
filing of this Form 10-K the Company has evaluated subsequent events through
March 15, 2010. The Company has disclosed these subsequent events in Note 10, to
the consolidated financial statements.
Business
Combinations
In
December 2007, the FASB issued authoritative guidance which establishes
principles and requirements for how an acquirer recognizes and measures in its
financial statements the identifiable assets acquired, the liabilities assumed,
any non-controlling interest in the acquiree and the goodwill acquired. The
guidance also requires transaction costs related to the business combination to
be expensed as incurred and establishes disclosure requirements to enable the
evaluation of the nature and financial effects of the business combination. The
guidance applies prospectively to business combinations for which the
acquisition date is on or after the beginning of the first annual reporting
period beginning on or after December 15, 2008. The Company adopted the guidance
on January 1, 2009. The adoption did not have an impact on the consolidated
financial statements.
37
2. Detail
of Selected Balance Sheet Accounts
Property
and Equipment
Property
and equipment are stated at cost and consist of:
|
At December 31,
|
||||||||
|
2009
|
2008
|
|||||||
|
Land
|
$ | 617 | $ | 617 | ||||
|
Buildings
|
2,209 | 2,166 | ||||||
|
Machinery
and equipment
|
6,109 | 6,049 | ||||||
| 8,935 | 8,832 | |||||||
|
Less
accumulated depreciation
|
5,766 | 5,558 | ||||||
| $ | 3,169 | $ | 3,274 | |||||
Accrued
and Other Current Liabilities
Accrued
and other current liabilities consist of:
|
At December 31,
|
||||||||
|
2009
|
2008
|
|||||||
|
Customer
advances
|
$ | 3,756 | $ | 2,080 | ||||
|
Customer
rebates
|
1,791 | 3,304 | ||||||
|
Payroll,
commissions, and bonuses
|
1,271 | 1,659 | ||||||
|
Accrued
inventory purchases
|
1,205 | 2,093 | ||||||
|
Other
|
2,901 | 2,546 | ||||||
| $ | 10,924 | $ | 11,682 | |||||
3. Long-Term
Obligations
On
September 21, 2009, the Company as guarantor and HWC Wire & Cable Company as
borrower, entered into the Second Amended and Restated Loan and Security
Agreement (“Loan Agreement”), with Bank of America, N.A., as agent and lender.
The Loan Agreement provides for a $75,000 revolving loan at the agent’s base
interest rate and matures on September 21, 2013. The lender has a security
interest in all of the assets of the Company with the exception of the real
estate in Houston, Texas. Availability under the Loan Agreement is calculated as
a percentage of qualifying accounts receivable and inventory.
Portions
of the outstanding loan may be converted to LIBOR loans in minimum amounts of
$1,000 and integral multiples of $100. Upon such conversion, interest is payable
at LIBOR plus a margin ranging from 1.25% to 1.75%, depending on the Company’s
debt-to-EBITDA ratio. The Company has entered into a series of one-month LIBOR
loans, which, upon maturity, are either rolled back into the revolving loan or
renewed under a new LIBOR contract.
The Loan
Agreement includes, among other things, covenants that require the Company to
maintain certain minimum financial ratios. Additionally, the Loan Agreement
allows for the unlimited payment of dividends and repurchases of stock, subject
to the absence of events of default, maintaining defined levels of fixed charge
coverage and minimum levels of availability. At December 31, 2009, the Company
was in compliance with the financial covenants governing its
indebtedness.
The
Company’s borrowings at December 31, 2009 and 2008 were $17,479 and $29,808,
respectively. The weighted average interest rates on outstanding borrowings were
2.1% and 2.3% at December 31, 2009 and 2008, respectively.
During
2009, the Company had an average available borrowing capacity of approximately
$51,677. This average was computed from the monthly borrowing base certificates
prepared for the lender. At December 31, 2009, the Company had available
borrowing capacity of $49,706 under the terms of the Loan Agreement. Under the
Loan Agreement, the Company is obligated to pay an unused facility fee of 0.2%
computed on a daily basis. During the years ended December 31, 2009, 2008
and 2007, the Company paid $107, $68, and $77, respectively, for the unused
facility.
38
Principal
repayment obligations for succeeding fiscal years are as follows:
|
2010
|
$ | — | ||
|
2011
|
— | |||
|
2012
|
— | |||
|
2013
|
17,479 | |||
|
Total
|
$ | 17,479 |
4. Income
Taxes
The
provision (benefit) for income taxes consists of:
|
Year Ended December 31,
|
||||||||||||
|
2009
|
2008
|
2007
|
||||||||||
|
Current:
|
||||||||||||
|
Federal
|
$ | 5,307 | $ | 14,022 | $ | 16,607 | ||||||
|
State
|
654 | 1,700 | 2,245 | |||||||||
|
Total
current
|
5,961 | 15,722 | 18,852 | |||||||||
|
Deferred:
|
||||||||||||
|
Federal
|
(674 | ) | (819 | ) | (511 | ) | ||||||
|
State
|
(67 | ) | (81 | ) | (46 | ) | ||||||
|
Total
deferred
|
(741 | ) | (900 | ) | (557 | ) | ||||||
|
Total
|
$ | 5,220 | $ | 14,822 | $ | 18,295 | ||||||
A
reconciliation of the U.S. Federal statutory tax rate to the effective tax rate
on income before taxes is as follows:
|
Year Ended December 31,
|
||||||||||||
|
2009
|
2008
|
2007
|
||||||||||
|
Federal
statutory rate
|
35.0 | % | 35.0 | % | 35.0 | % | ||||||
|
State
taxes, net of federal benefit
|
2.8 | 2.7 | 2.9 | |||||||||
|
Non-deductible
items
|
0.9 | 0.5 | 0.3 | |||||||||
|
Other
|
0.7 | 0.2 | (0.5 | ) | ||||||||
|
Total
effective tax rate
|
39.4 | % | 38.4 | % | 37.7 | % | ||||||
Significant
components of the Company’s deferred tax assets were as follows:
|
Year Ended
December 31,
|
||||||||
|
2009
|
2008
|
|||||||
|
Deferred
tax assets:
|
||||||||
|
Property
and equipment
|
$ | 386 | $ | 391 | ||||
|
Goodwill
|
148 | 339 | ||||||
|
Uniform
capitalization adjustment
|
634 | 543 | ||||||
|
Inventory
reserve
|
858 | 854 | ||||||
|
Allowance
for doubtful accounts
|
109 | 101 | ||||||
|
Stock
compensation expense
|
2,397 | 1,622 | ||||||
|
Other
|
99 | 94 | ||||||
|
Total
deferred tax assets
|
$ | 4,631 | $ | 3,944 | ||||
In 2006,
new accounting principles were issued which clarified the accounting for
uncertainty in income taxes recognized. The Company adopted these principles on
January 1, 2007, as required. The Company recorded the cumulative effect of
adopting these principles in retained earnings and other accounts as
applicable.
39
The
Company recognizes interest on any tax issue as a component of interest expense
and any related penalties in other operating expenses. As of December 31, 2009,
2008 and 2007, the Company made no provisions for interest or penalties related
to uncertain tax positions. The tax years 2005 through 2009 remain open to
examination by the major taxing jurisdictions to which the Company is
subject.
5. Stockholders’
Equity
In 2007,
the Board of Directors approved a stock repurchase program, where the Company is
authorized to purchase up to $75,000 of its outstanding shares of common stock,
depending on market conditions, trading activity, business conditions and other
factors. The program was initially scheduled to expire on December 31, 2009 but
has been extended through December 31, 2011. Shares of stock purchased
under the program are currently being held as treasury stock and may be used to
satisfy the exercise of options and the issuance of restricted stock, to fund
acquisitions, or for other uses as authorized by the Board of Directors. During
the year ended December 31, 2009, the Company did not repurchase any of its
stock. During the year ended December 31, 2008, the Company repurchased 977,254
shares for a total cost of $14,725. As of December 31, 2009, the Company had
total repurchases of 3,391,854 shares for a total cost of $55,615.
The
December 31, 2007 statement of cash flows has been adjusted to exclude accrued
shares purchases totaling $720 at December 31, 2007, funded during the first
quarter of 2008.
On August
1, 2007, the Board of Directors approved an initial cash dividend of $0.075 per
share payable to stockholders of record on August 15, 2007. This quarterly
dividend was paid at the same rate per share for the final quarter of 2007,
resulting in aggregate 2007 dividends of $2,997. On February 1, 2008,
the Board of Directors approved an increase in the quarterly dividend to $0.085
per share. Since February 2008, the Company has paid a quarterly cash dividend
of $0.085 per share, resulting in aggregate dividends in 2009 and 2008 of
$6,001 and $6,043, respectively.
On May
18, 2009, the Company’s Board of Directors adopted a stockholder rights plan and
declared a dividend of one preferred stock purchase right (a “Right”) for each
share of the Company’s common stock outstanding at the close of business on May
28, 2009. The Rights become exercisable (and separate from the common stock) ten
business days after (i) the acquisition of 20% or more of the common stock by
any person or group (an “Acquiring Person”) or (ii) the commencement of a tender
or exchange offer for 20% or more of the common stock.
In the
event that an Acquiring Person acquires 20% or more of the common stock, or if
the Company is the surviving corporation in a merger involving an Acquiring
Person, each Right (other than Rights owned by an Acquiring Person) will entitle
the holder to purchase for $40 (or the then-current purchase price) a number of
shares of the Company’s common stock having a market value of $80 (or twice the
then-current purchase price). Similarly, if the Company is acquired in a merger
or sells substantially all of its assets, each Right (other than Rights owned by
an Acquiring Person) will entitle the holder to purchase for the then-current
purchase price a number of shares of the surviving company’s stock having a
market value of twice the then-current purchase price.
The
Rights do not entitle the holder to vote or to receive dividends and may be
redeemed at the option of the Company for $0.001 per Right at any time before an
Acquiring Person acquires 20% or more of the common stock. At any time an
Acquiring Person owns between 20% and 50% of the common stock, the Board of
Directors may exchange all or part of the Rights (other than Rights owned by the
Acquiring Person) for shares of common stock on a one-for-one basis. Unless
previously exchanged or redeemed, the Rights will expire on May 18, 2012. The
Board of Directors will submit the stockholder rights plan for ratification by
the Company’s stockholders at the annual meeting to be held on May 7,
2010.
The
Company is authorized to issue 5,000,000 shares of preferred stock, par value
$.001 per share. The Board of Directors is authorized to fix the particular
preferences, rights, qualifications and restrictions of each series of preferred
stock. In connection with the adoption of the stockholder rights plan, the Board
of Directors designated 100,000 shares as Series A Junior Participating
Preferred Stock. No shares of preferred stock have been issued.
6. Related-Party
Transactions
In March
2007, the Company registered an offering for its then largest stockholder, Code,
Hennessy & Simmons II, L.P. and other selling stockholders, who sold
approximately 7,500,000 common shares at $25 per share. All the shares were sold
by selling stockholders, including approximately 6,900,000 common shares by
Code, Hennessy & Simmons II, L.P., thus there was no dilution to earnings
per share or any proceeds to the Company. After the offering, Code, Hennessy
& Simmons II, L.P.’s ownership was reduced from 38% to 8%. Code Hennessy
& Simmons II, L.P. subsequently distributed all of the remaining shares to
its partners and no longer holds any shares of common stock.
40
7. Employee
Benefit Plans
The
Company maintains a combination profit-sharing plan and salary deferral plan
(the “Plan”) for the benefit of its employees. Employees who are eligible to
participate in the Plan can contribute a percentage of their base compensation,
up to the maximum percentage allowable not to exceed the limits of Internal
Revenue Code (“Code”) Sections 401(k), 404, and 415, subject to the IRS-imposed
dollar limit. Employee contributions are invested in certain equity and
fixed-income securities, based on employee elections. The Company has adopted
the Safe Harbor provisions of the Code, whereby contributions up to the first 3%
of an employee’s compensation are matched 100% by the Company and the next 2%
are matched 50% by the Company. The Company’s match for the years
ended December 31, 2009, 2008 and 2007 was $537, $623, and $619
respectively.
8. Incentive
Plans
On
March 23, 2006, the Company adopted and on May 1, 2006, the stockholders
approved the 2006 Stock Plan (the “2006 Plan”) to provide incentives for certain
key employees and directors through awards and the exercise of options. The 2006
Plan provides for options to be granted at the fair market value of the
Company’s common stock at the date of grant and may be either nonqualified stock
options or incentive stock options as defined by Section 422 of the Code.
Under the 2006 Plan a maximum of 1,800,000 shares may be issued to
designated participants. The maximum number of shares available to any one
participant in any one calendar year is 500,000.
Stock
Option Awards
The
Company also has options outstanding under a stock option plan adopted in 2000
(the “2000 Plan”). The 2000 Plan provided for options to be granted at the fair
market value of the Company’s common stock at the date of the grant, which
options could be either nonqualified stock options or incentive stock options as
defined by Section 422 of the Code. In connection with the adoption of the 2006
Stock Plan, the Board of Directors resolved that no further options would be
granted under the 2000 Plan.
The
Company has granted options to purchase its common stock to employees and
directors of the Company under the two stock option plans at no less than the
fair market value of the underlying stock on the date of grant. These options
are granted for a term not exceeding ten years and may be forfeited in the event
the employee or director terminates, other than by retirement, his or her
employment or relationship with the Company. Options granted to employees
generally vest over three to five years, and options granted to directors
generally vest one year after the date of grant. Shares issued to satisfy the
exercise of options may be newly issued shares or treasury shares. Both option
plans contain anti-dilutive provisions that permit an adjustment of the number
of shares of the Company’s common stock represented by each option for any
change in capitalization. Compensation cost for options granted is charged to
expense on a straight line basis over the term of the option.
On
December 17, 2008, the Company granted options to purchase 65,000 shares of its
common stock to the Company’s chief executive officer with the exercise price
equal to the fair market value of the Company’s stock at the close of trading on
December 17, 2008. On January 9, 2008, the Company granted options to
purchase 65,000 shares of its common stock to the Company’s chief executive
officer with an exercise price equal to the fair market value of the Company’s
stock at the close of trading on January 9, 2008. In each case, the options have
a contractual life of ten years and vest 50% on March 9, 2011 and the remaining
50% on March 9, 2012, provided that in the event of the chief executive
officer’s death or permanent disability, such options would vest ratably based
on the days served from the date of grant.
On May 8,
2009, at the Annual Meeting of Stockholders, the Company issued options to
purchase 5,000 shares of its common stock to each non-employee director who was
re-elected (other than the Chairman of the Board, who received an option to
purchase 10,000 shares of the Company’s common stock), for an aggregate of
35,000 shares. Each option has an exercise price equal to the fair market value
of the Company’s common stock at the close of trading on May 8, 2009, has a
contractual life of ten years and vests one year after the date of
grant.
The fair
value of each option awarded is estimated on the date of grant using a
Black-Scholes option-pricing model. Expected volatilities are based on
historical volatility of the Company’s stock and the historical volatility of
the stock of similar companies, and other factors. The Company uses historical
data to estimate option exercises and employee terminations within the valuation
model. The expected life of options granted represents the period of time that
options granted are expected to be outstanding. The risk-free rate for periods
within the life of the option is based on the U.S. Treasury yield curve in
effect at the time of grant. For options issued, the following weighted average
assumptions were used:
41
|
Year Ended
December 31,
|
||||||||||||
|
2009
|
2008
|
2007
|
||||||||||
|
Risk-free
interest rate
|
1.00 | % | 2.51 | % | 4.53 | % | ||||||
|
Expected
dividend yield
|
3.29 | % | 3.21 | % | 0.25 | % | ||||||
|
Weighted
average expected life
|
2
years
|
5.5
years
|
5.5
years
|
|||||||||
|
Expected
volatility
|
81 | % | 55 | % | 45 | % | ||||||
During
the years ended December 31, 2009, 2008 and 2007, tax benefits of $13, $264 and
$1,235, respectively, were reflected in financing cash flows.
The total
intrinsic value of options exercised during the years ended December 31,
2009, 2008 and 2007 was $77, $738 and $3,200, respectively.
The
following summarizes stock option activity and related information:
|
2009
|
||||||||||||
|
Options
(in 000’s)
|
Weighted
Average
Exercise Price
|
Aggregate
Intrinsic
Value
|
||||||||||
|
Outstanding—Beginning
of year
|
1,178 | $ | 18.99 | $ | 465 | |||||||
|
Granted
|
35 | 4.04 | ||||||||||
|
Exercised
|
(10 | ) | 2.20 | |||||||||
|
Forfeitures
|
(8 | ) | (17.51 | ) | ||||||||
|
Expired
|
— | — | ||||||||||
|
Outstanding—End
of year
|
1,195 | $ | 18.93 | $ | 1,146 | |||||||
|
Exercisable—End
of year
|
300 | $ | 7.16 | $ | 456 | |||||||
|
Weighted
average fair value of options granted during 2009
|
$ | 4.04 | ||||||||||
|
Weighted
average fair value of options granted during 2008
|
$ | 5.24 | ||||||||||
|
Weighted
average fair value of options granted during 2007
|
$ | 11.53 | ||||||||||
Vesting
dates range from May 8, 2010 to December 17, 2013, and expiration dates
range from June 26, 2010 to May 8, 2019 at exercise prices and
average contractual lives as follows:
|
Exercise Prices
|
Outstanding
as of
12/31/09
(in 000’s)
|
Weighted
Average
Remaining
Contractual
Life
|
Exercisable
as of 12/31/09
(in 000’s)
|
Weighted
Average
Remaining
Contractual
Life
|
||||||||||
| $ |
0.53
|
9
|
2.02 | 9 | 2.02 | |||||||||
| $ |
2.67
|
46
|
6.00 | 30 | 6.00 | |||||||||
| $ |
9.27
|
215 | 8.96 | 30 | 8.96 | |||||||||
| $ |
10.32
|
35 | 9.35 | — | — | |||||||||
| $ |
11.99
|
65 | 8.02 | — | — | |||||||||
| $ |
13.00
|
15 | 6.47 | 15 | 6.47 | |||||||||
| $ |
15.40
|
70 | 7.96 | 28 | 7.96 | |||||||||
| $ |
16.98
|
30 | 6.55 | 30 | 6.55 | |||||||||
| $ |
17.36
|
45 | 8.35 | 45 | 8.35 | |||||||||
| $ |
17.98
|
15 | 6.61 | 15 | 6.61 | |||||||||
| $ |
21.73
|
130 | 6.97 | 78 | 6.97 | |||||||||
| $ |
26.19
|
500 | 7.19 | — | — | |||||||||
| $ |
30.25
|
20 | 7.33 | 20 | 7.33 | |||||||||
|
1,195
|
7.57
|
300
|
7.16
|
|||||||||||
42
The
total fair value of options vested during the years ended December 31,
2009, 2008 and 2007 was $1,013, $773 and $885, respectively.
Restricted
Stock Awards
On
December 15, 2009, the Company granted 80,000 voting shares of Restricted Stock
under the 2006 Stock Plan. These shares vest in one third increments, on the
third, fourth and fifth anniversary of the grant. Any dividends declared will be
accrued and paid to the recipient on the vesting date as long as the recipient
is still employed by the Company.
Restricted
common shares, under fixed plan accounting, are measured at fair value on the
date of grant based on the number of shares granted, estimated forfeitures and
the quoted price of the common stock. Such value is recognized as compensation
expense over the corresponding vesting period of five years.
The
following summarizes restricted stock awards as of December 31,
2009:
|
2009
|
||||||||
|
Shares
(in 000’s)
|
Weighted Average
Market Value at
Grant Date
|
|||||||
|
Non-vested
—Beginning of year
|
—
|
$ |
—
|
|||||
|
Granted
|
80
|
12.20
|
||||||
|
Vested
|
—
|
—
|
||||||
|
Cancelled/Forfeitures
|
—
|
—
|
||||||
|
Non-vested
—End of year
|
80
|
$ |
12.20
|
|||||
Total
stock-based compensation cost was $2,205, $2,134 and $1,826 for the years ended
December 31, 2009, 2008 and 2007, respectively. Total income tax benefit
recognized for stock-based compensation arrangements was $869, $820 and $689 for
the years ended December 31, 2009, 2008 and 2007,
respectively.
As of
December 31, 2009, there was $5,238 of total unrecognized compensation cost
related to nonvested share-based compensation arrangements. The cost is expected
to be recognized over a weighted average period of approximately thirty-three
months. There were 579,500 shares available for future grants under the 2006
Plan at December 31, 2009.
9. Commitments
and Contingencies
The
Company has entered into operating leases, primarily for distribution centers
and office facilities. These operating leases frequently include renewal options
at the fair rental value at the time of renewal. For leases with step rent
provisions, whereby the rental payments increase incrementally over the life of
the lease, the Company recognizes the total minimum lease payments on a straight
line basis over the minimum lease term. Facility rent expense was approximately
$2,161 in 2009, $1,999 in 2008 and $1,931 in 2007.
Future
minimum lease payments under non-cancelable operating leases with initial terms
of one year or more consisted of the following at December 31,
2009:
|
2010
|
$ | 2,469 | ||
|
2011
|
2,332 | |||
|
2012
|
1,820 | |||
|
2013
|
1,332 | |||
|
2014
|
953 | |||
|
Thereafter
|
210 | |||
|
Total
minimum lease payments
|
$ | 9,116 |
The
Company had aggregate purchase commitments for fixed inventory quantities of
approximately $27,713 at December 31,
2009.
43
The
Company, along with many other defendants, has been named in a number of
lawsuits in the state courts of Minnesota, North Dakota, New Jersey, and South
Dakota alleging that certain wire and cable which may have contained asbestos
caused injury to the plaintiffs who were exposed to this wire and cable. These
lawsuits are individual personal injury suits that seek unspecified amounts of
money damages as the sole remedy. It is not clear whether the alleged injuries
occurred as a result of the wire and cable in question or whether the Company,
in fact, distributed the wire and cable alleged to have caused any
injuries. The Company maintains general liability insurance that has
applied to these claims. To date, all costs associated with these claims have
been covered by the applicable insurance policies and all defense of these
claims has been handled by the applicable insurance companies. In addition, the
Company did not manufacture any of the wire and cable at issue, and the Company
would rely on any warranties from the manufacturers of such cable if it were
determined that any of the wire or cable that the Company distributed contained
asbestos which caused injury to any of these plaintiffs. In connection with
ALLTEL’s sale of the Company in 1997, ALLTEL provided indemnities with respect
to costs and damages associated with these claims that the Company believes it
could enforce if its insurance coverage proves inadequate.
The Company has a past due accounts receivable of $4,800 for wire
installed in certain facilities. In February 2010, the Company gave notice
to the owner of the facilities that the Company intends to file for a
lien. The Company believes it has legal rights to the recovery of amounts
due, either from the Company’s customer or the owner of the facilities, and as
such, no reserve has been recorded against the receivable balance at December
31, 2009.
There are
no legal proceedings pending against or involving the Company that, in
management’s opinion, based on the current known facts and circumstances, are
expected to have a material adverse effect on the Company’s consolidated
financial position, cash flows, or results from operations.
10.
Subsequent Events
On
February 9, 2010, the Board of Directors approved a quarterly dividend of $0.085
per share payable to stockholders of record on February 19, 2010. This dividend
totaling $1,500 was paid on February 26, 2010.
11. Select
Quarterly Financial Data (unaudited)
The
following table presents the Company’s unaudited quarterly results of operations
for each of the last eight quarters ended December 31, 2009. The unaudited
information has been prepared on the same basis as the audited consolidated
financial statements.
|
Year Ended December 31, 2009
|
||||||||||||||||
|
Fourth
Quarter
|
Third
Quarter
|
Second
Quarter
|
First
Quarter
|
|||||||||||||
|
(in thousands, except per share data)
|
||||||||||||||||
|
Sales
|
$ | 63,526 | $ | 63,579 | $ | 61,882 | $ | 65,832 | ||||||||
|
Gross
profit
|
$ | 12,707 | $ | 13,462 | $ | 12,972 | $ | 13,813 | ||||||||
|
Operating
income
|
$ | 3,355 | $ | 3,786 | $ | 3,118 | $ | 3,513 | ||||||||
|
Net
income
|
$ | 1,882 | $ | 2,241 | $ | 1,845 | $ | 2,064 | ||||||||
|
Earnings
per share:
|
||||||||||||||||
|
Basic
|
$ | 0.11 | $ | 0.13 | $ | 0.10 | $ | 0.12 | ||||||||
|
Diluted
|
$ | 0.11 | $ | 0.13 | $ | 0.10 | $ | 0.12 | ||||||||
|
Year Ended December 31,
2008
|
||||||||||||||||
|
Fourth
Quarter
|
Third
Quarter
|
Second
Quarter
|
First
Quarter
|
|||||||||||||
|
(in
thousands, except per share data)
|
||||||||||||||||
|
Sales
|
$ | 75,260 | $ | 98,854 | $ | 97,384 | $ | 89,441 | ||||||||
|
Gross
profit
|
$ | 16,177 | $ | 22,640 | $ | 24,231 | $ | 22,667 | ||||||||
|
Operating
income
|
$ | 4,855 | $ | 11,043 | $ | 13,006 | $ | 11,480 | ||||||||
|
Net
income
|
$ | 2,680 | $ | 6,575 | $ | 7,745 | $ | 6,737 | ||||||||
|
Earnings
per share:
|
||||||||||||||||
|
Basic
|
$ | 0.15 | $ | 0.37 | $ | 0.44 | $ | 0.37 | ||||||||
|
Diluted
|
$ | 0.15 | $ | 0.37 | $ | 0.44 | $ | 0.37 | ||||||||
44
None.
Evaluation
of Disclosure Controls and Procedures
In
accordance with Exchange Act Rules 13a-15 and 15a-15, we carried out an
evaluation, under the supervision and with the participation of management,
including our Chief Executive Officer and Chief Financial Officer, of the
effectiveness of our disclosure controls and procedures as of the end of the
period covered by this report. Based on that evaluation, our Chief Executive
Officer and Chief Financial Officer concluded that our disclosure controls and
procedures were effective as of December 31, 2009.
Design
and Evaluation of Internal Control over Financial Reporting
Pursuant
to Section 404 of the Sarbanes-Oxley Act of 2002, we included a report of
management’s assessment of the design and effectiveness of our internal controls
as part of this Annual Report on Form 10-K for the fiscal year ended December
31, 2009. Ernst & Young, LLP, our independent registered public accounting
firm, also attested to our internal control over financial reporting.
Management’s report and the independent registered accounting firm’s attestation
report are included on pages 46 and 47 under the captions entitled
“Management’s Report on Internal Control Over Financial Reporting” and “Report
of Independent Registered Public Accounting Firm on Internal Control Over
Financial Reporting,” and are incorporated herein by reference.
There has
been no change in our internal controls over financial reporting that occurred
during the year ended December 31, 2009 that has materially affected, or is
reasonably likely to materially affect, our internal controls over financial
reporting.
45
MANAGEMENT’S
REPORT ON INTERNAL CONTROL OVER FINANCIAL REPORTING
The
Company has assessed the effectiveness of its internal control over financial
reporting as of December 31, 2009 based on criteria established by Internal Control —
Integrated Framework issued by the Committee of Sponsoring Organizations of the
Treadway Commission (“COSO Framework”). The Company’s management is
responsible for establishing and maintaining adequate internal controls over
financial reporting. The Company’s independent registered public accountants
that audited the Company’s financial statements as of December 31, 2009
have issued an attestation report on management’s assessment of the
effectiveness of the Company’s internal control over financial reporting, which
appears on page 47.
Internal
control over financial reporting is a process designed to provide reasonable
assurance regarding the reliability of financial reporting and the preparation
of financial statements for external purposes in accordance with generally
accepted accounting principles. Internal control over financial reporting
includes those policies and procedures that: (1) pertain to the maintenance
of records that, in reasonable detail, accurately and fairly reflect the
transactions and dispositions of the assets of the company; (2) provide
reasonable assurance that transactions are recorded as necessary to permit
preparation of financial statements in accordance with generally accepted
accounting principles, and that receipts and expenditures of the company are
being made only in accordance with authorizations of management and directors of
the company; and (3) provide reasonable assurance regarding prevention or
timely detection of unauthorized acquisition, use, or disposition of the
company’s assets that could have a material effect on the financial statements.
Because of the inherent limitations, internal control over financial reporting
may not prevent or detect misstatements. Also, projections of any evaluation of
effectiveness to future periods are subject to the risk that controls may become
inadequate because of changes in conditions, or that the degree of compliance
with the policies and procedures may deteriorate.
The
Company’s assessment of the effectiveness of its internal control over financial
reporting included testing and evaluating the design and operating effectiveness
of its internal controls. In management’s opinion, the Company has maintained
effective internal control over financial reporting as of December 31,
2009, based on criteria established in the COSO Framework.
|
/s/ Charles A. Sorrentino
|
/s/ Nicol G. Graham
|
|
|
Charles
A. Sorrentino
|
Nicol
G. Graham
|
|
|
President
and Chief Executive Officer
|
Chief
Financial Officer, Treasurer
|
|
|
and
Secretary (Chief Accounting
Officer)
|
46
Report
of Independent Registered Public Accounting Firm on Internal Control Over
Financial Reporting
The
Board of Directors and Stockholders of Houston Wire & Cable
Company
We have
audited Houston Wire & Cable Company’s internal control over financial
reporting as of December 31, 2009, based on criteria established in Internal
Control—Integrated Framework issued by the Committee of Sponsoring Organizations
of the Treadway Commission (the COSO criteria). Houston Wire & Cable
Company’s management is responsible for maintaining effective internal control
over financial reporting, and for its assessment of the effectiveness of
internal control over financial reporting included in the accompanying
Management’s Report on Internal Control Over Financial Reporting. Our
responsibility is to express an opinion on the company’s internal control over
financial reporting based on our audit.
We
conducted our audit in accordance with the standards of the Public Company
Accounting Oversight Board (United States). Those standards require that we plan
and perform the audit to obtain reasonable assurance about whether effective
internal control over financial reporting was maintained in all material
respects. Our audit included obtaining an understanding of internal control over
financial reporting, assessing the risk that a material weakness exists, testing
and evaluating the design and operating effectiveness of internal control based
on the assessed risk, and performing such other procedures as we considered
necessary in the circumstances. We believe that our audit provides a reasonable
basis for our opinion.
A
company’s internal control over financial reporting is a process designed to
provide reasonable assurance regarding the reliability of financial reporting
and the preparation of financial statements for external purposes in accordance
with generally accepted accounting principles. A company’s internal control over
financial reporting includes those policies and procedures that (1) pertain to
the maintenance of records that, in reasonable detail, accurately and fairly
reflect the transactions and dispositions of the assets of the company; (2)
provide reasonable assurance that transactions are recorded as necessary to
permit preparation of financial statements in accordance with generally accepted
accounting principles, and that receipts and expenditures of the company are
being made only in accordance with authorizations of management and directors of
the company; and (3) provide reasonable assurance regarding prevention or timely
detection of unauthorized acquisition, use or disposition of the company’s
assets that could have a material effect on the financial
statements.
Because
of its inherent limitations, internal control over financial reporting may not
prevent or detect misstatements. Also, projections of any evaluation of
effectiveness to future periods are subject to the risk that controls may become
inadequate because of changes in conditions, or that the degree of compliance
with the policies or procedures may deteriorate.
In our
opinion, Houston Wire & Cable Company maintained, in all material respects,
effective internal control over financial reporting as of December 31, 2009,
based on the COSO criteria.
We also
have audited, in accordance with the standards of the Public Company Accounting
Oversight Board (United States), the consolidated balance sheets of Houston Wire
& Cable Company as of December 31, 2009 and 2008, and the related
consolidated statements of income, stockholders’ equity, and cash flows for each
of the three years in the period ended December 31, 2009 of Houston Wire &
Cable Company and our report dated March 15, 2010, expressed an unqualified
opinion thereon.
|
/s/
Ernst & Young LLP
|
|
|
Houston,
Texas
|
|
|
March
15, 2010
|
We have
no information to report pursuant to Item 9B.
PART
III
The
information called for by Item 10 relating to directors and nominees for
election to the Board of Directors is incorporated herein by reference to the
“Election of Directors” section of the registrant’s definitive Proxy Statement
relating to the Annual Meeting of Stockholders to be held on May 7,
2010. The information called for by Item 10 relating to executive
officers and certain significant employees is set forth in Part I of this Annual
Report on Form 10-K.
The
information called for by Item 10 relating to disclosure of delinquent Form 3, 4
or 5 filers is incorporated herein by reference to the “Stock Ownership of
Certain Beneficial Owners and Management” section of the registrant’s
definitive Proxy Statement relating to the Annual Meeting of
Stockholders to be held on May 7, 2010.
The
information called for by Item 10 relating to the code of ethics is incorporated
herein by reference to the “Corporate Governance and Board Committees – Code of
Business Practices” section of the registrant’s definitive Proxy
Statement relating to the Annual Meeting of Stockholders to be held on May
7, 2010.
The
information called for by Item 10 relating to the procedures by which security
holders may recommend nominees to the Board of Directors is incorporated herein
by reference to the “Corporate Governance and Board Committees – Stockholder
Recommendations for Director Nominations” section of the registrant’s definitive
Proxy Statement relating to the Annual Meeting of Stockholders to be held
on May 7, 2010.
The
information called for by Item 10 relating to the audit committee and the audit
committee financial expert is incorporated herein by reference to the “Corporate
Governance and Board Committees – Committees Established by the Board – Audit
Committee” section of the registrant’s definitive Proxy Statement
relating to the Annual Meeting of Stockholders to be held on May 7,
2010.
The
information called for by Item 11 is incorporated herein by reference to the
“Report of the Compensation Committee,” “Compensation Committee Interlocks and
Insider Participation,” “Executive Compensation” and “Director Compensation”
sections of the registrant’s definitive Proxy Statement
relating to the Annual Meeting of Stockholders to be held on May 7,
2010.
The
information called for by Item 12 is incorporated herein by reference to the
“Stock Ownership of Certain Beneficial Owners and Management” and “Equity
Compensation Plan Information” sections of the registrant’s
definitive Proxy Statement relating to the Annual Meeting of
Stockholders to be held on May 7, 2010.
The
information called for by Item 13 is incorporated herein by reference to the
“Corporate Governance and Board Committees – Are a Majority of the Directors
Independent?” and “Certain Relationships and Related Transactions” sections of
the registrant’s definitive Proxy Statement relating to the
Annual Meeting of Stockholders to be held on May 7, 2010.
The
information called for by Item 14 is incorporated herein by reference to the
“Principal Independent Accountant Fees and Services” section of the registrant’s
definitive Proxy Statement relating to the Annual Meeting of Stockholders
to be held on May 7, 2010.
48
PART
IV
|
(a)
|
The
following financial statements of our Company and Report of the
Independent Registered Public Accounting Firm are included in Part
II:
|
|
|
·
|
Report
of Independent Registered Public Accounting
Firm
|
|
|
·
|
Consolidated
Balance Sheets as of December 31, 2009 and
2008
|
|
|
·
|
Consolidated
Statements of Income for the years ended December 31, 2009, 2008 and
2007
|
|
|
·
|
Consolidated
Statements of Stockholders’ Equity for the years ended December 31, 2009,
2008 and 2007
|
|
|
·
|
Consolidated
Statements of Cash Flows for the years ended December 31, 2009, 2008 and
2007
|
|
|
·
|
Notes
to Consolidated Financial
Statements
|
|
(b)
|
Financial
Statement Schedules:
|
Financial
statement schedules have been omitted because they are either not applicable or
the required information has been disclosed in the financial statements or notes
thereto.
|
(c)
|
Exhibits
|
Exhibits
are set forth on the attached exhibit index
49
SIGNATURES
Pursuant
to the requirements of Section 13 or 15(d) of the Securities Exchange Act of
1934, the registrant has duly caused this report to be signed on its behalf by
the undersigned, thereunto duly authorized.
|
HOUSTON
WIRE & CABLE COMPANY
(Registrant)
|
||
|
Date:
March 15, 2010
|
By:
|
/s/
NICOL G. GRAHAM
|
|
Nicol
G. Graham
Chief
Financial Officer, Treasurer and
Secretary
|
||
Pursuant
to the requirements of the Securities Exchange Act of 1934, this report has been
signed below by the following persons on behalf of the registrant and in the
capacities and on the dates indicated.
|
SIGNATURE
|
TITLE
|
DATE
|
||
|
/s/
CHARLES A. SORRENTINO
|
President,
Chief Executive Officer and Director
|
March
15, 2010
|
||
|
Charles A.
Sorrentino
|
||||
|
/s/
NICOL G. GRAHAM
|
Chief
Financial Officer, Treasurer and
Secretary
(Chief Accounting Officer)
|
March
15, 2010
|
||
|
Nicol G.
Graham
|
||||
|
/s/
PETER M. GOTSCH
|
Director
|
March
15, 2010
|
||
|
Peter M.
Gotsch
|
||||
|
/s/
IAN STEWART FARWELL
|
Director
|
March
15, 2010
|
||
|
Ian
Stewart Farwell
|
||||
|
/s/
WILLIAM H. SHEFFIELD
|
Director
|
March
15, 2010
|
||
|
William
H. Sheffield
|
||||
|
/s/
SCOTT L. THOMPSON
|
Director
|
March
15, 2010
|
||
|
Scott
L. Thompson
|
||||
|
/s/
WILSON B. SEXTON
|
Director
|
March
15, 2010
|
||
|
Wilson B.
Sexton
|
||||
|
/s/
MICHAEL T. CAMPBELL
|
Director
|
March
15, 2010
|
||
|
Michael
T. Campbell
|
50
|
EXHIBIT
NUMBER
|
EXHIBIT
|
|
|
3.1
|
Amended
and Restated Certificate of Incorporation of Houston Wire & Cable
Company (incorporated herein by reference to Exhibit 3.1 to Houston Wire
& Cable Company’s Registration Statement on Form S-1 (Registration No.
333-132703))
|
|
|
3.2
|
By-Laws
of Houston Wire & Cable Company (incorporated herein by reference
to Exhibit 3.2 to Houston Wire & Cable Company’s Registration Current
Report on Form 8-K filed August 6, 2007)
|
|
|
4.1
|
Rights
Agreement dated as of May 18, 2009, between Houston Wire & Cable
Company and American Stock Tranfer & Trust Company, LLC (incorporated
herein by reference to Exhibit 4.1 to Houston Wire & Cable Company’s
Current Report on Form 8-K filed on May 19, 2009)
|
|
|
10.1
|
Houston
Wire & Cable Company 2000 Stock Plan (incorporated herein by
reference to Exhibit 10.2 to Houston Wire & Cable Company’s
Registration Statement on Form S-1 (Registration No.
333-132703))
|
|
|
10.2
|
Houston
Wire & Cable Company 2006 Stock Plan (incorporated herein by
reference to Exhibit 10.3 to Houston Wire & Cable Company’s
Registration Statement on Form S-1 (Registration No.
333-132703))
|
|
|
10.18
|
Employment
Agreement, dated as of April 26, 2006, by and between Charles A.
Sorrentino and Houston Wire & Cable Company (incorporated herein
by reference to Exhibit 10.14 to Houston Wire & Cable Company’s
Registration Statement on Form S-1 (Registration No.
333-132703))
|
|
|
10.23
|
Form
of Employee Stock Option Agreement under Houston Wire & Cable
Company’s 2006 Stock Plan (incorporated herein by reference to Exhibit
10.17 to Houston Wire & Cable Company’s Annual Report on Form 10-K for
the year ended December 31, 2007)
|
|
|
10.24
|
Form
of Director Stock Option Agreement under Houston Wire & Cable
Company’s 2006 Stock Plan (incorporated herein by reference to Exhibit
10.17 to Houston Wire & Cable Company’s Annual Report on Form 10-K for
the year ended December 31, 2007)
|
|
|
10.25
|
Description
of Senior Management Bonus Program (incorporated herein by reference to
Exhibit 10.3 to Houston Wire & Cable Company’s Current Report on Form
8-K filed December 27, 2006)
|
|
|
10.26
|
Form
of Director/Officer Indemnification Agreement by and between Houston Wire
& Cable Company and a director, member of a committee of the Board of
Directors or officer of Houston Wire & Cable Company (incorporated
herein by reference to Exhibit 10.24 to Houston Wire & Cable Company’s
Annual Report on Form 10-K for the year ended December 31,
2006)
|
|
|
10.27
|
Second
Amended and Restated Loan and Security Agreement, dated as of September
21, 2009 (incorporated herein by reference to Exhibit 10.1 to Houston Wire
& Cable Company’s Current Report on Form 8-K filed September 24,
2009)
|
|
|
21.1
|
Subsidiaries
of Houston Wire & Cable Company (incorporated herein by reference
to Exhibit 21.1 to Houston Wire & Cable Company’s Registration
Statement on Form S-1 (Registration No. 333-132703))
|
|
|
23.1*
|
Consent
of Ernst & Young, LLP
|
|
|
31.1*
|
Certification
of CEO Pursuant to Section 302 of the Sarbanes-Oxley Act of
2002
|
|
|
31.2*
|
Certification
of CFO Pursuant to Section 302 of the Sarbanes-Oxley Act of
2002
|
|
|
32.1*
|
Certifications
of CEO and CFO pursuant to 18 U.S.C. Section 1350, as adopted pursuant to
Section 906 of the Sarbanes-Oxley Act of
2002
|
51