Attached files
| file | filename |
|---|---|
| EX-23 - FIRST KEYSTONE CORP | v177296_ex23.htm |
| EX-21 - FIRST KEYSTONE CORP | v177296_ex21.htm |
| EX-31.2 - FIRST KEYSTONE CORP | v177296_ex31-2.htm |
| EX-31.1 - FIRST KEYSTONE CORP | v177296_ex31-1.htm |
| EX-32.2 - FIRST KEYSTONE CORP | v177296_ex32-2.htm |
| EX-32.1 - FIRST KEYSTONE CORP | v177296_ex32-1.htm |
UNITED
STATES
SECURITIES
AND EXCHANGE COMMISSION
Washington,
D.C. 20549
FORM
10-K
x ANNUAL
REPORT UNDER SECTION 13 or 15(d) OF THE SECURITIES EXCHANGE ACT OF
1934
For the
fiscal year ended December 31,
2009
or
¨ TRANSITION REPORT
PURSUANT TO SECTION 13 OR 15(d) OF THE SECURITIES EXCHANGE ACT OF
1934
For the
transition period from __________ to __________
Commission
file Number: 2-88927
FIRST KEYSTONE
CORPORATION
(Exact
name of registrant as specified in its Charter)
|
Pennsylvania
|
23-2249083
|
|||
|
(State
or other jurisdiction of incorporation)
|
(I.R.S.
Employer Identification Number)
|
|||
|
111
West Front Street Berwick, Pennsylvania
|
18603
|
|||
|
(Address
of principal executive offices)
|
(Zip
Code)
|
Registrant's
telephone number, including area code: (570) 752-3671
Securities
registered pursuant to Section 12(b) of the Act: None
Securities
registered pursuant to Section 12(g) of the Act: Common Stock, par value $2.00 per
share
Indicate
by check mark if the registrant is a well-known seasoned issuer as defined in
Rule 405 of the Securities Act.
Yes ¨ No
x
Indicate
by check mark if the registrant is not required to file reports pursuant to
Section 13 or Section 15(d) of the Exchange Act.
Yes ¨ No
x
Indicate
by check mark whether the Registrant (1) filed all reports required to be filed
by Section 13 or 15(d) of the Securities Exchange Act of 1934 during the past 12
months (or for such shorter period that the registrant was required to file such
reports), and (2) has been subject to such filing requirements for the past 90
days.
Yes x No
¨
Indicate
by check mark whether the registrant has submitted electronically and posted on
its corporate Web site, if any, every Interactive Data File required to be
submitted and posted pursuant to Rule 405 of Regulation S-T (§232.405 of
this chapter) during the preceding 12 months (or for such shorter period that
the registrant was required to submit and post such files).
Yes ¨ No
¨
Indicate
by check mark if there is no disclosure of delinquent filers in response to Item
405 of Regulation S-K contained in this form, and no disclosure will be
contained, to the best of registrant's knowledge, in definitive proxy or
information statements incorporated by reference in Part III of this Form 10-K
or any amendment to this Form 10-K.
x
Indicate
by check mark whether the registrant is a large accelerated filer, an
accelerated filer, a non-accelerated filer, or a smaller reporting company. See
definitions of “large accelerated filer,” “accelerated
filer,” and “small
reporting company” in Rule
12b-2 of the Exchange
Act. Large
accelerated filer ¨ Accelerated
filer x Non-accelerated
filer ¨ Smaller
reporting company ¨
Indicate by check mark whether the
registrant is a shell company (as defined in Rule 12b-2 of the
Act).
Yes ¨ No
x
The
aggregate market value of the registrant’s outstanding
voting common stock held by non-affiliates on June 30, 2009 determined by using
a per share closing price on that date of $16.15 as quoted on the Over the
Counter Bulletin Board, was $79,988,721.
At March
8, 2010, there were 5,440,196 shares of Common Stock, $2.00 par value,
outstanding.
DOCUMENTS
INCORPORATED BY REFERENCE
Portions
of the Registrant's 2010 definitive Proxy Statement are incorporated by
reference in Part III of this Report.
FIRST
KEYSTONE CORPORATION
FORM
10-K
Table of
Contents
|
Page
|
||
|
Part I
|
||
|
Item
1.
|
Business
|
1
|
|
Item
1A.
|
Risk
Factors
|
8
|
|
Item
1B.
|
Unresolved
Staff Comments
|
11
|
|
Item
2.
|
Description
of Properties
|
11
|
|
Item
3.
|
Legal
Proceedings
|
12
|
|
Item
4.
|
Reserved
|
12
|
|
Part II
|
||
|
Item
5.
|
Market
for Registrant's Common Equity and Related Shareholder Matters and Issuer
Purchases of Equity Securities
|
12
|
|
Item
6.
|
Selected
Financial Data
|
15
|
|
Item
7.
|
Management's
Discussion and Analysis of Financial Condition and Results of
Operations
|
16
|
|
Item
7A.
|
Quantitative
and Qualitative Disclosure About Market Risk
|
32
|
|
Item
8.
|
Financial
Statements and Supplementary Data
|
33
|
|
Item
9.
|
Changes
in and Disagreements with Accountants on Accounting and Financial
Disclosure
|
75
|
|
Item
9A.
|
Controls
and Procedures
|
75
|
|
Item
9B.
|
Other
Information
|
76
|
|
Part III
|
||
|
Item
10.
|
Directors,
Executive Officers and Corporate Governance
|
76
|
|
Item
11.
|
Executive
Compensation
|
76
|
|
Item
12.
|
Security
Ownership of Certain Beneficial Owners and Management and Related
Shareholder Matters
|
77
|
|
Item
13.
|
Certain
Relationships and Related Transactions, and Director
Independence
|
77
|
|
Item
14.
|
Principal
Accountant Fees and Services
|
77
|
|
Part IV
|
||
|
Item
15.
|
Exhibits
and Financial Statement Schedules
|
77
|
|
Signatures
|
79
|
|
|
Exhibit
21
|
|
|
|
Exhibit
23
|
|
|
|
Exhibit
31.1
|
|
|
|
Exhibit
31.2
|
|
|
|
Exhibit
32.1
|
|
|
|
Exhibit
32.2
|
|
iii
FIRST
KEYSTONE CORPORATION
FORM
10-K
PART
I
Forward Looking
Statements
In
addition to historical information, this Form 10-K contains forward-looking
statements. Examples of forward-looking statements include, but are
not limited to (a) projections or statements regarding future earnings,
expenses, net interest income, other income, earnings or loss per share, asset
mix and quality, growth prospects, capital structure, and other financial terms,
(b) statements of plans and objectives of management or the Board of Directors,
and ©
statements of assumptions, such as economic conditions in the Corporation’s
market areas. Such forward-looking statements can be identified by
the use of forward-looking terminology such as “believes”,
“expects”,
“may”,
“intends”,
“will”,
“should”,
“anticipates”,
or the negative of any of the foregoing or other variations thereon or
comparable terminology, or by discussion of strategy.
Forward-looking
statements are subject to certain risks and uncertainties such as local economic
conditions, competitive factors, and regulatory limitations. Actual
results may differ materially from those projected in the forward-looking
statements. Such risks, uncertainties and other factors that could
cause actual results and experience to differ from those projected include, but
are not limited to, the following: ineffectiveness of the business strategy due
to changes in current or future market conditions; the effects of economic
deterioration on current customers, specifically the effect of the economy on
loan customers’ ability to repay
loans; the effects of competition, and of changes in laws and regulations on
competition, including industry consolidation and development of competing
financial products and services; interest rate movements; the inability to
achieve merger-related synergies; difficulties in integrating distinct business
operations, including information technology difficulties; disruption from the
transaction making it more difficult to maintain relationships with customers
and employees, and challenges in establishing and maintaining operations in new
markets; volatilities in the securities markets; and deteriorating economic
conditions.
We
caution readers not to place undue reliance on these forward-looking
statements. They only reflect management’s analysis as of
this date. The Corporation does not revise or update these
forward-looking statements to reflect events or changed
circumstances. Please carefully review the risk factors described in
this document and in other documents the Corporation files from time to time
with the Securities and Exchange Commission, including the Annual Report on Form
10-K, Quarterly Reports on Form 10-Q, and any Current Reports on Form
8-K.
ITEM
1. BUSINESS
First
Keystone Corporation is a Pennsylvania business corporation, and a bank holding
company, registered with and supervised by the Board of Governors of the Federal
Reserve System. The Corporation was incorporated on July 6,
1983, and commenced operations on July 2, 1984, upon consummation of the
acquisition of all of the outstanding stock of First Keystone National
Bank. The Corporation has one wholly-owned subsidiary, the Bank,
which has a commercial banking operation and trust department as its major lines
of business. Since commencing operations, the Corporation's business
has consisted primarily of managing and supervising the Bank, and its principle
source of income has been dividends paid by the Bank. Greater than
98% of the company's revenue and profit came from the commercial banking
department for the years ended December 31, 2009, 2008, and 2007, and was the
only reportable segment. At December 31, 2009, the Corporation
had total consolidated assets, deposits and stockholders' equity of
approximately $758 million, $581 million and $74 million,
respectively.
The Bank
was organized in 1864. The Bank is a national banking association
that is a member of the Federal Reserve System. Its deposits are
insured by the Federal Deposit Insurance Corporation (FDIC) to the maximum
extent of the law regulated by the Office of the Comptroller of the Currency
(OCC). The Bank has fifteen branch locations (five branches within
Columbia County, five branches within Luzerne County, one branch in Montour
County, and four branches within Monroe County, Pennsylvania), and is a full
service commercial bank providing a wide range of services to individuals and
small to medium sized businesses in its Northeastern and Central Pennsylvania
market area. The Bank's commercial banking activities include
accepting time, demand, and savings deposits and making secured and unsecured
commercial, real estate and consumer loans. Additionally, the Bank
also provides personal and corporate trust and agency services to individuals,
corporations, and others, including trust investment accounts, investment
advisory services, mutual funds, estate planning, and management of pension and
profit sharing plans.
1
Acquisition
Effective November 1,
2007, the Corporation completed its acquisition of Pocono Community Bank through
the merger of Pocono with and into the Bank. On the acquisition date,
Pocono Community Bank had approximately $150 million in assets, $105 million in
loans and $110 million in deposits. Headquartered in Stroudsburg,
Pennsylvania and organized in 1996, Pocono had 4 banking offices located in
Monroe County, Pennsylvania. The acquisition expands the branch
network of the Corporation and provides Pocono customers with a broader array of
products and services. The Pocono branches continue to operate as a
division of the Bank under the name “Pocono
Community Bank, a division of First Keystone National Bank.”
Supervision
and Regulation
The
Corporation is subject to the jurisdiction of the SEC and of state securities
laws for matters relating to the offering and sale of its
securities. The Corporation is currently subject to the SEC's rules
and regulations relating to company's whose shares are registered under Section
12 of the Securities Exchange Act of 1934, as amended.
The
Corporation is also subject to the provisions of the Bank Holding Company Act of
1956, as amended , and to supervision by the Federal Reserve
Board. The Bank Holding Company Act requires the Corporation to
secure the prior approval of the Federal Reserve Board before it owns or
controls, directly or indirectly, more than 5% of the voting shares of
substantially all of the assets of any institution, including another
bank.
The Bank
Holding Company Act also prohibits acquisition of control of a bank holding
company, such as the Corporation, without prior notice to the Federal Reserve
Board. Control is defined for this purpose as the power, directly or
indirectly, to direct the management or policies of a bank holding company or to
vote 25% (or 10%, if no other person or persons acting on concert, holds a
greater percentage of the Common Stock) or more of the Corporation's Common
Stock.
The
Corporation is required to file an annual report with the Federal Reserve Board
and any additional information that the Federal Reserve Board may require
pursuant to the Bank Holding Company Act. The Federal Reserve Board
may also make examinations of the Corporation and any or all of its
subsidiaries.
The Bank
is subject to federal and state statutes applicable to banks chartered under the
banking laws of the United States, to members of the Federal Reserve System and
to banks whose deposits are insured by the FDIC. Bank operations are
also subject to regulations of the OCC, the Federal Reserve Board and the
FDIC.
The
primary supervisory authority of the Bank is the OCC, which regulates and
examines the Bank. The OCC has the authority under the Financial
Institutions Supervisory Act to prevent a national bank from engaging in an
unsafe or unsound practice in conducting its business.
Federal
and state banking laws and regulations govern, among other things, the scope of
a bank's business, the investments a bank may make, the reserves against
deposits a bank must maintain, loans a bank makes and collateral it takes, and
the activities of a bank with respect to mergers and consolidations and the
establishment of branches.
As a
subsidiary of a bank holding company, the Bank is subject to certain
restrictions imposed by the Federal Reserve Act on any extensions of credit to
the bank holding company or its subsidiaries, on investments in the stock or
other securities of the bank holding company or its subsidiaries and on taking
such stock or securities as collateral for loans. The Federal Reserve
Act and Federal Reserve Board regulations also place certain limitations and
reporting requirements on extensions of credit by a bank to principal
shareholders of its parent holding company, among others, and to related
interests of such principal shareholders. In addition, such
legislation and regulations may affect the terms upon which any person becoming
a principal shareholder of a holding company may obtain credit from banks with
which the subsidiary bank maintains a correspondent relationship.
Under the
Federal Deposit Insurance Act , the OCC possesses the power to prohibit
institutions regulated by it from engaging in any activity that would be an
unsafe or unsound banking practice or would otherwise be in violation of the
law.
2
Permitted
Non-Banking Activities
The
Federal Reserve Board permits bank holding companies to engage in non-banking
activities so closely related to banking, managing or controlling banks as to be
a proper incident thereto. The Corporation does not at this time
engage in any of these non-banking activities, nor does the Corporation have any
current plans to engage in any other permissible activities in the foreseeable
future.
Legislation
and Regulatory Changes
From time
to time, various types of federal and state legislation have been proposed that
could result in additional regulations of, and restrictions on, the business of
the Bank. It cannot be predicted whether any such legislation will be
adopted or how such legislation would affect the business of the
Bank. As a consequence of the extensive regulation of commercial
banking activities in the United States, the Bank's business is particularly
susceptible to being affected by federal legislation and regulations that may
increase the costs of doing business.
From time
to time, legislation is enacted which has the effect of increasing the cost of
doing business, limiting or expanding permissible activities or affecting the
competitive balance between banks and other financial
institutions. No prediction can be made as to the likelihood of any
major changes or the impact such changes might have on the Corporation and the
Bank. Certain changes of potential significance to the Corporation
which have been enacted recently and others which are currently under
consideration by Congress or various regulatory agencies are discussed
below.
Federal
Deposit Insurance Corporation Improvement Act of 1991
The
FDICIA established five different levels of capitalization of financial
institutions, with “prompt
corrective actions” and significant operational restrictions imposed on
institutions that are capital deficient under the categories. The
five categories are:
· well
capitalized
· adequately capitalized
· undercapitalized
· significantly
undercapitalized, and
· critically
undercapitalized.
To be
considered well capitalized, an institution must have a total risk-based capital
ratio of at least 10%, a Tier 1 risk-based capital ratio of at least 6%, a
leverage capital ratio of at least 5%, and must not be subject to any order or
directive requiring the institution to improve its capital level. An
institution falls within the adequately capitalized category if it has a total
risk-based capital ratio of at least 8%, a Tier 1 risk-based capital ratio of at
least 4%, and a leverage capital ratio of at least 4%. Institutions
with lower capital levels are deemed to be undercapitalized, significantly
undercapitalized or critically undercapitalized, depending on their actual
capital levels. In addition, the appropriate federal regulatory
agency may downgrade an institution to the next lower capital category upon a
determination that the institution is in an unsafe or unsound condition, or is
engaged in an unsafe or unsound practice. Institutions are required
under FDICIA to closely monitor their capital levels and to notify their
appropriate regulatory agency of any basis for a change in capital
category. On December 31, 2009 the Corporation and the Bank exceeded
the minimum capital levels of the well capitalized category.
Regulatory oversight of an
institution becomes more stringent with each lower capital category, with
certain “prompt
corrective actions” imposed depending on the level of capital
deficiency.
3
Other
Provisions of FDICIA
Each
depository institution must submit audited financial statements to its primary
regulator and the FDIC, which reports are made publicly available. In
addition, the audit committee of each depository institution must consist of
outside directors and the audit committee at “large
institutions” (as defined by FDIC regulation) must include members with banking
or financial management expertise. The audit committee at “large
institutions” must also have access to independent outside
counsel. In addition, an institution must notify the FDIC and the
institution's primary regulator of any change in the institution’s
independent auditor, and annual management letters must be provided to the FDIC
and the depository institution's primary regulator. The regulations
define a “large
institution” as one with over $500 million in assets, which does include the
Bank. Also, under the rule, an institution's independent auditor must
examine the institution's internal controls over financial reporting and perform
agreed-upon procedures to test compliance with laws and regulations concerning
safety and soundness.
Under
FDICIA, each federal banking agency must prescribe certain safety and soundness
standards for depository institutions and their holding
companies. Three types of standards must be prescribed:
· asset
quality and earnings
· operational
and managerial, and
· compensation
Such
standards would include a ratio of classified assets to capital, minimum
earnings, and, to the extent feasible, a minimum ratio of market value to book
value for publicly traded securities of such institutions and holding
companies. Operational and managerial standards must relate
to:
· internal
controls, information systems and internal audit systems
· loan
documentation
· credit
underwriting
· interest
rate exposure
· asset
growth, and
· compensation,
fees and benefits
FDICIA
also sets forth Truth in Savings disclosure and advertising requirements
applicable to all depository institutions.
Real
Estate Lending Standards. Pursuant to the FDICIA, the OCC and
other federal banking agencies adopted real estate lending guidelines which
would set loan-to-value ratios for different types of real estate
loans. The LTV ratio is generally defined as the total loan amount
divided by the appraised value of the property at the time the loan is
originated. If the institution does not hold a first lien position,
the total loan amount would be combined with the amount of all senior liens when
calculating the ratio. In addition to establishing the LTV ratios,
the guidelines require all real estate loans to be based upon proper loan
documentation and a recent appraisal of the property.
Regulatory
Capital Requirements
The
federal banking regulators have adopted certain risk-based capital guidelines to
assist in the assessment of the capital adequacy of a banking organization's
operations for both transactions reported on the balance sheet as assets and
transactions, such as letters of credit, and recourse agreements, which are
recorded as off balance sheet items. Under these guidelines, nominal
dollar amounts of assets and credit equivalent amounts of off balance sheet
items are multiplied by one of several risk adjustment percentages, which range
from 0% for assets with low credit risk, such as certain U.S. Treasury
securities, to 100% for assets with relatively high credit risk, such as
business loans.
4
The
following table presents the Corporation's capital ratios at December 31,
2009.
|
(In Thousands)
|
||||
|
Tier
I Capital
|
$ | 55,785 | ||
|
Tier
II Capital
|
5,323 | |||
|
Total
Capital
|
$ | 61,108 | ||
|
Adjusted
Total Average Assets
|
749,798 | |||
|
Total
Adjusted Risk-Weighted Assets1
|
513,574 | |||
|
Tier
I Risk-Based Capital Ratio2
|
10.86 | % | ||
|
Required
Tier I Risk-Based Capital Ratio
|
4.00 | % | ||
|
Excess
Tier I Risk-Based Capital Ratio
|
6.86 | % | ||
|
Total
Risk-Based Capital Ratio3
|
11.90 | % | ||
|
Required
Total Risk-Based Capital Ratio
|
8.00 | % | ||
|
Excess
Total Risk-Based Capital Ratio
|
3.90 | % | ||
|
Tier
I Leverage Ratio4
|
7.44 | % | ||
|
Required
Tier I Leverage Ratio
|
4.00 | % | ||
|
Excess
Tier I Leverage Ratio
|
3.44 | % | ||
1Includes off-balance sheet items at credit-equivalent values less intangible assets.
2Tier I Risk-Based Capital Ratio is
defined as the ratio of Tier I Capital to Total Adjusted Risk-Weighted
Assets.
3Total Risk-Based Capital Ratio is
defined as the ratio of Tier I and Tier II Capital to Total Adjusted
Risk-Weighted Assets.
4Tier I Leverage Ratio is defined as the
ratio of Tier I Capital to Adjusted Total Average Assets.
The
Corporation's ability to maintain the required levels of capital is
substantially dependent upon the success of the Corporation's capital and
business plans; the impact of future economic events on the Corporation's loan
customers; and the Corporation's ability to manage its interest rate risk and
investment portfolio and control its growth and other operating
expenses. See also, the information under the caption “Capital
Strength” appearing on page 28 of this 2009 Annual Report on Form
10-K.
Effect of Government
Monetary Policies
The
earnings of the Corporation are and will be affected by domestic economic
conditions and the monetary and fiscal policies of the United States government
and its agencies.
The
Federal Reserve Board has had, and will likely continue to have, an important
impact on the operating results of commercial banks through its power to
implement national monetary policy in order to, among other things, curb
inflation or combat a recession. The Federal Reserve Board has a
major effect upon the levels of bank loans, investments and deposits through its
open market operations in United States government securities and through its
regulations of, among other things, the discount rate on borrowings of member
banks and the reserve requirements against member bank deposits. It
is not possible to predict the nature and impact of future changes in monetary
and fiscal policies.
Effects of
Inflation
Inflation
has some impact on the Bank's operating costs. Unlike industrial
companies, however, substantially all of the Bank's assets and liabilities are
monetary in nature. As a result, interest rates have a more
significant impact on the Bank's performance than the general levels of
inflation. Over short periods of time, interest rates may not
necessarily move in the same direction or in the same magnitude as prices of
goods and services.
Environmental
Regulation
There are
several federal and state statutes that regulate the obligations and liabilities
of financial institutions pertaining to environmental issues. In
addition to the potential for attachment of liability resulting from its own
actions, a bank may be held liable, under certain circumstances, for the actions
of its borrowers, or third parties, when such actions result in environmental
problems on properties that collateralize loans held by the
bank. Further, the liability has the potential to far exceed the
original amount of the loan issued by the Bank. Currently, neither
the Corporation nor the Bank is a party to any pending legal proceeding pursuant
to any environmental statute, nor are the Corporation and the Bank aware of any
circumstances that may give rise to liability under any such
statute.
5
Interest Rate
Risk
Federal
banking agency regulations specify that the Bank's capital adequacy include an
assessment of the Bank's interest rate risk exposure. The
standards for measuring the adequacy and effectiveness of a banking
organization's Interest Rate Risk (IRR) management includes a measurement of
Board of Directors and senior management oversight, and a determination of
whether a banking organization's procedures for comprehensive risk management
are appropriate to the circumstances of the specific banking
organization. First Keystone National Bank has internal IRR models
that are used to measure and monitor IRR. Additionally, the
regulatory agencies have been assessing IRR on an informal basis for several
years. For these reasons, the Corporation does not expect the
addition of IRR evaluation to the agencies' capital guidelines to result in
significant changes in capital requirements for the Bank.
The Gramm-Leach-Bliley Act
of 2000
In 2000,
the Gramm-Leach-Bliley Act became law, which is also known as the Financial
Services Modernization Act. The act repealed some Depression-era
banking laws and will permit banks, insurance companies and securities firms to
engage in each others' businesses after complying with certain conditions and
regulations. The act grants to community banks the power to enter new
financial markets as a matter of right that larger institutions have managed to
do on an ad hoc basis. At this time, our company has no plans to
pursue these additional possibilities.
The Sarbanes-Oxley
Act
In 2002,
the Sarbanes-Oxley Act became law. The Act was in response to public
concerns regarding corporate accountability in connection with recent high
visibility accounting scandals. The stated goals of the
Sarbanes-Oxley Act are:
|
|
·
|
to
increase corporate responsibility;
|
|
|
·
|
to
provide for enhanced penalties for accounting and auditing improprieties
at publicly traded companies; and
|
|
|
·
|
to
protect investors by improving the accuracy and reliability of corporate
disclosures pursuant to the securities
laws.
|
The
Sarbanes-Oxley Act generally applies to all companies, both U.S. and non-U.S.,
that file periodic reports with the SEC under the Securities Exchange Act of
1934. The legislation includes provisions, among other
things:
|
|
·
|
governing
the services that can be provided by a public company’s
independent auditors and the procedures for approving such
services;
|
|
|
·
|
requiring
the chief executive officer and chief financial officer to certify certain
matters relating to the company’s periodic
filings under the Exchange Act;
|
|
|
·
|
requiring
expedited filings of reports by insiders of their securities transactions
and containing other provisions relating to insider conflicts of
interest;
|
|
|
·
|
increasing
disclosure requirements relating to critical financial accounting policies
and their application;
|
|
|
·
|
increasing
penalties for securities law violations;
and
|
|
|
·
|
creating
a public accounting oversight board, a regulatory body subject to SEC
jurisdiction with broad powers to set auditing, quality control and ethics
standards for accounting firms.
|
Emergency Economic
Stabilization Act of 2008 and American Recovery and Reinvestment Act of
2009
In
response to the financial crises affecting the banking system and financial
markets and going concern threats to investment banks and other financial
institutions, on October 3, 2008, the Emergency Economic Stabilization Act of
2008 (the “EESA”) was signed into law and subsequently amended by
the American Recovery and Reinvestment Act of 2009 on February 17, 2009. Under
the authority of the EESA, as amended, the United States Department of the
Treasury (the “Treasury”) created the Troubled Asset Relief Program
(“TARP”) Capital Purchase Program and through this program
invested in financial institutions by purchasing preferred stock and warrants to
purchase either common stock or additional shares of preferred stock. As of
December 31, 2009, the Treasury will not make additional investments under the
TARP Capital Purchase Program but is considering continuing a similar program
for banks under $10 billion in assets under a different
program.
6
The EESA,
as amended, also included a provision for a temporary increase in FDIC insurance
coverage from $100,000 to $250,000 per depositor through December 31, 2009. In
May 2009, Congress extended the increased coverage until December 31, 2013.
After that time, the per depositor coverage will return to
$100,000.
History and Business -
Bank
The
Bank's legal headquarters are located at 111 West Front Street, Berwick,
Pennsylvania.
As of
December 31, 2009, the Bank had total assets of $758,330,000, total
shareholders' equity of $74,167,000 and total deposits and other liabilities of
$684,163,000.
The Bank
engages in a full-service commercial banking business, including accepting time
and demand deposits, and making secured and unsecured commercial and consumer
loans. The Bank's business is not seasonal in nature. Its
deposits are insured by the FDIC to the extent provided by law. The
Bank has no foreign loans or highly leveraged transaction loans, as defined by
the Federal Reserve Board. Substantially all of the loans in the
Bank’s
portfolio have been originated by the Bank. Policies adopted by the
Board of Directors are the basis by which the Bank conducts its lending
activities.
At
December 31, 2009, the Bank had 155 full-time employees and 33 part-time
employees. In the opinion of management, the Bank enjoys a
satisfactory relationship with its employees. The Bank is not a party
to any collective bargaining agreement.
Competition -
Bank
The Bank
competes actively with other area commercial banks and savings and loan
associations, many of which are larger than the Bank, as well as with major
regional banking and financial institutions. The Bank's major
competitors in Columbia, Luzerne, Montour, and Monroe counties are:
· First
Columbia Bank & Trust Co. of Bloomsburg
· PNC
Bank, N.A.
· M
& T Bank
· FNB
Bank, N.A.
· Wachovia
Bank
· Sovereign
Bank
· Citizens
Bank
· ESSA
Bank & Trust
· First
National Community Bank
· North
Penn Bank
· Wayne
Bank
Credit
unions are also competitors, especially in Luzerne and Montour
counties. The Bank is generally competitive with all competing
financial institutions in its service area with respect to interest rates paid
on time and savings deposits, service charges on deposit accounts and interest
rates charged on loans.
Concentration
The
Corporation and the Bank are not dependent for deposits nor exposed by loan
concentrations to a single customer or to a small group of customers, such
that the loss of any one or more would not have a materially adverse
effect on the financial condition of the Corporation or the Bank.
Available
Information
The
Corporation’s
common stock is registered under Section 12(g) of the Securities Exchange Act of
1934. The Corporation is subject to the informational requirements of
the Exchange Act, and, accordingly, files reports, proxy statements and other
information with the Securities and Exchange Commission. The reports,
proxy statements and other information filed with the SEC are available for
inspection and copying at the SEC’s Public Reference
Room at 100 F Street, N.E., Washington, D.C. 20549. You may obtain
information on the operation of the Public Reference Room by calling the SEC at
1-800-SEC-0330. The
Corporation is an electronic filer with the SEC. The SEC maintains an
internet site that contains reports, proxy and information statements, and other
information regarding issuers that file electronically with the SEC.
The
SEC’s
internet site address is www.sec.gov.
7
A copy of
the Corporation’s Annual Report on
Form 10-K may be obtained without charge at www.fkyscorp.com or via email at
info@fknbank.com. Information may also be obtained via written
request to Investor Relations at First Keystone Corporation, Attention: Cheryl
Wynings, 111 West Front Street, P.O. Box 289, Berwick, Pennsylvania
18603.
ITEM
1A. RISK FACTORS
Investments
in First Keystone Corporation common stock involve risk. The market
price of First Keystone common stock may fluctuate significantly in response to
a number of factors, including:
The
Corporation Is Subject To Interest Rate Risk
The
Corporation’s
earnings and cash flows are largely dependent upon its net interest
income. Net interest income is the difference between interest income
earned on interest-earning assets such as loans and securities and interest
expense paid on interest-bearing liabilities such as deposits and borrowed
funds. Interest rates are highly sensitive to many factors that are
beyond the Corporation’s control,
including general economic conditions and policies of various governmental and
regulatory agencies and, in particular, the Board of Governors of the Federal
Reserve System. Changes in monetary policy, including changes in
interest rates, could influence not only the interest the Corporation receives
on loans and securities and the amount of interest it pays on deposits and
borrowings, but such changes could also affect (i) the Corporation’s ability to
originate loans and obtain deposits, (ii) the fair value of the Corporation’s financial assets
and liabilities, and (iii) the average duration of the Corporation’s mortgage-backed
securities portfolio. If the interest rates paid on deposits and
other borrowings increase at a faster rate than the interest rates received on
loans and other investments, the Corporation’s net interest
income, and therefore earnings, could be adversely affected. Earnings
could also be adversely affected if the interest rates received on loans and
other investments fall more quickly than the interest rates paid on deposits and
other borrowings.
Although
management believes it has implemented effective asset and liability management
strategies to reduce the potential effects of changes in interest rates on the
Corporation’s
results of operations, any substantial, unexpected, or prolonged change in
market interest rates could have a material adverse effect on the
Corporation’s
financial condition and results of operations.
The
Corporation’s
Profitability Depends Significantly On Economic Conditions In The Commonwealth
of Pennsylvania
The
Corporation’s
success depends primarily on the general economic conditions of the Commonwealth
of Pennsylvania and the specific local markets in which the Corporation
operates. Unlike larger national or other regional banks that are
more geographically diversified, the Corporation provides banking and financial
services to customers primarily in the Columbia, Luzerne, Montour, and Monroe
Counties. The local economic conditions in these areas have a
significant impact on the demand for the Corporation’s products and
services as well as the ability of the Corporation’s customers to
repay loans, the value of the collateral securing loans and the stability of the
Corporation’s
deposit funding sources. Also a significant decline in general
economic conditions could impact the local economic conditions and, in turn,
have a material adverse effect on the Corporation’s financial
condition and results of operations.
The
Corporation Operates In A Highly Competitive Industry
The
Corporation faces substantial competition in all areas of its operations from a
variety of different competitors, many of which are larger and may have more
financial resources. Such competitors primarily include national,
regional, and community banks within the various markets in which the
Corporation operates. Additionally, various out-of-state banks have
begun to enter or have announced plans to enter the market areas in which the
Corporation currently operates. The Corporation also faces
competition from many other types of financial institutions, including, without
limitation, savings and loans, credit unions, finance companies, brokerage
firms, insurance companies, factoring companies and other financial
intermediaries. Also, technology has lowered barriers to entry and
made it possible for non-banks to offer products and services traditionally
provided by banks, such as automatic transfer and automatic payment
systems. Many of the Corporation’s competitors have
fewer regulatory constraints and may have lower cost
structures.
8
The
Corporation’s
ability to compete successfully depends on a number of factors, including, among
other things:
|
|
·
|
The
ability to develop, maintain and build upon long-term customer
relationships based on top quality service, high ethical standards and
safe, sound assets.
|
|
|
·
|
The
ability to expand the Corporation’s market
position.
|
|
|
·
|
The
scope, relevance and pricing of products and services offered to meet
customer needs and demands.
|
|
|
·
|
The
rate at which the Corporation introduces new products and services
relative to its competitors.
|
|
|
·
|
Customer
satisfaction with the Corporation’s level of
service.
|
|
|
·
|
Industry
and general economic trends.
|
Failure
to perform in any of these areas could significantly weaken the Corporation’s
competitive position, which could adversely affect the Corporation’s
growth and profitability, which, in turn, could have a material adverse effect
on the Corporation’s
financial condition and results of operations.
The
Corporation Is Subject To Extensive Government Regulation and
Supervision
The
Corporation, primarily through the Bank, is subject to extensive federal and
state regulation and supervision. Banking regulations are primarily intended to
protect depositors’
funds, federal deposit insurance funds and the banking system as a whole, not
shareholders. These regulations affect the Corporation’s
lending practices, capital structure, investment practices, dividend policy and
growth, among other things. Congress and federal regulatory agencies continually
review banking laws, regulations and policies for possible changes. Changes to
statutes, regulations or regulatory policies could affect the Corporation in
substantial and unpredictable ways. Such changes could subject the Corporation
to additional costs, limit the types of financial services and products the
Corporation may offer and/or increase the ability of non-banks to offer
competing financial services and products, among other things. Failure to comply
with laws, regulations or policies could result in sanctions by regulatory
agencies, civil money penalties and/or reputation damage, which could have a
material adverse effect on the Corporation’s
business, financial condition and results of operations.
The
Corporation Is Subject To Claims and Litigation Pertaining To Fiduciary
Responsibility
From time
to time, customers make claims and take legal action pertaining to the
Corporation’s
performance of its fiduciary responsibilities. Whether customer claims and legal
action related to the Corporation’s
performance of its fiduciary responsibilities are founded or unfounded, if such
claims and legal actions are not resolved in a manner favorable to the
Corporation they may result in significant financial liability and/or adversely
affect the market perception of the Corporation and its products and services as
well as impact customer demand for those products and services. Any financial
liability or reputation damage could have a material adverse effect on the
Corporation’s
financial condition and results of operations.
The
Trading Volume In The Corporation’s
Common Stock Is Less Than That Of Other Larger Financial Services
Companies
The
Corporation’s
common stock is currently not listed, but traded on the Over the Counter
Bulletin Board. As a result, trading volume is less than that of
other larger financial services companies. A public trading market
having the desired characteristics of depth, liquidity and orderliness depends
on the presence in the marketplace of willing buyers and sellers of the
Corporation’s
common stock at any given time. This presence depends on the
individual decisions of investors and general economic and market conditions
over which the Corporation has no control. Given the lower trading
volume of the Corporation’s
common stock, significant sales of the Corporation’s
common stock, or the expectation of these sales, could cause the
Corporation’s
stock price to fall.
The
Corporation Is Subject To Lending Risk
As of
December 31, 2009, approximately 60.5% of the Corporation’s
loan portfolio consisted of commercial and industrial, construction and
commercial real estate loans. These types of loans are generally
viewed as having more risk of default than residential real estate loans or
consumer loans. These types of loans are also typically larger than
residential real estate loans and consumer loans. Because the
Corporation’s
loan portfolio contains a significant number of commercial and industrial,
construction and commercial real estate loans with relatively large balances,
the deterioration of one or a few of these loans could cause a significant
increase in non-performing loans. An increase in non-performing loans
could result in a net loss of earnings from these loans, an increase in the
provision for possible loan losses and an increase in loan charge-offs, all of
which could have a material adverse effect on the Corporation’s
financial condition and results of operations.
9
The
Corporation’s
Controls and Procedures May Fail or Be
Circumvented.
Management
regularly reviews and updates the Corporation’s internal
controls, disclosure controls and procedures, and corporate governance policies
and procedures. Any system of controls, however well designed and operated, is
based in part on certain assumptions and can provide only reasonable, not
absolute, assurances that the objectives of the system are met. Any failure or
circumvention of the Corporation’s controls and
procedures or failure to comply with regulations related to controls and
procedures could have a material adverse effect on the Corporation’s business,
results of operations and financial condition.
The
Corporation May Need or Be Compelled to Raise Additional Capital in the Future,
but That Capital May Not Be Available When it Is Needed and on Terms Favorable
to Current Shareholders.
Federal
banking regulators require the Corporation and Bank to maintain adequate levels
of capital to support their operations. These capital levels are
determined and dictated by law, regulation and banking regulatory
agencies. In addition, capital levels are also determined by the
Corporation’s
management and board of directors based on capital levels that they believe are
necessary to support the Corporation’s business
operations. The Corporation is evaluating its present and future
capital requirements and needs, is developing a comprehensive capital plan and
is analyzing capital raising alternatives, methods and options. Even
if the Corporation succeeds in meeting the current regulatory capital
requirements, the Corporation may need to raise additional capital in the near
future to support possible loan losses during future periods or to meet future
regulatory capital requirements.
Further,
the Corporation’s regulators may
require it to increase its capital levels. If the Corporation raises capital
through the issuance of additional shares of its common stock or other
securities, it would likely dilute the ownership interests of current investors
and would likely dilute the per-share book value and earnings per share of its
common stock. Furthermore, it may have an adverse impact on the
Corporation’s
stock price. New investors may also have rights, preferences and
privileges senior to the Corporation’s current
shareholders, which may adversely impact its current
shareholders. The Corporation’s ability to raise
additional capital will depend on conditions in the capital markets at that
time, which are outside its control, and on its financial
performance. Accordingly, the Corporation cannot assure you of its
ability to raise additional capital on terms and time frames acceptable to it or
to raise additional capital at all. If the Corporation cannot raise
additional capital in sufficient amounts when needed, its ability to comply with
regulatory capital requirements could be materially
impaired. Additionally, the inability to raise capital in sufficient
amounts may adversely affect the Corporation’s operations,
financial condition and results of operations.
If
We Conclude That the Decline in Value of Any of Our Investment Securities Is
Other than Temporary, We Will Be Required to Write Down the Credit-Related
Portion of the Impairment of That Security Through a Charge to
Earnings.
We review
our investment securities portfolio at each quarter-end reporting period to
determine whether the fair value is below the current carrying
value. When the fair value of any of our investment securities has
declined below its carrying value, we are required to assess whether the decline
is other than temporary. If we conclude that the decline is other
than temporary, we will be required to write down the credit-related portion of
the impairment of that security through a charge to earnings. Due to
the complexity of the calculations and assumptions used in determining whether
an asset is impaired, the impairment disclosed may not accurately reflect the
actual impairment in the future.
If
the Corporation’s Allowance For
Loan Losses Is Not Sufficient To Cover Actual Loan Losses, Its Earnings Could
Decrease
The
Corporation’s
loan customers may not repay their loans according to the terms of their loans,
and the collateral securing the payment of their loans may be insufficient to
assure repayment. The Corporation may experience significant credit
losses, which could have a material adverse effect on its operating
results. In determining the amount of the allowance for loan losses,
the Corporation reviews its loans and its loss and delinquency experience, and
the Corporation evaluates economic conditions. If its assumptions
prove to be incorrect, its allowance for loan losses may not cover inherent
losses in its loan portfolio at the date of its financial
statements. Material additions to the Corporation’s allowance would
materially decrease its net income. At December 31, 2009, its allowance for loan
losses totaled $5.3 million, representing 1.30% of its average total
loans.
Although
the Corporation believes it has underwriting standards to manage normal lending
risks, it is difficult to assess the future performance of its loan portfolio
due to the relatively recent origination of many of these loans. The
Corporation cannot assure that its non-performing loans will not increase or
that its non-performing or delinquent loans will not adversely affect its future
performance.
10
In
addition, federal regulators periodically review the Corporation’s
allowance for loan losses and may require it to increase its allowance for loan
losses or recognize further loan charge-offs. Any increase in its
allowance for loan losses or loan charge-offs as required by these regulatory
agencies could have a material adverse effect on its results of operations and
financial condition.
The
Corporation’s
Ability To Pay Dividends Is Subject to Limitations
The
Corporation is a bank holding company and its operations are conducted by First
Keystone National Bank, which is a separate and distinct legal
entity. Substantially all of the Corporation’s
assets are held by First Keystone National Bank.
The
Corporation’s
ability to pay dividends depends on its receipt of dividends from First Keystone
National Bank, its primary source of dividends. Dividend payments
from First Keystone National Bank are subject to legal and regulatory
limitations, generally based on net profits and retained earnings, imposed by
the various banking regulatory agencies. The ability of banking
subsidiaries to pay dividends is also subject to their profitability, financial
condition, capital expenditures and other cash flow
requirements. There is no assurance that First Keystone National Bank
will be able to pay dividends in the future or that the Corporation will
generate adequate cash flow to pay dividends in the future. The
Corporation’s
failure to pay dividends on its common stock could have material adverse effect
on the market price of its common stock.
ITEM
1B. UNRESOLVED STAFF COMMENTS
None.
ITEM
2. DESCRIPTION OF
PROPERTIES
The
Corporation and its subsidiary occupy sixteen properties in Columbia, Luzerne,
Montour, and Monroe counties in Pennsylvania, which are used principally as
banking offices.
Properties
owned are:
|
|
·
|
Main
Office located at 111 West Front Street, Berwick, Pennsylvania
18603;
|
|
|
·
|
Salem
Office located at 400 Fowler Avenue, Berwick, Pennsylvania
18603;
|
|
|
·
|
Freas
Avenue Office located at 701 Freas Avenue, Berwick, Pennsylvania
18603;
|
|
|
·
|
Scott
Township Office located at Central Road and Route 11, Bloomsburg,
Pennsylvania 17815;
|
|
|
·
|
Mifflinville
Office located at Third and Race Streets, Mifflinville, Pennsylvania
18631;
|
|
|
·
|
Hanover
Township Office located at 1540 Sans Souci Highway, Wilkes-Barre,
Pennsylvania 18706;
|
|
|
·
|
Danville
Office located at 1519 Bloom Road, Danville, Pennsylvania
17821;
|
|
|
·
|
Mountainhome
Office located at Route 390 & Price’s
Drive, Mountainhome, Pennsylvania
18342;
|
|
|
·
|
Brodheadsville
Office located at Route 209, Brodheadsville, Pennsylvania
18322;
|
|
|
·
|
Swiftwater
Office located at Route 611, Swiftwater, Pennsylvania
18370;
|
|
|
·
|
Vacant
lot held for expansion located at 117-119 West Front Street, Berwick,
Pennsylvania 18603;
|
|
|
·
|
Parking
lot located at Second and Market Streets, Berwick, Pennsylvania 18603;
and
|
|
|
·
|
17
ATM’s
located in Columbia, Luzerne, Montour, and Monroe
counties.
|
Properties
leased are:
|
|
·
|
Briar
Creek Office located inside the Giant Market at 50 Briar Creek Plaza,
Berwick, Pennsylvania 18603;
|
|
|
·
|
Nescopeck
Office located at 437 West Third Street, Nescopeck, Pennsylvania
18635;
|
|
|
·
|
Kingston
Office located at 179 South Wyoming Avenue, Kingston, Pennsylvania
18704;
|
|
|
·
|
Stroudsburg
Office located at 559 Main Street, Stroudsburg, Pennsylvania
18360;
|
|
|
·
|
Operations
Center located at 105 Market Street, Berwick, Pennsylvania 18603;
and
|
|
|
·
|
Mountain
Top Office located at 18 North Mountain Boulevard, Mountain Top,
Pennsylvania 18707 (land only).
|
11
ITEM
3. LEGAL
PROCEEDINGS
The
Corporation and/or the Bank are defendants in various legal proceedings arising
in the ordinary course of their business. However, in the opinion of
management of the Corporation and the Bank, there are no proceedings pending to
which the Corporation and the Bank is a party or to which their property is
subject, which, if determined adversely to the Corporation and the Bank, would
be material in relation to the Corporation's and Bank's individual profits or
financial condition, nor are there any proceedings pending other than ordinary
routine litigation incident to the business of the Corporation and the
Bank. In addition, no material proceedings are pending or are known
to be threatened or contemplated against the Corporation and the Bank by
government authorities or others.
ITEM
4. RESERVED
PART
II
|
ITEM
5.
|
MARKET
FOR REGISTRANT'S COMMON EQUITY, RELATED SHAREHOLDER MATTERS AND ISSUER
PURCHASES OF EQUITY SECURITIES
|
The
Corporation's Common Stock is traded in the over-the-counter market on the OTC
Bulletin Board under the symbol “FKYS.OB”. The
following table sets forth:
|
|
·
|
The
quarterly high and low prices for a share of the Corporation's Common
Stock during the periods indicated as reported to the management of the
Corporation and
|
|
|
·
|
Quarterly
dividends on a share of the Common Stock with respect to each quarter
since January 1, 2008.
|
MARKET
VALUE OF COMMON STOCK
|
2009:
|
High
|
Low
|
Per Share
Dividend
|
|||||||||
|
First
quarter
|
$ | 17.50 | $ | 14.01 | $ | .23 | ||||||
|
Second
quarter
|
$ | 16.55 | $ | 15.25 | $ | .23 | ||||||
|
Third
quarter
|
$ | 16.55 | $ | 15.00 | $ | .23 | ||||||
|
Fourth
quarter
|
$ | 17.95 | $ | 14.55 | $ | .23 | ||||||
|
2008:
|
||||||||||||
|
First
quarter
|
$ | 18.00 | $ | 15.25 | $ | .22 | ||||||
|
Second
quarter
|
$ | 18.00 | $ | 14.25 | $ | .22 | ||||||
|
Third
quarter
|
$ | 18.00 | $ | 15.50 | $ | .22 | ||||||
|
Fourth
quarter
|
$ | 16.00 | $ | 13.50 | $ | .23 | ||||||
As of
December 31, 2009, the Corporation had approximately 825 shareholders of
record.
The
Corporation has paid dividends since commencement of business in
1984. It is the present intention of the Corporation's Board of
Directors to continue the dividend payment policy; however, further dividends
must necessarily depend upon earnings, financial condition, appropriate legal
restrictions and other factors relevant at the time the Board of Directors of
the Corporation considers dividend policy. Cash available for
dividend distributions to shareholders of the Corporation must initially come
from dividends paid by the Bank to the Corporation. Therefore, the
restrictions on the Bank's dividend payments are directly applicable to the
Corporation.
12
Transfer
Agent:
|
Registrar
and Transfer Company
|
(800)
368-5948
|
|
10
Commerce Drive
|
|
|
Cranford,
NJ 07016-3752
|
The
following brokerage firms make a market in First Keystone Corporation common
stock:
|
RBC
Dain Rauscher
|
(800)
223-4207
|
|
Janney
Montgomery Scott LLC
|
(800)
526-6397
|
|
Stifel
Nicolaus & Co. Inc.
|
(800)
223-6807
|
|
Boenning
& Scattergood, Inc.
|
(800)
883-8383
|
Dividend Restrictions on the
Bank
The OCC
rules govern the payment of dividends by national
banks. Consequently, the Bank, which is subject to these rules, may
not pay dividends from capital (unimpaired common and preferred stock
outstanding) but only from retained earnings after deducting losses and bad
debts therefrom. To the extent that (1) the Bank has capital
surplus in an amount in excess of common capital and (2) the Bank can prove
that such surplus resulted from prior period earnings, the Bank, upon approval
of the OCC, may transfer earned surplus to retained earnings and thereby
increase its dividend capacity.
The Bank
may not pay any dividends on its capital stock during a period in which it may
be in default in the payment of its assessment for a deposit insurance premium
due to the FDIC, nor may it pay dividends on Common Stock until any cumulative
dividends on the Bank's preferred stock (if any) have been paid in full. The
Bank has never been in default in the payments of its assessments to the FDIC;
and the Bank has no outstanding preferred stock. In addition, under the Federal
Deposit Insurance Act (912 U.S.C. Section 1818), dividends cannot be declared
and paid if the OCC obtains a cease and desist order because, in the opinion of
the OCC, such payment would constitute an unsafe and unsound banking practice.
As of December 31, 2009, there was $271,000 in unrestricted retained earnings
and net income available at the Bank that could be paid as a dividend to the
Corporation under the current OCC regulations.
Dividend Restrictions on the
Corporation
Under the
Pennsylvania Business Corporation Law of 1988, as amended, the Corporation may
not pay a dividend if, after giving effect thereto, either:
|
|
·
|
The
Corporation would be unable to pay its debts as they become due in the
usual course of business, or
|
|
·
|
The
Corporation's total assets would be less than its total
liabilities.
|
The
determination of total assets and liabilities may be based upon:
|
|
·
|
Financial
statements prepared on the basis of generally accepted accounting
principles,
|
|
|
·
|
Financial
statements that are prepared on the basis of other accounting practices
and principles that are reasonable under the circumstances,
or
|
|
|
·
|
A
fair valuation or other method that is reasonable under the
circumstances.
|
Equity
Compensation Plan Information
Information
regarding the Corporation’s
equity compensation plan is incorporated herein by reference from the “Equity
Compensation Plan Information”
section of the Corporation’s
2010 definitive proxy statement filed on Schedule 14A.
13
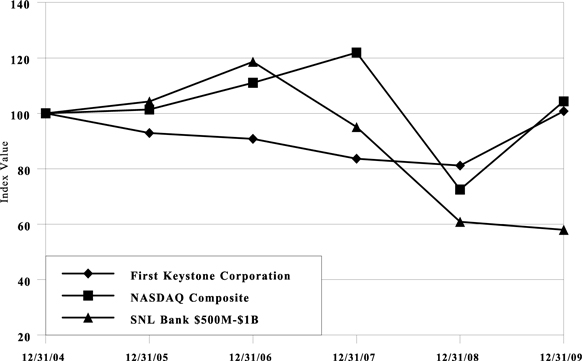
PERFORMANCE
GRAPH
The
following graph and table compare the cumulative total shareholder return on the
Corporation's common stock during the period December 31, 2004, through and
including December 31, 2009, with
|
|
·
|
the
cumulative total return on the SNL Securities Corporate Performance
Index1
for banks with less than $500 million in total assets in the Middle
Atlantic area2,
and
|
|
|
·
|
the
cumulative total return for all United States stocks traded on the NASDAQ
Stock Market.
|
The
comparison assumes $100 was invested on December 31, 2004, in the
Corporation’s
common stock and in each of the indices below and assumes further the
reinvestment of dividends into the applicable securities. The
shareholder return shown on the graph and table below is not necessarily
indicative of future performance.
FIRST
KEYSTONE CORPORATION
Total
Return Performance
|
Period Ending
|
||||||||||||||||||||||||
|
12/31/04
|
12/31/05
|
12/31/06
|
12/31/07
|
12/31/08
|
12/31/09
|
|||||||||||||||||||
|
First
Keystone Corporation
|
100.00 | 92.90 | 90.80 | 83.63 | 81.13 | 100.77 | ||||||||||||||||||
| 100.00 | 101.37 | 111.03 | 121.92 | 72.49 | 104.31 | |||||||||||||||||||
|
SNL
<$500M Bank Index
|
100.00 | 104.29 | 118.61 | 95.04 | 60.90 | 58.00 | ||||||||||||||||||
1 SNL
Securities is a research and publishing firm specializing in the collection and
dissemination of data on the banking, thrift and financial services
industries.
2 The
Middle Atlantic area comprises the states of Delaware, Pennsylvania, Maryland,
New Jersey, New York, the District of Columbia and Puerto
Rico.
14
|
ITEM
6.
|
SELECTED
FINANCIAL DATA
|
(Amounts
in thousands, except per share)
|
Year Ended December 31,
|
||||||||||||||||||||
|
2009
|
2008
|
2007
|
2006
|
2005
|
||||||||||||||||
|
SELECTED
FINANCIAL DATA:
|
||||||||||||||||||||
|
Total
Assets
|
$ | 758,330 | $ | 714,898 | $ | 681,207 | $ | 525,920 | $ | 512,399 | ||||||||||
|
Total
Investment securities
|
282,798 | 243,165 | 246,059 | 243,938 | 251,536 | |||||||||||||||
|
Net
loans
|
401,375 | 403,172 | 371,557 | 248,086 | 230,917 | |||||||||||||||
|
Total
Deposits
|
580,569 | 504,633 | 493,041 | 384,020 | 362,796 | |||||||||||||||
|
Stockholders'
equity
|
74,167 | 69,147 | 70,924 | 53,387 | 53,443 | |||||||||||||||
|
SELECTED
OPERATING DATA:
|
||||||||||||||||||||
|
Interest
income
|
$ | 37,726 | $ | 37,638 | $ | 31,899 | $ | 28,577 | $ | 26,382 | ||||||||||
|
Interest
expense
|
15,565 | 18,116 | 17,785 | 14,972 | 11,621 | |||||||||||||||
|
Net
interest income
|
$ | 22,161 | $ | 19,522 | $ | 14,114 | $ | 13,605 | $ | 14,761 | ||||||||||
|
Provision
for loan losses
|
800 | 700 | 150 | 500 | 750 | |||||||||||||||
|
Net
interest income after provision for loan and lease losses
|
$ | 21,361 | $ | 18,822 | $ | 13,964 | $ | 13,105 | $ | 14,011 | ||||||||||
|
Other
income
|
4,299 | 4,046 | 4,199 | 3,788 | 3,782 | |||||||||||||||
|
Other
expense
|
16,444 | 13,923 | 10,645 | 9,515 | 9,583 | |||||||||||||||
|
Income
before income taxes
|
$ | 9,216 | $ | 8,945 | $ | 7,518 | $ | 7,378 | $ | 8,210 | ||||||||||
|
Income
tax expense
|
1,279 | 1,394 | 1,391 | 1,188 | 1,363 | |||||||||||||||
|
Net
income
|
$ | 7,937 | $ | 7,551 | $ | 6,127 | $ | 6,190 | $ | 6,847 | ||||||||||
|
PER
COMMON SHARE DATA:
|
||||||||||||||||||||
|
Net
income
|
$ | 1.46 | $ | 1.39 | $ | 1.31 | $ | 1.35 | $ | 1.48 | ||||||||||
|
Cash
dividends
|
.92 | .89 | .88 | .85 | .78 | |||||||||||||||
|
PERFORMANCE
RATIOS:
|
||||||||||||||||||||
|
Return
on average assets
|
1.06 | % | 1.08 | % | 1.09 | % | 1.20 | % | 1.35 | % | ||||||||||
|
Return
on average equity
|
10.88 | % | 10.72 | % | 10.48 | % | 11.76 | % | 12.65 | % | ||||||||||
|
Dividend
payout ratio
|
63.06 | % | 64.12 | % | 68.25 | % | 62.63 | % | 52.61 | % | ||||||||||
|
Average
equity to average assets ratio
|
9.73 | % | 10.00 | % | 10.37 | % | 10.19 | % | 10.69 | % | ||||||||||
15
|
ITEM
7.
|
MANAGEMENT'S
DISCUSSION AND ANALYSIS OF FINANCIAL CONDITION AND RESULTS OF
OPERATIONS
|
The
purpose of Management’s
Discussion and Analysis of First Keystone Corporation, a bank holding company
(the Corporation), and its wholly owned subsidiary, First Keystone National Bank
(the Bank), is to assist the reader in reviewing the financial information
presented and should be read in conjunction with the consolidated financial
statements and other financial data contained herein. Refer to Forward Looking
Statements on page 1 for detailed information.
ACQUISITION
On
November 1, 2007, the Corporation acquired Pocono Community Bank (hereinafter
referred to as Pocono) of Stroudsburg, Pennsylvania. Pocono was a $120 million
bank which operated four full-service banking offices in Monroe County,
Pennsylvania. Period-to-period comparisons and the Management’s
Discussion are impacted by this acquisition. The tables in Management’s
Discussion include contributions of this acquisition as well as internal
changes. Refer to Note 2 on page 47 of the Notes to Consolidated Financial
Statements for detailed information.
RESULTS
OF OPERATIONS
Year
Ended December 31, 2009 Versus Year Ended December 31, 2008
Net
income increased to $7,937,000 for the year ended December 31, 2009, as compared
to $7,551,000 for the prior year, an increase of 5.1%. Earnings per share, both
basic and diluted, for 2009 were $1.46 as compared to $1.39 in 2008, an increase
of 5.0%. Cash dividends per share increased to $.92 in 2009 from $.89 in 2008,
an increase of 3.4%. The Corporation’s
return on average assets was 1.06% in 2009 as compared to 1.08% in 2008. Return
on average equity increased to 10.88% in 2009 from 10.72% in 2008. An increase
in earning asset levels resulted in an overall increase of interest income to
$37,726,000, up $88,000 or 0.2% from 2008. There was the accompanying decrease
in interest on deposits and borrowings as interest rates declined, which
resulted in interest expense of $15,565,000 in 2009, a decrease of $2,551,000 or
14.1% from 2008.
Net
interest income, as indicated below in Table 1, increased by $2,639,000 or 13.5%
to $22,161,000 for the year ended December 31, 2009. The Corporation's net
interest income on a fully taxable equivalent basis increased by $2,763,000, or
12.9% to $24,173,000 in 2009 as compared to an increase of $5,917,000, or 38.2%
to $21,410,000 in 2008.
Year
Ended December 31, 2008 Versus Year Ended December 31, 2007
Net
income increased to $7,551,000 for the year ended December 31, 2008, as compared
to $6,127,000 for the prior year, an increase of 23.2%. Earnings per share, both
basic and diluted, for 2008 were $1.39 as compared to $1.31 in 2007. Cash
dividends per share increased to $.89 in 2008 from $.88 in 2007, an increase of
1.1%. The Corporation’s
return on average assets was 1.08% in 2008 as compared to 1.09% in 2007. Return
on average equity increased to 10.72% in 2008 from 10.48% in 2007. An increase
in earning asset levels resulted in an overall increase of interest income to
$37,638,000, up $5,739,000 or 18.0% from 2007. Likewise, there was the
accompanying increase in interest on deposits and borrowings which resulted in
interest expense of $18,116,000 in 2008, an increase of $331,000 or 1.9% from
2007. Net interest income increased by $5,408,000 from 2007 to 2008 resulting in
net interest income of $19,522,000 and $21,410,000 on a fully tax equivalent
basis for 2008.
Table
1 — Net
Interest Income
|
(Amounts
in thousands)
|
2009/2008
|
2008/2007
|
||||||||||||||||||||||||||
|
Increase/(Decrease)
|
Increase/(Decrease)
|
|||||||||||||||||||||||||||
|
2009
|
Amount
|
%
|
2008
|
Amount
|
%
|
2007
|
||||||||||||||||||||||
|
Interest
Income
|
$ | 37,726 | $ | 88 | 0.2 | $ | 37,638 | $ | 5,739 | 18.0 | $ | 31,899 | ||||||||||||||||
|
Interest
Expense
|
15,565 | (2,551 | ) | (14.1 | ) | 18,116 | 331 | 1.9 | 17,785 | |||||||||||||||||||
|
Net
Interest Income
|
22,161 | 2,639 | 13.5 | 19,522 | 5,408 | 38.3 | 14,114 | |||||||||||||||||||||
|
Tax
Equivalent Adjustment
|
2,012 | 124 | 6.6 | 1,888 | 509 | 36.9 | 1,379 | |||||||||||||||||||||
|
Net
Interest Income (fully tax equivalent)
|
$ | 24,173 | $ | 2,763 | 12.9 | $ | 21,410 | $ | 5,917 | 38.2 | $ | 15,493 | ||||||||||||||||
16
Table
2 — Distribution
of Assets, Liabilities and Stockholders' Equity
|
2009
|
2008
|
2007
|
||||||||||||||||||||||||||
|
Average
|
Revenue/
|
Yield/
|
Average
|
Revenue/
|
Yield/
|
Average
|
Revenue/
|
Yield/
|
||||||||||||||||||||
|
Balance
|
Expense
|
Rate
|
Balance
|
Expense
|
Rate
|
Balance
|
Expense
|
Rate
|
||||||||||||||||||||
|
Interest
Earning Assets:
|
||||||||||||||||||||||||||||
|
Loans:
|
||||||||||||||||||||||||||||
|
Commercial, net1,2
|
$ | 48,286 | $ | 2,664 | 5.52 | % | $ | 33,029 | $ | 2,822 | 8.54 | % | $ | 21,054 | $ | 1,938 | 9.20 | % | ||||||||||
|
Real Estate1
|
347,992 | 21,420 | 6.16 | % | 333,336 | 21,663 | 6.50 | % | 234,465 | 15,993 | 6.82 | % | ||||||||||||||||
|
Consumer, Net1,2
|
12,170 | 922 | 7.58 | % | 25,498 | 1,136 | 4.46 | % | 21,097 | 1,263 | 5.99 | % | ||||||||||||||||
|
Fees
on Loans
|
— | 149 | — | % | — | 62 | — | % | — | (31 | ) | — | % | |||||||||||||||
|
Total Loans (Including Fees)3
|
$ | 408,448 | $ | 25,155 | 6.16 | % | $ | 391,863 | $ | 25,683 | 6.55 | % | $ | 276,616 | $ | 19,163 | 6.93 | % | ||||||||||
|
Investment
Securities:
|
||||||||||||||||||||||||||||
|
Taxable
|
$ | 175,042 | $ | 9,347 | 5.34 | % | $ | 156,011 | $ | 8,623 | 5.53 | % | $ | 179,431 | $ | 9,894 | 5.51 | % | ||||||||||
|
Tax Exempt1
|
78,277 | 5,227 | 6.68 | % | 78,902 | 5,128 | 6.50 | % | 66,844 | 4,124 | 6.17 | % | ||||||||||||||||
|
Total
Investment Securities
|
$ | 253,319 | $ | 14,574 | 5.75 | % | $ | 234,913 | $ | 13,751 | 5.85 | % | $ | 246,275 | $ | 14,018 | 5.69 | % | ||||||||||
|
Interest
Bearing Deposits in Banks
|
18,457 | 9 | 0.05 | % | 3,515 | 79 | 2.25 | % | 1,086 | 66 | 6.05 | % | ||||||||||||||||
|
Federal
Funds Sold
|
— | — | — | % | 436 | 13 | 2.98 | % | 688 | 31 | 4.56 | % | ||||||||||||||||
|
Total
Other Interest Earning Assets
|
18,457 | 9 | 0.05 | % | 3,951 | 92 | 2.33 | % | 1,774 | 97 | 5.47 | % | ||||||||||||||||
|
Total
Interest Earning Assets
|
$ | 680,224 | $ | 39,738 | 5.84 | % | $ | 630,727 | $ | 39,526 | 6.27 | % | $ | 524,665 | $ | 33,278 | 6.34 | % | ||||||||||
|
Non-Interest
Earning Assets:
|
||||||||||||||||||||||||||||
|
Cash
and Due From Banks
|
$ | 6,943 | $ | 9,876 | $ | 8,132 | ||||||||||||||||||||||
|
Allowance
for Loan Losses
|
(5,221 | ) | (5,163 | ) | (3,960 | ) | ||||||||||||||||||||||
|
Premises
and Equipment
|
10,515 | 8,427 | 5,519 | |||||||||||||||||||||||||
|
Foreclosed
Assets Held for Sale
|
78 | 109 | — | |||||||||||||||||||||||||
|
Other
Assets
|
57,259 | 56,635 | 29,741 | |||||||||||||||||||||||||
|
Total
Non-Interest Earning Assets
|
69,574 | 69,884 | 39,432 | |||||||||||||||||||||||||
|
Total
Assets
|
$ | 749,798 | $ | 700,611 | $ | 564,097 | ||||||||||||||||||||||
|
Interest
Bearing Liabilities:
|
||||||||||||||||||||||||||||
|
Savings,
NOW Accounts, and Money Markets
|
$ | 220,845 | $ | 2,491 | 1.13 | % | $ | 198,916 | $ | 3,113 | 1.56 | % | $ | 154,200 | $ | 3,681 | 2.39 | % | ||||||||||
|
Time
Deposits
|
280,005 | 8,873 | 3.17 | % | 259,480 | 10,795 | 4.16 | % | 214,232 | 9,876 | 4.61 | % | ||||||||||||||||
|
Short-Term
Borrowings
|
4,918 | 31 | 0.63 | % | 11,883 | 191 | 1.61 | % | 14,551 | 735 | 5.05 | % | ||||||||||||||||
|
Long-Term
Borrowings
|
79,899 | 3,830 | 4.79 | % | 71,221 | 3,539 | 4.97 | % | 58,345 | 2,901 | 4.97 | % | ||||||||||||||||
|
Fed
Funds Purchased
|
118 | 2 | 1.55 | % | 351 | 15 | 4.27 | % | 11 | — | 4.65 | % | ||||||||||||||||
|
Securities
Sold U/A to Repurchase
|
19,268 | 338 | 1.75 | % | 17,894 | 463 | 2.59 | % | 14,553 | 592 | 4.07 | % | ||||||||||||||||
|
Total
Interest Bearing Liabilities
|
$ | 605,053 | $ | 15,565 | 2.57 | % | $ | 559,745 | $ | 18,116 | 3.24 | % | $ | 455,892 | $ | 17,785 | 3.90 | % | ||||||||||
|
Non-Interest
Bearing Liabilities:
|
||||||||||||||||||||||||||||
|
Demand
Deposits
|
$ | 58,860 | $ | 57,102 | $ | 43,795 | ||||||||||||||||||||||
|
Other
Liabilities
|
12,959 | 13,315 | 5,940 | |||||||||||||||||||||||||
|
Stockholders’
Equity
|
72,926 | 70,449 | 58,470 | |||||||||||||||||||||||||
|
Total
Liabilities/Stockholders' Equity
|
$ | 749,798 | $ | 700,611 | $ | 564,097 | ||||||||||||||||||||||
|
Net
Interest Income Tax Equivalent
|
$ | 24,173 | $ | 21,410 | $ | 15,493 | ||||||||||||||||||||||
|
Net
Interest Spread
|
3.27 | % | 3.03 | % | 2.44 | % | ||||||||||||||||||||||
|
Net
Interest Margin
|
3.55 | % | 3.39 | % | 2.95 | % | ||||||||||||||||||||||
1Tax-exempt income has been adjusted to a tax equivalent basis using an incremental rate of 34%, and statutory interest expense disallowance.
2Installment
loans are stated net of unearned interest.
3Average
loan balances include non-accrual loans. Interest income on
non-accrual loans is not included.
17
NET
INTEREST INCOME
The major
source of operating income for the Corporation is net interest income. Net
interest income is the difference between interest income on earning assets,
such as loans and securities, and the interest expense on liabilities used to
fund those assets, including deposits and other borrowings. The amount of
interest income is dependent upon both the volume of earning assets and the
level of interest rates. In addition, the volume of non-performing loans affects
interest income. The amount of interest expense varies with the amount of funds
needed to support earning assets, interest rates paid on deposits and borrowed
funds, and finally, the level of interest free deposits.
Table 2
on the preceding pages provides a summary of average outstanding balances of
earning assets and interest bearing liabilities with the associated interest
income and interest expense as well as average tax equivalent rates earned and
paid as of year-end 2009, 2008 and 2007.
The yield
on earning assets was 5.84% in 2009, 6.27% in 2008, and 6.34% in 2007. The rate
paid on interest bearing liabilities was 2.57% in 2009, 3.24% in 2008, and 3.90%
in 2007. This resulted in an increase in our net interest spread to 3.27% in
2009, as compared to 3.03% in 2008 and 2.44% in 2007.
As Table
2 illustrates, the net interest margin, which is interest income less interest
expense divided by average earnings assets, was 3.55% in 2009 as compared to
3.39% in 2008 and 2.95% in 2007. The net interest margins are presented on a
tax-equivalent basis. The increase in net interest margin in 2009 and 2008 was
due primarily to the decline in interest paid on interest bearing liabilities as
interest rates in general declined, especially short-term interest rates. The
decreases in net interest margin in 2007 was due primarily to the increased
interest paid on interest bearing liabilities. This was a
result of more interest bearing liabilities repricing than earning
assets.
The
improvement in our net interest margin came from relatively stable earning asset
yields and lower funding costs in 2009 and 2008. The interest margin expansion
was experienced as the yield curve returned to its more normal upward sloping
environment in 2008 continuing into 2009 as compared to the previous years. Our
improved net interest margin will be under pressure when interest rates start to
rise since the Corporation continues to be liability sensitive and there will be
more liabilities including deposits repricing than earning assets (loans and
investments). To negate the potential impact of a lesser net interest margin,
the Corporation has focused on attracting lower cost checking, savings and money
market accounts and reduced somewhat its dependence on higher priced
certificates of deposit.
Table 3
sets forth changes in interest income and interest expense for the periods
indicated for each category of interest earning assets and interest bearing
liabilities. Information is provided on changes attributable to (i) changes in
volume (changes in average volume multiplied by prior rate); (ii) changes in
rate (changes in average rate multiplied by prior average volume); and, (iii)
changes in rate and volume (changes in average volume multiplied by change in
average rate).
Interest
income exempt from federal tax was $4,261,000 in 2009, $4,112,000 in 2008, and
$3,118,000 in 2007. Tax-exempt income has been adjusted to a
tax-equivalent basis using an incremental rate of 34%.
In 2009,
the increase in net interest income on a fully tax equivalent basis of
$2,763,000 resulted from an increase in volume of $894,000 and an increase of
$1,869,000 due to changes in rate. In 2008, the increase in net interest income
of $5,917,000 resulted from an increase in volume of $3,746,000 and an increase
of $2,171,000 due to changes in rate.
18
Table
3 — Changes in Income and Expense, 2009 and 2008
|
(Amounts in thousands)
|
2009 COMPARED TO 2008
|
2008 COMPARED TO 2007
|
||||||||||||||||||||||
|
VOLUME
|
RATE
|
NET
|
VOLUME
|
RATE
|
NET
|
|||||||||||||||||||
|
Interest
Income:
|
||||||||||||||||||||||||
|
Loans,
Net
|
$ | 1,087 | $ | (1,615 | ) | $ | (528 | ) | $ | 7,984 | $ | (1,464 | ) | $ | 6,520 | |||||||||
|
Taxable
Investment Securities
|
1,052 | (328 | ) | 724 | (1,291 | ) | 20 | (1,271 | ) | |||||||||||||||
|
Tax-Exempt
Investment Securities
|
(41 | ) | 140 | 99 | 744 | 260 | 1,004 | |||||||||||||||||
|
Other
Short-Term Investments
|
338 | (421 | ) | (83 | ) | 119 | (124 | ) | (5 | ) | ||||||||||||||
|
Total
Interest Income
|
$ | 2,436 | $ | (2,224 | ) | $ | 212 | $ | 7,556 | $ | (1,308 | ) | $ | 6,248 | ||||||||||
|
Interest
Expense:
|
||||||||||||||||||||||||
|
Savings,
Now, and Money Markets
|
$ | 343 | $ | (965 | ) | $ | (622 | ) | $ | 1,067 | $ | (1,635 | ) | $ | (568 | ) | ||||||||
|
Time
Deposits
|
854 | (2,776 | ) | (1,922 | ) | 2,086 | (1,167 | ) | 919 | |||||||||||||||
|
Short-Term
Borrowings
|
(122 | ) | (51 | ) | (173 | ) | (119 | ) | (410 | ) | (529 | ) | ||||||||||||
|
Long-Term
Borrowings
|
431 | (140 | ) | 291 | 640 | (2 | ) | 638 | ||||||||||||||||
|
Securities
Sold U/A to Repurchase
|
36 | (161 | ) | (125 | ) | 136 | (265 | ) | (129 | ) | ||||||||||||||
|
Total
Interest Expense
|
$ | 1,542 | $ | (4,093 | ) | $ | (2,551 | ) | $ | 3,810 | $ | (3,479 | ) | $ | 331 | |||||||||
|
Net
Interest Income
|
$ | 894 | $ | 1,869 | $ | 2,763 | $ | 3,746 | $ | 2,171 | $ | 5,917 | ||||||||||||
The
change in interest due to both volume and yield/rate has been allocated to
change due to volume and change due to yield/rate in proportion to the absolute
value of the change in each.
Balance
on non-accrual loans are included for computational
purposes. Interest income on non-accrual loans is not
included.
PROVISION
FOR LOAN LOSSES
For the
year ended December 31, 2009, the provision for loan losses was $800,000 as
compared to $700,000 as of December
31, 2008 and $150,000 as of December 31, 2007. The provision in 2008, increased
primarily because of the increase in net charge-offs. Net charge-offs by the
Corporation for the fiscal years ended December 31, 2009, 2008, and 2007, were
$673,000, $551,000, and $57,000, respectively.
The
Corporation did not change the manner in which it determines charge-offs. Rather
the challenges associated with the economy (higher unemployment and increased
delinquencies) in the past two years have been largely responsible for the
increase in charge-offs. While the Corporation cannot accurately predict future
charge-offs, we anticipate the trend of increased charge-offs will continue into
2010 as higher than normal unemployment continues.
The
allowance for loan losses as a percentage of loans, net of unearned interest,
was 1.31% as of December 31, 2009, 1.27% as of December 31, 2008, 1.34% as of
December 31, 2007.
On a
quarterly basis, the Corporation’s Board of
Directors and management perform a detailed analysis of the adequacy of the
allowance for loan losses. This analysis includes an evaluation of credit risk
concentration, delinquency trends, past loss experience, current economic
conditions, composition of the loan portfolio, classified loans and other
relevant factors.
The
Corporation will continue to monitor its allowance for loan losses and make
future adjustments to the allowance through the provision for loan losses as
conditions warrant. Although the Corporation believes that the allowance for
loan losses is adequate to provide for losses inherent in the loan portfolio,
there can be no assurance that future losses will not exceed the estimated
amounts or that additional provisions will not be required in the
future.
The Bank
is subject to periodic regulatory examination by the Office of the Comptroller
of the Currency (OCC). As part of the examination, the OCC will
assess the adequacy of the bank’s allowance for
loan losses and may include factors not considered by the Bank. In the event
that an OCC examination results in a conclusion that the Bank’s allowance for
loan losses is not adequate, the Bank may be required to increase its provision
for loan losses.
19
NON-INTEREST
INCOME
Non-interest
income is derived primarily from trust department revenue, service charges and
fees, income on bank owned life insurance, other miscellaneous revenue and the
gain on the sale of mortgage loans. In addition, investment securities gains or
losses also impact total non-interest income.
For the
year ended December 31, 2009, non-interest income amounted to $4,299,000, an
increase of $253,000, or 6.3% as compared to a decrease of $153,000, or 3.6% for
the year ended December 31, 2008. Table 4 provides the major categories of
non-interest income and each respective change comparing the past three years.
Investment securities losses in 2009 and 2008 were primarily the result of the
sale of equities securities at a loss. Also in 2008, there was an other than
temporary impairment charge on several bank equities securities.
The
Corporation does a quarterly impairment analysis. The analysis includes a review
of investment securities owned by our subsidiary, First Keystone National Bank
and a review of bank equities securities owned by the Corporation. With regards
to the investment securities of First Keystone National Bank, all individual
investment securities held at the end of each quarter are evaluated. The
evaluation determines if unrealized holding losses represent credit losses which
could require an other-than-temporary impairment charge through earnings.
Generally, unrealized losses related to general market conditions and/or
resultant lack of liquidity in the market do not require impairment charges.
Similarly, all bank equities securities held at each quarter end are evaluated
for other-than-temporary impairment charges, primarily if the market value has
declined significantly compared to the book value on an individual basis. Also,
trends relating to overall credit quality of financial institution equities
owned is considered in making an impairment charge decision.
Excluding
investment securities gains, non-interest income in 2009 increased $243,000, or
5.8% to $4,437,000. This compares to a increase of $478,000, or 12.9% in 2008
before investment securities gains. Income from the trust department, which
consists of fees generated from individual and corporate accounts, decreased in
2009 by $55,000, or 10.4% after decreasing by $51,000, or 8.8% in
2008. Decreased income from the trust department in 2009 and 2008 was
due primarily to the decrease in market values of assets under management,
especially equities securities and a reduction in estate fee
income.
Service
charges and fees, consisting primarily of service charges on deposit accounts
and ATM and debit card income, were the largest source of non-interest income in
2009 and 2008. Service charges and fees decreased by $104,000, or 4.2% in 2009
compared to an increase of $272,000, or 12.5% in 2008. A reduction in not
sufficient fund (NSF) fees in 2009 accounts for the decline in service charges
and fees during the past year.
Income on
Bank Owned Life Insurance (BOLI) increased $41,000 to $748,000 in 2009 as
compared to an increase of $149,000 to $707,000 in 2008. The income from BOLI
represents the increase in the cash surrender value of BOLI and is intended to
partially cover the costs of the Bank’s
employee benefit plan, including group life, disability, and health
insurance.
The gain
on sale of mortgages provided $300,000 in 2009 as compared to $136,000 in 2008.
The increase in gains on sale of mortgages was a function of the increased
originations largely due to customers taking advantage of lower mortgage rates
and refinancing. Subsequently mortgages were sold into the secondary market
during the past year. The Corporation continues to service the mortgages which
are sold, this servicing income provides an additional source of non-interest
income on an ongoing basis.
Other
income, consisting primarily of safe deposit box rentals, income from the sale
of non-deposit products, and miscellaneous fees amounted to $563,000 for 2009,
an increase of $197,000 or 53.8% over the $366,000 other income reported in
2008. The increased sale of non-deposit products, especially annuities and the
proceeds from a bank owned life insurance policy on a deceased employee account
for the majority of the increase in 2009.
20
Table 4 — Non-Interest
Income
|
(Amounts
in thousands)
|
2009/2008
|
2008/2007
|
||||||||||||||||||||||||||
|
Increase/(Decrease)
|
Increase/(Decrease)
|
|||||||||||||||||||||||||||
|
2009
|
Amount
|
%
|
2008
|
Amount
|
%
|
2007
|
||||||||||||||||||||||
|
Trust
Department
|
$ | 475 | $ | (55 | ) | (10.4 | ) | $ | 530 | $ | (51 | ) | (8.8 | ) | $ | 581 | ||||||||||||
|
Service
Charges and Fees
|
2,351 | (104 | ) | (4.2 | ) | 2,455 | 272 | 12.5 | 2,183 | |||||||||||||||||||
|
Income
on Bank Owned Life Insurance
|
748 | 41 | 5.8 | 707 | 149 | 26.7 | 558 | |||||||||||||||||||||
|
Gain
on Sale of Mortgages
|
300 | 164 | 120.6 | 136 | 47 | 52.8 | 89 | |||||||||||||||||||||
|
Other
|
563 | 197 | 53.8 | 366 | 61 | 20.0 | 305 | |||||||||||||||||||||
|
Subtotal
|
$ | 4,437 | $ | 243 | 5.8 | $ | 4,194 | $ | 478 | 12.9 | $ | 3,716 | ||||||||||||||||
|
Investment
Securities Gains (Losses)
|
(138 | ) | 10 | 6.8 | (148 | ) | (631 | ) | (130.6 | ) | 483 | |||||||||||||||||
|
Total
|
$ | 4,299 | $ | 253 | 6.3 | $ | 4,046 | $ | (153 | ) | (3.6 | ) | $ | 4,199 | ||||||||||||||
NON-INTEREST
EXPENSE
Non-interest
expense consists of salaries and benefits, occupancy, furniture and equipment,
and other miscellaneous expenses. Table 5 provides the yearly non-interest
expense by category, along with the amount, dollar changes, and percentage of
change.
Total
non-interest expense amounted to $16,444,000, an increase of $2,521,000, or
18.1% in 2009 compared to an increase of $3,278,000, or 30.8% in 2008. Expenses
associated with employees (salaries and employee benefits) continue to be the
largest non-interest expenditure. Salaries and employee benefits amounted to
49.0% of total non-interest expense in 2009 and 52.8% in 2008. Salaries and
employee benefits increased $706,000, or 9.6% in 2009 and $1,774,000, or 31.8%
in 2008. The increases in 2009 largely reflects additional hires and normal
salary adjustments along with increased benefit costs, especially health
insurance. In 2008, salary and employee benefits increased dramatically since it
was the first full year of the Pocono Community Bank acquisition with the
commensurate additional personnel expenses. The number of full time equivalent
employees was 172 as of December 31, 2009, and 163 as of December 31,
2008.
Net
occupancy expense increased $106,000, or 10.0% in 2009 as compared to an
increase of $306,000, or 40.4% in 2008. Furniture and equipment expense
increased $210,000, or 22.4% in 2009 compared to a increase of $172,000, or
22.5% in 2008. The increases in occupancy and furniture and equipment expense in
2009 relates to the opening of our Mountain Top office and the purchase of a new
core processing system. In 2008, the increase in occupancy and furniture and
equipment expenses relate to the Pocono acquisition and to a combination of
increases in rent and lease payments and new equipment purchases. FDIC insurance
expense increased $965,000, or 440.6% in 2009 as compared to an increase of
$178,000, or 434.1% in 2008. The increase in FDIC insurance for 2009 was a
result of both a special assessment levied by the FDIC on all banks and
increases in the annual insurance premiums in both 2009 and 2008. Other
non-interest expenses, including shares tax and professional services, decreased
$316,000, or 7.3% in 2009 after increasing $848,000 in 2008. The decline in
other non-interest expenses in 2009 relates to a reduction in advertising/
marketing fees and professional services fees.
The loss
due to defalcation negatively impacted total other expense in the pretax amount
of $850,000. Management believes the defalcation will be a covered loss with
insurance, less the deductible. Management of the Corporation believes that
investors’
understanding of the Corporation’s
performance is enhanced by disclosing non-GAAP financial measures without the
effect of the loss as a reasonable basis for comparison of the Corporation’s
ongoing results of operations. These non-GAAP measures should not be considered
a substitute for GAAP-basis measures and results. Our non-GAAP measures may not
be comparable to non-GAAP measures of other companies. The following Non-GAAP
Reconciliation Schedule provides a reconciliation of these non-GAAP financial
measures to the most closely analogous measure determined in accordance with
GAAP.
21
NON-GAAP
RECONCILIATION SCHEDULE
FIRST
KEYSTONE CORPORATION AND SUBSIDIARY
(Unaudited)
(In
Thousands)
|
For the Year Ended
|
||||
|
December 31, 2009
|
||||
|
Net
interest income after provision for loan losses
|
$ | 21,361 | ||
|
Non-interest
income
|
4,299 | |||
|
Non-interest
expense
|
(16,444 | ) | ||
|
Income
tax expense
|
(1,279 | ) | ||
|
Net
Income
|
7,937 | |||
|
Adjustments
|
||||
|
Other
expense
|
||||
|
Loss
due to defalcation
|
850 | |||
|
Income
tax expense
|
(289 | ) | ||
|
After
tax adjustment to GAAP
|
561 | |||
|
Adjusted
net income
|
$ | 8,498 | ||
The
overall level of non-interest expense remains low, relative to our peers
(community banks from $500 million to $1 billion in assets). In fact, our total
non-interest expense was less than 2% of average assets in both 2008 and 2007.
Our non-interest expense as a percentage of average assets places us among the
leaders in our peer financial institution categories in controlling non-interest
expense.
The large
increase in FDIC insurance expense and the loss from the defalcation resulted in
non-interest expense being 2.19% of average assets in 2009.
Table 5 — Non-Interest
Expense
|
(Amounts
in thousands)
|
2009/2008
|
2008/2007
|
||||||||||||||||||||||||||
|
Increase/(Decrease)
|
Increase/(Decrease)
|
|||||||||||||||||||||||||||
|
2009
|
Amount
|
%
|
2008
|
Amount
|
%
|
2007
|
||||||||||||||||||||||
|
Salaries
and Employee Benefits
|
$ | 8,056 | $ | 706 | 9.6 | $ | 7,350 | $ | 1,774 | 31.8 | $ | 5,576 | ||||||||||||||||
|
Occupancy,
Net
|
1,170 | 106 | 10.0 | 1,064 | 306 | 40.4 | 758 | |||||||||||||||||||||
|
Furniture
and Equipment
|
1,146 | 210 | 22.4 | 936 | 172 | 22.5 | 764 | |||||||||||||||||||||
|
FDIC
Insurance
|
1,184 | 965 | 440.6 | 219 | 178 | 434.1 | 41 | |||||||||||||||||||||
|
Loss
due to defalcation
|
850 | 850 | N/A | 0 | 0 | 0 | 0 | |||||||||||||||||||||
|
Other,
shares tax and professional services
|
4,038 | (316 | ) | (7.3 | ) | 4,354 | 848 | 24.2 | 3,506 | |||||||||||||||||||
|
Total
|
$ | 16,444 | $ | 2,521 | 18.1 | $ | 13,923 | $ | 3,278 | 30.8 | $ | 10,645 | ||||||||||||||||
INCOME
TAX EXPENSE
Income
tax expense for the year ended December 31, 2009, was $1,279,000 as compared to
$1,394,000 and $1,391,000 for the years ended December 31, 2008, and
December 31, 2007, respectively. In 2009, our income tax expense decreased even
though income before taxes increased $271,000 to $9,216,000 from $8,945,000 in
2008. An increase in tax exempt income reduced our income tax liability in 2009.
The corporation looks to maximize its tax-exempt interest derived from both
tax-free loans and tax-free municipal investments without triggering alternative
minimum tax. The effective income tax rate was 14.2% in 2009, 16.2% in 2008, and
18.0% in 2007. The limited availability of tax-free municipal investments at
attractive interest rates may result in a higher effective tax rate in future
years.
22
FINANCIAL
CONDITION
GENERAL
Total
assets increased to $758,330,000 at year-end 2009, an increase of 6.1% from
year-end 2008. As of December 31, 2009, total deposits amounted to $580,569,000,
an increase of 15.0% over 2008. Assets as of December 31, 2008 were
$714,898,000, an increase of 4.9% over 2007, while total deposits as of year-end
2008 amounted to $504,633,000, an increase of 2.4% from 2007.
In 2009,
because of the economy and the lack of loan demand, deposit growth was used to
fund the purchase of investment securities and to reduce short-term
borrowings.
In both
2008 and 2007, deposit growth was used principally to fund loan growth. The
Corporation continues to maintain and manage its asset growth. Our strong equity
capital position provides us an opportunity to further leverage our asset
growth. Borrowings decreased in 2009 by $36,956,000 after increasing by
$23,870,000 in 2008. Increased borrowings in 2008 and 2007 helped fund loan
growth and other asset growth on the balance sheet. Core deposits, which include
demand deposits and interest bearing demand deposits (NOWs), money market
accounts, savings accounts, and time deposits of individuals continues to be our
most significant source of funds. In 2009 and 2008, several successful sales
campaigns attracted new customers and generated growth in retail
certificates of deposit (time deposits of individuals) as well as checking,
savings and money market accounts.
EARNING
ASSETS
Earning
assets are defined as those assets that produce interest income. By maintaining
a healthy asset utilization rate, i.e., the volume of earning assets as a
percentage of total assets, the Corporation maximizes income. The earning asset
ratio (average interest earning assets divided by average total assets) equaled
90.7% for 2009, compared to 90.0% for 2008 and 93.0% for 2007. This indicates
that the management of earning assets is a priority and non-earning assets,
primarily cash and due from banks, fixed assets and other assets, are
maintained at minimal levels. The primary earning assets are loans
and investment securities.
LOANS
Total
loans, net of unearned income, decreased to $406,697,000 as of December 31,
2009, as compared to a balance of $408,367,000 as of December 31, 2008. Table 6
provides data relating to the composition of the Corporation's loan portfolio on
the dates indicated. Total loans, net of unearned income, decreased $1,670,000,
or 0.4% in 2009 compared to an increase of $31,764,000, or 8.4% in 2008. The
economy and the resultant decline in loan demand account for the reduction in
loans in 2009. Residential real estate loans increased only slightly in 2009
since the bulk of residential real estate loans originated were secondary market
conforming and were sold. The Corporation did not change its underwriting
standards in 2009, rather opportunities to originate commercial and consumer
loans declined because of the economy and the increased
unemployment.
The loan
portfolio is well diversified. Increases in the portfolio in 2008 were primarily
in commercial real estate loans and tax exempt loans. In 2007, the increase in
loans was primarily from the Pocono Community Bank acquisition. The Corporation
continues to originate and sell certain long-term fixed rate residential
mortgage loans which conform to secondary market requirements. The Corporation
derives ongoing income from the servicing of mortgages sold in the secondary
market.
The
Corporation continues to internally underwrite each of its loans to comply with
prescribed policies and approval levels established by its Board of
Directors.
23
Table
6 — Loans
Outstanding, Net of Unearned Income
|
(Amounts in thousands)
|
December 31,
|
|||||||||||||||||||
|
2009
|
2008
|
2007
|
2006
|
2005
|
||||||||||||||||
|
Commercial,
financial and agricultural:
|
||||||||||||||||||||
|
Commercial
secured by real estate
|
$ | 207,296 | $ | 206,095 | $ | 190,803 | $ | 123,673 | $ | 92,930 | ||||||||||
|
Commercial
- other
|
38,932 | 33,104 | 29,129 | 22,169 | 29,284 | |||||||||||||||
|
Tax
exempt
|
12,525 | 18,920 | 10,899 | 3,264 | 3,840 | |||||||||||||||
|
Real
estate (primarily residential mortgage loans)
|
138,092 | 136,288 | 130,865 | 86,208 | 92,840 | |||||||||||||||
|
Consumer
loans
|
10,802 | 15,291 | 16,712 | 18,728 | 18,467 | |||||||||||||||
|
Total
Gross Loans
|
$ | 407,647 | $ | 409,698 | $ | 378,408 | $ | 254,042 | $ | 237,361 | ||||||||||
|
Less: Unearned
income and
|
||||||||||||||||||||
|
unamortized
loan fees net of costs
|
950 | 1,331 | 1,805 | 2,285 | 2,768 | |||||||||||||||
|
Total
Loans, net of unearned income
|
$ | 406,697 | $ | 408,367 | $ | 376,603 | $ | 251,757 | $ | 234,593 | ||||||||||
INVESTMENT
SECURITIES
The
Corporation uses investment securities to not only generate interest and
dividend revenue, but also to help manage interest rate risk and to provide
liquidity to meet operating cash needs.
The
investment portfolio has been allocated between securities available for sale,
including restricted equity securities, and securities held to maturity. No
investment securities were established in a trading account. Available for sale
securities increased $37,649,000 or 15.7% to $277,824,000 in 2009 due to the
substantial increase in deposits during the year and the lack of loan demand.
Available for sale securities decreased $1,346,000, or 0.6% to $240,175,000 in
2008. At December 31, 2009 the net unrealized loss, net of the tax effect, on
these securities was $2,583,000 and is included in stockholders’
equity as accumulated other comprehensive loss. At December 31, 2008,
accumulated other comprehensive income, net of tax effect, amounted to a loss of
$4,671,000. In 2009, held to maturity securities increased $1,984,000, or 66.4%
to $4,974,000 after decreasing $1,548,000, or 34.1% in 2008. Table 7 provides
data on the carrying value of our investment portfolio on the dates indicated.
The vast majority of investment security purchases are allocated as available
for sale. This provides the Corporation with increased flexibility
should there be a need or desire to liquidate an investment
security.
The
investment portfolio includes U.S. Government Corporations and Agencies,
corporate obligations, mortgage backed securities, state and municipal
securities, both tax-exempt and taxable. In addition, the investment portfolio
includes restricted equity securities consisting primarily of common stock
investments in the Federal Reserve Bank and the Federal Home Loan Bank.
Marketable equity securities consists of common stock investments in other
commercial banks and bank holding companies. A quarterly impairment analysis is
conducted as outlined under non-interest income on page 20 of this
report.
Securities
available for sale may be sold as part of the overall asset and liability
management process. Realized gains and losses are reflected in the results of
operations on our statements of income. The investment portfolio does not
contain any structured notes, step-up bonds, off-balance sheet derivatives, or
trust preferred investments.
During
2009, interest bearing deposits in other banks increased to $7,227,000 from
$6,000 in 2008. Interest bearing deposits in other banks increased in 2009 since
deposit growth was substantial and the Corporation elected to take a defensive
posture and increase its liquidity in the event customers elected to withdraw
some deposits and also be prepared for possible increases in interest
rates.
24
Table
7 — Carrying
Value of Investment Securities
|
(Amounts
in thousands)
|
||||||||||||||||||||||||
|
December 31,
|
||||||||||||||||||||||||
|
2009
|
2008
|
2007
|
||||||||||||||||||||||
|
Available
|
Held to
|
Available
|
Held to
|
Available
|
Held to
|
|||||||||||||||||||
|
for Sale
|
Maturity
|
for Sale
|
Maturity
|
for Sale
|
Maturity
|
|||||||||||||||||||
|
U.
S. Government Corporations
|
||||||||||||||||||||||||
|
and
Agencies
|
$ | 59,422 | $ | 3,159 | $ | 78,344 | $ | 176 | $ | 149,607 | $ | 2,191 | ||||||||||||
|
State
and Municipal
|
162,600 | 1,815 | 133,461 | 2,814 | 74,359 | 2,347 | ||||||||||||||||||
|
Corporate
|
45,904 | — | 19,781 | — | 8,530 | — | ||||||||||||||||||
|
Marketable
Equity Securities
|
1,759 | — | 1,911 | — | 2,916 | — | ||||||||||||||||||
|
Restricted
Equity Securities
|
8,139 | — | 6,678 | — | 6,109 | — | ||||||||||||||||||
|
Total
Investment Securities
|
$ | 277,824 | $ | 4,974 | $ | 240,175 | $ | 2,990 | $ | 241,521 | $ | 4,538 | ||||||||||||
ALLOWANCE
FOR LOAN LOSSES
The
allowance for loan losses constitutes the amount available to absorb losses
within the loan portfolio. As of December
31, 2009, the allowance for loan losses was $5,322,000 as compared to $5,195,000
and $5,046,000 as of December 31, 2008 and 2007, respectively. The allowance for
loan losses as of December 31, 2007 included $1,282,000 acquired through the
Pocono Community Bank acquisition. The allowance for loan losses is established
through a provision for loan losses charged to expenses. Loans are charged
against the allowance for possible loan losses when management believes that the
collectibility of the principal is unlikely. The risk characteristics of the
loan portfolio are managed through the various control processes, including
credit evaluations of individual borrowers, periodic reviews, and
diversification by industry. Risk is further mitigated through the application
of lending procedures such as the holding of adequate collateral and the
establishment of contractual guarantees.
Management
performs a quarterly analysis to determine the adequacy of the allowance for
loan losses. The methodology in determining adequacy incorporates specific and
general allocations together with a risk/loss analysis on various segments of
the portfolio according to an internal loan review process. This assessment
results in an allocated allowance. Management maintains its loan review and loan
classification standards consistent with those of its regulatory supervisory
authority.
Management
feels, based upon its methodology, that the allowance for loan losses is
adequate to cover foreseeable future losses. Table 8 contains an analysis of our
Allowance for Loan Losses indicating charge-offs and recoveries by the year and
annual additional provisions charged to operations. In 2009, net charge-offs as
a percentage of average loans were .16%, in 2008 net charge-offs as a percentage
of average loans were .14% compared to .02% in 2007. Net charge-offs
amounted to $673,000 in 2009, $551,000 in 2008 and $57,000 in 2007. The increase
in net charge-offs in 2009 relate primarily to increased losses on commercial
loans, real estate loans and consumer loans. In 2008, the increase in net
charge-offs was directly related to real estate loans.
25
Table 8 — Analysis of Allowance for
Loan Losses
|
(Amounts in thousands)
|
Years Ended December 31,
|
|||||||||||||||||||
|
2009
|
2008
|
2007
|
2006
|
2005
|
||||||||||||||||
|
Balance
at beginning of period
|
$ | 5,195 | $ | 5,046 | $ | 3,671 | $ | 3,676 | $ | 3,828 | ||||||||||
|
Charge-offs:
|
||||||||||||||||||||
|
Commercial,
financial, and agricultural
|
211 | 44 | 12 | 493 | 338 | |||||||||||||||
|
Real
estate
|
354 | 633 | 138 | 183 | 497 | |||||||||||||||
|
Consumer
|
169 | 62 | 86 | 110 | 98 | |||||||||||||||
| 734 | 739 | 236 | 786 | 933 | ||||||||||||||||
|
Recoveries:
|
||||||||||||||||||||
|
Commercial,
financial, and agricultural
|
13 | 154 | 135 | 228 | — | |||||||||||||||
|
Real
estate
|
25 | 6 | 11 | 4 | 1 | |||||||||||||||
|
Consumer
|
23 | 28 | 33 | 49 | 30 | |||||||||||||||
| 61 | 188 | 179 | 281 | 31 | ||||||||||||||||
|
Net
charge-offs
|
673 | 551 | 57 | 505 | 902 | |||||||||||||||
|
Additions
charged to operations
|
800 | 700 | 150 | 500 | 750 | |||||||||||||||
|
Allowance
purchased
|
— | — | 1,282 | — | — | |||||||||||||||
|
Balance
at end of period
|
$ | 5,322 | $ | 5,195 | $ | 5,046 | $ | 3,671 | $ | 3,676 | ||||||||||
|
Ratio
of net charge-offs during the period to
|
||||||||||||||||||||
|
average
loans outstanding during the period
|
.16 | % | .14 | % | .02 | % | .21 | % | .39 | % | ||||||||||
|
Allowance
for loan losses to average loans
|
||||||||||||||||||||
|
outstanding
during the period
|
1.30 | % | 1.33 | % | 1.82 | % | 1.50 | % | 1.58 | % | ||||||||||
It is the
policy of management and the Corporation’s
Board of Directors to provide for losses on both identified and
unidentified losses inherent in its loan portfolio. A provision for loan losses
is charged to operations based upon an evaluation of the potential losses in the
loan portfolio. This evaluation takes into account such factors as
portfolio concentrations, delinquency, trends, trends of non-accrual and
classified loans, economic conditions, and other relevant factors.
The loan
review process which is conducted quarterly, is an integral part of our
evaluation of the loan portfolio. A detailed quarterly analysis to determine the
adequacy of the Corporation’s
allowance for loan losses is reviewed by our Board of Directors.
With our
manageable level of net charge-offs and the additions to the reserve from our
provision out of operations, the allowance for loan losses as a percentage of
average loans amounted to 1.30% in 2009, 1.33% to 2008, and 1.82% in
2007.
Table 9
sets forth the allocation of the Bank’s
allowance for loan losses by loan category and the percentage of loans in each
category to total loans receivable at the dates indicated. The portion of the
allowance for loan losses allocated to each loan category does not represent the
total available for future losses that may occur within the loan category, since
the total loan loss allowance is a valuation reserve applicable to the entire
loan portfolio.
Table
9 — Allocation
of Allowance for Loan Losses
|
(Amounts in thousands)
|
December 31,
|
|||||||||||||||||||||||||||||||||||||||
|
2009
|
%*
|
2008
|
%*
|
2007
|
%*
|
2006
|
%*
|
2005
|
%*
|
|||||||||||||||||||||||||||||||
|
Commercial,
financial, and
|
||||||||||||||||||||||||||||||||||||||||
|
agricultural
|
$ | 740 | 14.5 | $ | 721 | 12.7 | $ | 1,116 | 22.8 | $ | 674 | 19.7 | $ | 906 | 25.2 | |||||||||||||||||||||||||
|
Real
estate - mortgage
|
4,177 | 81.6 | 3,641 | 84.1 | 3,680 | 75.1 | 2,613 | 76.1 | 2,521 | 70.2 | ||||||||||||||||||||||||||||||
|
Consumer
and other loans
|
199 | 3.9 | 207 | 3.2 | 103 | 2.1 | 145 | 4.2 | 164 | 4.6 | ||||||||||||||||||||||||||||||
|
Unallocated
|
206 | N/A | 626 | N/A | 147 | N/A | 239 | N/A | 85 | N/A | ||||||||||||||||||||||||||||||
| $ | 5,322 | 100.0 | $ | 5,195 | 100.0 | $ | 5,046 | 100.0 | $ | 3,671 | 100.0 | $ | 3,676 | 100.0 | ||||||||||||||||||||||||||
26
NON-PERFORMING
ASSETS
Table 10
details the Corporation's non-performing assets as of the dates
indicated. Non-accrual loans are generally delinquent and past-due
approximately 90 days or more, depending upon the type of credit and the
collateral. When a loan is placed on non-accrual status, any unpaid interest is
charged against income. Restructured loans are loans where the borrower has been
granted a concession in the interest rate or payment amount because of financial
problems. Foreclosed assets held for sale represent property acquired through
foreclosure, or considered to be an in-substance foreclosure.
The total
of non-performing assets increased to $3,418,000 in 2009 after decreasing to
$1,761,000 as of December 31, 2008 from $3,458,000 as of December 31, 2007. The
economy, in particular increased unemployment, had a direct effect of increasing
our non-performing assets. The Corporation is closely monitoring its commercial
real estate portfolio because of the current economic environment. In
particular, vacancy rates are rising as rents and property values in some
markets have fallen. Losses on commercial real estate, which increased in 2009,
are projected to continue higher than normal into 2010. Non-accrual and
restructured loans increased to $2,948,000 in 2009 from $1,718,000 in 2008.
Foreclosed assets increased to $330,000 in 2009 from $28,000 in 2008. Loans
past-due 90 days or more and still accruing increased to $140,000 in 2009 from
$15,000 in 2008. Non-performing assets to period end loans foreclosed assets was
0.84% in 2009, 0.43% in 2008, and 0.92% in 2007. Total non-performing assets to
total assets also increased to 0.45% in 2009 from 0.25% and 0.51% in 2008 and
2007, respectively. Our allowance for loan losses to total non-performing assets
decreased to 155.7% in 2009 from 295.0% in 2008. While asset quality is a
priority, the corporation retains a full-time loan review officer to closely
track and monitor overall loan quality.
Improving
loan quality is a priority, and we actively work with borrowers to resolve
credit problems. In fact, we increased our efforts to assist borrowers in 2009
and will continue our increased work out efforts in 2010. As of year end 2009,
the Corporation did not have any troubled debt restructures in its portfolio.
Excluding the assets disclosed in Table 10, management is not aware of any
information about borrowers' possible credit problems which cause serious doubt
as to their ability to comply with present loan repayment terms.
Should
the economic climate no longer continue to be stable or begin to deteriorate,
borrowers may experience difficulty, and the level of non-performing loans and
assets, charge-offs and delinquencies could rise and possibly require additional
increases in our allowance for loan losses.
In
addition, regulatory authorities, as an integral part of their examinations,
periodically review the allowance for possible loan and lease losses. They may
require additions to allowances based upon their judgements about information
available to them at the time of examination.
Interest
income received on non-performing loans in 2009 and 2008 was $61,000 and
$94,000, respectively. Interest income, which would have been recorded on these
loans under the original terms in 2009 and 2008 was $242,000 and $145,000,
respectively. At December 31, 2009, the Corporation had no outstanding
commitments to advance additional funds with respect to these non-performing
loans.
A
concentration of credit exists when the total amount of loans to borrowers, who
are engaged in similar activities that are similarly impacted by economic or
other conditions, exceed 10% of total loans. As of December 31, 2009, 2008 and
2007, management is of the opinion that there were no loan concentrations
exceeding 10% of total loans.
Table
10 — Non-Performing
Assets
|
(Amounts in thousands)
|
December 31,
|
|||||||||||||||||||
|
2009
|
2008
|
2007
|
2006
|
2005
|
||||||||||||||||
|
Non-accrual
and restructured loans
|
$ | 2,948 | $ | 1,718 | $ | 3,208 | $ | 1,704 | $ | 2,069 | ||||||||||
|
Foreclosed
assets
|
330 | 28 | 65 | 41 | 397 | |||||||||||||||
|
Loans
past-due 90 days or more and still accruing
|
140 | 15 | 185 | 1,135 | 64 | |||||||||||||||
|
Total
non-performing assets
|
$ | 3,418 | $ | 1,761 | $ | 3,458 | $ | 2,880 | $ | 2,530 | ||||||||||
|
Non-performing
assets to period-end loans and foreclosed assets
|
0.84 | % | 0.43 | % | 0.92 | % | 1.14 | % | 1.08 | % | ||||||||||
|
Total
non-performing assets to total assets
|
0.45 | % | 0.25 | % | 0.51 | % | 0.55 | % | 0.49 | % | ||||||||||
|
Total
allowance for loan losses to total non-performing assets
|
155.7 | % | 295.0 | % | 145.9 | % | 127.5 | % | 145.3 | % | ||||||||||
27
Real
estate mortgages comprise 84.9% of the loan portfolio as of December 31, 2009,
as compared to 83.8% in 2008. Real estate mortgages consist of both residential
and commercial real estate loans. The real estate loan portfolio is well
diversified in terms of borrowers, collateral, interest rates, and maturities.
Also, the residential real estate loan portfolio is largely fixed rate
mortgages. The real estate loans are concentrated primarily in our marketing
area and are subject to risks associated with the local economy. The commercial
real estate loans typically reprise approximately each three to five years and
are also concentrated in our marketing area.
DEPOSITS
AND OTHER BORROWED FUNDS
Consumer
and commercial retail deposits are attracted primarily by First Keystone’s
subsidiary bank's fifteen full service office locations. The Bank offers a broad
selection of deposit products and continually evaluates its interest rates and
fees on deposit products. The Bank regularly reviews competing financial
institutions interest rates along with prevailing market rates, especially when
establishing interest rates on certificates of deposit.
Deposits
increased by $75,936,000, or a 15.0% for the year ending December 31, 2009. This
increase compares to a deposit increase of $11,592,000, or 2.4% in 2008. Much of
the deposit increase in 2009 relates to the economy and the concerns on Wall
Street. We believe customers sought the safety and stability of community banks,
together with the increased FDIC insurance limits, which accounts for the rise
in deposits during 2009.
During
2009, the Corporation experienced a deposit increase in both non-interest and
interest bearing deposits. Non-interest bearing deposits amounted to $61,779,000
as of December 31, 2009, an increase of $3,601,000 or 6.2% from 2008. Interest
bearing deposits amounted to $518,790,000 as of December 31, 2009, an increase
of $72,335,000, or 16.2% over 2008.
The
deposit growth in 2009 was not a function of First Keystone paying up with
higher interest rates to spur deposit growth. In fact, our cost of interest
bearing deposits declined in 2009 and our net-interest margin actually increased
to 3.55% in 2009 from 3.39% in 2008.
During
2009, because of our deposit growth and weak loan demand, the Corporation
reduced its reliance on borrowings. Short-term borrowings amounted to
$17,462,000 as of year-end 2009, a decrease of $37,870,000 from 2008. Long-term
borrowings remained stable at $82,976,000 in 2009 as compared to $82,062,000 as
of December 31, 2008. Total borrowings were $100,438,000 as of December 31,
2009, compared to $137,394,000 on December 31, 2008. Short-term borrowings are
comprised of federal funds purchased, securities sold under agreements to
repurchase, U.S. Treasury demand notes, and short-term borrowings from the
Federal Home Loan Bank (FHLB).
Long-term
borrowings are typically FHLB term borrowings with a maturity of one year or
more. Short-term borrowings from the Federal Home Loan Bank are commonly used to
offset seasonal fluctuations in deposits. In connection with FHLB borrowings, US
Treasury demand notes and securities sold under agreements to repurchase, the
Corporation maintains certain eligible assets as collateral.
CAPITAL
STRENGTH
Normal
increases in capital are generated by net income, less cash dividends paid out.
Also, the net unrealized gains or losses on investment securities
available-for-sale, net of taxes, referred to as accumulated other comprehensive
income may increase or decrease total equity capital. The total net increase in
capital was $5,020,000 in 2009 after a decrease of $1,777,000 in 2008. Much of
the increase in equity capital in 2009 relates to an increase in retained
earnings and a reduction in accumulated other comprehensive losses. The
accumulated other comprehensive income amounted to $(2,583,000) in 2009 and
$(4,671,000) in 2008. One factor which also decreased total equity capital in
2009 and 2008 relates to stock repurchase. The Corporation had 247,641 shares of
common stock as of December 31, 2009 and 2008, at a cost of $6,240,000 as
treasury stock.
Return on
equity (ROE) is computed by dividing net income by average stockholders’
equity. This ratio was 10.88% for 2009, 10.72% for 2008, and 10.48%
for 2007. Refer to Performance Ratios on page 15 —
Selected Financial Data for a more expanded listing of the ROE.
Adequate
capitalization of banks and bank holding companies is required and monitored by
regulatory authorities. Table 11 reflects risk-based capital ratios and the
leverage ratio for our Corporation and Bank. The Corporation's leverage ratio
was 7.44% at December 31, 2009, and 7.59% at December 31, 2008.
28
The
Corporation has consistently maintained regulatory capital ratios at or above
the “well capitalized” standards. For additional information
on capital ratios, see Note 17 on page 64 of this report. As Table 11 indicates,
the risk-based capital ratios for both the Corporation and the Bank, although
down slightly, remained strong. The risk-based capital calculation assigns
various levels of risk to different categories of bank assets, requiring higher
levels of capital for assets with more risk. Also measured in the risk-based
capital ratio is credit risk exposure associated with off-balance sheet
contracts and commitments.
Table
11 — Capital
Ratios
|
December 31, 2009
|
December 31, 2008
|
|||||||||||||||
|
Corporation
|
Bank
|
Corporation
|
Bank
|
|||||||||||||
|
Risk-Based
Capital:
|
||||||||||||||||
|
Tier
I risk-based capital ratio
|
10.86 | % | 11.85 | % | 10.95 | % | 11.97 | % | ||||||||
|
Total
risk-based capital ratio (Tier 1 and Tier 2)
|
11.90 | % | 12.88 | % | 12.02 | % | 13.03 | % | ||||||||
|
Leverage
Ratio:
|
||||||||||||||||
|
Tier
I capital to average assets
|
7.44 | % | 8.21 | % | 7.59 | % | 8.45 | % | ||||||||
LIQUIDITY
MANAGEMENT
Effective
liquidity management ensures that the cash flow requirements of depositors and
borrowers, as well as the operating cash needs of the Corporation, are
met.
Liquidity
is needed to provide the funding requirements of depositors withdrawals, loan
growth, and other operational needs. Asset liquidity is provided by investment
securities maturing in one year or less, other short-term investments, federal
funds sold, and cash and due from banks. At year-end 2009, cash and due from
banks and interest-bearing deposits in other banks totaled $11,426,000 as
compared to $9,951,000 at year-end 2008. Additionally, maturing loans and
repayment of loans are another source of asset liquidity. Uncertain about the
duration of some of our 2009 deposit growth, First Keystone chose to maintain
more liquidity than normal in the event customers elected to withdraw some
deposits.
Liability
liquidity is accomplished by maintaining a core deposit base, acquired by
attracting new deposits and retaining maturing deposits. Also,
short-term borrowings provide funds to meet liquidity.
Management
feels its current liquidity position is satisfactory given the fact that the
Corporation has a very stable core deposit base which has increased annually.
Secondly, our loan payments and principal paydowns on our mortgage backed
securities provide a steady source of funds. Also, short-term investments and
maturing investments represent additional sources of liquidity.
Finally,
the Corporation’s subsidiary bank
does have access to funds on a short-term basis from the Federal Reserve Bank
discount window. Also, Fed funds can be purchased by means of a borrowing line
at the Atlantic Central Bankers Bank. The Corporation has indirect access to the
capital markets through its membership in the Federal Home Loan Bank. Advances
on borrowings, both short-term and long-term, are available to help address any
liquidity needs.
MARKET
RISK
Market
risk is the risk of loss arising from adverse changes in the fair value of
financial instruments due to changes in interest rates, exchange rates and
equity prices. First Keystone Corporation’s market risk is
composed primarily of interest rate risk. The Corporation’s interest rate
risk results from timing differences in the repricing of assets, liabilities,
off-balance sheet instruments, and changes in relationships between ratio
indices and the potential exercise of explicit or embedded options.
Increases
in the level of interest rates also may adversely affect the fair value of the
Corporation’s
securities and other earning assets. Generally, the fair value of fixed-rate
instruments fluctuates inversely with changes in interest rates. As a result,
increases in interest rates could result in decreases in the fair value of the
Corporation’s
interest-earning assets, which could adversely affect the Corporation’s results of
operations if sold, or, in the case of interest earning assets classified as
available for sale, the Corporation’s
stockholders’
equity, if retained. Under the FASB ASC 320-10 Investment Debt and Equity
Securities, changes in the unrealized gains and losses, net of taxes, on
securities classified as available for sale will be reflected in the
Corporation’s
stockholders’
equity. The Corporation does not own any trading assets.
29
Asset/Liability
Management
The
principal objective of asset liability management is to manage the sensitivity
of the net interest margin to potential movements in interest rates and to
enhance profitability through returns from managed levels of interest rate risk.
The Corporation actively manages the interest rate sensitivity of its assets and
liabilities. Table 12 presents an interest sensitivity analysis of assets and
liabilities as of December 31, 2009. Several techniques are used for measuring
interest rate sensitivity. Interest rate risk arises from the mismatches in the
repricing of assets and liabilities within a given time period, referred to as a
rate sensitivity gap. If more assets than liabilities mature or reprice within
the time frame, the Corporation is asset sensitive. This position would
contribute positively to net interest income in a rising rate environment.
Conversely, if more liabilities mature or reprice, the Corporation is liability
sensitive. This position would contribute positively to net interest income in a
falling rate environment.
Limitations
of interest rate sensitivity gap analysis as illustrated in Table 12
include: a) assets and liabilities which contractually reprice within
the same period may not, in fact, reprice at the same time or to the same
extent; b) changes in market interest rates do not affect all assets and
liabilities to the same extent or at the same time, and c) interest rate
sensitivity gaps reflect the Corporation’s
position on a single day (December 31, 2009 in the case of the following
schedule) while the Corporation continually adjusts its interest sensitivity
throughout the year. The Corporation’s
cumulative gap at one year indicates the Corporation is liability
sensitive.
Table
12 — Interest
Rate Sensitivity Analysis
(Amounts
in thousands)
|
December 31, 2009
|
||||||||||||||||||||
|
One
|
1 - 5
|
Beyond
|
Not Rate
|
|||||||||||||||||
|
Year
|
Years
|
5 Years
|
Sensitive
|
Total
|
||||||||||||||||
|
Assets
|
$ | 153,914 | $ | 298,281 | $ | 266,430 | $ | 39,705 | $ | 758,330 | ||||||||||
|
Liabilities/Stockholders
Equity
|
251,170 | 282,390 | 149,362 | 75,408 | 758,330 | |||||||||||||||
|
Interest
Rate Sensitivity Gap
|
(97,256 | ) | 15,891 | 117,068 | (35,703 | ) | ||||||||||||||
|
Cumulative
Gap
|
(97,256 | ) | (81,365 | ) | 35,703 | |||||||||||||||
Earnings
at Risk
The
Bank’s
Asset/Liability Committee (ALCO) is responsible for reviewing the interest rate
sensitivity position and establishing policies to monitor and limit exposure to
interest rate risk. The guidelines established by ALCO are reviewed by the
Corporation’s
Board of Directors. The Corporation recognizes that more sophisticated tools
exist for measuring the interest rate risk in the balance sheet beyond interest
rate sensitivity gap. Although the Corporation continues to measure its interest
rate sensitivity gap, the Corporation utilizes additional modeling for interest
rate risk in the overall balance sheet. Earnings at risk and economic values at
risk are analyzed.
Earnings
simulation modeling addresses earnings at risk and net present value estimation
addresses economic value at risk. While each of these interest rate risk
measurements has limitations, taken together they represent a reasonably
comprehensive view of the magnitude of interest rate risk in the
Corporation.
Earnings
Simulation Modeling
The
Corporation’s
net income is affected by changes in the level of interest rates. Net
income is also subject to changes in the shape of the yield
curve. For example, a flattening of the yield curve would result in a
decline in earnings due to the compression of earning asset yields and increased
liability rates, while a steepening would result in increased earnings as
earning asset yields widen.
30
Earnings
simulation modeling is the primary mechanism used in assessing the impact of
changes in interest rates on net interest income. The model reflects
management's assumptions related to asset yields and rates paid on liabilities,
deposit sensitivity, size and composition of the balance sheet. The assumptions
are based on what management believes at that time to be the most likely
interest rate environment. Earnings at risk is the change in net interest income
from a base case scenario under an increase and decrease of 200 basis points in
the interest rate earnings simulation model.
Table 13
presents an analysis of the changes in net-interest income and net present value
of the balance sheet resulting from an increase or decrease of two percentage
points (200 basis points) in the level of interest rates. The calculated
estimates of change in net interest income and net present value of the balance
sheet are compared to current limits approved by ALCO and the Board of
Directors. The earnings simulation model projects net-interest income would
decrease by approximately 2.1% if rates fell by two percentage points over one
year. The model projects a decrease of approximately 5.9% in net-interest income
if rates rise by two percentage points over one year. Both of these forecasts
are within the one year policy guidelines.
Net
Present Value Estimation
The net
present value measures economic value at risk and is used for helping to
determine levels of risk at a point in time present in the balance sheet that
might not be taken into account in the earnings simulation model. The net
present value of the balance sheet is defined as the discounted present value of
asset cash flows minus the discounted present value of liability cash flows. At
year-end 2009, a 200 basis point immediate decrease in rates is estimated to
increase net present value by 12%. Additionally, net present value is projected
to decrease by 23.0% if rates increase immediately by 200 basis points. The
12.0% scenario is below our policy limits of 40%.
The
computation of the effects of hypothetical interest rate changes are based on
many assumptions. They should not be relied upon solely as being indicative of
actual results, since the computations do not contemplate actions management
could undertake in response to changes in interest rates.
Table
13 — Effect
of Change in Interest Rates
|
Projected Change
|
||||
|
Effect
on Net Interest Income
|
||||
|
1-year
Net Income simulation Projection
|
||||
|
–200 bp Shock
vs Stable Rate
|
(2.1 | )% | ||
|
+200
bp Shock vs Stable Rate
|
(5.9 | ) % | ||
|
Effect
on Net Present Value of Balance Sheet
|
||||
|
Static
Net Present Value Change
|
||||
|
–200 bp Shock
vs Stable Rate
|
12.0 | % | ||
|
+200
bp Shock vs Stable Rate
|
(23.0 | )% | ||
MARKET
PRICE/DIVIDEND HISTORY
As of
December 31, 2009, the corporation had 5,440,126 shares of $2.00 par value
common stock outstanding held by shareholders of record. First Keystone
Corporation’s
common stock is quoted on the Over The Counter (OTC) Bulletin Board under the
symbol “FKYS.OB”.
Table 14
reports the highest and lowest per share prices known to the Corporation and the
dividends paid during the periods indicated. These prices do not necessarily
reflect any dealer or retail markup, markdown or commission.
31
Table
14 — Market
Price/Dividend History
|
2009
|
2008
|
2007
|
||||||||||||||||||||||
|
Common Stock
|
Dividends
|
Common Stock
|
Dividends
|
Common Stock
|
Dividends
|
|||||||||||||||||||
|
High/Low
|
Paid
|
High/Low
|
Paid
|
High/Low
|
Paid
|
|||||||||||||||||||
|
First
Quarter
|
$ | 17.50/$14.01 | $ | .23 | $ | 18.00/$15.25 | $ | .22 | $ | 19.00/$17.50 | $ | .22 | ||||||||||||
|
Second
Quarter
|
$ | 16.55/$15.25 | .23 | $ | 18.00/$14.25 | .22 | $ | 21.75/$17.90 | .22 | |||||||||||||||
|
Third
Quarter
|
$ | 16.55/$15.00 | .23 | $ | 18.00/$15.50 | .22 | $ | 19.25/$17.00 | .22 | |||||||||||||||
|
Fourth
Quarter
|
$ | 17.95/$14.55 | .23 | $ | 16.00/$13.50 | .23 | $ | 18.25/$15.80 | .22 | |||||||||||||||
Table
15 — Quarterly
Results of Operations (Unaudited)
(Amounts
in thousands, except per share)
|
Three Months Ended
|
||||||||||||||||
|
2009
|
March 31
|
June 30
|
September 30
|
December 31
|
||||||||||||
|
Interest
income
|
$ | 9,363 | $ | 9,406 | $ | 9,253 | $ | 9,524 | ||||||||
|
Interest
expense
|
4,035 | 3,950 | 3,898 | 3,682 | ||||||||||||
|
Net
interest income
|
$ | 5,328 | $ | 5,456 | $ | 5,355 | $ | 5,842 | ||||||||
|
Provision
for loan losses
|
275 | 175 | 150 | 200 | ||||||||||||
|
Other
non-interest income
|
1,036 | 1,310 | 1,073 | 1,175 | ||||||||||||
|
Non-interest
expense
|
3,516 | 4,160 | 3,708 | 5,175 | ||||||||||||
|
Income
before income taxes
|
$ | 2,573 | $ | 2,431 | $ | 2,570 | $ | 1,642 | ||||||||
|
Income
taxes
|
471 | 268 | 484 | 56 | ||||||||||||
|
Net
income
|
$ | 2,102 | $ | 2,163 | $ | 2,086 | $ | 1,586 | ||||||||
|
Per
share
|
$ | .39 | $ | .39 | $ | .39 | $ | .29 | ||||||||
|
2008
|
March 31
|
June 30
|
September 30
|
December 31
|
||||||||||||
|
Interest
income
|
$ | 9,351 | $ | 9,267 | $ | 9,491 | $ | 9,529 | ||||||||
|
Interest
expense
|
4,853 | 4,546 | 4,399 | 4,318 | ||||||||||||
|
Net
interest income
|
$ | 4,498 | $ | 4,721 | $ | 5,092 | $ | 5,211 | ||||||||
|
Provision
for loan losses
|
50 | 75 | 75 | 500 | ||||||||||||
|
Other
non-interest income
|
1,105 | 998 | 1,130 | 813 | ||||||||||||
|
Non-interest
expense
|
3,450 | 3,348 | 3,446 | 3,679 | ||||||||||||
|
Income
before income taxes
|
$ | 2,103 | $ | 2,296 | $ | 2,701 | $ | 1,845 | ||||||||
|
Income
taxes
|
381 | 410 | 474 | 129 | ||||||||||||
|
Net
income
|
$ | 1,722 | $ | 1,886 | $ | 2,227 | $ | 1,716 | ||||||||
|
Per
share
|
$ | .32 | $ | .34 | $ | .41 | $ | .32 | ||||||||
ITEM
7A. QUANTITATIVE AND QUALITATIVE DISCLOSURE ABOUT
MARKET RISK
Information
with respect to quantitative and qualitative disclosures about market risk is
included in the information under Management’s
Discussion and Analysis in Item 7 hereof.
32
ITEM
8. FINANCIAL STATEMENTS AND
SUPPLEMENTARY DATA
REPORT OF INDEPENDENT
REGISTERED PUBLIC ACCOUNTING FIRM
BOARD OF
DIRECTORS AND STOCKHOLDERS OF FIRST KEYSTONE CORPORATION:
We have
audited the accompanying consolidated balance sheets of First Keystone
Corporation and Subsidiary as of December 31, 2009 and 2008, and the related
consolidated statements of income, changes in stockholders’
equity, and cash flows for each of the years in the three-year period ended
December 31, 2009. These consolidated financial statements are the
responsibility of the Corporation’s
management. Our responsibility is to express an opinion on these
consolidated financial statements based on our audits.
We
conducted our audits in accordance with the standards of the Public Company
Accounting Oversight Board (United States). Those standards require that we plan
and perform the audit to obtain reasonable assurance about whether the
consolidated financial statements are free of material
misstatement. An audit includes examining, on a test basis, evidence
supporting the amounts and disclosures in the consolidated financial
statements. An audit also includes assessing the accounting
principles used and significant estimates made by management, as well as
evaluating the overall consolidated financial statement
presentation. We believe that our audits provide a reasonable basis
for our opinion.
In our
opinion, the consolidated financial statements referred to above present fairly,
in all material respects, the consolidated financial position of First Keystone
Corporation and Subsidiary as of December 31, 2009 and 2008, and the
consolidated results of their operations and their cash flows for each of the
years in the three-year period ended December 31, 2009, in conformity with
accounting principles generally accepted in the United States of
America.
We have
also audited, in accordance with the standards of the Public Company Accounting
Oversight Board (United States) the effectiveness of First Keystone Corporation
and Subsidiary’s
internal control over financial reporting as of December 31, 2009, based on
criteria established in Internal
Control-Integrated Framework issued by the Committee of Sponsoring
Organizations of the Treadway Commission (COSO) and our report dated March 12,
2010, expressed an unqualified opinion thereon.
|
/s/ J. H. Williams & Co.,
LLP
|
||
|
J.
H. Williams & Co.,
LLP
|
||
Kingston,
Pennsylvania
March 12,
2010
33
FIRST
KEYSTONE CORPORATION AND SUBSIDIARY
CONSOLIDATED
BALANCE SHEETS
|
(Amounts in thousands)
|
December 31,
|
|||||||
|
2009
|
2008
|
|||||||
|
ASSETS
|
||||||||
|
Cash
and due from banks
|
$ | 4,199 | $ | 9,945 | ||||
|
Interest-bearing
deposits in other banks
|
7,227 | 6 | ||||||
|
Investment
securities available-for-sale
|
269,685 | 233,497 | ||||||
|
Investment
securities held-to-maturity (estimated fair value 2009 - $4,936; 2008 -
$2,906)
|
4,974 | 2,990 | ||||||
|
Restricted
securities at cost
|
8,139 | 6,678 | ||||||
|
Loans,
net of unearned income
|
406,697 | 408,367 | ||||||
|
Allowance
for loan losses
|
(5,322 | ) | (5,195 | ) | ||||
|
Net
loans
|
$ | 401,375 | $ | 403,172 | ||||
|
Premises
and equipment, net
|
11,465 | 9,169 | ||||||
|
Accrued
interest receivable
|
4,213 | 4,228 | ||||||
|
Cash
surrender value of bank owned life insurance
|
17,622 | 17,157 | ||||||
|
Goodwill
|
19,133 | 19,133 | ||||||
|
Prepaid
FDIC insurance
|
2,780 | 0 | ||||||
|
Other
assets
|
7,518 | 8,923 | ||||||
|
TOTAL
ASSETS
|
$ | 758,330 | $ | 714,898 | ||||
|
LIABILITIES
|
||||||||
|
Deposits:
|
||||||||
|
Non-interest
bearing
|
$ | 61,779 | $ | 58,178 | ||||
|
Interest
bearing
|
518,790 | 446,455 | ||||||
|
Total
Deposits
|
580,569 | 504,633 | ||||||
|
Short-term
borrowings
|
17,462 | 55,332 | ||||||
|
Long-term
borrowings
|
82,976 | 82,062 | ||||||
|
Accrued
interest and other expenses
|
3,101 | 3,488 | ||||||
|
Other
liabilities
|
55 | 236 | ||||||
|
TOTAL
LIABILITIES
|
$ | 684,163 | $ | 645,751 | ||||
|
STOCKHOLDERS'
EQUITY
|
||||||||
|
Preferred
stock, par value $10.00 per share; authorized and unissued 500,000
shares
|
$ | — | $ | — | ||||
|
Common
stock, par value $2.00 per share; authorized 10,000,00shares; issued
5,687,767 in 2009 and 2008
|
11,375 | 11,375 | ||||||
|
Surplus
|
30,269 | 30,269 | ||||||
|
Retained
earnings
|
41,346 | 38,414 | ||||||
|
Accumulated
other comprehensive (loss)
|
(2,583 | ) | (4,671 | ) | ||||
|
Treasury
stock, at cost, 247,641 shares in 2009 and 2008
|
(6,240 | ) | (6,240 | ) | ||||
|
TOTAL
STOCKHOLDERS' EQUITY
|
$ | 74,167 | $ | 69,147 | ||||
|
TOTAL
LIABILITIES AND STOCKHOLDERS' EQUITY
|
$ | 758,330 | $ | 714,898 | ||||
The
accompanying notes are an integral part of these consolidated financial
statements.
34
FIRST
KEYSTONE CORPORATION AND SUBSIDIARY
CONSOLIDATED
STATEMENTS OF INCOME
|
(Amounts in thousands, except per share data)
|
Year Ended December 31,
|
|||||||||||
|
2009
|
2008
|
2007
|
||||||||||
|
INTEREST
INCOME
|
||||||||||||
|
Interest
and fees on loans
|
$ | 24,819 | $ | 25,408 | $ | 19,049 | ||||||
|
Interest
and dividends on investment securities:
|
||||||||||||
|
Taxable
|
9,218 | 8,367 | 9,484 | |||||||||
|
Tax-exempt
|
3,550 | 3,514 | 2,860 | |||||||||
|
Dividends
|
130 | 256 | 409 | |||||||||
|
Deposits
in banks
|
9 | 79 | 66 | |||||||||
|
Federal
funds sold
|
— | 14 | 31 | |||||||||
|
Total
interest income
|
$ | 37,726 | $ | 37,638 | $ | 31,899 | ||||||
|
INTEREST
EXPENSE
|
||||||||||||
|
Deposits
|
$ | 11,364 | $ | 13,908 | $ | 13,557 | ||||||
|
Short-term
borrowings
|
371 | 669 | 1,327 | |||||||||
|
Long-term
borrowings
|
3,830 | 3,539 | 2,901 | |||||||||
|
Total
interest expense
|
$ | 15,565 | $ | 18,116 | $ | 17,785 | ||||||
|
Net
interest income
|
$ | 22,161 | $ | 19,522 | $ | 14,114 | ||||||
|
Provision
for loan losses
|
800 | 700 | 150 | |||||||||
|
Net
interest income after provision for loan losses
|
$ | 21,361 | $ | 18,822 | $ | 13,964 | ||||||
|
NON-INTEREST
INCOME
|
||||||||||||
|
Trust
department
|
$ | 475 | $ | 530 | $ | 581 | ||||||
|
Service
charges and fees
|
1,662 | 1,828 | 1,613 | |||||||||
|
Bank
owned life insurance income
|
748 | 707 | 558 | |||||||||
|
ATM
fees and debit card income
|
689 | 627 | 570 | |||||||||
|
Gain
on sale of loans
|
300 | 136 | 89 | |||||||||
|
Investment
securities gains (losses) - net
|
(138 | ) | (148 | ) | 483 | |||||||
|
Other
|
563 | 366 | 305 | |||||||||
|
Total
non-interest income
|
$ | 4,299 | $ | 4,046 | $ | 4,199 | ||||||
|
NON-INTEREST
EXPENSE
|
||||||||||||
|
Salaries
and employee benefits
|
$ | 8,056 | $ | 7,350 | $ | 5,576 | ||||||
|
Occupancy,
net
|
1,170 | 1,064 | 758 | |||||||||
|
Furniture
and equipment
|
1,146 | 936 | 764 | |||||||||
|
Professional
services
|
608 | 534 | 443 | |||||||||
|
State
shares tax
|
697 | 683 | 572 | |||||||||
|
FDIC
insurance
|
1,184 | 219 | 41 | |||||||||
|
Loss
due to defalcation
|
850 | — | — | |||||||||
|
Other
|
2,733 | 3,137 | 2,491 | |||||||||
|
Total
non-interest expense
|
$ | 16,444 | $ | 13,923 | $ | 10,645 | ||||||
|
Income
before income taxes
|
$ | 9,216 | $ | 8,945 | $ | 7,518 | ||||||
|
Income
tax expense
|
1,279 | 1,394 | 1,391 | |||||||||
|
NET
INCOME
|
$ | 7,937 | $ | 7,551 | $ | 6,127 | ||||||
|
PER
SHARE DATA
|
||||||||||||
|
Net
income per share:
|
||||||||||||
|
Basic
|
$ | 1.46 | $ | 1.39 | $ | 1.31 | ||||||
|
Diluted
|
$ | 1.46 | $ | 1.39 | $ | 1.31 | ||||||
|
Cash
dividends per share
|
$ | .92 | $ | .89 | $ | .88 | ||||||
The
accompanying notes are an integral part of these consolidated financial
statements.
35
FIRST
KEYSTONE CORPORATION AND SUBSIDIARY
CONSOLIDATED
STATEMENTS OF CHANGES IN STOCKHOLDERS' EQUITY
(Amounts
in thousands, except per share data)
|
Accumulated
|
||||||||||||||||||||||||||||
|
Other
|
||||||||||||||||||||||||||||
|
Common
|
Comprehensive
|
Retained
|
Comprehensive
|
Treasury
|
||||||||||||||||||||||||
|
Stock
|
Surplus
|
Income
|
Earnings
|
Income (Loss)
|
Stock
|
Total
|
||||||||||||||||||||||
|
Balance
At December 31, 2006
|
$ | 9,511 | $ | 16,119 | $ | 33,793 | $ | (126 | ) | $ | (5,910 | ) | $ | 53,387 | ||||||||||||||
|
Comprehensive
Income:
|
||||||||||||||||||||||||||||
|
Net
Income
|
$ | 6,127 | 6,127 | 6,127 | ||||||||||||||||||||||||
|
Change
in net unrealized (loss) on investment securities available-for- sale, net
of reclassification adjustment and tax effects
|
(40 | ) | (40 | ) | (40 | ) | ||||||||||||||||||||||
|
Total
comprehensive income
|
$ | 6,087 | ||||||||||||||||||||||||||
|
Purchase
of 18,791 shares of treasury stock
|
(332 | ) | (332 | ) | ||||||||||||||||||||||||
|
Issuance
of 932,203 shares pursuant to acquisition
|
1,864 | 14,132 | 15,996 | |||||||||||||||||||||||||
|
Cumulative
effect of change in accounting for deferred compensation endorsement
split-dollar life insurance arrangements
|
(36 | ) | (36 | ) | ||||||||||||||||||||||||
|
Recognition
of stock option expense
|
1 | 1 | ||||||||||||||||||||||||||
|
Cash
dividends - $.88 per share
|
(4,179 | ) | (4,179 | ) | ||||||||||||||||||||||||
|
Balance
at December 31, 2007
|
$ | 11,375 | $ | 30,252 | $ | 35,705 | $ | (166 | ) | $ | (6,242 | ) | $ | 70,924 | ||||||||||||||
|
Comprehensive
Income:
|
||||||||||||||||||||||||||||
|
Net
Income
|
$ | 7,551 | 7,551 | 7,551 | ||||||||||||||||||||||||
|
Change
in net unrealized (loss) on investment securities available-for- sale, net
of reclassification adjustment and tax effects
|
(4,505 | ) | (4,505 | ) | (4,505 | ) | ||||||||||||||||||||||
|
Total
comprehensive income
|
$ | 3,046 | ||||||||||||||||||||||||||
|
Issuance
of 50 shares of treasury stock upon exercise of employee stock
options
|
(1 | ) | 2 | 1 | ||||||||||||||||||||||||
|
Recognition
of stock option expense
|
18 | 18 | ||||||||||||||||||||||||||
|
Cash
dividends - $.89 per share
|
(4,842 | ) | (4,842 | ) | ||||||||||||||||||||||||
|
Balance
at December 31, 2008
|
$ | 11,375 | $ | 30,269 | $ | 38,414 | $ | (4,671 | ) | $ | (6,240 | ) | $ | 69,147 | ||||||||||||||
|
Comprehensive
Income:
|
||||||||||||||||||||||||||||
|
Net
Income
|
$ | 7,937 | 7,937 | 7,937 | ||||||||||||||||||||||||
|
Change
in net unrealized (loss) on investment securities available-for- sale, net
of reclassification adjustment and tax effects
|
2,088 | 2,088 | 2,088 | |||||||||||||||||||||||||
|
Total
comprehensive income
|
$ | 10,025 | ||||||||||||||||||||||||||
|
Cash
dividends - $.92 per share
|
(5,005 | ) | (5,005 | ) | ||||||||||||||||||||||||
|
Balance
at December 31, 2009
|
$ | 11,375 | $ | 30,269 | $ | 41,346 | $ | (2,583 | ) | $ | (6,240 | ) | $ | 74,167 | ||||||||||||||
The accompanying notes are an integral
part of these consolidated financial statements.
36
FIRST
KEYSTONE CORPORATION AND SUBSIDIARY
CONSOLIDATED
STATEMENTS OF CASH FLOWS
|
(Amounts in thousands)
|
Year Ended December 31,
|
|||||||||||
|
OPERATING
ACTIVITIES
|
2009
|
2008
|
2007
|
|||||||||
|
Net
income
|
$ | 7,937 | $ | 7,551 | $ | 6,127 | ||||||
|
Adjustments
to reconcile net income to net cash provided by (used in) operating
activities:
|
||||||||||||
|
Provision
for loan losses
|
800 | 700 | 150 | |||||||||
|
Depreciation
and amortization
|
762 | 710 | 663 | |||||||||
|
Stock
option expense
|
— | 18 | 1 | |||||||||
|
Premium
amortization on investment securities
|
322 | 95 | 120 | |||||||||
|
Discount
accretion on investment securities
|
(1,228 | ) | (677 | ) | (549 | ) | ||||||
|
Impairment
loss on investment securities
|
— | 437 | — | |||||||||
|
Core
deposit discount amortization net of accretion
|
269 | 181 | (35 | ) | ||||||||
|
Deferred
income tax benefit
|
(166 | ) | (471 | ) | (104 | ) | ||||||
|
Gain
on sale of mortgage loans originated for resale
|
(300 | ) | (136 | ) | (89 | ) | ||||||
|
Proceeds
from sale of mortgage loans originated for resale
|
20,130 | 8,992 | 7,467 | |||||||||
|
Originations
of mortgage loans originated for resale
|
(27,402 | ) | (12,218 | ) | (4,035 | ) | ||||||
|
(Gain)
loss on sales of investment securities
|
138 | (289 | ) | (483 | ) | |||||||
|
Gain
on sale of foreclosed real estate
|
(9 | ) | (31 | ) | — | |||||||
|
(Increase)
decrease in accrued interest receivable
|
15 | (987 | ) | 41 | ||||||||
|
Increase
in cash surrender value of bank owned life insurance
|
(748 | ) | (707 | ) | (558 | ) | ||||||
|
(Increase)
decrease in other assets - net
|
107 | (104 | ) | (143 | ) | |||||||
|
(Increase)
in prepaid FDIC insurance
|
(2,780 | ) | — | — | ||||||||
|
Increase
(decrease) in accrued interest and other expenses
|
(387 | ) | 32 | 734 | ||||||||
|
Increase
(decrease) in other liabilities - net
|
(181 | ) | 85 | 5 | ||||||||
|
Loss
from sale of premises and equipment
|
— | — | 3 | |||||||||
|
NET
CASH PROVIDED (USED IN) BY OPERATING ACTIVITIES
|
$ | (2,721 | ) | $ | 3,181 | $ | 9,315 | |||||
|
INVESTING
ACTIVITIES
|
||||||||||||
|
Proceeds
from sales of investment securities available-for-sale
|
$ | 82,407 | $ | 80,025 | $ | 79,828 | ||||||
|
Proceeds
from maturities and redemption of investment securities
available-for-sale
|
19,672 | 36,148 | 22,874 | |||||||||
|
Purchases
of investment securities available-for-sale
|
(134,338 | ) | (120,676 | ) | (93,968 | ) | ||||||
|
Proceeds
from maturities and redemption of investment securities
held-to-maturity
|
2,017 | 2,015 | 2,012 | |||||||||
|
Proceeds
from sales of investment securities held-to-maturity
|
— | — | 375 | |||||||||
|
Purchases
of investment securities held-to-maturity
|
(4,000 | ) | (467 | ) | — | |||||||
|
Proceeds
from sales of restricted securities
|
— | 3,601 | 3,427 | |||||||||
|
Purchases
of restricted securities
|
(1,461 | ) | (4,171 | ) | (2,820 | ) | ||||||
|
Proceeds
from bank owned life insurance
|
530 | — | — | |||||||||
|
Net
(increase) decrease in loans
|
7,920 | (29,184 | ) | (22,277 | ) | |||||||
|
Purchases
of premises and equipment
|
(3,023 | ) | (1,476 | ) | (692 | ) | ||||||
|
Purchase
of investment in real estate venture
|
— | (18 | ) | (485 | ) | |||||||
|
Purchase
of bank net of cash acquired
|
— | — | (13,626 | ) | ||||||||
|
Proceeds
from sales of premises and equipment
|
— | — | 2 | |||||||||
|
Purchase
of bank owned life insurance
|
— | — | (1,000 | ) | ||||||||
|
Proceeds
from sale of foreclosed real estate
|
441 | 384 | 41 | |||||||||
|
Decrease
in other liabilities related to acquisition
|
— | (152 | ) | — | ||||||||
|
NET
CASH (USED IN) INVESTING ACTIVITIES
|
$ | (29,835 | ) | $ | (33,971 | ) | $ | (26,309 | ) | |||
|
FINANCING
ACTIVITIES
|
||||||||||||
|
Net
increase (decrease) in deposits
|
$ | 75,957 | $ | 11,701 | $ | (616 | ) | |||||
|
Net
increase (decrease) in short-term borrowings
|
(37,870 | ) | 7,983 | 17,170 | ||||||||
|
Proceeds
from long-term borrowings
|
13,000 | 25,000 | 15,000 | |||||||||
|
Repayment
of long-term borrowings
|
(12,051 | ) | (9,077 | ) | (10,262 | ) | ||||||
|
Proceeds
from sale of treasury stock
|
— | 1 | — | |||||||||
|
Acquisition
of treasury stock
|
— | — | (332 | ) | ||||||||
|
Cash
dividends paid
|
(5,005 | ) | (4,842 | ) | (4,179 | ) | ||||||
|
NET
CASH PROVIDED BY FINANCING ACTIVITIES
|
$ | 34,031 | $ | 30,766 | $ | 16,781 | ||||||
|
INCREASE
(DECREASE) IN CASH AND CASH EQUIVALENTS
|
$ | 1,475 | $ | (24 | ) | $ | (213 | ) | ||||
|
CASH
AND CASH EQUIVALENTS AT BEGINNING OF YEAR
|
9,951 | 9,975 | 10,188 | |||||||||
|
CASH
AND CASH EQUIVALENTS AT END OF YEAR
|
$ | 11,426 | $ | 9,951 | $ | 9,975 | ||||||
The
accompanying notes are an integral part of these consolidated financial
statements.
37
FIRST
KEYSTONE CORPORATION AND SUBSIDIARY
Notes
to Consolidated Financial Statements for the Years Ended December 31, 2009, 2008
and 2007
NOTE 1 — SUMMARY OF SIGNIFICANT ACCOUNTING
POLICIES
The
accounting policies of First Keystone Corporation and Subsidiary (the “Corporation”)
are in accordance with accounting principles generally accepted in the United
States of America and conform to common practices within the banking industry.
The more significant policies follow:
Principles
of Consolidation
The
consolidated financial statements include the accounts of First Keystone
Corporation and its wholly-owned Subsidiary, First Keystone National Bank (the
“Bank”).
All significant inter-company balances and transactions have been eliminated in
consolidation.
Nature
of Operations
The
Corporation, headquartered in Berwick, Pennsylvania, provides a full range of
banking, trust and related services through its wholly-owned Bank subsidiary and
is subject to competition from other financial institutions in connection with
these services. The Bank serves a customer base which includes individuals,
businesses, public and institutional customers primarily located in the
Northeast Region of Pennsylvania. The Bank has 15 full service offices and 17
ATMs located in Columbia, Luzerne, Montour and Monroe Counties. The Corporation
and its subsidiary must also adhere to certain federal banking laws and
regulations and are subject to periodic examinations made by various federal
agencies.
Segment
Reporting
The
Corporation's banking subsidiary acts as an independent community financial
services provider, and offers traditional banking and related financial services
to individual, business and government customers. Through its branch and
automated teller machine network, the Bank offers a full array of commercial and
retail financial services, including the taking of time, savings and demand
deposits; the making of commercial, consumer and mortgage loans; and the
providing of other financial services. The Bank also performs personal,
corporate, pension and fiduciary services through its Trust
Department.
Management
does not separately allocate expenses, including the cost of funding loan
demand, between the commercial, retail, trust and mortgage banking operations of
the Corporation. Currently, management measures the performance and allocates
the resources of First Keystone Corporation as a single segment.
Use
of Estimates
The
preparation of these consolidated financial statements in conformity with
accounting principles generally accepted in the United States of America,
requires management to make estimates and assumptions that affect the reported
amounts of assets and liabilities and disclosure of contingent assets and
liabilities at the date of these consolidated financial statements and the
reported amounts of income and expenses during the reporting periods. Actual
results could differ from those estimates.
Investment
Securities
The
Corporation classifies its investment securities as either “Held-to-Maturity”
or “Available-for-Sale”
at the time of purchase. Debt securities are classified as Held-to-Maturity when
the Corporation has the ability and positive intent to hold the securities to
maturity. Investment securities Held-to-Maturity are carried at cost adjusted
for amortization of premium and accretion of discount to maturity.
Debt
securities not classified as Held-to-Maturity and equity securities are included
in the Available-for-Sale category and are carried at fair value. The amount of
any unrealized gain or loss, net of the effect of deferred income taxes, is
reported as other comprehensive income (loss) in the Consolidated Statement of
Changes in Stockholders’
Equity. Management's decision to sell Available-for-Sale securities is based on
changes in economic conditions controlling the sources and applications of
funds, terms, availability of and yield of alternative investments, interest
rate risk and the need for liquidity.
38
FIRST
KEYSTONE CORPORATION AND SUBSIDIARY
Notes
to Consolidated Financial Statements for the Years Ended December 31, 2009, 2008
and 2007
The cost
of debt securities classified as Held-to-Maturity or Available-for-Sale is
adjusted for amortization of premiums and accretion of discounts to expected
maturity. Such amortization and accretion, as well as interest and dividends is
included in interest income from investments. Realized gains and losses are
included in net investment securities gains and losses. The cost of investment
securities sold, redeemed or matured is based on the specific identification
method.
Restricted
Securities
Restricted
equity securities consist of stock in Federal Home Loan Bank of Pittsburgh
(“FHLB-Pittsburgh”), Atlantic
Central Bankers Bank (“ACBB”) and Federal
Reserve Bank and do not have a readily determinable fair value because their
ownership is restricted, and they can be sold back only to the FHLB-Pittsburgh,
ACBB, the Federal Reserve Bank or to another member institution. Therefore,
these securities are classified as restricted equity investment securities,
carried at cost, and evaluated for impairment. At December 31, 2009, the
Corporation held $6,661,000 in stock of FHLB-Pittsburgh, $35,000 in stock of
ACBB and $1,443,000 in stock of Federal Reserve Bank. At December 31, 2008, the
Corporation held $5,868,000 in stock of the FHLB-Pittsburgh, $35,000 in stock of
ACBB and $775,000 in stock of the Federal Reserve Bank.
The
Corporation evaluated its holding of restricted stock for impairment and deemed
the stock to not be impaired due to the expected recoverability of cost, which
equals the value reflected within the Corporation’s consolidated
financial statements. The decision was based on several items ranging from the
estimated true economic losses embedded within FHLB’s mortgage
portfolio to the FHLB’s liquidity
position and credit rating. The Corporation utilizes the impairment framework
outlined in GAAP to evaluate stock for impairment. The following factors were
evaluated to determine the ultimate recoverability of the cost of the
Corporation’s
restricted stock holdings; (i) the significance of the decline in net assets of
the FHLB as compared to the capital stock amount for the FHLB and the length of
time this situation has persisted; (ii) commitments by the FHLB to make payments
required by law or regulation and the level of such payments in relation to the
operating performance of the FHLB; (iii) the impact of legislative and
regulatory changes on the institutions and, accordingly, on the customer base of
the FHLB; (iv) the liquidity position of the FHLB; and (v) whether a decline is
temporary or whether it affects the ultimate recoverability of the FHLB stock
based on (a) the materiality of the carrying amount to the member institution
and (b) whether an assessment of the institution’s operational
needs for the foreseeable future allow management to dispose of the stock. Based
on the analysis of these factors, the Corporation determined that its holdings
of restricted stock were not impaired at December 31, 2009 and
2008.
Loans
Loans are
stated at their outstanding unpaid principal balances, net of deferred fees or
costs, unearned income and the allowance for loan losses. Interest on
installment loans is recognized as income over the term of each loan, generally,
by the actuarial method. Interest on all other loans is primarily recognized
based upon the principal amount outstanding on an actual day basis. Loan
origination fees and certain direct loan origination costs have been deferred
with the net amount amortized using the interest method over the contractual
life of the related loans as an interest yield adjustment.
Mortgage
loans held for resale are carried at the lower of cost or market on an aggregate
basis. These loans are sold without recourse to the Corporation.
Past-Due
Loans — Generally,
a loan is considered to be past-due when scheduled loan payments are in arrears
15 days or more. Delinquent notices are generated automatically when a loan is
15 days past-due. Collection efforts continue on loans past-due beyond 60 days
that have not been satisfied, when it is believed that some chance exists for
improvement in the status of the loan. Past-due loans are continually evaluated
with the determination for charge-off being made when no reasonable chance
remains that the status of the loan can be improved.
Non-Accrual
Loans — Generally,
a loan is classified as non-accrual and the accrual of interest on such a loan
is discontinued when the contractual payment of principal or interest has become
90 days past due or management has serious doubts about further collectibility
of principal or interest, even though the loan currently is performing. A loan
may remain on accrual status if it is in the process of collection and is either
guaranteed or well secured. When a loan is placed on non-accrual status, unpaid
interest credited to income in the current year is reversed and unpaid interest
accrued in prior years is charged against the allowance for loan
losses.
39
FIRST
KEYSTONE CORPORATION AND SUBSIDIARY
Notes
to Consolidated Financial Statements for the Years Ended December 31, 2009, 2008
and 2007
Certain
non-accrual loans may continue to perform, that is, payments are still being
received. Generally, the payments are applied to principal. These loans remain
under constant scrutiny and if performance continues, interest income may be
recorded on a cash basis based on management's judgement as to collectibility of
principal.
Allowance
for Loan Losses —
The allowance for loan losses is established through provisions for loan losses
charged against income. Loans deemed to be uncollectible are charged against the
allowance for loan losses and subsequent recoveries, if any, are credited to the
allowance.
A
principal factor in estimating the allowance for loan losses is the measurement
of impaired loans. A loan is considered impaired when, based on current
information and events, it is probable that the Corporation will be unable to
collect all amounts due according to the contractual terms of the loan
agreement. Under current accounting standards, the allowance for loan losses
related to impaired loans is based on discounted cash flows using the effective
interest rate of the loan or the fair value of the collateral for certain
collateral dependent loans.
The
allowance for loan losses is maintained at a level estimated by management to be
adequate to absorb potential loan losses. Management's periodic evaluation of
the adequacy of the allowance for loan losses is based on the Corporation's past
loan loss experience, known and inherent risks in the portfolio, adverse
situations that may affect the borrower's ability to repay (including the timing
of future payments), the estimated value of any underlying collateral,
composition of the loan portfolio, current economic conditions, and other
relevant factors. This evaluation is inherently subjective as it requires
material estimates including the amounts and timing of future cash flows
expected to be received on impaired loans that may be susceptible to significant
change.
Premises
and Equipment
Premises,
improvements, and equipment are stated at cost less accumulated depreciation
computed principally utilizing the straight-line method over the estimated
useful lives of the assets. Long-lived assets are reviewed for impairment
whenever events or changes in business circumstances indicate that the carrying
value may not be recovered. Maintenance and minor repairs are charged
to operations as incurred. The cost and accumulated depreciation of the premises
and equipment retired or sold are eliminated from the property accounts at the
time of retirement or sale, and the resulting gain or loss is reflected in
current operations.
Mortgage
Servicing Rights
The
Corporation originates and sells real estate loans to investors in the secondary
mortgage market. After the sale, the Corporation may retain the right to service
these loans. When originated mortgage loans are sold and servicing is retained,
a servicing asset is capitalized based on relative fair value at the date of
sale. Servicing assets are amortized as an offset to other fees in proportion
to, and over the period of, estimated net servicing income. The unamortized cost
is included in other assets in the accompanying consolidated balance sheet. The
servicing rights are periodically evaluated for impairment based on their
relative fair value.
Foreclosed
Real Estate
Real
estate properties acquired through, or in lieu of, loan foreclosure are held for
sale and are initially recorded at fair value on the date of foreclosure
establishing a new cost basis. After foreclosure, valuations are periodically
performed by management and the real estate is carried at the lower of carrying
amount or fair value less cost to sell and is included in other assets. Revenues
derived from and costs to maintain the assets and subsequent gains and losses on
sales are included in other non-interest income and expense. The
total of foreclosed real estate properties included in other assets amounted to
$330,000 and $28,000 at December 31, 2009 and 2008, respectively.
Bank
Owned Life Insurance
The
Corporation invests in Bank Owned Life Insurance (BOLI) with split dollar life
provisions. Purchase of BOLI provides life insurance coverage on
certain employees with the Corporation being owner and beneficiary of the
policies.
40
FIRST
KEYSTONE CORPORATION AND SUBSIDIARY
Notes
to Consolidated Financial Statements for the Years Ended December 31, 2009, 2008
and 2007
Investments
in Real Estate Ventures
The Bank
is a limited partner in real estate ventures that own and operate
affordable residential low-income housing apartment buildings for elderly
residents. The investments are accounted for under the effective yield method.
Under the effective yield method, the Bank recognizes tax credits as they are
allocated and amortizes the initial cost of the investment to provide a constant
effective yield over the period that the tax credits are allocated to the
Bank. Under this method, the tax credits allocated, net of any
amortization of the investment in the limited partnerships, are recognized in
the consolidated statements of income as a component of income tax
expense. The amount of tax credits allocated to the Bank were
$187,000 in 2009, $187,000 in 2008 and $151,000 in 2007, and the amortization of
the investments in the limited partnerships were $154,000, $148,000 and $108,000
in 2009, 2008 and 2007, respectively. The carrying value of the
investments as of December 31, 2009, 2008 and 2007, were $690,000, $844,000 and
$975,000, respectively, and is included in other assets in the accompanying
consolidated balance sheets.
Income
Taxes
The
provision for income taxes is based on the results of operations, adjusted
primarily for tax-exempt income. Certain items of income and expense are
reported in different periods for financial reporting and tax return purposes.
Deferred tax assets and liabilities are determined based on the differences
between the consolidated financial statement and income tax bases of assets and
liabilities measured by using the enacted tax rates and laws expected to be in
effect when the timing differences are expected to reverse. Deferred tax expense
or benefit is based on the difference between deferred tax asset or liability
from period to period.
Goodwill,
Other Intangible Assets, and Premium Discount
Goodwill
resulted from the acquisition of the Pocono Community Bank in November 2007 (See
Note 2) and of certain fixed and operating assets acquired and deposit
liabilities assumed of the branch of another financial institution in Danville,
Pennsylvania, in January 2004. Such goodwill represents the excess
cost of the acquired assets relative to the assets fair value at the dates of
acquisition. During the first quarter of 2008, $152,000 of liabilities were
recorded related to the Pocono acquisition as a purchase accounting adjustment
resulting in an increase in the excess purchase price. The amount was comprised
of the finalization of severance agreements and contract terminations related to
the acquisition. In accordance with current accounting standards, goodwill is
not amortized. Management performs an annual evaluation for impairment. Any
impairment of goodwill results in a charge to income. The Corporation
periodically assesses whether events or changes in circumstances indicate that
the carrying amounts of goodwill and other intangible assets may be impaired.
Goodwill is tested for impairment at the reporting unit level and an impairment
loss is recorded to the extent that the carrying amount of goodwill exceeds its
implied fair value. The Corporation has tested the goodwill included in its
consolidated balance sheet at December 31, 2009, and has determined there was no
impairment as of that date. No assurance can be given that future impairment
tests will not result in a charge to earnings.
Intangible
assets are comprised of core deposit intangibles and premium discount (negative
premium) on certificates of deposit acquired. The core deposit
intangible is being amortized over the average life of the deposits acquired as
determined by an independent third party. Premium discount (negative
premium) on acquired certificates of deposit resulted from the valuation of
certificate of deposit accounts by an independent third party. The
book value of certificates of deposit acquired was greater than their fair value
at the date of acquisition which resulted in a negative premium due to higher
cost of the certificates of deposit compared to the cost of similar term
financing.
Stock
Based Compensation
The
Corporation sponsors a stock option plan (see Note 21). Compensation cost is
recognized for stock options to employees based on the fair value of these
awards at the date of grant. A Black-Scholes model is utilized to estimate the
fair value of stock options. Compensation expense is recognized over the
requisite service period.
41
FIRST
KEYSTONE CORPORATION AND SUBSIDIARY
Notes
to Consolidated Financial Statements for the Years Ended December 31, 2009, 2008
and 2007
Per
Share Data
FASB ASC
260-10 Earnings Per Share ((SFAS) No. 128, “Earnings
Per Share”),
requires dual presentation of basic and fully diluted earnings per share. Basic
earnings per share is calculated by dividing net income by the weighted average
number of shares of common stock outstanding at the end of each period. Diluted
earnings per share is calculated by increasing the denominator for the assumed
conversion of all potentially dilutive securities. The Corporation's dilutive
securities are limited to stock options. The most recent options
issued were in December 2007.
Per share
data has been adjusted retroactively for stock splits and stock
dividends. The reconciliation of the numerators and denominators of
the basic and diluted earnings per share follows:
|
Year Ended December 31, 2009
|
||||||||||||
|
Weighted
Average
|
||||||||||||
|
Net Income
|
Number
of Shares
|
Per
Share
|
||||||||||
|
Numerators
|
Denominators
|
Amount
|
||||||||||
|
Net
income
|
$ | 7,937 | ||||||||||
|
Basic
earnings per share:
|
||||||||||||
|
Income
available to common stockholders
|
$ | 7,937 | 5,440 | $ | 1.46 | |||||||
|
Effect
of dilutive securities:
|
||||||||||||
|
Stock
options
|
2 | |||||||||||
|
Diluted
earnings per share:
|
||||||||||||
|
Income
available to common stockholders
|
$ | 7,937 | 5,442 | $ | 1.46 | |||||||
|
Year Ended December 31,
2008
|
||||||||||||
|
Weighted Average
|
||||||||||||
|
Net Income
|
Number of Shares
|
Per Share
|
||||||||||
|
Numerators
|
Denominators
|
Amount
|
||||||||||
|
Net
income
|
$ | 7,551 | ||||||||||
|
Basic
earnings per share:
|
||||||||||||
|
Income
available to common stockholders
|
$ | 7,551 | 5,440 | $ | 1.39 | |||||||
|
Effect
of dilutive securities:
|
||||||||||||
|
Stock
options
|
2 | |||||||||||
|
Diluted
earnings per share:
|
||||||||||||
|
Income
available to common stockholders
|
$ | 7,551 | 5,442 | $ | 1.39 | |||||||
42
FIRST
KEYSTONE CORPORATION AND SUBSIDIARY
Notes
to Consolidated Financial Statements for the Years Ended December 31, 2009, 2008
and 2007
|
Year Ended December 31, 2007
|
||||||||||||
|
Weighted Average
|
||||||||||||
|
Net Income
|
Number of Shares
|
Per Share
|
||||||||||
|
Numerators
|
Denominators
|
Amount
|
||||||||||
|
Net
income
|
$ | 6,127 | ||||||||||
|
Basic
earnings per share:
|
||||||||||||
|
Income
available to common stockholders
|
$ | 6,127 | 4,674 | $ | 1.31 | |||||||
|
Effect
of dilutive securities:
|
||||||||||||
|
Stock
options
|
6 | |||||||||||
|
Diluted
earnings per share:
|
||||||||||||
|
Income
available to common stockholders
|
$ | 6,127 | 4,680 | $ | 1.31 | |||||||
Cash
Flow Information
For
purposes of reporting consolidated cash flows, cash and cash equivalents include
cash on hand and due from other banks and interest bearing deposits in other
banks. The Corporation considers cash classified as interest bearing deposits
with other banks as a cash equivalent since they are represented by cash
accounts essentially on a demand basis.
Trust
Assets and Income
Property
held by the Corporation in a fiduciary or agency capacity for its customers is
not included in the accompanying consolidated financial statements since such
items are not assets of the Corporation. Trust Department income is
generally recognized on a cash basis and is not materially different
than if it were reported on an accrual basis.
Recent
Accounting Pronouncements
FASB
ASC 820-10 — In February 2008,
the FASB issued new guidance impacting FASB ASC 820-10, Fair Value Measurements
and Disclosures (FASB Staff Position No. 157-2). The staff position delays the
effective date of FASB ASC 820-10 (SFAS No. 157) for nonfinancial assets and
nonfinancial liabilities, except for items that are recognized or disclosed at
fair value in the financial statements on a recurring basis. The delay expired
January 1, 2009, and the expiration of the delay did not have a material impact
on the Corporation’s consolidated
financial positions or results of operations.
FASB
ASC 805 — In December 2007,
the FASB issued new guidance impacting FASB ASC 805, Business
Combinations (SFAS No 141® — Business
Combinations). The new guidance establishes principles and requirements for how
an acquiring company (1) recognizes and measures in its financial statements the
identifiable assets acquired, the liabilities assumed and any noncontrolling
interest in the acquiree, (2) recognizes and measures the goodwill acquired in
the business combination or a gain from a bargain purchase, and (3) determines
what information to disclose to enable users of the financial statements to
evaluate the nature and financial effects of the business combination. The new
standard became effective for the Corporation on January 1, 2009. The adoption
of this standard did not have a material impact on the Corporation’s consolidated
financial position or results of operations.
FASB
ASC 810-10 — In December 2007,
the FASB issued FASB ASC 810-10, Consolidation (Statement No. 160 — Noncontrolling
Interests in Consolidated Financial Statements — an
amendment of ARB No. 51). FASB ASC 810-10 requires the ownership
interests in subsidiaries held by parties other than the parent be clearly
identified, labeled and presented in the consolidated balance sheet within
equity, but separate from the parent’s equity. It also
requires the amount of consolidated net income attributable to the parent and
the noncontrolling interest to be clearly identified and presented on the face
of the consolidated statement of income. The new standard became effective for
the Corporation on January 1, 2009. The adoption of this standard did not have a
material impact on the Corporation’s consolidated
financial position or results of operations.
43
FIRST
KEYSTONE CORPORATION AND SUBSIDIARY
Notes
to Consolidated Financial Statements for the Years Ended December 31, 2009, 2008
and 2007
FASB
ASC 815-10 — In March 2008,
the FASB issued FASB ASC 815-10, Derivatives and Hedging (Statement No.
161 —Disclosures
about Derivative Instruments and Hedging Activities — an
amendment of FASB Statement No. 133). FASB ASC 815-10 requires enhanced
disclosures about how and why an entity uses derivative instruments, how
derivative instruments and related items are accounted for and how derivative
instruments and related hedged items affect an entity’s financial
position, financial performance and cash flows. The new standard became
effective for the Corporation on January 1, 2009. The adoption of this standard
did not have a material impact on the Corporation’s consolidated
financial position or results of operations.
FASB
ASC 855 — In May 2009, the
FASB issued FASB ASC 855, Subsequent Events (Statement No. 165 — Subsequent
Events). FASB ASC 855 establishes the period after the balance sheet date
during which management shall evaluate events or transactions that may occur for
potential recognition or disclosure in financial statements and the
circumstances under which an entity shall recognize events or transactions that
occur after the balance sheet date. FASB ASC 855 also requires disclosure of the
date through which subsequent events have been evaluated. The Corporation
adopted this standard for the interim reporting period ending June 30, 2009. The
adoption of this standard did not have a material impact on the Corporation’s consolidated
financial position or results of operations.
FASB
ASC 860 — In June 2009, the
FASB issued new guidance impacting FASB ASC 860, Transfers and Servicing
(Statement No. 166 — Accounting
for Transfers of Financial Assets — an
amendment of FASB Statement No. 140). The new guidance removes the
concept of a qualifying special-purpose entity and limits the circumstances in
which a financial asset, or portion of a financial asset, should be derecognized
when the transferor has not transferred the entire financial asset to an entity
that is not consolidated with the transferor in the financial statements being
presented and/or when the transferor has continuing involvement with the
transferred financial asset. The new standard will become effective for the
Corporation on January 1, 2010. The Corporation is currently evaluating the
impact of adopting the new standard on the consolidated financial
statements.
FASB
ASC 810-10 — In June 2009, the
FASB issued new guidance impacting FASB ASC 810-10, Consolidation (Statement No.
167 —Amendments
to FASB Interpretation No. 46®). The new
guidance amends tests for variable interest entities to determine whether a
variable interest entity must be consolidated. FASB ASC 810-10 requires an
entity to perform an analysis to determine whether an entity’s variable
interest or interests give it a controlling financial interest in a variable
interest entity. This standard requires ongoing reassessments of whether an
entity is the primary beneficiary of a variable interest entity and enhanced
disclosures that provide more transparent information about an entity’s involvement with
a variable interest entity. The new guidance will become effective for the
Corporation on January 1, 2010 and the Corporation is currently evaluating the
impact of adopting the standard on the consolidated financial
statements.
FASB
ASC 105-10 — In June 2009, the
FASB issued FASB ASC 105-10, Generally Accepted Accounting Principles (Statement
No. 168 — The
FASB Accounting Standards Codification and the Hierarchy of Generally Accepted
Accounting Principles). The new guidance replaces SFAS No. 162 and
establishes the FASB Accounting Standards Codification as the source of
authoritative accounting principles recognized by the FASB to be applied by
nongovernmental entities in the preparation of financial statements in
conformity with generally accepted accounting principles (“GAAP”). Rules and
interpretative releases of the Securities and Exchange Commission under federal
securities laws are also sources of authoritative GAAP for SEC registrants. The
new standard became effective for financial statements issued for interim and
annual periods ending after September 15, 2009. The adoption of this statement
did not have a material impact on the Corporation’s consolidated
financial position or results of operations. Technical references to generally
accepted accounting principles included in the Notes to Consolidated Financial
Statements are provided under the new FASB ASC structure with the prior
terminology included parenthetically.
FASB
ASC 715-20-50 — In December 2008,
the FASB issued new guidance impacting FASB ASC 715-20-50, Compensation
Retirement Benefits — Defined Benefit
Plans —
General (FASB Staff Position No. 132®- 1, Employers’
Disclosures about Postretirement Benefit Plan Assets). This provides
guidance on an employer’s disclosures
about plan assets of a defined benefit pension or other postretirement plan. The
guidance requires disclosure of the fair value of each major category of plan
assets for pension plans and other postretirement benefit plans. This standard
becomes effective for the Corporation on January 1, 2010. The Corporation is
currently evaluating the impact of adopting the new guidance on the consolidated
financial statements, but it is not expected to have a material
impact.
44
FIRST
KEYSTONE CORPORATION AND SUBSIDIARY
Notes
to Consolidated Financial Statements for the Years Ended December 31, 2009, 2008
and 2007
FASB
ASC 825-10-50 — In April 2009,
the FASB issued new guidance impacting FASB ASC 825-10-50, Financial Instruments
(FASB Staff Position No. FAS 107-1 and APB 28-1, Interim
Disclosures about Fair Value of Financial Instruments). This guidance
amends existing GAAP to require disclosures about fair values of financial
instruments for interim reporting periods as well as in annual financial
statements. The guidance also amends existing GAAP to require those disclosures
in summarized financial information at interim reporting periods. The
Corporation adopted this standard for the interim reporting period ending March
31, 2009.
FASB
ASC 320-10 — In April 2009,
the FASB issued new guidance impacting FASB ASC 320-10, Investments — Debt and Equity
Securities (FASB Staff Position No. FAS 115-2, Recognition
and Presentation of Other-Than-Temporary Impairments). This guidance
amends the other-than-temporary impairment guidance in U.S. generally accepted
accounting principles for debt securities. If an entity determines that it has
an other-than-temporary impairment on a security, it must recognize the credit
loss on the security in the income statement. The credit loss is defined as the
difference between the present value of the cash flows expected to be collected
and the amortized cost basis. FASB ASC 320-10 expands disclosures about
other-than-temporary impairment and requires that the annual disclosures in
existing generally accepted accounting principles be made for interim reporting
periods. The Corporation adopted this guidance for the interim reporting period
ending March 31, 2009.
FASB
ASC 820 — In April 2009,
the FASB issued new guidance impacting FASB ASC 820, Fair Value Measurements and
Disclosures (FASB Staff Position No. FAS 157-4, Determining
Fair Value When the Volume and Level of Activity for the Asset or Liability Have
Significantly Decreased and Identifying Transactions That Are Not
Orderly). This provides additional guidance on determining fair value
when the volume and level of activity for the asset or liability have
significantly decreased when compared with normal market activity for the asset
or liability. A significant decrease in the volume or level of activity for the
asset or liability is an indication that transactions or quoted prices may not
be determinative of fair value because transactions may not be orderly. In that
circumstance, further analysis of transactions or quoted prices is needed, and
an adjustment to the transactions or quoted prices may be necessary to estimate
fair value. The Corporation adopted this guidance for the interim reporting
period ending March 31, 2009 and it did not have a material impact on the
Corporation’s
consolidated financial position or results of
operations.
SAB
111 —
In April 2009, the Securities and Exchange Commission issued Staff Accounting
Bulletin No. 111 (“SAB 111”). SAB 111
amends Topic 5.M in the Staff Accounting Bulletin series entitled Other
Than Temporary Impairment of Certain Investments in Debt and Equity
Securities. On April 9, 2009, the FASB issued new guidance impacting FASB
ASC 320-10, Investments — Debt and Equity
Securities (FASB Staff Position No. FAS 115-2 and FAS 124-2, Recognition
and Presentation of Other-Than-Temporary Impairments). SAB 111 maintains
the previous views related to equity securities and amends Topic 5.M to exclude
debt securities from its scope. SAB 111 was effective for the Corporation as of
March 31, 2009. There was no material impact to the Corporation’s consolidated
financial position or results of operations upon
adoption.
SAB
112 —
In June 2009, the Securities and Exchange Commission issued Staff Accounting
Bulletin No. 112 (“SAB 112”). SAB 112
revises or rescinds portions of the interpretative guidance included in the
Staff Accounting Bulletin series in order to make the interpretative guidance
consistent with the recent pronouncements by the FASB, specifically FASB ASC 805
and FASB ASC 810-10 (SFAS No. 141® and SFAS No. 160).
SAB 112 was effective for the Corporation as of June 30, 2009. There was no
material impact to the Corporation’s consolidated
financial position or results of operations upon
adoption.
FASB
ASC 323 — In November 2008,
the FASB Emerging Issues Task Force reached a consensus on FASB ASC 323,
Investments — Equity Method and
Joint Ventures (Issue No. 08-6, Equity
Method Investment Accounting Considerations). The new guidance clarifies
the accounting for certain transactions and impairment considerations involving
equity method investments. An equity investor shall not separately test an
investee’s
underlying assets for impairment but will recognize its share of any impairment
charge recorded by an investee in earnings and consider the effect of the
impairment on its investment. An equity investor shall account for a share
issuance by an investee as if the investor had sold a proportionate share of its
investment, with any gain or loss recognized in earnings. The new guidance
became effective for the Corporation on January 1, 2009 and did not have a
material impact on the Corporation’s consolidated
financial position or results of operations.
45
FIRST
KEYSTONE CORPORATION AND SUBSIDIARY
Notes
to Consolidated Financial Statements for the Years Ended December 31, 2009, 2008
and 2007
FASB
ASC 350 — In November 2008,
the FASB Emerging Issues Task Force reached a consensus on FASB ASC 350,
Intangibles — Goodwill and
Other (Issue No. 08-7, Accounting
for Defensive Intangible Assets). The new guidance clarifies how to
account for defensive intangible assets subsequent to initial measurement. The
guidance applies to acquired intangible assets in situations in which an entity
does not intend to actively use an asset but intends to hold the asset to
prevent others from obtaining access to the asset. A defensive intangible asset
should be accounted for as a separate unit of accounting with an expected life
that reflects the consumption of the expected benefits related to the asset. The
benefit from holding a defensive intangible asset is the direct and indirect
cash flows resulting from the entity preventing others from using the asset. The
new guidance was effective for intangible assets acquired on or after January 1,
2009 and did not have a material impact on the Corporation’s consolidated
financial position or results of operations.
FASB
ASC 260-10 — In June 2008, the
FASB issued new guidance impacting FASB ASC 260-10, Earnings Per Share (FSP No.
EITF 03-06-1, Determining
Whether Instruments Granted in Share-Based Payment Transactions are
Participating Securities). This new guidance concluded that all
outstanding unvested share-based payment awards that contain rights to
nonforfeitable dividends participate in undistributed earnings with common
shareholders and therefore are considered participating securities for purposes
of computing earnings per share. Entities that have participating securities
that are not convertible into common stock are required to use the “two-class” method of
computing earnings per share. The two-class method is an earnings allocation
formula that determines earnings per share for each class of common stock and
participating security according to dividends declared (or accumulated) and
participation rights in undistributed earnings. This new guidance was effective
for fiscal years beginning after December 15, 2008 and interim periods within
those fiscal years. This new guidance became effective for the Corporation on
January 1, 2009 and did not have a material impact on the Corporation’s consolidated
financial position or results of operations.
FASB
ASC 820-10 — In August 2009,
the FASB issued an update (ASC No. 2009-05, Measuring Liabilities at Fair Value)
impacting FASB ASC 820-10, Fair Value Measurements and Disclosures. The update
provides clarification about measuring liabilities at fair value in
circumstances where a quoted price in an active market for an identical
liability is not available and the valuation techniques that should be used. The
update also clarifies that when estimating the fair value of a liability, a
reporting entity is not required to include a separate input or adjustment to
other inputs relating to the existence of a restriction that prevents the
transfer of the liability. This update became effective for the Corporation for
the reporting period ending September 30, 2009 and did not have a material
impact on the Corporation’s consolidated
financial position or results of operations.
FASB
ASC 820-10 — In September
2009, the FASB issued an update (ASC No. 2009-12, Investments in Certain
Entities That Calculate Net Asset Value per Share (or its equivalent)) impacting
FASB ASC 820-10, Fair Value Measurements and Disclosures. The amendments in this
update permit, as a practical expedient, a reporting entity to measure the fair
value of an investment that is within the scope of the amendments in this update
on the basis of the net asset value per share of the investment (or its
equivalent) if the net asset value of the investment is calculated in a manner
consistent with the measurement principles of Topic 946, Financial
Services-Investment Companies. The amendments in this update also require
disclosures by major category of investment about the attributes of investments
within the scope of the amendments in this update, such as the nature of any
restrictions on the ability to redeem an investment on the measurement date.
This update becomes effective for the Corporation for interim and annual
reporting periods ending after December 15, 2009. The Corporation is currently
evaluating the impact of adopting the new guidance on the consolidated financial
statements, but it is not expected to have a material
impact.
FASB
ASC 505-20 — In January 2010,
the FASB issued an update (ASC No. 2010-01, Accounting for Distributions to
Shareholders with Components of Stock and Cash) impacting FASB ASC 505-20,
Equity - Stock Dividends and Stock Splits. The amendments in this update clarify
that the stock portion of a distribution to shareholders that allows them to
elect to receive cash or stock with a potential limitation on the total amount
of cash that all shareholders can elect to receive in the aggregate is
considered a share issuance that is reflected in earnings per share and is not a
stock dividend. This update became effective for the Corporation for interim and
annual periods ending after December 15, 2009 and did not have a material impact
on the Corporation’s consolidated
financial position or results of operations.
FASB
ASC 810-10 — In January 2010,
the FASB issued an update (ASC No. 2010-02, Accounting and Reporting for
Decreases in Ownership of a Subsidiary - a Scope Clarification) impacting FASB
ASC 810-10, Consolidation. The amendments in this update address implementation
issues related to the changes of ownership provisions originally issued as FASB
Statement 160. It also improves the disclosures related to retained investments
in a deconsolidated subsidiary or a preexisting interest held by an acquirer in
a business combination. This update became effective for the Corporation for
interim and annual periods ending after December 15, 2009 and did not have a
material impact on the Corporation’s consolidated
financial position or results of operations.
46
FIRST
KEYSTONE CORPORATION AND SUBSIDIARY
Notes
to Consolidated Financial Statements for the Years Ended December 31, 2009, 2008
and 2007
FASB
ASC 820-10 — In January 2010,
the FASB issued an update (ASC No. 2010-06, Improving Disclosures about Fair
Value Measurements) impacting FASB ASC 820-10, Fair Value Measurements and
Disclosures. The amendments in this update require new disclosures about
significant transfers in and out of Level 1 and Level 2 fair value measurements.
The amendments also require a reporting entity to provide information about
activity for purchases, sales, issuances and settlements in level 3 fair value
measurements and clarify disclosures about the Level of disaggregation and
disclosures about inputs and valuation techniques. This update becomes effective
for the Corporation for interim and annual reporting periods beginning after
December 15, 2009. The Corporation is currently evaluating the impact of
adopting the new guidance on the consolidated financial
statements.
Advertising
Costs
It is the
Corporation’s
policy to expense advertising costs in the period in which they are incurred.
Advertising expense for the years ended December 31, 2009, 2008 and 2007, was
approximately $267,000, $316,000 and $349,000, respectively.
Subsequent
Events
Management
has evaluated subsequent events for reporting and disclosure in these financial
statements through March 12, 2010, the date the financial statements were
issued. No material subsequent events have occurred since December 31, 2009 that
require recognition or disclosure in the consolidated financial
statements.
Reclassifications
Certain
amounts in the consolidated financial statements of prior periods have been
reclassified to conform with presentation used in the 2009 consolidated
financial statements. Such reclassifications have no effect on the
Corporation’s
consolidated financial condition or net income.
NOTE
2 — ACQUISITIONS
Effective
November 1, 2007, the Corporation completed its acquisition of Pocono Community
Bank. Under the terms of the Agreement and Plan of Merger dated as of May 10,
2007, Pocono was acquired by First Keystone Corporation and merged with and into
First Keystone National Bank, its wholly owned subsidiary. Headquartered and
founded in Stroudsburg, Pennsylvania in 1996, Pocono had 4 banking offices
located in Monroe County, Pennsylvania. The acquisition expands the
branch network that the Corporation has and its opportunity to provide Pocono
customers with a broader mix of products and services. As part of the merger
agreement, Pocono continues to operate under the Pocono name and logo, and has
become a division of the Bank. The Corporation acquired 100% of the outstanding
shares of Pocono for a total purchase price of $33.565 million. The transaction
was accounted for in accordance with FASB ASC 805 Business Combinations (SFAS
No. 141, “Business
Combinations”). In connection
therewith, 1,042,266 Pocono shares were exchanged for 932,203 shares of the
Corporation’s
common stock and 703,684 Pocono shares were exchanged for cash consideration
totaling $11.329 million. Pocono options of 63,785 and warrants of 396,134 were
exchanged for cash consideration of $5.034 million. The allocation of the
Corporation’s
common stock and cash was such that the Pocono shareholders did not recognize
gain or loss for federal income tax purposes on those Pocono shares that were
exchanged for the Corporation’s common stock in
the merger. Pocono’s results of
operations are included in the Corporation’s results from the
date of acquisition, November 1, 2007 to December 31, 2007.
Assets
and liabilities of Pocono are recorded at estimated fair values as of the
acquisition date and the results of Pocono’s operations
included in income from November 1, 2007 to December 31, 2007. The fair values
of acquired assets and liabilities, including identifiable intangible assets,
are finalized as quickly as possible following an acquisition. The purchase
price allocations are complete.
47
FIRST
KEYSTONE CORPORATION AND SUBSIDIARY
Notes
to Consolidated Financial Statements for the Years Ended December 31, 2009, 2008
and 2007
The
following table shows the excess purchase price over carrying value of net
assets acquired, purchase price allocation and resulting goodwill recorded for
this acquisition:
(Amounts in
thousands)
|
Purchase
price
|
$ | 33,565 | ||
|
Carrying
value of net assets acquired
|
(14,329 | ) | ||
|
Excess
of purchase price over carrying value of net assets
acquired
|
19,236 | |||
|
Purchase
accounting adjustments:
|
||||
|
Investment
securities
|
182 | |||
|
Loans
|
1,101 | |||
|
Premises
and equipment
|
(148 | ) | ||
|
Deposits
|
167 | |||
|
Borrowings
|
97 | |||
|
Severance
and related costs
|
(877 | ) | ||
|
Deferred
taxes
|
232 | |||
|
Subtotal
|
19,990 | |||
|
Core
deposit intangibles
|
(2,081 | ) | ||
|
Goodwill
|
$ | 17,909 |
The
following table summarized the estimated fair value of net assets
acquired:
(Amounts
in thousands)
|
Assets
|
||||
|
Cash
and cash equivalents
|
$ | 1,387 | ||
|
Interest-bearing
deposits in other banks
|
68 | |||
|
Federal
funds sold
|
2,488 | |||
|
Investment
securities
|
13,122 | |||
|
Loans,
net of allowances for loan losses
|
104,752 | |||
|
Premises
and equipment-net
|
3,292 | |||
|
Accrued
interest receivable
|
596 | |||
|
Cash
surrender value of bank-owned life insurance
|
2,950 | |||
|
Goodwill
and other intangibles
|
19,838 | |||
|
Other
assets
|
1,065 | |||
|
Total
Assets
|
$ | 149,558 | ||
|
Liabilities
|
||||
|
Deposits
|
$ | 109,672 | ||
|
Borrowings
|
5,908 | |||
|
Other
liabilities
|
413 | |||
|
Total
Liabilities
|
$ | 115,993 | ||
|
Fair
Value of Net Assets Acquired
|
$ | 33,565 | ||
48
FIRST
KEYSTONE CORPORATION AND SUBSIDIARY
Notes
to Consolidated Financial Statements for the Years Ended December 31, 2009, 2008
and 2007
The
following unaudited pro forma consolidated financial information presents the
combined results of operations of the Corporation as if the Pocono acquisition
had occurred as of the beginning of 2007 and 2006, respectively:
|
(Dollars
in thousands, except per share amounts)
|
For
the Year Ended
|
|||||||
|
2007
|
2006
|
|||||||
|
Net
interest income
|
$ | 17,100 | $ | 17,182 | ||||
|
Provision
for loan losses
|
206 | 580 | ||||||
|
Net
interest income after provision for loan losses
|
16,894 | 16,602 | ||||||
|
Noninterest
income
|
4,658 | 4,245 | ||||||
|
Noninterest
expense
|
13,575 | 12,897 | ||||||
|
Income
before income tax expense
|
7,977 | 7,950 | ||||||
|
Income
tax expense
|
1,206 | 1,415 | ||||||
|
Net
Income
|
$ | 6,771 | $ | 6,535 | ||||
|
Net
Income Per Common Share
|
||||||||
|
Basic
|
$ | 1.21 | $ | 1.19 | ||||
|
Diluted
|
$ | 1.21 | $ | 1.19 | ||||
|
Average
Common Shares Outstanding
|
||||||||
|
Basic
|
5,606,316 | 5,503,359 | ||||||
|
Diluted
|
5,611,990 | 5,509,996 | ||||||
The pro
forma results include amortization of fair value adjustments on loans, deposits,
and debt, and amortization of newly acquired intangibles. The pro forma number
of average common shares outstanding includes adjustments for shares issued for
the acquisitions and the impact of additional dilutive securities but does not
assume any incremental share repurchases. The pro forma results presented do not
reflect cost savings or revenue enhancements anticipated from the acquisition
and are not necessarily indicative of what actually would have occurred if the
acquisition had been completed as of the beginning of the periods presented, nor
are they necessarily indicative of future consolidated results.
NOTE
3 — RESTRICTED
CASH BALANCES
The Bank
is required to maintain certain average reserve balances as established by the
Federal Reserve Bank. The amount of those reserve balances for the reserve
computation period which included December 31, 2009, was $1,505,000, which was
satisfied through the restriction of vault cash. In addition, the Bank maintains
a clearing balance at the Federal Reserve Bank to offset specific charges for
services. At December 31, 2009, the amount of this balance was
$5,185,000.
49
FIRST
KEYSTONE CORPORATION AND SUBSIDIARY
Notes
to Consolidated Financial Statements for the Years Ended December 31, 2009, 2008
and 2007
NOTE 4 — INVESTMENT
SECURITIES
The
amortized cost, related estimated fair value, and unrealized gains and losses
for investment securities classified as “Available-For-Sale”
or “Held-to-Maturity”
were as follows at December 31, 2009 and 2008:
|
Available-for-Sale
Securities
|
||||||||||||||||
|
(Amounts
in thousands)
|
Gross
|
Gross
|
Estimated
|
|||||||||||||
|
Amortized
|
Unrealized
|
Unrealized
|
Fair
|
|||||||||||||
|
December 31,
2009:
|
Cost
|
Gains
|
Losses
|
Value
|
||||||||||||
|
Obligations
of U.S. Government Corporations and Agencies:
|
||||||||||||||||
|
Mortgage-backed
|
$ | 52,730 | $ | 1,074 | $ | (575 | ) | $ | 53,229 | |||||||
|
Other
|
6,044 | 155 | (6 | ) | 6,193 | |||||||||||
|
Obligations
of state and political subdivisions
|
168,563 | 1,650 | (7,613 | ) | 162,600 | |||||||||||
|
Corporate
securities
|
44,262 | 1,651 | (9 | ) | 45,904 | |||||||||||
|
Marketable
equity securities
|
2,027 | 187 | (455 | ) | 1,759 | |||||||||||
|
Restricted
equity securities
|
8,139 | — | — | 8,139 | ||||||||||||
|
Total
|
$ | 281,765 | $ | 4,717 | $ | (8,658 | ) | $ | 277,824 | |||||||
|
Held-to-Maturity Securities
|
||||||||||||||||
|
(Amounts
in thousands)
|
Gross
|
Gross
|
Estimated
|
|||||||||||||
|
Amortized
|
Unrealized
|
Unrealized
|
Fair
|
|||||||||||||
|
December 31,
2009:
|
Cost
|
Gains
|
Losses
|
Value
|
||||||||||||
|
Obligations
of U.S. Government Corporations and Agencies:
|
||||||||||||||||
|
Mortgage-backed
|
$ | 159 | $ | 2 | $ | — | $ | 161 | ||||||||
|
Other
|
3,000 | 11 | (34 | ) | 2,977 | |||||||||||
|
Obligations
of state and political subdivisions
|
1,815 | 2 | (19 | ) | 1,798 | |||||||||||
|
Total
|
$ | 4,974 | $ | 15 | $ | (53 | ) | $ | 4,936 | |||||||
|
Available-for-Sale
Securities
|
||||||||||||||||
|
(Amounts
in thousands)
|
Gross
|
Gross
|
Estimated
|
|||||||||||||
|
Amortized
|
Unrealized
|
Unrealized
|
Fair
|
|||||||||||||
|
December 31,
2008:
|
Cost
|
Gains
|
Losses
|
Value
|
||||||||||||
|
Obligations
of U.S. Government Corporations and Agencies:
|
||||||||||||||||
|
Mortgage-backed
|
$ | 64,966 | $ | 2,032 | $ | — | $ | 66,998 | ||||||||
|
Other
|
11,011 | 335 | — | 11,346 | ||||||||||||
|
Obligations
of state and political subdivisions
|
142,805 | 308 | (9,652 | ) | 133,461 | |||||||||||
|
Corporate
securities
|
19,650 | 198 | (67 | ) | 19,781 | |||||||||||
|
Marketable
equity securities
|
2,605 | 253 | (947 | ) | 1,911 | |||||||||||
|
Restricted
equity securities
|
6,678 | — | — | 6,678 | ||||||||||||
|
Total
|
$ | 247,715 | $ | 3,126 | $ | (10,666 | ) | $ | 240,175 | |||||||
50
FIRST
KEYSTONE CORPORATION AND SUBSIDIARY
Notes
to Consolidated Financial Statements for the Years Ended December 31, 2009, 2008
and 2007
|
Held-to-Maturity Securities
|
||||||||||||||||
|
(Amounts
in thousands)
|
Gross
|
Gross
|
Estimated
|
|||||||||||||
|
Amortized
|
Unrealized
|
Unrealized
|
Fair
|
|||||||||||||
|
December 31,
2008:
|
Cost
|
Gains
|
Losses
|
Value
|
||||||||||||
|
Obligations
of U.S. Government Corporations and Agencies:
|
||||||||||||||||
|
Mortgage-backed
|
$ | 176 | $ | — | $ | (3 | ) | $ | 173 | |||||||
|
Other
|
— | — | — | — | ||||||||||||
|
Obligations
of state and political subdivisions
|
2,814 | 4 | (85 | ) | 2,733 | |||||||||||
|
Total
|
$ | 2,990 | $ | 4 | $ | (88 | ) | $ | 2,906 | |||||||
Securities
Available-for-Sale with an aggregate fair value of $150,703,000 in 2009 and
$140,811,000 in 2008; and securities Held-to-Maturity with an aggregate book
value of $2,507,000 in 2009 and $2,523,000 in 2008, were pledged to secure
public funds, trust funds, securities sold under agreements to repurchase, FHLB
advances and other balances of $76,257,000 in 2009 and $57,231,000 in 2008 as
required by law.
The
amortized cost, estimated fair value and weighted average yield of debt
securities, by contractual maturity, are shown below at December 31, 2009.
Expected maturities will differ from contractual maturities because borrowers
may have the right to call or prepay obligations with or without call or
prepayment penalties.
(Amounts
in thousands)
|
December 31, 2009
|
||||||||||||||||||||
|
U.S.
Government
|
Obligations
|
|||||||||||||||||||
|
Agency
&
|
of
State
|
Marketable
|
Restricted
|
|||||||||||||||||
|
Corporation
|
&
Political
|
Equity
|
Equity
|
Corporate
|
||||||||||||||||
|
Obligations1
|
Subdivisions2
|
Securities3
|
Securities3
|
Securities
|
||||||||||||||||
|
Available-For-Sale:
|
||||||||||||||||||||
|
Within
1 Year:
|
||||||||||||||||||||
|
Amortized
cost
|
$ | 100 | $ | — | $ | — | $ | — | $ | 6,123 | ||||||||||
|
Estimated
fair value
|
103 | — | — | — | 6,217 | |||||||||||||||
|
Weighted
average yield
|
4.70 | % | — | — | — | 4.46 | % | |||||||||||||
|
1 -
5 Years:
|
||||||||||||||||||||
|
Amortized
cost
|
2,000 | 454 | — | — | 35,829 | |||||||||||||||
|
Estimated
fair value
|
2,003 | 468 | — | — | 37,363 | |||||||||||||||
|
Weighted
average yield
|
2.20 | % | 4.02 | % | — | — | 4.49 | % | ||||||||||||
|
5 -
10 Years:
|
||||||||||||||||||||
|
Amortized
cost
|
4,477 | 1,684 | — | — | 2,310 | |||||||||||||||
|
Estimated
fair value
|
4,638 | 1,727 | — | — | 2,323 | |||||||||||||||
|
Weighted
average yield
|
4.57 | % | 4.26 | % | — | — | 1.79 | % | ||||||||||||
|
After
10
|
||||||||||||||||||||
|
Amortized
cost
|
52,197 | 166,425 | 2,027 | 8,139 | — | |||||||||||||||
|
Estimated
fair value
|
52,678 | 160,406 | 1,759 | 8,139 | — | |||||||||||||||
|
Weighted
average yield
|
4.68 | % | 5.20 | % | 2.65 | % | .94 | % | — | |||||||||||
|
Total:
|
||||||||||||||||||||
|
Amortized
cost
|
$ | 58,774 | $ | 168,563 | $ | 2,027 | $ | 8,139 | $ | 44,262 | ||||||||||
|
Estimated
fair value
|
59,422 | 162,601 | 1,759 | 8,139 | 45,903 | |||||||||||||||
|
Weighted
average yield
|
4.59 | % | 5.19 | % | 2.65 | % | .94 | % | 4.34 | % | ||||||||||
_______________________
1Mortgage-backed
securities are allocated for maturity reporting at their original maturity
date.
2Average
yields on tax-exempt obligations of state and political subdivisions have been
computed on a tax-equivalent basis using a 34% tax rate.
3Marketable
equity securities and restricted equity securities are not considered to have
defined maturities and are included in the after ten year
category.
51
FIRST
KEYSTONE CORPORATION AND SUBSIDIARY
Notes
to Consolidated Financial Statements for the Years Ended December 31, 2009, 2008
and 2007
(Amounts
in thousands)
|
December 31, 2009
|
||||||||||||||||||||
|
U.S.
Government
|
Obligations
|
|||||||||||||||||||
|
Agency
&
|
of
State
|
Marketable
|
Restricted
|
|||||||||||||||||
|
Corporation
|
&
Political
|
Equity
|
Equity
|
Corporate
|
||||||||||||||||
|
Obligations1
|
Subdivisions2
|
Securities3
|
Securities3
|
Securities
|
||||||||||||||||
|
Held-To-Maturity:
|
||||||||||||||||||||
|
Within
1 Year:
|
||||||||||||||||||||
|
Amortized
cost
|
$ | — | $ | — | $ | — | $ | — | $ | — | ||||||||||
|
Estimated
fair value
|
— | — | — | — | — | |||||||||||||||
|
Weighted
average yield
|
— | — | — | — | — | |||||||||||||||
|
1 -
5 Years:
|
||||||||||||||||||||
|
Amortized
cost
|
2,000 | 1,348 | — | — | — | |||||||||||||||
|
Estimated
fair value
|
1,966 | 1,339 | — | — | — | |||||||||||||||
|
Weighted
average yield
|
2.04 | % | 3.97 | % | — | — | — | |||||||||||||
|
5 -
10 Years:
|
||||||||||||||||||||
|
Amortized
cost
|
1,159 | — | — | — | — | |||||||||||||||
|
Estimated
fair value
|
1,172 | — | — | — | — | |||||||||||||||
|
Weighted
average yield
|
3.80 | % | — | — | — | — | ||||||||||||||
|
After
10 Years:
|
||||||||||||||||||||
|
Amortized
cost
|
— | 467 | — | — | — | |||||||||||||||
|
Estimated
fair value
|
— | 459 | — | — | — | |||||||||||||||
|
Weighted
average yield
|
— | 4.85 | % | — | — | — | ||||||||||||||
|
Total:
|
||||||||||||||||||||
|
Amortized
cost
|
$ | 3,159 | $ | 1,815 | $ | — | $ | — | $ | — | ||||||||||
|
Estimated
fair value
|
3,138 | 1,798 | — | — | — | |||||||||||||||
|
Weighted
average yield
|
2.69 | % | 4.20 | % | — | — | — | |||||||||||||
_______________________
1Mortgage-backed
securities are allocated for maturity reporting at their original maturity
date.
2Average
yields on tax-exempt obligations of state and political subdivisions have been
computed on a tax-equivalent basis using a 34% tax rate.
3Marketable
equity securities and restricted equity securities are not considered to have
defined maturities and are included in the after ten year category.
There
were no aggregate investments with a single issuer (excluding the U.S.
Government and its agencies) which exceeded ten percent of consolidated
shareholders’
equity at December 31, 2009. The quality rating of the obligations of state and
political subdivisions are generally investment grade, as rated by Moody’s
or Standard and Poors. The typical exceptions are local issues which are not
rated, but are secured by the full faith and credit obligations of the
communities that issued these securities. The state and political subdivision
investments are actively traded in a liquid market.
Proceeds
from sale of investments in Available-for-Sale debt and equity securities during
2009, 2008 and 2007 were $82,407,000, $83,626,000 and $83,255,000, respectively.
Gross gains realized on these sales were $1,721,000, $737,000 and $1,117,000,
respectively. Gross losses on these sales were $1,859,000, $885,000 and
$631,000, respectively. Included in gross losses in 2008 is an impairment loss
on certain equity securities in the amount of $437,000. There were no impairment
losses in 2009.
Proceeds
from sale of investments in Held-To-Maturity debt and equity securities during
2009, 2008, and 2007 were $0, $0 and $375,000, respectively. Gross
losses on these sales were $0, $0 and $3,000, respectively and there were no
gains realized during these periods.
52
FIRST
KEYSTONE CORPORATION AND SUBSIDIARY
Notes
to Consolidated Financial Statements for the Years Ended December 31, 2009, 2008
and 2007
Management
evaluates securities for other-than-temporary impairment (“OTTI”)
at least on a quarterly basis, and more frequently when economic or market
conditions warrant such an evaluation. Investment securities classified as
available-for-sale or held-to-maturity are generally evaluated for OTTI under
FASB ASC 320 (SFAS No. 115, Accounting for Certain Investments in Debt and
Equity Securities). In determining OTTI under the FASB 320 (SFAS No. 115) model,
management considers many factors, including (1) the length of time and the
extent to which the fair value has been less than cost , (2) the financial
condition and near-term prospects of the issuer, (3) whether the market decline
was affected by macroeconomic conditions; and (4) whether the entity has the
intent to sell the debt security or more likely than not will be required to
sell the debt security before its anticipated recovery. The assessment of
whether an other-than-temporary decline exists involves a high degree of
subjectivity and judgement and is based on the information available to
management at a point in time.
When
other-than-temporary impairment occurs, the amount of the other-than-temporary
impairment recognized in earnings depends on whether an entity intends to sell
the security or more likely than not will be required to sell the security
before recovery of its amortized cost basis less any current-period credit loss.
If an entity intends to sell or more likely than not will be required to sell
the security before recovery of its amortized cost basis less any current-period
credit loss, the other-than-temporary impairment shall be recognized in earnings
equal to the entire difference between the investment’s
amortized cost basis and its fair value at the balance sheet date. If an entity
does not intend to sell the security and it is not more likely than not that the
entity will be required to sell the security before recovery of its amortized
cost basis less any current-period loss, the other-than-temporary impairment
shall be separated into the amount representing the credit loss and the amount
related to all other factors. The amount of the total other-than-temporary
impairment related to the credit loss is determined based on the present value
of cash flows expected to be collected and is recognized in earnings. The amount
of the total other-than-temporary impairment related to the other factors shall
be recognized in other comprehensive income, net of applicable taxes. The
previous amortized cost basis less the other-than-temporary impairment
recognized in earnings shall become the new amortized cost basis of the
investment.
The fair
market value of the equity securities tends to fluctuate with the overall equity
markets as well as the trends specific to each institution. The equity
securities portfolio is reviewed in a similar manner as that of the debt
securities with greater emphasis placed on the length of time the market value
has been less than the carrying value and the financial sector outlook. The
Corporation also reviews dividend payment activities, levels of non-performing
assets and loan loss reserves, and whether or not the issuer is participating in
the TARP Capital Purchase Program. The starting point for the equity analysis is
the length and severity of market value decline. The Corporation and an
independent consultant monitor the entire portfolio monthly with particular
attention given to securities in a continuous loss position of at least ten
percent for over twelve months. During 2008, impairment was recognized on
several securities which management believed that a sufficient amount of credit
damage had occurred relative to the issuer’s
capital position to render the security unlikely to recover to our cost within
the near term. For the year ended December 31, 2008, the Corporation recorded an
other-than-temporary loss totaling $437,000 related to the investment in equity
securities. Securities with an unrealized loss that were determined to be
other-than-temporary were written down to fair value, with the write-down
recorded as a realized loss included in security (losses) gains. The Corporation
evaluated the near-term prospects of the issuer in relation the severity and
duration of the market value decline as well as the other attributes listed
above. Based on that evaluation and the Corporation’s
ability and intent to hold these equity securities for a reasonable period of
time sufficient for a forecasted recovery of fair value, the Corporation does
not consider these equity securities to be other-than-temporary impaired at
December 31, 2008. Based on the factors described above, management did not
consider any equity securities to be other-than-temporary impaired at December
31, 2009.
In
accordance with disclosures required by FASB ASC 320-10-50 Investments-Debt and
Equity Securities Disclosures (EITF No. 03-1), the summary below shows the gross
unrealized losses and fair value of the Bank’s
investments, aggregated by investment category, that individual securities have
been in a continuous unrealized loss position for less than 12 months or more
than 12 months as of December 31, 2009 and 2008:
53
FIRST
KEYSTONE CORPORATION AND SUBSIDIARY
Notes
to Consolidated Financial Statements for the Years Ended December 31, 2009, 2008
and 2007
December
31, 2009
|
Less Than 12 Months
|
12 Months or More
|
Total
|
||||||||||||||||||||||
|
Fair
|
Unrealized
|
Fair
|
Unrealized
|
Fair
|
Unrealized
|
|||||||||||||||||||
|
(Amounts
in thousands)
|
Value
|
Loss
|
Value
|
Loss
|
Value
|
Loss
|
||||||||||||||||||
|
Direct
obligations of the
|
||||||||||||||||||||||||
|
U.S.
Government
|
$ | 2,961 | $ | 39 | $ | — | $ | — | $ | 2,961 | $ | 39 | ||||||||||||
|
Federal
Agency
|
||||||||||||||||||||||||
|
Backed
Securities
|
31,545 | 575 | — | — | 31,545 | 575 | ||||||||||||||||||
|
Municipal
Bonds
|
48,858 | 1,483 | 37,530 | 6,150 | 86,388 | 7,633 | ||||||||||||||||||
|
Corporate
Securities
|
1,062 | 9 | — | — | 1,062 | 9 | ||||||||||||||||||
|
Equities
|
148 | 19 | 1,111 | 436 | 1,259 | 455 | ||||||||||||||||||
| $ | 84,574 | $ | 2,125 | $ | 38,641 | $ | 6,586 | $ | 123,215 | $ | 8,711 | |||||||||||||
December
31, 2008
|
Less Than 12 Months
|
12 Months or More
|
Total
|
||||||||||||||||||||||
|
Fair
|
Unrealized
|
Fair
|
Unrealized
|
Fair
|
Unrealized
|
|||||||||||||||||||
|
(Amounts
in thousands)
|
Value
|
Loss
|
Value
|
Loss
|
Value
|
Loss
|
||||||||||||||||||
|
Direct
obligations of the
|
||||||||||||||||||||||||
|
U.S.
Government
|
$ | — | $ | — | $ | — | $ | — | $ | — | $ | — | ||||||||||||
|
Federal
Agency
|
||||||||||||||||||||||||
|
Backed
Securities
|
— | — | 173 | 2 | 173 | 2 | ||||||||||||||||||
|
Municipal
Bonds
|
104,558 | 7,963 | 6,512 | 1,774 | 111,070 | 9,737 | ||||||||||||||||||
|
Corporate
Securities
|
7,039 | 68 | — | — | 7,039 | 68 | ||||||||||||||||||
|
Equities
|
428 | 119 | 728 | 828 | 1,156 | 947 | ||||||||||||||||||
| $ | 112,025 | $ | 8,150 | $ | 7,413 | $ | 2,604 | $ | 119,438 | $ | 10,754 | |||||||||||||
The
Corporation invests in various forms of agency debt including mortgage backed
securities and callable debt. The mortgage backed securities are issued by FHLMC
(Federal Home Loan Mortgage Corporation) of FNMA (Federal National Mortgage
Association). The municipal securities consist of general obligations and
revenue bonds. The equity securities consist of stocks in other bank holding
companies. The fair market value of the above securities is
influenced by market interest rates, prepayment speeds on mortgage securities,
bid to offer spreads in the market place and credit premiums for various types
of agency debt. These factors change continuously and therefore the market value
of these securities may be higher or lower that the Corporation’s
carrying value at any measurement date. Management does not believe any of their
157 securities in an unrealized position as of December 31, 2009 represents an
other-than-temporary impairment. The Corporation has the ability to hold the
remaining securities contained in the above table for a time necessary to
recover the cost.
Securities
with an unrealized loss that are determined to be other-than-temporary are
written down to fair value, with the write-down recorded as a realized loss
included in securities gains (losses). During 2008, the Corporation
recorded an other-than-temporary impairment loss totaling $437,000 related to
investments in certain equity securities.
Assets
Measured at Fair Value on a Recurring Basis
The
Corporation measures certain assets at fair value on a recurring basis. Fair
value is defined as a price that would be received to sell an asset in an
orderly transaction between market participants at the measurement date. SFAS
157 establishes a framework for measuring fair value that includes a hierarchy
used to classify the inputs used in measuring fair value. The hierarchy
prioritizes the inputs used in determining valuations into three levels. The
level in the fair value hierarchy within which the fair value measurement falls
is determined based on the lowest level input that is significant to the fair
value measurement. The levels of the fair value hierarchy are as
follows:
54
FIRST
KEYSTONE CORPORATION AND SUBSIDIARY
Notes
to Consolidated Financial Statements for the Years Ended December 31, 2009, 2008
and 2007
|
|
A.
|
Level 1: Fair
value is based on unadjusted quoted prices in active markets that are
accessible to the Bank for identical assets. These generally provide the
most reliable evidence and are used to measure fair value whenever
available.
|
|
|
B.
|
Level 2: Fair
value is based on significant inputs, other than Level 1 inputs, that are
observable either directly or indirectly for substantially the full term
of the asset through corroboration with observable market date. Level 2
inputs include quoted market prices in active markets for similar assets,
quoted market prices that are not active for identical or similar assets
and other observable inputs.
|
|
|
C.
|
Level 3: Fair
value is based on significant unobservable inputs. Examples of valuation
methodologies that would result in Level 3 classification include option
pricing models, discounted cash flows and other similar
techniques.
|
At
December 31, 2009 investments measured at fair value on a recurring basis and
the valuation methods used are as follows:
|
Level
1
|
Level
2
|
Level
3
|
Total
|
|||||||||||||
|
Available
for Sale Securities
|
||||||||||||||||
|
Obligations
of US Government Agencies
|
||||||||||||||||
|
Mortgaged-backed
|
$
|
—
|
$
|
53,229
|
$
|
—
|
$
|
53,229
|
||||||||
|
Other
|
—
|
6,193
|
—
|
6,193
|
||||||||||||
|
Obligations
of state and political subdivisions
|
—
|
162,600
|
—
|
162,600
|
||||||||||||
|
Corporate
securities
|
—
|
45,904
|
—
|
45,904
|
||||||||||||
|
Equity
securities
|
1,759
|
—
|
—
|
1,759
|
||||||||||||
|
Restricted
equity securities
|
—
|
8,139
|
—
|
8,139
|
||||||||||||
|
$
|
1,759
|
$
|
276,065
|
$
|
—
|
$
|
277,824
|
|||||||||
The
estimated fair values of equity securities classified as Level 1 are derived
from quoted market prices in active markets; these assets consist mainly of
stocks held in other banks. The estimated fair values of all debt securities
classified as Level 2 are obtained from nationally-recognized third-party
pricing agencies. The estimated fair values are derived primarily from cash flow
models, which include assumptions for interest rates, credit losses, and
prepayment speeds. The significant inputs utilized in the cash flow models are
based on market data obtained from sources independent of the Bank (observable
inputs), and are therefore classified as Level 2 within the fair value
hierarchy.
NOTE
5 — LOANS
Major
classifications of loans at December 31, 2009 and 2008 consisted
of:
(Amounts
in thousands)
|
2009
|
2008
|
|||||||
|
Commercial,
Financial, and Agricultural
|
$ | 38,932 | $ | 33,104 | ||||
|
Tax-exempt
|
12,525 | 18,920 | ||||||
|
Real
estate mortgages - Held-for-sale
|
10,429 | 3,613 | ||||||
|
Real
estate mortgages - Consumer
|
127,663 | 132,675 | ||||||
|
Real
estate mortgages - Commercial
|
207,296 | 206,095 | ||||||
|
Consumer
|
10,802 | 15,291 | ||||||
|
Gross
loans
|
$ | 407,647 | $ | 409,698 | ||||
|
Add
(deduct): Unearned discount
|
(1,273 | ) | (1,711 | ) | ||||
|
Net deferred loan fees and costs
|
323 | 380 | ||||||
|
Loans,
net of unearned income
|
$ | 406,697 | $ | 408,367 | ||||
55
FIRST
KEYSTONE CORPORATION AND SUBSIDIARY
Notes
to Consolidated Financial Statements for the Years Ended December 31, 2009, 2008
and 2007
Changes
in the allowance for loan losses for the years ended December 31, 2009, 2008 and
2007, were as follows:
(Amounts
in thousands)
|
2009
|
2008
|
2007
|
||||||||||
|
Balance,
January 1
|
$ | 5,195 | $ | 5,046 | $ | 3,671 | ||||||
|
Provision
charged to operations
|
800 | 700 | 150 | |||||||||
|
Loans
charged off
|
(734 | ) | (739 | ) | (236 | ) | ||||||
|
Recoveries
|
61 | 188 | 179 | |||||||||
|
Allowance
purchased
|
— | — | 1,282 | |||||||||
|
Balance,
December 31
|
$ | 5,322 | $ | 5,195 | $ | 5,046 | ||||||
Non-accrual
loans at December 31, 2009, 2008 and 2007 were $2,948,000, $1,718,000 and
$3,208,000, respectively. The gross interest that would have been recorded if
these loans had been current in accordance with their original terms and the
amounts actually recorded in income were as follows:
(Amounts
in thousands)
|
2009
|
2008
|
2007
|
||||||||||
|
Gross
interest due under terms
|
$ | 242 | $ | 145 | $ | 258 | ||||||
|
Amount
included in income
|
(61 | ) | (94 | ) | (144 | ) | ||||||
|
Interest
income not recognized
|
$ | 181 | $ | 51 | $ | 114 | ||||||
At
December 31, 2009, 2008 and 2007 the recorded investment in impaired loans as
defined by FASB ASC 310-10-35 Receivables Subsequent Measurements (SFAS 114) was
$2,948,000, $1,718,000 and $3,208,000 and the impaired loans allowances were
$834,000, $417,000 and $492,000, respectively at December 31, 2009, 2008 and
2007. The average recorded balance in impaired loans during the year ended
December 31, 2009, 2008 and 2007 was approximately $2,803,000, $4,246,000 and
$1,837,000, respectively.
Loans
past-due 90 days or more and still accruing interest were $140,000 at December
31, 2009 and $15,000 at
December
31, 2008.
At
December 31, 2009, there were no significant commitments to lend additional
funds with respect to non-accrual and restructured loans.
From time
to time, the Bank may agree to modify the contractual terms of a borrower’s loan. In cases
where such modifications represent a concession to a borrower experiencing
financial difficulty, the modification is considered a troubled debt
restructuring. Loans modified in a troubled debt restructuring are placed on
non-accrual status until the Bank determines the future collection of principal
and interest is reasonably assured, which generally requires that the borrower
demonstrate a period of performance according to the restructured terms of six
months. At December 31, 2009, there were no loans classified as troubled debt
restructurings.
NOTE
6 — MORTGAGE
SERVICING RIGHTS
The
mortgage loans sold serviced for others are not included in the accompanying
consolidated balance sheets. The unpaid principal balances of mortgage loans
serviced for others were $56,965,000 and $47,303,000 at December 31, 2009 and
2008, respectively. The balances of amortized capitalized mortgage servicing
rights, included in other assets at December 31, 2009 and 2008, were $346,000
and $277,000, respectively.
56
FIRST
KEYSTONE CORPORATION AND SUBSIDIARY
Notes
to Consolidated Financial Statements for the Years Ended December 31, 2009, 2008
and 2007
The
following summarizes mortgage servicing rights capitalized and amortized along
with the aggregate activity in the related valuation allowances:
(Amounts
in thousands)
|
2009
|
2008
|
2007
|
||||||||||
|
Balance,
January 1
|
$ | 277 | $ | 297 | $ | 254 | ||||||
|
Servicing
asset additions
|
148 | 63 | 103 | |||||||||
|
Amortization
|
(79 | ) | (83 | ) | (60 | ) | ||||||
|
Balance,
December 31
|
$ | 346 | $ | 277 | $ | 297 | ||||||
Custodial
escrow balances maintained in connection with the foregoing loan servicing, and
included in demand deposits, were approximately $24,000 and $32,000 at December
31, 2009 and 2008, respectively.
NOTE
7 — PREMISES AND
EQUIPMENT
A summary
of premises and equipment at December 31, 2009 and 2008 follows:
(Amounts
in thousands)
|
2009
|
2008
|
|||||||
|
Land
|
$ | 1,746 | $ | 1,746 | ||||
|
Buildings
|
9,815 | 8,822 | ||||||
|
Leasehold
improvements
|
390 | 391 | ||||||
|
Equipment
|
8,153 | 6,146 | ||||||
| 20,104 | 17,105 | |||||||
|
Less: Accumulated
depreciation
|
8,639 | 7,936 | ||||||
|
Total
|
$ | 11,465 | $ | 9,169 | ||||
Depreciation
amounted to $727,000 for 2009, $681,000 for 2008 and $472,000 for
2007.
The
banking subsidiary leases land and a bank building in Stroudsburg, Pennsylvania,
under a lease expiring in 2017 (See Note 15). Included in buildings above is the
bank building held under a capital lease with a cost of $953,000 and accumulated
amortization of $576,000 and $528,000 at December 31, 2009 and 2008,
respectively. Amortization on the bank building held under the capital lease was
$47,000 for each of the years ended December 31, 2009 and 2008.
NOTE
8 — GOODWILL, OTHER INTANGIBLE ASSETS,
AND PREMIUM DISCOUNTS
Goodwill,
other intangible assets, and premium discounts were comprised of the following
at December 31, 2009 and 2008:
(Amounts
in thousands)
|
Gross
|
Accumulated
|
|||||||||||||||
|
Carrying Amount
|
Amortization/(Accretion)
|
|||||||||||||||
|
2009
|
2008
|
2009
|
2008
|
|||||||||||||
|
Unamortized
intangible asset:
|
||||||||||||||||
|
Goodwill
|
$ | 19,133 | $ | 19,133 | $ | — | $ | — | ||||||||
|
Core
deposit intangibles
|
$ | 2,218 | $ | 2,218 | $ | 688 | $ | 399 | ||||||||
|
Premium
discount (negative premium) on acquired certificates of
deposit
|
$ | (385 | ) | $ | (385 | ) | $ | (383 | ) | $ | (362 | ) | ||||
57
FIRST
KEYSTONE CORPORATION AND SUBSIDIARY
Notes
to Consolidated Financial Statements for the Years Ended December 31, 2009, 2008
and 2007
Amortization
expense of the core deposit intangibles was $289,000, $289,000 and $61,000 for
the years ended December
31, 2009, 2008 and 2007, respectively. Accretion of the premium discount
(negative premium) of the acquired certificates of deposit was $21,000, $109,000
and $36,000 for the years ended December 31, 2009, 2008 and 2007,
respectively.
Estimated
amortization/accretion is as follows for the years ending December
31:
(Amounts
in thousands)
|
Amortization
|
Accretion
of Premium Discount
|
|||||||
|
of
Core
|
(Negative
Premium)
|
|||||||
|
Deposit Intangible
|
on Certificates of Deposit
|
|||||||
|
2010
|
289
|
(2)
|
||||||
|
2011
|
289
|
—
|
||||||
|
2012
|
283
|
—
|
||||||
|
2013
|
273
|
—
|
||||||
|
2014
|
273 |
—
|
||||||
NOTE
9 — DEPOSITS
Major
classifications of deposits at December 31, 2009 and 2008 consisted
of:
(Amounts
in thousands)
|
2009
|
2008
|
|||||||
|
Demand
- non-interest bearing
|
$ | 61,779 | $ | 58,178 | ||||
|
Demand
- interest bearing
|
117,229 | 83,912 | ||||||
|
Savings
|
116,857 | 94,700 | ||||||
|
Time,
$100,000 and over
|
96,335 | 87,259 | ||||||
|
Other
time
|
188,369 | 180,584 | ||||||
|
Total
deposits
|
$ | 580,569 | $ | 504,633 | ||||
The
following is a schedule reflecting classification and remaining maturities of
time deposits of $100,000 and over at December 31, 2009:
(Amounts
in thousands)
|
2010
|
$ | 65,866 | ||
|
2011
|
15,567 | |||
|
2012
|
8,139 | |||
|
2013
|
5,120 | |||
|
2014
|
1,643 | |||
| $ | 96,335 |
Interest
expense related to time deposits of $100,000 or more was $2,741,000 in 2009,
$3,408,000 in 2008 and $2,520,000 in 2007.
In
November 2007, approximately $109,672,000 of deposit accounts were assumed
through the acquisition of Pocono Community Bank (See Notes 2 and
13).
58
FIRST
KEYSTONE CORPORATION AND SUBSIDIARY
Notes
to Consolidated Financial Statements for the Years Ended December 31, 2009, 2008
and 2007
NOTE
10 — SHORT-TERM
BORROWINGS
Federal
funds purchased, securities sold under agreements to repurchase and Federal Home
Loan Bank advances generally represent overnight or less than 30-day borrowings.
U.S. Treasury tax and loan notes for collections made by the Bank are payable on
demand. Short-term borrowings consisted of the following at December 31, 2009
and 2008:
| (Amounts in thousands) |
2009
|
|||||||||||||||
|
Maximum
|
||||||||||||||||
|
Ending
|
Average
|
Month
End
|
Average
|
|||||||||||||
|
Balance
|
Balance
|
Balance
|
Rate
|
|||||||||||||
|
Federal
funds purchased and securities sold under agreements to
repurchase
|
$ | 17,024 | $ | 19,385 | $ | 23,000 | 1.75 | % | ||||||||
|
Federal
Home Loan Bank
|
— | 4,479 | 31,350 | .72 | % | |||||||||||
|
U.S.
Treasury tax and loan notes
|
438 | 440 | 907 | — | % | |||||||||||
|
Total
|
$ | 17,462 | $ | 24,304 | $ | 55,257 | 1.53 | % | ||||||||
| (Amounts in thousands) |
2008
|
|||||||||||||||
|
Maximum
|
||||||||||||||||
|
Ending
|
Average
|
Month
End
|
Average
|
|||||||||||||
|
Balance
|
Balance
|
Balance
|
Rate
|
|||||||||||||
|
Federal
funds purchased and securities sold under agreements to
repurchase
|
$ | 20,572 | $ | 18,245 | $ | 26,279 | 2.62 | % | ||||||||
|
Federal
Home Loan Bank
|
32,200 | 11,265 | 32,500 | 1.59 | % | |||||||||||
|
U.S.
Treasury tax and loan notes
|
2,560 | 618 | 2,559 | 1.82 | % | |||||||||||
|
Total
|
$ | 55,332 | $ | 30,128 | $ | 61,338 | 1.84 | % | ||||||||
NOTE
11 — LONG-TERM
BORROWINGS
Long-term
borrowings are comprised of advances from the Federal Home Loan Bank (FHLB) and
a capital lease assumed as a result of the acquisition of Pocono Community Bank
in the amount of $811,000. Long term capital lease scheduled maturities as of
December 31, 2009 are: $54,000 in 2010, $60,000 in 2011, $67,000 in 2012, and
$524,000 thereafter for a total balance of $705,000 as of December 31,
2009.
Under
terms of a blanket agreement, collateral for the loans is secured by certain
qualifying assets of the Corporation's banking subsidiary with
FHLB. The principal assets are real estate mortgages with a carrying
value of $330,498,000.
A
schedule of long-term borrowings by maturity as of December 31, 2009 and 2008
follows:
(Amounts
in thousands)
|
2009
|
2008
|
|||||||
|
Due
2009, 3.87% to 5.01%
|
$ | — | 12,000 | |||||
|
Due
2010, 4.95% to 6.76%
|
23,520 | 23,556 | ||||||
|
Due
2011, 2.73% to 5.03%
|
12,000 | 12,000 | ||||||
|
Due
2012, 1.44% to 4.93%
|
16,000 | 10,000 | ||||||
|
Due
2013, 2.48% to 4.60%
|
17,000 | 10,000 | ||||||
|
Due
2014, 5.41%
|
3,750 | 3,750 | ||||||
|
Due
2018, 3.91% to 4.86%
|
8,000 | 8,000 | ||||||
|
Due
2028, 5.14%
|
2,000 | 2,000 | ||||||
| $ | 82,270 | $ | 81,306 | |||||
59
FIRST
KEYSTONE CORPORATION AND SUBSIDIARY
Notes
to Consolidated Financial Statements for the Years Ended December 31, 2009, 2008
and 2007
NOTE
12 — INCOME TAXES
The
current and deferred components of the income tax provision (benefit) consisted
of the following:
(Amounts
in thousands)
|
2009
|
2008
|
2007
|
||||||||||
|
Federal
|
||||||||||||
|
Current
|
$ | 1,484 | $ | 1,865 | $ | 1,456 | ||||||
|
Deferred
(benefit)
|
(177 | ) | (419 | ) | (104 | ) | ||||||
| $ | 1,307 | $ | 1,446 | $ | 1,352 | |||||||
|
State
|
||||||||||||
|
Current
|
(40 | ) | — | 39 | ||||||||
|
Deferred
|
12 | (52 | ) | — | ||||||||
| $ | (28 | ) | $ | (52 | ) | $ | 39 | |||||
|
Total
provision for income taxes
|
$ | 1,279 | $ | 1,394 | $ | 1,391 | ||||||
The
following is a reconciliation between the actual provision for federal income
taxes and the amount of federal income taxes which would have been provided at
the statutory rate of 34%:
|
(Amounts
in thousands)
|
2009
|
2008
|
2007
|
|||||||||||||||||||||
|
Amount
|
Rate
|
Amount
|
Rate
|
Amount
|
Rate
|
|||||||||||||||||||
|
Provision
at statutory rate
|
$ | 3,133 | 34.0 | $ | 3,041 | 34.0 | % | $ | 2,556 | 34.0 | % | |||||||||||||
|
Tax-exempt
income
|
(1,463 | ) | (15.9 | ) | (1,397 | ) | (15.6 | ) | (1,060 | ) | (14.1 | ) | ||||||||||||
|
Non-deductible
expenses
|
147 | 1.6 | 177 | 2.0 | 165 | 2.2 | ||||||||||||||||||
|
Tax
credit from limited partnership
|
||||||||||||||||||||||||
|
Less
amortization - net
|
(134 | ) | (1.5 | ) | (136 | ) | (1.5 | ) | (79 | ) | (1.1 | ) | ||||||||||||
|
Bank
owned life insurance income - net
|
(337 | ) | (3.7 | ) | (240 | ) | (2.7 | ) | (190 | ) | (2.5 | ) | ||||||||||||
|
Other-net
|
(39 | ) | (.3 | ) | 1 | — | (40 | ) | (.5 | ) | ||||||||||||||
|
Applicable
federal income tax and rate
|
$ | 1,307 | 14.2 | % | $ | 1,446 | 16.2 | % | $ | 1,352 | 18.0 | % | ||||||||||||
Total
federal income tax attributable to realized security gains and losses was
$(47,000) in 2009, $98,000 in 2008 and $164,000 in 2007.
60
FIRST
KEYSTONE CORPORATION AND SUBSIDIARY
Notes
to Consolidated Financial Statements for the Years Ended December 31, 2009, 2008
and 2007
The
deferred tax assets and liabilities resulting from temporary timing differences
have been netted to reflect a net deferred tax asset (liability) included in
other assets or other liabilities in these consolidated financial statements.
The components of the net deferred tax asset (liability) at December 31, 2009
and 2008, are as follows:
(Amounts
in thousands)
|
2009
|
2008
|
|||||||
|
Deferred
Tax Assets:
|
||||||||
|
Allowance
for loan losses
|
$ | 1,791 | $ | 1,742 | ||||
|
Deferred
compensation
|
435 | 412 | ||||||
|
Mortgage
servicing rights
|
2 | — | ||||||
|
Contributions
|
6 | 5 | ||||||
|
Non-accrual
interest
|
5 | 30 | ||||||
|
Leases
|
112 | 114 | ||||||
|
Limited
partnership
|
100 | 70 | ||||||
|
Alternative
minimum tax credits
|
356 | 84 | ||||||
|
Tax
credits from limited partnerships
|
531 | 300 | ||||||
|
Unrealized
investment securities losses-net
|
1,358 | 2,429 | ||||||
|
Impairment
loss on investment securities
|
129 | 177 | ||||||
|
Capital
and net operating loss carry forwards
|
8 | 23 | ||||||
|
Total
|
$ | 4,833 | $ | 5,386 | ||||
|
Deferred
Tax Liabilities:
|
||||||||
|
Loan
fees and costs
|
$ | 205 | $ | 211 | ||||
|
Depreciation
|
550 | 271 | ||||||
|
Accretion
|
173 | 26 | ||||||
|
Mortgage
servicing rights
|
— | 4 | ||||||
|
Intangibles
|
392 | 452 | ||||||
|
Total
|
$ | 1,320 | $ | 964 | ||||
|
Net
Deferred Tax Asset
|
$ | 3,513 | $ | 4,422 | ||||
It is
anticipated that all deferred tax assets are to be realized and accordingly, no
valuation allowance has been provided.
The
Corporation and its subsidiary file a consolidated federal income tax
return.
NOTE
13 — SUPPLEMENTAL DISCLOSURES OF CASH FLOW
INFORMATION
During
the years ended December 31, 2009, 2008 and 2007, cash payments for interest
expense and income taxes were as follows:
(Amounts
in thousands)
|
2009
|
2008
|
2007
|
||||||||||
|
Interest
paid on deposits and other borrowings
|
$ | 15,874 | $ | 18,268 | $ | 17,448 | ||||||
|
Income
taxes paid
|
$ | 1,650 | $ | 1,598 | $ | 1,752 | ||||||
The
Corporation transferred loans to foreclosed assets held-for-sale in amounts of
$762,000, $342,000 and $624,000 in 2009, 2008 and 2007,
respectively.
61
FIRST
KEYSTONE CORPORATION AND SUBSIDIARY
Notes
to Consolidated Financial Statements for the Years Ended December 31, 2009, 2008
and 2007
Non-Cash
Investing and Financing Activities
On
November 1, 2007 First Keystone Corporation completed its acquisition of Pocono
Community Bank (See Note 2). A summary of the estimated fair value of the
non-cash assets acquired and the liabilities assumed at the date of acquisition
were as follows:
(Amounts
in thousands)
|
Assets
Acquired:
|
||||
|
Investment
securities
|
$ | 13,122 | ||
|
Loan,
net of allowances for loan losses
|
104,752 | |||
|
Premises
and equipment-net
|
3,292 | |||
|
Accrued
interest receivable
|
596 | |||
|
Cash
surrender value of bank-owned life insurance
|
2,950 | |||
|
Goodwill
and other intangibles
|
19,838 | |||
|
Other
assets
|
1,065 | |||
|
Total
Assets Acquired
|
$ | 145,615 | ||
|
Liabilities
Assumed:
|
||||
|
Deposits
|
$ | 109,672 | ||
|
Borrowings
|
5,908 | |||
|
Other
liabilities
|
413 | |||
|
Total
Liabilities Assumed
|
$ | 115,993 | ||
|
Net
Non-Cash Assets Acquired
|
$ | 29,622 | ||
The
Corporation issued 932,203 shares of common stock to the shareholders of Pocono
Community for a total of $15,996,000. The company paid $17,569,000 for the
acquisition less cash acquired from Pocono Community Bank in the amount of
$3,943,000 or a net cash expenditure of $13,626,000.
NOTE
14 — EMPLOYEE
BENEFIT PLANS AND DEFERRED COMPENSATION
AGREEMENTS
The
Corporation maintains a 401K Plan which has a combined tax qualified savings
feature and profit sharing feature for the benefit of its employees. Under the
savings feature, the Corporation matches 100% of the employee contribution up to
3% of compensation which amounted to $156,000, $145,000 and $111,000 in 2009,
2008 and 2007, respectively. Under the profit sharing feature, contributions, at
the discretion of the Board of Directors, are funded currently and amounted to
$399,000, $353,000 and $273,000 in 2009, 2008 and 2007,
respectively.
The Bank
also has non-qualified deferred compensation agreements with four of its
officers and three retired officers. These agreements are essentially unsecured
promises by the Bank to make monthly payments to the officers over a twenty year
period. Payments begin based upon specific criteria — generally, when the
officer retires. To account for the cost of payments yet to be made in the
future, the Bank recognizes an accrued liability in years prior to when payments
begin based on the present value of those future payments. The Bank’s accrued
liability for these deferred compensation agreements as of December 31, 2009 and
2008, was $1,231,000 and $1,173,000, respectively. The related
expense for these plans amounted to $112,000, $155,000 and $125,000 in 2009,
2008 and 2007, respectively.
The Bank
entered into agreements to provide post-retirement benefits to a retired
employee in the form of life insurance payable to the employee’s estate upon
their death through endorsement split dollar life insurance arrangements. The
Bank’s
accrued liabilities for these benefit agreements as of December 31, 2009 and
2008 was $48,000 and $38,000, respectively. The related expense for these
benefit agreements amounted to $10,000 and $2,000 for the years ended December
31, 2009 and 2008, respectively.
62
FIRST
KEYSTONE CORPORATION AND SUBSIDIARY
Notes
to Consolidated Financial Statements for the Years Ended December 31, 2009, 2008
and 2007
NOTE
15 — COMMITMENTS AND
CONTINGENCIES
The
Corporation’s
banking subsidiary currently leases four branch banking facilities and one
parcel of land, as well as two operation centers, under operating leases. Rent
expense for the years ended December 31, 2009, 2008 and 2007 was $283,000,
$274,000 and $216,000, respectively. Minimum rental payments required
under these operating leases are: 2010 - $380,000, 2011 - $381,000,
2012 - $292,000, 2013 - $233,000, 2014 - $216,000 and thereafter
$2,632,000.
The
banking subsidiary leases land and a bank building in Stroudsburg, Pennsylvania,
under a lease expiring in 2017. This lease has an operating lease commitment and
a capital lease component. Minimum future rental payments as of
December 31, 2009 under this noncancelable operating lease component for land
are due as follows and are included in the amounts of operating lease payments
above, 2010 - $36,000, 2011 - $36,000, 2012 - $36,000, 2013 -
$36,000, 2014 - $36,000 and thereafter $109,000.
Minimum
future lease payments under the capital lease component for the bank building as
of December 31, 2009 for each of the next five years and in the aggregate
are:
|
Year Ending December 31
|
||||
|
2010
|
113,000 | |||
|
2011
|
113,000 | |||
|
2012
|
115,000 | |||
|
2013
|
132,000 | |||
|
2014
|
132,000 | |||
|
Thereafter
|
384,000 | |||
|
Total
minimum lease payments
|
989,000 | |||
|
Less
amounts representing interest
|
279,000 | |||
|
Present
value of net minus lease payments
|
$ | 710,000 | ||
In the
normal course of business, there are various pending legal actions and
proceedings that are not reflected in the consolidated financial statements.
Management does not believe the outcome of these actions and proceedings will
have a material effect on the consolidated financial position of the
Corporation.
NOTE
16 — RELATED
PARTY TRANSACTIONS
Certain
directors and executive officers of First Keystone Corporation and its
Subsidiary and companies in which they are principal owners (i.e., at least 10%)
were indebted to the Corporation at December 31, 2009, 2008 and 2007. These
loans were made on substantially the same terms and conditions, including
interest rates and collateral, as those prevailing at the time for comparable
transactions with unrelated parties. The loans do not involve more than the
normal risk of collectibility nor present other unfavorable
features.
A summary
of the activity on the related party loans, comprised of 8 directors and 4
executive officers and their related companies consists of the
following:
(Amounts
in thousands)
|
2009
|
2008
|
2007
|
||||||||||
|
Balance
at January 1
|
$ | 3,542 | $ | 3,650 | $ | 939 | ||||||
|
Additions
|
3,881 | 1,779 | 4,074 | |||||||||
|
Deductions
|
(2,972 | ) | (1,887 | ) | (1,363 | ) | ||||||
|
Balance
at December 31
|
$ | 4,451 | $ | 3,542 | $ | 3,650 | ||||||
63
FIRST
KEYSTONE CORPORATION AND SUBSIDIARY
Notes
to Consolidated Financial Statements for the Years Ended December 31, 2009, 2008
and 2007
The above
loans represent funds drawn and outstanding at the date of the accompanying
consolidated financial statement. Commitments by the Bank to related parties on
lines of credit and letters of credit for 2009, 2008 and
2007, presented an additional off-balance sheet risk to the extent of
undisbursed funds in the amounts of $2,653,000, $2,889,000 and $2,574,000,
respectively, on the above loans.
Deposits
from certain officers and directors and/or their affiliated companies held by
the Bank amounted to $8,137,000 and $6,603,000 at December 31, 2009 and 2008,
respectively.
NOTE
17 — REGULATORY
MATTERS
Dividends
are paid by the Corporation to shareholders which are mainly provided by
dividends from the Bank. However, national banking laws place certain
restrictions on the amount of cash dividends allowed to be paid by the Bank to
the Corporation. Generally, the limitation provides that dividend payments may
not exceed the Bank's current year's retained income plus retained net income
for the preceding two years. During 2009, the Bank paid dividends to the
Corporation in the amount of $5,427,000 and the Bank’s net
income for the year ended December 31, 2009 was $8,147,000. During 2007 and
2008, the Bank paid dividends to the Corporation in the amounts of $10,459,000
and $5,662,000 respectively, and the Bank’s
net income for the years ended December 31, 2007 and 2008 was $5,817,000 and
$7,855,000, respectively. The amount of dividends paid in 2007 was utilized, in
part, to fund the Pocono Community Bank acquisition. Accordingly, in 2010,
without prior regulatory approval, the Bank may pay dividends to the Corporation
in the amount of $271,000, plus additional amounts equal to the net income
earned in 2010 for the period January 1, 2010 through the date of declaration
less any dividends which may have already been paid in 2010. Regulations also
limit the amount of loans and advances from the Bank to the Corporation to 10%
of consolidated net assets.
The
Corporation is subject to various regulatory capital requirements administered
by the federal banking agencies. Failure to meet minimum capital requirements
can initiate certain mandatory — and possibly
additional discretionary — actions by
regulators that, if undertaken, could have a direct material effect on the
Corporation’s
financial statements. Under capital adequacy guidelines and the regulatory
framework for prompt corrective action, the Corporation must meet specific
capital guidelines that involve quantitative measures of the Corporation’s assets,
liabilities, and certain off-balance sheet items as calculated under regulatory
accounting practices. The Corporation’s capital amounts
and classification are also subject to qualitative judgements by the regulators
about components, risk weightings and other factors. Management believes, as of
December 31, 2009 and 2008, that the Corporation and the Bank met all capital
adequacy requirements to which they are subject.
Quantitative
measures established by regulation to ensure capital adequacy require the Bank
to maintain minimum amounts and ratios (set fourth in the table below) of Total
and Tier I Capital (as defined in the regulations) to Risk-Weighted Assets (as
defined), and of Tier I Capital (as defined) to Average Assets (as
defined).
As of
December 31, 2009, the most recent notification from the Office of the
Comptroller of the Currency categorized the Bank as Well Capitalized under the
regulatory framework for prompt corrective action. To be categorized as Well
Capitalized, the Bank must maintain minimum Total Risk-Based, Tier I
Risked-Based and Tier I Leverage Ratios as set forth in the table. There are no
conditions or events since the notification that management believes have
changed the Bank's category.
|
(Amounts
in thousands)
|
To
Be Well
|
|||||||||||||||||||||||
|
Capitalized
Under
|
||||||||||||||||||||||||
|
For
Capital
|
Prompt
Corrective
|
|||||||||||||||||||||||
|
Actual
|
Adequacy Purposes
|
Action Provisions
|
||||||||||||||||||||||
|
Amount
|
Ratio
|
Amount
|
Ratio
|
Amount
|
Ratio
|
|||||||||||||||||||
|
As
of December 31, 2009:
|
||||||||||||||||||||||||
|
Total
Capital
|
||||||||||||||||||||||||
|
(to
Risk Weighted Assets)
|
$ | 66,666 | 12.88 | % | $ | 41,421 | 8.00 | % | $ | 51,777 | 10.00 | % | ||||||||||||
|
Tier
I Capital
|
||||||||||||||||||||||||
|
(to
Risk Weighted Assets)
|
61,344 | 11.85 | % | 20,711 | 4.00 | % | 31,066 | 6.00 | % | |||||||||||||||
|
Tier
I Capital
|
||||||||||||||||||||||||
|
(to
Average Assets)
|
61,344 | 8.21 | % | 29,884 | 4.00 | % | 37,355 | 5.00 | % | |||||||||||||||
64
FIRST
KEYSTONE CORPORATION AND SUBSIDIARY
Notes
to Consolidated Financial Statements for the Years Ended December 31, 2009, 2008
and 2007
|
(Amounts in
thousands)
|
Actual
|
For Capital
Adequacy Purposes
|
To Be Well
Capitalized Under
Prompt Corrective
Action Provisions
|
|||||||||||||||||||||
|
Amount
|
Ratio
|
Amount
|
Ratio
|
Amount
|
Ratio
|
|||||||||||||||||||
|
As
of December 31, 2008:
|
||||||||||||||||||||||||
|
Total
Capital
(to
Risk Weighted Assets)
|
$ | 63,694 | 13.03 | % | $ | 39,245 | 8.00 | % | $ | 49,057 | 10.00 | % | ||||||||||||
|
Tier
I Capital
(to
Risk Weighted Assets)
|
58,499 | 11.97 | % | 19,623 | 4.00 | % | 29,434 | 6.00 | % | |||||||||||||||
|
Tier
I Capital
(to
Average Assets)
|
58,499 | 8.45 | % | 27,706 | 4.00 | % | 34,633 | 5.00 | % | |||||||||||||||
The
Corporation’s
capital ratios are not materially different from those of the Bank.
NOTE
18 — FINANCIAL INSTRUMENTS WITH
OFF-BALANCE SHEET RISK AND CONCENTRATIONS OF CREDIT RISK
The
Corporation is a party to financial instruments with off-balance sheet risk in
the normal course of business to meet the financing needs of its customers.
These financial instruments include commitments to extend credit and standby
letters of credit. Those instruments involve, to varying degrees, elements of
credit and interest rate risk in excess of the amount recognized in the
consolidated balance sheets. The contract or notional amounts of those
instruments reflect the extent of involvement the Corporation has in particular
classes of financial instruments. The Corporation does not engage in trading
activities with respect to any of its financial instruments with off-balance
sheet risk.
The
Corporation’s
exposure to credit loss in the event of nonperformance by the other party to the
financial instrument for commitments to extend credit and standby letters of
credit is represented by the contractual notional amount of those
instruments.
The
Corporation uses the same credit policies in making commitments and conditional
obligations as it does for on-balance sheet instruments.
The
Corporation may require collateral or other security to support financial
instruments with off-balance sheet credit risk.
The
contract or notional amounts at December 31, 2009 and 2008 were as
follows:
(Amounts
in thousands)
|
2009
|
2008
|
|||||||
|
Financial
instruments whose contract amounts represent credit risk:
|
||||||||
|
Commitments
to extend credit
|
$ | 63,247 | $ | 52,762 | ||||
|
Financial
standby letters of credit
|
$ | 843 | $ | 904 | ||||
|
Performance
standby letters of credit
|
$ | 5,806 | $ | 6,936 | ||||
Commitments
to extend credit are agreements to lend to a customer as long as there is no
violation of any condition established in the contract. Commitments generally
have fixed expiration dates or other termination clauses that may require
payment of a fee. Since many of the commitments are expected to expire without
being drawn upon, the total commitment amounts do not necessarily represent
future cash requirements. The Corporation evaluates each customer’s
creditworthiness on a case-by-case basis. The amount of collateral obtained, if
deemed necessary by the Corporation upon extension of credit, is based on
management’s
credit evaluation of the counter-party. Collateral held varies but may include
accounts receivable, inventory, property, plant and equipment, and
income-producing commercial properties.
65
FIRST
KEYSTONE CORPORATION AND SUBSIDIARY
Notes
to Consolidated Financial Statements for the Years Ended December 31, 2009, 2008
and 2007
Standby
letters of credit are conditional commitments issued by the Corporation to
guarantee payment to a third party when a customer either fails to repay an
obligation or fails to perform some non-financial obligation. The credit risk
involved in issuing letters of credit is essentially the same as that involved
in extending loan facilities to customers. The Corporation may hold collateral
to support standby letters of credit for which collateral is deemed
necessary.
The
Corporation grants commercial, agricultural, real estate mortgage and consumer
loans to customers primarily in the counties of Columbia, Luzerne, Montour and
Monroe, Pennsylvania. The concentrations of credit by type of loan are set forth
in Note 5, “Loans”. It is
management’s
opinion that the loan portfolio was well balanced and diversified at December
31, 2009, to the extent necessary to avoid any significant concentration of
credit risk. However, its debtors ability to honor their contracts may be
influenced by the region’s
economy.
NOTE
19 — COMPREHENSIVE
INCOME
The
components of other comprehensive income and related tax effects are as
follows:
|
(Amounts
in thousands)
|
Years Ended December 31,
|
|||||||||||
|
2009
|
2008
|
2007
|
||||||||||
|
Unrealized
holding (losses) on available-for-sale investment securities arising
during the period
|
$ | (3,301 | ) | $ | (7,000 | ) | $ | 330 | ||||
|
Less
reclassification adjustment for net gains and losses realized in
income
|
(138 | ) | (148 | ) | 483 | |||||||
|
Change
in unrealized (losses) before tax effect
|
$ | (3,163 | ) | $ | (6,852 | ) | $ | (153 | ) | |||
|
Tax
effects
|
1,075 | 2,347 | (113 | ) | ||||||||
|
Net
change in unrealized (losses)
|
$ | (2,088 | ) | $ | (4,505 | ) | $ | (40 | ) | |||
NOTE
20 — STOCKHOLDERS’ EQUITY
On
November 1, 2007 First Keystone Corporation completed its acquisition of Pocono
Community Bank (See Note 2) and in connection therewith, issued 932,203 shares
of First Keystone common stock for a total of $15,996,000.
The
Corporation also offers to its shareholders a Dividend Reinvestment and Stock
Purchase Plan. First Keystone Corporation is authorized to issue up to 200,000
shares of its common stock under the plan. The plan provides First Keystone
shareholders a convenient and economical way to purchase additional shares of
common stock by reinvesting dividends. A plan participant can elect full
dividend reinvestment or partial dividend reinvestment provided at least 25
shares are enrolled in the plan. In addition, plan participants may make
additional voluntary cash purchases of common stock under the plan of not less
than $100 per calendar quarter or more than $2,500 in any calendar
quarter.
Shares of
First Keystone common stock are purchased for the plan either in the open market
by an independent broker on behalf of the plan, directly from First Keystone as
original issue shares, or through negotiated transactions. A combination of the
previous methods could also occur.
66
FIRST
KEYSTONE CORPORATION AND SUBSIDIARY
Notes
to Consolidated Financial Statements for the Years Ended December 31, 2009, 2008
and 2007
Participation
in this plan by shareholders began in 2001. Shares transferred under this
dividend reinvestment and stock purchase plan were as follows:
|
Year
|
Number of Shares
|
|||
|
2001
|
3,260
|
|||
|
2002
|
7,747
|
|||
|
2003
|
8,000
|
|||
|
2004
|
13,932
|
|||
|
2005
|
21,491
|
|||
|
2006
|
22,964
|
|||
|
2007
|
25,900
|
|||
|
2008
|
34,389
|
|||
|
2009
|
39,772
|
|||
NOTE
21 — STOCK COMPENSATION
PLAN
On
February 10, 1998, the Board of Directors adopted a stock option incentive plan
and initially reserved 100,000 shares of common stock for issuance under the
plan for certain employees of the Bank. After adjustments for the effects of
stock dividends, options exercised and options forfeited there remains 68,104
options for possible issuance. Under the Plan, options are granted at
fair market value and the time period during which any option granted may be
exercised may not commence before six months or continue beyond the expiration
of ten years after the option is awarded. Upon exercise of the stock
options, shares of the Corporation’s stock are issued
from Treasury Stock.
On
December 27, 2007, the Board of Directors issued 6,250 stock
options.
The fair
value of stock options issued to employees is measured on the date of the grant
and is recognized as compensation expense over the requisite service
period. Expected volatility and dividend yield are based on
historical stock prices and dividend amounts over past time periods equal in
length to the life of the options. The risk-free interest rate is
determined using the U.S. Treasury yield curve in effect at the date of the
grant. The expected life of the options is calculated using the
average term of the vesting period and the maximum term.
Stock
based compensation expense was $18,000 and $1,000 for the years ended December
31, 2008 and 2007, respectively, attributable to stock options granted in
2007. Stock based compensation expense was $8,000 for the year
ended December 31, 2006 attributable to stock options granted in
2005.
The fair
value of each option grant is estimated on the date of grant using the Binomial
Option Pricing Model derived from the Black-Scholes Option Pricing Model with
the following weighted-average assumptions used for options granted in 2007 and
2005, respectively: dividend yield of 5.25% and 4.05%; expected volatility of
26.17% and 23.04%; risk-free interest rate of 3.64% and 4.39%; and an expected
life of 5.25 years and 10 years.
67
FIRST
KEYSTONE CORPORATION AND SUBSIDIARY
Notes
to Consolidated Financial Statements for the Years Ended December 31, 2009, 2008
and 2007
Information
about stock options outstanding at December 31, 2009, is summarized as
follows:
|
2009
|
2008
|
2007
|
||||||||||||||||||||||
|
Weighted
|
Weighted
|
Weighted
|
||||||||||||||||||||||
|
Average
|
Average
|
Average
|
||||||||||||||||||||||
|
Stock
|
Exercise
|
Stock
|
Exercise
|
Stock
|
Exercise
|
|||||||||||||||||||
|
Options
|
Price
|
Options
|
Price
|
Options
|
Price
|
|||||||||||||||||||
|
Balance
at January 1
|
41,695 | $ | 16.86 | 54,562 | $ | 17.65 | 51,383 | $ | 17.55 | |||||||||||||||
|
Granted
|
— | — | — | — | 6,250 | 16.75 | ||||||||||||||||||
|
Granted
due to stock dividend
|
— | — | — | — | — | — | ||||||||||||||||||
|
Exercised
|
— | — | (50 | ) | 15.88 | — | — | |||||||||||||||||
|
Forfeited
|
(9,972 | ) | 15.85 | (12,817 | ) | 19.80 | (3,071 | ) | 15.95 | |||||||||||||||
|
Balance
at December 31
|
31,723 | 17.17 | 41,695 | 16.86 | 54,562 | 17.55 | ||||||||||||||||||
|
Exercisable
at December 31
|
31,723 | $ | 17.17 | 41,695 | $ | 16.86 | 48,312 | $ | 17.65 | |||||||||||||||
|
Weighted
average fair value of options granted during the year
|
$ | 2.98 | ||||||||||||||||||||||
Under the
terms of the stock option incentive plan, the stock options including amendments
as to price and terms were adjusted for the stock dividend in 2006.
Exercise
prices of options outstanding as of December 31, 2009, ranged from $10.28 to
$21.11 per share. The weighted average remaining contracted life is
approximately 4.03 years.
The
31,723 options outstanding as December 31, 2009 have an intrinsic value, which
is the amount that the value of the underlying stock exceeds the exercise price
of the options of $49,000. The total intrinsic value of the options exercised
during the years ended December 31, 2009, 2008 and 2007 was $0 for each year.
Cash received from stock options exercised for the years ended December 31,
2009, 2008 and 2007 was $0, $1,000 and $0, respectively.
The
following table summarizes information concerning the 1998 Employee Stock Option
Plan at December 31, 2009.
|
Options
Outstanding
|
Options
Exercisable
|
|||||||||||||||||||
|
Weighted
|
Weighted
|
Weighted
|
||||||||||||||||||
|
Average
|
Average
|
Average
|
||||||||||||||||||
|
Number
|
Remaining
|
Exercise
|
Number
|
Exercise
|
||||||||||||||||
|
Year
|
Outstanding*
|
Contractual
Life
|
Price
|
Exercisable
|
Price
|
|||||||||||||||
|
2000
|
4,950 | .75 | 10.28 | 4,950 | 10.28 | |||||||||||||||
|
2002
|
7,394 | 2.75 | 15.08 | 7,394 | 15.08 | |||||||||||||||
|
2003
|
10,231 | 3.75 | 21.11 | 10,231 | 21.11 | |||||||||||||||
|
2005
|
3,148 | 5.75 | 20.95 | 3,148 | 20.95 | |||||||||||||||
|
2007
|
6,000 | 8.00 | 16.75 | 6,000 | 16.75 | |||||||||||||||
| 31,723 | 17.17 | 31,723 | 17.17 | |||||||||||||||||
*As
adjusted for stock dividend noted above.
68
FIRST
KEYSTONE CORPORATION AND SUBSIDIARY
Notes
to Consolidated Financial Statements for the Years Ended December 31, 2009, 2008
and 2007
NOTE
22 — FAIR VALUES OF FINANCIAL
INSTRUMENTS
FASB ASC
825-10-50 Financial Instruments-Disclosure ((SFAS) 107, “Disclosures
about Fair Value of Financial Instruments”),
requires disclosure of fair value information about financial instruments,
whether or not required to be recognized in the consolidated balance sheets, for
which it is practicable to estimate such fair value. In cases where quoted
market prices are not available, fair values are based on estimates using
present value or other valuation techniques. These techniques are significantly
affected by the assumptions used, including the discount rate and estimates of
future cash flows. Fair value estimates derived through these techniques cannot
be substantiated by comparison to independent markets and, in many cases, could
not be realized in immediate settlement of the instrument. FASB ASC 825-10-50
(SFAS 107) excludes certain financial instruments and all nonfinancial
instruments from its disclosure requirements. Accordingly, the aggregate fair
value amounts presented do not represent the underlying value of the
Corporation.
The
following methods and assumptions were used by the Corporation in estimating its
fair value disclosures for financial instruments:
Cash
and Due From Banks, Short-Term Investments, Accrued Interest Receivable and
Accrued Interest Payable
The fair
values are equal to the current carrying values.
Investment
Securities
Fair
values have been individually determined based on currently quoted market
prices. If a quoted market price is not available, fair value is estimated using
quoted market prices for similar securities.
Loans
Fair
values are estimated for categories of loans with similar financial
characteristics. Loans were segregated by type such as commercial, tax-exempt,
real estate mortgages and consumer. For estimation purposes each loan category
was further segmented into fixed and adjustable rate interest terms and also
into performing and non-performing classifications.
The fair
value of each category of performing loans is calculated by discounting future
cash flows using the current rates at which similar loans would be made to
borrowers with similar credit ratings and for the same remaining
maturities.
Fair
value for non-performing loans is based on management’s
estimate of future cash flows discounted using a rate commensurate with the risk
associated with the estimated future cash flows. The assumptions used by
management are judgmentally determined using specific borrower
information.
Cash
Surrender Value of Bank Owned Life Insurance
Fair
value is equal to the cash surrender value of life insurance
policies.
Deposits
Under
FASB ASC 825-10-50 (SFAS 107), the fair value of deposits with no stated
maturity, such as Demand Deposits, Savings Accounts and Money Market Accounts is
equal to the amount payable on demand at December 31, 2009 and
2008.
Fair
values for fixed-rate certificates of deposit are estimated using a discounted
cash flow calculation that applies interest rates currently being offered on
similar term borrowings, to a schedule of aggregated expected monthly maturities
on time deposits.
69
FIRST
KEYSTONE CORPORATION AND SUBSIDIARY
Notes
to Consolidated Financial Statements for the Years Ended December 31, 2009, 2008
and 2007
Short-Term
and Long-Term Borrowings
The fair
values of short-term and long-term borrowings are estimated using discounted
cash flow analyses based on the Corporation's incremental borrowing rate for
similar instruments.
Commitments
to Extend Credit and Standby Letters of Credit
Management
estimates that there are no material differences between the notional amount and
the estimated fair value of those off-balance sheet items since they are
primarily composed of unfunded loan commitments which are generally priced at
market at the time of funding.
At
December 31, 2009 and 2008, the carrying values and estimated fair values of
financial instruments of the Corporation are presented in the table
below:
|
(Amounts
in thousands)
|
2009
|
2008
|
||||||||||||||
|
Carrying
|
Estimated
|
Carrying
|
Estimated
|
|||||||||||||
|
Amount
|
Fair Value
|
Amount
|
Fair Value
|
|||||||||||||
|
FINANCIAL
ASSETS:
|
||||||||||||||||
|
Cash
and due from banks
|
$ | 4,199 | $ | 4,199 | $ | 9,945 | $ | 9,945 | ||||||||
|
Short-term
investments
|
7,227 | 7,227 | 6 | 6 | ||||||||||||
|
Investment
securities - available for sale
|
277,824 | 277,824 | 240,175 | 240,175 | ||||||||||||
|
Investment
securities - held to maturity
|
4,974 | 4,936 | 2,990 | 2,906 | ||||||||||||
|
Net
loans
|
401,375 | 415,261 | 403,172 | 413,226 | ||||||||||||
|
Accrued
interest receivable
|
4,213 | 4,213 | 4,228 | 4,228 | ||||||||||||
|
Cash
surrender value of life insurance
|
17,622 | 17,622 | 17,157 | 17,157 | ||||||||||||
|
FINANCIAL
LIABILITIES:
|
||||||||||||||||
|
Deposits
|
580,569 | 558,389 | 504,633 | 499,922 | ||||||||||||
|
Short-term
borrowings
|
17,462 | 17,462 | 55,332 | 55,332 | ||||||||||||
|
Long-term
borrowings
|
82,976 | 86,771 | 82,062 | 87,555 | ||||||||||||
|
Accrued
interest and other expenses
|
3,101 | 3,101 | 3,488 | 3,488 | ||||||||||||
|
OFF-BALANCE
SHEET FINANCIAL INSTRUMENTS:
|
||||||||||||||||
|
Commitments
to extend credit
|
63,247 | 52,762 | ||||||||||||||
|
Financial
standby letters of credit
|
843 | 904 | ||||||||||||||
|
Performance
standby letters of credit
|
5,806 | 6,936 | ||||||||||||||
70
FIRST
KEYSTONE CORPORATION AND SUBSIDIARY
Notes
to Consolidated Financial Statements for the Years Ended December 31, 2009, 2008
and 2007
NOTE
23 — PARENT COMPANY FINANCIAL
INFORMATION
Condensed
financial information for First Keystone Corporation (parent company only) was
as follows:
|
BALANCE
SHEETS
|
||||||||
|
(Amounts
in thousands)
|
December 31
|
|||||||
|
2009
|
2008
|
|||||||
|
ASSETS
|
||||||||
|
Cash
in subsidiary bank
|
$ | 1,899 | $ | 1,380 | ||||
|
Investment
in subsidiary bank
|
79,618 | 74,804 | ||||||
|
Investment
in other equity securities
|
1,759 | 1,911 | ||||||
|
Prepayments
and other assets
|
683 | 650 | ||||||
|
TOTAL
ASSETS
|
$ | 83,959 | $ | 78,745 | ||||
|
LIABILITIES
|
||||||||
|
Advance
from subsidiary bank
|
$ | 9,792 | $ | 9,598 | ||||
|
TOTAL
LIABILITIES
|
$ | 9,792 | $ | 9,598 | ||||
|
STOCKHOLDERS’
EQUITY
|
||||||||
|
Preferred
stock
|
$ | — | $ | — | ||||
|
Common
stock
|
11,375 | 11,375 | ||||||
|
Surplus
|
30,269 | 30,269 | ||||||
|
Retained
earnings
|
41,346 | 38,414 | ||||||
|
Accumulated
other comprehensive income (loss)
|
(2,583 | ) | (4,671 | ) | ||||
|
Treasury
stock, at cost
|
(6,240 | ) | (6,240 | ) | ||||
|
TOTAL
STOCKHOLDERS’
EQUITY
|
$ | 74,167 | $ | 69,147 | ||||
|
TOTAL
LIABILITIES AND STOCKHOLDERS’
EQUITY
|
$ | 83,959 | $ | 78,745 | ||||
|
STATEMENTS
OF INCOME
|
||||||||||||
|
(Amounts
in thousands)
|
Year Ended December 31
|
|||||||||||
|
2009
|
2008
|
2007
|
||||||||||
|
INCOME
|
||||||||||||
|
Dividends
from Subsidiary Bank
|
$ | 5,427 | $ | 5,662 | $ | 10,459 | ||||||
|
Dividends
- other
|
57 | 100 | 107 | |||||||||
|
Securities
gains (losses)
|
(295 | ) | (542 | ) | 420 | |||||||
|
Interest
|
14 | 11 | 32 | |||||||||
|
TOTAL
INCOME
|
$ | 5,203 | $ | 5,231 | $ | 11,018 | ||||||
|
Operating
Expenses
|
67 | 86 | 89 | |||||||||
|
Income
Before Taxes and Equity in Undistributed Net Income of
Subsidiary
|
$ | 5,136 | $ | 5,145 | $ | 10,929 | ||||||
|
Income
tax expense
|
(81 | ) | (213 | ) | 160 | |||||||
|
Income
Before Equity in Undistributed Net Income of Subsidiary
|
$ | 5,217 | $ | 5,358 | $ | 10,769 | ||||||
|
Equity
in (excess of) Undistributed Net Income of Subsidiary
|
2,720 | 2,193 | (4,642 | ) | ||||||||
|
NET
INCOME
|
$ | 7,937 | $ | 7,551 | $ | 6,127 | ||||||
71
FIRST
KEYSTONE CORPORATION AND SUBSIDIARY
Notes
to Consolidated Financial Statements for the Years Ended December 31, 2009, 2008
and 2007
|
STATEMENTS
OF CASH FLOWS
|
||||||||||||
|
(Amounts
in thousands)
|
Year Ended December 31
|
|||||||||||
|
2009
|
2008
|
2007
|
||||||||||
|
OPERATING
ACTIVITIES
|
||||||||||||
|
Net
income
|
$ | 7,937 | $ | 7,551 | $ | 6,127 | ||||||
|
Adjustments
to reconcile net income to net cash provided by operating
activities:
|
||||||||||||
|
Securities
(gains) losses
|
295 | 105 | (420 | ) | ||||||||
|
Deferred
income tax benefit
|
59 | (196 | ) | — | ||||||||
|
Impairment
loss on investment securities
|
— | 437 | — | |||||||||
|
Equity
in (excess of) undistributed net income of subsidiary
|
(2,720 | ) | (2,193 | ) | 4,642 | |||||||
|
(Increase)
decrease in prepaid expenses and other assets
|
(86 | ) | (18 | ) | (56 | ) | ||||||
|
Increase
(decrease) in advances payable to subsidiary bank - net
operating
|
193 | 117 | 71 | |||||||||
|
Increase
(decrease) in accrued expenses and other liabilities
|
— | (102 | ) | 38 | ||||||||
|
NET
CASH PROVIDED BY OPERATING ACTIVITIES
|
$ | 5,678 | $ | 5,701 | $ | 10,402 | ||||||
|
INVESTING
ACTIVITIES
|
||||||||||||
|
Purchase
of equity securities
|
$ | (237 | ) | $ | — | $ | (765 | ) | ||||
|
Proceeds
from sale of equity securities
|
83 | 204 | 1,052 | |||||||||
|
Purchase
of bank
|
— | — | (16,539 | ) | ||||||||
|
NET
CASH PROVIDED BY (USED IN) INVESTING ACTIVITIES
|
$ | (154 | ) | $ | 204 | $ | (16,252 | ) | ||||
|
FINANCING
ACTIVITIES
|
||||||||||||
|
Proceeds
from sale of treasury stock
|
$ | — | $ | 1 | $ | — | ||||||
|
Acquisition
of treasury stock
|
— | — | (332 | ) | ||||||||
|
Cash
dividends paid
|
(5,005 | ) | (4,842 | ) | (4,179 | ) | ||||||
|
Advances
from subsidiary bank
|
— | — | 9,029 | |||||||||
|
NET
CASH PROVIDED BY (USED IN)
|
||||||||||||
|
FINANCING
ACTIVITIES
|
$ | (5,005 | ) | $ | (4,841 | ) | $ | 4,518 | ||||
|
INCREASE
(DECREASE) IN CASH AND CASH EQUIVALENTS
|
$ | 519 | $ | 1,064 | $ | (1,332 | ) | |||||
|
CASH
AND CASH EQUIVALENTS AT BEGINNING OF YEAR
|
1,380 | 316 | 1,648 | |||||||||
|
CASH
AND CASH EQUIVALENTS AT END OF YEAR
|
$ | 1,899 | $ | 1,380 | $ | 316 | ||||||
NOTE 24 — LOSS DUE TO
DEFALCATION
The
Corporation recorded a loss in the amount of $850,000, or $561,000 net of tax,
for the year ended December 31, 2009. It was determined by management through an
internal investigation that the defalcation was the result of unauthorized
activities of an employee (non-officer) of the Bank who has been terminated.
Management believes the defalcation will be a covered loss with insurance, less
the deductible. At the financial statement date, management is unable to
estimate the amount of recovery, if any, from an insurance policy that contains
coverage for this type of risk.
72
REPORT OF INDEPENDENT
REGISTERED PUBLIC ACCOUNTING FIRM
BOARD OF
DIRECTORS AND STOCKHOLDERS OF FIRST KEYSTONE CORPORATION
We have
audited First Keystone Corporation’s
internal control over financial reporting as of December 31, 2009, based on
criteria established in Internal
Control —
Integrated Framework issued by the Committee of Sponsoring Organizations
of the Treadway Commission (COSO). The Corporation’s
management is responsible for maintaining effective internal control over
financial reporting and for its assessment of the effectiveness of internal
control over financial reporting included in the accompanying Report of
Management on Internal Control over Financial Reporting. Our
responsibility is to express an opinion on of the Corporation’s
internal control over financial reporting based on our audit.
We
conducted our audit in accordance with the standards of the Public Company
Accounting Oversight Board (United States). Those standards require
that we plan and perform the audit to obtain reasonable assurance about whether
effective internal control over financial reporting was maintained in all
material respects. Our audit of internal control over financial
reporting included obtaining an understanding of internal control over financial
reporting, assessing the risk that a material weakness exists and testing and
evaluating the design and operating effectiveness of internal control based on
the assessed risk. Our audit also included performing such other procedures as
we considered necessary in the circumstances. We believe that our
audit provides a reasonable basis for our opinion.
A
company’s
internal control over financial reporting is a process designed to provide
reasonable assurance regarding the reliability of financial reporting and the
preparation of financial statements for external purposes in accordance with
accounting principles generally accepted in the United States of
America. A company’s
internal control over financial reporting includes those policies and procedures
that (1) pertain to the maintenance of records that, in reasonable detail,
accurately and fairly reflect the transactions and dispositions of the assets of
the company; (2) provide reasonable assurance that transactions are recorded as
necessary to permit preparation of financial statements in accordance with
accounting principles generally accepted in the United States of America and
that receipts and expenditures of the company are being made only in accordance
with authorizations of management and directors of the company; and (3) provide
reasonable assurance regarding prevention or timely detection of unauthorized
acquisition, use, or disposition of the company’s
assets that could have a material effect on the financial
statements.
Because
of its inherent limitations, internal control over financial reporting may not
prevent or detect misstatements. Also, projections of any evaluation
of effectiveness to future periods are subject to the risk that controls may
become inadequate because of changes in conditions, or that the degree of
compliance with the policies or procedures may deteriorate.
In our
opinion, First Keystone Corporation maintained, in all material respects,
effective internal control over financial reporting as of December 31, 2009,
based on criteria established in Internal
Control —
Integrated Framework issued by the Committee of Sponsoring Organizations
of the Treadway Commission (COSO).
We have
also audited, in accordance with the standards of the Public Company Accounting
Oversight Board (United States), the consolidated balance sheets of First
Keystone Corporation and Subsidiary as of December 31, 2009 and 2008 and the
related consolidated statements of income, changes in stockholders’
equity and cash flows for each of the years in the three-year period ended
December 31, 2009 and our report dated March 12, 2010 expressed an unqualified
opinion on those consolidated financial statements.
|
/s/ J. H. Williams & Co.,
LLP
|
||
|
J.
H. Williams & Co., LLP
|
Kingston,
Pennsylvania
March 12,
2010
73
|
ITEM
9.
|
CHANGES
IN AND DISAGREEMENTS WITH ACCOUNTANTS ON ACCOUNTING AND FINANCIAL
DISCLOSURE
|
Not
Applicable.
|
ITEM
9A.
|
CONTROLS
AND PROCEDURES
|
Evaluation
of Disclosure Controls and Procedures
The
Management of First Keystone Corporation (the “Corporation”),
with the participation of the Chief Executive Officer and Chief Financial
Officer, conducted an evaluation of the effectiveness of our disclosure controls
and procedures (as defined in Securities Exchange Act Rules 13a-15(e) or
15(d)-15(e)), as of December 31, 2009. Based upon such evaluation, the
Corporation’s
Chief Executive Officer and Chief Financial Officer have concluded that, as of
the end of such period, the Corporation’s
disclosure controls and procedures are effective in timely alerting them to
material information relating to the Corporation required to be included in our
periodic SEC filings.
During
the fourth quarter of 2009, management uncovered a defalcation in the pre-tax
amount of $850,000. The Corporation determined the defalcation was the result of
unauthorized activities by an employee of the Bank who was immediately
terminated. The Corporation expects insurance to cover the defalcation amount
less a $50,000 deductible.
Management’s
Report on Internal Control Over Financial Reporting
The
management of First Keystone Corporation is responsible for establishing and
maintaining adequate internal control over financial reporting. The
Corporation’s
internal control system was designed to provide reasonable assurance to the
Corporation’s
management and Board of Directors regarding the preparation and fair
presentation of published financial statements.
The
Corporation’s
internal control over financial reporting are supported by written policies that
pertain to the maintenance of records that, in reasonable detail, accurately and
fairly reflect transactions and dispositions of assets; provide reasonable
assurance that transactions are recorded as necessary to permit preparation of
financial statements in accordance with accounting principles generally accepted
in the United States of America, and that receipt and expenditures of the
Corporation are being made only in accordance with authorization of the
Corporation’s
management and Board of Directors; and provide reasonable assurance regarding
prevention or timely detection of unauthorized acquisition, use or disposition
of the Corporation’s
assets that could have a material effect on the consolidated financial
statements.
All
internal control systems, no matter how well designed, have inherent
limitations. Therefore, even those systems determined to be effective
can provide only reasonable assurance with respect to financial statement
preparation and presentation. Also, projections of any evaluation of
effectiveness to future periods are subject to the risk that controls may become
inadequate because of changes in conditions, or that the degree of compliance
with the policies or procedures may deteriorate.
The
management of First Keystone Corporation assessed the effectiveness of the
Corporation’s
internal control over financial reporting as of December 31, 2009. In
making this assessment, we used the criteria set forth by the Committee of
Sponsoring Organizations of the Treadway Commission (COSO) in Internal
Control —
Integrated Framework. Based on our assessment we believe that,
as of December 31, 2009, the Corporation’s
internal control over financial reporting is effective based on those
criteria.
First
Keystone Corporation’s
independent registered public accounting firm that audited the consolidated
financial statements has issued an audit report on our assessment of, and the
effective operation of, the Corporation’s
internal control over financial reporting as of December 31,
2009. This report appears on page 73.
74
Changes
in Internal Controls
In
response to the defalcation discussed above, the Audit Committee and the Board
of Directors has approved and management has implemented certain changes to the
Corporation’s
internal control over financial reporting which include: broadened segregation
and rotation of duties; intensified management oversight and analysis of general
ledger accounts; expanded documentation and approval procedures for certain
general ledger entries; and instituted an online, real-time core banking system.
In addition, management has instituted a program to require periodic testing of
these changes. The Corporation made no other changes in its internal controls or
in other factors that has materially affected, or is reasonably likely to
materially affect these controls subsequent to the date of the evaluation of the
controls by the Chief Executive and Chief Financial Officers.
|
ITEM
9B.
|
OTHER
INFORMATION
|
Not
Applicable.
PART
III
|
ITEM
10.
|
DIRECTORS,
EXECUTIVE OFFICERS AND CORPORATE
GOVERNANCE
|
The
information under the captions “Information
As To Directors and Nominees,”“Principal
Officers of the Bank and the Corporation”
and “Committees
of the Board of Directors”
are incorporated here by reference from First Keystone Corporation's proxy
statement for its 2010 annual meeting of shareholders scheduled for May 4,
2010. The information under the caption “Section
16(A) Beneficial Ownership Reporting Compliance”
and “Code
of Ethics”
are as follows:
SECTION
16(A) BENEFICIAL OWNERSHIP
REPORTING
COMPLIANCE
Section
16(a) of the Securities Exchange Act of 1934 requires the Corporation’s
directors, executive officers and shareholders who own more than 10% of the
Corporation’s
outstanding equity stock to file initial reports of ownership and reports of
changes in ownership of common stock and other equity securities of the
Corporation with the Securities and Exchange Commission. Based solely
on its review of copies of Section 16(a) forms received by it, or written
representations from reporting persons that no Form 5's were required for those
persons, the corporation believes that during the period January 1, 2009 through
December 31, 2009, its officers, directors and reporting shareholders were in
compliance with all filing requirements applicable to them.
CODE OF
ETHICS
The
Corporation has adopted a Directors and Senior Management Code of Ethical
Conduct, which applies to all members of the Board of Directors and to senior
officers of the Corporation. It can be found on the Investor
Relations section of our website at
www.firstkeystonecorporation.com.
|
ITEM 11.
|
EXECUTIVE
COMPENSATION
|
The
information under the captions “Executive
Compensation”
(pages 22 through 31), “Compensation
Discussion and Analysis (CD&A),”
Compensation Committee Interlocks and Insider Participation,”
and Compensation Committee Report”
are incorporated here by reference from First Keystone Corporation's proxy
statement for its 2010 annual meeting of shareholders scheduled for May 4,
2010.
75
|
ITEM 12.
|
SECURITY
OWNERSHIP OF CERTAIN BENEFICIAL OWNERS AND MANAGEMENT AND RELATED
SHAREHOLDER MATTERS
|
The
information under the caption “Share
Ownership”
and “Equity
Compensation Plan Information”
are incorporated here by reference from First Keystone Corporation's proxy
statement for its 2010 annual meeting of shareholders scheduled for May 4,
2010.
|
ITEM 13.
|
CERTAIN
RELATIONSHIPS AND RELATED TRANSACTIONS, AND DIRECTOR
INDEPENDENCE
|
The
information under the captions “Related
Person Transactions”
and “Governance
Of The Company”
are incorporated here by reference from First Keystone Corporation's proxy
statement for its 2009 annual meeting of shareholders scheduled for
May 4,
2010.
|
ITEM
14.
|
PRINCIPAL
ACCOUNTANT FEES AND SERVICES
|
The
information under the caption “Report
of the Audit Committee”
is incorporated here by reference from First Keystone Corporation’s
proxy statement for its 2010 annual meeting of shareholders scheduled for May 4,
2010.
PART
IV
|
ITEM
15.
|
EXHIBITS
AND FINANCIAL STATEMENT SCHEDULES
|
(a) 1. Financial
Statements
The
following consolidated financial statements are included in Part II, Item 8, of
this Report:
First
Keystone Corporation and Subsidiary.
|
Report
of Independent Registered Public Accounting Firm
|
33 | |||
|
Consolidated
Balance Sheets
|
34 | |||
|
Consolidated
Statements of Income
|
35 | |||
|
Consolidated
Statements of Stockholders’
Equity
|
36 | |||
|
Consolidated
Statements of Cash Flows
|
37 | |||
|
Notes
to Consolidated Financial Statements
|
38 | |||
|
Report
of Independent Registered Public Accounting Firm
|
73 |
2. Financial Statement
Schedules
Financial
statements schedules are omitted because the required information is either not
applicable, not required, or is shown in the financial statements or
in their notes.
76
3. Exhibits
Exhibits
required by Item 601 of Regulation S:
|
Exhibit Number Referred to
|
||
|
Item 601 of Regulation S-K
|
Description of Exhibit
|
|
|
3i
|
Articles
of Incorporation, as amended (Incorporated by reference to Exhibit 3(I) to
the Registrant's Report on Form 10-Q for the quarter ended March 31,
2006).
|
|
|
3ii
|
By-Laws,
as amended (Incorporated by reference to Exhibit 3(ii) to the Registrant's
Report on Form 8-K dated February 25, 2009).
|
|
|
10.1
|
Supplemental
Employee Retirement Plan (Incorporated by reference to Exhibit 10 to
Registrant's Annual Report on Form 10-Q for the quarter ended September
31, 2005).
|
|
|
10.2
|
Management
Incentive Compensation Plan (Incorporated by reference to Exhibit 10 to
Registrant's Report on Form 10-Q for the quarter ended September 30,
2006).
|
|
|
10.3
|
Profit
Sharing Plan (Incorporated by reference to Exhibit 10 to Registrant's
Report on Form 10-Q for the quarter ended September 30,
2006).
|
|
|
10.4
|
First
Keystone Corporation 1998 Stock Incentive Plan (Incorporated by reference
to Exhibit 10 to Registrant's Report on Form 10-Q for the quarter ended
September 30, 2006).
|
|
|
10.5
|
Employment
Agreement between First Keystone Corporation, First Keystone National Bank
and John G. Gerlach dated May 10, 2007 (Incorporated by reference to Annex
B to the Proxy Statement/Prospectus on the Registrant’s
Registration Statement on Form S-4, as amended (No.
333-145658)).
|
|
|
10.6
|
Consulting
Agreement between Keystone Corporation, First Keystone National Bank and
John G. Gerlach dated May 10, 2007 (Incorporated by reference to Annex C
to the Proxy Statement/Prospectus on the Registrant’s
Registration Statement on Form S-4, as amended (No.
333-145658)).
|
|
|
10.7
|
Form
of Non-Competition and Non-Solicitation Agreement by and between First
Keystone Corporation and the Pocono Community Bank directors (Incorporated
by reference to Annex F to the Proxy Statement/Prospectus on the
Registrant’s
Registration Statement on Form S-4, as amended (No.
333-145658)).
|
|
|
14
|
Code
of Ethics (Incorporated by reference to Exhibit 14 to Registrant’s
Report on Form 8-K dated January 9, 2007).
|
|
|
21
|
List
of Subsidiaries of the Corporation.
|
|
|
23
|
Consent
of Independent Auditors.
|
|
|
31.1
|
Rule
13a-14(a)/15d-14(a) Certification of Chief Executive
Officer.
|
|
|
31.2
|
Rule
13a-14(a)/15d-14(a) Certification of Chief Financial
Officer.
|
|
|
32.1
|
Section
1350 Certification of Chief Executive Officer.
|
|
|
32.2
|
Section
1350 Certification of Chief Financial
Officer.
|
77
SIGNATURES
Pursuant
to the requirements of Section 13 or 15(d) of the Securities Exchange Act
of 1934, the Registrant has duly caused this report to be signed on its behalf
by the undersigned, thereunto duly authorized.
|
FIRST
KEYSTONE CORPORATION
|
|
|
/s/ J. Gerald Bazewicz
|
|
|
J.
Gerald Bazewicz
|
|
|
President/Chief
Executive Officer
|
|
|
Date:
|
March 12,
2010
|
Pursuant
to the requirements of the Securities Exchange Act of 1934, this report has been
signed below by the following persons on behalf of the Registrant and in the
capacities and on the dates indicated.
|
/s/ John Arndt
|
March 12, 2010
|
|
|
John
Arndt, Secretary/Director
|
Date
|
|
|
/s/ J. Gerald Bazewicz
|
March 12, 2010
|
|
|
J.
Gerald Bazewicz, President/
|
Date
|
|
|
Chief
Executive Officer/Director
|
||
|
/s/ Don E. Bower
|
March 12, 2010
|
|
|
Don
E. Bower, Director
|
Date
|
|
|
/s/ Robert A. Bull
|
March 12, 2010
|
|
|
Robert
A. Bull, Director
|
Date
|
|
|
/s/ Robert E. Bull
|
March 12, 2010
|
|
|
Robert
E. Bull, Chairman/Director
|
Date
|
|
|
/s/ Joseph B. Conahan, Jr.
|
March 12, 2010
|
|
|
Joseph
B. Conahan, Jr., Director
|
Date
|
|
|
/s/ Jerome F. Fabian
|
March 12, 2010
|
|
|
Jerome
F. Fabian, Director
|
Date
|
|
|
/s/ John G. Gerlach
|
March 12, 2010
|
|
|
John
G. Gerlach, Director
|
Date
|
|
|
/s/ Diane C. A. Rosler
|
March 12, 2010
|
|
|
Diane
C.A. Rosler, Chief Financial Officer
|
Date
|
|
|
/s/ David R. Saracino
|
March 12, 2010
|
|
|
David
R. Saracino, Director
|
Date
|
78