Attached files
| file | filename |
|---|---|
| EX-3.2 - EXHIBIT 3.2 - DELTEK, INC | dex32.htm |
| EX-21.1 - EXHIBIT 21.1 - DELTEK, INC | dex211.htm |
| EX-23.1 - EXHIBIT 23.1 - DELTEK, INC | dex231.htm |
| EX-31.2 - EXHIBIT 31.2 - DELTEK, INC | dex312.htm |
| EX-14.1 - EXHIBIT 14.1 - DELTEK, INC | dex141.htm |
| EX-32.1 - EXHIBIT 32.1 - DELTEK, INC | dex321.htm |
| EX-31.1 - EXHIBIT 31.1 - DELTEK, INC | dex311.htm |
| EX-10.17 - EXHIBIT 10.17 - DELTEK, INC | dex1017.htm |
| EX-10.15 - EXHIBIT 10.15 - DELTEK, INC | dex1015.htm |
| EX-10.16 - EXHIBIT 10.16 - DELTEK, INC | dex1016.htm |
| EX-10.18 - EXHIBIT 10.18 - DELTEK, INC | dex1018.htm |
Table of Contents
UNITED STATES
SECURITIES AND EXCHANGE COMMISSION
Washington, D.C. 20549
FORM 10-K
| x | ANNUAL REPORT PURSUANT TO SECTION 13 OR 15(d) OF THE SECURITIES EXCHANGE ACT OF 1934 |
For the fiscal year ended December 31, 2009
OR
| ¨ | TRANSITION REPORT PURSUANT TO SECTION 13 OR 15(d) OF THE SECURITIES EXCHANGE ACT OF 1934 |
For the transition period from to
Commission File Number 001-33772
DELTEK, INC.
(Exact Name of Registrant as Specified in Its Charter)
| Delaware | 13880 Dulles Corner Lane, Herndon, Virginia 20171 | 54-1252625 | ||
| (State of Incorporation) | (Address of Principal Executive Offices) (Zip Code) | (IRS Employer Identification No.) |
Registrant’s Telephone Number, Including Area Code: (703) 734-8606
Securities registered pursuant to Section 12(b) of the Act:
| Title of each class | Name of each exchange on which registered | |
| common stock, par value $0.001 per share | The NASDAQ Global Select Market |
Securities registered pursuant to Section 12(g) of the Act:
Not applicable
Indicate by check mark if the registrant is a well-known seasoned issuer, as defined in Rule 405 of the Securities Act. Yes ¨ No x
Indicate by check mark if the registrant is not required to file reports pursuant to Section 13 or Section 15(d) of the Act. Yes ¨ No x
Indicate by check mark whether the registrant: (1) has filed all reports required to be filed by Section 13 or 15(d) of the Securities Exchange Act of 1934 during the preceding 12 months (or for such shorter period that the registrant was required to file such reports), and (2) has been subject to such filing requirements for the past 90 days. Yes x No ¨
Indicate by check mark whether the registrant has submitted electronically and posted on its corporate Web site, if any, every Interactive Data File required to be submitted and posted pursuant to Rule 405 of Regulation S-T (§232.405 of this chapter) during the preceding 12 months (or for such shorter period that the registrant was required to submit and post such files). Yes ¨ No ¨
Indicate by check mark if disclosure of delinquent filers pursuant to Item 405 of Regulation S-K is not contained herein, and will not be contained, to the best of registrant’s knowledge, in definitive proxy or information statements incorporated by reference in Part III of this Form 10-K or any amendment to this Form 10-K. x
Indicate by check mark whether the registrant is a large accelerated filer, an accelerated filer, a non-accelerated filer, or a smaller reporting company. See definitions of “large accelerated filer,” “accelerated filer,” and “smaller reporting company” in Rule 12b-2 of the Exchange Act. (Check one):
| Large accelerated filer ¨ | Accelerated filer x | Non-accelerated filer ¨ (Do not check if a smaller reporting company) |
Smaller reporting company ¨ |
Indicate by check mark whether the registrant is a shell company (as defined in Rule 12b-2 of the Exchange Act). Yes ¨ No x
The aggregate market value of the common stock of the registrant held by non-affiliates (based on the last reported sale price of the registrant’s common stock on June 30, 2009 on the Nasdaq Global Market) was approximately $63.4 million.
The number of shares of the registrant’s common stock and Class A common stock outstanding on March 9, 2010 was 67,235,668 and 100, respectively.
Documents incorporated by reference: Portions of the Proxy Statement for the 2010 Annual Meeting of Stockholders of the registrant to be filed subsequently with the Securities and Exchange Commission are incorporated by reference into Part III of this report.
Table of Contents
DELTEK, INC.
| Page | ||||
| Item 1. |
2 | |||
| Item 1A. |
12 | |||
| Item 1B. |
27 | |||
| Item 2. |
27 | |||
| Item 3. |
27 | |||
| Item 4. |
27 | |||
| Item 5. |
28 | |||
| Item 6. |
30 | |||
| Item 7. |
Management’s Discussion and Analysis of Financial Condition and Results of Operations |
31 | ||
| Item 7A. |
54 | |||
| Item 8. |
54 | |||
| Item 9. |
Changes In and Disagreements with Accountants on Accounting and Financial Disclosure |
54 | ||
| Item 9A. |
54 | |||
| Item 9B. |
57 | |||
| Item 10. |
57 | |||
| Item 11. |
57 | |||
| Item 12. |
Security Ownership of Certain Beneficial Owners and Management and Related Stockholder Matters |
57 | ||
| Item 13. |
Certain Relationships and Related Transactions, and Director Independence |
57 | ||
| Item 14. |
57 | |||
| Item 15. |
58 | |||
| 59 | ||||
i
Table of Contents
CERTAIN DEFINITIONS
All references in this Annual Report on Form 10-K to “Deltek,” “Company,” “we,” “us” and “our” refer to Deltek, Inc. and its consolidated subsidiaries (unless the context otherwise indicates).
FORWARD-LOOKING INFORMATION
This Annual Report on Form 10-K contains forward-looking statements, within the meaning of the Federal securities laws, about our business and prospects. Any statements contained herein that are not statements of historical fact may be deemed to be forward-looking statements. Without limiting the foregoing, the words “outlook,” “believes,” “plans,” “intends,” “expects,” “goals,” “potential,” “continues,” “may,” “seeks,” “approximately,” “predicts,” “estimates,” “anticipates” and similar expressions are intended to identify forward-looking statements, although not all forward-looking statements contain these words. Our future results may differ materially from our past results and from those projected in the forward-looking statements due to various uncertainties and risks, including those described in Item 1A of Part I (Risk Factors). The forward-looking statements speak only as of the date of this Annual Report and undue reliance should not be placed on these statements. We disclaim any obligation to update any forward-looking statements after the date of this Annual Report. The forward-looking statements do not include the potential impact of any mergers, acquisitions, divestitures, securities offerings or business combinations that may be announced or closed after the date hereof.
1
Table of Contents
| Item 1. | Business |
Company Overview
Since our founding in 1983, we have established a leading position as a provider of enterprise applications software and related services designed and developed specifically for project-focused organizations. These organizations include architectural and engineering (A/E) firms, government contractors, aerospace and defense contractors, information technology services firms, professional services and consulting organizations, discrete project manufacturing companies, grant-based not-for-profit organizations and government agencies, among others.
These project-focused organizations generate revenue from defined, discrete, customer-specific engagements or activities. Project-focused organizations typically require specialized software to help them automate complex business processes around the engagement, execution and delivery of projects. Our software applications enable project-focused organizations to significantly enhance the visibility they have over all aspects of their operations by providing them increased control over their critical business processes, accurate, project-specific financial information, and real-time performance measurements.
With our software solutions, project-focused organizations can better measure business results, optimize performance, streamline operations, identify partners and win new business. As of December 31, 2009, we have over 12,000 customers worldwide that spanned numerous project-focused industries and ranged in size from small organizations to large enterprises. In addition, over 8,500 organizations and professionals rely on our innovative online govWin solution to find, capture and deliver on revenue-generating government contracting opportunities.
Our enterprise applications software solutions provide end-to-end business process functionality designed to streamline and manage the complex business processes of project-focused organizations. Our software solutions are “purpose-built” for businesses that plan, forecast and otherwise manage their business processes based on projects, as opposed to generic software solutions that are generally designed for repetitive, unit-production-style businesses. Our broad portfolio of software applications includes:
| • | Comprehensive financial management solutions that integrate project control, financial processing and accounting functions, providing business owners and project managers with real-time access to information needed to track the revenue, costs and profitability associated with the performance of any project or activity; |
| • | Business applications that enable employees across project-focused organizations to more effectively manage and streamline business processes, including resource management, sales generation, human resources, corporate governance and performance management; |
| • | Enterprise project management solutions to plan and manage project costs and schedules, measure earned value, evaluate, select and prioritize projects based on strategic business objectives and facilitate compliance with regulatory reporting requirements; and |
| • | Business development solutions that enable customers to effectively manage the business development process, discover partnership opportunities and leverage new revenue-generating opportunities. |
See Item 7, “Company Overview” and “History” for information related to the development of our business.
Industry Overview
Enterprise applications software provides organizations with the ability to streamline, automate and integrate a variety of business processes, including financial management, supply chain management, human capital management, project and resource management, customer relationship management, manufacturing and business performance management.
2
Table of Contents
General purpose enterprise application vendors typically are not able to meet the needs of project-focused businesses effectively because they lack project-focused capabilities and market-specific functionality. Adapting and customizing general-purpose application software to meet the needs of project-focused businesses and organizations frequently results in significantly higher deployment costs and longer implementation times and can require increased levels of ongoing support. It can also result in missing or inaccurate metrics that are critical to driving better business performance.
The project-focused business software market is a separate category of enterprise applications software. The unique characteristics of project-focused organizations create special requirements for their business applications that frequently surpass the capabilities of generic applications software packages (for example, those designed primarily for manufacturing or financial services firms). Project-focused organizations require sophisticated, highly integrated software applications that automate end-to-end business processes across each stage of the project lifecycle. Project lifecycles vary significantly in length and complexity and can be difficult to forecast accurately. These projects need to be managed within the context of a company’s complete portfolio of existing and potential future projects.
Project-focused organizations often operate in environments or industries that pose unique challenges for their managers, who are frequently required to maintain specific business processes and accounting methodologies to meet contract requirements. For example, government contractors are subject to oversight by various U.S. federal government agencies, such as the Government Accountability Office (“GAO”) and the Defense Contract Audit Agency (“DCAA”), which have regulations requiring government contractors to be able to accurately maintain and audit specific project-based accounting records and to report on their compliance with government cost accounting requirements.
We believe that spending on software and technology related to the project-focused software business market will continue because of the increased regulatory environment that applies to government contractors and the large number of small and medium-sized businesses that require specialized software and technology.
Our Competitive Strengths
Our key competitive strengths include the following:
| • | Superior Value Proposition. Our software applications offer built-in project functionality at their core, making them faster and less costly to deploy, use and maintain when compared to general purpose enterprise applications. Our modular software architecture also enables our products to be deployed as a comprehensive solution or as individual applications, which provides our customers with the flexibility to select the applications that are relevant to them. Conversely, generic “one size fits all” applications software often requires extensive customization to add the specific functionality needed to manage complex project-focused organizations. This customization usually requires significantly more time and expense for the customer to install, operate and maintain the software. |
| • | Built-In Processes and Compliance. Project-focused organizations are often challenged with tracking and complying with intricate accounting policies and procedures, auditing requirements, contract terms and customer expectations. Our software is designed to make it easy for project managers and business executives to accurately monitor and measure specific project performance in detail with consistent application of business processes. Our applications also enable our customers to maintain records and report compliance with contract requirements to government agencies and their customers. |
| • | Deep Domain Expertise. For more than 26 years, our exclusive focus on meeting the complex needs of project-focused organizations has provided us with extensive knowledge and industry expertise. Our significant subject matter expertise enables us to deliver, implement, sell and support applications that are tailored to the existing and future needs of our customers. |
3
Table of Contents
| • | Leading Market Position. We are a leading provider of enterprise applications software designed specifically for project-focused organizations. Our customer base includes leading federal information technology contractors, A/E firms, professional services and consultant organizations, information technology services companies and aerospace and defense companies. |
Our Business Strategy and Growth Opportunities
We plan to focus on the following objectives to enhance our position as a leading provider of enterprise applications software to project-focused organizations:
| • | Expanding Penetration of Established Markets. We believe that our strong brand recognition and leading market position within the project-focused software market, particularly among the A&E and government contracting industries, provide us with significant opportunities to expand our sales within these markets with new and existing solutions and applications. |
| • | Expanding Within Existing Customer Base. We are continuously looking to increase our sales to our existing customers, both by increasing the number of our applications utilized by them and by offering upgrades from our legacy applications to our current portfolio. We offer a broad range of project-focused software applications addressing a variety of business processes and regularly introduce additional functionality to further expand the capabilities of our applications as well as simplify and accelerate deployment of our existing products. We also introduce new products through internal development, acquisitions and partnering with third parties. We believe that customers experiencing the benefits afforded by our applications will look to us as they expand the scope of business processes that they seek to automate. |
| • | Growing Our Presence in New Markets. We believe that our experience and success in attaining leadership in a number of key project-focused industries provides us with the opportunity to penetrate additional project-focused markets. We are building upon our track record of customer successes outside our established markets in industries such as consulting, information technology services, discrete project manufacturing and grant-based not-for-profits. We continue to develop additional industry-specific product functionality and are investing in targeted sales and marketing activities for new markets. |
| • | Growing Internationally. We believe it is important to expand our presence outside the United States, as we believe project-focused organizations in Canada, the United Kingdom, Europe, Middle East, Africa and the Asia-Pacific region are currently underserved for the products we offer. We have increased our international resources and capabilities to expand our international presence. |
| • | Making Strategic Acquisitions. We have acquired numerous companies or product lines to broaden our product portfolio, expand our customer base, and add additional development, services and support resources. We plan to continue to pursue acquisitions that present a strong strategic fit with our existing operations and are consistent with our overall growth strategy. We also may target future acquisitions of varying sizes to expand or add product functionality and capabilities to our existing product portfolio, add new products or solutions to our product portfolio or further expand our services team. |
4
Table of Contents
Our Products and Services
Products
We provide integrated solutions that are designed to meet the evolving needs of project-focused organizations of various sizes and complexity. These organizations use our software to automate critical business processes across all phases of the project lifecycle, including business development, project selection and prioritization, resource allocation, project planning and scheduling, team collaboration, risk mitigation, accounting, reporting and analysis. Our portfolio of applications is designed to provide the following benefits to our customers:
| • | Improving Business Decisions. Our applications enable decision makers to analyze multiple facets of their businesses in real-time and improve decision making by providing reporting, business intelligence, planning and analytical capabilities. |
| • | Optimizing Resources. Our applications allow resource planners to schedule, allocate, budget and forecast resource needs across multiple projects based on numerous factors, including required skill sets, location, availability and timing. As a result, resource planners can determine whether proposed fees are accurate, appropriate staff is available and utilized effectively, and projects are completed on time and on budget. |
| • | Winning New Business. Our customer relationship management applications enable our customers’ sales and marketing groups to generate demand for their services, build stronger customer relationships, manage project pipelines, more accurately forecast revenue, automate proposals and create accurate estimates for proposed services. |
| • | Streamlining Business Operations. Our applications help organizations lower transaction processing costs, improve billing processes, improve cash flow and reduce administrative burdens on employees through the automation of a variety of key business processes, including time collection, expense management and employee self-service. |
| • | Facilitating Compliance and Governance. Our applications help organizations comply with complex accounting and auditing requirements and report compliance to government agencies and their customers and maintain standardized controls around key business processes. |
| • | Managing, Evaluating and Prioritizing Projects. Our applications enable our customers to efficiently manage project profitability, monitor project schedule and progress, and evaluate, select and prioritize projects based on strategic business objectives. In addition, our earned value management applications enable organizations to plan and monitor the complex relationships between actual and forecasted project costs, schedules, actual progress and earned revenue. |
| • | Managing Business Development Opportunities. Our solutions enable our customers to manage their entire business development process and convert partnership prospects into revenue-generating opportunities. |
5
Table of Contents
Our applications portfolio is comprised of four major product families, each designed to meet the specific functionality and scalability requirements of the project-focused industries and customers we serve. The following table outlines our major product families:
| Product |
Features and Functionality |
Targeted Customers and Value Proposition | ||
| Deltek Costpoint |
• Provides a comprehensive financial management solution that tracks, manages and reports on key aspects of a project: planning, estimating, proposals, budgets, expenses, indirect costs, purchasing, billing, regulatory compliance and materials management.
• Includes a portfolio of business applications that deliver specialized functionality such as time collection, expense management, employee self-service, business performance management and human capital management.
• Includes govWin and Costpoint CRM, solutions that enable customers to manage the entire business development process, discover teaming partners and uncover revenue-generating opportunities.
• Scales to support complex business processes and large numbers of concurrent users. |
• Sophisticated medium- and large-scale project-focused organizations such as government contractors and commercial project-focused organizations.
• Customers purchase Costpoint to manage complex project portfolios and to facilitate compliance with detailed regulatory requirements. The Costpoint product family includes a broad set of scalable, integrated applications that streamline project-focused business processes across multiple disciplines and geographic locations. | ||
| Deltek Vision |
• An integrated solution that incorporates critical business functions, including project accounting, customer relationship management, resource management, time and expense capture and billing.
• Provides decision makers with real-time information across all business processes, allowing them to identify project trends and risks to facilitate decision making, improve business performance and align users around common goals.
• Highlights key performance indicators to determine project health and provides “one-click” access to project details needed to pinpoint and quickly resolve root causes of issues. |
• Professional services firms of all sizes, including A/E, information technology, design and management consulting firms.
• Customers purchase Vision for its ability to automate end-to-end business processes for project-focused firms, its intuitive Web-based interface and its innovative capabilities such as mobile device support and executive dashboards. | ||
6
Table of Contents
| Product |
Features and Functionality |
Targeted Customers and Value Proposition | ||
| Deltek GCS Premier | • Provides a robust accounting and project management solution that is cost effective, easy to use and helps firms comply with DCAA and other regulatory requirements.
• Provides a full view of project and financial information, enabling firms to respond quickly and accurately to variations in plans and profit projections. |
• Small and medium-sized government contractors who find that the limitations of spreadsheets and traditional small-business accounting packages prevent them from meeting government audit requirements in a cost-effective way.
• Customers purchase GCS for its ease of installation, built-in functionality and compliance with government regulations and reporting requirements and proven track record of customer success. | ||
| Deltek Enterprise Project Management |
• Provides a comprehensive solution for enterprise project management.
• Includes Deltek Cobra and Deltek MPM, market-leading systems for managing project costs, measuring earned value and analyzing budgets, actual costs and forecasts. With Cobra and MPM, businesses can measure the health and performance of projects and satisfy government-mandated regulations.
• Includes Deltek Open Plan, an enterprise-grade project management system, and Deltek wInsight, a leading tool for calculating, analyzing, sharing, consolidating and reporting on earned value data.
• Our enterprise project management solutions offer risk management and reporting tools and support many industry-standard third-party project scheduling tools. |
• Government contractors and professional services firms of all sizes that manage complex project portfolios. Our enterprise project management solutions help firms select the right projects, allocate resources across projects, mitigate risks and ultimately complete projects on time and on budget.
• Customers purchase our enterprise project management software for its ability to offer end-to-end capabilities in project selection, planning, risk assessment, resource balancing and earned value management reporting. | ||
Consulting Services
We employ a services team that provides a full range of consulting and technical services, from the early planning and design stages of an implementation to end-user training and after-implementation consulting services. Our services team is comprised of application consultants, project managers and technical applications specialists who work closely with our customers to implement and maintain our software solutions. Our primary consulting services offerings may be categorized into the following activities:
| • | Solution architecture services that align our applications and software solutions with our customers’ business processes and needs; |
| • | Application implementation services for our products, including business process design, software installation and configuration, application security, data conversion, integration with legacy applications and project management; |
7
Table of Contents
| • | Technology architecture design and optimization services that allow for the configuration of our applications and related third-party software and hardware configuration in our customers’ specific technology environments; |
| • | Project team and end-user training for our customers and partners in the functionality, configuration, administration and use of our products, including classroom training at various internal facilities, which we refer to as Deltek University; classroom training at customer sites; public seminars and webinars; and self-paced, self-study e-learning modules; and |
| • | After-implementation consulting services, including version upgrade consulting, system productivity review, industry best practice consulting, network/database maintenance services, acquisition integration support and long-term business system planning. |
Maintenance and Support
We receive maintenance services fees from customers for product support, upgrades and other customer services. Our technical support organization focuses on answering questions, resolving issues and keeping our customers’ operations running efficiently. We offer technical support through in-person phone-based support and through 24x7 access to our web-based support tools. Our comprehensive support programs also include ongoing product development and software updates, which includes minor enhancements, such as tax and other regulatory updates, as well as major updates such as new functionality and technology upgrades.
Our maintenance and support revenues are comprised of fees derived from new maintenance contracts associated with new software licenses and renewals of existing maintenance contracts. Initial annual maintenance fees are generally set as a fixed percentage of the software list price at the time of the initial license sale. Maintenance services are generally billed and paid in advance.
Customers
We consider a customer to be an organization that has licensed our software, or obtained maintenance support or consulting services for those licenses, pursuant to a written agreement or a “click-wrap” license that is activated upon installation.
Our solutions are used by organizations of various sizes, from small businesses to large enterprises. As of December 31, 2009, we had over 12,000 customers worldwide representing a wide range of industries, including A/E firms, aerospace and defense and other federal government contractors, information technology services firms, professional services and consulting organizations, discrete project manufacturing companies, grant-based not-for-profit organizations and government agencies, among others. In addition, over 8,500 government contractors participate in our collaborative online govWin solution to find, capture and deliver on revenue-generating business development opportunities.
In 2007, 2008 and 2009, no single customer accounted for 10% or more of our total revenue, and less than 6% of our total revenue was generated from international customers.
The percentage of our license revenue generated from international customers increased from 6% in 2008 to 9% in 2009. More than 94% of our total revenue was generated from customers inside the United States in 2007, 2008 and 2009.
See Note 18, Segment Information, of our consolidated financial statements contained elsewhere in this Annual Report for additional information related to our revenue derived from international customers. See Item 2, “Properties” for information related to our long-lived assets located in the United States and in foreign countries.
8
Table of Contents
Sales and Marketing
We sell our products primarily through our own sales force complemented by a network of indirect sales partners. Our direct sales force consists of experienced software sales professionals organized by customer type (for example, new vs. existing) market segment or product type. Our sales teams all operate under a common sales methodology that focuses on the individual markets and customers we serve. Our network of alliance partners complements our direct sales efforts by selling our products to specific customer segments and providing implementation services and support to our customers. These alliance partners primarily serve our Vision product family, support our international sales activity and provide sales and implementation support for our products sold to the entry level government contracting and professional services markets. Our indirect sales channel is comprised of independent reseller partners who primarily cover entry level markets. In 2009, our direct sales force generated approximately 91% of our software license fee revenue and our indirect sales channel was responsible for the remaining 9%.
We engage in a variety of marketing activities, including market research, product promotion and participation at industry conferences and trade shows, in order to generate additional revenue within key markets, optimize our market position, enhance lead generation, increase overall brand awareness and promote our new and existing products.
Partners and Alliances
An important component of our business strategy is to maintain and form alliances to better enable us to market, sell and implement our software and services. Our existing alliances encompass a wide variety of technology companies, business services firms, value-added resellers, accounting firms, specialized consulting firms, software vendors, business process outsourcers and other service providers. These alliances enable us to:
| • | Provide infrastructure technologies on which our products operate, including database, hardware and platform solutions; |
| • | Provide applications that leverage our customers’ existing information technology infrastructure; |
| • | Provide applications that complement and integrate with our products; |
| • | Provide our customers with additional point solution functionality complementing their Deltek applications; |
| • | Sell our products into new markets and geographies; |
| • | Promote wider acceptance and adoption of our solutions; |
| • | Receive referrals from accounting, tax and related advisory service providers; |
| • | Provide managed services for our solutions; |
| • | Provide off-site hosting and/or managed infrastructure services; |
| • | Offer an alternative to our customers that would rather outsource systems administration and information technology management; |
| • | Provide products and business services that complement back-office systems, such as forms and checks; and |
| • | Offer additional products and features to our customer base. |
Research and Development
Our research and development organization is structured to optimize our efforts around the design, development and release of our products. Specific disciplines within research and development include engineering, programming, quality assurance, product management, documentation, design and project management. Our research and development expenses were $43.4 million, $45.8 million, and $42.9 million in 2009, 2008 and 2007, respectively. As of December 31, 2009, we had approximately 350 employees in research and development, including approximately 200 in the United States, 140 in the Philippines and 10 in Australia.
9
Table of Contents
Technology
In the development of our software, we use broadly adopted, standards-based software technologies in order to create, maintain and enhance our project-focused solutions. Our developed solutions are generally both scalable and easily integrated into our customers’ existing information technology infrastructure. Our software design and engineering efforts are tailored to meet specific requirements of project-focused enterprises and provide the optimal experience for end-users who interact with our software to accomplish their job requirements.
The specific architecture and platform for each of our major product families is as follows:
| • | The Vision application suite offers a full range of highly integrated applications, which incorporate critical business functions, including project accounting, customer relationship management, resource management, time and expense capture and billing. Vision is a completely web-native software application based on the latest Microsoft platform technologies, including Microsoft.NET (“.NET”), Microsoft SQL Server and the Microsoft Office System. Designed for small and medium-sized businesses, Vision is intended to minimize the technology burden on firms with limited information technology staff. |
| • | The Costpoint application suite is designed to automate and manage complex project-focused business processes for larger organizations. Built using Java 2 Platform, Enterprise Edition (“J2EE”) technology, Costpoint is highly configurable and modular, enabling our customers to support project-centric business processes and large workloads. Costpoint’s modular architecture supports seamless integration of business applications which deliver specialized functionality such as time collection, expense management, business performance management, employee self-service and human capital management. |
| • | GCS Premier is a turnkey Windows application designed for small and medium-sized government contracting organizations. Built using .NET platform technologies, this solution is designed to be easy to install, learn and maintain with minimal information technology support. |
| • | Our Enterprise Project Management Solutions product line provides a comprehensive enterprise project management solution for our customers, including earned value management throughout the project lifecycle. Generally built using .NET and other web-based technologies, these solutions integrate with our own applications as well as third-party applications. This product line also includes a secure, web-based collaboration portal that provides the ability for distributed team members to collaborate on a project. |
| • | Our govWin solution, which allows customers to find, capture and deliver on revenue-generating government contracting opportunities, is an online network developed with web technologies based on PHP and Java. |
Our products are designed for rapid deployment and integration with third-party technologies within a company’s enterprise, including application servers, security systems and portals. Costpoint and Vision also provide web services interfaces and support for Service-Oriented Architectures to facilitate enhanced integration within the enterprise.
Competition
The global enterprise applications market for project-focused organizations is competitive. When competing for large enterprise customers with over 1,000 employees, we face the greatest competition from large, well-capitalized competitors such as Oracle and SAP. These larger vendors seek to influence customers’ purchase decisions by emphasizing their more comprehensive horizontal product portfolios, greater global presence and more sophisticated multi-national product capabilities. In addition, these vendors commonly bundle their enterprise resource planning solutions with a broader set of software applications, including middleware and database applications, and often significantly discount their individual solutions as part of a potentially larger sale.
10
Table of Contents
When competing for middle-market customers, ranging in size from 100 to 1,000 employees, we often face competition from a few vendors that provide industry-specific solutions. Middle-market customers are typically searching for industry specific functionality, ease of deployment and a lower total cost of ownership with the ability to add functionality over time as their businesses continue to grow.
When competing in the small business segment, which consists of organizations with fewer than 100 employees, we face competition from certain providers of solutions aimed at smaller businesses. Customers in the small business segment typically are searching for solutions which provide out-of-the-box functionality that help automate business processes and improve operational efficiency.
Although some of our competitors are larger organizations, have greater marketing resources and offer a broader range of applications and infrastructure, we believe that we compete effectively on the basis of our superior value proposition, built-in compliance functionality, domain expertise, leading market position and highly referenceable customer base.
Intellectual Property
We rely upon a combination of copyright, trade secret and trademark laws and non-disclosure and other contractual arrangements to protect our proprietary intellectual property rights under our license agreements. These measures may afford only limited protection of our intellectual property and proprietary rights associated with our software. We also enter into confidentiality agreements with employees and consultants involved in product development. We routinely require our employees, customers and potential business partners to enter into confidentiality agreements before we disclose any sensitive aspects of our software, technology or business plans.
We also incorporate a number of third-party software products into our technology platform pursuant to relevant licenses. We use third-party software, in certain cases, to meet the business requirements of our customers. We are not materially dependent upon these third-party software licenses, and we believe the licensed software is generally replaceable, by either licensing or purchasing similar software from another vendor or building the software functions ourselves.
Employees
As of December 31, 2009, we had approximately 1,140 employees worldwide, including approximately 150 in sales and marketing, 350 in product development, 470 in customer services and support and 170 in general and administrative positions. Of our approximately 1,140 worldwide employees, approximately 925 were located in the United States and 215 were located internationally. None of our employees is represented by a union or is a party to a collective bargaining agreement.
Available Information
We make our Annual Reports on Form 10-K, Quarterly Reports on Form 10-Q, Current Reports on Form 8-K and amendments to those reports available on our website (http://investor.deltek.com), free of charge, as soon as reasonably practicable after we have electronically filed or furnished such materials to the Securities and Exchange Commission. These filings are also available on the Securities and Exchange Commission’s website (www.sec.gov).
11
Table of Contents
| Item 1A. | Risk Factors |
Risks Related to Our Business
Our business is exposed to the risk that adverse economic or financial conditions may reduce or defer the demand for project-based enterprise applications software and solutions.
The demand for project-based enterprise applications software and solutions historically has fluctuated based upon a variety of factors, including the business and financial condition of our customers and on economic and financial conditions that affect the key sectors in which our customers operate.
Economic downturns or unfavorable changes in the financial and credit markets in both the United States and broader international markets, including economic recessions, could have an adverse effect on the operations, budgets and overall financial condition of our customers.
As a result, our customers may reduce their overall spending on information technology, purchase fewer of our products or solutions, lengthen sales cycles, or delay, defer or cancel purchases of our products or solutions. Furthermore, our customers may be less able to timely finance or pay for the products which they have purchased or could be forced into a bankruptcy or restructuring process, which could limit our ability to recover amounts owed to us. If any of our customers cease operations or file for bankruptcy protection, our ability to recover amounts owed to us for software license fees, consulting and implementation services or software maintenance may be severely impaired.
In addition, the financial and overall condition of third-party solutions providers and resellers of our products and solutions may be affected by adverse conditions in the economy and the financial and credit markets, which may adversely affect the sale of our products or solutions. For the twelve months ended December 31, 2009, resellers accounted for approximately 9% of our software license fee revenue.
We cannot predict the impact, timing, strength or duration of any economic slowdown or subsequent economic recovery, or of any disruption in the financial and credit markets. If the challenges in the financial and credit markets or the downturn in the economy or the markets in which we operate persist or worsen from present levels, our business, financial condition, cash flow, and results of operations could be materially adversely affected.
Our quarterly and annual operating results fluctuate, and as a result, we may fail to meet or exceed the expectations of securities analysts or investors, and our stock price could decline.
Historically, our operating results have varied from quarter to quarter and from year to year. Consequently, we believe that investors should not view our historical revenue and other operating results as an indicator of our future performance. A number of factors contribute to the variability in our revenue and other operating results, including the following:
| • | global and domestic economic and financial conditions; |
| • | the number and timing of major customer contract wins, which tend to be unpredictable and which may disproportionately impact our software license fee revenue and operating results; |
| • | the highest concentration of our software license sales is typically in the last month of each quarter resulting in diminished predictability of our quarterly results; |
| • | the higher concentration of our software license sales in the last quarter of each fiscal year, resulting in diminished predictability of our annual results; |
| • | the discretionary nature of our customers’ purchases, varying budget cycles and amounts available to fund purchases resulting in varying demand for our products and services; |
| • | delays or deferrals by customers in the implementation of our products; |
12
Table of Contents
| • | the level of product and price competition; |
| • | the length of our sales cycles; |
| • | the timing of recognition of deferred revenue; |
| • | any significant change in the number of customers renewing or terminating maintenance agreements with us; |
| • | our ability to deliver and market new software enhancements and products; |
| • | announcements of technological innovations by us or our competitors; |
| • | the relative mix of products and services we sell; |
| • | developments with respect to our intellectual property rights or those of our competitors; and |
| • | our ability to attract, train and retain qualified personnel. |
As a result of these and other factors, our operating results may fluctuate significantly from period to period and may not meet or exceed the expectations of securities analysts or investors. In that event, the price of our common stock could be adversely affected.
If we are unable to effectively respond to organizational challenges as our business evolves, our revenues, profitability and business reputation could be materially adversely affected.
Between 2006 and 2009 our total revenue increased from $228.3 million to $265.8 million, or approximately 16%. During this same period, our worldwide headcount increased from approximately 1,040 employees at the end of 2006 to approximately 1,140 employees worldwide at the end of 2009.
Continuing to expand and develop our business will place greater demands on our management, financial and accounting systems, information technology systems and other components of our infrastructure. To meet these demands, we continue to invest in enhanced or new systems, including enhancements to our accounting, billing and information technology systems. Although we have reduced headcount in the past two years, we continue to hire, train and retain employees with the specific skills needed to help address these demands.
If we fail to address the demands associated with the expansion and development of our business, our profitability and our business reputation could be materially adversely affected.
If we are unsuccessful in entering new market segments or further penetrating our existing market segments, our revenue or revenue growth could be materially adversely affected.
Our future results depend, in part, on our ability to successfully penetrate new markets, as well as to expand further into our existing markets. In order to grow our business, we may expand to other project-focused markets in which we may have less experience. Expanding into new markets requires both considerable investment and coordination of technical, support, sales, marketing and financial resources.
While we continually add functionality to our products to address the specific needs of both existing customers and new customers, we may be unsuccessful in developing appropriate or complete products, devoting sufficient resources or pursuing effective strategies for product development and marketing.
Our current or future products may not appeal to potential customers in new or existing markets. If we are unable to execute upon this element of our business strategy and expand into new markets or maintain and increase our market share in our existing markets, our revenue or revenue growth may be materially adversely affected.
13
Table of Contents
If our existing customers do not buy additional software and services from us, our revenue and revenue growth could be materially adversely affected.
Our business model depends, in part, on the success of our efforts to maintain and increase sales to our existing customers. We have typically generated significant additional revenues from our installed customer base through the sale of additional new licenses, add-on applications, expansion of existing implementations and professional and maintenance services. We may be unsuccessful in maintaining or increasing sales to our existing customers for any number of reasons, including the failure of our customers to increase the size of their operations, our inability to deploy new applications and features for our existing products or to introduce new products and services that are responsive to the business needs of our customers. If we fail to generate additional business from our customers, our revenue and profitability could be materially adversely affected.
If we do not successfully address the potential risks associated with our current or future global operations, we could experience increased costs or our operating results could be materially adversely affected.
We currently have customers in approximately 70 countries and have facilities in the Philippines, Australia and the United Kingdom.
Doing business internationally involves additional potential risks and challenges, including:
| • | managing international operations, including a global workforce; |
| • | conforming our products to local business practices or standards, including developing multi-lingual compatible software; |
| • | developing brand awareness for our products; |
| • | competing with local and international software vendors; |
| • | disruptions in international communications resulting from damage to, or disruptions of, telecommunications links, gateways, cables or other systems; |
| • | potential difficulties in collecting accounts receivable and longer collection periods in countries where the accounts receivable collections process may be more difficult; |
| • | potentially unstable political and economic conditions in countries in which we do business or maintain development operations; |
| • | potentially higher operating costs resulting from local laws, regulations and market conditions; |
| • | foreign currency controls and fluctuations resulting from intercompany balances or arrangements associated with our international operations; |
| • | reduced protection for intellectual property rights in a number of countries where we do business; |
| • | compliance with frequently changing governmental laws and regulations; |
| • | seasonality in business activity specific to various markets that is different than our recent historical experience; |
| • | potentially longer sales cycles in certain international markets; |
| • | potential restrictions on repatriation of earnings, including changes in the tax treatment of our international operations; and |
| • | potential restrictions on the export of technologies such as data security and encryption. |
These risks could increase our costs or adversely affect our operating results.
14
Table of Contents
If we are not successful in expanding our international business, our revenue growth could be materially adversely affected.
We have customers in approximately 70 countries and international markets now account for approximately 9% of our total software license fee revenue. Nonetheless, our ability to accelerate our international expansion will require us to deliver additional product functionality and foreign language translations that are responsive to the needs of the international customers that we target. If we are unable to expand our qualified direct sales force, identify additional strategic alliance partners, or negotiate favorable alliance terms, our international growth may be hampered. Our ability to expand internationally also is dependent on our ability to raise brand recognition for our products in international markets. If we are unable to further our expansion into international markets, our revenue and profitability could be materially adversely affected. In addition, our planned international expansion will require significant attention from our management as well as additional management and other resources in these markets.
We may be subject to integration and other risks from acquisition activities, which could materially impair our ability to realize the anticipated benefits of any acquisitions.
As part of our business strategy, we have acquired and intend to continue to acquire complementary businesses, technologies, product lines or services organizations. We may not realize the anticipated strategic or financial benefits of past or potential future acquisitions due to a variety of factors, including the following:
| • | the potential difficulty in integrating acquired products and technology into our software applications and business strategy; |
| • | the potential inability to achieve the desired revenue or cost synergies and benefits; |
| • | the potential difficulty in coordinating and integrating the sales, marketing, services, support and development activities of the acquired businesses, successfully cross selling products or services and managing the combined organizations; |
| • | the potential difficulty in retaining the strategic alliance partners of the acquired businesses on terms that are acceptable to us; |
| • | the potential difficulty in retaining, integrating, training and motivating key employees of the acquired business; |
| • | the potential difficulty and cost of establishing and integrating controls, procedures and policies; |
| • | the potential difficulty in predicting and responding to issues related to product transition, including product development, distribution and customer support; |
| • | the possibility that customers of the acquired business may not support any changes associated with our ownership of the acquired business and that as a result they may transition to products offered by our competitors, or may attempt to renegotiate contract terms or relationships, including maintenance agreements; |
| • | the acquisition may result in unplanned disruptions to our ongoing business and may divert management from day-to-day operations due to a variety of factors, including integration issues; |
| • | the possibility that goodwill or other intangible assets may become impaired and will need to be written off in the future; |
| • | the potential failure of the due diligence process to identify significant issues, including product quality, architecture and development issues or legal and financial contingencies (including ongoing maintenance or service contract concerns); and |
| • | lack of legal protection for the intellectual property we acquire. |
15
Table of Contents
If a significant number of our customers fail to renew or otherwise terminate their maintenance services agreements for our products, or if they are successful in renegotiating their agreements with us on terms that are unfavorable to us, our maintenance services revenues and our operating results could be materially harmed.
Our customers contract with us for ongoing product maintenance and support services. Historically, maintenance services revenues have represented a significant portion of our total revenue. Revenues from maintenance services constituted approximately 47% and 40% of our total revenue in 2009 and 2008, respectively.
Our maintenance and support services are generally billed and paid in advance. A customer may cancel its maintenance services agreement prior to the beginning of the next scheduled period. At the end of a contract term, or at the time a customer has cancellation rights, a customer could seek a modification of its maintenance services agreement terms, including modifications that could result in lower maintenance fees or our providing additional services without associated fee increases.
A customer may also elect to terminate its maintenance services agreement and rely on its own in-house technical staff or other third-party resources, or may replace our software with a competitor’s product. If our maintenance services business declines due to a significant number of contract terminations, or if we are forced to offer pricing or other maintenance terms that are unfavorable to us, our maintenance services revenues and operating results could be materially adversely affected.
If we fail to forecast the timing of our revenues or expenses accurately, our operating results could be materially different than we anticipated.
We use a variety of factors in our forecasting and planning processes, including historical trends, recent customer history, expectations of customer buying decisions, customer implementation schedules and plans, analyses by our sales and service teams, maintenance renewal rates, our assessment of economic or market conditions and many other factors. While these analyses may provide us with some guidance in business planning and expense management, these estimates are inherently imprecise and may not accurately predict the timing of our revenues or expenses. A variation in any or all of these factors, particularly in light of prevailing financial or economic conditions, could cause us to inaccurately forecast our revenues or expenses and could result in expenditures without corresponding revenue. As a result, our revenues and our operating results could be materially lower than anticipated.
To maintain our competitive position, we may be forced to reduce prices or limit price increases, which could result in materially reduced revenue, margins or net income.
We face significant competition across all of our product lines from a variety of sources, including larger multi-national software companies, smaller start-up organizations, point solution application providers, specialized consulting organizations, systems integrators and internal information technology departments of existing or potential customers. Several competitors, such as Oracle, SAP and Microsoft, have significantly greater financial, technical and marketing resources than we have.
In addition, some of our competitors have well-established relationships with our current and prospective customers and with major accounting and consulting firms that may prefer to recommend those competitors over us. Our competitors may also seek to influence some customers’ purchase decisions by offering more comprehensive horizontal product portfolios, superior global presence and more sophisticated multi-national product capabilities.
To maintain our competitive position, we may be forced to reduce prices or limit price increases, which could materially reduce our revenue, margins or net income.
16
Table of Contents
Our indebtedness or an inability to borrow additional amounts or refinance our debt could adversely affect our results of operations and financial condition and prevent us from fulfilling our financial obligations and business objectives.
As of December 31, 2009, we had approximately $179.0 million of outstanding debt under our credit agreement and term loans at interest rates which are subject to market fluctuation. In 2010, approximately $45 million of principal will become due and payable. Our indebtedness and related obligations could have important future consequences to us, such as:
| • | potentially limiting our ability to obtain additional financing to fund growth, working capital, capital expenditures or to meet existing debt service or other cash requirements; |
| • | exposing us to the risk of increased interest costs if the underlying interest rates rise significantly; |
| • | potentially limiting our ability to invest operating cash flow in our business due to existing debt service requirements; or |
| • | increasing our vulnerability to economic downturns and changing market conditions. |
Our ability to meet our existing debt service obligations, borrow additional funds or refinance our existing debt will depend on many factors, including prevailing financial or economic conditions, and our past performance and our financial and operational outlook. If we do not have enough cash to satisfy our debt service obligations, we may be required to refinance all or part of our existing debt, sell assets or reduce our spending. At any given time, we may not be able to refinance our debt or sell assets on terms acceptable to us or at all.
If we are unable to comply with the covenants or restrictions contained in our amended credit agreement, our lenders could declare all amounts outstanding under the credit agreement to be due and payable, which could materially adversely affect our financial condition.
In August 2009, we entered into an amended credit agreement (the “Amended Credit Agreement”) governing our term loans and revolving credit facility. The Amended Credit Agreement contains covenants that, among other things, restrict our and our subsidiaries’ ability to dispose of assets, incur additional indebtedness, incur guarantee obligations, pay dividends, create liens on assets, enter into sale and leaseback transactions, make investments, loans or advances, make acquisitions, engage in mergers or consolidations, change the business conducted by us and engage in certain transactions with affiliates.
Our Amended Credit Agreement also requires us to comply with certain financial ratios related to fixed charge coverage, interest coverage and leverage ratios. While we have historically complied with our financial ratio covenants, we may not be able to comply with these financial covenants in the future, which could cause all amounts outstanding to be due and payable, and which could limit our ability to meet ongoing or future capital needs. Our ability to comply with the covenants and restrictions contained in our Amended Credit Agreement may be adversely affected by economic, financial, industry or other conditions, some of which may be beyond our control.
The potential breach of any of the covenants or restrictions contained in our Amended Credit Agreement, unless cured within the applicable grace period, could result in a default under the Amended Credit Agreement that would permit the lenders to declare all amounts outstanding to be due and payable, together with accrued and unpaid interest. In such an event, we may not have sufficient assets to repay such indebtedness. As a result, any default could have serious consequences to our financial condition.
17
Table of Contents
If we defer recognition of software license fee revenue for a significant period of time after entering into a license agreement as a result of leveraging new sales or revenue-generating opportunities, our operating results in any particular quarter could be materially impacted.
We may be required to defer recognition of software license fee revenue from a license agreement with a customer if, for example:
| • | the software transactions include both currently deliverable software products and software products that are under development or require other undeliverable elements; |
| • | a particular customer requires services that include significant modifications, customizations or complex interfaces that could delay product delivery or acceptance; |
| • | the software transactions involve customer acceptance criteria; |
| • | there are identified product-related issues, such as known defects; |
| • | the software transactions involve payment terms that are longer than our standard payment terms, fees that depend upon future contingencies or include fixed-price deliverable elements; or |
| • | under the applicable accounting requirements, we are unable to separate recognition of software license fee revenue from maintenance or other services-related revenue, thereby requiring us to defer software license fee revenue recognition until the services are provided. |
Deferral of software license fee revenue may result in significant timing differences between the completion of a sale and the actual recognition of the revenue related to that sale. However, we generally recognize commission and other sales-related expenses associated with sales at the time they are incurred. As a result, if we are required to defer a significant amount of revenue, our operating results in any quarter could be materially adversely affected.
To the extent we sell any of our software solutions on a subscription basis, and if we fail to price or market those products appropriately, our software license fee revenue and cash flow could be materially reduced.
Our software license fee revenues are generally derived from the sale of perpetual licenses for software products. Each license fee generally is paid on a one-time basis either on a per-seat basis or as an enterprise license, and related revenue is generally recognized at the time the license is executed. Nearly all of our software license fee revenue for 2009 and 2008 was generated from the sale of perpetual licenses.
We have recently begun to offer some of our software products and solutions on a subscription basis. If more of our customers find subscription-based software appealing, we may need to offer additional products and solutions on a subscription basis. We may not successfully price, market or otherwise execute a subscription-based model. If we increase the use of a subscription-based licensing model, we could experience materially reduced software license fee revenues and cash flows associated with the transition to a subscription based licensing model.
If our investments in product development require greater resources than anticipated, our operating margins could be adversely affected.
We expect to continue to commit significant resources to maintain and improve our existing products and to develop new products. For example, our product development expenses were approximately $43.4 million, or 16% of revenue in 2009 and approximately $45.8 million, or 16% of revenue, in 2008. Our current and future product development efforts may require greater resources than we expect, or may not achieve the market acceptance that we expect and, as a result, we may not achieve margins we anticipate.
We may also be required to price our product enhancements, product features or new products at levels below those anticipated during the product development stage, which could result in lower revenues and margins for that product than we originally anticipated.
18
Table of Contents
We also may experience unforeseen or unavoidable delays in delivering product enhancements, product features or new products due to factors within or outside of our control. We may encounter unforeseen or unavoidable defects or quality control issues when developing product enhancements, product features or new products, which may require additional expenditures to resolve such issues and may affect the reputation our products have for quality and reliability. If we incur greater expenditures than we expect for our product development efforts, or if our products do not succeed, our revenues or margins could be materially adversely affected.
If we fail to adapt to changing technological and market trends or changing customer requirements, our market share could decline and our sales and profitability could be materially adversely affected.
Historically, the business application software market has been characterized by rapidly changing technologies, evolving industry standards, frequent new product introductions and short product lifecycles. The development of new technologically advanced software products is a complex and uncertain process requiring high levels of innovation, as well as accurate anticipation of technological and market trends.
Our future success will largely depend upon our ability to develop and introduce timely new products and product features in order to maintain or enhance our competitive position. The introduction of enhanced or new products requires us to manage the transition from, or integration with, older products in order to minimize disruption in sales of existing products and to manage the overall process in a cost-effective manner. If we do not successfully anticipate changing technological and market trends or changing customer requirements, and we fail to enhance or develop products timely, effectively and in a cost-effective manner, our ability to retain or increase market share may be harmed, and our sales and profitability could be materially adversely affected.
If our existing or prospective customers prefer an application software architecture other than the standards-based technology and platforms upon which we build or support our products, or if we fail to develop our new product enhancements or products to be compatible with the application software architecture preferred by existing and prospective customers, we may not be able to compete effectively, and our software license fee revenue could be materially reduced.
Many of our customers operate their information technology infrastructure on standards-based application software platforms such as J2EE and .NET. A significant portion of our product development is devoted to enhancing our products that deploy these and other standards-based application software platforms.
If our products are not compatible with future technologies and platforms that achieve industry standard status, we will be required to spend material development resources to develop products or product enhancements that are deployable on these platforms. If we are unsuccessful in developing these products or product enhancements, we may lose existing customers or be unable to attract prospective customers.
In addition, our customers may choose competing products other than our offerings based upon their preference for new or different standards-based application software than the software or platforms on which our products operate or are supported. Any of these adverse developments could injure our competitive position and could cause our software license fee revenue to be materially adversely affected.
Our software products are built upon and depend upon operating platforms and software developed and supplied by third parties. As a result, changes in the availability, features and price of, or support for, any of these third-party platforms or software, including as a result of the platforms or software being acquired by a competitor, could materially increase our costs, divert resources and materially adversely affect our competitive position and software license fee revenue.
Our software products are built upon and depend upon operating platforms and software developed by third-party providers. We license from several software providers technologies that are incorporated into our products. Our software may also be integrated with third-party vendor products for the purpose of providing or enhancing necessary functionality.
19
Table of Contents
If any of these operating platforms or software products ceases to be supported by its third-party provider, or if we lose any technology license for software that is incorporated into our products, including as a result of the platforms or software being acquired by a competitor, we may need to devote increased management and financial resources to migrate our software products to an alternative operating platform, identify and license equivalent technology or integrate our software products with an alternative third-party vendor product. In addition, if a provider enhances its product in a manner that prevents us from timely adapting our products to the enhancement, we may lose our competitive advantage, and our existing customers may migrate to a competitor’s product.
Third-party providers may also not remain in business, cooperate with us to support our software products or make their product available to us on commercially reasonable terms or provide an effective substitute product to us and our customers. Any of these adverse developments could materially increase our costs and materially adversely affect our competitive position and software license fee revenue.
If we lose access to, or fail to obtain, third-party software development tools on which our product development efforts depend, we may be unable to develop additional applications and functionality, and our ability to maintain our existing applications may be diminished, which may cause us to incur materially increased costs, reduced margins or lower revenue.
We license software development tools from third parties and use those tools in the development of our products. Consequently, we depend upon third parties’ abilities to deliver quality products, correct errors, support their current products, develop new and enhanced products on a timely and cost-effective basis and respond to emerging industry standards and other technological changes. If any of these third-party development tools become unavailable, if we are unable to maintain or renegotiate our licenses with third parties to use the required development tools, or if third-party developers fail to adequately support or enhance the tools, we may be forced to establish relationships with alternative third-party providers and to rewrite our products using different development tools.
We may be unable to obtain other development tools with comparable functionality from other third parties on reasonable terms or in a timely fashion. In addition, we may not be able to complete the development of our products using different development tools, or we may encounter substantial delays in doing so. If we do not adequately replace these software development tools in a timely manner, we may incur additional costs, which may materially reduce our margins or revenue.
If our products fail to perform properly due to undetected defects or similar problems, and if we fail to develop an enhancement to resolve any defect or other software problem, we could be subject to product liability, performance or warranty claims and incur material costs, which could damage our reputation, result in a potential loss of customer confidence and adversely impact our sales, revenue and operating results.
Our software applications are complex and, as a result, defects or other software problems may be found during development, product testing, implementation or deployment. In the past, we have encountered defects in our products as they are introduced or enhanced. If our software contains defects or other software problems:
| • | we may not be paid; |
| • | a customer may bring a warranty claim against us; |
| • | a customer may bring a claim for their losses caused by our product failure; |
| • | we may face a delay or loss in the market acceptance of our products; |
| • | we may incur unexpected expenses and diversion of resources to remedy the problem; |
| • | our reputation and competitive position may be damaged; and |
| • | significant customer relations problems may result. |
20
Table of Contents
Our customers use our software together with software and hardware applications and products from other companies. As a result, when problems occur, it may be difficult to determine the cause of the problem, and our software, even when not the ultimate cause of the problem, may be misidentified as the source of the problem. The existence of defects or other software problems, even when our software is not the source of the problem, might cause us to incur significant costs, divert the attention of our technical personnel from our product development efforts for a lengthy time period, require extensive consulting resources, harm our reputation and cause significant customer relations problems.
If our products fail to perform properly, we may face liability claims notwithstanding that our standard customer agreements contain limitations of liability provisions. A material claim or lawsuit against us could result in significant legal expense, harm our reputation, damage our customer relations, divert management’s attention from our business and expose us to the payment of material damages or settlement amounts. In addition, interruption in the functionality of our products or other defects could cause us to lose new sales and materially adversely affect our license and maintenance services revenues and our operating results.
A breach in the security of our software could harm our reputation and subject us to material claims, which could materially harm our operating results and financial condition.
Fundamental to the use of enterprise application software, including our software, is the ability to securely process, collect, analyze, store and transmit information. Third parties may attempt to breach the security of our solutions, third party applications that our products interface with, as well as customer databases and actual data. In addition, cyber attacks and similar acts could lead to interruptions and delays in customer processing or a loss or breach of a customer’s data.
We may be responsible, and liable, to our customers for certain breaches in the security of our software products. Any security breaches for which we are, or are perceived to be, responsible, in whole or in part, could subject us to claims, which could harm our reputation and result in significant litigation costs and damage awards or settlement amounts. Any imposition of liability, particularly liability that is not covered by insurance or is in excess of insurance coverage, could materially harm our operating results and financial condition. We might be required to expend significant financial and other resources to protect further against security breaches or to rectify problems caused by any security breach.
If we are not able to retain existing employees or hire qualified new employees, our business could suffer, and we may not be able to execute our business strategy.
Our business strategy and future success depends, in part, upon our ability to attract, train and retain highly skilled managerial, professional service, sales, development, marketing, accounting, administrative and infrastructure-related personnel. The market for these highly skilled employees is generally competitive in the geographies in which we operate.
Our business could be adversely affected if we are unable to retain qualified employees or recruit qualified personnel in a timely fashion, or if we are required to incur unexpected increases in compensation costs to retain key employees or meet our hiring goals. If we are not able to retain and attract the personnel we require, it could be more difficult for us to sell and develop our products and services and execute our business strategy, which could lead to a material shortfall in our anticipated results. Furthermore, if we fail to manage these costs effectively, our operating results could be materially adversely affected.
The loss of key members of our senior management team could disrupt the management of our business and materially impair the success of our business.
We believe that our success depends on the continued contributions of the members of our senior management team. We rely on our executive officers and other key managers for the successful performance of our business. Although we have employment arrangements with several members of our senior management
21
Table of Contents
team, none of these arrangements prevents any of our employees from leaving us. The loss of the services of one or more of our executive officers or key managers could have an adverse effect on our operating results and financial condition.
If we are not able to protect our intellectual property and other proprietary rights, we may not be able to compete effectively, and our software license fee revenue could be materially adversely affected.
Our success and ability to compete is dependent in significant degree on our intellectual property, particularly our proprietary software. We rely on a combination of copyrights, trademarks, trade secrets, confidentiality procedures and contractual provisions to establish and protect our rights in our software and other intellectual property. Despite our efforts to protect our proprietary rights, unauthorized parties may attempt to copy, design around or reverse engineer aspects of our products or to obtain and use information that we regard as proprietary.
Our competitors may independently develop software that is substantially equivalent or superior to our software. Furthermore, existing copyright law affords only limited protection for our software and may not protect such software in the event competitors independently develop products similar to ours.
We take significant measures to protect the secrecy of our proprietary source code. Despite these measures, unauthorized disclosure of some of or all of our source code could occur. Such unauthorized disclosure could potentially cause our source code to lose intellectual property protection and make it easier for third parties to compete with our products by copying their functionality, structure or operation.
In addition, the laws of some countries may not protect our proprietary rights to the same extent as do the laws of the United States. Therefore, we may not be able to protect our proprietary software against unauthorized third-party copying or use, which could adversely affect our competitive position and our software license fee revenue. Any litigation to protect our proprietary rights could be time consuming and expensive to prosecute or resolve, result in substantial diversion of management attention and resources, and could be unsuccessful, which could result in the loss of material intellectual property and other proprietary rights.
Potential future claims that we infringe upon third parties’ intellectual property rights could be costly and time-consuming to defend or settle or result in the loss of significant products, any of which could materially adversely impact our revenue and operating results.
Third parties could claim that we have infringed upon their intellectual property rights. Such claims, whether or not they have merit, could be time consuming to defend, result in costly litigation, divert our management’s attention and resources from day-to-day operations or cause significant delays in our delivery or implementation of our products.
We could also be required to cease to develop, use or market infringing or allegedly infringing products, to develop non-infringing products or to obtain licenses to use infringing or allegedly infringing technology. We may not be able to develop alternative software or to obtain such licenses or, if a license is obtainable, we cannot be certain that the terms of such license would be commercially acceptable.
If a claim of infringement were threatened or brought against us, and if we were unable to license the infringing or allegedly infringing product or develop or license substitute software, or were required to license such software at a high royalty, our revenue and operating results could be materially adversely affected.
In addition, we agree, from time to time, to indemnify our customers against certain claims that our software infringes upon the intellectual property rights of others. We could incur substantial costs in defending our customers against such claims.
22
Table of Contents
Catastrophic events may disrupt our business and could result in materially increased expenses, reduced revenues and profitability and impaired customer relationships.
We are a highly automated business and rely on our network infrastructure, enterprise applications and internal and external technology and infrastructure systems for our development, sales, marketing, support and operational activities. A disruption or failure of any or all of these systems could result from catastrophic events, whether climate related or otherwise, including major telecommunications failures, cyber attacks, terrorist attacks, fires, earthquakes, storms or other severe weather conditions. A disruption or failure of any or all of these systems could cause system interruptions to our operations, including product development, sales-cycle or product implementation delays, as well as loss of data or other disruptions to our relationships with current or potential customers.
The disaster recovery plans and backup systems that we have in place may not be effective in addressing a catastrophic event that results in the destruction or disruption of any of our critical business or information technology and infrastructure systems. As a result of any of these events, we may not be able to conduct normal business operations and may be required to incur significant expenses in order to resume normal business operations. As a result, our revenues and profitability may be materially adversely affected.
Our revenues are partially dependent upon federal government contractors and their need for compliance with Federal Government contract accounting and reporting standards, as well as data privacy and security requirements. Our failure to anticipate or adapt timely to changes in those standards could cause us to lose government contractor customers and materially adversely affect our revenue generated from these customers.
We derive a significant portion of our revenues from federal government contractors. In 2009 and 2008, over half of our software license fee revenue was generated from federal government contractor customers. Our government contractor customers utilize our Deltek Costpoint, Deltek GCS Premier or our enterprise project management applications to manage their contracts and projects with the Federal Government in a manner that accounts for expenditures in accordance with the Federal Government contracting accounting standards. These customers also have a requirement to maintain stringent data privacy and security safeguards.
For example, a key function of our Costpoint application is to enable government contractors to enter, review and organize accounting data in a manner that is compliant with applicable laws and regulations and to easily demonstrate compliance with those laws and regulations. If the Federal Government alters these compliance standards, or if there were any significant problem with the functionality of our software from a compliance or data security perspective, we may be required to modify or enhance our software products to satisfy any new or altered compliance standards. Our inability to effectively and efficiently modify our applications to resolve any compliance issue could result in the loss of government contract customers and materially adversely impact our revenue from these customers.
Significant reductions in the Federal Government’s budget or changes in the spending priorities for that budget could materially reduce government contractors’ demand for our products and services.
The Federal Government’s budget is subject to annual renewal and may be increased or decreased, whether on an overall basis or on a basis that could disproportionately injure our customers. Any significant downsizing, consolidation or insolvency of our Federal Government contractor customers resulting from changes in procurement policies, budget reductions, loss of government contracts, delays in contract awards or other similar procurement obstacles could materially adversely impact our customers’ demand for our software products and related services and maintenance.
Impairment of our goodwill or intangible assets may adversely impact our results of operations.
We have acquired several businesses which, in aggregate, have resulted in goodwill valued at approximately $63.9 million and other purchased intangible assets valued at approximately $13.7 million as of December 31,
23
Table of Contents
2009. This represents a significant portion of the assets recorded on our balance sheet. Goodwill and indefinite-lived intangible assets are reviewed for impairment at least annually or sooner under certain circumstances. Other intangible assets that are deemed to have finite useful lives will continue to be amortized over their useful lives but must be reviewed for impairment when events or changes in circumstances indicate that the carrying amount of these assets may not be recoverable. Screening for and assessing whether impairment indicators exist, or if events or changes in circumstances have occurred, including market conditions, operating fundamentals, competition and general economic conditions, requires significant judgment by management.
We performed tests for impairment of goodwill and intangible assets and determined that there was no impairment as of December 31, 2009. However, there can be no assurances that a charge to operations will not occur in the event of a future impairment. The decrease in the price of our stock that has occurred from time to time and may occur in the future increases the possibility of such an impairment in future periods. If an impairment is deemed to exist in the future, we would be required to write down the recorded value of these intangible assets to their then current estimated fair values. If a write down were to occur, it could materially adversely impact our results of operations and our stock price.
If we were to identify material weaknesses in our internal controls in the future, these material weaknesses may impede our ability to produce timely and accurate financial statements, result in inaccurate financial reporting or restatements of our financial statements, subject our stock to delisting and materially harm our business reputation and stock price.
As a public company, we are required to file annual and quarterly periodic reports containing our financial statements with the Securities and Exchange Commission within prescribed time periods. As part of The NASDAQ Global Select Market listing requirements, we are also required to provide our periodic reports, or make them available, to our stockholders within prescribed time periods.
If we were to identify material weaknesses in our internal control in the future, the required audit or review of our financial statements by our independent registered public accounting firm may be delayed. In addition, we may not be able to produce reliable financial statements, file our financial statements as part of a periodic report in a timely manner with the Securities and Exchange Commission or comply with The NASDAQ Global Select Market listing requirements. If we are required to restate our financial statements in the future, any specific adjustment may cause our operating results and financial condition, as restated, on an overall basis to be materially impacted.
If these events were to occur, our common stock listing on The NASDAQ Global Select Market could be suspended or terminated and, absent a waiver, we also would be in default under our credit agreement and our lenders could accelerate any obligation we have to them. We, or members of our management, could also be subject to investigation and sanction by the Securities and Exchange Commission and other regulatory authorities and to stockholder lawsuits. In addition, our stock price could decline, we could face significant unanticipated costs, management’s attention could be diverted and our business reputation could be materially harmed.
Risks Related to Ownership of Our Common Stock
Our stock price has been volatile and could continue to remain volatile for a variety of reasons, resulting in a substantial loss on your investment.
The stock markets generally have experienced extreme and increasing volatility, often unrelated to the operating performance of the individual companies whose securities are traded publicly. Broad market fluctuations and general economic and financial conditions may materially adversely affect the trading price of our common stock.
Significant price fluctuations in our common stock also could result from a variety of other factors, including:
| • | actual or anticipated fluctuations in our operating results or financial condition; |
| • | our competitors’ announcements of significant contracts, acquisitions or strategic investments; |
| • | changes in our growth rates or our competitors’ growth rates; |
24
Table of Contents
| • | conditions of the project-focused software industry; |
| • | securities analysts’ commentary about us or our industry; and |
| • | any other factor described in this “Risk Factors” section of this Annual Report. |
In addition, if the market value of our common stock falls below the book value of our assets, we could be forced to recognize an impairment of our goodwill or other assets. If this were to occur, our operating results would be adversely affected and the price of our common stock could be negatively impacted.
Future sales of our common stock by existing stockholders could cause our stock price to decline.
New Mountain Partners II, L.P., New Mountain Affiliated Investors II, L.P., and Allegheny New Mountain Partners, L.P. (collectively, the “New Mountain Funds”), our controlling stockholders, own more than 60% of outstanding common stock. If the New Mountain Funds were to sell substantial amounts of our common stock in the public market or if the market perceives that our stockholders may sell shares of our common stock, the market price of our common stock could decrease significantly.
The New Mountain Funds have the right, subject to certain conditions, to require us to register the sale of their shares under the federal securities laws. If this right is exercised, holders of other shares and, in certain circumstances, stock options may sell their shares alongside the New Mountain Funds, which could cause the prevailing market price of our common stock to decline. The majority of our common stock (and all shares of common stock underlying options outstanding under our 2005 Stock Option Plan and certain shares of common stock underlying options and restricted stock outstanding under our 2007 Stock Award and Incentive Plan) are, directly or indirectly, subject to a registration rights agreement.
We have also filed registration statements with the Securities and Exchange Commission covering shares subject to options and restricted stock outstanding under our 2005 Stock Option Plan and 2007 Plan and shares reserved for issuance under our 2007 Plan and our Employee Stock Purchase Plan.
A decline in the trading price of our common stock due to the occurrence of any future sales might impede our ability to raise capital through the issuance of additional shares of our common stock or other equity securities and may cause stockholders to lose part or all of their investment in our shares of common stock.
Our largest stockholders and their affiliates have substantial control over us and this could limit other stockholders’ ability to influence the outcome of key transactions, including any change of control.
Our largest stockholders, the New Mountain Funds, own more than 60% of our outstanding common stock and 100% of our Class A common stock. As a result, the New Mountain Funds are able to control all matters requiring approval by our stockholders, including the election of directors and the approval of mergers or other significant corporate transactions. The New Mountain Funds will retain the right to elect a majority of our directors so long as they own our Class A common stock and at least one-third of our outstanding common stock.
In addition, the New Mountain Funds will have the benefit of the rights conferred by the investor rights agreement, and New Mountain Capital, L.L.C. will continue to have certain rights under their advisory agreement. These rights include the ability to elect a majority of the members of the board of directors and control all matters requiring stockholder approval, including any transaction subject to stockholder approval (such as a merger or a sale of substantially all of our assets), as long as they collectively own a majority of the outstanding shares of our Class A common stock and at least one-third of the outstanding shares of our common stock.
The New Mountain Funds are also entitled to collect a transaction fee, unless waived by them, on a transaction by transaction basis, equal to 2% of the transaction value of each significant transaction exceeding $25 million in value directly or indirectly involving us or any of our controlled affiliates, including acquisitions, dispositions, mergers or other similar transactions, debt, equity or other financing transactions, public or private offerings of our securities and joint ventures, partnerships and minority investments. Although in 2009 the New
25
Table of Contents
Mountain Funds waived their right to collect a transaction fee in connection with our stock rights offering and the amendment of our Credit Agreement, their right to collect transaction fees otherwise remains in effect and continues until the New Mountain Funds cease to beneficially own at least 15% of our outstanding common stock or a change of control occurs.
The New Mountain Funds may have interests that differ from other stockholders’ interests, and they may vote in a way with which other stockholders disagree and that may be adverse to their interests. The concentration of ownership of our common stock may have the effect of delaying, preventing or deterring a change of control of our company, could deprive our stockholders of an opportunity to receive a premium for their common stock as part of a sale of our company and may adversely affect the market price of our common stock.
If we issue additional shares of our common stock, stockholders could experience dilution.
Our authorized capital stock consists of 200,000,000 shares of common stock, of which there were 67,235,668 shares outstanding as of March 9, 2010. The issuance of additional shares of our common stock or securities convertible into shares of our common stock could result in dilution of other stockholders’ ownership interest in us. In addition, if we issue additional shares of our common stock at a price that is less than the fair value of our common stock, other stockholders could, depending on their participation in that issuance, also experience immediate dilution of the value of their shares relative to what their value would have been had our common stock been issued at fair value. This dilution could be substantial.
Our stockholders do not have the same protections available to other stockholders of NASDAQ-listed companies because we are a “controlled company” within the meaning of The NASDAQ Global Select Market’s standards and, as a result, qualify for, and may rely on, exemptions from several corporate governance requirements.
Our controlling stockholders, the New Mountain Funds, control a majority of our outstanding common stock and have the ability to elect a majority of our board of directors. As a result, we are a “controlled company” within the meaning of the rules governing companies with stock quoted on The NASDAQ Global Select Market. Under these rules, a company as to which an individual, a group or another company holds more than 50% of the voting power is considered a “controlled company” and is exempt from several corporate governance requirements, including requirements that:
| • | a majority of the board of directors consists of independent directors; |
| • | compensation of officers be determined or recommended to the board of directors by a majority of its independent directors or by a compensation committee that is composed entirely of independent directors; and |
| • | director nominees be selected or recommended for election by a majority of the independent directors or by a nominating committee that is composed entirely of independent directors. |
We have availed ourselves of these exemptions. Accordingly, our stockholders do not have the same protections afforded to stockholders of other companies that are subject to all of The NASDAQ Global Select Market corporate governance requirements as long as the New Mountain Funds own a majority of our outstanding common stock.
Anti-takeover provisions in our charter documents, Delaware law and our shareholders’ agreement could discourage, delay or prevent a change in control of our company and may adversely affect the trading price of our common stock.
We are a Delaware corporation, and the anti-takeover provisions of the Delaware General Corporation Law may discourage, delay or prevent a change in control by prohibiting us (as a public company with common stock listed on The NASDAQ Global Select Market) from engaging in a business combination with an interested stockholder for a period of three years after the person becomes an interested stockholder, even if a change in
26
Table of Contents
control would be beneficial to our existing stockholders. In addition, our certificate of incorporation and bylaws may discourage, delay or prevent a change in our management or control over us that stockholders may consider favorable. Our certificate of incorporation and bylaws:
| • | authorize the issuance of “blank check” preferred stock that could be issued by our board of directors to thwart a takeover attempt; |
| • | provide the New Mountain Funds, through their stock ownership, with the ability to elect a majority of our directors if they beneficially own one-third or more of our common stock; |
| • | do not provide for cumulative voting; |
| • | provide that vacancies on the board of directors, including newly created directorships, may be filled only by a majority vote of directors then in office (subject to the rights of the Class A stockholders); |
| • | limit the calling of special meetings of stockholders; |
| • | permit stockholder action by written consent if the New Mountain Funds and its affiliates own one-third or more of our common stock; |
| • | require supermajority stockholder voting to effect certain amendments to our certificate of incorporation; and |
| • | require stockholders to provide advance notice of new business proposals and director nominations under specific procedures. |
In addition, certain provisions of our shareholders’ agreement require that certain covered persons (as defined in the shareholders’ agreement) vote their shares of our common stock in favor of certain transactions in which the New Mountain Funds propose to sell all or any portion of their shares of our common stock, or in which we propose to sell or otherwise transfer for value all or substantially all of the stock, assets or business of the company.
| Item 1B. | Unresolved Staff Comments |
None.
| Item 2. | Properties |
Our corporate headquarters are located in Herndon, Virginia, where we lease approximately 133,000 square feet of space under leases and subleases expiring in 2011 and 2012. In addition, we maintain domestic offices in California, Massachusetts and Oregon. Internationally, our offices are located in Australia, the Philippines and the United Kingdom. As of the years ended December 31, 2009, 2008, and 2007, $4.0 million, $3.0 million, and $3.5 million, respectively, of our total long-lived assets of $99.2 million, $97.4 million, and $82.8 million, respectively, were held outside of the United States.
Our business is generally not likely to be materially impacted by severe weather or climate-related events. However, a severe weather or other event could result in property damage and disruption to our operations, including disruption of our technology and communications systems.
| Item 3. | Legal Proceedings |
We are involved in various legal proceedings from time to time that are incidental to the ordinary conduct of our business. Although the outcomes of legal proceedings are inherently difficult to predict, we are not currently involved in any legal proceeding in which the outcome, in our judgment based on information currently available, is likely to have a material adverse effect on our business or financial position.
| Item 4. | Reserved |
27
Table of Contents
| Item 5. | Market for Registrant’s Common Equity, Related Stockholder Matters and Issuer Purchases of Equity Securities |
We do not have any plan or program for the repurchase of our common stock and did not repurchase any shares of our common stock during the year ended December 31, 2009.
Recent Sales of Unregistered Securities
On December 11, 2009, we issued 247,038 shares of our common stock to the shareholders of mySBX Corporation for an aggregate purchase price of $2,000,019, in connection with our acquisition of mySBX Corporation.
Common Stock Information
Our common stock is traded on The NASDAQ Global Select Market under the symbol “PROJ.”
The following table sets forth the high and low sales prices for our common stock for the periods indicated as reported by The NASDAQ Global Select Market:
| High | Low | |||||
| Year ended December 31, 2009: |
||||||
| Fourth Quarter |
$ | 8.94 | $ | 6.50 | ||
| Third Quarter |
8.50 | 4.11 | ||||
| Second Quarter |
5.27 | 3.58 | ||||
| First Quarter |
5.15 | 2.90 | ||||
| Year ended December 31, 2008: |
||||||
| Fourth Quarter |
$ | 6.79 | $ | 3.06 | ||
| Third Quarter |
9.05 | 5.14 | ||||
| Second Quarter |
14.04 | 7.36 | ||||
| First Quarter |
15.70 | 11.65 | ||||
There is no established public trading market for our Class A common stock. As of March 9, 2010, there were 109 stockholders of record of our common stock and three stockholders of record of our Class A common stock.
Our Class A common stock does not carry any general voting rights, dividend entitlement or liquidation preference, but it carries certain rights to designate up to a majority of the members of our board of directors. As a result of this stock ownership and other arrangements, we are deemed to be a “controlled company” under the rules established by The NASDAQ Global Select Market and qualify for, and rely on, the “controlled company” exception to the board of directors and committee composition requirements regarding independence under the rules of The NASDAQ Global Select Market.
We did not pay cash dividends in 2009 or 2008, and we currently do not intend to pay cash dividends. Our investor rights agreement requires the prior written consent of our controlling stockholder, the New Mountain Funds, if we wish to pay or declare any dividend on our capital stock. Our credit agreement also restricts our ability to pay cash dividends.
28
Table of Contents
Stock Performance Graph
The following graph compares the change in the cumulative total stockholder return on our common stock during the period from November 1, 2007 (the date of our initial public offering) through December 31, 2009, with the cumulative total return on the NASDAQ Computer Index and the NASDAQ Composite Index. The comparison assumes that $100 was invested on November 1, 2007 in our common stock and in each of the foregoing indices and assumes reinvestment of dividends, if any.
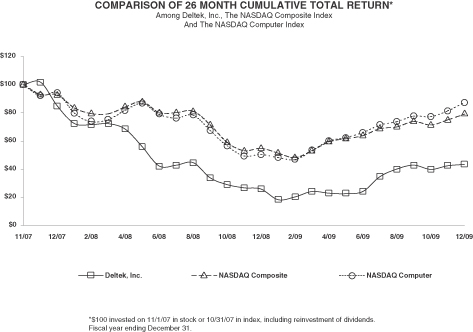
Assumes $100 invested on November 1, 2007
Assumes dividends reinvested
Fiscal year ended December 31, 2009, 2008 and 2007
| 11/1/2007 | 12/31/2007 | 12/31/2008 | 12/31/2009 | |||||||||
| Deltek, Inc. |
$ | 100.00 | $ | 84.85 | $ | 25.85 | $ | 43.34 | ||||
| NASDAQ Computer Index |
$ | 100.00 | $ | 94.22 | $ | 50.34 | $ | 87.46 | ||||
| NASDAQ Composite Index |
$ | 100.00 | $ | 92.70 | $ | 54.79 | $ | 79.14 | ||||
| (1) | This graph is not “soliciting material,” is not deemed filed with the Securities and Exchange Commission and is not to be incorporated by reference in any filing by us under the Securities Act or the Exchange Act, whether made before or after the date hereof and irrespective of any general incorporation language in any such filing. |
| (2) | The stock price performance shown on the graph is not necessarily indicative of future price performance. Information used in the graph was obtained from Research Data Group, Inc., a source believed to be reliable, but we are not responsible for any errors or omissions in such information. |
| (3) | The hypothetical investment in our common stock presented in the stock performance graph above is based on an assumed initial price of $17.95 per share, the closing price on November 1, 2007, the date of our initial public offering. The stock sold in our initial public offering was issued at a price to the public of $18.00 per share. |
29
Table of Contents
The equity compensation plan information required under this Item is incorporated by reference to the information provided under the heading “Equity Compensation Plan Information” in our definitive proxy statement to be filed with the Securities and Exchange Commission no later than 120 days after the fiscal year ended December 31, 2009.
| Item 6. | Selected Financial Data |
The following selected consolidated financial data should be read in conjunction with “Management’s Discussion and Analysis of Financial Condition and Results of Operations” and our consolidated financial statements contained elsewhere in this Annual Report. The statement of operations data and the balance sheet data for the years presented in the table below are derived from, and are qualified by reference to, our audited consolidated financial statements.
In April of 2005, the Company underwent a leveraged recapitalization and the Company changed to a C-corporation tax status subject to income taxation from an S-corporation in which income taxes were borne by the shareholders. During all the years presented in the table below, the Company made business acquisitions. These transactions could affect the comparability of the information presented.
| Year Ended December 31, | ||||||||||||||||
| 2009 | 2008 | 2007 | 2006 | 2005 | ||||||||||||
| (In thousands, except per share amounts) | ||||||||||||||||
| REVENUES: |
||||||||||||||||
| Software license fees |
$ | 58,907 | $ | 77,398 | $ | 87,118 | $ | 74,958 | $ | 45,923 | ||||||
| Consulting services |
77,807 | 91,566 | 83,353 | 66,573 | 41,212 | |||||||||||
| Maintenance and support services |
125,545 | 115,658 | 102,903 | 83,172 | 63,709 | |||||||||||
| Other revenues |
3,562 | 4,743 | 4,872 | 3,565 | 2,112 | |||||||||||
| Total revenues |
$ | 265,821 | $ | 289,365 | $ | 278,246 | $ | 228,268 | $ | 152,956 | ||||||
| Gross profit |
$ | 166,935 | $ | 180,899 | $ | 175,169 | $ | 146,608 | $ | 101,735 | ||||||
| Income (loss) before income taxes |
$ | 31,791 | $ | 36,113 | $ | 37,996 | $ | 25,267 | $ | (366 | ) | |||||
| Net income |
$ | 21,396 | $ | 23,519 | $ | 22,519 | $ | 15,298 | $ | 8,732 | ||||||
| Diluted earnings per share (a) |
$ | 0.37 | $ | 0.49 | $ | 0.50 | $ | 0.35 | $ | 0.15 | ||||||
| Shares used in diluted per share computation (a) |
57,596 | 47,729 | 44,820 | 43,409 | 57,143 | |||||||||||
| Total assets |
$ | 291,310 | $ | 193,272 | $ | 167,680 | $ | 134,488 | $ | 95,650 | ||||||
| Long-term debt |
$ | 134,358 | $ | 182,661 | $ | 192,815 | $ | 210,375 | $ | 213,275 | ||||||
| (a) | In accordance with FASB Accounting Standards Codification (ASC) 260, Earnings Per Share, for the purpose of computing the diluted number of shares, the number of weighted average common shares outstanding prior to June 1, 2009 was retroactively adjusted by a factor of 1.08 to reflect the impact of the bonus element associated with the common stock rights offering that we completed in June 2009. Diluted earnings per share was computed based on the diluted weighted average shares as adjusted by the bonus element. |
30
Table of Contents
| Item 7. | Management’s Discussion and Analysis of Financial Condition and Results of Operations |
This Management’s Discussion and Analysis of Financial Condition and Results of Operations (“MD&A”) should be read in conjunction with our consolidated financial statements and notes thereto which appear elsewhere in this Annual Report on Form 10-K. Our actual results may differ materially from those currently anticipated and expressed in such forward-looking statements as a result of a number of factors, including those discussed under “Risk Factors” and elsewhere in this Annual Report on Form 10-K.
All dollar amounts expressed as numbers in tables (except per share amounts)
in this MD&A are in millions.
Certain tables may not add due to rounding.
Company Overview
Since our founding in 1983, we have established a leading position as a provider of enterprise applications software and related services designed and developed specifically for project-focused organizations. These organizations include architectural and engineering firms, government contractors, aerospace and defense contractors, information technology services firms, consulting companies, discrete project manufacturing companies, grant-based not-for-profit organizations and government agencies, among others.
These project-focused organizations generate revenue from defined, discrete customer-specific engagements or activities. Project-focused organizations typically require specialized software to help them automate complex business processes around the engagement, execution and delivery of projects. Our software applications enable project-focused organizations to significantly enhance the visibility they have over all aspects of their operations by providing them increased control over their critical business processes, accurate, project-specific financial information, and real-time performance measurements.
With our software applications, project-focused organizations can better measure business results, optimize performance, streamline operations and win new business. As of December 31, 2009, we had over 12,000 customers worldwide that spanned numerous project-focused industries and ranged in size from small organizations to large enterprises. In addition, over 8,500 organizations and professionals rely on our innovative online govWin solution to find, capture and deliver on revenue-generating government contracting opportunities.
Our revenue is generated from sales of software licenses and related software maintenance and support agreements, professional services to assist customers with the implementation of our products, as well as education and training services. Our continued growth depends, in part, on our ability to generate license revenues from new customers and to continue to expand our presence by selling new products within our existing installed base of customers.
In our management decision making, we continuously balance our need to achieve short-term financial and operational goals with the equally critical need to continuously invest in our products and infrastructure to ensure our future success. In making decisions around spending levels in our various functional organizations, we consider many factors, including:
| • | Our ability to expand our presence and penetration of existing markets; |
| • | The extent to which we can sell new products to existing customers and sell upgrades to applications from legacy products in our current portfolio; |
| • | Our success in expanding our network of alliance partners; |
| • | Our ability to expand our presence in new markets and broaden our reach geographically; and |
| • | The pursuit and successful integration of acquired companies. |
31
Table of Contents
We have acquired companies to broaden our product offerings, expand our customer base and provide us with a future opportunity to migrate those added customers to newer applications we may develop. The products of the acquired companies provide our customers with core functionality that complements our own established products.
In evaluating our financial condition and operating performance, we consider a variety of factors including, but not limited to, the following:
| • | The growth rates of the individual components of our revenues (licenses, services and support) relative to recent historical trends and the growth rate of the overall market as reported or predicted by industry analysts; |
| • | The margins of our business relative to recent historical trends; |
| • | Our operating expenses and income from operations; |
| • | Our cash flow from operations; |
| • | The long-term success of our development efforts; |
| • | Our ability to successfully penetrate new markets; |
| • | Our ability to successfully integrate acquisitions and achieve anticipated synergies; |
| • | Our win rate against our competitors; and |
| • | Our long-term customer retention rates. |
Each of the factors may be evaluated individually or collectively by our senior management team in evaluating our performance as we balance our short-term quarterly objectives and our longer-term strategic goals and objectives.
Our total revenue for the year ended December 31, 2009 decreased as compared to the year ended December 31, 2008, as our customers deferred purchasing decisions, lengthened sales cycles and maintained more cautious investment policies in light of the current economic uncertainty. This affected revenue from both our Costpoint and Vision customers.
Our license revenue and total revenue for the three months ended December 31, 2009 increased to $19.2 million and $70.3 million, respectively, as compared to the three months ended September 30, 2009. License revenue and total revenue for the three months ended September 30, 2009 was $12.7 million and $64.1 million, respectively. We believe the increase in revenue was attributed to increasing confidence among our customers with regard to their economic outlook. While the timing and extent of any financial or economic turnaround remains uncertain, we expect improved confidence among our customers in the early part of 2010 as compared to the first three quarters of 2009. Nonetheless, we may not experience the same level of demand in the early part of 2010 when compared to historical periods for our software solutions.
Although near-term predictability for license revenue remains challenging across the software industry, we also expect our Costpoint, GCS Premier and enterprise project management (“EPM”) products to continue to account for a significant percentage of our overall software license fee revenue.
Going forward, we also expect that increased government spending, increased regulation by government agencies and the economic stimulus package could benefit our government contracting customers. While we anticipate that these trends may impact demand for our consulting, maintenance and support services in the future, it is difficult to predict when and to what extent the potential benefits of the economic stimulus package will be experienced by government contracting and other customers.
In addition, although we expect continued demand in 2010 for consulting services from customers due to additional purchases of our applications and the expansion of their use of our existing software, and continued
32
Table of Contents
demand for our maintenance services given our high maintenance retention rate and stable base of customers, we may not experience the same level of demand for consulting or maintenance and support services from our government contracting and architecture and engineering and professional services customers as they remain cautious with regard to their economic outlook. In addition, lower software license sales in 2009 may impact our consulting services revenues in 2010 and beyond, and we may not be able to replicate the impact of large implementation projects that will come to a successful conclusion during 2010.
In the three months ended December 31, 2009, we also experienced an increase in new customer activity among our architecture and engineering and other professional services customers, as new international customers leveraged our Vision products to support their businesses. While the timing and extent of any economic recovery remains uncertain, we expect that these current economic trends may continue in the early part of 2010. As a result, we may not experience the same level of demand when compared to historical periods for consulting, maintenance and support services from our architecture and engineering and other professional services customers due to the impact of the recession.
During 2009, the Company reduced headcount in certain areas to realign its resources. The Company anticipates additional restructuring charges in 2010 as it continues to realign its cost structure and allow for increased investment in key strategic objectives. In light of the continuing economic challenges our customers are facing and the related impact on their purchasing decisions, we have proactively managed, and will continue to proactively manage, our business to control operating expenses and realign resources in a way that will allow us to maximize near-term opportunities while maintaining the flexibility needed to achieve our longer-term strategic goals.
History
We were founded to develop and sell accounting software solutions for firms that contract with the U.S. government. Since our founding, we have continued our focus on providing solutions to government contractors as well as to other project-focused organizations, and at the same time we have broadened our product offerings by developing new software products, selectively acquiring businesses with attractive project-focused applications and services, and partnering with third parties.
In April 2005, New Mountain Partners II, L.P., New Mountain Affiliated Investors II, L.P., and Allegheny New Mountain Partners, L.P. (collectively, the “New Mountain Funds”) purchased the majority ownership of our company from the founding deLaski stockholders through a recapitalization transaction. Subsequent to this transaction, we implemented a strategy to recruit additional management talent and significantly improve our competitive position and growth prospects through increased investments in product development and sales and marketing initiatives, complemented by strategic acquisitions aimed at broadening our customer base and our product offerings.
In October 2005, we acquired Wind2, an enterprise software provider serving project-focused architectural and engineering (“A/E”) and other professional services firms. The acquisition of Wind2 enabled us to expand our presence in the A/E market by adding small and medium-sized engineering firms to our existing customer base.
In March 2006, we acquired WST, Inc. (“Welcom”), a leading provider of project portfolio management solutions, focused on earned value management, planning and scheduling, portfolio analysis, risk management and project collaboration products. The acquisition of Welcom increased our presence among a number of multinational aerospace, defense and government clients, augmenting our existing installed base of customers. This acquisition complemented our core product offerings and created opportunities for additional sales to our existing customer base.
In July 2006, we acquired C/S Solutions, Inc. (“CSSI”), a leading provider of business intelligence tools for the earned value management marketplace. The acquisition of CSSI built upon our leadership position in the
33
Table of Contents
enterprise project management sector by incorporating collaborative earned value management analytics delivered by CSSI’s wInsight software with our own earned value management engine, Cobra, and Costpoint, our enterprise resource planning solution for mid- to large-sized government contractors.
In April 2007, we acquired the business assets of Applied Integration Management Corporation (“AIM”), a provider of project management consulting services. This acquisition supplemented our existing project portfolio management systems implementation expertise and capabilities and allowed us to provide additional project portfolio management consulting, training and implementation services.
In April 2007, we reincorporated in the State of Delaware as Deltek, Inc.
In May 2007, we completed the acquisition of WST Pacific Pty Ltd. (“WSTP”), a provider of earned value management (“EVM”) solutions based in Australia, and previously a development partner of Welcom. The acquisition complemented our existing EVM development, services and support resources.
In November 2007, the Company completed its initial public offering consisting of 9,000,000 shares of common stock for $18.00 per share. For additional information regarding the initial public offering, see the Initial Public Offering section of Note 1 in our consolidated financial statements contained in Item 8 in this Annual Report on Form 10-K.
In August 2008, we acquired from Planview, Inc. the MPM solution (“MPM”), an earned value management software application used by government contractors and agencies to meet complex compliance requirements for their programs issued by the U.S. Federal Government. MPM integrates with Deltek wInsight to create a complete earned value solution for government contractors and agencies.
In June 2009, we completed a $60 million common stock rights offering to our stockholders and issued 20 million shares of common stock at a price of $3.00 per share.
In August 2009, we amended our existing Credit Agreement. As a result, we extended the maturity of $129.4 million of our $179.6 million in outstanding term loans to April 2013 with the remainder continuing to be due in April 2011. In addition, the expiration of $22.5 million of our $30 million revolving credit facility was extended to April 2013.
In December 2009, we acquired mySBX Corporation, an online enterprise that enables government contractors to rapidly identify opportunities, manage resources, win more business and increase profits.
Critical Accounting Policies and Estimates
In presenting our financial statements in conformity with generally accepted accounting principles (“GAAP”) in the United States, we are required to make estimates and assumptions that affect the reported amounts of assets, liabilities, revenues, costs and expenses and related disclosures. Some of the estimates and assumptions we are required to make relate to matters that are inherently uncertain as they pertain to future events. We base these estimates and assumptions on historical experience or on various other factors that we believe to be reasonable and appropriate under the circumstances. On an ongoing basis, we reconsider and evaluate our estimates and assumptions. Our future estimates may change if the underlying assumptions change. Actual results may differ significantly from these estimates.
For further information on our critical and other significant accounting policies, see Note 1, Organization and Summary of Significant Accounting Policies, of our consolidated financial statements contained in Item 8 of this Annual Report on Form 10-K. We believe that the critical accounting policies listed below involve our more significant judgments, assumptions and estimates and, therefore, could have the greatest potential impact on our consolidated financial statements.
| • | Revenue Recognition; |
| • | Stock-Based Compensation; |
34
Table of Contents
| • | Income Taxes; |
| • | Allowances for Doubtful Accounts Receivable; |
| • | Valuation of Purchased Intangible Assets and Acquired Deferred Revenue; and |
| • | Impairment of Identifiable Intangible and Other Long-Lived Assets and Goodwill. |
In June 2009, the FASB issued the FASB Accounting Standards Codification™ (the “Codification” or “ASC”), the authoritative guidance for GAAP. The Codification does not change how we account for transactions or the nature of the related disclosures made. The Codification supersedes all existing non-SEC accounting and reporting standards and was effective beginning July 1, 2009. In this Annual Report on Form 10-K, the references have been updated to reflect the new Codification references.
Revenue Recognition
We recognize revenue in accordance with ASC 985-605, Software-Revenue Recognition (“ASC 985-605”), as well as Technical Practice Aids issued from time to time by the AICPA, and in accordance with the Securities and Exchange Commission Staff Accounting Bulletin (“SAB”) No. 104, Revenue Recognition.
We derive revenues from three primary sources, or elements: software license fees for our products; maintenance and support for those products; and consulting services, including training, related to those products. A typical sales agreement includes both software licenses and maintenance and may also include consulting services and training.
Software License Fee Revenues: For sales arrangements involving multiple elements where the software does not require significant modification or customization, we recognize software license fee revenues using the residual method as described in ASC 985-605 because to date we have not established vendor specific objective evidence (“VSOE”) of fair value for the license element. Under the residual method, we allocate revenue to, and defer recognition of, undelivered elements based on their VSOE of fair value and recognize the difference between the total arrangement fee and the amount deferred for the undelivered elements as revenue for the delivered elements. The VSOE of fair value of the undelivered elements in multiple element arrangements is based on the price charged when such elements are sold separately. Our typical undelivered elements (maintenance and consulting services) are priced consistently such that VSOE generally exists for undelivered elements of our arrangements.
If VSOE exists to allow the allocation of a portion of the total fee to undelivered elements of the arrangement, the residual amount in the arrangement allocated to software license fee is recognized as revenue when all of the following are met:
| • | Persuasive evidence of an arrangement exists. It is our practice to require a signed contract or an accepted purchase order for existing customers. |
| • | Delivery has occurred. We deliver software by secure electronic means or physical delivery. Both means of delivery transfer title and risk to the customer. Shipping terms are generally FOB shipping point. |
| • | The software license sale is fixed and determinable. We recognize revenue for the license component of multiple element arrangements only when the VSOE of fair value of any undelivered elements is known, any uncertainties surrounding customer acceptance are resolved and there are no refund, return or cancellation rights associated with the delivered elements. Software license sales are generally considered fixed and determinable when payment terms are within 180 days. |
| • | Collectibility is probable. Amounts receivable must be collectible. For license arrangements that do not meet our collectibility standards, revenue is recognized as cash is received. |
35
Table of Contents
Consulting Services Revenues: Our consulting services revenues, which include software implementation, training and other consulting services, are generally billed based on hourly rates plus reimbursable out-of-pocket expenses and related administrative fees.
These services are generally not essential to the functionality of our software and are usually completed in three to six months, though larger implementations may take longer. We generally recognize revenues for these services as they are performed. In rare situations in which the services are deemed essential to the functionality of our software in the customer’s environment, we recognize the software and services revenue together in accordance with ASC 605-35, Revenue Recognition-Construction-Type and Certain Production-Type Contracts (“ASC 605-35”).
We sell training at a fixed rate for each specific class, at a per attendee price, or at a packaged price for several attendees, and revenue is recognized only when the customer completes the training. To the extent that our customers pay for the training services in advance of delivery, the amounts are recorded in deferred revenue until such time as the training is provided.
Maintenance and Support Services Revenues: Maintenance and support services include software updates on a when-and-if-available basis, telephone, online and web-based support and software defect fixes or patches. Maintenance revenues are recognized ratably over the term of the customer maintenance and support agreement.
The significant judgments and estimates for revenue recognition typically relate to the timing of an amount recognized for software license fee revenue, including whether collectibility is deemed probable, fees are fixed and determinable and services are essential to the functionality of the software. Changes to these assumptions would generally impact the timing and amount of revenue recognized for software license fee revenues versus other revenue categories.
Stock-Based Compensation
ASC 718, Compensation-Stock Compensation (“ASC 718”), requires that the cost of awards of equity instruments offered in exchange for employee services, including employee stock options, restricted stock awards, and employee stock purchases under our Employee Stock Purchase Plan (“ESPP”), are measured based on the fair value of the award on the measurement date of grant. We determine the fair value of options granted using the Black-Scholes-Merton option pricing model and recognize the cost over the period during which an employee is required to provide service in exchange for the award, generally the vesting period. The fair value of restricted stock awards is based on the closing price of our common stock on the date of grant and is recognized as expense over the requisite service period of the awards.
In accordance with ASC 718, we recorded $10.6 million, $8.8 million and $6.2 million in stock-based compensation expense for the years ended December 31, 2009, 2008 and 2007, respectively. The compensation expense recorded for the years ended December 31, 2009 and 2008 related to stock options, restricted stock awards and the ESPP, and for the year ended December 31, 2007, the compensation expense recorded related to stock options and ESPP.
The key assumptions used by management in the Black-Scholes-Merton option-pricing model include the fair value of our common stock at the grant date, which is also used to determine the option exercise price, the expected life of the option, the expected volatility of our common stock over the life of the option and the risk-free interest rate. In determining the amount of stock-based compensation to record, management must also estimate expected forfeitures of stock options over the expected life of the options.
Prior to our initial public offering in November 2007 and given the absence of an active market for our common stock, our board of directors or compensation committee (or its authorized member(s)) estimated the fair value of our common stock at the time of each grant. Numerous objective and subjective factors were
36
Table of Contents
considered in estimating the value of our common stock at each option grant date in accordance with the guidance in AICPA Practice Aid “Valuation of Privately-Held-Company Equity Securities Issued as Compensation”.
Based on these factors, employee stock options were granted during 2007 at exercise prices ranging from $12.24 to $18.00. Our initial public offering in November 2007 was $18.00 per share.
Valuation Methodology
From January 1, 2006 through the initial public offering, the valuation method that we used to estimate the fair value of our common stock utilized a combination of a market multiple methodology and a comparable transaction methodology.
The market multiple methodology considered market valuation multiples of similar enterprise application software firms (the “comparable software companies”). We selected seven comparable companies that met the following criteria:
| • | The company was primarily engaged in the enterprise software business; |
| • | The company was publicly held and actively traded; and |
| • | The enterprise value of the company was less than $1 billion. |
Based on an analysis of the valuation multiples of the comparable software companies, we determined an appropriate multiple to apply to the relevant values for:
| • | our cumulative earnings before interest, taxes, depreciation, amortization, recapitalization expenses and stock-based compensation expense (“adjusted EBITDA”) for the four quarters ended prior to the valuation date; |
| • | our estimated adjusted EBITDA for the current period, determined as of the valuation date based on management’s estimates; and |
| • | for periods beginning in October 2006, our estimated adjusted EBITDA for 2007. |
The result of this calculation was an estimate of our enterprise value using market multiples of comparable software companies.
The comparable transaction methodology considered market valuation multiples of over 20 software company acquisition transactions announced since early 2003. We selected transactions for this methodology from databases of publicly announced and completed controlling interest transactions involving enterprise software companies valued between $10 million and $15 billion. The analysis of comparable transactions included for each valuation was consistently updated to include transactions announced and completed since the prior valuation. The factors considered in our comparable transaction methodology analysis were the acquired company’s enterprise value to revenue multiple and its enterprise value to adjusted EBITDA ratio.
After analysis of the range of values of those comparable transactions as well as their mean and median values, a range of comparable enterprise value multiples that considered our growth rate and adjusted EBITDA margin levels was applied to our revenue and adjusted EBITDA levels. We further adjusted this value to remove the estimated impact of the control premium from the market multiples used. The result of this calculation was an estimate of our enterprise value using comparable transaction multiples of other acquired software firms.
The application of the market multiple methodology and the comparable transaction methodology was equally weighted and yielded an estimated enterprise value which we then adjusted for our cash and debt balances to estimate the aggregate value of our common stock. We then adjusted that valuation for a marketability discount ranging from 5% to 15% depending upon the proximity of an expected liquidity event
37
Table of Contents
such as our planned initial public offering to reflect the fact that our shares were not publicly tradable. The resulting valuation of our company was used to determine the estimated fair value of our common stock at the valuation date. Subsequent to our initial public offering in November 2007, the fair value of our common stock has been determined based upon the closing stock market value.
Because we do not have significant history associated with our stock options in order to determine the expected volatility of our options, we calculated expected volatility as of each grant date using an implied volatility method based in part on reported data for a peer group of publicly traded software companies for which historical information was available. We will continue to use peer group volatility information until sufficient historical volatility of our common stock is available to measure expected volatility for future option grants.
The average expected life of our stock options was determined according to the “SEC simplified method” as described in SAB No. 107, Share-Based Payment, which is the midpoint between the vesting date and the end of the contractual term. The risk-free interest rate was determined by reference to the U.S. Treasury yield curve rates with the remaining term equal to the expected life assumed at the date of grant. Forfeitures were estimated based on our historical analysis of actual stock option forfeitures and employee turnover. An increase or decrease by 5% in the forfeiture rate would not have a material effect on our financial statements.
Income Taxes
We are required to estimate our income taxes in each of the jurisdictions in which we operate. We record this amount as a provision or benefit for taxes in accordance with ASC 740, Income Taxes (“ASC 740”). This process involves estimating our current tax exposure, including assessing the risks associated with tax audits and assessing temporary differences resulting from different treatment of items for tax and accounting purposes. These differences result in deferred tax assets and liabilities, which are recorded in our financial statements. Although we believe that our estimates are reasonable, the final tax outcome of these matters could be different from our estimates reflected in our income tax provision. As such, any potential difference could have a material effect on our effective tax rate and consequently affect our operating results for the period in which such determination is made.
We follow ASC 740-10 which requires significant judgment in determining what constitutes an individual tax position as well as assessing the outcome of each tax position. Changes in judgment as to recognition and measurement of tax positions can affect the estimate of the effective tax rate and consequently affect our operating results.
As of December 31, 2009, we had deferred tax assets of approximately $12.4 million, which were primarily related to differences in the timing of recognition of revenue and expenses for book and tax purposes. We assess the likelihood that our deferred tax assets will be recovered from future taxable income and, to the extent we believe recovery is not likely, we establish a valuation allowance. As of December 31, 2009, we have no valuation allowances as we have determined it is more likely than not that the deferred tax assets would be realized.
Our deferred tax assets and liabilities are recorded at the enacted tax rates in effect for the year in which the differences are expected to reverse. If a change to the expected tax rate is determined to be appropriate due to differences between our assumptions and actual results of operations or statutory tax rates, it will affect the provision for income taxes during the period that the determination is made.
Allowances for Doubtful Accounts Receivable
We maintain allowances for doubtful accounts and sales allowances to provide adequate provision for potential losses from collecting less than full payment on our accounts receivable. We record provisions for sales allowances, which generally result from credits issued to customers in conjunction with cancellations of maintenance agreements or billing adjustments, as a reduction to revenues. We record provisions for bad debt, or
38
Table of Contents
credit losses, as a general and administrative expense in our income statement. We base these provisions on a review of our accounts receivable aging, individual overdue accounts, historical write-offs and adjustments of customer accounts due to service or other issues and an assessment of the general economic environment.
Valuation of Purchased Intangible Assets and Acquired Deferred Revenue
We allocate the purchase price paid in a business combination to the assets acquired, including intangible assets, and liabilities assumed at their estimated fair values. Such valuations require management to make significant estimates and assumptions, especially with respect to intangible assets.
Management makes estimates of fair value based upon assumptions and estimates we believe to be reasonable. These estimates are based upon a number of factors, including historical experience, market conditions and information obtained from the management of the acquired company. Critical estimates in valuing certain of the intangible assets include, but are not limited to, historical and projected customer retention rates, anticipated growth in revenue from the acquired customer and product base and the expected use of the acquired assets.
We amortize acquired intangible assets using either accelerated or straight-line methods depending upon which best approximates the proportion of future cash flows estimated to be generated in each period of the estimated useful life of the specific asset. Management must estimate the expected life and future cash flows from the acquired asset, both of which are inherently uncertain and unpredictable. Changes in the assumptions used in developing these estimates could have a material impact on the amortization expense recorded in our financial statements. Unanticipated events and circumstances may occur which may affect the accuracy or validity of our assumptions and estimates. As an example, for all of the acquisitions made during the years 2005 through 2009, we are amortizing the customer relationship intangible assets on an accelerated method using lives of five to ten years. The use of an accelerated method was based upon our estimates of the projected cash flows from the assets and the proportion of those cash flows received over the estimated life.
Had we used a straight-line method of amortization, amortization expense for 2009 would have been approximately $0.8 million less than the amount recorded. If we were to continue to use the same accelerated method, but reduce the estimated useful lives of those assets by one year, total amortization expense would have been higher by $0.3 million for 2009. We amortize acquired technology from our acquisitions using either an accelerated or a straight-line method over two to four years. If the useful lives for those assets were reduced by one year, amortization expense for 2009 would have been approximately $0.4 million which is $0.5 million lower than the current year expense.
As a component of our acquisitions, we acquired maintenance obligations (and the associated deferred revenue) with our acquisitions. We valued acquired deferred revenue based on estimates of the cost of providing solution support services plus a reasonable profit margin. Upon each acquisition, the acquired deferred revenue balances were recorded at an average of 43% of their book value on the date of acquisition. This reduced deferred revenue amount is recognized as revenue over the remaining contractual period of the obligation, generally no more than one year from the date of acquisition. Changes in the estimates used in determining these valuations could result in more or less revenue being recorded.
Impairment of Identifiable Intangible and Other Long-Lived Assets and Goodwill
We review identifiable intangible and other long-lived assets for impairment in accordance with ASC 360, Property, Plant, and Equipment (“ASC 360”) whenever events or changes in circumstances indicate the carrying amount may be impaired or unrecoverable.
We assess the impairment of goodwill and indefinite-lived intangible assets in accordance with ASC 350, Intangibles-Goodwill and Other (“ASC 350”). Accordingly, we test our goodwill and indefinite-lived intangible assets for impairment annually at December 31 or whenever events or changes in circumstances indicate an impairment may have occurred. The impairment test for goodwill compares the fair value of the reporting unit
39
Table of Contents
with its carrying amount. If the carrying amount exceeds its fair value, impairment is indicated. The impairment is measured as the excess of the recorded goodwill over its fair value.
The impairment test for indefinite-lived intangible assets compares the fair value of an indefinite-lived intangible asset with its carrying amount. If the fair value of the indefinite-lived intangible asset is less than its carrying amount, an impairment is measured as the excess of the carrying amount over the fair market value.
Factors that indicate the carrying amount of goodwill, identifiable intangible assets or other long-lived assets that may not be recoverable include under-performance relative to historical or projected operating results, significant changes or limitations in the manner of our use of the acquired assets, changes in our business strategy, adverse market conditions, changes in applicable laws or regulations and a variety of other factors and circumstances.
We determine the recoverability of our long-lived assets by comparing the carrying amount of the asset to our current estimates of net future undiscounted cash flows that the asset is expected to generate (or fair market value). If we determine that the carrying value of a long-lived asset may not be recoverable, an impairment charge is recognized, as an operating expense, equal to the amount by which the carrying amount exceeds the fair market value of the asset in the period the determination is made.
Results of Operations
The following table sets forth our statements of operations including dollar and percentage of change from the prior periods indicated:
| Year Ended December 31, | 2009 versus 2008 | 2008 versus 2007 | ||||||||||||||||||||||||
| 2009 | 2008 | 2007 | Change | % Change | Change | % Change | ||||||||||||||||||||
| (dollars in millions) | ||||||||||||||||||||||||||
| REVENUES: |
||||||||||||||||||||||||||
| Software license fees |
$ | 58.9 | $ | 77.4 | $ | 87.1 | $ | (18.5 | ) | (24 | ) | $ | (9.7 | ) | (11 | ) | ||||||||||
| Consulting services |
77.8 | 91.6 | 83.4 | (13.8 | ) | (15 | ) | $ | 8.2 | 10 | ||||||||||||||||
| Maintenance and support services |
125.5 | 115.7 | 102.9 | 9.8 | 9 | $ | 12.8 | 12 | ||||||||||||||||||
| Other revenues |
3.6 | 4.7 | 4.9 | (1.1 | ) | (24 | ) | $ | (0.2 | ) | (4 | ) | ||||||||||||||
| Total revenues |
$ | 265.8 | $ | 289.4 | $ | 278.3 | $ | (23.6 | ) | (8 | ) | $ | 11.1 | 4 | ||||||||||||
| COST OF REVENUES: |
||||||||||||||||||||||||||
| Cost of software license fees |
$ | 5.9 | $ | 6.6 | $ | 7.9 | $ | (0.7 | ) | (11 | ) | $ | (1.3 | ) | (16 | ) | ||||||||||
| Cost of consulting services |
65.8 | 75.3 | 72.6 | (9.5 | ) | (13 | ) | $ | 2.7 | 4 | ||||||||||||||||
| Cost of maintenance and support services |
22.5 | 21.4 | 17.4 | 1.1 | 5 | $ | 4.0 | 23 | ||||||||||||||||||
| Cost of other revenues |
4.7 | 5.2 | 5.3 | (0.5 | ) | (9 | ) | $ | (0.1 | ) | (2 | ) | ||||||||||||||
| Total cost of revenues |
$ | 98.9 | $ | 108.5 | $ | 103.2 | $ | (9.6 | ) | (9 | ) | $ | 5.3 | 5 | ||||||||||||
| GROSS PROFIT |
$ | 166.9 | $ | 180.9 | $ | 175.1 | $ | (14.0 | ) | (8 | ) | $ | 5.8 | 3 | ||||||||||||
| OPERATING EXPENSES: |
||||||||||||||||||||||||||
| Research and development |
$ | 43.4 | $ | 45.8 | $ | 42.9 | $ | (2.4 | ) | (5 | ) | $ | 2.9 | 7 | ||||||||||||
| Sales and marketing |
44.8 | 53.8 | 45.3 | (9.0 | ) | (17 | ) | $ | 8.5 | 19 | ||||||||||||||||
| General and administrative |
35.5 | 33.4 | 30.6 | 2.1 | 6 | $ | 2.8 | 9 | ||||||||||||||||||
| Restructuring charge |
3.9 | 1.0 | — | 2.9 | 290 | $ | 1.0 | 100 | ||||||||||||||||||
| Total operating expenses |
$ | 127.6 | $ | 134.0 | $ | 118.8 | $ | (6.4 | ) | (5 | ) | $ | 15.2 | 13 | ||||||||||||
| INCOME FROM OPERATIONS |
$ | 39.3 | $ | 46.9 | $ | 56.3 | $ | (7.6 | ) | (16 | ) | $ | (9.4 | ) | (17 | ) | ||||||||||
| Interest income |
0.1 | 0.6 | 0.3 | (0.5 | ) | (83 | ) | $ | 0.3 | 100 | ||||||||||||||||
| Interest expense |
(7.6 | ) | (11.0 | ) | (18.5 | ) | 3.4 | (31 | ) | $ | 7.5 | (41 | ) | |||||||||||||
| Other income (expense), net |
— | (0.4 | ) | (0.1 | ) | 0.4 | (100 | ) | $ | (0.3 | ) | 300 | ||||||||||||||
| INCOME BEFORE INCOME TAXES |
31.8 | 36.1 | 38.0 | (4.3 | ) | (12 | ) | $ | (1.9 | ) | (5 | ) | ||||||||||||||
| Income tax expense |
10.4 | 12.6 | 15.5 | (2.2 | ) | (17 | ) | $ | (2.9 | ) | (19 | ) | ||||||||||||||
| NET INCOME |
$ | 21.4 | $ | 23.5 | $ | 22.5 | $ | (2.1 | ) | (9 | ) | $ | 1.0 | 4 | ||||||||||||
40
Table of Contents
Revenues
| Year Ended December 31, | 2009 versus 2008 | 2008 versus 2007 | |||||||||||||||||||||
| 2009 | 2008 | 2007 | Change | % Change | Change | % Change | |||||||||||||||||
| (dollars in millions) | |||||||||||||||||||||||
| REVENUES: |
|||||||||||||||||||||||
| Software license fees |
$ | 58.9 | $ | 77.4 | $ | 87.1 | $ | (18.5 | ) | (24 | ) | $ | (9.7 | ) | (11 | ) | |||||||
| Consulting services |
77.8 | 91.6 | 83.4 | (13.8 | ) | (15 | ) | 8.2 | 10 | ||||||||||||||
| Maintenance and support services |
125.5 | 115.7 | 102.9 | 9.8 | 9 | 12.8 | 12 | ||||||||||||||||
| Other revenues |
3.6 | 4.7 | 4.9 | (1.1 | ) | (24 | ) | (0.2 | ) | (4 | ) | ||||||||||||
| Total revenues |
$ | 265.8 | $ | 289.4 | $ | 278.3 | $ | (23.6 | ) | (8 | ) | $ | 11.1 | 4 | |||||||||
Software License Fees
Our software applications are generally licensed to end-user customers under perpetual license agreements. We sell our software applications to end-user customers mainly through our direct sales force, as well as indirectly through our network of alliance partners and resellers. The timing of the sales cycle for our products varies in length based upon a variety of factors, including the size of the customer, the product being sold and whether the customer is a new or existing customer. While price is an important consideration, we primarily compete on product features, functionality and the needs of our customers within our served markets.
Software license fee revenues decreased $18.5 million, or 24%, to $58.9 million for the year ended December 31, 2009 compared to the year ended December 31, 2008. For the year ended December 31, 2009, license fee revenues from our Costpoint, GCS Premier and EPM products decreased $4.4 million compared with the prior year, while license fee revenues from our Vision software license fees decreased by $14.1 million for the same period. The decrease in revenues from sales of our Costpoint, GCS Premier and Enterprise Project Management (“EPM”) products to government contractor customers was partially attributable to the impact of two larger deals in 2008 that were not replicated in 2009, and was also attributable to customers taking a more cautious approach with regard to purchasing and investment decisions. We believe the decrease in revenues from sales of our Vision products was mainly attributable to customers deferring purchasing decisions, lengthening sales cycles and adopting more cautious investment policies during the current economic downturn.
While the timing and extent of any financial or economic turnaround remains uncertain, we expect improved confidence among our customers in the early part of 2010 as compared to the first three quarters of 2009. Nonetheless, we may not experience the same level of demand in the early part of 2010 when compared to historical periods for our software solutions.
Software license fee revenues decreased $9.7 million, or 11%, to $77.4 million for the year ended December 31, 2008 compared to the year ended December 31, 2007. For the year ended December 31, 2008, revenues from Vision software license fees decreased $10.3 million compared with the prior year primarily due to a number of architecture and engineering customers that deferred purchasing decisions, lengthened sales cycles and slowed the adoption of new technologies as their focus turned to the impact of the escalating financial crisis on their businesses in the latter half of 2008. Software license fee revenue from our Costpoint, GCS Premier, and EPM products increased for the year ended December 31, 2008 compared to the year ended December 31, 2007 by $0.6 million driven by continued demand for our products by government contractors.
Consulting Services
Our consulting services revenues are generated from software implementation and related project management and data conversion, as well as training, education and other consulting services associated with our software applications and are typically provided on a time-and-materials basis.
41
Table of Contents
Consulting services revenues decreased $13.8 million, or 15%, to $77.8 million for the year ended December 31, 2009 compared to the year ended December 31, 2008. This is a result of a $9.6 million decline in software implementation consulting services attributed to decreased software license fees. Also contributing to the decrease was a decline of $1.9 million in reimbursable revenues and a decline of $2.3 million in training and education related services. Implementation services represented 93% of total consulting revenues for the year ended December 31, 2009, compared to 92% in the prior year.
Although we expect continued demand in 2010 for consulting services from customers due to additional purchases of our applications and the expansion of their use of our existing software, we may not be able to replicate the impact of large implementation projects that will come to a successful conclusion during 2010, and lower software license sales in 2009 may also impact our consulting services revenues in 2010 and beyond. In addition, we may not experience the same level of demand as previously experienced from our government contracting and architecture and engineering and professional services customers as they remain cautious with respect to their economic outlook.
Consulting services revenues increased $8.2 million, or 10%, to $91.6 million for the year ended December 31, 2008 compared to the year ended December 31, 2007. The increase in revenue year over year was driven by an increase of $6.8 million of software implementation related services in addition to an increase of $1.4 million in training and education related services revenue in 2008. The increase in software implementation related services was a result of increased demand for implementation services and more billable services headcount.
Maintenance and Support Services
Our maintenance and support revenues are comprised of fees derived from new maintenance contracts associated with new software license sales and annual renewals of existing maintenance contracts. These contracts typically allow our customers to obtain online, telephone and internet-based support, as well as unspecified periodic upgrades or enhancements to our software on an as available basis. Maintenance services generally represent between 15% and 20% of the list price of the underlying software applications at the time of sale and are generally subject to contractually permitted annual rate increases.
Maintenance revenues increased $9.8 million, or 9%, to $125.5 million for the year ended December 31, 2009 compared to the year ended December 31, 2008. Maintenance revenues from our Costpoint, GCS Premier, and EPM products collectively increased $9.0 million year over year, and maintenance revenues from our Vision products increased $0.5 million. In addition, the sales allowance decreased $0.3 million. These increases were due to sales of new software licenses, renewals of maintenance agreements by our installed base of customers, the annual price escalations for our maintenance services and the impact of the MPM acquisition.
We expect that maintenance revenues will continue to be a significant source of revenue during the early part of 2010 given our high maintenance retention rate and our stable base of customers.
Maintenance revenues increased $12.8 million, or 12%, to $115.7 million for the year ended December 31, 2008 compared to the year ended December 31, 2007. Maintenance revenues from our Costpoint, GCS Premier, and EPM products collectively increased $6.8 million year over year and maintenance revenues from our Vision product increased $6.0 million. These increases were due to sales of new software licenses, renewals of maintenance agreements on our installed base of customers, and the annual price escalations for our maintenance services. These increases were partially offset by customer cancellations.
Other Revenues
Our other revenues consist primarily of fees collected for our annual user conference, which is typically held in the second quarter of the year, as well as sales of third-party hardware and software. For the year ended December 31, 2009, other revenues decreased $1.1 million, or 24%, to $3.6 million from $4.7 million in the prior year as a result of lower user conference revenues associated with lower conference attendance in the current year.
42
Table of Contents
For the year ended December 31, 2008, other revenues decreased $0.2 million, or 4%, to $4.7 million compared to the year ended December 31, 2007 as a result of a decrease in third-party hardware and software revenue of $0.6 million year over year. This decrease was partially offset by an increase in user conference revenue of $0.4 million as a result of higher attendance associated with our 2008 user conference.
Cost of Revenues
| Year Ended December 31, | 2009 versus 2008 | 2008 versus 2007 | |||||||||||||||||||||
| 2009 | 2008 | 2007 | Change | % Change | Change | % Change | |||||||||||||||||
| (dollars in millions) | |||||||||||||||||||||||
| COST OF REVENUES: |
|||||||||||||||||||||||
| Cost of software license fees |
$ | 5.9 | $ | 6.6 | $ | 7.9 | $ | (0.7 | ) | (11 | ) | $ | (1.3 | ) | (16 | ) | |||||||
| Cost of consulting services |
65.8 | 75.3 | 72.6 | (9.5 | ) | (13 | ) | 2.7 | 4 | ||||||||||||||
| Cost of maintenance and support services |
22.5 | 21.4 | 17.4 | 1.1 | 5 | 4.0 | 23 | ||||||||||||||||
| Cost of other revenues |
4.7 | 5.2 | 5.3 | (0.5 | ) | (9 | ) | (0.1 | ) | (2 | ) | ||||||||||||
| Total cost of revenues |
$ | 98.9 | $ | 108.5 | $ | 103.2 | $ | (9.6 | ) | (9 | ) | $ | 5.3 | 5 | |||||||||
Cost of Software License Fees
Our cost of software license fees consists of third-party software royalties, costs of product fulfillment, amortization of acquired technology and amortization of capitalized software.
Cost of software license fees decreased by $0.7 million, or 11%, to $5.9 million for the year ended December 31, 2009 compared to the year ended December 31, 2008 primarily due to lower amortization of capitalized software and purchased intangible assets.
Cost of software license fees decreased by $1.3 million, or 16%, to $6.6 million for the year ended December 31, 2008 compared to the year ended December 31, 2007. The decrease was primarily a result of decreased royalty expense for third-party software of $0.6 million driven by lower software license sales during the year ended December 31, 2008. In addition, there was a decrease in amortization from purchased intangibles of $0.4 million and capitalized software of $0.2 million. The decrease in amortization of software development costs was a result of previously capitalized software becoming fully amortized in the prior year resulting in no current year expense.
Cost of Consulting Services
Our cost of consulting services is comprised of the salaries, benefits, incentive compensation and stock-based compensation expense of services-related employees as well as third-party contractor expenses, travel and reimbursable expenses and classroom rentals. Cost of services also includes an allocation of our facilities and other costs incurred for providing implementation, training and other consulting services to our customers.
Cost of consulting services was $65.8 million for the year ended December 31, 2009, a decrease of $9.5 million, or 13%, compared to the year ended December 31, 2008. The key drivers were decreases in labor and related benefits of $5.5 million resulting from a reduction in headcount of 11% to approximately 290, decreases in travel expenses of $3.0 million, decreases in subcontractor expenses of $0.9 million and decreases in other expenses of $0.1 million. The cost reductions paralleled the decrease in consulting services revenues in 2009.
Cost of consulting services increased $2.7 million, or 4%, to $75.3 million for the year ended December 31, 2008 compared to the year ended December 31, 2007. The increase in labor and related benefits, bonus, and stock-based compensation resulted in a $4.3 million increase in cost of consulting services. This increase was partially offset by a decrease of $1.4 million of expenses related to our reduced reliance on subcontractor labor, lower travel related expenses and lower training and other related service expenses. At December 31, 2008, our ending services headcount was 320 as compared to 347 at December 31, 2007, or a decrease of 8%. Although
43
Table of Contents
ending headcount has decreased year over year, the annual average headcount for 2008 was higher by 20, or 6%, as compared to the 2007 annual average headcount; therefore resulting in increased labor related charges year over year.
Cost of Maintenance and Support Services
Our cost of maintenance and support services is primarily comprised of salaries, benefits, stock-based compensation, incentive compensation and third-party contractor expenses, as well as facilities and other expenses incurred in providing support to our customers.
Cost of maintenance services was $22.5 million for the year ended December 31, 2009, an increase of $1.1 million, or 5%, when compared to the year ended December 31, 2008. The change is due to an increase in labor and related benefits of $0.9 million and an increase in royalties of $0.3 million for third-party products, which are embedded or sold along with our products offerings. This is offset by decreases in travel of $0.1 million.
Cost of maintenance services increased $4.0 million, or 23%, to $21.4 million for the year ended December 31, 2008 compared to the year ended December 31, 2007. The increase was due to increased labor and related benefits, bonus, and stock-based compensation of $3.6 million and an increase in royalties for third-party products, which are embedded or sold along with our products, of $0.6 million offset by a decrease in travel related expenses and other support related expenses of $0.2 million year over year.
Cost of Other Revenues
Our cost of other revenues includes the cost of third-party equipment and software purchased for customers as well as the cost associated with our annual user conference. For the year ended December 31, 2009, cost of other revenues decreased to $4.7 million from $5.2 million in the prior year as a result of lower user conference costs associated with lower conference attendance in the current year.
Cost of other revenues decreased $0.1 million, or 2%, to $5.2 million for the year ended December 31, 2008 as compared to the year ended December 31, 2007 due to a decrease of $0.5 million in costs associated with lower third-party equipment and software sales offset by an increase in costs associated with our user conference of $0.3 million.
Operating Expenses
| Year Ended December 31, | 2009 versus 2008 | 2008 versus 2007 | |||||||||||||||||||
| 2009 | 2008 | 2007 | Change | % Change | Change | % Change | |||||||||||||||
| (dollars in millions) | |||||||||||||||||||||
| OPERATING EXPENSES: |
|||||||||||||||||||||
| Research and development |
$ | 43.4 | $ | 45.8 | $ | 42.9 | $ | (2.4 | ) | (5 | ) | $ | 2.9 | 7 | |||||||
| Sales and marketing |
44.8 | 53.8 | 45.3 | (9.0 | ) | (17 | ) | 8.5 | 19 | ||||||||||||
| General and administrative |
35.5 | 33.4 | 30.6 | 2.1 | 6 | 2.8 | 9 | ||||||||||||||
| Restructuring charge |
3.9 | 1.0 | — | 2.9 | 290 | 1.0 | 100 | ||||||||||||||
| Total operating expenses |
$ | 127.6 | $ | 134.0 | $ | 118.8 | $ | (6.4 | ) | (5 | ) | $ | 15.2 | 13 | |||||||
Research and Development
Our product development expenses consist primarily of salaries, benefits, stock-based compensation, incentive compensation and related expenses, including third-party contractor expenses, and other expenses associated with the design, development and testing of our software applications.
Research and development expenses decreased by $2.4 million, or 5%, to $43.4 million for the year ended December 31, 2009 compared to the year ended December 31, 2008. The drivers of the year over year decrease
44
Table of Contents
were lower labor costs and related benefits of $1.4 million resulting primarily from reduced headcount, lower travel expenses of $0.4 million, lower amortization of purchased intangibles of $0.3 million, and lower third-party contractor expenses of $0.3 million.
Research and development expenses increased by $2.9 million, or 7%, to $45.8 million for the year ended December 31, 2008 compared to the year ended December 31, 2007. Labor and related benefits, bonus, and stock-based compensation are the primary contributors of the year over year increase adding $4.0 million more in development related expense activities from 2007 to 2008. These costs were offset by a decrease of $0.9 million in third-party costs related to supporting new release developments as well as a decline in travel related expenses of $0.2 million.
Sales and Marketing
Our sales and marketing expenses consist primarily of salaries and related costs, commissions paid to our sales team and the cost of marketing programs, (including our demand generation efforts, advertising, events, marketing and corporate communications, field marketing and product marketing), and other expenses associated with our sales and marketing activities. Sales and marketing expenses also include amortization expense for acquired intangible assets associated with customer relationships.
Sales and marketing expenses decreased by $9.0 million, or 17%, to $44.8 million for the year ended December 31, 2009 compared to the year ended December 31, 2008. The decrease was due to decreased labor and related benefits of $5.6 million primarily from a reduction in headcount of 23% to approximately 150, decreased commissions of $2.6 million resulting from lower license sales in 2009, a $1.1 million decrease in select marketing programs, and decreased travel and other expenses of $0.7 million. Partially offsetting these decreases to expense were a $0.7 million increase in the amortization of purchased intangibles and a $0.3 million increase in third-party contractor expenses.
Sales and marketing expenses increased by $8.5 million, or 19%, to $53.8 million for the year ended December 31, 2008 compared to the year ended December 31, 2007. The change is primarily due to increased labor and related benefits, bonus, commissions, and stock-based compensation of $8.1 million driven by an increase in headcount coupled with an increase in travel related expenses of $0.6 million offset by $0.2 million in reduced other expenses.
General and Administrative
Our general and administrative expenses consist primarily of salaries and related costs for general corporate functions, including executive, finance, accounting, legal and human resources. General and administrative costs also include New Mountain Capital advisory fees, insurance premiums and third-party legal and other professional services fees, facilities and other expenses associated with our administrative activities.
General and administrative expenses increased by $2.1 million, or 6%, to $35.5 million for the year ended December 31, 2009 compared to the year ended December 31, 2008. The increase resulted from increases in legal fees of $1.5 million, labor and related benefits of $1.4 million, bad debt expense of $0.7 million, and professional fees of $0.4 million, partially offset by a reduction of $1.8 million in professional fees for external audit and SOX services.
General and administrative expenses increased by $2.8 million, or 9%, to $33.4 million for the year ended December 31, 2008 compared to the year ended December 31, 2007. Labor and related benefits, bonus, and stock-based compensation increased year over year by $2.2 million coupled with an increase in audit, professional services, insurance and third-party costs of $1.3 million primarily due to costs associated with being a public company. The increase was offset in part with a decrease in bad debt expense of $0.7 million driven by improved collectability in our foreign operations and overall improved billing processes.
45
Table of Contents
Restructuring Charge
Certain restructuring plans were implemented in 2009 to realign the Company’s cost structure and to allow for increased investment in its key strategic objectives. These plans included a reduction of headcount of approximately 100 employees which resulted in $3.1 million in aggregate restructuring charges for severance and severance-related costs. In addition, the Company recorded a restructuring charge of $0.7 million for the consolidation of one facility and for the closure of two office locations.
The Company anticipates additional restructuring charges in 2010 as it continues to realign its cost structure and allow for increased investment in its key strategic objectives.
During the year ended December 31, 2008, management implemented a restructuring plan to eliminate certain positions to realign the Company’s cost structure and for the elimination of excess office space. The charge taken in the second quarter of 2008 included $0.9 million for severance and severance-related costs for approximately 50 employees. The charge also included $0.1 million for facilities-related expenses, associated with closure of one office location and a reduction in space at a second location, and offset by a reduction in existing deferred rent liabilities.
Interest Income
Interest income in all periods reflects interest earned on our invested cash balances. Interest income decreased $0.5 million for the year ended December 31, 2009 compared to the year ended December 31, 2008. The principal drivers of this decrease were the change in the Company’s investment election for its funds from a traditional money market fund to a U.S. Treasury securities money market fund as well as the overall decrease in interest rates paid on money market funds.
Interest income increased by $0.3 million for the year ended December 31, 2008 compared to the year ended December 31, 2007 due to higher cash balances in 2008 as compared to 2007, reflecting the impact of the initial public offering in November 2007 and the cash flow generated from operations during 2008.
Interest Expense
| Year Ended December 31, | 2009 versus 2008 | 2008 versus 2007 | |||||||||||||||||||||
| 2009 | 2008 | 2007 | Change | % Change | Change | % Change | |||||||||||||||||
| (dollars in millions) | |||||||||||||||||||||||
| Interest expense |
$ | 7.6 | $ | 11.0 | $ | 18.5 | $ | (3.4 | ) | (31 | ) | $ | (7.5 | ) | (41 | ) | |||||||
Interest expense decreased by $3.4 million for the year ended December 31, 2009 compared to the year ended December 31, 2008. The decreases resulted from an overall decrease in the British Banker’s Association Interest Settlement Rates for dollar deposits (the “LIBO rate”) as well as from the prepayment of debt during the first half of 2009.
Interest expense decreased by $7.5 million for the year ended December 31, 2008 compared to the year ended December 31, 2007. The decrease resulted from lower interest rates, coupled with lower borrowings under our term loan and our credit facility during 2008. In addition, our lower leverage ratio resulted in a reduction in the spread over the LIBO rate from 2.25% to 2.00%.
The Company anticipates that interest expense will increase in 2010 due to the Amended Credit Agreement which increased the interest rate for the extended portion of both the term loans and the revolving credit facility to a LIBO rate plus 4.25% with a LIBO rate floor of 2.00%.
46
Table of Contents
Income Taxes
| Year Ended December 31, | 2009 versus 2008 | 2008 versus 2007 | |||||||||||||||||||||
| 2009 | 2008 | 2007 | Change | % Change | Change | % Change | |||||||||||||||||
| (dollars in millions) | |||||||||||||||||||||||
| Income tax expense |
$ | 10.4 | $ | 12.6 | $ | 15.5 | $ | (2.2 | ) | (17 | ) | $ | (2.9 | ) | (19 | ) | |||||||
Income tax expense for the twelve months ended December 31, 2009 decreased $2.2 million to $10.4 million compared to $12.6 million for the twelve months ended December 31, 2008. As a percentage of pre-tax income, income tax expense was 32.7% and 34.9% for the twelve months ended December 31, 2009 and 2008, respectively. The income tax expense for 2009 is lower than the income tax expense for 2008 due primarily to the lower pre-tax income as well as various newly implemented tax strategies including increased credits for qualified research and development activities, the expected utilization of foreign tax credits not scheduled to expire for ten years, and the deductibility of certain expenses.
Income tax expense decreased by $2.9 million for the year ended December 31, 2008 compared to the year ended December 31, 2007. As a percentage of pre-tax income, income tax expense was 34.9% and 40.7% for the years ended December 31, 2008 and 2007, respectively. The decrease in the effective tax rate was primarily the result of realizing tax benefits from losses in foreign subsidiaries, and realizing increased tax benefits from research and development tax credits and certain tax deductions and adjustments resulting from a detailed functional and economic analysis of related party transactions reflected in our updated transfer pricing agreements. As a result of this change in geographic distribution of income, we released all of the valuation allowance we had previously recorded because we determined that it was more likely than not that we would be able to realize the tax benefits associated with its foreign losses. Of the $1.1 million valuation allowance we released in 2008, $0.5 million was recorded against goodwill and the remaining $0.6 million was recorded in the profit and loss statement.
During the twelve months ended December 31, 2009, the Company established an additional liability of approximately $0.7 million associated with the establishment of a reserve for foreign tax credits as well as certain permanent adjustments and associated interest on prior period ASC 740-10 adjustments.
During the year ended December 31, 2008, the Company established an additional liability of approximately $0.4 million which included a $0.2 million increase associated with certain research and development tax credits acquired from WST Corporation. Changes to these unrecognized tax benefits will primarily be recorded as part of the income tax expense. For further information, see Note 11, Income Taxes, of our consolidated financial statements contained in Item 8 of this Annual Report on Form 10-K.
Credit Agreement
The Company has maintained a credit agreement with a syndicate of lenders led by Credit Suisse (the “Credit Agreement”) since 2005. In August 2009, the Company amended the Credit Agreement. At the time of the amendment, the Company had term loans of $179.6 million outstanding and a $30 million revolving credit facility on which there were no borrowings. The term loans and revolving credit facility were to expire on April 22, 2011 and April 22, 2010, respectively.
As a result of the amendment, the Company extended the maturity of $129.4 million of term loans to April 22, 2013. In addition, the expiration of $22.5 million of the revolving credit facility was extended to April 22, 2013. The remaining $50.2 million of term loans mature and $7.5 million of the revolving credit facility continues to expire on April 22, 2011 and April 22, 2010, respectively.
The non-extended portion of the term loans continues to accrue interest at a rate of 2.25% above the British Banker’s Association Interest Settlement Rates for dollar deposits. The non-extended portion of the revolving credit facility continues to accrue interest at a rate of 2.50% or 1.50%, depending on the type of borrowing. The spread above the LIBO rate decreases as the Company’s leverage ratio, as defined in the Amended Credit
47
Table of Contents
Agreement, decreases. The interest rate for the extended portion of both the term loans and the revolving credit facility is the LIBO rate plus 4.25% with a LIBOR floor of 2.0%. In addition, the Company will pay an annual fee equal to 0.75% of the undrawn portion on the revolving credit facility that was extended to April 22, 2013.
As of December 31, 2009 and December 31, 2008, the outstanding amount of the term loans was $179.0 million and $192.8 million, respectively, and there were no borrowings outstanding under the revolving credit facility.
All the loans under the Amended Credit Agreement are collateralized by substantially all of our assets (including our subsidiaries’ assets) and require us to comply with financial covenants requiring us to maintain defined minimum levels of interest coverage and fixed charges coverage and providing for a limitation on our leverage ratio. The financial ratio covenants in the Amended Credit Agreement remained unchanged.
The following table summarizes the significant financial covenants under the Amended Credit Agreement (adjusted EBITDA below is as defined in the Amended Credit Agreement):
| As of December 31, 2009 |
Most Restrictive Required Level | |||||||
| Covenant Requirement |
Calculation |
Required Level |
Actual Level |
|||||
| Minimum Interest Coverage |
Cumulative adjusted EBITDA for the prior four quarters/consolidated interest expense | Greater than 2.75 to 1.00 | 9.78 | Greater than 3.00 to 1.00 effective January 1, 2010 | ||||
| Minimum Fixed Charges Coverage | Cumulative adjusted EBITDA for the prior four quarters/(interest expense + principal payments + capital expenditures + capitalized software costs + cash tax payments) | Greater than 1.10 | 2.76 | Greater than 1.10 | ||||
| Leverage Coverage |
Total debt/cumulative adjusted EBITDA for the prior four quarters | Less than 3.25 to 1.00 | 2.77 | Less than 3.25 to 1.00 | ||||
The Amended Credit Agreement also requires us to comply with non-financial covenants that restrict or limit certain corporate activities by us and our subsidiaries, including our ability to incur additional indebtedness, guarantee obligations, or create liens on our assets, enter into sale and leaseback transactions, engage in mergers or consolidations, or pay cash dividends.
Based on our current and expected performance, we believe we will continue to satisfy the financial covenants of our Amended Credit Agreement for the foreseeable future.
As of December 31, 2009, we were in compliance with all covenants related to our Amended Credit Agreement.
In connection with the Amended Credit Agreement, we incurred debt issuance costs of $2.3 million during the third quarter of 2009, of which $2.1 million will be amortized to interest expense over the remaining term of the modified debt. Previously deferred debt issuance costs that existed at the time of the credit agreement amendment will also be amortized over the remaining term of the modified debt. We incurred no debt issuance costs in 2007 and 2008.
Debt issuance costs have generally been amortized and reflected in interest expense over the lives of the respective loans. At December 31, 2009, $1.3 million of unamortized debt issuance costs remained in “Prepaid Expenses and Other Current Assets” and $1.5 million was reflected in “Other Assets” on the consolidated balance sheet. During the years ended December 31, 2009, 2008, and 2007, costs of $1.0 million, $0.8 million and $1.1 million, respectively, were amortized and reflected in interest expense. The December 31, 2009 amount included $98,000 of accelerated amortization of debt issuance costs as a result of prepayments on the term loans
48
Table of Contents
from the annual excess cash flow in the first quarter of 2009 and due to the completion of the rights offering in the second quarter of 2009. The December 31, 2007 amount included $233,000 of accelerated amortization of debt issuance costs as a result of the Company’s prepayment on the term loans in the fourth quarter of 2007. For fiscal year 2008, there was no accelerated amortization of debt issuance costs.
The Amended Credit Agreement requires mandatory prepayments of the term loans from our annual excess cash flow, as defined in the Amended Credit Agreement, and from the net proceeds of certain asset sales or equity issuances. During the first quarter of 2009, we made a scheduled principal payment of $498,000 and a contractually required principal prepayment of $9.7 million from our 2008 annual excess cash flow. The Amended Credit Agreement also requires us to prepay a portion of the term loans from the net proceeds of certain equity issuances to certain investors so that our leverage ratio (as defined in the Amended Credit Agreement) is less than 2.75. In connection with our common stock rights offering, we were required to make a mandatory principal prepayment of approximately $3.1 million from the net proceeds from the rights offering, as our leverage ratio was greater than 2.75 to 1 prior to the completion of the rights offering. The mandatory excess cash flow payment made in March 2009 was applied first against the scheduled principal payments under the original Credit Agreement for a twelve month period and, secondly, with the excess applied ratably against the remaining debt payments in the amortization schedule under the original Credit Agreement. The prepayment from our rights offering was applied ratably against the remaining debt payments under the original Credit Agreement.
We expect to pay a mandatory prepayment of the term loans from our 2009 excess cash flow at March 31, 2010. A payment of $26.7 million will be due which will be applied pro rata against the non-extended and extended term loans. The payments will be applied against regularly scheduled principal payments for a twelve month period and, secondly, with the excess applied ratably against the remaining debt payments for the outstanding term loans.
See discussion below in Contractual Obligations and Commitments for our future scheduled principal payments on the Amended Credit Agreement.
Liquidity and Capital Resources
Overview of Liquidity
Our primary operating cash requirements include the payment of salaries, incentive compensation and related benefits, and other headcount-related costs as well as the costs of office facilities and information technology systems. We fund these requirements through cash collections from our customers for the purchase of our software, consulting services and maintenance services. Amounts due from customers for software license and maintenance services are generally billed in advance of the contract period.
The cost of our acquisitions has been financed with available cash flow and, to the extent necessary, short-term borrowings from our revolving credit facility. These borrowings were repaid in subsequent periods with available cash provided by operating activities as well as with proceeds from our initial public offering. We utilize our revolving credit facility for the additional purpose of providing the required guarantee related to certain letters of credit for our real estate leases. At December 31, 2009, the total amount of letters of credit guaranteed under the revolving credit facility was $0.9 million. As a result, available borrowings on the revolving credit facility at December 31, 2009 were $29.1 million.
Historically, our cash flows have been subject to variability from year-to-year, primarily as a result of one-time or infrequent events. We expect that our future growth will continue to require additional working capital. Although such future working capital requirements are difficult to forecast, based on our current estimates of revenues and expenses we believe that anticipated cash flows from operations and available sources of funds (including available borrowings under our revolving credit facility) will provide sufficient liquidity for us to fund our business and meet our obligations for the next twelve months. In addition, our Amended Credit
49
Table of Contents
Agreement provides for greater financial flexibility by extending our debt repayments over a longer term. We also believe that the aggregate cash balance of $132.6 million as of December 31, 2009 is sufficient to cover the payments due over the next eighteen months of $70.0 million under the Amended Credit Agreement. In the future, however, we may require additional liquidity to fund our operations, strategic investments and acquisitions, and debt repayment obligations, which could entail raising additional funds or further refinancing of our Amended Credit Agreement.
In June 2009, we completed our common stock rights offering, which was fully subscribed by our stockholders, resulting in the issuance of 20 million shares of common stock. Net proceeds after deducting fees and offering expenses were approximately $58.2 million. We used approximately $3.1 million to prepay indebtedness under our Credit Agreement and intend to use the remaining net proceeds from the rights offering for additional working capital, strategic investments and acquisitions, reduction of indebtedness or general corporate purposes. In the fourth quarter of 2007, we completed our initial public offering. The net proceeds to the Company were $42.6 million which were used to repay a $25.0 million balance on our revolving credit facility and to make a $17.6 million prepayment on our term loans.
Analysis of Cash Flows
For the year ended December 31, 2009, net cash provided by operating activities was $59.8 million compared to $42.6 million provided during the comparable period of 2008. The increase of $17.2 million was attributed to a decrease in cash payments of $5.1 million for taxes, $5.0 million in interest and $9.1 million in other operating activities partially offset by an increase in cash payments for restructuring charges of $2.0 million. The increase in deferred revenue of $18.4 million was primarily attributed to accelerating our maintenance billing process in the second quarter of 2009.
For the year ended December 31, 2008, net cash provided by operating activities was $42.6 million compared to $19.1 million provided during the comparable period of 2007. This increase of $23.5 million is primarily driven by the additional cash associated with increased customer payments of $23.9 million offset by higher cash payments for income taxes and other expenses during the year ended December 31, 2008.
Beginning in 2010, all maintenance billing will generally occur on an annual rather than quarterly basis which will result in an expected increase in deferred revenue in 2010.
Net cash used in investing activities was $7.9 million for the year ended December 31, 2009, compared to $24.0 million used during the comparable period of 2008. Our use of cash during the year ended December 31, 2009 was for the acquisition of mySBX of $5.4 million, purchase of property and equipment of $2.4 million and capitalized software development costs of $0.1 million. Net cash used in investing activities was $24.0 million for the year ended December 31, 2008, compared to $15.6 million used during the comparable period of 2007. The increase of $8.4 million is due to cash used in 2008 of $16.4 million for the acquisition of MPM, AIM contingent consideration of $1 million, and additional consideration for Welcom of $0.5 million as compared to 2007 for which we paid $6.1 million for AIM and WSTP. Other cash used in investing activities of $5.7 million was associated with purchases of property and equipment in 2008.
Net cash provided by financing activities was $44.9 million for the year ended December 31, 2009, compared to $0.3 million provided during the year ended December 31, 2008. Cash provided by financing activities during the year ended December 31, 2009 was primarily related to proceeds received from our rights offering of $58.2 million, net of issuance costs, and proceeds from issuance of stock under our employee stock purchase plan (“ESPP”) as well as stock option exercises of $2.9 million. This was offset by $13.9 million in debt repayments and payments for deferred financing costs of $2.3 million. Debt repayments consisted of a scheduled cash repayment of $1.1 million and contractually required prepayments of $12.8 million.
Net cash provided by financing activities was $0.3 million for the year ended December 31, 2008, compared to $6.8 million provided during the year ended December 31, 2007. This decrease is due to proceeds from our initial public offering in the fourth quarter of 2007 of $43.0 million, $22.5 million in proceeds from the issuance
50
Table of Contents
of debt in 2007, offset by higher debt repayments of $59.2 million in 2007. In addition, proceeds from exercise of stock options, issuance of stock under our ESPP plan and the related tax benefit on options were higher by $4.7 million in 2007. The proceeds from the stock option activity in 2007 were offset by $4.8 million in payments made in 2007 to stockholders and the redemption of stock in relation to our capitalization. We used $42.6 million in net proceeds from our initial public offering to pay down $25.0 million of indebtedness on our outstanding revolving credit facility and $17.6 million on our term loan. As of December 31, 2008 we had no borrowings against our revolving credit facility.
Impact of Seasonality
Fluctuations in our quarterly software license fee revenues have historically reflected, in part, seasonal fluctuations driven by our customers’ procurement cycles for enterprise software and other factors. These factors have historically yielded a peak in software license fee revenue in the fourth quarter due to increased spending by our customers during that time. However, as a result of the current economic environment, the seasonality of our business has been impacted by our customers’ views of their economic outlook. Therefore, past seasonality may not be indicative of current or future seasonality.
Our consulting services revenues are impacted by software license sales, the availability of consulting resources to work on customer implementations, and the adequacy of our contracting activity to maintain full utilization of available resources. As a result, services revenues are much less subject to seasonal fluctuations.
Our maintenance revenues are not subject to significant seasonal fluctuations.
Contractual Obligations and Commitments
We have various contractual obligations and commercial commitments. Our material capital commitments consist of term loan related debt obligations and commitments under facilities and operating leases. We rarely enter into binding purchase commitments. The following table summarizes our existing contractual obligations and contractual commitments as of December 31, 2009:
| Payments Due By December 31, | |||||||||||||||||||||
| Contractual Obligations |
Total | 2010 | 2011 | 2012 | 2013 | 2014 | Thereafter | ||||||||||||||
| (dollars in thousands) | |||||||||||||||||||||
| Term loan |
$ | 178,957 | $ | 44,707 | $ | 25,873 | $ | 1,092 | $ | 107,285 | $ | — | $ | — | |||||||
| Operating leases |
14,498 | 7,032 | 5,870 | 1,508 | 88 | — | — | ||||||||||||||
| Liability for redemption of stock in recapitalization |
317 | 317 | — | — | — | — | — | ||||||||||||||
The table above does not include interest payments with respect to the outstanding term loans. Interest expense associated with the non-extended portion of our term loans is variable and therefore fluctuates with interest rate fluctuations in the market. Based on the variable rate debt outstanding as of December 31, 2009, a hypothetical 1% increase in interest rates would only increase interest expense by approximately $0.5 million on an annual basis, because the current LIBO rate on the fixed rate portion of our term loans was more than 1% lower than the 2% LIBOR floor applicable to our term loans.
Following the repayment of $0.3 million in the fourth quarter of 2009, our scheduled repayments on the outstanding amount of the term loans are as detailed in the above table. However, the amount and timing of these scheduled payments could vary based on the required mandatory prepayments from our annual excess cash flow, and from the net proceeds of certain asset sales or equity issuances as defined in the Amended Credit Agreement. The repayment in 2010 of $44.7 million includes scheduled repayments of $18.0 million and a prepayment of $26.7 million from our 2009 annual excess cash flow. We expect to make $27.0 million, $5.2 million and $12.5 million in principal payments by March 31, 2010, September 30, 2010 and December 31, 2010, respectively.
51
Table of Contents
The above table does not include approximately $1.9 million of long-term income tax liabilities recorded in accordance with ASC 740-10 because we are unable to reasonably estimate the timing of these potential future payments.
Off-Balance Sheet Arrangements
As of December 31, 2009, we had no off-balance sheet arrangements.
Indemnification
We provide limited indemnification to our customers against intellectual property infringement claims made by third parties arising from the use of our software products. Due to the established nature of our primary software products and the lack of intellectual property infringement claims in the past, we cannot estimate the fair value nor determine the total nominal amount of the indemnification, if any. Estimated losses for such indemnification are evaluated under ASC 450, Contingencies, as interpreted by ASC 460, Guarantees. We have secured copyright and trademark registrations for our software products with the U.S. Patent and Trademark Office, and we have intellectual property infringement indemnification from our third-party partners whose technology may be embedded or otherwise bundled with our software products. Therefore, we generally consider the probability of an unfavorable outcome in an intellectual property infringement case to be relatively low. We have not encountered material costs as a result of such obligations and have not accrued any liabilities related to such indemnifications.
Recently Adopted Accounting Pronouncements
In December 2007, the FASB issued ASC 805, Business Combinations, which replaces the former standard SFAS 141. ASC 805 requires assets and liabilities acquired in a business combination, contingent consideration, and certain acquired contingencies to be measured at their fair values as of the date of acquisition. ASC 805 also requires that acquisition-related costs and restructuring costs be recognized separately from the business combination. ASC 805 is effective beginning on or after December 15, 2008. For business combinations entered into after the effective date of ASC 805, prospective application of the new standard is applied. The guidance in SFAS 141 is applied to business combinations entered into before the effective date of ASC 805. Beginning in 2009, we adopted ASC 805 which was applied to our 2009 acquisition.
In April 2008, the FASB issued ASC 350-30-55, Intangibles-Goodwill and Other-General Intangibles Other than Goodwill. ASC 350-30-55 amends the factors that should be considered in developing renewal or extension assumptions used to determine the useful life of a recognized intangible asset under ASC 350, Intangibles-Goodwill and Other. The objective is to improve the consistency between the useful life of a recognized intangible asset under ASC 350 and the period of expected cash flows used to measure the fair value of the asset under ASC 805. ASC 350-30-55 is effective for fiscal years beginning after December 15, 2008. The guidance in ASC 350-30-55 for useful life estimates is applied prospectively to intangible assets acquired after December 31, 2008. Beginning in 2009, we adopted ASC 350-30-55 which was applied to our 2009 acquisition.
In November 2008, the FASB issued ASC 350-30-35, Intangibles-Goodwill and Other-General Intangibles Other than Goodwill. ASC 350-30-35 clarifies the accounting for acquired intangible assets in situations in which the acquirer does not intend to actively use the asset but intends to hold (lock up) the asset to prevent its competitors from obtaining access to the asset (a defensive intangible asset). Under ASC 350-30-35, defensive intangible assets will be treated as a separate asset recognized at fair value and assigned a useful life in accordance with ASC 350. ASC 350-30-35 is effective for intangible assets acquired on or after the beginning of the first annual reporting period beginning on or after December 15, 2008, or January 1, 2009 for Deltek. During 2009, we did not acquire any defensive intangible assets.
In April 2009, the FASB issued ASC 805-20, Business Combinations-Identifiable Assets and Liabilities, and Any Noncontrolling Interest. ASC 805-20 amends the guidance in ASC 805 regarding pre-acquisition contingencies. The guidance in ASC 805-20 requires the recognition at fair value of an asset or liability assumed
52
Table of Contents
in a business combination that arises from a contingency if the acquisition date fair value can be reasonably estimated during the measurement period. If the fair value cannot be reasonably estimated, the asset or liability would be recognized in accordance with ASC 450, Contingencies, if the criteria in ASC 450 were met at the acquisition date. Previously, ASC 805 required pre-acquisition contingencies to be measured at fair value at the date of acquisition. ASC 805-20 is effective for business combinations occurring after January 1, 2009. Beginning in 2009, we adopted ASC 805-20, however, we did not acquire any pre-acquisition contingencies in our 2009 acquisition.
In April 2009, the FASB issued ASC 825-10-65, Financial Instruments-Transition, effective for interim periods ending after June 15, 2009. ASC 825-10-65 requires disclosures about fair value of financial instruments for interim reporting periods of publicly traded companies as well as in annual financial statements to improve the transparency and quality of financial reporting. ASC 825-10-65 amends ASC 270, Interim Reporting, to require those disclosures in summarized financial information at interim reporting periods. See Part II, Item 8, Note 1, Fair Value Measurements, for the related disclosures. The adoption of ASC 825-10-65 in the second quarter of 2009 did not have a material impact on our results of operations, financial position, or cash flows.
In April 2009, the FASB issued ASC 820-10-35, Fair Value Measurements and Disclosures-Subsequent Measurement. ASC 820-10-35 provides guidance on how to determine the fair value of assets and liabilities when the volume and level of activity for the asset or liability has significantly decreased. ASC 820-10-35 also provides guidance on identifying circumstances that indicate a transaction is not orderly. In addition, ASC 820-10-35 requires disclosure in interim and annual periods of the inputs and valuation methods used in determining fair value and a discussion of any changes in those valuation methods. ASC 820-10-35 is effective for annual and interim periods ending on or after June 15, 2009. During the second quarter of 2009, we adopted the provisions in ASC 820-10-35. The provisions adopted did not have an impact on our financial statements as our fair value measurements are Level 1 measurements in an active market with orderly transactions.
In May 2009, the FASB issued ASC 855, Subsequent Events, effective for interim and annual periods ending after June 15, 2009. ASC 855 establishes the accounting for, and disclosure of, events that occur after the balance sheet date but before financial statements are issued or are available to be issued. See Part II, Item 8, Note 20, Subsequent Events, for the related disclosures. The adoption of ASC 855 in the second quarter of 2009 did not have a material impact on our results of operations, financial position, or cash flows.
In August 2009, the FASB issued Accounting Standards Update (ASU) No. 2009-05 (“ASU 2009-05”), Fair Value Measurement and Disclosure: Measuring Liabilities at Fair Value, which amends ASC 820-10-35. The guidance in ASU 2009-05 provides clarification on measuring liabilities at fair value when a quoted price in an active market is not available. The ASU specifies that a valuation technique should be applied that uses either the quote of the liability when traded as an asset, the quoted prices for similar liabilities or similar liabilities when traded as assets, or another valuation technique consistent with existing fair value measurement guidance such as a present value technique or a technique that is based on the amount at the measurement date that the reporting entity would pay to transfer the identical liability or would receive to enter into the identical liability. The guidance also states that when estimating the fair value of a liability, a reporting entity is not required to include a separate input or adjustments to other inputs relating to the existence of a restriction that prevents the transfer of the liability. ASU 2009-05 is effective for the first reporting period beginning after issuance, or October 1, 2009. The adoption of ASU 2009-05 did not have an impact on our financial statements as we currently do not have any liabilities measured at fair value.
Recent Accounting Pronouncements
In October 2009, the FASB issued ASU 2009-13, Multiple-Deliverable Revenue Arrangements, and the FASB issued ASU 2009-14, Certain Revenue Arrangements That Include Software Elements, on revenue recognition that will become effective for the Company beginning January 1, 2011, with earlier adoption permitted. We do not anticipate that the adoption of these standards will have an impact on its consolidated financial statements.
53
Table of Contents
| Item 7A. | Quantitative and Qualitative Disclosures About Market Risk |
Interest Rate Risk
Our exposure to market risk for changes in interest rates relates primarily to our outstanding debt and cash and cash equivalents consisting primarily of funds held in money market accounts on a short-term basis with no withdrawal restrictions. At December 31, 2009, we had $132.6 million in cash and cash equivalents. Our interest expense associated with the non-extended portion of our term loans and revolving credit facility will vary with market rates. As of December 31, 2009, we had approximately $179.0 million in debt outstanding, of which $128.7 million is set at a fixed rate, due to the LIBOR floor established in the Amended Credit Agreement, and the remaining $50.2 million is at a variable rate. Based upon the variable rate debt outstanding as of December 31, 2009, a hypothetical 1% increase in interest rates would increase interest expense by approximately $0.5 million on an annual basis, and likewise decrease our earnings and cash flows. However, an increase in LIBOR subsequent to December 31, 2009 could cause our fixed rate debt to become variable and our interest expense to vary.
We cannot predict market fluctuations in interest rates and their impact on our variable rate debt, or whether fixed-rate long-term debt will be available to us at favorable rates, if at all. Consequently, future results may differ materially from the hypothetical 1% increase discussed above.
Based on the investment interest rate and our cash and cash equivalents balance as of December 31, 2009, a hypothetical 1% decrease in interest rates would decrease interest income by approximately $1.3 million on an annual basis, and likewise decrease our earnings and cash flows. We do not currently use derivative financial instruments in our investment portfolio.
Foreign Currency Exchange Risk
Our results of operations and cash flows are subject to fluctuations due to changes in foreign currency exchange rates, particularly changes in the British pound, the Philippine peso, and the Australian dollar. As our international operations continue to grow, we may choose to use foreign currency forward and option contracts to manage currency exposures. We do not currently have any such contracts in place, nor did we have any such contracts during 2009, 2008, or 2007. To date, exchange rate fluctuations have not had a material impact on our operating results and cash flows given the scope of our international presence. A hypothetical 10% increase or decrease in foreign currency exchange rates would not have a material effect on our financial statements.
| Item 8. | Financial Statements and Supplementary Data |
Our consolidated financial statements, together with the related notes and the report of independent registered public accounting firm, are set forth on the pages indicated in Item 15.
| Item 9. | Changes In and Disagreements with Accountants on Accounting and Financial Disclosure |
Not applicable.
| Item 9A. | Controls and Procedures |
Evaluation of Disclosure Controls and Procedures
Our management maintains disclosure controls and procedures that are designed to ensure that information required to be disclosed in our periodic reports pursuant to the Securities Exchange Act of 1934, as amended (the “Exchange Act”), is recorded, processed, summarized and reported within the time periods specified in the SEC’s rules and forms, and that such information is accumulated and communicated to our management, including our Chief Executive Officer, our Chief Financial Officer, and our Principal Accounting Officer, as appropriate, to allow for timely decisions regarding required financial disclosures.
54
Table of Contents
Our management evaluated, with the participation of our Chief Executive Officer, our Chief Financial Officer and our Principal Accounting Officer, the effectiveness of the design and operation of our disclosure controls and procedures pursuant to Exchange Act Rules 13a-15(e) or 15d-15(e) as of December 31, 2009. Based on this evaluation, our Chief Executive Officer, our Chief Financial Officer, and our Principal Accounting Officer concluded that our disclosure controls and procedures were effective as of December 31, 2009.
Our management’s report on internal control over financial reporting (as defined in Exchange Act Rules 13(a)-15(e) or 15(d)-15(f)) and the independent registered public accounting firm’s related audit report on the effectiveness of our internal control over financial reporting are included in this Item 9A of this Annual Report on Form 10-K.
Changes in Internal Control Over Financial Reporting
There were no changes in our internal control over financial reporting (as such term is defined in Rules 13a-15(f) and 15d-15(f) under the Exchange Act) during the quarter ended December 31, 2009 that have materially affected, or are reasonably likely to materially affect, our internal control over financial reporting.
Management’s Report on Internal Control Over Financial Reporting
Our management is responsible for establishing and maintaining adequate internal control over financial reporting as defined in Exchange Act Rules 13a-15(f) and 15d-15(f). Our management is required to assess the effectiveness of our internal control over financial reporting as of the end of the fiscal year, and report, based on that assessment, whether our internal control over financial reporting is effective.
Our internal control over financial reporting is a process designed under the supervision of our Chief Executive Officer, our Chief Financial Officer, and our Principal Accounting Officer to provide reasonable assurance regarding the reliability of financial reporting and the preparation of our financial statements for external reporting purposes in accordance with accounting principles generally accepted in the United States.
Our internal control over financial reporting includes policies and procedures that (1) pertain to the maintenance of records that, in reasonable detail, accurately and fairly reflect transactions and dispositions of assets; (2) provide reasonable assurance that transactions are recorded as necessary to permit preparation of financial statements in accordance with accounting principles generally accepted in the United States, and that receipts and expenditures are being made only in accordance with authorizations of the Company’s management and board of directors; and (3) provide reasonable assurance regarding prevention or timely detection of unauthorized acquisition, use or disposition of our assets that could have a material effect on our financial statements.
A control system, no matter how well conceived and operated, can provide only reasonable, not absolute, assurance that the objectives of the control system are met. Further, the design of a control system must reflect the fact that there are resource constraints, and the benefits of controls must be considered relative to their costs. Because of the inherent limitations in any control system, internal control over financial reporting may not prevent or detect misstatements due to human error, or the improper circumvention or overriding of internal controls. In addition, projections of any evaluation of effectiveness to future periods are subject to the risk that controls may become inadequate because of changes in conditions and that the degree of compliance with the policies or procedures may change over time.
As of December 31, 2009, management conducted an assessment of the effectiveness of our internal control over financial reporting based on the framework established in Internal Control—Integrated Framework issued by the Committee of Sponsoring Organizations of the Treadway Commission (COSO). Based on this assessment, management has determined that our internal control over financial reporting as of December 31, 2009 was effective.
The effectiveness of our internal control over financial reporting as of December 31, 2009 has been audited by Deloitte & Touche LLP, our independent registered public accounting firm, which also audited our consolidated financial statements included in this Form 10-K.
55
Table of Contents
REPORT OF INDEPENDENT REGISTERED PUBLIC ACCOUNTING FIRM
To the Audit Committee and Stockholders of
Deltek, Inc.
Herndon, Virginia
We have audited the internal control over financial reporting of Deltek, Inc. and its subsidiaries (the “Company”) as of December 31, 2009, based on the criteria established in Internal Control—Integrated Framework issued by the Committee of Sponsoring Organizations of the Treadway Commission. The Company’s management is responsible for maintaining effective internal control over financial reporting and for its assessment of the effectiveness of internal control over financial reporting, included in the accompanying Management’s Report on Internal Control Over Financial Reporting. Our responsibility is to express an opinion on the Company’s internal control over financial reporting based on our audit.
We conducted our audit in accordance with the standards of the Public Company Accounting Oversight Board (United States). Those standards require that we plan and perform the audit to obtain reasonable assurance about whether effective internal control over financial reporting was maintained in all material respects. Our audit included obtaining an understanding of internal control over financial reporting, assessing the risk that a material weakness exists, testing and evaluating the design and operating effectiveness of internal control based on the assessed risk, and performing such other procedures as we considered necessary in the circumstances. We believe that our audit provides a reasonable basis for our opinion.
A company’s internal control over financial reporting is a process designed by, or under the supervision of, the company’s principal executive and principal financial officers, or persons performing similar functions, and effected by the company’s board of directors, management, and other personnel to provide reasonable assurance regarding the reliability of financial reporting and the preparation of financial statements for external purposes in accordance with generally accepted accounting principles. A company’s internal control over financial reporting includes those policies and procedures that (1) pertain to the maintenance of records that, in reasonable detail, accurately and fairly reflect the transactions and dispositions of the assets of the company; (2) provide reasonable assurance that transactions are recorded as necessary to permit preparation of financial statements in accordance with generally accepted accounting principles, and that receipts and expenditures of the company are being made only in accordance with authorizations of management and directors of the company; and (3) provide reasonable assurance regarding prevention or timely detection of unauthorized acquisition, use, or disposition of the company’s assets that could have a material effect on the financial statements.
Because of the inherent limitations of internal control over financial reporting, including the possibility of collusion or improper management override of controls, material misstatements due to error or fraud may not be prevented or detected on a timely basis. Also, projections of any evaluation of the effectiveness of the internal control over financial reporting to future periods are subject to the risk that the controls may become inadequate because of changes in conditions, or that the degree of compliance with the policies or procedures may deteriorate.
In our opinion, the Company maintained, in all material respects, effective internal control over financial reporting as of December 31, 2009, based on the criteria established in Internal Control—Integrated Framework issued by the Committee of Sponsoring Organizations of the Treadway Commission.
We have also audited, in accordance with the standards of the Public Company Accounting Oversight Board (United States), the consolidated financial statements as of and for the year ended December 31, 2009 of the Company and our report dated March 11, 2010 expressed an unqualified opinion on those financial statements.
/s/ DELOITTE & TOUCHE LLP
McLean, Virginia
March 11, 2010
56
Table of Contents
| Item 9B. | Other Information |
None.
Certain information required by Part III is omitted from this Annual Report as we intend to file our definitive Proxy Statement for the 2010 Annual Meeting of Stockholders pursuant to Regulation 14A of the Securities Exchange Act of 1934, as amended, no later than 120 days after the end of the fiscal year covered by this Annual Report (the “2010 Proxy Statement”), and certain information included in the 2010 Proxy Statement is incorporated herein by reference.
| Item 10. | Directors, Executive Officers and Corporate Governance |
The information required by this Item is incorporated herein by reference to the information provided under the headings “Executive Officers of the Company,” “Election of Directors,” “Section 16(a) Beneficial Ownership Reporting Compliance” and “Corporate Governance” in the 2010 Proxy Statement.
| Item 11. | Executive Compensation |
The information required by this Item is incorporated herein by reference to the information provided under the headings “Executive and Director Compensation,” “Executive and Director Compensation – Compensation Committee Report” and “Corporate Governance – Board Meetings and Committees – Compensation Committee Interlocks and Insider Participation” in the 2010 Proxy Statement.
| Item 12. | Security Ownership of Certain Beneficial Owners and Management and Related Stockholder Matters |
The information required by this Item is incorporated herein by reference to the information provided under the headings “Ownership of Securities” and “Executive and Director Compensation” in the 2010 Proxy Statement.
| Item 13. | Certain Relationships and Related Transactions, and Director Independence |
The information required by this Item is incorporated herein by reference to the information provided under the headings “Related Party Transactions” and “Corporate Governance” in the 2010 Proxy Statement.
| Item 14. | Principal Accountant Fees and Services |
The information required by this Item is incorporated herein by reference to the information provided under the heading “Principal Accounting Fees and Services” in the 2010 Proxy Statement.
57
Table of Contents
| Item 15. | Exhibits and Financial Statement Schedules |
(a) Consolidated Financial Statements
| 1. | Consolidated Financial Statements. The consolidated financial statements as listed in the accompanying “Index to Consolidated Financial Information” are filed as part of this Annual Report. |
| 2. | Consolidated Financial Statement Schedules. Schedules have been omitted because they are not applicable or are not required or the information required to be set forth in those schedules is included in the consolidated financial statements or related notes. |
All other schedules not listed in the accompanying index have been omitted as they are either not required or not applicable, or the required information is included in the consolidated financial statements or the notes thereto.
(b) Exhibits
The exhibits listed in the Index to Exhibits are filed as part of this Annual Report on Form 10-K.
58
Table of Contents
Pursuant to the requirements of Section 13 or 15(d) of the Securities Exchange Act of 1934, the registrant has duly caused this report to be signed on its behalf by the undersigned, thereunto duly authorized.
| DELTEK, INC. | ||
| By: | /S/ KEVIN T. PARKER | |
| Name: | Kevin T. Parker | |
| Title: | Chairman, President and Chief Executive Officer | |
Date: March 12, 2010
Pursuant to the requirements of the Securities Exchange Act of 1934, this report has been signed below by the following persons on behalf of the registrant and in the capacities and on the dates indicated.
| Name |
Position |
Date | ||
| /S/ KEVIN T. PARKER Kevin T. Parker |
Chairman, President and Chief Executive Officer (Principal Executive Officer) | March 12, 2010 | ||
| /S/ MICHAEL P. CORKERY Michael P. Corkery |
Executive Vice President, Chief Financial Officer and Treasurer (Principal Financial Officer) | March 12, 2010 | ||
| /S/ MICHAEL KRONE Michael Krone |
Senior Vice President, Corporate Controller and Assistant Treasurer (Principal Accounting Officer) | March 12, 2010 | ||
| /S/ ALOK SINGH Alok Singh |
Lead Director | March 12, 2010 | ||
| /S/ MICHAEL B. AJOUZ Michael B. Ajouz |
Director | March 12, 2010 | ||
| /S/ NANCI E. CALDWELL Nanci E. Caldwell |
Director | March 10, 2010 | ||
| /S/ KATHLEEN DELASKI Kathleen deLaski |
Director | March 12, 2010 | ||
| /S/ JOSEPH M. KAMPF Joseph M. Kampf |
Director | March 12, 2010 | ||
| /S/ STEVEN B. KLINSKY Steven B. Klinsky |
Director | March 12, 2010 | ||
| /S/ THOMAS M. MANLEY Thomas M. Manley |
Director | March 6, 2010 | ||
| /S/ ALBERT A. NOTINI Albert A. Notini |
Director | March 12, 2010 | ||
| /S/ JANET R. PERNA Janet R. Perna |
Director | March 12, 2010 | ||
59
Table of Contents
Item 15 (a) 1—INDEX TO CONSOLIDATED FINANCIAL INFORMATION
F-1
Table of Contents
REPORT OF INDEPENDENT REGISTERED PUBLIC ACCOUNTING FIRM
To the Audit Committee and Stockholders of
Deltek, Inc.
Herndon, Virginia
We have audited the accompanying consolidated balance sheets of Deltek, Inc. and its subsidiaries (the “Company”) as of December 31, 2009 and 2008, and the related consolidated statements of operations, changes in stockholders’ equity (deficit), and cash flows for each of the three years in the period ended December 31, 2009. These financial statements are the responsibility of the Company’s management. Our responsibility is to express an opinion on the financial statements based on our audits.
We conducted our audits in accordance with the standards of the Public Company Accounting Oversight Board (United States). Those standards require that we plan and perform the audit to obtain reasonable assurance about whether the financial statements are free of material misstatement. An audit includes examining, on a test basis, evidence supporting the amounts and disclosures in the financial statements. An audit also includes assessing the accounting principles used and significant estimates made by management, as well as evaluating the overall financial statement presentation. We believe that our audits provide a reasonable basis for our opinion.
In our opinion, such consolidated financial statements present fairly, in all material respects, the financial position of Deltek, Inc. and its subsidiaries as of December 31, 2009 and 2008, and the results of their operations and their cash flows for each of the three years in the period ended December 31, 2009, in conformity with accounting principles generally accepted in the United States of America.
We have also audited, in accordance with the standards of the Public Company Accounting Oversight Board (United States), the Company’s internal control over financial reporting as of December 31, 2009, based on the criteria established in Internal Control—Integrated Framework issued by the Committee of Sponsoring Organizations of the Treadway Commission and our report dated March 11, 2010 expressed an unqualified opinion on the Company’s internal control over financial reporting.
/s/ DELOITTE & TOUCHE LLP
McLean, Virginia
March 11, 2010
F-2
Table of Contents
CONSOLIDATED BALANCE SHEETS
(in thousands, except share data)
| December 31, 2009 |
December 31, 2008 |
|||||||
| ASSETS |
||||||||
| CURRENT ASSETS: |
||||||||
| Cash and cash equivalents |
$ | 132,636 | $ | 35,788 | ||||
| Accounts receivable, net of allowance of $2,658 and $2,195 at December 31, 2009 and December 31, 2008, respectively |
42,531 | 47,747 | ||||||
| Deferred income taxes |
6,014 | 4,635 | ||||||
| Prepaid expenses and other current assets |
11,256 | 6,874 | ||||||
| Income taxes receivable |
— | 846 | ||||||
| TOTAL CURRENT ASSETS |
192,437 | 95,890 | ||||||
| PROPERTY AND EQUIPMENT, NET |
11,371 | 14,639 | ||||||
| CAPITALIZED SOFTWARE DEVELOPMENT COSTS, NET |
618 | 1,438 | ||||||
| LONG-TERM DEFERRED INCOME TAXES |
6,359 | 4,125 | ||||||
| INTANGIBLE ASSETS, NET |
13,748 | 17,396 | ||||||
| GOODWILL |
63,910 | 57,654 | ||||||
| OTHER ASSETS |
3,165 | 2,130 | ||||||
| TOTAL ASSETS |
$ | 291,608 | $ | 193,272 | ||||
| LIABILITIES AND STOCKHOLDERS’ EQUITY (DEFICIT) |
||||||||
| CURRENT LIABILITIES: |
||||||||
| Current portion of long-term debt |
$ | 44,707 | $ | 10,154 | ||||
| Accounts payable and accrued expenses |
26,740 | 28,734 | ||||||
| Accrued liability for redemption of stock in recapitalization |
317 | 317 | ||||||
| Deferred revenues |
40,176 | 21,296 | ||||||
| Income taxes payable |
992 | — | ||||||
| TOTAL CURRENT LIABILITIES |
112,932 | 60,501 | ||||||
| LONG-TERM DEBT |
134,250 | 182,661 | ||||||
| OTHER TAX LIABILITIES |
1,871 | 1,003 | ||||||
| OTHER LONG-TERM LIABILITIES |
1,875 | 2,917 | ||||||
| TOTAL LIABILITIES |
250,928 | 247,082 | ||||||
| COMMITMENTS AND CONTINGENCIES (NOTE 17) |
||||||||
| STOCKHOLDERS’ EQUITY (DEFICIT) |
||||||||
| Preferred stock, $0.001 par value—authorized, 5,000,000 shares; none issued or outstanding at December 31, 2009 and December 31, 2008 |
— | — | ||||||
| Common stock, $0.001 par value—authorized, 200,000,000 shares; issued and outstanding, 66,292,415 and 43,474,220 shares at December 31, 2009 and December 31, 2008, respectively |
66 | 43 | ||||||
| Class A common stock, $0.001 par value—authorized, 100 shares; issued and outstanding, 100 shares at December 31, 2009 and December 31, 2008 |
— | — | ||||||
| Additional paid-in capital |
249,798 | 177,249 | ||||||
| Accumulated deficit |
(208,509 | ) | (229,905 | ) | ||||
| Accumulated other comprehensive deficit |
(675 | ) | (1,197 | ) | ||||
| TOTAL STOCKHOLDERS’ EQUITY (DEFICIT) |
40,680 | (53,810 | ) | |||||
| TOTAL LIABILITIES AND STOCKHOLDERS’ EQUITY (DEFICIT) |
$ | 291,608 | $ | 193,272 | ||||
See accompanying notes to consolidated financial statements.
F-3
Table of Contents
CONSOLIDATED STATEMENTS OF OPERATIONS
(in thousands, except share and per share data)
| Year Ended December 31, | ||||||||||||
| 2009 | 2008 | 2007 | ||||||||||
| REVENUES: |
||||||||||||
| Software license fees |
$ | 58,907 | $ | 77,398 | $ | 87,118 | ||||||
| Consulting services |
77,807 | 91,566 | 83,353 | |||||||||
| Maintenance and support services |
125,545 | 115,658 | 102,903 | |||||||||
| Other revenues |
3,562 | 4,743 | 4,872 | |||||||||
| Total revenues |
265,821 | 289,365 | 278,246 | |||||||||
| COST OF REVENUES: |
||||||||||||
| Cost of software license fees |
5,873 | 6,563 | 7,855 | |||||||||
| Cost of consulting services |
65,833 | 75,327 | 72,559 | |||||||||
| Cost of maintenance and support services |
22,463 | 21,404 | 17,387 | |||||||||
| Cost of other revenues |
4,717 | 5,172 | 5,276 | |||||||||
| Total cost of revenues |
98,886 | 108,466 | 103,077 | |||||||||
| GROSS PROFIT |
166,935 | 180,899 | 175,169 | |||||||||
| OPERATING EXPENSES: |
||||||||||||
| Research and development |
43,486 | 45,819 | 42,925 | |||||||||
| Sales and marketing |
44,784 | 53,764 | 45,299 | |||||||||
| General and administrative |
35,494 | 33,384 | 30,619 | |||||||||
| Restructuring charge |
3,866 | 980 | — | |||||||||
| Total operating expenses |
127,630 | 133,947 | 118,843 | |||||||||
| INCOME FROM OPERATIONS |
39,305 | 46,952 | 56,326 | |||||||||
| Interest income |
46 | 637 | 295 | |||||||||
| Interest expense |
(7,603 | ) | (11,002 | ) | (18,493 | ) | ||||||
| Other income (expense), net |
43 | (474 | ) | (132 | ) | |||||||
| INCOME BEFORE INCOME TAXES |
31,791 | 36,113 | 37,996 | |||||||||
| Income tax expense |
10,395 | 12,594 | 15,477 | |||||||||
| NET INCOME |
$ | 21,396 | $ | 23,519 | $ | 22,519 | ||||||
| EARNINGS PER SHARE (a) |
||||||||||||
| Basic |
$ | 0.38 | $ | 0.51 | $ | 0.52 | ||||||
| Diluted |
$ | 0.37 | $ | 0.49 | $ | 0.50 | ||||||
| COMMON SHARES AND EQUIVALENTS OUTSTANDING (a) |
||||||||||||
| Basic weighted average shares |
56,777,552 | 46,570,596 | 43,239,528 | |||||||||
| Diluted weighted average shares |
57,596,326 | 47,729,493 | 44,820,335 | |||||||||
| (a) | In accordance with FASB Accounting Standards Codification (ASC) 260, Earnings Per Share, for the purpose of computing the basic and diluted number of shares, the number of weighted average common shares outstanding prior to June 1, 2009 was retroactively adjusted by a factor of 1.08 to reflect the impact of the bonus element associated with the common stock rights offering that was completed in June 2009. See Note 13, Earnings Per Share, for additional information. |
See accompanying notes to consolidated financial statements.
F-4
Table of Contents
CONSOLIDATED STATEMENTS OF CASH FLOWS
(in thousands)
| Year Ended December 31, | ||||||||||||
| 2009 | 2008 | 2007 | ||||||||||
| CASH FLOWS FROM OPERATING ACTIVITIES: |
||||||||||||
| Net income |
$ | 21,396 | $ | 23,519 | $ | 22,519 | ||||||
| Adjustments to reconcile net income to net cash provided by operating activities: |
||||||||||||
| Provision for doubtful accounts |
2,267 | 1,023 | 2,259 | |||||||||
| Depreciation and amortization |
10,547 | 10,188 | 9,241 | |||||||||
| Amortization of debt issuance costs |
962 | 793 | 1,096 | |||||||||
| Write down of acquired in process research and development |
— | 290 | 160 | |||||||||
| Stock-based compensation expense |
8,675 | 8,480 | 6,134 | |||||||||
| Employee stock purchase plan expense |
1,896 | 282 | 35 | |||||||||
| Restructuring charge, net |
932 | — | — | |||||||||
| Loss on disposal of fixed assets |
42 | 469 | 214 | |||||||||
| Deferred income taxes |
(3,556 | ) | (2,586 | ) | (2,464 | ) | ||||||
| Changes in assets and liabilities, net of effect from acquisitions: |
||||||||||||
| Accounts receivable, net |
3,273 | 6,302 | (17,586 | ) | ||||||||
| Prepaid expenses and other assets |
(4,154 | ) | 282 | (1,794 | ) | |||||||
| Accounts payable and accrued expenses |
(2,846 | ) | (4,022 | ) | 3,343 | |||||||
| Income taxes payable/receivable |
1,939 | (1,675 | ) | 2,544 | ||||||||
| Excess tax benefit from stock option exercises |
(80 | ) | (64 | ) | (1,759 | ) | ||||||
| Other tax liabilities |
868 | 452 | 21 | |||||||||
| Other long-term liabilities |
(824 | ) | (630 | ) | (120 | ) | ||||||
| Deferred revenues |
18,439 | (547 | ) | (4,748 | ) | |||||||
| Net Cash Provided by Operating Activities |
59,776 | 42,556 | 19,095 | |||||||||
| CASH FLOWS FROM INVESTING ACTIVITIES: |
||||||||||||
| Acquisitions, net of cash acquired |
(5,369 | ) | (17,924 | ) | (6,101 | ) | ||||||
| Purchase of property and equipment |
(2,368 | ) | (5,687 | ) | (9,055 | ) | ||||||
| Capitalized software development costs |
(150 | ) | (349 | ) | (412 | ) | ||||||
| Net Cash Used in Investing Activities |
(7,887 | ) | (23,960 | ) | (15,568 | ) | ||||||
| CASH FLOWS FROM FINANCING ACTIVITIES: |
||||||||||||
| Issuance of common stock |
— | — | 87 | |||||||||
| Issuance of common stock in connection with rights offering, net of issuance costs |
58,228 | — | — | |||||||||
| Proceeds from exercise of stock options |
887 | 277 | 3,950 | |||||||||
| Excess tax benefit from stock awards |
80 | 64 | 1,759 | |||||||||
| Proceeds from issuance of stock under employee stock purchase plan |
2,015 | 712 | — | |||||||||
| Shares withheld for minimum tax withholding on vested restricted stock awards |
(123 | ) | — | — | ||||||||
| Sale of common stock in initial public offering, net of offering costs |
— | (275 | ) | 42,991 | ||||||||
| Redemption of stock and stockholder payments in recapitalization |
— | — | (4,780 | ) | ||||||||
| Proceeds from the issuance of debt |
— | — | 22,500 | |||||||||
| Payments for deferred financing costs |
(2,336 | ) | — | — | ||||||||
| Repayment of debt |
(13,858 | ) | (498 | ) | (59,712 | ) | ||||||
| Net Cash Provided by Financing Activities |
44,893 | 280 | 6,795 | |||||||||
| IMPACT OF FOREIGN EXCHANGE RATES ON CASH AND CASH EQUIVALENTS |
66 | (179 | ) | 102 | ||||||||
| NET INCREASE IN CASH AND CASH EQUIVALENTS |
96,848 | 18,697 | 10,424 | |||||||||
| CASH AND CASH EQUIVALENTS––Beginning of period |
35,788 | 17,091 | 6,667 | |||||||||
| CASH AND CASH EQUIVALENTS––End of period |
$ | 132,636 | $ | 35,788 | $ | 17,091 | ||||||
See accompanying notes to consolidated financial statements.
F-5
Table of Contents
CONSOLIDATED STATEMENTS OF CASH FLOWS
(in thousands)
| Year Ended December 31, | |||||||||
| 2009 | 2008 | 2007 | |||||||
| SUPPLEMENTAL DISCLOSURES OF CASH FLOW INFORMATION: |
|||||||||
| Noncash activity: |
|||||||||
| Stock issued for acquisitions |
$ | 1,454 | $ | — | $ | 500 | |||
| Accrued liability for acquisition of business |
$ | — | $ | — | $ | 550 | |||
| Accrued liability for purchases of property and equipment |
$ | 44 | $ | 785 | $ | 69 | |||
| Accrued liability for public offering transaction costs |
$ | — | $ | — | $ | 275 | |||
| Cash paid during the period for: |
|||||||||
| Interest |
$ | 6,961 | $ | 11,928 | $ | 15,927 | |||
| Income taxes, net |
$ | 11,238 | $ | 16,341 | $ | 15,297 | |||
See accompanying notes to consolidated financial statements.
F-6
Table of Contents
CONSOLIDATED STATEMENTS OF CHANGES IN STOCKHOLDERS’ EQUITY (DEFICIT)
(in thousands, except share data)
| Preferred Stock | Common Stock | Class A Common Stock |
Additional Paid-In Capital |
Accumulated Deficit |
Accumulated Other Comprehensive Deficit |
Total Shareholders’ Equity (Deficit) |
|||||||||||||||||||||||||||
| Shares | Amount | Shares | Amount | Shares | Amount | ||||||||||||||||||||||||||||
| Balance at December 31, 2006 |
100 | $ | — | 39,405,993 | $ | 39 | — | $ | — | $ | 112,350 | $ | (275,943 | ) | $ | (511 | ) | $ | (164,065 | ) | |||||||||||||
| Net income |
— | — | — | — | — | — | — | 22,519 | — | 22,519 | |||||||||||||||||||||||
| Foreign currency translation adjustments |
— | — | — | — | — | — | — | — | 177 | 177 | |||||||||||||||||||||||
| Comprehensive income |
22,696 | ||||||||||||||||||||||||||||||||
| Sale of common stock |
— | — | 6,115 | — | — | — | 87 | — | — | 87 | |||||||||||||||||||||||
| Stock issued for acquisitions |
— | — | 38,109 | — | — | — | 500 | — | — | 500 | |||||||||||||||||||||||
| Sale of common stock in initial public offering |
3,009,475 | 3 | — | — | 42,713 | 42,716 | |||||||||||||||||||||||||||
| Stock options exercised |
— | — | 586,831 | 1 | — | — | 3,949 | — | — | 3,950 | |||||||||||||||||||||||
| Tax benefit on stock options exercised |
— | — | — | — | — | — | 1,759 | — | — | 1,759 | |||||||||||||||||||||||
| Stock compensation |
— | — | — | — | — | — | 6,169 | — | — | 6,169 | |||||||||||||||||||||||
| Conversion of preferred stock to Class A Common Stock |
(100 | ) | — | — | — | 100 | — | — | — | — | — | ||||||||||||||||||||||
| Balance at December 31, 2007 |
— | $ | — | 43,046,523 | $ | 43 | 100 | $ | — | $ | 167,527 | $ | (253,424 | ) | $ | (334 | ) | $ | (86,188 | ) | |||||||||||||
| Net income |
— | — | — | — | — | — | — | 23,519 | — | 23,519 | |||||||||||||||||||||||
| Foreign currency translation adjustments |
— | — | — | — | — | — | — | — | (863 | ) | (863 | ) | |||||||||||||||||||||
| Comprehensive income |
22,656 | ||||||||||||||||||||||||||||||||
| Issuance of common stock under the employee stock purchase plan |
— | — | 82,736 | — | — | — | 712 | — | — | 712 | |||||||||||||||||||||||
| Stock options exercised |
— | — | 59,311 | — | — | — | 277 | — | — | 277 | |||||||||||||||||||||||
| Issuance of restricted stock awards, net |
— | — | 285,650 | — | — | — | — | — | — | — | |||||||||||||||||||||||
| Tax benefit on stock options exercised |
— | — | — | — | — | — | 64 | — | — | 64 | |||||||||||||||||||||||
| Tax deficiency from other stock option activity |
— | — | — | — | — | — | (93 | ) | — | — | (93 | ) | |||||||||||||||||||||
| Stock compensation |
— | — | — | — | — | — | 8,762 | — | — | 8,762 | |||||||||||||||||||||||
| Balance at December 31, 2008 |
— | $ | — | 43,474,220 | $ | 43 | 100 | $ | — | $ | 177,249 | $ | (229,905 | ) | $ | (1,197 | ) | $ | (53,810 | ) | |||||||||||||
| Net income |
— | — | — | — | — | — | — | 21,396 | — | 21,396 | |||||||||||||||||||||||
| Foreign currency translation adjustments |
— | — | — | — | — | — | — | — | 522 | 522 | |||||||||||||||||||||||
| Comprehensive income |
21,918 | ||||||||||||||||||||||||||||||||
| Issuance of common stock in connection with rights offering, net of issuance costs |
— | — | 20,000,000 | 20 | — | — | 58,208 | — | — | 58,228 | |||||||||||||||||||||||
| Stock issued for acquisitions |
— | — | 247,038 | — | — | — | 1,454 | — | — | 1,454 | |||||||||||||||||||||||
| Issuance of common stock under the employee stock purchase plan |
— | — | 635,855 | 1 | — | — | 2,014 | — | — | 2,015 | |||||||||||||||||||||||
| Stock options exercised |
— | — | 245,750 | — | — | — | 887 | — | — | 887 | |||||||||||||||||||||||
| Issuance of restricted stock awards, net |
— | — | 1,707,848 | 2 | — | — | (2 | ) | — | — | — | ||||||||||||||||||||||
| Tax benefit from stock awards |
— | — | — | — | — | — | 80 | — | — | 80 | |||||||||||||||||||||||
| Tax deficiency from other stock option activity |
— | — | — | — | — | — | (541 | ) | — | — | (541 | ) | |||||||||||||||||||||
| Stock compensation |
— | — | — | — | — | — | 10,547 | — | — | 10,547 | |||||||||||||||||||||||
| Exchange of liability for restricted stock |
— | — | — | — | — | — | 25 | — | — | 25 | |||||||||||||||||||||||
| Payment of income tax witheld on vested restricted stock awards |
— | — | (18,296 | ) | — | — | — | (123 | ) | — | — | (123 | ) | ||||||||||||||||||||
| Balance at December 31, 2009 |
— | $ | — | 66,292,415 | $ | 66 | 100 | $ | — | $ | 249,798 | $ | (208,509 | ) | $ | (675 | ) | $ | 40,680 | ||||||||||||||
See accompanying notes to consolidated financial statements.
F-7
Table of Contents
NOTES TO CONSOLIDATED FINANCIAL STATEMENTS
1. ORGANIZATION AND SUMMARY OF SIGNIFICANT ACCOUNTING POLICIES
Organization
Deltek, Inc. (“Deltek” or the “Company”) is a leading provider of enterprise applications software and related services designed specifically for project-focused organizations. Project-focused organizations generate revenue from defined, discrete, customer-specific engagements or activities. Project-focused organizations typically require specialized software to help them automate complex business processes around the engagement, execution, and delivery of projects. Deltek’s software enables them to significantly enhance the visibility they have over all aspects of their operations by providing them increased control over their critical business processes, accurate project-specific financial information, and real-time performance measurements.
In April 2007, the Company converted to a Delaware corporation changing its name to “Deltek, Inc.” from a Virginia corporation under the name of “Deltek Systems, Inc.”
Initial Public Offering
In November 2007, the Company completed an initial public offering consisting of 9,000,000 shares of common stock at $18.00 per share. The total shares sold in the offering included 5,990,525 shares sold by selling stockholders and 3,009,475 shares sold by the Company.
After deducting the payment of underwriters’ discounts and commissions and offering expenses, the net proceeds to the Company from the sale of shares in the offering were $42.6 million. The net proceeds from the offering were used to repay a $25.0 million balance on the revolving credit facility and to make a $17.6 million prepayment on the outstanding term loan.
Rights Offering
In May 2009, the Company issued non-transferable subscription rights to the Company’s stockholders of record to subscribe for 20 million shares of the Company’s common stock on a pro rata basis at a subscription price of $3.00 per share. Stockholders received one right for each share of common stock owned on the record date, April 14, 2009. Based on the number of shares outstanding on the record date, the rights offering entitled each stockholder to purchase 0.4522 shares of common stock at the subscription price. On May 27, 2009, the subscription period expired and the rights offering was fully subscribed by participating stockholders of the Company, resulting in the issuance of 20 million shares of common stock on June 1, 2009. Net proceeds from the offering after deducting fees and offering expenses were $58.2 million. In accordance with the provisions of the credit agreement, the Company used $3.1 million to prepay indebtedness. See Note 9, Debt, for additional details regarding the mandatory prepayment and Note 13, Earnings Per Share, for additional details regarding the rights offering.
Principles of Consolidation
The consolidated financial statements are prepared in accordance with accounting principles generally accepted in the United States of America and include the accounts of the Company and its wholly-owned subsidiaries. All intercompany balances and transactions have been eliminated in consolidation.
Use of Estimates
The preparation of consolidated financial statements in conformity with accounting principles generally accepted in the United States of America requires management to make estimates and assumptions that affect the reported amounts of assets and liabilities and disclosure of contingent assets and liabilities at the date of the
F-8
Table of Contents
financial statements, and the reported amounts of revenue and expenses during the reporting periods. Areas of the financial statements where estimates may have the most significant effect include the allowance for doubtful accounts receivable and sales allowances, lives of tangible and intangible assets, impairment of long-lived and other assets, realization of deferred tax assets, accrued liabilities, stock-based compensation, revenue recognition, valuation of acquired deferred revenue and intangible assets, and provisions for income taxes. Actual results could differ from those estimates.
Financial Accounting Standards Board (“FASB”) Codification
In June 2009, the FASB issued the FASB Accounting Standards Codification™ (the “Codification” or “ASC”), the authoritative guidance for GAAP. The Codification does not change how the Company accounts for its transactions or the nature of related disclosures made. The Codification supersedes all existing non-SEC accounting and reporting standards and was effective for the Company beginning July 1, 2009. In these financial statements, the references have been updated to reflect the new Codification references.
Revenue Recognition
The Company’s revenues are generated primarily from three sources: licensing of software products, providing maintenance and support for those products, and providing consulting services for those products. Deltek’s consulting services consist primarily of implementation services, training and assessment, and design services. A typical sales arrangement includes both software licenses and maintenance, and may also include consulting services. Consulting services are also regularly sold separately from other elements, generally on a time-and-materials basis. The Company recognizes revenue in accordance with ASC 985-605, Software-Revenue Recognition (“ASC 985-605”), and in accordance with the Securities and Exchange Commission Staff Accounting Bulletin (“SAB”) No. 104, Revenue Recognition.
Consulting services are generally not essential to the functionality of the Company’s software and are usually completed in three to six months, though larger implementations may take longer. The Company generally recognizes revenues for these services as they are performed. In the case of software arrangements where services are essential to the software functionality, the Company recognizes the software and services revenue together in accordance with ASC 605-35, Revenue Recognition-Construction-Type and Certain Production-Type Contracts (“ASC 605-35”).
For sales arrangements involving multiple elements, where software licenses are sold together with maintenance and support, consulting, training, or other services, the Company recognizes revenue using the residual method. Under the residual method, to determine the amount to allocate to and recognize revenue on delivered elements, normally the license element of the arrangement, the Company first allocates and defers revenue for any undelivered elements based upon objective evidence of fair value of those elements. The objective evidence of fair value used is required to be specific to the Company and commonly referred to as vendor-specific objective evidence, or “VSOE”. The Company recognizes the difference between the total arrangement fee and the amount deferred for the undelivered elements as revenue for the delivered elements.
For maintenance and support agreements, VSOE is based upon historical renewal rates and, in some cases, renewal rates stated in the Company’s agreements.
For consulting services and training sold as part of a multiple element sales arrangement, VSOE is based upon the prices charged for those services when sold separately. For sales arrangements that require the Company to deliver future specified products or services in which VSOE of fair value is not available, the entire arrangement is deferred.
Under its standard perpetual software license agreements, the Company recognizes revenue from the license of software upon execution of a signed agreement and delivery of the software provided that the software license
F-9
Table of Contents
fees are fixed and determinable, collection of the resulting receivable is probable, and VSOE exists to allow the allocation of a portion of the total fee to any undelivered elements of the arrangement. If a right of return exists, revenue is recognized upon the expiration of that right.
The Company’s standard software license agreement does not include customer acceptance provisions; if acceptance provisions are provided, delivery is deemed to occur upon acceptance.
Software license fee revenues from resellers are recognized using a sell-through model whereby the Company recognizes revenue when these channels complete the sale and the Company delivers the software products.
The Company’s standard payment terms for its software license agreements are generally within 180 days. The Company considers the software license fee to be fixed and determinable unless the fee is subject to refund or adjustment, or is not payable within 180 days. Revenue from arrangements with payment terms extending beyond 180 days is recognized as payments become due and payable.
Implementation, installation and other consulting services are generally billed based upon hourly rates, plus reimbursable out-of-pocket expenses and related administrative fees. Revenue on these arrangements is recognized based on hours actually incurred at the contract billing rates, plus out-of-pocket expenses. Implementation, installation and other consulting services revenue under fixed-fee arrangements is generally recognized as the services are performed.
The Company generally sells training services at a fixed rate for each specific training session at a per-attendee price, and revenue is recognized upon the customer attending and completing the training. The Company also sells training on a time-and-materials basis. In situations where customers pay for services in advance of the services being rendered, the related prepayment is recorded as deferred revenue and recognized as revenue when the services are performed.
Maintenance and support services include unspecified periodic software upgrades or enhancements, bug fixes and phone support. Initial annual maintenance and support generally represent between 15% and 20% of the related software license list price, depending upon the related product. Customers generally prepay for maintenance, and these prepayments are recorded as deferred revenue and revenue is recognized ratably over the term of the maintenance period.
Other revenue mainly includes fees collected for the Company’s annual user conference, which is typically held in the second quarter. Other revenue also includes the resale and sublicensing of third-party hardware and software products in connection with the software license and installation of the Company’s products, and is generally recognized upon delivery. In addition, other revenue includes revenue that is recognized ratably over the subscriber’s membership period.
Sales taxes and other taxes collected from customers and remitted to governmental authorities are presented on a net basis and, as such, are excluded from revenues.
Cash and Cash Equivalents
The Company considers all liquid investments purchased with an original maturity of three months or less to be cash equivalents. The Company’s cash equivalents primarily include funds held in money market accounts on a short-term basis.
F-10
Table of Contents
The Company’s investments (in thousands) are as follows:
| Year Ended December 31, | ||||||
| 2009 | 2008 | |||||
| Cash |
$ | — | $ | — | ||
| Money Market Fund Investments |
132,636 | 35,788 | ||||
| Total Cash and Cash Equivalents |
$ | 132,636 | $ | 35,788 | ||
Accounts Receivable and Allowance for Doubtful Accounts
Accounts receivable consists of amounts due to the Company arising from normal business activities. The Company maintains an allowance for estimated losses resulting from the expected failure of some of its customers to make required payments (or “credit losses”) and a sales allowance for customer maintenance cancellations and consulting services adjustments. The provision for sales allowances are charged against the related revenue items and provision for doubtful accounts (credit losses) are recorded in “General and Administrative” expense. The Company estimates uncollectible amounts for both sales allowances and credit losses based upon historical trends, age of customer receivable balances, and evaluation of specific customer receivable activity.
Prepaid and Other Current Assets
Prepaid and other current assets primarily consist of prepaid fees for third-party software, prepaid maintenance for internal use software, prepaid costs associated with the Company’s annual user conference, and other assets.
Concentrations of Credit Risk
Financial instruments that could subject the Company to significant concentrations of credit risk consist principally of cash and cash equivalents and accounts receivable. At December 31, 2009 the Company’s cash equivalents were invested in a money market fund that invests exclusively in AAA-rated (i) bills, notes and bonds issued by the U.S. Treasury, (ii) U.S. Government guaranteed repurchase agreements fully collateralized by U.S. Treasury obligations, and (iii) U.S. Government guaranteed securities. As a result, the risk of non-performance of the money market fund is very low. The investments have a net asset value equal to $1.00 with no withdrawal restrictions and with no investments in auction rate securities. In addition, the money market fund has not experienced a decline in value and its net asset value has historically not dropped below $1.00. The credit risk with respect to accounts receivable is diversified due to the large number of entities comprising the Company’s customer base and credit losses have generally been within the Company’s estimates.
Property and Equipment
Property and equipment are stated at cost and are depreciated using the straight-line method over their estimated useful lives, generally five to seven years for furniture and equipment, three to five years for computer equipment, and three to five years for software. Leasehold improvements are amortized over the shorter of the useful life of the asset or the lease term, generally five to ten years.
Foreign Currency Translation and Transactions
The Company’s consolidated financial statements are translated into U.S. dollars in accordance with ASC 830, Foreign Currency Matters. For all operations outside the United States, assets and liabilities are translated in U.S. Dollars at the current rates of exchange in effect at the balance sheet date. Income and expense items are translated at the average exchange rate that prevailed during the period. The resulting translation adjustments are
F-11
Table of Contents
recorded in “Accumulated Other Comprehensive Deficit,” a separate component of stockholders equity (deficit). Foreign currency transactions are denominated in a currency other than a subsidiary’s functional currency. A change in the exchange rates between a subsidiary’s functional currency and the currency in which a transaction is denominated increases or decreases the expected amount of functional currency cash flows upon settlement of the transaction. That increase or decrease in expected functional currency cash flows is reported by the Company as a foreign currency transaction gain (loss) and is recorded in “Other Income (Expense), Net.”
Software Development Costs
Software development costs incurred subsequent to establishing technological feasibility and until general release of the software products are capitalized in accordance with ASC 985-20, Software—Cost of Software to be Sold, Leased or Marketed when the timeframe between technological feasibility and general release are significant. Certain development efforts include the preparation of a detailed program design, which is the basis for establishing technological feasibility. Other efforts do not involve creation of a detailed program design, and therefore technological feasibility is not established until a working model of the software is developed, which generally occurs just prior to general release of the software.
Amortization of capitalized development costs begins once the products are available for general release. Amortization is determined on a product-by-product basis using the greater of a ratio of current product revenue to projected current and future product revenue, or an amount calculated using the straight-line method over the estimated economic life of the product, which is generally four years. Software development costs of $150,000, $349,000, and $412,000 were capitalized for the fiscal years 2009, 2008, and 2007, respectively. Amortization of capitalized software was $971,000, $1.3 million, and $1.5 million for the same respective periods. All other research and development costs are expensed as incurred.
Income Taxes
Income taxes are accounted for in accordance with ASC 740, Income Taxes (“ASC 740”) and ASC 740-10, Income Taxes-Overall (“ASC 740-10”). Under ASC 740, deferred tax assets and liabilities are computed based on the difference between the financial statement and tax basis of assets and liabilities and are measured by applying enacted tax rates and laws for the taxable years in which those differences are expected to reverse. In addition, in accordance with ASC 740, a valuation allowance is required to be recognized if it is believed more likely than not that a deferred tax asset will not be fully realized. ASC 740-10 prescribes a recognition threshold of more likely than not, and a measurement attribute for all tax positions taken or expected to be taken on a tax return, in order for those positions to be recognized in the financial statements. The Company continually reviews tax laws, regulations and related guidance in order to properly record any uncertain tax liabilities.
Goodwill and Other Intangible Assets
The Company allocates the purchase price paid in a purchase business combination to the assets acquired, including intangible assets, and liabilities assumed at estimated fair values considering a number of factors, including the use of an independent appraisal.
In estimating the fair value of acquired deferred revenue, the Company considers the direct cost of fulfilling the legal performance obligations associated with the liability, plus a normal profit margin. The Company amortizes its intangible assets using an accelerated or straight-line method which best approximates the proportion of the future cash flows estimated to be generated in each period over the estimated useful life of the applicable asset.
F-12
Table of Contents
Acquired intangible assets are being amortized over the following periods:
| Member community |
10 years | |
| Customer relationships |
5–10 years | |
| Acquired technology |
2–4 years | |
| Acquired project management process |
5 years | |
| Trade names |
1-2 years–indefinite life | |
| Non-compete agreements |
Term of agreement |
In accordance with ASC 350, Intangibles-Goodwill and Other (“ASC 350”), goodwill and our other indefinite-lived intangible assets are not amortized, but instead tested for impairment at least annually. Accordingly the Company performs impairment tests as of December 31 of each year. No impairment of goodwill or other indefinite-lived intangible assets were recorded based upon these tests as of December 31, 2009, 2008, or 2007, as the Company determined that the fair value of these assets exceeded their carrying value.
In accordance with ASC 360, Property, Plant and Equipment (“ASC 360”), the Company reviews its long-lived assets, including property and equipment and intangible assets, for impairment whenever events or changes in circumstances indicate that the carrying amounts of the assets may not be fully recoverable. If the total of the expected undiscounted future net cash flows is less than the carrying amount of the asset, a loss is recognized for the difference between the fair value and carrying amount of the asset. There have been no impairment charges for the years ended December 31, 2009, 2008, and 2007.
Fair Value Measurements
Effective January 1, 2008, the Company adopted ASC 820-10, Fair Value Measurements and Disclosures (“ASC 820-10”). ASC 820-10 defines fair value, establishes a fair value hierarchy for assets and liabilities measured at fair value and expands required disclosure about fair value measurements. As of December 31, 2009 and 2008, the Company measured its money market funds at fair value based on quoted prices that are equivalent to par value (Level 1). The Company did not have any assets measured at fair value on a recurring basis using significant other observable inputs (Level 2) or significant unobservable inputs (Level 3), or any liabilities measured at fair value as prescribed by ASC 820-10.
Financial instruments are defined as cash, evidence of an ownership interests in an entity or contracts that impose an obligation to deliver cash, or other financial instruments to a third-party. Cash and cash equivalents, which are primarily cash and funds held in money-market accounts on a short-term basis, are carried at fair market value. The carrying amounts of accounts receivable, accounts payable, and accrued expenses approximate fair value because of the short maturity term of these instruments. The carrying value of the Company’s debt is reported in the financial statements at cost. Although there is no active market for the debt, the Company has determined that the carrying value of its debt approximates fair value as a result of the Company’s recent debt refinancing at current market rates (See Note 9, Debt) as well as the fact that the debt has a variable interest rate component. The estimated fair value of the Company’s debt at December 31, 2009 and December 31, 2008 was $179.0 million and $192.8 million, respectively. The Company’s policy with respect to derivative financial instruments is to record them at fair value with changes in value recognized in earnings during the period of change. As of December 31, 2009 and December 31, 2008, the Company had no derivative financial instruments.
Debt Issuance Costs
Costs incurred in connection with securing the Company’s credit facility and debentures are capitalized and recorded as “Prepaid Expenses and Other Current Assets” and “Other Assets” on the consolidated balance sheets. The debt issuance costs are amortized and reflected in “Interest Expense” over the respective lives of the loans using the effective interest method.
F-13
Table of Contents
Stock-Based Compensation
The Company accounts for stock based compensation in accordance with ASC 718, Compensation-Stock Compensation (“ASC 718”). ASC 718 requires that the cost of awards of equity instruments offered in exchange for employee services, including employee stock options, restricted stock awards, and employee stock purchases under the Company’s Employee Stock Purchase Plan (“ESPP”), are measured based on the fair value of the award on the measurement date of grant. The Company determines the fair value of options granted using the Black-Scholes-Merton option pricing model and recognizes the cost over the period during which an employee is required to provide service in exchange for the award, generally the vesting period. The fair value of restricted stock awards is based on the closing price of the Company’s common stock on the date of grant and is recognized as expense over the requisite service period of the awards.
Recently Adopted Accounting Pronouncements
In December 2007, the FASB issued ASC 805, Business Combinations (“ASC 805”), which replaces the former standard SFAS 141. ASC 805 requires assets and liabilities acquired in a business combination, contingent consideration, and certain acquired contingencies to be measured at their fair values as of the date of acquisition. ASC 805 also requires that acquisition-related costs and restructuring costs be recognized separately from the business combination. ASC 805 is effective beginning on or after December 15, 2008. For business combinations entered into after the effective date of ASC 805, prospective application of the new standard is applied. The guidance in SFAS 141 is applied to business combinations entered into before the effective date of ASC 805. Beginning in 2009, the Company adopted ASC 805 which was applied in the current year acquisition.
In April 2008, the FASB issued ASC 350-30-55, Intangibles-Goodwill and Other-General Intangibles Other than Goodwill (“ASC 350-30-55”). ASC 350-30-55 amends the factors that should be considered in developing renewal or extension assumptions used to determine the useful life of a recognized intangible asset under ASC 350, Intangibles-Goodwill and Other. The objective is to improve the consistency between the useful life of a recognized intangible asset under ASC 350 and the period of expected cash flows used to measure the fair value of the asset under ASC 805. ASC 350-30-55 is effective for fiscal years beginning after December 15, 2008. The guidance in ASC 350-30-55 for useful life estimates is applied prospectively to intangible assets acquired after December 31, 2008. Beginning in 2009, the Company adopted ASC 350-30-55 which was applied in the current year acquisition.
In November 2008, the FASB issued ASC 350-30-35, Intangibles-Goodwill and Other-General Intangibles Other than Goodwill (“ASC 350-30-35”). ASC 350-30-35 clarifies the accounting for acquired intangible assets in situations in which the acquirer does not intend to actively use the asset but intends to hold (lock up) the asset to prevent its competitors from obtaining access to the asset (a defensive intangible asset). Under ASC 350-30-35, defensive intangible assets will be treated as a separate asset recognized at fair value and assigned a useful life in accordance with ASC 350. ASC 350-30-35 is effective for intangible assets acquired on or after the beginning of the first annual reporting period beginning on or after December 15, 2008, or January 1, 2009 for Deltek. During 2009, the Company did not acquire any defensive intangible assets.
In April 2009, the FASB issued ASC 805-20, Business Combinations-Identifiable Assets and Liabilities, and Any Noncontrolling Interest (“ASC 805-20”). ASC 805-20 amends the guidance in ASC 805 regarding pre-acquisition contingencies. The guidance in ASC 805-20 requires the recognition at fair value of an asset or liability assumed in a business combination that arises from a contingency if the acquisition date fair value can be reasonably estimated during the measurement period. If the fair value cannot be reasonably estimated, the asset or liability would be recognized in accordance with ASC 450, Contingencies (“ASC 450”), if the criteria in ASC 450 were met at the acquisition date. Previously, ASC 805 required pre-acquisition contingencies to be measured at fair value at the date of acquisition. ASC 805-20 is effective for business combinations occurring after January 1, 2009. Beginning in 2009, the Company adopted ASC 805-20, however, the Company did not acquire pre-acquisition contingencies in the current year acquisition.
F-14
Table of Contents
In April 2009, the FASB issued ASC 825-10-65, Financial Instruments-Transition (“ASC 825-10-65”), effective for interim periods ending after June 15, 2009. ASC 825-10-65 requires disclosures about fair value of financial instruments for interim reporting periods of publicly traded companies as well as in annual financial statements to improve the transparency and quality of financial reporting. ASC 825-10-65 amends ASC 270, Interim Reporting, to require those disclosures in summarized financial information at interim reporting periods. See above, Fair Value Measurements, for the related disclosures. The Company’s adoption of ASC 825-10-65 in the second quarter of 2009 did not have a material impact on the Company’s results of operations, financial position, or cash flows.
In April 2009, the FASB issued ASC 820-10-35, Fair Value Measurements and Disclosures-Subsequent Measurement (“ASC 820-10-35”). ASC 820-10-35 provides guidance on how to determine the fair value of assets and liabilities when the volume and level of activity for the asset or liability has significantly decreased. ASC 820-10-35 also provides guidance on identifying circumstances that indicate a transaction is not orderly. In addition, ASC 820-10-35 requires disclosure in interim and annual periods of the inputs and valuation methods used in determining fair value and a discussion of any changes in those valuation methods. ASC 820-10-35 is effective for annual and interim periods ending on or after June 15, 2009. During the second quarter of 2009, the Company adopted the provisions in ASC 820-10-35. The provisions adopted did not have an impact on the Company’s financial statements as the Company’s fair value measurements are Level 1 measurements in an active market with orderly transactions.
In May 2009, the FASB issued ASC 855, Subsequent Events (“ASC 855”), effective for interim and annual periods ending after June 15, 2009. ASC 855 establishes the accounting for, and disclosure of, events that occur after the balance sheet date but before financial statements are issued or are available to be issued. See Note 20, Subsequent Events, for the related disclosures. The Company’s adoption of ASC 855 in the second quarter of 2009 did not have a material impact on the Company’s results of operations, financial position, or cash flows.
In August 2009, the FASB issued Accounting Standards Update (ASU) No. 2009-05 (“ASU 2009-05”), Fair Value Measurement and Disclosure: Measuring Liabilities at Fair Value, which amends ASC 820-10-35. The guidance in ASU 2009-05 provides clarification on measuring liabilities at fair value when a quoted price in an active market is not available. The ASU specifies that a valuation technique should be applied that uses either the quote of the liability when traded as an asset, the quoted prices for similar liabilities or similar liabilities when traded as assets, or another valuation technique consistent with existing fair value measurement guidance such as a present value technique or a technique that is based on the amount at the measurement date that the reporting entity would pay to transfer the identical liability or would receive to enter into the identical liability. The guidance also states that when estimating the fair value of a liability, a reporting entity is not required to include a separate input or adjustments to other inputs relating to the existence of a restriction that prevents the transfer of the liability. ASU 2009-05 is effective for the first reporting period beginning after issuance, or October 1, 2009. The adoption of ASU 2009-05 did not have an impact on the Company’s financial statements as the Company currently does not have any liabilities measured at fair value.
Recent Accounting Pronouncements
In October 2009, the FASB issued ASU 2009-13, Multiple-Deliverable Revenue Arrangements, and the FASB issued ASU 2009-14, Certain Revenue Arrangements That Include Software Elements, on revenue recognition that will become effective for the Company beginning January 1, 2011, with earlier adoption permitted. The Company does not anticipate that the adoption of these standards will have an impact on its consolidated financial statements.
2. BUSINESS ACQUISITIONS
mySBX
In December 2009, the Company acquired 100% of the outstanding common stock of mySBX Corporation (“mySBX”), an online network where government contractors of all sizes and independent professionals go to
F-15
Table of Contents
publish and secure new opportunities, find qualified partners, identify and place resources and collaborate in communities that focus on areas critical to business. The results of operations of mySBX have been included in the consolidated financial statements since the acquisition date.
The aggregate purchase price was $6.8 million and included cash payments of $5.4 million and common stock issued of $1.4 million.
Per the purchase agreement, the Company paid $95,000 of mySBX acquisition costs which were expensed as incurred. In addition, there is a retention arrangement with one of the mySBX stockholders for restricted stock totaling $547,000 which vests 50% and 100% if the individual is employed on the one-year and two-year anniversary, of the acquisition, respectively. This amount is being expensed as the requisite services are provided. The acquisition did not result in any contingent consideration.
The following table summarizes the estimated fair values of assets acquired and liabilities assumed at the date of acquisition (in thousands):
| Accounts receivable |
$ | 18 | ||
| Intangible assets |
791 | |||
| Goodwill |
6,062 | |||
| Deferred tax assets |
903 | |||
| Accounts payable |
(594 | ) | ||
| Accrued expenses |
(41 | ) | ||
| Deferred revenue |
(5 | ) | ||
| Deferred tax liability |
(312 | ) | ||
| Total purchase price |
$ | 6,822 | ||
The components and the initial estimated useful lives of the intangible assets listed in the above table as of the acquisition date are as follows (in thousands):
| Amount | Life | ||||
| Tradename and trademarks |
$ | 25 | 2 years | ||
| Technology |
458 | 4 years | |||
| Member community |
136 | 10 years | |||
| Customer relationships |
172 | 10 years | |||
| $ | 791 | ||||
The customer relationships and member community are being amortized using an accelerated amortization method over ten years and the expense is included in “Sales and Marketing” expense. Tradename and trademarks are being amortized using a straight-line method of amortization over two years and the expense is included in “General and Administrative” expense. Technology is being amortized using an accelerated amortization method over four years and the expense is included in “Cost of Other Revenues” expense. The weighted average amortization period for the intangibles is 6.3 years. The goodwill recorded in this transaction is not deductible for tax purposes.
MPM
In August 2008, the Company acquired certain assets and operations of Planview, Inc.’s MPM solution (“MPM”). The results of MPM have been included in the consolidated financial statements since the acquisition date. MPM is an earned value management (“EVM”) software application used by government contractors and agencies to meet the complex compliance requirements for their programs issued by the U.S. Federal Government.
The aggregate purchase price was $16.4 million which consisted of cash consideration.
F-16
Table of Contents
The following table summarizes the fair values of the assets acquired and liabilities assumed at the date of acquisition (in thousands):
| Accounts receivable |
$ | 48 | ||
| Fixed assets |
7 | |||
| Deferred tax assets |
124 | |||
| Intangible assets |
8,870 | |||
| Goodwill |
7,820 | |||
| Deferred revenue |
(321 | ) | ||
| Deferred tax liability |
(124 | ) | ||
| Total purchase price |
$ | 16,424 | ||
The components and the useful lives of the intangible assets listed in the above table as of the acquisition date are as follows (in thousands):
| Amount | Life | ||||
| In-process technology |
$ | 290 | — | ||
| Tradenames |
300 | Indefinite | |||
| Developed software |
830 | 4 years | |||
| Customer relationships |
7,450 | 7 years | |||
| $ | 8,870 | ||||
The acquired tradenames were deemed to have an indefinite life and accordingly, are not being amortized until such time that the useful life is determined to no longer be indefinite in accordance with ASC 350. The tradenames are tested for impairment in accordance with the provisions of ASC 350. The developed software is being amortized using an accelerated amortization method over four years and the expense is included in “Cost of Software License Fees” expense. The customer relationships are being amortized using an accelerated amortization method over seven years and the expense is included in “Sales and Marketing” expense. The $290,000 of in-process technology was written off as a research and development expense in the third quarter of 2008 as it had no alternative future use. The weighted average amortization period for the intangibles is 6.7 years. The goodwill recorded in this transaction will be deductible for tax purposes over 15 years.
WST Pacific Pty Ltd
In May 2007, the Company acquired 100% of the outstanding common stock of WST Pacific Pty Ltd (“WSTP”), a developer of EVM software and provider of services and support resources in the EVM marketplace. The results of operations of WSTP have been included in the consolidated financial statements since the acquisition date.
The aggregate purchase price, net of $602,000 in cash acquired, was $1.2 million and included cash payments through September 30, 2007 of $1.8 million. The Company has entered into retention arrangements with the two principal WSTP stockholders totaling $450,000 if the individuals are employed on the eighteen-month anniversary of the acquisition. This amount was paid in the fourth quarter of 2008 and was previously being expensed as the requisite services were provided.
F-17
Table of Contents
The following table summarizes the fair values of the assets acquired and liabilities assumed at the date of acquisition (in thousands):
| Accounts receivable |
$ | 586 | ||
| Fixed assets |
79 | |||
| Deferred tax assets |
90 | |||
| Intangible assets |
330 | |||
| Goodwill |
788 | |||
| Other assets |
30 | |||
| Accounts payable |
(416 | ) | ||
| Deferred revenue |
(176 | ) | ||
| Deferred tax liability |
(99 | ) | ||
| Total purchase price, net of cash |
$ | 1,212 | ||
The components and the useful lives of the intangible assets listed in the above table as of the acquisition date are as follows (in thousands):
| Amount | Life | ||||
| Developed software |
$ | 40 | 3 years | ||
| Customer relationships |
290 | 7 years | |||
| $ | 330 | ||||
The developed software is being amortized on a straight-line basis over a three-year period and the expense is included in “Cost of Software License Fees.” The customer relationships are being amortized using an accelerated amortization method over seven years and the expense is included in “Sales and Marketing” expense. The weighted average amortization period for the intangibles is 6.5 years. The goodwill recorded in this transaction is not deductible for foreign tax purposes.
Applied Integration Management Corporation
In April 2007, the Company acquired certain assets and operations of Applied Integration Management Corporation (“AIM”), a provider of consulting services for EVM systems. The results of operations of AIM have been included in the consolidated financial statements since the acquisition date.
The aggregate purchase price was $5.9 million and included cash payments through September 30, 2008 of $5.4 million, common stock valued at $500,000 and direct acquisition costs of $91,000. The value of the 38,109 common shares issued was determined by the Company’s Board of Directors in accordance with the guidance in AICPA Practice Aid “Valuation of Privately-Held-Company Equity Securities Issued as Compensation”.
As part of the acquisition, the Company is required to pay additional cash consideration of up to $1.0 million contingent on AIM consulting services revenue meeting specified levels by April 30, 2008. As of September 30, 2008, the contingency had been satisfied and the additional $1.0 million in consideration was paid. The Company entered into retention arrangements with the two AIM stockholders totaling $500,000 if the individuals are employed on the one-year anniversary of the acquisition. This amount was expensed as the requisite services were provided, and was paid during second quarter of 2008.
The following table summarizes the fair values of the assets acquired, as adjusted, at the date of the acquisition (in thousands):
| Intangible assets |
$ | 1,090 | |
| Goodwill |
4,801 | ||
| Total purchase price, net of cash |
$ | 5,891 | |
F-18
Table of Contents
The components and the useful lives of the intangible assets listed in the above table as of the acquisition date are as follows (in thousands):
| Amount | Life | ||||
| Customer relationships |
$ | 540 | 5 years | ||
| PMWorks process |
390 | 5 years | |||
| In-process technology |
160 | — | |||
| $ | 1,090 | ||||
The PMWorks process, which is a project management methodology, is being amortized on a straight-line basis over a five-year period and the expense is included in “Cost of Consulting Services.” The customer relationships are being amortized using an accelerated amortization method over five years and the expense is included in “Sales and Marketing” expense. The $160,000 of in-process technology was written off as it had no alternative future use. The weighted average amortization period for the intangibles is 5.0 years. The goodwill recorded in this transaction is deductible for tax purposes.
3. ACCOUNTS RECEIVABLE
Accounts receivable consisted of the following (in thousands):
| Year Ended December 31, | ||||||||
| 2009 | 2008 | |||||||
| Accounts receivable–billed |
$ | 39,478 | $ | 47,695 | ||||
| Accounts receivable–unbilled |
5,711 | 2,247 | ||||||
| Allowance for doubtful accounts and sales allowances |
(2,658 | ) | (2,195 | ) | ||||
| Total |
$ | 42,531 | $ | 47,747 | ||||
Activity in the allowance for doubtful accounts for the fiscal years ended December 31, 2009, 2008 and 2007 was as follows (in thousands):
| Year Ended December 31, | ||||||||||||
| 2009 | 2008 | 2007 | ||||||||||
| Allowance for doubtful accounts |
||||||||||||
| Beginning balance |
$ | 2,195 | $ | 2,866 | $ | 1,960 | ||||||
| Provision for doubtful accounts–sales allowances |
1,331 | 764 | 1,445 | |||||||||
| Provision for doubtful accounts–credit losses |
936 | 259 | 974 | |||||||||
| Foreign currency translation adjustments |
1 | 27 | — | |||||||||
| Charges against allowance |
(1,805 | ) | (1,721 | ) | (1,513 | ) | ||||||
| Ending balance |
$ | 2,658 | $ | 2,195 | $ | 2,866 | ||||||
4. PROPERTY AND EQUIPMENT
The components of “Property and Equipment, Net” consisted of the following (in thousands):
| Year Ended December 31, | ||||||||
| 2009 | 2008 | |||||||
| Furniture and equipment |
$ | 4,749 | $ | 3,562 | ||||
| Computer equipment |
13,193 | 11,711 | ||||||
| Software |
8,797 | 9,949 | ||||||
| Leasehold improvements |
4,465 | 4,105 | ||||||
| Total |
31,204 | 29,327 | ||||||
| Less–accumulated depreciation and amortization |
(19,833 | ) | (14,688 | ) | ||||
| Property and equipment, net |
$ | 11,371 | $ | 14,639 | ||||
F-19
Table of Contents
Depreciation and amortization expense for the years ended December 31, 2009, 2008, and 2007 was $5.1 million, $4.5 million, and $3.3 million, respectively.
5. PREPAID EXPENSES AND OTHER CURRENT ASSETS
Prepaid expenses and other current assets consisted of the following (in thousands):
| Year Ended December 31, | ||||||
| 2009 | 2008 | |||||
| Prepaid software maintenance and royalties |
$ | 3,777 | $ | 3,071 | ||
| Prepaid conferences and events |
2,356 | 235 | ||||
| Prepaid rent |
1,844 | 616 | ||||
| Debt issuance costs |
1,287 | 788 | ||||
| Prepaid insurance |
776 | 811 | ||||
| Others |
1,216 | 1,353 | ||||
| Total |
$ | 11,256 | $ | 6,874 | ||
6. GOODWILL AND OTHER INTANGIBLE ASSETS
Goodwill
The value of goodwill is primarily derived from the Company’s acquisitions beginning with the acquisition of certain assets of A/E Management and the acquisition of Semaphore Inc. in 2000 to the acquisition of mySBX in December 2009. The Company amortized goodwill until January 1, 2002. In accordance with ASC 350, the Company discontinued amortization of its goodwill beginning January 1, 2002. Per the guidelines of ASC 350, the Company performed tests for goodwill impairment as of December 31, 2009, 2008, and 2007 and determined that there was no impairment of goodwill as the Company assessed its fair value and determined the fair value exceeded the carrying value.
The following table represents the balance and changes in goodwill for the years ended December 31, 2009 and 2008 (in thousands):
| Balance as of January 1, 2008 |
50,082 | |||
| AIM acquisition |
450 | |||
| MPM acquisition |
7,820 | |||
| Welcom acquisition |
250 | |||
| Welcom tax adjustments |
(769 | ) | ||
| Foreign currency translation adjustments |
(179 | ) | ||
| Balance as of December 31, 2008 |
$ | 57,654 | ||
| mySBX acquisition |
6,062 | |||
| Foreign currency translation adjustments |
194 | |||
| Balance as of December 31, 2009 |
$ | 63,910 | ||
In 2008 the increase to goodwill associated with the AIM acquisition was due to an additional $450,000 liability for contingent consideration. In the third quarter of 2008, the Company acquired MPM and recorded $7.8 million of goodwill associated with the transaction. The decrease in goodwill associated with the Welcom purchase was due to a change in the third quarter of 2008 in the valuation allowance of the purchased deferred tax asset. In the fourth quarter of 2008, the Company paid and recognized $250,000 in consideration associated with goals set forth in the Welcom purchase agreement.
F-20
Table of Contents
Other Intangible Assets
The following tables set forth information for intangible assets subject to amortization and for intangible assets not subject to amortization (in thousands):
| As of December 31, 2009 | ||||||||||
| Gross Carrying Amount |
Accumulated Amortization |
Net Carrying Amount | ||||||||
| Amortized Intangible Assets |
||||||||||
| Customer relationships |
$ | 20,064 | $ | (11,896 | ) | $ | 8,168 | |||
| Developed software |
9,110 | (8,066 | ) | 1,044 | ||||||
| Tradename and non-compete |
347 | (323 | ) | 24 | ||||||
| Foreign currency translation adjustments |
29 | (17 | ) | 12 | ||||||
| Total |
$ | 29,550 | $ | (20,302 | ) | $ | 9,248 | |||
| Unamortized Intangible Assets |
||||||||||
| Tradename |
$ | 4,500 | $ | — | $ | 4,500 | ||||
| Total |
$ | 34,050 | $ | (20,302 | ) | $ | 13,748 | |||
| As of December 31, 2008 | ||||||||||||
| Gross Carrying Amount |
Accumulated Amortization |
Net Carrying Amount |
||||||||||
| Amortized Intangible Assets |
||||||||||||
| Customer relationships |
$ | 19,756 | $ | (8,400 | ) | $ | 11,356 | |||||
| Developed software |
8,652 | (7,125 | ) | 1,527 | ||||||||
| Tradename and non-compete |
322 | (280 | ) | 42 | ||||||||
| Foreign currency translation adjustments |
(53 | ) | 24 | (29 | ) | |||||||
| Total |
$ | 28,677 | $ | (15,781 | ) | $ | 12,896 | |||||
| Unamortized Intangible Assets |
||||||||||||
| Tradename |
$ | 4,500 | $ | — | $ | 4,500 | ||||||
| Total |
$ | 33,177 | $ | (15,781 | ) | $ | 17,396 | |||||
Amortization expense related to intangible assets acquired in business combinations is allocated to cost of revenue or operating expense on the statement of operations based on the revenue stream to which the asset contributes. Amortization expense consisted of the following (in thousands):
| Year Ended December 31, | |||||||||
| 2009 | 2008 | 2007 | |||||||
| Included in cost of revenue: |
|||||||||
| Cost of software license fees |
$ | 853 | $ | 1,355 | $ | 1,712 | |||
| Cost of consulting services |
78 | 78 | 59 | ||||||
| Cost of other revenues |
10 | — | — | ||||||
| Total included in cost of revenue |
941 | 1,433 | 1,771 | ||||||
| Included in operating expenses: |
3,539 | 3,127 | 2,706 | ||||||
| Total |
$ | 4,480 | $ | 4,560 | $ | 4,477 | |||
F-21
Table of Contents
As of December 31, 2009, the estimated future amortization expense is summarized in the table below as follows (in thousands):
| Years Ending December 31, | |||
| 2010 |
$ | 3,383 | |
| 2011 |
2,552 | ||
| 2012 |
1,633 | ||
| 2013 |
932 | ||
| 2014 |
736 | ||
| Thereafter |
— | ||
| Total |
$ | 9,236 | |
In accordance with ASC 360, the Company reviews its long-lived assets, including property and equipment and intangible assets, for impairment whenever events or changes in circumstances indicate that the carrying amounts of the assets may not be fully recoverable. If the total of the expected undiscounted future net cash flows is less than the carrying amount of the asset, a loss is recognized for the difference between the fair value and carrying amount of the asset. There have been no impairment charges for the years ended December 31, 2009, 2008, and 2007.
7. DEFERRED REVENUES
The Company has deferred revenues related to software license fees, services and maintenance. Deferred services and deferred maintenance generally result when the Company has received payment for services and maintenance and support that have not yet been performed. The related revenues are deferred until the services have been performed. Deferred software license fee revenues generally result when one or more software products included in a multiple-element arrangement have not been delivered or if certain other revenue recognition conditions are not met.
The current portion of deferred revenues consisted of the following (in thousands):
| Year Ended December 31, | ||||||
| 2009 | 2008 | |||||
| Deferred software license fees |
$ | 2,377 | $ | 275 | ||
| Deferred consulting services |
2,940 | 4,680 | ||||
| Deferred maintenance and support services |
34,855 | 16,317 | ||||
| Deferred other revenues |
4 | 24 | ||||
| Total |
$ | 40,176 | $ | 21,296 | ||
At December 31, 2009, the balance in deferred maintenance and support services increased over the prior year due to a change in the Company’s billing policies for maintenance renewals. The change in policy required more advanced billing for contractual maintenance renewals.
The Company had $887,000 of deferred maintenance and support services and $0 of deferred software license fees at December 31, 2009 included in “Other Long-Term Liabilities.” At December 31, 2008, “Other Long-Term Liabilities” included $400,000 of deferred maintenance and support services and $691,000 of deferred software license fees.
F-22
Table of Contents
8. ACCOUNTS PAYABLE AND ACCRUED EXPENSES
Accounts payable and accrued expenses consisted of the following (in thousands):
| Year Ended December 31, | ||||||
| 2009 | 2008 | |||||
| Accrued wages and other employee benefits |
$ | 10,109 | $ | 11,727 | ||
| Accrued bonuses and commissions |
5,807 | 5,425 | ||||
| Accounts payable |
1,659 | 2,458 | ||||
| Deferred rent, current |
1,295 | 792 | ||||
| Other accrued expenses |
7,870 | 8,332 | ||||
| Total |
$ | 26,740 | $ | 28,734 | ||
9. DEBT
The Company has maintained a credit agreement with a syndicate of lenders led by Credit Suisse (the “Credit Agreement”) since 2005. In August 2009, the Company amended the Credit Agreement (the “Amended Credit Agreement”). At the time of the amendment, the Company had term loans of $179.6 million outstanding and a $30 million revolving credit facility on which there were no borrowings. The term loans and revolving credit facility were to expire on April 22, 2011 and April 22, 2010, respectively.
As a result of the amendment, the Company extended the maturity of $129.4 million of term loans to April 22, 2013. In addition, the expiration of $22.5 million of the revolving credit facility was extended to April 22, 2013. The remaining $50.2 million of the term loans and $7.5 million of the revolving credit facility continue to expire on April 22, 2011 and April 22, 2010, respectively.
The non-extended portion of the term loans continues to accrue interest at a rate of 2.25% above the British Banker’s Association Interest Settlement Rates for dollar deposits (the “LIBO rate” or “LIBOR”). The non-extended portion of the revolving credit facility continues to accrue interest at a rate of 2.50% or 1.50%, depending on the type of borrowing. The spread above the LIBO rate decreases as the Company’s leverage ratio, as defined in the Amended Credit Agreement, decreases. The interest rate for the extended portion of both the term loans and the revolving credit facility is the LIBO rate plus 4.25% with a LIBOR floor of 2.00%. The financial ratio covenants in the Amended Credit Agreement remained unchanged.
In accordance with the guidance in ASC 470-50, Debt-modifications and Extinguishments, the amendment of the Credit Agreement is accounted for as a debt modification since the Amended Credit Agreement is not substantially different than the original agreement due to the present value of the change in cash flows being less than 10% and because there is no change in the creditor. The Company paid $2.3 million of debt issuance costs, of which $2.1 million was paid to Credit Suisse and the other lenders and will be amortized to interest expense over the remaining term of the modified debt. Previously deferred debt issuance costs of $1.0 million as of August 24, 2009 will be amortized over the remaining term of the modified debt.
The Amended Credit Agreement requires scheduled quarterly principal payments, which commenced on September 30, 2009 with a payment of $323,000. On December 31, 2009, the Company made another scheduled principal payment of $323,000. In addition, the Amended Credit Agreement continues to require mandatory prepayments of the term loans from annual excess cash flow, as defined in the Amended Credit Agreement, and from the net proceeds of certain asset sales or equity issuances. Mandatory prepayments, such as those made from annual cash flow as well as voluntary prepayments, are applied pro rata against the outstanding balances of the non-extended and extended loans.
During the first quarter of 2009, the Company made a scheduled principal payment of $498,000 and a mandatory principal prepayment of $9.7 million from the Company’s annual excess cash flow. As a result of the rights offering completed in the second quarter of 2009, the Company made a mandatory principal prepayment of
F-23
Table of Contents
approximately $3.1 million from the net proceeds from the rights offering. The mandatory excess cash flow payment made in the first quarter of 2009 was applied first against the scheduled principal payments, under the original Credit Agreement, for a twelve month period with the excess applied ratably against the remaining debt payments in the amortization schedule under the original Credit Agreement. The prepayment from the Company’s rights offering was applied ratably against the remaining debt payments under the original Credit Agreement.
Upon completion of the initial public offering in the fourth quarter of 2007, the Company made a prepayment on the term loans under the original Credit Agreement in the amount of $17.6 million. This payment included the scheduled principal payments per the original Credit Agreement through September 30, 2008. The Company made a scheduled principal payment of $498,000 on December 31, 2008.
The following table summarizes future principal payments on the Amended Credit Agreement as of December 31, 2009 (in thousands):
| Principal Payment | |||
| 2010 |
$ | 44,707 | |
| 2011 |
25,873 | ||
| 2012 |
1,092 | ||
| 2013 |
107,285 | ||
| Total principal payments |
$ | 178,957 | |
The loans are collateralized by substantially all of the Company’s assets and require the maintenance of certain financial covenants. The Amended Credit Agreement also requires the Company to comply with non-financial covenants that restrict certain corporate activities, including incurring additional indebtedness, guaranteeing obligations, creating liens on assets, entering into sale and leaseback transactions, engaging in certain mergers or consolidations, or paying cash dividends. The Company was in compliance with all covenants as of December 31, 2009.
As of December 30, 2009, the outstanding amount of the term loans was $179.0 million, with interest at 6.25% for the extended portion of the term loans and 2.5% for the non-extended portion of the term loans. As of December 31, 2008, the outstanding amount of the term loans was $192.8 million with interest at 2.5%. The aggregate annual weighted average interest rates were 3.62% and 5.28% for 2009 and 2008, respectively. There were no borrowings under the revolving credit facility at December 31, 2009 and December 31, 2008. At December 31, 2009, the Company was contingently liable under open standby letters of credit and bank guarantees issued by the Company’s banks in favor of third parties primarily relating to real estate lease obligations. These instruments reduce the Company’s available borrowings under the revolving credit facility. The revolving credit facility was utilized to guarantee the letters of credit in an amount totaling $877,000. As a result, at December 31, 2009, the available borrowings on the revolving credit facility were $29.1 million.
At December 31, 2009 and December 31, 2008, the current portion of the unamortized debt issuance costs of $1.3 million and $788,000, respectively, is reflected as “Prepaid Expenses and Other Current Assets” in the consolidated balance sheets. The noncurrent portion of the unamortized debt issuance costs for those same periods of $1.5 million and $846,000, respectively, is reflected as “Other Assets” in the consolidated balance sheets. The debt issuance costs are being amortized and reflected in “Interest Expense” over the remaining term of the modified debt, including the previously deferred debt issuance costs that existed at the time of the Credit Agreement amendment. Prior to the amendment and extension of the Credit Agreement, these costs were being amortized over the original lives of the loans. The debt issuance costs are accelerated to the extent that any prepayment is made on the term loans. During the years ended December 31, 2009, 2008, and 2007, costs of $962,000, $793,000, and $1.1 million, respectively, were amortized and reflected in “Interest Expense.” The December 31, 2009 amount included $98,000 of accelerated amortization of debt issuance costs as a result of the
F-24
Table of Contents
Company’s prepayments on the terms loans from the annual excess cash flow in the first quarter of 2009 and due to the completion of the rights offering in the second quarter of 2009. The December 31, 2007 amount included $233,000 of accelerated amortization of debt issuance costs as a result of the Company’s prepayment on the term loans in the fourth quarter of 2007. For fiscal year 2008 there was no accelerated amortization of debt issuance costs.
Debt consists of the following (in thousands):
| Year Ended December 31, | ||||||
| 2009 | 2008 | |||||
| Term loans |
$ | 178,957 | $ | 192,815 | ||
| Less: Current portion of term loans |
44,707 | 10,154 | ||||
| Long-term debt |
$ | 134,250 | $ | 182,661 | ||
10. EMPLOYEE BENEFITS
401(k) Plan—The Company has a 401(k) plan covering all eligible employees. Employees are eligible to participate on their first day of employment, but are not eligible for the Company contribution until the first month following three full months of employment. Company contributions vest ratably over three years. The Board of Directors approved a discretionary contribution of 4% of eligible compensation for 2009, 2008 and 2007. The Company’s contribution expense for 2009, 2008 and 2007 was approximately $692,000, $3.3 million, and $2.6 million, respectively. The Company’s contribution for 2009 was suspended starting with the second quarter of 2009 and remained suspended for the remainder of fiscal year 2009.
11. INCOME TAXES
For financial reporting purposes, income before income taxes includes the following components:
| Year Ended December 31 | ||||||||||
| 2009 | 2008 | 2007 | ||||||||
| Domestic |
$ | 29,964 | $ | 32,275 | $ | 39,454 | ||||
| Foreign |
1,827 | 3,838 | (1,458 | ) | ||||||
| $ | 31,791 | $ | 36,113 | $ | 37,996 | |||||
The provision for income taxes consisted of the following (in thousands):
| Year Ended December 31, | ||||||||||||
| 2009 | 2008 | 2007 | ||||||||||
| Current: |
||||||||||||
| Federal |
$ | 10,920 | $ | 11,690 | $ | 14,544 | ||||||
| State |
2,850 | 2,507 | 3,035 | |||||||||
| Foreign |
181 | 724 | 362 | |||||||||
| Total current |
$ | 13,951 | $ | 14,921 | $ | 17,941 | ||||||
| Deferred: |
||||||||||||
| Federal |
(3,391 | ) | (2,194 | ) | (2,006 | ) | ||||||
| State |
(468 | ) | (455 | ) | (403 | ) | ||||||
| Foreign |
303 | 322 | (55 | ) | ||||||||
| Total deferred |
(3,556 | ) | (2,327 | ) | (2,464 | ) | ||||||
| Provision for income taxes |
$ | 10,395 | $ | 12,594 | $ | 15,477 | ||||||
F-25
Table of Contents
The reported expense or benefit for income taxes differs from the amount computed by applying the statutory U.S. federal income tax rate of 35% to the income before income taxes as follows (in thousands):
| Year Ended December 31, | |||||||||||||||||||||
| 2009 | 2008 | 2007 | |||||||||||||||||||
| Expense at statutory rate |
$ | 11,127 | 35.0 | % | $ | 12,639 | 35.0 | % | $ | 13,299 | 35.0 | % | |||||||||
| Change resulting from: |
|||||||||||||||||||||
| State taxes, net of federal benefit |
1,212 | 3.8 | % | 1,174 | 3.3 | % | 1,736 | 4.6 | % | ||||||||||||
| Domestic production activities deduction |
(712 | ) | -2.2 | % | (1,110 | ) | -3.1 | % | (746 | ) | -2.0 | % | |||||||||
| Research and development tax credit |
(799 | ) | -2.5 | % | (757 | ) | -2.1 | % | — | 0.0 | % | ||||||||||
| Foreign tax credit |
(913 | ) | -2.9 | % | — | 0.0 | % | — | 0.0 | % | |||||||||||
| Foreign tax rate differential |
258 | 0.8 | % | 250 | 0.7 | % | 297 | 0.8 | % | ||||||||||||
| Change in valuation allowance |
— | 0.0 | % | (569 | ) | -1.6 | % | 569 | 1.5 | % | |||||||||||
| Non deductible items |
(133 | ) | -0.4 | % | 707 | 2.0 | % | 433 | 1.1 | % | |||||||||||
| Other |
355 | 1.1 | % | 260 | 0.7 | % | (111 | ) | -0.3 | % | |||||||||||
| Total |
$ | 10,395 | 32.7 | % | $ | 12,594 | 34.9 | % | $ | 15,477 | 40.7 | % | |||||||||
The following table summarizes the significant components of the Company’s deferred tax assets and liabilities for 2009 and 2008 (in thousands):
| Year Ended December 31, | ||||||||
| 2009 | 2008 | |||||||
| Deferred tax assets: |
||||||||
| Employee compensation and benefits |
$ | 10,525 | $ | 7,704 | ||||
| Deductible goodwill and purchased intangible assets |
2,218 | 2,096 | ||||||
| Allowances and other accrued liabilities |
1,391 | 1,250 | ||||||
| Foreign tax credit |
916 | — | ||||||
| Net operating loss carryforwards |
896 | 299 | ||||||
| Deferred rent |
874 | 1,001 | ||||||
| Deferred revenue |
796 | 1,917 | ||||||
| Other |
117 | 135 | ||||||
| Total deferred tax assets |
$ | 17,733 | $ | 14,402 | ||||
| Deferred tax liabilities: |
||||||||
| Acquired intangibles |
(2,439 | ) | (2,545 | ) | ||||
| Depreciation |
(1,382 | ) | (1,222 | ) | ||||
| Software development costs |
(850 | ) | (1,032 | ) | ||||
| Other |
(689 | ) | (843 | ) | ||||
| Total deferred tax liabilities |
(5,360 | ) | (5,642 | ) | ||||
| Net deferred tax asset before allowance |
12,373 | 8,760 | ||||||
| Valuation allowance |
— | — | ||||||
| Net deferred tax asset |
$ | 12,373 | $ | 8,760 | ||||
U.S. income taxes and foreign withholding taxes have not been provided on undistributed earnings of non-U.S. subsidiaries because such earnings are considered to be reinvested indefinitely outside the U.S., and it is not practicable to estimate the amount of tax that may be payable upon distribution.
Deferred tax assets are reduced by a valuation allowance if the Company believes it is more likely than not that some portion or the entire deferred tax asset will not be realized. As the Company believes it is more likely than not to realize all its deferred tax assets, no valuation allowance has been recorded in the current year. During
F-26
Table of Contents
2008, the Company performed a detailed functional and economic analysis involving benchmarking against transactions among entities that are not under the Company’s control. Based on the Company’s analysis, it made certain changes to its transfer pricing agreements. As a result of this change in geographic distribution of income during the third quarter of 2008, the Company released all of the valuation allowance it had previously recorded because the Company determined that it was more likely than not that the Company would be able to realize the tax benefits associated with its foreign losses. Of the $1.1 million valuation allowance the Company released in 2008, $559,000 was recorded against goodwill and the remaining $569,000 was recorded in the profit and loss statement.
Effective January 1, 2007, the Company adopted the provisions of ASC 740-10 which clarifies the criteria that an individual tax position must satisfy for some or all of the benefits of that position to be recognized in a company’s financial statements in accordance with ASC 740. ASC 740-10 prescribes a recognition threshold of more likely than not, and a measurement attribute for all tax positions taken or expected to be taken on a tax return, in order for those tax positions to be recognized in the financial statements. ASC 740-10 also provides guidance on derecognition, classification, interest and penalties, accounting in interim periods, disclosure, and transition.
A reconciliation of the beginning and ending amount of unrecognized tax benefits, excluding interest and penalties, is as follows (in thousands):
| 2009 | 2008 | 2007 | ||||||||
| Balance at January 1 |
$ | 849 | $ | 435 | $ | 269 | ||||
| Increases (decreases) for tax positions taken during prior period |
457 | 23 | (87 | ) | ||||||
| Increases for tax positions taken during current period |
386 | 391 | 253 | |||||||
| Balance at December 31 |
$ | 1,692 | $ | 849 | $ | 435 | ||||
During the twelve months ended December 31, 2009, the Company established an additional liability under ASC 740-10 of $843,000 which included a $777,000 increase associated with tax credits related to foreign taxes and research and development. The liability also included a $66,000 increase related to certain non deductible expenses. Additionally, the liability increased by $24,000 for interest. Interest and penalties related to uncertain tax positions are recorded as part of the provision for income taxes. At December 31, 2009, the Company has recorded a liability under ASC 740-10 of $1,692,000 plus interest and potential penalties of $133,000 and $46,000, respectively. These liabilities for unrecognized tax benefits are included in “Other Tax Liabilities”. As of December 31, 2009, 2008 and 2007, the Company had $1,692,000, $849,000 and $435,000 of unrecognized tax benefits, respectively, which if recognized, would affect income tax expense. The Company does not expect that the amounts of unrecognized tax benefits will change significantly within the next twelve months. Subsequent to the adoption of ASC 805 on January 1, 2009, liabilities settled for lesser amounts will primarily affect income tax expense in the period of reversal.
The Company files income tax returns, including returns for its subsidiaries with federal, state, local and foreign jurisdictions. With few exceptions, the Company is no longer subject to examination for the years before 2006. Currently, the Company is under audit in Virginia and the Philippines for the tax periods ending December 31, 2007 and 2006.
12. STOCKHOLDERS’ EQUITY (DEFICIT)
Preferred Stock—The Company’s Board of Directors has the authority, without further action by the stockholders, to issue preferred stock in one or more series and to fix the terms and rights of the preferred stock. Such actions by the Board of Directors could adversely affect the voting power and other rights of the holders of common stock. Preferred stock could thus be issued quickly with terms that could delay or prevent a change in control of the Company or make removal of management more difficult.
F-27
Table of Contents
Common Stock—In November 2007, the Company completed an initial public offering consisting of 9,000,000 shares of common stock for $18.00 per share. The total shares sold in the offering included 5,990,525 shares sold by selling stockholders and 3,009,475 shares sold by the Company.
In May 2009, the Company issued non-transferable subscription rights to the Company’s stockholders of record to subscribe for 20 million shares of the Company’s common stock on a pro rata basis at a subscription price of $3.00 per share. Stockholders received one right for each share of common stock owned on the record date, April 14, 2009. Based on the number of shares outstanding on the record date, the rights offering entitled each stockholder to purchase 0.4522 shares of common stock at the subscription price. On May 27, 2009, the subscription period expired and the rights offering was fully subscribed by participating stockholders of the Company, resulting in the issuance of 20 million shares of common stock on June 1, 2009.
Changes in Capital Stock—In April 2007, in conjunction with the Company’s conversion from a Virginia to a Delaware corporation, the Company authorized additional shares of capital stock to include a total of 200,000,000 shares, par value $0.001 per share of common stock, 100 shares, par value $0.001 per share Class A Common Stock and 5,000,000 shares, par value $0.001 per share of preferred stock. At the effective date of the conversion, each of the 100 shares of Series A Preferred Stock outstanding just prior to the conversion, was converted into 100 shares of Class A Common Stock.
13. EARNINGS PER SHARE
Net income per share is computed under the provisions of ASC 260, Earnings Per Share (“ASC 260”). Basic earnings per share is computed using net income and the weighted average number of common shares outstanding. Diluted earnings per share reflect the weighted average number of common shares outstanding plus any potentially dilutive shares outstanding during the period. Potentially dilutive shares consist of shares issuable upon the exercise of stock options, restricted stock and shares from the ESPP.
The following table sets forth the computation of basic and diluted net income per share (dollars in thousands, except share and per share data):
| Year Ended December 31, | |||||||||
| 2009 | 2008 | 2007 | |||||||
| Basic earnings per share computation: |
|||||||||
| Net income (A) |
$ | 21,396 | $ | 23,519 | $ | 22,519 | |||
| Weighted average common shares–basic (B) |
56,777,552 | 46,570,596 | 43,239,528 | ||||||
| Basic net income per share (A/B) |
$ | 0.38 | $ | 0.51 | $ | 0.52 | |||
| Diluted earnings per share computation: |
|||||||||
| Net income (A) |
$ | 21,396 | $ | 23,519 | $ | 22,519 | |||
| Shares computation: |
|||||||||
| Weighted average common shares–basic |
56,777,552 | 46,570,596 | 43,239,528 | ||||||
| Effect of dilutive stock options, restricted stock, and ESPP |
818,774 | 1,158,897 | 1,580,807 | ||||||
| Weighted average common shares–diluted (C) |
57,596,326 | 47,729,493 | 44,820,335 | ||||||
| Diluted net income per share (A/C) |
$ | 0.37 | $ | 0.49 | $ | 0.50 | |||
In June 2009, the Company completed its common stock rights offering, as a result of which the Company issued 20 million shares of the Company’s common stock at a subscription price of $3.00 per share. In accordance with ASC 260, a rights offering where the exercise price at issuance is less than the fair value of the stock is considered to include a bonus element, requiring an adjustment to the prior period number of shares outstanding used to compute basic and diluted earnings per share. In accordance with ASC 260, the weighted
F-28
Table of Contents
average common shares outstanding used in the computation of basic and diluted earnings per share was retroactively increased by an adjustment factor of 1.08 for all periods prior to the period in which the rights offering was completed.
For the years ended December 31, 2009, 2008 and 2007, 5,383,001, 4,158,873 and 1,129,350 shares of common stock, respectively, were outstanding but not included in the computation of diluted earnings per share because their effect would have been anti-dilutive. These excluded shares related to potentially dilutive securities primarily associated with stock options granted by the Company pursuant to its equity plans.
14. STOCK-BASED COMPENSATION
Stock Incentive Plans
The Company has historically granted equity awards to directors and employees under two separate equity plans.
The Company’s 2005 Stock Option Plan (the “2005 Plan”) authorized the Company to grant options to purchase up to 6,310,000 shares of common stock to directors and employees. Option grants under the 2005 Plan ceased upon the approval of the Company’s 2007 Stock Incentive and Award Plan (the “2007 Plan”).
In April 2007, the Company’s Board of Directors approved the 2007 Plan, which allowed the Company to grant up to 1,840,000 new stock incentive awards or options, including incentive and nonqualified stock options, stock appreciation rights, restricted stock, dividend equivalent rights, performance units, performance shares, performance-based restricted stock, share awards, phantom stock and cash incentive awards. The aggregate number of shares reserved and available for grant and issuance pursuant to the 2007 Plan increases automatically each January 1 in an amount equal to 3% of the total number of shares of the Company’s common stock issued and outstanding on December 31 of the immediately preceding calendar year, unless otherwise reduced by the Board of Directors. Shares issued under the plan may be from either authorized but unissued shares or issued shares from restricted stock awards which have been withheld by the Company upon vesting and returned to the plan as shares available for future issuance. Options and awards issued under the 2007 Plan are not subject to the same stockholders’ agreement as the 2005 Plan which restricts how and when shares may be sold.
Upon adoption of ASC 718, the Company selected the Black-Scholes-Merton option-pricing model as the most appropriate model for determining the estimated fair value for stock-based awards. The fair value of stock option awards is amortized on a straight-line basis over the requisite service period of the awards, which is generally the vesting period. The fair value of the Company’s stock on the date of grant was determined by the Company’s Board of Directors or, subsequent to December 2006, the Compensation Committee (or its authorized member(s)) prior to the Company’s stock becoming publicly traded in November 2007. Expected volatility was calculated as of each grant date based on reported data for a peer group of publicly traded companies for which historical information was available, as well as the Company’s volatility since the date of its initial public offering. The Company will continue to use peer group volatility information, until historical volatility of the Company is relevant, to measure expected volatility for future option grants. The average expected life was determined under the simplified calculation as provided by the SEC’s Staff Accounting Bulletin No. 107, Share-Based Payment, which is the mid-point between the vesting date and the end of the contractual term. The risk-free interest rate is determined by reference to the U.S. Treasury yield curve rates with the remaining term equal to the expected life assumed at the date of grant. Forfeitures are estimated based on the Company’s historical analysis of employee attrition.
Stock options and restricted stock awards are granted at the discretion of the Board of Directors or the Compensation Committee (or its authorized member(s)) and expire 10 years from the date of the grant. Options generally vest over a four-year period based upon required service conditions. Certain options granted to the Board of Directors vest over one year. No options have vesting provisions tied to performance or market conditions. The Company calculates the pool of additional paid-in capital associated with excess tax benefits
F-29
Table of Contents
using the “simplified method”. At December 31, 2009, there were 1,130,472 options available for future grant. Under the provisions of the 2005 Plan, each option holder was required to execute a stockholders’ agreement prior to being deemed the holder of, or having rights with respect to, any shares of the Company’s common stock. Stockholders who were a party to the stockholders’ agreement are entitled to participate proportionately in an offering of common stock by New Mountain Funds. Stockholders could only sell in conjunction with an offering or sale by New Mountain Funds and not at any other time.
Under the provisions of the 2007 Plan, the Company’s Chief Executive Officer was only able to sell shares of common stock in conjunction with a sale of shares by New Mountain Funds (and up to the same proportion as New Mountain Funds) until New Mountain Funds owns less than 15% of the Company’s outstanding capital stock. This restriction was waived with respect to the February 2009 equity grant made to the Chief Executive Officer.
Under the provisions of the 2007 Plan, executives, senior vice presidents and holders of 100,000 or more shares of common stock or options were only permitted to sell shares of common stock in conjunction with a sale of shares by New Mountain Funds (and up to the same proportion as New Mountain Funds) until New Mountain Funds owns less than 15% of the Company’s outstanding capital stock. In addition, these individuals were required by New Mountain Funds to participate in such a sale and to vote in favor of such a transaction if stockholder approval is required.
As of October 30, 2009, New Mountain Funds and the Company waived the remaining selling restrictions imposed by the stockholders’ agreements applicable to the 2005 Plan and 2007 Plan for all current and former employees of the Company other than the Company’s Chief Executive Officer. Additionally, as of December 15, 2009, these restrictions were also waived for the Company’s Chief Executive Officer and certain members of the Board of Directors.
The weighted average assumptions used in the Black-Scholes-Merton option-pricing model were as follows:
| Year Ended December 31, | |||||||||
| 2009 | 2008 | 2007 | |||||||
| Dividend yield |
0.0 | % | 0.0 | % | 0.0 | % | |||
| Expected volatility |
69.5 | % | 58.0 | % | 50.0 | % | |||
| Risk-free interest rate |
2.3 | % | 3.1 | % | 4.6 | % | |||
| Expected life (in years) |
6.2 | 6.2 | 6.2 | ||||||
The following table presents the stock-based compensation expense for stock options, restricted stock and ESPP included in the related financial statement line items (in thousands):
| Year Ended December 31, | |||||||||
| 2009 | 2008 | 2007 | |||||||
| Included in cost of revenue: |
|||||||||
| Cost of consulting services |
$ | 2,002 | $ | 1,663 | $ | 1,010 | |||
| Cost of maintenance and support services |
661 | 47 | 335 | ||||||
| Total included in cost of revenue |
2,663 | 1,710 | 1,345 | ||||||
| Included in operating expenses: |
|||||||||
| Research and development |
2,339 | 1,889 | 1,237 | ||||||
| Sales and marketing |
2,054 | 1,777 | 1,227 | ||||||
| General and administrative |
3,515 | 3,386 | 2,360 | ||||||
| Total included in operating expenses |
7,908 | 7,052 | 4,824 | ||||||
| Total pre-tax compensation expense |
$ | 10,571 | $ | 8,762 | $ | 6,169 | |||
| Tax Benefit |
4,165 | 3,452 | 2,431 | ||||||
| Compensation expense, net of tax |
$ | 6,406 | $ | 5,310 | $ | 3,738 | |||
F-30
Table of Contents
Stock Options
The following table summarizes the activity of all the Company’s stock option plans from January 1, 2007 to December 31, 2009:
| Number of Options |
Weighted Average Exercise Price |
Aggregate Intrinsic Value (in thousands) | |||||||
| Options outstanding at January 1, 2007 |
4,601,838 | $ | 6.20 | ||||||
| Options granted |
2,456,350 | 14.85 | |||||||
| Options forfeited |
(143,933 | ) | 9.36 | ||||||
| Options exercised |
(586,831 | ) | 6.73 | $ | 6,573 | ||||
| Options outstanding at December 31, 2007 |
6,327,424 | 9.44 | |||||||
| Options granted |
1,343,315 | 10.58 | |||||||
| Options forfeited |
(873,569 | ) | 13.17 | ||||||
| Options exercised |
(59,311 | ) | 4.70 | $ | 271 | ||||
| Options outstanding at December 31, 2008 |
6,737,859 | 9.21 | |||||||
| Options granted |
159,450 | 3.93 | |||||||
| Options forfeited |
(626,374 | ) | 11.26 | ||||||
| Options exercised |
(245,750 | ) | 3.61 | $ | 376 | ||||
| Options outstanding at December 31, 2009 |
6,025,185 | $ | 9.08 | $ | 9,153 | ||||
The weighted average grant date fair value of all options granted was $2.51, $5.65, and $8.31 for the years ended December 31, 2009, 2008 and 2007, respectively, as determined under the Black-Scholes-Merton valuation model. The total cash received for options exercised was approximately $887,000, $277,000 and $3,950,000 during 2009, 2008 and 2007, respectively. For the years ended December 31, 2009, 2008 and 2007, total recognized tax benefits from the exercise of stock options were $148,000, $107,000 and $2.5 million, respectively. The intrinsic value for stock options exercised in the above table is calculated as the difference between the market value on the date of exercise and the exercise price of the shares. The stock options exercised during 2009, 2008 and 2007 were issued from previously authorized common stock.
Stock option compensation expense for the years ended December 31, 2009, 2008 and 2007 was $6.7 million, $8.2 million and $6.1 million, respectively. As of December 31, 2009, compensation cost related to nonvested stock options not yet recognized in the income statement was $7.4 million and expected to be recognized over an average period of 1.65 years. Option grants that vested during the years ended December 31, 2009, 2008 and 2007 had a combined fair value of $7.9 million, $7.6 million, and $3.3 million, respectively.
The following table summarizes stock option vesting activity for the year ended December 31, 2009:
| Number of Options |
Weighted Average Grant Date Fair Value | |||||
| Nonvested stock options as of December 31, 2008 |
3,893,995 | 5.76 | ||||
| Options granted |
159,450 | 2.51 | ||||
| Options forfeited |
(368,000 | ) | 6.46 | |||
| Options vested |
(1,697,390 | ) | 4.68 | |||
| Nonvested stock options as of December 31, 2009 |
1,988,055 | $ | 6.28 | |||
F-31
Table of Contents
The following table summarizes information regarding stock options exercisable and stock options vested and expected to vest as of December 31, 2009 (in thousands, except share data):
| Stock Options Exercisable |
Stock Options Vested and Expected to Vest | |||||
| Stock options outstanding |
4,037,130 | 5,816,890 | ||||
| Weighted average exercise price |
$ | 7.90 | $ | 9.01 | ||
| Aggregate intrinsic value |
$ | 8,195 | $ | 9,012 | ||
| Weighted average remaining contractual life (in years) |
6.44 | 6.84 | ||||
In November 2007, the Compensation Committee of the Board of Directors modified the exercise price of certain stock options granted to 11 employees in October 2007. This modification resulted in an increase of approximately $227,000 in total compensation expense attributable to the award, recognized over the remainder of the requisite service period of four years.
Restricted Stock
During the year ended December 31, 2009 the company issued 1,781,500 shares of restricted stock. The weighted average aggregate grant date fair value was $11.1 million and is recognized as expense on a straight-line basis over the requisite service period of the awards. Restricted stock awards vest over either a two- or four-year vesting period. The Company’s restricted stock awards are accounted for as equity awards. The grant date fair value is based on the closing price of the Company’s common stock on the date of grant. The Company did not grant any restricted stock prior to February 2008.
Restricted stock awards are considered outstanding at the time of grant as the stock holders are entitled to voting rights. Dividend payments are deferred until the requisite service period has lapsed; additionally, any deferred dividends will be forfeited if the award shares are forfeited by the grantee. Unvested restricted stock awards are not considered outstanding in the computation of basic earnings per share.
Restricted stock activity for the years ended December 31, 2008 and 2009 is as follows:
| Number of shares |
Weighted Average Grant Date Fair Value |
Weighted Average Remaining Vesting Term (in years) | ||||||
| Nonvested shares as of January 1, 2008 |
— | $ | — | |||||
| Granted |
303,000 | 7.11 | ||||||
| Forfeited |
(17,350 | ) | 9.95 | |||||
| Vested |
— | — | ||||||
| Nonvested shares as of December 31, 2008 |
285,650 | 6.93 | 3.6 | |||||
| Granted |
1,781,500 | 6.22 | ||||||
| Forfeited |
(73,652 | ) | 5.05 | |||||
| Vested |
(69,836 | ) | 6.98 | |||||
| Nonvested shares as of December 31, 2009 |
1,923,662 | 6.34 | 3.13 | |||||
| Shares vested and expected to vest as of December 31, 2009 |
1,590,479 | 6.25 | ||||||
Restricted stock compensation expense for the years ended December 31, 2009 and 2008 was $1.9 million and $263,000, respectively. As of December 31, 2009, there was $8.2 million of unrecorded compensation cost for restricted stock not yet recognized in the income statement. The intrinsic value of the restricted stock awards outstanding at December 31, 2009 is $15.0 million calculated as the market value of the Company’s stock on December 31, 2009.
F-32
Table of Contents
Upon each vesting period of the restricted stock awards, employees are subject to minimum tax withholding obligations. The 2007 Plan allows the Company, at the employee’s election, to withhold a sufficient number of shares due to the employee to satisfy the employee’s minimum tax withholding obligations. As of December 31, 2009, the Company had withheld 18,296 shares of common stock at a value of $123,000. Pursuant to the terms of the 2007 Plan, the shares withheld were returned to the 2007 Plan reserve for future issuance and, accordingly, the Company’s issued and outstanding common stock and additional paid-in capital were reduced to reflect this adjustment.
Employee Stock Purchase Program
In April 2007, the Company’s Board of Directors adopted the ESPP to provide eligible employees an opportunity to purchase up to 750,000 shares of the Company’s common stock through accumulated payroll deductions. The ESPP was effective when the Company completed an initial public offering of its common stock. Employees contribute to the plan during six-month offering periods that begin on March 1st and September 1st of each year. The per share price of common stock purchased pursuant to the ESPP shall be 90% of the fair market value of a share of common stock on (i) the first day of an offering period, or (ii) the date of purchase, whichever is lower.
Compensation expense for the ESPP is recognized in accordance with ASC 718. The weighted average assumptions used in the Black- Scholes-Merton option-pricing model were as follows:
| Year Ended December 31, | ||||||||||||
| 2009 | 2008 | 2007 | ||||||||||
| Weighted average fair value |
$ | 3.28 | $ | 2.90 | $ | 3.96 | ||||||
| Dividend yield |
0.0 | % | 0.0 | % | 0.0 | % | ||||||
| Expected volatility |
69.1 | % | 55.0 | % | 50.0 | % | ||||||
| Risk-free interest rate |
0.33 | % | 2.20 | % | 3.86 | % | ||||||
| Expected life (in years) |
0.21 | 0.44 | 0.33 | |||||||||
ESPP compensation expense for the years ended December 31, 2009, 2008 and 2007 was $1.9 million, $282,000 and $35,000, respectively. As of December 31, 2009, there was approximately $44,000 of unrecorded compensation cost for the ESPP not yet recognized in the income statement which is expected to be recognized in the first quarter of 2010. The Company recognized $80,000, $21,000 and $0 in tax benefits related to the ESPP for the years ended December 31, 2009, 2008 and 2007, respectively. A total of 635,855 shares and 82,736 shares were issued under the plan in the years ended December 31, 2009 and 2008, respectively. During 2007, no shares were issued under the ESPP. In February 2010, the number of shares available for purchase under the ESPP plan was increased from 750,000 to 1,500,000, of which 718,591 had been issued as of December 31, 2009.
15. RELATED PARTY TRANSACTIONS
Pursuant to the 2005 recapitalization agreement, New Mountain Capital, L.L.C. is entitled to receive $500,000 annually as an advisory fee for providing ongoing management, financial and investment banking services to the Company. New Mountain Capital, L.L.C. agreed to waive advisory fees for the third quarter of 2007 and for subsequent periods upon completion of the Company’s initial public offering. The Company therefore did not incur any advisory fees for the years ended December 31, 2009 and 2008.
New Mountain Capital, L.L.C. is also entitled to receive transaction fees equal to 2% of the transaction value of each significant transaction directly or indirectly involving the Company or any of its controlled affiliates, including, but not limited to, acquisitions, dispositions, mergers, or other similar transactions, debt, equity or other financing transactions, public or private offerings of the Company’s securities and joint ventures, partnerships and minority investments. Transaction fees are payable upon the consummation of a significant transaction. No fee is payable for a transaction with a value of less than $25.0 million. In connection with the
F-33
Table of Contents
amendment of the Company’s Credit Agreement, New Mountain Capital L.L.C. agreed to waive any transaction fee payable. New Mountain Capital L.L.C. also waived any transaction fee payable in relation to the common stock rights offering in June 2009. The Company did not incur any transaction fees for the years ended December 31, 2009 and 2008.
16. RESTRUCTURING CHARGE
2009 Restructuring Activity
The Company implemented discrete restructuring plans in each quarter of 2009. These restructuring plans were to eliminate certain positions to realign the Company’s cost structure, to create a virtual workforce and to allow for increased investment in its key strategic objectives.
Restructuring activities for the year ended December 31, 2009 are as follows (in thousands):
| Year Ended December 31, 2009 | ||||||||||||
| Charges and adjustments to charges |
Cash Payments | Total remaining liability | ||||||||||
| Q1 2009 Plan |
||||||||||||
| Severance and benefits | $ | 1,305 | $ | (1,295 | ) | $ | 10 | |||||
| Facilities | — | — | — | |||||||||
| Total Q1 2009 Plan |
$ | 1,305 | $ | (1,295 | ) | $ | 10 | |||||
| Q2 2009 Plan |
||||||||||||
| Severance and benefits | $ | 1,012 | $ | (974 | ) | $ | 38 | |||||
| Facilities | 164 | (51 | ) | 113 | ||||||||
| Total Q2 2009 Plan |
$ | 1,176 | $ | (1,025 | ) | $ | 151 | |||||
| Q3 2009 Plan |
||||||||||||
| Severance and benefits | $ | 53 | $ | (34 | ) | $ | 19 | |||||
| Facilities | 573 | (216 | ) | 357 | ||||||||
| Total Q3 2009 Plan |
$ | 626 | $ | (250 | ) | $ | 376 | |||||
| Q4 2009 Plan |
||||||||||||
| Severance and benefits | $ | 759 | $ | (364 | ) | $ | 395 | |||||
| Facilities | — | — | — | |||||||||
| Total Q4 2009 Plan |
$ | 759 | $ | (364 | ) | $ | 395 | |||||
| Total 2009 |
||||||||||||
| Severance and benefits | $ | 3,129 | $ | (2,667 | ) | $ | 462 | |||||
| Facilities | 737 | (267 | ) | 470 | ||||||||
| Total 2009 |
$ | 3,866 | $ | (2,934 | ) | $ | 932 | |||||
Severance and Benefits
During 2009, the restructuring plans included a reduction of headcount of approximately 100 employees for the year ending December 31, 2009. As a result of these plans, the Company recorded a restructuring charge of $3.1 million for severance and severance-related costs in its consolidated statement of operations for the year ended December 31, 2009. As of December 31, 2009, the Company has a remaining severance and benefits liability of $462,000. This amount is reflected as “Accounts Payable and Accrued Expenses” in the condensed consolidated balance sheet.
Facilities
During 2009, the restructuring plans included the consolidation of one office location and the closure of two office locations. As a result of these plans, the Company recorded a restructuring charge of $737,000 for facilities
F-34
Table of Contents
in its consolidated statement of operations for the year ended December 31, 2009. As of December 31, 2009, the Company has a remaining facility liability of $470,000 which is expected to be settled over the next two years. This amount is reflected as “Accounts Payable and Accrued Expenses” of $431,000 and “Other Long-Term Liabilities” of $39,000 in the condensed consolidated balance sheet.
2008 Restructuring Activity
During the second quarter of 2008, management implemented a restructuring plan to eliminate certain positions to realign the Company’s cost structure. As a result of this plan, the Company recorded a charge of $914,000 for severance and severance-related costs as a restructuring charge in its consolidated statement of operations for the year ended December 31, 2008. As of December 31, 2008, the Company had no remaining severance and benefits liability. Additionally during the second quarter of 2008, the Company recorded $66,000 as a restructuring charge in its consolidated statement of operations relating to the closure of one office location and the reduction of space at a second office location. All amounts related to these facilities charges have been paid as of December 31, 2008.
17. COMMITMENTS AND CONTINGENCIES
Office Space Leases—The Company leases office space under noncancelable operating leases, a number of which contain renewal options and escalation clauses. Rent expense was approximately $7.2 million, $7.6 million, and $7.1 million for the years ended December 31, 2009, 2008, and 2007, respectively. The Company does not sublease any of its leased space.
As of December 31, 2009, the future minimum operating lease payments are summarized in the table below as follows (in thousands):
| Years Ending December 31, |
|||
| 2010 |
$ | 7,032 | |
| 2011 |
5,870 | ||
| 2012 |
1,508 | ||
| 2013 |
88 | ||
| 2014 |
— | ||
| Thereafter |
— | ||
| Total |
$ | 14,498 | |
In accordance with ASC 840, Leases, the Company recognizes its rent expense on a straight-line basis over the life of the respective lease arrangement regardless of when the payments are due resulting in a deferred rent liability mainly from escalating base rents. At December 31, 2009 and 2008, the long term deferred rent liability was $1.0 million and $1.8 million, respectively.
Other Matters—The Company is involved in claims and legal proceedings arising from normal business operations. The Company does not expect these matters, individually or in the aggregate, to have a material impact on the Company’s financial condition, results of operations or cash flows.
During 2008, the Company was involved in a claim and legal proceeding arising from its normal operations. On March 20, 2008, the parties resolved all issues between them, which included an agreement to dismiss the legal proceeding with prejudice.
At December 31, 2009 and 2008, the Company was contingently liable under open standby letters of credit and bank guarantees issued under the Amended Credit Agreement (see Note 9, Debt) by the Company’s banks in favor of third parties. These letters of credit and bank guarantees primarily relate to real estate lease obligations and totaled $877,000 and $896,000 at December 31, 2009 and 2008, respectively. These instruments had not been drawn on by third parties at December 31, 2009 or 2008.
F-35
Table of Contents
Guarantees—The Company provides indemnifications to customers against intellectual property infringement claims made by third parties arising from the use of the Company’s software products. Due to the nature of the indemnifications provided, the Company cannot estimate the fair value nor determine the total nominal amount of the indemnifications, if any. Estimated losses for such indemnifications are evaluated under ASC 450, as interpreted by ASC 460, Guarantees. The Company has secured copyright registrations for its own software products with the U.S. Patent and Trademark Office, and is provided intellectual property infringement indemnifications from its third-party partners whose technology may be embedded or otherwise bundled with the Company’s software products. Therefore, the Company considers the probability of an unfavorable outcome in an intellectual property infringement case relatively low. The Company has not encountered material costs as a result of such obligations and has not accrued any liabilities related to such indemnifications.
Product Warranty—The Company’s standard software license agreement includes a warranty provision for software products. The Company generally warrants for a period of up to one year after delivery that the software shall operate substantially as stated in the then current documentation provided that the software is used in a supported computer system. The Company provides for the estimated cost of product warranties based on specific warranty claims, provided that it is probable that a liability exists and provided the amount can be reasonably estimated. To date, the Company has not had any material costs associated with these warranties.
18. SEGMENT INFORMATION
The Company operates as one reportable segment as the Company’s principal business activity relates to selling project-based software solutions and implementation services. The Company’s chief operating decision maker, the Chief Executive Officer, evaluates the performance of the Company as one consolidated unit based upon software license fee revenues, consulting services, maintenance revenues, and operating costs.
The Company’s products and services are sold primarily in the United States, but also include sales through direct and indirect sales channels in other countries, primarily in Canada, South Africa, Australia and the United Kingdom. For the year ended December 31, 2009, less than 6% of the Company’s revenues were generated from sales outside of the United States. Less than 5% of the Company’s revenues were generated from sales outside of the United States for the years ended December 31, 2008 and 2007. As of December 31, 2009 and 2008, the Company had $4.0 and $3.0 million, respectively, of long-lived assets held outside of the United States.
No single customer accounted for more than 10% of the Company’s revenue for the years ended December 31, 2009, 2008 and 2007.
F-36
Table of Contents
19. SUPPLEMENTAL QUARTERLY FINANCIAL INFORMATION (unaudited)
Summarized quarterly supplemental consolidated financial information for 2009 and 2008 are as follows (in thousands, except per share amounts):
| Quarter Ended, | ||||||||||||
| March 31 | June 30 | September 30 | December 31 | |||||||||
| 2009 |
||||||||||||
| Total revenues |
$ | 61,993 | $ | 69,369 | $ | 64,114 | $ | 70,345 | ||||
| Gross profit |
$ | 37,505 | $ | 41,260 | $ | 40,681 | $ | 47,489 | ||||
| Net income |
$ | 2,654 | $ | 4,901 | $ | 6,607 | $ | 7,234 | ||||
| Basic income per share (a) |
$ | 0.06 | $ | 0.09 | $ | 0.10 | $ | 0.11 | ||||
| Shares used in basic per share computation (a) |
46,672 | 52,394 | 63,611 | 64,144 | ||||||||
| Diluted income per share (a) |
$ | 0.06 | $ | 0.09 | $ | 0.10 | $ | 0.11 | ||||
| Shares used in diluted per share computation (a) |
47,290 | 52,914 | 64,808 | 65,411 | ||||||||
| 2008 |
||||||||||||
| Total revenues |
$ | 69,354 | $ | 77,365 | $ | 70,950 | $ | 71,696 | ||||
| Gross profit |
$ | 41,752 | $ | 46,812 | $ | 45,524 | $ | 46,811 | ||||
| Net income |
$ | 4,021 | $ | 5,423 | $ | 8,025 | $ | 6,050 | ||||
| Basic income per share (a) |
$ | 0.09 | $ | 0.12 | $ | 0.17 | $ | 0.13 | ||||
| Shares used in basic per share computation (a) |
46,502 | 46,552 | 46,586 | 46,641 | ||||||||
| Diluted income per share (a) |
$ | 0.08 | $ | 0.11 | $ | 0.17 | $ | 0.13 | ||||
| Shares used in diluted per share computation (a) |
47,851 | 47,692 | 47,605 | 47,199 | ||||||||
| (a) | In accordance with ASC 260, for the purpose of computing the basic and diluted number of shares, the number of weighted average common shares outstanding prior to June 1, 2009 was retroactively adjusted by a factor of 1.08 to reflect the impact of the bonus element associated with the common stock rights offering that was completed in June 2009. |
| (b) | No cash dividends have been declared or paid in any period presented. |
F-37
Table of Contents
INDEX TO EXHIBITS
| Exhibit |
Description of Documents | |
| 2.1 |
Recapitalization Agreement, effective as of December 23, 2004, by and among New Mountain Partners II, L.P., New Mountain Affiliated Investors II, L.P., Allegheny New Mountain Partners, L.P., Deltek Systems, Inc., the shareholders of Deltek Systems, Inc. and Kenneth E. deLaski, as shareholders’ representative, as amended March 14, 2005 and April 21, 2005 (incorporated by reference to Exhibits 2.1, 2.2 and 2.3 from the Registrant’s Registration Statement on Form S-1 (333-142737) filed on May 8, 2007) | |
| 2.2 |
Advisory Agreement, dated as of April 22, 2005, between Deltek Systems, Inc. and New Mountain Capital, L.L.C. (incorporated by reference to Exhibit 2.4 from the Registrant’s Registration Statement on Form S-1 (333-142737) filed on May 8, 2007) | |
| 2.3 |
Advisory Fee Waiver Letter, dated as of September 26, 2007, between Deltek, Inc. and New Mountain Capital, L.L.C (incorporated by reference to Exhibit 2.5 from the Registrant’s Registration Statement on Form S-1 (333-142737) filed on October 15, 2007) | |
| 3.1 |
Certificate of Incorporation of Deltek, Inc. (incorporated by reference to Exhibit 3.1 from the Registrant’s Registration Statement on Form S-1 (333-142737) filed on May 8, 2007) | |
| 3.2 |
Amended and Restated Bylaws of Deltek, Inc. ** | |
| 4.1 |
Specimen Common Stock Certificate (incorporated by reference to Exhibit 4.1 from the Registrant’s Registration Statement on Form S-1 (333-142737) filed on May 8, 2007) | |
| 4.2 |
Specimen Class A Common Stock Certificate (incorporated by reference to Exhibit 4.2 from the Registrant’s Registration Statement on Form S-1 (333-142737) filed on May 8, 2007) | |
| 4.3 |
Investor Rights Agreement, dated as of April 22, 2005, by and among Deltek Systems, Inc., New Mountain Partners II, L.P., New Mountain Affiliated Investors II, L.P., Allegheny New Mountain Partners, L.P. and the persons listed on the signature pages thereto, as amended August 10, 2007 (incorporated by reference to Exhibit 4.3 from the Registrant’s Registration Statement on Form S-1 (333-142737) filed on May 8, 2007 and Exhibit 4.6 from the Registrant’s Registration Statement on Form S-1 (333-142737) filed on August 21, 2007) | |
| 4.4 |
Management Rights Letters, dated April 22, 2005, between New Mountain Partners II, L.P. and Deltek Systems, Inc. and between Allegheny New Mountain Partners, L.P. and Deltek Systems, Inc. (incorporated by reference to Exhibits 4.4 and 4.5 from the Registrant’s Registration Statement on Form S-1 (333-142737) filed on May 8, 2007) | |
| 9.1 |
Shareholders’ Agreement, dated as of April 22, 2005, among Deltek Systems, Inc., the deLaski Shareholders and the persons listed on the signature pages thereto (and for purposes of Sections 3.3 and 3.4, New Mountain Partners II, L.P., New Mountain Affiliated Investors II, L.P. and Allegheny New Mountain Partners, L.P.) (incorporated by reference to Exhibit 9.1 from the Registrant’s Registration Statement on Form S-1 (333-142737) filed on May 8, 2007) | |
| 9.2 |
Form of Joinder Agreement to Shareholders’ Agreement (incorporated by reference to Exhibit 9.2 from the Registrant’s Registration Statement on Form S-1 (333-142737) filed on May 8, 2007) | |
| 9.3 |
Form of Director Shareholder’s Agreement (incorporated by reference to Exhibit 9.3 from the Registrant’s Registration Statement on Form S-1 (333-142737) filed on May 8, 2007) | |
| 9.4 |
Form of 2005 Optionee Shareholder’s Agreement (incorporated by reference to Exhibit 9.4 from the Registrant’s Registration Statement on Form S-1 (333-142737) filed on August 21, 2007) | |
| 9.5 |
Joinder Agreement to the Shareholder’s Agreement between Kevin T. Parker and Deltek Systems, Inc., dated December 29, 2005 (incorporated by reference to Exhibit 9.5 from the Registrant’s Registration Statement on Form S-1 (333-142737) filed on May 8, 2007) | |
Table of Contents
| Exhibit |
Description of Documents | |
| 9.6 |
Amendment No. 1 to Shareholder’s Agreement between Deltek Systems, Inc. and Joseph M. Kampf, dated September 14, 2006 (incorporated by reference to Exhibit 9.6 from the Registrant’s Registration Statement on Form S-1 (333-142737) filed on May 8, 2007) | |
| 9.7 |
Form of 2007 Optionee Shareholder’s Agreement (incorporated by reference to Exhibit 9.7 from the Registrant’s Registration Statement on Form S-1 (333-142737) filed on August 21, 2007) | |
| 9.8 |
Form of Amendment to Director Shareholder’s Agreement (incorporated by reference to Exhibit 9.8 from the Registrant’s Registration Statement on Form S-1 (333-142737) filed on August 21, 2007) | |
| 9.9 |
Form of Amendment No. 1 to the Shareholder’s Agreement (incorporated by reference to Exhibit 9.9 from the Registrant’s Registration Statement on Form S-1 (333-142737) filed on August 21, 2007) | |
| 10.1 |
Summary of Employee Incentive Compensation Plan (incorporated by reference to Exhibit 10.1 from the Registrant’s Registration Statement on Form S-1 (333-142737) filed on October 15, 2007) | |
| 10.2 |
2007 Stock Incentive and Award Plan (incorporated by reference to Exhibit 10.2 from the Registrant’s Registration Statement on Form S-1 (333-142737) filed on August 21, 2007) | |
| 10.3 |
Amended and Restated 2005 Stock Option Plan (incorporated by reference to Exhibit 10.3 from the Registrant’s Registration Statement on Form S-1 (333-142737) filed on May 8, 2007) | |
| 10.4 |
Deltek, Inc. Amended and Restated Employee Stock Purchase Plan (incorporated by reference to Exhibit 4.4 from the Registrant’s Registration Statement on Form S-8 (333-165099) filed on February 26, 2010) | |
| 10.5 |
Employment Agreement between Kevin T. Parker and Deltek Systems, Inc., dated June 16, 2005, as amended April 7, 2007 (incorporated by reference to Exhibit 10.6 from the Registrant’s Registration Statement on Form S-1 (333-142737) filed on May 8, 2007 and Exhibit 10.68 from the Registrant’s Registration Statement on Form S-1 (333-142737) filed on August 21, 2007) | |
| 10.6 |
Employment Offer Letter between David R. Schwiesow and Deltek Systems, Inc., dated May 8, 2006, as amended May 2, 2007 (incorporated by reference to Exhibit 10.12 from the Registrant’s Registration Statement on Form S-1 (333-142737) filed on May 8, 2007 and Exhibit 10.76 from the Registrant’s Registration Statement on Form S-1 (333-142737) filed on August 21, 2007) | |
| 10.7 |
Employment Offer Letter between William D. Clark and Deltek Systems, Inc., dated October 6, 2005, as amended May 2, 2007 (incorporated by reference to Exhibit 10.17 from the Registrant’s Registration Statement on Form S-1 (333-142737) filed on May 8, 2007 and Exhibit 10.73 from the Registrant’s Registration Statement on Form S-1 (333-142737) filed on August 21, 2007) | |
| 10.8 |
Employment Offer Letter between Carolyn J. Parent and Deltek Systems, Inc., dated February 8, 2006 (incorporated by reference to Exhibit 10.25 from the Registrant’s Registration Statement on Form S-1 (333-142737) filed on May 8, 2007) | |
| 10.9 |
Employment Offer Letter between Holly C. Kortright and Deltek Systems, Inc., dated September 25, 2006, as amended May 2, 2007 (incorporated by reference to Exhibit 10.29 from the Registrant’s Registration Statement on Form S-1 (333-142737) filed on May 8, 2007 and Exhibit 10.74 from the Registrant’s Registration Statement on Form S-1 (333-142737) filed on August 21, 2007) | |
| 10.10 |
Form of Stock Option Agreement issued under the Amended and Restated 2005 Stock Option Plan (incorporated by reference to Exhibit 10.32 from the Registrant’s Registration Statement on Form S-1 (333-142737) filed on May 8, 2007) | |
| 10.11 |
Form of Director Stock Option Agreement (four-year-vesting) issued under the Amended and Restated 2005 Stock Option Plan (incorporated by reference to Exhibit 10.41 from the Registrant’s Registration Statement on Form S-1 (333-142737) filed on May 8, 2007) | |
Table of Contents
| Exhibit |
Description of Documents | |
| 10.12 |
Form of Amendment to Director Stock Option Agreement (incorporated by reference to Exhibit 10.42 from the Registrant’s Registration Statement on Form S-1 (333-142737) filed on May 8, 2007) | |
| 10.13 |
Form of Director Stock Option Agreement issued under the Amended and Restated 2005 Stock Option Plan (one-year vesting) (incorporated by reference to Exhibit 10.43 from the Registrant’s Registration Statement on Form S-1 (333-142737) filed on May 8, 2007) | |
| 10.14 |
Form of Stock Option Agreements for Director (four-year vesting) and Employee issued pursuant to the Deltek, Inc. 2007 Stock and Incentive Award Plan (incorporated by reference to Exhibit 10.84 from the Registrant’s Registration Statement on Form S-1 (333-142737) filed on August 21, 2007) | |
| 10.15 |
Form of Director Stock Option Agreement (one-year vesting) issued pursuant to the Deltek, Inc. 2007 Stock and Incentive Award Plan ** | |
| 10.16 |
Form of Officer Stock Option Agreement issued pursuant to the Deltek, Inc. 2007 Stock and Incentive Award Plan ** | |
| 10.17 |
Form of Officer Restricted Stock Agreement (four-year vesting) issued pursuant to the Deltek, Inc. 2007 Stock and Incentive Award Plan ** | |
| 10.18 |
Form of Officer Restricted Stock Agreement (two-year vesting) issued pursuant to the Deltek, Inc. 2007 Stock and Incentive Award Plan ** | |
| 10.19 |
Non-Competition Agreement, dated as of February 8, 2006, between Carolyn J. Parent and Deltek Systems, Inc. (incorporated by reference to Exhibit 10.44 from the Registrant’s Registration Statement on Form S-1 (333-142737) filed on May 8, 2007) | |
| 10.20 |
Non-Competition Agreement, dated as of April 22, 2005, between Kenneth E. deLaski and Deltek Systems, Inc. (incorporated by reference to Exhibit 10.45 from the Registrant’s Registration Statement on Form S-1 (333-142737) filed on May 8, 2007) | |
| 10.21 |
Non-Competition Agreement, dated as of April 22, 2005, between Donald deLaski and Deltek Systems, Inc. (incorporated by reference to Exhibit 10.46 from the Registrant’s Registration Statement on Form S-1 (333-142737) filed on May 8, 2007) | |
| 10.22 |
Form of Share Price Adjustment Agreement (incorporated by reference to Exhibit 10.51 from the Registrant’s Registration Statement on Form S-1 (333-142737) filed on May 8, 2007) | |
| 10.23 |
Amendment and Restatement Agreement, dated August 24, 2009, by and among Deltek, Inc., as borrower, the lender signatories thereto and Credit Suisse, as lender, lead arranger and administrative agent (incorporated by reference to Exhibit 99.1 from the Registrant’s Current Report on Form 8-K (Commission File Number 001-33772) filed on August 24, 2009) | |
| 10.24 |
Amended and Restated Credit Agreement, dated August 24, 2009, by and among Deltek, Inc., as borrower, the lender signatories thereto and Credit Suisse, as lender, lead arranger and administrative agent (incorporated by reference to Exhibit 99.2 from the Registrant’s Current Report on Form 8-K (Commission File Number 001-33772) filed on August 24, 2009) | |
| 10.25 |
Guarantee and Collateral Agreement, dated as of April 22, 2005, among Deltek Systems, Inc., the subsidiaries of Deltek Systems, Inc. signatories thereto and Credit Suisse First Boston, as collateral agent (incorporated by reference to Exhibit 10.59 from the Registrant’s Registration Statement on Form S-1 (333-142737) filed on May 8, 2007) | |
| 10.26 |
Supplement No. 1 to Guarantee and Collateral Agreement, dated as of October 3, 2005, among Deltek Systems, Inc., the subsidiary guarantors signatory thereto and Credit Suisse, as collateral agent (incorporated by reference to Exhibit 10.60 from the Registrant’s Registration Statement on Form S-1 (333-142737) filed on May 8, 2007) | |
Table of Contents
| Exhibit |
Description of Documents | |
| 10.27 |
Supplement No. 2 to Guarantee and Collateral Agreement, dated as of March 17, 2006, among Deltek Systems, Inc., the subsidiary guarantors signatory thereto and Credit Suisse First Boston as collateral agent (incorporated by reference to Exhibit 10.61 from the Registrant’s Registration Statement on Form S-1 (333-142737) filed on May 8, 2007) | |
| 10.28 |
Supplement No. 3 to Guarantee and Collateral Agreement, dated as of July 24, 2006, among Deltek Systems, Inc., the subsidiary guarantors signatory thereto and Credit Suisse, as collateral agent (incorporated by reference to Exhibit 10.62 from the Registrant’s Registration Statement on Form S-1 (333-142737) filed on May 8, 2007) | |
| 10.29 |
Subsidiary Trademark Security Agreement, dated as of July 21, 2006 between C/S Solutions, Inc. as subsidiary guarantor and Credit Suisse, as collateral agent (incorporated by reference to Exhibit 10.64 from the Registrant’s Registration Statement on Form S-1 (333-142737) filed on May 8, 2007) | |
| 10.30 |
Subsidiary Trademark Security Agreement, dated as of May 1, 2006 between WST Corporation as subsidiary guarantor and Credit Suisse, as collateral agent (incorporated by reference to Exhibit 10.65 from the Registrant’s Registration Statement on Form S-1 (333-142737) filed on May 8, 2007) | |
| 10.31 |
Subsidiary Trademark Security Agreement, dated as of October 14, 2005 between Wind2 Software, Inc., as subsidiary guarantor and Credit Suisse, as collateral agent (incorporated by reference to Exhibit 10.66 from the Registrant’s Registration Statement on Form S-1 (333-142737) filed on May 8, 2007) | |
| 10.32 |
Subsidiary Copyright Security Agreement, dated as of October 14, 2005 between Wind2 Software, Inc., as subsidiary guarantor and Credit Suisse, as collateral agent (incorporated by reference to Exhibit 10.67 from the Registrant’s Registration Statement on Form S-1 (333-142737) filed on May 8, 2007) | |
| 10.33 |
Employment Letter Agreement between Richard P. Lowrey and Deltek, Inc., dated May 2, 2007 (incorporated by reference to Exhibit 10.70 from the Registrant’s Registration Statement on Form S-1 (333-142737) filed on August 21, 2007) | |
| 10.34 |
Employment Letter Agreement between Eric Brehm and Deltek, Inc., dated May 2, 2007 (incorporated by reference to Exhibit 10.71 from the Registrant’s Registration Statement on Form S-1 (333-142737) filed on August 21, 2007) | |
| 10.35 |
Employment Letter Agreement between Carolyn J. Parent and Deltek, Inc., dated May 2, 2007 (incorporated by reference to Exhibit 10.72 from the Registrant’s Registration Statement on Form S-1 (333-142737) filed on August 21, 2007) | |
| 10.36 |
Employment Offer Letter between Garland T. Hall and Deltek, Inc., dated September 18, 2008 (incorporated by reference to Exhibit 10.91 from the Registrant’s Annual Report on Form 10-K (Commission File Number 001-33772) filed on March 13, 2009) | |
| 10.37 |
Transaction Fee Waiver Letter, dated as of April 24, 2009, between Deltek, Inc. and New Mountain Capital, L.L.C. (incorporated by reference to Exhibit 10.93 from the Registrant’s Registration Statement on Form S-3 (333-158388) filed on April 30, 2009) | |
| 10.38 |
Letter Agreement, dated as of April 28, 2009, between Deltek, Inc. and New Mountain Capital, L.L.C. (incorporated by reference to Exhibit 10.94 from the Registrant’s Registration Statement on Form S-3 (333-158388) filed on April 30, 2009) | |
| 10.39 |
Employment Letter, dated May 5, 2008 between Deltek, Inc. and Mark Wabschall (incorporated by reference to Exhibit 99.1 from the Registrant’s Current Report on Form 8-K (Commission File Number 001-33772) filed on August 4, 2009) | |
| 10.40 |
Separation Agreement and Release, dated July 29, 2009 between Deltek, Inc. and Mark Wabschall (incorporated by reference to Exhibit 99.2 from the Registrant’s Current Report on Form 8-K (Commission File Number 001-33772) filed on August 4, 2009) | |
Table of Contents
| Exhibit |
Description of Documents | |
| 10.41 |
Employment Letter, dated June 27, 2008, between Deltek, Inc. and Michael Krone (incorporated by reference to Exhibit 99.1 from the Registrant’s Current Report on Form 8-K (Commission File Number 001-33772) filed on August 5, 2009) | |
| 10.42 |
Form of Executive Officer Waiver Agreement to Shareholders’ Agreement entered into among Deltek, Inc., New Mountain Capital and each Executive Officer of Deltek, Inc. (incorporated by reference to Exhibit 10.98 from the Registrant’s Quarterly Report on Form 10-Q (Commission File Number 001-33772) filed on August 7, 2009) | |
| 10.43 |
Waiver Letter Agreement, dated August 6, 2009, between Deltek, Inc. and New Mountain Capital (incorporated by reference to Exhibit 10.99 from the Registrant’s Quarterly Report on Form 10-Q (Commission File Number 001-33772) filed on August 7, 2009) | |
| 10.44 |
Donald deLaski Waiver Letter Agreement, dated October 30, 2009, between Deltek, Inc. and New Mountain Capital (incorporated by reference to Exhibit 99.1 from the Registrant’s Current Report on Form 8-K (Commission File Number 001-33772) filed on October 30, 2009) | |
| 10.45 |
Executive Officer Letter Agreement, dated October 30, 2009, between Deltek, Inc. and New Mountain Capital (incorporated by reference to Exhibit 99.2 from the Registrant’s Current Report on Form 8-K (Commission File Number 001-33772) filed on October 30, 2009) | |
| 10.46 |
Former Employee and other Stockholder Waiver Letter Agreement, dated October 30, 2009, between Deltek, Inc. and New Mountain Capital (incorporated by reference to Exhibit 99.3 from the Registrant’s Current Report on Form 8-K (Commission File Number 001-33772) filed on October 30, 2009) | |
| 10.47 |
Employment Letter, dated August 10, 2009, between Deltek, Inc. and James Dellamore (incorporated by reference to Exhibit 10.105 from the Registrant’s Quarterly Report on Form 10-Q (Commission File Number 001-33772) filed on November 6, 2009) | |
| 10.48 |
Employment Letter, dated September 30, 2009, between Deltek, Inc. and Deborah Fitzgerald (incorporated by reference to Exhibit 10.106 from the Registrant’s Quarterly Report on Form 10-Q (Commission File Number 001-33772) filed on November 6, 2009) | |
| 10.49 |
Employment Letter, dated December 10, 2009, between Deltek, Inc. and Michael Corkery (incorporated by reference to Exhibit 99.1 from the Registrant’s Current Report on Form 8-K (Commission File Number 001-33772) filed on December 17, 2009) | |
| 10.50 |
Kevin Parker Waiver Letter Agreement, dated December 15, 2009, between Deltek, Inc. and New Mountain Capital (incorporated by reference to Exhibit 99.1 from the Registrant’s Current Report on Form 8-K (Commission File Number 001-33772) filed on December 15, 2009) | |
| 10.51 |
Directors Waiver Letter Agreement, dated December 15, 2009, between Deltek, Inc. and New Mountain Capital (incorporated by reference to Exhibit 99.2 from the Registrant’s Current Report on Form 8-K (Commission File Number 001-33772) filed on December 15, 2009) | |
| 10.52 |
Amendment dated December 15, 2009, to the Former Employee and other Stockholder Waiver Letter Agreement, dated October 30, 2009, between Deltek, Inc. and New Mountain Capital (incorporated by reference to Exhibit 99.3 from the Registrant’s Current Report on Form 8-K (Commission File Number 001-33772) filed on December 15, 2009) | |
| 14.1 |
Deltek, Inc. Code of Business Conduct and Ethics ** | |
| 21.1 |
Subsidiaries of Deltek, Inc. ** | |
| 23.1 |
Consent of Deloitte & Touche, LLP, Independent Registered Public Accounting Firm ** | |
| 31.1 |
Certification of Principal Executive Officer required by Rule 13a-14(a) or Rule 15d-14(a) of the Securities Exchange Act of 1934, as adopted pursuant to Section 302 of the Sarbanes-Oxley Act of 2002 ** | |
Table of Contents
| Exhibit |
Description of Documents | |
| 31.2 |
Certification of Principal Financial Officer required by Rule 13a-14(a) or Rule 15d-14(a) of the Securities Exchange Act of 1934, as adopted pursuant to Section 302 of the Sarbanes-Oxley Act of 2002 ** | |
| 32.1 |
Certification of Chief Executive Officer and Chief Financial Officer pursuant to 18 U.S.C. Section 1350, as adopted pursuant to Section 906 of the Sarbanes-Oxley Act of 2002 ** | |
| ** | Filed herewith |