Attached files
Table of Contents
UNITED STATES
SECURITIES AND EXCHANGE COMMISSION
Washington, D.C. 20549
FORM 10-K
(Mark One)
| x | ANNUAL REPORT PURSUANT TO SECTION 13 OR 15(d) OF THE SECURITIES EXCHANGE ACT OF 1934 |
For the fiscal year ended December 31, 2009
OR
| ¨ | TRANSITION REPORT PURSUANT TO SECTION 13 OR 15(d) OF THE SECURITIES EXCHANGE ACT OF 1934 |
For the transition period from to .
Commission file number 000-50947
COGENT, INC.
(Exact name of registrant as specified in its charter)
| Delaware | 95-4305768 | |
| (State or other jurisdiction of incorporation or organization) |
(I.R.S. Employer Identification No.) |
639 North Rosemead Blvd.
Pasadena, California 91107
(Address of principal executive offices)
Registrant’s telephone number, including area code: (626) 325-9600
Securities registered pursuant to Section 12(b) of the Act: Common Stock
(Title of Class)
Securities registered pursuant to Section 12(g) of the Act: None
Indicate by check mark if the registrant is a well-known seasoned issuer, as defined in Rule 405 of the Securities Act. Yes ¨ No þ
Indicate by check mark if the registrant is not required to file reports pursuant to Section 13 or Section 15(d) of the Act. Yes ¨ No þ
Indicate by check mark whether the registrant: (1) has filed all reports required to be filed by Section 13 or 15(d) of the Securities Exchange Act of 1934 during the preceding 12 months (or for such shorter period that the registrant was required to file such reports), and (2) has been subject to such filing requirements for the past 90 days. Yes þ No ¨
Indicate by check mark whether the registrant has submitted electronically and posted on its corporate Web site, if any, every Interactive Data File required to be submitted and posted pursuant to Rule 405 of Regulation S-T during the preceding 12 months (or for such shorter period that the registrant was required to submit and post such files). Yes ¨ No ¨
Indicate by check mark if disclosure of delinquent filers pursuant to Item 405 of Regulation of S-K is not contained herein, and will not be contained, to the best of the registrant’s knowledge, in definitive proxy or information statements incorporated by reference in Part III of this Form 10-K or any amendment to this Form 10-K þ
Indicate by check mark whether the registrant is a large accelerated filer, an accelerated filer, a non-accelerated filer, or a smaller reporting company. See the definitions of “large accelerated filer,” “accelerated filer” and “smaller reporting company” in Rule 12b-2 of the Exchange Act.
| Large accelerated filer ¨ | Accelerated filer þ | |
| Non-accelerated filer ¨ (Do not check if a smaller reporting company) |
Smaller reporting company ¨ |
Indicate by check mark whether the registrant is a shell company (as defined in Rule 12b-2 of the Exchange Act). Yes ¨ No þ
The aggregate market value of the voting and non-voting common equity held by non-affiliates of the registrant as of the last business day of the registrant’s most recently completed second fiscal quarter, based upon the closing sale price of the registrant’s common stock on June 30, 2009 (the last trading day in the second calendar quarter of 2009) as reported on the NASDAQ Global Select Market was $501,079,830.*
As of February 24, 2010, there were 89,553,152 shares of the registrant’s Common Stock outstanding.
| * | Excludes shares of Common Stock held by executive officers, directors and stockholders whose ownership exceeds 5% of the shares outstanding at June 30, 2009. This calculation does not reflect a determination that such persons are affiliates for any other purposes. |
DOCUMENTS INCORPORATED BY REFERENCE
Portions of the registrant’s definitive proxy statement to be filed with the Commission pursuant to Regulation 14A in connection with the registrant’s 2010 Annual Meeting of Stockholders (the “Proxy Statement”) or portions of the registrant’s 10-K/A, to be filed subsequent to the date hereof, are incorporated by reference into Part III of this Report. Such Proxy Statement or 10-K/A will be filed with the Commission not later than 120 days after the conclusion of the registrant’s fiscal year ended December 31, 2009.
Table of Contents
Form 10-K
For the Fiscal Year Ended December 31, 2009
Table of Contents
| 1 | ||||
| Item 1. |
1 | |||
| Item 1A. |
16 | |||
| Item 1B. |
27 | |||
| Item 2. |
27 | |||
| Item 3. |
27 | |||
| Item 4. |
27 | |||
| 28 | ||||
| Item 5. |
28 | |||
| Item 6. |
31 | |||
| Item 7. |
Management’s Discussion and Analysis of Financial Condition and Results of Operations |
32 | ||
| Item 7A. |
48 | |||
| Item 8. |
49 | |||
| Item 9. |
Changes in and Disagreements with Accountants on Accounting and Financial Disclosure |
49 | ||
| Item 9A. |
49 | |||
| Item 9B. |
51 | |||
| 52 | ||||
| Item 10. |
52 | |||
| Item 11. |
52 | |||
| Item 12. |
Security Ownership of Certain Beneficial Owners and Management and Related Stockholder Matters |
52 | ||
| Item 13. |
Certain Relationships and Related Transactions, and Director Independence |
52 | ||
| Item 14. |
52 | |||
| 53 | ||||
| Item 15. |
53 | |||
TRADEMARKS
We have registered U.S. trademarks for Cogent, Cogent Systems, BlueCheck, Live-ID, Fusion and PMA. Each trademark, trade name or service mark of another company appearing in this Annual Report on Form 10-K belongs to its holder, and does not belong to us.
Table of Contents
This Annual Report (including the following section regarding Management’s Discussion and Analysis of Financial Condition and Results of Operations) contains forward-looking statements regarding our business, financial condition, results of operations and prospects. Words such as “expects,” “anticipates,” “intends,” “plans,” “believes,” “seeks,” “estimates” and similar expressions or variations of such words are intended to identify forward-looking statements, but are not the exclusive means of identifying forward-looking statements in this Annual Report. Additionally, statements concerning future matters such as the development of new products, sales levels, expense levels and other statements regarding matters that are not historical are forward-looking statements.
Although forward-looking statements in this Annual Report reflect the good faith judgment of our management, such statements can only be based on facts and factors currently known by us. Consequently, forward-looking statements are inherently subject to risks and uncertainties and actual results and outcomes may differ materially from the results and outcomes discussed in or anticipated by the forward-looking statements. Factors that could cause or contribute to such differences in results and outcomes include without limitation those discussed under the heading “Risk Factors” below, as well as those discussed elsewhere in this Annual Report. Readers are urged not to place undue reliance on these forward-looking statements, which speak only as of the date of this Annual Report. We undertake no obligation to revise or update any forward-looking statements in order to reflect any event or circumstance that may arise after the date of this Annual Report. Readers are urged to carefully review and consider the various disclosures made in this Annual Report, which attempt to advise interested parties of the risks and factors that may affect our business, financial condition, results of operations and prospects.
We were incorporated in California in April 1990 and reincorporated in Delaware in May 2004.
Overview
We are a leading provider of Automated Fingerprint Identification Systems, or AFIS, and other fingerprint biometrics solutions to governments, law enforcement agencies and other organizations worldwide. Our AFIS solutions enable customers to capture fingerprint images electronically, encode fingerprints into searchable files and accurately compare a set of fingerprints to a database of potentially millions of fingerprints in seconds. For nearly twenty years, we have researched, designed and developed fingerprint biometric technologies that incorporate advanced concepts in fluid dynamics, neural networks, image enhancement, data mining and massively parallel processing. Our proprietary software algorithms, together with optimized hardware, enable our customers to cost-effectively achieve what we believe to be industry-leading accuracy rates and performance. We support the latest standards in fingerprint biometrics and have based our systems on cost-effective, industry-standard hardware and software platforms. We are focused on enabling our customers to expand the capabilities of their systems as their biometrics needs evolve.
Industry Background
Authentication and Identification of Individuals Plays an Important Role in Society
Effectively authenticating and identifying individuals is critical to the safety and integrity of transactions, communications, travel and life in today’s society. Security breaches and frauds resulting from failures in authentication and identification systems can cause economic harm and loss of life. As a result of growing public awareness of security and economic risks, people are becoming increasingly willing to submit to security checks and other identity verification procedures. Authentication of an individual’s identity is necessary when governments, law enforcement agencies and other organizations need to confirm that an individual is who he claims to be. This necessity arises, for example, when a traveler enters a foreign country, a citizen votes, a
1
Table of Contents
suspect is arrested, an individual withdraws money from an ATM, a consumer purchases an item on the Internet or an employee seeks access to a restricted area. To authenticate the individual’s claimed identity in these types of scenarios, organizations traditionally implement processes to examine the individual’s credentials, such as signatures, drivers’ licenses, passports, access cards, PINs or passwords. If the authentication process indicates that the credentials are invalid or if there are no credentials to examine, such as when an unknown person leaves evidence of fingerprints, known as latents, at a crime scene, organizations frequently initiate an identification process to determine the individual’s identity.
Traditional Authentication and Identification Processes are Inadequate
Traditional processes for authenticating and identifying individuals have inherent weaknesses. Criminals and imposters can easily compromise these processes by falsifying credentials by forging a signature, altering a photograph on a driver’s license or passport or stealing a physical access card. Imposters can use the compromised credentials to gain unauthorized access to physical locations, such as buildings and airplanes, and to confidential information, such as medical data and financial records, and cause significant harm. Traditional authentication and identification methodologies can also be cumbersome and inefficient to use. Individuals are required to remember several passwords and PINs for the multitude of access, credit and membership cards they carry. The costs incurred by organizations to administer these traditional processes can be significant.
Evolution of Biometric Authentication and Identification Processes
The inadequacies of traditional authentication and identification processes, coupled with more stringent security requirements and an increasingly global economy and mobile population, have in recent years contributed to the increased focus on the development of biometrics. Biometrics is the automated use of unique physiological characteristics of individuals, such as fingerprints, palm prints, faces or irises, to determine or verify an individual’s identity. The individual’s biometric characteristic is captured and encoded and then compared against previously encoded biometric data stored in an electronic database to determine or verify the individual’s identity. Because biometrics technology utilizes an unchanging, unique characteristic of a person that cannot be lost, stolen, shared or forgotten, it has the capability to be more accurate, convenient and cost-effective than traditional methodologies.
Fingerprints have been, and we believe will continue to be, the most widely used biometric because they are relatively simple to capture, either voluntarily or from latents at crime scenes, are relatively non-intrusive and benefit from a substantial existing infrastructure that employs fingerprints for identification. Governments and law enforcement agencies around the world have already created vast databases of fingerprints and the American National Standard Institute and the National Institute of Standards and Technology have standardized a common format, called ANSI/NIST, which is used to describe, classify and share fingerprints. According to the FBI, its criminal database alone contains the fingerprints of more than 60 million individuals. In addition, the United States Department of Homeland Security database contained the fingerprints of over 110 million individuals at the end of 2009. Other organizations throughout the world, including foreign governments and law enforcement agencies, other U.S. government agencies such as the Department of State, and the approximately 15,000 state and local law enforcement agencies in the United States, also have established large fingerprint databases, and these databases are continuing to grow.
Automated Fingerprint Identification Systems
The most pervasive, large-scale fingerprint biometrics technology implementations today are AFIS. AFIS are typically used to compare one person’s fingerprints against a large database of fingerprints. This is known as one-to-many matching. The technology for AFIS was originally developed by the FBI and Scotland Yard to facilitate criminal investigations, and AFIS have achieved widespread acceptance within national, state and local law enforcement agencies globally. AFIS are comprised of fingerprint input scanning devices and software and computers that encode, process and store electronic versions of fingerprints. Originally, the fingerprint input
2
Table of Contents
devices were scanners that uploaded rolled fingerprint images obtained by rolling all ten inked fingers, known as tenprints, from nail to nail on cards or from latents obtained at crime scenes. Today, electronic fingerprint scanners, known as live-scans, are also available to directly capture flat fingerprint images by pressing the finger onto an input device and submitting the fingerprints to an AFIS. After the fingerprints of the subject are captured, the AFIS encodes the unique features associated with fingerprint ridge endings or bifurcations, known as minutiae, into a data set that is submitted for matching. Most commonly, existing fingerprint biometric systems classify, or bin, the stored fingerprints using basic criteria such as loops and whorls. Using this approach, the search program disregards those portions of the database that are inconsistent with the classification of the subject’s fingerprints and only searches the relevant portions of the database.
AFIS deployments range widely in size, cost and complexity. In a local law enforcement deployment, the AFIS may be entirely contained within a single facility, with one or more fingerprint input devices attached to local computers, networked to a low-cost, small scale system capable of searching up to tens of thousands of records. As AFIS grow larger, they may consist of hundreds of fingerprint acquisition stations throughout a state or country and employ dedicated networks for transmission of biometric data and dozens of dedicated computers.
The diagram below represents a typical, full scale AFIS architecture:
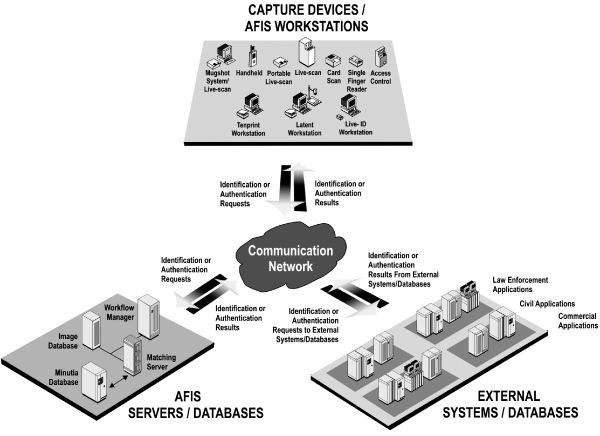
Growth Expected in the AFIS Market
The widespread deployment of AFIS and the development of biometric technologies to support the AFIS market have been among the biggest contributors to the growth of the biometrics industry. This growth is being driven by the increase in the worldwide demand for elevated security measures and a general increase in willingness for people to submit to security checks and other identity verification procedures. In response to this
3
Table of Contents
demand, the United States has increased spending on security measures. Governments worldwide are establishing agencies and departments focused on security, such as the formation of the Department of Homeland Security, or DHS, which integrated numerous existing agencies and formed a single department with the mission of protecting the United States against terrorism. Governments have also announced initiatives mandating heightened security measures and recommending or requiring the use of biometrics technology as part of the overall security solution. As a result, government agencies have indicated that they will make investments in information technology, including biometrics, to fulfill their missions.
The AFIS market is also poised for growth in its core law enforcement sector. Many of the approximately 15,000 state and local law enforcement agencies in the United States utilize AFIS solutions. Many of these law enforcement agencies are upgrading their AFIS based on the development of technology that enables new AFIS capabilities, such as 1,000 pixels per inch (ppi) resolution instead of the conventional 500 ppi resolution for better image quality. Many law enforcement agencies are also seeking to make their AFIS web-enabled and to enable their AFIS to search fingerprints using both flat and rolled methods and to search palm prints. We believe law enforcement agencies not currently using AFIS solutions are also likely to deploy such solutions to achieve faster response times and increased accuracy than they are achieving through existing methods.
Growth Expected in the Market for Other Fingerprint Biometrics Products and Solutions
In addition to AFIS, the market for other fingerprint biometrics solutions is expected to increase. Advances in AFIS technology and widespread deployment of AFIS are resulting in both increased public awareness and acceptance of biometrics solutions and the establishment of an infrastructure that we believe will expedite the adoption of other fingerprint biometrics solutions. As a result of the advances necessitated by the development of the AFIS market, fingerprint biometrics solutions have become much more sophisticated and capable of application in a number of other environments. Several initiatives requiring increased spending on other fingerprint biometrics solutions have already begun. For example, numerous foreign jurisdictions around the world have begun to establish national identification card programs, which will require the issuance of smart ID cards with embedded fingerprint information for each citizen. Foreign jurisdictions such as Hong Kong, Italy, Morocco, the United Kingdom and Thailand have implemented or are in the process of implementing national identification programs.
Governments, Law Enforcement Agencies and Other Organizations Face Challenges in Implementing Successful Fingerprint Biometrics Solutions
To satisfy the evolving needs of the market for other fingerprint biometrics solutions, vendors must deliver systems that achieve increasingly high levels of both accuracy and performance in a cost-effective and scalable manner. Many existing solutions are challenged in their ability to meet these needs because they are limited by the following problems:
| • | Inaccuracy. Accuracy rates of AFIS solutions are measured in two ways: detection failure rates and false positive rates. Detection failures occur when an AFIS fails to match a submitted fingerprint against a matching fingerprint in the database. A false positive occurs when a fingerprint is incorrectly matched to a fingerprint in the database. Many AFIS solutions have a relatively high detection failure rate, particularly when tenprints are not available, due to the use of binning and a limited ability to use fingerprints with poor image quality. Classification binning relies heavily on data supplied by a full tenprint, and errors made in the binning process can also cause detection failures. Classification errors are particularly problematic for systems that attempt to search flat fingerprints because they are frequently binned differently from rolled fingerprints, even when the prints belong to the same person. Because the quality of fingerprint images stored as minutiae datasets in databases is highly variable, existing AFIS have difficulty matching against poorer quality images. This makes it difficult for existing systems to effectively match against digitized versions of older fingerprint cards, poorer quality latents taken at crime scenes and fingerprints that were improperly taken at law enforcement or government agencies. |
4
Table of Contents
| • | Performance Constraints. To address heightened security requirements, organizations are beginning to perform biometric authentication checks in areas of high traffic, such as airports, embassies or state/country borders, where it is more challenging to capture full tenprints. In these environments, fast capture and response times are required. Moreover, many AFIS use binning to try to expedite response times, but AFIS that use binning are ineffective at delivering accurate search results in a timely manner when the subject submits less than a full tenprint, as binning under such circumstances eliminates much less of the database and necessitates a broader and more time-consuming search. |
| • | High Costs and Lack of Linear Scalability and Flexibility. In addition, integration of these biometric products and solutions with existing networks and infrastructure can be costly and complex. As databases and the number of searches grow, governments, law enforcement agencies and other organizations need flexible systems that can be scaled in a linear and cost-effective manner. Using most existing fingerprint biometrics solutions, governments, law enforcement agencies and other organizations have had to purchase multiple costly servers to assemble the requisite processing power to achieve acceptable response times and accuracy rates, and these large server deployments are complex and costly to manage on an ongoing basis. |
The constraints and shortcomings of many existing fingerprint biometrics solutions have inhibited the rate of deployment outside of traditional law enforcement environments. These constraints have become more pronounced as a result of the increased focus on security and protection from terrorism, as well as increased attention to economic losses from fraudulent activity, the rising costs of administering and the cumbersome nature of using traditional authentication and identification methodologies. These needs create a significant opportunity for a vendor that can leverage the technology developed in large AFIS deployments to provide accurate, rapid, scalable, flexible and cost-effective fingerprint biometric solutions.
Our Solution
We are a leading provider of advanced AFIS and other fingerprint biometrics solutions to governments, law enforcement agencies and other organizations worldwide. For nearly twenty years, we have researched, designed, developed and marketed advanced fingerprint biometric technologies and integrated solutions. We believe our proprietary software algorithms, together with optimized hardware, enable our customers to cost-effectively deploy AFIS solutions that consistently deliver industry leading accuracy rates and performance. Our solutions are designed to be scalable, enabling customers to seamlessly expand the capabilities of their AFIS, and flexible, enabling customers to deploy our AFIS in a variety of operating systems and hardware configurations. As a result, we provide a complete AFIS solution that enables customers to achieve a low total cost of ownership both upon initial deployment and throughout its entire lifecycle. Key benefits of our solutions include:
End-to-End Solution and Services Capability. We have designed and developed a fully integrated AFIS solution comprised of our proprietary fingerprint biometric software, together with optimized hardware and professional services. We offer all of the elements a customer needs to deploy fingerprint biometric solutions, including:
| • | Search and Retrieval Software. At the core of our solutions are our proprietary search algorithms that accelerate the matching process while maintaining accuracy. This software can run on standard hardware, but in larger deployments our customers typically run it on servers that we enhance with our Programmable Matching Accelerator, or PMA, boards that are optimized for rapid searches. The combination of powerful searching software and optimized hardware processing speeds enables us to deliver fingerprint biometrics solutions that can meet the most demanding requirements of governments, law enforcement agencies and other organizations. |
| • | Capture Devices. We offer several types of capture devices that enable our customers to obtain and process either flat or rolled fingerprints in a wide variety of places without ink, such as police stations, airports and immigration offices. All of our live-scan devices run our proprietary Image Flow software, which employs advanced algorithms to improve feature extraction from the fingerprint images, thereby |
5
Table of Contents
| enhancing search accuracy. We also offer portable devices that enable customers to obtain and process fingerprints remotely. Our live-scan devices provide real-time image previews on screen for improved quality control and reduced processing time. |
| • | Systems Integration Services. Our service abilities enable us to deliver full end-to-end solutions regardless of the operating or network environment and to design custom interfaces to existing systems. Our highly trained and skilled engineering professionals have extensive expertise in designing and deploying AFIS and other biometrics solutions that are integrated with our customers’ existing systems. Because our core intellectual property resides in our software capabilities, we can cost-effectively bundle our software with optimized off-the-shelf hardware components to create solutions for our customers that deliver the performance capabilities they demand. Moreover, our solutions implement standards-based approaches that simplify integration and support. |
High Accuracy Rates. We believe our solutions enable our AFIS customers to search large databases with industry leading accuracy and performance. A key factor in our ability to achieve these accuracy rates is our approach of searching the entire database rather than relying on binning like most other AFIS. As a result, our solutions do not suffer from binning errors. We can more effectively search both flat and rolled prints, which leads to increased accuracy. Moreover, because our software reflects our nearly twenty years of research and development on neural network, fluid dynamics and advanced image processing principles, we are able to extract more minutiae from lower quality fingerprints to minimize detection failures and false positives.
High Performance. Our solutions deliver high performance and enable rapid response times when searching large databases while still maintaining a high degree of accuracy. Our PMA servers accelerate the processing capability of standard server architectures and can compare over ten million fingerprints per second per PMA server. We achieve this performance level by implementing our advanced search algorithms and our proprietary Data Flow technology, which enables massively parallel processing on our PMA servers to eliminate the need for binning. Because we do not need to bin, our solutions can rapidly search based on any number of prints. Furthermore, our PMA servers can be easily clustered together, which enables customers to employ multiple servers in an integrated solution and achieve throughput levels that scale with their needs. Our rapid response times enable our customers to deploy our systems in high traffic areas where real-time authentication or identification based on flat prints is critical.
Significant Cost Savings and Linear Scalability and Flexibility. The power, linear scalability and flexibility of our solutions can result in significant cost savings to our customers. The power of our solutions reduces our customers’ initial costs and related ongoing maintenance and administrative costs because one of our PMA servers running our software can typically accomplish the equivalent processing of multiple Windows, UNIX or Linux servers working with other existing AFIS solutions. In addition, our solutions enable our customers to expand their systems smoothly and economically as their processing needs grow and as their systems evolve because they can incrementally purchase additional PMA servers which can be easily connected to one another, or rack mounted, to linearly scale matching throughput and support system growth as their databases grow and the number of required searches increases. Moreover, all of our current products are backwards compatible with earlier versions, enabling our customers to integrate our solutions with their existing network and infrastructure and easily and cost-effectively upgrade their systems as we develop new generations of our technology. Furthermore, our solutions are flexible and work effectively in heterogeneous network environments that include multiple hardware systems and operating systems such as Windows, UNIX and Linux. As a result, we believe the total cost of ownership of our solutions is lower than the cost of competing solutions.
Products and Services
We principally offer biometrics solutions to the government sector, which consists of federal, state, local and foreign governments and agencies, including immigration/border control agencies, electoral commissions and law enforcement agencies. At the core of each of our products is our proprietary Image Flow Processing, Data Flow Computing and Information Fusion software.
6
Table of Contents
AFIS Solutions
We offer a variety of products and services designed to enable customers to deploy cost-effective, accurate and high performance AFIS solutions. We offer our PMA servers bundled with our proprietary software to perform the searching and matching functions that are central to an AFIS, as well as live-scan fingerprint capture devices. We also deliver design and integration services and necessary computing and equipment infrastructure to enable deployment into diverse and heterogeneous environments. Our customers typically deploy our AFIS solutions in either traditional AFIS environments, such as law enforcement, where we market our solution as Cogent Automated Fingerprint Identification System, or CAFIS, or in live production environments, such as border crossings, where we market our solution as Cogent Live-ID.
We offer two primary AFIS solutions, each of which incorporates our PMAs and our live-scan devices:
Cogent Automated Fingerprint Identification System. CAFIS is our full-function, networked AFIS solution for local, regional and national systems. While each CAFIS deployment is unique to the customer due to its specific design and integration requirements, all such deployments employ our proprietary software, and the larger deployments rely significantly on our PMA servers. We believe that CAFIS is one of the most accurate systems in the world for twoprint, tenprint, latent and palm print searches.
CAFIS can be integrated with external AFIS, live-scan systems, hand-held wireless devices, secure web-based Internet solutions and other information systems. CAFIS features a modular and expandable architecture that can be scaled to meet any agency’s database size, throughput and integration requirements. CAFIS can quickly and accurately search databases of enrolled subjects, with multiple records per subject in image resolutions of both 500 ppi and 1,000 ppi. Any number of modular elements can be incorporated into CAFIS, including PMA servers, workstations, live-scans and wireless handheld computers. For agencies with modest throughput requirements, systems can be configured using an NT or UNIX-based transaction server hosting our Image Flow, Data Flow and Information Fusion software. For local agencies, we provide an affordable AFIS solution on a stand-alone workstation that incorporates much of the tenprint and latent functionality and all the accuracy of large-scale AFIS systems. This workstation can scale to support larger-scale systems as agency needs change. CAFIS can be configured with a number of built-in safeguards that ensure service resiliency, while providing safety of information through its fault tolerant architecture, disk mirroring, automated database backup and disaster recovery options. It is also capable of integrating other authentication and identification solutions, such as facial recognition and smart cards.
Cogent Live-ID. Our Live-ID AFIS solution enables our customers to rapidly identify individuals who submit their fingerprints for border crossings, background checks, fraud prevention, criminal investigation, document identification, voting stations and other activities where security is a concern. Live-ID has been deployed in many demanding environments, including the United States Visitor and Immigrant Status Indicator Technology, or US-VISIT, program. As a result of our powerful searching and matching technology and the improved feature extraction from our image capture technology, Live-ID provides a rapid and efficient identification solution using only two flat fingerprints. Our Live-ID system can be configured to run on hand-held devices, notebook computers, stand-alone workstations and enterprise systems serving users in a vast network of sites. Live-ID can be implemented on platforms operating under UNIX, Windows and Linux, enabling users to submit search transactions and receive results with a standard web browser. Live-ID can also be used in non-governmental environments to provide authentication of an individual’s identity for a variety of transactions, including e-commerce applications.
Live-ID implements our Data Flow matching technology to accurately search entire databases containing up to millions of records in a matter of seconds. Our Information Fusion technology makes it possible to combine identification systems so that Live-ID can search databases of digital photographs, signatures and demographic data simultaneously.
7
Table of Contents
AFIS Products
We offer two key products in our AFIS solutions deployments:
Programmable Matching Accelerator Servers. Our proprietary PMA server is a high-speed image matching server at the core of a customer’s AFIS or Live-ID system that can support search speeds of up to ten million print comparisons per second per server. These speeds, which are made possible by the integration of our proprietary software with our advanced design PMAs, are necessary to adequately address the needs of customers that require real-time identification results when searching databases containing thousands to millions of records.
Our PMAs are modular units that enable customers to linearly increase matching throughput to support system and database growth by rack-mounting multiple PMA servers. PMA servers are comprised of up to eighteen of our PMA boards integrated with a commercially available server that has a high-speed input/output processor board and multiple random access memory drives. Our PMA boards use field programmable gate array integrated circuits optimized to run our proprietary software, rather than costly general purpose microprocessors or inflexible ASICs. As a result, we can cost-effectively program our PMA servers to perform a variety of matching tasks for fingerprints and palm prints. Our PMA boards also provide redundancy because the PMA boards house mirrored databases in on-board random access memory that contain files used by the system to generate fingerprint matches. The mirrored configuration and speed of the random access memory allow the system to perform simultaneous search transactions at very high speeds while still maintaining the reliability of the system.
Live-scan Systems. We offer a suite of live-scan systems running our proprietary software that improve minutiae feature extraction during the capture and encoding of fingerprint and palm print data. These systems can capture rolled or flat fingerprints and palm prints of a subject in an easy-to-learn and inkless manner. Using our software, these products enable real-time previewing, which helps the operator to place, guide and align the fingers and palms correctly, and provide immediate feedback, including error messages, if prints are not captured at an acceptable quality. These features improve the efficiency of the fingerprint capture process and enhance the effectiveness of the matching process by capturing and submitting high quality fingerprints to the AFIS or Live-ID system more quickly than live-scan devices that utilize other software programs. Scanning resolution meets ANSI/NIST and Federal Bureau of Investigation standards, and the scanner is certified to meet and exceed Federal Bureau of Investigation requirements. All data formatting is done with Federal Bureau of Investigation certified compression algorithms. Textual and graphic information is displayed in a single monitor, with a graphic user interface and on-screen buttons and zoom features. Our live-scan product suite is designed to enable integration within larger AFIS and booking management systems, including CAFIS, Live-ID and legacy AFIS solutions.
Our live-scan booking station is an advanced live-scan system designed to withstand extreme working conditions such as those present in jails and prisons. The system features a high-security glass front and a ruggedized cabinet. We also offer a desktop live-scan system and a portable live-scan system.
AFIS Services
Design, Integration and Training. We offer design and integration services and training that complement our AFIS product solutions. At the commencement of a large CAFIS or Live-ID deployment, we establish project management teams that utilize a formal project management development process to meet the customer’s desired performance objectives. We develop and deliver customized solutions to governments, law enforcement agencies and other organizations that require integration with existing information systems that interface with external AFIS systems. We also work with major systems integrators in providing tailored solutions. After installation, we conduct performance tests to validate performance objectives. We also offer tailored training plans that include classes, on-the-job training and in-house seminars. As part of our training services, we provide customized user guides along with manuals.
8
Table of Contents
Web-based Application Services. We provide a fully outsourced Live-ID service on a web-based hosted application service business model. Systems are housed and maintained in a secure data center at our headquarters. The data center is equipped with high-speed, fault-tolerant Cogent PMA matchers and enterprise servers. Customers using this service can offer fingerprint matching services for applications such as background checks without investing in an entire AFIS infrastructure and pay on a transaction basis.
ASIC Applications
Our proprietary application specific integrated circuit, or ASIC, is designed to perform biometric image processing and matching for both fingerprints and facial images. Based on a microprocessor core, our proprietary ASIC incorporates a powerful two-dimensional digital signal processing engine and supports memory bus interfaces with synchronous dynamic random access memory, read-only memory, flash memory and static random access memory devices. Our proprietary ASIC is typically delivered as part of our proprietary Identification Module, which is a stand-alone image processing and biometric matching unit designed for applications requiring biometric identification and authentication. To provide maximum flexibility for integrating the Identification Module with a variety of user applications, the module supports a number of fingerprint sensor options, including silicon sensors and optical sensors and communication interface options, as well as magnetic stripe card, contact smart card and contactless smart card readers.
The Identification Module supports both one-to-one authentication and one-to-many identification applications. Host application systems can manage the Identification Module through common communication protocols, such as Ethernet. We also offer an original equipment manufacturer, or OEM, development kit for application development and integration. This kit comes with a variety of tools and options to provide high degrees of flexibility and customization for a wide range of applications.
Examples of applications powered by our proprietary ASIC are:
BlueCheck. BlueCheck is a Bluetooth enabled mobile fingerprint scanner for law enforcement applications. Weighing only 3 ounces the BlueCheck is equipped with a durable LCD display for real-time feedback, a 500 dpi fingerprint sensor and our proprietary ASIC technology for embedded encryption, image compression and on-device matching. Used with our Live-ID and MobileIDENT software, BlueCheck allows users to perform in-the-field fingerprint capture and identifications.
Fusion. The Fusion is a handheld device for military and law enforcement personnel operating in a variety of austere environments around the globe. The device captures and stores 10,000 plus (scalable) records: forensic-quality fingerprints, latent fingerprints, iris images, photos and textual data. Other features include internal matching against stored records, wireless connectivity via 802.11b/g or Bluetooth, GPS tagging of all records collected, and a weight of just over one pound.
BioGate. BioGate is a physical access control system that provides a sophisticated, accurate and customizable biometrics solution to support a variety of access control environments. This system can replace existing access card systems with an easy-to-use system that controls access by requiring that an individual seeking entry submit to a finger scan to confirm his right to access a restricted area. Featuring our matching software, a 500 ppi resolution silicon fingerprint sensor and a contact smart card reader or optional magnetic stripe card reader, BioGate provides a high level of accuracy and speed. BioGate can increase security while making the access control system more convenient for authorized personnel.
National Identification Card Programs. Numerous foreign jurisdictions around the world have begun to establish national identification card programs, which will require the issuance of smart ID cards with embedded fingerprint information. Foreign jurisdictions such as Hong Kong, Italy, Morocco, the United Kingdom and Thailand have implemented or are in the process of implementing national identification programs. Many of these programs involve enrolling citizens in a database and issuing each citizen an identification card, some of which are smart cards that contain a chip, such as our proprietary ASIC, that has a digital template of fingerprints
9
Table of Contents
embedded in it. This information can be accessed and matched against a real-time scan of a citizen’s finger to enable real-time authentication of the citizen’s identity for a variety of purposes. Our proprietary ASIC is currently used in the Hong Kong Smart Identity Card Program.
MobileIDENT. MobileIDENT integrates our proprietary ASIC with a forensic quality fingerprint sensor (500 ppi resolution), a digital camera, a smart card reader and a Windows mobile-based Pocket PC to create a handheld AFIS that can locally store and search fingerprints on our proprietary ASIC chip. MobileIDENT can also communicate with a central AFIS search engine with results returned to the MobileIDENT. In addition, MobileIDENT supports match-on-card authentication whereby a captured fingerprint is compared to fingerprint minutiae stored on a smart card. MobileIDENT enables law enforcement officers to make rapid and effective identifications and authentications at ports of entry and exit, at sporting events, for roadside vehicle checks, for major public events and at any remote location where timely identification or authentication checks may be required.
Technology
We developed our proprietary technology through an extensive research and development program focused on innovative algorithms for image processing and biometric identification. These highly complex matching algorithms are the core of our technology, and we have optimized the hardware deployed in our customers’ systems to run these algorithms efficiently. Our engineers have extensive expertise in matching algorithms, image enhancement, image compression, fuzzy mathematics, morphology, neural networks, security, encryption, communications, data mining and data fusion. By leveraging this expertise over our nearly twenty year history, we have developed advanced algorithms for statistical pattern recognition, structural pattern recognition, random process modeling and error and distortion modeling.
Image Flow Technology. Our Image Flow software utilizes fluid dynamics principles to perform real-time identification and classification of minutiae and other irregularities that define the unique biometric features. Since fingerprints have a natural graphical flow embodied in the ridges in human fingers, our Image Flow software enables our algorithms to identify the patterns of a fingerprint similar to the surface appearances associated with fluid flow. This enables us to employ mathematical modeling, using the principles of fluid dynamics, for enhancing poor fingerprints lifted from crime scenes or less than optimal images. Utilizing ridge pattern information in a fingerprint image, our Image Flow algorithms capture the flow information via partial differential equations, solve the numerical equations, and provide accurate feature data associated with the fingerprint image. By analytically modeling these natural flows, which are unique to each individual, our software can establish a positive identity using a variety of biometrics, including fingerprints, palm prints, and facial images. Our image processing software operates throughout our AFIS solutions to enable more detailed feature extraction to improve the accuracy of searches and descriptive function modeling to improve the speed of searches.
Data Flow Technology. Utilizing innovative hyper-pipeline and massively parallel computing architectures, our Data Flow super computing technology provides an in-depth analysis of the similarity of natural object characteristics to accurately and automatically identify matching characteristics. This technology enables very high-speed computation, and it is scalable to run on hand-held computers, desktop computers and enterprise servers. Our Data Flow technology utilizes parallel processing techniques to deliver high throughput by conducting parallel database searches while expending minimal time per comparison. The Data Flow technology implements a design paradigm that features a dataflow computing architecture based upon the Single Instruction Multiple Data, or SIMD, dataflow computer model. The SIMD model packs multiple data elements into a single register and performs the same calculation on all of them at the same time, and computational accelerators move performance bottlenecks from the processor into the processor’s memory hierarchy. This technology enables us to optimize both our accuracy and transaction throughput by capitalizing on the fact that all the fingerprints in the database can be accessed in parallel. We have also developed advanced wavelet compression and coding design technologies to enhance system speed.
10
Table of Contents
The design of our PMA boards also manifests our Data Flow technology. The PMA board design features extremely high input/output bandwidth to process the database using a massively parallel and hyper-pipeline architecture implemented on a single card that plugs into a standard interface on a commercially available server. Our PMA servers have been designed to support the high-speed capabilities of the Data Flow algorithms and provide scalable matching units that can individually perform ten million fingerprint comparisons per second. For every transaction, our PMA server initializes the search engine by loading the search fingerprint minutiae data to the search engine. The PMA server continues sending the fingerprint minutiae data to the data pipe of the search engine while the search engine data pipe is not full.
Information Fusion Technology. Our Information Fusion technology integrates data mining and data fusion technologies with biometric identification to enable the transformation of raw data into business information. To meet customer requirements, AFIS and other fingerprint biometrics systems must integrate with larger communications and information systems. Our Information Fusion technology improves the accuracy of our solutions by utilizing sophisticated fusion algorithms to combine biometric data from multiple sources and multiple algorithms.
Our Information Fusion technology includes system integration tools and techniques to integrate information from disparate information systems, such as intelligence systems, criminal history systems and border crossing systems. This technology includes advanced workflow and state transition modeling architectures that we use to develop custom workflows and seamless integration of data in customers’ information systems. Rather than maintaining multiple versions of our software for a variety of applications and customers, our Information Fusion software requires only one master version that is both dynamically and statically configured based on each customer’s requirements. Information Fusion facilitates the rapid development of extension modules for individual customer deployments to address specific needs, and we can frequently use the functionality developed for one customer in future customer deployments. This technology also provides an efficient framework for providing customer support of delivered systems, which can reduce customers’ maintenance costs and increase system reliability. The ability to provide integration across local, state, national and international systems is a key advantage for governments and law enforcement agencies in implementing heightened security procedures.
Customers
We have derived, and believe that we will continue to derive, a significant portion of our revenues from a limited number of customers. The table below indicates the percentage of our total revenues from customers from whom we derived at least 10% of our revenues for the years ended December 31, 2007, 2008 and 2009:
| Year Ended December 31, | |||||||||
| Percentage of Revenues |
2007 | 2008 | 2009 | ||||||
| DHS |
34 | % | 57 | % | 41 | % | |||
| CNE |
13 | % | 0 | % | 0 | % | |||
The DHS obtains our products and services either under a blanket purchase order agreement or by instructing contractors to purchase our products and services on its behalf.
Our most recent arrangement with the National Electoral Council of Venezuela (“CNE”) was completed in December 2006 and revenues from all of our arrangements with the CNE were fully recognized by June 30, 2007.
Sales and Marketing
We market our AFIS solutions and other fingerprint biometrics solutions directly to end-users and indirectly through prime contractors. We market our proprietary ASIC device indirectly through OEMs, resellers and distributors. As of December 31, 2009, we employed 40 individuals who were involved in our sales and marketing efforts.
11
Table of Contents
Sales efforts for our AFIS and other government related fingerprint biometrics solutions are predominantly focused on establishing and maintaining new and existing relationships with defense and IT solutions companies that typically serve as prime contractors on government projects. We also market our AFIS and other government related fingerprint biometrics solutions directly to end customers if the project is focused primarily on a biometrics implementation. For large AFIS deployments, a government entity typically issues a request for proposal, or RFP. In the RFP, the entity will usually provide the project’s specifications and performance requirements, and then solicit proposals from prospective prime contractors who are on the approved vendor list. Because we are one of three leading vendors that offer AFIS solutions, we are typically included in any U.S. or international RFP that is open for competitive bidding. We enhance our opportunities for being selected as a prime or subcontractor by utilizing references from our existing customers, usually bidding on a fixed price basis and employing consultants who have strong relationships in our international markets. We assemble a multi-disciplined project management team to draft the proposal, or to assist with drafting if we are the subcontractor, negotiate the actual contract and deploy the solution. Once our solution has been deployed, the project management team educates our customer on the use of our AFIS and other biometrics solutions. The project management team is also frequently involved in upgrading our customers to more comprehensive solutions as their needs grow. In addition, when competing for local, state and international contracts from governments and law enforcement agencies, we seek to team with local systems integrators in the jurisdiction in which the contract is to be performed.
As part of our general sales and marketing efforts we have also established the Cogent User Group. The main purpose of this group is to provide feedback on existing solutions, identify needs for new products and identify new desirable capabilities for both existing and new solutions. We have an annual user conference where members can provide feedback on our solutions and products. We utilize the information gathered from members of the Cogent User Group and the information gathered from clients by our project management teams to better enable us to create and deliver to our customers timely upgrades and new solutions that meet evolving customer needs.
Manufacturing and Suppliers
For our PMA servers, we conduct finish assembly operations, quality assurance, manufacturing engineering, documentation control and integration at our headquarters facility in Pasadena, California. We acquire the servers from commercial suppliers such as IBM and Hewlett-Packard. We outsource the assembly of our PMA boards to contract manufacturers to reduce fixed costs and to provide flexibility in meeting market demands. We directly purchase the components of our PMA boards, including printed circuit boards, field programmable gate arrays and memory integrated circuits, and our contract manufacturers assemble them to our specifications. The contract manufacturers deliver the assembled PMA boards to us, and we perform finish assembly procedures before testing and integrating the final products into the commercial servers with software and manuals in our Pasadena, California facility.
Samsung Semiconductor, Inc. fabricates our proprietary ASIC wafers in Asia. Various subcontractors perform assembly, packaging and testing of our ASICs, allowing us to purchase and receive only finished ASIC product. We maintain a facility in Shenzhen, China where we perform research and development and assembly of our products that incorporate our proprietary ASIC. Certain components of our products that are assembled in Shenzhen are outsourced to contract partners, none of which are sole source suppliers. We also store and distribute our inventory of consumer and commercial products from the Shenzhen facility.
Most component parts used in our products are standard off-the-shelf items, which are, or can be, purchased from two or more sources. In addition to Samsung, IBM and Hewlett-Packard, we utilize products from suppliers such as Sun Microsystems and Dell Computer, which provide computer workstations, L-1 Identity Solutions and Cross Match Technologies, which provide live-scans, Oracle, Informix, Sybase and Microsoft, who supply database software and UPEK, Validity and Atmel, who supply sensors. We select suppliers on the basis of functionality, manufacturing capacity, quality and cost. Whenever possible and practicable, we strive to have at least two manufacturing locations for each product. Nevertheless, our reliance on third-party manufacturers
12
Table of Contents
involves risks, including possible limitations on availability of products due to market abnormalities, unavailability of, or delays in obtaining access to, certain product technologies and the absence of complete control over delivery schedules, manufacturing yields, and total production costs. The inability of our suppliers to deliver products of acceptable quality and in a timely manner or our inability to procure adequate supplies of our products could disrupt our ability to meet customer demands or reduce our gross margins.
Customer Service
We believe that customer service is critical to our success, and we have committed significant resources to this function. Our contracts provide for telephone, web-based or email support and occasionally on-site support. Our systems are configured for remote access, allowing us to solve most problems remotely and without customer involvement. We also maintain a customer support database that allows us to both resolve problems and prevent recurrences of prior problems.
Competition
The market for biometric solutions is highly competitive, rapidly evolving and fragmented, and subject to changing technology, shifting customer needs and frequent introductions of new products and services. A significant number of established companies have developed or are developing and marketing software and hardware for biometric products and applications that currently compete or will compete directly with our offerings. Our offerings also compete with non-biometric technologies such as public key infrastructure solutions, smart card security solutions, and traditional key, card, surveillance and password systems. Many of our competitors have significantly more financial and other resources than we do. We believe that additional competitors will continue to enter the biometrics market and become significant long-term competitors, and that, as a result, competition will increase in the near term. We sometimes compete with third parties who are also our suppliers or prime contractors. Companies competing with us may introduce products that are competitively priced, have increased performance or functionality or incorporate technological advances not yet developed or implemented by us. Our current principal competitors include:
| • | diversified technology providers, such as NEC and Safran Group (through its wholly owned subsidiary MorphoTrak) that offer integrated AFIS solutions to governments, law enforcement agencies and other organizations; |
| • | companies that are AFIS component providers, such as Cross Match Technologies and L-1 Identity Solutions; |
| • | prime government contractors that develop integrated information technology products and services that include biometrics-related solutions that are frequently delivered in partnership with diversified technology providers and biometrics-focused companies; and |
| • | companies focused on other fingerprint biometrics solutions, such as AuthenTec, Dermalog and UPEK. |
We believe the principal competitive factors in the market for our biometric solutions include the following:
| • | accuracy of matching; |
| • | speed of matching; |
| • | pricing including total cost of system ownership, including initial costs and ongoing maintenance and support; |
| • | customization; |
| • | scalability that enables rapid and accurate matching in extremely large databases; |
| • | quality of service and support |
| • | degree of security provided; |
13
Table of Contents
| • | ease of use; |
| • | functionality; |
| • | size; and |
| • | reliability. |
We believe that we compete favorably with our competitors on the basis of the aforementioned factors. Our ability to remain competitive will depend to a great extent upon our ongoing performance in the areas of product development and customer support.
Backlog
We record an item as backlog when we receive a contract, purchase order or other notification, such as an award document, indicating the number of units to be purchased, the purchase price, specifications and other customary terms and conditions. Our backlog also includes deferred revenue reflected on our consolidated balance sheet. Further, we include in our estimated backlog contracts that have been awarded but not yet signed or for which certain contract terms such as quantities or specifications have not yet been fully defined. For these awarded contracts, we have made assumptions based on best available information to estimate their values. There can be no assurance that any of the contracts comprising our backlog presented in this Annual Report will result in actual revenue in any particular periods or that the actual revenue from such contracts will equal our backlog estimates. Furthermore, there can be no assurance that any contract included in our estimated backlog that actually generates revenue will be profitable. These backlog estimates are based on our experience under such contracts and similar contracts and may not be accurate. As of December 31, 2008 and 2009, our total backlog was $168.1 million and $210.7 million, respectively. We have included $60.4 million in our estimated backlog as of December 31, 2009 for awarded contracts. Approximately $127.2 million of backlog is not expected to be filled in 2010. We cannot assure you that we will realize revenue from our entire backlog or as to timing thereof. In addition, a significant portion of our revenue is not recognized upon shipment, but is recognized only upon customer acceptance of our systems or over the term of our contracts under the percentage-of-completion method.
Research and Development
We engage in substantial research and development to advance our core products and develop new products and carryout research and development activities at our corporate headquarters in Pasadena, California and at various international locations. We conduct research on algorithm development, hardware development, system engineering and architecture, industry standards, technology integration, user productivity features and performance enhancement. We also invest substantial resources in commercializing the technology that we develop in our research and development efforts into products that meet the needs of our customers. We have found that while there are unique features to each client engagement, there is often a degree of commonality. Under our customer contracts, we typically obtain the rights to use any improvements to our technology developed on a particular customer deployment on other customer deployments. As a result, we have historically been able to moderate our research and development expenses by leveraging the improvements developed by our personnel working on customer engagements. Our research and development expense was $10.6 million in 2007, $14.8 million in 2008 and $15.0 million in 2009.
Intellectual Property
Our success will depend in part on our ability to protect our intellectual property. The core technology used in our products and solutions is not the subject of any patent or copyright protection. We have one issued patent and two pending patent applications relating to our Data Flow and Information Fusion technology as well as two issued patents on technology related to optical sensors and image reconstructions for the commercial markets.
14
Table of Contents
We also rely primarily on a portfolio of intellectual property rights, both foreign and domestic, including trade secrets, trademarks, contractual provisions, patent applications and licenses to protect our intellectual property. Our registered trademarks relate to Cogent, Cogent Systems, BlueCheck, Live-ID, Fusion and PMA.
If we fail to protect our intellectual property rights adequately, our competitors might gain access to our technology, and our business would thus be harmed. In addition, defending our intellectual property rights might entail significant expense. Any of our trademarks or other intellectual property rights may be challenged by others or invalidated through administrative processes or litigation. In addition, our patents, or any other patents that may be issued to us in the future, may not provide us with any competitive advantages, or may be challenged by third parties. Furthermore, legal standards relating to the validity, enforceability and scope of protection of intellectual property rights are uncertain. Effective patent, trademark, copyright and trade secret protection may not be available to us in every country where we market our solutions. The laws of some foreign countries may not be as protective of intellectual property rights as those in the United States, and domestic and international mechanisms for enforcement of intellectual property rights in those countries may be inadequate. Accordingly, despite our efforts, we may be unable to prevent third parties from infringing upon or misappropriating our intellectual property or otherwise gaining access to our technology.
We may be required to expend significant resources to monitor and protect our intellectual property rights. We may initiate claims or litigation against third parties for infringement of our proprietary rights or to establish the validity of our proprietary rights. Any such litigation, whether or not it is ultimately resolved in our favor, would result in significant expense to us and divert the efforts of our technical and management personnel. For example, in April 2005 we initiated a lawsuit against Northrop Grumman which asserted that Northrop caused us harm by misappropriating our trade secrets. Our management devoted a significant amount of time to, and we spent a significant amount of funds in connection with, this lawsuit, which was settled in 2007.
As the number of entrants into our market increases, the possibility of an intellectual property claim against us grows. Our technologies may not be able to withstand any third-party claims against their use. Any intellectual property claims, with or without merit, could be time-consuming and expensive to litigate or settle, and could divert management attention from executing our business plan. In addition, we may be required to indemnify our customers for third-party intellectual property infringement claims, which would increase the cost to us of an advance ruling in such a claim. An adverse determination could also prevent us from offering our service to others.
We generally enter into confidentiality agreements with our employees, vendors, industry partners and customers. Furthermore, we generally control access to and distribution of our documentation and other proprietary information. Despite this protection, unauthorized parties may copy aspects of our current or future software products or obtain and use information that we regard as proprietary, and such unauthorized use could harm our business.
Employees
As of December 31, 2009, we employed 434 full-time employees, including 163 in research and development, 199 in operations and engineering services, 40 in sales and marketing and 32 in general and administration. At December 31, 2009, 239 of our employees were located in the United States and 195 of our employees were located outside the United States.
We have never had any work stoppage and none of our employees are represented by a labor organization or are party to any collective bargaining arrangements. We consider our employee relations to be good.
15
Table of Contents
Government Regulation
Our business is subject to various government regulations, including:
| • | the Federal Acquisition Regulations, or the FAR, and agency regulations supplemental to the FAR, which comprehensively regulate the formation and administration of, and performance under government contracts; |
| • | the Truth in Negotiations Act, which requires certification and disclosure of all cost and pricing data in connection with contract negotiations; |
| • | the Cost Accounting Standards, which impose accounting requirements that govern the right to reimbursement under cost-based government contracts; |
| • | the Foreign Corrupt Practices Act; and |
| • | laws, regulations and executive orders restricting the use and dissemination of information classified for national security purposes and the exportation of certain products and technical data. |
Segment Information; Financial Information about Geographic Areas
We consider our business activities to constitute a single segment. A summary of our revenues and assets by geographic area is set forth in Note 13 to our consolidated financial statements included elsewhere in this Annual Report.
Available Information
We file reports with the Securities and Exchange Commission (“SEC”). We make available on our website under “Investor Relations/SEC Filings,” free of charge, our annual reports on Form 10-K, quarterly reports on Form 10-Q, current reports on Form 8-K and amendments to those reports as soon as reasonably practicable after we electronically file such materials with or furnish them to the SEC. Our website address is www.cogentsystems.com. You can also read and copy any materials we file with the SEC at the SEC’s Public Reference Room at 100 F Street, NE, Washington, DC 20549. You can obtain additional information about the operation of the Public Reference Room by calling the SEC at 1-800-SEC-0330. In addition, the SEC maintains an Internet site (www.sec.gov) that contains reports, proxy and information statements, and other information regarding issuers that file electronically with the SEC, including us.
You should consider each of the following factors as well as the other information in this Annual Report in evaluating our business and our prospects. The risks and uncertainties described below are not the only ones we face. Additional risks and uncertainties not presently known to us or that we currently consider immaterial may also impair our business operations. If any of the following risks actually occur, our business and financial results could be harmed. In that case, the trading price of our common stock could decline. You should also refer to the other information set forth in this Annual Report, including our financial statements and the related notes.
Our business could be adversely affected by significant changes in the contracting or fiscal policies of governments and governmental entities.
We derive substantially all of our revenues from contracts with international, federal, state and local governments and government agencies, and subcontracts under federal government prime contracts, and we believe that the success and growth of our business will continue to depend on our successful procurement of government contracts either directly or through prime contractors. Accordingly, changes in government contracting policies or government budgetary constraints could directly affect our financial performance. Among the factors that could adversely affect our business are:
| • | changes in fiscal policies or decreases in available government funding; |
16
Table of Contents
| • | changes in government funding priorities; |
| • | changes in government programs or applicable requirements; |
| • | the adoption of new laws or regulations or changes to existing laws or regulations; |
| • | changes in political or social attitudes with respect to security and defense issues; |
| • | changes in audit policies and procedures of government entities; |
| • | potential delays or changes in the government appropriations process; and |
| • | delays in the payment of our invoices by government payment offices. |
These and other factors could cause governments and governmental agencies, or prime contractors that use us as a subcontractor, to reduce their purchases under existing contracts, to exercise their rights to terminate contracts at-will or to abstain from exercising options to renew contracts, any of which could have an adverse effect on our business, financial condition and results of operations. Many of our government customers are subject to stringent budgetary constraints. The award of additional contracts from government agencies could be adversely affected by spending reductions or budget cutbacks at these agencies.
In 2008 and 2009, we derived 57% and 41%, respectively, of our revenues from a limited number of customers.
In each fiscal period we have derived, and we believe that in each future fiscal period we will continue to derive, a significant portion of our revenues from a limited number of customers. In 2008, the DHS accounted for 57% of revenues, and in 2009 the DHS accounted for 41% of revenues. We do not have any long-term contracts with any of our customers, including the DHS, for the sale of our products, and our future sales will depend upon the receipt of new orders. To the extent that any significant customer, like the DHS, reduces or delays its purchases from us or terminates its relationship with us, our revenues would decline significantly and our financial condition and results of operations would suffer substantially. For example, a delay in the rollout of US-VISIT, or the completion of the implementation of that program, resulting in a decrease or cessation of orders for our products from the DHS, would materially affect our business.
In 2008 and 2009, we derived 80% and 79%, respectively, of our revenues from the sale of our solutions either directly or indirectly to U.S. government entities pursuant to government contracts, which involve competitive bidding and may be subject to cancellation or delay without penalty, any of which may produce volatility in our revenues and earnings.
Our performance in any one reporting period is not necessarily indicative of future operating performance because of our reliance on a small number of customers, the majority of which are government entities. Government contracts are frequently awarded only after formal competitive bidding processes, which have been and may continue to be protracted, and typically impose provisions that permit cancellation in the event that necessary funds are unavailable to the public agency. In many cases, unsuccessful bidders for government agency contracts are provided the opportunity to formally protest certain contract awards through various agency, administrative and judicial channels. The protest process may substantially delay a successful bidder’s contract performance, result in cancellation of the contract award entirely and distract management. We may not be awarded contracts for which we bid, and substantial delays or cancellation of purchases may even follow our successful bids as a result of such protests.
In addition, local government agency contracts may be contingent upon availability of matching funds from federal or state entities. Also, law enforcement and other government agencies are subject to political, budgetary, purchasing and delivery constraints which may cause our quarterly and annual revenues and operating results to fluctuate in a manner that is difficult to predict.
17
Table of Contents
If the biometrics market does not experience significant growth or if our products do not achieve broad acceptance both domestically and internationally, we will not be able to grow our business.
Our revenues are derived from sales of our biometrics solutions. We cannot accurately predict the future growth rate or the size of the biometrics market. The expansion of the biometrics market and the market for our biometrics solutions depends on a number of factors, such as:
| • | the cost, performance and reliability of our solutions and the products and services offered by our competitors; |
| • | customers’ perceptions regarding the benefits of biometrics solutions; |
| • | the development and growth of demand for biometric solutions in markets outside of government and law enforcement; |
| • | public perceptions regarding the intrusiveness of these solutions and the manner in which organizations use the biometric information collected; |
| • | public perceptions regarding the confidentiality of private information; |
| • | proposed or enacted legislation related to privacy of information; |
| • | customers’ satisfaction with biometrics solutions; and |
| • | marketing efforts and publicity regarding biometrics solutions. |
Even if biometrics solutions gain wide market acceptance, our solutions may not adequately address market requirements and may not continue to gain market acceptance. If biometrics solutions generally or our solutions specifically do not gain wide market acceptance, we may not be able to achieve our anticipated level of growth and our revenues and results of operations would suffer.
Our financial results often vary significantly from quarter to quarter and may be negatively affected by a number of factors.
Since individual orders can represent a meaningful percentage of our revenues and net income in any single quarter, the deferral or cancellation of or failure to close a single order in a quarter can result in a revenue and net income shortfall that results in our failing to meet securities analysts’ expectations for that period. We base our current and future expense levels on our internal operating plans and sales forecasts, and our operating costs are to a large extent fixed. As a result, we may not be able to sufficiently reduce our costs in any quarter to adequately compensate for an unexpected near-term shortfall in revenues, and even a small shortfall could disproportionately and adversely affect financial results for that quarter.
In addition, our financial results may fluctuate from quarter to quarter and be negatively affected by a number of factors, including the following:
| • | the lack or reduction of government funding and the political, budgetary and purchasing constraints of our government agency customers; |
| • | the terms of customer contracts that affect the timing of revenue recognition; |
| • | the size and timing of our receipt of customer orders; |
| • | significant fluctuation in demand for our solutions; |
| • | price reductions or adjustments, new competitors, or the introduction of enhanced solutions from new or existing competitors; |
| • | cancellations, delays or contract amendments by government agency customers; |
| • | protests of federal, state or local government contract awards by competitors; |
18
Table of Contents
| • | unforeseen legal expenses, including litigation and/or administrative protest costs; |
| • | the results of audits by government agencies; |
| • | expenses related to acquisitions or mergers; |
| • | potential effects of providing services as a prime contractor that may not carry gross margins as high as those of our core solutions; |
| • | impairment charges arising out of our assessments of goodwill and intangibles; and |
| • | other one-time financial charges. |
We face intense competition from other biometrics solutions providers, including diversified technology providers, alternative solutions providers and providers of biometric products.
A significant number of established companies have developed or are developing and marketing software and hardware for fingerprint biometrics products and applications that currently compete with or will compete directly with our offerings. Our offerings also compete with non-biometric technologies such as public key infrastructure solutions, smart card security solutions and traditional key, card surveillance and password systems. We believe that additional competitors will enter the biometrics market and become significant long-term competitors, and that, as a result, competition will increase. In certain instances, we compete with third parties who are also our suppliers or prime contractors. Companies competing with us may introduce solutions that are competitively priced, have increased performance or functionality or incorporate technological advances we have not yet developed or implemented. Our current principal competitors include:
| • | diversified technology providers such as NEC and Safran Group (through its wholly owned subsidiary MorphoTrak) that offer integrated AFIS solutions to governments, law enforcement agencies and other organizations; |
| • | companies that are AFIS component providers, such as Cross Match Technologies and L-1 Identity Solutions; |
| • | prime government contractors that develop integrated information technology products and services that include biometrics-related solutions that are frequently delivered in partnership with diversified technology providers and biometrics-focused companies; and |
| • | companies focused on other fingerprint biometric solutions, such as AuthenTec, Dermalog and UPEK. |
We expect competition to intensify in the near term in the biometrics market. Many current and potential competitors have substantially greater financial, marketing, research and manufacturing resources than we have. To compete effectively in this environment, we must continually develop and market new and enhanced solutions and technologies at competitive prices and must have the resources available to invest in significant research and development activities. Our failure to compete successfully could cause our revenues and market share to decline.
We are subject to extensive government regulation, and our failure to comply with applicable regulations could subject us to penalties that may restrict our ability to conduct our business.
We are affected by and must comply with various government regulations that impact our operating costs, profit margins and the internal organization and operation of our business. Furthermore, we may be audited to assure our compliance with these requirements. Our failure to comply with applicable regulations, rules and approvals could result in the imposition of penalties, the loss of our government contracts or our disqualification as a U.S. government contractor, all of which could adversely affect our business, financial condition and results of operations.
19
Table of Contents
Among the most significant regulations affecting our business are:
| • | the Federal Acquisition Regulations, or the FAR, and agency regulations supplemental to the FAR, which comprehensively regulate the formation and administration of, and performance under government contracts; |
| • | the Truth in Negotiations Act, which requires certification and disclosure of all cost and pricing data in connection with contract negotiations; |
| • | the Cost Accounting Standards, which impose accounting requirements that govern our right to reimbursement under cost-based government contracts; |
| • | the Foreign Corrupt Practices Act; and |
| • | laws, regulations and executive orders restricting the use and dissemination of information classified for national security purposes and the exportation of certain products and technical data. |
These regulations affect how our customers and we can do business and, in some instances, impose added costs on our business. Any changes in applicable laws and regulations could restrict our ability to conduct our business. Any failure by us to comply with applicable laws and regulations could result in contract termination, price or fee reductions or suspension or debarment from contracting with the federal government generally.
Our lengthy and variable sales cycle will make it difficult to predict financial results.
Our AFIS solutions often require a lengthy sales cycle ranging from several months to sometimes over a year before we can receive approvals for purchase. The length of the sales cycle depends on the size and complexity of the solutions, the customer’s budgeting process, the customer’s in-depth evaluation of our solutions and a competitive bidding process. As a result, we may incur substantial expense before we earn associated revenues, since a significant portion of our operating expenses is relatively fixed. The lengthy sales cycles of our solutions make forecasting the volume and timing of sales difficult. In addition, the delays inherent in lengthy sales cycles raise additional risks that customers may cancel contracts or change their minds. If customer cancellations occur, they could result in the loss of anticipated sales without allowing us sufficient time to reduce our operating expenses.
Security breaches in systems that we sell or maintain could result in the disclosure of sensitive government information or private personal information that could result in the loss of clients and negative publicity.
Many of the systems we sell manage private personal information and protect information involved in sensitive government functions. A security breach in one of these systems could cause serious harm to our business as a result of negative publicity and could prevent us from having further access to such systems or other similarly sensitive areas for other governmental clients.
As part of our service offerings, we agree from time to time to maintain and operate a portion of the AFIS systems of our customers on an outsourced web-based application hosting basis. Our ability to continue this service is subject to a number of risks. For example, our systems may be vulnerable to physical or electronic break-ins and service disruptions that could lead to interruptions, delays, loss of data or the inability to process user requests. If any such compromise of our security were to occur, it could be very expensive to cure, could damage our reputation and could discourage potential customers from using our services. Although we have not experienced attempted break-ins, we may experience such attempts in the future. Our systems may also be affected by outages, delays and other difficulties. Our insurance coverage may be insufficient to cover losses and liabilities that may result from such events.
20
Table of Contents
If we are unable to continue to obtain U.S. government authorization regarding the export of our products, or if current or future export laws limit or otherwise restrict our business, we could be prohibited from shipping our products to certain countries, which could cause our business, financial condition and results of operations to suffer.
We must comply with U.S. laws regulating the export of our products. In some cases, explicit authorization from the U.S. government is needed to export our products. The export regimes and the governing policies applicable to our business are subject to changes. We cannot assure you that such export authorizations will be available to us or for our products in the future. In some cases where we act as a subcontractor, we rely upon the compliance activities of our prime contractors, and we cannot assure you that they have taken or will take all measures necessary to comply with applicable export laws. If we or our prime contractor partners cannot obtain required government approvals under applicable regulations, we may not be able to sell our products in certain international jurisdictions.
Failure to properly manage projects may result in costs or claims against us, and our financial results could be adversely affected.
Deployments of our solutions often involve large-scale projects. The quality of our performance on such projects depends in large part upon our ability to manage relationships with our customers and to effectively manage the projects and deploy appropriate resources, including our own project managers and third party subcontractors, in a timely manner. Any defects or errors or failures to meet clients’ expectations could result in reputational damage or even claims for substantial monetary damages against us. In addition, we sometimes guarantee customers that we will complete a project by a scheduled date or that our solutions will achieve defined performance standards. If our solutions experience a performance problem, we may not be able to recover the additional costs we will incur in our remedial efforts, which could materially impair profit from a particular project. Moreover, 11% of our revenues in 2008 and 25% of our revenues in 2009 were derived from fixed price contracts. Changes in the actual and estimated costs and time to complete fixed-price, time-certain projects may result in revenue adjustments for contracts where revenue is recognized under the percentage of completion method. Finally, if we miscalculate the amount of resources or time we need to complete a project for which we have agreed to capped or fixed fees, our financial results could be adversely affected.
The biometrics industry is characterized by rapid technological change and evolving industry standards, which could render our existing solutions obsolete.
Our future success will depend upon our ability to develop and introduce a variety of new capabilities and enhancements to our existing solutions in order to address the changing and sophisticated needs of the marketplace. Frequently, technical development programs in the biometrics industry require assessments to be made of the future direction of technology, which is inherently difficult to predict. Delays in introducing new products and enhancements, the failure to choose correctly among technical alternatives or the failure to offer innovative products or enhancements at competitive prices may cause customers to forego purchases of our solutions and purchase our competitors’ solutions. We may not have adequate resources available to us or may not adequately keep pace with appropriate requirements in order to effectively compete in the marketplace.
We are dependent on our management team, particularly Ming Hsieh, our founder and Chief Executive Officer, and the loss of any key member of our team may impair our ability to operate effectively and may harm our business.
Our success depends largely upon the continued services of our executive officers and other key personnel, particularly Ming Hsieh, our founder and Chief Executive Officer. The relationships that our key managers have cultivated with our customers makes us particularly dependent upon their continued employment with us. We are also substantially dependent on the continued services of our existing engineering and project management personnel because of the highly technical nature of our solutions. We do not have employment agreements with
21
Table of Contents
any of our executive officers or key personnel obligating them to provide us with continued services and therefore, they could terminate their employment with us at any time without penalty. We do not maintain key person life insurance policies on any of our employees. The loss of one or more members of our management team could seriously harm our business.
Termination of all or some of our backlog of orders could negatively affect our sales.
We record an item as backlog when we receive a contract, purchase order or other notification, such as an award document, indicating the specific products and/or services to be purchased, the purchase price, specifications and other customary terms and conditions. Our backlog also includes deferred revenue reflected on our consolidated balance sheet. Further, we include in our estimated backlog contracts that have been awarded but not yet signed or for which certain contract terms such as quantities or specifications have not yet been fully defined. For these awarded contracts, we have made assumptions based on best available information to estimate their values. There can be no assurance that any of the contracts comprising our backlog presented in this Annual Report will result in actual revenue in any particular periods or that the actual revenue from such contracts will equal our backlog estimates. Furthermore, there can be no assurance that any contract included in our estimated backlog that actually generates revenue will be profitable. These backlog estimates are based on our experience under such contracts and similar contracts and may not be accurate. As of December 31, 2008 and 2009, our total backlog was $168.1 million and $210.7 million, respectively. We have included $60.4 million in our estimated backlog as of December 31, 2009 for awarded contracts. Approximately $127.2 million of backlog is not expected to be filled in 2010.
Loss of limited source suppliers may result in delays or additional expenses.
We obtain hardware components and complete products from a limited group of suppliers, and we do not have any long term agreements with any of these suppliers obligating them to continue to sell components or products to us. Our reliance on them involves significant risks, including reduced control over quality, price, and delivery schedules. Moreover, any financial instability of, or consolidation among, our manufacturers or contractors could result in our having to find new suppliers. We may experience significant delays in manufacturing and shipping our products to customers if we lose these sources or if the supplies from these sources are delayed, or are of poor quality or supplied in insufficient amounts. As a result, we may be required to incur additional development, manufacturing and other costs to establish alternative sources of supply. It may take several months to locate alternative suppliers, if required, or to re-tool our products to accommodate components from different suppliers. We cannot predict if we will be able to obtain replacement components within the time frames we require at an affordable cost, or at all. Any delays resulting from suppliers failing to deliver components or products on a timely basis, in sufficient quantities and of sufficient quality or any significant increase in the price of components from existing or alternative suppliers could disrupt our ability to meet customer demands or reduce our gross margins.
Our business could be adversely affected by negative audits by government agencies, and we could be required to reimburse the U.S. government for costs that we have expended on our contracts, and our ability to compete successfully for future contracts could be materially impaired.
Government agencies may audit us as part of their routine audits and investigations of government contracts. As part of an audit, these agencies may review our performance on contracts, cost structures and compliance with applicable laws, regulations and standards. These agencies may also review the adequacy of, and our compliance with, our internal control systems and policies, including our purchasing, property, estimating, compensation and management information systems. Furthermore, government audit standards have recently changed, and companies, like us, who work with government agencies have come under increased audit scrutiny. If any of our costs are found to be improperly allocated to a specific contract, the costs may not be reimbursed and any costs already reimbursed for such contract may have to be refunded. An audit could materially affect our competitive position and result in a material adjustment to our financial results or statement
22
Table of Contents
of operations. If a government agency audit uncovers improper or illegal activities, we may be subject to civil and criminal penalties and administrative sanctions, including termination of contracts, forfeiture of profits, suspension of payments, fines and suspension or debarment from doing business with the federal government. In addition, we could suffer serious reputational harm if allegations of impropriety were made against us. If we were suspended or debarred from contracting with the federal government generally, or if our reputation or relationships with government agencies were impaired, or if the government otherwise ceased doing business with us or significantly decreased the amount of business it does with us, our revenues and prospects would be materially harmed.
Any failure to protect our intellectual property rights could impair our ability to protect our proprietary technology which could have a material adverse effect on our business, financial condition and results of operations, and on our ability to compete effectively.
The core technology used in our products and solutions is not the subject of any patent protection, and we may be unable to obtain patent protection in the future. We rely primarily on trade secrets and confidentiality procedures to protect our proprietary technology, and cannot assure you that we will be able to enforce the patents we own effectively against third parties. Despite our efforts, these measures can only provide limited protection. Unauthorized third parties may try to copy or reverse engineer portions of our products or otherwise obtain and use our intellectual property. If we fail to protect our intellectual property rights adequately, our competitors may gain access to our technology, and our business would thus be harmed. In addition, defending our intellectual property rights may entail significant expense. Any of our trademarks or other intellectual property rights may be challenged by others or invalidated through administrative processes or litigation. In addition, our patents, or any patents that may be issued to us in the future, may not provide us with any competitive advantages, or may be challenged by third parties. Furthermore, legal standards relating to the validity, enforceability and scope of protection of intellectual property rights are uncertain. Effective patent, trademark, copyright and trade secret protection may not be available to us in every country in which we market our solutions. The laws of some foreign countries may not be as protective of intellectual property rights as those in the United States, and domestic and international mechanisms for enforcement of intellectual property rights may be inadequate. Accordingly, despite our efforts, we may be unable to prevent third parties from infringing upon or misappropriating our intellectual property or otherwise gaining access to our technology.
We may be required to expend significant resources to monitor and protect our intellectual property rights. We may initiate claims or litigation against third parties for infringement of our proprietary rights or to establish the validity of our proprietary rights. Any such litigation, whether or not it is ultimately resolved in our favor, could result in significant expense to us and divert the efforts of our technical and management personnel. For example, in April 2005 we initiated a lawsuit against Northrop Grumman which asserted that Northrop caused us harm by misappropriating our trade secrets. Our management devoted a significant amount of time to, and we spent a significant amount of funds in connection with, this lawsuit, which was settled in 2007.
We may be sued by third parties for alleged infringement of their proprietary rights.
As the size of our market increases, the likelihood of an intellectual property claim against us increases. Our technologies may not be able to withstand third-party claims against their use. Any intellectual property claims, with or without merit, could be time-consuming and expensive to litigate or settle, and could divert management attention away from the execution of our business plan. In addition, we may be required to indemnify our customers for third-party intellectual property infringement claims, which would increase the cost to us of an adverse ruling in such a claim. An adverse determination could also prevent us from offering our solutions to others.
23
Table of Contents
Ming Hsieh controls a significant amount of our outstanding stock, and this may delay or prevent a change of control of our company or adversely affect our stock price.
Ming Hsieh, our Chief Executive Officer, controlled a significant amount of our outstanding common stock as of December 31, 2009. As a result, he is able to substantially influence matters requiring stockholder approval, such as the election of directors and the approval of significant corporate transactions. These types of transactions include transactions involving an actual or potential change of control of our company or other transactions that other stockholders may deem to be in their best interests and in which such stockholders could receive a premium for their shares.
Because competition for highly qualified project managers and technical personnel is intense, we may not be able to attract and retain the managers we need to support our business plan.
To execute our business plan, we must attract and retain highly qualified project managers. Competition for hiring these managers is intense, especially with regard to engineers with high levels of experience in designing, developing and integrating biometrics solutions. We may not be successful in attracting and retaining qualified managers. Many of the companies with which we compete for hiring experienced managers have greater resources than we have. In addition, in making employment decisions, particularly in the Internet and high-technology industries, job candidates often consider the value of the equity incentives they are to receive in connection with their employment. Significant volatility in the price of our stock may, therefore, adversely affect our ability to attract or retain key managers. If we fail to attract new personnel or fail to retain and motivate our current managers, our business and future growth prospects could be severely harmed.
Competition for skilled personnel in our industry is intense and companies such as ours sometimes experience high attrition rates with regard to their skilled employees. In addition, we often must comply with provisions in federal government contracts that require employment of persons with specified levels of education and work experience. The loss of any significant number of our existing key technical personnel or our inability to attract and retain key technical employees in the future could have a material adverse effect on both our ability to win new business and our financial results.
International uncertainties and fluctuations in the value of foreign currencies could harm our profitability.
During the years ended December 31, 2008 and December 31, 2009, revenues outside of the Americas accounted for approximately 14% and 16%, respectively, of our total revenues. We also currently have international operations, including offices in Austria, Canada, China, Taiwan and the United Kingdom. Our international revenues and operations are subject to a number of material risks, including, but not limited to:
| • | difficulties in building and managing foreign operations; |
| • | regulatory uncertainties in foreign countries; |
| • | difficulties in enforcing agreements and collecting receivables through foreign legal systems and other relevant legal issues; |
| • | longer payment cycles; |
| • | foreign and U.S. taxation issues; |
| • | potential weaknesses in foreign economies; |
| • | fluctuations in the value of foreign currencies; |
| • | general economic and political conditions in the markets in which we operate; and |
| • | unexpected domestic and international regulatory, economic or political changes. |
24
Table of Contents
Fluctuations in the value of foreign currencies relative to the U.S. dollar may, in some locations, make our solutions more expensive than solutions offered by our competitors. This would make our solutions less price competitive, which could harm our business. We do not currently engage in currency hedging activities to limit the risks of currency fluctuations. Therefore, fluctuations in the value of foreign currencies could harm our profitability.
If biometrics solutions and products based on biometrics other than fingerprints become predominant or more significant in the biometrics market, our business, financial condition and results of operations could suffer materially.
Our current business and products are based primarily on fingerprint biometrics. It is possible that other biometrics solutions could become predominant or more significant in the future, such as biometrics based on face or iris recognition. In such event, we cannot assure you that we would be able to develop and market successful products and solutions based on these other biometrics or that any such products or solutions we develop would be as successful as our fingerprint biometric solutions.
Our products and solutions could have unknown defects or errors, which may give rise to claims against us or divert application of our resources from other purposes.
Products and solutions as complex as those we offer frequently develop or contain undetected defects or errors. Despite testing, defects or errors may arise in our existing or new products and solutions, which could result in loss of revenue or market share, failure to achieve market acceptance, diversion of development resources, injury to our reputation and increased service and maintenance costs. Defects or errors in our products and solutions might discourage customers from purchasing future products and services.
Potential future acquisitions could be difficult to integrate, divert the attention of key management personnel, disrupt our business, dilute stockholder value and adversely affect our financial results.
As part of our business strategy, we intend to consider acquisitions of companies, technologies and products that we feel could accelerate our ability to compete in our core markets or allow us to enter new markets. Acquisitions involve numerous risks, including:
| • | difficulties in integrating operations, technologies, accounting and personnel; |
| • | difficulties in supporting and transitioning customers of our acquired companies; |
| • | diversion of financial and management resources from existing operations; |
| • | risks of entering new markets; |
| • | potential loss of key employees; and |
| • | inability to generate sufficient revenues to offset acquisition costs. |
Acquisitions also frequently result in the recording of goodwill and other intangible assets which are subject to potential impairments in the future that could harm our financial results. In addition, if we finance acquisitions by issuing convertible debt or equity securities, our existing stockholders may be diluted, which could affect the market price of our stock. As a result, if we fail to properly evaluate acquisitions or investments, we may not achieve the anticipated benefits of any such acquisitions, and we may incur costs in excess of what we anticipate.
Our charter documents and Delaware law may deter potential acquirers of our business and may thus depress our stock price.
Our amended and restated certificate of incorporation and our bylaws contain provisions that could delay or prevent a change of control of our company that our stockholders might consider favorable. In addition, we are
25
Table of Contents
governed by the provisions of Section 203 of the Delaware General Corporation Law, which may discourage, delay or prevent certain business combinations with stockholders owning 15% or more of our outstanding voting stock. These and other provisions in our charter documents may make it more difficult for stockholders or potential acquirers to initiate actions that are opposed by the then-current board of directors, including delaying or impeding a merger, tender offer, or proxy contest or other change of control transaction involving our company. Any delay or prevention of a change of control transaction could cause stockholders to lose a substantial premium over the then current market price of their shares.
The trading price of our common stock is volatile.
The trading prices of the securities of technology companies have historically been highly volatile. Accordingly, the trading price of our common stock is likely to be subject to wide fluctuations. Factors affecting the trading price of our common stock may include:
| • | variations in our financial results; |
| • | announcements of technological innovations, new solutions, strategic alliances or significant agreements by us or by our competitors; |
| • | recruitment or departure of key personnel; |
| • | changes in the estimates of our financial results or changes in the recommendations of any securities analysts that elect to follow our common stock; and |
| • | market conditions in our industry, the industries of our customers and the economy as a whole. |
In addition, if the market for biometrics or other technology stocks or the stock market in general experiences continued or greater loss of investor confidence, the trading price of our common stock could decline for reasons unrelated to our business or financial results. The trading price of our common stock might also decline in reaction to events that affect other companies in our industry even if these events do not directly affect us.
Future sales of shares by existing stockholders could cause our stock price to decline.
All of our outstanding shares are eligible for sale in the public market, subject in certain cases to volume limitations under Rule 144 of the Securities Act of 1933, as amended. Also, shares subject to outstanding options and rights under our 2000 Stock Option Plan and 2004 Equity Incentive Plan are eligible for sale in the public market to the extent permitted by the provisions of various vesting agreements and Rules 144 and 701 under the Securities Act. If these shares are sold, or if it is perceived that they will be sold in the public market, the trading price of our common stock could decline.
In addition, Ming Hsieh, who was our sole stockholder prior to our initial public offering, continues to hold a substantial number of shares of our common stock. Sales by Mr. Hsieh of a substantial number of shares, or the expectation that such sales may occur, could significantly reduce the market price of our common stock.
If we fail to maintain an effective system of internal controls, we may not be able to accurately report our financial results. As a result, current and potential stockholders could lose confidence in our financial reporting, which would harm our business.
Effective internal controls are necessary for us to provide reliable financial reports. If we cannot provide reliable financial reports, our operating results could be misstated, our reputation may be harmed and the trading price of our stock could be negatively affected. There can be no assurance that our controls over financial processes and reporting will be effective in the future.
26
Table of Contents
Item 1B. Unresolved Staff Comments
None.
Our corporate headquarters occupies approximately 151,000 square feet in Pasadena, California in a building we purchased in 2005. We also lease properties in Reston, Virginia, Dublin, Ohio, Austin Texas, Albany, New York, London, U.K., Vienna, Austria, Taipei, Taiwan, Beijing, China and Ontario, Canada for use as local project management and business development offices, and lease a manufacturing and research and development facility in Shenzhen, China. The size and location of these properties changes from time to time based on business requirements. In addition, we own a 20,074 square feet building in South Pasadena, California which we currently lease to a third party. We believe our space is adequate for current needs and that suitable additional or substitute space will be available to accommodate the foreseeable expansion of our operations.
From time to time, we may become involved in various lawsuits and legal proceedings which arise in the ordinary course of business. However, litigation is subject to inherent uncertainties, and an adverse result in these or other matters may arise from time to time that may harm our business. We are not currently aware of any such legal proceedings or claims that we believe will have, individually or in the aggregate, a material adverse affect on our business, financial condition or operating results.
27
Table of Contents
Item 5. Market for Registrant’s Common Equity, Related Stockholder Matters and Issuer Purchases of Equity Securities
Our common stock has been traded on the NASDAQ Global Select Market (formerly the NASDAQ National Market) under the symbol “COGT” since September 24, 2004. Prior to that time, there was no public market for our common stock. The following table sets forth the range of high and low sales prices on the NASDAQ Global Select Market of the common stock for the periods indicated, as reported by NASDAQ.
| Common Stock Price | ||||||
| High | Low | |||||
| Fiscal Year 2008 |
||||||
| First Quarter 2008 |
$ | 11.50 | $ | 8.28 | ||
| Second Quarter 2008 |
12.77 | 8.85 | ||||
| Third Quarter 2008 |
12.38 | 9.60 | ||||
| Fourth Quarter 2008 |
14.40 | 7.88 | ||||
| Fiscal Year 2009 |
||||||
| First Quarter 2009 |
$ | 13.52 | $ | 9.88 | ||
| Second Quarter 2009 |
12.58 | 10.05 | ||||
| Third Quarter 2009 |
11.58 | 10.07 | ||||
| Fourth Quarter 2009 |
10.39 | 8.53 | ||||
As of February 24, 2010, there were 89,553,152 holders of record of our common stock. On February 24, 2010, the last sale price reported on the NASDAQ Global Select Market for our common stock was $10.44 per share.
We did not declare or pay any cash dividends on our common stock during our fiscal years ended December 31, 2008 and 2009. We do not anticipate paying dividends on our common stock for at least the foreseeable future. Any determination to pay dividends in the future will be at the discretion of our Board of Directors and will depend upon our results of operations, financial condition and other factors as the Board of Directors, in its discretion, deems relevant.
Issuer Purchases of Equity Securities (1)
| Period |
Total Number of Shares Purchased |
Average Price Paid per Share |
Total Number of Shares Purchased as Part of Publicly Announced Plans or Programs |
Approximate Dollar Value of Shares that May Yet Be Purchased Under the Plans or Programs | ||||||
| October 1, 2009 - October 31, 2009 |
— | $ | — | — | $ | 90,625,768 | ||||
| November 1, 2009 - November 12, 2009 (2) |
121,259 | 9.02 | 121,259 | 89,532,588 | ||||||
| November 13, 2009 - November 30, 2009 (3) |
146,510 | 8.58 | 146,510 | 98,742,991 | ||||||
| December 1, 2009 - December 31, 2009 (3) |
101,500 | 8.71 | 101,500 | 97,858,424 | ||||||
| Total |
369,269 | 369,269 | 97,858,424 | |||||||
| (1) | On November 1, 2007, we announced that our Board of Directors authorized a program to repurchase up to $100 million of our common shares over a 12 month period expiring in October 2008 (the “Repurchase Program”). On November 13, 2008, we announced that our Board of Directors had extended the expiration date of the Repurchase Program to November 12, 2009 and increased the amount of common stock that may be repurchased under the program to an aggregate of up to $150 million. Acting pursuant to this Repurchase Program, we repurchased a total of 6,160,336 shares during 2007, 2008 and 2009 at an aggregate cost of |
28
Table of Contents
| $60.5million. On November 3, 2009, we announced that our Board of Directors authorized a new repurchase program that replaces the Repurchase Program (the “New Repurchase Program”). Under the New Repurchase Program we may repurchase up to $100 million of our common shares over a 12 month period beginning on November 13, 2009 and expiring on November 12, 2010. Acting pursuant to this New Repurchase Program, we repurchased a total of 248,010 shares during November and December 2009 at an aggregate cost of $2.1 million. We are not obligated to purchase any shares. Depending on market conditions, shares may be repurchased, using our cash resources, from time to time at prevailing market prices through open market or negotiated transactions. Subject to applicable securities laws, repurchases may be made at such times and in such amounts as our management deems appropriate. Purchases can be discontinued at any time our management feels additional purchases are not warranted. The authorized amount remaining available under the New Repurchase Program for share repurchases was $97.9million at December 31, 2009. |
| (2) | Purchases made pursuant to the Repurchase Program |
| (3) | Purchases made pursuant to the New Repurchase Program |
29
Table of Contents
Performance Measurement Comparison
The following graph illustrates a comparison of the total cumulative stockholder return on our common stock since September 24, 2004, the date of our initial public offering, to two indices: (i) Center for Research in Security Prices (“CRSP”) Total Return Index for the NASDAQ Stock Market and (ii) the NASDAQ Computer and Data Processing Services Index. The graph assumes an initial investment of $100 on September 24, 2004 and that all dividends have been reinvested. No cash dividends have been declared on our common stock since the date of our initial public offering. The comparisons in the graph are required by the SEC and are not intended to forecast or be indicative of possible future performance of our common stock.
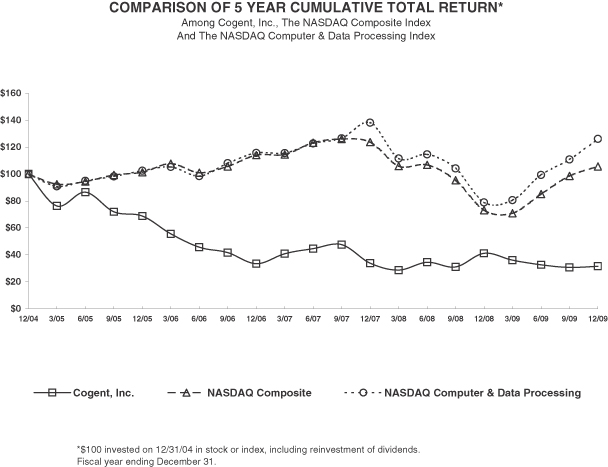
30
Table of Contents
Item 6. Selected Consolidated Financial Data
The following selected consolidated financial data should be read together with “Management’s Discussion and Analysis of Financial Condition and Results of Operations” and our consolidated financial statements and related notes included elsewhere in this Annual Report. The selected consolidated balance sheet data as of December 31, 2008 and 2009 and the selected consolidated statement of income data for each of the three years in the period ended December 31, 2009, have been derived from our audited consolidated financial statements, which are included elsewhere in this Annual Report. The selected consolidated balance sheet data as of December 31, 2005, 2006 and 2007 and selected consolidated statement of income data for the years ended December 31, 2005 and 2006 have been derived from our audited consolidated financial statements not included in this Annual Report. Historical results are not necessarily indicative of the results to be expected in the future.
| Year Ended December 31, | |||||||||||||||||
| 2005 | 2006 | 2007 | 2008 | 2009 | |||||||||||||
| (in thousands) | |||||||||||||||||
| Statements of Income Data: |
|||||||||||||||||
| Revenues: |
|||||||||||||||||
| Product revenues |
$ | 141,649 | $ | 79,055 | $ | 80,572 | $ | 90,761 | $ | 84,512 | |||||||
| Maintenance and services revenues |
18,240 | 22,602 | 25,222 | 34,920 | 45,071 | ||||||||||||
| Total revenues |
159,889 | 101,657 | 105,794 | 125,681 | 129,583 | ||||||||||||
| Cost of revenues: |
|||||||||||||||||
| Cost of product revenues (1) |
53,308 | 37,455 | 33,081 | 29,335 | 33,205 | ||||||||||||
| Cost of maintenance and services revenues (1) |
4,997 | 6,252 | 7,615 | 15,146 | 15,697 | ||||||||||||
| Total cost of revenues |
58,305 | 43,707 | 40,696 | 44,481 | 48,902 | ||||||||||||
| Gross profit |
101,584 | 57,950 | 65,098 | 81,200 | 80,681 | ||||||||||||
| Operating expenses: |
|||||||||||||||||
| Research and development (1) |
8,908 | 8,627 | 10,625 | 14,788 | 14,918 | ||||||||||||
| Selling and marketing (1) |
7,543 | 7,974 | 9,382 | 13,187 | 13,216 | ||||||||||||
| General and administrative (1) |
10,152 | 13,031 | 19,927 | 10,157 | 10,460 | ||||||||||||
| Income from settlement of lawsuit |
— | — | — | (10,000 | ) | — | |||||||||||
| Total operating expenses |
26,603 | 29,632 | 39,934 | 28,132 | 38,594 | ||||||||||||
| Operating income |
74,981 | 28,318 | 25,164 | 53,068 | 42,087 | ||||||||||||
| Other income: |
|||||||||||||||||
| Interest income |
9,050 | 17,325 | 22,132 | 16,862 | 10,531 | ||||||||||||
| Other, net |
518 | 441 | (117 | ) | 189 | 496 | |||||||||||
| Total other income |
9,568 | 17,766 | 22,015 | 17,051 | 11,027 | ||||||||||||
| Income before income taxes |
84,549 | 46,084 | 47,179 | 70,119 | 53,114 | ||||||||||||
| Income tax provision (benefit) |
19,263 | 16,356 | 18,537 | 24,939 | 20,654 | ||||||||||||
| Net income |
$ | 65,286 | $ | 29,728 | $ | 28,642 | $ | 45,180 | $ | 32,460 | |||||||
| (1) | Includes share based compensation expense as follows: |
| Year Ended December 31, | |||||||||||||||
| 2005 | 2006 | 2007 | 2008 | 2009 | |||||||||||
| (in thousands) | |||||||||||||||
| Cost of product revenues |
$ | 246 | $ | 307 | $ | 332 | $ | 470 | $ | 488 | |||||
| Cost of maintenance and services revenues |
444 | 471 | 320 | 576 | 625 | ||||||||||
| Research and development |
1,751 | 650 | 350 | 937 | 939 | ||||||||||
| Selling and marketing |
1,483 | 1,387 | 919 | 912 | 840 | ||||||||||
| General and administrative |
2,154 | 1,641 | 804 | 801 | 685 | ||||||||||
| $ | 6,078 | $ | 4,456 | $ | 2,725 | $ | 3,696 | $ | 3,577 | ||||||
31
Table of Contents
| Year Ended December 31, | |||||||||||||||
| 2005 | 2006 | 2007 | 2008 | 2009 | |||||||||||
| (in thousands, except per share data) | |||||||||||||||
| Net income per share (2): |
|||||||||||||||
| Basic |
$ | 0.74 | $ | 0.32 | $ | 0.30 | $ | 0.50 | $ | 0.36 | |||||
| Diluted |
$ | 0.69 | $ | 0.31 | $ | 0.30 | $ | 0.50 | $ | 0.36 | |||||
| Weighted average number of shares used in per share calculations: |
|||||||||||||||
| Basic |
88,403 | 94,051 | 94,223 | 89,947 | 89,628 | ||||||||||
| Diluted |
94,053 | 96,037 | 95,837 | 90,938 | 90,575 | ||||||||||
| December 31, | |||||||||||||||
| 2005 | 2006 | 2007 | 2008 | 2009 | |||||||||||
| (in thousands) | |||||||||||||||
| Balance Sheet Data: |
|||||||||||||||
| Cash and cash equivalents |
$ | 19,805 | $ | 18,801 | $ | 8,955 | $ | 34,862 | $ | 28,726 | |||||
| Investments in marketable securities |
330,795 | 395,425 | 435,352 | 445,034 | 497,145 | ||||||||||
| Working capital |
359,190 | 365,330 | 374,736 | 316,454 | 311,402 | ||||||||||
| Total debt |
— | — | — | — | — | ||||||||||
| Total assets |
513,265 | 540,941 | 551,188 | 620,131 | 640,563 | ||||||||||
| Deferred revenue |
45,158 | 37,504 | 27,648 | 74,978 | 61,973 | ||||||||||
| Total stockholders’ equity |
458,612 | 490,559 | 510,216 | 519,472 | 552,087 | ||||||||||
| (2) | See Note 1 to our consolidated financial statements for an explanation of the determination of the number of shares used to compute basic and diluted per share amounts. |
Item 7. Management’s Discussion and Analysis of Financial Condition and Results of Operations
This report contains forward-looking statements. These statements relate to future events or our future financial performance. In some cases, you can identify forward-looking statements by terminology such as “may,” “will,” “should,” “expect,” “plan,” “anticipate,” “believe,” “estimate,” “predict,” “potential” or “continue,” the negative of such terms or other comparable terminology. These statements are only predictions. Actual events or results may differ materially.
Although we believe that the expectations reflected in the forward-looking statements are reasonable, we cannot guarantee future results, levels of activity, performance or achievements. Moreover, neither we, nor any other person, assume responsibility for the accuracy and completeness of the forward-looking statements. We are under no obligation to update any of the forward-looking statements after the filing of this Annual Report to conform such statements to actual results or to changes in our expectations.
The following discussion of our financial condition and results of operations should be read in conjunction with our consolidated financial statements and the related notes and other financial information appearing elsewhere in this Annual Report. Readers are also urged to carefully review and consider the various disclosures made by us which attempt to advise interested parties of the factors which affect our business, including without limitation the disclosures made in Item 1A of Part I of this Annual Report under the caption “Risk Factors”.
Risk factors that could cause actual results to differ from those contained in the forward-looking statements include but are not limited to: changes in government policies; uncertain political conditions in international markets; deriving a significant portion of revenues from a limited number of customers; deriving a significant portion of revenues from the sale of solutions pursuant to government contracts; failure of the biometrics market to experience significant growth; failure of our products to achieve broad acceptance; potential fluctuations in
32
Table of Contents
quarterly and annual results; changes in our effective tax rate; failure to successfully compete; failure to comply with government regulations; failure to accurately predict financial results due to long sales cycles; negative publicity and/or loss of clients due to security breaches resulting in the disclosure of confidential information; loss of export licenses or changes in export laws; failure to manage projects; rapid technology change in the biometrics market; loss of a key member of management team; termination of backlog orders; loss of limited source suppliers; negative audits by government agencies; failure to protect intellectual property; and exposure to intellectual property and product liability claims.
Overview
We are a leading provider of advanced Automated Fingerprint Identification Systems, (“AFIS”), and other fingerprint biometrics solutions to governments, law enforcement agencies and other organizations worldwide. We were incorporated and commenced operations in 1990. We have been researching, designing, developing and marketing AFIS and other fingerprint biometrics solutions since inception. During most of our operating history, we have achieved positive income and cash flows from operations. For the years ended December 31, 2008 and December 31, 2009, our revenues increased as our revenue base diversified from a product and customer standpoint. In addition to our strong AFIS products business, during these periods we experienced significant revenues from three other areas: our maintenance and service revenues increased as a percentage of our total revenues; sales of our web-based application service programs increased; and sales of our handheld mobile scanners became an important contributor to our revenue. We expect these trends to continue in 2010, and believe the result will be revenues increasing in 2010 over 2009 levels. During 2010 we expect to recognize revenue from previously announced contracts with customers including Northrop Grumman, U.K. Post Office Limited, Ecuador and the Department of Homeland Security, or DHS, as well as from new contracts with customers such as the DHS and various programs in Europe.
Sources of Revenues
We generate product revenues principally from sales of our AFIS solutions, which typically consist of our Programmable Matching Accelerator, (“PMA”), servers and other AFIS equipment, including workstations and live-scans, bundled with our proprietary software. Also included in product revenues are fees generated from design and deployment of our AFIS solutions. We generate maintenance revenues from maintenance contracts that are typically included with the sale of our AFIS solutions. Maintenance contracts for technical support and software updates generally cover a period of one year, and after contract expiration, our customers have the right to purchase maintenance contract renewals, which generally cover a period of one year. Revenues from maintenance contracts are deferred and amortized on a straight-line basis over the life of the maintenance obligation. We generate services revenues from engineering services and AFIS system operation services that are not an element of an arrangement for the sale of products. These services are typically performed under fixed-price and time-and-material agreements.
We market our solutions primarily to U.S. and foreign government agencies and law enforcement agencies. In a typical contract with a government agency for an initial AFIS deployment, we agree to design the AFIS, supply and install equipment and software and integrate the AFIS within the agency’s existing network infrastructure. These initial deployment contracts frequently require significant modification or customization of our solution as part of our integration services. These contracts provide for billings up to a fixed price total contract value upon completion of agreed milestones or deliveries, with each milestone or delivery typically having a value specified in the contract. These customers usually impose specific performance and acceptance criteria that must be satisfied prior to invoicing for each milestone or delivery. When customers purchase AFIS solutions that do not require significant modification or customization of our software, whether as an initial deployment or as an expansion of an existing AFIS, we typically agree to deliver the products and perform limited installation services subject to customer-specific acceptance criteria. Certain of our customers, including the DHS, submit purchase orders under blanket purchase order agreements. Blanket purchase order agreements set out the basic terms and conditions of our arrangement with the customer and simplify the procedures for
33
Table of Contents
ordering our products to avoid administrative processes that would otherwise apply, particularly with the federal government. The billing of these contracts is generally tied to delivery and acceptance of specific AFIS equipment, usually our PMA servers or live-scans. Most of our contracts for AFIS solutions also include an ongoing maintenance obligation that we honor over a term specified in the deployment contract or the blanket purchase order agreement. The nature of our business and our customer base is such that we negotiate a set of unique terms for each contract that are based upon the purchaser’s standard form of documentation.
The most significant portion of our revenues in the most recent three fiscal years has been derived form sales to the DHS. The DHS uses our solutions in connection with the implementation of the US-VISIT program. We anticipate that the DHS will account for a significant portion of our revenues for the foreseeable future. We do not have any long-term contracts with any of our customers, including the DHS, for the sale of our products, and our future sales will depend upon the receipt of new orders. Any delay or other change in the rollout of US-VISIT or any failure to obtain new orders from the DHS could cause our revenues to fall short of our expectations.
We also expect to experience continued demand from a number of other governments as they deploy AFIS solutions at points of entry and exit, including borders, seaports and airports, and in connection with national identification programs. For example, we recently won a contract with the U.K. National Mobile Identification Project (formerly known as MIDAS) to provide a full AFIS, an online ordering system and mobile biometric capture devices to suit a broad range of policing needs in the U.K. Another example is the contract we won earlier this year to provide an AFIS for the New York State Office of Temporary and Disability Assistance. The quantity and timing of orders from both U.S. and foreign government entities depends on a number of factors outside of our control, such as the level and timing of budget appropriations. Government contracts for security solutions, at points of entry and exit and in connection with national identification programs are typically awarded in open competitive bidding processes. Therefore, our future level of sales of AFIS solutions for deployments and at points of entry and exit may vary substantially, and will depend on our ability to successfully compete for this business.
Cost of Revenues and Operating Expenses
Cost of Revenues. Cost of product revenues consists principally of compensation costs incurred in designing, integrating, installing and customizing AFIS solutions, the costs associated with manufacturing, assembling and testing our AFIS solutions and utilizing subcontractors. A substantial portion of these costs represents components, such as servers, integrated circuits, workstations, live-scans and other hardware. Cost of product revenues also includes related overhead, compensation, final assembly, quality-assurance, inventory management, support costs and payments to contract manufacturers that perform assembly functions. Cost of maintenance and services revenues consists of customer support costs and training and professional service expenses, including compensation. Cost of revenues also includes share-based compensation allocable to personnel performing services related to cost of revenues. We expect our gross margin to be affected by many factors, including our mix of products and the amount of third party hardware included in our AFIS solutions. Other factors that may affect our gross margin include changes in selling prices of our products, maintenance and services, fluctuations in demand for our products, the timing and size of customer orders, fluctuations in manufacturing volumes, changes in costs of components and new product introductions by us and our competitors and agreements entered into with our subcontractors.
Research and Development. Research and development expenses consist primarily of salaries and related expenses for engineering personnel, fees paid to consultants and outside service providers, depreciation of development and test equipment, prototyping expenses related to the design, development, testing and enhancements of our products, and the cost of computer support services. We expense all research and development costs as incurred. Under our customer contracts, we typically obtain the rights to use any improvements to our technology developed on a particular customer deployment on other customer deployments. As a result, we have historically been able to moderate our research and development expenses by leveraging the
34
Table of Contents
improvements developed by our personnel working on customer engagements. Research and development expenses also include share-based compensation allocable to personnel performing services related to research and development.
Selling and Marketing. Selling and marketing expenses consist primarily of salaries, commissions and related expenses for personnel engaged in marketing, sales, public relations and advertising, along with promotional and trade show costs and travel expenses. Sales and marketing expenses also include share-based compensation allocable to personnel performing services related to sales and marketing.
General and Administrative. General and administrative expenses include salaries and related expenses for personnel engaged in finance, human resources, insurance, information technology, administrative activities and legal and accounting fees. General and administrative expenses also include share-based compensation allocable to personnel performing general and administrative services.
Settlement of Claims against Northrop
In April 2005, we initiated a lawsuit against Northrop Grumman in California State Court (Cogent Systems, Inc. vs. Northrop Grumman Corporation, Northrop Grumman Technology Overseas, Inc., et al., Superior Court of the State of California, in and for the County of Los Angeles, Case No. BC 332199) based on claims of breach of contract, conversion, misappropriation of trade secrets and other claims (the “Action”). On December 5, 2007, we and Northrop entered into a definitive Settlement Agreement and Mutual Release of Claims (the “Settlement”). Pursuant to the terms of the Settlement, we and Northrop formally settled and released all claims and causes of action alleged in the Action. Under the Settlement, we entered into four agreements with Northrop (collectively, the “Agreements”):
1. The “Settlement Agreement,” pursuant to which Northrop agreed to pay us $25 million, of which $15 million was paid in January 2008 and $10 million was paid in January 2009;
2. The “Software License Agreement,” pursuant to which Northrop will pay us $15 million over three years for a non-exclusive license to use certain of our automated fingerprint identification software in certain existing programs, of which $5 million was paid in each of January 2008, January 2009 and January 2010;
3. The “Product and Services” Agreement, pursuant to which Northrop will pay us a minimum of $20 million for products and services over the five year term of the agreement, of which $5 million was paid in January 2009; and
4. The “Strategic Alliance Agreement” pursuant to which we and Northrop will meet semiannually over the three year term of the agreement to discuss business opportunities and proposal efforts for the design, development, sale and support of biometric identification solutions.
Our total proceeds under the agreements will be $60.0 million. We have accounted for the agreements as one multiple element arrangement. The contract values for each of the agreements do not necessarily represent the fair value of each agreement. The Strategic Alliance Agreement was determined not to be an element requiring accounting recognition. We determined that the $20 million in proceeds scheduled under the Product and Services Agreement includes both a guaranteed payment component valued at $1.0 million and a component for the purchase of products and services valued at $19.0 million using VSOE of fair value in accordance with authoritative guidance issued by the FASB on software revenue recognition. We determined the fair value of the Software License Agreement and the guaranteed payment component of the Product and Services Agreement to be $30.0 million and $1.0 million, respectively, based on generally accepted valuation techniques. The residual method was used to derive the $10.0 million fair value for the Settlement Agreement.
Accounting for the Software License Agreement is subject to the FASB guidance on software revenue recognition. However, the provision of the AFIS software under the Software License Agreement did not
35
Table of Contents
represent a stand-alone arm’s length transaction. Rather, the revenue amount was determined based on a valuation. Thus, we did not believe it appropriate to apply our standard maintenance VSOE rate to this amount and we could not determine the fair value of the associated maintenance commitment. We will recognize revenue under the Software License Agreement and the Products and Services Agreement, on a combined basis, based on the lowest proportion of revenue recognizable under the contracts. While we were not able to establish VSOE of the maintenance commitment, we believe our standard maintenance rate represents a reasonable basis for the allocation of revenues recognized under the Software License Agreement, between product and maintenance, as the revenues are recognized over the term of the Software License Agreement. We will therefore allocate a portion of the revenues representing our standard annual maintenance renewal rate (based on VSOE), to maintenance revenues, in accordance with Rule 5-03(b)(1) of Regulation S-X. The remainder will be recorded as product revenues. The $1.0 million value of the guaranteed payment will be recognized as income on a pro-rata basis (i.e. each dollar of revenue under the Products and Services Agreement will result in ninety-five cents of revenue and five cents of Income from settlement of lawsuit). The residual value allocated to the Settlement Agreement is presented as Income from settlement of lawsuit in the accompanying consolidated statement of income for the year ended December 31, 2008.
Due to the risks associated with extended payment terms, recognition of the revenues and the gain on settlement of litigation will be limited to the amounts collected from Northrop. Since the recognition of revenues from several elements is limited due to risks associated with the extended payment terms, we will allocate cash collections to each element on a basis consistent with their relative fair value.
Application of Critical Accounting Estimates
Our discussion and analysis of our financial condition and results of operations are based upon our financial statements, which have been prepared in accordance with accounting principles generally accepted in the U.S. The preparation of these financial statements requires us to make estimates and judgments that affect the reported amounts of assets, liabilities, revenues and expenses, and related disclosure of contingent assets and liabilities. On an on-going basis, we evaluate these estimates, including those related to percentage-of-completion, bad debts, inventories, investments, income taxes, commitments, contingencies and litigation. We base our estimates on historical experience and on various other assumptions that are believed to be reasonable under the circumstances, the results of which form the basis for making judgments about the carrying values of assets and liabilities that are not readily apparent from other sources. Actual results may differ from these estimates under different assumptions or conditions.
We consider the following accounting estimates to be both those most important to the portrayal of our results of operations and financial condition and those that require the most subjective judgment:
| • | revenue recognition; |
| • | commitments and contingencies; |
| • | allowance for doubtful accounts; |
| • | investments in marketable securities; |
| • | accounting for taxes; and |
| • | accounting for share-based compensation. |
Revenue Recognition. Because our proprietary software is essential to the functionality of our AFIS solutions and other biometrics products, we apply the authoritative guidance issued by the FASB on software revenue recognition. For arrangements that require significant production, modification, or customization of software, we apply authoritative guidance issued by the FASB for long-term construction-type contracts and the accounting for performance of construction-type and production type contracts. To the extent an element within our software arrangements falls within a level of accounting literature that is higher than the FASB guidance on
36
Table of Contents
software revenue recognition, we record revenue on such element in accordance with the relevant authoritative literature. For arrangements that contain the lease of equipment, we account for the lease element in accordance with authoritative guidance issued by the FASB on accounting for leases and account for the remaining elements in the arrangement in accordance with authoritative guidance issued by the FASB on software revenue recognition. For arrangements that contain a non-software deliverable such as hardware, we apply authoritative guidance issued by the FASB on accounting for non-software deliverables in an arrangement containing more-than-incidental software and recognize revenue when all other revenue recognition criteria are met. For multiple element arrangements not subject to software revenue recognition, we account for these arrangements in accordance with authoritative guidance issued by the FASB on revenue arrangements with multiple deliverables. The application of the appropriate accounting principle to our revenue is dependent upon the specific transaction and whether the sale includes systems, software and services or a combination of these items. As our business evolves, the mix of products and services sold will impact the timing of when revenue and related costs are recognized. Additionally, revenue recognition involves judgments, including the determination of vendor specific evidence of fair value, estimates of costs to complete contracts accounted for using the percentage of completion method of accounting and assessments of the likelihood of nonpayment. We analyze various factors, including a review of specific transactions, the credit-worthiness of our customers, our historical experience and market and economic conditions. Changes in judgments on these factors could materially impact the timing and amount of revenue and costs recognized.
Product Revenues
The timing of product revenues recognition is dependent on the nature of the product sold and is generally comprised of the following:
| • | Revenues associated with AFIS solutions that do not require significant modification or customization of our software, exclusive of amounts allocated to maintenance for which the Company has vendor specific evidence of fair value (“VSOE”) are recognized upon installation and receipt of written acceptance of the solution by the customer when required by the provisions of the contract, provided all other criteria for revenue recognition have been met. |
| • | Revenues associated with AFIS solutions that require significant modification or customization of our software, are recognized using the percentage-of-completion method. The percentage-of-completion method reflects the portion of the anticipated contract revenue which has been earned, equal to the ratio of labor effort expended to date to the anticipated final labor effort, based on current estimates of total labor effort necessary to complete the project. The amount subject to the percentage-of-completion method is exclusive of the maintenance, the fair value of which is established by VSOE. Material differences may result in the amount and timing of our revenue for any period if actual results differ from our judgments and estimates. The Company recognizes revenue in this manner from sales of significant initial AFIS deployments. |
| • | Revenue associated with the sale of our application specific integrated circuit, or ASIC applications, stand-alone live-scans and other biometric products, exclusive of maintenance (when applicable), the fair value of which is established by VSOE, is recognized upon shipment to the customer provided (i) persuasive evidence of an arrangement exists, (ii) title and risk of ownership has passed to the buyer, (iii) the fee is fixed or determinable and (iv) collection is deemed probable. |
| • | Revenue associated with service offerings where the Company maintains and operates a portion of the AFIS systems on an outsourced application-hosting basis is recognized on a per transaction basis provided (i) persuasive evidence of an arrangement exists, (ii) the fee is fixed or determinable and (iii) collection is deemed probable. |
| • | Revenue associated with contracts where sufficient VSOE cannot be established for the allocation of revenue to the various elements of the arrangement is deferred until the earlier of the point at which (i) such sufficient VSOE is established or (ii) all elements of the arrangement have been delivered, except for when the only undelivered element in the arrangement for which VSOE has not been established is maintenance. In these instances revenue is recognized ratably over the contractual |
37
Table of Contents
| maintenance term, but in accordance with Rule 5-03(b)(1) of Regulation S-X, the Company allocates a portion of the revenues recognized to maintenance revenues based on an analysis of historical maintenance renewals, and the residual is allocated to product revenues. Revenues recognized under such arrangements was $179,000, $671,000 and $3.9 million for years ended December 31, 2007, 2008 and 2009, respectively. |
| • | As a result of our analysis of historical maintenance renewals that occurred through December 31, 2009, the Company determined that during the twelve months ended December 31, 2009, the Company no longer had sufficient pricing consistency of maintenance renewals to establish VSOE of maintenance for our AFIS arrangements bundled with maintenance that were executed during the nine months ended December 31, 2009. During the year ended December 31, 2009, the impact on such arrangements was the deferral of $1.0 million of revenue that would have otherwise been recognized. Any new AFIS arrangements that the Company executes in future periods in which maintenance becomes the only undelivered element and the Company is unable to establish VSOE of maintenance, would typically result in the total payments due under the arrangement being deferred and recognized as revenue, subject to the Rule 5-03(b)(1) allocation, ratably over the contractual maintenance term. |
| • | Cash received from customers in advance of recognition of the related revenue is recorded as deferred revenue. |
Maintenance Revenues
Maintenance revenue consists of fees for providing technical support and software updates on a when-and-if available basis. We recognize all maintenance revenue ratably over the applicable maintenance period. We determine the amount of maintenance revenue to be deferred through reference to substantive maintenance renewal provisions contained in a particular arrangement or, in the absence of such renewal provisions, through reference to VSOE of maintenance renewal rates. We consider substantive maintenance provisions to be provisions where the stated maintenance renewal as a percentage of the product fee is comparable to our normal pricing for maintenance only renewals. In the event that maintenance included in an AFIS solutions contract does not have VSOE, the entire arrangement fee, including the contractual amount of the maintenance obligation, is included in revenues and recognized ratably over the term of the maintenance period, as described above under the caption “Product Revenues.”
Services Revenues
Professional services revenue is primarily derived from engineering services and AFIS system operation and maintenance services that are not an element of an arrangement for the sale of products. These services are generally billed on a time-and-materials basis. The majority of our professional services are performed either directly or indirectly for U.S. government organizations. Revenue from such services is recognized as the services are provided.
The amount of revenue recognized from commissions where we are acting as an agent is the net amount after payments are made to the primary obligor responsible for delivering the services.
Revenue Recognition Criteria
We recognize revenue when persuasive evidence of an arrangement exists, the element has been delivered, the fee is fixed or determinable and collection of the resulting receivable is probable.
Persuasive evidence of an arrangement: We use either contracts signed by both the customer and us or written purchase orders issued by the customer that legally bind us and the customer as evidence of an arrangement.
38
Table of Contents
Product delivery: We deem delivery to have occurred when AFIS solutions are installed and, when required under the terms of a particular arrangement, upon acceptance by the customer. Shipments of our ASICs, stand-alone live-scans and other biometric products are recognized as revenue when shipped and title and risk of ownership has passed to the buyer.
Fixed or determinable fee: For product arrangements not accounted for using the percentage-of-completion method, we consider the fee to be fixed or determinable if the fee is not subject to refund or adjustment and the payment terms are within normal established practices. If the fee is not fixed or determinable, we recognize the revenue as amounts become due and payable.
Collection is deemed probable: We conduct a credit review for all significant transactions at the time of the arrangement to determine the credit-worthiness of the customer. Collection is deemed probable if we expect that the customer will pay amounts under the arrangement as payments become due.
Deferred Revenue. Our deferred revenue balance results primarily from payments received from customers in advance of recognition of the related revenue and, to a lesser extent, from invoicing of customers prior to recognition of the related revenue. Certain customers make upfront payments resulting in cash collected prior to our recognition of revenue. These payments can be significant. We record this upfront payment as deferred revenue and reduce the deferred revenue balance as revenue is recognized. As a result, our deferred revenue balance fluctuates from quarter to quarter because it is a function of the timing of (i) the receipt of cash payments from those customers who pay in advance of revenue recognition, (ii) invoicing of customers in advance of revenue recognition and (iii) amortization of deferred revenues into revenues. Deferred revenues also consist of payments received in advance from our customers for maintenance agreements, under which revenues are recognized ratably over the term of the maintenance period. However, the fluctuation in the deferred revenue balance from quarter to quarter is generally not significantly affected by the deferred maintenance revenue. Because the mix of customers who pay or are invoiced in advance of revenue recognition changes from period to period, fluctuations in our deferred revenue balance are not a reliable indicator of total revenue to be recognized in any future period. Our cash flow from operations is also affected each quarter as a result of fluctuations in the deferred revenue balance.
Commitments and Contingencies. We periodically evaluate all pending or threatened contingencies and commitments, if any, that are reasonably likely to have a material adverse effect on our operations or financial position. We assess the probability of an adverse outcome and determine if it is remote, reasonably possible or probable as defined in accordance with authoritative guidance issued by the FASB on accounting for contingencies. If information available prior to the issuance of our financial statements indicates that it is probable that an asset had been impaired or a liability had been incurred at the date of our financial statements, and the amount of the loss, or the range of probable loss can be reasonably estimated, then such loss is accrued and charged to operations. If no accrual is made for a loss contingency because one or both of the conditions pursuant to authoritative guidance issued by the FASB on accounting for contingencies are not met, but the probability of an adverse outcome is at least reasonably possible, we will disclose the nature of the contingency and provide an estimate of the possible loss or range of loss, or state that such an estimate cannot be made.
Allowances for Doubtful Accounts. We maintain an allowance for doubtful accounts for estimated losses resulting from the inability of our customers to make required payments, which results in a provision for bad debt expense. We determine the adequacy of this allowance by evaluating individual customer accounts receivable, through consideration of the customer’s financial condition, credit history and current economic conditions. If the financial condition of our customers was to deteriorate, resulting in an impairment of their ability to make payments, additional allowances may be required.
Investments in Marketable Securities. Our investments in marketable securities consist of money market funds, certificates of deposit and commercial paper, U.S. Treasury securities, government-sponsored enterprise securities, municipal bonds, foreign government bonds and corporate bonds and notes. Marketable securities are classified as available-for-sale securities and are accounted for at their fair value. We have the intent, ability and
39
Table of Contents
history of holding these securities until maturity. Unrealized holding gains and losses are excluded from earnings and reported net of the related tax effect in other comprehensive income (OCI) as a separate component of stockholders’ equity. When the fair value of an investment declines below its original cost, we consider all available evidence to evaluate whether the decline is other-than-temporary. Among other things, we consider the duration and extent of the decline and economic factors influencing the markets. If a decline in fair value is judged to be other-than-temporary, the cost basis of the individual security is written down to fair value as a new cost basis and the amount of the write-down is included in earnings (that is, accounted for as a realized loss). The new cost basis is not to be changed for subsequent recoveries in fair value. Subsequent increases in the fair value of available-for-sale securities are included in OCI; subsequent decreases in fair value, if not an other-than-temporary impairment, also are included in OCI. The determination of whether a loss is other than temporary is highly judgmental and may have a material impact on our results of operations.
Management makes decisions relating to our marketable securities in accordance with the criteria, policies and guidelines set forth in a written investment policy adopted by our Board of Directors. The primary goal of our investment policy is to invest cash balances in a manner that ensures the preservation and liquidity of those funds. We are not permitted to invest or trade in securities for short-term speculative purposes, or otherwise hold investments in speculative debt or equity.
The investment policy sets forth eligible investments and mandates the following with respect to our investment portfolio:
| • | The maximum maturity for each issue is three years, and the maximum weighted average maturity of our investment portfolio is no more than two years; |
| • | Investments (other than direct obligations of the U.S. Government and securities of U.S. Government-sponsored agencies) must have a short-term rating of at least A-1/SP-1 by Standard & Poor’s or P-1/MIG 1 by Moody’s. If there is no short-term rating the issuer must have a long-term rating of single “A” or better by Standard & Poor’s or Moody’s. Investments in longer term issues must have a rating of at least single “A” by Standard & Poor’s and/or Moody’s; and |
| • | Positions in all investments may not exceed 5% per issuer; provided that there is no limitation with regard to money market sweep funds, direct obligations of the U.S. Government or securities of U.S. Government-sponsored agencies. |
Accounting for Taxes. In preparing our consolidated financial statements, we estimate our income tax liability in each of the jurisdictions in which we operate by estimating our actual current tax exposure together with assessing temporary differences resulting from differing treatment of items for tax and financial statement purposes. As of December 31, 2009, our net deferred tax assets were $21.2 million. Management judgment is required in assessing the realizability of our deferred tax assets. In performing this assessment, we consider whether it is more likely than not that some portion or all of the deferred tax assets will not be realized. The ultimate realization of deferred tax assets is dependent upon the generation of future taxable income during the periods in which those temporary differences become deductible. We consider the scheduled reversal of deferred tax liabilities, projected future taxable income, and tax planning strategies in making this assessment. In the event that actual results differ from our estimates or we adjust our estimates in future periods, we may need to make or adjust valuation allowances with respect to our deferred tax assets, which could materially impact our financial position and results of operations. Our income tax provision is based on calculations and assumptions that may be subject to examination by the Internal Revenue Service and other tax authorities. Should the actual results differ from our estimates, we would have to adjust the income tax provision in the period in which the facts that give rise to the revision become known. Tax law and rate changes are reflected in the income tax provision in the period in which such changes are enacted.
We generate a significant portion of our revenues from contracts with foreign government agencies. Each country with which we do business has its own particular rules to determine the point at which our activities
40
Table of Contents
within such country will become subject to taxes, if any. To the extent our contracts with foreign government agencies are subject to income taxes and we do not generate adequate foreign tax credits for purposes of our Federal income tax return, our effective tax rate may be impacted.
Effective January 1, 2007, we adopted authoritative guidance issued by the FASB on accounting for uncertainty in income taxes, which requires significant judgment in determining what constitutes an individual tax position as well as assessing the outcome of each tax position. Changes in judgment as to recognition or measurement of tax positions can materially affect the estimate of the effective tax rate and consequently, affect our operating results.
Accounting for Share-Based Compensation. The calculation of share-based employee compensation expense involves estimates that require management’s judgment. These estimates include the fair value of each of our stock option awards, which is estimated on the date of grant using a Black-Scholes option-pricing model as discussed in Note 11 of our consolidated financial statements included elsewhere in this report. The fair value of options granted is amortized on a straight-line basis over the requisite service periods of the awards, which are generally the vesting periods. The expected term of stock option awards granted is calculated using the “simplified method”, which utilizes the weighted average expected life of each tranche of stock option, determined based on the sum of each tranche’s vesting period plus one-half of the period from the vesting date of each tranche to the stock option’s expiration in accordance with authoritative accounting guidance. We estimate the volatility of our common stock at the date of grant based on the implied volatility of publicly traded options on our common stock. Our decision to use implied volatility was based upon the availability of actively traded options on our common stock and our belief that implied volatility is more representative of future stock price trends than historical volatility. We base the risk-free interest rate that we use in the Black-Scholes option valuation model on the implied yield in effect at the time of option grant on U.S. Treasury zero-coupon issues with equivalent remaining terms. We do not anticipate paying any cash dividends in the foreseeable future. Consequently, we use an expected dividend yield of zero in the Black-Scholes option valuation model. We estimate forfeitures at the time of grant and revise those estimates in subsequent periods if actual forfeitures differ from those estimates. We use historical data to estimate pre-vesting option forfeitures and record share-based compensation expense only for those awards that are expected to vest.
Beginning in 2007, the Compensation Committee of the Company’s Board of Directors has issued awards of nonvested equity share units to certain of the Company’s directors, employees and executive officers under the Company’s 2004 Equity Incentive Plan. These awards entitle the holder to shares of common stock subject to certain terms and, generally, vest in 25% increments each year on the anniversary of the grant date throughout a four year vesting period. The nonvested equity share unit awards are valued based on the closing market price on the date of award. We use historical data to estimate pre-vesting nonvested share forfeitures and record share-based compensation expense only for those awards that are expected to vest. Nonvested equity share unit compensation is to be amortized and charged to operations on a straight-line basis over the four year vesting period.
41
Table of Contents
Results of Operations
The following table sets forth selected statements of income data for each of the periods indicated expressed as a percentage of total revenues:
| Year Ended December 31, | |||||||||
| 2007 | 2008 | 2009 | |||||||
| Revenues: |
|||||||||
| Product revenues |
76.2 | % | 72.2 | % | 65.2 | % | |||
| Maintenance and services revenues |
23.8 | 27.8 | 34.8 | ||||||
| Total revenues |
100.0 | 100.0 | 100.0 | ||||||
| Cost of revenues: |
|||||||||
| Cost of product revenues |
31.3 | 23.3 | 25.6 | ||||||
| Cost of maintenance and services revenues |
7.2 | 12.1 | 12.1 | ||||||
| Total cost of revenues |
38.5 | 35.4 | 37.7 | ||||||
| Gross profit |
61.5 | 64.6 | 62.3 | ||||||
| Operating expenses: |
|||||||||
| Research and development |
10.0 | 11.8 | 11.5 | ||||||
| Selling and marketing |
8.9 | 10.5 | 10.2 | ||||||
| General and administrative |
18.8 | 8.1 | 8.1 | ||||||
| Income from settlement of lawsuit |
— | (8.0 | ) | — | |||||
| Total operating expenses |
37.7 | 22.4 | 29.8 | ||||||
| Operating income |
23.8 | 42.2 | 32.5 | ||||||
| Income before income taxes |
44.6 | 55.8 | 41.0 | ||||||
| Income tax provision |
17.5 | 19.8 | 16.0 | ||||||
| Net income |
27.1 | % | 36.0 | % | 25.0 | % | |||
Comparison of Results for the Years Ended December 31, 2008 and 2009
Revenues. Revenues were $129.6 million for the year ended December 31, 2009 compared to $125.7 million for the year ended December 31, 2008. Product revenues were $84.5 million for the year ended December 31, 2009 compared to $90.8 million for the year ended December 31, 2008. The $6.3 million, or 6.9% decrease in product revenues was primarily driven by a decrease of $18.3 million in revenue from the DHS, partially offset by the recognition of $12.5 million in revenue from the Bureau of Census and Hong Kong Police.
Maintenance and services revenues increased to $45.1 million for the year ended December 31, 2009 from $34.9 million for the year ended December 31, 2008. The increase of $10.2 million or 29.2% was primarily due to (i) an increase in maintenance renewals and engineering services associated with product sales in prior periods, and (ii) maintenance revenues earned under recent completed arrangements for systems for DHS and Morocco.
Gross Profit. Gross profit as a percentage of revenues was 62.3% for the year ended December 31, 2009 compared to 64.6% for the same period of the prior year. Product gross margins were 60.7% for the year ended December 31, 2009 compared to 67.7% for the year ended December 31, 2008. The decline in margins on product revenues was primarily due to a change in the mix of products sold during the year ended December 31, 2009. During 2009, we recognized a greater portion of our revenues from hardware intensive solutions which typically have lower margins than our software intensive solutions.
42
Table of Contents
Costs of maintenance and service revenues slightly increased to $15.7 million for the year ended December 31, 2009 from $15.1 million for the year ended December 31, 2008. Maintenance and services gross margins increased to 65.2% during the year ended December 31, 2009 from 56.6% during the year ended December 31, 2008. The increase maintenance and services gross margin was primarily due to the timing of recognition of maintenance renewal revenue differing from when we incur the actual costs for the maintenance.
Research and Development. Research and development expenses increased $0.1 million, or 0.9% to $14.9 million for year ended December 31, 2009, compared to $14.8 million for the year ended December 31, 2008. As a percentage of revenues, research and development expenses decreased 0.3% to 11.5% of revenues for the year ended December 31, 2009 compared to 11.8% of revenues for the year ended December 31, 2008. This slight decrease in research and development expenses as a percentage of revenues was primarily due to higher revenues realized in 2009 compared to 2008 with relatively flat research and development expenses year over year.
Selling and Marketing. Selling and marketing expenses were consistent at $13.2 million for the years ended December 31, 2009 and 2008. As a percentage of revenues such expenses decreased to 10.2% for the year ended December 31, 2009 from 10.5% for the year ended December 31, 2008. This decrease in selling and marketing expenses as a percentage of revenues was primarily due to higher revenues realized in 2009 compared to 2008 with relatively flat selling and marketing expenses year over year.
General and Administrative. General and administrative expenses were $10.5 million and $10.2 million for the years ended December 31, 2009 and 2008, respectively. As a percentage of revenues, general and administrative expenses remained flat at 8.1% for the year ended December 31, 2009 and 2008, respectively. The increase in general and administrative expenses in 2009 was primarily due to increases in our bad debt reserve.
Interest Income. We earned interest income of $10.5 million during the year ended December 31, 2009, compared to $16.9 million during the year ended December 31, 2008. The decrease in interest income was primarily due to us holding a higher amount of securities issued or guaranteed by the U.S. Government and a decrease in interest rates, partially offset by higher average cash and investment balances as a result of cash generated from operations.
Income Tax Provision. We recognized an income tax provision of $20.7 million during the year ended December 31, 2009 as a result of the net income earned in the period. Our effective tax rate of 38.9% for the year ended December 31, 2009 represents federal, state and foreign taxes on our income reduced primarily as a result of benefits resulting from the domestic production activities deduction, disqualifying disposition of incentive stock options; and by federal and state research and development credits. We recognized an income tax provision of $24.9 million, with an effective tax rate of 35.6%, during the year ended December 31, 2008 as a result of the net income earned in the period. Our effective tax rate of 35.6% for the year ended December 31, 2008 represents federal, state and foreign taxes on our income reduced primarily as a result of benefits resulting from domestic production activities deduction, disqualifying disposition of incentive stock options; and by research and development credits. The increase in the effective tax rate from 35.6% during the year ended December 31, 2008 to 38.9% during the year ended December 31, 2009 is primarily due to a reduction in the domestic production activity deduction for 2008 as a result of the Company’s change in method of accounting for deferred revenue for tax purposes, as well as state tax changes and less deductions related to equity based compensation.
Comparison of Results for the Years Ended December 31, 2007 and 2008
Revenues. Revenues were $125.7 million for the year ended December 31, 2008 compared to $105.8 million for the year ended December 31, 2007. Product revenues were $90.8 million for the year ended December 31, 2008 compared to $80.6 million for the year ended December 31, 2007. The $10.2 million, or 12.6% increase in product revenues was primarily driven by an increase of $37.5 million in revenues from the DHS and Spain. This increase was partially offset by a decrease of $22.2 million in revenues from CNE and RCMP, due to the completion of contracts under which we provided AFIS solutions.
43
Table of Contents
Maintenance and services revenues increased to $34.9 million for the year ended December 31, 2008 from $25.2 million for the year ended December 31, 2007. The increase of $9.7 million or 38.5% was primarily due to (i) an increase in maintenance renewals and engineering services associated with product sales in prior periods, (ii) maintenance revenues earned under recent completed arrangements for systems for DHS and Morocco and (iii) contribution from our Security Solutions Division, which we acquired in April 2008 (the “SSD Division”).
Gross Profit. Gross profit as a percentage of revenues was 64.6% for the year ended December 31, 2008 compared to 61.5% for the same period of the prior year. Product gross margins were 67.7% for the year ended December 31, 2009 compared to 58.9% for the year ended December 31, 2007. The improvement in margins on product revenues was primarily due to a change in the mix of products sold during the year ended December 31, 2008. During 2007, we recognized a large portion of our revenues from hardware intensive AFIS solutions which typically have lower margins than our software intensive solutions.
Costs of maintenance and service revenues increased to $15.1 million for the year ended December 31, 2008 from $7.6 million for the year ended December 31, 2007. Maintenance and services gross margins decreased from 69.8% during the year ended December 31, 2007 to 56.6% during the year ended December 31, 2008. The increase in costs of maintenance and services was primarily due to an increase in the number of personnel engaged in providing maintenance and support services, as we expanded capacity in response to increasing demand. In addition, the decrease in margins on maintenance and services were partially due to the SSD Division, which has lower gross margins than our historic service gross margins.
Research and Development. Research and development expenses increased to $14.8 million, or 11.8% of revenues, for year ended December 31, 2008, compared to $10.6 million, or 10.0% of revenues, for the year ended December 31, 2007. The increase of $4.2 million, or 39.2% was primarily due to an increase in salary expense and other labor related costs driven by an increase in research and development headcount. In connection with our effort to develop new products, such as the Fusion and Mobile Ident II for our customers, we increased research and development headcount by 48% to 176 as of December 31, 2008 from 119 as of December 31, 2007.
Selling and Marketing. Selling and marketing expenses increased to $13.2 million, or 10.5% of revenues, for the year ended December 31, 2008, compared to $9.4 million, or 8.9% of revenues, for the year ended December 31, 2007. The increase in selling and marketing expenses of $3.8 million, or 40.6%, was primarily due to an increase in consulting service fees of $1.4 million, to support business development and proposal activities, and an increase in salary expenses and other labor related costs of $1.4 million which were driven by an increase in headcount. This increase in consulting services and headcount was in anticipation of a general increase in the number and size of contracts coming up for proposal in the biometric industry.
General and Administrative. General and administrative expenses decreased to $10.2 million, or 8.1% of revenues, for the year ended December 31, 2008, compared to $19.9 million, or 18.8% of revenues, for the year ended December 31, 2007. The $9.7 million, or 49.0%, decrease was primarily due to the settlement, effective as of September 2007, of our legal action against Northrop Grumman. Legal fees incurred in connection with our lawsuit against Northrop Grumman were $10.8 million during the year ended December 31, 2007, and we only incurred minor legal expenses relating to the settlement in the first quarter of the year ended December 31, 2008. This decrease was partially offset by an increase in accounting fees of $584,000 primarily relating to the Northrop settlement in 2008.
Income from Settlement of Lawsuit. In January 2008, we received $20.0 million in connection with the settlement of our legal claims against Northrop. Upon collecting the proceeds from the settlement we recognized $10.0 million in the quarter ended March 31, 2008, representing the residual fair value of the Settlement Agreement component, as Income from settlement of lawsuit.
44
Table of Contents
Interest Income. We earned interest income of $16.9 million during the year ended December 31, 2008, compared to $22.1 million during the year ended December 31, 2007. The decrease in interest income was primarily due to a decrease in interest rates partially offset by cash generated from operations.
Income Tax Provision. We recognized an income tax provision of $24.9 million during the year ended December 31, 2008 as a result of the net income earned in the period. Our effective tax rate of 35.6% for the year ended December 31, 2008 represents federal, state and foreign taxes on our income reduced primarily as a result of benefits resulting from the domestic production activities deduction, disqualifying disposition of incentive stock options; and by federal and state research and development credits. We recognized an income tax provision of $18.5 million, with an effective tax rate of 39.3%, during the year ended December 31, 2007 as a result of the net income earned in the period. Our effective tax rate of 39.3% for the year ended December 31, 2007 represents federal, state and foreign taxes on our income reduced primarily as a result of benefits resulting from research and development credits. The decrease in the effective tax rate from 39.3% during the year ended December 31, 2007 to 35.6% during the year ended December 31, 2008 is primarily due the tax benefits from the domestic production activities deduction and disqualifying disposition of incentive stock options.
Liquidity and Capital Resources
Since our inception, we have financed our operations by generating cash from operations. Since September 2004 we have supplemented our cash resources through public offerings of our common stock, raising $228.6 million in our initial public offering in September 2004 and $96.8 million in a subsequent public offering in June 2005. As of December 31, 2009, we had $28.7 million in cash and cash equivalents and $497.1 million in investments in marketable securities.
Cash provided by operations
In addition to our net income, the key drivers of our cash flows from operations are changes in accounts receivable, accounts payable and accrued expenses, deferred revenues, inventory and deferred income taxes and taxes payable. The effect of these key drivers on our cash provided by operations for the years ended December 31, 2007, 2008 and 2009 was as follows:
| Year ended December 31, | ||||||||||||
| 2007 | 2008 | 2009 | ||||||||||
| (in thousands) | ||||||||||||
| Key Drivers of Cash Provided by Operations |
||||||||||||
| Net income |
$ | 28,642 | $ | 45,180 | $ | 32,460 | ||||||
| Changes in: |
||||||||||||
| Billed and unbilled accounts receivable |
(5,535 | ) | 964 | 8,981 | ||||||||
| Inventory and contract related costs |
8,057 | (6,906 | ) | 871 | ||||||||
| Prepaid expenses and other current assets |
96 | (1,397 | ) | (4,703 | ) | |||||||
| Accounts payable and accrued expenses |
1,899 | 10,507 | (34 | ) | ||||||||
| Deferred revenues |
(9,878 | ) | 47,330 | (12,988 | ) | |||||||
| Deferred income taxes |
15,128 | (8,608 | ) | 17,736 | ||||||||
| Net other activity |
(2,288 | ) | 2,124 | 15,927 | ||||||||
| Net cash provided by operating activities |
$ | 36,121 | $ | 89,194 | $ | 58,250 | ||||||
A substantial portion of our revenues represents sales of multiple element software based solutions. Elements of our software based solutions may be delivered immediately or may be delivered over several years. The timing for the recognition of our revenues, and the related costs, is dependent on the nature of the products and services sold and does not necessarily coincide with cash collections. On the other hand, the timing of cash collections depends on our customers’ budgeting processes, the length and terms of each arrangement and the competitive bidding process.
45
Table of Contents
The $13.0 million net decrease in deferred revenues during the year ended December 31, 2009 was primarily due to the completion of various contracts, including DHS, HP Italy, Hong Kong, and Census. This decrease was offset by the deferral of revenue relating to funds collected for products and services purchased under the settlement agreements by Northrop as well as contracts with other customers that were begun but not completed during the year. The $47.3 million increase in deferred revenues during the year ended December 31, 2008 was partially due to $10.0 million collected from Northrop pursuant to services to be provided under the settlement agreements. The remaining $37.3 million increase in deferred revenue is related to various contracts, including DHS, Maryland, Spain and HP Italy.
The amount of income taxes paid for the year ended December 31, 2009 has decreased from 2008 primarily as a result of temporary differences related to the timing of recognizing income for book and tax purposes. In addition, our effective tax rates have been impacted by the disqualifying disposition of incentive stock options and the deduction for qualified production activities income, which reduce our income taxes payable and result in positive cash flow. Our cash flows from income taxes could be impacted depending on the timing of disqualifying dispositions. To the extent we have previously recorded share-based compensation expense related to incentive stock options we record the benefit from the disqualifying disposition of incentive stock options as a reduction to our provision for income taxes.
Cash used in Investing Activities
Net cash used in investing activities was $35.5 million, $22.9 million and $60.8 million for the years ended December 31, 2007, 2008 and 2009, respectively. Investing activities consisted primarily of (i) purchases and sales of available-for-sale securities and (ii) capital expenditures, which generally consisted of computer equipment and software for our engineering, service and information technology departments. Cash used of $33.8 million, $9.7 million and $58.0 million during the years ended December 31, 2007, 2008 and 2009, respectively, represented the net increase of investments in marketable securities due to purchases and sales of available-for-sale securities. Capital expenditures of $2.3 million, $5.3 million and $2.8 million during the years ended December 31, 2007, 2008 and 2009, respectively, primarily represented the purchase of computer equipment and software for our engineering, service and information technology departments. In 2008 and 2009, capital expenditures also included costs related to improvements made to our new corporate headquarters in Pasadena, California. Additionally in 2008, we paid $3.0 million to acquire a 20% interest in ANP Technologies, Inc. and $4.9 million to acquire the assets of the Security Solutions Division of MAXIMUS Inc.
Cash used in Financing Activities
Cash used in financing activities was $10.7 million, $40.7 million and $3.8 million for the years ended December 31, 2007, 2008 and 2009, respectively. We used $13.9 million to repurchase 1,142,302 shares of our common stock during the year ended December 31, 2007, $45.5 million to repurchase 4,896,775 shares of our common stock during the year ended December 31, 2008 and $3.2 million to repurchase 369,269 shares of our common stock during the year ended December 31, 2009. Proceeds from the exercise of stock options were $637,000, $1.1 million and $0.3 million during the years ended December 31, 2007, 2008 and 2009, respectively. We paid employment taxes on behalf of our employees relating to our nonvested share awards of $1.3 million and $1.1 million during the years ended December 31, 2008 and 2009, respectively.
On November 1, 2007, we announced that our Board of Directors had approved a stock repurchase program (the “Repurchase Program”). Pursuant to the Repurchase Program, beginning on November 5, 2007, we were authorized to repurchase up to $100 million of our common stock. The initial expiration date of the Repurchase Program was October 29, 2008. On November 13, 2008, we announced that our Board of Directors had extended the expiration date of the Repurchase Program to November 12, 2009 and increased the amount of common stock that may be purchased under the Repurchase Program to an aggregate of up to $150 million. Acting pursuant to this Repurchase Program, we repurchased a total of 6,160,336 shares during 2007, 2008 and 2009 at an aggregate cost of $60.5 million.
46
Table of Contents
On November 3, 2009, we announced that our Board of Directors authorized a new repurchase program that replaces the Repurchase Program (the “New Repurchase Program”). Under the New Repurchase Program we may repurchase up to $100 million of our common shares over a 12 month period beginning on November 13, 2009 and expiring on November 12, 2010. Acting pursuant to this New Repurchase Program, we repurchased a total of 248,010 shares during November and December 2009 at an aggregate cost of $2.1 million.
We are not obligated to purchase any shares. Depending on market conditions, shares may be repurchased, using our cash resources, from time to time at prevailing market prices through open market or negotiated transactions. Subject to applicable securities laws, repurchases may be made at such times and in such amounts as our management deems appropriate. Purchases can be discontinued at any time our management feels additional purchases are not warranted.
We currently have no material cash commitments, except our normal recurring trade payables, expense accruals and operating leases, all of which are currently expected to be funded through existing working capital and future cash flows from operations. We believe that our cash and cash equivalent balances will be sufficient to satisfy our cash requirements for at least the next twelve months. Although we cannot accurately anticipate the effect of inflation or foreign exchange markets on our operations, we do not believe these external economic forces have had, or are likely in the foreseeable future to have, a material impact on our liquidity or capital resources.
At December 31, 2009 we did not have any relationships with unconsolidated entities or financial partnerships, such as entities often referred to as structured finance, special purpose, or variable interest entities, which would have been established for the purpose of facilitating off-balance sheet arrangements or other contractually narrow or limited purposes. In addition, we did not engage in trading activities involving non-exchange traded contracts. As a result, we are not exposed to any financing, liquidity, market or credit risk that could arise if we had engaged in such relationships. We do not have material relationships and transactions with persons or entities that derive benefits from their non-independent relationship with us or our related parties.
Commitments and contingencies as discussed in the Note 10 to the Consolidated Financial Statements do not include payments that could be made related to our unrecognized tax benefits liability, which amounted to $8.9 million as of December 31, 2009. The timing and amount of any future payments is not reasonably estimable, as such payments are dependent on the completion and resolution of examinations with tax authorities.
At December 31, 2009, our outstanding contractual cash commitments were as follows:
| Total | Less than 1 Year |
1-3 Years | 3-5 Years | More than 5 Years | |||||||||||
| (in thousands) | |||||||||||||||
| Non-cancelable operating lease obligations |
$ | 6,890 | $ | 1,467 | $ | 2,081 | $ | 1,476 | $ | 1,866 | |||||
Recent Accounting Pronouncements
Effective January 1, 2008, we adopted the disclosure requirements (see Note 5 to the consolidated financial statements) of authoritative guidance issued by the Financial Accounting Standards Board (“FASB”) on fair value measurements. On January 1, 2009, we implemented the previously deferred provisions of this guidance for nonfinancial assets and liabilities recorded at fair value, which had no impact on our financial statements but did expand our associated disclosures.
Effective January 1, 2009, we adopted authoritative guidance issued by the FASB on business combinations. Adoption had no impact on our financial statements.
On January 1, 2009, we adopted the authoritative guidance issued by the FASB that changes the accounting and reporting for non-controlling interests. Adoption had no impact on our financial statements.
47
Table of Contents
On April 1, 2009, we adopted the authoritative guidance issued by the FASB that provides additional guidance for estimating fair value when the volume and level of activity for the asset or liability have significantly decreased and requires that companies provide interim and annual disclosures of the inputs and valuation technique(s) used to measure fair value. Adoption of this guidance did not have a significant impact on our accounting for financial instruments, but did expand our associated disclosures.
On April 1, 2009, we adopted the authoritative guidance issued by the FASB that provides additional guidance designed to create greater clarity and consistency in accounting and presenting impairment losses on securities. This guidance is intended to bring greater consistency to the timing of impairment recognition, and provide greater clarity to investors about the credit and noncredit components of impaired debt securities that are not expected to be sold. The measure of impairment in comprehensive income remains fair value. It also requires increased and more timely disclosures regarding expected cash flows, credit losses, and an aging of securities with unrealized losses. Adoption of this guidance did not have a significant impact on our accounting for financial instruments, but did expand our associated disclosures.
On April 1, 2009, we adopted the authoritative guidance issued by the FASB that provides required disclosures about fair value of financial instruments in financial statements for interim reporting periods of publicly traded companies as well as in annual financial statements. Adoption of this accounting guidance did not have a significant impact on our accounting for financial instruments.
On June 30, 2009, we adopted the authoritative guidance issued by the FASB that provides guidance to establish general standards of accounting for, and disclosures of, events that occur after the balance sheet date but before financial statements are issued or are available to be issued. The adoption of this guidance did not have a material impact on our consolidated financial position, results of operations or cash flows.
In June 2009, the FASB issued authoritative guidance on the consolidation of variable interest entities, which is effective for us beginning January 1, 2010. The new guidance requires revised evaluations of whether entities represent variable interest entities, ongoing assessments of control over such entities, and additional disclosures for variable interests. We believe adoption of this new guidance will not have a material impact on our financial statements.
In October 2009, the FASB issued authoritative guidance on revenue recognition that will become effective for us beginning January 1, 2011, with earlier adoption permitted. Under the new guidance on arrangements that include software elements, tangible products that have software components and non-software components that function together to deliver the tangible products essential functionality will no longer be within the scope of the software revenue recognition guidance, and software-enabled products will now be subject to other relevant revenue recognition guidance. Additionally, the FASB issued authoritative guidance on revenue arrangements with multiple deliverables that are outside the scope of the software revenue recognition guidance. Under the new guidance, when VSOE or third party evidence for deliverables in an arrangement cannot be determined, a best estimate of the selling price is required to separate deliverables and allocate arrangement consideration using the relative selling price method. The new guidance includes new disclosure requirements on how the application of the relative selling price method affects the timing and amount of revenue recognition. We are currently evaluating the effect that adoption of this new guidance will have on our financial statements.
Other new pronouncements issued but not effective until after December 31, 2009, are not expected to have a significant effect on our consolidated financial position or results of operations.
Item 7A. Quantitative and Qualitative Disclosures about Market Risk
Although we generally bill for our products and services mostly in U.S. dollars, our financial results could be affected by factors such as changes in foreign currency rates or weak economic conditions in foreign markets. A strengthening of the dollar could make our products and services less competitive in foreign markets and
48
Table of Contents
therefore could reduce our revenues. We are billed by and pay substantially all of our vendors in U.S. dollars. In the future, an increased portion of our revenues and costs may be denominated in foreign currencies. To date, exchange rate fluctuations have had little impact on our operating results. We do not enter into derivative instrument transactions for trading or speculative purposes.
Fixed income securities are subject to interest rate risk. The fair value of our investment portfolio would not be significantly impacted by either a 100 basis point increase or decrease in interest rates due mainly to the short-term nature of the major portion of our investment portfolio. The portfolio is diversified and consists primarily of investment grade securities to minimize credit risk.
Item 8. Financial Statements and Supplementary Data
Our consolidated financial statements at December 31, 2008 and 2009 and the Report of Deloitte & Touche LLP, Independent Registered Public Accounting Firm, are included elsewhere in this Annual Report on Form 10-K.
Item 9. Changes in and Disagreements with Accountants on Accounting and Financial Disclosure
None.
Item 9A. Controls and Procedures
Evaluation of Disclosure Controls and Procedures
We maintain disclosure controls and procedures that are designed to ensure that information required to be disclosed in our Exchange Act reports is recorded, processed, summarized and reported within the time periods specified in the SEC’s rules and forms and that such information is accumulated and communicated to our management including our Chief Executive Officer and Chief Financial Officer, as appropriate, to allow for timely decisions regarding required disclosure. In designing and evaluating the disclosure controls and procedures, management recognizes that any controls and procedures, no matter how well designed and operated can provide only reasonable assurance of achieving the desired control objectives and management is required to apply its judgment in evaluating the cost-benefit relationship of possible controls and procedures.
As required by Rule 13a-15(b) under the Exchange Act, we conducted an evaluation, under the supervision and with the participation of our management, including our Chief Executive Officer and our Chief Financial Officer, of the effectiveness of the design and operation of our disclosure controls and procedures as of the end of the period covered by this report. Based upon the foregoing evaluation, our principal executive officer and our principal financial officer concluded that as of December 31, 2009 our disclosure controls and procedures were effective at the reasonable assurance level.
Changes in Our Controls
There were no changes in our internal controls over financial reporting during our most recent quarter that have materially affected, or are reasonably likely to materially affect our internal controls over financial reporting.
Report of Management on Internal Control over Financial Reporting
Our management is responsible for establishing and maintaining adequate internal control over financial reporting, as defined in Exchange Act Rule 13a-15(f). Under the supervision and with the participation of company management, including our Chief Executive Officer and Chief Financial Officer, we conducted an evaluation of the effectiveness of our internal control over financial reporting based on the framework in Internal Control — Integrated Framework issued by the Committee of Sponsoring Organizations of the Treadway Commission. Based on our evaluation, our management concluded that our internal control over financial reporting was effective as of December 31, 2009.
49
Table of Contents
REPORT OF INDEPENDENT REGISTERED PUBLIC ACCOUNTING FIRM
To the Board of Directors and Shareholders of
Cogent, Inc.
Pasadena, California
We have audited the internal control over financial reporting of Cogent, Inc. and subsidiaries (the “Company”) as of December 31, 2009, based on criteria established in Internal Control — Integrated Framework issued by the Committee of Sponsoring Organizations of the Treadway Commission. The Company’s management is responsible for maintaining effective internal control over financial reporting and for its assessment of the effectiveness of internal control over financial reporting, included in the accompanying Report of Management on Internal Control over Financial Reporting. Our responsibility is to express an opinion on the Company’s internal control over financial reporting based on our audit.
We conducted our audit in accordance with the standards of the Public Company Accounting Oversight Board (United States). Those standards require that we plan and perform the audit to obtain reasonable assurance about whether effective internal control over financial reporting was maintained in all material respects. Our audit included obtaining an understanding of internal control over financial reporting, assessing the risk that a material weakness exists, testing and evaluating the design and operating effectiveness of internal control based on the assessed risk, and performing such other procedures as we considered necessary in the circumstances. We believe that our audit provides a reasonable basis for our opinion.
A company’s internal control over financial reporting is a process designed by, or under the supervision of, the company’s principal executive and principal financial officers, or persons performing similar functions, and effected by the company’s board of directors, management, and other personnel to provide reasonable assurance regarding the reliability of financial reporting and the preparation of financial statements for external purposes in accordance with generally accepted accounting principles. A company’s internal control over financial reporting includes those policies and procedures that (1) pertain to the maintenance of records that, in reasonable detail, accurately and fairly reflect the transactions and dispositions of the assets of the company; (2) provide reasonable assurance that transactions are recorded as necessary to permit preparation of financial statements in accordance with generally accepted accounting principles, and that receipts and expenditures of the company are being made only in accordance with authorizations of management and directors of the company; and (3) provide reasonable assurance regarding prevention or timely detection of unauthorized acquisition, use, or disposition of the company’s assets that could have a material effect on the financial statements.
Because of the inherent limitations of internal control over financial reporting, including the possibility of collusion or improper management override of controls, material misstatements due to error or fraud may not be prevented or detected on a timely basis. Also, projections of any evaluation of the effectiveness of the internal control over financial reporting to future periods are subject to the risk that the controls may become inadequate because of changes in conditions, or that the degree of compliance with the policies or procedures may deteriorate.
In our opinion, the Company maintained, in all material respects, effective internal control over financial reporting as of December 31, 2009, based on the criteria established in Internal Control — Integrated Framework issued by the Committee of Sponsoring Organizations of the Treadway Commission.
We have also audited, in accordance with the standards of the Public Company Accounting Oversight Board (United States), the consolidated financial statements and financial statement schedule as of and for the year ended December 31, 2009 of the Company and our report dated March 12, 2010 expressed an unqualified opinion on those financial statements and the financial statement schedule.
/s/ Deloitte & Touche LLP
Los Angeles, California
March 12, 2010
50
Table of Contents
In February 2010, the Compensation Committee of our Board of Directors approved 2010 base salaries, 2010 Non-Equity Incentive Plan targets, equity awards and payouts under the 2009 Non-Equity Incentive Plan for the executive officers who were named in the Summary Compensation Table of our 2009 Proxy Statement. We refer to these executive officers as our “named executive officers.”
Base Salaries for 2010. The Compensation Committee increased Ming Hsieh’s base salary by 2.0% to $306,000, Paul Kim’s base salary by 2.2% to $274,000, Michael Hollowich’s base salary by 2.4% to $216,000 and James Jasinski’s base salary by 2.4% to $216,000. The adjusted base salaries are effective as of January 1, 2010.
2010 Non-Equity Incentive Plan Targets. The Compensation Committee approved 2010 contingent target awards for the named executed officers under our 2010 Non-Equity Incentive Plan. The final award, if any, will be calculated as the product of the executive officer’s base salary, applicable target percentage and a corporate performance score reflecting the achievement of company financial objectives and individual executive officer performance objectives in 2010. The range of the target percentages of base salary used in the 2010 contingent target awards for the named executive officers is 2% to 70%.
Equity Awards. The Compensation Committee approved grants of 40,000 restricted stock units to Mr. Kim, 16,000 restricted stock units to Mr. Hollowich and 16,000 restricted stock units to Mr. Jasinski. Such grants will be made effective as of May 15, 2010.
2009 Non-Equity Incentive Plan Payouts; 2009 Bonus. The Compensation Committee approved payouts under the 2009 Non-Equity Incentive Plan of $100,000 to Mr. Hsieh, $60,000 to Mr. Kim, $100,000 to Mr. Hollowich and $80,000 to Mr. Jasinski.
51
Table of Contents
Item 10. Directors, Executive Officers and Corporate Governance
The information required by this item will be set forth in the Proxy Statement or Form 10-K/A and is incorporated in this report by reference.
Item 11. Executive Compensation
The information required by this item will be set forth in the Proxy Statement or Form 10-K/A and is incorporated in this report by reference
Item 12. Security Ownership of Certain Beneficial Owners and Management and Related Stockholder Matters
The information required by this item will be set forth in the Proxy Statement or Form 10-K/A and is incorporated in this report by reference.
Item 13. Certain Relationships and Related Transactions, and Director Independence
The information required by this item will be set forth in the Proxy Statement or Form 10-K/A and is incorporated in this report by reference.
Item 14. Principal Accounting Fees and Services
The information required by this item will be set forth in the Proxy Statement or Form 10-K/A and is incorporated in this report by reference.
52
Table of Contents
Item 15. Exhibits, Financial Statement Schedules
The following documents are filed as part of this report:
Financial statement schedules other than those listed above have been omitted because they are either not required, not applicable or the information is otherwise included.
(b) Exhibits:
Exhibits.
| Exhibit |
Description of Documents | |
| 3.1(1) | Amended and Restated Certificate of Incorporation of the registrant | |
| 3.2(2) | Amended and Restated Bylaws of the registrant | |
| 4.1(3) | Specimen Common Stock Certificate | |
| 10.1(3)# | Form of Indemnity Agreement for directors and executive officers | |
| 10.2(3)# | 2000 Stock Option Plan and forms of Incentive Stock Option Agreement and Nonqualified Stock Option Agreement thereunder | |
| 10.3(5)# | Amended and Restated 2004 Equity Incentive Plan and forms of Stock Option Agreements thereunder. | |
| 10.5(3)# | Employment Agreement by and between the registrant and Paul Kim, dated January 5, 2004 | |
| 10.6(3)# | Employment Agreement by and between the registrant and Michael Hollowich, dated February 19, 2001 | |
| 10.7(3)# | Employment Agreement by and between the registrant and James Jasinski, dated May 9, 2002 | |
| 10.8(3) | Automated Fingerprint Matcher Systems Equipment and Services Blanket Purchase Agreement (BPA), dated July 11, 2002 by and between the registrant and INS Headquarters Procurement Division | |
| 10.9(3) | Tax Matters Agreement among the registrant, Ming Hsieh, Fang Liu Hsieh, Trustee of the Fang Liu Hsieh Annuity Trust No. 1 dated May 12, 2004, and Ming Hsieh, Trustee of the Ming Hsieh Annuity Trust No. 1 dated May 11, 2004 | |
| 10.11(3) | Amended and Restated Tax Matters Agreement among the registrant, Ming Hsieh, Fang Liu-Hsieh, trustee of the Fang Liu Hsieh Annuity Trust No. 1 dated May 12, 2004, and Ming Hsieh, Trustee of the Ming Hsieh Annuity Trust No. 1 dated May 12, 2004 | |
53
Table of Contents
| Exhibit |
Description of Documents | |
| 10.12(4) | Settlement Agreement entered December 5, 2007 by and between Cogent, Inc., on the one hand, and Northrop Grumman Corporation, Northrop Grumman Information Technology Overseas, Inc., Northrop Grumman Information Technology, Inc., Northrop Grumman Space & Mission Systems, Inc. and Northrop Grumman Commercial Systems, Inc., on the other hand. | |
| 10.15(6)# | Form of Notice of Restricted Stock Unit Award and Restricted Stock Unit Award Agreement for Non-Employee Directors under the Amended and Restated 2004 Equity Incentive Plan. | |
| 10.16(6)# | Form of Notice of Restricted Stock Unit Award and Restricted Stock Unit Award Agreement for Employees under the Amended and Restated 2004 Equity Incentive Plan. | |
| 21.1(7) | Subsidiaries of the Registrant. | |
| 23.1 | Consent of Deloitte & Touche LLP, Independent Registered Public Accounting Firm | |
| 31.1 | Certification of Chief Executive Officer pursuant to Rules 13a-14 and 15d-14 promulgated under the Securities Exchange Act of 1934 | |
| 31.2 | Certification of Chief Financial Officer pursuant to Rules 13a-14 and 153-14 promulgated under the Securities Exchange Act of 1934 | |
| 32.1 | Certification of Chief Executive Officer pursuant to 18 U.S.C. Section 1350, as adopted pursuant to Section 906 of the Sarbanes-Oxley Act of 2002 | |
| 32.2 | Certification of Chief Financial Officer pursuant to 18 U.S.C. Section 1350, as adopted pursuant to Section 906 of the Sarbanes-Oxley Act of 2002 | |
| (1) | Incorporated by reference to the Company’s Current Report on Form 8-K filed with the Securities and Exchange Commission on November 1, 2004. |
| (2) | Incorporated by reference to the Company’s Current Report on Form 8-K filed with the Securities and Exchange Commission on October 29, 2007. |
| (3) | Incorporated by reference to the Company’s Registration Statement on Form S-1 filed with the Securities and Exchange Commission on May 14, 2004, as amended (File No. 333-115535). |
| (4) | Incorporated by reference to the Company’s Current Report on Form 8-K filed with the Securities and Exchange Commission on December 11, 2007. |
| (5) | Incorporated by reference to the Company’s Annual Report on Form 10-K for the fiscal year ended December 31, 2007 filed with the Securities and Exchange Commission on March 3, 2008. |
| (6) | Incorporated by reference to the Company’s Quarterly Report on Form 10-Q for the quarterly period ended September 30, 2009 filed with the Securities and Exchange Commission on November 4, 2009. |
| (7) | Incorporated by reference to the Company’s Annual Report on Form 10-K for the year ended December 31, 2008 filed with the Securities and Exchange Commission on March 3, 2009. |
| # | Indicates management contract or compensatory plan. |
54
Table of Contents
REPORT OF INDEPENDENT REGISTERED PUBLIC ACCOUNTING FIRM
To the Board of Directors and Stockholders of
Cogent, Inc.
Pasadena, California
We have audited the accompanying consolidated balance sheets of Cogent, Inc. and subsidiaries (the “Company”) as of December 31, 2009 and 2008, and the related consolidated statements of income, stockholders’ equity, and cash flows for each of the three years in the period ended December 31, 2009. Our audits also included the financial statement schedule listed in the Index at Item 15. These financial statements and financial statement schedule are the responsibility of the Company’s management. Our responsibility is to express an opinion on the financial statements and financial statement schedule based on our audits.
We conducted our audits in accordance with the standards of the Public Company Accounting Oversight Board (United States). Those standards require that we plan and perform the audit to obtain reasonable assurance about whether the financial statements are free of material misstatement. An audit includes examining, on a test basis, evidence supporting the amounts and disclosures in the financial statements. An audit also includes assessing the accounting principles used and significant estimates made by management, as well as evaluating the overall financial statement presentation. We believe that our audits provide a reasonable basis for our opinion.
In our opinion, such consolidated financial statements present fairly, in all material respects, the financial position of Cogent, Inc. and subsidiaries as of December 31, 2009 and 2008, and the results of their operations and their cash flows for each of the three years in the period ended December 31, 2009, in conformity with accounting principles generally accepted in the United States of America. Also, in our opinion, such financial statement schedule, when considered in relation to the basic consolidated financial statements taken as a whole, presents fairly, in all material respects, the information set forth therein.
We have also audited, in accordance with the standards of the Public Company Accounting Oversight Board (United States), the Company’s internal control over financial reporting as of December 31, 2009, based on the criteria established in Internal Control — Integrated Framework issued by the Committee of Sponsoring Organizations of the Treadway Commission and our report dated March 12, 2010 expressed an unqualified opinion on the Company’s internal control over financial reporting.
/s/ Deloitte & Touche LLP
Los Angeles, California
March 12, 2010
F-1
Table of Contents
CONSOLIDATED BALANCE SHEETS
(amounts in thousands, except share data)
| December 31, | |||||||
| 2008 | 2009 | ||||||
| ASSETS |
|||||||
| Current assets: |
|||||||
| Cash and cash equivalents |
$ | 34,862 | $ | 28,726 | |||
| Investments in marketable securities |
277,434 | 279,498 | |||||
| Billed accounts receivable, net of allowance for doubtful accounts of $660 and $1,215 at December 31, 2008 and 2009, respectively |
30,767 | 19,984 | |||||
| Unbilled accounts receivable |
1,110 | 2,152 | |||||
| Inventory and contract related costs |
12,715 | 16,596 | |||||
| Prepaid expenses and other current assets |
3,251 | 8,477 | |||||
| Deferred income taxes |
31,956 | 12,059 | |||||
| Total current assets |
392,095 | 367,492 | |||||
| Investments in marketable securities |
167,600 | 217,647 | |||||
| Inventory and contract related costs |
5,813 | 1,063 | |||||
| Property and equipment, net |
37,192 | 37,552 | |||||
| Deferred income taxes |
9,112 | 9,162 | |||||
| Intangible and other assets |
8,319 | 7,647 | |||||
| Total assets |
$ | 620,131 | $ | 640,563 | |||
| LIABILITIES AND STOCKHOLDERS’ EQUITY |
|||||||
| Current liabilities: |
|||||||
| Accounts payable |
$ | 4,629 | $ | 4,451 | |||
| Accrued expenses |
11,574 | 12,042 | |||||
| Deferred revenues |
59,438 | 39,597 | |||||
| Total current liabilities |
75,641 | 56,090 | |||||
| Long-term liabilities |
|||||||
| Deferred revenues |
15,540 | 22,376 | |||||
| Other liabilities |
9,478 | 10,010 | |||||
| Total liabilities |
100,659 | 88,476 | |||||
| Commitments and contingencies (note 10) |
|||||||
| Stockholders’ equity: |
|||||||
| Preferred stock, $0.001 par value; 5,000,000 shares authorized; no shares issued or outstanding at December 31, 2008 and 2009, respectively |
— | — | |||||
| Common stock, $0.001 par value; 245,000,000 shares authorized; 95,943,495 and 89,548,375 shares issued and outstanding at December 31, 2008 and 2009, respectively |
120 | 120 | |||||
| Additional paid-in capital |
433,843 | 384,237 | |||||
| Retained earnings |
147,477 | 164,858 | |||||
| Accumulated other comprehensive income |
1,278 | 2,872 | |||||
| Treasury stock, at cost; 6,379,077 and zero shares at December 31, 2008 and 2009, respectively |
(63,246 | ) | — | ||||
| Total stockholders’ equity |
519,472 | 552,087 | |||||
| Total liabilities and stockholders’ equity |
$ | 620,131 | $ | 640,563 | |||
See accompanying notes to consolidated financial statements.
F-2
Table of Contents
CONSOLIDATED STATEMENTS OF INCOME
(in thousands, except per share data)
| Year Ended December 31, | |||||||||||
| 2007 | 2008 | 2009 | |||||||||
| Revenues: |
|||||||||||
| Product revenues |
$ | 80,572 | $ | 90,761 | $ | 84,512 | |||||
| Maintenance and services revenues |
25,222 | 34,920 | 45,071 | ||||||||
| Total revenues |
105,794 | 125,681 | 129,583 | ||||||||
| Cost of revenues: |
|||||||||||
| Cost of product revenues |
33,081 | 29,335 | 33,205 | ||||||||
| Cost of maintenance and services revenues |
7,615 | 15,146 | 15,697 | ||||||||
| Total cost of revenues |
40,696 | 44,481 | 48,902 | ||||||||
| Gross profit |
65,098 | 81,200 | 80,681 | ||||||||
| Operating expenses: |
|||||||||||
| Research and development |
10,625 | 14,788 | 14,918 | ||||||||
| Selling and marketing |
9,382 | 13,187 | 13,216 | ||||||||
| General and administrative |
19,927 | 10,157 | 10,460 | ||||||||
| Income from settlement of lawsuit |
— | (10,000 | ) | — | |||||||
| Total operating expenses |
39,934 | 28,132 | 38,594 | ||||||||
| Operating income |
25,164 | 53,068 | 42,087 | ||||||||
| Other income: |
|||||||||||
| Interest income |
22,132 | 16,862 | 10,531 | ||||||||
| Other, net |
(117 | ) | 189 | 496 | |||||||
| Total other income |
22,015 | 17,051 | 11,027 | ||||||||
| Income before income taxes |
47,179 | 70,119 | 53,114 | ||||||||
| Income tax provision |
18,537 | 24,939 | 20,654 | ||||||||
| Net income |
$ | 28,642 | $ | 45,180 | $ | 32,460 | |||||
| Basic net income per share |
$ | 0.30 | $ | 0.50 | $ | 0.36 | |||||
| Diluted net income per share |
$ | 0.30 | $ | 0.50 | $ | 0.36 | |||||
| Shares used in computing basic net income per share |
94,223 | 89,947 | 89,628 | ||||||||
| Shares used in computing diluted net income per share |
95,837 | 90,938 | 90,575 | ||||||||
See accompanying notes to consolidated financial statements.
F-3
Table of Contents
CONSOLIDATED STATEMENTS OF STOCKHOLDERS’ EQUITY
YEARS ENDED DECEMBER 31, 2007, 2008 AND 2009
(in thousands)
| Common Stock | Additional Paid in Capital |
Retained Earnings |
Accumulated Other Comprehensive Income (loss) |
Treasury Stock | Comprehensive Income |
Total Stockholders’ Equity |
|||||||||||||||||||||||||||
| Shares | Amount | Shares | Amount | ||||||||||||||||||||||||||||||
| Balances at January 1, 2007 |
94,493 | 120 | 419,446 | 75,019 | (154 | ) | (340 | ) | (3,872 | ) | — | 490,559 | |||||||||||||||||||||
| Stock options exercised |
478 | — | 637 | — | — | — | — | — | 637 | ||||||||||||||||||||||||
| Adoption of new FASB guidance on income taxes |
— | — | — | (1,364 | ) | — | — | — | — | (1,364 | ) | ||||||||||||||||||||||
| Excess tax benefit |
— | — | 2,481 | — | — | — | — | — | 2,481 | ||||||||||||||||||||||||
| Share-based compensation |
— | — | 2,575 | — | — | — | — | — | 2,575 | ||||||||||||||||||||||||
| Repurchase of common stock |
— | — | — | — | — | (1,142 | ) | (13,850 | ) | (13,850 | ) | ||||||||||||||||||||||
| Comprehensive income: |
|||||||||||||||||||||||||||||||||
| Net income |
— | — | — | 28,642 | — | — | — | 28,642 | 28,642 | ||||||||||||||||||||||||
| Other comprehensive income (net of tax) |
— | — | — | — | 536 | — | — | 536 | 536 | ||||||||||||||||||||||||
| Comprehensive income |
— | — | — | — | — | — | 29,178 | — | |||||||||||||||||||||||||
| Balances at December 31, 2007 |
94,971 | 120 | 425,139 | 102,297 | 382 | (1,482 | ) | (17,722 | ) | — | 510,216 | ||||||||||||||||||||||
| Stock options exercised |
826 | — | 1,108 | — | — | — | — | — | 1,108 | ||||||||||||||||||||||||
| Excess tax benefit |
— | — | 5,062 | — | — | — | — | — | 5,062 | ||||||||||||||||||||||||
| Share-based compensation |
— | — | 3,844 | — | — | — | — | — | 3,844 | ||||||||||||||||||||||||
| Nonvested equity share unit awards released |
146 | — | (1,310 | ) | — | — | — | — | — | (1,310 | ) | ||||||||||||||||||||||
| Repurchase of common stock |
— | — | — | — | — | (4,897 | ) | (45,524 | ) | (45,524 | ) | ||||||||||||||||||||||
| Comprehensive income: |
— | ||||||||||||||||||||||||||||||||
| Net income |
— | — | — | 45,180 | — | — | — | 45,180 | 45,180 | ||||||||||||||||||||||||
| Other comprehensive income (net of tax) |
— | — | — | — | 896 | — | — | 896 | 896 | ||||||||||||||||||||||||
| Comprehensive income |
— | — | — | — | — | — | — | $ | 46,076 | — | |||||||||||||||||||||||
| Balances at December 31, 2008 |
95,943 | 120 | 433,843 | 147,477 | 1,278 | (6,379 | ) | (63,246 | ) | — | 519,472 | ||||||||||||||||||||||
| Stock options exercised |
172 | — | 309 | — | — | — | — | — | 309 | ||||||||||||||||||||||||
| Tax deficiency from stock based compensation |
(984 | ) | (984 | ) | |||||||||||||||||||||||||||||
| Share-based compensation |
— | — | 3,580 | — | — | — | — | — | 3,580 | ||||||||||||||||||||||||
| Nonvested equity share unit awards released |
181 | (1,109 | ) | — | — | — | — | — | (1,109 | ) | |||||||||||||||||||||||
| Repurchase of common stock |
— | — | — | — | — | (369 | ) | (3,235 | ) | (3,235 | ) | ||||||||||||||||||||||
| Retirement of treasury stock |
(6,748 | ) | (51,402 | ) | (15,079 | ) | 6,748 | 66,481 | — | ||||||||||||||||||||||||
| Comprehensive income: |
— | ||||||||||||||||||||||||||||||||
| Net income |
— | — | — | 32,460 | — | — | — | 32,460 | 32,460 | ||||||||||||||||||||||||
| Other comprehensive income (net of tax) |
— | — | — | — | 1,594 | — | — | 1,594 | 1,594 | ||||||||||||||||||||||||
| Comprehensive income |
— | — | — | — | — | — | — | $ | 34,054 | — | |||||||||||||||||||||||
| Balances at December 31, 2009 |
89,548 | $ | 120 | $ | 384,237 | $ | 164,858 | $ | 2,872 | $ | — | $ | — | $ | 552,087 | ||||||||||||||||||
See accompanying notes to consolidated financial statements.
F-4
Table of Contents
CONSOLIDATED STATEMENTS OF CASH FLOWS
(in thousands)
| Year ended December 31, | ||||||||||||
| 2007 | 2008 | 2009 | ||||||||||
| Cash Flows from operating activities: |
||||||||||||
| Net income |
$ | 28,642 | $ | 45,180 | $ | 32,460 | ||||||
| Adjustments to reconcile net income to net cash provided by operating activities: |
||||||||||||
| Depreciation and amortization |
1,733 | 2,812 | 3,441 | |||||||||
| Allowance for doubtful accounts |
(164 | ) | 183 | 675 | ||||||||
| Share-based compensation |
2,725 | 3,696 | 3,577 | |||||||||
| Excess tax benefit from share based compensation |
(2,481 | ) | (5,062 | ) | (206 | ) | ||||||
| Amortization of bond premium (discount) on available for sale securities |
(5,691 | ) | 415 | 8,019 | ||||||||
| Equity in earnings of investee |
— | (129 | ) | (304 | ) | |||||||
| Deferred income taxes |
15,128 | (8,608 | ) | 17,736 | ||||||||
| Changes in assets and liabilities: |
||||||||||||
| Billed accounts receivable |
(4,864 | ) | 873 | 10,023 | ||||||||
| Unbilled accounts receivable |
(671 | ) | 91 | (1,042 | ) | |||||||
| Inventory and contract related costs |
8,057 | (6,906 | ) | 871 | ||||||||
| Prepaid expenses and other current assets |
96 | (1,397 | ) | (4,703 | ) | |||||||
| Other assets |
170 | (35 | ) | 193 | ||||||||
| Accounts payable |
(433 | ) | 607 | (307 | ) | |||||||
| Accrued expenses |
2,332 | 9,900 | 273 | |||||||||
| Other liabilities |
1,420 | 244 | 532 | |||||||||
| Deferred revenues |
(9,878 | ) | 47,330 | (12,988 | ) | |||||||
| Net cash provided by operating activities |
36,121 | 89,194 | 58,250 | |||||||||
| Cash Flows from investing activities: |
||||||||||||
| Purchase of available-for-sale securities |
(1,528,670 | ) | (840,255 | ) | (406,676 | ) | ||||||
| Proceeds from sale of available-for-sale securities |
1,494,915 | 830,573 | 348,690 | |||||||||
| Expiration of restrictions on cash |
585 | — | — | |||||||||
| Purchase of equity investment |
(3,000 | ) | — | |||||||||
| Acquisition of Security Solutions Division |
— | (4,927 | ) | — | ||||||||
| Purchase of property and equipment |
(2,316 | ) | (5,345 | ) | (2,789 | ) | ||||||
| Net cash used in investing activities |
(35,486 | ) | (22,954 | ) | (60,775 | ) | ||||||
| Cash Flows from financing activities: |
||||||||||||
| Payment of employment taxes related to release of nonvested equity share unit awards |
— | (1,310 | ) | (1,109 | ) | |||||||
| Proceeds from the exercise of stock options |
637 | 1,109 | 309 | |||||||||
| Excess tax benefit from share based compensation |
2,481 | 5,062 | 206 | |||||||||
| Repurchase of common stock |
(13,850 | ) | (45,524 | ) | (3,235 | ) | ||||||
| Net cash used in financing activities |
(10,732 | ) | (40,663 | ) | (3,829 | ) | ||||||
| Effect of exchange rate changes on cash |
251 | 330 | 218 | |||||||||
| Net (decrease) increase in cash and cash equivalents |
(9,846 | ) | 25,907 | (6,136 | ) | |||||||
| Cash and cash equivalents, beginning of period |
18,801 | 8,955 | 34,862 | |||||||||
| Cash and cash equivalents, end of period |
$ | 8,955 | $ | 34,862 | $ | 28,726 | ||||||
| Supplemental disclosures of cash flow information |
||||||||||||
| Cash received (paid) during the period for: |
||||||||||||
| Interest income |
$ | 15,503 | $ | 16,706 | $ | 19,504 | ||||||
| Income taxes |
$ | (1,826 | ) | $ | (28,628 | ) | $ | (5,110 | ) | |||
| Non-cash financing activities: |
||||||||||||
| Share-based compensation, capitalized and deferred as inventory and contract related costs |
$ | 150 | $ | 147 | $ | 3 | ||||||
| Conversion of property and equipment to inventories |
$ | 45 | $ | — | $ | — | ||||||
| Property and equipment included in accounts payable |
$ | 229 | ||||||||||
See accompanying notes to consolidated financial statements.
F-5
Table of Contents
NOTES TO CONSOLIDATED FINANCIAL STATEMENTS
Note 1. Description of the Business and Summary of Significant Accounting Policies
General
Cogent, Inc. and subsidiaries (“Cogent” or “the Company”) was initially incorporated in the state of California on April 20, 1990 as Cogent Systems, Inc. and was reincorporated in Delaware on May 3, 2004 as Cogent, Inc. Cogent is a provider of advanced automated fingerprint identification systems (“AFIS”) solutions, which typically consist of Cogent’s Programmable Matching Accelerator (“ PMA”), servers and other AFIS equipment, including work stations and live-scans, bundled with our proprietary software, and other fingerprint biometrics products and solutions, to governments, law enforcement agencies and other organizations worldwide. Cogent also provides professional services and technical support and maintenance services to its customers.
Basis of Presentation
The accompanying consolidated financial statements have been prepared in accordance with accounting principles generally accepted in the United States, or (“GAAP”). The consolidated financial statements include the accounts of Cogent and its wholly owned subsidiaries. Cogent and its subsidiaries are collectively referred to herein as the “Company.” All significant intercompany accounts and transactions have been eliminated.
Effective January 2008, Cogent and ANP Technologies, Inc. (“ANP”), a biological detection company producing nano-assays entered into an agreement whereby Cogent obtained 20% of the outstanding shares of ANP in exchange for $3.0 million in cash and the transfer of Cogent’s reader technology, applicable only for the biological market. Cogent’s investment in ANP is accounted for under the equity method. The Company’s share of its equity in earning of the investee, which totaled $129,000 and $304,000 during the years ended December 31, 2008 and 2009, respectively, is not material and therefore is reported in the Other, net line item in the Company’s consolidated statement of income.
Use of Estimates and Assumptions
The preparation of financial statements in conformity with generally accepted accounting principles requires management to make estimates and assumptions for the reporting period and as of the financial statement date. These estimates and assumptions affect the reported amounts of assets and liabilities, the disclosure of contingent liabilities, and the reported amounts of revenues and expenses. Actual results could differ from those estimates.
Investments in Marketable Securities
The Company accounts for its investments in debt and equity securities in conformity with authoritative guidance issued by the Financial Accounting Standards Board (“FASB”). Marketable securities are classified as available-for-sale securities and are accounted for at their fair value. Unrealized gains and losses on these securities are reported as other comprehensive income (loss). Management determines the appropriate classification of such securities at the time of purchase and reevaluates such classification as of each balance sheet date. When the fair value of an investment declines below its original cost, the Company evaluates the investment in accordance with FASB authoritative guidance that provides additional clarity to address the determination as to when an investment is considered impaired, whether that impairment is other than temporary, and the measurement of an impairment loss. To date, the Company has had no such other-than-temporary declines below cost basis. The Company utilizes specific identification in computing realized gains and losses on the sale of investments.
Accounts Receivable
The Company generally bills its customers under its long term contracts pursuant to billing schedules contained in the contracts or, upon completion of agreed milestones or deliveries, with each milestone or delivery typically having a value specified in the contract. Unbilled accounts receivable is principally comprised of
F-6
Table of Contents
revenue recognized on contracts for which invoices have not been issued. It is expected that all unbilled accounts receivable balances will be billed in the next 12 months. Amounts billable under retainage provisions are billed to the customer upon contract completion and acceptance by the customer.
Inventory and contract related costs
Inventory and contract related costs consist of the following:
| December 31, | ||||||
| 2008 | 2009 | |||||
| (in thousands) | ||||||
| Materials and components |
$ | 6,126 | $ | 8,706 | ||
| Inventory and costs related to long-term contracts |
679 | 74 | ||||
| Deferred costs of revenue |
11,723 | 8,879 | ||||
| $ | 18,528 | $ | 17,659 | |||
Materials and components are stated at the lower of cost or market determined using the first-in, first-out method. Inventoried costs relating to long-term contracts are stated at actual production costs incurred to date reduced by amounts identified with revenue recognized on progress completed. Deferred costs of revenue relate to contracts, for which revenue has been deferred, and such costs are stated at actual production costs incurred to date, which primarily include materials, labor and subcontract costs which are directly related to the contract. Deferred costs of revenue are amortized to cost of revenues at the time revenue is recognized.
Impairment of Long-Lived Assets
The Company reviews its long-lived assets in accordance with authoritative guidance issued by the FASB which provides guidance on the recognition and measurement of the impairment of long-lived assets to be held and used, and the measurement of long-lived assets to be disposed of by sale. Long-lived assets and certain identifiable intangibles with finite lives are reviewed for impairment whenever events or changes in circumstances indicate that the carrying amount of an asset may not be recoverable. Recoverability of assets to be held and used is measured by a comparison of the carrying amount of the assets to future net cash flows (undiscounted and without interest) expected to be generated by the asset. If such assets are considered to be impaired, the impairment to be recognized is measured by the amount by which the carrying amount of the assets exceeds the fair value of the assets. Assets to be disposed of are reported at the lower of the carrying amount or fair value less costs to sell.
Property and Equipment
The cost of property and equipment, less applicable estimated residual values, is depreciated over their estimated useful lives, on the straight-line method, from the date the specific asset is completed, installed, and ready for normal use, as follows:
| Useful Life | ||
| Buildings |
30 | |
| Building improvements |
10 | |
| Furniture and other equipment |
5 | |
| Computer equipment |
3-5 | |
| Purchased software |
3 |
Goodwill and Acquisition-Related Intangible Assets
The Company classifies the difference between the purchase price and the fair market value of net assets acquired as goodwill. The Company classifies intangible assets apart from goodwill if the assets have contractual or other legal rights or if the assets can be separated and sold, transferred, licensed, rented or exchanged.
F-7
Table of Contents
The Company evaluates the carrying value of goodwill and intangible assets not subject to amortization for impairment as of the first day of the fourth quarter of each calendar year or whenever events or changes in circumstances indicate that the carrying value of goodwill or intangible assets not subject to amortization may not be recoverable. For the evaluation of intangible assets not subject to amortization, the Company compares the fair value of these intangible assets to their carrying amount. If the carrying amount of these intangible assets exceed their fair value, an impairment loss would be recognized in an amount equal to that excess.
For the evaluation of goodwill, the Company applies the two-step process whereby it identifies its reporting units and determines the carrying value of each reporting unit by assigning the assets and liabilities to those reporting units in order to assess goodwill for impairment. In the first step of a two-step impairment test, the Company determines the fair value of these reporting units. The Company compares the fair value for each reporting unit to its carrying value. If the fair value of a reporting unit exceeds its carrying value, goodwill of the reporting unit is considered not impaired and no further testing is required. If the fair value does not exceed the carrying value, the second step of the impairment test shall be performed to measure the amount of impairment loss, if any. The second step compares the implied fair value of that reporting unit’s goodwill with its carrying amount. If the carrying amount of the reporting unit’s goodwill exceeds its implied fair value, an impairment loss would be recognized in an amount equal to that excess.
Concentrations of Credit Risk
Financial instruments that potentially subject the Company to significant concentrations of credit risk consist primarily of cash and cash equivalents, investments in marketable securities and accounts receivable. The Company restricts investments in cash and cash equivalents and investments in marketable securities to financial institutions with high credit standing. At December 31, 2009, the majority of the Company’s cash and cash equivalents and investments in marketable securities were held at financial institutions located in California and New York. Accounts at these institutions are insured by the Federal Deposit Insurance Corporation up to $250,000. Uninsured balances aggregate approximately $525.4 million (including foreign accounts) as of December 31, 2009. The Company performs periodic evaluations of the relative credit standing of financial institutions and limits the amount of risk by selecting financial institutions with a strong credit standing. The Company periodically performs credit evaluations of its customers and maintains reserves for potential losses on its accounts receivable.
Revenue Recognition
The Company generates revenues principally from sales of its AFIS solutions, which typically consist of PMA servers and other AFIS equipment, including workstations and live-scans, bundled with the Company’s proprietary software. The Company’s proprietary software is essential to the functionality of its AFIS solutions and other biometric products. The sales price of the Company’s AFIS solutions generally includes one year of maintenance, which can be renewed. The Company also generates revenues under long-term contracts to provide customized systems as well as revenues derived from services performed under fixed-price and time-and-material agreements. To a lesser extent, the Company generates revenues from sales of its proprietary biometrics application specific integrated circuit (“ASIC”) and biometrics products that incorporate its proprietary ASIC. The Company classifies the revenues generated by these activities as either product revenues, or as maintenance and services.
Because our proprietary software is essential to the functionality of our AFIS solutions and other biometrics products, we apply the authoritative guidance issued by the FASB on software revenue recognition . For arrangements that require significant production, modification, or customization of software, we apply authoritative guidance issued by the FASB for long-term construction-type contracts and the accounting for performance of construction-type and production type contracts. To the extent an element within our software arrangements falls within a level of accounting literature that is higher than the FASB guidance on software revenue recognition, we record revenue on such element in accordance with the relevant authoritative literature. For arrangements that contain the lease of equipment, we account for the lease element in accordance with authoritative guidance issued by the FASB on accounting for leases and account for the remaining elements in
F-8
Table of Contents
the arrangement in accordance with authoritative guidance issued by the FASB on software revenue recognition. For arrangements that contain a non-software deliverable such as hardware, we apply authoritative guidance issued by the FASB on accounting for non-software deliverables in an arrangement containing more-than-incidental software and recognize revenue when all other revenue recognition criteria are met. For multiple element arrangements not subject to software revenue recognition, we account for these arrangements in accordance with authoritative guidance issued by the FASB on revenue arrangements with multiple deliverables. The application of the appropriate accounting principle to our revenue is dependent upon the specific transaction and whether the sale includes systems, software and services or a combination of these items. As our business evolves, the mix of products and services sold will impact the timing of when revenue and related costs are recognized. Additionally, revenue recognition involves judgments, including determination of vendor specific evidence of fair value, estimates of costs to complete contracts accounted for using the percentage of completion method of accounting and assessments of the likelihood of nonpayment. We analyze various factors, including a review of specific transactions, the credit-worthiness of our customers, our historical experience and market and economic conditions. Changes in judgments on these factors could materially impact the timing and amount of revenue and costs recognized.
Product Revenues. The timing of product revenues recognition is dependent on the nature of the product sold and is generally comprised of the following:
| • | Revenues associated with AFIS solutions that do not require significant modification or customization of our software, exclusive of amounts allocated to maintenance for which the Company has vendor specific evidence of fair value (“VSOE”) are recognized upon installation and receipt of written acceptance of the solution by the customer when required by the provisions of the contract, provided all other criteria for revenue recognition have been met. |
| • | Revenues associated with AFIS solutions that require significant modification or customization of our software, are recognized using the percentage-of-completion method in accordance with provisions of FASB authoritative guidance on accounting for performance of construction-type and production type contracts. The percentage-of-completion method reflects the portion of the anticipated contract revenue which has been earned, equal to the ratio of labor effort expended to date to the anticipated final labor effort, based on current estimates of total labor effort necessary to complete the project. The amount subject to the percentage-of-completion method is exclusive of the maintenance, the fair value of which is established by VSOE. Material differences may result in the amount and timing of our revenue for any period if actual results differ from our judgments and estimates. The Company recognizes revenue in this manner from sales of significant initial AFIS deployments. |
| • | Revenue associated with the sale of our application specific integrated circuit, or ASIC applications, stand-alone live-scans and other biometric products, exclusive of maintenance (when applicable), the fair value of which is established by VSOE, is recognized upon shipment to the customer provided (i) persuasive evidence of an arrangement exists, (ii) title and risk of ownership has passed to the buyer, (iii) the fee is fixed or determinable and (iv) collection is deemed probable. |
| • | Revenue associated with service offerings where the Company maintains and operates a portion of the AFIS systems on an outsourced application-hosting basis is recognized on a per transaction basis provided (i) persuasive evidence of an arrangement exists, (ii) the fee is fixed or determinable and (iii) collection is deemed probable. |
| • | Revenue associated with contracts where sufficient VSOE cannot be established for the allocation of revenue to the various elements of the arrangement is deferred until the earlier of the point at which (i) such sufficient VSOE is established or (ii) all elements of the arrangement have been delivered, except for when the only undelivered element in the arrangement for which VSOE has not been established is maintenance. In these instances revenue is recognized ratably over the contractual maintenance term, but in accordance with Rule 5-03(b)(1) of Regulation S-X, the Company allocates a portion of the revenues recognized to maintenance revenues based on an analysis of historical maintenance renewals, and the residual is allocated to product revenues. Revenues recognized under such arrangements were $179,000, $671,000 and $3.9 million for the years ended December 31, 2007, 2008 and 2009, respectively. |
F-9
Table of Contents
As a result of our analysis of historical maintenance renewals that occurred through December 31, 2009, the Company determined that during the year ended December 31, 2009, the Company no longer had sufficient pricing consistency of maintenance renewals to establish VSOE of maintenance for our AFIS arrangements bundled with maintenance that were executed during the nine months ended December 31, 2009. During the year ended December 31, 2009, the impact on such arrangements was the deferral of $1.0 million of revenue that would have otherwise been recognized. Any new AFIS arrangements that the Company executes in future periods in which maintenance becomes the only undelivered element and the Company is unable to establish VSOE of maintenance, would typically result in the total payments due under the arrangement being deferred and recognized as revenue, subject to the Rule 5-03(b)(1) allocation, ratably over the contractual maintenance term.
| • | Cash received from customers in advance of recognition of the related revenue is recorded as deferred revenue. |
Maintenance Revenues. Maintenance revenues consist of fees for providing technical support and software updates on a when-and-if available basis. The Company recognizes all maintenance revenue ratably over the applicable maintenance period. The Company determines the amount of maintenance revenue to be deferred through reference to substantive maintenance renewal provisions contained in a particular arrangement or, in the absence of such renewal provisions, based on an analysis of separate sales of maintenance. The Company considers substantive maintenance provisions to be provisions where the stated maintenance renewal as a percentage of the product fee is comparable to its normal pricing for maintenance only renewals. In the event that maintenance included in an AFIS solutions contract does not have VSOE, the entire arrangement fee, including the contractual amount of the maintenance obligation, is recognized ratably over the term of the maintenance period.
Services Revenues. Professional services revenues are primarily derived from engineering services and AFIS system operation and maintenance services that are not an element of an arrangement for the sale of products. These services are generally billed on a time-and-materials basis. The majority of the Company’s professional services are performed either directly or indirectly for U.S. government organizations. Revenue from such services is recognized as the services are provided.
The amount of revenue recognized from commissions where the Company is acting as an agent is the net amount after payments are made to the primary obligor responsible for delivering the services.
Revenue Recognition Criteria. The Company recognizes revenue when persuasive evidence of an arrangement exists, the element has been delivered, the fee is fixed or determinable, and collection of the resulting receivable is probable. A discussion about these revenue recognition criteria and their applicability to the Company’s transactions follows:
| • | Persuasive evidence of an arrangement: The Company uses either contracts signed by both the customer and the Company or written purchase orders issued by the customer that legally bind the Company and the customer as evidence of an arrangement. |
| • | Product delivery: The Company deems delivery to have occurred when AFIS solutions are installed and, when required under the terms of the arrangement, when accepted by the customer. Shipments of ASICs, stand-alone live-scans and other biometric products are recognized as revenue when shipped and title and risk of ownership has passed to the buyer. |
| • | Fixed or determinable fee: The Company considers the fee to be fixed or determinable if the fee is not subject to refund or adjustment and the payment terms are within its normal established practices. If the fee is not fixed or determinable, the Company recognizes the revenue as amounts become due and payable. |
| • | Collection is deemed probable: The Company conducts a credit review for all significant transactions at the time of the arrangement to determine the credit-worthiness of the customer. Collection is deemed probable if the Company expects that the customer will pay amounts under the arrangement as payments become due. |
F-10
Table of Contents
See Note 2 for a discussion regarding the Company’s revenue recognition related to the settlement of claims with Northrop.
Deferred Revenue
Deferred revenue consists primarily of payments received in advance of revenue recognition from the sale of the Company’s AFIS solutions, including maintenance. Revenues from maintenance fees are recognized ratably over the term of the maintenance period.
Concentration
The Company derives a significant portion of its revenues from a limited number of customers:
| Year ended December 31, | |||||||||
| Percentage of Revenues |
2007 | 2008 | 2009 | ||||||
| Customer A |
34 | % | 57 | % | 41 | % | |||
| Customer B |
13 | % | * | * | |||||
| December 31, | |||||||||
| Percentage of Billed Accounts Receivable |
2008 | 2009 | |||||||
| Customer A |
19 | % | 20 | % | |||||
| Customer B |
* | * | |||||||
| Customer C |
* | 15 | % | ||||||
| Customer D |
16 | % | * | ||||||
| (*) | Amounts do not exceed 10% for such period |
Research and Development
Research and development costs consist primarily of salaries, share-based compensation and other personnel-related costs, bonuses, facility costs and third-party services. The Company maintains a research and development staff to enhance its products and to develop new products. In accordance with accounting guidance issued by the FASB, software costs are expensed as incurred until technological feasibility of the software is determined and the recovery of the cost can reasonably be expected, after which any additional costs are capitalized. The Company has expensed all software development costs because the establishment of technological feasibility of products and their availability for sale have substantially coincided.
Advertising Costs
Advertising costs are expensed as incurred and were not significant for any period presented.
Income Taxes
Current income tax expense is the amount of income taxes expected to be payable for the current year. Deferred income tax assets and liabilities are computed annually for differences between the financial statement and income tax bases of assets and liabilities. Such deferred income tax asset and liability computations are based on enacted tax laws and rates applicable to periods in which the differences are expected to reverse. If necessary, a valuation allowance is established to reduce deferred income tax assets to the amount expected to be realized.
F-11
Table of Contents
Sales Taxes
The Company includes sales taxes collected from customers and remitted to government agencies on a net basis within accrued expenses and other current liabilities in the accompanying consolidated balance sheet.
Foreign Currency Translation
Assets and liabilities of foreign operations are translated at current rates of exchange while results of operations are translated at average rates in effect for the period. Translation gains or losses are shown as a separate component of accumulated other comprehensive income (loss). Foreign currency transaction gains and losses result from exchange rate changes for transactions denominated in currencies other than the functional currency and are included in other income in our consolidated statements of income.
Net Income Per Share
Basic net income per common share is calculated by dividing net income by the weighted-average number of common shares outstanding during the reporting period. Diluted net income per common share reflects the effects of potentially dilutive securities, which consist of stock options and nonvested equity share units. A reconciliation of the numerator and denominator used in the calculation of basic and diluted net income per share follows:
| Year Ended December 31, | |||||||||
| 2007 | 2008 | 2009 | |||||||
| (in thousands, except per share data) | |||||||||
| Numerator: |
|||||||||
| Net income available to common stockholders |
$ | 28,642 | $ | 45,180 | $ | 32,460 | |||
| Denominator for basic net income per share — weighted average shares Denominator: |
|||||||||
| Denominator for basic net income per share — weighted average shares |
94,223 | 89,947 | 89,628 | ||||||
| Stock options and nonvested equity share units |
1,614 | 991 | 947 | ||||||
| Denominator for diluted net income per share — adjusted weighted average shares |
95,837 | 90,938 | 90,575 | ||||||
| Basic net income per share |
$ | 0.30 | $ | 0.50 | $ | 0.36 | |||
| Diluted net income per share |
$ | 0.30 | $ | 0.50 | $ | 0.36 | |||
During the years ended December 31, 2007, 2008 and 2009, options to purchase 442,900, 959,640 and 438,000 shares of common stock were not included in the computation of diluted earnings per share because the options exercise price was greater than the average market price of the common shares for each of these respective periods.
Commitments and Contingencies
The Company evaluates all pending or threatened contingencies and any commitments, if any, which are reasonably likely to have a material adverse effect on its operations or financial position. The Company assesses the probability of an adverse outcome and determines if it is remote, reasonably possible or probable as defined in accordance with the authoritative guidance issued by the FASB on accounting for contingencies . If information available prior to the issuance of the Company’s financial statements indicates that it is probable that an asset had been impaired or a liability had been incurred at the date of the Company’s financial statements, and the amount of the loss, or the range of probable loss can be reasonably estimated, then such loss is accrued and charged to operations. If no accrual is made for a loss contingency because one or both of the conditions pursuant to this guidance are not met, but the probability of an adverse outcome is at least reasonably possible, the Company will disclose the nature of the contingency and provide an estimate of the possible loss or range of loss, or state that such an estimate cannot be made.
F-12
Table of Contents
Comprehensive Income
Comprehensive income consists of net income and other comprehensive income (loss). Other comprehensive income (loss) includes certain changes in equity that are excluded from net income. Specifically, cumulative foreign currency translation adjustments and unrealized gains or losses on the Company’s investments in marketable securities are included in accumulated other comprehensive income (loss).
The components of total comprehensive income are as follows:
| Year ended December 31, | |||||||||
| 2007 | 2008 | 2009 | |||||||
| (in thousands) | |||||||||
| Net income |
$ | 28,642 | $ | 45,180 | $ | 32,460 | |||
| Other comprehensive income: |
|||||||||
| Unrealized gain on marketable securities, net of tax |
294 | 254 | 1,333 | ||||||
| Change in foreign currency translation adjustment |
242 | 642 | 261 | ||||||
| Total comprehensive income |
$ | 29,178 | $ | 46,076 | $ | 34,054 | |||
Subsequent Events
Management has evaluated subsequent events after the balance sheet date through the date of issuance of the Company’s Annual Report on Form 10-K for the year ended December 31, 2009, for appropriate accounting treatment and disclosure.
Recent Accounting Pronouncements
Effective January 1, 2008, the Company adopted the disclosure requirements (see Note 5) of authoritative guidance issued by the FASB on fair value measurements. On January 1, 2009, the Company implemented the previously deferred provisions of this guidance for nonfinancial assets and liabilities recorded at fair value, which had no impact on the Company’s financial statements but did expand the Company’s associated disclosures.
Effective January 1, 2009, the Company adopted authoritative guidance issued by the FASB on business combinations. Adoption had no impact on the Company’s financial statements.
On January 1, 2009, the Company adopted the authoritative guidance issued by the FASB that changes the accounting and reporting for non-controlling interests. Adoption had no impact on the Company’s financial statements.
On April 1, 2009, the Company adopted the authoritative guidance issued by the FASB that provides additional guidance for estimating fair value when the volume and level of activity for the asset or liability have significantly decreased and requires that companies provide interim and annual disclosures of the inputs and valuation technique(s) used to measure fair value. Adoption of this accounting guidance did not have a significant impact on the Company’s accounting for financial instruments, but did expand the Company’s associated disclosures.
On April 1, 2009, the Company adopted the authoritative guidance issued by the FASB that provides additional guidance designed to create greater clarity and consistency in accounting and presenting impairment losses on securities. It is intended to bring greater consistency to the timing of impairment recognition, and provide greater clarity to investors about the credit and noncredit components of impaired debt securities that are not expected to be sold. The measure of impairment in comprehensive income remains fair value. This pronouncement also requires increased and more timely disclosures regarding expected cash flows, credit losses, and an aging of securities with unrealized losses. Adoption of this accounting guidance did not have a significant impact on the Company’s accounting for financial instruments, but did expand the Company’s associated disclosures.
On April 1, 2009, the Company adopted the authoritative guidance issued by the FASB that provides required disclosures about fair value of financial instruments in financial statements for interim reporting periods of publicly traded companies as well as in annual financial statements. Adoption of this accounting guidance did not have a significant impact on the Company’s accounting for financial instruments.
F-13
Table of Contents
On June 30, 2009, the Company adopted the authoritative guidance issued by the FASB that provides guidance to establish general standards of accounting for, and disclosures of, events that occur after the balance sheet date but before financial statements are issued or are available to be issued. This pronouncement was effective for interim or fiscal periods ending after June 15, 2009. Accordingly, the Company adopted the provisions of this guidance on June 30, 2009 and evaluated these events through the issuance date of the accompanying financial statements. The adoption of this accounting guidance did not have a material impact on the Company’s consolidated financial position, results of operations or cash flows.
In June 2009, the FASB issued authoritative guidance on the consolidation of variable interest entities, which is effective for us beginning January 1, 2010. The new guidance requires revised evaluations of whether entities represent variable interest entities, ongoing assessments of control over such entities, and additional disclosures for variable interests. Adoption of this new guidance will not have a material impact on the Company’s financial statements.
In October 2009, the FASB issued authoritative guidance on revenue recognition that will become effective for us beginning January 1, 2011, with earlier adoption permitted. Under the new guidance on arrangements that include software elements, tangible products that have software components and non-software components that function together to deliver the tangible products’ essential functionality will no longer be within the scope of the software revenue recognition guidance, and software-enabled products will now be subject to other relevant revenue recognition guidance. Additionally, the FASB issued authoritative guidance on revenue arrangements with multiple deliverables that are outside the scope of the software revenue recognition guidance. Under the new guidance, when VSOE or third party evidence for deliverables in an arrangement cannot be determined, a best estimate of the selling price is required to separate deliverables and allocate arrangement consideration using the relative selling price method. The new guidance includes new disclosure requirements on how the application of the relative selling price method affects the timing and amount of revenue recognition. The Company is currently evaluating the effect that adoption of this new guidance will have on the Company’s financial statements.
Other new pronouncements issued but not effective until after December 31, 2009, are not expected to have a significant effect on the Company’s consolidated financial position or results of operations.
Note 2. Settlement of Claims with Northrop
In April 2005, Cogent initiated a lawsuit against Northrop Grumman Corporation in California State Court (Cogent Systems, Inc. vs. Northrop Grumman Corporation, Northrop Grumman Technology Overseas, Inc., et al., Superior Court of the State of California, in and for the County of Los Angeles, Case No. BC 332199) based on claims of breach of contract, conversion, misappropriation of trade secrets, breach of trust, interference with prospective economic advantage, breach of the implied covenants of good faith and fair dealing, and unfair competition (the “Action”). On December 5, 2007, Cogent and Northrop entered into a definitive Settlement Agreement and Mutual Release of Claims (the “Settlement”). Pursuant to the terms of the Settlement, Cogent and Northrop formally settled and released all claims and causes of action alleged in the Action. Under the Settlement, Cogent and Northrop entered into four agreements; collectively, the “Agreements”:
1. The “Settlement Agreement,” pursuant to which Northrop agreed to pay Cogent $25 million, of which $15 million was paid in January 2008 and $10 million was paid in January 2009;
2. The “Software License Agreement,” pursuant to which Northrop will pay Cogent $15 million over three years for a non-exclusive license to use certain of Cogent’s automated fingerprint identification software in certain existing programs, of which $5 million was paid in each of January 2008, January 2009 and January 2010;
3. The “Product and Services Agreement,” pursuant to which Northrop will pay Cogent a minimum of $20 million for products and services over the five year term of the agreement, of which $5 million was paid in January 2009; and
F-14
Table of Contents
4. The “Strategic Alliance Agreement,” pursuant to which Cogent and Northrop will meet semiannually over the three year term of the agreement to discuss business opportunities and proposal efforts for the design, development, sale and support of biometric identification solutions.
Total proceeds to Cogent under the agreements will be $60.0 million. Cogent has accounted for the agreements as one multiple element arrangement. Contractual proceeds to Cogent under each of the agreements do not necessarily represent the fair value of each agreement. The Strategic Alliance Agreement was determined not to be an element requiring accounting recognition. The Company determined that the $20 million in proceeds scheduled under the Product and Services Agreement includes both a guaranteed payment component valued at $1.0 million and a component for the purchase of products and services valued at $19.0 million using VSOE of fair value in accordance with authoritative guidance issued by the FASB on software revenue recognition. The Company determined the fair value of the Software License Agreement and the guaranteed payment component of the Product and Services Agreement to be $30.0 million and $1.0 million, respectively, based on generally accepted valuation techniques. The residual method was used to derive the $10.0 million fair value for the Settlement Agreement.
| Element |
Scheduled Proceeds |
Allocated Fair Value | ||||
| (in millions) | ||||||
| Product and Services Agreement |
$ | 20.0 | $ | 20.0 | ||
| Software License Agreement |
15.0 | 30.0 | ||||
| Settlement Agreement |
25.0 | 10.0 | ||||
| $ | 60.0 | $ | 60.0 | |||
Accounting for the Software License Agreement is subject to the FASB guidance on software revenue recognition. However, the provision of the AFIS software under the Software License Agreement did not represent a stand-alone arm’s length transaction. Rather, the revenue amount was determined based on a valuation. Thus, the Company did not believe it appropriate to apply the Company’s standard maintenance VSOE rate to this amount and the Company could not determine the fair value of the associated maintenance commitment. The Company will recognize revenue under the Software License Agreement and the Products and Services Agreement, on a combined basis, based on the lowest proportion of revenue recognizable under the contracts. While the Company was not able to establish VSOE of the maintenance commitment, the Company believes its standard maintenance rate represents a reasonable basis for the allocation of revenues recognized under the Software License Agreement, between product and maintenance, as the revenues are recognized over the term of the Software License Agreement. The Company will therefore allocate a portion of the revenues representing its standard annual maintenance renewal rate (based on VSOE), to maintenance revenues. The remainder will be recorded as product revenues. The $1.0 million value of the guaranteed payment will be recognized as income on a pro-rata basis (i.e., each dollar of revenue under the Products and Services Agreement will result in ninety-five cents of revenue and five cents of Income from settlement of lawsuit). The residual value allocated to the Settlement Agreement is presented as Income from settlement of lawsuit in the accompanying consolidated statement of income.
In January 2008, the Company received its first scheduled payments of $15.0 million pursuant to the Settlement Agreement and $5.0 million pursuant to the Software License Agreement. During the fourth quarter of 2008, Northrop ordered $5.0 million of products and services pursuant to the Product and Services Agreement which was paid in the first quarter of 2009. Additionally, in the first quarter of 2009, the Company received its second scheduled payment of $10.0 million pursuant to the Settlement Agreement, and $5.0 million pursuant to the Software License Agreement. As of December 31, 2009, the $5.0 million order is included in deferred revenues. Of the $20.0 million in payments received under the Agreements in 2008, $10.0 million was recognized in January 2008 as income from settlement of a lawsuit in the accompanying consolidated statement of income. This $10.0 million represents the residual value allocated to the Settlement Agreement out of the total
F-15
Table of Contents
fair value of the Agreements of $60.0 million. The Company recognizes revenue under the Software License Agreement and the Products and Services Agreement, on a combined basis, based on the lowest proportion of revenue recognizable under the contracts. Of the $20.0 million received in the first quarter of 2009, no amounts were recognized as revenue under the combined Software License Agreement or the Product and Services Agreement. Additionally, the second payment of $10.0 million pursuant to the Settlement Agreement was not recognized as income for the year ended December 31, 2009. Total deferred revenue from Northrop pursuant to the Agreements was $30.0 million as of December 31, 2009.
Note 3. Acquisition of the Security Solutions Division of MAXIMUS, Inc.
Effective April 30, 2008, the Company acquired the Security Solutions Division (the “SSD Division”) of MAXIMUS Inc. for an aggregate cash purchase price of $5.2 million which included transaction costs of $178,000. Of that purchase price, $250,000 was retained by the Company for a period of one year as security for certain indemnification obligations. The SSD Division provides identity management and credentialing services, security consulting and custom web application development related to logical and physical access services.
The Company allocated the purchase price to the tangible and identifiable intangible assets acquired based on their fair values, which were determined using generally accepted valuation techniques. The Company did not assume liabilities from this acquisition. The goodwill that arose from the acquisition reflected value to the Company from:
| • | acquiring a highly trained and qualified workforce, |
| • | utilizing their existing platform for growth in the expanding market for identity management and credentialing, |
| • | and obtaining the benefits of a strong revenue stream with profitable performance serving governmental customers. |
The following table summarizes the allocation of the purchase price (in thousands):
| Estimated Fair Value |
Weighted Average Useful Lives (in years) | ||||
| Tangible assets: |
|||||
| Prepaid and other assets |
$ | 37 | |||
| Property and equipment |
57 | ||||
| 94 | |||||
| Intangible assets: |
|||||
| Backlog |
$ | 260 | <1 | ||
| Customer relationships |
1,500 | 3 | |||
| Non-compete agreement |
400 | 3 | |||
| Goodwill |
2,924 | ||||
| 5,084 | |||||
| Total assets acquired |
$ | 5,178 | |||
The weighted average useful lives for the above noted intangibles on the acquisition date is 2.7 years, excluding Goodwill, which is indefinite-lived. Goodwill is expected to be amortizable for tax purposes.
The results of the operations of the SSD Division have been consolidated with our results since their acquisition. Pro forma results of operations have not been presented because the acquisition was not material in relation to our consolidated financial position or results of operations.
F-16
Table of Contents
Note 4. Intangible Assets and Goodwill
Goodwill is tested for impairment at least annually and more frequently if an event occurs to indicate it may be impaired. Based on its annual impairment tests in 2008 and 2009, the Company determined that goodwill was not impaired. Furthermore, the Company determined there were no events or changes in circumstances that indicate that carrying values of goodwill or other intangible assets are not be recoverable as of December 31, 2009.
The following table provides information regarding the Company’s intangible assets with finite lives (in thousands):
| December 31, 2008 | December 31, 2009 | |||||||||||||||||||
| Useful lives (years) |
Gross carrying amount |
Accumulated amortization |
Net amount |
Gross carrying amount |
Accumulated amortization |
Net amount | ||||||||||||||
| Backlog |
<1 | $ | 260 | $ | 260 | $ | — | $ | 260 | $ | 260 | $ | — | |||||||
| Customer relationships |
3 | 1,500 | 333 | 1,167 | 1,500 | 833 | 667 | |||||||||||||
| Non-compete agreement |
3 | 400 | 89 | 311 | 400 | 222 | 178 | |||||||||||||
| Patents |
5 | 750 | 550 | 200 | 750 | 700 | 50 | |||||||||||||
| Total |
$ | 2,910 | $ | 1,232 | $ | 1,678 | $ | 2,910 | $ | 2,015 | $ | 895 | ||||||||
Amortization expense for intangible assets with finite lives was $150,000, $832,000 and $783,000 for the year ended December 31, 2007, 2008 and 2009, respectively.
Estimated amortization expense is expected to be $683,000 in 2010 and $212,000 in 2011. As of December 31, 2009, the Company had intangible assets not subject to amortization in the amount $2.9 million which relates to goodwill from the SSD Division acquisition.
Prior to the business combination that occurred during the year ended December 31, 2008, the Company had no goodwill. The following table shows changes in the carrying value of goodwill (in thousands):
| Gross Carrying Amount |
Accumulated Impairment Losses |
Net Amount | |||||||
| Balance as of January 1, 2008 |
$ | — | $ | — | $ | — | |||
| Goodwill acquired |
2,924 | — | 2,924 | ||||||
| Impairment losses |
— | — | — | ||||||
| Balance as of December 31, 2009 |
$ | 2,924 | $ | — | $ | 2,924 | |||
Intangibles and goodwill are not measured at fair value on an ongoing basis but are subject to fair value adjustments in certain circumstances (e.g., when there is evidence of impairment). At December 31, 2009, no fair value adjustments were required for non-financial assets or liabilities.
F-17
Table of Contents
Note 5. Investments in Marketable Securities
The Company has investments classified as available-for-sale securities included in short-term and long-term investments, categorized as follows (in thousands):
December 31, 2009
| Amortized Cost |
Gross Unrealized Gains |
Gross Unrealized Losses |
Fair Value | ||||||||||
| Type of Security |
|||||||||||||
| Short-term instruments |
$ | 5,107 | $ | — | $ | — | $ | 5,107 | |||||
| Corporate debt securities with maturities of less than one year |
75,299 | 734 | — | 76,033 | |||||||||
| Municipal securities with maturities of less than one year |
46,544 | 227 | — | 46,771 | |||||||||
| U.S. government securities with maturities of less than one year |
150,723 | 885 | (21 | ) | 151,587 | ||||||||
| Total short-term investments |
277,673 | 1,846 | (21 | ) | 279,498 | ||||||||
| Corporate debt securities with maturities between one and two years |
98,244 | 741 | (31 | ) | 98,954 | ||||||||
| U.S. government securities with maturities between one and two years |
118,539 | 365 | (211 | ) | 118,693 | ||||||||
| Total long-term investments |
216,783 | 1,106 | (242 | ) | 217,647 | ||||||||
| $ | 494,456 | $ | 2,952 | $ | (263 | ) | $ | 497,145 | |||||
December 31, 2008
| Amortized Cost |
Gross Unrealized Gains |
Gross Unrealized Losses |
Fair Value | ||||||||||
| Type of Security |
|||||||||||||
| Short-term instruments |
$ | 18,433 | $ | — | $ | — | $ | 18,433 | |||||
| Corporate debt securities with maturities of less than one year |
145,835 | 277 | (1,778 | ) | 144,334 | ||||||||
| Municipal securities with maturities of less than one year |
3,091 | 6 | — | 3,097 | |||||||||
| U.S. government securities with maturities of less than one year |
110,872 | 698 | — | 111,570 | |||||||||
| Total short-term investments |
278,231 | 981 | (1,778 | ) | 277,434 | ||||||||
| Corporate debt securities with maturities between one and two years |
64,709 | 220 | (438 | ) | 64,491 | ||||||||
| Municipal securities with maturities through October 2017 |
14,603 | 175 | — | 14,778 | |||||||||
| U.S. government securities with maturities between one and two years |
86,946 | 1,391 | (6 | ) | 88,331 | ||||||||
| Total long-term investments |
166,258 | 1,786 | (444 | ) | 167,600 | ||||||||
| $ | 444,489 | $ | 2,767 | $ | (2,222 | ) | $ | 445,034 | |||||
Proceeds from the sale of available-for-sale securities for each of the years in the three years ended December 31, 2007, 2008 and 2009, are disclosed separately in the accompanying consolidated statements of cash flows. In each of the three years ended December 31, 2007, 2008 and 2009 there were no gross realized gains or gross realized losses that the Company recognized.
F-18
Table of Contents
The following table shows the gross unrealized losses and fair value of the Company’s investments with unrealized losses that are not deemed to be other-than-temporarily impaired, aggregated by investment category and length of time that the individual securities have been in a continuous unrealized loss position at December 31, 2009.
| Less Than 12 Months | 12 Months or Greater | Total | ||||||||||||||||||
| Fair Value | Unrealized Losses |
Fair Value | Unrealized Losses |
Fair Value | Unrealized Losses |
|||||||||||||||
| (in thousands) | ||||||||||||||||||||
| Type of Security: |
||||||||||||||||||||
| Short-term instruments |
$ | 5,107 | $ | — | $ | — | $ | — | $ | 5,107 | $ | — | ||||||||
| Corporate debt securities |
174,987 | (31 | ) | — | — | 174,987 | (31 | ) | ||||||||||||
| Municipal securities |
46,771 | — | — | — | 46,771 | — | ||||||||||||||
| U.S. government securities |
270,280 | (232 | ) | — | — | 270,280 | (232 | ) | ||||||||||||
| Total investments |
$ | 497,145 | $ | (263 | ) | $ | — | $ | — | $ | 497,145 | $ | (263 | ) | ||||||
The Company’s short-term instruments consist primarily of money market funds, certificates of deposit and commercial paper. These available-for-sale securities are accounted for at their fair value, and unrealized gains and losses on these securities are reported as a separate component of stockholders’ equity. The Company’s corporate debt securities, long and short term, include debt securities issued pursuant to the Temporary Liquidity Guarantee Program which are U.S. Government securities. In addition, the Company’s municipal securities, long and short term, include pre-refunded municipal bonds that are secured by U.S. Treasury securities. The accumulated unrealized gain (loss) on available-for-sale securities at December 31, 2008 and December 31, 2009 was as follows:
| December 31, 2008 |
December 31, 2009 | |||||
| (in thousands) | ||||||
| Accumulated unrealized gain |
$ | 545 | $ | 2,689 | ||
As indicated in Note 1, the Company adopted the provisions of authoritative guidance issued by the FASB on fair value measurements for financial assets and liabilities effective January 1, 2008. This pronouncement clarifies the definition of fair value as an exit price representing the amount that would be received to sell an asset or paid to transfer a liability in an orderly transaction between market participants. As such, fair value is a market-based measurement that should be determined based on assumptions that market participants would use in pricing an asset or liability. As a basis for considering such assumptions, it establishes a three-tier value hierarchy, which prioritizes, in descending order, the inputs used in measuring fair value as follows:
Level 1 — Observable inputs such as quoted prices in active markets
Level 2 — Inputs other than the quoted prices in active markets that are observable either directly or indirectly
Level 3 — Unobservable inputs in which there is little or no market data, which require us to develop our own assumptions.
F-19
Table of Contents
This hierarchy requires the Company to use observable market data, when available, and to minimize the use of unobservable inputs when determining fair value. On a recurring basis, the Company measures certain financial assets and liabilities at fair value, including its marketable securities. The Company’s investment instruments, except for auction rate securities, listed below are classified within Level 2 of the fair value hierarchy because they are valued using quoted market prices, broker or dealer quotations, or alternative pricing sources with reasonable levels of price transparency. The Company’s auction rate securities are classified as Level 3 of the fair value hierarchy due to the limited market data for pricing these securities.
| As of December 31, 2009 |
Fair value | Level 1 | Level 2 | Level 3 | ||||||||
| (in thousands) | ||||||||||||
| Short-term instruments |
$ | 5,107 | $ | — | $ | 5,107 | $ | — | ||||
| Corporate debt securities |
174,988 | — | 172,412 | 2,576 | ||||||||
| Municipal securities |
46,770 | — | 46,770 | — | ||||||||
| U.S. government securities |
270,280 | — | 270,280 | — | ||||||||
| $ | 497,145 | $ | — | $ | 494,569 | $ | 2,576 | |||||
As of December 31, 2009, the Company’s investments included $2.6 million of auction rate securities which are classified as long-term investments in marketable securities. Due to uncertainties in the credit markets, the Company has been unable to liquidate its investments in auction rate securities. Based on its analysis of impairment factors, including, but not limited to, whether the credit ratings of the issuers deteriorate, or the collateral of the securities deteriorates, the Company’s auction rate securities are not deemed to be impaired as of December 31, 2009.
The following table sets forth a reconciliation of changes in the fair value of financial assets classified as Level 3 in the fair value hierarchy:
| Fair Value Measurements Using Significant Unobservable Inputs Level 3 |
||||
| (in thousands) | ||||
| Balance at January 1, 2009 |
$ | 4,248 | ||
| Total gains or losses (realized or unrealized) |
— | |||
| Included in earnings |
— | |||
| Included in comprehensive income |
— | |||
| Purchases, issuances, and settlements |
(1,672 | ) | ||
| Transfers in and/or out of Level 3 |
— | |||
| Balance at December 31, 2009 |
$ | 2,576 | ||
F-20
Table of Contents
Note 6. Property and Equipment
Property and equipment consist of the following:
| As of December 31, | ||||||||
| 2008 | 2009 | |||||||
| (in thousands) | ||||||||
| Land |
$ | 11,582 | $ | 11,582 | ||||
| Building |
20,706 | 20,732 | ||||||
| Building improvements |
3,197 | 4,249 | ||||||
| Furniture and fixtures |
591 | 937 | ||||||
| Computer and other equipment |
6,903 | 8,443 | ||||||
| Purchased software |
608 | 661 | ||||||
| 43,587 | 46,604 | |||||||
| Accumulated depreciation |
(6,395 | ) | (9,052 | ) | ||||
| Property and equipment, net |
$ | 37,192 | $ | 37,552 | ||||
On October 7, 2005, the Company purchased a 343,000 square foot property consisting of land and three buildings in Pasadena, California including the corporate headquarters of the Company. The acquisition costs accumulated for the buildings not yet placed in service as of December 31, 2008 and December 31, 2009 were approximately $12.0 million and $12.1 million, respectively. Certain portions of the buildings were leased to third parties during the year ended December 31, 2007 and part of the year ended December 31, 2008. Lease payments received, net of related costs, were recorded as other income and were not material to any period presented. The Company did not lease certain portions of the buildings to third parties during the year ended December 31, 2009.
In October 2008, the former corporate headquarters of the Company located in South Pasadena, California was leased to a third party. Lease payments received, net of related costs, are recorded undiscounted as other income and are not material to the year ended December 31, 2008 and 2009. The lease is 15 years with a future rental commitment from its tenant of approximately $11.6 million as of December 31, 2009.
Depreciation expense related to property and equipment was approximately $1.6 million, $2.0 million and $2.7 million during the years ended December 31, 2007, 2008 and 2009, respectively.
Note 7. Deferred Revenues and Deferred Costs
In December 2007, the Company settled its lawsuit with Northrop Grumman (See Note 2). As of December 31, 2009, deferred revenue related to the settlement agreements was $30.0 million.
In November 2007, the Company entered into a contract to provide a turnkey AFIS to certain law enforcement agencies in Spain for $11.0 million. In December 2007, the Company recorded $6.0 million in deferred revenue representing a scheduled billing under the contract. The system was accepted in the fourth quarter of 2008 and $3.7 million of revenue related to this contract was recognized. Deferred revenue related to the contract was $6.8 million as of December 31, 2008 and $4.8 million as of December 31, 2009, respectively. The deferred balance as of December 31, 2009 consists primarily of unamortized maintenance revenue which will be recognized over the remaining contract period of 5 years.
In August 2006, the Company entered into a contract with a law enforcement agency in Maryland to provide an integrated AFIS system as well as provide other services to re-engineer some of their clearance and record maintenance systems. As of December 31, 2009, the Company has $2.7 million in deferred revenue which represents billing for maintenance services to be rendered over the remaining contract period.
F-21
Table of Contents
Note 8. Income Taxes
The provision for income taxes consists of the following:
| Year ended December 31, | ||||||||||
| 2007 | 2008 | 2009 | ||||||||
| (in thousands) | ||||||||||
| Current: |
||||||||||
| Federal |
$ | 2,418 | $ | 27,803 | $ | 425 | ||||
| State |
— | 4,076 | 1,201 | |||||||
| Foreign |
453 | 1,075 | 780 | |||||||
| 2,871 | 32,954 | 2,406 | ||||||||
| Deferred: |
||||||||||
| Federal |
12,439 | (7,725 | ) | 16,462 | ||||||
| State |
2,675 | (882 | ) | 1,274 | ||||||
| 15,114 | (8,607 | ) | 17,736 | |||||||
| Interest and penalties |
552 | 592 | 512 | |||||||
| $ | 18,537 | $ | 24,939 | $ | 20,654 | |||||
The components of deferred tax assets and liabilities are as follows:
| Year ended December 31, |
||||||||
| 2008 | 2009 | |||||||
| (in thousands) | ||||||||
| Deferred tax assets: |
||||||||
| Deferred revenue |
$ | 34,449 | $ | 11,333 | ||||
| Research and development credit carryforward |
4,300 | 4,927 | ||||||
| Share-based compensation |
2,940 | 1,939 | ||||||
| Foreign tax credits |
2,233 | 3,050 | ||||||
| State taxes |
1,152 | 887 | ||||||
| Accrued Bonus |
— | 1,343 | ||||||
| Accrued Costs |
— | 1,052 | ||||||
| Other |
1,105 | 1,587 | ||||||
| Total deferred tax assets |
$ | 46,179 | $ | 26,118 | ||||
| Deferred tax liabilities: |
||||||||
| Inventory |
$ | (4,750 | ) | $ | (3,615 | ) | ||
| Unrealized gain on marketable securities |
(212 | ) | (1,022 | ) | ||||
| Depreciation |
(149 | ) | (260 | ) | ||||
| Total deferred tax liabilities |
(5,111 | ) | (4,897 | ) | ||||
| Net deferred tax assets |
$ | 41,068 | $ | 21,221 | ||||
Based on the Company’s historical and anticipated future pre-tax results of operations, management believes it is more likely than not that the Company will realize the benefit of its net deferred tax assets as of December 31, 2009. Management believes the existing net deductible temporary differences will reverse during periods in which the Company generates net taxable income; however, there can be no assurance that the Company will generate any earnings or any specific level of continuing earnings in future years.
F-22
Table of Contents
The following is a reconciliation of the statutory federal income tax provision calculated based on the federal income tax rate to the Company’s actual tax provision:
| Year ended December 31, | ||||||||||||
| 2007 | 2008 | 2009 | ||||||||||
| (in thousands) | ||||||||||||
| Federal income taxes at the statutory rate |
$ | 16,513 | $ | 24,542 | $ | 18,590 | ||||||
| State income taxes, net of federal benefit |
1,684 | 1,705 | 2,046 | |||||||||
| Domestic production activities deduction |
— | (910 | ) | (183 | ) | |||||||
| Foreign taxes |
1,044 | 861 | 791 | |||||||||
| Foreign tax credits |
(1,044 | ) | (861 | ) | (791 | ) | ||||||
| Federal research and development credit |
(137 | ) | (216 | ) | (400 | ) | ||||||
| Share-based compensation |
— | (613 | ) | (91 | ) | |||||||
| Interest and penalty expense |
552 | 592 | 532 | |||||||||
| Other |
(75 | ) | (161 | ) | 160 | |||||||
| $ | 18,537 | $ | 24,939 | $ | 20,654 | |||||||
As of December 31, 2009, the Company had state research and development tax credit carryforwards of approximately $7.6 million. The state research and development tax credit carryforwards do not expire and are carried forward indefinitely until fully utilized.
Effective January 1, 2007, the Company adopted accounting guidance issued by the which FASB prescribes a comprehensive model for recognizing, measuring, presenting and disclosing in the financial statements tax positions taken or expected to be taken on a tax return, including a decision whether to file or not to file in a particular jurisdiction. For those benefits to be recognized, a tax position must be more likely than not to be sustained upon examination by taxing authorities. The amount recognized is measured as the largest amount of benefit that is greater than 50 percent likely of being realized upon ultimate settlement.
The following table summarizes the activity related to the Company’s unrecognized tax benefits:
| (in thousands) | ||||
| Gross unrecognized tax benefits as of January 1, 2007 |
$ | 9,032 | ||
| Decreases in tax positions for prior years |
(5,442 | ) | ||
| Gross unrecognized tax benefits as of January 1, 2008 |
3,590 | |||
| Decreases in tax positions for prior years |
(16 | ) | ||
| Increases from tax positions taken in current year |
5,365 | |||
| Gross unrecognized tax benefits as of January 1, 2009 |
8,939 | |||
| Decreases in tax positions for prior years |
(57 | ) | ||
| Gross unrecognized tax benefits as of December 31, 2009 |
$ | 8,882 | ||
Included in the balance of unrecognized tax benefits at December 31, 2008 and December 31, 2009 are $1.5 million of tax benefits that, if recognized, would affect the effective tax rate. The unrecognized tax benefit balance as of December 31, 2008 and 2009 also included approximately $7.4 million for both years related to items that would affect other tax accounts, primarily deferred income taxes, if recognized. The Company believes that it is reasonably possible that a decrease of up to $5.4 million in unrecognized tax benefits related to temporary federal tax positions may be necessary within the next 12 months. The liability for unrecognized tax benefits is recorded in income taxes payable and other long-term liabilities in the consolidated balance sheet.
The Company continues to recognize accrued interest and penalties related to unrecognized tax benefits in the income tax provision. As of December 31, 2008 and December 31, 2009, the total amount of accrued income tax-related interest and penalties before tax benefits was $1.5 million and $2.0 million, respectively.
F-23
Table of Contents
The Company files Federal income tax returns, as well as multiple state, local and foreign jurisdiction tax returns. With few exceptions, the Company is no longer subject to examination for its U.S. Federal and state, foreign and local jurisdictions for years prior to 2004. The Internal Revenue Service completed its examination of the Company’s Federal consolidated tax returns for 2004 and 2005 and issued a “no change” letter. The California Franchise Tax Board completed its examination of the Company’s California tax returns for 2005 and 2006 and issued a “no change” letter.
The Company experienced disqualifying dispositions of incentive stock options during the three years ended December 31, 2009. Disqualifying dispositions result in a tax deduction in the Company’s corporate tax return equal to the intrinsic value of the option at exercise. To the extent the Company recorded share-based compensation expense related to disqualifying dispositions of incentive stock options, the Company recorded the benefit from the disqualifying dispositions as a reduction to the Company’s provision for income taxes. The Company does not recognize any tax benefit to additional paid-in capital for share-based compensation expense that is allowable for income tax purposes that is greater than the expense recorded in the consolidated financial statements as the Company recognizes such benefit when the tax deduction reduces actual taxes payable. During the years ended December 31, 2007, 2008 and 2009, the Company recognized tax benefits of $2.5 million, $5.1 million and $206,000 to additional paid-in capital for the reduction in actual taxes payable. As of December 31, 2009, the Company has state research and development income tax credit carryforwards in the amount of $653,000 as a result of share-based compensation that will be credited to additional paid-in capital when utilized in future periods to reduce income taxes payable.
Note 9. Bank Agreements
The Company has a revolving line of credit with a U.S. bank to provide advances for trade finance transactions and working capital requirements of up to $20 million. Borrowings under the line of credit bear interest at the bank’s reference rate (3.25% at December 31, 2009). The line of credit is secured by Company assets consisting of equipment, inventory and accounts receivable. There were no outstanding borrowings under this line at December 31, 2008 and 2009. Covenants in connection with the agreement impose restrictions and requirements related to, among other things, maintenance of certain insurance requirements, limitations on outside indebtedness, and use of proceeds for business operations. This line of credit was renewed in April 2009 and expires in May 2010.
Note 10. Commitments and Contingencies
Facility Lease
The Company leases certain of its operating facilities under non-cancelable operating leases extending through November 2020. The following are the remaining future minimum rental commitments under the operating leases for each year ending December 31:
| (in thousands) | |||
| 2010 |
$ | 1,467 | |
| 2011 |
1,107 | ||
| 2012 |
483 | ||
| 2013 |
491 | ||
| 2014 |
538 | ||
| Remaining |
2,804 | ||
| Total future minimum lease payments |
$ | 6,890 | |
Rent expense for the years ended December 31, 2007, 2008 and 2009 was approximately $313,000, $557,000 and $1.5 million respectively.
F-24
Table of Contents
Litigation
During the normal course of business, the Company may be subject to litigation involving various business matters. Management believes that an adverse outcome of any such known matters would not have a material adverse impact on the Company.
Note 11. Accounting for Share-Based Compensation and Employee Benefit Plans
Share-based compensation expense included in the Company’s results of operations was as follows:
| Year Ended December 31, | |||||||||
| 2007 | 2008 | 2009 | |||||||
| (in thousands) | |||||||||
| Cost of product revenues |
$ | 332 | $ | 470 | $ | 488 | |||
| Cost of maintenance and services revenues |
320 | 576 | 625 | ||||||
| Research and development expenses |
350 | 937 | 939 | ||||||
| Selling and marketing expenses |
919 | 912 | 840 | ||||||
| General and administrative expenses |
804 | 801 | 685 | ||||||
| $ | 2,725 | $ | 3,696 | $ | 3,577 | ||||
The Company recognized income tax benefits relating to the stock based compensation in the table above of approximately $765,000, $1.3 million and $1.4 million for the years ended December 31, 2007, 2008 and 2009, respectively. The Company has two stock option plans, the 2000 Stock Option Plan and the 2004 Equity Incentive Plan, which authorize the issuance of stock options, nonvested equity share units and other share-based instruments to employees and directors.
2000 Stock Option Plan
The Company’s Board of Directors has adopted the 2000 Stock Option Plan (the “Plan”), which authorizes the Company to grant or issue options to purchase up to a total of 16,000,000 shares of the Company’s common stock. Options issued under the Plan vest as determined by the Plan Administrator, which is the Compensation Committee of the Board of Directors, at the time of grant and typically must be exercised within 10 years from the date of grant. The terms of options granted under these option plans are determined at the time of grant, which generally vest 25% at the completion of the first year and quarterly thereafter over the remaining three-year period.
2004 Equity Incentive Plan
In May 2004, the Company’s Board of Directors and stockholders approved the 2004 Equity Incentive Plan (the “Equity Plan”). A total of 16,000,000 shares of common stock are initially authorized and reserved for issuance under the Equity Plan for incentives such as stock options, stock appreciation rights, nonvested share awards, nonvested share units, performance shares, performance units and deferred stock awards. The actual number of awards which may be granted under the Equity Plan shall be reduced, at all times, by the number of stock options outstanding under the 2000 Stock Option Plan. The number of shares reserved for issuance under the Equity Plan is subject to an annual increase on January 1 of each year beginning in 2005 equal to the lesser of (a) 1.5% of the outstanding shares on the immediately preceding December 31, (b) 750,000 shares or (c) a lesser amount as determined by the Board. The terms of equity incentives granted under these option plans are determined at the time of grant. Stock options generally vest 25% at the completion of the first year and quarterly thereafter over the remaining three-year period, and in any case the option price may not be less than the fair market value per share on the date of grant. Nonvested equity share units awards generally vest 25% on each anniversary of the grant date during the four year vesting period.
F-25
Table of Contents
Stock Options
The fair values of each award granted under the Company’s stock option plans were estimated at the date of grant using the Black-Scholes option pricing model and the following weighted average assumptions:
| Year Ended December 31, | |||||||||
| 2007 | 2008 | 2009 | |||||||
| Volatility |
46 | % | 46 | % | 46 | % | |||
| Risk-free interest rate |
4.48 | % | 2.98 | % | 2.00 | % | |||
| Dividend yield |
0.00 | % | 0.00 | % | 0.00 | % | |||
| Expected life (years) |
6.1 | 6.1 | 6.1 | ||||||
The weighted average estimated fair value of options granted was as follows:
| Year Ended December 31, | |||||||||
| 2007 | 2008 | 2009 | |||||||
| Weighted average fair value |
$ | 6.56 | $ | 4.86 | $ | 4.69 | |||
The calculation of share-based employee compensation expense involves estimates that require management’s judgment. These estimates include the fair value of each of our stock option awards, which is estimated on the date of grant using a Black-Scholes option-pricing model. The fair value of options granted is amortized on a straight-line basis over the requisite service periods of the awards, which are generally the vesting periods. The expected term of stock option awards granted is calculated using the “simplified method”, which utilizes the weighted average expected life of each tranche of stock option, determined based on the sum of each tranche’s vesting period plus one-half of the period from the vesting date of each tranche to the stock option’s expiration in accordance with authoritative accounting guidance. Management estimates the volatility of the common stock at the date of grant based on the implied volatility of publicly traded options on the common stock. The decision to use implied volatility was based upon the availability of actively traded options on the Company’s common stock and management’s belief that implied volatility is more representative of future stock price trends than historical volatility. The Company bases the risk-free interest rate that is used in the Black-Scholes option valuation model on the implied yield in effect at the time of option grant on U.S. Treasury zero-coupon issues with equivalent remaining terms. The Company does not anticipate paying any cash dividends in the foreseeable future. Consequently, the Company uses an expected dividend yield of zero in the Black-Scholes option valuation model. The Company estimates forfeitures at the time of grant and revises those estimates in subsequent periods if actual forfeitures differ from those estimates. Historical data is used to estimate pre-vesting option forfeitures and record share-based compensation expense only for those awards that are expected to vest.
F-26
Table of Contents
Options granted during the three years ended December 31, 2009 were granted with an exercise price equal to the fair market value of the Company’s common stock on the date of grant. A combined summary of the status of stock options granted under the 2000 Stock Option Plan and the 2004 Equity Incentive Plan as well as changes during three years ended as of December 31, 2009 is presented below:
| Number of options |
Weighted Average Exercise Price |
Weighted Average Remaining Contractual Life in Years |
Aggregate Intrinsic Value | ||||||||
| (in thousands) | |||||||||||
| Outstanding at December 31, 2008 |
1,433,415 | $ | 8.16 | ||||||||
| Granted |
12,000 | $ | 10.13 | ||||||||
| Exercised |
(172,327 | ) | $ | 1.81 | |||||||
| Canceled or forfeited |
(68,662 | ) | $ | 13.89 | |||||||
| Outstanding at December 31, 2009 |
1,204,426 | $ | 8.77 | 5.2 | $ | 5,134 | |||||
| Exercisable at December 31, 2009 |
1,084,261 | $ | 8.33 | 4.9 | $ | 5,127 | |||||
| Vested and expected to vest |
1,188,805 | $ | 8.88 | 5.2 | $ | 5,134 | |||||
A total of 2,349,410 options remain available for grant under the Company’s equity incentive plans at December 31, 2009. The following tables further describe stock options outstanding at December 31, 2009.
The Company defines in-the-money options at December 31, 2009 as options that had exercise prices that were lower than the $10.39 fair market value of its common stock at that date. The aggregate intrinsic value of options outstanding at December 31, 2009 is calculated as the difference between the exercise price of the underlying options and the fair market value of the Company’s common stock for the 714,126 shares that were in-the-money at that date. There were 691,626 in-the-money options exercisable at December 31, 2009. The total intrinsic value of options exercised during the years ended December 31, 2007, 2008 and 2008 was approximately $5.6 million, $8.2 million and $1.6 million respectively, determined as of the date of exercise. As of December 31, 2009, there was approximately $0.7 million of total unrecognized compensation cost related to the unvested options that is expected to be recognized over a weighted-average period of 1.1 years.
Upon the exercise of a stock option award, shares of common stock are issued from authorized but unissued shares.
Nonvested equity share units
Beginning in 2007, the Compensation Committee of the Board of Directors has issued awards of nonvested equity share units to certain of the Company’s, directors, employees and executive officers under the Company’s 2004 Equity Incentive Plan. These awards entitle the holder to shares of common stock subject to certain terms and, generally, vest in 25% increments each year on the anniversary of the grant date throughout a four year vesting period. The nonvested equity share unit awards are valued based on the closing market price on the date of award. Nonvested equity share unit compensation is to be amortized and charged to operations on a straight-line basis over the four year vesting period.
F-27
Table of Contents
A summary of nonvested equity share unit activity is as follows:
| Shares | Weighted Average Grant Date Fair Value |
Aggregate Intrinsic Value | |||||||
| (in thousands) | |||||||||
| Nonvested equity share units outstanding at December 31, 2008 |
941,975 | $ | 11.28 | $ | 12,783 | ||||
| Granted |
81,400 | 10.99 | |||||||
| Vested |
(293,638 | ) | 9.51 | ||||||
| Cancelled or forfeited |
(9,600 | ) | 10.88 | ||||||
| Nonvested equity share units outstanding at December 31, 2009 |
720,137 | $ | 11.98 | $ | 8,624 | ||||
| Expected to vest |
626,519 | $ | 10.39 | $ | 6,509 | ||||
The Company recorded $110,000, $2.8 million and $3.5 million in compensation cost on outstanding nonvested equity share units during the years ended December 31, 2007, 2008 and 2009. As of December 31, 2009, there was approximately $7.6 million of total unrecognized compensation cost related to nonvested equity share unit-based compensation that is expected to be recognized over a weighted-average period of 3.8 years.
Upon the issuance of shares upon the vesting of a nonvested equity share unit, shares of common stock are issued from authorized but unissued shares.
Employee Benefit Plans
The Company has a 401(k) plan that allows eligible employees to contribute up to the established allowable limit under Internal Revenue guidelines. The basic maximum allowable amount was $16,500 of an employee’s pay in 2009. All employees age 18 or older with three months of service are eligible for participation. After one year of service, the Company contributes 3% of total compensation, which is also subject to annual limits, and may, at its discretion, make additional contributions. The Company’s contribution related expense was $360,000, $463,000 and $521,000 during the years ended December 31, 2007, 2008 and 2009 respectively.
Note 12. Stock Repurchase Program
On November 1, 2007, the Company announced that its Board of Directors authorized a program to repurchase up to $100 million of its common shares over a 12 month period expiring in October 2008 (the “Repurchase Program”). On November 13, 2008, the Company announced that its Board of Directors had extended the expiration date of the Repurchase Program to November 12, 2009 and increased the amount of common stock that may be repurchased under the program to an aggregate of up to $150 million.
On November 3, 2009, the Company announced that its Board of Directors authorized a new repurchase program that replaces the Repurchase Program (the “New Repurchase Program”). Under the New Repurchase Program the Company may repurchase up to $100 million of its common shares over a 12 month period beginning on November 13, 2009 and expiring on November 12, 2010.
The Company is not obligated to purchase any shares. Depending on market conditions, shares may be repurchased, using the Company’s cash resources, from time to time at prevailing market prices through open market or negotiated transactions. Subject to applicable securities laws, repurchases may be made at such times and in such amounts as the Company’s management deems appropriate. Purchases can be discontinued at any time the Company’s management feels additional purchases are not warranted.
F-28
Table of Contents
Acting pursuant to the Repurchase Program and New Repurchase Program the Company repurchased a total of 6,408,346 shares during 2007, 2008 and 2009 at an aggregate cost of $62.2 million. The shares were purchased in the open market using the Company’s cash resources. The authorized amount remaining available for share repurchase as of December 31, 2009 is $97.9 million. The share repurchase program may be suspended or discontinued at any time without prior notice. Shares repurchased under the share repurchase program are canceled and deemed authorized but unissued shares. During the year ended December 31, 2009, the Company canceled 6,748,346 treasury shares that were originally repurchased for a total of $66.5 million. The Company recorded the cancellation of these treasury shares as a decrease of $51.4 million to “additional paid in capital” and a decrease of $15.1 million to “retained earnings” in the consolidated balance sheets. There were no treasury shares canceled during the years ended December 31, 2008 and 2007.
Note 13. Segment Information
The Company considers its business activities to constitute a single segment. A summary of the Company’s revenues by geographic area follows (in thousands):
| Year Ended December 31, 2007 | |||||||||||||||
| Americas | Europe | Asia | Other | Total | |||||||||||
| Revenues: |
|||||||||||||||
| Product revenues |
$ | 65,967 | $ | 4,579 | $ | 613 | $ | 9,413 | $ | 80,572 | |||||
| Maintenance and services revenues |
21,700 | 2,405 | 870 | 247 | 25,222 | ||||||||||
| Total |
$ | 87,667 | $ | 6,984 | $ | 1,483 | $ | 9,660 | $ | 105,794 | |||||
| Year Ended December 31, 2008 | |||||||||||||||
| Americas | Europe | Asia | Other | Total | |||||||||||
| Revenues: |
|||||||||||||||
| Product revenues |
$ | 77,946 | $ | 4,418 | $ | 505 | $ | 7,892 | $ | 90,761 | |||||
| Maintenance and services revenues |
29,712 | 2,182 | 880 | 2,146 | 34,920 | ||||||||||
| Total |
$ | 107,658 | $ | 6,600 | $ | 1,385 | $ | 10,038 | $ | 125,681 | |||||
| Year Ended December 31, 2009 | |||||||||||||||
| Americas | Europe | Asia | Other | Total | |||||||||||
| Revenues: |
|||||||||||||||
| Product revenues |
$ | 72,135 | $ | 7,246 | $ | 5,131 | $ | $ | 84,512 | ||||||
| Maintenance and services revenues |
36,291 | 3,699 | 998 | 4,083 | 45,071 | ||||||||||
| Total |
$ | 108,426 | $ | 10,945 | $ | 6,129 | $ | 4,083 | $ | 129,583 | |||||
Revenues from external customers in the United States were $61.2 million, $102.6 million and $103.8 million for the years ended December 31, 2007, 2008 and 2009 respectively. Included in Americas in the table above is $14.0 million of revenue attributed to a customer in Venezuela for the year ended December 31, 2007.
At December 31, 2008 and 2009, the Company’s property and equipment, net of accumulated depreciation and intangible assets net of amortization was as follows (in thousands):
| December 31, | ||||||
| 2008 | 2009 | |||||
| Property and equipment, net of accumulated depreciation in the United States |
$ | 34,281 | $ | 34,926 | ||
| Property and equipment, net of accumulated depreciation in other countries |
2,911 | 2,626 | ||||
| $ | 37,192 | $ | 37,552 | |||
| Intangible assets, net of accumulated amortization in the United States |
$ | 4,602 | $ | 3,818 | ||
F-29
Table of Contents
Note 14. Unaudited Quarterly Information
In the opinion of management, the following selected unaudited quarterly data has been prepared on the same basis as the audited financial statements and includes all adjustments, consisting of normal recurring adjustments, necessary for a fair presentation of the results of operations for the periods presented (in thousands).
| Mar. 31 2009 |
Jun. 30 2009 |
Sep. 30 2009 |
Dec. 31 2009 | ||||||||||
| Total revenues |
$ | 31,034 | $ | 31,771 | $ | 28,868 | $ | 37,910 | |||||
| Total cost of revenues |
9,814 | 11,459 | 13,506 | 14,123 | |||||||||
| Gross profit |
21,220 | 20,312 | 15,362 | 23,787 | |||||||||
| Operating expenses |
9,902 | 9,566 | 9,460 | 9,666 | |||||||||
| Net income |
8,950 | 8,487 | 5,660 | 9,363 | |||||||||
| Earnings per share: |
|||||||||||||
| Diluted |
$ | 0.10 | $ | 0.09 | $ | 0.06 | $ | 0.10 | |||||
| Basic |
0.10 | 0.09 | 0.06 | 0.10 | |||||||||
| Mar. 31 2008 |
Jun. 30 2008 |
Sep. 30 2008 |
Dec. 31 2008 | ||||||||||
| Total revenues |
$ | 24,631 | $ | 26,041 | $ | 35,032 | $ | 39,977 | |||||
| Total cost of revenues |
7,542 | 9,351 | 10,496 | 17,092 | |||||||||
| Gross profit |
17,089 | 16,690 | 24,536 | 22,885 | |||||||||
| Operating expenses |
(1,195 | ) | 9,037 | 9,808 | 10,482 | ||||||||
| Net income |
14,428 | 7,210 | 12,034 | 11,508 | |||||||||
| Earnings per share: |
|||||||||||||
| Diluted |
$ | 0.16 | $ | 0.08 | $ | 0.13 | $ | 0.13 | |||||
| Basic |
0.16 | 0.08 | 0.13 | 0.13 | |||||||||
F-30
Table of Contents
COGENT, INC.
VALUATION AND QUALIFYING ACCOUNTS
| Description |
Balance at Beginning of Period |
Additions Charged to Costs and Expenses [1] |
Deductions and other Adjustments |
Balance at End of Period | ||||||||||
| Year ended December 31, 2007: |
||||||||||||||
| Allowance for doubtful accounts |
$ | 692,000 | $ | (164,000 | ) | $ | (51,000 | ) | $ | 477,000 | ||||
| Year ended December 31, 2008: |
||||||||||||||
| Allowance for doubtful accounts |
$ | 477,000 | $ | 594,000 | $ | (411,000 | ) | $ | 660,000 | |||||
| Year ended December 31, 2009: |
||||||||||||||
| Allowance for doubtful accounts |
$ | 660,000 | $ | 675,000 | $ | (120,000 | ) | $ | 1,215,000 | |||||
| [1] | Represents the charges to the allowance for doubtful accounts, net of recoveries. |
S-1
Table of Contents
Pursuant to the requirements of Section 13 or 15(d) of the Securities Exchange Act of 1934, the registrant has duly caused this report to be signed on its behalf by the undersigned, thereunto duly authorized.
March 12, 2010
Cogent, Inc.
| By | /S/ MING HSIEH | |
| Ming Hsieh President and Chief Executive Officer (Principal Executive Officer) |
Pursuant to the requirements of the Securities Exchange Act of 1934, this Report has been signed below by the following persons on behalf of the registrant and in the capacities and on the dates indicated:
| Signature |
Title |
Date | ||
| /S/ MING HSIEH Ming Hsieh |
President, Chief Executive Officer and Director (Principal Executive Officer) |
March 12, 2010 | ||
| /S/ PAUL KIM Paul Kim |
Chief Financial Officer (Principal Financial and |
March 12, 2010 | ||
| /S/ JOHN BOLGER John Bolger |
Director | March 12, 2010 | ||
| /S/ JOHN P. STENBIT John P. Stenbit |
Director | March 12, 2010 | ||
| /S/ KENNETH R. THORNTON Kenneth R. Thornton |
Director | March 12, 2010 | ||