Attached files
| file | filename |
|---|---|
| 8-K - FORM 8-K - Bank of Commerce Holdings | f55282e8vk.htm |
Exhibit 99.1

| Stock Offering Investor Presentation Patrick J. Moty, President and CEO Samuel D. Jimenez, SVP & Chief Financial Officer |
| We have filed a registration statement (including a prospectus) with the SEC for the offering to which this communication relates. Before you invest, you should read the prospectus in that registration statement and other documents we have filed with the SEC for more complete information about us and this offering. You may get these documents for free by visiting EDGAR on the SEC Web site at www.sec.gov or by visiting our web site at www.bankofcommerceholdings.com. Alternatively, we, any underwriter, or any dealer participating in the offering will arrange to send you the prospectus if you request it by calling toll-free (800) 800-4693. Certain statements contained herein are forward-looking statements within the meaning of Section 27-A of the Securities Act of 1933 and Section 21E of the Securities Exchange Act of 1934 and are subject to the safe harbor provisions of the Private Securities Litigation Reform Act of 1995, that involve risks and uncertainties. Actual results may differ materially from the results in these forward-looking statements. Factors that might cause such a difference include, among other matters, changes in interest rates, economic conditions, governmental regulation and legislation, credit quality and competition affecting the Company's business; the risk of natural disasters and future catastrophic events including terrorist related incidents; and other factors discussed in the Company's Annual Report on Form 10-K for the year ended December 31, 2009 and in subsequent reports filed on Form 8-K. The Company does not undertake any obligation to publicly update or revise any of these forward-looking statements, whether to reflect new information, future events or otherwise, except as required by law. Cautionary and Forward Looking Statements |
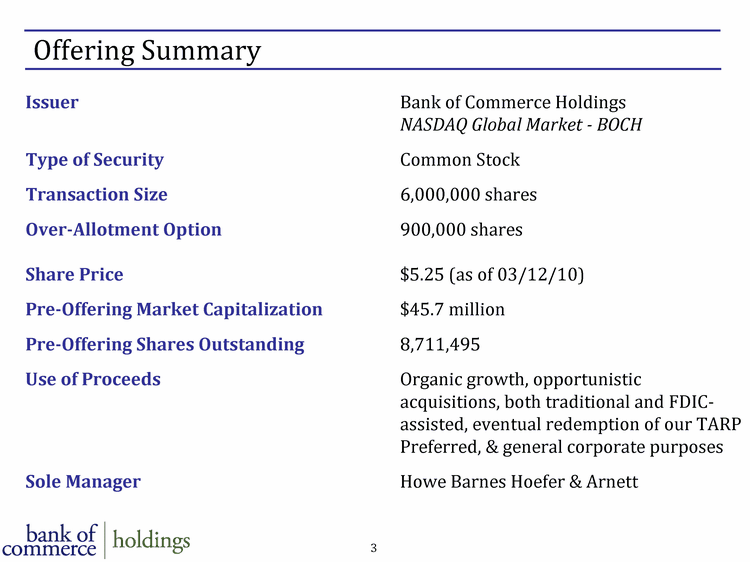
| Issuer Bank of Commerce Holdings NASDAQ Global Market - BOCH Type of Security Common Stock Transaction Size 6,000,000 shares Over-Allotment Option 900,000 shares Share Price $5.25 (as of 03/12/10) Pre-Offering Market Capitalization $45.7 million Pre-Offering Shares Outstanding 8,711,495 Use of Proceeds Organic growth, opportunistic acquisitions, both traditional and FDIC- assisted, eventual redemption of our TARP Preferred, & general corporate purposes Sole Manager Howe Barnes Hoefer & Arnett Offering Summary |
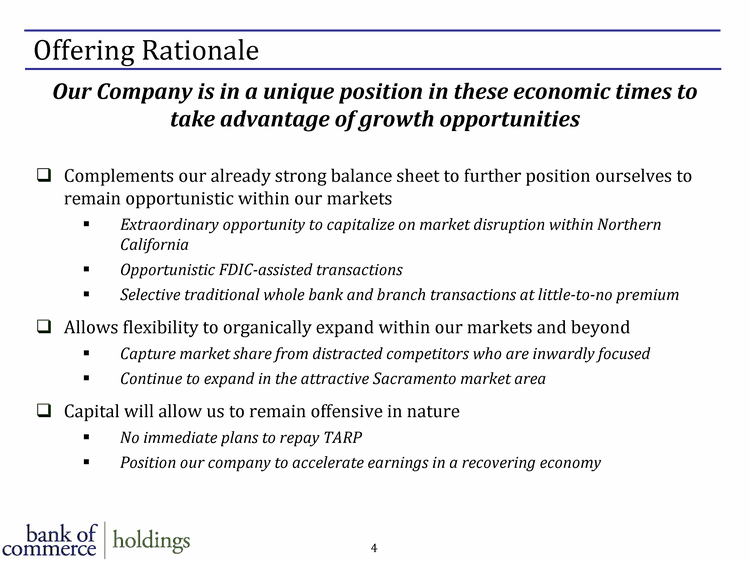
| Offering Rationale Complements our already strong balance sheet to further position ourselves to remain opportunistic within our markets Extraordinary opportunity to capitalize on market disruption within Northern California Opportunistic FDIC-assisted transactions Selective traditional whole bank and branch transactions at little-to-no premium Allows flexibility to organically expand within our markets and beyond Capture market share from distracted competitors who are inwardly focused Continue to expand in the attractive Sacramento market area Capital will allow us to remain offensive in nature No immediate plans to repay TARP Position our company to accelerate earnings in a recovering economy Our Company is in a unique position in these economic times to take advantage of growth opportunities |
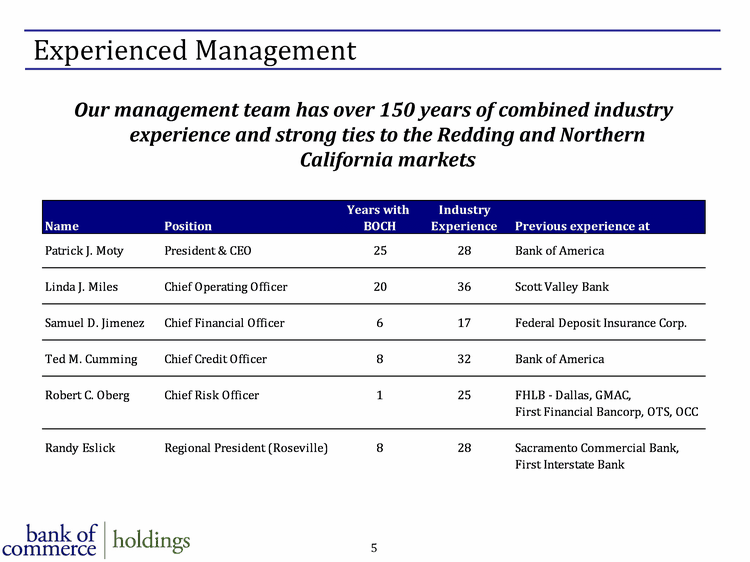
| Experienced Management Our management team has over 150 years of combined industry experience and strong ties to the Redding and Northern California markets |
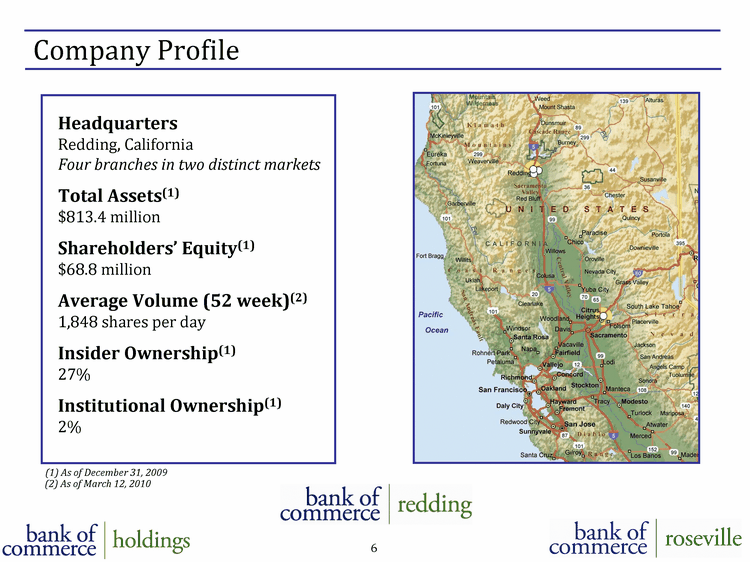
| Company Profile Headquarters Redding, California Four branches in two distinct markets Total Assets(1) $813.4 million Shareholders' Equity(1) $68.8 million Average Volume (52 week)(2) 1,848 shares per day Insider Ownership(1) 27% Institutional Ownership(1) 2% (1) As of December 31, 2009 (2) As of March 12, 2010 |
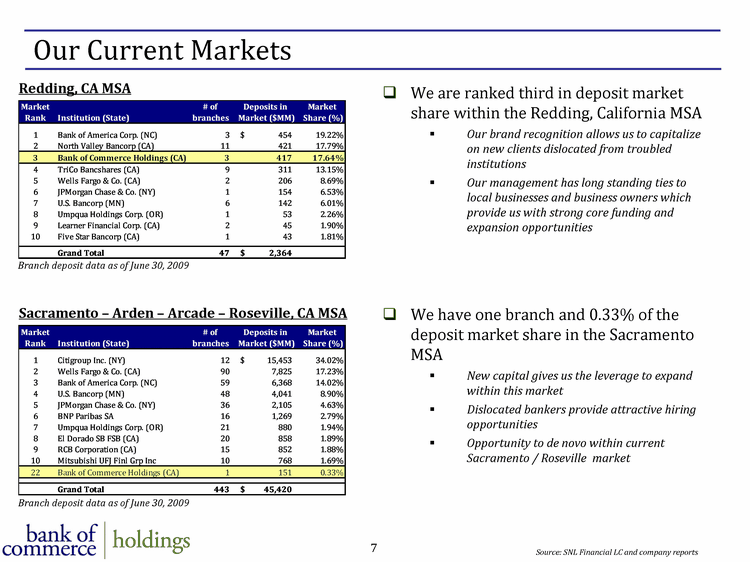
| Our Current Markets Sacramento - Arden - Arcade - Roseville, CA MSA Redding, CA MSA We are ranked third in deposit market share within the Redding, California MSA Our brand recognition allows us to capitalize on new clients dislocated from troubled institutions Our management has long standing ties to local businesses and business owners which provide us with strong core funding and expansion opportunities We have one branch and 0.33% of the deposit market share in the Sacramento MSA New capital gives us the leverage to expand within this market Dislocated bankers provide attractive hiring opportunities Opportunity to de novo within current Sacramento / Roseville market Source: SNL Financial LC and company reports Branch deposit data as of June 30, 2009 Branch deposit data as of June 30, 2009 |
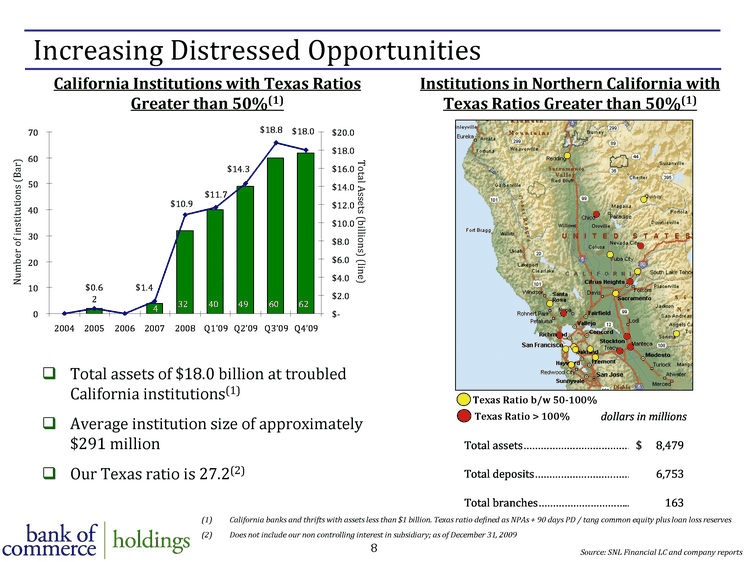
| Increasing Distressed Opportunities California Institutions with Texas Ratios Greater than 50%(1) California banks and thrifts with assets less than $1 billion. Texas ratio defined as NPAs + 90 days PD / tang common equity plus loan loss reserves Does not include our non controlling interest in subsidiary; as of December 31, 2009 Total assets of $18.0 billion at troubled California institutions(1) Average institution size of approximately $291 million Our Texas ratio is 27.2(2) Number of institutions (Bar) Total Assets (billions) (line) Institutions in Northern California with Texas Ratios Greater than 50%(1) Texas Ratio > 100% Texas Ratio b/w 50-100% Source: SNL Financial LC and company reports |
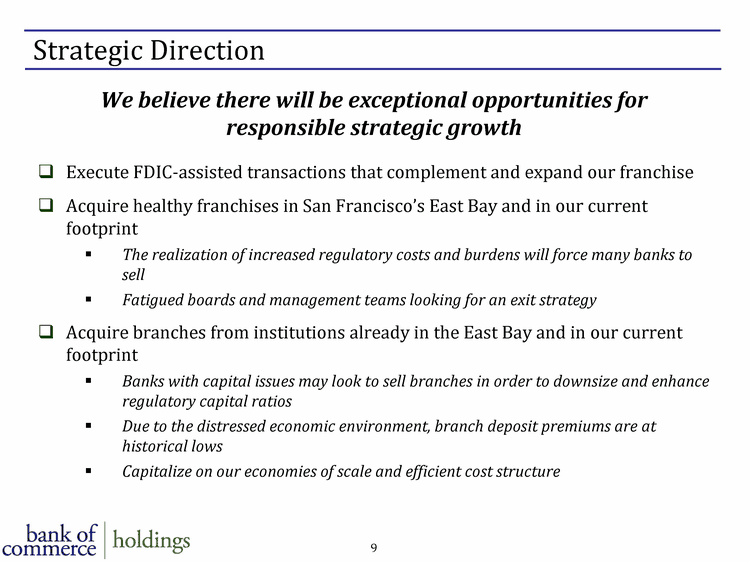
| Strategic Direction Execute FDIC-assisted transactions that complement and expand our franchise Acquire healthy franchises in San Francisco's East Bay and in our current footprint The realization of increased regulatory costs and burdens will force many banks to sell Fatigued boards and management teams looking for an exit strategy Acquire branches from institutions already in the East Bay and in our current footprint Banks with capital issues may look to sell branches in order to downsize and enhance regulatory capital ratios Due to the distressed economic environment, branch deposit premiums are at historical lows Capitalize on our economies of scale and efficient cost structure We believe there will be exceptional opportunities for responsible strategic growth |
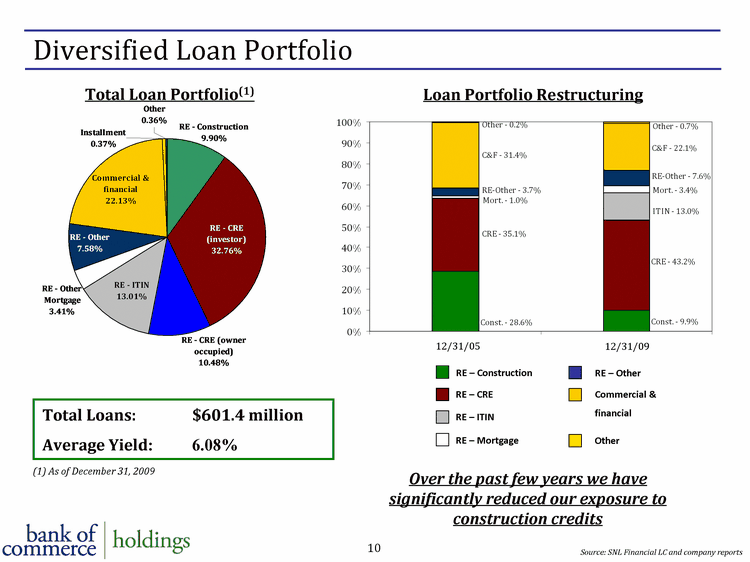
| Diversified Loan Portfolio Total Loan Portfolio(1) RE - Construction RE - CRE RE - ITIN RE - Mortgage RE - Other Commercial & financial Other Loan Portfolio Restructuring Over the past few years we have significantly reduced our exposure to construction credits Total Loans: $601.4 million Average Yield: 6.08% Source: SNL Financial LC and company reports 12/31/05 12/31/09 (1) As of December 31, 2009 |
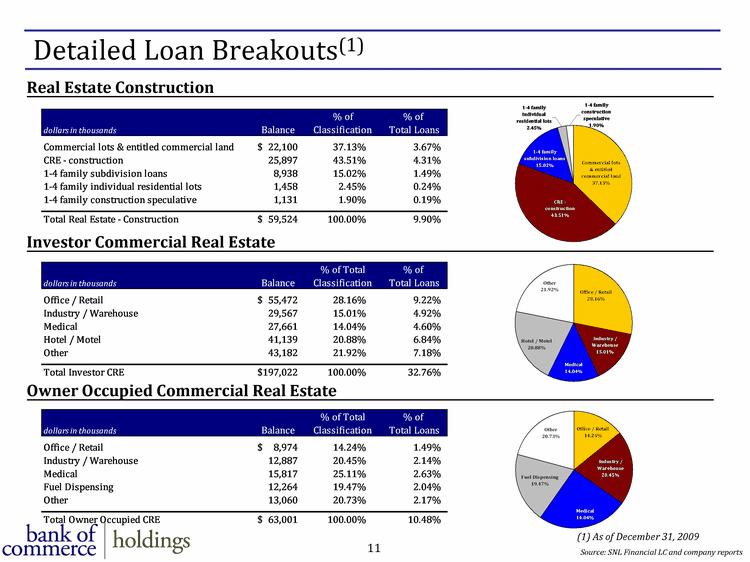
| Detailed Loan Breakouts(1) Real Estate Construction Investor Commercial Real Estate Owner Occupied Commercial Real Estate Source: SNL Financial LC and company reports (1) As of December 31, 2009 |
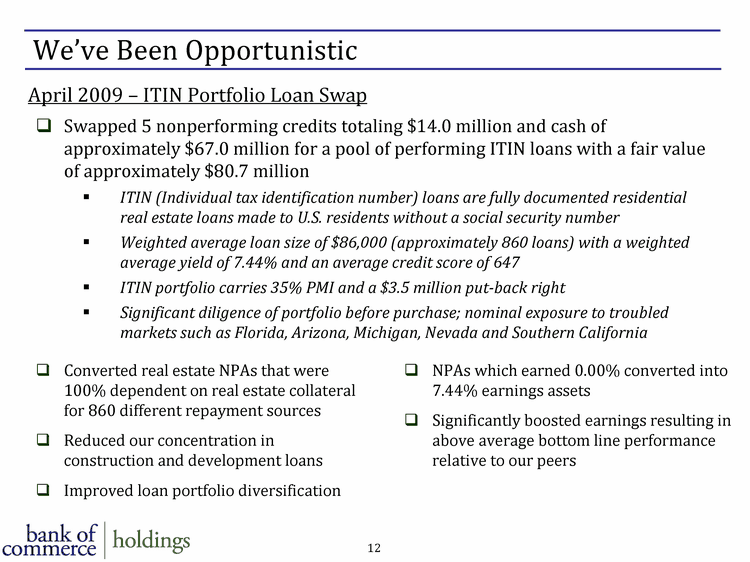
| We've Been Opportunistic Swapped 5 nonperforming credits totaling $14.0 million and cash of approximately $67.0 million for a pool of performing ITIN loans with a fair value of approximately $80.7 million ITIN (Individual tax identification number) loans are fully documented residential real estate loans made to U.S. residents without a social security number Weighted average loan size of $86,000 (approximately 860 loans) with a weighted average yield of 7.44% and an average credit score of 647 ITIN portfolio carries 35% PMI and a $3.5 million put-back right Significant diligence of portfolio before purchase; nominal exposure to troubled markets such as Florida, Arizona, Michigan, Nevada and Southern California April 2009 - ITIN Portfolio Loan Swap Converted real estate NPAs that were 100% dependent on real estate collateral for 860 different repayment sources Reduced our concentration in construction and development loans Improved loan portfolio diversification NPAs which earned 0.00% converted into 7.44% earnings assets Significantly boosted earnings resulting in above average bottom line performance relative to our peers |
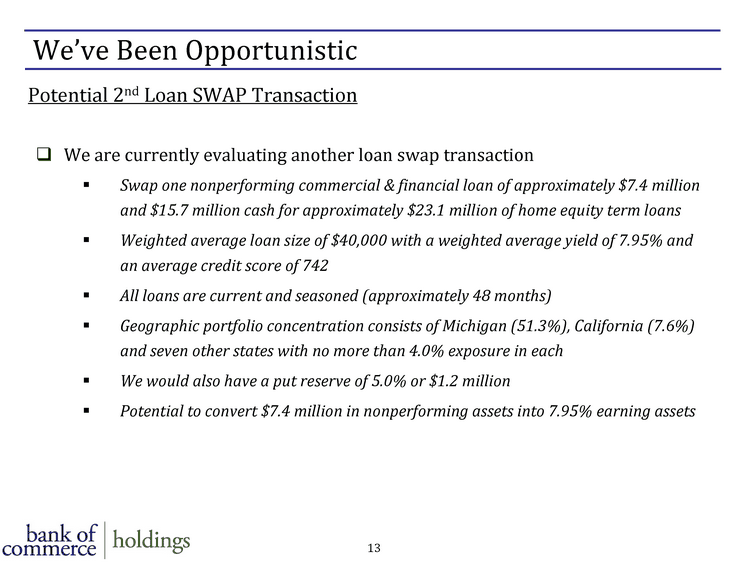
| We've Been Opportunistic We are currently evaluating another loan swap transaction Swap one nonperforming commercial & financial loan of approximately $7.4 million and $15.7 million cash for approximately $23.1 million of home equity term loans Weighted average loan size of $40,000 with a weighted average yield of 7.95% and an average credit score of 742 All loans are current and seasoned (approximately 48 months) Geographic portfolio concentration consists of Michigan (51.3%), California (7.6%) and seven other states with no more than 4.0% exposure in each We would also have a put reserve of 5.0% or $1.2 million Potential to convert $7.4 million in nonperforming assets into 7.95% earning assets Potential 2nd Loan SWAP Transaction |
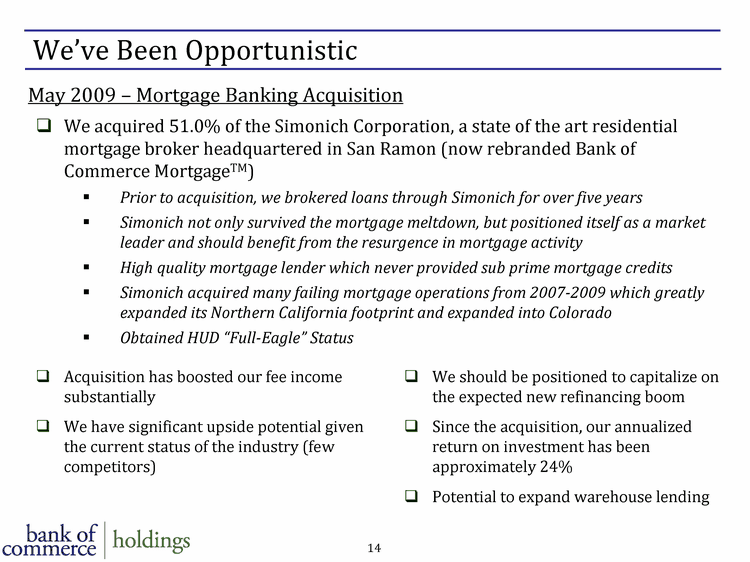
| We've Been Opportunistic We acquired 51.0% of the Simonich Corporation, a state of the art residential mortgage broker headquartered in San Ramon (now rebranded Bank of Commerce MortgageTM) Prior to acquisition, we brokered loans through Simonich for over five years Simonich not only survived the mortgage meltdown, but positioned itself as a market leader and should benefit from the resurgence in mortgage activity High quality mortgage lender which never provided sub prime mortgage credits Simonich acquired many failing mortgage operations from 2007-2009 which greatly expanded its Northern California footprint and expanded into Colorado Obtained HUD "Full-Eagle" Status May 2009 - Mortgage Banking Acquisition Acquisition has boosted our fee income substantially We have significant upside potential given the current status of the industry (few competitors) We should be positioned to capitalize on the expected new refinancing boom Since the acquisition, our annualized return on investment has been approximately 24% Potential to expand warehouse lending |
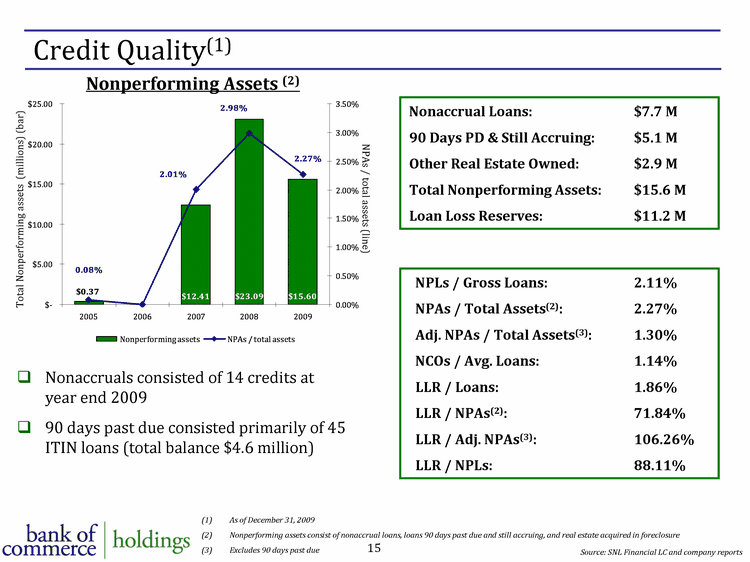
| Credit Quality(1) Nonperforming Assets (2) NPAs / total assets (line) Total Nonperforming assets (millions) (bar) As of December 31, 2009 Nonperforming assets consist of nonaccrual loans, loans 90 days past due and still accruing, and real estate acquired in foreclosure Excludes 90 days past due Nonaccrual Loans: $7.7 M 90 Days PD & Still Accruing: $5.1 M Other Real Estate Owned: $2.9 M Total Nonperforming Assets: $15.6 M Loan Loss Reserves: $11.2 M NPLs / Gross Loans: 2.11% NPAs / Total Assets(2): 2.27% Adj. NPAs / Total Assets(3): 1.30% NCOs / Avg. Loans: 1.14% LLR / Loans: 1.86% LLR / NPAs(2): 71.84% LLR / Adj. NPAs(3): 106.26% LLR / NPLs: 88.11% Nonaccruals consisted of 14 credits at year end 2009 90 days past due consisted primarily of 45 ITIN loans (total balance $4.6 million) Source: SNL Financial LC and company reports |
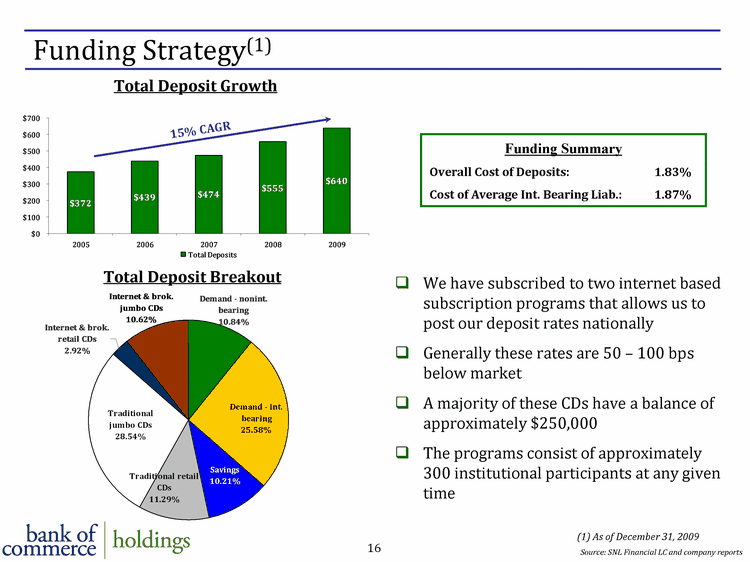
| Funding Strategy(1) Total Deposit Breakout Total Deposit Growth 15% CAGR Funding Summary Overall Cost of Deposits: 1.83% Cost of Average Int. Bearing Liab.: 1.87% We have subscribed to two internet based subscription programs that allows us to post our deposit rates nationally Generally these rates are 50 - 100 bps below market A majority of these CDs have a balance of approximately $250,000 The programs consist of approximately 300 institutional participants at any given time Source: SNL Financial LC and company reports (1) As of December 31, 2009 |
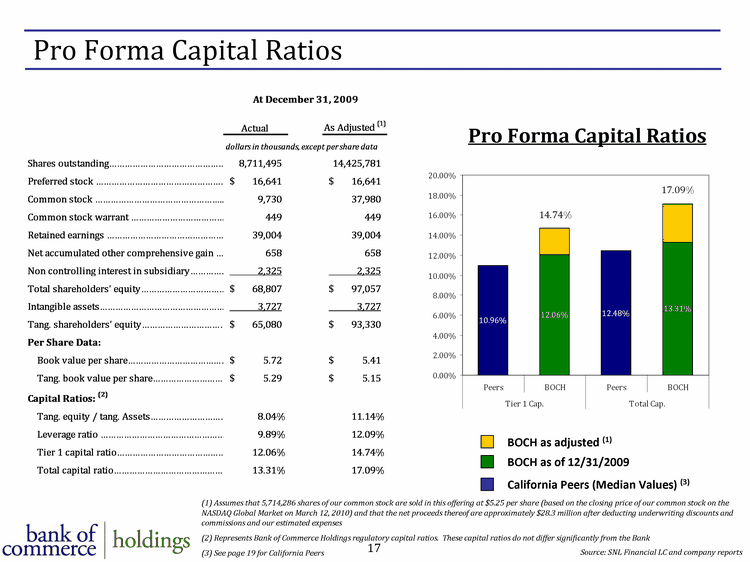
| Pro Forma Capital Ratios California Peers (Median Values) (3) BOCH as of 12/31/2009 BOCH as adjusted (1) Pro Forma Capital Ratios (1) Assumes that 5,714,286 shares of our common stock are sold in this offering at $5.25 per share (based on the closing price of our common stock on the NASDAQ Global Market on March 12, 2010) and that the net proceeds thereof are approximately $28.3 million after deducting underwriting discounts and commissions and our estimated expenses (2) Represents Bank of Commerce Holdings regulatory capital ratios. These capital ratios do not differ significantly from the Bank (3) See page 19 for California Peers Source: SNL Financial LC and company reports |
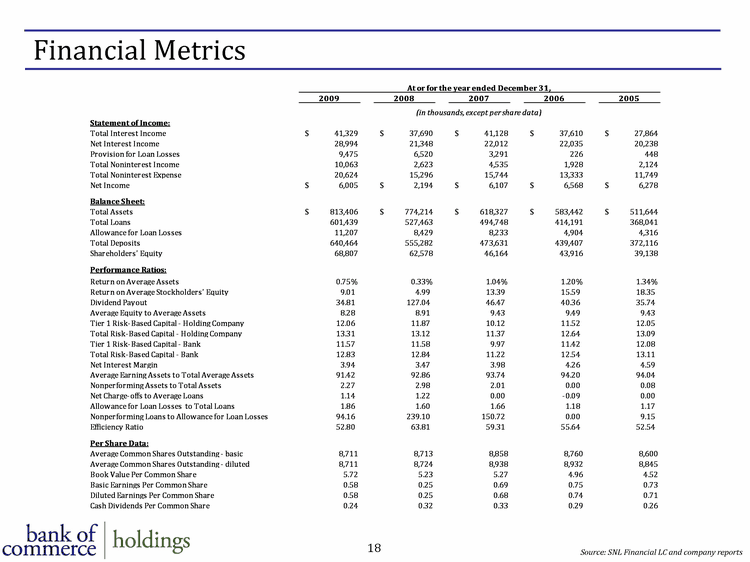
| Financial Metrics Source: SNL Financial LC and company reports |
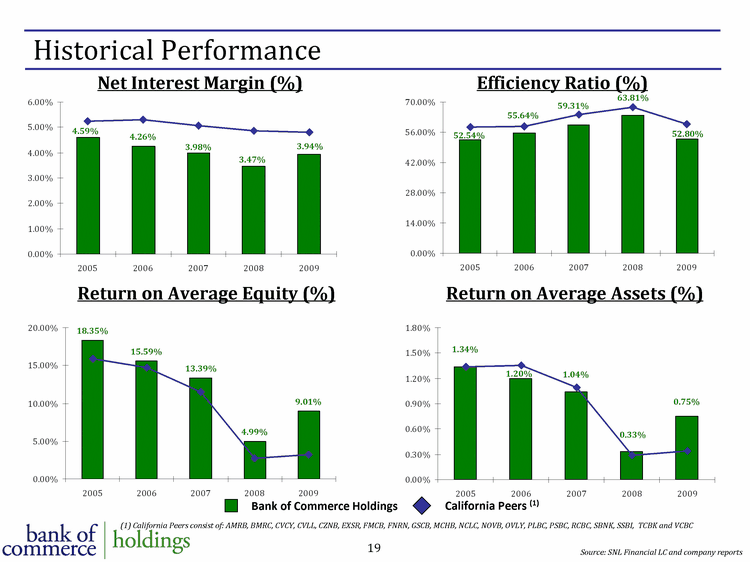
| Historical Performance Return on Average Equity (%) Net Interest Margin (%) Efficiency Ratio (%) Return on Average Assets (%) Bank of Commerce Holdings California Peers (1) Source: SNL Financial LC and company reports (1) California Peers consist of: AMRB, BMRC, CVCY, CVLL, CZNB, EXSR, FMCB, FNRN, GSCB, MCHB, NCLC, NOVB, OVLY, PLBC, PSBC, RCBC, SBNK, SSBI, TCBK and VCBC |
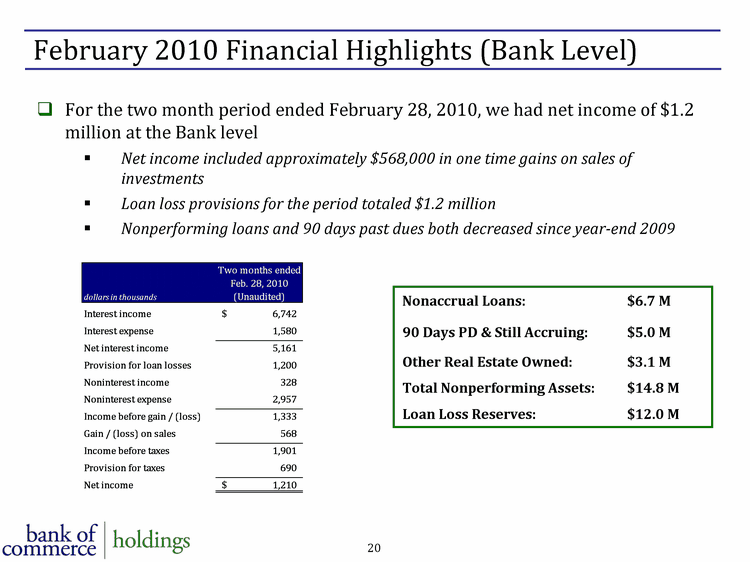
| February 2010 Financial Highlights (Bank Level) For the two month period ended February 28, 2010, we had net income of $1.2 million at the Bank level Net income included approximately $568,000 in one time gains on sales of investments Loan loss provisions for the period totaled $1.2 million Nonperforming loans and 90 days past dues both decreased since year-end 2009 Nonaccrual Loans: $6.7 M 90 Days PD & Still Accruing: $5.0 M Other Real Estate Owned: $3.1 M Total Nonperforming Assets: $14.8 M Loan Loss Reserves: $12.0 M |

| Patrick J. Moty Samuel D. Jimenez President & CEO SVP & Chief Financial Officer (530) 722-3953 (530) 722-3952 patm@reddingbankofcommerce.com samj@reddingbankofcommerce.com |
