Attached files
Table of Contents
UNITED STATES
SECURITIES AND EXCHANGE COMMISSION
Washington, D.C. 20549
FORM 10-K
| þ | ANNUAL REPORT PURSUANT TO SECTIONS 13 OR 15(d) OF THE SECURITIES EXCHANGE ACT OF 1934 |
For the Fiscal Year Ended December 31, 2009
OR
| ¨ | TRANSITION REPORT PURSUANT TO SECTION 13 OR 15(d) OF THE SECURITIES EXCHANGE ACT OF 1934 |
For the Transition Period From TO
Commission file number 000-32980
BMP SUNSTONE CORPORATION

600 W. Germantown Pike, Suite 400
Plymouth Meeting, Pennsylvania 19462
(Exact Name of Registrant as Specified in its Charter)
| Delaware | 20-0434726 | |
| (State or Other Jurisdiction of Incorporation or Organization) |
(I.R.S. Employer Identification No.) | |
| 600 W. Germantown Pike, Suite 400 Plymouth Meeting, Pennsylvania |
19462 | |
| (Address of Principal Executive Offices) | (Zip Code) | |
(610) 940-1675
Registrant’s telephone number, including area code
SECURITIES REGISTERED PURSUANT TO SECTION 12(b) OF THE ACT:
| COMMON STOCK, PAR VALUE $0.001 PER SHARE |
NASDAQ | |
| (Title of Class) | (Name of exchange on which registered) |
SECURITIES REGISTERED PURSUANT TO SECTION 12(g) OF THE ACT:
(Title of Class)
Indicate by check mark if the registrant is a well-known seasoned issuer, as defined in Rule 405 of the Securities Act. Yes ¨ No þ
Indicate by check mark if the registrant is not required to file reports pursuant to Section 13 or Section 15(d) of the Act. Yes ¨ No þ
Indicate by check mark whether the registrant: (1) has filed all reports required to be filed by Section 13 or 15(d) of the Securities Exchange Act of 1934 during the preceding 12 months (or for such shorter period that the registrant was required to file such reports), and (2) has been subject to such filing requirements for the past 90 days. Yes þ No ¨
Indicate by check mark whether the registrant has submitted electronically and posted on its corporate Web site, if any, every Interactive Data File required to be submitted and posted pursuant to Rule 405 of Regulation S-T (§ 232.405 of this chapter) during the preceding 12 months (or for such shorter period that the registrant was required to submit and post such files). Yes ¨ No ¨
Indicate by check mark if disclosure of delinquent filers pursuant to Item 405 of Rule S-K is not contained herein, and will not be contained, to the best of registrants’ knowledge, in definitive proxy or information statements incorporated by reference in Part III of this Form 10-K or any amendment to this Form 10-K. þ
Indicate by check mark whether the registrant is a large accelerated filer, an accelerated filer, a non-accelerated filer, or a smaller reporting company. See the definitions of “large accelerated filer,” “accelerated filer” and “smaller reporting company” in Rule 12b-2 of the Exchange Act. (Check one):
| Large accelerated filer ¨ | Accelerated filer þ | Non-accelerated filer ¨ | Smaller Reporting Company ¨ | |||
| (Do not check if a smaller reporting company) |
Indicate by check mark whether the registrant is a shell company (as defined in Rule 12b-2 of the Exchange Act) Yes ¨ No þ
The aggregate market value of Common Stock held by non-affiliates of the registrant as of the registrant’s stock on June 30, 2009 (based on the last reported sale price on the Nasdaq Global Market as of such date) was $117,376,000 assuming all officers, directors and persons deemed to be the beneficial owner (beneficial ownership determined in accordance with the rules of the Securities and Exchange Commission) of 10% or more of our capital stock are affiliates. As of March 15, 2010 there were 41,941,987 shares of the registrant’s Common Stock outstanding.
DOCUMENTS INCORPORATED BY REFERENCE
Portions of the definitive proxy statement for the registrant’s 2010 annual meeting of stockholders to be filed within 120 days after the end of the period covered by this Annual Report on Form 10-K are incorporated by reference into Part III of this Annual Report on Form 10-K.
Table of Contents
TABLE OF CONTENTS
Table of Contents
CAUTIONARY NOTE REGARDING FORWARD-LOOKING STATEMENTS
In addition to historical facts or statements of current condition, this report and the documents into which this report is and will be incorporated contain forward-looking statements within the meaning of Section 27A of the Securities Act of 1933, as amended, and Section 21E of the Securities Exchange Act of 1934, as amended, or the Exchange Act. Forward-looking statements contained in this report constitute our expectations or forecasts of future events as of the date this report was filed with the Securities and Exchange Commission (the “SEC”) and are not statements of historical fact. You can identify these statements by the fact that they do not relate strictly to historical or current facts. Such statements may include words such as “anticipate,” “will,” “estimate,” “expect,” “project,” “intend,” “should,” “plan,” “believe,” “hope,” and other words and terms of similar meaning in connection with any discussion of, among other things, future operating or financial performance, strategic initiatives and business strategies, regulatory or competitive environments, our intellectual property and product development. In particular, these forward-looking statements include, among others, statements about:
| • | our business strategy; |
| • | competition in the Chinese pharmaceutical industry and our ability to compete; |
| • | our belief that a significant opportunity exists to obtain an increased market share in the Chinese pharmaceutical marketing and distribution markets by offering development services with market fulfillment services; |
| • | our expectation that substantially all of our revenues, profits, cash flows and assets will continue to be derived in China and be denominated in Chinese currency; |
| • | our belief regarding the significance of brand recognition; |
| • | our future financial and operating results; |
| • | the dependence of our future success on obtaining additional promotional and market research agreements and licensing rights for China; |
| • | our ability to fund our current level of operations for the next twelve months through our cash and cash equivalents; |
| • | our expectation regarding our cash and cash equivalents; |
| • | impact of recent accounting pronouncements; |
| • | our expectation regarding our Exchange Act reporting obligations; and |
| • | any other statements regarding matters not of historical fact. |
The words “may,” “will,” “expect,” “intend,” “anticipate,” “estimate,” “believe,” “continue,” and similar expressions may identify forward-looking statements, but the absence of these words does not necessarily mean that a statement is not forward-looking. Forward-looking statements involve known and unknown risks, uncertainties and achievements, and other factors that may cause our or our industry’s actual results, levels of activity, performance, or achievements to be materially different from the information expressed or implied by these forward-looking statements. While we believe that we have a reasonable basis for each forward-looking statement contained in this report, we caution you that these statements are based on a combination of facts and factors currently known by us and projections of the future about which we cannot be certain. Many factors affect our ability to achieve our objectives, including:
| • | our inability to compete successfully against new and existing competitors or to leverage our marketing capabilities with our distribution capabilities; |
| • | delays in product introduction and marketing or interruptions in supply; |
| • | a decrease in business from our major clients; |
1
Table of Contents
| • | adverse economic, political or social conditions in China; |
| • | difficulties in acquiring complementary businesses or in integrating acquired businesses; |
| • | our inability to obtain additional capital when necessary; |
| • | our inability to manage our growth effectively; |
| • | our inability to attract and retain key personnel; |
| • | our inability to effectively market our services or obtain and maintain arrangements with manufacturers; and |
| • | a slowdown in the Chinese economy. |
In addition, you should refer to the “Risk Factors” section of this report for a discussion of other factors that may cause our actual results to differ materially from those implied by our forward-looking statements. As a result of these factors, we cannot assure you that the forward-looking statements in this report will prove to be accurate. In addition, if our forward-looking statements prove to be inaccurate, the inaccuracy may be material. In light of the significant uncertainties in these forward-looking statements, you should not regard these statements as a representation or warranty by us or any other person that we will achieve our objectives and plans in any specified time frame, if at all. We may not update these forward-looking statements, even though our situation may change in the future.
2
Table of Contents
| ITEM 1. | BUSINESS |
BMP Sunstone Corporation, a Delaware corporation, referred to herein as BMP Sunstone, we, us, our and the Company, is a specialty pharmaceutical company engaged in the development, manufacture, and sales of over-the-counter, or OTC, medicinal brands for women and children in China. We also provide other international pharmaceutical manufacturers with a single point of contact for comprehensive services, including clinical research and product registration, marketing and promotional support, and product distribution, to facilitate the introduction of their pharmaceutical products into the Chinese market.
Our business in Manufactured Products medicines for children and women is conducted primarily by our subsidiary Sunstone (Tangshan) Pharmaceutical Co., Ltd, or Sunstone. Integrated market-entry services for international pharmaceutical manufacturers are provided through Beijing Med-Pharm Co. Ltd., or BMP China, Beijing WanWei Pharmaceutical Co., Ltd., or WanWei, and Shanghai Rongheng Pharmaceutical Co., Ltd., or Rongheng.
Our profit from operations derives mainly from Sunstone, BMP China, and WanWei.
We were incorporated in the State of Delaware in November, 2003, as a wholly owned subsidiary of Just Great Coffee, Inc., a New Jersey corporation. In January 2004, Just Great Coffee, Inc. merged with and into us and we were the surviving corporation. BMP China was incorporated in China in May 1994. In December 2001, Abacus Investments Limited, or Abacus, acquired a 100% equity interest in BMP China. In February 2004, we acquired all of the equity interests of BMP China from Abacus in exchange for our issuance to Abacus of 7,807,509 shares of our common stock, which represented approximately 90% of our common stock at the time of the exchange. As a result of this exchange, BMP China became our wholly owned subsidiary. In December 2005, we completed our acquisition of WanWei. On October 31, 2007, we completed the acquisition of 49% of the issued share capital of Sunstone China Limited (formerly named Hong Kong Fly International Health Care Limited), or Sunstone China, which holds a 100% equity interest in Sunstone. On February 18, 2008, we completed the acquisition of the remaining 51% interest in Sunstone China that we had not already acquired (for the period November 1, 2007 through February 17, 2008, we accounted for Sunstone China as an equity investee). On July 4, 2008, we completed the acquisition of 63.3% of the issued share capital of Rongheng. On February 16, 2009, Sunstone received its business license for 50% of the outstanding equity of Zhangjiakou Shengda Pharmaceutical Co.Ltd, which has changed its name to Sunstone Shengda (Zhangjiakou) Pharmaceutical Co.Ltd, or Shengda. On April 16, 2009, Sunstone Fly (Tangshan) Pharmaceutical Co. Ltd, or Sunstone Fly, whose 70% outstanding equity is held by Sunstone, was founded. Sunstone Fly produces traditional Chinese medicines, or TCMs, for the pediatric market.
3
Table of Contents
Set forth below is a chart that reflects our current corporate organization:
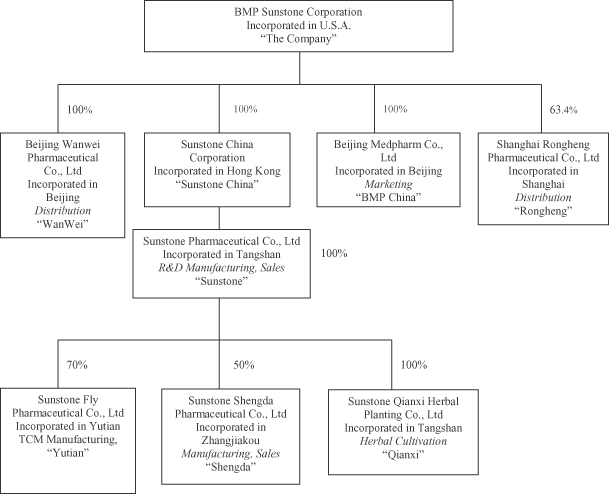
4
Table of Contents
Industry Environment and Development Prospects
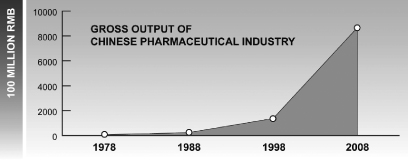
Economic reform and the gradual opening of markets in China began in the late 1970’s. Since then, the climate for both domestic and foreign businesses has undergone dramatic transformation. According to 2009 Medicine Economic News, during this 30-year period, Chinese per-capita consumption of goods and services increased 28 times, per-capita health expenditures increased 64 times, and per-capita drug spending increased from RMB4 to RMB378. Further according to 2009 Medicine Economic News, in 1978, China’s share of the global pharmaceutical market was only 0.9% and by 2008, that share had increased to 8.3%. The gross output value of the Chinese pharmaceutical industry (see the chart below) grew from $7.9 billion in 1978 to $866.6 billion in 2008. This represents a compound annual growth rate, or CAGR, of 17%, or approximately 1.5 times the CAGR of GDP in China during the same period. The total volume of foreign trade value of Chinese medicines and health products grew from $330 million in 1978 to $48.69 billion in 2008.
IMS Health forecasts that China will be the 3rd largest medicinal market in the world in 2011, and that by 2020, it will have moved into second position, behind only the United States.
We believe economic conditions for the pharmaceutical industry in China remain favorable. In 2009, the growth rate in the Chinese GDP reached 8.7% and the economic aggregate totaled RMB33.5 trillion. According to data from the Chinese Ministry of Industry and Information, during the first three quarters of 2009 the gross output value of the Chinese pharmaceutical industry reached RMB618.4 billion This represents a year-over-year increase of 17.3%, more than 14 percentage points higher than the corresponding average growth rate for all Chinese industries combined (2.97%). Given the strong growth of both domestic demand for medicines and pharmaceutical manufacturing capacity and output, we expect this robust rate of growth to continue.
Market conditions also continue to be influenced by the evolution of Chinese government healthcare policy. “Opinions of the State Council on Deepening the Reform of the Medical and Health Care System,” issued by The State Council of the People’s Republic of China (the State Council) in April 2009, signaled the formal commencement of a major public health initiative by the Chinese government. The goal of this new policy is to provide access to basic medical care for every person in China by the 2020. Subsequent government policy statements related to this reform, including “Opinions on Formulation and Implementation of National Essential Medicine System,” “National Essential Drugs List,” and “China’s National Medical Insurance Catalog,” or the 2009 NIC, are set to exert considerable, generally positive, influence on the Chinese pharmaceutical industry and its future development. For example, as stated above, a major component of these reforms is an effort to extend basic medical insurance coverage to a larger portion of the Chinese population.
In January 2009, the State Council of the People’s Republic of China announced it would spend RMB850 billion over three years to increase the enrollment rate in basic medical insurance above 90% among urban residents and participants in the new rural cooperative medical system; raise the governmental per-capita subsidy for medical insurance to RMB120 starting in 2010; and increase the reimbursement rates and payment limits for medical services. The Ministry of Human Resources and Social Security of the People’s Republic of China estimated that, by the end of 2009, the number of Chinese citizens with medical insurance had already reached
5
Table of Contents
1.2 billion. According to the State Food and Drug Administration, or the SFDA, Southern Medicine Economy Economic Research Institute, the portion of anticipated growth in the Chinese pharmaceutical market directly attributable to this expansion of medical insurance coverage will be approximately RMB200 billion in 2010. As a result, the gross output value of the Chinese pharmaceutical industry is expected to grow by 23% in 2010, reaching RMB1.25 trillion.
Our Opportunity
The centers of growth for the global pharmaceutical industry will continue a steady shift from European, American and other leading markets to Asia, Australia, Latin American, Eastern Europe and other regions. One of the largest and fastest growing of these growing markets, China, will represent a significant opportunity for the pharmaceutical industry for the foreseeable future. BMP Sunstone has made strategic investments in key sectors of this dynamic marketplace to secure a competitive position and drive market share growth. In addition to the beneficial impact of favorable economic conditions and government health policies on the Chinese pharmaceutical market, the following factors also enhance the prospects for rapid development and strong performance of our Company:
Large Population and Target Segment Size
Home to nearly 20% of all human beings, China is the most populous nation in the world. According to the Chinese National Bureau of Statistics, the total national population at the end of 2008 was 1.328 billion. Nearly half (48.5%) of this total, or 644 million Chinese, were female, with the number of women of reproductive age exceeding 350 million. The number of children (0-14 years old) was 251 million, accounting for 19% of the total population. There were 16.08 million births in 2009.
Aging Population
China’s aging population is also growing, expected to reach 173 million in 2010, representing approximately 12.5% of the total population. By 2020, it is estimated by China’s Population and Development Research Center that the growth in the aging population in China will accelerate, reaching 245 million or over 16% of the total population.
Continued Urbanization
Population migration into large urban centers continues to accelerate in China. At the end of 2008, the Chinese urban population was 606 million, or 45.7% of the total population. By 2020, an estimated 50%-55% of all Chinese will live in cities.
Large Gynecological Market
The market for medicines for women in China is approximately RMB20 billion and is dominated by treatments for common gynecological disorders including vaginal inflammation and endometriosis. Approximately 42.9% of women will experience at least one incidence of vaginal inflammation, and about 30% of women, particularly between the ages of 30 and 50, suffer from hysteromyoma (fibroids). Approximately 10-15% of the 300 million women of child-bearing age in China are diagnosed with endometriosis each year. We have obtained the exclusive license to market and distribute Depo Provera from Pfizer for the treatment of Endometriosis.
Unmet Needs in the Obstetrical Market
As a report from The World Health Organization revealed, the current caesarean birth rate in China is 40%-46%, the highest in the world. Approximately 25% of these procedures are unnecessary. The incidence of
6
Table of Contents
premature delivery ranges from 5-15% and the incidence of threatened premature delivery reached 28% as more Chinese women wait until they are older to become pregnant. The Guidelines for Labor Induction in Late Stage Pregnancy was published in the Chinese Journal of Obstetrics and Gynecology in January 2008 and selected Propess as the first line treatment for labor induction in late stage pregnancy. Propess is marketed and distributed by us in China. In addition, we market and distribute Anpo for the management of pre-term labor.
Growing Pediatric Market.
The market for pediatric medicines has grown to nearly RMB30 billion. The most significant products for this market are anti-cold medicines, drugs for respiratory diseases, anti-diarrhea medicines, anti-infectives and vitamins, which account for 80% of all pediatric medicine. Our GoodBaby product range manufactured and sold by Sunstone is a leading pediatric brand in China.
Growth of OTC Market
The market for over-the-counter, or OTC, medicines in China has shown rapid development, growing from RMB 1.9 billion in 1990 to RMB 129.5 billion in 2008. According to China Medicine News, in 2010, China is expected to become the world’s second largest market for OTC medicines. Corresponding to the rapid development of China’s OTC market, some original research-based multinational corporations accelerated the growth in China’s OTC market through mergers and acquisitions.
Progress in China’s medical reform initiatives, movement toward universal medical insurance, an aging population, as well as the consolidation and integration of the domestic pharmaceutical markets will encourage further development of the Chinese pharmaceutical industry and significantly expand commercial opportunity. Furthermore, among Chinese pharmaceutical segments, the obstetrical, gynecological and pediatric markets are relatively fragmented and underserved. Taken together, these factors define a broad range of attractive opportunities for further growth of BMP Sunstone.
Description of Business and Position in Industry
BMP Sunstone is a fully integrated specialty pharmaceutical company with both prescription and OTC products focused primarily on pediatrics and women’s health. Sunstone is a leading domestic producer of OTC brand medicines for women and children, while BMP China operates a leading professional sales organization specializing in obstetrical prescription medicines.
The Company has been devoted to the development of the Chinese pharmaceutical market since its inception and has already made significant progress toward becoming a market leader on the basis of a flexible and highly efficient approach to mergers and acquisitions, a management team with extensive operational and business development experience in China, and a high degree of collaboration among our subsidiary companies. Through brand extensions and expanded channel coverage, Sunstone has built leading OTC brand families for children (“Goodbaby”) and for women (“Confort”). By virtue of unique product introductions, our medical sales and promotion capabilities, and a clear focus on gynecology and obstetrics, BMP China has maintained rapid growth and become the leading domestic supplier of obstetrical medicines. The pharmaceutical distribution businesses of WanWei and Rongheng have also experienced rapid growth and the enhancement of their collaboration with BMP China has laid a solid foundation for the nationwide expansion of BMP China.
Sunstone (Manufactured Products Segment)
Our Manufactured Products segment consists of the operations of Sunstone. Sunstone specializes in medicines for women and children and has manufacturing facilities located in Tangshan, Hebei Province China. Revenues from the Manufactured Products segment account for more than 90% of Sunstone’s total revenue. In 2009, sales of GoodBaby products accounted for 78.3% of total revenue, and sales of Confort products accounted for 12.1% of total revenue.
7
Table of Contents
According to the China Pharmaceutical Statistical Annual Report in 2008, Sunstone ranked among the top 100 National Pharmaceutical Enterprises based on both revenue and profit.
Products
Sunstone owns 102 Product Approval Numbers, which represents the number of products approved for sale by the SFDA. Sunstone markets three brand families “Goodbaby,” “Confort” and “Nemei.”
Major products in the Goodbaby brand family include Pediatric Paracetamol and Amantadine Hydrochloride Granules, Pediatric Huatan Coughing Granules, Pediatric Kechuanling Oral Solution, Amoxicillin and Clavulanate Dispersible Tablets for children, Amoxicillin Dispersible Tablets, Roxithromycin Dispersible Tablets, Pidotimod Tablets, Montmorillonite Granules, and Pediatric Vitamin Granules.
The product portfolio under the Confort brand includes multiple products for vaginal infections, including Compound Zedoary Turmeric Oil Suppository, Econazole Nitrate Suppository, Clotrimazole and Chlorhexidine Acetate Suppositories and Nifuratel-Nystatin Vaginal Soft Capsules.
The Nemei brand family consists of a variety of OTC women’s health products related to nutrition and general well being.
GoodBaby has been designated a Certified Famous Chinese Brand. Confort has received a famous trademark designation from Hebei Province.
For three consecutive years, from 2005 to 2008, GoodBaby was ranked among the “Most Recommended Brands by Pharmacy Employees” by the Chinese OTC Medicine Association.
In August 2009, the Chinese OTC Medicine Association ranked Sunstone’s Amantadine Hydrochloride Granules No.1 among pediatric OTC medicines. In October 2009, GoodBaby and Confort were recognized as the “Most Recommended Brands by Pharmacy Employees” by China Drugstore Magazine. In December 2009, Goodbaby and Confort were named the “Favorite Brand of Chinese Women and Children” by the Chinese Women and Children Development Center.
Related Subsidiaries
Shengda specializes in antibiotic research, development and production. It has approval from the SFDA to manufacture approximately 76 products, and primarily focuses on penicillin and cephalosporin products. Dosages and flavors are specifically designed for the unique needs of children and the product portfolio includes some of the most widely prescribed and effective pediatric medicines, such as amoxicillin tablets and capsules, as well as amoxicillin and clavulanate potassium compounds. The products are formulated as dispersible tablets, which offer consistently high levels of safety and efficacy and are preferred by parents for ease of administration to children.
Distribution and Marketing
As of December 31, 2009, Sunstone had more than 1,500 salespeople in 35 regional offices promoting its products throughout China.
To broaden awareness of Sunstone brands and appreciation for our leading role in protecting the health and well-being of women and children in China, we have launched four public health campaigns, including “GoodBaby Family Medicine-chest activity,” “Bright Mother, Healthy Baby appraisal,” “GoodBaby Health Plan in Community” and “Goodbaby Cup Painting competition.” These campaigns reach children and mothers through kindergartens, elementary schools, and communities all over China. Our approach to creating value for our customers is based on the concept of “customized solution, customized health,” and we try to incorporate this
8
Table of Contents
idea into all of our promotional activities. We believe our business is about more than promoting our products; it is about promoting health. In 2009, we carried out a large public service activity, “Light New Hope,” to support the mothers and children of the Sichuan-Wenchuan earthquake disaster region in collaboration with pharmacies all over China. This activity, which included over 100,000 pharmacies, successfully heightened our corporate image and increased popular support for the Sunstone, GoodBaby and Confort brands.
Our sales system has enabled us to build a large selling network. This network, extending throughout most of China, gives us access to 25,000 target hospitals, pharmacies, and community and county-level medical institutions, as well as more than 350 independent distributors. Essentially, we have expansive coverage of primary pharmacies in all major consumer markets in China.
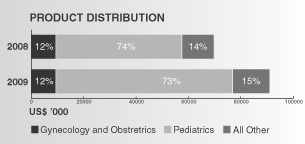
Our product distribution during 2009 and 2008 for Sunstone and BMP China is represented in the charts below:
Research and Development
Throughout its history, Sunstone has engaged in extensive research and development activities through independent research and development and cooperation with leading scientific research institutions in China. Currently, Sunstone is conducting 32 trials for drugs which have received clinical trial approval, or CTAs, including 13 products for pediatrics and 7 products for gynecology. In addition, Sunstone currently has 5 CTAs pending review for Product Approval Numbers. The successful development of new products is an important driver of Sunstone’s continued success.
Sunstone secured the Hi-tech Enterprise Certificate issued by the Hebei Science and Technology Department, which provides Sunstone with a preferential income tax rate of 15% for the years 2008, 2009 and 2010.
Intellectual Property
Sunstone owns or licenses 25 patents which have been approved by the Intellectual Property Office of the People’s Republic of China, and 13 invention patents. These patents provide protection relating to production technology, production devices and package design, giving our products unique competitive advantages and differentiation. Sunstone has obtained more than 100 trademarks, including those relating to Goodbaby, Confort, Sunstone and other major marks or names.
WanWei (Pharmaceutical Distribution Segment)
WanWei was founded in 1999 and its main business is distribution of medicinal products. In addition to the distribution of TCMs, chemical pharmaceutical preparations, chemical pharmaceutical products, antibiotics, biochemical drugs, biological products, and psychotropic drugs (Category II), since its inception, WanWei has been the sole supplier of raw materials for medicinal compounding at key hospitals in the region of Beijing. WanWei is also a qualified supplier of raw materials for medicinal precursor chemicals, Category II psychotropic
9
Table of Contents
drugs, protein assimilation drugs, and peptide hormones, providing additional business resources and unique competitive advantages. WanWei owns an extensive hospital sales network in Beijing, with access to 100% of Tier III (top tier) and 61% of Tier II hospitals, covering more than 600 hospitals or greater than 80% of the total number medical treatment institutions in Beijing. WanWei has established business relationships with 67 of the more than 240 pharmaceutical distributors in Beijing, has geographic coverage of all the districts and counties in Beijing region, and can reach the majority of retail pharmacies in these areas.
WanWei acts as the exclusive or non-exclusive agent in Beijing for some suppliers’ products. With the legal right to import drugs, WanWei functions as BMP China’s importer of licensed products and the nationwide exclusive agent for these products.
Under this arrangement with BMP China, WanWei has become the sole distributor for Propess, Anpo and Ferriprox in China. In November 2009, we acquired exclusive promotional rights in China for Depo-Provera (a treatment for endometriosis) from Pfizer. WanWei has developed a nationwide distribution network consisting of 48 distributors in over 22 provinces/municipalities and 38 cities comprising the main economically developed regions of China.
As of the end of 2009, revenues from WanWei accounted for 25.3% of our total revenue.
WanWei Product Portfolio
WanWei currently distributes approximately 800 products, including approximately eight products on an exclusive basis, in Beijing or throughout China. The five highest revenue producing products distributed by WanWei accounted for 37.9% of WanWei’s total sales in 2009.
Rongheng (Pharmaceutical Distribution Segment)
Rongheng was established in 1996 and its business activity is primarily in Shanghai, which is currently the largest pharmaceutical market in China.
Rongheng has a distribution network that covers 300 hospitals and 1,000 retail pharmacies through Tier 2 distributors. Rongheng has access to 80% of Tier III and 70% Tier II hospitals in Shanghai. Rongheng distributes approximately 450 products. The five highest revenue producing products distributed by Rongheng accounted for 24.3% of Rongheng’s total revenue in 2009. Rongheng aims to become a unique pharmaceutical distributor by offering value-added services to product suppliers.
As of the end of 2009, revenues from Rongheng accounted for 12.7% of our total revenue.
BMP China (Licensed Products Segment)
Our Licensed Products Segment consists of the operations of BMP China, which is headquartered in Beijing, China. BMP China is the successor to Beijing Medpharm Corporation Co., Ltd, which was one of the first companies to integrate drug registration, marketing and promotion in China, especially for imported licensed products.
BMP China has developed into a professional pharmaceutical marketing company focused on obstetrics, gynecology and pediatrics, and provides a package of tailored market-entry services from registration of imported medicines through professional promotion of approved products and life-cycle management for western pharmaceutical manufacturers that are seeking to enter the Chinese market.
10
Table of Contents
Product Registration
To prepare for market entry, we provide foreign pharmaceutical companies with integrated analytic services for pharmaceutical products. Through preparation of data and reports related to clinical trials, we consult with the SFDA and its subordinate Center for Drug Evaluation, or CDE, and we are able to provide comprehensive clinical trial management services until the import drug license, or IDL, is ultimately acquired.
Professional Academic Promotion
As of December 31, 2009, we employ 92 field-based marketing and sales personnel, allowing us to reach the main cities and regions in the country and cover more than 1,000 large and medium Ob/Gyn and/or specialty hospitals as well as Tier III hospitals. Most of the Company’s medical representatives have degrees in medicine or pharmacy and have extensive experience in medical marketing enhanced by the Company’s regular professional training programs.
Our proven promotion models include regular call cycles to provide doctors with the latest technical knowledge about our products and inform them about industry trends. We also expand awareness of and preference for our products through regular participation in medical symposia, case workshops, round table meeting discussions, and scientific exhibitions. By facilitating attendance by our key customers at international medical conferences, we further enhance our relationship and their understanding of our products. We also provide patients and doctors with comprehensive informational and education materials to enhance their understanding of our products
Through these efforts, the Company and our products have been widely recognized inside the Chinese pharmaceutical industry, while at the same time winning extensive support and favorable comments from numerous medical opinion leaders and professional academic institutions. These relationships have, in turn, facilitated favorable formulary position and reimbursement levels for our products. Among the four products that we have already launched, Anpo injection and Anpo tablets have been listed in Class A of the 2009 National Insurance Catalogue, or NIC, Propess® has been listed in Class B of the 2009 NIC – Limited for Maternity Reimbursement, and Ferriprox® was admitted into the “Wholly Planned Scope of Medicines for General Outpatient Service in Basic Medical Insurance of Guangdong Province (On Trial Basis)” at the end of October, 2009.
Product Portfolio for Sales and Marketing Services
We provide sales and marketing service to the following licensed products:
| Product Name |
Indication |
Active ingredient |
Partner |
Launch | ||||
| Propess |
Cervical Ripening | Dinoprostone | Cytokine Pharmasciences |
2005-Present | ||||
| Anpo injection |
Pre-term Labor Mgmt | Ritodrine hydrochloride | Taiwan Biotech | 2006-Present | ||||
| Anpo tablets |
Pre-term Labor Mgmt | Ritodrine hydrochloride | Taiwan Biotech | 2006-Present | ||||
| Ferriprox |
Iron overload (Thalassemia) |
Deferiprone | ApoPharma Inc | 2008-Present | ||||
| Depo Provera |
Endometriosis | Medroxyprogesterone Acetate |
Pfizer, Inc | 2nd half of 2010 | ||||
Competition
The consolidation of the Chinese pharmaceutical market is gradually increasing, which increases barriers to entry. Driven by the needs for product innovation and market competitiveness, mergers and restructurings of existing pharmaceutical enterprises became more common, further improving the scale and integration of the industry leaders, including China National Pharmaceutical Group and Shanghai Pharmaceutical Group. Changes
11
Table of Contents
in the bidding policy for Chinese government contracts and increased standards for Good Manufacturing Practice, or GMP, and Good Supply Practice, or GSP, are also enhancing the competitiveness of industry participants. Manufacturing enterprises that are able to combine the advantages of new drug innovation, high product quality, and brand marketing will become the dominant competitors in the future. For distribution enterprises, sales volume, terminal networks, and advanced warehousing and distribution facilities will be the keys to future competitiveness. Product marketing companies will be competitive only if they retain the professional marketing and sales staff and the specialized hospital promotions teams preferred by manufactures and hospitals.
Due to the increasing challenges of drug development and the patent expirations of major pharmaceutical brands, many international manufacturers are turning to generic drug and OTC product strategies in their life-cycle management planning. Increasing health care and health insurance costs are also increasing government interest in and support for the development of OTC products. In China, the growth rate of the OTC market has been significantly higher than foreign OTC markets over the last decade, attracting rapidly expanding interest and investment from international pharmaceutical companies. Major trends including Chinese healthcare reform, rising urbanization, and increased awareness among Chinese consumers of self-medication (coupled with greater buying power) will contribute to the rapid development of the OTC medicines market in China.
The Chinese government permits advertising of OTC brands through mass media channels. The ability to build brand awareness and enhance corporate reputation through consumer promotion is also driving the development and acceptance of OTC drugs, while attracting additional competitors to the market.
Sunstone is one of the leaders in the Chinese OTC medicines market, particularly in the fields of pediatrics and gynecology. In August 2009, the Chinese OTC Medicine Association ranked Sunstone’s Amantadine Hydrochloride Granules No. 1 among OTC chemicals and other drugs (in the pediatrics class). In October 2009, GoodBaby and Confort were recognized as the “Most Recommended Brands by Pharmacy Employees” by China Drugstore Magazine. In December 2009, GoodBaby and Confort were named “Favorite Brand of Chinese Women and Children” by Chinese Women and Children Development Center.
With market development for more than 10 years, Sunstone has formed its unique market promotion model, and established well-known brands Goodbaby and Confort. Through TV advertising, magazine and newspaper, professional media, Sunstone established partnership with many provincial and city level women and children organizations, and we believe its four market activities (“GoodBaby Family Medicine-Chest Activity,” “Bright mother, Healthy baby Appraisal,” “GoodBaby Health Plan in Community” and “GoodBaby Cup Painting Competition”) for the public good are very popular with women and children. We believe consumers’ awareness and loyalty to GoodBaby and Confort are continuing to improve. The largest competitor to our Goodbaby products is Shanghai Johnson and Johnson Pharmaceuticals, Ltd’s cold medicines. The largest competitor to our Confort products is miconazole nitrate suppositories manufactured by Xi’an Janssen Pharmaceutical, Ltd.
BMP China’s business is based on introducing advanced pharmaceutical products for gynecological and pediatric indications into China on the basis of exclusive licensing agreements with international innovator companies. Using a unique promotion model, BMP China has established a leading position in the obstetrics field. Its hospital promotion team specializing in gynecology and pediatrics has laid a solid foundation for future product launches, robust sales growth, and the expansion of BMP China as a dominant competitor in this field.
WanWei now covers over 80% of hospital networks and a majority of retail pharmacies in Beijing. We are increasing the number and variety of products we are licensed to distribute on an exclusive basis. Due to its storage capacity and transportation capabilities, WanWei can assure these customers 24-hour delivery for normal orders and immediate delivery for special orders. With the expansion of BMP China’s business to national scale, WanWei conducts business in 38 cities and 22 provinces in China. This national reach has increased WanWei’s competitive advantage in Beijing.
12
Table of Contents
Rongheng is located in Shanghai, China’s number one pharmaceutical market. Rongheng covers 300 hospitals and nearly 1,000 retail pharmacies in Shanghai. Rongheng’s regional capabilities have allowed WanWei and BMP China to expand our business in Shanghai.
The 2009 NIC will strengthen the competitiveness of our products in the pharmaceutical market. The 2009 NIC is the official drug reimbursement list compiled as part of China’s ongoing healthcare reform plan, and includes a total of 2,151 drugs. Seventy eight of BMP Sunstone’s products have been included in the 2009 NIC, twelve of which are new additions since the last catalog published in 2004. These new additions include some of BMP Sunstone’s best selling products, including Confort, a women’s health treatment for vaginal infections, and Propess, a medication used to induce labor in late-stage pregnancy. The Company’s Amoxicillin and Amoxicillin & Clavulanate Potassium products, which treat cough and cold symptoms, were also added to the 2009 NIC. In addition, the Company’s thalassemia medication, Ferriprox, has been added on a preliminary basis to Guangdong Province’s Medical Insurance Catalog.
The 2009 NIC is a vital part of the universal healthcare system in China and will greatly expand the pharmaceutical market in China. We believe the inclusion of two of our best-performing products, Confort and Propess, as well as our cough and cold products, in the 2009 NIC and the preliminary inclusion of Ferriprox in Guangdong Province’s Medical Insurance Catalog will expand our sales. Guangdong Province has the highest incidence of thalassemia in China and treatment for this disorder can be very expensive. Therefore, we believe that the potential for partial reimbursement in Guangdong Province will boost sales of Ferriprox throughout that province. We believe that the inclusion of our products in the insurance catalogs will strengthen our brand recognition and accelerate our penetration into our key therapeutic areas, including women’s and children’s health.
Our management team has extensive experience in the domestic and foreign pharmaceutical industries. Key members of our executive management team have backgrounds in mergers and acquisitions, business development, operations management, pharmaceutical marketing and sales, and/or product development and lifecycle management with both domestic and international pharmaceutical companies.
Our Strategy
Our goal is to become a unique fully-integrated specialty pharmaceutical company focused primarily on pediatrics and women’s health. The main elements of our strategy include the following:
Further Consolidating Brand and Channel Advantages of Sunstone’s Products for Women and Children
Over more than a decade of brand-building, we believe Sunstone has firmly established the “Good Baby” and “Confort” product portfolios in their respective markets in China and made them “household names” among Chinese consumers. Moving forward, we plan to utilize mass media channels to further expand the popularity and reputation of Sunstone “GoodBaby” and “Confort” brands, including TV advertising, two-dimensional advertising and web-site promotions.
Sunstone has established a sales network with over 1400 sales representatives and more than 350 distributors, to provide adequate coverage of major drugstores in significant markets throughout China. Sunstone has also established partnerships with many regional and local women’s and children’s advocacy organizations to develop public health campaigns. With their assistance, Sunstone has reached more than ten million consumers over the past decade through participation in these special programs.
Enriching Sunstone’s Product Lines in Multiple Ways
Sunstone continues to expand its product lines of medicines for women and children through mergers and acquisitions, technology transfer, independent R&D, and other activities. Most recently, in April, 2009, after
13
Table of Contents
completing the acquisition of 50% of the outstanding equity interests in Zhangjiakou Shengda Pharmaceutical Co., LTD, we folded its Amoxicillin Dispersible Tablets and Amoxicillin Clavulanate Dispersible Tablets into the GoodBaby brand, further enriching our Goodbaby antibacterial product line.
Strengthening Our Prescription Hospital Coverage and Marketing Power By Focusing on Women and Children.
We are one of the leading companies in obstetrics in China. Propess and Anpo were included in Class B of the 2009 NIC, which will help us to expand our market coverage in hospitals. We plan to strengthen our sales force by adding personnel, enhancing the targeting of hospital accounts, and exploring ways to improve the productivity of sales calls.
In November, 2009, we signed an agreement with Pfizer for an exclusive marketing license for Depo-Provera in China. In the Chinese market, Depo Provera is highly differentiated among treatments for endometriosis because of its long-acting preparation and significant analgesic effect. It has been included in Class B of the 2009 NIC, which will expedite its utilization in the gynecology field.
Growth from consolidation, market expansion and channel synergy
We believe that we are well-positioned to expand our client base and introduce additional products into our business platform. We intend to leverage our existing marketing arm by layering new products into the current sales force. Our sales strategy includes internal growth and growth through strategic acquisitions, specifically in major urban markets in China. We believe this consolidation strategy presents an opportunity to achieve significant gains in efficiency.
Regulation of the Pharmaceutical Industry in China
The following discussion describes certain Chinese laws, rules and regulations, which apply to the Company and the Company’s activities related thereto.
Protocol on Accession of China into the World Trade Organization
China acceded to the World Trade Organization, or WTO, on December 11, 2001. According to Annex 9 of the Protocol on the Accession of the People’s Republic of China, China allowed foreign invested enterprises to distribute pharmaceutical products directly in China. In December 2004, we entered into an agreement to acquire Wanwei and completed the acquisition in 2005.
Regulation of Foreign Ownership of Pharmaceutical Distribution Companies in China
Under the Administrative Measures on the Foreign Investment in Commercial Sector adopted on April 16, 2004 by the Sixth Ministry Meeting of the Ministry of Commerce of the People’s Republic of China and effective as of December 11, 2004, foreign enterprises were permitted to establish or invest in wholly foreign-owned enterprises or joint ventures that engage in wholesale or retail sales of pharmaceuticals in China.
Permits and Licenses for Pharmaceutical Distribution and Manufacture Enterprises
Before any pharmaceutical distribution enterprise, including any manufacturer, wholesaler or retailer, can produce or distribute pharmaceutical products in China, it must obtain a pharmaceutical manufacture and distribution permit issued by the appropriate provincial or county level branch of the SFDA where the pharmaceutical distribution enterprise is located. The granting of a pharmaceutical manufacture and distribution permit is subject to an inspection of the premises and facilities, warehouse, hygiene environment, quality control systems, personnel and equipment of such enterprise. The pharmaceutical production license and pharmaceutical
14
Table of Contents
distribution permit is valid for five years. Pharmaceutical distribution enterprises and pharmaceutical manufacture enterprises must apply for renewal of their permit no later than six months prior to the expiration date of the license with the appropriate governmental authority.
In addition to the pharmaceutical distribution permit and pharmaceutical production license, pharmaceutical distribution and manufacture enterprises also must obtain a business license from the appropriate administration bureau for industry and commerce to commence its business. We have obtained the appropriate business licenses for the jurisdictions in which we operate.
Good Supply Practice Standards
Good Supply Practice, or GSP, standards were established to regulate pharmaceutical wholesale and retail enterprises to ensure the quality of distribution of pharmaceutical products in China. The current applicable GSP standards, which were passed by the SFDA, came into effect on July 1, 2000. Under these standards, wholesale and retail enterprises in China must implement strict control on the distribution of pharmaceutical products with respect to, among other things, staff qualifications, distribution premises, warehouse, inspection equipment and facilities, management and quality control in order to obtain a GSP certificate to carry out business in China.
The GSP certificate is generally valid for five years. Pharmaceutical distribution enterprises must apply for renewal of their GSP certificates no later than three months prior to the date of expiration of their GSP certificates, subject to reassessment by the SFDA. Our distribution companies have valid GSP licenses in effect.
Good Manufacturing Practice Standards
Good Manufacturing Practice, or GMP, standards were established to regulate pharmaceutical manufacture enterprises to ensure quality manufacturing of pharmaceutical products in China. The current applicable GMP standards, which were passed by the SFDA, came into effect on October 1, 2005. Under these standards, pharmaceutical manufacturing enterprises in China must implement strict control on the manufacture of pharmaceutical products with respect to, among other things, staff qualifications, manufacture equipment, quality control standards, production process, purification, and environmental protection in order to obtain a GMP certificate to carry out business in China. The SFDA performs on-site inspection for enterprises applying for and holding certification.
The GMP certificate is valid for five years. Pharmaceutical manufacture enterprises must apply for renewal of their GMP certificates no later than six months prior to the date of expiration of their GMP certificates, subject to certification decision of SFDA. Our manufacturing facility has a valid GMP licenses in effect.
Bidding System for Drug Purchases by Medical Organizations
In accordance with the Notice on Issuing Certain Regulations on the Trial Implementation of Centralized Tender Purchase of Drugs by Medical Organizations, promulgated on July 7, 2000, and the Notice on Further Improvement on the Implementation of Centralized Tender Purchase of Drugs by Medical Organizations promulgated on July 23, 2001, non-profit medical organizations established by county or higher level government in China are required to implement bidding processes for the purchase of pharmaceuticals. In principle, medical organizations are required to join together to organize bids to purchase pharmaceuticals in bulk volume. The bids are to be assessed by a committee formed by pharmaceutical experts who are recognized by the relevant authorities, with reference to, most importantly, drug quality, and other criteria, including price, service and quality of the drug manufacturers.
Several Provisions on Further Regulating the Centralized Tender Purchase of Drugs by Medical Organizations, promulgated on September 23, 2004, provides that pharmaceutical wholesalers must have the due authorization of the pharmaceutical manufacturers to participate in the bidding process. Pharmaceutical manufacturers can participate in the bidding process on their own.
15
Table of Contents
Insurance Catalogue
Pursuant to the Decision of the State Council on the Establishment of the State Basic Medical Insurance System for Urban Employees and the Implementation Measures for the Administration of the Scope of Medical Insurance Coverage for Pharmaceuticals for Urban Employees, the Ministry of Labor and Social Security in China established the Insurance Catalogue. The Insurance Catalogue is divided into Class A and B drugs. The medicines included in Class A are designated by the Chinese governmental authorities for general application.
Patients purchasing medicines included in Class A are entitled to reimbursement of the costs of such medicines from the social medical fund in accordance with relevant regulations in China. Patients purchasing medicines included in Class B are required to pay a predetermined proportion of the costs of such medicines.
On November 30, 2009, the Ministry of Human Resources and Social Security published the 2009 NIC. The new catalogue is divided into Class A and B, based upon reimbursement. The 2009 NIC is China’s health care reform plans’ official drug reimbursement list and includes 2,151 drugs in total. Seventy eight of BMP Sunstone’s products have been included in the 2009 NIC, twelve of which are new additions from the last published catalog in 2004. These new additions include some of BMP Sunstone’s best selling products, such as Confort, a women’s health treatment for vaginal infections, and Propess, a first line treatment for labor induction in late-stage pregnancy. The Company’s Amoxicillin and Amoxicillin & Clavulanate Potassium products, which treat cough and cold symptoms, were also added to the 2009 NIC. In addition, the Company’s thalassemia medication, Ferriprox, has been preliminarily added to Guangdong Province’s Medical Insurance Catalog.
Price Controls
According to the “Notice on State Development and Reform Commission Pricing Drugs Catalog”, the prices of drugs are currently established in one of two ways: either the government fixes the price or the price is market-based. Drugs priced by the government are limited to the those listed in the NIC and a small number of monopoly specific drugs, including psychotropic substances, narcotic drugs, vaccines and family planning drugs, which are produced by the Chinese national government. Within these groups, the price management department of the State Council is responsible for pricing. Provincial price administration departments are responsible for pricing the drugs in Class B of the 2009 NIC, TCMs, and the compounded products produced by hospitals. Prices for drugs not subject to government control can be established by their manufacturers or distributors based on supply and demand and other market forces. The majority of our revenues are generated by products not under price controls.
Application for Registration of Imported Medicines
The SFDA is the national authority for drug registration, responsible for the review and approval of clinical studies, production and importation of drugs based on drug registration regulations.
An imported drug requires marketing approval in its origin country or region of manufacture. An import drug without such a marketing approval may still be approved after the SFDA confirms the safety and efficacy of the drug and there is a clinical need for the drug. The drug for which import application is made shall also meet the GMP standards in its country or region of origin as well as GMP requirements in China
An IDL is valid for five years. Pharmaceutical manufacture enterprises must apply for renewal of their IDL no later than six months prior to the date of expiration of their IDL, subject to correlative regulations of SFDA.
Employees
Substantially all of our employees are located in China. As of December 31, 2009, we had 1,198 full time employees, 161 of whom were management, finance or administrative employees, 516 of whom were sales and
16
Table of Contents
marketing employees, 478 of whom were manufacturing and warehouse employees and 43 of whom were quality assurance and research employees. We have not experienced any strikes or other labor disturbances that have interfered with our operations, and we believe that the relationship between our management and our employees is good.
We are required to contribute a portion of our employees’ total salaries to the Chinese government’s social insurance funds, including medical insurance, unemployment insurance and job injuries insurance, and a housing assistance fund, in accordance with applicable regulations. In the last three years, we contributed the following amounts to these funds:
| Year |
Contribution in US Dollars* |
Contribution in RMB | ||
| 2009 |
$1,345,000 | RMB 9,203,000 | ||
| 2008 |
$ 812,000 | RMB 5,562,318 | ||
| 2007 |
$ 488,166 | RMB 3,476,669 |
| * | Based on exchange rates in effect at March 1 of the following year. |
We expect the amount of contribution to the government’s social insurance funds to increase in 2010 as we expand our workforce and operations.
Executive Officers
The following table identifies our current executive officers:
| Name |
Age | Position | ||
| David Gao |
60 | Chief Executive Officer and Director | ||
| Fred M Powell |
48 | Chief Financial Officer | ||
| Yanping Zhao |
47 | Corporate Vice President |
David (Xiaoying) Gao has served as our Chief Executive Officer since February 2004. Since February 2002, Mr. Gao has served as Chairman of BMP China’s board of directors. Mr. Gao served as President and director of Abacus Investments, Ltd., a private wealth management company, from August 2003 until June 2004, and as Chief Executive Officer of Abacus from July 2003 to June 2004. From 1989 to 2002, Mr. Gao held various positions at Motorola, Inc., a publicly-traded company specializing in wireless, broadband and automotive communications technologies and embedded electronic products, including: Vice President and Director, Integrated Electronic System Sector, Asia-Pacific operation, from 1998 to 2002; Member, Motorola Asia Pacific Management Board, Management Board of Motorola Japan Ltd., from 2000 to 2002; and Motorola China Management Board from 1996 to 2002. Mr. Gao holds a BSC in Mechanical Engineering from the Beijing Institute of Technology, a BSC in Mechanical Engineering from Hanover University, Germany, and an M.B.A. from The Massachusetts Institute of Technology.
Fred M. Powell, CPA, joined us as our Chief Financial Officer in January 2005. From May 2002 until December 2004, Mr. Powell served as the Chief Financial Officer of Eximias Pharmaceutical Corporation, a privately-held biopharmaceutical company. From April 1999 to May 2002, Mr. Powell served as the Senior Vice President, Finance and Administration, of InnaPhase Corporation, a technology solutions provider for life sciences companies that was acquired by Thermo-Electron Corporation in 2004. From March 1993 to April 1999, Mr. Powell held various positions at Premier Research Worldwide, a publicly-traded company specializing in providing clinical and diagnostic services to the pharmaceutical and biotech industries, including: Director of Finance and Administration, from 1993 to 1996, and Chief Financial Officer, from 1996 to 1999. Mr. Powell is a Certified Public Accountant and holds a BS in Accounting from Pennsylvania State University.
17
Table of Contents
Yanping Zhao joined us as our Corporate Vice President in October 2007. From September 2000 until September 2007, Ms. Zhao served as Vice President and Executive Director, Sino Biopharmaceutical Limited (a subsidiary of CHIATAI PHARM GROUP), a Hong Kong Stock Exchange listed company. Meanwhile, she served as the Executive Director of ChaiTai Frd, which was sold to Bausch&Lomb. she also served as Director of Xian ChaiTai Co. Ltd., and Vice Chairman in Shanxi Ankang ChaiTai Pharmaceutical Co. Ltd. From September 1992 through August 2000, Ms. Zhao served in senior management positions, with Chia Tai Pharmaceutical Group. From July 1983 through August 1992, Ms. Zhao served as Director China Inner Mongolia Autonomous Region Medicine and Health Products Import & Export Corporation. Ms. Zhao has a Pharmaceutical degree from Shenyang Pharmaceutical University and an MBA from Dalian University of Technology.
Available Information
We file annual, quarterly, and current reports and other documents with the Securities and Exchange Commission (the “SEC”) under the Securities Exchange Act of 1934, as amended, or the Exchange Act. The public can obtain any documents that we file with the SEC at http://www.sec.gov.
We make available free of charge our Annual Reports on Form 10-K, Quarterly Reports on Form 10-Q, Current Reports on Form 8-K and any amendment to those reports filed or furnished pursuant to Section 13(a) or 15(d) of the Exchange Act as soon as reasonably practicable after filing such materials with, or furnishing such materials to, the SEC, on or through our Internet website, www.bmpsunstone.com. We are not including the information contained on our website as a part of, or incorporating it by reference into, this Annual Report on Form 10-K.
18
Table of Contents
| ITEM 1A. | RISK FACTORS |
Investing in our securities involves significant risk, including the risks identified below and in our Securities and Exchange Commission, or SEC, filings that are incorporated by reference into this Annual Report on Form 10-K. If any of these risks or uncertainties actually occurs, our business, financial condition or results of operations could be materially adversely affected. Additional risks and uncertainties of which we are unaware or that we currently believe are immaterial could also materially adversely affect our business, financial condition or results of operations. In any case, the trading price of our common stock could decline, and you could lose all or part of your investment.
Risks Relating to Our Business
We may be unsuccessful in our strategy of expanding our product portfolio, acquiring complementary businesses or integrating acquired businesses.
Our business strategy includes expanding our business capabilities through both internal growth and the acquisition of complementary businesses and licensing pharmaceutical products for marketing and distribution in China. We may be unable to find additional complementary businesses to acquire or we may be unable to enter into additional agreements to market and distribute pharmaceutical products.
Future acquisitions or joint ventures may result in substantial per share financial dilution of our common stock from the issuance of equity securities. Completion of future acquisitions also would expose us to potential risks, including risks associated with:
| • | the assimilation of new operations, technologies and personnel; |
| • | unforeseen or hidden liabilities; |
| • | the diversion of resources from our existing businesses; |
| • | the inability to generate sufficient revenue to offset the costs and expenses of acquisitions; and |
| • | the potential loss of, or harm to relationships with, employees, customers and suppliers as a result of the integration of new businesses. |
The commercial success of our products depends upon the degree of market acceptance among the medical community. Failure to attain market acceptance among the medical community would have an adverse impact on our operations and profitability.
The commercial success of our products depends upon the degree of market acceptance they achieve among the Chinese medical community, particularly physicians and hospitals. Physicians might not prescribe or recommend our products to patients, and procurement departments of hospitals might not purchase our products. The acceptance of any of our products among the medical community will depend upon several factors, including:
| • | the safety and effectiveness of the product; |
| • | the effectiveness of our efforts to market our products to hospitals and physicians; |
| • | the product’s cost-effectiveness; |
| • | the product’s perceived advantages and disadvantages relative to competing products or treatments; and |
| • | the prevalence and severity of side effects. |
If our products fail to attain market acceptance among the medical community, our operations and profitability would be adversely affected.
19
Table of Contents
We may experience delays in product introduction and marketing or interruptions in supply.
Our revenues are dependent on the ability of the manufacturers and distributors with which we associate to supply and distribute product to our customers.
If delays occur, or manufacturers and distributors are unable to supply and distribute product to our customers in a timely manner, our operating results and financial condition will suffer. In addition, our contracts with pharmaceutical owners and manufacturers relating to some of the products in our product portfolio have a limited duration and have minimum sales requirements that, if not met, could lead to termination or non-renewal of the contract, or the ability of the manufacturer to render the contract non-exclusive, which could harm our revenues. In addition, Sunstone purchases raw materials from a limited number of suppliers, but we believe that other suppliers could provide similar raw materials on comparable terms. A change in suppliers, however, could cause a delay in manufacturing and a possible loss of sales, which would affect operating results adversely.
The recent financial crisis and uncertainty in global economic conditions could negatively affect our business, results of operations, and financial condition.
The recent financial crisis affecting the banking system and financial markets and the current uncertainty in global economic conditions have resulted in a tightening in the credit markets, a low level of liquidity in many financial markets, and extreme volatility in credit, equity and fixed-income markets. There could be a number of follow-on effects from these economic developments on our business, including insolvency of key suppliers resulting in product delays; inability of customers to obtain credit to finance purchases of our products and/or customer insolvencies; counterparty failures negatively impacting our treasury operations; decreased customer confidence; and decreased customer demand, including order delays or cancellations.
Our stock price may be volatile.
Our common stock price may be volatile. The stock market in general has experienced extreme volatility that has often been unrelated to the operating performance of particular companies. The market price for our common stock may be influenced by many factors, including:
| • | the success of competitive products or technologies; |
| • | regulatory developments in China; |
| • | developments or disputes concerning patents or other proprietary rights; |
| • | the recruitment or departure of key personnel; |
| • | variations in our financial results or those of companies that are perceived to be similar to us; |
| • | market conditions in the our industry and issuance of new or changed securities analysts’ reports or recommendations; and |
| • | general economic, industry and market conditions. |
Our operating results may fluctuate as a result of factors beyond our control.
Our operating results may fluctuate significantly in the future as a result of a variety of factors, many of which are beyond our control. These factors include:
| • | the costs of pharmaceutical products and development; |
| • | the relative speed and success with which we can obtain and maintain customers, merchants and vendors for our services and manufacturers and suppliers of products to market to our customers; |
| • | changes in our pricing policies, suppliers and competitors; |
20
Table of Contents
| • | the ability of our suppliers to provide products in a timely manner to our customers; |
| • | increased competition in our markets; and |
| • | other general economic and seasonal factors. |
We may be required to write off goodwill or other intangible assets in the future. If we are required to write off goodwill or other intangible assets, our financial position or results of operations could be adversely affected.
Under generally accepted accounting principles in the United States, or GAAP, we review our goodwill and other indefinite-lived assets for impairment each year as of December 31 and during interim periods when events or changes in circumstances indicate the carrying value may not be recoverable. The carrying value of our goodwill may not be recoverable due to factors such as a decline in stock price and market capitalization, reduced estimates of future cash flows and slower growth rates in our industry. Estimates of future cash flows are based on an updated long-term financial outlook of our operations. However, actual performance in the near-term or long-term could be materially different from these forecasts, which could adversely impact future estimates.
We may be unable to obtain additional capital when necessary and on terms that are acceptable to us.
Our future capital requirements will depend on many factors, including our ability to maintain our existing cost structure and return on sales and execute our business and strategic plans as currently conceived. We expect that we will need significant additional cash resources to operate and expand our business in the future and we may attempt to raise additional funds through public or private financing or from other sources. The sale of additional equity securities could result in additional dilution to our stockholders. Additional indebtedness would result in additional debt service obligations and could result in operating and financing covenants that would restrict our operations. In addition, financing may not be available in amounts or on terms acceptable to us, if at all. If we are not able to raise additional capital through fund raising activities we could be forced to curtail some of the currently anticipated expenditures in the above mentioned areas. Should we be forced to do this it could have an impact on our anticipated future growth.
We may be unsuccessful in attracting or retaining key sales, marketing and other personnel.
The success of our business is dependent on our ability to attract and retain highly skilled managers and sales and marketing personnel. BMP China, Sunstone, Wanwei and Rongheng sales and marketing personnel carry out critical promotional and sales activities of BMP China, Sunstone, Wanwei and Rongheng. We depend, and will continue to depend in the foreseeable future, on the personal efforts and abilities of our executive management team and other officers and key employees. The loss of these officers or our other key management persons could harm our business and prospects for growth. In addition, as we plan to expand in China, we will need to attract additional qualified managerial staff and other personnel. We may have difficulty in hiring and retaining a sufficient number of qualified personnel to work in China. This may impede the development of our distribution business and the expansion of our business in China.
We may be unable to manage our growth effectively.
Our business strategy is based on the assumption that we will access additional distribution channels in the future and that the number of our customers and the extent of our operations will grow. Our ability to compete effectively and to manage our future growth, if any, requires us to:
| • | continue to improve our financial and management controls and reporting systems and procedures to support the proposed expansion of our business operations as a result of our acquisition of Sunstone and the acquisition of any additional distribution channels in the future; and |
| • | locate or hire, at reasonable compensation rates, qualified personnel and other employees necessary to expand our capacity in order to accommodate the proposed expansion of our business operations. |
21
Table of Contents
If we are unable to accomplish any of these objectives, we will be unsuccessful in effectively managing our growth, which could harm our business, operating results and financial condition.
Product sales by Sunstone are concentrated in a limited number of products.
Sunstone derives a substantial portion of its revenue from the sales of Pediatric Paracetamol and Amantadine Hydrochloride Granules, Xiao’er Huatan Zhike Granules, Xiao’er Kechuan Ling Oral Solution, Jianer Xiahoshi Oral Solution, and Compound Zedoary Turmeric Oil. As Sunstone China expects sales of these products to continue to comprise a substantial portion of total revenues in the future, any factors adversely affecting the sales of any of these products will have a material adverse effect on Sunstone China’s business, financial condition and results of operations.
Competition for sales to pharmaceutical distributors in China is intense.
Sunstone sells its products to approximately 325 pharmaceutical distributors in China. Sales to distributors account for substantially all of Sunstone’s revenues. Sunstone does not have distribution agreements longer than two years and competes for desired distributors with other pharmaceutical manufacturers. Any disruption of Sunstone’s distribution network, including its failure to renew its existing distribution agreements with desired distributors, could negatively affect its ability to effectively sell its products and could materially and adversely affect its business, financial condition and results of operations.
Our business strategy to use our marketing arm to create demand for products that we will offer exclusively through a distribution arm may fail.
Our business strategy depends in large part on our ability to establish exclusive distribution and marketing relationships with pharmaceutical manufacturers and suppliers and to leverage our marketing arm to create demand for products that we will distribute exclusively through a distribution arm. A number of factors could hinder the success of this strategy, including, among other things, our failure to:
| • | obtain a sufficient number of effective distribution channels, whether through internal growth or strategic acquisition; |
| • | create sufficient demand for products that we will distribute exclusively; and |
| • | enter into and maintain exclusive distribution and marketing relationships with pharmaceutical manufacturers on profitable terms. |
If we are unable to implement this strategy effectively, our business, operating results and financial condition could suffer.
We may not achieve our projected development goals in the time frames we announce and expect.
We set goals for timing of the accomplishment of objectives material to our success, such as the receipt of regulatory approval for our acquisitions, commencement and completion of clinical trials, anticipated regulatory submission and approval dates and timing of product launches. The actual timing of these events can vary dramatically due to factors beyond our control, such as delays or failures in our clinical trials, the uncertainties inherent in the regulatory approval process and delays in achieving manufacturing or marketing arrangements sufficient to commercialize our products. There can be no assurance that our clinical trials will be completed, that we will make regulatory submissions or receive regulatory approvals as planned or that we will be able to adhere to our current schedule for the launch of any of our products. Any failure to achieve one or more of these milestones as planned could have a material adverse effect on our business, operating results and financial condition.
22
Table of Contents
We may be unable to compete successfully against new and existing competitors.
We operate in a highly competitive market with few barriers to entry. We expect that competition will continue to intensify. Some of our competitors are more established than we are, and have significantly greater financial, technical, marketing and other resources than we do. Many of our competitors have greater name recognition and a larger customer base than we do. These competitors may be able to respond more quickly to new or changing opportunities and customer requirements and may be able to undertake more extensive promotional and distribution activities, offer more attractive terms to customers, and adopt more aggressive pricing policies. Competition could reduce our market share or force us to lower our prices to unprofitable levels.
If we fail to increase our brand recognition, we may face difficulty in obtaining new customers and business partners.
We believe that establishing, maintaining and enhancing our brand in a cost-effective manner is critical to achieving widespread acceptance of our current and future services and is an important element in our effort to increase our customer base and obtain new business partners. We believe that the importance of brand recognition will increase as competition in our market develops. Some of our potential competitors already have well-established brands in the pharmaceutical promotion and distribution industry. Successful promotion of our brand will depend largely on our ability to maintain a sizeable and active customer base, our marketing efforts and our ability to provide reliable and useful services at competitive prices. Brand promotion activities may not yield increased revenue, and even if they do, any increased revenue may not offset the expenses we incur in building our brand. If we fail to successfully promote and maintain our brand, or if we incur substantial expenses in an unsuccessful attempt to promote and maintain our brand, we may fail to attract enough new customers or retain our existing customers to the extent necessary to realize a sufficient return on our brand-building efforts, in which case our business, operating results and financial condition would be materially adversely affected.
Risks Relating to Doing Business in China
We face increased risks of doing business due to the extent of our operations in China.
Our operating subsidiaries, Sunstone, BMP China, Wanwei, and Rongheng, are organized and located in China. China currently is undertaking economic reforms. There are significant political and economic tensions resulting from these reforms that could affect the business environment in China. Our efforts to expand into China pose special risks that could adversely affect our business. Doing business in China also will subject us to the customary risks of doing business in foreign countries. These risks include, among others, the effects of:
| • | fluctuations in foreign currency exchange rates and controls; |
| • | competitive disadvantages to established foreign businesses with significant current market share and business and customer relationships; |
| • | tax and regulatory policies of local governments and the possibility of trade embargoes; |
| • | political instability, war or other hostilities; and |
| • | laws and policies of the United States and China affecting foreign trade and investment. |
Any of these risks could cause significant interruptions in our distribution and other operations, which would adversely affect our ability to conduct business in China and our financial condition, results of operations and business.
Fluctuations in the Chinese Renminbi could adversely affect our results of operations.
Substantially all of our revenues, profits, cash flows and assets have been, and we expect will continue to be, derived in China and be denominated in Chinese currency, or RMB. The value of the RMB, which is
23
Table of Contents
controlled and adjusted periodically by the Chinese government, fluctuates and is subject to changes in the political and economic conditions in China. Any devaluation of the RMB could adversely affect the value of our common stock in foreign currency terms because we will receive substantially all of our revenues in RMB. Fluctuations in exchange rates also could adversely affect the value, translated or converted into United States dollars, of our net assets, earnings and any declared dividends. In addition, a devaluation of the RMB is likely to increase the portion of our cash flow required to satisfy any foreign currency denominated obligations.
Government control of currency conversion could adversely affect our operations and financial results.
Substantially all of our revenues are in RMB, which currently is not a freely convertible currency. Any restrictions on currency exchange may limit our ability to use revenue generated in RMB to make dividend payments in United States dollars. Under China’s existing foreign exchange regulations, the RMB is freely convertible for trade and service-related foreign exchange transactions, but not for direct investment, loan or investment in securities outside of China without the prior approval of China’s State Administration of Foreign Exchange, or the SAFE. Foreign exchange transactions under our capital account, including foreign currency-denominated borrowings from Chinese or foreign banks and principal payments with respect to foreign currency-denominated obligations, continue to be subject to significant foreign exchange controls and require the approval of the SAFE. These limitations could affect our ability to obtain foreign exchange through debt or equity financing, or to obtain foreign exchange for capital expenditures. In the future, the Chinese government may take measures at its discretion to restrict access to foreign currencies for current account transactions if foreign currencies become scarce in China. We may be unable to pay dividends in United States dollars or other foreign currencies to our stockholders if the Chinese government restricts access to foreign currencies for current account transactions.
We may be restricted in our ability to transfer funds to our Chinese operating subsidiaries, which may restrict our ability to act in response to changing market conditions.
Any transfer by us of funds to our Chinese subsidiaries through a stockholder loan and the ability for our Chinese subsidiaries to obtain an RMB loan secured by us or other foreign institutions are subject to registration with China’s State Administration of Foreign Exchange. If the sum of the aggregated medium-term and long-term external debts, the outstanding short-term external debts and RMB loans secured by foreign institution(s) of a Chinese subsidiary is less than the difference between its total investment amount and its registered capital, the Chinese subsidiary is required to apply to the appropriate examination and approval authority to increase its total investment amount. Accordingly, any transfer of funds from us, directly or indirectly, to any of our Chinese subsidiaries by means of increasing its registered capital is subject to approval by the appropriate examination and approval authorities in China. This limitation on the free flow of funds between us and our Chinese subsidiaries may restrict our ability to react to changing market conditions.
China’s economic, political and social conditions, and its government policies, could adversely affect our business.
Substantially all of our operations are conducted in China and substantially all of our revenues are derived in China. Accordingly, our results of operations, financial condition and prospects are subject, to a significant degree, to economic, political and legal developments in China. The economy of China differs from the economies of most developed countries in many respects, including:
| • | level of government involvement; |
| • | economic structure; |
| • | allocation of resources; |
| • | level of development; |
| • | inflation rates; |
24
Table of Contents
| • | growth rate; and |
| • | control of foreign exchange. |
The economy of China has been transitioning from a planned economy to a more market-oriented economy. Although in recent years the Chinese government has implemented measures emphasizing the utilization of market forces for economic reform, the reduction of state ownership of productive assets and the establishment of sound corporate governance in business enterprises, a substantial portion of productive assets in China is still owned by the Chinese government. In addition, the Chinese government continues to play a significant role in regulating industrial development. It also exercises significant control over China’s economic growth through the allocation of resources, controlling payment of foreign currency-denominated obligations, setting monetary policy and providing preferential treatment to particular industries or companies.
A slowdown of the Chinese economy could adversely affect our growth and profitability.
Our financial results have been, and are expected to continue to be, affected by conditions in the Chinese economy and pharmaceutical industry. Although the Chinese economy has grown significantly in the past decade, it is unclear whether the future Chinese economy will continue to grow significantly and what impact it will have on our financial results.
The legal system in China has inherent uncertainties that could limit the legal protections available to us.
We currently conduct our business primarily through our wholly owned operating subsidiaries, Sunstone, BMP China, Wanwei, and Rongheng, and expect in the future to conduct our business through Sunstone, BMP China, Wanwei and Rongheng and others that we acquire, which are and will be organized in China. These subsidiaries generally are subject to laws and regulations applicable to foreign investment in China and, in particular, laws applicable to wholly foreign-owned enterprises. In addition, we depend on several affiliated entities in China to honor their service agreements with us. Chinese law governs almost all of these agreements, and disputes arising out of these agreements are expected to be decided by arbitration in China. The Chinese legal system is based on written statutes. Prior court decisions may be cited for reference but have limited precedential value. Since 1979, Chinese legislation and regulations have significantly enhanced the protections afforded to various forms of foreign investments in China. However, since these laws and regulations are relatively new and the Chinese legal system continues to evolve, the interpretations of many laws, regulations and rules are not always uniform, and enforcement of these laws, regulations and rules involves uncertainties that may limit remedies available to us. Any litigation in China may be protracted and may result in substantial costs and diversion of resources and management attention. In addition, China may enact new laws or amend current laws that may be detrimental to us, which may have a material adverse effect on our business operations.
We may be exposed to liabilities under the Foreign Corrupt Practices Act, and any determination that we violated the Foreign Corrupt Practices Act could have a material adverse effect on our business.
We are subject to the United States Foreign Corrupt Practices Act, or the FCPA, and other laws that prohibit improper payments or offers of payments to foreign governments and their officials and political parties by U.S. persons and issuers as defined by the statute for the purpose of obtaining or retaining business. We have operations and agreements with third parties and we make sales in China, which is known to experience corruption. Our activities in China create the risk of unauthorized payments or offers of payments by one of the employees, consultants, sales agents or distributors of our company or the companies in which we invest that could be in violation of various laws including the FCPA, even though these parties are not always subject to our control. It is our policy to implement safeguards to discourage these practices by our employees. However, our existing safeguards and any future improvements may prove to be less than effective, and the employees, consultants, sales agents or distributors of our company or the companies in which we invest may engage in conduct for which we might be held responsible. Violations of the FCPA may result in severe criminal or civil sanctions, and we may be subject to other liabilities, which could negatively affect our business, operating results
25
Table of Contents
and financial condition. In addition, the government may seek to hold us liable for successor liability FCPA violations committed by companies in which we invest or that we acquire.
We have limited business insurance coverage in China.
Insurance companies in China offer limited business insurance options. As a result, we have not maintained, and currently do not maintain, any liability, hazard or other insurance covering our services, business, operations, errors, acts or omissions, personnel or properties. To the extent that we are unable to recover from others for any uninsured losses, such losses could result in a loss of capital and significant harm to our business. If any action, suit and/or proceeding is brought against us and we are unable to pay a judgment rendered against us and/or defend ourselves against such action, suit and/or proceeding, our business, financial condition and operations could be negatively affected.
Failure by our stockholders or beneficial owners who are PRC citizens or residents to comply with certain PRC foreign exchange regulations could restrict our ability to distribute profits, restrict our overseas and cross-border investment activities or subject us to liabilities under PRC laws, which could adversely affect our business and financial condition.
In October 2005, the SAFE issued Notice on Relevant Issues Concerning Foreign Exchange Administration for PRC Residents Engaging in Financing and Roundtrip Investments via Overseas Special Purpose Vehicles, or SAFE Circular 75. SAFE Circular 75 states that since October 2005, PRC citizens or residents must register, prior to establishing or controlling an offshore entity, with the SAFE or its local branch in connection with their establishment or control of the offshore entity established or controlled for the purpose of overseas equity financing involving an investment whereby the offshore entity acquires or controls onshore assets or equity interests from the PRC citizens or residents.
Further, since we are a public company in the United States and our stockholders often hold their shares in street name, we may not be fully aware or informed of the identities of all our beneficial owners who are PRC citizens or residents, and we may not always be able to compel our beneficial owners to comply with the SAFE Circular 75 requirements. As a result, we cannot assure you that all of our stockholders or beneficial owners who are PRC citizens or residents will at all times comply with, or in the future make or obtain any applicable registrations or approvals required by SAFE Circular 75. Failure to register by these stockholders could subject us and our subsidiaries to, among other things, potential fines or legal sanctions.
We may be subject to fines and legal sanctions imposed by the SAFE or other PRC government authorities if we or our PRC employees fail to comply with recent PRC regulations relating to employee stock options granted by offshore listed companies to PRC citizens.
On March 28, 2007, the SAFE issued Application Procedures of Foreign Exchange Administration for Domestic Individuals Participating in Employee Stock Holding Plan or Stock Option Plan of Overseas-Listed Company, or the Stock Option Rule. Under the Stock Option Rule, PRC citizens who have been granted stock options by an offshore-listed company are required, through a PRC agent or PRC subsidiary of the offshore-listed company, to register with the SAFE and complete certain other procedures. Although we are planning to make the registration, there is no assurance that such registration will be successful. Our failure to register could subject us and our employees to potential fines or legal sanctions, restrict our overseas or crossborder investment activities, limit our subsidiaries’ ability to make distributions or dividends, or affect our ownership structure, which would adversely affect our business, financial condition and results of operations.
26
Table of Contents
Risks Relating to Pharmaceutical Distribution in China
Price control regulations may decrease our profitability.
The prices of certain medicines we distribute, including those listed in the Chinese government’s catalogue of medications that are reimbursable under the Insurance Catalogue, which is the official Chinese catalogue that lists drugs for which reimbursement is available, are subject to control by the relevant state or provincial price administration authorities. In practice, price control with respect to these medicines sets a ceiling on their retail price. The actual price of such medicines set by manufacturers, wholesalers and retailers cannot historically exceed the price ceiling imposed by applicable government price control regulations. Such price controls, especially downward price adjustment, may negatively affect Sunstone’s revenue and profitability.
The bidding process with respect to the purchase of pharmaceutical products may lead to reduced revenue.
Chinese regulations require non-profit medical organizations established in China to implement bidding procedures for the purchase of drugs. It is intended that the implementation of a bidding purchase system will be extended gradually and will cover, among other drugs, those drugs consumed in large volume and commonly used for clinical uses. Pharmaceutical wholesalers must have the due authorization of the pharmaceutical manufacturers in order to participate in the bidding process. If, for the purpose of reducing the bidding price, pharmaceutical manufacturers participate in the bidding process on their own and enter into purchase and sales contracts with medical organizations directly without authorizing a pharmaceutical distributor, the revenue of Wanwei and Rongheng may be adversely affected.
If the medicines Wanwei distributes and Sunstone manufactures are replaced by other medicines or are removed from China’s Insurance Catalogue in the future, our revenue may suffer.
Under Chinese regulations, patients purchasing medicines listed by China’s state and/or provincial governments in the Insurance Catalogue may be reimbursed, in part or in whole, by a social medicine fund. Accordingly, pharmaceutical distributors prefer to engage in the distribution of medicines listed in the Insurance Catalogue. Currently, some products that Sunstone, Wanwei and Rongheng distribute are listed in the Insurance Catalogue. The content of the Insurance Catalogue is subject to change by the Ministry of Labor and Social Security of China, and new medicines may be added to the Insurance Catalogue by provincial level authorities as part of their limited ability to change certain medicines listed in the Insurance Catalogue. If our products are replaced by other medicines or removed from the Insurance Catalogue in the future, our revenue may suffer.
Risks Relating to Our Common Stock
There may not be a viable public market for our common stock.
Our common stock has only been traded on The NASDAQ Global Market since June 7, 2007 and prior to that, from August 10, 2006 to June 6, 2007, our common stock was traded on The NASDAQ Capital Market, and an active trading market may not develop or be sustained. We have never declared or paid any cash dividends on our capital stock, and we currently intend to retain all available funds and any future earnings to support operations and finance the growth and development of our business and do not intend to pay cash dividends on our common stock for the foreseeable future. Therefore, investors will have to rely on appreciation in our stock price and a liquid trading market in order to achieve a gain on their investment. The market prices for securities of pharmaceutical distribution companies have historically been highly volatile, and the market has from time to time experienced significant price and volume fluctuations that are unrelated to the operating performance of particular companies. From August 2006 through March 13, 2010, the trading prices for our common stock ranged from a high of $13.40 to a low of $2.25.
27
Table of Contents
Sales of substantial amounts of our common stock in the public market could depress the market price of our common stock.
Since June 7, 2007, our common stock has been traded on The NASDAQ Global Market. From August 10, 2006 to June 6, 2007, our common stock was traded on The NASDAQ Capital Market. If our stockholders sell substantial amounts of common stock in the public market, including common stock issuable upon the exercise of outstanding warrants and options, or the market perceives that such sales may occur, the market price of our common stock could fall and we may be unable to sell our common stock in the future. We had 41,941,987 shares of common stock outstanding as of March 12, 2010. 6,882,763 of these outstanding shares are held by Artis Capital Management, LP who may be deemed to be our “affiliate” as that term is defined under Rule 144 under the Securities Act, and would be subject to Rule 144.
Our common stock may experience extreme price and volume fluctuations, which could lead to costly litigation for us and make an investment in us less appealing.
The market price of our common stock may fluctuate substantially due to a variety of factors, including:
| • | announcements concerning our competitors or the pharmaceutical distribution industry in general; |
| • | rate of sales and customer acceptance; |
| • | changing factors related to doing business in China; |
| • | interruption of supply or changes in our agreements with manufacturers or distributors; |
| • | new regulatory pronouncements and changes in regulatory guidelines and timing of regulatory approvals; |
| • | general and industry-specific economic conditions; |
| • | additions to or departures of our key personnel; |
| • | variations in our quarterly financial and operating results; |
| • | changes in market valuations of other companies that operate in our business segments or in our industry; |
| • | lack of adequate trading liquidity; |
| • | announcements about our business partners; |
| • | changes in accounting principles; and |
| • | general market conditions. |
The market prices of the securities of early-stage companies, particularly companies like ours without consistent product revenues and earnings, could be highly volatile. In the past, companies that experience volatility in the market price of their securities have often faced securities class action litigation. Whether or not meritorious, litigation brought against us could result in substantial costs, divert our management’s attention and resources and harm our financial condition and results of operations.
| ITEM 1B. | UNRESOLVED STAFF COMMENTS |
Not applicable.
| ITEM 2. | PROPERTIES |
Our principal executive offices are located at 600 W. Germantown Pike, Suite 400, Plymouth Meeting, Pennsylvania 19462. We lease this office space under a lease with American Executive Centers, Inc. at a rent of $6,000 per month. This lease agreement expires in January 2011.
28
Table of Contents
BMP China’s principal executive and business offices are located in Beijing. On December 1, 2007, BMP China entered into an office lease agreement for the lease of 1,063 square meters of office space located in the Min Sheng Life Plaza at East Third Ring Road, North, Chaoyang District, Beijing. The term of the office lease agreement commenced on the date of the office lease agreement and will expire on November 30, 2012. The total monthly rental rate, including property management and associated fees, is RMB 92,000 ($14,000 per month as of March 1, 2010). BMP China leases additional sales office space throughout China with varying lease dates. The total monthly rate is RMB 20,000 per month ($3,000 per month as of March 1, 2010).
Our principal China executive offices are located at Min Sheng Life Plaza at East Third Ring Road, North, Chaoyang District, Beijing. The term of the office lease agreement commenced on December 1, 2007 and will expire on November 30, 2012. The total monthly rental rate, including property management and associated fees, is RMB 50,000 ($7,000 per month as of March 1, 2010).
On October 1, 2007, Wanwei entered into an office lease agreement for the lease of approximately 800 square meters of office space located in Hua Teng Plaza at Building 195, East Fourth Ring Road Middle, Chaoyang District, Beijing. The term of the office lease agreement commenced on the date of the office lease agreement and will expire on September 30, 2012. The total monthly rental rate is RMB 61,000 ($9,000 per month as of March 1, 2010).
Wanwei has a lease agreement with Wanhui Group for the lease of its warehouse, covering an area of approximately 6,850 square meters. This lease agreement expired in December 2007 and is extended on a monthly basis. The total monthly rental rate is RMB 56,000 per month ($8,000 per month as of March 1, 2010).
On August 1, 2008, Rongheng entered into an office lease agreement with Shanghai Jiushi Company Ltd for the lease of 380 square meters of office space located in Shanghai. The term of the office lease commenced on August 1, 2008 and will expire on August 31, 2011. The total monthly rental rate is RMB 75,000 ($11,000 per month as of March 1, 2010).
Rongheng has a lease agreement with Shanghai Shenyijiancai Company Ltd for the lease of its warehouse, covering an area of approximately 1,557 square meters. The term of this lease space commenced on March 15, 2005 and will expire on March 14, 2011. The total monthly rental rate is RMB 22,000 ($3,000 per month as of March 1, 2010).
In Tangshan, Hebei Province, PRC, we own Sunstone’s administrative, development and manufacturing facilities totaling approximately 354,000 square feet.
On November 26, 2007, Sunstone entered into an office lease with Zhijun Tong, a company director. The office space is approximately 692 square meters and is located in 37 South MoFang Road, Chaoyang District, Beijing. The lease is extended on a month to month basis. The total monthly rental is RMB 53,000 ($8,000 per month as of March 1, 2010). Sunstone leases additional sales office space throughout China with varying lease dates. The total monthly rental rate is RMB 13,000 ($1,900 per month as of March 1, 2010).
| ITEM 3. | LEGAL PROCEEDINGS |
We are not currently a party to any material legal proceedings.
29
Table of Contents
| ITEM 4. | RESERVED. |
| ITEM 5. | MARKET FOR REGISTRANT’S COMMON EQUITY, RELATED STOCKHOLDER MATTERS AND ISSUER PURCHASES OF EQUITY SECURITIES |
Since June 7, 2007, our common stock has been traded on The NASDAQ Global Market under the trading symbol “BJGP.” From August 10, 2006 to June 6, 2007, our common stock was traded on The NASDAQ Capital Market. The following table shows the high and low closing sales prices of our common stock for each quarter of the fiscal year ended December 31, 2009 and for each quarter of the fiscal year ended December 31, 2008.
| High | Low | |||||
| 2009: |
||||||
| Fourth quarter, ended December 31, 2009 |
$ | 5.98 | $ | 3.47 | ||
| Third quarter, ended September 30, 2009 |
5.15 | 3.92 | ||||
| Second quarter, ended June 30, 2009 |
4.93 | 3.01 | ||||
| First quarter, ended March 31, 2009 |
5.41 | 2.44 | ||||
| 2008: |
||||||
| Fourth quarter, ended December 31, 2008 |
$ | 6.74 | $ | 4.64 | ||
| Third quarter, ended September 30, 2008 |
7.43 | 3.89 | ||||
| Second quarter, ended June 30, 2008 |
7.96 | 5.61 | ||||
| First quarter, ended March 31, 2008 |
10.24 | 7.26 | ||||
On March 10, 2010, the closing price of our common stock was $5.72. As of March 10, 2010 we had approximately 71 holders of record of our common stock.
DIVIDEND POLICY
We have never declared any cash dividends and do not anticipate paying cash dividends in the near future. Any future determination to pay cash dividends will be at the discretion of our board of directors and will be dependent on our results of operations, financial condition, contractual restrictions and other factors that our board of directors considers relevant. Pursuant to our 12.5% secured convertible notes due July 1, 2011, without the prior written consent of the holders of greater than fifty percent (50%) of the aggregate principal amount of such notes then outstanding, we are restricted from declaring or paying any dividends while such notes are outstanding.
30
Table of Contents
COMPARISON OF CUMULATIVE TOTAL RETURN
AMONG BMP SUNSTONE CORP.,
NASDAQ MARKET INDEX AND SIC CODE INDEX
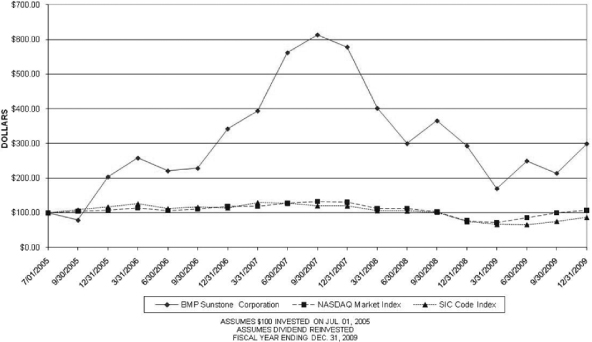
The above performance graph shows a comparison of cumulative total returns for our common stock, the NASDAQ Market Index and the SIC Code Index assuming the investment of $100 in our common stock and each index on July 1, 2005, the date when our common stock became registered under the Exchange Act, and the reinvestment of dividends, if any. Prior period performance should not be used as a guide to future performance.
31
Table of Contents
| ITEM 6. | SELECTED FINANCIAL DATA |
The following tables present selected financial data with respect to the Company for the fiscal years ended December 31, 2009, 2008, 2007, 2006 and 2005. We derived the selected financial data for the fiscal years ended December 31, 2009, 2008, 2007, 2006 and 2005 from our audited financial statements. The selected financial data appearing in this section should be read in conjunction with the Management’s Discussion and Analysis of Financial Condition and Results of Operations section and the financial statements and related notes appearing elsewhere in this Form 10-K.
| Year Ended December 31, | ||||||||||||||||||||
| 2009 | 2008 | 2007 | 2006 | 2005 | ||||||||||||||||
| ($ amounts in thousands) | ||||||||||||||||||||
| Statement of Operations: |
||||||||||||||||||||
| Net revenues |
$ | 146,868 | $ | 114,867 | $ | 31,003 | $ | 24,258 | $ | 4,179 | ||||||||||
| Cost of sales |
72,859 | 57,557 | 26,716 | 22,312 | 4,980 | |||||||||||||||
| Gross profit (loss) |
74,009 | 57,310 | 4,287 | 1,946 | (801 | ) | ||||||||||||||
| Operating expenses: |
||||||||||||||||||||
| Sales and marketing expenses |
47,778 | 39,666 | 4,377 | 2,687 | 407 | |||||||||||||||
| General and administrative expenses |
17,844 | 13,898 | 10,780 | 6,190 | 4,406 | |||||||||||||||
| Total operating expenses |
65,622 | 53,564 | 15,157 | 8,877 | 4,813 | |||||||||||||||
| Income (Loss) from operations |
8,387 | 3,746 | (10,870 | ) | (6,931 | ) | (5,614 | ) | ||||||||||||
| Interest income (expense), net |
(4,651 | ) | (7,071 | ) | (567 | ) | 101 | (37 | ) | |||||||||||
| Equity method investment gain (loss) |
25 | 675 | (264 | ) | — | — | ||||||||||||||
| Loss on early extinguishment of debt |
(4,573 | ) | — | — | — | — | ||||||||||||||
| Gain on derivatives |
1,204 | — | — | — | — | |||||||||||||||
| Other income |
— | — | 81 | 34 | 7 | |||||||||||||||
| Provision for income taxes |
2,392 | 792 | 15 | — | 80 | |||||||||||||||
| Net loss |
$ | (2,000 | ) | $ | (3,442 | ) | $ | (11,635 | ) | $ | (6,796 | ) | $ | (5,724 | ) | |||||
| Less: Net loss attributable to the noncontrolling interest |
96 | — | — | — | — | |||||||||||||||
| Net loss applicable to common stockholders |
$ | (1,904 | ) | $ | (3,442 | ) | $ | (11,635 | ) | $ | (6,796 | ) | $ | (5,724 | ) | |||||
| Basic and diluted net loss per common share |
$ | (0.05 | ) | $ | (0.09 | ) | $ | (0.41 | ) | $ | (0.30 | ) | $ | (0.31 | ) | |||||
| Basic common shares outstanding |
41,398 | 38,617 | 28,120 | 22,864 | 18,569 | |||||||||||||||
| Fully diluted common shares outstanding |
48,633 | 39,841 | 29,822 | 22,864 | 18,569 | |||||||||||||||
| Year Ended December 31, | |||||||||||||||
| 2009 | 2008 | 2007 | 2006 | 2005 | |||||||||||
| Balance Sheet Data: |
|||||||||||||||
| Cash and cash equivalents |
$ | 21,554 | $ | 15,740 | $ | 22,837 | $ | 15,331 | $ | 6,906 | |||||
| Total assets |
252,255 | 237,651 | 80,923 | 27,517 | 16,677 | ||||||||||
| Total liabilities |
96,840 | 90,019 | 31,914 | 8,957 | 9,278 | ||||||||||
| Total BMP Sunstone Corporation stockholders’ equity |
$ | 153,975 | $ | 147,632 | $ | 49,009 | $ | 18,560 | $ | 7,399 | |||||
32
Table of Contents
| ITEM 7. | MANAGEMENT’S DISCUSSION AND ANALYSIS OF FINANCIAL CONDITION AND RESULTS OF OPERATIONS |
You should read the following discussion and analysis of our financial condition and results of operations together with our consolidated financial statements and the related notes appearing elsewhere in this Annual Report on Form 10-K. Some of the information contained in this discussion and analysis as set forth elsewhere in this Annual Report on Form 10-K, including information with respect to our plans and strategy for our business and related financing, includes forward-looking statements that involve risks and uncertainties. You should review Item 1A. “Risk Factors” of this Annual Report on Form 10-K for a discussion of important factors that could cause actual results to differ materially from the results described in or implied by these forward-looking statements.
Overview
BMP Sunstone Corporation, a Delaware corporation, referred to herein as BMP Sunstone, we our, us, and the Company, is a specialty pharmaceutical company with over-the-counter, or OTC, prescription drugs, manufacturing, marketing and distribution based in China. Through our subsidiary, Sunstone (Tangshan) Pharmaceutical Co., Ltd., or Sunstone, we manufacture, market and distribute OTC products in China. In addition, through Beijing Medpharm Co. Ltd., or BMP China, Beijing Wanwei Pharmaceutical Co., Ltd., or Wanwei and Shanghai Rongheng Pharmaceutical Company, or Rongheng, we offer to foreign and domestic pharmaceutical manufacturers in China, services focused primarily on marketing and promotional services and distribution services.
Financial Overview
Since our inception, we have generated significant losses. As of December 31, 2009, we had an accumulated deficit of approximately $32.9 million.
Our future success will depend on expanding sales of our current products, obtaining additional promotional and market research agreements and licensing rights for China and expanding our OTC sales through Sunstone. During 2009, 2008 and 2007, we have pursued a strategy of broadening our range of promoted products, and we are currently actively reviewing for license various Manufactured Products and products in development from western pharmaceutical companies for marketing and distribution in China.
Liquidity and Capital Resources
Cash
As of December 31, 2009, we had cash and cash equivalents of approximately $21.5 million, which represented 8.5% of our total assets. Our cash and cash equivalents are highly liquid investments with a maturity of three months or less at the time of purchase and are primarily invested in short-term money market instruments and investments. However, we do not anticipate any losses with respect to such cash balances because the balances are invested in highly rated securities.
Common Stock
Since we acquired BMP China in February 2004, we have funded our operations through the issuance of shares of our common stock and debt. In March 2004, we completed a private placement of 8,695,652 shares of our common stock at a price of $1.15 per share, which yielded gross proceeds to us of approximately $10.0 million and net proceeds to us of approximately $8.8 million (the “First Financing”).
On October 19, 2005, we completed a private placement of 4,199,981 shares of our common stock at a price of $1.50 per share, which yielded gross proceeds to us of approximately $6.3 million and net proceeds to us of
33
Table of Contents
approximately $5.9 million (the “Second Financing”). Investors in the Second Financing also received warrants to purchase an aggregate of 1,049,828 shares of common stock, half of which had an exercise price equal to $1.875 and the balance of which had an exercise price equal to $2.25.
On December 20, 2006, we completed a private placement of 3,333,306 shares of our common stock at a price of $4.50 per share, which yielded gross proceeds to us of approximately $15 million and net proceeds to us of approximately $14.1 million (the “Third Financing”). Investors in the Third Financing also received warrants to purchase an aggregate of 1,116,611 shares of common stock, which had an exercise price equal to $5.625.
On August 17, 2007, pursuant to a registered direct public offering, we issued 3,470,557 units, consisting of (i) one share of our common stock and (ii) warrants to purchase two-tenths of a share of our common stock at an exercise price of $9.37 per share, for a purchase price of $9.395 per unit, which yielded gross proceeds to us of approximately $32.6 million and net proceeds to us of approximately $30.6 million (the “Fourth Financing”). The issuance resulted in the issuance of an aggregate of 3,470,557 shares of our common stock and warrants to purchase 694,111 shares of our common stock. In August 2007, we also issued 60,897 shares of our common stock as compensation for placement agent services provided in connection with this registered direct public offering.
On October 14, 2008 pursuant to a registered direct public offering, we issued 433,000 shares of the Company’s common stock at $5.00 per share. Gross proceeds from the offering amounted to approximately $2.2 million and net proceeds were approximately $2.0 million. In October 2008, the Company also issued 4,546 shares of our common stock as compensation for placement agent services provided in connection with this registered direct offering.
On February 20, 2009, the Company closed its offering of 559,062 units (the “Units”), each consisting of (i) two shares of the Company’s common stock, and (ii) a warrant to purchase one share of common stock at an exercise price of $4.00 per share, which exercise price was subject to potential re-pricing, as follows:
If on the 90th day after the closing date (the “Re-price Date”), the volume weighted average trading price, or VWAP, calculated over the 20 trading days prior to the Re-price Date of the common stock is less than $4.00 per share, the exercise price of the warrants will be reset to the greater of (i) $1.80 or (ii) the VWAP. The warrants are exercisable beginning any time on or after the Re-price Date and expiring on the fifth anniversary of the closing date. In no event, shall the number of shares of common stock and shares of common stock underlying the warrants exceed 19.99% of the Company’s outstanding common stock as of February 13, 2009.
The Units were offered by the Company at a purchase price of $6.40 per Unit (the “Offering”). As a result of the Offering, the Company issued 1,118,124 shares of common stock and 559,062 warrants. The net proceeds to the Company from the Offering were approximately $3,000,000.
After 90 days from the issuance of the warrants, or May 21, 2009, the warrant option reprice provisions expired, the exercise price remained at $4.00 and the warrant was deemed to be indexed to its own stock. Accordingly, the warrant liability was extinguished in the amount of $1,342,000 and recorded as additional paid capital.
Long-Term Debt
On November 1, 2007, we completed a private placement of $23 million principal amount of 10.0% senior secured promissory notes due on May 1, 2009, to qualified institutional and accredited investors. The offering, which raised gross proceeds of $23.1 million, included warrants with a five-year term to purchase an aggregate of 575,000 shares of our common stock and warrants with an eighteen-month term to purchase an aggregate of 462,580 shares of our common stock at an exercise price of $12.43. The net proceeds from the offering were approximately $21.9 million.
34
Table of Contents
On January 20, 2009, BMP Sunstone completed an exchange of $10,650,000 in principal amount of its 10.0% senior secured promissory notes (the “10.0% Notes”) for $10,650,000 in principal amount of its 12.5% secured convertible notes (the “January Exchange Notes”), pursuant to note exchange agreements (the “Note Exchange Agreements”) by and between the Company and certain holders of the 10.0% Notes. Following the exchange, $12,350,000 in principal amount of 10.0% Notes remained outstanding.
Pursuant to the Note Exchange Agreements, the Company issued the January Exchange Notes in the aggregate principal amount of $10,650,000 to the noteholders. The January Exchange Notes bear interest at a rate of 12.5% per annum, payable quarterly in arrears beginning on April 1, 2009. The January Exchange Notes have a maturity date of July 1, 2011. The accrued but unpaid interest on the 10.0% Notes prior to the exchange was paid to the noteholders participating in the exchange on April 1, 2009.
Based upon the original terms of the January Exchange Notes, a noteholder may convert its January Exchange Note into fully paid and non-assessable shares of common stock of the Company from time to time at a conversion price, subject to certain adjustments, equal to $5.00. If the Company issues common stock in one or more offerings to investors on or prior to September 15, 2009 (other than any offerings following the issuance of common stock in one or more offerings to investors resulting in the receipt of proceeds (net of all commissions) by the Company in an aggregate amount of at least $16,000,000), the conversion price will equal the lesser of (i) $5.00 or (ii) 115% of the lowest price per share of common stock for which the Company sells common stock in any offering.
The January Exchange Notes were subsequently amended in March 2009 to fix the conversion price option at $3.00.
On March 13, 2009, the Company entered into a Placement Agency Agreement with Philadelphia Brokerage Corporation (the “Placement Agent”), as placement agent relating to the issuance and sale to investors of up to $7,000,000 principal amount of 12.5% Subordinated Convertible Notes due July 1, 2011 (the “March Public Notes”) convertible into common shares of the Company (the “Placement”).
The March Public Notes bear interest at the annual rate of 12.5% from March 16, 2009, or the most recent interest payment date to which interest has been paid or provided for, payable quarterly in arrears on April 1, July 1, October 1 and January 1 of each year, commencing April 1, 2009 to the persons in whose names the March Public Notes are registered at the close of business on March 15, June 15, September 15 or December 15 (whether or not a business day), as the case may be, preceding the respective interest payment date.
On May 14, 2009, the Company amended the terms of the March Public Notes to fix the conversion price at an amount equal to $3.00 per share of common stock and to add a covenant stating that the Company shall not issue equity, convertible debt or securities convertible into equity at an amount equal to less than $2.75 per share of common stock (with such $2.75 amount to include the fair value of any option, warrant or similar right offered by the Company and to be adjusted in the manner identical to the adjustment of the conversion price as provided in the amendment) until December 31, 2009. The amendment of the March Public Notes was effective as of March 16, 2009.
On March 13, 2009, the Company completed an exchange (the “March Exchange”) of $1,000,000 principal amount of its 10.0% Notes for the same principal amount of its 12.5% March Exchange Secured Convertible Notes due July 1, 2011 (the “March Exchange Notes”), pursuant to a note exchange agreement (the “Note Exchange Agreement”) by and between the Company and certain holders of the 10.0% Notes (the “March Exchange Noteholders”). The terms of the March Exchange Notes are substantially similar to those of the January Exchange Notes. The Company recorded the fair value of the amended notes at $1,026,000 as of March 13, 2009 which will be amortized to face value using the effective interest method over the remaining term of such notes.
35
Table of Contents
In addition, on March 16, 2009, the Company completed a private placement (the “Private Placement”) of $6,350,000 principal amount of 12.5% March Cash Secured Convertible Notes due July 1, 2011 (the “March Cash Notes”). The terms of the March Cash Notes are substantially similar to the terms of the March Exchange Notes. The Company consummated the Private Placement by entrance into purchase agreements (the “Purchase Agreement”) with certain investors (the “Private Noteholders”).
The Company amended the March Exchange Notes (the “March Exchange Note Amendment”) and the March Cash Notes (the “March Cash Note Amendment”) on May 14, 2009. The terms of the March Exchange Note Amendment and March Cash Note Amendment are substantially similar to the terms of the January Exchange Note Third Amendment. The March Exchange Note Amendment was effective as of March 13, 2009 and the March Cash Note Amendment was effective as of March 16, 2009.
On March 16, 2009 the Company called the remaining $11,350,000 of its 10.0% Secured Promissory Notes due May 1, 2009.
On June 24, 2009, the Company entered into a RMB 30,000,000 (or $4,381,000 as of June 24, 2009) loan agreement with the Bank of Communication in China. The term of the loan is June 24, 2009 through May 24, 2011 at 5.4% annual rate of interest and pays interest monthly. The Company’s obligations under the debt are secured by assets of Sunstone. The loan agreement does not contain any covenants. As of December 31, 2009, RMB 30,000,000 (or $4,383,000) is outstanding and is due May 2011.
On July 17, 2009, the Company entered into a RMB 16,000,000 (or $2,339,000 as of July 17, 2009) loan agreement with China Construction Bank in China. The term of the loan is July 17, 2009 through July 16, 2012 at 5.4% annual rate of interest paid monthly. The Company’s obligations under the debt are secured by the assets of Sunstone. The loan does not contain any covenants. As of December 31, 2009, RMB 16,000,000 (or $2,340,000) is outstanding and is due July 2012.
On October 15, 2009, Taiyangshi Fly Tangshan Pharmaceutical Co., or Yutian, entered into a RMB 50,000,000 (or $7,315,000 as of October 15, 2009) loan agreement with Bank of Commerce. The term of the loan is October 15, 2009 through September 27, 2012 at 5.4% annual rate of interest paid quarterly. The Company’s obligations under the debt are secured by assets of Yutian. The loan does not contain any covenants. As of December 31, 2009, RMB 50,000,000 (or $7,313,000) is outstanding and is due September 27, 2012.
Notes Receivable
As of December 31, 2009 we had notes receivable of approximately $17.5 million which represented 7.0% of our total assets. Notes receivable are notes received from customers for the settlement of trade receivable balances. As of December 31, 2009, all notes receivables were issued by established banks in the PRC and these notes are irrevocable, transferrable and have maturities of six months or less. The fair value of the notes receivable approximated their carrying value.
Limitations on Transfer of Cash (and other assets) to the United States
Registered Capital and Taxes. China restricts the amount of cash (and other assets) that is legally permitted to be sent to the U.S. by any subsidiary of the Company formed under Chinese law. This restriction is based upon each subsidiary having scheduled registered capital injected into its business sufficient for the subsidiary’s operational requirements. Once this restriction is met, the Company is able to distribute to the U.S. any cash (or other assets) resulting from the profits of these subsidiaries generated during the Company’s ownership of each subsidiary, subject to a withholding tax of 5% and a required retention of 10% of after-tax profits as a surplus reserve (until such time as the surplus reserve equals 50% of the registered capital of such subsidiary). Cash (or other assets) held by the Company’s Chinese subsidiaries that are attributable to profits generated prior to the ownership by the Company of these subsidiaries is not allowed to be transferred to the U.S., but such cash (or other assets) is allowed to be used by the subsidiaries for operations within China.
36
Table of Contents
Cash Flow
We anticipate that our December 31, 2009 balance of approximately $21.5 million in unrestricted cash and cash equivalents will be sufficient to fund our current level of operations for at least the next 12 months. Our future capital requirements will depend on many factors, including those factors described in Item 1A. “Risk Factors” of this Annual Report on Form 10-K as well as our ability to maintain our existing cost structure and return on sales, fund obligations for additional capital that will occur on additional product licenses and acquisitions and execution of our business and strategic plans as currently conceived.
Net cash provided by operating activities was $34,000 for the year ended December 31, 2009. This amount reflected our net loss of $1,904,000, offset by $12,001,000 in net non-cash charges including loss on early extinguishment of debt of $4,573,000, amortization of intangibles of $3,543,000, depreciation of $2,437,000, bad debt expense of $354,000, gain on disposal of Alliance BMP of $7,000, gain on fair value of derivatives of $1,204,000, stock-based compensation expense of $2,380,000, amortization of debt discount and debt issuance costs of $763,000, equity method investment income of $25,000, loss on the disposal of assets of $58,000, non controlling interest of $96,000 and deferred taxes of $782,000. In addition, we generated $4,768,000 of operating cash as a result of changes in certain of our operating assets and liabilities during the year ended December 31, 2009. The changes in operating assets and liabilities were increases in accrued expenses of $4,021,000 and deferred revenues of $80,000, and decreases in prepaid expenses of $491,000 and inventory of $176,000. Offsetting these changes were increases in accounts receivable of $7,250,000, notes receivable of $1,703,000, other receivables of $1,457,000 and value added tax receivable of $277,000 and decreases of $3,480,000 and due to related parties of $657,000.
Cash used in investing activities was $5,951,000 and reflects the acquisition of property and equipment of $10,553,000, the acquisition of land rights of $901,000, the investment in Shengda of $2,047,000 and the cash received for the sale of our investment in Alliance BMP of $7,550,000. Net cash provided by financing activities was $11,206,000, which consisted of $2,999,000 net proceeds from the issuance of common stock, $163,000 from the exercise of warrants and options, decrease in restricted cash of $25,000 proceeds from the issuance of long term debt of $12,031,000, which was offset by repayment of long term debt of $11,350,000 and net receipts on bank borrowings of $7,338,000.
Contractual obligations
| Payments due by period | |||||||||||
| Total | Less than 1 year |
1-3 years | 3-5 years | More than 5 years | |||||||
| ($ amount in thousands) | |||||||||||
| Long term debt, including interest |
$ | 44,006 | 5,204 | 38,802 | — | — | |||||
| Operating lease obligations |
1,667 | 777 | 890 | — | — | ||||||
| Total contractual obligations |
$ | 45,673 | 5,981 | 39,692 | — | — | |||||
Debt obligations
Long-Term Debt
See description of our long-term debt under the Liquidity and Capital Resources section of this Management Discussion and Analysis of Financial Condition and Results of Operations.
37
Table of Contents
Operating lease obligations
The Company leases its executive office facility in Plymouth Meeting, Pennsylvania 19462 under a lease agreement that expires January 2011. The lease requires minimum monthly rental payments of $6,000.
The Company leases it China executive office facility in Beijing under a lease agreement that expires November 2012. The lease requires minimum monthly rental payments of $7,000.
The Company leases its BMP China office facility in Beijing, China under a lease agreement that expires during November 2012. The lease requires minimum monthly rental payments of $14,000. The Company leases additional sales office space throughout China with varying lease expiration dates.
The Company leases its Wanwei office in Beijing, China under a lease agreement that expires September 2012. The lease requires minimum monthly rental payments of $9,000.
The Company leases its Rongheng office in Shanghai under a lease that expires August 2011. The lease requires minimum monthly rental payments of $11,000. The Company leases its Rongheng warehouse in Shanghai under a lease that expires March 2011. The lease requires minimum monthly rental payments of $3,000.
Results of Operations
Critical Accounting Policies
Our management’s discussion and analysis of our financial condition and results of operations are based on our financial statements, which have been prepared in accordance with GAAP. The preparation of these financial statements requires us to make estimates and assumptions that affect the reported amounts of assets and liabilities and the disclosure of contingent assets or liabilities as of the dates of the financial statements as well as the reported revenues and expenses during the reporting periods. On an ongoing basis, we evaluate our estimates and assumptions. We base our estimates on historical experience and various other factors and assumptions that we believe to be reasonable under the circumstances, the results of which form the basis for making judgments about the carrying value of assets and liabilities that are not readily apparent from other sources. Actual results might differ materially from these estimates under different assumptions or conditions.
While our significant accounting policies are more fully described in Note 2 to our financial statements included elsewhere in this Annual Report on Form 10-K, we believe the following critical accounting estimates reflect our more significant estimates and assumptions used in the preparation of our financial statements:
Revenue Recognition
The Company recognizes sales and related cost of sales at Sunstone when persuasive evidence of an arrangement exists, delivery has occurred, the price is fixed or determinable, and collectability is reasonably assured. Written sales agreements and customer purchase orders are used as evidence of the terms of the arrangements. Products are considered delivered when the product is received by the customer at its or a designated location, which is the point when the customer takes ownership and assumes risk of loss. The Company’s sales agreements do not provide the customer the right of return, unless the products are defective in which case the Company allows for an exchange of products.
We recognize distribution revenues and related cost of sales at the later of (a) the time of shipment or (b) when title passes to the customers, provided that there is evidence of a final arrangement, there are no uncertainties surrounding acceptance, collectability is probable and the price is fixed. Revenues consist of gross sales less provisions for estimated customer returns, discounts, vendor payments and volume rebates. Amounts billed to a customer for shipping and handling are reported as revenue. We recognize commission revenue, net of
38
Table of Contents
returns, on products delivered by the distribution provider at the time of delivery, provided that there is evidence of a final arrangement, there are no uncertainties surrounding acceptance, collectability is probable and the price is fixed. Under the terms of these agreements revenues are generally receivable within 90 days of delivery. We estimate the reserve for product returns at the time revenue is recognized based on historical trends, and information from customers.
Accounts Receivable and Bad Debts
Accounts receivable are stated as the amount management expects to collect from outstanding balances. We perform ongoing credit evaluations of our customers and generally require no collateral to secure accounts receivable. We maintain an allowance for potentially uncollectible accounts receivable based on our assessment of the collectability of accounts receivable. This assessment is based upon specific identification of customer accounts and our best estimate of potential loss. We evaluate the adequacy of our allowance for doubtful accounts at least quarterly. If the financial condition of our customers were to weaken, additional allowances may be required. Moreover, if our allowance for doubtful accounts is understated, we will be required to take additional charges in future periods.
Inventory Reserve
We review our inventory reserve based on our established criteria which reserves 50% of the inventory value if the remaining life is six months and 100% if expired. In addition, in certain cases, additional inventory reserve charges are recorded based upon facts that would not give rise to a reserve charge under the historical reserve criteria, or if in management’s opinion, additional amounts are considered necessary based upon current industry conditions.
Income Taxes
We recognize deferred tax assets and liabilities for the expected future tax consequences of temporary differences between the financial statement and tax basis of assets and liabilities using enacted tax rates in effect for the years in which the differences are expected to reverse. A valuation allowance is provided for deferred tax assets where the recoverability of the assets is uncertain. Specifically, the determination to provide a valuation allowance is dependent upon our assessment of whether it is more-likely-than-not that sufficient future taxable income will be generated in the relevant tax jurisdiction to utilize the deferred tax asset. We review our internal sales forecasts and pre-tax earnings estimates to make our assessment regarding the utilization of deferred tax assets. In the event we determine that future taxable income likely will not be sufficient to utilize the deferred tax asset, we will record a valuation allowance. If that assessment were to change, we would record a benefit on the consolidated statement of operations. We do not recognize an increase in tax liability for the unrecognized tax benefit because the Company has a full valuation allowance against any related deferred tax assets.
Accounting for Stock-Based Compensation
We follow a fair value basis of accounting for stock options and other equity instruments and report stock-based employee compensation in our financial statements. Stock-based compensation expense recognized for the years ended December 31, 2009 and 2008 was $2,380,000 and $2,438,000, respectively, which consisted of stock-based compensation expense related to stock options and stock grants under our employee incentive plans.
During the year ended December 31, 2009, we issued options to employees and board members to purchase 360,000 shares of common stock, at exercise prices ranging from $3.49 to $3.84.
39
Table of Contents
Year Ended December 31, 2009 Compared to Year Ended December 31, 2008
The following table sets forth the amounts and the percentage relationship to revenues of certain items in our consolidated statements of income for the years ended December 31, 2009 and 2008:
| Year Ended December 31, | Year Ended December 31, | |||||||||||||
| 2009 | 2008 | 2009 | 2008 | |||||||||||
| ($ amounts in thousands) | ||||||||||||||
| Net Revenues |
$ | 146,868 | $ | 114,867 | 100.0 | % | 100.0 | % | ||||||
| Cost of Goods Sold |
72,859 | 57,557 | 49.6 | % | 50.1 | % | ||||||||
| Gross Profit |
74,009 | 57,310 | 50.4 | % | 49.9 | % | ||||||||
| Sales and Marketing Expenses |
47,778 | 39,666 | 32.5 | % | 34.5 | % | ||||||||
| General and Administrative Expenses |
17,844 | 13,898 | 12.2 | % | 12.1 | % | ||||||||
| Total Operating Expenses |
65,622 | 53,564 | 44.7 | % | 46.6 | % | ||||||||
| Income From Operations |
8,387 | 3,746 | 5.7 | % | 3.3 | % | ||||||||
| Other Income (Expense): |
||||||||||||||
| Interest Income |
225 | 70 | 0.2 | % | 0.1 | % | ||||||||
| Interest Expense |
(4,430 | ) | (6,301 | ) | -3.0 | % | -5.5 | % | ||||||
| Debt Issuance Cost Amortization |
(446 | ) | (840 | ) | -0.3 | % | -0.7 | % | ||||||
| Equity Method Investment Earnings |
25 | 675 | 0.0 | % | 0.6 | % | ||||||||
| Loss on Early Extinguishment of Debts |
(4,573 | ) | — | -3.1 | % | — | ||||||||
| Gain on Derivatives |
1,204 | — | 0.8 | % | — | |||||||||
| Total Other Income (Expense) |
(7,995 | ) | (6,396 | ) | -5.4 | % | -5.5 | % | ||||||
| Profit Before Provision for Income Taxes |
392 | (2,650 | ) | 0.3 | % | -2.2 | % | |||||||
| Provision for Income Taxes |
2,392 | 792 | 1.6 | % | 0.7 | % | ||||||||
| Net Loss |
$ | (2,000 | ) | $ | (3,442 | ) | -1.3 | % | -2.9 | % | ||||
Net Revenue:
Net revenue was approximately $146,868,000 for the year ended December 31, 2009 as compared with approximately $114,867,000 for the year ended December 31, 2008. Revenue by product category is as follows:
| Year Ended December 31, | $ Increase | % Increase | ||||||||||
| 2009 | 2008 | |||||||||||
| ($ amounts in thousands) | ||||||||||||
| Manufactured Products (1) |
$ | 83,954 | $ | 65,715 | $ | 18,239 | 27.8 | % | ||||
| Distribution Products (2) |
55,847 | 43,717 | 12,130 | 27.7 | % | |||||||
| Licensed Products |
7,067 | 5,435 | 1,632 | 30.0 | % | |||||||
| $ | 146,868 | $ | 114,867 | $ | 32,001 | 27.9 | % | |||||
| (1) | Revenue for Manufactured Products segment is for the year ended December 31, 2009 and for the period February 18, 2008 through December 31, 2008. |
| (2) | Revenue for Distribution Products segment includes Wanwei for years ended December 31, 2009 and 2008 and Rongheng for the year ended December 31, 2009 and for the period July 5, 2008 through December 31, 2008. |
40
Table of Contents
The following table reflects our revenue in 2009 by product segment:
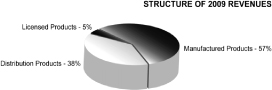
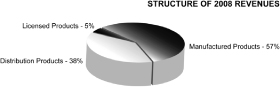
Manufactured Products. Sunstone revenues were $83,954,000 for the year ended December 31, 2009 and $65,715,000 for the period February 18, 2008 through December 31, 2008. Sunstone manufactures and sells pediatric products under the Goodbaby brand, women’s health products under the Confort brand and nutritional products under the Nemei brand. The Goodbaby brand accounted for 78.3% of Sunstone’s total product sales for the year ended December 31, 2009 and 80.8% of Sunstone’s total product sales for the period February 18, 2008 through December 31, 2008. The top products were Pediatric Paracetamol and Amantadine Hydrochloride Granules for the treatment of the common cold, Pediatric Huatan Coughing Granules for the treatment of coughing, Confort Pessaries for vaginal infections, Pidotimod Tablets to increase immune system response and Pediatric Kechuan Ling Oral Solution for the treatment of coughing. These top five products accounted for approximately 85.1% of Sunstone’s revenues for the year ended December 31, 2009 and 89.7% for the period February 28 through December 31, 2008. The Confort brand accounted for 12.1% of Sunstone’s total product sales for the year ended December 31, 2009 and for the period February 18, 2008 through December 31, 2008.
The following table reflects our revenue in 2009 and 2008 for our leading products in the manufactured products segment:
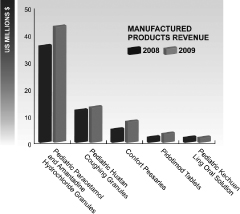
Pharmaceutical Distribution. Distribution revenue for the year ended December 31, 2009, excluding licensed products, was $55,847,000 as compared to $43,717,000 for the year ended December 31, 2008. Rongheng’s revenues were $18,694,000 were included for the year ended December 31, 2009 as compared to $10,022,000 for the period July 5, 2008 through December 31, 2008 as compared to Rongheng’s top five products were Selenious Yeast Tablets, Cefotiam Hydrochloride, Gemcitabine Hydrochloride, Iohexol and Almitrine and Raubasine compound which collectively accounted for 24.3% of Rongheng’s revenue for the year ended December 31, 2009 and 22.1% of Rongheng’s revenue for the period July 5 through December 31, 2008. Wanwei’s revenues were $37,153,000 for the year ended December 31, 2009 as compared to $33,695,000 for the year ended December 31, 2008. Wanwei’s top five products excluding our licensed products, were Xingnaojing, Glurenorm, Ferrous Succinate Tablets, Xuebijing and Golden Dragon Capsule which collectively accounted for 37.9% and 35.1% of Wanwei’s revenue for the years ended December 31, 2009 and 2008, respectively.
41
Table of Contents
Licensed Products. We provided sales and marketing and distribution services for Anpo and Propess used in obstetrics, and Ferriprox for iron overload in patients with Thalassemia. Revenues totaled $7,067,000 for the year ended December 31, 2009 as compared to $5,435,000 for the year ended December 31, 2008, an increase of 30.0%. This increase was the result of continued sales and marketing efforts promoting Propess, Anpo and Ferriprox. As of December 31, 2009 there were 539, 719, and 27 hospitals selling Propess, Anpo and Ferriprox respectively, versus 461, 546 and 6 hospitals respectively, as of December 31, 2008.
The following chart sets forth our revenue in 2009, 2008 and 2007 from our leading products in the licensed product segment:
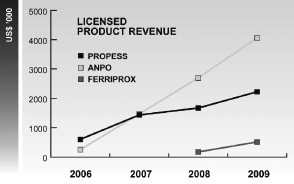
42
Table of Contents
Cost of Goods Sold:
Cost of Goods Sold was approximately $72,859,000 for the year ended December 31, 2009 as compared with approximately $57,557,000 for the year ended December 31, 2008. Cost of Goods Sold by product category is as follows:
| Year Ended December 31, | $ Increase |
% Increase |
||||||||||||
| 2009 | 2008 | |||||||||||||
| ($ amounts in thousands) | ||||||||||||||
| Manufactured Products (1) |
||||||||||||||
| Revenues |
$ | 83,954 | $ | 65,715 | $ | 18,239 | 27.8 | % | ||||||
| Cost of Goods Sold |
18,605 | 14,953 | 3,652 | 24.4 | % | |||||||||
| Gross Profit |
$ | 65,349 | $ | 50,762 | $ | 14,587 | 28.7 | % | ||||||
| Gross Margin % |
77.8 | % | 77.2 | % | ||||||||||
| Distribution Products (2) |
||||||||||||||
| Revenues |
$ | 55,847 | $ | 43,717 | $ | 12,130 | 27.7 | % | ||||||
| Cost of Goods Sold |
51,521 | 40,276 | 11,245 | 27.9 | % | |||||||||
| Gross Profit |
$ | 4,326 | $ | 3,441 | $ | 885 | 25.7 | % | ||||||
| Gross Margin % |
7.7 | % | 7.9 | % | ||||||||||
| Licensed Products |
||||||||||||||
| Revenues |
$ | 7,067 | $ | 5,435 | $ | 1,632 | 30.0 | % | ||||||
| Cost of Goods Sold |
2,733 | 2,328 | 405 | 17.4 | % | |||||||||
| Gross Profit |
$ | 4,334 | $ | 3,107 | $ | 1,227 | 39.5 | % | ||||||
| Gross Margin % |
61.3 | % | 57.2 | % | ||||||||||
| Total |
||||||||||||||
| Total Revenues |
$ | 146,868 | $ | 114,867 | $ | 32,001 | 27.9 | % | ||||||
| Total Cost of Goods Sold |
72,859 | 57,557 | 15,302 | 26.6 | % | |||||||||
| Gross Profit |
$ | 74,009 | $ | 57,310 | $ | 16,699 | 29.1 | % | ||||||
| Gross Margin % |
50.4 | % | 49.9 | % | ||||||||||
| (1) | Revenue and cost of goods sold for the Manufactured Products segment is for the year ended December 31, 2009 and for the period February 18, 2008 through December 31, 2008. |
| (2) | Revenue and cost of goods sold for the Distribution and Licensed Products segment includes Wanwei for the year ended December 31, 2009 and 2008 and Rongheng for the year ended December 31, 2009 and for the period July 5, 2008 through December 31, 2008. |
Cost of goods sold was approximately $72,859,000 for the year ended December 31, 2009 as compared with $57,557,000 for the year ended December 31, 2008. The gross profit for the year ended December 31, 2009 was 50.4% as compared to 49.9% for the year ended December 31, 2008. The gross profit of Sunstone products for the year ended December 31, 2009 was $65,349,000 as compared to $50,762,000 for the period February 18, 2008 through December 31, 2008. The gross margin for the year ended December 31, 2009 was 77.8% as compared to 77.2% for period February 18, 2008 through December 31, 2008.
The gross profits for the year ended December 31, 2009 for distribution was $4,326,000 as compared to $3,441,000 for the year ended December 31, 2008. The gross margin for distribution products was 7.7% for the year ended December 31, 2009 as compared to 7.9% for the year ended December 31, 2008.
43
Table of Contents
The gross profits for the year ended December 31, 2009 for licensed products was $4,334,000 as compared to $3,107,000 for the year ended December 31, 2008. The gross margin for licensed products was 61.3% for the year ended December 31, 2009 as compared to 57.2% for the year ended December 31, 2008. The increase in gross margin was the result of the Company’s revenue mix changing to include a larger percentage of high-gross-profit products. In addition, the Company introduced a higher gross profit version of Propess in 2009.
Sales and Marketing Expenses:
Sales and marketing expenses were $47,778,000 for the year ended December 31, 2009 as compared with $39,666,000 for the year ended December 31, 2008. This represents an $8,112,000 increase or 20.5% increase over 2008. Advertising, travel and entertainment, marketing, salaries and related benefits, selling expenses and amortization of intangibles account for $41,754,000 or 87.6% of sales and marketing expenses for the year ended December 31, 2009 as compared to $34,747,000 or 87.6% for the year ended December 31, 2008. Sunstone and Rongheng were acquired in 2008 whereas 2009 reflects a full year of activity for Sunstone and Rongheng. The most significant sales and marketing expense increases for the year ended December 31, 2009 as compared to the year ended December 31, 2008 are as follows: marketing and advertising of $3,074,000; travel and entertainment of $3,641,000; and sales office selling expenses $1,530,000. For 2010 and future years we expect the percentage of sales and marketing expenses to revenue will remain at a consistent percentage of revenues as compared to 2009.
General and Administrative Expenses:
General and administrative expenses were approximately $17,844,000 for the year ended December 31, 2009 as compared to $13,898,000 for the year ended December 31, 2008. General and administrative expenses as a percentage of net revenues increased to 12.2% for the year ended December 31, 2009 as compared to 12.1% for the year ended December 31, 2008. Salaries and related benefits increased $1,373,000 for the year ended December 31, 2009 as compared to the year ended December 31, 2008. The increase was the result of Sunstone and Rongheng were acquired during 2008 and reflect a full year of activity in 2009, executive management’s salaries were not increased in 2009 and there was no bonus paid for executive management in 2009 and Wanwei accrued severance for a reduction in workforce. Research and development expenses increased $1,669,000 for the year ended December 31, 2009 as compared to the year ended December 31, 2008. Our general and administrative expenses in 2010 and future years is expected to remain as a constant percentage of revenues or decline as our revenue growth is expected to exceed any increase of general and administrative expenses as compared to 2009.
Interest Income:
Our interest income primarily consists of income earned on our cash and cash equivalents and debt premium amortization. We received interest income on our balances of cash and cash equivalents of $93,000 during the year ended December 31, 2009 and $70,000 for the year ended December 31, 2008. Total premium amortization was $132,000 for the year ended December 31, 2009. As of December 31, 2009, the unamortized debt premium amounted to $171,000.
Interest Expense:
Our interest expense primarily consists of incurred interest and debt discount amortization from our November 2007, January 2009 and March 2009 long term debt financing. We had interest expense of $4,430,000 for the year ended December 31, 2009 and $6,301,000 in 2008, of which total amortization of debt discount was $450,000 for the year ended December 31, 2009 as compared to $3,067,000 for the year ended December 31, 2008.
44
Table of Contents
Debt Issuance Cost Amortization:
Our issuance cost amortization is the result of our long-term debt financing costs we incurred in November 2007. The Company defers debt issuance costs and amortizes the amount over the life of debt on a straight-line basis which approximates the effective interest method. The unamortized debt issuance cost was $718,000 as of December 31, 2009. Total amortization of debt issuance cost was $446,000 for the year ended December 31, 2009 as compared to $840,000 for the year ended December 31, 2008.
Equity Method Investment Income:
For our 50% investment in Shengda that was not fully consolidated and is included in our financial statements under the equity method of accounting for the period February 17 through December 31, 2009, the difference between the cost of our investment and our proportionate share of the equity in the underlying net assets is accounted for under the purchase method of accounting. Under the purchase method of accounting we allocate the purchase price to the net assets acquired in the transaction at their respective estimated fair market values. The excess cost over book value of net assets acquired is amortized over the estimated useful life of acquired assets (with definitive useful lives) against our share of investee earnings.
The following table provides a reconciliation of our equity method investment income. Prior to purchase accounting adjustments, Shengda generated net income of $642,000, or $321,000 for our 50% equity ownership. The total of excess value of inventory sold of $61,000 and amortization for the period was $235,000 which resulted in an equity method investment income of $25,000.
| ($ amounts in thousands) |
||||
| Equity in earnings of Shengda for period February 17 through December 31, 2009 |
$ | 321 | ||
| Less adjustments of excess fair value: |
||||
| Inventory sold |
(61 | ) | ||
| Depreciation and Amortization expense on buildings and intangible assets |
(235 | ) | ||
| Total equity method investment income after amortization |
$ | 25 | ||
Loss on Early Extinguishment of Debt:
During the year ended December 31, 2009, the Company recorded a loss of approximately $4,573,000 in deferred loan costs, debt discount and debt premium, relative to the early extinguishment of the debt under the previously outstanding long term debt.
Gain on Derivatives:
The gain on derivatives liability is in connection with the convertible notes issued in January 2009, which were amended in March 2009 and May 2009, and the warrants which were issued as part of the common stock issuance in February 2009. The gain on derivatives was $1,204,000 for the year ended December 31, 2009.
Income Taxes
For the year ended December 31, 2009, we recognized $2,392,000 of income tax expense on profit before income taxes of $392,000. This compared to income tax expense for the year ended December 31, 2008 of $792,000 on loss before income taxes of $2,650,000. China does not permit the filing of a consolidated tax return for the entities which are wholly owned by the Company, which results in Sunstone having income tax expense on profit before income taxes while the Company has a consolidated loss before income taxes. Prior to December 2008 we recorded taxes at 25% for Sunstone. On December 3, 2008, Sunstone obtained the Hi-tech Enterprise Certificate issued by the Hebei Science and Technology Department. This designation entitled Sunstone to receive preferential treatment in 2008, 2009 and 2010 which reduced its income tax rate from 25% to
45
Table of Contents
15%. On February 18, 2008 upon acquisition of 51% of Sunstone China, we recorded a deferred tax liability for non-deductible intangible amortization. The tax rate to set the deferred tax liability was at the then current rate of 25%. The favorable granting of high-tech status in 2008 caused us to reduce the deferred tax liability expected to be expensed in 2009 and 2010 from 25% to 15%, resulting in a reduction in 2008 taxes of $670,000.
Year Ended December 31, 2008 Compared to Year Ended December 31, 2007
The following table sets forth the amounts and the percentage relationship to revenues of certain items in our consolidated statements of operations for the years ended December 31, 2008 and 2007:
| Year Ended December 31, | Year Ended December 31, | |||||||||||||
| 2008 | 2007 | 2008 | 2007 | |||||||||||
| ($ amounts in thousands) | ||||||||||||||
| Net Revenues |
$ | 114,867 | $ | 31,003 | 100.0 | % | 100.0 | % | ||||||
| Cost of Goods Sold |
57,557 | 26,716 | 50.1 | % | 86.2 | % | ||||||||
| Gross Profit |
57,310 | 4,287 | 49.9 | % | 13.8 | % | ||||||||
| Sales and Marketing Expenses |
39,666 | 4,377 | 34.5 | % | 14.1 | % | ||||||||
| General and Administrative Expenses |
13,898 | 10,760 | 12.1 | % | 34.7 | % | ||||||||
| Loss on Disposal of Asset |
— | 20 | 0.0 | % | 0.1 | % | ||||||||
| Total Operating Expenses |
53,564 | 15,157 | 46.6 | % | 48.9 | % | ||||||||
| Income (Loss) From Operations |
3,746 | (10,870 | ) | 3.3 | % | -35.1 | % | |||||||
| Other Income (Expense): |
||||||||||||||
| Interest Income |
70 | 620 | 0.1 | % | 2.0 | % | ||||||||
| Interest Expense |
(6,301 | ) | (1,047 | ) | -5.5 | % | -3.4 | % | ||||||
| Debt Issuance Cost Amortization |
(840 | ) | (140 | ) | -0.7 | % | -0.5 | % | ||||||
| Equity Method Investment Earnings (Loss) |
675 | (264 | ) | 0.6 | % | -0.8 | % | |||||||
| Other Income (Expense) |
— | 81 | 0.0 | % | 0.3 | % | ||||||||
| Total Other Income (Expense) |
(6,396 | ) | (750 | ) | -5.5 | % | -2.4 | % | ||||||
| Loss Before Provision for Income Taxes |
(2,650 | ) | (11,620 | ) | -2.2 | % | -37.5 | % | ||||||
| Provision for Income Taxes |
792 | 15 | 0.7 | % | 0.0 | % | ||||||||
| Net Loss |
$ | (3,442 | ) | $ | (11,635 | ) | -2.9 | % | -37.5 | % | ||||
Net Revenue:
Net revenue was approximately $114,867,000 for the year ended December 31, 2008 as compared with approximately $31,003,000 for the year ended December 31, 2007. Revenue by product category is as follows:
| Year Ended December 31, | $ Increase | % Increase | ||||||||||
| 2008 | 2007 | |||||||||||
| ($ amounts in thousands) | ||||||||||||
| Manufactured Products (1) |
$ | 65,715 | $ | — | $ | 65,715 | N/A | % | ||||
| Distribution Products (2) |
43,717 | 27,911 | 15,806 | 56.6 | % | |||||||
| Licensed Products |
5,435 | 3,092 | 2,343 | 75.8 | % | |||||||
| $ | 114,867 | $ | 31,003 | $ | 83,864 | 270.5 | % | |||||
| (1) | Revenue for Manufactured Products segment is for the period February 18, 2008 through December 31, 2008. |
| (2) | Revenue for Distribution products segment includes Wanwei for 12 months ended December 31, 2008 and 2007 and Rongheng for the period July 5, 2008 through December 31, 2008. |
46
Table of Contents
Manufactured Products. Sunstone revenues were $65,715,000 for the period February 18, 2008 through December 31, 2008. Sunstone manufactures and sells pediatric products under the Goodbaby brand, women’s health products under the Confort brand and nutritional products under the Nemei brand. The Goodbaby brand accounted for 80.8% of Sunstone’s total product sales for the period February 18, 2008 through December 31, 2008. The top products were the treatment of Pediatric Paracetamol and Amantadine Hydrochloride Granules for the treatment of the common cold, Pediatric Huatan Zhike Granules for the treatment of coughing, Pediatric Kechuanling Oral Solution for the treatment of coughing and Pidotimod Tablets to increase immune system response. The Confort brand accounts for 12.5% of Sunstone’s total product sales for the year ended December 31, 2008 with Confort Pessaries as the leading product. These top five products accounted for approximately 89.7% of Sunstone’s revenue for the period.
Pharmaceutical Distribution. Distribution revenue for the year ended December 31, 2008, excluding licensed products, was $43,717,000 as compared to $27,911,000 for the year ended December 31, 2007. Rongheng’s revenues of $10,022,000 were included for the period July 5, 2008 through December 31, 2008. Rongheng’s top five products were Selenious Yeast Tablets, Cefotiam Hydrochloride, Gemcitabine Hydrochloride, Iohexol and Almitrine and Raubasine compound which collectively accounted for 22.1% of Rongheng’s revenue for the period July 5 through December 31, 2008. Wanwei’s top five products excluding our licensed products, were Xingnaojing, Glurenorm, Ferrous Succinate Tablets, Xuebijing and Golden Dragon Capsule which collectively accounted for 35.1% of Wanwei’s revenue for the year ended December 31, 2008.
Licensed Products. We provided sales and marketing and distribution services for Anpo and Propess used in obstetrics, Galake for mild to moderate pain and Ferriprox for iron overload in patients with Thalassemia. Revenues totaled $5,435,000 for the year ended December 31, 2008 as compared to $3,092,000 for the year ended December 31, 2007, an increase of 75.8%. This increase was the result of continued sales and marketing efforts promoting Propess and Anpo and initiating sales of Galake and Ferriprox during the third quarter of 2007 and third quarter 2008. As of December 31, 2008 there were 461 and 546 hospitals selling Propess and Anpo respectively, versus 412 and 421, respectively, as of December 31, 2007. In addition, there were 195 hospitals selling Galake as of December 31, 2008.
47
Table of Contents
Cost of Goods Sold:
Cost of Goods Sold was approximately $57,557,000 for the year ended December 31, 2008 as compared with approximately $26,716,000 for the year ended December 31, 2007. Cost of Goods Sold by product category is as follows:
| Year Ended December 31, |
||||||||||||||
| 2008 | 2007 | $ Increase | % Increase | |||||||||||
| ($ amounts in thousands) | ||||||||||||||
| Manufactured Products (1) |
||||||||||||||
| Revenues |
$ | 65,715 | $ | N/A | $ | N/A | N/A | |||||||
| Cost of Goods Sold |
14,953 | N/A | N/A | N/A | ||||||||||
| Gross Profit |
$ | 50,762 | $ | N/A | $ | N/A | N/A | |||||||
| Gross Margin % |
77.2 | % | N/A | |||||||||||
| Distribution Products |
||||||||||||||
| Revenues |
$ | 43,717 | $ | 27,911 | $ | 15,806 | 56.6 | % | ||||||
| Cost of Goods Sold |
40,276 | 25,450 | 14,826 | 58.3 | % | |||||||||
| Gross Profit |
$ | 3,441 | $ | 2,461 | $ | 980 | 39.8 | % | ||||||
| Gross Margin % |
7.9 | % | 8.8 | % | ||||||||||
| Licensed Products |
||||||||||||||
| Revenues |
$ | 5,435 | $ | 3,092 | $ | 2,343 | 75.8 | % | ||||||
| Cost of Goods Sold |
2,328 | 1,266 | 1,062 | 83.9 | % | |||||||||
| Gross Profit |
$ | 3,107 | $ | 1,826 | $ | 1,281 | 70.2 | % | ||||||
| Gross Margin % |
57.2 | % | 59.1 | % | ||||||||||
| Total |
||||||||||||||
| Revenues |
$ | 114,867 | $ | 31,003 | $ | 83,864 | 270.5 | % | ||||||
| Cost of Goods Sold |
57,557 | 26,716 | 30,841 | 115.4 | % | |||||||||
| Gross Profit |
$ | 57,310 | $ | 4,287 | $ | 53,023 | 1236.8 | % | ||||||
| Gross Margin % |
49.9 | % | 13.8 | % | ||||||||||
| (1) | Revenue and cost of goods sold for the Manufactured Products segment is for the period February 18, 2008 through December 31, 2008. |
| (2) | Revenue and cost of goods sold for the Distribution Products segment includes Wanwei for the 12 months ended December 31, 2008 and 2007 and Rongheng for the period July 5, 2008 through December 31, 2008. |
Cost of goods sold was approximately $57,557,000 for the year ended December 31, 2008 as compared with $26,716,000 for the year ended December 31, 2007. The gross profit for the year ended December 31, 2008 was 49.9% as compared to 13.8% for the year ended December 31, 2007. The gross profit for the year ended December 31, 2008 of Sunstone products was $50,762,000, which included $1,019,000 of amortization and fair value adjustments of inventory resulting from the Sunstone acquisition. The gross profit for the year ended December 31, 2008 was 77.2%, which included the purchase accounting adjustments.
The gross profit for the year ended December 31, 2008 for distribution products was $3,441,000 as compared to $2,461,000 for the year ended December 31, 2007. The gross profit for distribution products was 7.9% for the year ended December 31, 2008 as compared to 8.8% for the year ended September 30, 2007.
48
Table of Contents
The gross profits for the year ended December 31, 2008 for licensed products was $3,107,000 as compared to $1,826,000 the year ended December 31, 2007. The gross margin for licensed products was 57.2% for the year ended December 31, 2008 as compared to 59.1% for the year ended December 31, 2007.
Sales and Marketing Expenses:
Sales and marketing expenses were $39,666,000 for the year ended December 31, 2008 as compared with $4,377,000 for the year ended December 31, 2007. The acquisitions of Sunstone and Rongheng in February 2008 and July 2008, respectively, accounted for $35,272,000 of the increase in sales and marketing for the year ended December 31, 2008. Advertising, travel and entertainment, marketing, salaries and related benefits, selling expenses and amortization of intangibles account for $34,747,000 or 87.6% of sales and marketing expenses for the year ended December 31, 2008. The most significant sales and marketing expense increases for the year ended December 31, 2008 as compared to the year ended December 31, 2007 are as follows: television, newspaper and magazine advertising of $7,471,000; travel and entertainment of $6,479,000; marketing $5,984,000; salaries and related benefits of $5,204,000; sales office selling expenses $4,400,000; and amortization of intangibles of $2,996,000 which resulted from the acquisition of Sunstone.
General and Administrative Expenses:
General and administrative expenses were approximately $13,898,000 for the year ended December 31, 2008 as compared to $10,760,000 for the year ended December 31, 2007. General and administrative expenses as a percentage of net revenues decreased to 12.1% for the year ended December 31, 2008 as compared to 34.7% for the year ended December 31, 2007. The acquisition of Sunstone and Rongheng during 2008 accounted for $4,241,000 of the increase in general and administrative expenses. Salaries and related benefits increased $1,525,000 for the year ended December 31, 2008 as compared to the year ended December 31, 2007. This increase is the result of the Sunstone and Rongheng acquisitions for $1,626,000. Stock-based compensation increased $705,000 for year ended December 31, 2008 as compared to the year ended December 31, 2007. Office rent and supply expenses increased $741,000 for the year ended December 31, 2008 as compared to the year ended December 31, 2007 as a result of BMP China, BMP Sunstone Corporation Beijing Representative Office and Wanwei moving into new offices during 2008 and the acquisitions of Sunstone and Rongheng. State and business taxes increased $604,000 for the year ended December 31, 2008 as compared to December 31, 2007, of which $392,000 of the increase was the result of the Sunstone and Rongheng acquisitions. Depreciation expenses increased $557,000 for the year ended December 31, 2008 as compared to the year ended December 31, 2007, of which $493,000 was the result of the Sunstone and Rongheng acquisitions. Offsetting the above increases in 2008 was a reversal of $525,000 which was an over accrual for social taxes from prior years. In addition, in 2007 we paid a $2,000,000 upfront milestone payment. We did not have any milestone payments in 2008.
Interest Income:
Our interest income primarily consists of income earned on our cash and cash equivalents. We received interest income of $70,000 during the year ended December 31, 2008 and $620,000 in 2007.
Interest Expense:
Our interest expense primarily consists of incurred interest and debt discount amortization from our November 2007 long-term debt financing. We had interest expense of $6,301,000 during the year ended December 31, 2008 and $1,047,000 in 2007. As a part of the issuance of the debt, the Company issued common stock purchase warrants to the purchasers of the debt giving them the right to purchase up to an aggregate of 1,037,580 shares of common stock at an exercise price of $12.43 per share. Class A warrants will expire on May 1, 2009 and Class B warrants expire on November 1, 2012, unless sooner exercised. The relative fair value of these warrants on their date of grant, which was determined to be approximately $4,601,000, was recorded as a discount to the underlying debt and as an addition to additional paid-in capital. The discount is being amortized
49
Table of Contents
over the term of the underlying debt on a straight-line basis, which approximates the effective interest method. As of December 31, 2008, the unamortized debt discount amounted to approximately $1,022,000. Total amortization of the debt discount was $3,067,000 for the year ended December 31, 2008 as compared to $511,000 for the year ended December 31, 2007.
Debt Issuance Cost Amortization:
Our issuance cost amortization is the result of our long-term debt financing costs we incurred in November 2007. The Company defers debt issuance costs and amortizes the amount over the life of debt on a straight-line basis which approximates the effective interest method. The unamortized debt issuance cost was $280,000 as of December 31, 2008. Total amortization of debt issuance cost was $840,000 for the year ended December 31, 2008 as compared to $140,000 for the year ended December 31, 2007.
Equity Method Investment Income:
For our 49% investment in Sunstone China that was not fully consolidated and is included in our financial statements under the equity method of accounting for the period January 1, 2008 through February 17, 2008, the difference between our cost of our investment and our proportionate share of the equity in the underlying net assets is accounted for under the purchase method of accounting. Under the purchase method of accounting we allocate the purchase price to the net assets acquired in the transaction at their respective estimated fair market values. The premium we pay that represents the excess cost over the underlying fair value of our proportionate share of the net assets acquired, is referred to as equity method goodwill. The excess cost over book value of net assets acquired not representing trademarks and goodwill is amortized over the estimated useful life of acquired assets (with definitive useful lives) against our share of investee earnings.
The following table provides a reconciliation of our equity method investment income. Prior to purchase accounting adjustments, Sunstone China generated net income of $2,104,000, or $1,031,000 for our 49% equity ownership. The total of amortization for the period was $356,000 which resulted in a equity method investment income of $675,000.
| ($ amounts in thousands) | ||||
| Equity in earnings of Sunstone China for period January 1 through February 17, 2008 |
$ | 1,031 | ||
| Less adjustments of excess fair value: |
||||
| Amortization expense of intangible assets |
(356 | ) | ||
| Total equity method investment income after amortization |
$ | 675 | ||
Income Taxes
For the year ended December 31, 2008, we recognized $792,000 of income tax expense on loss before income taxes of $2,650,000. This compared to income tax expense for the year ended December 31, 2007 of $15,000 on loss before income taxes of $11,620,000. China does not permit the filing of a consolidated tax return for the entities which are wholly owned by the Company, which results in Sunstone having income tax expense on profit before income taxes while the Company’s has a consolidated loss before income taxes. Prior to December 2008 we recorded taxes at 25% for Sunstone. On December 3, 2008, Sunstone obtained the Hi-tech Enterprise Certificate issued by the Hebei Science and Technology Department. This designation entitled Sunstone to receive preferential treatment in 2008, 2009 and 2010 which reduced its income tax rate from 25% to 15%. On February 18, 2008 upon acquisition of 51% of Sunstone China, we recorded a deferred tax liability for non-deductible intangible amortization. The tax rate to set the deferred tax liability was at the then current rate of 25%. The favorable granting of high-tech status in 2008 caused us to reduce the deferred tax liability expected to be expensed in 2009 and 2010 from 25% to 15%, resulting in a reduction in 2008 taxes of $670,000.
50
Table of Contents
Related Party Transactions
For description of our related party transactions, see Part IV exhibits and Financial Statement Note 14.
Recent Accounting Pronouncements
In June 2009, the Financial Accounting Standards Board (the “FASB”) issued the FASB Accounting Standards Codification (the “Codification”). The Codification has become the single source for all authoritative GAAP recognized by the FASB to be applied for financial statements issued for periods ending after September 15, 2009. We adopted the Codification in 2009 and it did not have an effect on our financial position or results of operations.
On January 1, 2008, the Company adopted a new accounting standard regarding fair value measurements as it relates to financial assets and financial liabilities. In February 2008, the FASB issued new accounting guidance, which delayed the effective date of the standard for all nonfinancial assets and nonfinancial liabilities, except those that are recognized or disclosed at fair value in the financial statements on at least an annual basis, until January 1, 2009 for calendar year-end entities.
The standard defines fair value, establishes a framework for measuring fair value in accordance with GAAP, and expands disclosures about fair value measurements. The provisions of this standard apply to other accounting pronouncements that require or permit fair value measurements and are to be applied prospectively with limited exceptions. The adoption of the standard, as it relates to financial assets and financial liabilities, had no significant impact on the Company’s financial statements. Management has adopted the standard as of the effective date, as it relates to nonfinancial assets and nonfinancial liabilities and there was no significant impact on the Company’s financial statements. The standard establishes a fair value hierarchy that prioritizes observable and unobservable inputs used to measure fair value into three broad levels, which are described below:
Level 1—Unadjusted quoted prices in active markets that are accessible at the measurement date for identical, unrestricted assets or liabilities.
Level 2—Inputs other than quoted prices included within Level 1 that are observable for the asset or liability, either directly or indirectly, including quoted prices for similar assets or liabilities in active markets; quoted prices for identical or similar assets or liabilities in markets that are not active; inputs other than quoted prices that are observable for the asset or liability (e.g., interest rates); and inputs that are derived principally from or corroborated by observable market data by correlation or other means.
Level 3—Inputs that are both significant to the fair value measurement and unobservable.
In October 2008, the FASB issued new accounting guidance which clarifies prior guidance regarding the application of fair value in a market that is not active and provides an example to illustrate key considerations in determining the fair value of a financial asset when the market for that financial asset is not active. The standard is effective upon issuance, including prior periods for which financial statements have not been issued. The Company adopted the standard for the period ended December 31, 2008 and the adoption did not have any significant impact on its consolidated balance sheets, statements of operations, or disclosures.
The fair value of cash equivalents and restricted cash was $22.7 million at December 31, 2009. These financial instruments are classified in Level 1 of the fair value hierarchy described above.
In December 2007, the FASB issued new accounting guidance regarding how an entity accounts for the acquisition of a business. The standard carries forward the existing requirements to account for all business combinations using the acquisition method (formerly called the purchase method). In general, the standard requires acquisition-date fair value measurement of identifiable assets acquired, liabilities assumed, and noncontrolling interests in the acquiree. The standard eliminates the cost-based purchase method.
51
Table of Contents
The new measurement requirements result in the recognition of the full amount of acquisition-date goodwill, which includes amounts attributable to noncontrolling interests. The acquirer recognizes in income any gain or loss on the remeasurement to acquisition-date fair value of consideration transferred or of previously acquired equity interests in the acquiree. Neither the direct costs incurred to effect a business combination nor the costs the acquirer expects to incur under a plan to restructure an acquired business may be included as part of the business combination accounting. As a result, those costs are charged to expense when incurred, except for debt or equity issuance costs, which are accounted for in accordance with other generally accepted accounting principles.
The standard also changes the accounting for in-process research and development, and restructuring costs. In addition, after the standard is adopted, changes in uncertain tax positions or valuation allowances for deferred tax assets acquired in a business combination are recognized as adjustments to income tax expense or contributed capital, as appropriate, even if the deferred tax asset or tax position was initially acquired prior to the effective date of the standard. The Company adopted the standard as of the required effective date of January 1, 2009. The adoption of the standard did not have any significant impact on the Company’s consolidated balance sheets, statement of operations or disclosures.
In April 2008, the FASB issued accounting guidance which amends the factors that should be considered in developing the renewal or extension assumptions used to determine the useful life of a recognized intangible asset under a previously issued standard with regards to Goodwill and Other Intangible Assets. This standard also requires expanded disclosure related to the determination of intangible asset useful lives. The standard is effective for fiscal years beginning after December 15, 2008. The Company has adopted the standard as of the required effective date of January 1, 2009 and the adoption did not have any significant impact on its consolidated balance sheets, statements of operations, or disclosures.
In June 2008, the FASB issued new accounting guidance which specifies that a contract that would otherwise meet the definition of a derivative but is both (a) indexed to the Company’s own stock and (b) classified in stockholders’ equity in the statement of financial position would not be considered a derivative financial instrument. The standard provides a new two-step model to be applied in determining whether a financial instrument or an embedded feature is indexed to an issuer’s own stock and thus able to qualify for the standard’s scope exception. This standard is effective for financial statements issued for fiscal years beginning after December 15, 2008, and interim periods within those fiscal years. Early application is not permitted. The Company has adopted this standard as of January 1, 2009 in its evaluation of its derivatives.
In March 2008, the FASB issued accounting guidance which requires companies with derivative instruments to disclose information about how and why the company used derivative instruments; how the company accounts for derivative instruments and related hedged items; and how derivative instruments and related hedged items affect the company’s financial position, financial performance, and cash flows. The expanded disclosure guidance also requires a company to provide information about its strategies and objectives for using derivative instrument; disclose credit-risk-related contingent features in derivative agreements and information about counterparty credit risk; and present the fair value of derivative instruments and related gains or losses in a tabular format. The Company adopted the standard as of the required effective date of January 1, 2009 and applied its provisions prospectively by providing the additional disclosures in its financial statements.
In April 2009, the FASB issued new accounting guidance requiring disclosures about the fair value of financial instruments in interim as well as in annual financial statements. The adoption of this standard has resulted in additional disclosures only in our interim financial statements, and therefore did not impact our financial position, results of operations or cash flows. The Company has adopted the standard as of the required effective date of June 15, 2009. See Note 11 for discussion of fair value measurements of our derivative instruments.
52
Table of Contents
In May 2009, the FASB issued new accounting guidance which provided accounting and disclosure requirements for subsequent events. This standard introduces new terminology, defines a date through which management must evaluate subsequent events, and lists the circumstances under which an entity must recognize and disclose events or transactions occurring after the balance-sheet date. The Company adopted this standard as of June 30, 2009, which was the required effective date.
In August 2009, the FASB issued new accounting guidance regarding amendments to various topics containing SEC Staff Accounting Bulletins. This guidance represents technical corrections to various topics within the FASB Codification containing SEC Staff Accounting Bulletins, to update cross-references to Codification text. We have evaluated this new standard and have determined that it will not have a significant impact on the determination or reporting of our financial results.
In August 2009, the FASB issued new accounting guidance amending the fair value measurement of liabilities. The guidance provided in this standard is effective for the first reporting period (including interim periods) beginning after issuance. We have evaluated this new standard and have determined that it will not have a significant impact on the determination or reporting of our financial results.
In December 2009, the FASB issued new accounting guidance which amends the Codification as a result of the FASB’s issuance of “Amendments to FASB Interpretation No. 46(R)” during June of 2009. This amendment requires an enterprise to perform an analysis to determine whether the enterprise’s variable interest or interests give it a controlling financial interest in a variable interest entity. This guidance requires ongoing reassessments of whether an enterprise is the primary beneficiary of a variable interest entity. This amendment eliminates the quantitative approach previously required for determining the primary beneficiary of a variable interest entity, which was based on determining which enterprise absorbs the majority of the entity’s expected losses, receives a majority of the entity’s expected residual returns, or both. This guidance requires enhanced disclosures that will provide users of financial statements with more transparent information about an enterprise’s involvement in a variable interest entity. This amendment is effective as of the beginning of each reporting entity’s first annual reporting period that begins after November 15, 2009, for interim periods within that first annual reporting period, and for interim and annual reporting periods thereafter. Earlier application is prohibited. We are in the process of evaluating this new guidance, and assessing its impact on the determination or reporting of our financial results.
In January 2010, the FASB issued new accounting guidance which provides amendments to “Consolidation – Overall” and related guidance within U.S. GAAP to clarify the scope of the decrease in ownership provisions of the Subtopic and related guidance. The amendments also clarify that the decrease in ownership guidance does not apply to certain transactions even if they involve businesses. The guidance is effective beginning in the first interim or annual reporting period ending on or after December 15, 2009. We have evaluated this new guidance, and have determined that it will not have a significant impact on the determination or reporting of our financial results.
In January 2010, the FASB issued new accounting guidance which amend “Fair Value Measurements and Disclosures” that will provide more robust disclosures about (1) the different classes of assets and liabilities measured at fair value, (2) the valuation techniques and inputs used, (3) the activity in Level 3 fair value measurements, and (4) the transfers between Levels 1, 2, and 3. The new disclosures and clarifications of existing disclosures are effective for interim and annual periods beginning after December 15, 2009, except for certain disclosures which are effective for fiscal years beginning after December 15, 2010, and for interim periods within those fiscal years. We are in the process of evaluating this new guidance and assessing its impact on the determination or reporting of our financial results.
53
Table of Contents
| ITEM 7A. | QUANTITATIVE AND QUALITATIVE DISCLOSURES ABOUT MARKET RISK |
Foreign Exchange Rate Sensitivity
We are exposed to cash flow and earnings fluctuations resulting from foreign exchange rate variation because of our operations are in China. This exposure arises from the translation of financial statements of our foreign subsidiaries, from RMB, the functional currency of China, into United States dollars, our functional currency of our parent entity. For additional information, see Item 1A. “Risk Factors — Risks Related to Doing Business in China — Fluctuations in the Chinese could adversely affect our results of operations”.
We do not, as a routine matter, use hedging vehicles to manage foreign exchange exposures. As of December 31, 2009, a 10% unfavorable change in the foreign exchange rates affecting balance sheet transactional exposures would have resulted in an increase in pre-tax loss of approximately $1,279,000. This hypothetical reduction on transactional exposure is based on the difference between December 31, 2009 actual foreign exchange rates and hypothetical rates assuming a 10% unfavorable change in foreign exchange rates on that date.
The translation of the balance sheets of our Chinese operations from RMB into U.S. dollars is sensitive to changes in foreign exchange rates. These translation gains or losses are recorded as translation adjustments within shareholders’ equity on our balance sheet. Using the example above, the hypothetical change in translation adjustments would be calculated by multiplying the net assets of our Chinese operations by a 10% unfavorable change in the applicable foreign exchange rates. As of December 31, 2009, these hypothetical changes would reduce shareholders’ equity by approximately $16,510,000 or 10.7% of our December 31, 2009 shareholder equity of $153,975,000.
Interest Rate Sensitivity
We invest in high-quality financial instruments, primarily money market funds, federal agency notes, corporate debt securities, bank certificates of deposit, commercial paper and United States treasury notes, which we believe are subject to limited credit risk. We currently do not hedge interest rate exposure. Due to the short-term nature of our investments, we do not believe that we have any material exposure to interest rate risk arising from our investments.
| ITEM 8. | FINANCIAL STATEMENTS AND SUPPLEMENTARY DATA |
Our financial statements, together with the report of our independent registered public accounting firm, appear at pages F-2 through F-40 respectively, of this Annual Report on Form 10-K.
| ITEM 9. | CHANGE IN AND DISAGREEMENTS WITH ACCOUNTANTS ON ACCOUNTING AND FINANCIAL DISCLOSURE |
None.
| ITEM 9A. | CONTROLS AND PROCEDURES |
| (a) | Evaluation of Disclosure Controls and Procedures |
Our management, with the participation of our Chief Executive Officer and Chief Financial Officer, evaluated the effectiveness of our disclosure controls and procedures as of the end of the period covered by this report. Based on that evaluation, the Chief Executive Officer and Chief Financial Officer concluded that our disclosure controls and procedures as of the end of the period covered by this report were functioning effectively to provide reasonable assurance that the information required to be disclosed by us in reports filed under the Exchange Act is (i) recorded, processed, summarized and reported within the time periods specified in the SEC’s
54
Table of Contents
rules and forms and (ii) accumulated and communicated to our management, including the Chief Executive Officer and Chief Financial Officer, as appropriate to allow timely decisions regarding disclosure. A controls system cannot provide absolute assurance, however, that the objectives of the controls system are met, and no evaluation of controls can provide absolute assurance that all control issues and instances of fraud, if any, within a company have been detected.
| (b) | Changes in Internal Control Over Financial Reporting |
No change in our internal control over financial reporting occurred during our fourth fiscal quarter that materially affected, or is reasonably likely to material affect, our internal control over financial reporting. Management’s Report on Internal Control over Financial Reporting and the Report of Independent Registered Public Accounting Firm thereon are set forth below.
Management’s Report on Internal Control over Financial Reporting
Our management is responsible for establishing and maintaining adequate internal control over financial reporting. Our internal control over financial reporting is a process designed under the supervision of our Chief Executive Officer and Chief Financial Officer to provide reasonable assurance regarding the reliability of financial reporting and the preparation of our financial statements for external reporting purposes in accordance with GAAP.
As of the end of our 2009 fiscal year, management conducted an assessment of the effectiveness of our internal control over financial reporting based on the framework established in Internal Control—Integrated Framework issued by the Committee of Sponsoring Organizations of the Treadway Commission. Based on this assessment, management has determined that our internal control over financial reporting as of December 31, 2009 is effective.
Our internal control over financial reporting includes policies and procedures that pertain to the maintenance of records that, in reasonable detail, accurately and fairly reflect transactions and dispositions of assets; provide reasonable assurances that transactions are recorded as necessary to permit preparation of financial statements in accordance with GAAP, and that receipts and expenditures are being made only in accordance with authorizations of our management and directors; and provide reasonable assurance regarding prevention or timely detection of unauthorized acquisition, use or disposition of our assets that could have a material effect on our financial statements.
Our internal control over financial reporting as of December 31, 2009 has been audited by Grant Thornton, an independent registered public accounting firm, as stated in their report set forth on page F-4 hereof.
| ITEM 9B. | OTHER INFORMATION |
None.
55
Table of Contents
| ITEM 10. | DIRECTORS, EXECUTIVE OFFICERS AND CORPORATE GOVERNANCE |
Identification of Directors
Information with respect to our board of directors is set forth under the caption “Election of Directors” in our definitive proxy statement to be filed pursuant to Regulation 14A, which information is incorporated herein by reference.
Identification of Executive Officers
Information with respect to our executive officers is set forth in Item I of this Annual Report on Form 10-K.
Section 16(a) Beneficial Ownership Compliance
Information with respect to Section 16(a) compliance of our directors and executive officers is set forth under the caption “Section 16(a) Beneficial Ownership Reporting Compliance” in our definitive proxy statement to be filed pursuant to Regulation 14A, which information is incorporated herein by reference.
Corporate Governance
Information with respect to our Corporate Governance is set forth under the caption “Corporate Governance” in our definitive proxy statement to be filed pursuant to Regulation 14A, which information is incorporated herein by reference.
| ITEM 11. | EXECUTIVE COMPENSATION |
Information required by this item is set forth under the captions “Compensation of Non-Employee Directors, “Compensation Committee Interlocks and Insider Participation” and “Executive Compensation” in our definitive proxy statement to be filed pursuant to Regulation 14A, which information is incorporated herein by reference.
| ITEM 12. | SECURITY OWNERSHIP OF CERTAIN BENEFICIAL OWNERS AND MANAGEMENT AND RELATED STOCKHOLDER MATTERS |
Information required by this item is set forth under the caption “Security Ownership of Certain Beneficial Owners and Management” in our definitive proxy statement to be filed pursuant to Regulation 14A, which information is incorporated herein by reference.
The following table shows certain information concerning our common stock to be issued in connection with our equity compensation plans as of December 31, 2009:
| Plan Category |
Number of Securities to be Issued upon Exercise of Outstanding options, Warrants and Rights (a) |
Weighted-Average Exercise Price of Outstanding Options, Warrants and Rights (b) |
Number of Securities Remaining Available for Future Issuance Under Equity Compensation Plans (Excluding Securities Reflected in Column (a)) | ||||
| Equity Compensation Plans Approved by Security Holders |
3,446,232 | $ | 5.00 | 1,127,790 | |||
| Equity Compensation Plans Not Approved by Security Holders |
— | — | — | ||||
| Total |
3,446,232 | $ | 5.00 | 1,127,790 | |||
56
Table of Contents
| ITEM 13. | CERTAIN RELATIONSHIPS AND RELATED TRANSACTIONS, DIRECTOR INDEPENDENCE |
Information required by this item set forth under the caption, “Certain Relationships and Related Transactions” and “Corporate Governance-Affirmative Determinations Regarding Director Independence” in our definitive proxy statement to be filed pursuant to Regulation 14A, which information is incorporated herein by reference.
| ITEM 14. | PRINCIPAL ACCOUNTANT FEES AND SERVICES |
Information required by this item is set forth under the captions “Corporate Governance-Audit Committee Report” in our definitive proxy statement to be filed pursuant to Regulation 14A, which information is incorporated herein by reference.
57
Table of Contents
| ITEM 15. | EXHIBITS AND FINANCIAL STATEMENT SCHEDULES |
| (a) | Documents Filed as Part of This Report |
The following is a list of our consolidated financial statements and our subsidiaries and supplementary data included in this report under Item 8 of Part II hereof:
| 1. | Financial Statements and Supplemental Data |
See Item 8 of this Annual Report on Form 10-K.
| 2. | Financial Statement Schedules |
Schedule II — Valuation and Qualifying Accounts
Schedule II should be read in conjunction with the consolidated financial statements and related notes thereto set forth under Item 8 of this Annual Report on Form 10-K. All other schedules are omitted because they are not applicable, not required, or the required information is included in the consolidated financial statements or notes thereto.
| (b) | Exhibits |
The following is a list of exhibits filed as part of this Annual Report on Form 10-K. Where so indicated by footnote, exhibits that were previously filed are incorporated by reference. For exhibits incorporated by reference, the location of the exhibit in the previous filing is indicated.
| Exhibit |
Description | |
| 2.1 | Sale and Purchase Agreement, dated as of July 14, 2007, by and among Beijing Med-Pharm Corporation, Han Zhiqiang and Tong Zhijun (Incorporated by reference to Exhibit 2.1 of our Current Report on Form 8-K filed with the SEC on July 19, 2007) | |
| 2.2 | Sale and Purchase Agreement, dated as of September 28, 2007, by and among Beijing Med-Pharm Corporation, Han Zhiqiang and Tong Zhijun (Incorporated by reference to Exhibit 2.1 of our Current Report on Form 8-K filed with the SEC on October 4, 2007) | |
| 2.3 | Supplementary Agreement, dated as of September 28, 2007, by and among Beijing Med-Pharm Corporation, Han Zhiqiang and Tong Zhijun (Incorporated by reference to Exhibit 2.2 of our Current Report on Form 8-K filed with the SEC on October 4, 2007) | |
| 3.1 | Amended and Restated Certificate of Incorporation (Incorporated by reference to Exhibit 3.1 of our Annual Report on Form 10-K filed with the SEC on March 17, 2008) | |
| 3.2 | Amended and Restated Bylaws (Incorporated by reference to Exhibit 3.1 of our Current Report on Form 8-K filed with the SEC on December 19, 2007) | |
| 4.1 | Form of Common Stock Certificate (Incorporated by reference to Exhibit 4.1 of our Registration Statement on Form S-1 (Registration No. 333-121957) filed with the SEC on January 11, 2005, as amended) | |
| 4.2 | Form of Warrant issued on April 26, 2004 (Incorporated by reference to Exhibit 4.2 of our Registration Statement on Form S-1 (Registration No. 333-121957) filed with the SEC on January 11, 2005, as amended) | |
| 4.3 | Form of Subscription Agreement, dated October 14, 2005, as amended, by and between Beijing Med-Pharm Corporation and the signatories thereto (Incorporated by reference to Exhibit 4.1 of our Current Report on Form 8-K filed with the SEC on October 20, 2005) | |
58
Table of Contents
| Exhibit |
Description | |
| 4.4 | Form of Subscription Agreement, dated December 20, 2006, by and between Beijing Med-Pharm Corporation and the signatories thereto (Incorporated by reference to Exhibit 4.1 to our Current Report on Form 8-K filed with the SEC on December 21, 2006) | |
| 4.5 | Form of Warrant, dated December 20, 2006, by and between Beijing Med-Pharm Corporation and the signatories thereto (Incorporated by reference to Exhibit 4.2 to our Current Report on Form 8-K filed with the SEC on December 21, 2006) | |
| 4.6 | Form of Warrant to purchase shares of Common Stock (Incorporated by reference to Exhibit 4.1 of our Current Report on Form 8-K filed with the SEC on August 23, 2007) | |
| 4.7 | Form of Subscription Agreement (Incorporated by reference to Exhibit 10.2 of our Current Report on Form 8-K filed with the SEC on August 23, 2007) | |
| 4.8 | Form of Subscription Agreement (Incorporated by reference to Exhibit 4.1 of our Current Report on Form 8-K filed with the SEC on November 6, 2007) | |
| 4.9 | Form of Five Year Warrant (Incorporated by reference to Exhibit 4.2 of our Current Report on Form 8-K filed with the SEC on November 6, 2007) | |
| 4.10 | Form of 18 Month Warrant (Incorporated by reference to Exhibit 4.3 of our Current Report on Form 8-K filed with the SEC on November 6, 2007) | |
| 4.11 | Form of 10.0% Senior Secured Promissory Note due May 1, 2009 (Incorporated by reference to Exhibit 4.4 of the Current Report on Form 8-K filed with the SEC on November 6, 2007) | |
| 4.12 | Form of Subscription Agreement (Incorporated by reference to Exhibit 10.2 of our Current Report on Form 8-K filed with the SEC on October 10, 2008) | |
| 4.13 | Equity Transfer Agreement, dated December 19, 2008, between Sunstone (Tangshan) Pharmaceutical Co., Ltd. and Beijing Penn Pharmaceutical Sci-Tech Development Co., Ltd. (Incorporated by reference to Exhibit 10.1 of the Current Report on Form 8-K/A filed with the SEC on February 10, 2009) | |
| 4.14 | Form of Warrant (Incorporated by reference to Exhibit 4.1 of the Current Report on Form 8-K filed with the SEC on February 17, 2009) | |
| 4.15 | Form of Purchase Agreement (Incorporated by reference to Exhibit 10.2 of the Current Report on Form 8-K filed with the SEC on February 17, 2009) | |
| 4.16 | Form of Amended 12.5% Secured Convertible Notes (which notes were originally issued by the Company on January 20, 2009) as amended through March 13, 2009. (Incorporated by reference to Exhibit 4.1 of the Current Report on Form 8-K filed with the SEC on March 16, 2009) | |
| 4.17 | Form of 12.5% March Exchange Secured Convertible Notes due July 1, 2011 as issued by the Company on March 13, 2009. (Incorporated by reference to Exhibit 4.2 of the Current Report on Form 8-K filed with the SEC on March 16, 2009) | |
| 4.18 | Form of 12.5% March Cash Secured Convertible Notes due July 1, 2011 as issued by the Company on March 16, 2009. (Incorporated by reference to Exhibit 4.3 of the Current Report on Form 8-K filed with the SEC on March 16, 2009) | |
| 4.19 | Form of Note Exchange Agreement, as entered into on March 13, 2009, by the Company and certain holders of the Company’s 10.0% Senior Secured Promissory Notes due May 1, 2009. (Incorporated by reference to Exhibit 10.1 of the Current Report on Form 8-K filed with the SEC on March 16, 2009) | |
59
Table of Contents
| Exhibit |
Description | |
| 4.20 | Form of Purchase Agreement, as entered into on March 16, 2009, by the Company and the investors signatory thereto. (Incorporated by reference to Exhibit 10.2 of the Current Report on Form 8-K filed with the SEC on March 16, 2009) | |
| 4.21 | Amendment No. 1 to the Pledge Agreement, as entered into on March 12, 2009, by the Company and the noteholders signatory thereto. (Incorporated by reference to Exhibit 10.3 of the Current Report on Form 8-K filed with the SEC on March 16, 2009) | |
| 4.22 | Form of 12.5% Subordinated Convertible Notes due July 1, 2011 as issued by the Company on March 16, 2009. (Incorporated by reference to Exhibit 4.1 of the Current Report on Form 8-K filed with the SEC on March 16, 2009) | |
| 4.23 | Form of Subscription Agreement, as entered into on March 16, 2009, by the Company and the investor signatory thereto. (Incorporated by reference to Exhibit 10.2 of the Current Report on Form 8-K filed with the SEC on March 16, 2009) | |
| 4.24 | Form of Indenture for Senior Debt Securities (Incorporated by reference to Exhibit 10.3 of the Current Report on Form 8-K filed with the SEC on March 16, 2009) | |
| 4.25 | Form of Indenture for Subordinated Debt Securities, as entered into on March 16, 2009, by the Company and The Bank of New York Mellon, as trustee. (Incorporated by reference to Exhibit 10.4 of the Current Report on Form 8-K filed with the SEC on March 16, 2009) | |
| 4.26 | Form of Allonge, as entered into on April 15, 2009, by the Company and holders of the Company’s 12.5% Subordinated Convertible Notes due July 1, 2011. (Incorporated by reference to Exhibit 10.1 of the Current Report on Form 8-K filed with the SEC on April 16, 2009) | |
| 4.27 | First Supplemental Indenture, as entered into on April 15, 2009, by the Company and The Bank of New York Mellon, as trustee (Incorporated by reference to Exhibit 10.2 of the Current Report on Form 8-K filed with the SEC on April 16, 2009) | |
| 4.28 | Form of Third Agreement to Amend 12.5% Secured Convertible Notes due July 1, 2011, as entered into on May 14, 2009, by the Company and certain holders of the Company’s 12.5% Secured Convertible Notes due July 1, 2011 (Incorporated by reference to Exhibit 10.1 of the Current Report on Form 8-K filed with the SEC on May 17, 2009) | |
| 4.29 | Form of Agreement to Amend 12.5% March Exchange Secured Convertible Notes due July 1, 2011, as entered into on May 14, 2009, by the Company and certain holders of the Company’s 12.5% March Exchange Secured Convertible Notes due July 1, 2011 (Incorporated by reference to Exhibit 10.2 of the Current Report on Form 8-K filed with the SEC on May 17, 2009) | |
| 4.30 | Form of Second Agreement to Amend 12.5% March Cash Secured Convertible Notes due July 1, 2011, as entered into on May 14, 2009, by the Company and a certain holder of the Company’s 12.5% March Cash Secured Convertible Notes due July 1, 2011 (Incorporated by reference to Exhibit 10.3 of the Current Report on Form 8-K filed with the SEC on May 17, 2009) | |
| 4.31 | Form of Second Allonge, as entered into on May 14, 2009, by the Company and holders of the Company’s 12.5% Subordinated Convertible Notes due July 1, 2011 (Incorporated by reference to Exhibit 10.4 of the Current Report on Form 8-K filed with the SEC on May 17, 2009) | |
| 4.32 | Second Supplemental Indenture, as entered into on May 14, 2009, by the Company and The Bank of New York Mellon, as trustee (Incorporated by reference to Exhibit 10.5 of the Current Report on Form 8-K filed with the SEC on May 17, 2009) | |
| 4.33 | Share Purchase Agreement, dated as of August 3, 2009, by and between Alliance UniChem Group Limited and BMP Sunstone Corporation (Incorporated by reference to Exhibit 10.1 of the Current Report on Form 8-K filed with the SEC on August 4, 2009) | |
60
Table of Contents
| Exhibit |
Description | |
| 10.1ü | Employment Agreement, dated October 14, 2005, between Beijing Med-Pharm Corporation and David Gao (Incorporated by reference to Exhibit 10.1 of our Registration Statement on Form S-1 (Registration No. 333-121957) filed with the SEC on January 11, 2005, as amended) | |
| 10.2 | Consulting Agreement, dated July 1, 2004, between Beijing Med-Pharm Corporation and Ning Ning Chang (Incorporated by reference to Exhibit 10.2 of our Registration Statement on Form S-1 (Registration No. 333-121957) filed with the SEC on January 11, 2005, as amended) | |
| 10.3 | 2004 Stock Incentive Plan (Incorporated by reference to Exhibit 10.3 of our Registration Statement on Form S-1 (Registration No. 333-121957) filed with the SEC on January 11, 2005, as amended) | |
| 10.4 | Share Transfer and Debt Restructuring Agreement, dated December 15, 2004, between Beijing Wanwei Pharmaceutical Group and Beijing Med-Pharm Corporation (Incorporated by reference to Exhibit 10.4 of our Registration Statement on Form S-1 (Registration No. 333-121957) filed with the SEC on January 11, 2005, as amended) | |
| 10.5 | Share Transfer Agreement, dated December 15, 2004, between Beijing Med-Pharm Corporation and Wen Xin (Incorporated by reference to Exhibit 10.5 of our Registration Statement on Form S-1 (Registration No. 333-121957) filed with the SEC on January 11, 2005, as amended) | |
| 10.6 | Entrusted Loan Contract, dated December 27, 2004, between Beijing Med-Pharm Calculating Co. Ltd., China International Trust and Investment Industrial Bank and Beijing Wanwei Pharmaceutical Co. Ltd. (Incorporated by reference to Exhibit 10.6 of our Registration Statement on Form S-1 (Registration No. 333-121957) filed with the SEC on January 11, 2005, as amended) | |
| 10.7ü | Summary of Fred M. Powell Severance Terms (Incorporated by reference to Exhibit 10.7 of our Registration Statement on Form S-1/A (Registration No. 333-121957) filed with the SEC on April 19, 2005, as amended) | |
| 10.8 | Letter Agreement, dated June 6, 2002, by and among Biomet Merck, Merck China, Xiamen International Economic and Trade Company, and Beijing Med-Pharm Corporation (Incorporated by reference to Exhibit 10.8 of our Registration Statement on Form S-1/A (Registration No. 333-121957) filed with the SEC on May 13, 2005, as amended) | |
| 10.9 | Distributorship Agreement, dated August 29, 2005, by and among Cytokine PharmaSciences, Inc., Controlled Therapeutics (Scotland) Limited and Beijing Med-Pharm Corporation (Incorporated by reference to Exhibit 10.9 of our Registration Statement on Form S-1 (Registration No. 333-121957) filed with the SEC on January 11, 2005, as amended) | |
| 10.10 | Agreement, dated July 19, 2005, by and between Beijing Med-Pharm Corporation and MCM Klosterfrau GmbH, as amended on September 20, 2005 (Incorporated by reference to Exhibit 10.2 of our Quarterly Report on Form 10-Q for the fiscal quarter ended September 30, 2005, filed with the SEC on November 14, 2005) | |
| 10.11 | Office Lease Agreement, dated October 13, 2005, by and between Beijing Shengshang Asset Management Co. Ltd. and Beijing Med-Pharm Market Calculating Co. Ltd. (Incorporated by reference to Exhibit 10.11 of our Registration Statement on Form S-1 (Registration No. 333-121957) filed with the SEC on January 11, 2005, as amended) | |
| 10.12** | Exclusive Patent and Know How License Agreement, dated October 26, 2005, by and among Psimedica Ltd., Psioncology Pte. Ltd. and Beijing Med-Pharm Corporation (Incorporated by reference to Exhibit 10.1 of our Quarterly Report on Form 10-Q for the fiscal quarter ended September 30, 2005, filed with the SEC on November 14, 2005) | |
61
Table of Contents
| Exhibit |
Description | |
| 10.13 | Letter Agreement, dated as of January 20, 2006, amending the terms of the Exclusive Patent and Know How License Agreement among Psimedica Ltd., Psioncology Pte. Ltd. and Beijing Med-Pharm Corporation dated October 26, 2005 (Incorporated by reference to Exhibit 10.1 of our Current Report on form 8-K, filed with the SEC on January 26, 2006) | |
| 10.14 | Shareholders’ Agreement, dated as of January 18, 2007, among Beijing Med-Pharm Corporation, Alliance Unichem Group Limited and Alliance BMP Limited (Incorporated by reference to Exhibit 99.1 of our Current Report on Form 8-K filed with the SEC on January 30, 2007) | |
| 10.15 | Shareholders’ Agreement, dated as of July 14, 2007, by and among Beijing Med-Pharm Corporation, Han Zhiqiang, Tong Zhijun, Hong Kong Fly International Health Care Limited and Sunstone (Tangshan) Pharmaceutical Co., Ltd. (Incorporated by reference to Exhibit 10.1 of our Current Report on Form 8-K filed with the SEC on July 19, 2007) | |
| 10.16ü | Employment Agreement, dated as of January 1, 2008, between BMP Sunstone Corporation and Han Zhiqiang (Incorporated by reference to Exhibit 10.17 of our Annual Report on Form 10-K filed with the SEC on March 17, 2008) | |
| 10.17ü | Employment Agreement, dated as of October 1, 2007, between BMP Sunstone Corporation and Zhao Yanping (Incorporated by reference to Exhibit 10.18 of our Annual Report on Form 10-K filed with the SEC on March 17, 2008) | |
| 10.18** | Agreement, dated as of November 22, 2007 by and between Beijing Med-Pharm Corporation and Shanghai Novartis Trading Co., Limited (Incorporated by reference to Exhibit 10.19 of our Annual Report on Form 10-K filed with the SEC on March 17, 2008) | |
| 10.19 | Beijing Med-Pharm Corporation 2007 Omnibus Equity Compensation Plan (Incorporated by reference to Exhibit 10.20 of our Annual Report on Form 10-K/A filed with the SEC on May 7, 2008, as amended) | |
| 10.20ü | Employment Agreement, dated as of March 31, 2008, by and between BMP Sunstone Corporation and Fred M. Powell (Incorporated by reference to Exhibit 10.1 of our Quarterly Report on Form 10-Q for the fiscal quarter ended March 31, 2008, filed with the SEC on May 19, 2008) | |
| 21.1* | Subsidiaries of the Registrant | |
| 23.1* | Consent of Grant Thornton, Hong Kong | |
| 23.2* | Consent of KPMG | |
| 31.1* | Certification of Principal Executive Officer Pursuant to Section 302 of the Sarbanes-Oxley Act of 2002/SEC Rule 13a-14(a) | |
| 31.2* | Certification of Principal Financial Officer Pursuant to Section 302 of the Sarbanes-Oxley Act of 2002/SEC Rule 13a-14(a) | |
| 32.1* | Certification Pursuant to Section 1350 of Chapter 63 of 18 U.S.C. as Adopted Pursuant to Section 906 of the Sarbanes-Oxley Act of 2002/SEC Rule 13a-14(b) | |
| 32.2* | Certification Pursuant to Section 1350 of Chapter 63 of 18 U.S.C. as Adopted Pursuant to Section 906 of the Sarbanes-Oxley Act of 2002/SEC Rule 13a-14(b) | |
| * | Filed herewith |
| ** | Certain information in this exhibit has been omitted and has been filed separately with the Securities and Exchange Commission pursuant to a confidential treatment request under 17 C.F.R. Section 200.80(b)(4), 200.83 and 230.406. |
| ü | Management contract or compensatory plan or arrangement required to be filed or incorporated as an exhibit. |
62
Table of Contents
BMP Sunstone Corporation and Subsidiaries
F-1
Table of Contents
REPORT OF INDEPENDENT REGISTERED PUBLIC ACCOUNTING FIRM
Board of Directors and Shareholders
BMP Sunstone Corporation:
We have audited the accompanying consolidated balance sheets of BMP Sunstone Corporation (a Delaware corporation) and subsidiaries (the “Company”) as of December 31, 2009 and 2008, and the related consolidated statements of operations, stockholders’ equity and comprehensive loss, and cash flows for each of the three years in the period ended December 31, 2009. These financial statements are the responsibility of the Company’s management. Our responsibility is to express an opinion on these financial statements based on our audits. We did not audit the financial statements of Sunstone China Limited (formerly known as Hong Kong Fly International Health Care Limited and subsidiary), the investment in which, as discussed in Note 3 to the financial statements, is accounted for by the equity method of accounting for the period ended December 31, 2007. The Company’s equity in the net income of Sunstone China Limited and subsidiary was $896,000 for the two months ended December 31, 2007. The financial statements of Sunstone China Limited and its subsidiary were audited by other auditors whose report has been furnished to us, and our opinion, insofar as it relates to the amounts included for Sunstone China Limited and subsidiary for the period ended December 31, 2007 is based solely on the report of the other auditors.
We conducted our audits in accordance with the standards of the Public Company Accounting Oversight Board (United States). Those standards require that we plan and perform the audit to obtain reasonable assurance about whether the financial statements are free of material misstatement. An audit includes examining, on a test basis, evidence supporting the amounts and disclosures in the financial statements. An audit also includes assessing the accounting principles used and significant estimates made by management, as well as evaluating the overall financial statement presentation. We believe that our audits and the report of the other auditors provide a reasonable basis for our opinion.
In our opinion, based on our audits and the report of the other auditors, the consolidated financial statements referred to above present fairly, in all material respects, the consolidated financial position of BMP Sunstone Corporation and subsidiaries as of December 31, 2009 and 2008, and the consolidated results of their operations and their cash flows for each of the three years in the period ended December 31, 2009 in conformity with accounting principles generally accepted in the United States of America.
Our audit was conducted for the purpose of forming an opinion on the basic consolidated financial statements taken as a whole. Schedule II is presented for purposes of additional analysis and is not a required part of the basic consolidated financial statements. This schedule has been subjected to the auditing procedures applied in the audit of the basic consolidated financial statements and, in our opinion, is fairly stated in all material respects in relation to the basic consolidated financial statements taken as a whole.
We also have audited, in accordance with the standards of the Public Company Accounting Oversight Board (United States), BMP Sunstone Corporation and subsidiaries’ internal control over financial reporting as of December 31, 2009, based on criteria established in Internal Control—Integrated Framework issued by the Committee of Sponsoring Organizations of the Treadway Commission (COSO) and our report dated March 15, 2010 expressed an unqualified opinion on the effectiveness of the Company’s internal control over financial reporting.
/s/ GRANT THORNTON
Hong Kong
March 15, 2010
F-2
Table of Contents
REPORT OF INDEPENDENT REGISTERED PUBLIC ACCOUNTING FIRM
The Board of Directors
Hong Kong Fly International Health Care Limited:
We have audited the consolidated balance sheet of Hong Kong Fly International Health Care Limited and subsidiary (the “Company”) as of December 31, 2007, and the related consolidated statements of income, shareholders’ equity and comprehensive income, and cash flows for the two-month period ended December 31, 2007. These consolidated financial statements are the responsibility of the Company’s management. Our responsibility is to express an opinion on these consolidated financial statements based on our audit.
We conducted our audit in accordance with the standards of the Public Company Accounting Oversight Board (United States). Those standards require that we plan and perform the audit to obtain reasonable assurance about whether the financial statements are free of material misstatement. An audit includes consideration of internal control over financial reporting as a basis for designing audit procedures that are appropriate in the circumstances, but not for the purpose of expressing an opinion on the effectiveness of the Company’s internal control over financial reporting. Accordingly, we express no such opinion. An audit also includes examining, on a test basis, evidence supporting the amounts and disclosures in the financial statements, assessing the accounting principles used and significant estimates made by management, as well as evaluating the overall financial statement presentation. We believe that our audit provides a reasonable basis for our opinion.
In our opinion, the consolidated financial statements referred to above present fairly, in all material respects, the financial position of Hong Kong Fly International Health Care Limited and subsidiary as of December 31, 2007, and the results of their operations and their cash flows for the two-month period ended December 31, 2007 in conformity with U.S. generally accepted accounting principles.
As described in Note 1(b), on February 18, 2008, BMP Sunstone Corporation, formerly known as Beijing Med-Pharm Corporation, consummated the acquisition of the remaining 51% of the equity interest in the Company, which was not previously owned. The financial statements of the Company do not reflect any adjustments to the assets and liabilities that might subsequently be necessary as a result of this transaction.
/s/ KPMG
Hong Kong, China
March 12, 2008
F-3
Table of Contents
REPORT OF INDEPENDENT REGISTERED PUBLIC ACCOUNTING FIRM
Board of Directors and Shareholders
BMP Sunstone Corporation:
We have audited BMP Sunstone Corporation (a Delaware Corporation) and subsidiaries’ (the “Company”) internal control over financial reporting as of December 31, 2009, based on criteria established in Internal Control—Integrated Framework issued by the Committee of Sponsoring Organizations of the Treadway Commission (COSO). The Company’s management is responsible for maintaining effective internal control over financial reporting and for its assessment of the effectiveness of internal control over financial reporting, included in the accompanying Management’s Report on Internal Control Over Financial Reporting. Our responsibility is to express an opinion on the Company’s internal control over financial reporting based on our audit.
We conducted our audit in accordance with the standards of the Public Company Accounting Oversight Board (United States). Those standards require that we plan and perform the audit to obtain reasonable assurance about whether effective internal control over financial reporting was maintained in all material respects. Our audit included obtaining an understanding of internal control over financial reporting, assessing the risk that a material weakness exists, testing and evaluating the design and operating effectiveness of internal control based on the assessed risk, and performing such other procedures as we considered necessary in the circumstances. We believe that our audit provides a reasonable basis for our opinion.
A company’s internal control over financial reporting is a process designed to provide reasonable assurance regarding the reliability of financial reporting and the preparation of financial statements for external purposes in accordance with generally accepted accounting principles. A company’s internal control over financial reporting includes those policies and procedures that (1) pertain to the maintenance of records that, in reasonable detail, accurately and fairly reflect the transactions and dispositions of the assets of the company; (2) provide reasonable assurance that transactions are recorded as necessary to permit preparation of financial statements in accordance with generally accepted accounting principles, and that receipts and expenditures of the company are being made only in accordance with authorizations of management and directors of the company; and (3) provide reasonable assurance regarding prevention or timely detection of unauthorized acquisition, use, or disposition of the company’s assets that could have a material effect on the financial statements.
Because of its inherent limitations, internal control over financial reporting may not prevent or detect misstatements. Also, projections of any evaluation of effectiveness to future periods are subject to the risk that controls may become inadequate because of changes in conditions, or that the degree of compliance with the policies or procedures may deteriorate.
In our opinion, BMP Sunstone Corporation maintained, in all material respects, effective internal control over financial reporting as of December 31, 2009, based on criteria established in Internal Control—Integrated Framework issued by COSO.
We also have audited, in accordance with the standards of the Public Company Accounting Oversight Board (United States), the consolidated balance sheets of the Company as of December 31, 2009 and 2008, and the related consolidated statements of operations, stockholders’ equity and comprehensive loss, and cash flows for each of the three years in the period ended December 31, 2009 and our report dated March 15, 2010 expressed an unqualified opinion.
/s/ GRANT THORNTON
Hong Kong
March 15, 2010
F-4
Table of Contents
BMP Sunstone Corporation and Subsidiaries
Consolidated Balance Sheets
($ amounts in thousands)
| December 31, 2009 |
December 31, 2008 |
|||||||
| Assets |
||||||||
| Current Assets: |
||||||||
| Cash and Cash Equivalents |
$ | 21,544 | $ | 15,740 | ||||
| Restricted Cash |
1,125 | 1,150 | ||||||
| Notes Receivable |
17,541 | 15,797 | ||||||
| Accounts Receivable, net of allowance for doubtful accounts of $481 and $127, respectively |
37,752 | 30,897 | ||||||
| Inventory, net of allowance for obsolescence of $98 and $0 |
9,811 | 10,184 | ||||||
| Due From Related Parties |
— | 1,834 | ||||||
| Receivable from Alliance Unichem |
7,550 | |||||||
| Other Receivables |
3,648 | 2,168 | ||||||
| VAT Receivable |
1,093 | 921 | ||||||
| Prepaid Expenses and Other Current Assets |
6,322 | 6,247 | ||||||
| Total Current Assets |
106,386 | 84,938 | ||||||
| Property and Equipment, net |
30,967 | 22,840 | ||||||
| Investment in Shengda |
2,950 | — | ||||||
| Investment in Alliance BMP Limited |
— | 15,093 | ||||||
| Investments at cost |
146 | 146 | ||||||
| Goodwill |
70,033 | 69,866 | ||||||
| Other Assets |
405 | 875 | ||||||
| Land Use Rights, net of accumulated amortization |
2,860 | 2,002 | ||||||
| Intangible Assets, net of accumulated amortization |
38,508 | 41,891 | ||||||
| Total Assets |
$ | 252,255 | $ | 237,651 | ||||
| Liabilities and Equity |
||||||||
| Current Liabilities: |
||||||||
| Notes Payable and Bank Borrowings, net of debt discount |
$ | 6,406 | $ | 33,591 | ||||
| Accounts Payable |
24,465 | 27,482 | ||||||
| Due to Related Party |
1,437 | 4,361 | ||||||
| Deferred Revenue |
208 | 128 | ||||||
| Accrued Expenses |
18,478 | 14,601 | ||||||
| Total Current Liabilities |
50,994 | 80,163 | ||||||
| Long-Term Debt, net of debt premium |
36,749 | — | ||||||
| Deferred Taxes |
9,097 | 9,856 | ||||||
| Total Liabilities |
96,840 | 90,019 | ||||||
| Commitments and Contingencies |
— | — | ||||||
| Equity: |
||||||||
| Common Stock, $.001 Par Value; 75,000,000 Shares Authorized; 41,931,987 and 40,246,410 Shares Issued and Outstanding as of December 31, 2009 and December 31, 2008, respectively |
42 | 40 | ||||||
| Additional Paid in Capital |
168,772 | 160,864 | ||||||
| Common Stock Warrants |
8,621 | 9,049 | ||||||
| Accumulated Deficit |
(32,946 | ) | (31,042 | ) | ||||
| Accumulated Other Comprehensive Income |
9,486 | 8,721 | ||||||
| Total BMP Sunstone Corporation Stockholders’ Equity |
153,975 | 147,632 | ||||||
| Non Controlling Interest |
1,440 | — | ||||||
| Total Liabilities and Equity |
$ | 252,255 | $ | 237,651 | ||||
The accompanying notes are an integral part of these consolidated financial statements.
F-5
Table of Contents
BMP Sunstone Corporation and Subsidiaries
Consolidated Statements of Operations
($ amounts in thousands)
| For the Years Ended December 31, |
2009 | 2008 | 2007 | |||||||||
| Net Revenues |
||||||||||||
| Third Parties |
$ | 142,417 | $ | 108,246 | $ | 31,003 | ||||||
| Related Parties |
4,451 | 6,621 | — | |||||||||
| Total Net Revenues |
146,868 | 114,867 | 31,003 | |||||||||
| Cost of Sales |
72,859 | 57,557 | 26,716 | |||||||||
| Gross Profit |
74,009 | 57,310 | 4,287 | |||||||||
| Sales and Marketing Expenses |
47,778 | 39,666 | 4,377 | |||||||||
| General and Administration Expenses |
17,844 | 13,898 | 10,780 | |||||||||
| Total Operating Expenses |
65,622 | 53,564 | 15,157 | |||||||||
| Income (Loss) From Operations |
8,387 | 3,746 | (10,870 | ) | ||||||||
| Other Income (Expense): |
||||||||||||
| Interest Income |
225 | 70 | 620 | |||||||||
| Interest Expense |
(4,430 | ) | (6,301 | ) | (1,047 | ) | ||||||
| Debt Issuance Cost Amortization |
(446 | ) | (840 | ) | (140 | ) | ||||||
| Equity Method Investment Income (Loss) |
25 | 675 | (264 | ) | ||||||||
| Loss on Early Extinguishment of Debt |
(4,573 | ) | — | — | ||||||||
| Gain on Derivatives |
1,204 | — | — | |||||||||
| Other Income |
— | — | 81 | |||||||||
| Total Other Income (Expense) |
(7,995 | ) | (6,396 | ) | (750 | ) | ||||||
| Loss Before Provision For Income Taxes |
392 | (2,650 | ) | (11,620 | ) | |||||||
| Provision For Income Taxes |
2,392 | 792 | 15 | |||||||||
| Net Loss |
$ | (2,000 | ) | $ | (3,442 | ) | $ | (11,635 | ) | |||
| Less: Net Loss Attributable to the Noncontrolling Interest |
96 | — | — | |||||||||
| Net Loss Attributable to BMP Sunstone |
$ | (1,904 | ) | $ | (3,442 | ) | $ | (11,635 | ) | |||
| Basic and Fully-Diluted Loss Per Share |
$ | (0.05 | ) | $ | (0.09 | ) | $ | (0.41 | ) | |||
| Basic Shares Outstanding |
41,398 | 38,617 | 28,120 | |||||||||
| Fully Diluted Shares Outstanding |
48,633 | 39,841 | 29,822 | |||||||||
The accompanying notes are an integral part of these consolidated financial statements.
F-6
Table of Contents
BMP Sunstone Corporation and Subsidiaries
Consolidated Statements of Stockholders’ Equity and Comprehensive Income (Loss)
($ amounts in thousands)
| Common Stock | Additional Paid-in Capital |
Common Stock Warrants |
Accumulated Deficit |
Accumulated Other Comprehensive loss Foreign Currency Translation |
Non Controlling Interest |
Total Stockholder’s Equity |
||||||||||||||||||||||
| Number of Shares |
$.001 Par Value |
|||||||||||||||||||||||||||
| Balance as of December 31, 2006 |
26,522,868 | $ | 26 | $ | 28,041 | $ | 6,371 | $ | (15,965 | ) | $ | 87 | $ | — | $ | 18,560 | ||||||||||||
| Common Stock Issuance in Connection with Private Placement |
3,531,454 | 4 | 32,602 | — | — | — | — | 32,606 | ||||||||||||||||||||
| Costs Incurred in Connection with Stock Issuance |
— | — | (2,004 | ) | — | — | — | — | (2,004 | ) | ||||||||||||||||||
| Stock-Based Compensation |
— | — | 1,734 | — | — | — | — | 1,734 | ||||||||||||||||||||
| Common Stock Warrants Issuance |
— | — | (4,250 | ) | 8,980 | — | — | — | 4,730 | |||||||||||||||||||
| Warrant Exercise |
1,186,591 | 1 | 10,000 | (5,604 | ) | — | — | — | 4,397 | |||||||||||||||||||
| Net Loss |
— | — | — | — | (11,635 | ) | — | — | (11,635 | ) | ||||||||||||||||||
| Other Comprehensive Loss |
||||||||||||||||||||||||||||
| Foreign Currency Translation |
— | — | — | — | — | 621 | — | 621 | ||||||||||||||||||||
| Total Comprehensive Loss |
— | — | — | — | — | — | — | (11,014 | ) | |||||||||||||||||||
| Balance as of December 31, 2007 |
31,240,913 | $ | 31 | $ | 66,123 | $ | 9,747 | $ | (27,600 | ) | $ | 708 | — | $ | 49,009 | |||||||||||||
| Common Stock Issuance in Connection with Acquisition of Sunstone |
8,000,000 | 8 | 88,611 | — | — | — | — | 88,619 | ||||||||||||||||||||
| Common Stock Issuance in Connection with Private Placement |
437,546 | 0 | 2,188 | — | — | — | — | 2,188 | ||||||||||||||||||||
| Costs incurred in Connection with Stock Issuance |
— | — | (186 | ) | — | — | — | — | (186 | ) | ||||||||||||||||||
| Stock Based Compensation |
— | — | 2,438 | — | — | — | — | 2,438 | ||||||||||||||||||||
| Warrant and Option Exercise |
567,951 | 1 | 1,690 | (698 | ) | — | — | — | 993 | |||||||||||||||||||
| Net Loss |
(3,442 | ) | (3,442 | ) | ||||||||||||||||||||||||
| Other Comprehensive Loss |
||||||||||||||||||||||||||||
| Foreign Currency Translation |
— | — | — | — | — | 8,013 | — | 8,013 | ||||||||||||||||||||
| Total Comprehensive Loss |
— | — | — | — | — | — | — | 4,571 | ||||||||||||||||||||
| Balance as of December 31, 2008 |
40,246,410 | 40 | 160,864 | 9,049 | (31,042 | ) | 8,721 | — | 147,632 | |||||||||||||||||||
| Common Stock Issuance in Connection with Private Placement |
1,118,124 | 1 | 2,846 | 731 | — | — | — | 3,578 | ||||||||||||||||||||
| Common Stock Issuance in Connection with Debt Financing |
135,875 | — | 417 | — | — | — | — | 417 | ||||||||||||||||||||
| Costs incurred in Connection with Stock Issuance |
— | (579 | ) | — | — | — | — | (579 | ) | |||||||||||||||||||
| Stock Based Compensation |
— | — | 2,380 | — | — | — | — | 2,380 | ||||||||||||||||||||
| Warrant Exercise |
58,496 | — | 198 | (130 | ) | — | — | — | 68 | |||||||||||||||||||
| Extinguishment of Derivatory Liability |
— | — | 2,897 | — | — | — | — | 2,897 | ||||||||||||||||||||
| Note Conversion |
333,332 | 1 | — | — | — | — | — | 1 | ||||||||||||||||||||
| Option Exercise |
39,750 | — | 1,095 | — | — | — | — | 1,095 | ||||||||||||||||||||
| Common Stock Warrants Issuance |
(839 | ) | (839 | ) | ||||||||||||||||||||||||
| Common Stock Warrants |
— | — | 1,029 | (1,029 | ) | — | — | — | ||||||||||||||||||||
| Non Controlling Interest |
— | — | (1,536 | ) | — | — | — | 1,536 | — | |||||||||||||||||||
| Net Loss |
— | — | — | — | (1,904 | ) | (96 | ) | (2,000 | ) | ||||||||||||||||||
| Other Comprehensive Loss |
||||||||||||||||||||||||||||
| Foreign Currency Translation |
— | — | — | — | — | 765 | 765 | |||||||||||||||||||||
| Total Comprehensive Loss |
— | — | — | — | — | — | — | (1,235 | ) | |||||||||||||||||||
| Balance as of December 31, 2009 |
41,931,987 | $ | 42 | $ | 168,772 | $ | 8,621 | $ | (32,946 | ) | $ | 9,486 | $ | 1,440 | $ | (155,415 | ) | |||||||||||
The accompanying notes are an integral part of these consolidated financial statements.
F-7
Table of Contents
BMP Sunstone Corporation and Subsidiaries
Consolidated Statements of Cash Flows
($ in thousands)
| |
For the Years Ended December 31 |
| ||||||||||
| 2009 | 2008 | 2007 | ||||||||||
| Cash Flows from Operating Activities: |
||||||||||||
| Net Loss |
$ | (1,904 | ) | $ | (3,442 | ) | $ | (11,635 | ) | |||
| Adjustments to Reconcile Net Loss to Net Cash (Used) In Operating Activities: |
||||||||||||
| Bad Debt Expense |
354 | 83 | 44 | |||||||||
| Depreciation and Amortization of Property and Equipment |
2,437 | 1,842 | 111 | |||||||||
| Amortization of Intangible Assets, Inventory at Fair Value and Land Use Rights |
3,543 | 4,339 | 256 | |||||||||
| Amortization of Debt Discount and Deferred Debt Issuance Costs |
763 | 3,907 | 651 | |||||||||
| Stock-Based Compensation |
2,380 | 2,438 | 1,734 | |||||||||
| Gain on Fair Value of Derivatives |
(1,204 | ) | — | — | ||||||||
| Loss on Early Extinguishment of Debt |
4,573 | — | — | |||||||||
| Equity Method Investment (Income) Loss |
(25 | ) | (675 | ) | 264 | |||||||
| Loss on Disposal of Asset |
58 | 2 | 20 | |||||||||
| Gain on Disposal of Investment in Alliance BMP |
(7 | ) | — | — | ||||||||
| Non Controlling Interest |
(96 | ) | — | — | ||||||||
| Deferred Taxes |
(782 | ) | (1,380 | ) | — | |||||||
| (Increase) Decrease in Accounts Receivable |
(7,250 | ) | 535 | (4,514 | ) | |||||||
| (Increase) Decrease in Notes Receivable |
(1,703 | ) | 177 | — | ||||||||
| Decrease (Increase) in Inventory |
176 | (3,213 | ) | (928 | ) | |||||||
| Decrease in Due to Related Parties |
(657 | ) | (3,277 | ) | — | |||||||
| Increase in Other Receivables |
(1,457 | ) | (1,718 | ) | (370 | ) | ||||||
| Increase in Value Added Tax Receivable |
(277 | ) | (37 | ) | (231 | ) | ||||||
| Decrease (Increase) in Prepaid Expenses and Other Current Assets |
491 | (1,587 | ) | (1,007 | ) | |||||||
| (Decrease) Increase in Accounts Payable |
(3,480 | ) | 6,857 | 2,720 | ||||||||
| Increase (Decrease) in Deferred Revenue |
80 | (33 | ) | 133 | ||||||||
| Increase (Decrease) in Accrued Expenses |
4,021 | (1,491 | ) | 2,084 | ||||||||
| Net Cash Provided by (Used) in Operating Expenses |
34 | 3,327 | (10,668 | ) | ||||||||
| Cash Flows from Investing Activities |
||||||||||||
| Acquisition payment due to Wanwei Group |
— | — | (214 | ) | ||||||||
| Cash paid for Acquisition Sunstone China |
— | — | (33,107 | ) | ||||||||
| Note Receivable |
— | — | (659 | ) | ||||||||
| Acquisition of Property and Equipment |
(10,553 | ) | (3,292 | ) | (563 | ) | ||||||
| Payments for Land Use Rights |
(901 | ) | — | — | ||||||||
| Cash Received in Acquisitions of Sunstone China and Rongheng |
— | 2,587 | — | |||||||||
| Acquisition of Rongheng |
— | (1,661 | ) | — | ||||||||
| Investment in Shengda |
(2,047 | ) | (867 | ) | — | |||||||
| Investment in Alliance BMP |
— | (12,320 | ) | (2,773 | ) | |||||||
| Proceeds from Disposal of Alliance BMP |
7,550 | — | — | |||||||||
| Net Cash Used In Investing Activities |
(5,951 | ) | (15,553 | ) | (37,316 | ) | ||||||
| Cash Flows from Financing Activities: |
||||||||||||
| Net Proceeds from Common Stock Issuance |
2,999 | 2,002 | 30,603 | |||||||||
| Net Proceeds from Exercise of Warrants and Options |
163 | 968 | 4,397 | |||||||||
| Net Proceeds from Long Term Debt Issuance |
12,031 | — | 17,139 | |||||||||
| Payments on Long Term Debt |
(11,350 | ) | ||||||||||
| Proceeds from Issuance of Warrants |
— | — | 4,731 | |||||||||
| Net Receipts (Payments) on Bank Borrowings |
7,338 | 1,728 | (676 | ) | ||||||||
| Decrease (Increase) in Restricted Cash, net |
25 | 147 | (1,032 | ) | ||||||||
| Net Cash Provided by Financing Activities |
11,206 | 4,845 | 55,162 | |||||||||
| Effect of exchange rate changes on cash |
515 | 284 | 328 | |||||||||
| Net (Decrease) Increase in Cash and Equivalents |
5,804 | (7,097 | ) | 7,506 | ||||||||
| Cash and Equivalents, Beginning |
15,740 | 22,837 | 15,331 | |||||||||
| Cash and Equivalents, Ending |
21,544 | 15,740 | 22,837 | |||||||||
| Supplemental Disclosure of Cash Flow Information: |
||||||||||||
| Cash Paid During the Years for: |
||||||||||||
| Income Taxes |
$ | 3,934 | $ | 3,135 | $ | 0 | ||||||
| Interest |
$ | 3,444 | $ | 3,058 | $ | 131 | ||||||
The accompanying notes are an integral part of these consolidated financial statements.
F-8
Table of Contents
Non-Cash Investing and Financing Activities:
During the year ended December 31, 2009, the Company completed an exchange of $10,650,000 in principal amount of its 10.0% senior secured promissory notes, for $10,650,000 in principal amount of its 12.5% secured convertible notes, pursuant to note exchange agreements by and between the Company and certain holders of the 10.0% Notes.
During the year ended December 31, 2009, the Company completed an exchange of $1,000,000 in principal amount of its 10.0% Notes for the same principal amount of its 12.5% March Exchange Secured Convertible Notes due July 1, 2011, pursuant to a note exchange agreement by and between the Company and certain holders of the 10.0% Notes.
During the year ended December 31, 2007, the Company completed a registered direct public offering and issued common stock warrants for the purchase of 694,111 shares of common stock, and in connection with services provided associated with the registered direct public offering completed August 2007, the Company issued common stock warrants for the purchase of 60,897 shares of common stock. These warrants have been valued using the Black-Scholes option pricing model at $4,379,000.
During the year ended December 31, 2007, the Company, as a part of the issuance of debt, issued common stock purchase warrants to the purchasers of the Debt giving them the right to purchase up to an aggregate of 1,037,580 shares of common stock at an exercise price of $12.43 per share. The relative fair value of these warrants on their date of grant, which was valued at $4,601,000 using the Black-Scholes option pricing model, was recorded as a discount to the underlying debt and as an addition to additional paid-in capital. The discount is being amortized to interest expense over the term of the underlying debt. The Company incurred $1,260,000 debt issuance costs which are being amortized to interest expense over the term of the underlying debt.
F-9
Table of Contents
BMP Sunstone Corporation and Subsidiaries
Notes to the Consolidated Financial Statements
1. Business
BMP Sunstone Corporation, a Delaware corporation, is a specialty pharmaceutical company with over-the-counter (OTC) manufacturing, marketing and distribution based in China. Our corporate headquarters are in suburban Philadelphia and our Chinese operations are based in Beijing, Shanghai and Tangshan. Our services, which we offer through Beijing Medpharm Co. Ltd., or BMP China, Beijing Wanwei Pharmaceutical Co., Ltd., or Wanwei, Shanghai Rongheng Pharmaceutical Company, or Rongheng and Sunstone (Tangshan) Pharmaceutical Co., Ltd, or Sunstone, to foreign and domestic pharmaceutical manufacturers in China, focus primarily on marketing and promotional services and distribution services.
2. Significant Accounting Policies:
Principles of Consolidation: The consolidated financial statements of BMP Sunstone Corporation and Subsidiary (collectively referred to as “the Company”) ) include the accounts of BMP Sunstone Corporation (the “Parent”) and its direct and indirect wholly-owned subsidiaries, Beijing Medpharm Co. Ltd. (“BMP China”), Beijing Wanwei Pharmaceutical Co., Ltd. (“Wanwei”), Sunstone China Limited (formerly named Hong Kong Fly International Health Care Limited) (“Sunstone China”), the 100% owner of Sunstone (Tangshan) Pharmaceutical Co., Ltd (“Sunstone”), Shanghai Rongheng Pharmaceutical, Ltd (“Rongheng”), Dejee Company Limited and BMP Sunstone Corporation Beijing Representative Office. All significant inter-company balances and transactions have been eliminated in consolidation. For investments in which the Company owns less than 20% of the voting shares or does not have significant influence, the cost method of accounting is used. Under the cost method of accounting, the Company does not record its share in the earnings and losses of the companies in which it has an investment.
Cash and Equivalents and Restricted Cash: The Company maintains a cash management program, which provides for the investment of excess cash balances primarily in short-term money market instruments and investments, which, at times, may exceed federally insured limits. The Company considers such highly liquid investments with original maturities of three months or less when purchased to be cash equivalents.
The Company maintains certain bank accounts in the PRC which are not protected by FDIC insurance or other insurance. Cash balance held in PRC bank accounts to $18,905,000 and $15,351,000 as of December 31, 2009 and 2008, respectively. As of December 31, 2009 and 2008, the Company held $2,638,000 and $388,000 of cash balances within the United States of which $2,138,000 at December 31, 2009 was in excess of FDIC insurance limits.
In 2007, the Company issued an aggregate of $23,000,000 principal amount of 10% Senior Secured Debt (the Debt) due May 1, 2009. As part of the debt agreement the Company was required to hold 6 months interest in a designated escrow account totaling $1,150,000 until the repayment of the loan. The loan was extinguished in 2009 and the amount is no longer restricted.
In 2009, the Company issued an aggregate of $25,000,000 principal amount of long term debt due July 1, 2011. As part of the debt agreements, the Company is required to hold 6 months interest in a designated escrow account totaling $1,125,000. Restricted cash is unavailable to the Company until certain contractual terms and conditions are met.
Notes Receivable: The Company receives notes receivable for the settlement of trade receivables balances. Notes receivables are notes received from customers for the settlement of trade receivable balances. All notes receivable are issued by established banks in the People’s Republic of China, and these notes are irrevocable and transferrable, and have a maturity of six months or less. During the year ended December 31, 2009 the Company recorded $742,000 in interest expenses for notes which were discounted prior to maturity.
F-10
Table of Contents
BMP Sunstone Corporation and Subsidiaries
Notes to Consolidated Financial—(Continued)
Trade Accounts Receivable and Concentration of Credit Risk: Financial instruments that potentially subject the Company to concentration of credit risk consist primarily of accounts receivable. Accounts receivable are stated at the amount management expects to collect from outstanding balances. The Company performs ongoing credit evaluations of its customers and generally requires no collateral to secure accounts receivable. The Company maintains an allowance for potentially uncollectible accounts receivable based upon its assessment of the collectability of accounts receivable.
Inventory: Inventory at Sunstone is stated at the lower of cost or market value. Cost is determined using the weighted average cost method. Cost of work-in-progress and finished goods are comprised of direct materials, direct labor and related manufacturing overhead based on normal operating capacities. Inventory of distribution products is stated at the lower of cost or market. Cost is determined on a standard cost basis that approximates actual cost on the first-in, first-out (FIFO) method. Market is determined based on net realizable value. Appropriate consideration is given to obsolescence, excessive levels, deterioration, and other factors in evaluating net realizable value.
Property and Equipment: Property and equipment are recorded at cost, and consist of office equipment, furniture and fixtures, vehicles and leasehold improvements. Depreciation and amortization is calculated using the straight-line method over the estimated useful lives of the related assets.
Investment in Sunstone China and Shengda: Our 49% investment in Sunstone China is included in our financial statements under the equity method of accounting for the period November 1, 2007 through February 17, 2008. The difference between the cost of our investment and our proportionate share of the equity in the underlying net assets is accounted for under the purchase method of accounting. Under the purchase method of accounting we allocate the purchase price to the net assets acquired in the transaction at their respective estimated fair market values. The premium we paid, representing the excess cost over the underlying fair value of our proportionate share of the net assets acquired, is referred to as equity method goodwill. The excess cost over book value of net assets acquired not representing trademarks and goodwill is amortized over the estimated useful life of acquired assets (with definitive useful lives) against our share of investee earnings. On February 18, 2008, the Company acquired the remaining 51% of Sunstone for eight million shares of BMP’s common stock. For more information on our 51% acquisition of Sunstone China, see Note 3.
For our 50% investment in Zhangjiakou Shengda Pharmaceutical Co., Ltd (“Shengda) that was not fully consolidated is included in our financial statements under the equity method of accounting for the period February 17, 2009 through December 31, 2009. The difference between our cost of our investment and our proportionate share of the equity in the underlying net assets is accounted for under the purchase method of accounting. Under the purchase method of accounting we allocate the purchase price to the net assets acquired in the transaction at their respective estimated fair market values. The excess cost over book value of net assets acquired is amortized over the estimated useful life of acquired assets (with definitive useful lives) against our share of investee earnings.
Land Use Rights: Land use rights represent the exclusive right to occupy and use a piece of land in the PRC during the contractual term of the land use right. Land use rights are carried at cost and charged to expense on a straight line basis over the respective periods of the rights.
Goodwill and Intangible Assets: The Company performs tests of goodwill to determine if impairment has occurred. Intangible assets are primarily an allocation of a portion of the purchase price in connection with the Sunstone China, Wanwei and Rongheng acquisitions to the following identifiable intangible assets: Favorable Contracts, Customer Relationships and Trademarks. The Company evaluates the recoverability of identifiable intangible assets whenever events or changes in circumstances indicate that an intangible asset’s carrying amount
F-11
Table of Contents
BMP Sunstone Corporation and Subsidiaries
Notes to Consolidated Financial—(Continued)
may not be recoverable. Such circumstances could include, but are not limited to: (1) a significant decrease in the market value of an asset, (2) a significant adverse change in the extent or manner in which an asset is used, or (3) an accumulation of costs significantly in excess of the amount originally expected for the acquisition of an asset. The Company measures the carrying amount of the asset against the estimated undiscounted future cash flows associated with it. Should the sum of the expected future net cash flows be less than the carrying value of the asset being evaluated, an impairment loss would be recognized. The impairment loss would be calculated as the amount by which the carrying value of the asset exceeds its fair value. The estimate of fair value is based on various valuation techniques, including the discounted value of estimated future cash flows. The evaluation of asset impairment requires the Company to make assumptions about future cash flows over the life of the asset being evaluated. These assumptions require significant judgment and actual results may differ from assumed and estimated amounts.
Debt Issuance Costs: The Company defers debt issuance costs and amortizes the amount over the life of debt on a straight-line basis which approximates the effective interest method. The unamortized debt issuance cost was $718,000 and $280,000 as of December 31, 2009 and 2008. A total of $446,000 and $840,000 of debt issuance costs had been amortized for the years ended December 31, 2009 and 2008.
Revenue Recognition: The Company recognizes sales and related cost of sales at Sunstone when persuasive evidence of an arrangement exists, delivery has occurred, the price is fixed or determinable, and collectability is reasonably assured. Written sales agreements and customer purchase orders are used as evidence of the terms of the arrangements. Products are considered delivered when the product is received by the customer at its or a designated location, which is the point when the customer takes ownership and assumes risk of loss. The Company’s sales agreements do not provide the customer the right of return, unless the products are defective in which case the Company allows for an exchange of products.
The Company recognizes distribution sales and related cost of sales at the later of (a) the time of shipment or (b) when title passes to the customers, provided that there is evidence of a final arrangement, there are no uncertainties surrounding acceptance, collectability is probable and the price is fixed. Revenues are comprised of gross sales less provisions for estimated customer returns, discounts, vendor payments and volume rebates. Amounts billed to a customer for shipping and handling are reported as revenue.
During the years ended December 31, 2009, 2008 and 2007, shipping and handling expenses incurred by the Company amounted to approximately $2,506,000, $1,668,000 and $265,000 respectively are expensed as cost of sales in the period when the sale occurs.
The Company provides comprehensive marketing and promotion services to manufacturers under exclusive agreements for specified pharmaceuticals, which are distributed through distribution agreements between the manufacturers and the distribution provider. The Company has also entered into separate cooperation agreements with the distributor. The Company recognizes revenue, net of returns, on products delivered by the distribution provider at the time of delivery, provided that there is evidence of a final arrangement, there are no uncertainties surrounding acceptance, collectability is probable and the price is fixed. Under the terms of the agreements, revenues are generally receivable within 90 days of delivery. We estimate the reserve for product returns at the time revenue is recognized based on various market data, historical trends, and information from customers.
The Company also provides clinical and regulatory services, which include pre-market entry analysis and product registration services. Fees for such services are contractually fixed, with payment schedules generally defined in accordance with significant milestones of the contracted service. Revenue is recognized as the services are provided, and payments received in advance of such services are recorded as deferred revenue until such time the services are completed.
F-12
Table of Contents
BMP Sunstone Corporation and Subsidiaries
Notes to Consolidated Financial—(Continued)
Sales revenue represents the invoiced value of goods, net of a value-added tax (“VAT”). All of the Company’s products that are sold in the PRC are subject to a Chinese VAT at a rate of 17% of the gross sales price or at a rate approved by the Chinese local government. This VAT may be offset by VAT paid by the Company on raw materials and other materials included in the cost of producing its finished product. The VAT amounts paid and available for offset are maintained in current liabilities.
Foreign Currency Translation: The accounts of the Company’s foreign subsidiary are translated based upon the determination that he functional currency of its subsidiary should be their local currency, the Chinese RenMinBi (RMB). The translations of the functional currency financial statements of its subsidiary into United States reporting currency are performed for assets and liabilities denominated in foreign currencies using the closing exchange rates in effect at the balance sheet dates. Income statement amounts are translated using the average exchange rate during the year. Gains and losses resulting from foreign currency exchange rates changes from the prior year are reported separately as accumulated other comprehensive income foreign currency translation in stockholders’ equity.
Income Taxes: The Company follows an asset and liability approach to financial accounting and reporting for income taxes. Deferred income tax assets and liabilities are computed annually for differences between the financial statement and tax bases of assets and liabilities that will result in taxable or deductible amounts in the future based on enacted tax laws and rates applicable to the periods in which the differences are expected to affect taxable income. Valuation allowances are established when necessary to reduce deferred tax assets to the amounts expected to be realized. Income tax expense is the tax payable or refundable for the period plus or minus the change during the period in deferred tax assets and liabilities.
The Company recognizes the financial statement benefits of a tax position only after determining that the relevant tax authority would more likely than not sustain the position following an audit. For tax positions meeting the more-likely-than-not threshold, the amount recognized in the financial statements is the largest benefit that has a greater than 50 percent likelihood of being realized upon ultimate settlement with the relevant tax authority.
The amount of unrecognized tax benefits as of December 31, 2009 was $941, which, if ultimately recognized, will reduce the Company’s annual effective tax rate. The Company does not expect any material change in unrecognized tax benefits within the next twelve months.
The change in unrecognized tax benefits for the 12 months ended December 31, 2009 is as follows:
| ($ amount in thousands) | |||
| Balance at January 1, 2009 |
$ | 834 | |
| Increase for tax positions related to the current year |
107 | ||
| Balance at December 31, 2009 |
$ | 941 | |
The Company is subject to income taxes in the U.S. Federal jurisdiction, and various state and foreign jurisdictions. Tax regulations within each jurisdiction are subject to the interpretation of the related tax laws and regulations and require significant judgment to apply. This evaluation was performed for tax years ended December 31, 2009, 2008, 2007 and 2006, the tax years which remain subject to examination by major tax jurisdictions. The Company is not currently under examination by U.S. Federal and state tax authorities or any foreign jurisdiction.
F-13
Table of Contents
BMP Sunstone Corporation and Subsidiaries
Notes to Consolidated Financial—(Continued)
The Company recognizes interest accrued related to unrecognized tax benefits as interest expense and penalties accrued in operating expenses, if any, for all periods presented. The Company has not accrued interest and penalties related to unrecognized tax benefits as of December 31, 2009.
Fair Value of Financial Instruments: Cash, accounts receivable, accounts payable, accrued liabilities and debt are reflected in the financial statements at carrying amounts which approximate fair value.
Earnings Per Share: The Company calculates basic earnings per share based on the weighted-average number of outstanding common shares and incremental shares. The Company calculates diluted earnings per share based on the weighted-average number of outstanding common shares plus the effect of dilutive stock options and other incremental shares. Common stock equivalents have been excluded from the diluted per share calculations as of December 31, 2009, 2008 and 2007, as the Company has incurred a net loss during each of the years then ended, and their inclusion would have been anti-dilutive.
Advertising Costs: The Company expenses advertising costs as incurred. For the years ended December 31, 2009, 2008 and 2007 the Company incurred $12,124,000, $7,473,000 and $5,000 in advertising expenses, respectively.
Research and Development: The Company engages in research and development activities through independent research and development and cooperation with research institutions in China. For the years ended December 31, 2009 and 2008 the Company incurred expenses of $1,906,000 and $237,000 in research and development, respectively. The Company did not have any research and development expenses for the year ended December 31, 2007.
Use of Estimates: Management has used estimates and assumptions relating to the reporting of assets and liabilities and the disclosure of contingent assets and liabilities in its preparation of the consolidated financial statements in accordance with accounting principles generally accepted in the United States. Actual results experienced by the Company may differ from those estimates.
Milestone Payments: The Company enters into licensing agreements with various third parties that involve the provision of funding and/or payments for the achievement of milestones. Since development projects are subject to regulatory approval procedures and other uncertainties, the conditions for the capitalization of costs incurred before approvals are received are not satisfied, and these costs are, therefore, expensed as incurred.
Stock-Based Compensation: The Company has a stock-based employee compensation plan, the 2007 Omnibus Equity Compensation Plan (which merged with the 2004 Stock Incentive Plan as of April 26, 2007) (the “Plan”), which provides for the issuance of stock options, stock appreciation rights, restricted stock, restricted stock units, performance awards, other stock grants and other equity-based awards (See Note 17).
Recent Accounting Pronouncements:
In June 2009, the Financial Accounting Standards Board (the “FASB”) issued the FASB Accounting Standards Codification (the “Codification”). The Codification has become the single source for all authoritative GAAP recognized by the FASB to be applied for financial statements issued for periods ending after September 15, 2009. We adopted the Codification in 2009 and it did not have an effect on our financial position or results of operations.
On January 1, 2008, the Company adopted a new accounting standard regarding fair value measurements as it relates to financial assets and financial liabilities. In February 2008, the FASB issued new accounting
F-14
Table of Contents
BMP Sunstone Corporation and Subsidiaries
Notes to Consolidated Financial—(Continued)
guidance, which delayed the effective date of the standard for all nonfinancial assets and nonfinancial liabilities, except those that are recognized or disclosed at fair value in the financial statements on at least an annual basis, until January 1, 2009 for calendar year-end entities.
The standard defines fair value, establishes a framework for measuring fair value in accordance with GAAP, and expands disclosures about fair value measurements. The provisions of this standard apply to other accounting pronouncements that require or permit fair value measurements and are to be applied prospectively with limited exceptions. The adoption of the standard, as it relates to financial assets and financial liabilities, had no significant impact on the Company’s financial statements. Management has adopted the standard as of the effective date, as it relates to nonfinancial assets and nonfinancial liabilities and there was no significant impact on the Company’s financial statements. The standard establishes a fair value hierarchy that prioritizes observable and unobservable inputs used to measure fair value into three broad levels, which are described below:
Level 1—Unadjusted quoted prices in active markets that are accessible at the measurement date for identical, unrestricted assets or liabilities.
Level 2—Inputs other than quoted prices included within Level 1 that are observable for the asset or liability, either directly or indirectly, including quoted prices for similar assets or liabilities in active markets; quoted prices for identical or similar assets or liabilities in markets that are not active; inputs other than quoted prices that are observable for the asset or liability (e.g., interest rates); and inputs that are derived principally from or corroborated by observable market data by correlation or other means.
Level 3—Inputs that are both significant to the fair value measurement and unobservable.
In October 2008, the FASB issued new accounting guidance which clarifies prior guidance regarding the application of fair value in a market that is not active and provides an example to illustrate key considerations in determining the fair value of a financial asset when the market for that financial asset is not active. The standard is effective upon issuance, including prior periods for which financial statements have not been issued. The Company adopted the standard for the period ended December 31, 2008 and the adoption did not have any significant impact on its consolidated balance sheets, statements of operations, or disclosures.
The fair value of cash equivalents and restricted cash was $22.7 million at December 31, 2009. These financial instruments are classified in Level 1 of the fair value hierarchy described above.
In December 2007, the FASB issued new accounting guidance regarding how an entity accounts for the acquisition of a business. The standard carries forward the existing requirements to account for all business combinations using the acquisition method (formerly called the purchase method). In general, the standard requires acquisition-date fair value measurement of identifiable assets acquired, liabilities assumed, and noncontrolling interests in the acquiree. The standard eliminates the cost-based purchase method.
The new measurement requirements result in the recognition of the full amount of acquisition-date goodwill, which includes amounts attributable to noncontrolling interests. The acquirer recognizes in income any gain or loss on the remeasurement to acquisition-date fair value of consideration transferred or of previously acquired equity interests in the acquiree. Neither the direct costs incurred to effect a business combination nor the costs the acquirer expects to incur under a plan to restructure an acquired business may be included as part of the business combination accounting. As a result, those costs are charged to expense when incurred, except for debt or equity issuance costs, which are accounted for in accordance with other generally accepted accounting principles.
F-15
Table of Contents
BMP Sunstone Corporation and Subsidiaries
Notes to Consolidated Financial—(Continued)
The standard also changes the accounting for in-process research and development, and restructuring costs. In addition, after the standard is adopted, changes in uncertain tax positions or valuation allowances for deferred tax assets acquired in a business combination are recognized as adjustments to income tax expense or contributed capital, as appropriate, even if the deferred tax asset or tax position was initially acquired prior to the effective date of the standard. The Company adopted the standard as of the required effective date of January 1, 2009. The adoption of the standard did not have any significant impact on the Company’s consolidated balance sheets, statement of operations or disclosures.
In April 2008, the FASB issued accounting guidance which amends the factors that should be considered in developing the renewal or extension assumptions used to determine the useful life of a recognized intangible asset under a previously issued standard with regards to Goodwill and Other Intangible Assets. This standard also requires expanded disclosure related to the determination of intangible asset useful lives. The standard is effective for fiscal years beginning after December 15, 2008. The Company has adopted the standard as of the required effective date of January 1, 2009 and the adoption did not have any significant impact on its consolidated balance sheets, statements of operations, or disclosures.
In June 2008, the FASB issued new accounting guidance which specifies that a contract that would otherwise meet the definition of a derivative but is both (a) indexed to the Company’s own stock and (b) classified in stockholders’ equity in the statement of financial position would not be considered a derivative financial instrument. The standard provides a new two-step model to be applied in determining whether a financial instrument or an embedded feature is indexed to an issuer’s own stock and thus able to qualify for the standard’s scope exception. This standard is effective for financial statements issued for fiscal years beginning after December 15, 2008, and interim periods within those fiscal years. Early application is not permitted. The Company has adopted this standard as of January 1, 2009 in its evaluation of its derivatives.
In March 2008, the FASB issued accounting guidance which requires companies with derivative instruments to disclose information about how and why the company used derivative instruments; how the company accounts for derivative instruments and related hedged items; and how derivative instruments and related hedged items affect the company’s financial position, financial performance, and cash flows. The expanded disclosure guidance also requires a company to provide information about its strategies and objectives for using derivative instrument; disclose credit-risk-related contingent features in derivative agreements and information about counterparty credit risk; and present the fair value of derivative instruments and related gains or losses in a tabular format. The Company adopted the standard as of the required effective date of January 1, 2009 and applied its provisions prospectively by providing the additional disclosures in its financial statements.
In April 2009, the FASB issued new accounting guidance requiring disclosures about the fair value of financial instruments in interim as well as in annual financial statements. The adoption of this standard has resulted in additional disclosures only in our interim financial statements, and therefore did not impact our financial position, results of operations or cash flows. The Company has adopted the standard as of the required effective date of June 15, 2009. See Note 11 for discussion of fair value measurements of our derivative instruments.
In May 2009, the FASB issued new accounting guidance which provided accounting and disclosure requirements for subsequent events. This standard introduces new terminology, defines a date through which management must evaluate subsequent events, and lists the circumstances under which an entity must recognize and disclose events or transactions occurring after the balance-sheet date. The Company adopted this standard as of June 30, 2009, which was the required effective date.
F-16
Table of Contents
BMP Sunstone Corporation and Subsidiaries
Notes to Consolidated Financial—(Continued)
In August 2009, the FASB issued new accounting guidance amending “Accounting for Redeemable Equity Instruments.” This standard represents an update to prior accounting guidance regarding the Classification and Measurement of Redeemable Securities. We have evaluated this new standard and have determined that it will not have a significant impact on the determination or reporting of our financial results.
In August 2009, the FASB issued new accounting guidance amending the fair value measurement of liabilities. The guidance provided in this standard is effective for the first reporting period (including interim periods) beginning after issuance. We have evaluated this new standard and have determined that it will not have a significant impact on the determination or reporting of our financial results.
In December 2009, the FASB issued new accounting guidance which amends the Codification as a result of the FASB’s issuance of “Amendments to FASB Interpretation No. 46(R)” during June of 2009. This amendment requires an enterprise to perform an analysis to determine whether the enterprise’s variable interest or interests give it a controlling financial interest in a variable interest entity. This guidance requires ongoing reassessments of whether an enterprise is the primary beneficiary of a variable interest entity. This amendment eliminates the quantitative approach previously required for determining the primary beneficiary of a variable interest entity, which was based on determining which enterprise absorbs the majority of the entity’s expected losses, receives a majority of the entity’s expected residual returns, or both. This guidance requires enhanced disclosures that will provide users of financial statements with more transparent information about an enterprise’s involvement in a variable interest entity. This amendment is effective as of the beginning of each reporting entity’s first annual reporting period that begins after November 15, 2009, for interim periods within that first annual reporting period, and for interim and annual reporting periods thereafter. Earlier application is prohibited. We are in the process of evaluating this new guidance, and assessing its impact on the determination or reporting of our financial results.
In January 2010, the FASB issued new accounting guidance which provides amendments to “Consolidation – Overall” and related guidance within U.S. GAAP to clarify the scope of the decrease in ownership provisions of the Subtopic and related guidance. The amendments also clarify that the decrease in ownership guidance does not apply to certain transactions even if they involve businesses. The guidance is effective beginning in the first interim or annual reporting period ending on or after December 15, 2009. We have evaluated this new guidance, and have determined that it will not have a significant impact on the determination or reporting of our financial results.
In January 2010, the FASB issued new accounting guidance which amend “Fair Value Measurements and Disclosures” that will provide more robust disclosures about (1) the different classes of assets and liabilities measured at fair value, (2) the valuation techniques and inputs used, (3) the activity in Level 3 fair value measurements, and (4) the transfers between Levels 1, 2, and 3. The new disclosures and clarifications of existing disclosures are effective for interim and annual periods beginning after December 15, 2009, except for certain disclosures which are effective for fiscal years beginning after December 15, 2010, and for interim periods within those fiscal years. We are in the process of evaluating this new guidance and assessing its impact on the determination of reporting of our financial results.
Reclassifications: Certain reclassifications have been made to prior year balances in order to conform to the current presentation.
3. Acquisitions:
On October 31, 2007, the Company acquired 49% of the issued share capital of Sunstone China Limited (“Sunstone China”), a Hong Kong corporation, which holds 100% of the equity interests of Sunstone (Tangshan)
F-17
Table of Contents
BMP Sunstone Corporation and Subsidiaries
Notes to Consolidated Financial—(Continued)
Pharmaceutical Co., Ltd. (“Sunstone”), for cash consideration of $32 million, plus direct acquisition costs of $1.1 million. Sunstone is a manufacturer of primarily over-the-counter (OTC) medicines, with operations in Tangshan, Hebei Province, People’s Republic of China. The acquisition has been accounted for under the purchase method of accounting. The purchase price was allocated to the net assets of Sunstone China, based upon their estimated fair values as of the date of purchase, as estimated by management.
The following table summarizes the allocation of the purchase price for the proportionate share of Sunstone China’s net assets acquired at fair value:
| ($ amount in thousands) | |||
| Purchase Price |
$ | 33,107 | |
| Less: Fair value of identifiable assets acquired: |
|||
| Cash |
1,986 | ||
| Accounts receivable |
5,285 | ||
| Accounts receivable from related parties |
610 | ||
| Bills receivable |
6,042 | ||
| Inventory |
2,298 | ||
| Prepaid expenses and other assets |
569 | ||
| Restricted cash |
65 | ||
| Due from related parties |
263 | ||
| Deferred income taxes |
64 | ||
| Buildings |
2,740 | ||
| Land use rights |
967 | ||
| Fixed assets other than buildings |
6,465 | ||
| 27,354 | |||
| Plus: Fair value of liabilities assumed: |
|||
| Borrowings |
5,795 | ||
| Accounts Payable |
1,133 | ||
| Accrued liabilities and other payables |
5,262 | ||
| Income tax payable |
1,140 | ||
| Due to related parties |
1,738 | ||
| 15,068 | |||
| Excess of cost over fair value of net assets acquired intangible assets and goodwill |
$ | 20,821 | |
F-18
Table of Contents
BMP Sunstone Corporation and Subsidiaries
Notes to Consolidated Financial—(Continued)
Goodwill and the intangible assets are not deductible for tax purposes. The intangible assets, except for indefinite-life trademarks and goodwill, are being amortized over estimated useful lives from the date of acquisition and was recorded against our equity in earnings. The following table provides a reconciliation of our equity method investment loss for the period November 1, 2007 through December 31, 2007. Prior to purchase accounting adjustments Sunstone China generated net income of $1,829,000, or $896,000 for our 49% equity ownership. The total amortization for the period was $1,160,000 which resulted in a equity method investment loss of $264,000.
| ($ amount in thousands) | ||||
| Equity in earnings of Sunstone China for the two months ending December 31, 2007 |
$ | 896 | ||
| Less adjustments of excess fair value: |
||||
| Inventory sold |
(991 | ) | ||
| Depreciation expense on buildings |
(2 | ) | ||
| Amortization expense of intangible assets, including land use rights |
(167 | ) | ||
| (1,160 | ) | |||
| Total equity method investment loss after amortization |
$ | (264 | ) | |
On February 18, 2008, the Company acquired the remaining 51% of Sunstone China for eight million shares of BMP’s common stock, valued at approximately $94.7 million (based upon the average quoted prices of our stock for two days prior to the agreement, the day of the agreement and two days subsequent to the agreement).
The following table provides a reconciliation of our equity method investment income for the period January 1, 2008 through February 17, 2008. Prior to purchase accounting adjustments, Sunstone China generated net income of $2,104,000, or $1,031,000 for our 49% equity ownership. The total amortization for the period was $356,000 which resulted in a equity method investment income of $675,000.
| ($ amounts in thousands) | ||||
| Equity in earnings of Sunstone China for period January 1 through February 17, 2008 |
$ | 1,031 | ||
| Less adjustments of excess fair value: |
||||
| Amortization expense of intangible assets |
(356 | ) | ||
| (356 | ) | |||
| Total equity method investment income after amortization |
$ | 675 | ||
The acquisition of Sunstone has been accounted for as a step acquisition business combination in fiscal year 2008. We have allocated our investment basis to our pro rata share of Sunstone’s assets and liabilities at each significant acquisition date based on the estimated fair values of such assets and liabilities on such dates, and the excess of our investment basis over the adjusted estimated fair values of such identifiable net assets has been allocated to goodwill. For financial reporting purposes, we have accounted for Sunstone using the equity method through February 17, 2008, and as a consolidated subsidiary thereafter.
F-19
Table of Contents
BMP Sunstone Corporation and Subsidiaries
Notes to Consolidated Financial—(Continued)
The following table summarizes the allocation of the 51% purchase price for the proportionate share of Sunstone China’s net assets acquired at fair value at the date of acquisition:
| ($ amounts in thousands) | |||
| Purchase Price |
|||
| Value of shares to acquire 51% of Sunstone China |
$ | 88,619 | |
| Direct acquisition costs |
570 | ||
| $ | 89,189 | ||
| Less: Fair Value of identifiable assets acquired: |
|||
| Cash |
1,075 | ||
| Accounts receivable |
6,872 | ||
| Bills Receivable |
7,768 | ||
| Inventory |
2,003 | ||
| Prepaid expenses and other assets |
932 | ||
| Due from related parties |
1,016 | ||
| Deferred income taxes |
165 | ||
| Land use rights |
1,045 | ||
| Fixed assets |
9,913 | ||
| 30,789 | |||
| Plus: Fair value of liabilities assumed: |
|||
| Borrowings |
4,725 | ||
| Accounts payable |
2,444 | ||
| Accrued liabilities and other payables |
6,757 | ||
| Due to related parties |
2,275 | ||
| Deferred tax liability |
11,009 | ||
| 27,210 | |||
| Excess of cost over fair value of net assets acquired-intangible assets and goodwill |
$ | 85,610 | |
The excess cost over the fair value of the net assets acquired has been allocated to identifiable assets as of the date of the acquisition with the remaining amount of $63,547,000 carried as goodwill.
Acquisition of Rongheng
On July 4, 2008, the Company completed its acquisition of 63.3 percent of Rongheng. Rongheng is a pharmaceutical distribution company which distributes over 400 pharmaceutical products to more than 140 top-tier hospitals and 1,000 retail pharmacies in Shanghai. Rongheng was founded in 1999 by CAS Shanghai Shenglongda Biotech Group, Ltd. Co., a high-tech biomedical group focused on research and development, marketing and sales of new biotechnology and pharmaceuticals in China, and Orient International (Holding) Co., one of the largest foreign trade enterprises in China. Shanghai Rongheng International Trade Co., Ltd. of Orient International (Holding) Co., CAS Shanghai Shenglongda Biotech Group and one other individual own the remaining 36.7 percent of Rongheng.
In acquiring its 63.3 percent interest in Rongheng, the Company exchanged cash consideration of $1.6 million, of which $0.9 million was used to purchase shares in Rongheng and the remainder functioned as a capital injection, plus direct acquisition costs of $0.1 million. The acquisition has been accounted for under the purchase method of accounting.
F-20
Table of Contents
BMP Sunstone Corporation and Subsidiaries
Notes to Consolidated Financial—(Continued)
We have allocated our investment basis to our pro rata share of Rongheng’s assets and liabilities as of the acquisition date based on the estimated fair values of such assets and liabilities on such date, and the excess of our investment basis over the adjusted estimated fair values of such identifiable net assets has been allocated to goodwill. For financial reporting purposes, we have accounted for Rongheng as a consolidated subsidiary from July 5, 2008 through December 31, 2008.
The following table summarizes the allocation of the July 4, 2008 acquisition of the 63.3% purchase price for the proportionate share of Rongheng’s net assets acquired at fair value at the date of acquisition:
| ($ amount in thousands) | |||
| Purchase price: |
|||
| Value of shares to acquire 63.3% of Rongheng |
$ | 880 | |
| Cash Consideration |
735 | ||
| Direct acquisition costs |
46 | ||
| $ | 1,661 | ||
| Less: Fair value of identifiable assets acquired: |
|||
| Cash and equivalents |
455 | ||
| Accounts receivable |
3,973 | ||
| Inventory |
1,495 | ||
| Prepaid expenses and other assets |
246 | ||
| Fixed assets |
49 | ||
| 6,218 | |||
| Plus: Fair value of liabilities assumed: |
|||
| Current liabilities |
7,094 | ||
| Excess of cost over fair value of net assets acquired — intangible assets and goodwill |
$ | 2,537 | |
The excess of cost over fair value of the net assets acquired of $2.5 million has been allocated to customer relationships in the amount of $0.2 million as of the date of the acquisition, with the remaining amount of $2.3 million allocated to goodwill. Customer relationships have a weighted average amortization period of 10 years.
Acquisition of Guangzhou Pharmaceuticals Corporation
On January 28, 2008, Alliance BMP Limited (“Alliance BMP”), an investment vehicle based in the United Kingdom that is 80 percent-owned by Alliance Boots Ltd. and 20 percent-owned by us, completed its acquisition of a 50 percent stake in Guangzhou Pharmaceuticals Corporation. The investment was accounted for under the cost method of accounting. Our total investment in Alliance BMP was $15.1 million. The remaining 50 percent ownership of Guangzhou Pharmaceuticals Corporation is retained by a Hong Kong and Shanghai Exchange-listed company.
On August 3, 2009, the Company entered into a Share Purchase Agreement with Alliance UniChem Group Limited for the sale of the Company’s 20% ownership of Alliance BMP Limited (“Alliance BMP”), an investment vehicle based in the United Kingdom, for $15,100,000. The Company recorded Alliance BMP under the cost method investment and prior to the sale Alliance BMP did not record any impairment charges relating to this investment. The Company received $7,550,000 during the year ended December 31, 2009, and the remaining balance of $7,550,000, representing 50% percent of the total consideration, is due in August 2010. The Company recognized a gain on the sale of $7,000 for the year ended December 31, 2009.
F-21
Table of Contents
Sunstone Corporation and Subsidiaries
Notes to Consolidated Financial—(Continued)
Acquisition of Zhangjiakou Shengda Pharmaceutical Co., Ltd
On December 19, 2008, Sunstone entered into an Equity Transfer Agreement with Beijing Penn Pharmaceutical Sci-Tech Development Co., Ltd. (“Beijing Penn”) to purchase 50% of the outstanding equity interests of Zhangjiakou Shengda Pharmaceutical Co., Ltd. (“Shengda”) for RMB 20.0 million (or $2,920,000 as of February 16, 2009) in cash. On February 16, 2009 we received the business license of Shengda and closed on the acquisition. Shengda has changed its name to Sunstone Shengda (Zhangjiakou) Pharmaceutical Co., Ltd.
The purchase price is payable in installments:
| • | RMB 6 million (or $875,000 as of December 31, 2008) was payable within 15 business days following the signing of the Equity Transfer Agreement and was paid as of December 31, 2008; |
| • | RMB 14 million (or $2,050,000 as of December 30, 2009) was payable in five equal installments on the second, fourth, sixth, eighth and tenth month anniversary following the closing of the transactions contemplated by the Equity Transfer Agreement and was paid as of December 31, 2009. |
Pursuant to the Equity Transfer Agreement, the Company purchased 50% of the outstanding equity interests of Shengda from Beijing Penn. Shengda is a Sino-foreign joint venture corporation with a contract period of 30 years. Following the transactions as completed by the Equity Transfer Agreement, the Company is one of two shareholders of Shengda. The investment in Shengda was accounted for under the equity method of accounting. Our total investment in Shengda was $2,950,000 as of December 31, 2009, of which we had paid $2,925,000. There were no acquisition costs incurred during the years ended December 31, 2009 or 2008.
The following table summarizes the allocation of the purchase price for the proportionate share of Shengda’s net assets acquired at fair value.
| ($ in thousands) | |||
| Purchase Price |
$ | 2,920 | |
| Less: Fair value of identifiable assets |
|||
| Cash |
398 | ||
| Accounts receivable |
68 | ||
| Other receivable |
84 | ||
| Prepaid expenses and other assets |
38 | ||
| Inventory |
512 | ||
| Fixed Assets |
743 | ||
| 1,843 | |||
| Plus: Fair value of liabilities assumed |
|||
| Accounts payable |
275 | ||
| Accrued liabilities and other payables |
432 | ||
| 707 | |||
| Excess of cost over fair value of net assets acquired |
$ | 1,784 | |
F-22
Table of Contents
Sunstone Corporation and Subsidiaries
Notes to Consolidated Financial—(Continued)
The following is the relative fair value of the identifiable intangible assets as of the date of acquisition.
| Weighted Average Amortization Period |
December 31, 2009 | ||||||||||
| Gross Carrying Amount |
Accumulated Amortization |
Net Book Value | |||||||||
| Intangible assets |
|||||||||||
| Completed Technology |
12 Years | $ | 983 | $ | 75 | $ | 908 | ||||
| Trademark |
12 Years | 357 | 25 | 332 | |||||||
| In Process Research and Development |
16 Years | 209 | 11 | 198 | |||||||
| Customer Relationship |
5 Years | 192 | 99 | 93 | |||||||
| GMP License |
2 Years | 43 | 18 | 25 | |||||||
| Intangible Assets |
$ | 1,784 | $ | 228 | $ | 1,556 | |||||
The intangible assets are being amortized over estimated useful lives as described above from the date of the acquisition and recorded against our equity in earnings. The following table provides a reconciliation of our equity method investment income for the period February 17, 2009 through December 31, 2009. Prior to purchase accounting adjustments, Shengda generated net income of $642,000 or $321,000 for our 50% equity ownership. The total of amortization and inventory write off for the period was $296,000 which resulted in equity method investment income of $25,000.
Reconciliation of Equity Method Investment Income:
| ($ in thousands) | |||
| Equity in earnings of Shengda for the period |
|||
| February 17 through December 31, 2009 |
$ | 321 | |
| Less adjustments of excess fair value: |
|||
| Inventory sold |
61 | ||
| Depreciation and amortization expense on buildings and intangible assets, including land use rights |
235 | ||
| Total equity method investment income |
$ | 25 | |
Acquisition of Taiyangshi Fly Tangshan Pharmaceutical Co., Ltd.
On April 12, 2009, Sunstone entered into a joint venture agreement with Tangshan Yangguang Fly Business Consultants Co., Ltd. (“Tangshan SunshineFly”) to establish Taiyangshi Fly Tangshan Pharmaceutical Co., Ltd. (“Yutian”), located in Yutian County, Tangshan, China. Yutian is owned 70% by Sunstone and 30% by Tangshan SunshineFly. The joint venture agreement requires Sunstone to inject RMB 35 million (or $5.1 million as of December 31, 2009) and Tangshan SunshineFly to contribute technology with an estimated value of RMB 15 million (or $2.2 million as of December 31, 2009) to the joint venture. On April 16, 2009, Yutian received the business license.
In acquiring our 70 percent interest in Yutian, Sunstone has agreed to inject RMB 35 million, all of which was injected as of September 30, 2009. Tangshan SunshineFly will contribute production technology at a later date once the manufacturing facility is completed. For financial reporting purposes, we have accounted for Yutian as a consolidated subsidiary from April 16, 2009 through December 31, 2009.
F-23
Table of Contents
Sunstone Corporation and Subsidiaries
Notes to Consolidated Financial—(Continued)
The noncontrolling interest of Tangshan SunshineFly represents the fair value of 30 percent of Sunstone’s cash injection as of December 31, 2009, or RMB 35 million (or $5.1 million as of December 31, 2009), adjusted for 30% of the net loss of Yutian. For the period April 16, 2009 through December 31, 2009, Yutian generated a loss of $320,000.
| ($ in thousands) | |||
| Noncontrolling interest: |
|||
| 30% of Sunstone’s payments allocated to Tangshan SunshineFly |
$ | 1,536 | |
| Less: Loss in Yutian for the period April 16, 2009 through December 31, 2009 |
96 | ||
| Noncontrolling interest |
$ | 1,440 | |
Pro forma results have not been included as there is no operating history as the Yutian manufacturing plant is currently being constructed and is expected to be completed in 2010.
4. Inventories
Inventories by category consist of the following:
| December 31, | ||||||
| 2009 | 2008 | |||||
| ($ amount in thousands) | ||||||
| Raw materials |
$ | 2,801 | $ | 3,028 | ||
| Work in process |
816 | 314 | ||||
| Finished goods |
6,194 | 6,842 | ||||
| Total inventories, net |
$ | 9,811 | $ | 10,184 | ||
5. Prepaid Expenses and Other Current Assets:
Prepaid expenses and other current assets as of December 31, 2009 and 2008 consist of the following:
| 2009 | 2008 | |||||
| ($ amounts in thousands) | ||||||
| Advance payments to Sunstone Suppliers |
$ | 3,774 | $ | 4,005 | ||
| Advance payments to Wanwei Suppliers |
1,693 | 1,700 | ||||
| Prepaid and other current assets |
855 | 542 | ||||
| $ | 6,322 | $ | 6,247 | |||
F-24
Table of Contents
BMP Sunstone Corporation and Subsidiaries
Notes to Consolidated Financial—(Continued)
6. Property and Equipment:
Property and equipment as of December 31, 2009 and 2008 consist of the following:
| Useful Lives | 2009 | 2008 | ||||||
| ($ amounts in thousands) | ||||||||
| Buildings |
20 Years | $ | 17,078 | $ | 16,440 | |||
| Machinery and equipment |
5-10 Years | 12,115 | 9,504 | |||||
| Furniture, fixtures and office equipment |
2-10 Years | 1,450 | 1,432 | |||||
| Motor Vehicles |
5-10 Years | 1,556 | 1,443 | |||||
| Leasehold Improvements |
2-5 Years | 581 | 579 | |||||
| 32,780 | 29,398 | |||||||
| Less: Accumulated Depreciation |
9,775 | 7,953 | ||||||
| Add: Construction in Progress |
7,962 | 1,395 | ||||||
| $ | 30,967 | $ | 22,840 | |||||
During the years ended December 31, 2009, 2008 and 2007, depreciation and amortization expense was $2,437,000, $1,842,000 and $111,000 respectively. During the years ended December 31, 2009 and 2008, cost of sales included $1,422,000 and $1,300,000 of depreciation, respectively.
7. Land Use Rights:
Land use rights as of December 31, 2009 and 2008 consist of the following:
| 2009 | 2008 | |||||
| ($ amounts in thousands) | ||||||
| Land Use Rights |
3,500 | 2,069 | ||||
| Less: Accumulated amortization |
640 | 67 | ||||
| $ | 2,860 | $ | 2,002 | |||
All lands in the PRC are state-owned and no individual land ownership rights exist. The Company has obtained land use rights certificates for the land on which its facilities are located in Tangshan, Hebei Province. The land use rights have between 17 and 41.1 years remaining.
8. Goodwill and Intangible Assets:
Goodwill and intangibles assets as of December 31, 2009 consists of the following:
| Weighted Average Amortization Period |
Gross Carrying Amount |
Accumulated Amortization | Net Book Value | ||||||||
| ($ amounts in thousands) | |||||||||||
| Favorable contracts |
17 Years | $ | 6,434 | $ | 772 | $ | 5,662 | ||||
| Customer relationships |
10 Years | 20,696 | $ | 6,864 | 13,832 | ||||||
| Trademarks |
Indefinite | 19,014 | $ | — | 19,014 | ||||||
| $ | 46,144 | $ | 7,636 | $ | 38,508 | ||||||
| Goodwill |
$ | 70,033 | $ | — | $ | 70,033 | |||||
F-25
Table of Contents
BMP Sunstone Corporation and Subsidiaries
Notes to Consolidated Financial—(Continued)
Trademarks were recorded related to the acquisition of Sunstone in RMB. For financial statement reporting, we translate our financial statements into US dollars. For the year ended December 31, 2009, trademarks increased $47,000 as a result of foreign currency fluctuation.
Goodwill was recorded related to the acquisitions of Sunstone and Rongheng in RMB. For financial statement reporting, we translate our financial statements into US dollars. For the year ended December 31, 2009, goodwill increased $168,000 as a result of foreign currency fluctuation.
During the years ended December 31, 2009, 2008 and 2007, amortization was $3,494,000, $4,339,000 and $256,000, respectively. Amortization expense of intangible assets is estimated to be approximately $2,883,000, $2,571,000, $2,299,000 and $2,017,000 and $1,796,000 for 2010, 2011, 2012, 2013 and 2014, respectively.
9. Notes payable and bank borrowings
Notes payable as of December 31, 2009 and 2008 consists of the following:
| 2009 | 2008 | |||||
| ($ amounts in thousands) | ||||||
| Short-term bank borrowings secured by assets |
$ | — | $ | 9,133 | ||
| Short-term bank borrowings secured by accounts and notes receivable |
4,943 | |||||
| Short-term bank borrowings secured by assets of related parties |
— | 2,480 | ||||
| Current portion of long term debt, net of debt discount (See Note 11) |
1,463 | 21,978 | ||||
| Notes Payable and Bank Borrowing |
$ | 6,406 | $ | 33,591 | ||
Short-term bank borrowings secured by assets represents borrowings that are secured by the Company’s land use rights and property with net book value of $12,031,000 as of December 31, 2008.
At December 31, 2008 short-term bank borrowings secured by assets of related parties represent borrowings secured by property of Zhiquiang Han.
Short-term bank borrowings secured by accounts and notes receivable represent borrowings that are secured by accounts and notes receivable of $6.2 million.
The weighted average interest rate on short-term borrowings outstanding as of December 31, 2009 and 2008 was 5.0% and 7.2%.
F-26
Table of Contents
BMP Sunstone Corporation and Subsidiaries
Notes to Consolidated Financial—(Continued)
10. Accrued Expenses
Accrued expenses as of December 31, 2009 and 2008, consists of the following:
| 2009 | 2008 | |||||
| ($ amounts in thousands) | ||||||
| Accrued taxes and related expenses |
$ | 4,022 | $ | 7,112 | ||
| Accrued marketing |
3,584 | 66 | ||||
| Accrued salaries and related expenses |
2,423 | 1,152 | ||||
| Accrued advertising expense |
191 | 1,093 | ||||
| Accrued travel and entertainment expenses |
1,751 | 881 | ||||
| Accrued sales office expenses |
3,032 | 823 | ||||
| Accrued social welfare and related expenses |
795 | 1,409 | ||||
| Accrued professional fees |
245 | 418 | ||||
| Accrued interest expense |
750 | 383 | ||||
| Accrued other |
1,685 | 1,264 | ||||
| Total Accrued expenses |
$ | 18,478 | $ | 14,601 | ||
11. Long-term debt
January Exchange Notes
On January 20, 2009, the Company completed an exchange (the “Exchange”) of $10,650,000 in principal amount of its 10.0% senior secured promissory notes (the “10.0% Notes”) for $10,650,000 in principal amount of its 12.5% secured convertible notes (the “January Exchange Notes”), pursuant to note exchange agreements (the “Note Exchange Agreements”) by and between the Company and certain holders of the 10.0% Notes (the “Noteholders”). Following the Exchange, $12,350,000 in principal amount of 10.0% Notes remained outstanding.
Pursuant to the Note Exchange Agreements, the Company issued the January Exchange Notes in the aggregate principal amount of $10,650,000 to the Noteholders. The January Exchange Notes bear interest at a rate of 12.5% per annum, payable quarterly in arrears beginning on April 1, 2009. The January Exchange Notes have a maturity date of July 1, 2011. The accrued but unpaid interest on the 10.0% Notes prior to the Exchange was paid to the Noteholders participating in the Exchange on April 1, 2009.
Based upon the original terms of the January Exchange Notes, a Note holder may convert its January Exchange Note into fully paid and non-assessable shares of common stock, par value $0.001 per share (the “Common Shares”), of the Company from time to time at a conversion price, subject to certain adjustments, equal to $5.00. If the Company issues Common Shares in one or more offerings to investors on or prior to September 15, 2009 (other than any offerings following the issuance of Common Shares in one or more offerings to investors resulting in the receipt of proceeds (net of all commissions) by the Company in an aggregate amount of at least $16,000,000), the conversion price will equal the lesser of (i) $5.00 or (ii) 115% of the lowest price per Common Share for which the Company sells Common Shares in any offering.
Notwithstanding the foregoing, pursuant to certain amendments to the January Exchange Notes, dated as of January 29, 2009, if the conversion price of the January Exchange Notes would result, upon conversion of all such notes, in the issuance of Common Shares in amount equal to or greater than 8,049,282 Common Shares (which was equal to 20.00% of 40,246,410, which was the number of outstanding Common Shares on the date thereof), the conversion price shall be increased to $1.33 (which is equal to the principal amount of the January
F-27
Table of Contents
BMP Sunstone Corporation and Subsidiaries
Notes to Consolidated Financial—(Continued)
Exchange Notes of $10,650,000 divided by 8,049,282 increased to the nearest whole cent), which would result, upon conversion of all of the January Exchange Notes, in the issuance of Common Shares in an aggregate amount less than 20.00% of the outstanding Common Shares on the date thereof. The January Exchange Notes were further amended by that certain January Exchange Note Second Amendment (as defined below) and that certain January Exchange Note Third Amendment (as defined below).
At the date of issuance of the January Exchange Notes, the Company was subject to the terms of an embedded derivative instrument due to the fact that the related contract was not indexed to its own stock.
The Company determined that the January Exchange Notes contained an embedded derivative. The fair value of the embedded derivative was determined to be $3,262,000, and was recorded as a derivative liability at inception. The recorded amount is being accreted through charges to the consolidated statements of operations using the effective interest method over the period of the January Exchange Notes. At March 13, 2009, the date of the January Exchange Note Second Amendment (as defined below), the fair value of the derivative was $1,555,000. The decrease in the fair value of the derivative between January 20, 2009 and March 13, 2009 was recorded in the consolidated statements of operations as a gain on derivative during the quarter ended March 31, 2009.
The Company amended the January Exchange Notes (the “January Exchange Notes Second Amendment”) such that the definition of certain terms and the mechanics of conversion of the January Exchange Notes parallel those in the March Exchange Notes (as defined below) and to restrict the issuance of Company securities to officers and directors of the Company below an effective price of $3.00 per common share. A Noteholder may convert its January Exchange Note into fully paid and non-assessable shares of common stock, par value $0.001 per share (the “Common Shares”), of the Company from time to time at a conversion price, subject to certain adjustments, equal to $3.00. The Company further amended the January Exchange Notes on May 14, 2009 (the “January Exchange Notes Third Amendment”) such that the conversion price was set at an amount equal to $3.00 per share of common stock and to add a covenant stating that the Company shall not issue equity, convertible debt or securities convertible into equity at an amount equal to or less than $2.75 per share of common stock (with such $2.75 amount to include the fair value of any option, warrant or similar right offered by the Company and to be adjusted in the manner identical to the adjustment of the conversion price as provided in amended note agreement of the January Exchange Notes) until December 31, 2009. The January Exchange Notes Third Amendment was effective as of March 13, 2009.
As of March 13, 2009, the derivative liability was extinguished and recorded as additional paid-in capital, in accordance with accounting standards.
The derivative was not intended to hedge any specific risk exposures, such as fluctuating interest rates, exchange rates, commodity prices, etc. Therefore, the derivative constituted neither a cash flow hedge, nor a fair value hedge. The volume of derivative activity relates solely to the embedded derivative instrument itself, and changes in fair value thereon.
F-28
Table of Contents
BMP Sunstone Corporation and Subsidiaries
Notes to Consolidated Financial—(Continued)
The effect of the derivative instrument on the consolidated statements of operations for the year ended December 31, 2009 follows:
| Location of Gain (Loss) Recognized in Income Statement |
Amount of Gain (Loss) Recognized in Income Statement for the Year ended December 31, 2009 | |||||
| ($ in thousands) | ||||||
| Derivatives not designated as hedging |
||||||
| Embedded Derivative |
Other Income | (Expense) | $ | 1,707 | ||
| Total |
$ | 1,707 | ||||
The fair value of the derivative liability was determined using the Black Scholes Option Pricing method. The valuation methodology uses a combination of observable (Level 2) and unobservable (Level 3) inputs in calculating fair value. As required, assets are classified in their entirety based on the lowest level of input that is significant to the fair value measurement.
The table below sets forth a summary of changes in the fair value of the Company’s level 3 derivative for the nine months ended December 31, 2009.
| ($ in thousands) | ||||
| Balance as of December 31, 2008 |
$ | 0 | ||
| Record Derivative Liability on Conversion Option at January 20, 2009 |
3,262 | |||
| Change in Fair Value of Derivative Liability |
(1,707 | ) | ||
| Extinguishment of Derivative Liability |
(1,555 | ) | ||
| Balance as of December 31, 2009 |
$ | 0 | ||
The terms of the January Exchange Notes entered into on January 20, 2009 were substantially different from the previous terms of the January Exchange Notes. Therefore, this transaction was accounted for as an extinguishment of debt. This resulted in a loss on debt extinguishment of $678,000, recognized in the consolidated statements of operations for the year ended December 31, 2009. In conjunction with this debt extinguishment, $548,000 of unamortized warrant discount and $130,000 of unamortized debt issuance costs were written off in the consolidated statements of operations for the year ended December 31, 2009.
As previously noted, the terms of the January Exchange Notes were amended effective as of the second amendment date of the notes of March 13, 2009 to fix the conversion price option at $3.00.
Based on evaluation, the terms of the January Exchange Notes, as amended and effective on March 13, 2009, were determined to be substantially different from the previous terms of the January Exchange Notes. As a result, this March 13, 2009 amendment was accounted for as an extinguishment of debt. This resulted in a loss on debt extinguishment, recognized in the consolidated statements of operations for the year ended December 31, 2009. In conjunction with this debt extinguishment, $3,156,000 of unamortized debt discount and $247,000 of unamortized debt issuance costs were written off in the consolidated statements of operations for the year ended December 31, 2009. The Company recorded the fair value of the amended notes at $10,927,000, as of March 13, 2009 which will be amortized to face value using the effective interest method over the remaining term of the notes. Amortization of debt premium of $106,000 was recorded, for the period from March 13, 2009 through December 31, 2009.
F-29
Table of Contents
BMP Sunstone Corporation and Subsidiaries
Notes to Consolidated Financial—(Continued)
March Public Notes
On March 13, 2009, the Company entered into a Placement Agency Agreement with Philadelphia Brokerage Corporation (the “Placement Agent”), as placement agent relating to the issuance and sale to investors of up to $7,000,000 principal amount of 12.5% Subordinated Convertible Notes due July 1, 2011 (the “March Public Notes”) convertible into common shares of the Company (the “Placement”).
The March Public Notes bear interest at the annual rate of 12.5% from March 16, 2009, or the most recent interest payment date to which interest has been paid or provided for, payable quarterly in arrears on April 1, July 1, October 1 and January 1 of each year, commencing April 1, 2009 to the persons in whose names the March Public Notes are registered at the close of business on March 15, June 15, September 15 or December 15 (whether or not a business day), as the case may be, preceding the respective interest payment date.
Each note holder of a March Public Note is entitled, at his option, at any time after the close of business on May 15, 2009, to convert the March Public Notes (or any portion of the principal amount thereof which is $1,000 or an integral multiple thereof) into fully paid and non-assessable common shares of the Company, at a conversion price per share equal to $3.00.
On May 14, 2009, the Company amended the terms of the March Public Notes to fix the conversion price at an amount equal to $3.00 per share of common stock and to add a covenant stating that the Company shall not issue equity, convertible debt or securities convertible into equity at an amount equal to less than $2.75 per share of common stock (with such $2.75 amount to include the fair value of any option, warrant or similar right offered by the Company and to be adjusted in the manner identical to the adjustment of the conversion price as provided in the amendment) until December 31, 2009. The amendment of the March Public Notes was effective as of March 16, 2009.
March Exchange Notes
On March 13, 2009, the Company completed an exchange (the “March Exchange”) of $1,000,000 principal amount of its 10.0% Notes for the same principal amount of its 12.5% March Exchange Secured Convertible Notes due July 1, 2011 (the “March Exchange Notes”), pursuant to a note exchange agreement (the “Note Exchange Agreement”) by and between the Company and certain holders of the 10.0% Notes (the “March Exchange Noteholders”). The terms of the March Exchange Notes are substantially similar to those of the January Exchange Notes. The Company recorded the fair value of the amended notes at $1,026,000 as of March 13, 2009 which will be amortized to face value using the effective interest method over the remaining term of such notes.
On November 20, 2009, the holders of the $1,000,000 March Exchange Notes converted $1,000,000 principal to 333,333 shares of common stock. Amortization of debt premium of $8,000 was recorded for the period from March 13, 2009 through November 20, 2009. In conjunction with this conversion $18,000 of unamortized debt premium was written off in the consolidated statements of operations for the year ended December 31, 2009.
March Cash Notes
On March 16, 2009, the Company completed a private placement (the “Private Placement”) of $6,350,000 principal amount of 12.5% March Cash Secured Convertible Notes due July 1, 2011 (the “March Cash Notes”). The terms of the March Cash Notes are substantially similar to the terms of the March Exchange Notes. The Company consummated the Private Placement by entrance into purchase agreements (the “Purchase Agreement”) with certain investors (the “Private Noteholders”).
F-30
Table of Contents
BMP Sunstone Corporation and Subsidiaries
Notes to Consolidated Financial—(Continued)
The Company amended the March Exchange Notes (the “March Exchange Note Amendment”) and the March Cash Notes (the “March Cash Note Amendment”) on May 14, 2009. The terms of the March Exchange Note Amendment and March Cash Note Amendment are substantially similar to the terms of the January Exchange Note Third Amendment. The March Exchange Note Amendment was effective as of March 13, 2009 and the March Cash Note Amendment was effective as of March 16, 2009.
The terms of the March Exchange Notes entered into on March 13, 2009 were substantially different to the previous terms of the March Exchange Notes. Therefore, this transaction was accounted for as an extinguishment of debt. This resulted in a loss on debt extinguishment of $90,000, recognized in the consolidated statement of operations for the year ended December 31, 2009. In conjunction with this debt extinguishment, $52,000 of unamortized warrant discount and $12,000 of unamortized debt issuance costs were written off in the consolidated statement of operations for the year ended December 31, 2009.
On March 16, 2009 the Company called the remaining $11,350,000 of its 10.0% Secured Promissory Notes due May 1, 2009. This resulted in a loss on debt extinguishment of $125,000, recognized in the consolidated statement of operations for the year ended December 31, 2009.
Bank of Communication
On June 24, 2009, the Company entered into a RMB 30,000,000 (or $4,381,000 as of June 24, 2009) loan agreement with Bank of Communication in China. The term of the loan is June 24, 2009 through May 24, 2011 with a 5.4% annual rate of interest paid monthly. The Company’s obligations under the debt are secured by the assets of Sunstone. The loan agreement does not contain any covenants. As of December 31, 2009, RMB 30,000,000 (or $4,388,000) is outstanding and is due May 2011.
China Construction Bank
On July 17, 2009, the Company entered into a RMB 16,000,000 (or $2,339,000 as of July 17, 2009) loan agreement with China Construction Bank in China. The term of the loan is July 17, 2009 through July 16, 2012 at 5.4% annual rate of interest paid monthly. The Company’s obligations under the debt are secured by the assets of Sunstone. The loan does not contain any covenants. As of December 31, 2009, RMB 16,000,000 (or $2,340,000) is outstanding and is due July 2012.
Bank of Communication
On October 15, 2009, Yutian entered into a RMB 50,000,000 (or $7,315,000 as of October 15, 2009) loan agreement with Bank of Commerce. The term of the loan is October 15, 2009 through September 27, 2012 at 5.4% annual rate of interest paid quarterly. The Company’s obligations under the debt are secured by assets of Yutian. The loan does not contain any covenants. As of December 31, 2009, RMB 50,000,000 (or $7,313,000) is outstanding and is due September 27, 2012.
2007 Debt
On November 1, 2007, the Company issued an aggregate of $23,000,000 principal amount of 10% Senior Secured Debt (the Debt) due May 1, 2009.
The Debt bears interest of 10% per annum, payable semi-annually in arrears on May 1st and November 1st, commencing May 1, 2008. Accrued interest, related to the Debt, which is included in accrued expenses, amounted to $383,000, as of December 31, 2008. As part of the debt agreement the Company is required to hold 6 months interest in a designated escrow account totaling $1,150,000.
F-31
Table of Contents
BMP Sunstone Corporation and Subsidiaries
Notes to Consolidated Financial—(Continued)
The Company’s obligations under the Debt are secured by a security interest in the 51% interest in Sunstone.
As a part of the issuance of the Debt, the Company issued common stock purchase warrants to the purchasers of the Debt giving them the right to purchase up to an aggregate of 1,037,580 shares of common stock at an exercise price of $12.43 per share. Class A warrants expired on May 1, 2009 and Class B warrants will expire on November 1, 2012, unless sooner exercised.
The relative fair value of these warrants on their date of grant, which was determined to be approximately $4,601,000, was recorded as a discount to the underlying debt and as an addition to additional paid-in capital. The discount was amortized over the term of the underlying debt on a straight line basis, which approximates the effective interest method. The fair value of the warrants was computed using the Black-Scholes option pricing model.
The Company assumed a risk-free interest rate of 4.10%, no dividends, expected volatility ranging from 43.24% — 75.90% and the contractual life of the warrants ranging from approximately 1.5 to 5 years. As of December 31, 2008, the unamortized debt discount amounted to approximately $1,022,000. Total amortization of the debt discount recorded as interest expense was $3,067,000 and $511,000 for the years ended December 31, 2008 and 2007. The effective interest rate on the debt was approximately 28.7%.
In connection with the sale of the Debt and warrants, the Company entered into a Registration Rights Agreement with the purchasers of the Debt and warrants under which the Company was required, on or before February 28, 2008, to file a registration statement with the Securities and Exchange Commission (SEC) covering the sale of Debt and warrants and to use the Company’s best efforts to have the registration statement declared effective as promptly as possible thereafter but in any event, by 90 days of filing such registration. The Company filed the registration statement on February 14, 2008 and it was declared effective May 9, 2008.
The Company exchanged $10,650,000 of the Debt in January 2009 as part of the January Exchange Notes, $1,000,000 of the Debt in March 2009 as part of the March Exchange Notes and called the remaining balance of $11,350,000 of the Debt on March 16, 2009.
F-32
Table of Contents
BMP Sunstone Corporation and Subsidiaries
Notes to Consolidated Financial—(Continued)
Long-term debt consists of the following at December 31, 2009, and December 31, 2008:
| 2009 | 2008 | |||||
| ($ amount in thousands) | ||||||
| January Exchange Notes, 12.5% secured convertible notes, due July 1, 2011 convertible into 3,550,000 shares of common stock at any time prior to maturity |
$ | 10,650 | $ | — | ||
| March Public Notes, 12.5% unsecured convertible notes, due July 1, 2011 convertible into 2,333,333 shares of common stock at any time prior to maturity |
7,000 | — | ||||
| March Cash Notes, 12.5% secured convertible notes, due July 1, 2011 convertible into 2,116,667 shares of common stock at any time prior to maturity |
6,350 | — | ||||
| Bank of Communication Loan, 5.4% secured bank loan due May 24, 2011 |
4,388 | — | ||||
| China Construction Bank Loan, 5.4% secured bank loan due July 16, 2012 |
2,340 | |||||
| Bank of Communication Loan, 5.4% secured loan due in installments beginning October 15, 2010 to September 27, 2012 |
7,313 | — | ||||
| November 2007 Notes, 10.0% secured notes, due May 1, 2009 |
— | 23,000 | ||||
| Total Long term debt |
38,041 | 23,000 | ||||
| Add: Debt premium |
171 | — | ||||
| Less: Debt discount |
— | 1,022 | ||||
| Less: Current portion of long term debt |
1,463 | 21,978 | ||||
| Long-term debt, less current portion |
$ | 36,749 | $ | — | ||
Future payments under notes payable agreement are as follows as of December 31, 2009:
| Year Ending December 31, |
Principal amount due | ||
| ($ amount in thousands) | |||
| 2010 |
1,463 | ||
| 2011 |
30,582 | ||
| 2012 |
5,996 | ||
| Total |
$ | 38,041 | |
12. Common Stock and Common Stock Warrants:
On February 20, 2009, the Company closed its offering of 559,062 units (the “Units”), each consisting of (i) two shares of the Company’s common stock, par value $0.001 per share (“Common Stock”), and (ii) a warrant (“Warrant”) to purchase one share of Common Stock at an exercise price of $4.00 per share, which exercise price is subject to potential re-pricing.
If on the 90th day after the closing date (the “Re-price Date”), the volume weighted average trading price calculated over the 20 trading days prior to the Re-price Date (the “VWAP”) of the Common Stock is less than $4.00 per share, the exercise price of the Warrants will be reset to the greater of (i) $1.80 or (ii) the VWAP. The Warrants are exercisable beginning any time on or after the Re-price Date and expiring on the fifth anniversary of the Closing Date. In no event, shall the number of shares of Common Stock and shares of Common Stock underlying the Warrants exceed 19.99% of the Company’s outstanding Common Stock as of February 13, 2009.
F-33
Table of Contents
BMP Sunstone Corporation and Subsidiaries
Notes to Consolidated Financial—(Continued)
The Units were offered by the Company at a purchase price of $6.40 per Unit (the “Offering”). As a result of the Offering, the Company issued 1,118,124 shares of Common Stock and 559,062 Warrants. The net proceeds to the Company from the Offering were approximately $3,000,000.
At the date of issuance of the Warrants, the Company determined that the financial instrument constituted a derivative. The fair value of the derivative was determined to be $838,000, and was recorded as a derivative liability at inception. The recorded amount is being accreted through charges to the consolidated statements of operations using the effective interest method over the term of the Warrants. At March 31, 2009, the fair value of the derivative was $894,000. The increase in the fair value of the derivative was also recorded in the consolidated statements of operations as a loss on derivative during the quarter ended March 31, 2009. The loss on derivatives of $503,000 was recorded for the period February 20, 2009 through December 31, 2009.
The Company is subject to a derivative warrant liability instrument due to the fact that the related contract is not indexed to its own stock. The derivative is accounted for and classified as a “Derivative Liability” within the other liabilities section of the consolidated balance sheet. The change in the fair value of the derivative is included within “other income (loss)” in the consolidated statements of operations. The change in the fair value of the derivative instrument affects the “Gain on Fair Value of Derivatives” line in the “cash flows from operating activities” section of the consolidated statements of cash flows.
After 90 days from the issuance of the warrants, or May 21, 2009, the warrant option reprice provisions expired and the warrant was deemed to be indexed to its own stock, accordingly the warrant liability was extinguished in the amount of $1,342,000 and recorded as additional paid in capital.
The derivative is not intended to hedge any specific risk exposures, such as fluctuating interest rates, exchange rates, commodity prices, etc. Therefore, the derivative constitutes neither a cash flow hedge, nor a fair value hedge. The volume of derivative activity relates solely to the derivative warrant liability instrument itself, and changes in fair value thereon.
The effect of the derivative instrument on the consolidated statements of operations for the year ended December 31, 2009 follows:
| Location of Gain (Loss) in Income Statement |
Amount of Gain (Loss) Recognized in Income Statement Year ended December 31, 2009 |
|||||
| ($ in thousands) | ||||||
| Derivatives not designated as hedging |
||||||
| Derivative Warrant Liability |
Other Income (Expense) | $ | (503 | ) | ||
| Total |
$ | (503 | ) | |||
The fair value of the warrant liability was determined using the Black Scholes Option Pricing method. The valuation methodology uses a combination of observable (Level 2) and unobservable (Level 3) inputs in calculating fair value.
As required, assets are classified in their entirety based on the lowest level of input that is significant to the fair value measurement.
F-34
Table of Contents
Sunstone Corporation and Subsidiaries
Notes to Consolidated Financial—(Continued)
The table below sets forth a summary of changes in the fair value of the Company’s level 3 derivative for the year ended December 31, 2009:
| ($ in thousands) | ||||
| Balance as of December 31, 2008 |
$ | 0 | ||
| Recording of Derivative Liability on Warrant Issuance |
839 | |||
| Change in Fair Value of Derivative Liability |
503 | |||
| Extinguishment of Derivative Liability |
(1,342 | ) | ||
| Balance as of December 31, 2009 |
$ | — | ||
On October 14, 2008, pursuant to a registered direct public offering, the Company issued 433,000 shares of the Company’s Common Stock at $5.00 per share. Gross proceeds from the offering amounted to approximately $2.2 million less associated costs of approximately $186,000. In October 2008, the Company also issued 4,546 shares of the Company’s Common Stock as compensation for placement agent services provided in connection with this registered direct offering.
In August 2007 pursuant to a registered direct public offering, the Company issued 3,470,557 units, consisting of (i) one share of the Company’s common stock and (ii) warrants to purchase two-tenths of a share of the Company’s common stock at an exercise price of $9.37 per share, for a purchase price of $9.395 per unit. The warrants have a term of five years and are immediately exercisable. The issuance resulted in the issuance of an aggregate of 3,470,557 shares of the Company’s common stock and warrants to purchase 694,111 shares of the Company’s common stock. Gross proceeds from the private placement amounted to approximately $32,602,000, less associated costs of approximately $2,003,000. In August 2007, the Company also issued 60,897 shares of the Company’s common stock as compensation for placement agent services provided in connection with this registered direct public offering.
The fair value of these warrants, totaled $4,379,000 and was estimated at the date of grant using the Black-Scholes option pricing model with the following weighted average assumptions for 2007: risk-free interest rate was 4.57 %, an expected dividend yield of 0%, the volatility factor of the expected market price of the Company’s common stock was 81%, and a weighted average contractual life of the warrants of 5 years.
13. EPS Reconciliation:
The following table sets forth the computation of weighted-average shares outstanding for calculating basic and diluted earnings per share for the fiscal years ended:
| 2009 | 2008 | |||
| Weighted-average shares – Basic |
41,398 | 38,617 | ||
| Effect of dilutive securities |
||||
| Stock options |
818 | 1,174 | ||
| Warrants |
22 | 50 | ||
| Convertible debt |
6,395 | — | ||
| Weighted-average shares – Diluted |
48,633 | 39,841 | ||
For the year ended December 31, 2009 and 2008, 2,200,000 and 3,246,000 shares, respectively, of the Company’s ordinary shares attributable to the stock options and warrants were excluded from the calculation of diluted income per share because the conversion price or exercise price exceeded the average price of the Company’s ordinary shares.
F-35
Table of Contents
Sunstone Corporation and Subsidiaries
Notes to Consolidated Financial—(Continued)
14. Income Taxes:
The provision for income taxes during the years ended December 31, 2009, 2008 and 2007 consists of the following:
| 2009 | 2008 | 2007 | ||||||||||
| ($ amounts in thousands) | ||||||||||||
| Domestic: |
||||||||||||
| Current |
$ | — | $ | — | $ | — | ||||||
| Deferred |
(3,566 | ) | (3,785 | ) | (2,920 | ) | ||||||
| (3,566 | ) | (3,785 | ) | (2,920 | ) | |||||||
| Foreign: |
||||||||||||
| Current |
3,420 | 2,176 | 15 | |||||||||
| Deferred |
(1,777 | ) | (1,569 | ) | (97 | ) | ||||||
| 1,643 | 607 | (82 | ) | |||||||||
| Total Domestic & Foreign |
(1,923 | ) | (3,178 | ) | (3,002 | ) | ||||||
| Change in Valuation Allowance |
4,315 | 3,970 | 3,017 | |||||||||
| $ | 2,392 | $ | 792 | $ | 15 | |||||||
Deferred income taxes reflect the impact of temporary differences between the amounts of assets and liabilities for financial reporting purposes and such amounts as measured by tax laws.
The United States and foreign components of loss before income taxes were as follows:
| For the Years Ended December 31, | ||||||||||||
| 2009 | 2008 | 2007 | ||||||||||
| ($ amounts in thousands) | ||||||||||||
| United States |
$ | (14,256 | ) | $ | (10,704 | ) | $ | (8,291 | ) | |||
| Foreign |
13,679 | 8,129 | (3,268 | ) | ||||||||
| $ | (577 | ) | $ | (2,575 | ) | $ | (11,559 | ) | ||||
The temporary differences that give rise to a significant portion of the deferred income tax asset as of the year ended December 31, 2009 and 2008 are as follows:
| 2009 | 2008 | |||||||
| ($ amounts in thousands) | ||||||||
| Net Operating Loss Carryforwards |
$ | 14,126 | $ | 11,261 | ||||
| Stock Based Compensation |
1,496 | 1,124 | ||||||
| Other Temporary Differences |
1,095 | (410 | ) | |||||
| Less: Valuation Allowance |
(16,154 | ) | (11,839 | ) | ||||
| Net Deferred Tax Asset |
$ | 563 | $ | 136 | ||||
| Deferred Tax Liabilities |
||||||||
| Intangibles |
(9,660 | ) | (10,262 | ) | ||||
| Net Deferred Tax Liability |
$ | (9,097 | ) | $ | (10,126 | ) | ||
F-36
Table of Contents
Sunstone Corporation and Subsidiaries
Notes to Consolidated Financial—(Continued)
For the years ended December 31, 2009 and 2008, a valuation allowance for deferred tax assets of $16,154,000 and $11,839,000 respectively, has been established to reduce the deferred tax assets to amounts estimated by management to be realizable.
The reconciliation of the statutory tax rate to the Company’s effective tax rate is as follows:
| 2009 | 2008 | 2007 | |||||||
| ($ amounts in thousands) | |||||||||
| Federal Statutory Income Tax Rate |
34.00 | % | 34.00 | % | 34.00 | % | |||
| State Statutory Income Tax Rate |
97.52 | % | 22.31 | % | 5.11 | % | |||
| Permanent Items & Other |
201.81 | % | 78.20 | % | (13.13 | %) | |||
| Foreign Income Tax Rate |
25.00 | % | 25.00 | % | 33.00 | % | |||
| Foreign Net Operating Losses Not Carried Forward |
(25.00 | %) | (25.00 | %) | (33.00 | %) | |||
| Less: Change in Valuation Allowance |
(748.13 | %) | (165.90 | %) | (26.11 | %) | |||
| Effective Tax Rate |
(414.80 | %) | (31.39 | %) | (0.13 | %) | |||
For the year ended December 31, 2009, the Company has net operating loss carryforwards for federal and state income tax purposes of approximately $31,609,000 which are available to offset future federal and state taxable income, if any.
The domestic federal and state operating losses expire as follows:
| Year of Expiration |
Federal Operating Losses |
State Operating Losses | ||||
| ($ amounts in thousands) | ||||||
| 2024 |
$ | 1,398 | $ | 1,398 | ||
| 2025 |
3,413 | 3,413 | ||||
| 2026 |
2,639 | 2,639 | ||||
| 2027 |
6,665 | 6,665 | ||||
| 2028 |
9,067 | 9,067 | ||||
| 2029 |
8,427 | 8,427 | ||||
| $ | 31,609 | $ | 31,609 | |||
The Company’s income tax provision and related reserves are based on management’s current estimates and such estimates may require adjustments in the future based on management’s evaluation of conditions and circumstances in effect at that time. The Company has net operating loss carryforwards of $10,639,000 for China which are available to offset taxable income if any. China provides net operating loss carryforwards for five years. The foreign net operating losses expire from 2010 through 2014.
15. Lease Commitments:
The Company leases its executive office facility in Plymouth Meeting, Pennsylvania 19462 under a lease agreement that expires January 2011. The lease requires minimum monthly rental payments of $6,000.
The Company leases it China executive office facility in Beijing under a lease agreement that expires November 2012. The lease requires minimum monthly rental payments of $7,000.
F-37
Table of Contents
Sunstone Corporation and Subsidiaries
Notes to Consolidated Financial—(Continued)
The Company leases its BMP China office facility in Beijing, China under a lease agreement that expires during November 2012. The lease requires minimum monthly rental payments of $14,000. The Company leases additional sales office space throughout China with varying lease expiration dates.
The Company leases its Wanwei office in Beijing, China under a lease agreement that expires September 2012. The lease requires minimum monthly rental payments of $9,000.
The Company leases its Rongheng office in Shanghai under a lease that expires August 2011. The lease requires minimum monthly rental payments of $11, 000. The Company leases its Rongheng warehouse in Shanghai under a lease that expires March 2011. The lease requires minimum monthly rental payments of $5,000.
During the years ended December 31, 2009, 2008, and 2007, rent expense incurred by the Company amounted to approximately $1,289,000, $1,137,000, and $360,000 respectively.
Future minimum lease payments due under the lease agreement as of December 31, 2009 are as follows:
| Year Ending December 31, |
Minimum Payment Due | ||
| ($ amounts in thousands) | |||
| 2010 |
777 | ||
| 2011 |
519 | ||
| 2012 |
371 | ||
| Total |
$ | 1,667 | |
16. Related Party Transactions:
On March 13, 2009 the Company issued an aggregate of $7,000,000 principal amount of 12.5% Subordinated Convertible Notes (the Subordinated Notes) due July 1, 2011. Certain shareholders of the company that qualified as 5% or more shareholders participated on the debt issuance.
On January 20, 2009, the Company completed an exchange of $10,650,000 in principal amount of its 10% senior secured promissory notes for 10,650,000 in principal amount of its 12.5% secured convertible notes (January Exchange Notes) due July 1, 2011. Certain shareholders of the company that qualified as 5% or more shareholders participated in the January Exchange Notes.
During the year ended December 31, 2009, the Company sold $4,451,000 in pharmaceutical products to related party entities of the Company’s President and Director, Zhiqiang Han (Han) as compared to $6,621,000 for the period February 18 through December 31, 2008. During the year ended December 31, 2009 the Company leased office space in Beijing from an entity controlled by Zhijun Tong (Tong) Company Director for a total of $92,000 as compared to $91,000 for the period February 18 through December 31, 2009. At December 31, 2009, the Company had a balance due to Han, director of the Company.
At December 31, 2009, $128,000 is due to entities controlled by Han.
On June 25, 2007, Shanghai Rongheng Pharmaceutical Company Limited, or Rongheng entered into a $659,000 loan with an annualized rate of 5.67% with Wanwei. This note was entered into prior to the company acquiring 63.3% of Rongheng. The note was for 6 months with an original maturity date of December 25, 2007 which had been extended an additional 6 months to June 25, 2008. The note is currently extended on a month to month basis. The proceeds of the loan are being used by Rongheng as working capital.
F-38
Table of Contents
Sunstone Corporation and Subsidiaries
Notes to Consolidated Financial—(Continued)
On April 27, 2008 the Company entered into a $2,480,000 loan with an annualized rate of 9.712%. The loan is collateralized with the personal residence of Han. The note was repaid in 2009.
On July 5, 2008, the Company acquired 63.3% of Rongheng. Based upon the Share Transfer and Capital Increase Agreement related to Rongheng, the Company agreed to a guarantee arrangement for the outstanding debt due to Rongheng International Trade Co. Ltd of Orient International Holding Co. (RHIT”) and Shanghai CAS Shenglongda Biotech Group Co, Ltd (“Shenglongda”).
| Balance at December 31, 2009 | |||
| ($ amounts in thousands) | ($ in thousands) | ||
| Amounts due to related parties: |
|||
| Due to entities controlled by Han |
$ | 128 | |
| Due to RHIT |
921 | ||
| Due to Shenglongda |
388 | ||
| $ | 1,437 | ||
During 2009 the Company received an advance payment for the purchase of inventory of $433,000 from Shengda. The $433,000 was paid during 2009.
17. Restrictions on Dividends:
The Company’s ability to make payments on indebtedness it may incur and to distribute dividends to its stockholders is dependent on the earnings and the distribution of funds from its subsidiaries. If BMP China, Rongheng, Wanwei, Sunstone or future subsidiaries incur indebtedness of their own in the future, the instruments governing such indebtedness could restrict their ability to pay dividends or make other distributions to the Company, which in turn would limit the Company’s ability to make payments on indebtedness it may incur and to distribute dividends to its stockholders. Further, the Company’s corporate structure may restrict the distribution of dividends to its shareholders since Chinese regulations permit payment of dividends only out of accumulated profits as determined in accordance with Chinese accounting standards and regulations.
18. Segment Information:
The Company had three reportable segments for the year ended December 31, 2009 and 2008: (i) the Manufactured Products reportable segment which includes the operations of Sunstone, (ii) the Pharmaceutical Distribution reportable segment which includes the operations of Wanwei and Rongheng and (iii) the Licensed Products reportable segment which includes the operations of BMP China. For the year ended December 31, 2007 the Company had two reportable segments: (i) the Pharmaceutical Distribution reportable segment which includes the operations of Wanwei and Rongheng and (ii) the Licensed Products reportable segment which includes the operations of BMP China.
Manufactured Products Segment (Sunstone)
The chief operating decision maker for the Sunstone Manufactured Products segment is the General Manager of Sunstone whose function is to allocate resources to, and assess the performance of Sunstone. This segment primarily manufactures and sells branded products into the retail pharmacy supply chain. Sunstone operates in a high margin environment selling pediatric and women’s health pharmaceutical and nutritional products.
F-39
Table of Contents
Sunstone Corporation and Subsidiaries
Notes to Consolidated Financial—(Continued)
Pharmaceutical Distribution Segment (Wanwei and Rongheng)
The chief operating decision makers for the Pharmaceutical Distribution segment are the General Managers of Wanwei and Rongheng whose function is to allocate resources to, and assess the performance of their respective business. This segment services both pharmaceutical manufacturers and healthcare providers in the pharmaceutical supply channel. The warehousing and distribution of pharmaceutical drugs, which are purchased from the same suppliers, is the primary business activity of our distributors. Pharmaceutical Distribution operates in a high volume and low margin environment.
Wanwei and Rongheng distribute brand name and generic pharmaceuticals, over-the-counter healthcare products, and home healthcare supplies and equipment to a variety of healthcare providers.
Licensed Products Segment (BMP China)
The chief operating decision maker for the Sales and Marketing segment is the Corporate Vice President and General Manager of BMP China whose function is to allocate resources to and assess the performance of BMP China. This segment markets exclusively licensed prescription drugs nationwide to healthcare providers of prescription drugs.
The following tables present reportable segment information for the periods indicated:
| Revenue | ||||||||||||
| 2009 | 2008 | 2007 | ||||||||||
| ($ amounts in thousands) | ||||||||||||
| Year ended December 31, | ||||||||||||
| Manufactured Products |
$ | 83,954 | $ | 65,715 | $ | — | ||||||
| Licensed Products |
63,751 | 49,078 | 30,884 | |||||||||
| Sales and marketing |
7,067 | 1,734 | 1,019 | |||||||||
| Elimination |
(7,904 | ) | (1,660 | ) | (900 | ) | ||||||
| Total Revenues |
$ | 146,868 | $ | 114,867 | $ | 31,003 | ||||||
| Operating Income | ||||||||||||
| 2009 | 2008 | 2007 | ||||||||||
| Year ended December 31, | ||||||||||||
| Manufactured Products |
$ | 16,669 | $ | 11,912 | $ | — | ||||||
| Distribution Products |
(470 | ) | (246 | ) | 44 | |||||||
| Licensed Products |
760 | (1,904 | ) | (3,535 | ) | |||||||
| Corporate |
(8,021 | ) | (5,748 | ) | (7,825 | ) | ||||||
| Eliminations |
(551 | ) | (268 | ) | 446 | |||||||
| Total Operating Profit (Loss) |
$ | 8,387 | $ | 3,746 | $ | (10,870 | ) | |||||
F-40
Table of Contents
BMP Sunstone Corporation and Subsidiaries
Notes to Consolidated Financial—(Continued)
| Assets | ||||||||||||
| 2009 | 2008 | 2007 | ||||||||||
| Year ended December 31, | ||||||||||||
| Manufactured Products |
$ | 208,382 | $ | 191,968 | $ | — | ||||||
| Distribution Products |
32,722 | 29,540 | 19,585 | |||||||||
| Licensed Products |
1,274 | 1,077 | 3,012 | |||||||||
| Corporate |
165,231 | 165,469 | 78,261 | |||||||||
| Eliminations |
(155,354 | ) | (150,403 | ) | (19,935 | ) | ||||||
| Total Assets |
$ | 252,255 | $ | 237,651 | $ | 80,923 | ||||||
| Depreciation | ||||||||||||
| 2009 | 2008 | 2007 | ||||||||||
| Year ended December 31, | ||||||||||||
| Manufactured Products |
$ | 2,133 | $ | 1,580 | $ | — | ||||||
| Distribution Products |
208 | 168 | 73 | |||||||||
| Licensed Products |
55 | 54 | 21 | |||||||||
| Corporate |
41 | 40 | 17 | |||||||||
| Total Depreciation |
$ | 2,437 | $ | 1,842 | $ | 111 | ||||||
| Capital Expenditures | ||||||||||||
| 2009 | 2008 | 2007 | ||||||||||
| Year ended December 31, | ||||||||||||
| Manufactured Products |
$ | 10,446 | $ | 2,934 | $ | — | ||||||
| Distribution Products |
46 | 338 | 434 | |||||||||
| Licensed Products |
49 | 20 | 106 | |||||||||
| Corporate |
12 | — | 23 | |||||||||
| Total Capital Expenditures |
$ | 10,553 | $ | 3,292 | $ | 563 | ||||||
| Goodwill and Intangibles | ||||||||||||
| 2009 | 2008 | 2007 | ||||||||||
| Year ended December 31, | ||||||||||||
| Manufactured Products |
$ | 105,830 | $ | 108,977 | $ | — | ||||||
| Distribution Products |
2,711 | 2,780 | 473 | |||||||||
| Total Goodwill and Intangibles |
$ | 108,541 | $ | 111,757 | $ | 473 | ||||||
| Interest Expense (Income) | ||||||||||||
| 2009 | 2008 | 2007 | ||||||||||
| Year ended December 31, | ||||||||||||
| Manufactured Products |
$ | 804 | $ | 943 | $ | 0 | ||||||
| Distribution Products |
(2 | ) | (20 | ) | 56 | |||||||
| Licensed Products |
0 | (2 | ) | 15 | ||||||||
| Corporate |
3,404 | 5,310 | 356 | |||||||||
| Total Interest Expense (Income) |
$ | 4,206 | $ | 6,231 | $ | 427 | ||||||
F-41
Table of Contents
BMP Sunstone Corporation and Subsidiaries
Notes to Consolidated Financial—(Continued)
| Income Tax Expense | |||||||||
| 2009 | 2008 | 2007 | |||||||
| Year ended December 31, | |||||||||
| Manufactured Products |
$ | 2,388 | $ | 789 | $ | 0 | |||
| Distribution Products |
4 | 3 | 15 | ||||||
| $ | 2,392 | $ | 792 | $ | 15 | ||||
19. Stock-Based Compensation
The Company’s 2007 Omnibus Equity Compensation Plan (the “Plan”) which merged with the Company’s 2004 Plan as of April 26, 2007 provides for grants of stock options (incentive stock options and nonqualified stock options), stock appreciation rights, restricted stock, restricted stock units, performance awards, other stock grants and other stock-based awards to all employees (including employees who are directors and officers), non-employee directors, consultants and independent contractors of the Company and its affiliates. The Plan authorizes the issuance of up to 5,000,000 shares of the Company’s common stock, subject to adjustment, and provides that no more than 400,000 shares of common stock, subject to adjustment, may be awarded to any one individual in any calendar year if the value of the award is based solely on an increase in the value of shares of the Company’s common stock after the date of grant of the award. The Plan also provides that no more than 100,000 shares of common stock, subject to adjustment, may be awarded to any one individual in any calendar year if the value of the award is not based solely on an increase in the value of shares of the Company’s common stock after the date of grant of the award. Options are granted for a term of ten years and vest over a four year period. Options granted under the Plan from 2005 through December 31, 2009 vest 25% after the first year of the date of grant and ratably each month over the remaining 36 month period. Options granted in 2004 under the Stock Plan vest 50% after the first two years of the date of hire and ratably each month over the remaining 24 month period. The Plan is administered by the Company’s Compensation Committee. The Compensation Committee has the authority to determine the individuals who will receive grants, the type of grant, the number of shares subject to the grant, the terms of the grant, the time the grants will be made, the duration of any exercise or restriction period, and to deal with any other matters arising under the Plan. Options granted under the Plan may be “incentive stock options,” which are intended to qualify with the requirements of section 422 of the Code, and “nonqualified stock options,” which are not intended to so qualify. The Company’s board of directors may amend or terminate the Plan at any time if required under the Plan, subject to stockholder approval. Unless terminated earlier by the board of directors or extended by the board of directors, with the approval of the Company’s stockholders, no awards may be granted under the Plan after April 26, 2012.
The fair value of each option grant is estimated on the date of grant using the Black-Scholes option pricing model with the following assumptions:
| Year ended December 31, | |||||||||
| 2009 | 2008 | 2007 | |||||||
| Expected life (years) |
5.0 | 5.0 | 5.0 | ||||||
| Risk-free interest rate |
1.87-2.41 | % | 2.36-3.22 | % | 4.52-5.23 | % | |||
| Expected Volatility |
78.00 | % | 55.00 | % | 78.00-80.00 | % | |||
| Expected Dividend yield |
0.00 | % | 0.00 | % | 0.00 | % | |||
The weighted average estimated fair value of the options granted for the year ended December 31, 2009, 2008, and 2007 was $2.24, $3.83, and $6.38 respectively.
F-42
Table of Contents
BMP Sunstone Corporation and Subsidiaries
Notes to Consolidated Financial—(Continued)
The Black-Scholes option valuation model was developed for use in estimating the fair value of traded options, which have no vesting restrictions and are fully transferable. In addition, option valuation models require the input of highly subjective assumptions including the expected stock volatility. Because the Company’s employee stock options have characteristics significantly different from those of traded options, and because changes in subjective input assumptions can materially affect the fair value estimate, in management’s opinion, the existing models do not necessarily provide a reliable single measure of the fair value of its employee stock options. Compensation cost which is based on the fair value of options granted is recognized on a straight line basis over the service period.
A summary of the options issued by the Company for the year ended December 31, 2009 is as follows:
| Options | Weighted- Average Exercise Price Per Share |
Weighted - Average Remaining Contractual Term (in years) |
Aggregate Intrinsic Value | ||||||
| Outstanding on January 1, 2009 |
3,157,801 | $ | 5.17 | ||||||
| Granted |
360,000 | $ | 3.54 | ||||||
| Exercised |
39,750 | $ | 2.41 | ||||||
| Canceled |
31,819 | $ | 8.81 | ||||||
| Outstanding on December 31, 2009 |
3,446,232 | $ | 5.00 | 6.38 | 6,624,000 | ||||
| Exercisable on December 31, 2009 |
2,382,983 | $ | 4.27 | 5.46 | 5,826,000 | ||||
The total intrinsic value of options exercised during the year ended December 31, 2009, 2008 and 2007 was $120,000, $1,691,000 and $340,000, respectively. Intrinsic value is measured using the fair market value price of the Corporation’s common stock less the applicable exercise price.
A summary of the status of the Corporation’s non-vested shares as of December 31, 2009 is presented below:
| Nonvested Shares |
Shares | Weighted-Average Grant-Date Fair Value | ||
| Nonvested at January 1, 2009 |
1,354,271 | 4.57 | ||
| Granted |
360,000 | 2.25 | ||
| Vested |
619,203 | 4.28 | ||
| Canceled |
31,819 | 5.90 | ||
| Nonvested at December 31, 2009 |
1,063,249 | 3.91 | ||
The unrecognized share-based compensation cost related to stock option expense at December 31, 2009 is $3,724,000 and will be recognized over a weighted average of 2.11 years. The total fair value of shares vested during the years ended December 31, 2009, 2008 and 2007 was $2,650,000, $2,562,000 and $1,324,000, respectively.
20. Commitments and Contingencies:
Rongheng
Based upon the Share Transfer and Capital Increase Agreement related to Shanghai Rongheng Pharmaceutical Co. Ltd. (Rongheng) and among Shanghai CAS Shenglongda Biotech (Group) Co., Ltd.
F-43
Table of Contents
BMP Sunstone Corporation and Subsidiaries
Notes to Consolidated Financial—(Continued)
(“Shenglongda”), Shanghai Rongheng International Trade Co., Ltd. of Orient International (Holding) Co. (“RHIT”) and Yiliang Lou, and BMP Sunstone; the parties have agreed to a guarantee arrangement, based on the principle of “first lending, first repaid”, with respect to certain indebtedness of Rongheng.
RHIT advanced RMB 9.4 million to Rongheng. This outstanding loan balance will be repaid by Rongheng in priority in accordance with the following arrangement: Within sixty days after the completion of the share transfer and the capital increase provided per the agreement, BMP shall provide a shareholder’s loan to Rongheng in order that Rongheng can repay RMB 3 million to RHIT; Within two years after the completion of the share transfer and the capital increase provided per the agreement, BMP Sunstone shall provide a shareholder’s loan to Rongheng so that Rongheng can repay the remaining amount owed to RHIT by installments. However, Rongheng may, in light of its business operation, retain an amount not more than 20% of the total amount which will be repaid, and the retained amount shall be repaid no later than the next year. During the year ended December 31, 2009, the Company repaid RMB 3 Million to RHIT.
21. Subsequent Events
On January 8, 2010, the Company announced Zhiqiang Han (“Han”) resigned his position as the Company’s President and Chief Operating Officer, effective immediately. Mr. Han will receive benefits of one year salary of $350,000, and all outstanding and vested options will immediately vest. The cost of vesting the options is $365,000. In addition, in connection with Han’s resignation, the Company agreed to accelerate the vesting of 60% of Han’s restricted common stock shares in the Company. All of the shares of the Company’s common stock that Han received when Sunstone China sold to the Company in February 2008 will be fully vested and saleable by February 2011. The Company will record the salary and related taxes and accelerated vesting of Han’s options in 2010.
22. Quarterly Financial Information (Unaudited):
Selected unaudited quarterly results for the year ended December 31, 2009 and 2008 were as follows:
| Total | Dec. 31, 2009 |
Sept. 30, 2009 |
June 30, 2009 |
Mar. 31, 2009 |
|||||||||||||||
| ($ amounts in thousands) | |||||||||||||||||||
| Year Ended December 31, 2009 |
|||||||||||||||||||
| Revenues |
$ | 146,868 | $ | 41,497 | $ | 33,625 | $ | 32,483 | $ | 39,263 | |||||||||
| Gross Profit |
74,009 | 23,281 | 15,676 | 14,394 | 20,658 | ||||||||||||||
| Operating Profit |
8,387 | 4,036 | 1,040 | 93 | 3,218 | ||||||||||||||
| Net Profit (Loss) |
(1,904 | ) | 2,009 | (207 | ) | (1,716 | ) | (1,990 | ) | ||||||||||
| Basic and diluted Income (Loss) per share |
$ | (0.05 | ) | $ | 0.05 | $ | (0.01 | ) | $ | (0.04 | ) | $ | (0.05 | ) | |||||
| Total | Dec. 31, 2008 |
Sept. 30, 2008 |
June 30, 2008 |
Mar. 31, 2008 |
|||||||||||||||
| ($ amounts in thousands) | |||||||||||||||||||
| Year Ended December 31, 2008 |
|||||||||||||||||||
| Revenues |
$ | 114,867 | $ | 36,637 | $ | 30,503 | $ | 29,638 | $ | 18,089 | |||||||||
| Gross Profit |
57,310 | 19,201 | 13,827 | 16,561 | 7,721 | ||||||||||||||
| Operating Income (Loss) |
3,746 | 1,773 | 1,765 | 1,604 | (1,396 | ) | |||||||||||||
| Net Profit (Loss) |
(3,442 | ) | 1,119 | (816 | ) | (1,267 | ) | (2,478 | ) | ||||||||||
| Basic and diluted Income (Loss) per share |
$ | (0.09 | ) | $ | 0.03 | $ | (0.02 | ) | $ | (0.03 | ) | $ | (0.07 | ) | |||||
F-44
Table of Contents
BMP SUNSTONE CORPORATION AND SUBSIDIARIES
SCHEDULE II
VALUATION AND QUALIFYING ACCOUNTS
For the Years Ended December 31, 2007, 2008 and 2009
| Description |
Balance at beginning of Period |
Charged to costs and Expenses |
Deductions (write-offs) |
Balance at End of Period | ||||||||
| ($ amount in thousands) | ||||||||||||
| December 31, 2007 |
||||||||||||
| Allowance for doubtful accounts |
$ | — | $ | 44 | $ | — | $ | 44 | ||||
| December 31, 2008 |
||||||||||||
| Allowance for doubtful accounts |
$ | 44 | $ | 83 | $ | — | $ | 127 | ||||
| December 31, 2009 |
||||||||||||
| Allowance for doubtful accounts |
$ | 127 | $ | 354 | $ | — | $ | 481 | ||||
| December 31, 2007 |
||||||||||||
| Allowance for inventory |
$ | — | $ | — | $ | — | $ | — | ||||
| December 31, 2008 |
||||||||||||
| Allowance for inventory |
$ | — | $ | — | $ | — | $ | — | ||||
| December 31, 2009 |
||||||||||||
| Allowance for inventory |
$ | — | $ | 98 | $ | — | $ | 98 | ||||
F-45
Table of Contents
Pursuant to the requirements of Section 13 or 15(d) of the Securities Exchange Act of 1934, as amended, the registrant has duly caused this report to be signed on its behalf by the undersigned, thereunto duly authorized.
| March 15, 2010 | BMP SUNSTONE CORPORATION | |||||||
| By: | /S/ FRED M. POWELL | |||||||
| Fred M. Powell Chief Financial Officer (Principal financial and accounting officer) | ||||||||
Pursuant to the requirements of the Securities Exchange Act of 1934, this report has been signed below by the following persons on behalf of the Registrant and in the capacities and on the dates indicated.
| By: | /S/ DAVID GAO | By: | /S/ MARTYN D. GREENACRE | |||||
| David Gao Chief Executive Officer, Director and Principal Executive Officer March 15, 2010 |
Martyn D. Greenacre Director March 15, 2010 | |||||||
| By: | /S/ LESLIE BALEDGE | By: | /S/ JACK M. FERRARO | |||||
| Leslie Baledge Director March 15, 2010 |
Jack M. Ferraro Director March 15, 2010 | |||||||
| By: | /S/ FRANK J. HOLLENDONER | By: | /S/ JOHN W. STAKES, M.D. | |||||
| Frank J. Hollendoner Director March 15, 2010 |
John W. Stakes, M.D. Director March 15, 2010 | |||||||
| By: | /S/ FRED M. POWELL | By: | /S/ ALBERT YEUNG | |||||
| Fred M. Powell Chief Financial Officer (Principal Financial Officer) March 15, 2010 |
Albert Yeung Director March 15, 2010 | |||||||
| By: | /S/ DANIEL J. HARRINGTON | By: | /S/ ZHIJUN TONG | |||||
| Daniel J. Harrington Director March 15, 2010 |
Zhijun Tong Director March 15, 2010 | |||||||
Table of Contents
EXHIBIT INDEX
The following is a list of exhibits filed as part of this Annual Report on Form 10-K. Where so indicated by footnote, exhibits that were previously filed are incorporated by reference. For exhibits incorporated by reference, the location of the exhibit in the previous filing is indicated.
| Exhibit |
Description | |
| 2.1 | Sale and Purchase Agreement, dated as of July 14, 2007, by and among Beijing Med-Pharm Corporation, Han Zhiqiang and Tong Zhijun (Incorporated by reference to Exhibit 2.1 of our Current Report on Form 8-K filed with the SEC on July 19, 2007) | |
| 2.2 | Sale and Purchase Agreement, dated as of September 28, 2007, by and among Beijing Med-Pharm Corporation, Han Zhiqiang and Tong Zhijun (Incorporated by reference to Exhibit 2.1 of our Current Report on Form 8-K filed with the SEC on October 4, 2007) | |
| 2.3 | Supplementary Agreement, dated as of September 28, 2007, by and among Beijing Med-Pharm Corporation, Han Zhiqiang and Tong Zhijun (Incorporated by reference to Exhibit 2.2 of our Current Report on Form 8-K filed with the SEC on October 4, 2007) | |
| 3.1 | Amended and Restated Certificate of Incorporation (Incorporated by reference to Exhibit 3.1 of our Annual Report on Form 10-K filed with the SEC on March 17, 2008) | |
| 3.2 | Amended and Restated Bylaws (Incorporated by reference to Exhibit 3.1 of our Current Report on Form 8-K filed with the SEC on December 19, 2007) | |
| 4.1 | Form of Common Stock Certificate (Incorporated by reference to Exhibit 4.1 of our Registration Statement on Form S-1 (Registration No. 333-121957) filed with the SEC on January 11, 2005, as amended) | |
| 4.2 | Form of Warrant issued on April 26, 2004 (Incorporated by reference to Exhibit 4.2 of our Registration Statement on Form S-1 (Registration No. 333-121957) filed with the SEC on January 11, 2005, as amended) | |
| 4.3 | Form of Subscription Agreement, dated October 14, 2005, as amended, by and between Beijing Med-Pharm Corporation and the signatories thereto (Incorporated by reference to Exhibit 4.1 of our Current Report on Form 8-K filed with the SEC on October 20, 2005) | |
| 4.4 | Form of Subscription Agreement, dated December 20, 2006, by and between Beijing Med-Pharm Corporation and the signatories thereto (Incorporated by reference to Exhibit 4.1 to our Current Report on Form 8-K filed with the SEC on December 21, 2006) | |
| 4.5 | Form of Warrant, dated December 20, 2006, by and between Beijing Med-Pharm Corporation and the signatories thereto (Incorporated by reference to Exhibit 4.2 to our Current Report on Form 8-K filed with the SEC on December 21, 2006) | |
| 4.6 | Form of Warrant to purchase shares of Common Stock (Incorporated by reference to Exhibit 4.1 of our Current Report on Form 8-K filed with the SEC on August 23, 2007) | |
| 4.7 | Form of Subscription Agreement (Incorporated by reference to Exhibit 10.2 of our Current Report on Form 8-K filed with the SEC on August 23, 2007) | |
| 4.8 | Form of Subscription Agreement (Incorporated by reference to Exhibit 4.1 of our Current Report on Form 8-K filed with the SEC on November 6, 2007) | |
| 4.9 | Form of Five Year Warrant (Incorporated by reference to Exhibit 4.2 of our Current Report on Form 8-K filed with the SEC on November 6, 2007) | |
| 4.10 | Form of 18 Month Warrant (Incorporated by reference to Exhibit 4.3 of our Current Report on Form 8-K filed with the SEC on November 6, 2007) | |
Table of Contents
| Exhibit |
Description | |
| 4.11 | Form of 10.0% Senior Secured Promissory Note due May 1, 2009 (Incorporated by reference to Exhibit 4.4 of the Current Report on Form 8-K filed with the SEC on November 6, 2007) | |
| 4.12 | Form of Subscription Agreement (Incorporated by reference to Exhibit 10.2 of our Current Report on Form 8-K filed with the SEC on October 10, 2008) | |
| 4.13 | Equity Transfer Agreement, dated December 19, 2008, between Sunstone (Tangshan) Pharmaceutical Co., Ltd. and Beijing Penn Pharmaceutical Sci-Tech Development Co., Ltd. (Incorporated by reference to Exhibit 10.1 of the Current Report on Form 8-K/A filed with the SEC on February 10, 2009) | |
| 4.14 | Form of Warrant (Incorporated by reference to Exhibit 4.1 of the Current Report on Form 8-K filed with the SEC on February 17, 2009) | |
| 4.15 | Form of Purchase Agreement (Incorporated by reference to Exhibit 10.2 of the Current Report on Form 8-K filed with the SEC on February 17, 2009) | |
| 4.16 | Form of Amended 12.5% Secured Convertible Notes (which notes were originally issued by the Company on January 20, 2009) as amended through March 13, 2009. (Incorporated by reference to Exhibit 4.1 of the Current Report on Form 8-K filed with the SEC on March 16, 2009) | |
| 4.17 | Form of 12.5% March Exchange Secured Convertible Notes due July 1, 2011 as issued by the Company on March 13, 2009. (Incorporated by reference to Exhibit 4.2 of the Current Report on Form 8-K filed with the SEC on March 16, 2009) | |
| 4.18 | Form of 12.5% March Cash Secured Convertible Notes due July 1, 2011 as issued by the Company on March 16, 2009. (Incorporated by reference to Exhibit 4.3 of the Current Report on Form 8-K filed with the SEC on March 16, 2009) | |
| 4.19 | Form of Note Exchange Agreement, as entered into on March 13, 2009, by the Company and certain holders of the Company’s 10.0% Senior Secured Promissory Notes due May 1, 2009. (Incorporated by reference to Exhibit 10.1 of the Current Report on Form 8-K filed with the SEC on March 16, 2009) | |
| 4.20 | Form of Purchase Agreement, as entered into on March 16, 2009, by the Company and the investors signatory thereto. (Incorporated by reference to Exhibit 10.2 of the Current Report on Form 8-K filed with the SEC on March 16, 2009) | |
| 4.21 | Amendment No. 1 to the Pledge Agreement, as entered into on March 12, 2009, by the Company and the noteholders signatory thereto. (Incorporated by reference to Exhibit 10.3 of the Current Report on Form 8-K filed with the SEC on March 16, 2009) | |
| 4.22 | Form of 12.5% Subordinated Convertible Notes due July 1, 2011 as issued by the Company on March 16, 2009. (Incorporated by reference to Exhibit 4.1 of the Current Report on Form 8-K filed with the SEC on March 16, 2009) | |
| 4.23 | Form of Subscription Agreement, as entered into on March 16, 2009, by the Company and the investor signatory thereto. (Incorporated by reference to Exhibit 10.2 of the Current Report on Form 8-K filed with the SEC on March 16, 2009) | |
| 4.24 | Form of Indenture for Senior Debt Securities (Incorporated by reference to Exhibit 10.3 of the Current Report on Form 8-K filed with the SEC on March 16, 2009) | |
| 4.25 | Form of Indenture for Subordinated Debt Securities, as entered into on March 16, 2009, by the Company and The Bank of New York Mellon, as trustee. (Incorporated by reference to Exhibit 10.4 of the Current Report on Form 8-K filed with the SEC on March 16, 2009) | |
| 4.26 | Form of Allonge, as entered into on April 15, 2009, by the Company and holders of the Company’s 12.5% Subordinated Convertible Notes due July 1, 2011. (Incorporated by reference to Exhibit 10.1 of the Current Report on Form 8-K filed with the SEC on April 16, 2009) | |
Table of Contents
| Exhibit |
Description | |
| 4.27 | First Supplemental Indenture, as entered into on April 15, 2009, by the Company and The Bank of New York Mellon, as trustee (Incorporated by reference to Exhibit 10.2 of the Current Report on Form 8-K filed with the SEC on April 16, 2009) | |
| 4.28 | Form of Third Agreement to Amend 12.5% Secured Convertible Notes due July 1, 2011, as entered into on May 14, 2009, by the Company and certain holders of the Company’s 12.5% Secured Convertible Notes due July 1, 2011 (Incorporated by reference to Exhibit 10.1 of the Current Report on Form 8-K filed with the SEC on May 17, 2009) | |
| 4.29 | Form of Agreement to Amend 12.5% March Exchange Secured Convertible Notes due July 1, 2011, as entered into on May 14, 2009, by the Company and certain holders of the Company’s 12.5% March Exchange Secured Convertible Notes due July 1, 2011 (Incorporated by reference to Exhibit 10.2 of the Current Report on Form 8-K filed with the SEC on May 17, 2009) | |
| 4.30 | Form of Second Agreement to Amend 12.5% March Cash Secured Convertible Notes due July 1, 2011, as entered into on May 14, 2009, by the Company and a certain holder of the Company’s 12.5% March Cash Secured Convertible Notes due July 1, 2011 (Incorporated by reference to Exhibit 10.3 of the Current Report on Form 8-K filed with the SEC on May 17, 2009) | |
| 4.31 | Form of Second Allonge, as entered into on May 14, 2009, by the Company and holders of the Company’s 12.5% Subordinated Convertible Notes due July 1, 2011 (Incorporated by reference to Exhibit 10.4 of the Current Report on Form 8-K filed with the SEC on May 17, 2009) | |
| 4.32 | Second Supplemental Indenture, as entered into on May 14, 2009, by the Company and The Bank of New York Mellon, as trustee (Incorporated by reference to Exhibit 10.5 of the Current Report on Form 8-K filed with the SEC on May 17, 2009) | |
| 4.33 | Share Purchase Agreement, dated as of August 3, 2009, by and between Alliance UniChem Group Limited and BMP Sunstone Corporation (Incorporated by reference to Exhibit 10.1 of the Current Report on Form 8-K filed with the SEC on August 4, 2009) | |
| 10.1ü | Employment Agreement, dated October 14, 2005, between Beijing Med-Pharm Corporation and David Gao (Incorporated by reference to Exhibit 10.1 of our Registration Statement on Form S-1 (Registration No. 333-121957) filed with the SEC on January 11, 2005, as amended) | |
| 10.2 | Consulting Agreement, dated July 1, 2004, between Beijing Med-Pharm Corporation and Ning Ning Chang (Incorporated by reference to Exhibit 10.2 of our Registration Statement on Form S-1 (Registration No. 333-121957) filed with the SEC on January 11, 2005, as amended) | |
| 10.3 | 2004 Stock Incentive Plan (Incorporated by reference to Exhibit 10.3 of our Registration Statement on Form S-1 (Registration No. 333-121957) filed with the SEC on January 11, 2005, as amended) | |
| 10.4 | Share Transfer and Debt Restructuring Agreement, dated December 15, 2004, between Beijing Wanwei Pharmaceutical Group and Beijing Med-Pharm Corporation (Incorporated by reference to Exhibit 10.4 of our Registration Statement on Form S-1 (Registration No. 333-121957) filed with the SEC on January 11, 2005, as amended) | |
| 10.5 | Share Transfer Agreement, dated December 15, 2004, between Beijing Med-Pharm Corporation and Wen Xin (Incorporated by reference to Exhibit 10.5 of our Registration Statement on Form S-1 (Registration No. 333-121957) filed with the SEC on January 11, 2005, as amended) | |
| 10.6 | Entrusted Loan Contract, dated December 27, 2004, between Beijing Med-Pharm Calculating Co. Ltd., China International Trust and Investment Industrial Bank and Beijing Wanwei Pharmaceutical Co. Ltd. (Incorporated by reference to Exhibit 10.6 of our Registration Statement on Form S-1 (Registration No. 333-121957) filed with the SEC on January 11, 2005, as amended) | |
| 10.7ü | Summary of Fred M. Powell Severance Terms (Incorporated by reference to Exhibit 10.7 of our Registration Statement on Form S-1/A (Registration No. 333-121957) filed with the SEC on April 19, 2005, as amended) | |
Table of Contents
| Exhibit |
Description | |
| 10.8 | Letter Agreement, dated June 6, 2002, by and among Biomet Merck, Merck China, Xiamen International Economic and Trade Company, and Beijing Med-Pharm Corporation (Incorporated by reference to Exhibit 10.8 of our Registration Statement on Form S-1/A (Registration No. 333-121957) filed with the SEC on May 13, 2005, as amended) | |
| 10.9 | Distributorship Agreement, dated August 29, 2005, by and among Cytokine PharmaSciences, Inc., Controlled Therapeutics (Scotland) Limited and Beijing Med-Pharm Corporation (Incorporated by reference to Exhibit 10.9 of our Registration Statement on Form S-1 (Registration No. 333-121957) filed with the SEC on January 11, 2005, as amended) | |
| 10.10 | Agreement, dated July 19, 2005, by and between Beijing Med-Pharm Corporation and MCM Klosterfrau GmbH, as amended on September 20, 2005 (Incorporated by reference to Exhibit 10.2 of our Quarterly Report on Form 10-Q for the fiscal quarter ended September 30, 2005, filed with the SEC on November 14, 2005) | |
| 10.11 | Office Lease Agreement, dated October 13, 2005, by and between Beijing Shengshang Asset Management Co. Ltd. and Beijing Med-Pharm Market Calculating Co. Ltd. (Incorporated by reference to Exhibit 10.11 of our Registration Statement on Form S-1 (Registration No. 333-121957) filed with the SEC on January 11, 2005, as amended) | |
| 10.12** | Exclusive Patent and Know How License Agreement, dated October 26, 2005, by and among Psimedica Ltd., Psioncology Pte. Ltd. and Beijing Med-Pharm Corporation (Incorporated by reference to Exhibit 10.1 of our Quarterly Report on Form 10-Q for the fiscal quarter ended September 30, 2005, filed with the SEC on November 14, 2005) | |
| 10.13 | Letter Agreement, dated as of January 20, 2006, amending the terms of the Exclusive Patent and Know How License Agreement among Psimedica Ltd., Psioncology Pte. Ltd. and Beijing Med-Pharm Corporation dated October 26, 2005 (Incorporated by reference to Exhibit 10.1 of our Current Report on form 8-K, filed with the SEC on January 26, 2006) | |
| 10.14 | Shareholders’ Agreement, dated as of January 18, 2007, among Beijing Med-Pharm Corporation, Alliance Unichem Group Limited and Alliance BMP Limited (Incorporated by reference to Exhibit 99.1 of our Current Report on Form 8-K filed with the SEC on January 30, 2007) | |
| 10.15 | Shareholders’ Agreement, dated as of July 14, 2007, by and among Beijing Med-Pharm Corporation, Han Zhiqiang, Tong Zhijun, Hong Kong Fly International Health Care Limited and Sunstone (Tangshan) Pharmaceutical Co., Ltd. (Incorporated by reference to Exhibit 10.1 of our Current Report on Form 8-K filed with the SEC on July 19, 2007) | |
| 10.16ü | Employment Agreement, dated as of January 1, 2008, between BMP Sunstone Corporation and Han Zhiqiang (Incorporated by reference to Exhibit 10.17 of our Annual Report on Form 10-K filed with the SEC on March 17, 2008) | |
| 10.17ü | Employment Agreement, dated as of October 1, 2007, between BMP Sunstone Corporation and Zhao Yanping (Incorporated by reference to Exhibit 10.18 of our Annual Report on Form 10-K filed with the SEC on March 17, 2008) | |
| 10.18** | Agreement, dated as of November 22, 2007 by and between Beijing Med-Pharm Corporation and Shanghai Novartis Trading Co., Limited (Incorporated by reference to Exhibit 10.19 of our Annual Report on Form 10-K filed with the SEC on March 17, 2008) | |
| 10.19 | Beijing Med-Pharm Corporation 2007 Omnibus Equity Compensation Plan (Incorporated by reference to Exhibit 10.20 of our Annual Report on Form 10-K/A filed with the SEC on May 7, 2008, as amended) | |
| 10.20ü | Employment Agreement, dated as of March 31, 2008, by and between BMP Sunstone Corporation and Fred M. Powell (Incorporated by reference to Exhibit 10.1 of our Quarterly Report on Form 10-Q for the fiscal quarter ended March 31, 2008, filed with the SEC on May 19, 2008) | |
Table of Contents
| Exhibit |
Description | |
| 21.1* | Subsidiaries of the Registrant | |
| 23.1* | Consent of Grant Thornton, Hong Kong | |
| 23.2* | Consent of KPMG | |
| 31.1* | Certification of Principal Executive Officer Pursuant to Section 302 of the Sarbanes-Oxley Act of 2002/SEC Rule 13a-14(a) | |
| 31.2* | Certification of Principal Financial Officer Pursuant to Section 302 of the Sarbanes-Oxley Act of 2002/SEC Rule 13a-14(a) | |
| 32.1* | Certification Pursuant to Section 1350 of Chapter 63 of 18 U.S.C. as Adopted Pursuant to Section 906 of the Sarbanes-Oxley Act of 2002/SEC Rule 13a-14(b) | |
| 32.2* | Certification Pursuant to Section 1350 of Chapter 63 of 18 U.S.C. as Adopted Pursuant to Section 906 of the Sarbanes-Oxley Act of 2002/SEC Rule 13a-14(b) | |
| * | Filed herewith |
| ** | Certain information in this exhibit has been omitted and has been filed separately with the Securities and Exchange Commission pursuant to a confidential treatment request under 17 C.F.R. Section 200.80(b)(4), 200.83 and 230.406. |
| ü | Management contract or compensatory plan or arrangement required to be filed or incorporated as an exhibit. |