Attached files
| file | filename |
|---|---|
| 8-K - Triangle Petroleum Corp | v176908_8-k.htm |
| EX-3.1 - Triangle Petroleum Corp | v176908_ex3-1.htm |
| EX-10.1 - Triangle Petroleum Corp | v176908_ex10-1.htm |
| EX-99.2 - Triangle Petroleum Corp | v176908_ex99-2.htm |
| EX-99.3 - Triangle Petroleum Corp | v176908_ex99-3.htm |
1
Excerpts from Presentation to Potential Investors
February 23, 2010

2
Forward-Looking Statements
These presentation materials include a number of forward-looking statements that reflect the current views of our management with respect to future events and financial
performance. You can identify these
statements by forward-looking words such as “may,” “will,” “expect,” “anticipate,” “believe,” “estimate” and “continue,” or similar words.
Those statements include statements regarding
our and members of our management team’s intent, belief or current expectations as well as the assumptions on which such
statements are based. Prospective investors are cautioned that any such forward-looking statements are not guarantees of future
performance and involve risk and
uncertainties, and that actual results may differ materially from those contemplated by such forward-looking statements.
Readers are urged to carefully review and consider the various disclosures made by us in these materials and in our other reports we filed with the U.S. Securities and
Exchange Commission. These presentation
materials should be read in conjunction with the sections entitled “Management’s Discussion and Analysis of Financial Condition
and Results of Operations,” “Consolidated Financial Statements” and notes related thereto in our Annual
Report on Form 10-K for the year ended January 31, 2009 and our
Quarterly Report on Form 10-Q for the quarterly period ended October 31, 2009. Important factors currently known to our management could cause actual results to differ
materially from those
in forward-looking statements. We undertake no obligation to update or revise forward-looking statements to reflect changed assumptions, the
occurrence of unanticipated events or changes in the future operating results over time. We believe that these assumptions
are based upon reasonable data derived from and
known about our business and operations. No assurances are made that actual results of operations or the results of our future activities will not differ materially from these
assumptions. Factors that
could cause differences include, but are not limited to, our ability to find oil and gas reserves that are economically recoverable, the volatility of oil
and gas prices, the uncertain economic conditions in the United States and globally, our ability to
develop reserves and sustain production, our estimate of the sufficiency of
our existing capital sources, our ability to raise additional capital to fund cash requirements for future operations, in prospect development and property acquisitions or
dispositions
and in projecting future rates of production or future reserves, the timing of development expenditures and drilling of wells, and the operating hazards attendant
to the oil and gas business.
Prior to 2010, the SEC generally permitted oil and gas companies, in their filings, to disclose only proved reserves that a company has demonstrated by actual production or
conclusive formation tests
to be economically and legally producible under existing economic and operating conditions. Beginning with year-end reserves for 2009, the SEC
permits the optional disclosure of probable and possible reserves. We use the terms “estimated
ultimately recoverable,” or EUR, “resource potential,” “recoverable reserves”
or other descriptions of volumes of hydrocarbons to describe volumes of resources potentially recoverable through additional drilling or recovery techniques
that the SEC’s
guidelines prohibit us from including in filings with the SEC. Estimates of resource potential, recoverable reserves or estimated ultimately recoverable amounts do not reflect
volumes that are demonstrated as being commercially
or technically recoverable. Even if commercially or technically recoverable, a significant recovery factor would be
applied to these volumes to determine estimates of volumes of proved reserves. Accordingly, these estimates are by
their nature more speculative than estimates of proved
reserves and accordingly are subject to substantially greater risk of being actually realized by us. The methodology for resource potential, recoverable reserves or estimated
ultimately
recoverable amounts may also be different than the methodology and guidelines used by the Society of Petroleum Engineers and is different from the SEC’s
guidelines for estimating probable and possible reserves.
Furthermore, the forward looking statements contained in these presentation materials are made as of the date hereof, and we undertake no obligation, except as required by
applicable securities legislation,
to update publicly or to revise any of the included forward looking statements, whether as a result of new information, future events or
otherwise. The forward looking statements contained herein are
expressly qualified by this cautionary statement.

3
Management Representatives
Dr. Peter Hill
Chief Executive Officer
Jonathan Samuels, CFA
Chief Financial Officer

4
Experienced Management Team
Jonathan Samuels
Chief Financial Officer
P. Jeffrey McKenna
V.P. Corporate
Development
Currently serves as Chief Financial Officer, Director, and Corporate Secretary of Triangle Petroleum Corporation.
Mr. Samuels served in several roles at Palo Alto Investors with an emphasis on oil and gas exploration and production companies as well as
oilfield services companies. Prior to that, Mr. Samuels
has held positions at several other investment organizations, including roles at Alpine
Investors, Orient Global, Ixora Capital and Banc of America Securities.
Mr. Samuels holds a bachelor’s degree from the University of California, San Diego and an MBA from the Wharton School at the University of
Pennsylvania. He is a CFA Charterholder.
Currently serves as V.P. Corporate Development for Triangle Petroleum Corporation.
Mr. McKenna is a senior landman with over 28 years of oil and gas experience in both public and private companies including as a founder of
two private oil and gas exploration and production companies (Revolve
Energy Inc. and Revolution Energy Ltd.), and as Vice President Land
at Volterra Energy Inc. and OGY Petroleum Ltd., Land Manager at Startech Energy Inc. and various roles at Husky Oil Ltd. and Conoco
Canada Limited.
Mr. McKenna holds a Bachelor of Commerce from Saint Mary’s University.
Dr. Peter Hill
Chief Executive Officer
Currently serves as Chief Executive Officer and Director of Triangle Petroleum Corporation. Dr. Hill also currently serves as Chairman of the
Board of Torreador Resource Corporation (NASDAQ: TRGL)
Dr. Hill has over 37 years of experience in the international oil and gas industry serving in various executive and non-executive roles most
notably: as Director/Chairman at Austral Pacific Energy (2006-2008),
President and CEO of Harvest Natural Resources (NYSE: HNR) (2000
to 2005), Technical Director/Chief Operating Officer at Hardy Oil & Gas (1998-2000), and 22 years with BP plc (LSE:BP) holding various
senior positions including Chief Geologist, Chief
of Staff for BP Exploration, and President of BP Venezuela. Mr. Hill has also served as an
independent advisor to Palo Alto Investors (2008 - 2009).
Mr. Hill holds a PhD in Sedimentology from Southampton University & Trinity College, Dublin as well as a B.S. in Geology from Southampton
University
5
Triangle Petroleum Overview
Focused Bakken Shale acreage acquisition and development strategy – We currently hold a
participation interest in 13,000 gross (4,000 net)
acres in the Williston Basin Bakken Shale with plans to
accumulate approximately 100,000 gross (30,000 net) acres over the next eighteen months
Operating partner capable of achieving near term development plans – Entered into a two year
participation agreement with Slawson Exploration,
a private operator with significant experience in the
Bakken Shale
Management team in place to achieve strategic goals – Recent management restructuring focused on
a new technically and fiscally disciplined
approach designed to achieve growth and cost targets
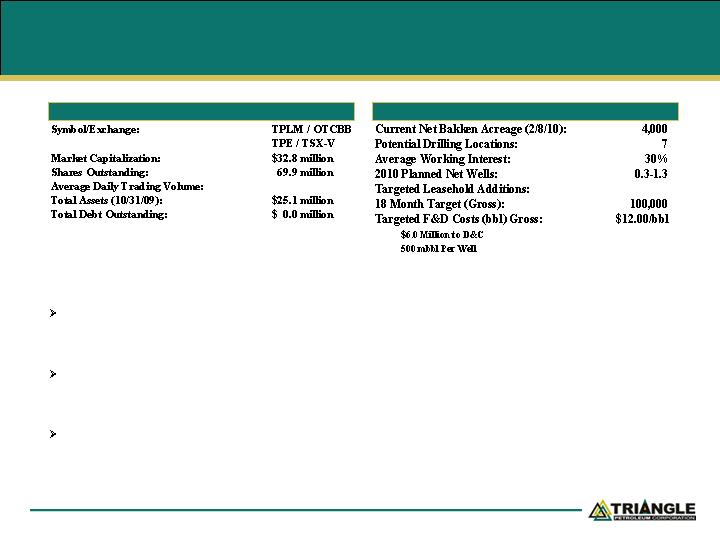
Bakken Shale Portfolio Highlights
Corporate Detail

6
Investment Considerations
Focused on growing Bakken Shale acreage position
Targeting 100,000 gross (30,000 net) acres within the next 18 months
Expect to control 10,000 net acres by year end 2010
Strategic joint venture partner has significant operating experience in the Bakken Shale
Slawson Exploration has significant historical experience drilling and acquiring leasehold interests in
the Bakken Shale
Expected to commence drilling of our first well in 3Q:10
Industry activity in Rough Rider project area believed to lessen the risk of planned
drilling activity
Initial wells are expected to be drilled nearby significant producing wells
Management team has significant experience in the Bakken Shale
Additional upside with over 400,000 net acre position in Nova Scotia
7
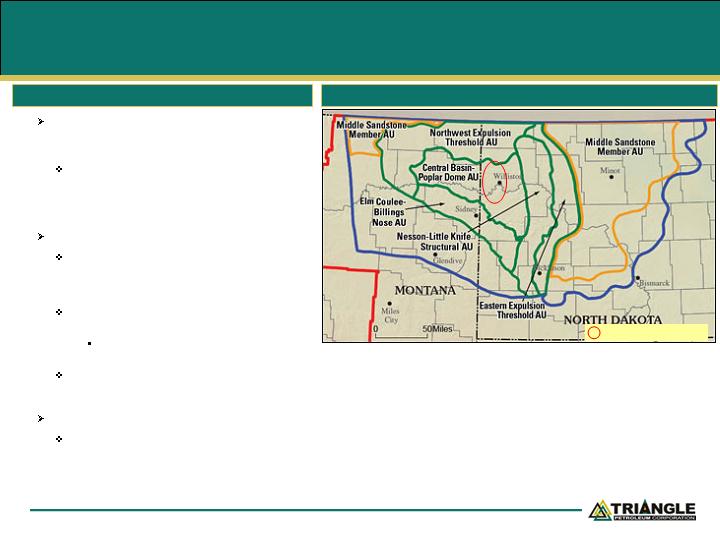
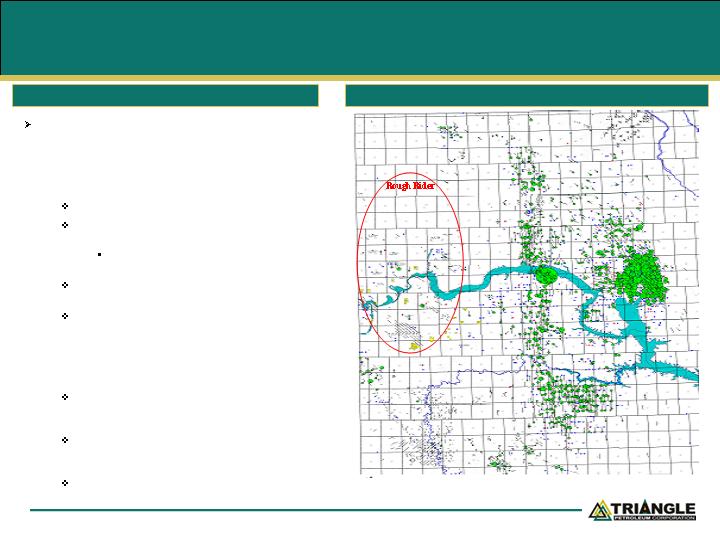
Williston Basin Bakken Shale Overview
USGS Bakken Shale Formation Assessment (April 2008)
Bakken Shale Overview
(1) Bakken Shale data collected from the published report by the United States Geological Survey (April 10, 2008)
Map showing boundary of Bakken-Lodgepole Total Petroleum System (TPS) (in blue),
five continuous assessment units (AU) (in green), and one conventional AU (in orange)
defined for the assessment of undiscovered
oil resources in the Upper Devonian–
Lower Mississippian Bakken Formation in the U.S. portion of the TPS. The outermost
green line defines the area of oil generation for the upper shale member of the
formation. Map by USGS.
Denotes Rough Rider Area
The Bakken Shale formation is the largest oil
accumulation assessed by the USGS (U.S.
Geological Survey) in the Lower 48(1)
In April 2008, the USGS estimated the amount
of technically recoverable reserves in the
Bakken Shale formation (Montana and North
Dakota) to total between 3.0 to 4.3 billion
barrels of oil
Significant running room to acquire leasehold
The Bakken Shale formation (as of the 2008
assessment) is believed to cover approximately
7 million acres located primarily in North
Dakota and Eastern Montana
Field is expanding west of the Nesson
Anticline
Industry activity has reduced drilling risk
in the Rough Rider area
Many of the major operators are shifting focus
from acreage accumulation to development
programs
Three Forks formation offers additional upside
Formation is believed to be present across the
Rough Rider area
8
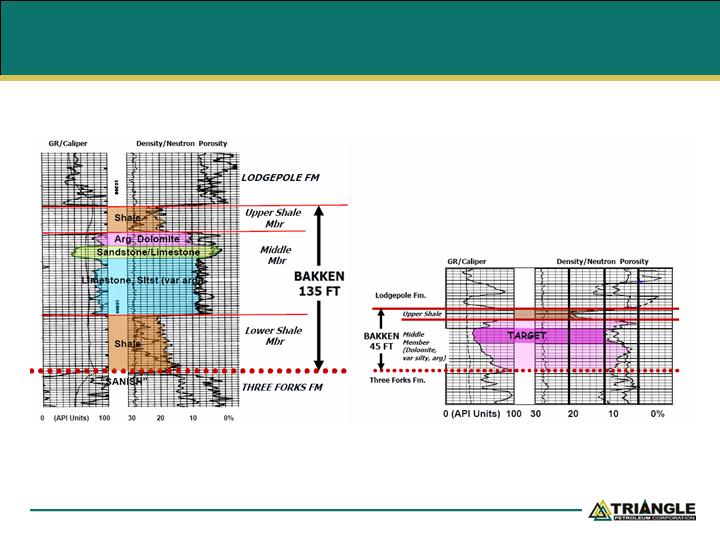
Middle Bakken Shale – Rock Types

9
Bakken Shale Geology – Reservoir Distribution

10
Bakken Shale – Cross Section
Source: Whiting Petroleum investor presentation

11
Bakken – Key Requirements
Be within hydrocarbon maturity/expulsion window
Identify rock types with
i) available rock storage/porosity capacity
ii) rock properties to permit flow and hold fractures
Drill long laterals in key sandstones/dolomite reservoirs
Deliver quality fracture stimulations/completions
Contain well/infrastructure costs
Have controlled take away capacity to avoid price erosion
12
Slawson Participation Agreement
Recently entered into a 2 year strategic participation
agreement with Slawson Exploration Corporation to
acquire and develop acreage in the Rough Rider
area of the Bakken Shale
Terms
100,000 gross acre participation agreement
$25 million gross capital expenditure requirement
per year
Either party can opt-out of additional expenditures
after meeting pro rata annual requirement
Slawson agrees to operate all wells on acquired
acreage
Drilling promote - We agree to pay 33% of well cost
to earn a 30% working interest in all wells drilled in
the covered area
2010 Planned
Activity
We have acquired 4,000 net acres to date with plans
to add a minimum of 6,000 net acres by year end
2010
Current 2010 budget of $10.0 million for leases and
$2.5-$6.0 million for drilling capex
First Slawson operated well expected to be drilled in
3Q:10
Participation Agreement Overview
Triangle Petroleum Current Leasehold
13
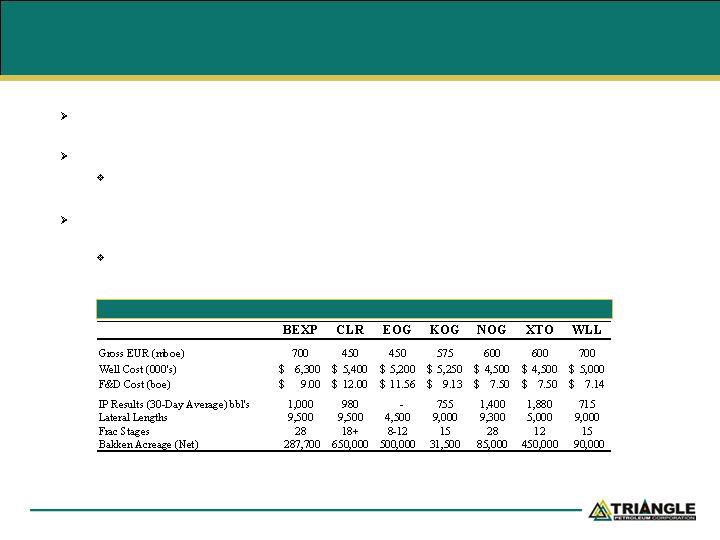
Bakken Shale Industry Peer Comparables(1)
Regional drilling results confirm statistical nature of Bakken Shale
Completion techniques have unlocked development in the play
The industry peer group continues to refine its drilling and completion techniques with the latest wells targeting long
laterals of 9,000+ feet and 25-32 stage fracs per well
Brigham Exploration has been the most active driller in the Rough Rider area to date with published 24
hour IP rates averaging 2,420 boepd
Brigham continues to project an estimated ultimate recovery (EUR) of approximately 700 mboe with additional
upside potential from the lower Three Forks formation
*XTO and NOG IP results are based on 24hour tests
Industry Peer Comparables
(1) Data related to our industry peer comparables operating in the Bakken Shale has been gathered from publicly available information, including company presentations,
conference call transcripts
and company press releases, disclosed in 2009 and 2010. We are unable to confirm whether the information was prepared by a qualified
reserves evaluator or auditor in accordance with the Canadian Oil & Gas Evaluation Handbook or by an independent engineer
or geoscientist within the principles of the
Society of Petroleum Engineers
14
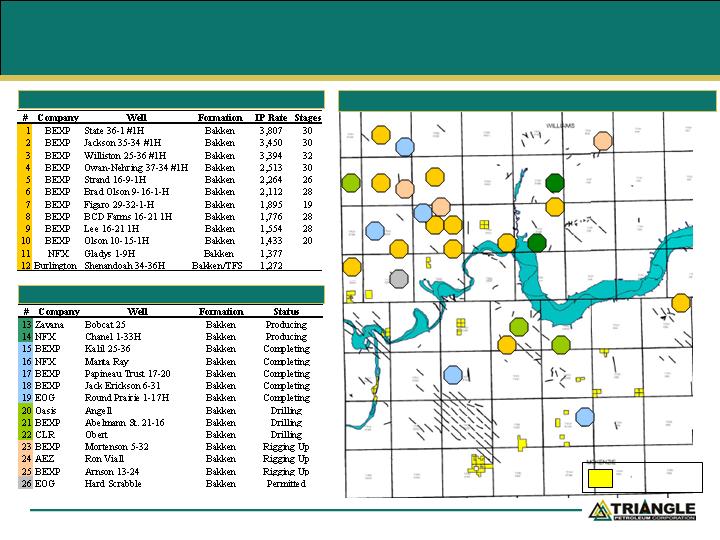
Bakken Shale – Rough Rider Project Area
Rough Rider Results/Current Activity
7
6
8
4
12
2
9
5
1
3
11
10
15
16
18
17
21
19
20
22
25
23
24
26
13
14
Rough Rider Results/Current Activity
Williams and McKenzie Counties, North Dakota
* Data gathered from publicly available datapoints including company presentations, conference call transcripts, and company press releases
TPLM Acreage
Position
15
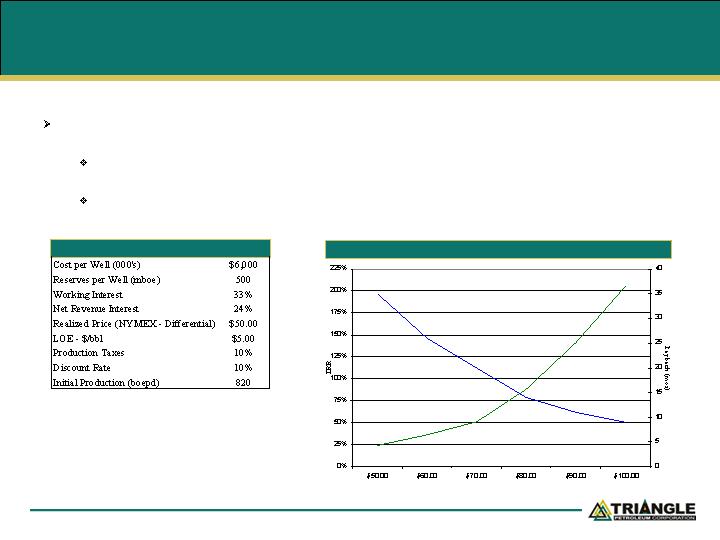
Bakken Shale Well IRR Sensitivities
Economic assumptions are based on historical performance analysis of 231 horizontal wells
(1)
targeting the Bakken Shale formation
At $60 NYMEX oil price, we expect to generate an IRR of 36% based on current well economic
assumptions
Current estimates using longer laterals provide significant upside if confirmed following initial well
drilling results
Well Economic Assumptions (8/8th’s )
Bakken Shale Well – IRR NYMEX Price Sensitivities and Payback
(1) Data gathered from the North Dakota bureau of land management database

16
Financial Overview
17
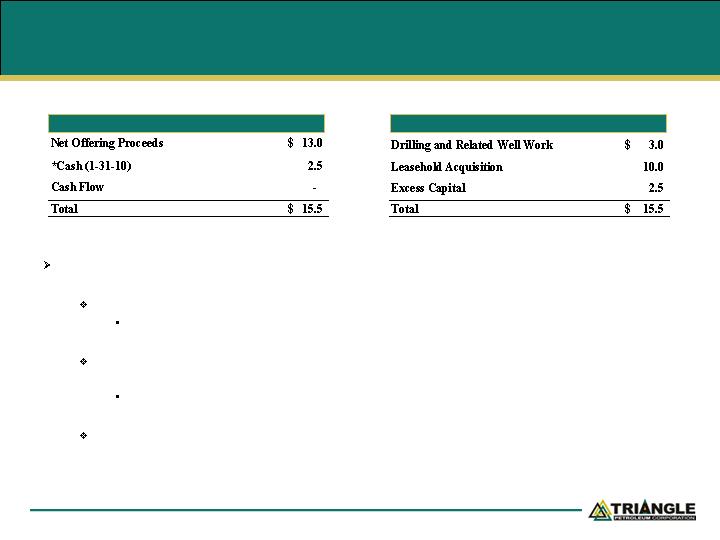
2010 Capital Plan – Pro Forma Sources and Uses
2010 Capital Expenditures Budget
Targeting exiting the year with 10,000 net acres in the Bakken Shale formation
Average cost less than $1,000/acre
We also plan to commence drilling at least one well beginning in 3Q:10 and potentially up to three
gross wells by year end depending on rig availability
$6.0 million gross ($2.0 million net) budgeted for the first well
Actively seeking other leasing opportunities outside of the area covered by the participation
agreement with Slawson
Sources
Uses
*1-31-10 cash balance adjusted for Slawson participation agreement

18
Three Year Development Plan
Phase 1: Build Company & Team
Completed a management restructuring as part of a new strategic initiative focused on acquiring and
developing acreage in onshore unconventional oil and gas basins in North America
Announced a 2 year participation agreement with Slawson Exploration whereby we will acquire
leasehold interest and Slawson will operate the wells on the respective acreage
Phase 2: Leasehold Acquisition
Acquired 13,000 gross (4,000 net) acres in McKenzie and Williams Counties, North Dakota
prospective for the Bakken Shale formation
Expect to acquire approximately 100,000 gross acres in the Bakken Shale formation over the next
eighteen months
Phase 3: Development
Expect to commence drilling first horizontal Bakken Shale well in 3Q:10
Multi year drilling program targeting approximately 50 gross (16 net wells) over the next three
years
19
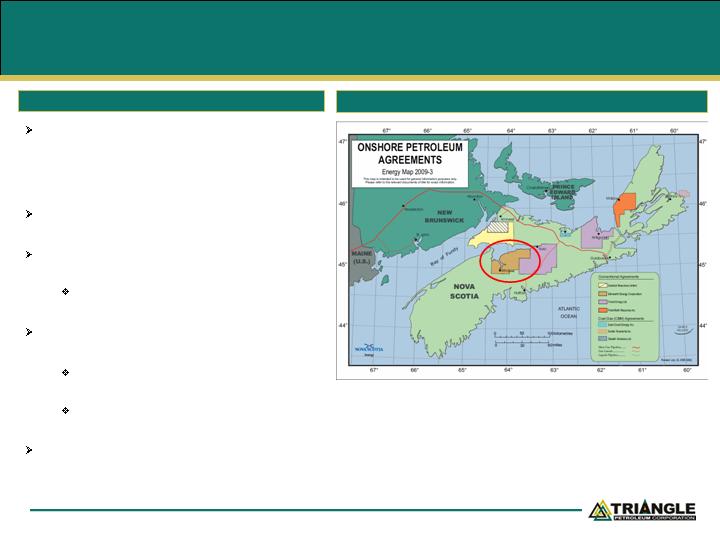
Nova Scotia Upside
We hold an 87% working interest in the
Windsor Block, a largely under-explored
land base in Nova Scotia with numerous
conventional and unconventional shale gas
formation targets
2009 2D Seismic shoot reflects a significant
4-way closure
Estimated risk capital of $2.9 million capable of
providing significant upside return with success
Currently seeking an industry partner to buy
in on a promoted basis
Access to major nearby pipeline feeding the
northeast United States
Improves time to production as well as
attractive transportation costs
Receives NYMEX or premium to NYMEX
price depending on season
Current terms require us to drill one well by
April 2011
Nova Scotia, Canada - Windsor Block (412,964 net acres)
Triangle Petroleum Current Leasehold

20
Investment Considerations
Focused on growing Bakken Shale acreage position
Targeting 100,000 gross (30,000 net) acres within the next 18 months
Expect to control 10,000 net acres by year end 2010
Strategic joint venture partner has significant operating experience in the Bakken Shale
Slawson Exploration has significant historical experience drilling and acquiring leasehold interests in
the Bakken Shale
Expected to commence drilling of our first well in 3Q:10
Industry activity in Rough Rider project area believed to lessen the risk of planned
drilling activity
Initial wells are expected to be drilled nearby significant producing wells
Management team has significant experience in the Bakken Shale
Additional upside with over 400,000 net acre position in Nova Scotia