Attached files
UNITED
STATES
SECURITIES
AND EXCHANGE COMMISSION
Washington, D.C.
20549
Form 10-K
|
|
þ
|
ANNUAL REPORT PURSUANT TO
SECTION 13 OR 15(d) OF THE SECURITIES EXCHANGE ACT OF 1934 FOR THE
FISCAL YEAR ENDED DECEMBER 31,
2009.
|
or
|
|
o
|
TRANSITION REPORT PURSUANT TO
SECTION 13 OR 15(d) OF THE SECURITIES EXCHANGE ACT OF 1934 FOR THE
TRANSITION PERIOD FROM _____________ TO
_____________.
|
Commission
File Number: 000-51730
Thomas
Weisel Partners Group, Inc.
(Exact
name of registrant as specified in its charter)
|
Delaware
|
20-3550472
|
|
|
(State
or other jurisdiction of
incorporation
or organization)
|
(I.R.S.
Employer
Identification
No.)
|
One
Montgomery Street
San Francisco,
California 94104
(415) 364-2500
(Address,
including zip code, and telephone number, including area code, of registrant’s
principal executive office)
Securities
registered pursuant to Section 12(b) of the Act:
None
Securities
registered pursuant to Section 12(g) of the Act:
Common
Stock, par value $0.01 per share
Indicate
by check mark if the registrant is a well-known seasoned issuer, as defined in
Rule 405 of the Securities Act. Yes o
No þ
Indicate
by check mark if the registrant is not required to file reports pursuant to
Section 13 or 15(d) of the Act. Yes o
No þ
Indicate
by check mark whether the registrant (1) has filed all reports required to
be filed by Section 13 or 15(d) of the Securities Exchange Act of 1934
during the preceding 12 months (or for such shorter period that the
registrant was required to file such reports), and (2) has been subject to
such filing requirements for the past
90 days. Yes þ
No o
Indicate
by check mark if disclosure of delinquent filers pursuant to Item 405 of
Regulation S-K is not contained herein, and will not be contained, to the
best of registrant’s knowledge, in definitive proxy or information statements
incorporated by reference in Part III of the Annual Report on
Form 10-K or any amendment to this Annual Report on Form 10-K.
þ
Indicate
by check mark whether the registrant is a large accelerated filer, an
accelerated filer, or a non-accelerated filer. See definition of “accelerated
filer and large accelerated filer” in Rule 12b-2 of the Exchange Act.
(Check one):
|
Large
accelerated filer o
|
Accelerated
filer þ
|
Non-accelerated
filer o
|
Smaller
reporting company o
|
Indicate
by check mark whether the registrant is a shell company (as defined in
Rule 12b-2 of the Act). Yes o
No þ
The
aggregate market value of the common stock held by non-affiliates of the
registrant as of the last business day of the registrant’s most recently
completed second fiscal quarter, based upon the closing sale price of the
registrants’ common stock on June 30, 2009 as reported on The NASDAQ Stock
Market, Inc. was $162,235,551.
As of
March 10, 2010 there were 32,852,852 shares of the registrant’s common
stock outstanding, including 6,183,121 shares of TWP Acquisition Company
(Canada), Inc., a wholly-owned subsidiary of the registrant. Each exchangeable
share is exchangeable at any time into common stock of the registrant on a
one-for-one basis, entitles the holder to dividend and other rights economically
equivalent to those of the common stock, and through a voting trust, votes at
meetings of stockholders of the registrant.
DOCUMENTS
INCORPORATED BY REFERENCE
Portions
of the definitive Proxy Statement for the registrants’ Annual Meeting of
Shareholders to be held on May 20, 2010 have been incorporated by reference into
Part III of this Annual Report on Form 10-K.
|
Item
Number
|
Page
|
|||||
|
1.
|
Business
|
1
|
||||
|
1A.
|
Risk
Factors
|
8
|
||||
|
1B.
|
Unresolved Staff
Comments
|
18
|
||||
|
2.
|
Properties
|
18
|
||||
|
3.
|
Legal
Proceedings
|
19
|
||||
|
4.
|
Submission of Matters to a Vote
of Security Holders
|
19
|
||||
|
5.
|
Market for Registrant’s Common
Equity, Related Shareholder Matters and Issuer Purchases of Equity
Securities
|
23
|
||||
|
6.
|
Selected Financial
Data
|
26
|
||||
|
7.
|
Management’s Discussion and
Analysis of Financial Condition and Results of Operations
|
27
|
||||
|
7A.
|
Quantitative and Qualitative
Disclosures About Market Risk
|
40
|
||||
|
8.
|
Financial Statements and
Supplementary Data
|
43
|
||||
|
9.
|
Changes in and Disagreements with
Accountants on Accounting and Financial Disclosure
|
43
|
||||
|
9A.
|
Controls and
Procedures
|
43
|
||||
|
9B.
|
Other
Information
|
43
|
||||
|
10.
|
Directors, Executive Officers,
and Corporate Governance of the Registrant
|
44
|
||||
|
11.
|
Executive
Compensation
|
44
|
||||
|
12.
|
Security Ownership of Certain
Beneficial Owners and Management and Related Shareholder
Matters
|
44
|
||||
|
13.
|
Certain Relationships and Related
Transactions, and
Director Independence
|
44
|
||||
|
14.
|
Principal Accountant Fees and
Services
|
44
|
||||
|
15.
|
Exhibits and Financial Statement
Schedules
|
44
|
||||
|
S-1
|
||||||
|
E-1
|
||||||
Special
Note Regarding Forward-Looking Statements
This
Annual Report on Form 10-K in Item 1 – “Business”,
Item 1A – “Risk Factors”, Item 7 – “Management’s Discussion
and Analysis of Financial Condition and Results of Operations” and in other
sections includes forward-looking statements within the meaning of Section 27A
of the Securities Act of 1933, as amended (the “Securities Act”) and Section 21E
of the Securities Exchange Act of 1934, as amended (the “Exchange Act”). In some
cases, you can identify these statements by forward-looking words such as “may”,
“might”, “will”, “should”, “expect”, “plan”, “anticipate”, “believe”,
“estimate”, “predict”, “potential”, “intend” or “continue”, the negative of
these terms and other comparable terminology. These forward-looking statements,
which are subject to risks, uncertainties and assumptions about us, may include
expectations as to our future financial performance, which in some cases may be
based on our growth strategies and anticipated trends in our business. These
statements are based on our current expectations and projections about future
events. There are important factors that could cause our actual results, level
of activity, performance or achievements to differ materially from the results,
level of activity, performance or achievements expressed or implied by the
forward-looking statements. In particular, you should consider the numerous
risks outlined in Part I, Item 1A – “Risk Factors” in this Annual
Report on Form 10-K.
Although
we believe the expectations reflected in the forward-looking statements are
reasonable, we cannot guarantee future results, level of activity, performance
or achievements. Moreover, neither we nor any other person assumes
responsibility for the accuracy or completeness of any of these forward-looking
statements. You should not rely upon forward-looking statements as predictions
of future events. We are under no duty to update any of these forward-looking
statements after the date of this filing to conform our prior statements to
actual results or revised expectations, except as required by Federal securities
law.
Forward-looking
statements include, but are not limited to, the following:
|
·
|
Our
statement in Part I, Item 1 – “Business” that we believe our
efforts to reduce costs and preserve capital, while maintaining the
breadth of our coverage will lead to a significant improvement in our
financial results as capital market activity
returns.
|
|
·
|
Our
statement in Part I, Item 1 – “Competition” that we believe that
we have the capital and resources to provide our products and services and
that our product offerings are suited to our clients
needs.
|
|
·
|
Our
statements in Part I, Item 1A – “Risk
Factors” that
|
|
o
|
We
believe we may experience competitive pressures as some of our competitors
seek to obtain market share by competing on the basis of
price.
|
|
o
|
We
may grow our business through both internal expansion and through
strategic investments, acquisitions or joint
ventures.
|
|
o
|
We
intend to retain any future earnings to fund the operation and expansion
of our business, and therefore, we do not anticipate paying cash dividends
in the foreseeable future.
|
|
o
|
We
may incur significant expenses in connection with initiating new business
activities or in connection with any expansion of our underwriting,
brokerage or asset management
businesses.
|
|
o
|
We
may engage in strategic acquisitions and investments for which we may
incur significant expenses.
|
|
·
|
Our
statements in Part II, Item 7 – “Management’s Discussion and Analysis of
Financial Condition and Results of Operations”
that
|
|
o
|
We
believe the near-term investment banking opportunity in the technology and
resource sectors to be significant and that our banking platform, with a
focus on these growth sectors, will
benefit.
|
|
o
|
A
significant portion of our new hires have been in brokerage operations and
are professionals who bring incremental relationships to the firm, which
should positively impact future
revenues.
|
|
o
|
We
increased the number of our senior investment banking calling officers,
which we believe will positively impact future
results.
|
|
o
|
We
may carry out repurchases of our common stock from time to time in the
future and our Board of Directors may authorize additional repurchases in
the future, in each case for the purpose of settling obligations to
deliver common stock to employees who have received Restricted Stock Units
under our Equity Incentive Plan.
|
|
o
|
We
believe that our current level of equity capital, current cash balances,
funds anticipated to be provided by operating activities and funds
available to be drawn under temporary loan agreements, will be adequate to
meet our liquidity and regulatory capital requirements for the next 12
months.
|
Item
1. Business
Overview
We are an
investment bank focused principally on growth companies and growth investors. We
provide a combination of bulge bracket capabilities and specialized services to
this segment of the market. Our service offerings include strategic
advice on mergers and acquisitions and raising public and private equity,
independent equity research insights, asset management services and proven
brokerage transaction execution capabilities. We focus on building
and maintaining long-term strategic advisory relationships with growth companies
and take a lifecycle approach to servicing these companies. We combine our
industry knowledge base with our corporate, venture capital and professional
relationships to identify leading growth companies for our
services.
Our
executive offices are located at One Montgomery Street, San Francisco,
California. We have offices in more than 12 cities throughout North America and
Europe.
We were
formed in 1998 as Thomas Weisel Partners Group LLC and on February 7, 2006,
Thomas Weisel Partners Group, Inc. (“TWPG”), a Delaware corporation, succeeded
to the business of Thomas Weisel Partners Group LLC and completed an initial
public offering of its common stock.
We are
committed to being a premier global, growth-focused, investment bank. In January
2008, we completed our acquisition of Westwind Capital Corporation, an
independent, institutional investment bank focused on growth companies and
growth investors, particularly in the energy and mining sectors. Through the
acquisition, we expanded our coverage of growth verticals, adding energy and
mining, and significantly enhanced our global presence.
We are
exposed to volatility and trends in the general securities market, the economy
and in particular the growth sectors of the economy. The global credit crisis,
corporate consolidation and failures, lack of investor confidence and further
economic deterioration all led to a dramatic slowdown in the capital markets,
which in turn impacted the number of our investment banking transactions. During
this period, we made a concerted effort to reduce costs and preserve capital,
while maintaining the breadth of our coverage. We believe these efforts will
lead to a significant improvement in our financial results as capital market
activity returns.
Principal
Business Lines
Our
business is organized into four service offerings: investment banking,
brokerage, equity research and asset management.
Investment
Banking
Our
investment bankers provide two primary categories of services:
(i) corporate finance and (ii) strategic advisory.
Corporate Finance. Our
corporate finance practice is comprised of industry coverage groups that advise
on and structure capital raising solutions for our corporate clients through
public and private offerings of equity and debt securities, including
convertible debt. We offer a wide range of financial services designed to meet
the needs of growth companies, including initial public offerings, follow-on and
confidentially marketed offerings, equity-linked offerings, private investments
in public equity and private placements of debt and equity securities. Within
corporate finance, our capital markets group executes a variety of transactions,
both public underwritten securities offerings and private agented offerings,
assists clients with investor relations advice and introduces companies seeking
to raise capital to investors that we believe will be supportive long-term
investors. We assist the efforts of our corporate finance practice by providing
aftermarket trading support for our corporate finance clients.
Strategic
Advisory. Our strategic
advisory services include general strategic advice as well as transaction
specific advice regarding mergers and acquisitions, divestitures, spin-offs,
privatizations, special committee assignments and takeover defenses. Our
specialized advisory professionals work in conjunction with our industry
coverage groups in advising our corporate clients. We seek to become a trusted
advisor to the leading growth companies and to achieve a balance between our
buy- and sell-side assignments. Our buy- and sell-side assignments are generated
through our network of business relationships and by our reputation for quality
execution. Our strategic advisory services are also supported by our
capital markets professionals,
who provide assistance in acquisition financing and market intelligence in
connection with mergers and acquisitions transactions.
Brokerage
We
provide two principal categories of services within our brokerage operations:
(i) institutional brokerage, which comprises institutional sales, sales
trading, trading, special situations and non-deal road shows and
(ii) private client services.
Institutional Brokerage. We
provide equity and non-equity securities sales and trading services to more than
1,000 institutional investors.
Institutional Sales. Our
institutional sales professionals provide equity and non-equity securities sales
services to institutional investors and seek to develop strong relationships
with the portfolio managers they serve by developing expertise and working
closely with our equity research department. Our institutional sales
professionals focus on growth companies identified by our equity research
department and seek to develop a thorough understanding of those
companies.
Sales Trading. Our sales
traders are experienced in the industry and are knowledgeable regarding both the
markets for growth company securities and the institutional traders who buy and
sell them. Through our sales trading professionals, we connect with many large
and active buy-side trading desks in the United States, Canada and
Europe.
Trading. Our trading
professionals provide support to our institutional clients in their pursuit of
best execution, including facilitating block trades, providing electronic
trading services, committing capital and otherwise providing
liquidity.
Special Situations. Our
special situations group focuses on sourcing liquidity via overnight block
trades, reverse inquiries and quiet accumulations for investment banking,
institutional, private equity and high net worth clients in a confidential
manner and in connection with these activities engages in certain proprietary
trading activities.
Non-Deal Road Shows. We work
to leverage our industry knowledge and relationships by helping our
institutional clients maintain and build corporate contacts through coordinating
company and investor meetings that are unrelated to planned or pending
investment banking transactions, commonly referred to as non-deal road shows. We
believe these non-deal road shows underscore our high-service approach, promote
our brokerage services and are valued by our institutional brokerage clients.
Non-deal road shows present an environment for investors to further their
understanding of companies in which they have an equity position or that may be
attractive investment opportunities and for company executives to broaden
relationships with their investors and develop relationships with potential
investors.
Private Client Services. Our
private client services department offers brokerage and advisory services to
high-net-worth individuals. Our private client professionals emphasize capital
preservation and growth through prudent planning and work closely with clients
to personalize solutions that address their individual needs.
Equity
Research
Our
research analysts perform independent research to help our clients understand
the dynamics that drive the sectors and companies they cover. We seek to
differentiate ourselves through originality of perspective, depth of insight and
ability to uncover industry trends.
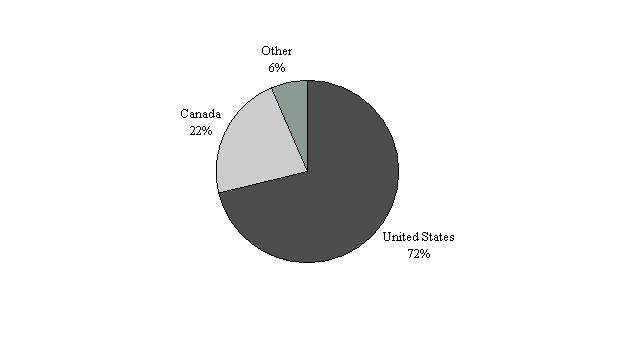
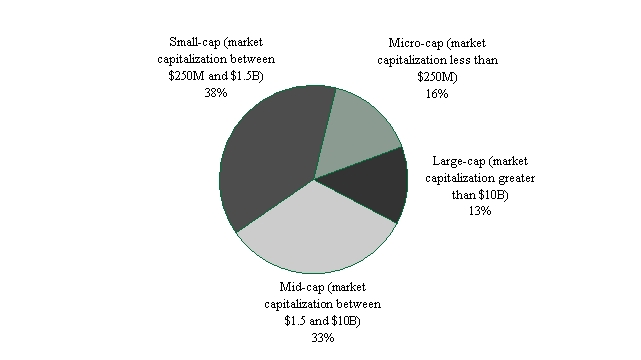
As of
December 31, 2009, our equity research professionals covered 500 companies
headquartered in 21 countries. Approximately 87% of the companies covered had
market capitalizations of $10 billion or less.
Equity
Research by Geographic Location of Company Headquarters
(as of
December 31, 2009)
Equity
Research by Market Capitalization
(as of
December 31, 2009)
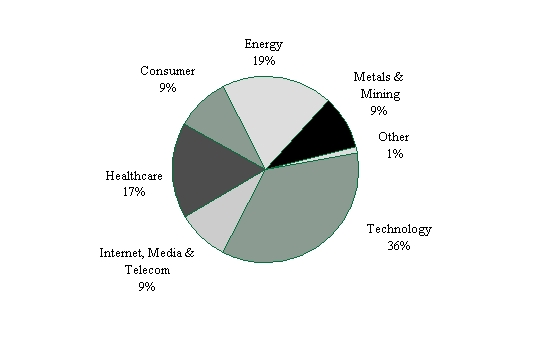
The
sectors and industry components we focus on within equity research are set forth
in the table and chart below:
|
Technology
|
Healthcare
|
Energy
|
|
Hardware
|
• Biotechnology
|
•
Alternative Energy
|
|
• Applied
Technologies
|
• Healthcare
Information Technology and
|
•
Energy Equipment & Services
|
|
• Communications
Equipment
|
Pharmaceutical
Services
|
• International
Oil & Gas
|
|
• Computer
Systems and Storage
|
• Healthcare
Services
|
•
Oil & Gas Exploration and Production
|
|
• Electronic
Supply Chain
|
• Life
Science and Medical Technology
|
|
|
• Information
& Financial Technology Services
|
• Pharmaceuticals:
Specialty
|
Metals
and Mining
|
|
• Semiconductors:
Analog & Mixed Signal
|
•
Base Metals and Uranium
|
|
|
• Semiconductors:
Processors & Components
|
Consumer
|
•
Gold and Precious Metals
|
|
• Retailing:
Hardlines
|
|
|
|
Software &
Services
|
• Retailing:
Softlines
|
Other
|
|
• Software:
Applications & Communications
|
• Sports
and Lifestyle Brands
|
•
Special Situations
|
|
• Software:
Infrastructure
|
•
Financial Services
|
|
|
•
Fertilizers / Materials
|
||
|
Internet
Media and Telecom
|
||
|
•
Internet Services
|
||
|
•
Media & Entertainment
|
||
|
• Telecom
Services
|
Equity
Research by Sector
(based on
number of companies covered as of December 31, 2009)
Our
research analysts analyze major trends, publish research on new areas of growth,
provide fundamental, company-specific coverage and work with our institutional
clients to identify and evaluate investment opportunities in publicly traded
companies. They periodically publish comprehensive “white-paper” studies of an
industry or a long-term investment theme, provide analysis and commentary on
growth companies and publish detailed primary research on investment
opportunities.
We
annually host several sector conferences targeting growth companies and
investors, including an Alternative Energy Conference, Consumer Conference,
Emerging Communications Conference, Energy Conference, Healthcare Conference,
Metals and Mining Conference and Technology and Telecom Conference. We use these
specialized events to showcase companies to institutional investors focused on
investing in these growth sectors. We believe that our conferences differentiate
us from smaller investment banks that may lack the relationships and resources
to host broadly attended industry events.
Asset
Management
Our asset
management division is divided into three principal units: (i) private
investment funds, (ii) public equity investment products and (iii) distribution
management.
Private Investment Funds. We
are currently the managing general partner of three groups of investment
funds:
|
·
|
Thomas
Weisel Global Growth Partners is a fund of funds for private primary fund
investments formed in 2000 with capital commitments of
$287.6 million. A fund for secondary private equity fund investments
with capital commitments of $130.9 million was formed in 2002, a
third fund for private equity secondary investments with capital
commitments of $54.0 million was formed in 2008 and a fourth fund for
private equity investments with capital commitments of $45.5 million was
formed in 2009.
|
|
·
|
Thomas
Weisel Healthcare Venture Partners is a healthcare venture capital fund
that invests in the emerging life sciences and medical technology sectors.
The fund was formed in 2003 with capital commitments of $121.8
million.
|
|
·
|
Thomas
Weisel Venture Partners is a venture capital fund that invests in
information technology companies, particularly in the broadly defined
software and communications industries. The fund was formed in 2000 with
capital commitments of approximately
$252.5 million.
|
As
manager of these funds, we receive management fees generally based on committed
capital or net assets of the partnerships.
We
maintain a non-managing special limited partner interest in Thomas Weisel India
Opportunity Fund, L.P. (“TWIOF”) as a result of a transaction in December 2008
under which (i) Thomas Weisel Capital Management LLC, the former investment
advisor of TWIOF, assigned its rights, responsibilities and obligations as
advisor of TWIOF to Guggenheim Partners India Management, LLC, an affiliate of
Guggenheim Partners, (ii) Guggenheim Partners India GP, LLC , an affiliate of
Guggenheim Partners, became the general partner of TWIOF and (iii) affiliates of
Guggenheim Partners acquired, directly or indirectly, assets related to the
operation of TWIOF, including assets from our India subsidiary, Thomas Weisel
International Private Limited. As a result of the transaction, neither us nor
any of our affiliates manages TWIOF but an affiliate of ours continues to
maintain an immaterial economic interest in TWIOF, consisting of an investment
of less than $0.6 million and a right to participate in a portion of the carried
interest of the fund.
Public Equity Investment
Products. We have a small/mid-cap growth public equity investment team
based in Portland, Oregon. We have provided approximately $18 million of seed
investment capital for the products they manage. This public equity investment
team also manages products through an asset management subsidiary and is
entitled to receive approximately 50% of net profits generated.
Distribution Management.
Distribution management actively manages securities distributions from private
equity and venture capital funds. We seek to enhance the returns realized by
distributions made from private equity and venture capital funds. The
distribution management services we provide include dedicated portfolio
management, execution, consolidated reporting and administrative
support.
Employees
As of
December 31, 2009, we had 453 employees, excluding those employees who have
given notice to leave or those on garden leave.
Our
professionals draw upon their experience and market expertise to provide
differentiated advice and customized services to our clients. We believe our
professionals are attracted to our company by our specialized market focus,
entrepreneurial culture and commitment to our clients. None of our employees are
represented by collective bargaining agreements. We have not experienced any
work stoppages and believe our relationship with our employees to be
satisfactory.
Competition
As an
investment bank, all aspects of our business are intensely competitive. Our
competitors are investment banking firms, other brokerage firms and financial
advisory firms. We compete with some of our competitors nationally or regionally
and with others on a product or service level. Many of our competitors have
substantially greater capital and resources than we do and offer a broader range
of financial products. We believe that the principal factors affecting
competition in our business include client relationships, reputation, the
abilities of our professionals, market focus and the relative quality and price
of our services and products.
In recent years there has been
substantial consolidation and convergence among companies in the financial
services industry. Legislative and regulatory changes in the United States
have allowed commercial
banks to enter businesses previously limited to investment banks, and a number
of large commercial banks, insurance companies and other broad-based financial
services firms have established or acquired broker-dealers or merged with other
financial institutions. This trend toward consolidation and convergence has
significantly increased the capital base and geographic reach of many of our
competitors. Many of our competitors have the ability to offer a wider range of
products and services that may enhance their competitive position. They may also
have the ability to support investment banking and securities products and
services with commercial banking, insurance and other financial services
capabilities in an effort to gain market share, which could result in pricing
pressure in our businesses.
We
experience price competition with respect to our investment banking business.
One trend, particularly in the equity underwriting business, toward multiple
book runners has increased the competitive pressure in the investment banking
industry and may lead to lower average transaction fees.
We
experience price competition with respect to our brokerage business, including
large block trades, spreads and trading commissions. The ability to execute
trades electronically and through other alternative trading systems has
increased the pricing pressure on trading commissions and spreads, as well as
affected the volume of trades being executed through traditional full-service
platforms.
We
experience competition with respect to our asset management business both in the
pursuit of investors for our investment funds and products and in the
identification and completion of investments in attractive portfolio companies
for our investment funds. We compete for individual and institutional clients on
the basis of price, the range of products we offer, the quality of our services
as well as on the basis of financial resources available to us and invested in
our products. We may be competing with other investors and corporate buyers for
the investments that we make.
Competition
is also intense for the recruitment and retention of qualified professionals.
Our ability to continue to compete effectively in our businesses will depend
upon our continued ability to attract new professionals and retain and motivate
our existing professionals.
Despite
the competition that we face, we believe our investment banking, brokerage and
research products compare favorably with those of our competitors. We believe
that we have the capital and resources to provide our products and services and
that our product offerings are suited to our clients needs. We believe that our
focus and reputation for providing these products and services to growth
companies and the relationships we have built within these communities
differentiates us from our competition.
As
compared to our competitors, we may be limited in providing our investment
banking and brokerage products and services by our regulatory
capital.
The
competitive landscape in Canada and Europe is similar to that of the United
States where we face competition from investment banking firms, other brokerage
firms and financial advisory firms, many of who have substantially greater
capital resources than us and offer a broader range of financial
products.
Regulation
Our
business, as well as the financial services industry in general, is subject to
extensive regulation in the United States, Canada and elsewhere. As a matter of
public policy, regulatory bodies in the United States, Canada and the rest of
the world are charged with safeguarding the integrity of the securities and
other financial markets and with protecting the interests of customers
participating in those markets. These regulatory bodies adopt and amend rules
(which are subject to approval by government agencies) for regulating the
industry and conduct periodic examinations of members. In the United States, the
Securities and Exchange Commission (the “SEC”) is the federal agency responsible
for the administration of the federal securities laws.
Thomas
Weisel Partners LLC (“TWP”), our wholly-owned subsidiary, is registered as a
broker-dealer with the SEC and the Financial Industry Regulatory Authority
(“FINRA”), a self-regulatory organization which is itself subject to oversight
by the SEC and which adopts and enforces rules governing the conduct, and
examines the activities of its member firms in all 50 states and the
District of Columbia. Accordingly, TWP is subject to regulation and oversight by
the SEC and FINRA. In 2007, TWP opened and registered branch offices in London,
England, Zurich, Switzerland, Chicago, Illinois, Cleveland, Ohio and Baltimore,
Maryland. In 2008, TWP opened and registered branch offices in Denver, Colorado,
Toronto, Ontario, Canada, and Calgary, Alberta, Canada. In 2009, TWP opened and
registered a branch office in Dallas, Texas. State securities regulators also
have regulatory or oversight authority over TWP. In addition, TWP and several
other wholly-owned subsidiaries of ours, including Thomas Weisel Capital
Management LLC, Thomas Weisel Asset Management LLC, TW Asset Management LLC and
Thomas Weisel Global Growth Partners LLC, are registered as investment advisers
with the SEC and therefore are subject to their regulation and oversight. TWP is
also a member of, and is subject to regulation by, the New York Stock Exchange
(“NYSE”), the American Stock Exchange and the Ontario Securities Commission. TWP
is also registered as an introducing broker with the Commodity Futures Trading
Commission and is a member of the National Futures Association.
Broker-dealers
are subject to regulations that cover all aspects of the securities business,
including sales methods, trade practices among broker-dealers, use and
safekeeping of customers’ funds and securities, capital structure,
record-keeping, the financing of customers’ purchases and the conduct and
qualifications of directors, officers and employees. We are required by the SEC
to be a member of the Securities Investors Protection Corporation (“SIPC”).
SIPC’s primary role is investor protection. As a member firm we may be assessed
fees on our revenues. The SIPC provides protection for securities and cash held
in client accounts up to $500,000 per client, with cash claims not to exceed
$100,000. This coverage does not protect against market fluctuations. As a
registered broker-dealer and member of various self-regulatory organizations,
TWP is subject to the SEC’s uniform net capital rule, Rule 15c3-1. The uniform
net capital rule specifies the minimum level of net capital a broker-dealer must
maintain. The SEC and various self-regulatory organizations impose rules that
require notification when net capital falls below certain predefined criteria
that limit the ratio of subordinated debt to equity in the regulatory capital
composition of a broker-dealer and that constrain the ability of a broker-dealer
to expand its business under certain circumstances. Additionally, the SEC’s
uniform net capital rule imposes certain requirements that may have the effect
of prohibiting a broker-dealer from distributing or withdrawing capital and
requiring prior notice to the SEC for certain withdrawals of capital. The SEC
has adopted rule amendments that establish alternative net capital requirements
for broker-dealers that are part of a consolidated supervised entity. As a
condition to its use of the alternative method, a broker-dealer’s ultimate
holding company and affiliates (referred to collectively as a consolidated
supervised entity) must consent to group-wide supervision and examination by the
SEC. If we elect to become subject to the SEC’s group-wide supervision, we will
be required to report to the SEC computations of our capital
adequacy.
Thomas
Weisel Partners Canada, Inc. (“TWPC”), our registered Canadian broker-dealer
subsidiary, is subject to regulation by the securities commissions of Ontario,
Quebec, Alberta, British Columbia, Manitoba, Saskatchewan and Nova Scotia, is a
member of the Investment Industry Regulatory Organization of Canada (“IIROC”)
and is a participating organization of the Toronto Stock Exchange and the TSX
Venture Exchange. TWPC is required by the IIROC to belong to the Canadian
Investors Protection Fund (“CIPF”), whose primary role is investor protection.
The CIPF may charge member firms assessments based on revenues and risk
premiums. The CIPF provides protection for securities and cash held in client
accounts up to CDN$1,000,000 per client with separate coverage of CDN$1,000,000
for certain types of accounts. This coverage does not protect against market
fluctuations. TWPC is subject to the minimum capital rule (By-Law No. 17 of the
IIROC) and the early warning system (By-Law No. 30 of the IIROC). The minimum
capital rule requires that every member shall have and maintain at all times
risk adjusted capital greater than zero calculated in accordance with Form 1
(Joint Regulatory Financial Questionnaire and Report) and with such requirements
as the Board of Directors of the IIROC may from time to time prescribe.
Insufficient risk adjusted capital may result in suspension from membership of
the IIROC.
Thomas
Weisel Partners International Limited, a registered U.K. broker-dealer
subsidiary, is subject to regulation by the Financial Securities Authority in
the United Kingdom. Our broker-dealer branch office in Zurich, Switzerland is
subject to the oversight of the Swiss Federal Banking Commission.
The
effort to combat money laundering and terrorist financing is a priority in
governmental policy with respect to financial institutions. The USA PATRIOT
Act of 2001 contains anti-money laundering and financial transparency laws and
mandates the implementation of various new regulations applicable to
broker-dealers and other financial services companies, including standards for
verifying client identification at account opening and obligations to monitor
client transactions and report suspicious activities. Anti-money laundering laws
outside the United States contain some similar provisions. The obligation of
financial institutions, including us, to identify their customers, watch for and
report suspicious transactions, respond to requests for information by
regulatory authorities and law enforcement agencies, and share information with
other financial institutions, has required the implementation and maintenance of
internal practices, procedures and controls which have increased, and may
continue to increase, our costs, and any failure with respect to our programs in
this area could subject us to regulatory consequences, including substantial
fines and potentially other liabilities.
In
addition to U.S. federal regulations, certain of our businesses are subject
to compliance with laws and regulations of U.S. state governments,
non-U.S. governments, their respective agencies and/or various
self-regulatory organizations or exchanges relating to the privacy of client
information. Any failure to comply with these regulations could expose us to
liability and/or reputational damage.
Additional
legislation, changes in rules promulgated by the SEC and self-regulatory
organizations or changes in the interpretation or enforcement of existing laws
and rules, either in the United States, Canada or elsewhere, may directly affect
the mode of our operations and profitability.
U.S. and
non-U.S. government agencies and self-regulatory organizations, as well as
state securities commissions in the United States, are empowered to conduct
administrative proceedings that can result in censure, fine, the issuance of
cease-and-desist orders or the suspension or expulsion of a broker-dealer or its
directors, officers or employees. Occasionally, our subsidiaries have been
subject to investigations and proceedings, and sanctions have been imposed for
infractions of various regulations relating to our
activities.
Where
You Can Find More Information
We are
required to file annual, quarterly and current reports, proxy statements and
other information required by the Exchange Act, with the SEC. You may read and
copy any document we file with the SEC at the SEC’s public reference room
located at 100 F Street, N.E., Washington, D.C. 20549, U.S.A.
Please call the SEC at 1-800-SEC-0330 for further information on the public
reference room. Our SEC filings are also available to the public from the SEC’s
internet site at http://www.sec.gov.
We
maintain a public internet site at http://www.tweisel.com and make available
free of charge through this site our Annual Reports on Form 10-K, Quarterly
Reports on Form 10-Q, Current Reports on Form 8-K, Proxy Statements and
Forms 3, 4 and 5 filed on behalf of directors and executive officers, as
well as any amendments to those reports filed or furnished pursuant to the
Exchange Act as soon as reasonably practicable after we electronically file such
material with, or furnish it to, the SEC. We also post on our website the
charters for our Board of Directors’ Audit Committee, Compensation Committee and
Corporate Governance and Nominations Committee, as well as our Corporate
Governance Guidelines, our Code of Conduct and Ethics governing our directors,
officers and employees and other related materials. In addition, we also post on
our website, under “Investment Banking – Transactions”, links to listings of our
completed investment banking transactions and our transactions in registration.
The information on our website is not part of this Annual Report.
Our
Investor Relations Department can be contacted at Thomas Weisel Partners Group,
Inc., One Montgomery Street, San Francisco, California 94104,
Attention: Investor Relations; telephone: 415-364-2500; e-mail:
investorrelations@tweisel.com.
Item
1A. Risk
Factors
We face a
variety of risks in our business, many of which are substantial and inherent in
our business and operations. The following are some of the important risk
factors that could affect our business, our industry and holders of our common
stock. These risks are not exhaustive. Other sections of this Annual Report on
Form 10-K may include additional factors which could adversely impact our
business and financial performance. Moreover, we operate in a very competitive
and rapidly changing environment. New risk factors emerge from time to time and
it is not possible for our management to predict all risk factors, nor can we
assess the impact of all factors on our business or the extent to which any
factor, or combination of factors, may cause actual results to differ materially
from those contained in any forward-looking statements.
Risks
Related to Our Business
Our
businesses have been and may continue to be adversely affected by conditions in
the global financial markets and economic conditions generally.
Our
businesses, by their nature, do not produce predictable earnings, and are
affected by changes in economic conditions generally and in particular by
conditions in the financial markets. Beginning in mid-2007, these conditions
have changed suddenly and, for a period of time in the fall of 2008 and into
2009, very negatively.
In the
fall of 2008 and into 2009, the financial services industry and the securities
markets generally experienced significant valuation declines in virtually all
asset categories. This was initially triggered by the subprime mortgage crisis,
but eventually spread to other asset classes, including equities. Financial
markets over this period have been characterized by substantially higher
volatility, a lack of liquidity and a general loss of investor confidence,
initially in financial institutions, and eventually companies in a number of
other industries and in the broader markets, including the industries in which
we specialize. While the markets have generally stabilized and improved since
the early part of 2009, asset values for many asset classes have not returned to
previous levels. Business, financial and economic conditions continue to be
negatively impacted by the events of recent years.
Market
conditions have also led to the failure or merger of a number of prominent
financial institutions with which we compete. Financial institution failures or
near-failures have resulted in further losses and have also impacted the trading
prices of shares in all financial institutions, including ours. In addition,
during 2009, the United States and many other international markets experienced
a recession. Business activity across a wide range of industries and regions,
including the sectors in which we specialize, has been greatly reduced, and many
companies were, and some continue to be, in serious difficulty.
Our
investment banking business has been and may continue to be adversely affected
by market conditions. Poor economic conditions and other adverse conditions can
adversely affect and have adversely affected investor confidence, resulting in
significant industry-wide declines in the size and number of underwritings and
of financial advisory transactions, which could have an adverse effect on our
revenues and our profit margins. In addition, reductions in the trading prices
for equity securities tend to reduce the deal value of investment banking
transactions, such as underwritings and mergers and acquisitions transactions,
which in turn may reduce the fees we earn from these transactions.
In
certain circumstances, market uncertainty or general declines in market or
economic activity may affect our brokerage businesses by decreasing levels of
overall activity or by decreasing volatility, but at other times market
uncertainty and even declining economic activity may result in higher trading
volumes or higher spreads or both.
Also,
difficult market conditions have decreased the value of certain assets under
management in our asset management and private client business, which decrease
the amount of asset-based fees we receive, and may also affect our ability to
attract additional, or retain existing, assets under management within these
businesses.
In
addition, as an investment bank focused principally on the growth sectors of the
economy, we depend significantly on transactions by venture capital-backed
companies for sources of revenues and potential business opportunities. To the
extent venture capital investment activities slow due to difficult market
conditions or otherwise, our business, financial condition, results of
operations and cash flows may be adversely affected.
Our
financial performance depends to a great extent on the economic environment in
which we operate. While the business environment has generally improved since
early 2009, there can be no assurance that these conditions will continue in the
near or long term. Accordingly, our results of operations will continue to
fluctuate and may not improve until the business environment
stabilizes.
We
focus principally on specific sectors of the economy, and deterioration in the
business environment in these sectors generally or decline in the market for
securities of companies within these sectors could materially adversely affect
our businesses.
We focus
principally on the technology, healthcare, energy and alternative energy, mining
and consumer sectors of the economy. Underwriting transactions, strategic
advisory engagements and related trading activities in our focus sectors
represent a significant portion of our businesses. Therefore, volatility in the
business environment in these sectors generally, or in the market for securities
of companies within these sectors particularly, could substantially affect our
financial results and the market value of our common stock. The business
environment for companies in these sectors can experience substantial
volatility, and our financial results may consequently be subject to significant
variations from year to year. The market for securities in each of our focus
sectors may also be subject to industry-specific risks. For example, changes in
policies by the United States Food and Drug Administration may affect the market
for securities of biotechnology and healthcare companies and volatility in the
commodities markets may affect the market for securities of energy or mining
companies that operate in the affected markets. Any future downturns in our
focus sectors could materially adversely affect our business and results of
operations.
Regulatory and legal
developments related to auction rate securities could adversely affect our
business, financial condition, operations and cash flow.
Since
February 2008, the auctions through which most auction rate securities (“ARS”)
are sold and interest rates are determined have failed, resulting in a lack of
liquidity for these securities.
We,
together with many other firms in the financial services industry, have received
inquiries from FINRA requesting information concerning purchases of ARS by our
customers. Separately, we have been named in FINRA arbitrations filed by three
retail customers who purchased ARS.
We did
not, at any time, underwrite ARS or manage the associated auctions. We acted as
agent for our customers when buying in auctions managed by underwriters.
Nevertheless, some combination of FINRA and/or our customers could seek to
compel us to purchase ARS from our customers, although we do not have sufficient
regulatory capital nor do we have cash or borrowing capacity to repurchase all
of the ARS held by those customers. We are and have been exploring potential
solutions for our Private Client Services customers and have supported the
efforts of industry participants, including particularly the efforts of those
underwriters of ARS who have entered into settlements with the SEC and other
regulators that contain “best efforts” commitments to repurchase ARS, to resolve
issues relating to the lack of liquidity for ARS. We have filed Statements of
Claims with FINRA against the various investment banks who acted as the
underwriters and auction managers of most of the ARS currently held by our
customers. Through this process, we hope to secure for our customers relief that
is the same as or equivalent to the relief that these entities have agreed to
provide to their own retail customers.
On July
23, 2009, the Staff of the Enforcement Department of FINRA advised the Company
that the Staff has made a preliminary determination to recommend disciplinary
action against the Company relating to certain activities involving ARS. The
Staff’s recommendation involves potential violations of FINRA and Municipal
Securities Rulemaking Board rules and certain anti-fraud and other provisions of
the Federal securities laws in connection with particular transactions involving
ARS. A Staff preliminary determination is neither a formal allegation nor is it
evidence of wrongdoing.
The
Company has responded to the Staff’s preliminary determination and continues to
communicate with the Staff in an effort to try to resolve the matter. Based upon
its discussions with the Staff, the Company believes that it has reached an
understanding in principle, subject to documenting that understanding in a
letter of acceptance, waiver and consent acceptable to FINRA, that would resolve
all aspects of the investigation of the Company. In light of the terms of that
agreement in principle, the Company has established in total a $4.0 million
provision for loss contingencies related to the FINRA investigation, all of
which would be paid to FINRA as a fine in connection with the resolution of all
aspects of the investigation of the Company.
There can
be no assurance, however, that the Company’s efforts to resolve these matters
will be successful or that a disciplinary proceeding will not be brought. The
Company is prepared to contest vigorously any formal disciplinary action that
would result in a censure, fine, or other sanction that could be material to its
business, financial condition, operations and cash flows. If FINRA were to
institute disciplinary action, it is possible that such action could result in a
material adverse effect on the Company’s business, financial condition,
operations and cash flows. However, the Company is unable to determine at this
time the impact of the ultimate resolution of this matter.
Our
financial results may fluctuate substantially from period to period, which may
impair our stock price.
We have
experienced, and expect to experience in the future, significant periodic
variations in our revenues and results of operations. These variations may be
attributable in part to the fact that our investment banking revenues are
typically earned upon the successful completion of a transaction, the timing of
which is uncertain and beyond our control. In most cases we receive little or no
payment for investment banking engagements that do not result in the successful
completion of a transaction. As a result, our business is highly dependent on
market conditions as well as the decisions and actions of our clients and
interested third parties. For example, a client’s acquisition transaction may be
delayed or terminated because of a failure to agree upon final terms with the
counterparty, failure to obtain necessary regulatory consents or board or
shareholder approvals, failure to secure necessary financing, adverse market
conditions or unexpected financial or other problems in the client’s or
counterparty’s business. If the parties fail to complete a transaction on which
we are advising or an offering in which we are participating, we will earn
little or no revenue from the transaction. This risk may be intensified by our
focus on growth companies, as the market for securities of many of these
companies has experienced significant variations in the number and size of
equity offerings. Recently, more companies initiating the process of an initial
public offering are simultaneously exploring merger and acquisition
opportunities. If we are not engaged as a strategic advisor in any such
dual-tracked process, our investment banking revenues would be adversely
affected in the event that an initial public offering is not
consummated.
Our
ability to retain our professionals and recruit additional professionals is
critical to the success of our business, and our failure to do so may materially
adversely affect our reputation, business and results of
operations.
Our
ability to obtain and successfully execute our business depends upon the
personal reputation, judgment, business generation capabilities and project
execution skills of our senior professionals, particularly Thomas W. Weisel, our
founder, Chairman and Chief Executive Officer, Lionel F. Conacher, our President
and Chief Operating Officer, and the other members of our Executive Committee.
Our senior professionals’ personal reputations and relationships with our
clients are a critical element in obtaining and executing client engagements. We
encounter intense competition for qualified employees from other companies in
the investment banking industry as well as from businesses outside the
investment banking industry, such as investment advisory firms, hedge funds,
private equity funds and venture capital funds. From time to time, we have
experienced losses of investment banking, brokerage, research and other
professionals, and losses of our key personnel may occur in the future. The
departure or other loss of Mr. Weisel, Mr. Conacher, any other member of our
Executive Committee or any other senior professional who manages substantial
client relationships and possesses substantial experience and expertise, could
impair our ability to secure or successfully complete engagements, protect our
market share or retain assets under management, each of which, in turn, could
materially adversely affect our business and results of operations. Certain of
our investment funds may be subject to key man provisions which, upon the
departure or other loss of some or all of the investment professionals managing
the fund, may permit the investors in the fund to dissolve the fund or may
result in a reduction of the management fees paid with respect to the investment
fund.
In
connection with our initial public offering and our conversion to corporate
form, many of our professionals received substantial amounts of common stock in
exchange for their membership interests. Ownership of, and the ability to
realize equity value from, our common stock, unlike that of membership interests
in Thomas Weisel Partners Group LLC (the predecessor to TWPG), does not depend
upon continued employment, and our professionals are not restricted from leaving
us by the potential loss of the value of their ownership interests. Similarly,
in connection with our acquisition of Westwind, many of the Westwind
professionals received substantial amounts of common stock (or shares
exchangeable for our common stock) in consideration of their ownership interests
in Westwind. Ownership of, and the ability to realize equity value from our
common stock (or shares exchangeable for our common stock), unlike that of
ownership interests in Westwind, does not depend on continued employment, and
these professionals are not restricted from leaving us by potential loss of the
value of their ownership interests. These shares of common stock (and shares
exchangeable for our common stock) are subject to certain restrictions on
transfer, and a portion are pledged to secure liquidated damages obligations to
us as set forth in the Partners’ Equity Agreement and the Westwind Capital
Corporation Shareholders’ Equity Agreement, each of which has been filed as an
exhibit to our Annual Report on Form 10-K for the fiscal year ended December 31,
2008. However, these agreements will survive for only a limited period and will
permit any professional that is party thereto to leave us without losing any of
their shares of common stock (or shares exchangeable for our common stock) if
they comply with these agreements, and, in some cases, compliance with these
agreements may also be waived. Consequently, the steps we have taken to
encourage the continued service of these individuals after our initial public
offering and after the acquisition of Westwind may not be
effective.
If any of
our professionals were to join an existing competitor or form a competing
company, some of our clients could choose to use the services of that competitor
instead of our services. The compensation arrangements, non-competition
agreements and lock-up agreements we have entered into with certain of our
professionals may not prove effective in preventing them from resigning to join
our competitors, and the non-competition agreements may not be upheld if we were
to seek to enforce our rights under these agreements.
If we are
unable to retain our professionals or recruit additional professionals, our
reputation, business, results of operations, financial condition and cash flows
may be materially adversely affected.
Pricing
and other competitive pressures may impair the revenues and profitability of our
brokerage business.
We derive
a significant portion of our revenues from our brokerage business. Along with
other brokerage firms, we have experienced intense price competition in this
business in recent years. In particular, the ability to execute trades
electronically and through other alternative trading systems has increased the
pressure on trading commissions, volume and spreads and has required us to make
investments in our brokerage business in order to compete. We expect this trend
toward alternative trading systems to continue. We believe we may experience
competitive pressures in these and other areas as some of our competitors seek
to obtain market share by competing on the basis of price. In addition, we face
pressure from our larger competitors, which may be better able to offer a
broader range of complementary products and services to brokerage clients in
order to win their trading business. As we are committed to maintaining our
comprehensive research coverage to support our brokerage business, we may be
required to make substantial investments in our research capabilities. If we are
unable to compete effectively with our competitors in these areas, brokerage
revenues may decline and our business, financial condition and results of
operations may be adversely affected.
We
face strong competition from larger firms.
The
brokerage, investment banking and asset management industries are intensely
competitive, and we expect them to remain so. We compete on the basis of a
number of factors, including client relationships, reputation, the abilities and
past performance of our professionals, market focus and the relative quality and
price of our services and products. We have experienced intense price
competition with respect to our brokerage business, including large block
trades, spreads and trading commissions, as well as competition due to the
increased use of commission sharing arrangements. Other competitive pressures in
investment banking, including the trends toward multiple book runners and
multiple financial advisors handling transactions, have continued and could
adversely affect our average fee per transaction, even during periods where the
volume and number of investment banking transactions are increasing. Competitive
factors with respect to our asset management activities include the amount of
firm capital we can invest in new products and our ability to increase assets
under management, including our ability to attract capital for new investment
funds. We believe we may continue to experience competitive pressures in these
and other areas in the future.
Many of
our competitors in the brokerage, investment banking and asset management
industries have a broader range of products and services, greater financial and
marketing resources, larger customer bases, greater name recognition, more
senior professionals to serve their clients’ needs, greater global reach and
more established relationships with clients than we have. These larger and
better capitalized competitors may be better able to respond to changes in the
brokerage, investment banking and asset management industries, to compete for
skilled professionals, to finance acquisitions, to fund internal growth and to
compete for market share generally.
The scale
of our competitors has increased over time as a result of substantial
consolidation among companies in the brokerage and investment banking
industries. In addition, a number of large commercial banks, insurance companies
and other broad-based financial services firms have established or acquired
underwriting or financial advisory practices and broker-dealers or have merged
with other financial institutions. These firms have the ability to offer a wider
range of products than we do, which may enhance their competitive position. They
also have the ability to support investment banking with commercial banking,
insurance and other financial services in an effort to gain market share, which
has resulted, and could further result, in pricing pressure in our businesses.
In particular, the ability to provide financing has become an important
advantage for some of our larger competitors and, because we do not provide such
financing, we may be unable to compete as effectively for clients in a
significant part of the brokerage and investment banking market. If we are
unable to compete effectively with our competitors, our business, financial
condition and results of operations will be adversely affected.
We
have incurred losses and may incur losses in the future.
We
recorded net losses of $203.3 million, including a goodwill impairment charge of
$92.6 million, for the year ended December 31, 2008 and $63.7 million for the
year ended December 31, 2009, and we may incur additional losses in the future.
If we are unable to finance future losses, those losses may have a significant
effect on our liquidity as well as our ability to operate.
In
addition, we may incur significant expenses in connection with initiating new
business activities or in connection with any expansion of our underwriting,
brokerage or asset management businesses. We may also engage in strategic
acquisitions and investments for which we may incur significant expenses.
Accordingly, we will need to increase our revenues at a rate greater than our
expenses to achieve and maintain profitability. If our revenues do not increase
sufficiently, or even if our revenues increase but we are unable to manage our
expenses, we will not achieve and maintain profitability in future
periods.
Our
capital markets and strategic advisory engagements are singular in nature and
may not provide for subsequent engagements.
Our
strategy is to take a lifecycle approach in providing investment banking
services to our clients, however, our investment banking clients generally
retain us on a short-term, engagement-by-engagement basis in connection with
specific capital markets or mergers and acquisitions transactions, rather than
on a recurring basis under long-term contracts. Therefore, we must seek out new
engagements when our current engagements are successfully completed or are
terminated. As a result, high activity levels in any period are not necessarily
indicative of continued high levels of activity in any subsequent period. If we
are unable to generate a substantial number of new engagements and generate fees
from the successful completion of these transactions, our business and results
of operations would likely be adversely affected.
Poor
investment performance, pricing pressure and other competitive factors may
reduce our asset management revenues or result in losses.
Asset
management revenues are primarily derived from management fees which are based
on committed capital and/or assets under management and incentive fees, which
are earned if the return of our investment funds exceeds certain threshold
returns. Our ability to maintain or increase assets under management is subject
to a number of factors, including investors’ perception of our past performance,
market or economic conditions, competition from other fund managers and our
ability to negotiate terms with major investors.
Investment
performance is one of the most important factors in retaining existing clients
and competing for new asset management and private equity business, and our
historical performance may not be indicative of future results. Poor investment
performance and other competitive factors could reduce our revenues and impair
our growth in many ways, including:
|
|
·
|
existing
clients may withdraw funds from our asset management business in favor of
better performing products;
|
|
|
·
|
our
incentive fees could decline or be eliminated
entirely;
|
|
|
·
|
firms
with which we have business relationships may terminate these
relationships with us;
|
|
|
·
|
our
capital investments in our investment funds or the seed capital we have
committed to new asset management products may diminish in value or may be
lost; and
|
|
|
·
|
our
key employees in the business may depart, whether to join a competitor or
otherwise.
|
Our
investment funds include gains and losses that have not yet been realized
through sales or other transactions. These unrealized gains and losses are
recognized in our results of operations because these investments are accounted
for in accordance with accounting principles generally accepted in the United
States of America (“GAAP”) using the fair value method. In most cases, pricing
inputs are unobservable for the investment and include situations where there is
little, if any, market activity for the investment. The inputs used in the
determination of fair value require significant management judgment or
estimation. Due to the inherent uncertainty of valuation, fair values of these
non-marketable investments may differ from the values that would have been used
had a ready market existed for these investments, which differences could be
material, and these differences may result in increased volatility in our asset
management revenues.
To the
extent our future investment performance is perceived to be poor in either
relative or absolute terms, our asset management revenues will likely be reduced
and our ability to raise new funds will likely be impaired. Even when market
conditions are generally favorable, our investment performance may be adversely
affected by our investment style and the particular investments that we
make.
The
contraction of the credit markets and the general downturn of the economy have
been major contributors to a reduction in the available investor capital pool.
This, coupled with the over-allocation of many institutional investors to the
alternative asset fund class, could make it increasingly difficult for us to
raise capital for new investment funds. Also, difficult market conditions have
decreased the value of assets under management in our asset management and
private client business, which decreases the amount of asset-based fees we
receive, and may also affect our ability to attract additional, or retain
existing assets under management within these businesses.
Increases
in capital commitments in our trading, underwriting and other businesses
increase the potential for significant losses.
The trend
in capital markets is toward larger and more frequent commitments of capital by
financial services firms in many of their activities. For example, in order to
attract clients, investment banks are increasingly committing capital to
purchase large blocks of stock from publicly-traded issuers or their significant
shareholders, instead of the more traditional marketed underwriting process, in
which marketing is typically completed before an investment bank commits capital
to purchase securities for resale. We have participated in this trend and expect
to continue to do so. As a result, we will be subject to increased risk as we
commit greater amounts of capital to facilitate primarily client-driven
business. Furthermore, we may suffer losses even when economic and market
conditions are generally favorable for others in the industry.
We may
enter into large transactions in which we commit our own capital as part of our
trading business. The number and size of these large transactions may materially
affect our results of operations in a given period. We may also incur
significant losses from our trading activities due to market fluctuations and
volatility from quarter to quarter. To the extent that we own assets, i.e., have
long positions, a downturn in the value of those assets or in those markets
could result in losses. Conversely, to the extent that we have sold assets we do
not own, i.e., have short positions, an upturn in those markets could expose us
to potentially unlimited losses as we attempt to cover our short positions by
acquiring assets in a rising market.
We also
commit capital to investment funds we sponsor and utilize our own funds as seed
capital for new products and services in our asset management business. These
investments may diminish in value or may be lost entirely if market conditions
are not favorable.
Limitations
on our access to capital could impair our liquidity and our ability to conduct
our businesses.
Liquidity,
or ready access to funds, is essential to financial services firms. Failures of
financial institutions have often been attributable in large part to
insufficient liquidity. Liquidity is of particular importance to our trading
business, and perceived liquidity issues may affect our clients’ and
counterparties’ willingness to engage in brokerage transactions with us. Our
liquidity could be impaired due to circumstances that we may be unable to
control, such as a general market disruption or an operational problem that
affects our trading clients, third parties or us. Further, our ability to sell
assets may be impaired if other market participants are seeking to sell similar
assets at the same time.
Our asset
management business is also subject to liquidity risk due to investments in
high-risk, illiquid assets. We have made substantial principal investments in
our investment funds and may make additional investments in future funds, which
often invest in securities that are not publicly traded. There is a significant
risk that we may be unable to realize our investment objectives by sale or other
disposition at attractive prices or may otherwise be unable to complete any exit
strategy. In particular, these risks could arise from changes in the financial
condition or prospects of the portfolio companies in which investments are made
and from changes in national or international economic conditions or changes in
laws, regulations, fiscal policies or political conditions of countries in which
investments are made. Even if an investment proves to be profitable, it may be
several years or longer before any profits can be realized in cash.
We have
several broker-dealer subsidiaries in several different jurisdictions which are
each subject to the capital requirements of the relevant governmental and
self-regulatory authorities in those jurisdictions. For example, TWP, our
largest broker-dealer subsidiary, is subject to the net capital requirements of
the SEC and various self-regulatory organizations of which it is a member. These
requirements typically specify the minimum level of net capital a broker-dealer
must maintain. Any failure to comply with these net capital requirements could
impair our ability to conduct our core business as a brokerage
firm.
TWP and
our other broker-dealer subsidiaries are subject to laws and regulations that
authorize regulatory bodies to block or reduce the flow of funds from them to
TWPG. As a holding company, TWPG depends on distributions and other payments
from its subsidiaries to fund payments on its obligations, including debt
obligations. As a result, regulatory actions could impede access to funds that
TWPG needs to make payments on these obligations.
Our
ability to refinance existing notes could affect our liquidity and our ability
to conduct our services.
TWPG
has two outstanding senior notes with an aggregate principal amount of $23
million, both of which will mature in February 2011. If TWPG is unable to
refinance those senior notes before they mature there could be a material
negative impact on the cash and capital of TWPG and its subsidiaries that could
impair our ability to conduct our business.
Our
risk management policies and procedures may leave us exposed to unidentified or
unanticipated risk.
Our risk
management strategies and techniques may not be fully effective in mitigating
our risk exposure in all market environments or against all types of
risk.
Among
other risks, we are exposed to the risk that third parties that owe us money,
securities or other assets will not perform their obligations. These parties may
default on their obligations to us due to bankruptcy, lack of liquidity,
operational failure, breach of contract or other reasons. We are also subject to
the risk that our rights against third parties may not be enforceable in all
circumstances. As a clearing member firm, we finance our customer positions and
could be held responsible for the defaults or misconduct of our customers.
Although we regularly review credit exposures to specific clients and
counterparties and to specific industries and regions that we believe may
present credit concerns, default risk may arise from events or circumstances
that are difficult to detect or foresee. In addition, concerns about, or a
default by, one institution could lead to significant liquidity problems, losses
or defaults by other institutions, which in turn could adversely affect us.
Also, risk management policies and procedures that we utilize with respect to
investing our own funds or committing our capital with respect to investment
banking, trading activities or asset management activities may not protect us or
mitigate our risks from those activities. If any of the variety of instruments,
processes and strategies we utilize to manage our exposure to various types of
risk are not effective, we may incur losses.
Our
operations and infrastructure may malfunction or fail.
Our
businesses are highly dependent on our ability to process, on a daily basis, a
large number of complex transactions across diverse markets. Our brokerage
operations, accounting or other data processing systems may fail to operate
properly or become disabled as a result of events that are wholly or partially
beyond our control, including a disruption of electrical or communications
services or our inability to occupy one or more of our offices. The inability of
our systems to accommodate these transactions could also constrain our ability
to expand our businesses. If any of these systems do not operate properly or are
disabled, if we experience difficulties in conforming these systems to changes
in law or regulation or changes in our business activities or if there are other
shortcomings or failures in our internal processes, people or systems, we could
suffer an impairment to our liquidity, financial loss, disruption of our
businesses, liability to clients, regulatory intervention or reputational
damage.
We also
face the risk of operational failure of any of our clearing agents, the
exchanges, clearing houses or other financial intermediaries we use to
facilitate our securities transactions. Any such failure could adversely affect
our ability to effect transactions and to manage our exposure to
risk.
In addition, our ability to conduct business may be adversely
impacted by a disruption in the infrastructure that supports our businesses and
the communities in which we are located. This may include a disruption due to
transitioning from one third-party service provider to another or due to a
disruption involving electrical, communications, transportation or other
services used by us or third parties with which we conduct business, whether due
to fire, other natural disaster, power or communications failure, act of
terrorism or war or otherwise. Nearly all of our employees in our primary
locations work in close proximity to each other. If a disruption occurs in one
location and our employees in that location are unable to communicate with or
travel to other locations, our ability to service and interact with our clients
may suffer, and we may not be able to successfully implement contingency plans
that depend on communication or travel. Insurance policies to mitigate these
risks may not be available or may be more expensive than the perceived benefit.
Further, any insurance that we may purchase to mitigate certain of these risks
may not cover our loss.
Our operations also rely on secure electronic processing, storage and
transmission of confidential information. Our computer systems, software and
networks may be vulnerable to unauthorized access, computer viruses or other
malicious code and other events that could have a security impact. If one or
more of such events occur, this potentially could jeopardize our or our clients’
or counterparties’ confidential and other information processed and stored in
and transmitted through our computer systems and networks or otherwise cause
interruptions or malfunctions in our, our clients’, our counterparties’ or third
parties’ operations. We may be required to expend significant additional
resources to modify our protective measures or to investigate and remediate
vulnerabilities or other exposures, and we may be subject to litigation and
financial losses that are either not insured against or not fully covered
through any insurance maintained by us.
Strategic
investments or acquisitions and joint ventures may result in additional risks
and uncertainties in our business.
We may
grow our business through both internal expansion and through strategic
investments, acquisitions or joint ventures. To the extent we make strategic
investments or acquisitions or enter into joint ventures, we face numerous risks
and uncertainties combining or integrating businesses, including integrating
relationships with customers, business partners and internal data processing
systems. In the case of joint ventures, we are subject to additional risks and
uncertainties in that we may be dependent upon, and subject to liability, losses
or reputational damage relating to, systems, controls and personnel that are not
under our control. In addition, conflicts or disagreements between us and our
joint venture partners may negatively impact our businesses.
Any
future acquisitions or joint ventures could entail a number of risks, including
problems with the effective integration of operations, the inability to maintain
key pre-acquisition business relationships, the inability to retain key
employees, increased operating costs, exposure to unanticipated liabilities,
risks of misconduct by employees not subject to our control, difficulties in
realizing projected efficiencies, synergies and cost savings, and exposure to
new or unknown liabilities.
Any
future growth of our business may require significant resources and/or result in
significant unanticipated losses, costs or liabilities. In addition, expansions,
acquisitions or joint ventures may require significant managerial attention,
which may be diverted from our other operations.
Our
international activities are subject to political, economic, legal, operational
and other risks that are inherent in operating in a foreign
country.
In
connection with our business activities in Canada, England and Switzerland, and
to the extent that we pursue other business opportunities outside the United
States, we will be subject to political, economic, legal, operational and other
risks that are inherent in operating in a foreign country, including risks of
possible nationalization, expropriation, price controls, capital controls,
exchange controls and other restrictive governmental actions, as well as the
outbreak of hostilities. In many countries, the laws and regulations applicable
to the securities and financial services industries are uncertain and evolving,
and it may be difficult for us to determine the exact requirements of local laws
in every market. Our inability to remain in compliance with local laws in a
particular foreign market could have a significant and negative effect not only
on our businesses in that market but also on our reputation generally. We are
also subject to the enhanced risk that transactions we structure might not be
legally enforceable in the relevant jurisdictions.
We
are exposed to foreign currency risk.
As a
result of our international operations, we hold assets, incur liabilities, earn
revenues and pay expenses in foreign currencies, including the Canadian dollar,
the Swiss franc and the pound sterling. Because our financial statements will
continue to be presented in U.S. dollars, we will be required to translate
assets, liabilities, income and expenses that relate to our international
operations and that are denominated in foreign currencies into U.S. dollars at
the then-applicable exchange rates. Additionally, we do not enter into contracts
to hedge against foreign exchange variability inherent in transactions
denominated in foreign currencies. As a result, increases and decreases in
the value of the U.S. dollar versus the various foreign currencies will increase
volatility in our financial results.
Risks
Related to Our Industry
Risks
associated with regulatory impact on capital markets.
Highly-publicized
financial scandals in recent years have led to investor concerns over the
integrity of the U.S. financial markets and have prompted Congress, the SEC and
FINRA to significantly expand corporate governance and public disclosure
requirements. To the extent that private companies, in order to avoid becoming
subject to these new requirements, decide to forgo initial public offerings, our
equity underwriting business may be adversely affected. In addition, provisions
of the Sarbanes-Oxley Act of 2002 and the corporate governance rules imposed by
self-regulatory organizations have diverted many companies’ attention away from
capital market transactions, including securities offerings and acquisition and
disposition transactions. In particular, companies that are or are planning to
be public are incurring significant expenses in complying with the SEC and
accounting standards relating to internal control over financial reporting, and
companies that disclose material weaknesses in such controls under the new
standards may have greater difficulty accessing the capital
markets.
Financial
services firms have been subject to increased scrutiny over the last several
years, increasing the risk of financial liability and reputational harm
resulting from adverse regulatory actions.
Firms in
the financial services industry have been operating in a difficult regulatory
environment. The U.S. financial services industry has experienced increased
scrutiny from a variety of regulators, including the SEC, FINRA and state
attorneys general. Penalties and fines sought by regulatory authorities have
increased substantially over the last several years. This regulatory and
enforcement environment has created uncertainty with respect to a number of
transactions that had historically been entered into by financial services firms
and that were generally believed to be permissible and appropriate. We may be
adversely affected by changes in the interpretation or enforcement of existing
laws and rules by these governmental authorities and self-regulatory
organizations. We also may be adversely affected as a result of new or revised
legislation or regulations imposed by the SEC, other United States or foreign
governmental regulatory authorities or self-regulatory organizations that
supervise the financial markets. Among other things, we could be fined,
prohibited from engaging in some of our business activities or subject to
limitations or conditions on our business activities. Substantial legal
liability or significant regulatory action against us could have material
adverse financial effects or cause significant reputational harm to us, which
could seriously harm our business prospects.
In
addition, financial services firms are subject to numerous conflicts of interest
or perceived conflicts. The SEC and other Federal and state regulators have
increased their scrutiny of potential conflicts of interest. We have adopted
various policies, controls and procedures to address or limit actual or
perceived conflicts and regularly seek to review and update our policies,
controls and procedures. However, appropriately dealing with conflicts of
interest is complex and difficult, and our reputation could be damaged if we
fail, or appear to fail, to deal appropriately with conflicts of interest. Our
policies and procedures to address or limit actual or perceived conflicts may
also result in increased costs. Failure to adhere to these policies and
procedures may result in regulatory sanctions or client litigation.
Our
exposure to legal liability is significant, and damages that we may be required
to pay and the reputational harm that could result from legal action against us
could materially adversely affect our businesses.
We face
significant legal risks in our businesses, and, in recent years, the volume of
claims and amount of damages sought in litigation and regulatory proceedings
against financial institutions have been increasing. These risks include
potential liability under securities or other laws for materially false or
misleading statements made in connection with securities offerings and other
transactions, potential liability for “fairness opinions” and other advice we
provide to participants in strategic transactions and disputes over the terms
and conditions of complex trading arrangements. We are also subject to claims
arising from disputes with employees for alleged discrimination or harassment,
among other things. These risks often may be difficult to assess or quantify,
and their existence and magnitude often remain unknown for substantial periods
of time.
Our role
as advisor to our clients on important underwriting or mergers and acquisitions
transactions involves complex analysis and the exercise of professional
judgment, including rendering “fairness opinions” in connection with mergers and
other transactions. Therefore, our activities may subject us to the risk of
significant legal liabilities to our clients and aggrieved third parties,
including shareholders of our clients who could bring securities class actions
against us. Our investment banking engagements typically include broad
indemnities from our clients and provisions to limit our exposure to legal
claims relating to our services, but these provisions may not protect us or may
not be enforceable in all cases. For example, an indemnity from a client that
subsequently is placed into bankruptcy is likely to be of little value to us in
limiting our exposure to claims relating to that client. As a result, we may
incur significant legal and other expenses in defending against litigation and
may be required to pay substantial damages for settlements and adverse
judgments. Substantial legal liability or significant regulatory action against
us could have a material adverse effect on our results of operations or cause
significant reputational harm to us, which could seriously harm our business and
prospects.
While our
review of loss contingencies has led us to conclude that, based upon currently
available information, we have established an adequate provision for loss
related to these matters, we are not able to predict with certainty the outcome
of such matters, and there can be no assurance that those matters will not have
a material adverse effect on our results of operations in any future period, and
a significant judgment or settlement could have a material adverse impact on our
results of operations, consolidated statements of financial condition and cash
flows.
Employee
misconduct could harm us and is difficult to detect and deter.
There
have been a number of highly publicized cases involving fraud or other
misconduct by employees in the financial services industry in recent years, and
we run the risk that employee misconduct could occur at our company. For
example, misconduct by employees could involve the improper use or disclosure of
confidential information, which could result in regulatory sanctions and serious
reputational or financial harm. It is not always possible to deter employee
misconduct, and the precautions we take to detect and prevent this activity may
not be effective in all cases, and we may suffer significant reputational harm
for any misconduct by our employees.
Risks
Related to Ownership of Our Common Stock
The
market price of our common stock may decline.
The price
of our common stock may fluctuate greatly, depending upon many factors,
including our perceived prospects and those of the financial services industry
in general, differences between our actual financial and operating results and
those expected by investors, changes in general economic or market conditions,
broad market fluctuations and failure to be covered by securities analysts.
Declines in the price of our stock may adversely affect our ability to recruit
and retain key employees, including our senior professionals.
Factors
that could cause fluctuations in our stock price may include, among others,
actual or anticipated variations in quarterly operating results, changes in
financial estimates by us or by any securities analysts who might cover our
stock, our failure to meet the estimates made by securities analysts,
announcements by us or our competitors of significant acquisitions, strategic
partnerships or divestitures, announcements by our competitors of their
financial or operating results, to the extent those announcements are perceived
by investors to be indicative of our future financial results or market
conditions, additions or departures of key personnel, sales of our common stock,
including sales of our common stock by our directors, officers and employees or
by our other principal stockholders, and cyclical changes in the market in the
growth sectors of the economy.
Taken
together, a significant percentage of our outstanding common stock and
exchangeable shares is owned or controlled by our senior professionals and other
employees, and their interests may differ from those of other
shareholders.
Our Chief
Executive Officer, Thomas W. Weisel, beneficially owns approximately 8% of our
common stock, and our President and Chief Operating Officer, Lionel F. Conacher,
beneficially owns approximately 4% of our common stock (including exchangeable
shares). Mr. Weisel and Mr. Conacher, together with the other members of our
Executive Committee, collectively own approximately 16% of our common stock
(including exchangeable shares) and together with our current employees own a
significant percentage of our common stock outstanding. As a result of these
shareholdings, our current employees have significant influence over the outcome
of elections of our board of directors, control over our management and
policies, in general, and influence the outcome of any corporate transaction or
other matter submitted to the shareholders for approval, including mergers,
consolidations and the sale of all or substantially all of our assets, and their
interests may differ from those of other shareholders.
Future
sales of our common stock may cause the price of our common stock to decline or
affect the trading volume of our common stock.
Sales of
substantial amounts of common stock by our senior professionals, employees and
other shareholders, or the possibility of such sales, may adversely affect the
price of our common stock, may impede our ability to raise capital through the
issuance of equity securities, and may cause trading volume in our common stock
to be volatile.
In
connection with our initial public offering and our acquisition of Westwind,
many of our employees received substantial amounts of common stock or
exchangeable shares, which are currently subject to transfer restrictions. Once
those restrictions lapse, future sales of those shares may cause the price of
our common stock to decline or affect the trading volume of our common
stock.
Approximately
14,630,000 outstanding shares of common stock or exchangeable shares are
currently restricted and not freely transferable. Those shares of common stock
and exchangeable shares will no longer be restricted upon the expiration of the
transfer restrictions contained in the relevant shareholders’ equity agreements,
which will occur on or before February 2011. If those employees
decide to sell all or a portion of their shares in the public markets, and those
sales happen at or around the same time due to the limited periods of time
(trading windows) when we allow our employees to trade our common stock, the
price of our common stock may decline and the trading volume of our common stock
may be affected.
TWPG
has granted a substantial number of equity awards to our employees. Future sales
of our common stock associated with those equity awards may cause the price of
our common stock price to decline or affect the trading volume of our common
stock.
We have
granted and will continue to grant in the future equity awards to our employees.
Upon vesting and delivery of the shares of common stock underlying those awards,
many employees may decide to sell all or a portion of their shares in the public
markets, and those sales may happen at or around the same time due to similar
vesting dates or due to the limited periods of time (trading windows) when we
allow our employees to trade our common stock. Those factors may cause the price
of our common stock to decline or affect the trading volume of our common stock.
As of December 31, 2009 there were 9,172,635 restricted stock units
outstanding.
Your
interest in our firm may be diluted due to issuance of additional shares of
common stock.
Owners of
our common stock may experience dilution of their equity investment as a result
of our issuance of additional shares of common stock or securities that are
convertible into, or exercisable for, shares of our common stock. We may issue
additional shares of common stock in connection with any merger or acquisition
we undertake, in future public or private offerings to raise additional capital
or in satisfaction of currently outstanding restricted stock units, warrants and
options. We also have granted and will continue to grant equity awards under our
Equity Incentive Plan as part of our compensation and hiring processes, and when
these awards are vested or become deliverable we will issue additional shares of
common stock in satisfaction thereof.
For
further information refer to the “Securities Authorized for Issuance under
Equity Compensation Plans” within Item 5 — “Market for Registrant’s Common
Equity, Related Stockholder Matters and Issuer Purchases of Equity Securities”
of this Annual Report on Form 10-K.
We
may be required to make substantial payments under indemnification
agreements.
In
connection with our initial public offering and our conversion to corporate
form, we entered into agreements that provide for the indemnification of our
members, partners, directors, officers and certain other persons authorized to
act on our behalf against certain losses that may arise out of our initial
public offering or the related reorganization transactions, certain liabilities
of our partners relating to the time they were members of Thomas Weisel Partners
Group LLC, and certain tax liabilities of our former members that may arise in
respect of periods prior to our initial public offering when we operated as a
limited liability company.
In
addition, in connection with acquisition transactions, such as our acquisition
of Westwind, and in connection with the ordinary conduct of our business, such
as in our relationship with our clearing brokers, we have provided and will
continue to provide indemnities to counterparties. We may be required to make
payments under these indemnification agreements, which could adversely affect
our financial condition.
We
do not expect to pay any cash dividends in the foreseeable future.
We intend
to retain any future earnings to fund the operation and expansion of our
business, and, therefore, we do not anticipate paying cash dividends in the
foreseeable future. Accordingly, our shareholders must rely on sales of their
shares of common stock after price appreciation, which may never occur, as the
primary way to realize any future gains on an investment in our common stock.
Investors seeking cash dividends should not purchase our common
stock.
Provisions
of our organizational documents may discourage an acquisition of
us.
Our organizational
documents contain provisions that will impede the removal of directors and may
discourage a third party from making a proposal to acquire us. For example, our
board of directors may, without the consent of shareholders, issue preferred
stock with greater voting rights than our common stock. If a change of control
or change in management that shareholders might otherwise consider to be
favorable is prevented or delayed, the market price of our common stock could
decline.
Item
1B. Unresolved Staff
Comments
There are
no unresolved written comments that were received from the SEC staff 180 days or
more before the end of our 2009 fiscal year relating to our periodic or current
reports filed under the Securities Exchange Act of 1934.
Item
2. Properties
Our
principal operating locations are as follows, all of which are leased
facilities:
|
Location
|
Lease
Expiration Year(s)
|
Approximate
Size
(in square
feet)
|
Area
Subleased to Others
(in square
feet)
|
Facility
Character and Principal Business Use
|
||||||
|
San
Francisco, California
|
2010,
2012 and 2015
|
140,400 | 58,400 |
Corporate
Headquarters, Brokerage, Research, Investment Banking, Asset
Management
|
||||||
|
New
York, New York
|
2010
and 2016
|
55,500 | — |
Brokerage,
Research, Investment Banking, Asset Management
|
||||||
|
Boston,
Massachusetts
|
2010
|
19,100 | 3,800 |
Brokerage,
Research, Investment Banking, Asset Management
|
||||||
|
Toronto,
Canada
|
2019
|
20,000 | — |
Brokerage,
Research, Investment Banking
|
||||||
|
Calgary,
Canada
|
2013
|
8,100 | 2,600 |
Brokerage,
Research, Investment Banking
|
||||||
|
Zurich,
Switzerland
|
2011
|
5,400 | — |
Brokerage
|
||||||
|
Portland,
Oregon
|
2010
|
5,300 | — |
Asset
Management
|
||||||
|
London,
U.K.
|
2010
|
4,200 | — |
Brokerage,
Investment Banking, Research
|
||||||
|
Denver,
Colorado
|
2011
|
3,300 | — |
Brokerage,
Research
|
||||||
|
Chicago,
Illinois
|
2010
|
2,000 | — |
Brokerage,
Research
|
||||||
In
addition, we lease approximately 19,100 square feet of office space in Menlo
Park, California, however all such office space has been sublet under separate
agreements. These sublease agreements are for the full term of our original
lease, both of which expire in 2010.
Item
3. Legal
Proceedings
A
discussion of Legal Proceedings is included in Note 16 – Commitments, Guarantees
and Contingencies to the consolidated financial statements included in Item 15
of this Annual Report on Form 10-K.
Item
4. Submission of Matters to a
Vote of Security Holders
There
were no matters submitted to a vote of security holders during the fourth
quarter of our year ended December 31, 2009.
Directors
and Executive Officers of the Registrant
Set forth
below is information concerning our board of directors and executive officers.
Each director will hold office until our next annual meeting of shareholders to
be held on May 20, 2010, and until a successor has been duly elected and
qualified. Executive officers are appointed by and serve at the discretion of
our board of directors.
|
Name
|
Age
|
Title
|
|||
|
Thomas
W. Weisel
|
69 |
Director,
Chairman and Chief Executive Officer
|
|||
|
Matthew
R. Barger
|
52 |
Lead
Director
|
|||
|
Thomas
I.A. Allen
|
69 |
Director
|
|||
|
Michael
W. Brown
|
64 |
Director
|
|||
|
Robert
E. Grady
|
52 |
Director
|
|||
|
B.
Kipling Hagopian
|
68 |
Director
|
|||
|
Alton
F. Irby III
|
69 |
Director
|
|||
|
Timothy
A. Koogle
|
58 |
Director
|
|||
|
Lionel
F. Conacher
|
47 |
President
and Chief Operating Officer
|
|||
|
Shaugn
S. Stanley
|
50 |
Chief
Administrative Officer
|
|||
|
Ryan
Stroub
|
41 |
Chief
Financial Officer
|
|||
|
Tom
Carbeau
|
37 |
Head
of Institutional Sales
|
|||
|
Mark
P. Fisher
|
40 |
General
Counsel
|
|||
|
Keith
Gay
|
51 |
Head
of Research
|
|||
|
Keith
Harris
|
55 |
President
and Chief Financial Officer of Thomas Weisel Partners Canada
Inc.
|
|||
|
William
L. McLeod
|
44 |
Co-Head
of Investment Banking
|
|||
|
Brad
Raymond
|
44 |
Co-Head
of Investment Banking
|
|||
|
Paul
C. Slivon
|
51 |
Chairman
of Wealth Management
|
|||
|
Anthony
V. Stais
|
44 |
Head
of Trading
|
|||
A brief
biography of each director and executive officer follows:
Thomas W. Weisel has served
as our Chairman and Chief Executive Officer since October 1998 and has been a
director of Thomas Weisel Partners Group, Inc. since October 2005. Prior to
founding Thomas Weisel Partners, from 1978 until September 1998, Mr. Weisel was
Chairman and Chief Executive Officer of Montgomery Securities, an investment
banking and financial services firm. Mr. Weisel also founded and served as
President of Montgomery Sports, which was also known as Tailwind Sports. Mr.
Weisel served as a director on the NASDAQ Stock Market Board of Directors from
2002 to 2006. Mr. Weisel received a bachelor of arts degree from Stanford
University and an M.B.A. from Harvard Business School.
Matthew R. Barger has served
as our Lead Director since September 2009 and a director of Thomas Weisel
Partners Group, Inc. since February 2007. Mr. Barger is currently a Senior
Advisor to Hellman & Friedman LLC, a private equity firm. Mr. Barger joined
Hellman & Friedman in 1984 and has held several positions during his tenure,
including that of Managing General Partner. Prior to joining Hellman &
Friedman, Mr. Barger was an associate in the Corporate Finance Department of
Lehman Brothers Kuhn Loeb. Mr. Barger serves as a director of Hall Capital
Partners, an investment advisory firm, and also serves as an Advisory Board
member of Artisan Partners and of Mondrian Investment Partners, both investment
advisory firms. Mr. Barger holds a bachelor’s degree from Yale University and an
M.B.A. from the Stanford Graduate School of Business.
Thomas I.A. Allen has been a
director of Thomas Weisel Partners Group, Inc. since February 2008. Mr. Allen
was a Partner of, and is of Counsel to, Ogilvy Renault LLP, an international law
firm based in Canada. Mr. Allen served as a director of Westwind Capital
Corporation, prior to its acquisition by Thomas Weisel Partners in January 2008.
Mr. Allen also serves as a director of Mundoro Capital Inc., Terra Nova Minerals
Inc., YM BioSciences Inc. and Middlefield Bancorp Limited. Mr. Allen is a Fellow
of the Chartered Institute of Arbitrators (London, England). He is also past
Chairman of the Accounting Standards Oversight Council of Canada and a former
member of the Advisory Board of the Office of the Superintendent of Financial
Institutions of Canada and past Chairman of the Corporate Finance Committee of
the Investment Dealers Association of Canada (IDA), a former public director of
the IDA, and a former member of the IDA’s Executive Committee. Mr. Allen holds a
bachelor of arts degree and an LL.B, both from the University of Western
Ontario.
Michael W. Brown has been a
director of Thomas Weisel Partners Group, Inc. since February 2007. Mr. Brown
was an officer of Microsoft Corporation from December 1989 through July 1997,
serving as Vice President and Chief Financial Officer from August 1994 to July
1997, as Vice President – Finance from April 1993 to August 1994 and as
Treasurer from January 1990 to April 1993. Prior to joining Microsoft, Mr. Brown
spent 18 years with Deloitte & Touche LLP in various positions. Mr. Brown is
also a director of EMC Corporation, a provider of information management
systems, software and services, a director of VMware, Inc., a provider of
computer virtualization solutions, and a director of Administaff, Inc., a
professional employer organization providing services such as payroll and
benefits administration. Mr. Brown is also a director of several private
companies. Mr. Brown is a past Chairman of the Nasdaq Stock Market Board of
Directors and a past governor of the National Association of Securities Dealers.
Mr. Brown holds a bachelor of science degree in economics from the University of
Washington in Seattle.
Robert E. Grady has been a
director of Thomas Weisel Partners Group, Inc. since September 2009. Mr. Grady
is currently a partner and managing director at Cheyenne Capital, a private
equity investment firm. Prior to joining Cheyenne Capital, from 2000 -2009, Mr.
Grady served as a partner at The Carlyle Group, one of the world’s largest
private equity firms, where he was Chairman and Managing Partner of Carlyle
Venture Partners, the firm’s U.S. venture and growth capital organization. Mr.
Grady joined Carlyle in 2000 as global head of Venture Capital and served as a
Member of Carlyle’s Management Committee. Mr. Grady served as Chairman of the
National Venture Capital Association’s Board of Directors from 2006 – 2007,
having joined the Board of Directors in 2002. Prior to joining Carlyle, Mr.
Grady was a Managing Director and member of the Management Committee at
Robertson Stephens. Mr. Grady previously served in the White House as Deputy
Assistant to President George H.W. Bush and as Executive Associate Director of
the Office of Management and Budget. Mr. Grady also served for a decade on the
faculty of the Stanford Graduate School of Business where he taught courses on
environmental policy and regulation. Mr. Grady is also a Director of AuthenTec,
Inc., Maxim Integrated Products and several privately-held companies. Mr. Grady
holds a bachelors degree from Harvard College and an M.B.A. from the Stanford
Graduate School of Business.
B. Kipling Hagopian has been
a director of Thomas Weisel Partners Group, Inc. since January 2006. Mr.
Hagopian was a founder of Brentwood Associates, a venture capital investment
company, and was a general partner of all of the funds started by Brentwood
Associates from inception until 1996. He has been a Special Limited Partner of
each of the five Brentwood funds started since 1989, and is a Special Advisory
Partner to Redpoint Ventures I which is a successor to Brentwood Associates’
information technology funds. Mr. Hagopian is also a Managing Partner of Apple
Oaks Partners LLC, a private investment company which manages his own capital
and the capital of one other individual. Mr. Hagopian serves as Chairman of the
Board of Directors of Maxim Integrated Products, a semiconductor company. Mr.
Hagopian holds a bachelor of arts degree and an M.B.A., both from the University
of California, Los Angeles.
Alton F. Irby III has been a
director of Thomas Weisel Partners Group, Inc. since February 2008. Mr. Irby is
a founding partner of London Bay Capital LLC, a privately held investment firm,
which was founded in May 2006 and he was founding partner of Tricorn Partners
LLP, a privately held investment bank from May 2003 to May 2006. Prior to
founding Tricorn Partners, Mr. Irby was Chairman and Chief Executive Officer of
HawkPoint Partners, formerly known as National Westminster Global Corporate
Advisory, and was a founding partner of Hambro Magan Irby Holdings. He is the
chairman of ContentFilm plc and also serves as a director of McKesson
Corporation (and of one of McKesson Corporation’s U.K. subsidiaries) and several
other privately held firms. Mr. Irby holds a bachelor’s degree from the Georgia
Institute of Technology and served four years on active duty as an intelligence
officer in the U.S. Marine Corps.
Timothy A. Koogle has been a
director of Thomas Weisel Partners Group, Inc. since January 2006. In 1978, Mr.
Koogle founded Phase 2, Inc., which was sold to Motorola, Inc. in 1981. Mr.
Koogle served in a number of executive management positions with Motorola
between 1981 and 1990. He was President of Intermec Corporation and Corporate
Vice President of its parent company, Western Atlas/ Litton, a multinational
technology company from 1990 to 1995. Mr. Koogle was the founding Chief
Executive Officer of Yahoo! Inc. from July 1995 to May 2001 and Chairman of the
Board of Directors of Yahoo! from 1999 to 2001. Mr. Koogle served as Vice
Chairman and Director of Yahoo! from May 2001 to August 2003. He is currently a
private venture investor engaged in the formation and growth of early stage
technology companies. He is also founder and Chief Executive Officer of
Serendipity Land Holdings, LLC, a private land development company, and the
Managing Director of The Koogle Foundation, a private philanthropic organization
focused on the education of underprivileged youth. Mr. Koogle holds a bachelor
of science degree from the University of Virginia and M.S. and D. Engr. degrees
in mechanical engineering from Stanford University.
Lionel F. Conacher joined
Thomas Weisel Partners as President in January 2008 in connection with the
acquisition of Westwind Capital Corporation and was also named our Chief
Operating Officer in March 2008. Prior to joining Thomas Weisel Partners, Mr.
Conacher served as an officer of Westwind since 2002, first as a Managing
Director and then as the Chief Executive Officer and President. Prior to his
employment by Westwind, Mr. Conacher held positions with Citigroup, Brookfield
Asset Management and National Bank Financial. Mr. Conacher holds a bachelor’s
degree from Dartmouth College in economics and art History.
Shaugn S. Stanley joined
Thomas Weisel Partners in 1998 and has served as Chief Administrative Officer of
Thomas Weisel Partners since April 2009. Previously, Mr. Stanley served as Chief
Financial Officer of Thomas Weisel Partners from its founding in 1998 to 2001
and from March 2008 to April 2009 and as a Managing Director from 2001 to 2008.
Prior to joining Thomas Weisel Partners, Mr. Stanley was Chief Financial Officer
of Montgomery Securities from 1996 to 1998 and Chief Financial Officer for the
brokerage division of Fidelity Investments from 1990 to 1996. Mr. Stanley
received a Bachelor of Science in Accounting degree from Stephen F. Austin State
University and is a Certified Public Accountant.
Ryan Stroub joined Thomas
Weisel Partners in 2006 and has served as Chief Financial Officer of Thomas
Weisel Partners since April 2009. Previously, Mr. Stroub served as Chief
Accounting Officer of Thomas Weisel Partners. Prior to joining Thomas Weisel
Partners, Mr. Stroub was with E*TRADE Financial Corporation for seven years
serving as the Corporate Controller. Mr. Stroub holds a degree in accounting
from the University of California at Santa Barbara.
Tom Carbeau joined Thomas
Weisel Partners in 2006 and has served as Senior Managing Director and Head of
Institutional Sales since April 2008. Prior to serving as Head of Institutional
Sales, Mr. Carbeau served as Director of Sales. Mr. Carbeau has over 14 years of
experience in institutional sales, equity capital markets and corporate finance.
Prior to joining Thomas Weisel Partners, Mr. Carbeau was Executive Director at
CIBC World Markets from 2002 to 2006 and Vice President at Morgan Stanley from
2000 to 2002. Mr. Carbeau received a bachelor of science degree in finance from
Georgetown University.
Mark P. Fisher has served as
our General Counsel since May 2005. From January 1998 until May 2005, prior to
joining Thomas Weisel Partners, Mr. Fisher practiced corporate and
securities law at Sullivan & Cromwell LLP. Mr. Fisher received a
bachelor of arts degree from Stanford University, a J.D. from Harvard Law School
and a Ph.D. in economics from the University of Chicago.
Keith Gay joined Thomas
Weisel Partners in 1999 and has served as our Head of Research since February
2008 and served as our Associate Director of Research prior to that time. Prior
to his becoming Associate Director of Research, Mr. Gay was a Research Analyst
who followed Applications Software in the Technology sector from 2000 to 2005 at
Thomas Weisel Partners. From 1996 until 1999, he was a Managing Director and a
Senior Research Analyst at NationsBanc Montgomery Securities, where he followed
the Education and Training sectors. Prior to his employment with NationsBanc
Montgomery Securities, Mr. Gay was a Vice President in Investment Banking at
Merrill Lynch & Co., where he covered the General Industrials sector. He
entered the investment banking business following a ten-year career in the U.S.
Air Force, where he was an Assistant Professor at the U.S. Air Force Academy
Department of Management. Mr. Gay received a Bachelor of Arts degree in
Economics from the University of California at Los Angeles and a Master of
Business Administration degree from the Anderson School at the University of
California at Los Angeles.
Keith Harris joined Thomas
Weisel Partners in January 2008 in connection with the acquisition of Westwind
Capital Corporation and is Treasurer of Thomas Weisel Partners as well as
President and Chief Financial Officer of Thomas Weisel Partners Canada Inc.
Prior to joining Thomas Weisel Partners, Mr. Harris was Chief Financial Officer
of Westwind Partners Inc. from its start-up in 2002. For the period from 1989 to
2002, Mr. Harris held senior positions in institutional broker-dealer boutiques,
Chief Financial Officer of Octagon Capital Corporation and Chief Operating
Officer of Sanwa McCarthy Securities. Mr. Harris holds a Bachelor of Commerce
degree from the University of Toronto and is a Canadian Chartered
Accountant.
William L. McLeod joined
Thomas Weisel Partners in 2004 and has served as Co-Head of Investment Banking
and Director of Capital Markets since July 2007. Prior to serving as Co-Director
of Investment Banking, Mr. McLeod served as a Managing Director and Head Capital
Markets with Thomas Weisel Partners. Mr. McLeod has over 17 years of Wall
Street investment banking experience, including, prior to joining Thomas Weisel
Partners, at Banc of America Securities, as Co-Head of U.S. Equity Capital
Markets, and at J.P. Morgan Securities. Mr. McLeod has a bachelor’s degree from
Southern Methodist University and an M.B.A. from the University of
Chicago.
Brad Raymond joined Thomas
Weisel Partners in 2004 and has served as Co-Head of Investment Banking since
July 2007. Prior to serving as Co-Director of Investment Banking, Mr. Raymond
served as a Managing Director with Thomas Weisel Partners’ Investment Banking
department. Mr. Raymond has more than 14 years of investment banking experience,
with a focus on the technology sector. Prior to joining Thomas Weisel Partners,
Mr. Raymond was affiliated with Morgan Stanley from 1999 to 2004, including
serving as Co-Head of Software Investment Banking. In addition, Mr. Raymond
worked within the technology investment banking groups at both J.P. Morgan
Securities and Alex Brown & Sons. Mr. Raymond has a bachelor’s degree from
Harvard College and an M.B.A. from the Haas School of Business at the University
of California at Berkeley.
Paul C. Slivon joined Thomas
Weisel Partners in 1999 and has served as our Chairman of Wealth Management
since April 2008. Prior to serving as our Chairman of Wealth Management, Mr.
Slivon was Head of Institutional Sales from 2001 to 2008 and a Partner in
Institutional Sales from 1999 to 2001. Prior to joining Thomas Weisel Partners,
Mr. Slivon served as Managing Director of Institutional Sales at Robertson
Stephens & Company Group, L.L.C., an investment banking and financial
services firm from January 1993 until January 1999. Previously, Mr. Slivon
was Senior Vice President of Kemper Securities. Mr. Slivon received a
bachelor of arts degree from Amherst College and an M.B.A. from the University
of California, Los Angeles.
Anthony V. Stais has served
as our Head of Trading since September 2006, and previously served as
Co-Director of Trading since June 2005. Mr. Stais joined Thomas Weisel Partners
in January 2001 and served as our Director of Sales-Trading from January 2001 to
June 2005. Prior to joining Thomas Weisel Partners, between August 1987 and
January 2001, Mr. Stais worked at Goldman Sachs, Merrill Lynch and Salomon
Brothers in both institutional sales trading and wealth management. Mr. Stais
received a bachelor of arts degree from Bowdoin College.
There are no family relationships among any of our directors and
executive officers. There are no contractual obligations regarding election of
our directors, except that we have agreed with Mr. Weisel in his employment
agreement to take all reasonable action to cause him to be appointed or elected
to our board of directors during his employment with us.
Item
5. Market for Registrant’s
Common Equity, Related Stockholder Matters and Issuer Purchases of Equity
Securities
Issuer
Purchases of Equity Securities
During
the three months ended December 31, 2009, we repurchased the following shares of
our common stock:
|
Month
|
Number
of Shares
|
Average
Purchase
Price
per Share
|
|||
|
October
|
|||||
|
Employee
transactions (1)
|
2,166
|
$
|
6.25
|
||
|
November
|
|||||
|
Employee
transactions (1)
|
688
|
4.87
|
|||
|
December
|
|||||
|
Employee
transactions (1)
|
5,310
|
3.93
|
|||
|
Total
|
8,164
|
$
|
4.63
|
||
|
(1)
|
Includes
shares of common stock that were otherwise scheduled to be delivered to
employees in respect of vesting Restricted Stock Units. These shares were
withheld from delivery (under the terms of grants under the Equity
Incentive Plan) to offset tax withholding obligations of the employee
recipients that occur upon the vesting of Restricted Stock Units. In lieu
of delivering these shares to the employee recipients, we satisfied a
portion of their tax withholding obligations with cash in an amount
equivalent to the value of such shares on the scheduled delivery
date.
|
In
March 2008, the Board of Directors authorized the repurchase up to 2,000,000
shares of common stock for the purpose of settling obligations to deliver common
stock in the future to employees who have received restricted stock units under
our Equity Incentive Plan. Additional repurchases pursuant to this authority may
be carried out from time to time in the future. As of December 31, 2009,
1,544,323 shares had been repurchased. Furthermore, our Board of Directors may
authorize additional repurchases for the purpose of settling obligations to
deliver common stock in the future to employees who have received restricted
stock units under our Equity Incentive Plan.
Market
Information and Dividend Policy
Our
common stock is traded on The Nasdaq Stock Market, Inc. (“Nasdaq”) under the
symbol “TWPG”. In 2008, we voluntarily requested that our common stock be
delisted from the Toronto Stock Exchange where it traded under the symbol “TWP”.
The Toronto Stock Exchange subsequently granted our request. The following table
sets forth the quarterly high and low sales prices per share of our common stock
as reported by Nasdaq for each quarter during the following years
ended:
|
December
31, 2009
|
December
31, 2008
|
|||||||||||||||
|
High
|
Low
|
High
|
Low
|
|||||||||||||
|
First
Quarter
|
$
|
5.00
|
$
|
2.36
|
$
|
13.91
|
$
|
6.35
|
||||||||
|
Second
Quarter
|
6.07
|
3.47
|
7.43
|
5.01
|
||||||||||||
|
Third
Quarter
|
6.16
|
3.68
|
9.33
|
3.90
|
||||||||||||
|
Fourth
Quarter
|
6.36
|
3.56
|
8.99
|
2.65
|
||||||||||||
As of
December 31, 2009, there were approximately 123 holders of record of our common
stock. This number
does not include stockholders for whom shares were held in “nominee” or “street”
name. No dividends have been declared or paid on our common stock. We do not
currently anticipate that we will pay any cash dividends on our common stock in
the foreseeable future.
Securities
Authorized for Issuance under Equity Compensation Plans
The
following table provides information as of December 31, 2009 with respect to
compensation plans under which equity securities of the registrant are
authorized for issuance:
|
Plan
Category
|
Plan
Name
|
Number
of Securities to be Issued Upon Exercise of Outstanding Options, Warrants
and Rights
|
Weighted-Average
Exercise Price of Outstanding Options, Warrants and Rights
|
Number
of Securities Remaining Available for Future Issuance Under Equity
Compensation Plans
|
|||||
|
Equity
compensation plans approved by security holders
|
Thomas
Weisel Partners Group, Inc. Equity Incentive Plan (1)
|
9,616,184
|
(2)
|
$ 7.87
|
(3)
|
6,066,525
|
(4)
|
||
|
Equity
compensation plans not approved by security holders
|
None
|
—
|
—
|
—
|
|||||
|
Total
|
9,616,184
|
(2)
|
$ 7.87
|
(3)
|
6,066,525
|
(4)
|
|
(1)
|
Approved
by Thomas Weisel Partners Group LLC as sole shareholder of TWPG prior to
our initial public offering. Subsequent amendments to the Equity Incentive
Plan were approved by the shareholders of TWPG at the 2007 and 2008 Annual
Meetings of Shareholders and the 2009 Special Meeting of Shareholders.
Total number of shares issuable under the plan as of December 31, 2009 is
17,150,000.
|
|
(2)
|
These
shares of common stock may be issued pursuant to 9,172,635 outstanding
restricted stock units and 443,549 outstanding
options.
|
|
(3)
|
Under
the Thomas Weisel Partners Group, Inc. Equity Incentive Plan, no exercise
price is applicable to restricted stock units. The weighted-average
exercise price stated relates solely to the options issued under the
Equity Incentive Plan. As of December 31, 2009, there were 443,549
outstanding options with a weighted-average exercise price of
$7.87.
|
|
(4)
|
Number
of securities remaining available for future issuance does not reflect
approximately 731,000 restricted stock units that were withheld from
delivery to offset tax withholding obligations of the employee recipients
upon the vesting of the restricted stock units, as well as forfeitures
that occurred from January 1, 2010 through February 28, 2010. Also not
included in the number of securities remaining available for future
issuance are approximately 3,500,000 shares granted from January 1, 2010
through February 28, 2010.
|
Performance
Graph
The
following graph and table compare:
|
|
·
|
the
performance of an investment in our common stock over the period of
February 3, 2006 through January 4, 2010, beginning with an investment at
the closing market price on February 3, 2006, the end of the first day our
common stock traded on the Nasdaq following our initial public offering,
and thereafter based on the closing price of our common stock on the
Nasdaq; with
|
|
|
·
|
an
investment in the Russell 2000 Growth Index and an investment in the
Standard and Poor’s Mid Cap Investment Banking & Brokerage Index
Sub-Industry Index (the “S&P Brokerage Sub-Industry Index”), in each
case, beginning with an investment at the closing price on February 2,
2006 and thereafter based on the closing price of the
index.
|
The graph
and table assume $100 was invested on the starting date at the price indicated
above and that dividends, if any, were reinvested on the date of payment without
payment of any commissions. The performance shown in the graph and table
represents past performance and should not be considered an indication of future
performance.
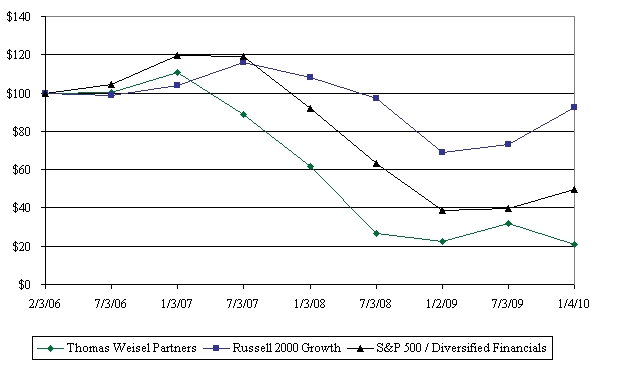
|
2/3/06
|
7/3/06
|
1/3/07
|
7/3/07
|
1/3/08
|
7/3/08
|
1/2/09
|
7/3/2009
|
1/4/10
|
||||||||||||||||||||||||||||
|
Thomas
Weisel Partners Group, Inc.
|
$ | 100.00 | $ | 100.26 | $ | 110.94 | $ | 88.85 | $ | 61.61 | $ | 26.51 | $ | 22.34 | $ | 31.87 | $ | 20.89 | ||||||||||||||||||
|
Russell
2000 Growth Index
|
$ | 100.00 | $ | 98.72 | $ | 103.94 | $ | 115.75 | $ | 108.23 | $ | 97.00 | $ | 69.01 | $ | 73.35 | $ | 92.45 | ||||||||||||||||||
|
S&P
500 / Diversified Financials
|
$ | 100.00 | $ | 104.22 | $ | 119.62 | $ | 119.30 | $ | 92.04 | $ | 63.36 | $ | 38.63 | $ | 39.82 | $ | 49.87 | ||||||||||||||||||
The
information provided above under the heading “Performance Graph” shall not be
considered “filed” for purposes of Section 18 of the Securities Exchange Act of
1934 or incorporated by reference in any filing under the Securities Act of 1933
or the Securities Exchange Act of 1934.
Item
6. Selected Financial
Data
Set forth
below is selected consolidated financial and other data of Thomas Weisel
Partners Group, Inc. (in
thousands, except Selected Data and Ratios). The Selected Data and Ratios
have been obtained or derived from our records.
The data
below should be read in conjunction with Item 1A – “Risk Factors”, Item 7 –
“Management’s Discussion and Analysis of Financial Condition and Results of
Operations”, our consolidated financial statements and the notes to our
consolidated financial statements. In January 2008, we acquired Westwind. The
results of Westwind have been included in our consolidated financial statements
since January 2, 2008.
|
As
of or For the Year Ended December 31,
|
||||||||||||||||||||
|
2009
|
2008
|
2007
|
2006
|
2005
|
||||||||||||||||
|
Statement
of Operations
|
||||||||||||||||||||
|
Revenues:
|
||||||||||||||||||||
|
Investment
banking
|
$
|
71,165
|
$
|
63,305
|
$
|
127,228
|
$
|
124,136
|
$
|
75,300
|
||||||||||
|
Brokerage
|
103,170
|
131,939
|
120,187
|
123,809
|
138,497
|
|||||||||||||||
|
Asset
management
|
21,464
|
(7,120
|
)
|
33,414
|
25,752
|
36,693
|
||||||||||||||
|
Interest
income
|
913
|
7,341
|
17,718
|
13,525
|
5,510
|
|||||||||||||||
|
Other
revenue
|
—
|
—
|
920
|
—
|
—
|
|||||||||||||||
|
Total
revenues
|
196,712
|
195,465
|
299,467
|
287,222
|
256,000
|
|||||||||||||||
|
Interest
expense
|
(1,656
|
)
|
(5,938
|
)
|
(10,418
|
)
|
(10,905
|
)
|
(5,114
|
)
|
||||||||||
|
Net
revenues
|
195,056
|
189,527
|
289,049
|
276,317
|
250,886
|
|||||||||||||||
|
Expenses
excluding interest:
|
||||||||||||||||||||
|
Compensation
and benefits
|
133,355
|
147,186
|
187,902
|
152,195
|
154,163
|
|||||||||||||||
|
Non-compensation
expenses
|
125,550
|
237,893
|
103,920
|
97,997
|
101,594
|
|||||||||||||||
|
Total
expenses excluding interest
|
258,905
|
385,079
|
291,822
|
250,192
|
255,757
|
|||||||||||||||
|
Income
(loss) before taxes
|
(63,849
|
)
|
(195,552
|
)
|
(2,773
|
)
|
26,125
|
(4,871
|
)
|
|||||||||||
|
Provision
for taxes (tax benefit)
|
(171
|
)
|
7,700
|
(2,793
|
)
|
(8,796
|
)
|
2,187
|
||||||||||||
|
Net
income (loss)
|
(63,678
|
)
|
(203,252
|
)
|
20
|
34,921
|
(7,058
|
)
|
||||||||||||
|
Less:
Preferred dividends and accretion
|
—
|
—
|
—
|
(1,608
|
)
|
(15,654
|
)
|
|||||||||||||
|
Net
income (loss) attributable to common shareholders and to Class A, B and C
shareholders
|
$
|
(63,678
|
)
|
$
|
(203,252
|
)
|
$
|
20
|
$
|
33,313
|
$
|
(22,712
|
)
|
|||||||
|
Net
income (loss) per share:
|
||||||||||||||||||||
|
Basic
net income (loss) per share
|
$
|
(1.96
|
)
|
$
|
(6.29
|
)
|
$
|
—
|
$
|
1.39
|
||||||||||
|
Diluted
net income (loss) per share
|
$
|
(1.96
|
)
|
$
|
(6.29
|
)
|
$
|
—
|
$
|
1.34
|
||||||||||
|
Statement
of Financial Condition
|
||||||||||||||||||||
|
Total
assets
|
$
|
253,777
|
$
|
281,650
|
$
|
586,680
|
$
|
483,189
|
$
|
312,823
|
||||||||||
|
Total
liabilities
|
123,940
|
109,749
|
313,053
|
216,135
|
199,428
|
|||||||||||||||
|
Total
redeemable convertible preference stock
|
—
|
—
|
—
|
—
|
223,792
|
|||||||||||||||
|
Shareholders’
and members’ equity (deficit)
|
129,837
|
171,901
|
273,627
|
267,054
|
(110,397
|
)
|
||||||||||||||
|
Debt,
including capital lease obligations
|
22,813
|
22,253
|
27,420
|
32,499
|
19,539
|
|||||||||||||||
|
Selected
Data and Ratios
|
||||||||||||||||||||
|
Cash
dividends declared per common share
|
$
|
—
|
$
|
—
|
$
|
—
|
$
|
—
|
$
|
—
|
||||||||||
|
Investment
banking:
|
||||||||||||||||||||
|
Number
of transactions
|
115
|
82
|
83
|
87
|
63
|
|||||||||||||||
|
Revenue
per transaction (in
millions)
|
$
|
0.62
|
$
|
0.77
|
$
|
1.53
|
$
|
1.43
|
$
|
1.15
|
||||||||||
|
Brokerage:
|
||||||||||||||||||||
|
Average
daily brokerage revenue (in
millions)
|
$
|
0.41
|
$
|
0.52
|
$
|
0.48
|
$
|
0.49
|
$
|
0.55
|
||||||||||
|
Equity
research:
|
||||||||||||||||||||
|
Publishing
analysts
|
34
|
37
|
29
|
30
|
39
|
|||||||||||||||
|
Companies
covered
|
500
|
500
|
480
|
485
|
565
|
|||||||||||||||
|
Number
of companies covered per publishing analyst
|
15
|
14
|
17
|
16
|
14
|
|||||||||||||||
|
Other:
|
||||||||||||||||||||
|
Average
number of employees
|
488
|
641
|
632
|
565
|
548
|
|||||||||||||||
|
For
the Year Ended
|
||||
|
December 31,
2006
|
||||
|
Pro
forma, as adjusted (unaudited) (1)
|
||||
|
Pro
forma net revenues (2)
|
$
|
276,179
|
||
|
Pro
forma income before tax (2)
|
25,987
|
|||
|
Pro
forma tax benefit (3)
|
(7,363
|
)
|
||
|
Pro
forma net income (2)
(3)
|
33,350
|
|||
|
Pro
forma preferred dividends and accretion
|
—
|
|||
|
Pro
forma net income attributable to common shareholders and to Class A, B and
C shareholders (2)
(3)
|
33,350
|
|||
|
Pro
forma earnings per share:
|
||||
|
Pro
forma basic earnings per share
|
$
|
1.39
|
||
|
Pro
forma diluted earnings per share
|
$
|
1.34
|
||
|
Pro
forma weighted average shares used in the computation of per share
data:
|
||||
|
Pro
forma basic weighted average shares outstanding
|
23,980
|
|||
|
Pro
forma diluted weighted average shares outstanding
|
24,945
|
|||
|
(1)
|
The
pro forma, as adjusted amounts depict results we estimate we would have
had during the year ended December 31, 2006 if the reorganization
transactions had taken place on January 1, 2006, as these amounts change
tax expense to amounts that we estimate we would have paid if we were a
corporation beginning January 1, 2006. Additionally, these amounts
decrease net revenues by the amount of interest expense on notes payable
issued to preferred shareholders upon consummation of the reorganization
transactions. The amounts for the year ended December 31, 2006
reflect pro forma results of operations as if these transactions had
occurred on January 1, 2006.
|
|
(2)
|
Reflects
decrease in net revenues and net income before tax of $0.1 million
for the estimated interest expense for the notes issued to Class D
and D-1 preferred shareholders.
|
|
(3)
|
On
a pro forma basis, the tax benefit for the year ended December 31, 2006
was decreased by the estimated additional tax expense of $1.5 million
as if we were a corporation beginning January 1, 2006. The additional tax
expense is attributable to our applicable tax rate, a combination of
Federal, state and local income tax rates, of 42% applied to our pro forma
net income for the period beginning January 1, 2006 through
February 6, 2006.
|
Item
7. Management’s Discussion and
Analysis of Financial Condition and Results of Operations
Overview
The
economic environment at the beginning of 2009 was a continuation of the
consumer-led recession of 2008. The global credit crisis, corporate
consolidation and failures, lack of investor confidence and further economic
deterioration all led to a dramatic slowdown in the capital markets, which in
turn impacted the number of our investment banking transactions. In the latter
half of 2009, an economic recovery began to take hold. Investment banking
revenues rebounded as the capital market activity increased for emerging growth
companies. During this period, we raised capital for companies across the
majority of our industry sectors with mining, technology and energy being the
most active. Additionally, our mergers and acquisitions team completed several
visible transactions, primarily in technology and healthcare. We believe the
near-term investment banking opportunity in the technology and resource sectors
to be significant and that our banking platform, with a focus on these growth
sectors, will benefit.
During
the cyclical downturn, we took significant steps to reduce our compensation and
non-compensation costs in order to align costs with expected revenues and to
preserve capital. During 2009, we further reduced our net headcount by
approximately 100 employees, which follows a net headcount reduction in 2008 of
approximately 200 employees. As of December 31, 2009, we had 453 employees, a
40% reduction from the beginning of 2008. Other significant non-compensation
cost reductions are attributed to our initiatives to consolidate facilities and
renegotiate rates for technology and communication services. We believed that
these measures were necessary in the near-term to preserve capital and that they
advantageously positioned us in the long term to demonstrate our earnings
capabilities when capital market activity returns to the levels we experienced
prior to the downturn.
Over the
course of the past two years, we have opportunistically hired investment banking
and brokerage professionals to expand or strengthen our platform in specific
areas. A significant portion of our new hires have been in brokerage operations
and are professionals who bring incremental relationships to the firm, which
should positively impact future revenues. Over the same period, we increased the
number of our senior investment banking calling officers, which we believe will
also positively impact future results. As we begin to see more activity in the
growth sectors of the economy, we should benefit from maintaining our presence
and coverage of the consumer, energy and alternative energy, healthcare, mining
and technology growth sectors.
We have
maintained the breadth of our platform while broadening our industry verticals
and geographic exposure. We believe that the improving capital market
environment and related opportunities in 2010 could provide a foundation which
would lead to a significant improvement in our financial
results.
Consolidated
Results of Operations
Our
businesses, by their nature, do not produce predictable earnings and are
affected by changes in economic conditions generally and in particular by
conditions in the financial markets as well as the growth sectors and companies
which we service. For a further discussion of the factors that may affect our
future operating results, see Part I, Item 1A – “Risk Factors” of this Annual
Report on Form 10-K.
The
following table provides a summary of our results of operations (dollar amounts in
thousands):
|
For
the Year Ended December 31,
|
2008-2009
|
2007-2008
|
||||||||||||||||||
|
2009
|
2008
|
2007
|
%
Change
|
%
Change
|
||||||||||||||||
|
Net
revenues
|
$
|
195,056
|
$
|
189,527
|
$
|
289,049
|
2.9
|
%
|
(34.4
|
)%
|
||||||||||
|
Loss
before taxes
|
(63,849
|
)
|
(195,552
|
)
|
(2,773
|
)
|
(67.3
|
)
|
nm
|
|||||||||||
|
Net
income (loss)
|
(63,678
|
)
|
(203,252
|
)
|
20
|
(68.7
|
)
|
nm
|
||||||||||||
|
Net
loss per share:
|
||||||||||||||||||||
|
Basic
net loss per share
|
$
|
(1.96
|
)
|
$
|
(6.29
|
)
|
$
|
—
|
||||||||||||
|
Diluted
net loss per share
|
$
|
(1.96
|
)
|
$
|
(6.29
|
)
|
$
|
—
|
||||||||||||
nm
– Not meaningful.
Revenues
The
following table sets forth our revenues, both in dollar amounts and as a
percentage of net revenues (dollar amounts in
thousands):
|
For
the Year Ended December 31,
|
2008-2009
|
2007-2008
|
||||||||||||||||||
|
2009
|
2008
|
2007
|
%
Change
|
%
Change
|
||||||||||||||||
|
Revenues:
|
||||||||||||||||||||
|
Investment
banking
|
$
|
71,165
|
$
|
63,305
|
$
|
127,228
|
12.4
|
%
|
(50.2
|
)%
|
||||||||||
|
Brokerage
|
103,170
|
131,939
|
120,187
|
(21.8
|
)
|
9.8
|
||||||||||||||
|
Asset
management
|
21,464
|
(7,120
|
)
|
33,414
|
nm
|
(121.3
|
)
|
|||||||||||||
|
Interest
income
|
913
|
7,341
|
17,718
|
(87.6
|
)
|
(58.6
|
)
|
|||||||||||||
|
Other
revenue
|
—
|
—
|
920
|
—
|
(100.0
|
)
|
||||||||||||||
|
Total
revenues
|
196,712
|
195,465
|
299,467
|
0.6
|
(34.7
|
)
|
||||||||||||||
|
Interest
expense
|
(1,656
|
)
|
(
5,938
|
)
|
(10,418
|
)
|
(72.1
|
)
|
(
43.0
|
)
|
||||||||||
|
Net
revenues
|
$
|
195,056
|
$
|
189,527
|
$
|
289,049
|
2.9
|
%
|
(34.4
|
)%
|
||||||||||
|
Percentage
of net revenues:
|
||||||||||||||||||||
|
Investment
banking
|
36.5
|
%
|
33.4
|
%
|
44.0
|
%
|
||||||||||||||
|
Brokerage
|
52.9
|
69.6
|
41.6
|
|||||||||||||||||
|
Asset
management
|
11.0
|
(3.8
|
)
|
11.6
|
||||||||||||||||
|
Interest
income
|
0.4
|
3.9
|
6.1
|
|||||||||||||||||
|
Other
revenue
|
—
|
—
|
0.3
|
|||||||||||||||||
|
Total
revenues
|
100.8
|
103.1
|
103.6
|
|||||||||||||||||
|
Interest
expense
|
(0.8
|
)
|
(3.1
|
)
|
(3.6
|
)
|
||||||||||||||
|
Net
revenues
|
100.0
|
%
|
100.0
|
%
|
100.0
|
%
|
||||||||||||||
Investment Banking Revenue
Our
investment banking revenue includes (i) management fees, underwriting fees,
selling concessions and agency placement fees earned through our participation
in public offerings and private placements of equity and debt securities,
including convertible debt, (ii) fees earned as a strategic advisor in
mergers and acquisitions and similar transactions and (iii) the value of
warrants received as partial payment for investment banking services. Investment
banking revenues are typically recognized at the completion of each transaction.
Underwriting revenues are presented net of related expenses. Non-reimbursable
expenses associated with private placement and advisory transactions are
recorded as non-compensation expenses.
The
following table sets forth our investment banking revenue and the number of
investment banking transactions (dollar amounts in thousands):
|
For
the Year Ended December 31,
|
2008-2009
|
2007-2008
|
||||||||||||||||||
|
2009
|
2008
|
2007
|
%
Change
|
%
Change
|
||||||||||||||||
|
Investment
banking revenue:
|
||||||||||||||||||||
|
Capital
raising
|
$
|
45,188
|
$
|
28,183
|
$
|
77,634
|
60.3
|
%
|
(63.7
|
)%
|
||||||||||
|
Strategic
advisory
|
25,977
|
35,122
|
49,594
|
(26.0
|
)
|
(29.2
|
)
|
|||||||||||||
|
Total
investment banking revenues
|
$
|
71,165
|
$
|
63,305
|
$
|
127,228
|
12.4
|
%
|
(50.2
|
)%
|
||||||||||
|
Investment
banking transactions:
|
||||||||||||||||||||
|
Capital
raising
|
92
|
59
|
66
|
|||||||||||||||||
|
Strategic
advisory
|
23
|
23
|
17
|
|||||||||||||||||
|
Total
investment banking transactions
|
115
|
82
|
83
|
|||||||||||||||||
|
Average
revenue per transaction (1)
|
$
|
619
|
$
|
772
|
$
|
1,533
|
||||||||||||||
|
(1)
|
Revenue
per investment banking transaction is generally higher in the U.S. than in
Canada.
|
2009 versus 2008. Investment
banking revenue increased $7.9 million in 2009 from 2008. This was
due in part to significant activity in the mining sector and the economic
recovery that began in the latter half of 2009, which resulted in increased
capital market activity for emerging growth companies. Our average
revenue per transaction was $0.6 million and $0.8 million in 2009 and 2008,
respectively. During 2009 and 2008 we closed 115 and 82 investment banking
transactions, respectively. During both 2009 and 2008, 36% of our investment
banking revenue was earned from the ten largest transactions during the
respective periods.
Capital
raising revenue accounted for 63% and 45% of our investment banking revenue in
2009 and 2008, respectively. Capital raising revenue increased $17.0 million to
$45.2 million in 2009 from 2008. Our average revenue per capital raising
transaction was $0.5 million in both 2009 and 2008.
Strategic
advisory revenue accounted for 37% and 55% of our investment banking revenue in
2009 and 2008, respectively. Strategic advisory revenue decreased $9.1 million
to $26.0 million in 2009 from 2008. Our average revenue per strategic
advisory transaction decreased to $1.1 million in 2009 from $1.5 million in
2008. The decrease in our average revenue per transaction is due to three large
transactions during the 2008, representing approximately $10.7 million of our
strategic advisory revenues.
In 2009,
investment banking transactions in the mining sector, primarily in Canada,
resulted in the increase in our capital raising investment banking revenues over
the prior period. We also experienced increased activity in the energy and
technology sectors during the fourth quarter of 2009, which represented 15% and
32% of investment banking revenues during 2009, respectively.
2008 versus 2007. Investment banking
revenue decreased $63.9 million in 2008 from 2007. This was
due principally to the unprecedented turmoil in the financial markets and
the economic recession, which resulted in decreased client activity levels and a
corresponding decrease in the number of investment banking transactions,
excluding the impact of the Westwind acquisition. Our average
revenue per transaction was $0.8 million and $1.5 million in 2008 and
2007, respectively. During 2008 and 2007, we closed 82 and 83 investment banking
transactions, respectively. Excluding the impact from the Westwind acquisition,
we closed 37 investment banking transactions in 2008. The change in our revenue
per transaction is primarily due to our acquisition of Westwind which,
historically, has completed a larger number of smaller sized transactions. In
addition, during 2007 our investment banking revenue included $13.4 million in
revenue generated from a single strategic advisory transaction. During 2008 and
2007, 36% and 31%, respectively, of our investment banking revenue was earned
from the ten largest transactions during the respective periods.
Capital
raising revenue accounted for 45% and 61% of our investment banking revenue in
2008 and 2007, respectively. Capital raising revenue decreased $49.5 million to
$28.2 million in 2008. Our average revenue per capital raising transaction
decreased to $0.5 million during 2008 from $1.2 million in 2007. During
2008 and 2007 we closed 59 and 66 capital raising transactions, respectively.
Excluding the impact from the Westwind acquisition, we closed 18 capital raising
transactions in 2008.
Strategic
advisory revenue accounted for 55% and 39% of our investment banking revenue in
2008 and 2007, respectively. Strategic advisory revenue decreased $14.5 million
to $35.1 million in 2008. Our average revenue per strategic advisory
transaction decreased to $1.5 million during 2008 from $2.9 million in 2007. The
decrease in our average revenue per strategic advisory transaction was primarily
due to a single strategic advisory transaction which resulted in $13.4 million
of revenue during 2007. During 2008 and 2007, we closed 23 and 17 strategic
advisory transactions, respectively. Excluding the impact from the Westwind
acquisition, we closed 19 strategic advisory transactions in
2008.
Brokerage
Revenue
Our
brokerage revenue includes (i) commissions paid by customers for brokerage
transactions in equity securities, (ii) spreads paid by customers on convertible
debt securities, (iii) trading gains (losses) which result from market
making activities from our commitment of capital to facilitate customer
transactions and from proprietary trading activities relating to our convertible
debt and special situations trading groups, (iv) advisory fees paid to us
by high-net-worth individuals and institutional clients of our private client
services group, which are generally based on the value of the assets we manage
and (v) fees paid to us for equity research.
2009 vs. 2008.
Brokerage revenue decreased $28.8 million in 2009 from 2008. The decrease
in brokerage revenue was primarily attributable to lower commission revenue from
our institutional business in the United States, Canada and Europe. Also
contributing to the decrease in brokerage revenue was our private client
services group, whose asset-based fees decreased as a result of the decrease in
the value of the assets they managed.
The
decrease in institutional commissions was primarily driven by a general decrease
in market volume and a higher loss ratio on net commissions. The combined
average daily volume on the New York Stock Exchange and the Nasdaq was
approximately 3.6 billion in 2009, a decrease of 4.3% from 2008. Our
combined average daily customer trading volume in 2009 decreased 12.7% from
2008. Another significant contributing factor to the decrease in our combined
average daily customer trading volume was our clients, who sought to reduce risk
during the capital market downturn, which led to reduced trading activity in the
latter half of 2009. The decrease
in volume, coupled with an increase in volatility in the growth stocks we trade
and an increase in competition for these trades requiring us to commit more
capital to facilitate trades, led to the higher loss ratio.
2008 versus 2007. Brokerage
revenue increased by $11.8 million in 2008 from 2007. This increase is primarily
due to our acquisition of Westwind in January 2008 and our expansion into Europe
in late 2007. During 2008, brokerage revenues of $13.3 million were generated
from former Westwind clients. These increases were offset by net trading losses
in our convertible debt trading business as we considerably reduced our
proprietary convertible debt trading book in the latter part of
2008.
The
combined average daily volume on the New York Stock Exchange, Nasdaq and the
Toronto Stock Exchange was approximately 4.0 billion shares during 2008, an
increase of 3.0% from 2007. Our combined average daily customer trading volume
increased 36.9% in 2008 from 2007 primarily due to our acquisition of
Westwind.
In
addition to our acquisition of Westwind, we believe the steps we took in 2008,
including (i) broadening our geographic coverage and (ii) developing our product
offerings within electronic trading in order to attract and retain trading
volume from customers who are shifting away from utilizing full-service
brokerage services and increasing their use of alternative trading systems,
resulted in our increased trading volume from institutional
customers.
Asset
Management Revenue
Our asset
management revenue includes (i) fees from investment partnerships we
manage, (ii) allocation of the appreciation and depreciation in the fair value
of our investments in the underlying partnerships, (iii) fees we earn from the
management of equity distributions received by our clients, (iv) other
asset management-related realized and unrealized gains and losses on investments
not associated with investment partnerships and (v) realized and unrealized
gains and losses on warrants received as partial payment for investment banking
services. Our investments in partnerships include the following private
investment funds: Thomas Weisel Capital Partners (“TWCP”), Thomas Weisel Global
Growth Partners (“TWGGP”), Thomas Weisel Healthcare Venture Partners (“TWHVP”)
and Thomas Weisel Venture Partners (“TWVP”).
The
following table sets forth our asset management revenue (dollar amounts in thousands):
|
For
the Year Ended December 31,
|
2008-2009
|
2007-2008
|
||||||||||||||||||
|
2009
|
2008
|
2007
|
%
Change
|
%
Change
|
||||||||||||||||
|
Asset
management revenue:
|
||||||||||||||||||||
|
Management
fees
|
$
|
15,205
|
$
|
14,691
|
$
|
15,946
|
3.5
|
%
|
(7.9
|
)%
|
||||||||||
|
Investments
in partnerships realized and unrealized gains and losses—net
|
(952
|
)
|
(13,414
|
)
|
17,662
|
(92.9
|
)
|
nm
|
||||||||||||
|
Other
investments realized and unrealized gains and losses—net
|
7,211
|
(8,397
|
)
|
(194
|
)
|
(185.9
|
)
|
nm
|
||||||||||||
|
Total
asset management revenue
|
$
|
21,464
|
$
|
(7,120
|
)
|
$
|
33,414
|
nm
|
(121.3
|
)%
|
||||||||||
2009 versus 2008. Investments
in partnerships realized and unrealized gains (losses) were as follows (dollar amounts in
thousands):
|
For
the Year Ended December 31,
|
||||||||||||
|
2009
|
2008
|
%
Change
|
||||||||||
|
Investments
in partnerships realized and unrealized gains (losses)—net:
|
||||||||||||
|
TWCP
|
$
|
(1,432
|
)
|
$
|
(3,155
|
)
|
(54.6
|
)%
|
||||
|
TWGGP
|
(133
|
)
|
(2,271
|
)
|
(94.2
|
)
|
||||||
|
TWHVP
|
(2,316
|
)
|
(4,530
|
)
|
(48.9
|
)
|
||||||
|
TWVP
|
(731
|
)
|
(2,956
|
)
|
(75.3
|
)
|
||||||
|
Other
|
3,660
|
(502
|
)
|
nm
|
||||||||
|
Total
investments in partnerships realized and unrealized gains (losses)—net
|
$
|
(952
|
)
|
$
|
(13,414
|
)
|
(92.9
|
)%
|
||||
The net
realized and unrealized investment loss during 2009 was attributable to our
partnership interests in private portfolio companies caused by both downward
valuations of those companies seeking capital in the current environment and
declining operating results. Stock price decreases associated with our interests
in public companies held in these partnerships also contributed to the loss.
This loss was partially offset by an unrealized gain attributable to our
interest in a partnership which has invested in a privately held company that
experienced significant growth in its operating results since our interest was
acquired at the beginning of 2008.
We
recorded net investment gains in other investments of $7.2 million in 2009
compared to net investment losses of $8.4 million in 2008 primarily due to an
increase in unrealized and realized gains on warrants and equity securities in
2009, partially offset by unrealized losses on ARS.
Management
fees increased $0.5 million in 2009 from 2008 as a result of an increase in
assets under management in TWGGP.
2008 versus 2007. Investments in
partnerships realized and unrealized gains and losses were as follows (dollar amounts in
thousands):
|
For
the Year Ended December 31,
|
||||||||||||
|
2008
|
2007
|
%
Change
|
||||||||||
|
Investments
in partnerships realized and unrealized gains (losses)—net:
|
||||||||||||
|
TWCP
|
$
|
(3,155
|
)
|
$
|
763
|
(513.4
|
)%
|
|||||
|
TWGGP
|
(2,271
|
)
|
2,654
|
(185.6
|
)
|
|||||||
|
TWHVP
|
(4,530
|
)
|
4,226
|
(207.2
|
)
|
|||||||
|
TWVP
|
(2,956
|
)
|
9,591
|
(130.8
|
)
|
|||||||
|
Other
|
(502
|
)
|
428
|
(217.2
|
)
|
|||||||
|
Total
investments in partnerships realized and unrealized gains (losses)—net:
|
$
|
(13,414
|
)
|
$
|
17,662
|
(175.9
|
)%
|
|||||
The net
realized and unrealized investment loss during 2008 was attributable to our
partnership interests in private portfolio companies caused by downward
valuations of those companies seeking capital during a period of decline in the
equity markets and lack of liquidity in the capital markets. Stock price
decreases associated with our interests in public companies held in these
partnerships also contributed to the loss.
We
recorded investment losses in other investments of $8.4 million in 2008 compared
to investment losses of $0.2 million in 2007. The investment losses in 2008 were
primarily due to net realized and unrealized losses on warrants acquired through
the Westwind acquisition of $6.2 million and declines in the value of equity
securities held by our small/mid cap funds.
Management
fees decreased $1.3 million in 2008 from 2007 as a result of a decrease in
assets under management in 2008 as compared to 2007.
Other
Revenue
2007. Other revenue of $0.9
million recorded in 2007 relates to the gain, net of selling costs, on the sale
of certain software previously developed for internal use. At the time of sale
there were no amounts capitalized relating to this software.
Net
Revenues by Geographic Segment
The
following table sets forth our net revenues by geographic segment (dollar amounts in
thousands):
|
For
the Year Ended December 31,
|
2008-2009
|
2007-2008
|
||||||||||||||||||
|
2009
|
2008
|
2007
|
%
Change
|
%
Change
|
||||||||||||||||
|
United
States
|
$
|
139,838
|
$
|
161,321
|
$
|
289,040
|
(13.3
|
)%
|
(44.2
|
)%
|
||||||||||
|
Other
countries
|
55,218
|
28,206
|
9
|
95.8
|
nm
|
|||||||||||||||
|
Total
net revenues
|
$
|
195,056
|
$
|
189,527
|
$
|
289,049
|
2.9
|
%
|
(34.4
|
)%
|
||||||||||
No single
customer accounted for 10% or more of net revenues during the years ended
December 31, 2009, 2008 and 2007.
2009 versus 2008. Net
revenues from countries other than the United States consist primarily of net
revenues from Canada. Net revenues from Canada during 2009 and 2008 accounted
for 77% and 75%, respectively, of net revenues from other
countries.
2008 versus 2007. Net revenues from
countries other than the United States increased $28.2 million during 2008 from
2007 as a result of our acquisition of Westwind in January 2008 and our
expansion into Europe in late 2007. During 2008, net revenues from countries
other than the United States consisted primarily of net revenues from Canada,
which accounted for approximately 75% of net revenues from other
countries.
The
following table sets forth information relating to our expenses excluding
interest, both in dollar amounts and as a percentage of net revenues (dollar amounts in thousands):
|
For
the Year Ended December 31,
|
2008-2009
|
2007-2008
|
||||||||||||||||||
|
2009
|
2008
|
2007
|
%
Change
|
%
Change
|
||||||||||||||||
|
Expenses
excluding interest:
|
||||||||||||||||||||
|
Compensation
and benefits
|
$
|
133,355
|
$
|
147,186
|
$
|
187,902
|
(9.4
|
)%
|
(21.7
|
)%
|
||||||||||
|
Non-compensation
expenses
|
125,550
|
237,893
|
103,920
|
(47.2
|
)
|
128.9
|
||||||||||||||
|
Total
expenses excluding interest
|
$
|
258,905
|
$
|
385,079
|
$
|
291,822
|
(32.8
|
)%
|
32.0
|
%
|
||||||||||
|
Percentage
of net revenues:
|
||||||||||||||||||||
|
Compensation
and benefits
|
68.4
|
%
|
77.7
|
%
|
65.0
|
%
|
||||||||||||||
|
Non-compensation
expenses
|
64.3
|
125.5
|
36.0
|
|||||||||||||||||
|
Total
|
132.7
|
%
|
203.2
|
%
|
101.0
|
%
|
||||||||||||||
|
Average
number of employees
|
488
|
641
|
632
|
|||||||||||||||||
Compensation
and Benefits Expense
Compensation
and benefits expense to secure the services of our employees has historically
been the largest component of our total expenses. Compensation and benefits
expense includes salaries, overtime, bonuses, commissions, share-based
compensation, benefits, severance, employment taxes and other employee
costs.
We pay
discretionary bonuses based on a combination of company and individual
performance, and we have entered into guaranteed contractual agreements with
employees that require specified bonus payments, both of which are accrued over
the related service periods. These bonuses make up a significant portion of our
compensation and benefits expense.
Share-based
awards constitute a portion of our compensation expense, and as a general
matter, vest over a three or four-year service period, are subject to continued
employment and, accordingly, are recorded as non-cash compensation expense
ratably over the service period beginning on the date of grant. As a result, our
aggregate compensation expense has been, and will continue to be, impacted as we
recognize share-based compensation expense associated with the vesting of prior
year grants in current and future periods. As of December 31, 2009, there was
$29.8 million of unrecognized compensation expense related to non-vested
restricted stock unit awards, which is expected to be recognized over a
weighted-average period of 2.0 years.
Since
January 2009, we have reduced our total headcount by approximately 20% as part
of our ongoing efforts to reduce our operating costs in order to mitigate the
effect of the decline in revenues. As an additional temporary cost saving
measure, we temporarily reduced base salaries for employees with titles of Vice
President and above by 10% during 2009, including our Chief Executive Officer,
President and other executive officers. For the 2009-2010 director term, we
reduced the base compensation for non-employee directors from $75,000 to
$50,000. Future headcount levels and resulting compensation costs will be
significantly dependent on the level of capital markets activity. We are not
anticipating further reductions in headcount, and in the beginning of 2010 we
restored our employees base salaries, including those of our Chief Executive
Officer, President and other executive officers.
2009 versus 2008.
Compensation and benefits expense decreased $13.8 million in 2009 from
2008. This change was the result of a decrease in salary, commissions and
related taxes and benefits expense of $16.9 million, $4.9 million and $3.3
million, respectively, during 2009 from 2008. The decrease was partially offset
by an increase in bonus of $11.7 million in 2009 from 2008. The overall decrease
was due to the 40% reduction in our headcount from January 2, 2008 through
December 2009. We had 453 and 572 employees at December 31, 2009 and 2008,
respectively. Compensation and benefits expense in 2009 and 2008 included $0.2
million and $6.3 million, respectively, of non-cash compensation expense
relating to share-based awards made in connection with our initial public
offering.
2008 versus 2007. Compensation and
benefits expense decreased $40.7 million in 2008 from 2007. Included in this
decrease are expenses of $18.2 million related to the acquisition of Westwind.
Excluding the impact from the Westwind acquisition, compensation and benefits
expense would have decreased $58.9 million during 2008. This fluctuation was
primarily the result of a decrease in bonus expense of $56.2 million. The
reduction in bonus expense is due to the significant decrease in our 2008
revenue as well as a one-time compensation expense in the fourth quarter of 2007
attributable to the acceleration of the payment of 2008 mid-year retention
bonuses. In addition, salary expense decreased $10.5 million during the same
period due to our reduction in non-Westwind employee headcount during 2008. This
decrease is partially offset by an increase in share-based compensation expense
of $7.3 million as a result of additional grants of restricted stock units made
during 2008. Compensation and benefits expense in 2008 and 2007 included $6.3
million and $6.1 million, respectively, of non-cash compensation expense
relating to share-based awards made in connection with our initial public
offering.
Our
non-compensation expenses include (i) brokerage execution, clearance and account
administration, (ii) communications and data processing, (iii) depreciation and
amortization of property and equipment, (iv) amortization of other intangible
assets, (v) goodwill impairment, (vi) marketing and promotion, (vii) occupancy
and equipment and (viii) other expenses.
Over the
last two years, we have worked diligently to reduce our expense base in order to
improve earnings and preserve capital. During 2009, non-compensation expenses
decreased by $19.7 million from 2008, excluding the goodwill impairment charge
of $92.6 million in 2008. Included in our non-compensation expenses for 2009 and
2008 are non-cash facilities lease loss charges of $2.3 million and $6.0 million
as a result of reducing our real estate footprint in San
Francisco.
2009 versus 2008.
Non-compensation expense decreased $112.3 million in 2009 from 2008. Of this
decrease, $92.6 million is attributable to the goodwill impairment recorded
during 2008. Other than the goodwill impairment, we reduced non-compensation
expense by $19.7 million in 2009 from 2008. Marketing and promotion expense
decreased $5.1 million due to a reduction of client related employee travel in
2009, partially driven by our headcount reductions. Occupancy and equipment
expense decreased $6.6 million primarily due to exiting or subletting offices in
India, New York and San Francisco during 2008. Communications and data
processing decreased $4.7 million primarily due to data services no longer
needed as a result of the reduction of headcount and to a lesser extent the
consolidation of our service providers. Amortization of intangible assets
decreased $5.3 million due to the use of an accelerated method of amortization
and the full amortization of our investment banking backlog intangible during
2008. The overall decrease in our non-compensation expense is partially offset
by a loss occurred in 2009 of approximately $5.1 million due to a
customer who failed to pay for several equity purchases that
we executed at the customer’s request, which is included in other
expenses. Based on our agreement with our primary clearing broker, we were
required to settle and pay for those transactions on the customer’s
behalf.
2008 versus 2007.
Non-compensation expense increased $134.0 million in 2008 from 2007. This
increase includes the goodwill impairment of $92.6 million and the amortization
of identifiable intangible assets acquired as a result of the Westwind
acquisition in January 2008 of $15.3 million. In addition, included in this
increase are additional operating expenses of $18.4 million attributable to our
acquisition of Westwind. Excluding the goodwill impairment, intangible
amortization and the impact from the Westwind acquisition, non-compensation
expense would have increased $7.7 million during 2008.
The
increase of $7.7 million in non-compensation expense includes an increase in
occupancy and equipment expense of $6.0 million during 2008 from 2007 primarily
due to our exiting certain office space in September and December 2008 for which
we recorded a $6.0 million lease loss charge. In addition, brokerage execution,
clearance and account administration increased $4.6 million during 2008 from
2007 primarily as a result of increased brokerage activity during the period.
Communication and data processing expense increased by $1.1 million due to
increased costs associated with our expansion into Canada, Europe and the
Midwest. This overall increase of $11.7 million is partially offset by a
decrease of $3.0 million in marketing and promotion primarily due to a decrease
in client related travel and conference expenses in 2008.
Provision
for Taxes
We
account for income taxes by recognizing deferred tax assets and liabilities
based upon temporary differences between the financial reporting and tax basis
of our assets and liabilities. Valuation allowances are established when
necessary to reduce deferred tax assets when it is more likely than not that a
portion or all of the deferred tax assets will not be realized. The change in
the effective tax rate in 2009 from 2008 is primarily due to the recognition of
unrecognized tax benefits in Canada, the cumulative compensation expense
recognized for financial reporting purposes for restricted stock units in excess
of the allowable tax deductions, and the increase in the valuation allowance as
a result of the U.S. net operating losses.
During
the year ended December 31, 2008, we determined that it was more-likely-than-not
that our U.S. deferred tax assets would not be realized. We made this
determination primarily based on the significant losses we incurred in 2008 as a
result of the severe economic downturn and its effect on the capital markets. As
of December 31, 2009, we continued to carry a full valuation allowance on
our U.S. and U.K. deferred tax assets due to continued losses incurred during
2009.
Our
effective tax rates for 2009, 2008 and 2007 were 0.3%, (3.9)% and 100.7%,
respectively. The tax benefit for 2009 relates to our operations in Canada. The
change in the effective tax rate in 2009 from 2008 is primarily due to the
recognition of unrecognized tax benefits in Canada of $1.1 million in 2009.
The decrease in our effective tax rate in 2008 from 2007 is primarily due to the
recognition of deferred tax benefits in 2007 resulting in a reduction to our
effective tax rate of 49.8%, our recognition of a deferred tax valuation
allowance in 2008 of $44.8 million resulting in a reduction to our effective tax
rate of 18.7%, and the 2008 impairment charge to goodwill acquired in the
Westwind transaction of $92.6 million, which did not provide a tax benefit and
resulted in a reduction to our effective tax rate of 17.0%.
Refer to
the “Deferred Tax Valuation Allowance” section within “Critical Accounting
Policies and Estimates” below for additional disclosures on factors considered
by management in the establishment of the valuation allowance on deferred tax
assets.
On
January 2, 2008, we acquired Westwind and under the agreement, we indirectly
acquired 100 percent of Westwind’s outstanding shares and Westwind became our
indirect subsidiary. Total consideration was approximately $156 million, which
consisted of $45 million in cash, 7,009,112 shares of our common stock valued at
$15.35 per share (based on the average closing price over a five day period
starting two days prior to the acquisition announcement date of October 1, 2007
and ending two days after the announcement date) and direct acquisition costs of
$3.1 million consisting primarily of legal, accounting and advisory fees. Common
stock issued includes 6,639,478 exchangeable shares, which are shares issued by
our Canadian subsidiary and are exchangeable for shares of our common
stock.
During
the year ended December 31, 2008, we experienced a significant decline in our
market capitalization which was affected by the uncertainty in the financial
markets. The tightening of the credit markets contributed to a sharp decline in
our capital raising investment banking revenues during the same period. Based on
the difficult conditions in business climate and our perception that the climate
is unlikely to change in the near term, we recorded a full impairment charge to
the goodwill asset of $92.6 million that was recorded as part of the Westwind
acquisition. The impairment charge was determined based on our fair value
utilizing a discounted cash flow analysis, and we considered our market
capitalization to determine the reasonableness of the discounted cash
flow.
Liquidity
and Capital Resources
Due to
the economic environment and its impact on the capital markets, we incurred net
losses for the two year period ended December 31, 2009, which contributed to a
reduction in cash in 2009 from 2008 and from 2007. Although we
incurred these losses, we believe that our current level of equity capital,
current cash balances, funds anticipated to be provided by operating activities
and funds available to be drawn under temporary loan agreements, will be
adequate to meet our liquidity and regulatory capital requirements for the next
12 months. Our broker dealers have adequate capital with
consolidated excess net capital of $44.2 million. Our cash and cash equivalents
at December 31, 2009 are $97.1 million, and we have taken significant steps to
reduce our compensation expenses by reducing headcount and reduce
non-compensation expenses by consolidating facilities and renegotiating rates
with vendors, which we expect to have a significant positive impact on operating
cash flows.
We
currently do not anticipate significant capital expenditure requirements in the
foreseeable future. Refer to the “Contractual Obligations” below for
a summary of commitments requiring cash payments, which primarily consist of
operating lease commitments and commitments to invest in private equity
funds. Additionally, included in securities owned is seed capital
which we have provided to our small/mid-cap growth public equity investment team
which may be available for withdrawal as the investment product obtains
additional commitments of capital from third party investors.
Cash
Flows
In
2009, cash and cash equivalents decreased $19.5 million from $116.6 million at
December 31, 2008. A significant portion of this decrease was due to
our net loss in 2009. Additionally, investing and financing
activities used $12.4 million of cash and cash equivalents during 2009 due to
the repurchase at par of $13.3 million of ARS from our customer accounts in July
2009, the net settlement of equity awards that became deliverable to our
employees of $2.4 million, the purchase of property plant and equipment of $1.5
million and the purchase of partnership investments and other investments
excluding ARS of $1.2 million offset by cash received from the sale or
redemption of ARS of $3.4 million and the sale of warrants of $3.3
million.
Auction
Rate Securities
ARS are
variable rate debt instruments, having long-term maturity dates of approximately
25 to 33 years, but whose interest rates are reset through an auction process,
most commonly at intervals of 7 and 35 days. The interest earned on these
investments is exempt from Federal income tax. All of our ARS are backed by
pools of student loans and were rated AAA, AA, A, Aaa, A1, A3, or Baa3 at
December 31, 2009.
As of
December 31, 2009 and 2008, we held ARS with a par value of $19.6 million and
$9.7 million, respectively, and a fair value of $18.1 million and $8.9 million,
respectively. The 2009 balance includes the July 2009 repurchase at par
of $13.3 million of ARS that we had previously sold from our
account in January 2008 to three customers without those customers’ prior
written consent.
In 2008,
widespread auction failures resulted in a lack of liquidity for these previously
liquid securities. As a result, the principal balance of our ARS will not be
accessible until successful auctions occur, a buyer is found outside of the
auction process, the issuers and the underwriters establish a different form of
financing to replace these securities or final payments come due according to
the contractual maturities. Our valuation of ARS assesses the credit and
liquidity risks associated with the securities, compares the yields on ARS to
similarly rated municipal issues and determines the fair values based on a
discounted cash flow analysis. We determined that our ARS had a fair value
decline of $0.8 million in each of the years ended December 31, 2009 and 2008.
Key assumptions of the discounted cash flow analysis included the
following:
Coupon Rate – In determining
fair value, we projected future interest rates based on the average near term
historical interest rate for these issues, the Securities Industry and Financial
Markets Association Municipal Swap Index and benchmark yield curves. The average
interest rates assumed ranged from 2.5% to 4.1% on a taxable equivalent yield
basis.
Discount Rate – Our discount
rate was based on a spread over LIBOR and consisted of a spread of 330 to 620
bps over this yield curve which we adjusted down to a spread of 135 to 200 bps
over periods of time ranging from 12 to 19 quarters. This spread is included in
the discount rate to reflect the current and expected illiquidity, which we
expect to moderate over time.
Timing of Liquidation – Our
cash flow projections consisted of various scenarios for each security wherein
we valued the ARS at points in time where it was in the interest of the issuer,
based on the fail rate, to redeem the securities. We concluded values for each
security based on the average valuation of these various scenarios. For the
securities analyzed, the shortest time to liquidation was assumed to be 27
months.
In 2009,
ARS were redeemed at their par value of $3.2 million, and ARS were sold for $0.2
million, which approximates par value. In January 2010, we sold ARS securities
for $2.0 million with a par value of $2.2 million.
Debt
Financing
Our
outstanding notes consist of a note in the principal amount of $10 million
issued to the California Public Employees’ Retirement System and a note in the
principal amount of $13 million issued to Nomura America Investment, Inc (the
“Senior Notes”). The Senior Notes have similar terms and covenants. The Senior
Notes bear interest at a floating rate equal to the mid-term applicable Federal
rate in effect from time to time and mature in 2011. A third note (the
“Contingent Payment Senior Note”) in the principal amount of $10 million
was issued to the California Public Employees’ Retirement System and was paid in
full in September 2008. The Senior Notes contain covenants regarding additional
debt and other liabilities that could cause them to become callable and require
that the notes be repaid should we enter into a transaction to liquidate or
dispose of all or substantially all of our property, business or assets. As of
December 31, 2009, we are in compliance with these covenants.
Bonus
and Net Settlement of Share-Based Compensation
The
timing of bonus compensation payments to our employees may significantly affect
our cash position and liquidity from period to period. While our employees are
generally paid salaries semi-monthly during the year, bonus payments, which make
up a larger portion of total compensation, have historically been paid in
February and July. In 2008, we made aggregate cash discretionary bonus payments
to our employees of $65.2 million, excluding payments of $12.6 million
attributable to 2007 bonuses earned by Westwind employees. In 2009, we made
aggregate cash bonus payments to our employees of $29.1 million. In January
and February of 2010, we made aggregate cash bonus payments to our employees of
approximately $33.3 million.
During
2009, approximately 1,700,000 shares of freely transferable common stock became
deliverable to our employees in respect of share-based awards previously
granted. We elected to settle a portion of these vesting shares through a net
settlement feature to meet the minimum employee statutory income tax withholding
requirements. During 2009, we made payments of $2.4 million related to the net
settlement of shares. Our cash position and liquidity will be effected to the
extent we elect to continue to settle a portion of vesting shares through net
settlement in the future.
In
February 2010, approximately 1,770,000 shares of freely transferable common
stock became deliverable to our employees in respect of share-based awards
previously granted, and we made payments of $2.6 million related to the net
settlement of these shares.
Regulatory
Net Capital and Other Amounts Required to be Maintained at Broker-Dealer
Subsidiary
We have
the following registered securities broker-dealers:
|
|
·
|
Thomas
Weisel Partners LLC
|
|
|
·
|
Thomas
Weisel Partners Canada Inc.
|
|
|
·
|
Thomas
Weisel Partners International Limited
(“TWPIL”)
|
TWP is a
registered U.S. broker-dealer that is subject to the Net Capital Rule
administered by the SEC and the Financial Industry Regulatory Authority
(“FINRA”), which requires the maintenance of minimum net capital. SEC and FINRA
regulations also provide that equity capital may not be withdrawn or cash
dividends paid if certain minimum net capital requirements are not
met.
TWPC is a
registered investment dealer in Canada and is subject to the capital
requirements of the Investment Industry Regulatory Organization of Canada. TWPIL
is a registered U.K. broker-dealer and is subject to the capital requirements of
the Financial Securities Authority.
Our
broker dealers maintain sufficient regulatory capital. The table below
summarizes the minimum capital requirements for our
broker-dealer subsidiaries (in thousands):
|
December
31, 2009
|
||||||||||||
|
Required
Net Capital
|
Net
Capital
|
Excess
Net Capital
|
||||||||||
|
TWP
|
$
|
1,000
|
$
|
31,112
|
$
|
30,112
|
||||||
|
TWPC
|
238
|
12,533
|
12,295
|
|||||||||
|
TWPIL
|
1,119
|
2,870
|
1,751
|
|||||||||
|
Total
|
$
|
2,357
|
$
|
46,515
|
$
|
44,158
|
||||||
Our
clearing brokers are also the primary source of the short-term financing of our
securities inventory. In connection with the provision of the short-term
financing, we are required to maintain deposits with our clearing brokers. These
deposits are included in our net receivable from or payable to clearing brokers
in the consolidated statements of financial condition.
Regulatory
net capital requirements change based on certain investment and underwriting
activities. Accordingly, we regularly monitor our liquidity position, including
our cash and net capital positions. In April 2008, TWP entered into a $25.0
million revolving note and subordinated loan agreement. The credit period in
which TWP could draw on the note ended on April 18, 2009. TWP renewed this
agreement on April 30, 2009, and the new credit period expires April 30, 2010.
From time to time we may borrow funds under this subordinated loan agreement or
under similar liquidity facilities. Such funds would constitute capital for
purposes of calculating our net capital position. This facility is available
subject to certain conditions including the following: (i) maintaining a certain
level of equity, (ii) meeting a certain level of net capital based upon
regulatory financial statement filings, (iii) continuing to employ Thomas W.
Weisel as Chief Executive Officer, (iv) continuing to operate TWP’s investment
banking and brokerage operations and (v) demonstrating TWP’s investment banking
and brokerage operations continue to generate a specified percentage of total
revenues. As of December 31, 2009, TWP did not meet the equity threshold
specified in the agreement.
Off-Balance
Sheet Arrangements
In the
ordinary course of business we enter into various types of off-balance sheet
arrangements including certain reimbursement guarantees, which include
contractual commitments and guarantees. For a discussion of our activities
related to these off-balance sheet arrangements, see Note 16 –
Contingencies, Commitments and Guarantees and Note 17 – Financial Instruments
with Off-Balance Sheet Risk, Credit Risk or Market Risk to our consolidated
financial statements.
Contractual
Obligations
The
following table provides a summary of our contractual obligations as of
December 31, 2009 (in
thousands):
|
Contractual
Obligation Due by Period
|
||||||||||||||||||||
|
2010
|
2011-2012
|
2013-2014
|
Thereafter
|
Total
|
||||||||||||||||
|
Notes
payable (1)
|
$
|
621
|
$
|
23,069
|
$
|
—
|
$
|
—
|
$
|
23,690
|
||||||||||
|
Capital
leases (2)
|
213
|
95
|
—
|
—
|
308
|
|||||||||||||||
|
Operating
leases (3)
|
16,581
|
25,472
|
19,967
|
11,906
|
73,926
|
|||||||||||||||
|
Commitment
to invest in private equity funds (4)
|
3,927
|
1,262
|
285
|
—
|
5,474
|
|||||||||||||||
|
Unaccrued
guaranteed compensation payments
|
307
|
2,224
|
—
|
—
|
2,531
|
|||||||||||||||
|
Total
contractual obligations
|
$
|
21,649
|
$
|
52,122
|
$
|
20,252
|
$
|
11,906
|
$
|
105,929
|
||||||||||
|
(1)
|
Represents
remaining principal amount and related estimated interest payable for
notes issued in connection with our initial public
offering.
|
|
(2)
|
Includes
estimated interest payable related to capital lease
liability.
|
|
(3)
|
Operating
lease expense is presented net of sublease rental
income.
|
|
(4)
|
The
private equity fund commitments have no specific contribution dates. The
timing of these contributions is presented based upon estimated
contribution dates, except for the contributions to unaffiliated funds,
which we are unable to estimate and are included as of the earliest
possible contribution date.
|
Critical
Accounting Policies and Estimates
The
preparation of financial statements in conformity with accounting principles
generally accepted in the United States of America requires management to make
estimates and assumptions about future events that affect the amounts reported
in our consolidated financial statements and their notes. Actual results could
differ significantly from those estimates. We believe that the following
discussion addresses our most critical accounting policies, which are those that
are most important to the presentation of our financial condition and results of
operations and require management’s most difficult, subjective and complex
judgments.
Fair
Value of Financial Instruments
The
objective of a fair value measurement is to determine the price that would be
received to sell an asset or paid to transfer a liability in an orderly
transaction between market participants at the measurement date (the exit
price), other than in a forced or liquidation sale. The hierarchy gives the
highest priority to unadjusted quoted prices in active markets for identical
assets or liabilities (Level 1 measurement) and the lowest priority to
unobservable inputs (Level 3 measurements). Assets and liabilities are
classified in their entirety based on the lowest level of input that is
significant to the fair value measurement. Our financial assets and liabilities
measured and reported at fair value are classified and disclosed in one of the
following categories:
|
|
·
|
Level
1 – Quoted prices are available in active markets for identical
investments as of the reporting date. Investments included in this
category are money market funds, listed equities and equity index funds.
We do not adjust the quoted price of these investments, even in situations
where we hold a large position and a sale could reasonably be expected to
affect the quoted price.
|
|
|
·
|
Level
2 – Pricing inputs are other than quoted prices in active markets, which
are either directly or indirectly observable as of the reporting date, and
fair value is determined through the use of models or other valuation
methodologies. Investments generally included in this category are
convertible bonds.
|
|
|
·
|
Level
3 – Pricing inputs are unobservable for the investment and include
situations where there is little, if any, market activity for the
investment. The inputs used in the determination of fair value require
significant management judgment or estimation. Investments generally
included in this category are partnership interests in private investment
funds, warrants, ARS and securities that cannot be publicly offered or
sold unless registration has been affected under the Securities
Act.
|
Securities
owned, securities sold, but not yet purchased and investments in partnerships
and other investments on our consolidated statements of financial condition
consist of financial instruments carried at fair value, with related unrealized
gains or losses recognized in our results of operations. The use of fair value
to measure these financial instruments, with related unrealized gains and losses
recognized immediately in our results of operations, is fundamental to our
consolidated financial statements.
The fair
value of financial instruments is derived using observable market prices,
observable market parameters or broker or dealer prices (bid and ask prices), if
available. In the case of financial instruments transacted on recognized
exchanges, the observable market prices represent quotations for completed
transactions from the exchange on which the financial instrument is principally
traded. For offsetting positions in the same financial instrument, the same
price within the bid-ask spread is used to measure both the long and short
positions. For financial instruments that do not have readily determinable fair
values through quoted market prices, the determination of fair value is derived
using techniques appropriate for each particular product.
The fair
value of Level 1 assets is based on observable market prices, observable market
parameters, or is derived from broker or dealer prices. The availability of
observable market prices and pricing parameters can vary from product to
product. When available, observable market prices and pricing or market
parameters in a product may be used to derive a price without requiring
significant judgment. In certain markets, observable market prices or market
parameters are not available for all products, and fair value is determined
using techniques appropriate for each particular product. These techniques
involve some degree of management judgment.
Level 3
investments in illiquid or private company equity securities that do not have
readily determinable fair values require us to estimate fair value using the
best information available. Among the factors considered by us in determining
the fair value are the cost, terms and liquidity of the investments, the
financial condition and operating results of the issuer, the quoted market price
of publicly traded securities with similar quality and yield and other factors
generally pertinent to the valuation of investments. In instances where a
security is subject to transfer restrictions, the value of the security is based
primarily on the quoted price of a similar security without restriction but may
be reduced by an amount estimated to reflect such restrictions. Even where the
value of a security is derived from an independent source, certain assumptions
may be required to determine the security’s fair value. For example, we assume
that the size of positions that we hold would not be large enough to affect the
quoted price of the securities if we sell them, and that any such sale would
happen in an orderly manner. The actual value realized upon disposition could be
different from the current estimated fair value. Private investments may also be
valued at cost for a period of time after an acquisition as the best indicator
of fair value. At December 31, 2009 and 2008, our Level 3 assets were
$57.0 million and $44.2 million, respectively. This balance primarily
consists of investments in funds managed by our Asset Management Subsidiaries
and unaffiliated general partners, warrants received as partial payment for
investment banking services, ARS and private investments in the equity of
operating companies.
Financial
instruments carried at contract amounts have short-term maturities (one year or
less), are repriced frequently or bear market interest rates and, accordingly,
those contracts are carried at amounts approximating fair value. Financial
instruments carried at contract amounts on our consolidated statements of
financial condition include receivables from and payables to clearing brokers
and corporate finance and syndicate receivables.
During
the year ended December 31, 2008, ARS for which the auctions failed were moved
to Level 3 as the assets were subject to valuation using unobservable inputs.
These ARS, as well as the ARS purchased subsequent to December 31, 2008,
continue to be classified as Level 3 instruments at December 31,
2009.
Investments
in Partnerships and Other Investments
Investments
in partnerships and other investments include our general and limited
partnership interests in investment partnerships and direct investments in
non-public companies. These interests are carried at estimated fair value. The
net assets of investment partnerships consist primarily of investments in
non-marketable securities. The underlying investments held by such partnerships
and direct investments in non-public companies are valued based on estimated
fair value ultimately determined by us in our capacity as general partner or
investor and, in the case of an investment in an unaffiliated investment
partnership, are based on financial statements prepared by an unaffiliated
general partner. Due to the inherent uncertainty of valuation, fair values of
these non-marketable investments may differ from the values that would have been
used had a ready market existed for these investments, and the differences could
be material. Increases and decreases in estimated fair value are recorded based
on underlying information of these non-public company investments including
third-party transactions evidencing a change in value, market comparables,
operating cash flows and financial performance of the companies, trends within
sectors and/or regions, underlying business models, expected exit timing and
strategy, and specific rights or terms associated with the investment, such as
conversion features and liquidation preferences. In cases where an estimate of
fair value is determined based on financial statements prepared by an
unaffiliated general partner, such financial statements are generally unaudited
other than audited year-end financial statements. Upon receipt of audited
financial statements from an investment partnership, we adjust the fair value of
the investments to reflect the audited partnership results if they differ from
initial estimates. We also perform procedures to evaluate fair value estimates
provided by unaffiliated general partners.
The
investment partnerships in which we are general partner may allocate carried
interest and make carried interest distributions, which represent an additional
allocation of net realized and unrealized gains to the general partner if the
partnerships’ investment performance reaches a threshold as defined in the
respective partnership agreements. These allocations are recognized in revenue
as realized and unrealized gains and losses on investments in partnerships. Our
recognition of allocations of carried interest gains and losses from the
investment partnerships in revenue is not adjusted to reflect expectations about
future performance of the partnerships.
As the investment partnerships realize
gains from the sale of their investments, they may make cash distributions as
provided for in the partnership agreements. Distributions that result from
carried interest may subsequently become subject to claw back if the fair value
of private equity partnership assets subsequently decrease in fair value. To the
extent these decreases in fair value and allocated losses exceed our capital
account balance, a liability is recorded by us. These liabilities for claw back
obligations are not required to be paid to the investment partnerships until the
dissolution of such partnerships, and are only required to be paid if the
cumulative amounts actually distributed exceed the amount due based on the
cumulative operating results of the partnerships. Accordingly, such liabilities
may be reversed if returns in the investment partnerships increase in the
future. At December 31, 2009 and 2008, we had a liability for such claw back
obligation of approximately $2 million and zero, respectively.
We earn
fees from the investment partnerships which we manage or of which we are a
general partner. Such management fees are generally based on the net assets or
committed capital of the underlying partnerships. Through March 31, 2007, we
agreed in certain cases to waive management fees, in lieu of making a cash
contribution, in satisfaction of our general partner investment commitments to
the investment partnerships. In these cases, we generally recognize our
management fee revenues at the time when we are allocated a special profit
interest in realized gains from these partnerships. With respect to the
investment partnerships existing as of March 31, 2007, we will no longer waive
management fees subsequent to March 31, 2007.
Liability
for Lease Losses
Our
accrued expenses and other liabilities include a liability for lease losses
related to office space that we subleased or vacated due to staff reductions in
2009 and in prior years. At December 31, 2009, and 2008 the lease loss liability
was $7.4 million and $9.6 million, respectively, and will expire with the
termination of the relevant facility leases through 2012. We estimate our
liability for lease losses as the net present value of the differences between
lease payments and receipts under sublease agreements. At December 31, 2009 we
have subleases on all floors or facilities we vacated that are co-terminus with
our lease commitments.
Legal
and Other Contingent Liabilities
We are
involved in a number of judicial, regulatory and arbitration matters arising in
connection with its business. The outcome of matters we are involved in cannot
be determined at this time, and the results cannot be predicted with certainty.
There can be no assurance that these matters will not have a material adverse
effect on our results of operations in any future period, and a significant
judgment could have a material adverse impact on our consolidated statements of
financial condition, operations and cash flows. We may in the future become
involved in additional litigation in the ordinary course of our business,
including litigation that could be material to our business.
We review
the need for any loss contingency reserves and establish reserves when, in the
opinion of management, it is probable that a matter would result in liability,
and the amount of loss, if any, can be reasonably estimated. Generally, in view
of the inherent difficulty of predicting the outcome of those matters,
particularly in cases in which claimants seek substantial or indeterminate
damages, it is not possible to determine whether a liability has been incurred
or to reasonably estimate the ultimate or minimum amount of that liability until
the case is close to resolution, in which case no reserve is established until
that time. See Note 16 – Commitments, Guarantees and Contingencies to the
consolidated financial statements included in Item 15 of this Annual Report of
Form 10-K for a further description of legal proceedings.
Additionally,
we will record receivables for insurance recoveries for legal settlements and
expenses when such amounts are covered by insurance and recovery of such losses
or costs are considered probable of recovery. These amounts will be recorded as
other assets in the consolidated statements of financial condition and will
reduce other expense to the extent such losses or costs have been incurred, in
the consolidated statements of operations.
Allowance
for Doubtful Accounts
Our
receivables include corporate finance and syndicate receivables relating to our
advisory and investment banking engagements and also include our related party
receivables. We record an allowance for doubtful accounts on these receivables
based on a specific identification basis. Management is continually evaluating
our receivables for collectibility and possible write-off by examining the facts
and circumstances surrounding each specific case where a loss is deemed a
possibility.
Deferred
Tax Valuation Allowance
In
determining our provision for income taxes, we recognize deferred tax assets and
liabilities based on the difference between the carrying value of assets and
liabilities for financial and tax reporting purposes. For our investments in
partnerships, adjustments to the carrying value are made based on determinations
of the fair value of underlying investments held by such partnerships. Both
upward and downward adjustments to the carrying value of investment
partnerships, which are recorded as unrealized gains and losses in asset
management revenue in our consolidated statements of operations, represent
timing differences until such time as these gains and losses are
realized.
Guidance
states that a deferred tax asset should be reduced by a valuation allowance if
based on the weight of all available evidence, it is more likely than not (a
likelihood of more than 50%) that some portion or the entire deferred tax asset
will not be realized. The valuation allowance should be sufficient to reduce the
deferred tax asset to the amount that is more likely than not to be realized.
The determination of whether a deferred tax asset is realizable is based on
weighing all available evidence, including both positive and negative evidence.
The guidance provides that the realization of deferred tax assets, including
carryforwards and deductible temporary differences, depends upon the existence
of sufficient taxable income of the same character during the carryback or
carryforward period. The guidance requires the consideration of all sources of
taxable income available to realize the deferred tax asset, including the future
reversal of existing temporary differences, future taxable income exclusive of
reversing temporary differences and carryforwards, taxable income in carryback
years and tax-planning strategies.
Our
operations are in a cumulative loss position for the three-year period ended
December 31, 2009 primarily created by significant operating losses in 2008 and
2009 due to the challenging environment for the capital markets. For purposes of
assessing the realization of the deferred tax assets, this cumulative taxable
loss position is considered significant negative evidence and has caused us to
conclude that it is more likely than not that we will not be able to realize the
deferred tax assets in the future. As of December 31, 2008, we recorded
full valuation allowances of $44.8 million and $1.7 million on our U.S. and
U.K. deferred tax assets, respectively. As of December 31, 2009, the valuation
allowances increased to $67.0 million on U.S. deferred tax assets and $1.8
million on the U.K. deferred tax asset. We will reassess the realization of the
deferred tax assets each reporting period. To the extent that our financial
results improve and the deferred tax assets become realizable, we will be able
to reduce the valuation allowance through earnings.
In 2007,
we reduced a previously established $1.4 million valuation allowance to zero
resulting in the recognition of a $1.4 million deferred tax benefit. The
valuation allowance was recorded due to uncertainty of our ability to generate
future capital gains to offset a deferred tax benefit, which resulted from
unrealized capital losses in our investments in partnerships. In 2007, we
recorded net capital gains of $17.7 million in our investments in partnerships,
which included the recognition of previously recorded unrealized gains. The
valuation allowance was reduced due to the significant recognition of capital
gains, the continued performance of our investments and the expectation of being
able to reduce unrealized capital losses through recognition and future
unrealized capital gains.
Business
Combinations
We
allocate the purchase price of acquired businesses to the tangible and
intangible assets acquired and liabilities assumed based on estimated fair
values. Such allocations require management to make significant estimates and
assumptions, especially with respect to intangible assets acquired.
Management’s
estimates of fair value are based upon assumptions believed to be reasonable.
These estimates are based on information obtained from management of the
acquired companies and are inherently uncertain. Critical estimates in valuing
certain of the intangible assets include, but are not limited to, (i) future
expected cash flows from acquired businesses, (ii) future expected cash flows
from employees subject to non-compete agreements and (iii) the acquired
company’s market position.
Unanticipated
events and circumstances may occur which may affect the accuracy or validity of
such assumptions, estimates or actual results.
Goodwill
and Long-Lived Assets
We are required to
evaluate goodwill annually to determine whether it is impaired. Goodwill is also
required to be tested between annual impairment tests if an event occurs or
circumstances change that would reduce the fair value of a reporting unit below
its carrying amount. We selected the fourth quarter to perform our annual
goodwill impairment testing.The guidance requires a two-step impairment
test be performed on goodwill. In the first step, we compare the fair value of
the reporting unit to its carrying value. If the fair value of the reporting
unit exceeds the carrying value of the net assets assigned to that unit,
goodwill is considered not impaired and we are not required to perform further
testing. If the carrying value of the net assets assigned to the reporting unit
exceeds the fair value of the reporting unit, then we must perform the second
step of the impairment test in order to determine the implied fair value of the
reporting unit’s goodwill. If the carrying value of a reporting unit’s goodwill
exceeds its implied fair value, then we would record an impairment loss equal to
the difference.
During
the year ended December 31, 2008, we experienced a significant decline in our
market capitalization which was affected by the uncertainty in the financial
markets. The tightening of the credit markets contributed to a sharp decline in
our capital raising investment banking revenues during the same period. Based on
this operating environment and our perception that the climate was unlikely to
change in the near term, we recorded a full impairment charge to the goodwill
asset of $92.6 million. The impairment charge was determined based on our fair
value utilizing a discounted cash flow analysis, and we considered our market
capitalization to determine the reasonableness of the discounted cash
flow.
We review
impairment and disposal of long-lived assets whenever events or changes in
circumstances indicate that the carrying amount of an asset may not be
recoverable. The recoverability of an asset is measured by a comparison of the
carrying amount of an asset to its estimated undiscounted future cash flows
expected to be generated. If the carrying amount of an asset exceeds its
estimated future cash flows, an impairment charge is recognized by the amount by
which the carrying amount of the asset exceeds the fair value of the
asset.
While we
believe our estimates and judgments about future cash flows are reasonable,
future impairment charges may be required if the expected cash flow estimates,
as projected, do not occur or if events change requiring us to revise our
estimates.
Recently
Issued Accounting Pronouncements
Accounting for Assets Acquired and
Liabilities Assumed in a Business Combination That Arise from Contingencies –
In April
2009, the Financial Accounting Standards Board (“FASB”) issued amending and
clarifying guidance over business combinations to address application issues
raised by preparers, auditors and members of the legal profession on initial
recognition and measurement, subsequent measurement and accounting and
disclosure of assets and liabilities arising from contingencies in a business
combination. This guidance is effective for acquisitions on or after the
beginning of the first annual reporting period beginning on or after December
15, 2008. We adopted the guidance upon issuance, and the adoption did not have a
material impact on our consolidated statements of financial condition,
operations and cash flows.
Determining Whether a Market Is Not
Active and a Transaction Is Not Distressed – In April 2009, the FASB
issued guidance providing additional guidance on determining whether a market
for a financial asset is not active and a transaction is not distressed for fair
value measurements. The guidance was effective for interim and annual periods
ending after March 15, 2009 and is applied prospectively. We adopted the
guidance on March 31, 2009, and the adoption did not have a material impact on
our consolidated statements of financial condition, operations and cash
flows.
Determining Fair Value When the
Volume and Level of Activity for the Asset or Liability Have Significantly
Decreased and Identifying Transactions That Are Not Orderly – In April
2009, the FASB issued additional guidance for estimating fair value when the
volume and level of activity for the asset or liability have significantly
decreased. This guidance also assists in identifying circumstances that indicate
a transaction is not orderly. This guidance was effective for interim and annual
reporting periods ending after June 15, 2009 and is applied prospectively. We
adopted the guidance on June 30, 2009, and the adoption did not have a material
impact on our consolidated statements of financial condition, operations and
cash flows.
Accounting for Transfers of
Financial Assets – In June 2009, the FASB issued guidance to improve the
relevance, representational faithfulness and comparability of the information
that a reporting entity provides in its financial reports about a transfer of
financial assets, the effects of a transfer on its financial position, financial
performance and cash flows, and a transferor’s continuing involvement in
transferred financial assets. This guidance is effective for interim and annual
periods ending after November 15, 2009 and is applied prospectively. We adopted
the guidance on December 31, 2009, and the adoption did not have an impact on
our consolidated statements of financial condition, operations and cash
flows.
Consolidation of Variable Interest
Entities – In June 2009, the FASB issued new guidance on consolidation of
variable interest entities (“VIE”) which is effective January 1, 2010. This
new guidance amends the consolidation guidance applicable to VIEs, including
changing the approach to determining a VIE’s primary beneficiary (the reporting
entity that must consolidate the VIE) and the frequency of reassessment. In
January 2010, the FASB voted to defer the effective date of this new guidance
for a reporting enterprise’s interest in certain investment companies and for
certain money market funds. The adoption of this new guidance, except the
deferred portion which we are currently evaluating, is not expected to have a
material impact on our consolidated statements of financial condition,
operations and cash flows.
Measuring Liabilities at Fair
Value – In August 2009, the FASB issued guidance with the objective to
provide clarification in circumstances in which a quoted market price in an
active market for the identical liability is not available. The guidance is
applicable when trying to measure the fair value of a liability under fair value
accounting rules. The guidance is effective for the first reporting period,
including interim reporting periods, beginning after the standard was issued. We
adopted the guidance upon issuance, and the adoption did not have a material
impact on our consolidated statements of financial condition, operations and
cash flows.
Item
7A. Quantitative and Qualitative Disclosures About Market Risk
Our
business and financing activities directly expose us to various types of risks,
including (i) market risk relating to, among other things, the changes in the
market value of equity or debt instruments and (ii) interest rate risk relating
to the effect of changes in interest rates and the yield curve on the value of
debt instruments that we hold and our payment obligations in respect of notes
that we have issued. We are also exposed to other risks in the conduct of our
business such as credit risk and the effects of inflation. Our exposure to these
risks could be material to our consolidated financial statements. Set forth
below is a discussion of some of these risks together with quantitative
information regarding the aggregate amount and value of financial instruments
that we hold or in which we maintain a position or that we have issued and that
remain outstanding, in each case, as of December 31, 2009 and 2008. Due to the
nature of our business, in particular our trading business, the amount or value
of financial instruments that we hold or maintain a position in will fluctuate
on a daily and intra-day basis, and the year-end values and amounts presented
below are not necessarily indicative of the exposures to market risk, interest
rate risk and other risks we may experience at various times throughout any
given year.
Market
Risk
Market
risk represents the risk of loss that may result from the change in value of a
financial instrument due to fluctuations in its market price. Market risk may be
exacerbated in times of trading illiquidity when market participants refrain
from transacting in normal quantities and/or at normal bid-offer spreads. Our
exposure to market risk is directly related to our role as a financial
intermediary in customer trading and to our market-making, investment banking
and investment activities, which include committing from time to time to
purchase large blocks of stock from publicly-traded issuers or their significant
shareholders. We trade in equity and convertible debt securities as an active
participant in both listed and over-the-counter equity and convertible debt
markets. Market risk is inherent in financial instruments.
The
following tables categorize our market risk sensitive financial instruments by
type of security and, where applicable, by contractual maturity
date.
As of
December 31, 2009 (in
thousands):
|
Maturity
Date
|
Carrying
Value
as of
|
|||||||||||||||||||||||||||||||
|
2010
|
2011
|
2012
|
2013
|
2014
|
Thereafter
|
Total
Principal
|
December
31,
2009
|
|||||||||||||||||||||||||
|
Inventory
positions:
|
||||||||||||||||||||||||||||||||
|
Convertible
bonds—long
|
$
|
—
|
$
|
—
|
$
|
—
|
$
|
—
|
$
|
—
|
$
|
—
|
$
|
—
|
$
|
—
|
||||||||||||||||
|
Warrants—long
(1)
|
296
|
5,282
|
161
|
—
|
—
|
121
|
5,860
|
5,860
|
||||||||||||||||||||||||
|
Equity
securities—long
|
16,063
|
|||||||||||||||||||||||||||||||
|
Total—long
|
296
|
5,282
|
161
|
—
|
—
|
121
|
5,860
|
21,923
|
||||||||||||||||||||||||
|
Equity
securities—short
|
19
|
|||||||||||||||||||||||||||||||
|
Equity
index fund—short
|
15,560
|
|||||||||||||||||||||||||||||||
|
Total—short
|
15,579
|
|||||||||||||||||||||||||||||||
|
Other
investments:
|
||||||||||||||||||||||||||||||||
|
Auction
rate securities
|
100
|
(2)
|
—
|
—
|
—
|
—
|
19,500
|
(3)
|
19,600
|
18,087
|
||||||||||||||||||||||
|
Other
|
2,392
|
|||||||||||||||||||||||||||||||
|
(1)
|
Maturity
date is based on the warrant expiration date. An assumption of expiration
date was made when none was
available.
|
|
(2)
|
Represents
2010 redemptions as of February 28,
2010.
|
|
(3)
|
Represents
contractual maturity date. Please refer to further discussion regarding
ARS included in the “Liquidity and Capital Resources” section
above.
|
As of
December 31, 2008 (in
thousands):
|
Maturity
Date
|
Carrying
Value
as of
|
|||||||||||||||||||||||||||||||
|
2009
|
2010
|
2011
|
2012
|
2013
|
Thereafter
|
Total
Principal
|
December
31,
2008
|
|||||||||||||||||||||||||
|
Inventory
positions
|
||||||||||||||||||||||||||||||||
|
Convertible
bonds—long
|
$
|
—
|
$
|
1,000
|
$
|
7,050
|
$
|
—
|
$
|
—
|
$
|
4,500
|
$
|
12,550
|
$
|
6,402
|
||||||||||||||||
|
Warrants—long
(1)
|
250
|
153
|
27
|
—
|
—
|
—
|
430
|
430
|
||||||||||||||||||||||||
|
Equity
securities—long
|
12,095
|
|||||||||||||||||||||||||||||||
|
Total—long
|
250
|
1,153
|
7,077
|
—
|
—
|
4,500
|
12,980
|
18,927
|
||||||||||||||||||||||||
|
Equity
securities—short
|
1,465
|
|||||||||||||||||||||||||||||||
|
Equity
index fund—short
|
10,072
|
|||||||||||||||||||||||||||||||
|
Total—short
|
11,537
|
|||||||||||||||||||||||||||||||
|
Other
investments
|
||||||||||||||||||||||||||||||||
|
Auction
rate securities
|
—
|
—
|
—
|
—
|
—
|
9,650
|
(2)
|
9,650
|
8,913
|
|||||||||||||||||||||||
|
Other
|
2,248
|
|||||||||||||||||||||||||||||||
|
(1)
|
Maturity
date is based on the warrant expiration date. An assumption of expiration
date was made when none was
available.
|
|
(2)
|
Represents
contractual maturity date. Please refer to further discussion regarding
ARS included in the “Liquidity and Capital Resources” section
above.
|
In
connection with our asset management activities, we provide seed investment
funds for new asset management products to be invested in long and short
positions in publicly traded equities. These seed investments are included in
the tables presented above.
In
addition to the positions set forth in the table above, we maintain investments
in private equity, venture capital and other investment funds. These investments
are carried at fair value in accordance with industry guidance, and as of
December 31, 2009 and December 31, 2008, the fair value of these investments was
$30.7 million and $32.7 million, respectively.
From time
to time we may use a variety of risk management techniques and hedging
strategies in the ordinary course of our brokerage activities, including
establishing position limits by product type and industry sector, closely
monitoring inventory turnover, maintaining long and short positions in related
securities and using exchange-traded equity options and other derivative
instruments.
In
connection with our brokerage activities, management reviews reports appropriate
to the risk profile of specific trading activities. Typically, market conditions
are evaluated and transaction details and securities positions are reviewed.
These activities seek to ensure that trading strategies are within acceptable
risk tolerance parameters, particularly when we commit our own capital to
facilitate client trading. We believe that these procedures, which stress timely
communications between our traders, institutional brokerage management and
senior management, are important elements in evaluating and addressing market
risk.
Interest
rate risk represents the potential loss from adverse changes in market interest
rates. As we may hold U.S. Treasury securities, ARS and convertible debt
securities, and incur interest-sensitive liabilities from time to time, we are
exposed to interest rate risk arising from changes in the level and volatility
of interest rates and in the shape of the yield curve. Certain of these interest
rate risks may be managed through the use of short positions in
U.S. government and corporate debt securities and other instruments. In
addition, we issued floating rate notes to California Public Employees’
Retirement System and Nomura America Investment, Inc., and therefore we are
exposed to the risk of higher interest payments on those notes if interest rates
rise.
The
tables below provide information about our financial instruments that are
sensitive to changes in interest rates. For inventory positions, other
investments and notes payable, the table presents principal cash flows with
contractual maturity dates.
As of
December 31, 2009
(in
thousands):
|
Maturity
Date
|
Carrying
Value
as of
|
|||||||||||||||||||||||||||||||
|
2010
|
2011
|
2012
|
2013
|
2014
|
Thereafter
|
Total
Principal
|
December
31,
2009
|
|||||||||||||||||||||||||
|
Inventory
positions:
|
||||||||||||||||||||||||||||||||
|
Convertible
bonds—long
|
$
|
—
|
$
|
—
|
$
|
—
|
$
|
—
|
$
|
—
|
$
|
—
|
$
|
—
|
$
|
—
|
||||||||||||||||
|
Other
investments:
|
||||||||||||||||||||||||||||||||
|
Auction
rate securities (1)
|
100
|
(4)
|
—
|
—
|
—
|
—
|
19,500
|
(5)
|
19,600
|
18,087
|
||||||||||||||||||||||
|
Notes
payable:
|
||||||||||||||||||||||||||||||||
|
Senior
Note, floating mid-term AFR(2)
+ 2.25% (3)
|
—
|
13,000
|
—
|
—
|
—
|
—
|
13,000
|
12,732
|
||||||||||||||||||||||||
|
Senior
Note, floating mid-term AFR(2)
+ 2.25% (3)
|
—
|
10,000
|
—
|
—
|
—
|
—
|
10,000
|
9,794
|
||||||||||||||||||||||||
|
(1)
|
The
weighted average Federal tax exempt interest rate was 0.73% at December
31, 2009.
|
|
(2)
|
Applicable
Federal Rate.
|
|
(3)
|
We
have recorded the debt principal at a discount to reflect the below-market
stated interest rate of these notes at inception. We amortize the discount
to interest expense so that the interest expense approximates our
incremental borrowing rate. The weighted average interest rate was 4.36%
at December 31, 2009.
|
|
(4)
|
Represents
2010 redemptions as of February 28,
2010.
|
|
(5)
|
Represents
contractual maturity date. Please refer to further discussion regarding
ARS included in the “Liquidity and Capital Resources” section
above.
|
As of
December 31, 2008 (in
thousands):
|
Maturity
Date
|
Carrying
Value
as of
|
|||||||||||||||||||||||||||||||
|
2009
|
2010
|
2011
|
2012
|
2013
|
Thereafter
|
Total
Principal
|
December
31,
2008
|
|||||||||||||||||||||||||
|
Inventory
positions
|
||||||||||||||||||||||||||||||||
|
Convertible
bonds—long
|
$
|
—
|
$
|
1,000
|
$
|
7,050
|
$
|
—
|
$
|
—
|
$
|
4,500
|
$
|
12,550
|
$
|
6,402
|
||||||||||||||||
|
Other
investments
|
||||||||||||||||||||||||||||||||
|
Auction
rate securities (1)
|
—
|
—
|
—
|
—
|
—
|
9,650
|
(3)
|
9,650
|
8,913
|
|||||||||||||||||||||||
|
Notes
payable
|
||||||||||||||||||||||||||||||||
|
Senior
Note, floating mid-term AFR(2)
+ 2.25% (3)
|
—
|
—
|
13,000
|
—
|
—
|
—
|
13,000
|
12,492
|
||||||||||||||||||||||||
|
Senior
Note, floating mid-term AFR(2)
+ 2.25% (3)
|
—
|
—
|
10,000
|
—
|
—
|
—
|
10,000
|
9,609
|
||||||||||||||||||||||||
|
(1)
|
The
weighted average Federal tax exempt interest rate was 1.91% at December
31, 2008.
|
|
(2)
|
Applicable
Federal Rate.
|
|
(3)
|
We
have recorded the debt principal at a discount to reflect the below-market
stated interest rate of these notes at inception. We amortize the discount
to interest expense so that the interest expense approximates our
incremental borrowing rate. The weighted average interest rate was 5.17%
at December 31, 2008.
|
|
(4)
|
Represents
contractual maturity date. Please refer to further discussion regarding
ARS included in the “Liquidity and Capital Resources” section
above.
|
Our broker-dealer subsidiaries place
and execute customer orders. The orders are then settled by unrelated clearing
organizations that maintain custody of customers’ securities and provide
financing to customers. The majority of our transactions, and consequently the
concentration of our credit exposure, is with our clearing brokers. The clearing
brokers are also the primary source of our short-term financing (securities
sold, but not yet purchased), which is collateralized by cash and securities
owned by us and held by the clearing brokers. Our securities owned may be
pledged by the clearing brokers. The amount receivable from and payable to the
clearing brokers in the consolidated statements of financial condition represent
amounts receivable and payable in connection with the proprietary and customer
trading activities. As of December 31, 2009 and December 31, 2008, we had
cash on deposit with the clearing brokers of $60.8 million and $69.3 million,
respectively, that was not collateralizing liabilities to the clearing brokers.
In addition to the clearing brokers, we are exposed to credit risk from other
brokers, dealers and other financial institutions with which we transact
business.
Through
indemnification provisions in our agreement with our clearing organizations,
customer activities may expose us to off-balance sheet credit risk. We may be
required to purchase or sell financial instruments at prevailing market prices
in the event a customer fails to settle a trade on its original terms or in the
event cash and securities in customer margin accounts are not sufficient to
fully cover customer obligations. We seek to control the risks associated with
brokerage services for our customers through customer screening and selection
procedures as well as through requirements that customers maintain margin
collateral in compliance with governmental and self-regulatory organization
regulations and clearing organization policies.
During
2009, we recorded a loss of $5.1 million due to a customer who failed to
pay for several equity purchases that we executed at the
customer’s request. Based on our agreement with our primary clearing broker, we
were required to settle and pay for those transactions on the customer’s
behalf. We recorded the loss in bad debt expense which is included in other
expense in the consolidated statement of operations. We believe the loss was
incurred as a result of fraudulent activity on the part of the customer and are
vigorously pursuing that customer for the losses incurred upon liquidating those
positions.
Effects
of Inflation
Due to
the fact that our assets are generally liquid in nature, they are not
significantly affected by inflation. However, the rate of inflation affects our
expenses, such as employee compensation, office leasing costs and communications
charges, which may not be readily recoverable in the price of services offered
by us. To the extent inflation results in rising interest rates and has other
adverse effects upon the securities markets, it may adversely affect our
financial condition, operations and cash flows.
Regulatory
and Legal Risk
Legal
risk includes the risk of customer and/or regulatory claims in connection with
ARS matters. While these claims may not be the result of any wrongdoing, we do,
at a minimum, incur costs associated with investigating and defending against
such claims. In addition, we are generally subject to extensive legal and
regulatory requirements and are subject to potentially sizable adverse legal
judgments or arbitration awards, and fines, penalties, and other sanctions for
non-compliance with those legal and regulatory requirements. We have
comprehensive procedures addressing issues such as regulatory capital
requirements, sales and trading practices, use of and safekeeping of customer
funds, the extension of credit, including margin loans, collection activities,
money laundering and record keeping. We act as an underwriter or selling group
member in equity offerings, and we have potential legal exposure to claims
relating to these securities offerings. To manage this exposure, a committee of
senior executives reviews proposed underwriting commitments to assess the
quality of the offering and the adequacy of due diligence
investigation.
The
financial statements and supplementary data required by this item are included
in Item 15 –
“Exhibits and Financial Statement Schedules” of this Annual Report on
Form 10-K.
Item
9. Changes in Disagreements
with Accountants on Accounting and Financial
Disclosure
None.
Item
9A. Controls and
Procedures
We
maintain disclosure controls and procedures that are designed to ensure that
material information required to be disclosed in our periodic reports filed or
submitted under the Securities Exchange Act of 1934, as amended (the “Exchange
Act”), is recorded, processed, summarized and reported within the time periods
specified in the SEC’s rules and forms. Our disclosure controls and procedures
are also designed to ensure that information required to be disclosed in the
reports we file or submit under the Exchange Act is accumulated and communicated
to our management, including our Chief Executive Officer and Chief Financial
Officer as appropriate, to allow timely decisions regarding required
disclosure.
During
the year ended December 31, 2009, we carried out an evaluation, under the
supervision and with the participation of management, including the Chief
Executive Officer and Chief Financial Officer, of the effectiveness of the
design and operation of the disclosure controls and procedures, as defined in
Rules 13a-15(e) and 15d-15(e) under the Exchange Act. Based upon that
evaluation, our Chief Executive Officer and Chief Financial Officer concluded
that our disclosure controls and procedures were effective as of December 31,
2009.
There
were no changes in our internal control over financial reporting in the year
ended December 31, 2009 that have materially affected, or are reasonably likely
to materially affect, our internal control over financial
reporting.
The
certifications required by Section 302 of the Sarbanes-Oxley Act of 2002 are
filed as Exhibits 31.1 and 31.2, respectively, to this Annual Report on Form
10-K.
Report
of Management on Internal Control over Financial Reporting
The
management of Thomas Weisel Partners Group, Inc. is responsible for establishing
and maintaining adequate internal control over financial reporting. Internal
control over financial reporting is a process to provide reasonable assurance
regarding the reliability of our financial reporting for external purposes in
accordance with accounting principles generally accepted in the United States of
America. Internal control over financial reporting includes maintaining records
that in reasonable detail accurately and fairly reflect our transactions;
providing reasonable assurance that transactions are recorded as necessary for
preparation of our financial statements; providing reasonable assurance that
receipts and expenditures are made in accordance with management authorization;
and providing reasonable assurance that unauthorized acquisition, use or
disposition of company assets that could have a material effect on our financial
statements would be prevented or detected on a timely basis. Because of its
inherent limitations, internal control over financial reporting is not intended
to provide absolute assurance that a misstatement of our financial statements
would be prevented or detected.
Management
conducted an evaluation of the effectiveness of our internal control over
financial reporting based on the framework and criteria established in Internal Control — Integrated
Framework, issued by the Committee of Sponsoring Organizations of the
Treadway Commission. This evaluation included review of the documentation of
controls, evaluation of the design effectiveness of controls, testing of the
operating effectiveness of controls and a conclusion on this evaluation. Based
on this evaluation, management concluded that our internal control over
financial reporting was effective as of December 31, 2009.
Our
internal control over financial reporting as of December 31, 2009 has been
audited by Deloitte & Touche LLP, an independent registered public
accounting firm, as stated in their report which is included in Part IV,
Item 15 of this Annual Report on Form 10-K.
Item
9B. Other
Information
None.
Item
10. Directors, Executive Officers, and
Corporate Governance of the Registrant
The
information required by this item is included in Item 4 – “Submission of Matters
to a Vote of Security Holders” of this Annual Report on Form 10-K, as well as
incorporated herein by reference to the sections entitled “The Board of
Directors and its Committees”, “Compensation of Directors” and “Section 16(a)
Beneficial Ownership Reporting Compliance” in our definitive Proxy Statement for
the Annual Meeting of Shareholders scheduled to be held on May 20, 2010 (the
“Proxy Statement”), which we expect to file with the SEC in April 2010.
Item
11. Executive
Compensation
The
information required by this item is incorporated herein by reference to the
sections entitled “Executive Compensation” and “Compensation Discussion and
Analysis” in the Proxy Statement.
Item
12. Security
Ownership of Certain Beneficial Owners and Management and Related Stockholder
Matters
The
information required by this item is included in Item 5 – “Market for
Registrant’s Common Equity, Related Shareholder Matters and Issuer Purchases of
Equity Securities” of this Annual Report on Form 10-K, as well as incorporated
herein by reference to the section entitled “Security Ownership of Certain
Beneficial Owners and Management” in the Proxy Statement.
Item
13. Certain Relationships and
Related Transactions, and Director Independence
The
information required by this item is incorporated herein by reference to the
section entitled “Certain Relationships and Related Transactions” in the Proxy
Statement.
Item
14. Principal Accountant Fees
and Services
The
information required by this item is incorporated herein by reference to the
section entitled “Fees Paid to Independent Auditors” in the Proxy Statement.
Item
15. Exhibits
and Financial Statement Schedules
|
(a)
|
The
following documents are filed as part of this Annual Report on Form
10-K:
|
|
1.
|
Consolidated
Financial Statements
|
|
·
|
Report
of Independent Registered Public Accounting Firm on Consolidated Financial
Statements;
|
|
·
|
Report
of Independent Registered Public Accounting Firm on Internal Control Over
Financial Reporting;
|
|
·
|
Consolidated
Statements of Financial Condition as of December 31, 2009 and
2008;
|
|
·
|
Consolidated
Statements of Operations for the years ended December 31, 2009, 2008 and
2007;
|
|
·
|
Consolidated
Statements of Changes in Shareholders’ Equity for the years ended December
31, 2009, 2008 and 2007;
|
|
·
|
Consolidated
Statements of Cash Flows for the years ended December 31, 2009, 2008 and
2007; and
|
|
·
|
Notes
to the Consolidated Financial
Statements
|
|
2.
|
Financial
Statement Schedules
|
Separate
financial statement schedules have been omitted either because they are not
applicable or because the required information is included in the consolidated
financial statements or notes described in Item 15(a)(1)
above.
|
3.
|
Exhibits
|
Refer to
the Exhibit Index for a list of the exhibits being filed or furnished with
or incorporated by reference into this Annual Report on Form
10-K.
INDEX
TO CONSOLIDATED FINANCIAL STATEMENTS
|
Consolidated
Financial Statements
|
Page
|
||
|
Report
of Independent Registered Public Accounting Firm
|
F-2
|
||
|
Report
of Independent Registered Public Accounting Firm on Internal Control Over
Financial Reporting
|
F-3
|
||
|
Consolidated Statements of
Financial Condition
|
F-4
|
||
|
Consolidated Statements of
Operations
|
F-5
|
||
|
Consolidated Statements of
Changes in Shareholders’ and Members’ Equity (Deficit)
|
F-6
|
||
|
Consolidated Statements of Cash
Flows
|
F-7
|
||
|
Notes to the Consolidated
Financial Statements
|
F-8
|
||
|
Note 1 –
Organization
|
F-8
|
||
|
Note 2 – Significant
Accounting Policies
|
F-8
|
||
|
Note 3 – Securities
Owned and Securities Sold, But Not Yet Purchased
|
F-13
|
||
|
Note 4 – Investments in
Partnerships and Other Investments
|
F-13
|
||
|
Note 5 – Related Party
Transactions
|
F-14
|
||
|
Note 6 – Property and
Equipment
|
F-15
|
||
|
Note
7 – Acquisition
|
F-15
|
||
|
Note
8 – Goodwill and Other Intangible Assets
|
F-17
|
||
|
Note 9 – Accrued
Expenses and Other Liabilities
|
F-17
|
||
|
Note 10 –
Notes Payable
|
F-18
|
||
|
Note 11 – Financial Instruments
|
F-18
|
||
|
Note
12 – Net Income (Loss) Per Share
|
F-21
|
||
|
Note
13 – Share-Based Compensation
|
F-22
|
||
|
Note
14 – Income Taxes
|
F-24
|
||
|
Note 15 – Employee
Benefits
|
F-26
|
||
|
Note 16 – Commitments,
Guarantees and Contingencies
|
F-26
|
||
|
Note 17 – Financial
Instruments with Off-Balance Sheet Risk, Credit Risk or Market
Risk
|
F-31
|
||
|
Note 18 – Regulated
Broker-Dealer Subsidiaries
|
F-31
|
||
|
Note 19 – Segment
Information
|
F-32
|
||
|
Note 20 – Quarterly
Financial Information (Unaudited)
|
F-33
|
||
|
Note 21 – Subsequent
Event
|
F-33
|
||
Report
of Independent Registered Public Accounting Firm
To the
Board of Directors and Shareholders of
Thomas
Weisel Partners Group, Inc. and Subsidiaries
San Francisco,
California
We have
audited the accompanying consolidated statements of financial condition of
Thomas Weisel Partners Group, Inc. and subsidiaries (the “Company”) as of
December 31, 2009 and 2008, and the related consolidated statements of
operations, changes in shareholders’ equity, and cash flows for each of the
three years in the period ended December 31, 2009. These financial
statements are the responsibility of the Company’s management. Our
responsibility is to express an opinion on these financial statements based on
our audits.
We
conducted our audits in accordance with the standards of the Public Company
Accounting Oversight Board (United States). Those standards require that we plan
and perform the audit to obtain reasonable assurance about whether the financial
statements are free of material misstatement. An audit includes examining, on a
test basis, evidence supporting the amounts and disclosures in the financial
statements. An audit also includes assessing the accounting principles used and
significant estimates made by management, as well as evaluating the overall
financial statement presentation. We believe that our audits provide a
reasonable basis for our opinion.
In our
opinion, such consolidated financial statements present fairly, in all material
respects, the financial position of Thomas Weisel Partners Group, Inc. and
subsidiaries at December 31, 2009 and 2008, and the results of their
operations and their cash flows for each of the three years in the period ended
December 31, 2009, in conformity with accounting principles generally
accepted in the United States of America.
We have
also audited, in accordance with the standards of the Public Company Accounting
Oversight Board (United States), the Company’s internal control over financial
reporting as of December 31, 2009, based on the criteria established in
Internal Control —
Integrated Framework issued by the Committee of Sponsoring Organizations
of the Treadway Commission and our report dated March 12, 2010 expressed an
unqualified opinion on the Company’s internal control over financial
reporting.
/s/
Deloitte & Touche LLP
San Francisco,
California
March 12,
2010
Report
of Independent Registered Public Accounting Firm
To
the Board of Directors and Shareholders of
Thomas
Weisel Partners Group, Inc. and Subsidiaries
San Francisco,
California
We have
audited the internal control over financial reporting of Thomas Weisel Partners
Group, Inc. and subsidiaries (the “Company”) as of December 31, 2009,
based on criteria established in Internal Control — Integrated
Framework issued by the Committee of Sponsoring Organizations of the
Treadway Commission. The Company’s management is responsible for maintaining
effective internal control over financial reporting and for its assessment of
the effectiveness of internal control over financial reporting, included in the
accompanying Report of Management on Internal Control over Financial Reporting.
Our responsibility is to express an opinion on the Company’s internal control
over financial reporting based on our audit.
We
conducted our audit in accordance with the standards of the Public Company
Accounting Oversight Board (United States). Those standards require that we plan
and perform the audit to obtain reasonable assurance about whether effective
internal control over financial reporting was maintained in all material
respects. Our audit included obtaining an understanding of internal control over
financial reporting, assessing the risk that a material weakness exists, testing
and evaluating the design and operating effectiveness of internal control based
on the assessed risk, and performing such other procedures as we considered
necessary in the circumstances. We believe that our audit provides a reasonable
basis for our opinion.
A
company’s internal control over financial reporting is a process designed by, or
under the supervision of, the company’s principal executive and principal
financial officers, or persons performing similar functions, and effected by the
company’s board of directors, management, and other personnel to provide
reasonable assurance regarding the reliability of financial reporting and the
preparation of financial statements for external purposes in accordance with
generally accepted accounting principles. A company’s internal control over
financial reporting includes those policies and procedures that (1) pertain
to the maintenance of records that, in reasonable detail, accurately and fairly
reflect the transactions and dispositions of the assets of the company;
(2) provide reasonable assurance that transactions are recorded as
necessary to permit preparation of financial statements in accordance with
generally accepted accounting principles, and that receipts and expenditures of
the company are being made only in accordance with authorizations of management
and directors of the company; and (3) provide reasonable assurance
regarding prevention or timely detection of unauthorized acquisition, use, or
disposition of the company’s assets that could have a material effect on the
financial statements.
Because
of the inherent limitations of internal control over financial reporting,
including the possibility of collusion or improper management override of
controls, material misstatements due to error or fraud may not be prevented or
detected on a timely basis. Also, projections of any evaluation of the
effectiveness of the internal control over financial reporting to future periods
are subject to the risk that the controls may become inadequate because of
changes in conditions, or that the degree of compliance with the policies or
procedures may deteriorate.
In our
opinion, the Company maintained, in all material respects, effective internal
control over financial reporting as of December 31, 2009, based on the
criteria established in Internal Control — Integrated
Framework issued by the Committee of Sponsoring Organizations of the
Treadway Commission.
We have
also audited, in accordance with the standards of the Public Company Accounting
Oversight Board (United States), the consolidated financial statements as of and
for the year ended December 31, 2009 of the Company and our report dated
March 12, 2010 expressed an unqualified opinion on those financial
statements.
/s/
Deloitte & Touche LLP
San Francisco,
California
March 12,
2010
THOMAS
WEISEL PARTNERS GROUP, INC. AND SUBSIDIARIES
CONSOLIDATED
STATEMENTS OF FINANCIAL CONDITION
(In
thousands, except share and per share data)
|
December
31, 2009
|
December 31,
2008
|
|||||||
|
ASSETS
|
||||||||
|
Cash
and cash equivalents
|
$
|
97,055
|
$
|
116,588
|
||||
|
Restricted
cash
|
6,768
|
6,718
|
||||||
|
Securities
owned
|
16,063
|
18,497
|
||||||
|
Receivable
from clearing brokers
|
20,320
|
12,064
|
||||||
|
Corporate
finance and syndicate receivables—net of allowance for doubtful accounts
of $560 and $950, respectively
|
9,901
|
5,716
|
||||||
|
Investments
in partnerships and other investments
|
57,000
|
44,245
|
||||||
|
Receivables
from related parties—net of allowance for doubtful loans of $2,859 and
$2,324, respectively
|
1,543
|
2,263
|
||||||
|
Property
and equipment—net of accumulated depreciation and amortization of $78,730
and $102,047, respectively
|
14,853
|
20,581
|
||||||
|
Other
intangible assets—net of accumulated amortization of $25,188 and $15,254,
respectively
|
16,401
|
23,229
|
||||||
|
Other
assets
|
13,873
|
31,749
|
||||||
|
Total
assets
|
$
|
253,777
|
$
|
281,650
|
||||
|
LIABILITIES
AND SHAREHOLDERS’ EQUITY
|
||||||||
|
Liabilities:
|
||||||||
|
Securities
sold, but not yet purchased
|
$
|
15,579
|
$
|
11,537
|
||||
|
Payable
to clearing brokers
|
25
|
13
|
||||||
|
Accrued
compensation
|
35,467
|
21,824
|
||||||
|
Accrued
expenses and other liabilities
|
44,969
|
47,978
|
||||||
|
Capital
lease obligations
|
287
|
152
|
||||||
|
Notes
payable
|
22,526
|
22,101
|
||||||
|
Deferred
tax liability
|
5,087
|
6,144
|
||||||
|
Total
liabilities
|
123,940
|
109,749
|
||||||
|
Commitments
and contingencies (See Note 16 to the consolidated financial
statements)
|
—
|
—
|
||||||
|
Shareholders’
equity:
|
||||||||
|
Exchangeable
common stock—par value $0.01 per share, 6,236,948 and 6,639,478 shares
issued and outstanding, respectively
|
62
|
66
|
||||||
|
Common
stock—par value $0.01 per share, 100,000,000 shares authorized, 26,240,118
and 25,693,394 shares issued, respectively
|
262
|
257
|
||||||
|
Additional
paid-in capital
|
495,024
|
484,289
|
||||||
|
Accumulated
deficit
|
(352,118
|
)
|
(288,440
|
)
|
||||
|
Accumulated
other comprehensive loss
|
(9,305
|
)
|
(14,745
|
)
|
||||
|
Treasury
stock—at cost, 783,762 and 1,544,286 shares, respectively
|
(4,088
|
)
|
(9,526
|
)
|
||||
|
Total
shareholders’ equity
|
129,837
|
171,901
|
||||||
|
Total
liabilities and shareholders’ equity
|
$
|
253,777
|
$
|
281,650
|
||||
See
accompanying notes to the consolidated financial statements.
THOMAS
WEISEL PARTNERS GROUP, INC. AND SUBSIDIARIES
CONSOLIDATED
STATEMENTS OF OPERATIONS
(In
thousands, except per share data)
|
Year
Ended December 31,
|
||||||||||||
|
2009
|
2008
|
2007
|
||||||||||
|
Revenues:
|
||||||||||||
|
Investment
banking
|
$
|
71,165
|
$
|
63,305
|
$
|
127,228
|
||||||
|
Brokerage
|
103,170
|
131,939
|
120,187
|
|||||||||
|
Asset
management
|
21,464
|
(7,120
|
)
|
33,414
|
||||||||
|
Interest
income
|
913
|
7,341
|
17,718
|
|||||||||
|
Other
revenue
|
—
|
—
|
920
|
|||||||||
|
Total
revenues
|
196,712
|
195,465
|
299,467
|
|||||||||
|
Interest
expense
|
(1,656
|
)
|
(5,938
|
)
|
(10,418
|
)
|
||||||
|
Net
revenues
|
195,056
|
189,527
|
289,049
|
|||||||||
|
Expenses,
excluding interest:
|
||||||||||||
|
Compensation
and benefits
|
133,355
|
147,186
|
187,902
|
|||||||||
|
Brokerage
execution, clearance and account administration
|
25,211
|
27,102
|
20,363
|
|||||||||
|
Communications
and data processing
|
17,490
|
22,195
|
18,993
|
|||||||||
|
Depreciation
and amortization of property and equipment
|
7,859
|
7,784
|
6,450
|
|||||||||
|
Amortization
of other intangible assets
|
9,934
|
15,254
|
—
|
|||||||||
|
Goodwill
impairment
|
—
|
92,597
|
—
|
|||||||||
|
Marketing
and promotion
|
8,860
|
13,915
|
15,147
|
|||||||||
|
Occupancy
and equipment
|
19,869
|
26,509
|
18,988
|
|||||||||
|
Other
expense
|
36,327
|
32,537
|
23,979
|
|||||||||
|
Total
expenses, excluding interest
|
258,905
|
385,079
|
291,822
|
|||||||||
|
Loss
before taxes
|
(63,849
|
)
|
(195,552
|
)
|
(2,773
|
)
|
||||||
|
Provision
for taxes (tax benefit)
|
(171
|
)
|
7,700
|
(2,793
|
)
|
|||||||
|
Net
income (loss)
|
$
|
(63,678
|
)
|
$
|
(203,252
|
)
|
$
|
20
|
||||
|
Net
loss per share:
|
||||||||||||
|
Basic
net loss per share
|
$
|
(1.96
|
)
|
$
|
(6.29
|
)
|
$
|
—
|
||||
|
Diluted
net loss per share
|
$
|
(1.96
|
)
|
$
|
(6.29
|
)
|
$
|
—
|
||||
|
Weighted
average shares used in computation of per share data:
|
||||||||||||
|
Basic
weighted average shares outstanding
|
32,515
|
32,329
|
26,141
|
|||||||||
|
Diluted
weighted average shares outstanding
|
32,515
|
32,329
|
26,446
|
|||||||||
See
accompanying notes to the consolidated financial statements.
THOMAS
WEISEL PARTNERS GROUP, INC. AND SUBSIDIARIES
CONSOLIDATED
STATEMENTS OF CHANGES IN SHAREHOLDERS’ EQUITY
(In
thousands)
|
Exchangeable
Common Stock
|
Common
Stock
|
Additional
Paid-in
|
Accumulated
|
Accumulated
Other Comprehensive
|
Treasury
|
Total
Shareholders’
|
Total
Comprehensive Income
|
|||||||||||||||||||||||||||||||||
|
Shares
|
Amount
|
Shares
|
Amount
|
Capital
|
Deficit
|
Income
(Loss)
|
Shares
|
Equity
|
(Loss)
|
|||||||||||||||||||||||||||||||
|
Balance—December
31, 2006
|
—
|
$
|
—
|
25,754
|
$
|
258
|
$
|
352,299
|
$
|
(85,208
|
)
|
$
|
(295
|
)
|
$
|
—
|
$
|
267,054
|
$
|
34,935
|
||||||||||||||||||||
|
Net
income
|
—
|
—
|
—
|
—
|
—
|
20
|
—
|
—
|
20
|
20
|
||||||||||||||||||||||||||||||
|
Currency
translation adjustment
|
—
|
—
|
—
|
—
|
—
|
—
|
138
|
—
|
138
|
138
|
||||||||||||||||||||||||||||||
|
Share-based
compensation expense
|
—
|
—
|
—
|
—
|
10,716
|
—
|
—
|
10,716
|
—
|
|||||||||||||||||||||||||||||||
|
Excess
tax benefits from share-based compensation
|
—
|
—
|
—
|
—
|
12
|
—
|
—
|
—
|
12
|
—
|
||||||||||||||||||||||||||||||
|
Vested
and delivered restricted stock units
|
—
|
—
|
48
|
—
|
—
|
—
|
—
|
—
|
—
|
—
|
||||||||||||||||||||||||||||||
|
Repurchase
or reacquisition of common stock
|
—
|
—
|
(567
|
)
|
(6
|
)
|
(4,307
|
)
|
—
|
—
|
—
|
(4,313
|
)
|
—
|
||||||||||||||||||||||||||
|
Balance—December
31, 2007
|
—
|
—
|
25,235
|
252
|
358,720
|
(85,188
|
)
|
(157
|
)
|
—
|
273,627
|
158
|
||||||||||||||||||||||||||||
|
Net
loss
|
—
|
—
|
—
|
—
|
—
|
(203,252
|
)
|
—
|
—
|
(203,252
|
)
|
(203,252
|
)
|
|||||||||||||||||||||||||||
|
Acquisition
of Westwind
|
||||||||||||||||||||||||||||||||||||||||
|
Issuance
of exchangeable shares of common stock
|
6,639
|
66
|
—
|
—
|
101,709
|
—
|
—
|
—
|
101,775
|
—
|
||||||||||||||||||||||||||||||
|
Issuance
of common stock
|
—
|
—
|
370
|
4
|
5,671
|
—
|
—
|
—
|
5,675
|
—
|
||||||||||||||||||||||||||||||
|
Currency
translation adjustment
|
—
|
—
|
—
|
—
|
—
|
—
|
(14,588
|
)
|
—
|
(14,588
|
)
|
(14,588
|
)
|
|||||||||||||||||||||||||||
|
Share-based
compensation expense
|
—
|
—
|
—
|
—
|
18,551
|
—
|
—
|
—
|
18,551
|
—
|
||||||||||||||||||||||||||||||
|
Excess
tax deficiencies from share-based compensation
|
—
|
—
|
—
|
—
|
(12
|
)
|
—
|
—
|
—
|
(12
|
)
|
—
|
||||||||||||||||||||||||||||
|
Vested
and delivered restricted stock units
|
—
|
—
|
243
|
3
|
(3
|
)
|
—
|
—
|
—
|
—
|
—
|
|||||||||||||||||||||||||||||
|
Repurchase
or reacquisition of common stock
|
—
|
—
|
(155
|
)
|
(2
|
)
|
(347
|
)
|
—
|
—
|
(9,526
|
)
|
(9,875
|
)
|
—
|
|||||||||||||||||||||||||
|
Balance—December
31, 2008
|
6,639
|
66
|
25,693
|
257
|
484,289
|
(288,440
|
)
|
(14,745
|
)
|
|
(9,526
|
)
|
171,901
|
(217,840
|
)
|
|||||||||||||||||||||||||
|
Net
loss
|
—
|
—
|
—
|
—
|
—
|
(63,678
|
)
|
—
|
—
|
(63,678
|
)
|
(63,678
|
)
|
|||||||||||||||||||||||||||
|
Currency
translation adjustment
|
—
|
—
|
—
|
—
|
—
|
—
|
5,440
|
—
|
5,440
|
5,440
|
||||||||||||||||||||||||||||||
|
Share-based
compensation expense
|
—
|
—
|
—
|
—
|
17,054
|
—
|
—
|
—
|
17,054
|
—
|
||||||||||||||||||||||||||||||
|
Vested
and delivered restricted stock units
|
—
|
—
|
180
|
1
|
(6,138
|
)
|
—
|
—
|
6,138
|
1
|
—
|
|||||||||||||||||||||||||||||
|
Converted
exchangeable common stock
|
(367
|
)
|
(4
|
)
|
367
|
4
|
—
|
—
|
—
|
—
|
—
|
—
|
||||||||||||||||||||||||||||
|
Repurchase
or reacquisition of common stock
|
—
|
—
|
—
|
—
|
—
|
—
|
—
|
(700
|
)
|
(700
|
)
|
—
|
||||||||||||||||||||||||||||
|
Reacquisition
of exchangeable common stock
|
(35
|
)
|
—
|
—
|
—
|
(181
|
)
|
—
|
—
|
—
|
(181
|
)
|
—
|
|||||||||||||||||||||||||||
|
Balance—December
31, 2009
|
6,237
|
$
|
62
|
26,240
|
$
|
262
|
$
|
495,024
|
$
|
(352,118
|
)
|
$
|
(9,305
|
)
|
$
|
(4,088
|
)
|
$
|
129,837
|
$
|
(58,238
|
)
|
||||||||||||||||||
See
accompanying notes to the consolidated financial
statements.
THOMAS
WEISEL PARTNERS GROUP, INC. AND SUBSIDIARIES
CONSOLIDATED
STATEMENTS OF CASH FLOWS
(In
thousands)
|
Year
Ended December 31,
|
||||||||||||
|
2009
|
2008
|
2007
|
||||||||||
|
CASH
FLOW FROM OPERATING ACTIVITIES:
|
||||||||||||
|
Net
income (loss)
|
$
|
(63,678
|
)
|
$
|
(203,252
|
)
|
$
|
20
|
||||
|
Adjustments
to reconcile net income (loss) to net cash provided by (used in) operating
activities:
|
||||||||||||
|
Depreciation
and amortization of property and equipment
|
7,859
|
7,784
|
6,450
|
|||||||||
|
Amortization
of other intangible assets
|
9,934
|
15,254
|
—
|
|||||||||
|
Goodwill
impairment
|
—
|
92,597
|
—
|
|||||||||
|
Share-based
compensation expense
|
19,406
|
18,969
|
10,900
|
|||||||||
|
Excess
tax benefits from share-based compensation
|
—
|
—
|
(12
|
)
|
||||||||
|
Deferred
tax expense (benefit)
|
(2,797
|
)
|
14,956
|
(5,231
|
)
|
|||||||
|
Provision
for doubtful corporate finance and syndicate receivable
accounts
|
512
|
1,295
|
718
|
|||||||||
|
Provision
(credit) for facility lease loss
|
2,292
|
6,044
|
(208
|
)
|
||||||||
|
Deferred
rent expense
|
(30
|
)
|
(455
|
)
|
(706
|
)
|
||||||
|
Warrants
received from investment banking transactions
|
(1,597
|
)
|
(712
|
)
|
—
|
|||||||
|
Unrealized
and realized loss (gain) on investments in partnerships and other
investments—net
|
(4,807
|
)
|
19,987
|
(17,706
|
)
|
|||||||
|
Interest
amortization on notes payable
|
425
|
851
|
818
|
|||||||||
|
Other
|
78
|
(87
|
)
|
159
|
||||||||
|
Net
effect of changes in operating assets and liabilities—net of effects from
acquisition:
|
||||||||||||
|
Cash
segregated under Federal or other regulations
|
—
|
—
|
(250
|
)
|
||||||||
|
Securities
owned and securities sold, but not yet purchased—net
|
8,133
|
50,892
|
(10,164
|
)
|
||||||||
|
Corporate
finance and syndicate receivables—net
|
(4,305
|
)
|
15,190
|
749
|
||||||||
|
Distributions
from investment partnerships
|
1,122
|
7,865
|
11,537
|
|||||||||
|
Other
assets
|
7,177
|
(5,454
|
)
|
(16,396
|
)
|
|||||||
|
Receivable
from/payable to clearing brokers—net
|
(6,715
|
)
|
(11,213
|
)
|
(1,381
|
)
|
||||||
|
Accrued
expenses and other liabilities
|
2,699
|
(27,404
|
)
|
6,346
|
||||||||
|
Accrued
compensation
|
13,233
|
(47,544
|
)
|
18,941
|
||||||||
|
Net
cash provided by (used in) operating activities
|
(11,059
|
)
|
(44,437
|
)
|
4,584
|
|||||||
|
CASH
FLOW FROM INVESTING ACTIVITIES:
|
||||||||||||
|
Increase
in restricted cash
|
(50
|
)
|
—
|
—
|
||||||||
|
Purchase
of property and equipment
|
(1,453
|
)
|
(5,229
|
)
|
(3,225
|
)
|
||||||
|
Acquisition—net
of cash received
|
—
|
(8,109
|
)
|
—
|
||||||||
|
Purchase
of investments in partnerships and other investments
|
(14,516
|
)
|
(7,241
|
)
|
(159,155
|
)
|
||||||
|
Proceeds
from sale of investments in partnerships and other
investments
|
6,965
|
46,978
|
177,844
|
|||||||||
|
Net
cash provided by (used in) investing activities
|
(9,054
|
)
|
26,399
|
15,464
|
||||||||
|
CASH
FLOW FROM FINANCING ACTIVITIES:
|
||||||||||||
|
Repayment
of capital lease obligations
|
(121
|
)
|
(130
|
)
|
(131
|
)
|
||||||
|
Addition
of notes payable
|
—
|
—
|
25,000
|
|||||||||
|
Repayment
of notes payable
|
—
|
(6,117
|
)
|
(30,766
|
)
|
|||||||
|
Excess
tax benefits from share-based compensation
|
—
|
—
|
12
|
|||||||||
|
Cash
paid for net settlement of equity awards
|
(2,351
|
)
|
(972
|
)
|
—
|
|||||||
|
Repurchase
or reacquisition of common stock
|
(700
|
)
|
(9,528
|
)
|
(1,245
|
)
|
||||||
|
Reacquisition
of exchangeable common stock
|
(181
|
)
|
—
|
—
|
||||||||
|
Net
cash used in financing activities
|
(3,353
|
)
|
(16,747
|
)
|
(7,130
|
)
|
||||||
|
Effect
of exchange rate changes on cash and cash equivalents
|
3,933
|
(5,630
|
)
|
—
|
||||||||
|
NET
INCREASE (DECREASE) IN CASH AND CASH EQUIVALENTS
|
(19,533
|
)
|
(40,415
|
)
|
12,918
|
|||||||
|
CASH
AND CASH EQUIVALENTS—Beginning of year
|
116,588
|
157,003
|
144,085
|
|||||||||
|
CASH
AND CASH EQUIVALENTS—End of year
|
$
|
97,055
|
$
|
116,588
|
$
|
157,003
|
||||||
|
SUPPLEMENTAL
CASH FLOW DISCLOSURE
|
||||||||||||
|
Cash
paid for interest
|
$
|
714
|
$
|
4,760
|
$
|
9,412
|
||||||
|
Cash
paid for taxes
|
$
|
832
|
$
|
6,958
|
$
|
15,140
|
||||||
|
Non-cash
investing activities:
|
||||||||||||
|
Issuance
of common shares and exchangeable common shares for acquisition of
Westwind
|
—
|
107,450
|
—
|
|||||||||
|
Addition
of capital lease obligations
|
256
|
247
|
—
|
|||||||||
|
Non-cash
financing activities:
|
||||||||||||
|
Issuance
of common shares in connection with vested restricted stock
units
|
4,597
|
3,115
|
733
|
|||||||||
See
accompanying notes to the consolidated financial
statements.
THOMAS
WEISEL PARTNERS GROUP, INC. AND SUBSIDIARIES
NOTES
TO THE CONSOLIDATED FINANCIAL STATEMENTS
NOTE
1 – ORGANIZATION
Organization
Thomas
Weisel Partners Group, Inc., a Delaware corporation, together with its
subsidiaries (collectively, the “Company”), is an investment banking firm
headquartered in San Francisco, California. The Company operates on an
integrated basis and is managed as a single operating segment providing
financial services that include investment banking, brokerage, equity research
and asset management.
The
Company conducts its investment banking, brokerage and equity research business
through the following subsidiaries:
|
|
·
|
Thomas
Weisel Partners LLC (“TWP”) – TWP is a registered broker-dealer under the
Securities Exchange Act of 1934, as amended (the “Exchange Act”) and a
member of the New York Stock Exchange, Inc. (“NYSE”), the American Stock
Exchange, the Financial Industry Regulatory Authority (“FINRA”) and the
Ontario Securities Commission. TWP is also a registered introducing broker
under the Commodity Exchange Act and a member of the National Futures
Association. TWP conducts certain of its activities through affiliates and
branch offices in Canada and the United Kingdom (“U.K.”) and through a
representative office in
Switzerland.
|
|
|
·
|
Thomas
Weisel Partners Canada Inc. (“TWPC”) – TWPC is an investment dealer
registered in the Canadian provinces of Ontario, Quebec, Alberta, British
Columbia, Saskatchewan, Manitoba and Nova Scotia and is a member of the
Investment Industry Regulatory Organization of Canada
(“IIROC”).
|
|
|
·
|
Thomas
Weisel Partners International Limited (“TWPIL”) – TWPIL is a U.K.
securities firm authorized by the Financial Services Authority in the U.K.
and conducts certain of its activities through a representative office in
Switzerland.
|
TWP, TWPC
and TWPIL introduce on a fully disclosed basis proprietary and customer
securities transactions to other broker dealers (the “clearing brokers”) for
clearance and settlement.
The
Company primarily conducts its asset management business through Thomas Weisel
Capital Management LLC (“TWCM”), a registered investment adviser under the
Investment Advisers Act of 1940, as amended. TWCM is a general partner of a
series of investment funds in venture capital and fund of funds through the
following subsidiaries (the “Asset Management Subsidiaries”):
|
|
·
|
Thomas
Weisel Global Growth Partners LLC (“TWGGP”) is a registered investment
adviser under the Investment Advisers Act and provides fund management and
private investor access to venture and growth managers. TWGGP also manages
investment funds that are active buyers of secondary interests in private
equity funds, as well as portfolios of direct interests in venture-backed
companies;
|
|
|
·
|
Thomas
Weisel Healthcare Venture Partners LLC (“TWHVP”) is the managing general
partner of a venture capital fund that invests in the emerging life
sciences and medical technology sectors, including medical devices,
specialty pharmaceuticals, emerging biopharmaceuticals, drug delivery
technologies and biotechnology; and
|
|
|
·
|
Thomas
Weisel Venture Partners LLC (“TWVP”) is the managing general partner of a
venture capital fund that invests in emerging information technology
companies.
|
NOTE
2 –SIGNIFICANT ACCOUNTING POLICIES
Basis of Presentation – These consolidated
financial statements are prepared in conformity with accounting principles
generally accepted in the United States of America (“GAAP”). The consolidated
financial statements include the accounts of Thomas Weisel Partners Group, Inc.,
and its wholly-owned subsidiaries. Accordingly, all intercompany balances and
transactions have been eliminated. Certain prior year amounts have been
reclassified in order to conform to the current year’s
presentation.
Use of Estimates – The preparation of the
Company’s consolidated financial statements in conformity with GAAP requires
management to make estimates and assumptions that affect the reported amounts of
assets and liabilities at the date of the consolidated financial statements and
the reported amounts of revenues and expenses during the reporting period.
Actual amounts could differ from those estimates and such differences could be
material to the consolidated financial statements.
Investment Banking
Revenue–
Investment banking revenue includes underwriting and private placement
agency fees earned through the Company’s participation in public offerings and
private placements of equity and debt securities, including convertible debt,
and fees earned as a financial advisor in mergers and acquisitions and similar
transactions. Also included in investment banking revenue is the value of
warrants received as partial payment for investment banking services.
Underwriting revenues are earned in securities offerings in which the Company
acts as an underwriter and include management fees, selling concessions and
underwriting fees. Management fees are recorded on the offering date, selling
concession on the trade date and underwriting fees at the time the underwriting
is completed and the related income is reasonably determinable. Syndicate
expenses related to securities offerings in which the Company acts as
underwriter or agent are deferred until the related revenue is recognized.
Merger and acquisition fees and other strategic advisory revenues are generally
earned and recognized upon successful completion of the engagement, except for
fees earned upon the delivery of a fairness opinion and fees earned ratably over
the term of a retainer. Underwriting revenues are presented net of related
expenses. Unreimbursed expenses associated with private placement and strategic
advisory transactions are recorded as expenses excluding interest.
In 2007,
investment banking revenue included strategic advisory revenues of $13.4 million
generated from multiple advisory services performed for a single client. There
was no customer concentration in strategic advisory revenues for 2009 and
2008.
Brokerage Revenue – The majority of the
Company’s brokerage revenue is derived from commissions paid by customers from
brokerage transactions in equity securities and spreads paid by customers on
convertible debt securities. Commission revenues and related expenses resulting
from securities transactions executed are recorded on a trade date basis.
Brokerage revenue also includes net unrealized and realized trading gains and
losses which result from market making activities from the Company’s commitment
of capital to facilitate customer transactions and from proprietary trading
activities relating to the Company’s convertible debt and special situations
trading groups. In addition, brokerage revenue includes fees paid to the Company
for investment advisory services provided through its private client services
group to both institutional and high-net-worth individual investors based on the
value of assets under management and fees paid to the Company for research.
These fees are recognized in income as earned.
Asset Management Revenue– Asset management revenue
includes (i) management fees from investment partnerships and the
management of equity distributions received by our clients, (ii) realized and
unrealized gains and losses from the valuation of the Company’s investments in
partnerships and other investments, and (iii) realized and unrealized gains and
losses on warrants received as partial payment for investment banking
services.
Management fees are earned from
managing investment partnerships and are recorded as services are provided
pursuant to contractual agreements. Management fees earned from investment
partnerships are
generally paid monthly or
quarterly based upon either committed capital or assets under management
depending upon the nature of the investment product. In certain investment
partnerships the Company had elected to waive receipt of management fees in lieu
of making direct cash capital contributions. These waived management fees are
treated as deemed contributions by the Company to the partnerships, satisfy the
capital commitments to which the Company would otherwise be subject as general
partner and are recognized in revenue when the investment partnership generates
gains and allocates the gains to the general partner in respect of previously
waived management fees. Because waived management fees are contingent upon the
recognition of realized gains by the investment partnership, revenue is not
recognized until the contingency is satisfied. The Company will no longer waive
management fees subsequent to March 31, 2007.
The
investment partnerships in which the Company is a general partner may allocate
carried interest and make carried interest distributions, which represent an
additional allocation of net realized and unrealized gains, to the general
partner if the partnerships’ investment performance reaches a threshold as
defined in the respective partnership agreements. These allocations are
recognized in revenue as realized and unrealized gains and losses in investments
in partnerships. The Company’s recognition of allocations of carried interest
gains and losses from the investment partnerships in revenue is not adjusted to
reflect expectations about future performance of the partnerships.
As the investment partnerships realize
gains from the sale of their investments, they may make cash distributions to
the Company as provided for in the partnership agreements. Distributions that
result from carried interest may subsequently become subject to claw back if the
fair value of private equity partnership assets subsequently decrease in fair
value. To the extent these decreases in fair value and allocated losses exceed
the Company’s capital account balance, a liability is recorded in accrued
expense and other liabilities in the consolidated statements of financial
condition (see Note 9 – Accrued Expenses and Other Liabilities). These
liabilities for claw back obligations are not required to be paid to the
investment partnerships until the dissolution of such partnerships, and are only
required to be paid if the cumulative amounts actually distributed to the
Company exceed the amount due to the Company based on the cumulative operating
results of the partnerships. Accordingly, such liabilities may be reversed if
returns in the investment partnerships increase in the future. At December 31,
2009 and 2008, the Company had a liability for such claw back obligation of
approximately $2 million and zero, respectively.
Cash and Cash Equivalents
– The Company considers
highly liquid investments with maturities of three months or less at the date of
purchase to be cash equivalents. Cash and cash equivalents include cash we had
on deposit with the clearing brokers of $60.8 million and
$69.3 million as of December 31, 2009 and 2008,
respectively.
Restricted Cash – Restricted
cash consists of cash and restricted deposits as collateral for letters of
credit related to lease commitments. Restricted cash is as follows (in
thousands):
|
December
31,
|
||||||||
|
2009
|
2008
|
|||||||
|
Restricted
cash
|
$
|
4,241
|
$
|
4,241
|
||||
|
Restricted
deposits
|
2,527
|
2,477
|
||||||
|
Total
restricted cash
|
$
|
6,768
|
$
|
6,718
|
||||
Securities Owned
and Securities Sold, but not yet Purchased – Securities owned and securities sold,
but not yet purchased are recorded on a trade date basis and are carried at fair
value. Realized and unrealized gains and losses have been reflected in brokerage
revenue or asset management revenue. Equity securities and equity index funds
are carried at market value which is determined using quoted market prices.
Convertible debt securities and other fixed income securities are carried at fair value determined using
recent transactions, dealer quotes and comparable fixed income
values.
Investments in Partnerships and
Other Investments – Investments in partnerships and other investments
consist of the Company’s general and limited partnership interests in investment
partnerships, direct investments in non-public equity securities, investments in
auction rate securities (“ARS”) and warrants that are received as partial
payment for investment banking services. These investments are accounted for
using the fair value method, which requires unrealized gains and losses to be
recorded in the consolidated statements of operations, based on the percentage
interest in the underlying partnerships or based on the fair value of the other
investment.
The net
assets of the investment partnerships consist primarily of investments in
non-marketable securities. The underlying investments held by such partnerships
are valued based on estimated fair value ultimately determined by the Company or
its affiliates in the Company’s capacity as general partner and, in the case of
an investment in an unaffiliated investment partnership, are based on financial
statements prepared by an unaffiliated general partner. Increases and decreases
in estimated fair value are recorded based on underlying information of these
non-public company investments including third-party transactions evidencing a
change in value, market comparables, operating cash flows and financial
performance of the companies, trends within sectors and/or regions, underlying
business models, expected exit timing and strategy, and specific rights or terms
associated with the investment, such as conversion features and liquidation
preferences.
Property and Equipment – Property and equipment,
including office furniture and equipment, hardware and software and leasehold
improvements, are stated at cost, net of accumulated depreciation and
amortization. Depreciation of furniture, equipment and computer hardware and
software is computed using the straight-line method over the estimated useful
lives of the assets, ranging from three to seven years. Leasehold improvements
are amortized over the shorter of the term of the lease or the useful life of
the asset, as appropriate.
The
Company capitalizes certain costs of computer software developed or obtained for
internal use and amortizes the amounts over the estimated useful life of the
software, generally not exceeding four years. Property and equipment is reviewed
for impairment whenever events or changes in circumstances indicate that the
carrying amount of assets may not be recoverable.
Leases – Leases are classified as
either capital or operating leases. For capital leases, the present value of the
related lease payments is recorded as a liability. Amortization of capitalized
leased assets is computed on the straight-line method over the useful life of
the asset.
Liability for Lease Losses
– Included in accrued
expenses and other liabilities in the consolidated statements of financial
condition is a liability for lease losses related to office space that the
Company subleased due to staff reductions in 2009 and in prior years. The
Company estimates its liability for lease losses as the net present value of the
differences between lease payments and receipts under sublease agreements. At
December 31, 2009 the Company has subleases on all floors or facilities that
were vacated and are co-terminus with the lease commitments.
Receivable from and Payable to
Clearing Brokers –
TWP and TWPC clear customer transactions through other broker-dealers on
a fully disclosed basis. The amounts receivable from and payable to the clearing
brokers relates to such transactions. TWP and TWPC have indemnified the clearing
brokers for any losses as a result of customer nonperformance.
Fair Value of Financial
Instruments –
Securities owned, securities sold, but not yet purchased and investments
in partnerships and other investments are recorded at fair value. The Company’s
other financial instruments, primarily including corporate finance and syndicate
receivables, receivable from and payable to clearing brokers, and certain other
assets, are recorded at their cost or contract amount which is considered by
management to approximate their fair value as they are short-term in nature or
are subject to frequent repricing.
Corporate Finance and Syndicate
Receivables –
Corporate finance and syndicate receivables include receivables relating
to the Company’s capital raising or advisory engagements. The Company records an
allowance for doubtful accounts on these receivables on a specific
identification basis.
A summary
of the allowance for doubtful corporate finance and syndicate receivable
accounts is presented below (in thousands):
|
For
the Year Ended December 31,
|
||||||||||||
|
2009
|
2008
|
2007
|
||||||||||
|
Balance—Beginning of
Year
|
$
|
950
|
$
|
725
|
$
|
7
|
||||||
|
Provision
for doubtful accounts
|
512
|
1,295
|
718
|
|||||||||
|
Write-offs
|
(937
|
)
|
(1,070
|
)
|
—
|
|||||||
|
Foreign
currency translation
|
35
|
—
|
—
|
|||||||||
|
Balance—End of
Year
|
$
|
560
|
$
|
950
|
$
|
725
|
||||||
Compensation and Benefits
– Compensation and
benefits expense includes salaries, overtime, bonuses, commissions, share-based
compensation, benefits, employment taxes and other employee costs. Share-based
compensation is accrued over the service period of the related restricted stock
units. Accruals of compensation cost for awards with a performance condition are
based on the probable outcome of that performance condition. Bonuses are accrued
over the service period to which they relate. In the case of guaranteed amounts,
the service period is defined by the contract, whereas the service period for
discretionary awards is defined by the payment dates and the conditions, if any,
that must be fulfilled in order to receive the award.
Provision for Taxes
(Benefit)– The
Company accounts for taxes by recognizing tax benefits or expenses on the
temporary differences between the financial reporting and tax bases of its
assets and liabilities. Valuation allowances are established when necessary to
reduce deferred tax assets when it is more likely than not that a portion or all
of the deferred tax assets will not be realized.
The
Company follows guidance which prescribes a recognition threshold and
measurement attributes for the financial statement recognition and measurement
of a tax position taken, or expected to be taken in a tax return, and also
provides guidance on the derecognition, classification, interest and penalties,
accounting in interim periods, and disclosure.
The
Company records income tax expense on the earnings of its foreign subsidiaries,
but it does not provide any distribution taxes on the undistributed earnings of
these subsidiaries as the Company intends to reinvest any earnings
indefinitely.
Comprehensive Income (Loss)
– Comprehensive income
(loss) consists of two components, net income (loss) and other comprehensive
income (loss). Other comprehensive income (loss) refers to revenue, expenses,
gains and losses that are recorded as an element of shareholders’ equity but are
excluded from net income (loss). The Company’s other comprehensive income (loss)
is comprised of foreign currency translation adjustments.
Foreign Currency Translation
– Assets and
liabilities denominated in non-U.S. currencies are translated at the rate
of exchange prevailing on the date of the consolidated statement of financial
condition, and revenues and expenses are translated at average rates of exchange
for the period. Gains (losses) on translation of the consolidated financial
statements are from the Company’s subsidiaries where the functional currency is
not the U.S. dollar. Translation gains (losses) are reflected as a
component of accumulated other comprehensive income (loss). Gains and losses on
foreign currency transactions are included in the consolidated statements of
operations.
Business Combinations – In
accordance with business combination accounting, the Company
allocates the purchase price of acquired businesses to the tangible and
intangible assets acquired and liabilities assumed based on estimated fair
values. Such allocations require management to make significant estimates and
assumptions, especially with respect to intangible assets acquired.
Management’s
estimates of fair value are based upon assumptions believed to be reasonable.
These estimates are based on information obtained from management of the
acquired companies and are inherently uncertain. Critical estimates in valuing
certain of the intangible assets include, but are not limited to, (i) future
expected cash flows from acquired businesses, (ii) future expected cash flows
from employees subject to non-compete agreements and (iii) the acquired
company’s market position.
Goodwill
and Long-Lived Assets – The Company is required to
evaluate goodwill annually to determine whether it is impaired. Goodwill is also
required to be tested between annual impairment tests if an event occurs or
circumstances change that would reduce the fair value of a reporting unit below
its carrying amount. The Company selected the fourth quarter to perform its
annual goodwill impairment testing. The guidance requires a two-step
impairment test be performed on goodwill. In the first step, the Company
compares the fair value of the reporting unit to its carrying value. If the fair
value of the reporting unit exceeds the carrying value of the net assets
assigned to that unit, goodwill is considered not impaired and the Company is
not required to perform further testing. If the carrying value of the net assets
assigned to the reporting unit exceeds the fair value of the reporting unit,
then the Company must perform the second step of the impairment test in order to
determine the implied fair value of the reporting unit’s goodwill. If the
carrying value of a reporting unit’s goodwill exceeds its implied fair value,
then the Company would record an impairment loss equal to the difference. As a
result of its 2008 goodwill impairment test, the Company recorded a full
impairment charge to the goodwill asset during the year ended December 31,
2008.
Long-lived
assets, such as property and equipment and purchased intangible assets subject
to amortization are reviewed for impairment whenever events or changes in
circumstances indicate that the carrying amount of an asset may not be
recoverable. The recoverability of an asset is measured by a comparison of the
carrying amount of an asset to its estimated undiscounted future cash flows
expected to be generated. If the carrying amount of an asset exceeds its
estimated future cash flows, an impairment charge is recognized by the amount by
which the carrying amount of the asset exceeds the fair value of the
asset.
While the
Company believes its estimates and judgments about future cash flows are
reasonable, future impairment charges may be required if the expected cash flow
estimates, as projected, do not occur or if events change requiring the Company
to revise its estimates. See Note 8 – Goodwill and Other Intangible
Assets.
New
Accounting Pronouncements
Accounting for Assets Acquired and
Liabilities Assumed in a Business Combination That Arise from Contingencies –
In April
2009, the Financial Accounting Standards Board (“FASB”) issued amending and
clarifying guidance over business combinations to address application issues
raised by preparers, auditors and members of the legal profession on initial
recognition and measurement, subsequent measurement and accounting and
disclosure of assets and liabilities arising from contingencies in a business
combination. This guidance is effective for acquisitions on or after the
beginning of the first annual reporting period beginning on or after December
15, 2008. The Company adopted the guidance upon issuance, and the adoption did
not have a material impact on its consolidated statements of financial
condition, operations and cash flows.
Determining Whether a Market Is Not
Active and a Transaction Is Not Distressed – In April 2009, the FASB
issued guidance providing additional guidance on determining whether a market
for a financial asset is not active and a transaction is not distressed for fair
value measurements. The guidance was effective for interim and annual periods
ending after March 15, 2009 and is applied prospectively. The Company adopted
the guidance on March 31, 2009, and the adoption did not have a material impact
on its consolidated statements of financial condition, operations and cash
flows.
Determining Fair Value When the
Volume and Level of Activity for the Asset or Liability Have Significantly
Decreased and Identifying Transactions That Are Not Orderly – In April
2009, the FASB issued additional guidance for estimating fair value when the
volume and level of activity for the asset or liability have significantly
decreased. This guidance also assists in identifying circumstances that indicate
a transaction is not orderly. This guidance was effective for interim and annual
reporting periods ending after June 15, 2009 and is applied prospectively. The
Company adopted the guidance on June 30, 2009, and the adoption did not have a
material impact on its consolidated statements of financial condition,
operations and cash flows.
Accounting for Transfers of
Financial Assets – In June 2009, the FASB issued guidance to improve the
relevance, representational faithfulness and comparability of the information
that a reporting entity provides in its financial reports about a transfer of
financial assets, the effects of a transfer on its financial position, financial
performance and cash flows, and a transferor’s continuing involvement in
transferred financial assets. This guidance is effective for interim and annual
periods ending after November 15, 2009 and is applied prospectively. The Company
adopted the guidance on December 31, 2009, and the adoption did not have an
impact on its consolidated statements of financial condition, operations and
cash flows.
Consolidation of Variable Interest
Entities – In June 2009, the FASB issued new guidance on consolidation of
variable interest entities (“VIE”) which is effective January 1, 2010. This
new guidance amends the consolidation guidance applicable to VIEs, including
changing the approach to determining a VIE’s primary beneficiary (the reporting
entity that must consolidate the VIE) and the frequency of reassessment. In
January 2010, the FASB voted to defer the effective date of this new guidance
for a reporting enterprise’s interest in certain investment companies and for
certain money market funds. The adoption of this new guidance, except the
deferred portion which the Company is currently evaluating, is not expected to
have a material impact on its consolidated statements of financial condition,
operations and cash flows.
Measuring Liabilities at Fair
Value – In August 2009, the FASB issued guidance with the objective to
provide clarification in circumstances in which a quoted market price in an
active market for the identical liability is not available. The guidance is
applicable when trying to measure the fair value of a liability under fair value
accounting rules. The guidance is effective for the first reporting period,
including interim reporting periods, beginning after the standard was issued.
The Company adopted the guidance upon issuance, and the adoption did not have a
material impact on its consolidated statements of financial condition,
operations and cash flows.
NOTE
3 – SECURITIES OWNED AND SECURITIES SOLD, BUT NOT YET
PURCHASED
Securities
owned and securities sold, but not yet purchased were as follows (in thousands):
|
December
31,
|
||||||||||||||||
|
2009
|
2008
|
|||||||||||||||
|
Securities
Owned
|
Securities
Sold, But Not Yet Purchased
|
Securities
Owned
|
Securities
Sold, But Not Yet Purchased
|
|||||||||||||
|
Equity
securities
|
$
|
16,063
|
$
|
19
|
$
|
12,095
|
$
|
1,465
|
||||||||
|
Equity
index fund
|
—
|
15,560
|
—
|
10,072
|
||||||||||||
|
Convertible
bonds
|
—
|
—
|
6,402
|
—
|
||||||||||||
|
Total
securities owned and securities sold, but not yet
purchased
|
$
|
16,063
|
$
|
15,579
|
$
|
18,497
|
$
|
11,537
|
||||||||
At
December 31, 2009 and December 31, 2008, securities sold, but not yet
purchased were collateralized by cash and cash equivalents and securities owned,
which are held at the clearing brokers. Cash and cash equivalents that are
collaterizing securities sold, but not yet purchased are included in the
receivable from clearing brokers in the consolidated statements of financial
condition.
At
December 31, 2009 and December 31, 2008, the Company did not hold
securities in the table above that cannot be publicly offered or sold unless
registration has been affected under the Securities Act of 1933, as amended (the
“Securities Act”).
NOTE
4 – INVESTMENTS IN PARTNERSHIPS AND OTHER INVESTMENTS
Investments
in partnerships and other investments consisted of the following (in thousands):
|
December
31,
|
||||||||
|
2009
|
2008
|
|||||||
|
Investments
in partnerships
|
$
|
30,661
|
$
|
32,654
|
||||
|
Other
investments
|
||||||||
|
Auction
rate securities
|
18,087
|
8,913
|
||||||
|
Warrants
|
5,860
|
430
|
||||||
|
Other
|
2,392
|
2,248
|
||||||
|
Total
investments in partnerships and other investments
|
$
|
57,000
|
$
|
44,245
|
||||
Investments
in Partnerships
Investments
in partnerships consist of investments in private equity partnerships, including
the Company’s general partner interests in investment partnerships, at fair
value.
Some of
the Company’s investments in partnerships interests meet the definition of a
VIE. The Company does not consolidate these VIEs because it has determined that
the Company is not the primary beneficiary. For general partnership interests
that do not qualify as VIEs, the partnership agreements have established simple
majority kick-out rights for limited partner interests, and therefore the
Company does not consolidate the partnerships.
Other
Investments
As of
December 31, 2009 and 2008, the Company held ARS with a par value of $19.6
million and $9.7 million, respectively, and a fair value of $18.1 million and
$8.9 million, respectively. The 2009 balance includes the July 2009 repurchase
at par of $13.3 million of ARS that the Company had previously sold from
its account in January 2008 to three customers without those customers’
prior written consent.
The ARS
are variable rate debt instruments, having long-term maturity dates of
approximately 25 to 33 years, but whose interest rates are reset through an
auction process, most commonly at intervals of 7 and 35 days. The interest
earned on these investments is exempt from Federal income tax. All of the
Company’s ARS are backed by pools of student loans and were rated AAA, AA, A,
Aaa, A1, A3, or Baa3 at December 31, 2009. The Company continues to receive
interest when due on its ARS and expects to continue to receive interest when
due in the future. The weighted-average Federal tax exempt interest rate was
0.73% at December 31, 2009.
In 2008,
widespread auction failures resulted in a lack of liquidity for these previously
liquid securities. As a result, the principal balance of the Company’s ARS will
not be accessible until successful auctions occur, a buyer is found outside of
the auction process, the issuers and the underwriters establish a different form
of financing to replace these securities or final payments come due according to
the contractual maturities. The Company’s valuation of its ARS assesses the
credit and liquidity risks associated with the securities, compares the yields
on its ARS to similarly rated municipal issues and determines the fair values
based on a discounted cash flow analysis. The Company determined that its ARS
had a fair value decline of $0.8 million in each of the years ended December 31,
2009 and 2008. Key assumptions of the discounted cash flow analysis included the
following:
Coupon Rate – In determining
fair value, the Company projected future interest rates based on the average
near term historical interest rate for these issues, the Securities Industry and
Financial Markets Association Municipal Swap Index and benchmark yield curves.
The average interest rates assumed ranged from 2.5% to 4.1% on a taxable
equivalent yield basis.
Discount Rate – The Company’s
discount rate was based on a spread over LIBOR and consisted of a spread of 330
to 620 bps over this yield curve which the Company adjusted down to a spread of
135 to 200 bps over periods of time ranging from 12 to 19 quarters. This spread
is included in the discount rate to reflect the current and expected
illiquidity, which the Company expects to moderate over time.
Timing of Liquidation – The
Company’s cash flow projections consisted of various scenarios for each security
wherein it valued the ARS at points in time where it was in the interest of the
issuer, based on the fail rate, to redeem the securities. The Company’s
concluded values for each security were based on the average valuation of these
various scenarios. For the securities analyzed, the shortest time to liquidation
was assumed to be 27 months.
In
January 2010, the Company sold ARS with a par value of $2.2 million at December
31, 2009 for $2.0 million.
The
Company’s warrants received in connection with investment banking transactions
are primarily non-transferable warrants on publicly traded companies. The
Company’s valuation of its warrants is estimated using a Black-Scholes Merton
option pricing model, which incorporates the following assumptions: 1)
underlying company value was estimated based on closing market prices; 2)
volatility was based on historic trading data of the underlying company; 3) the
risk-free interest rate was derived from government yield curves and calculated
based on a weighted average of the risk-free interest rates that correspond
closest to the expected remaining life of the warrant; and 4) the marketability
discount was estimated based on management’s judgment about the market for
similar instruments as well as the environment of the industries in which the
underlying companies participate, and is based on valuation models that compute
such discounts.
NOTE
5 – RELATED PARTY TRANSACTIONS
Receivables
from related parties consisted of the following (in thousands):
|
December
31,
|
||||||||
|
2009
|
2008
|
|||||||
|
Co-Investment
Fund loans to employees and former employees
|
$
|
3,759
|
$
|
3,947
|
||||
|
Employee
loans and other related party receivables
|
643
|
640
|
||||||
|
Less—Allowance for doubtful
loans
|
(2,859
|
)
|
(2,324
|
)
|
||||
|
Total
receivables from related parties
|
$
|
1,543
|
$
|
2,263
|
||||
Related
Party Loans
Co-Investment Funds – In 2000
and 2001, the Company established an investment program for employees wherein
employees who qualified as accredited investors were able to contribute up to 4%
of their compensation to private equity funds (the “Co-Investment Funds”). The
Co-Investment Funds were established solely for employees of the Company and
invested side-by-side with the Company’s affiliates, Thomas Weisel Capital
Partners, L.P. (a private equity fund formerly managed by the Company) and
Thomas Weisel Venture Partners L.P. As part of this program, the Company made
loans to employees for capital contributions to the Co-Investment Funds in
amounts up to 400% of employees’ contributions. The Company discontinued the
investment program for employees in 2002.
The
Company holds as collateral the investment in the Co-Investment Funds and
establishes a reserve that reduces the carrying value of the receivable and
accrued interest to the fair value of the collateralized ownership interest of
the employees and former employees in the Co-Investment Funds. During 2009, the
Company increased the reserve related to the Co-Investment Funds by $0.5
million. During 2009, the Co-Investment Funds distributed $0.2 million, which
was credited towards repayment of loans to employees. The Co-Investment Funds
did not make any distributions that were credited towards repayment of the loans
to employees during 2008.
Employee Loans –
The Company from time to
time prior to its initial public offering made unsecured loans to its employees.
These loans were not part of a Company program, but were made as a matter of
course. The Company previously established a reserve for the face value of these
loans. In June 2007, two employees entered into agreements with the Company that
provide for repayment of the loans by December 31, 2008, if they have not
already been repaid, from funds generated through repurchase by the Company of
shares of the Company’s common stock held by the employees. In September 2008, the two employees
and the Company amended the agreements described above to extend the repayment
date of the loans to February 2011. As of December 31, 2009, the two employees
have collectively repaid $0.3 million of their outstanding loan balances in cash
or from proceeds they received through the repurchase by the Company of shares
of the Company’s common stock held by the employees.
Mr. Weisel,
the Company’s Chairman and Chief Executive Officer, and certain other employees
of the Company from time to time use an airplane owned by Ross Investments Inc.
(“Ross”), an entity wholly-owned by Mr. Weisel, for business travel. The
Company and Ross have adopted a time-sharing agreement in accordance with
Federal Aviation Regulation 91.501 to govern the Company’s use of the Ross
aircraft, pursuant to which the Company reimburses Ross for the travel expenses.
For the years ended December 31, 2009, 2008 and 2007, the Company paid
approximately $138,000, $127,000 and $210,000, respectively, to Ross on account
of such expenses. These amounts are included in marketing and promotion expense
within the consolidated statements of operations. As of December 31, 2009 and
December 31, 2008, the Company did not have any amounts payable to
Ross.
In
addition, the Company provides personal office services to Mr. Weisel.
Pursuant to an understanding between Mr. Weisel and the Company, Mr. Weisel
reimburses the Company for out-of-pocket expenses the Company incurs for such
services. Amounts incurred by the Company for these services for the year ended
December 31, 2009, 2008 and 2007 were approximately $284,000, $337,000 and
$322,000, respectively. The receivable from Mr. Weisel at December 31, 2009 and
December 31, 2008 was approximately $74,000 and $73,000, respectively. The
amount outstanding at December 31, 2009 was paid by Mr. Weisel in January
2010.
In 2009,
the Company agreed to provide personal office services, as needed, to Mr.
Conacher, its President and Chief Operating Officer. Mr. Conacher reimburses the
Company for the cost of such services and for out-of-pocket expenses it incurs
on his behalf. Amounts incurred by the Company for year ended December 31, 2009
were approximately $40,000, which had been fully repaid as of December 31,
2009.
On July
27, 2009, the Company entered into a President Employment Agreement, a
Relocation Agreement and a Side Agreement with Mr. Conacher. The Relocation
Agreement sets forth terms and conditions applicable to Mr. Conacher’s
relocation from Canada to the Company’s headquarters in San Francisco. Pursuant
to the Relocation Agreement, on August 5, 2009, Mr. Conacher sold 175,000 shares
of the Company’s common stock at $4.00 per share. Computershare Trust Company of
Canada, the trustee for the trust that distributes Company common stock
associated with vesting restricted stock units held by Canadian employees of the
Company, acquired the shares. In conjunction with the sale of shares by Mr.
Conacher and pursuant to the Relocation Agreement, the Company granted 175,000
options to Mr. Conacher. The options have an exercise price of $4.00, will vest
in February 2011 and are exercisable until August 2014. At December 31, 2009,
132,575 shares remain in the trust and have been recorded as treasury stock in
the consolidated statements of financial condition.
NOTE
6 – PROPERTY AND EQUIPMENT
Property
and equipment consisted of the following (in thousands):
|
December 31,
|
||||||||
|
2009
|
2008
|
|||||||
|
Leasehold
improvements
|
$
|
62,268
|
$
|
66,694
|
||||
|
Equipment,
computer hardware and software
|
11,829
|
36,716
|
||||||
|
Furniture
and artwork
|
18,576
|
18,596
|
||||||
|
Capital
leases
|
910
|
622
|
||||||
|
Total
property and equipment
|
93,583
|
122,628
|
||||||
|
Less—Accumulated depreciation
and amortization
|
(78,730
|
)
|
(102,047
|
)
|
||||
|
Total
property and equipment—net
|
$
|
14,853
|
$
|
20,581
|
||||
Depreciation
and amortization expense related to property and equipment totaled $7.9 million,
$7.8 million and $6.4 million for the years ended December 31, 2009, 2008,
and 2007, respectively.
In 2009,
the Company evaluated fully depreciated property and equipment and determined
that $30.1 million of these assets were no longer in service. The associated
property and equipment and accumulated depreciation and amortization balances
were written-off in 2009.
NOTE
7 – ACQUISITION
On
January 2, 2008, the Company acquired Westwind Capital Corporation (“Westwind”),
a full-service, institutionally oriented, independent investment bank focused on
the energy and mining sectors. Westwind, which was founded in 2002 and
headquartered in Toronto, had additional offices in Calgary and the U.K. Under
the agreement, the Company indirectly acquired 100 percent of Westwind’s
outstanding shares and Westwind became an indirect subsidiary of the Company.
The Company acquired Westwind in order to further expand its geographic coverage
in both Canada and the U.K., as well as expand its industry coverage into the
energy and mining sectors of the economy.
The total
purchase consideration was approximately $156 million, which consisted of $45
million in cash, 7,009,112 shares of the Company’s common stock valued at $15.35
per share (based on the average closing price over a five day period starting
two days prior to the acquisition announcement date of October 1, 2007 and
ending two days after the announcement date) and direct acquisition costs of
$3.1 million consisting primarily of legal, accounting and advisory fees. Common
stock issued includes 6,639,478 exchangeable shares, which are shares issued by
a Canadian subsidiary of the Company and are exchangeable for shares of the
Company’s common stock.
The
Company accounted for its acquisition of Westwind utilizing the purchase
method. The purchase price was allocated between the business acquisition
and the non-compete agreements executed with Westwind’s employee shareholders on
a fair value basis. The results of operations for the acquired business are
included in the accompanying consolidated statements of operations since the
acquisition.
The
following sets forth the Company’s allocation of the purchase price
consideration (in
thousands):
|
Cash
|
$
|
36,891
|
||
|
Securities
owned
|
9,917
|
|||
|
Goodwill
|
98,204
|
|||
|
Other
intangible assets
|
21,000
|
|||
|
Other
liabilities assumed—net
|
(19,284
|
)
|
||
|
Deferred
tax liabilities on acquired identifiable intangible assets
|
(7,106
|
)
|
||
|
Total
purchase price allocation for the business acquisition
|
139,622
|
|||
|
Non-compete
agreements
|
24,033
|
|||
|
Deferred
tax liability on acquired non-compete agreements
|
(8,133
|
)
|
||
|
Total
consideration
|
$
|
155,522
|
Under
business combination accounting, the total purchase price was allocated to
Westwind’s net tangible and identifiable intangible assets based on their
estimated fair values as of January 2, 2008. The excess of the purchase price
over the net tangible and identifiable intangible assets was recorded as
goodwill. In addition to the acquisition of the business, the Company also
entered into non-compete agreements with a majority of the Westwind employee
shareholders who became employees of the Company subsequent to the acquisition.
These non-compete agreements generally apply for a period of 1 to 3 years
following the employee’s departure from the Company (if that departure occurs
within the first three years following the Company’s acquisition of Westwind)
and include a liquidated damages provision that would require employees who
breach the non-compete agreement to pay the Company an amount equal to 50% of
the consideration received for their shares in Westwind. In performing the
purchase price allocation, the Company considered, among other factors, its
intention for future use of the acquired assets, analyses of historical
financial performance and estimates of future performance of Westwind’s
operations. The fair value of other intangible assets was based on the income
approach.
Unaudited
Pro Forma Financial Information
The
following unaudited pro forma financial information for the year ended December
31, 2007 gives effect to the Company’s acquisition of Westwind as if the
acquisition had occurred as of January 1, 2007. The unaudited pro forma
financial information is based on historical financial statements of the Company
and Westwind.
The
unaudited pro forma financial information was prepared using the purchase method
of accounting with the Company treated as the accounting acquirer. The unaudited
pro forma financial information does not purport to be indicative of the results
that would have actually been achieved had such transactions been completed as
of the assumed date and for the period presented, or which may be achieved in
the future.
The
following sets forth the unaudited pro forma financial information for the year
ended December 31, 2007 (in
thousands, except per share data):
|
Pro
forma net revenues
|
$
|
373,848
|
||
|
Pro
forma loss before taxes
|
$
|
(2,859
|
)
|
|
|
Pro
forma net loss
|
$
|
(476
|
)
|
|
|
Pro
forma net loss per share:
|
||||
|
Pro
forma basic net loss per share
|
$
|
(0.01
|
)
|
|
|
Pro
forma diluted net loss per share
|
$
|
(0.01
|
)
|
|
|
Pro
forma weighted average shares used in the computation of per share
data:
|
||||
|
Pro
forma basic weighted average shares outstanding
|
33,150
|
|||
|
Pro
forma diluted weighted average shares outstanding
|
33,150
|
NOTE
8 — GOODWILL AND OTHER INTANGIBLE ASSETS
The
following sets forth the other intangible assets associated with the acquisition
of Westwind as of December 31, 2009 (in
thousands):
|
Gross
Carrying Amount
|
Accumulated
Amortization
|
Impairment
|
Foreign
Currency Translation
|
Net
Book Value December 31, 2009
|
Useful
Life
|
||||||||||||||||
|
Customer
relationships
|
$
|
18,400
|
$
|
7,691
|
$
|
—
|
$
|
1,295
|
$
|
9,414
|
7.5
years
|
||||||||||
|
Non-compete
agreements
|
24,033
|
14,375
|
665
|
(1)
|
2,006
|
6,987
|
3.0
years
|
||||||||||||||
|
Investment
banking backlog
|
2,600
|
2,457
|
—
|
143
|
—
|
1.0
year
|
|||||||||||||||
|
Total
other intangible assets
|
$
|
45,033
|
$
|
24,523
|
$
|
665
|
$
|
3,444
|
$
|
16,401
|
|||||||||||
|
|
(1)
|
Included
in amortization of other intangible assets in the consolidated statement
of operations.
|
The
following sets forth the remaining amortization of the other intangible assets
based on accelerated and straight-line methods of amortization over the
respective useful lives as of December 31, 2009 (in thousands):
|
2010
|
$ | 9,727 | ||
|
2011
|
2,093 | |||
|
2012
|
1,636 | |||
|
2013
|
1,294 | |||
|
2014
|
1,028 | |||
|
Thereafter
|
623 | |||
|
Total
amortization
|
$ | 16,401 |
Amortization
expense related to other intangible assets was $9.9 million and $15.3 million
for the year ended December 31, 2009 and 2008, respectively.
In
connection with the allocation of the Westwind purchase price consideration, the
Company recorded goodwill of $98.2 million. Subsequent to the acquisition, the
Company experienced a significant decline in its market capitalization which was
affected by the uncertainty in the financial markets. Based on the difficult
conditions in the business climate and the Company’s perception that the climate
was unlikely to change in the near term, the Company recorded a full impairment
charge to the goodwill asset of $92.6 million during the year ended December 31,
2008. The impairment charge was determined based on the fair value of the
Company utilizing a discounted cash flow analysis and considered the Company’s
market capitalization to determine the reasonableness of the discounted cash
flow. The difference between the goodwill balance recorded on the acquisition
date and the amount impaired during the year ended December 31, 2008 is due to a
currency translation adjustment of $5.6 million.
NOTE
9 – ACCRUED EXPENSES AND OTHER LIABILITIES
Accrued
expenses and other liabilities consisted of the following (in thousands):
|
December
31,
|
||||||||
|
2009
|
2008
|
|||||||
|
Syndicate
liabilities
|
$
|
4,523
|
$
|
897
|
||||
|
Accounts
payable and other liabilities
|
28,302
|
30,732
|
||||||
|
Investment
in partnership general partner liability
|
57
|
1,873
|
||||||
|
Carried
interest claw back liability
|
2,016
|
—
|
||||||
|
Liability
for lease losses
|
7,371
|
9,608
|
||||||
|
Deferred
rent
|
2,700
|
3,218
|
||||||
|
Deferred
incentive fees
|
—
|
1,650
|
||||||
|
Total
accrued expenses and other liabilities
|
$
|
44,969
|
$
|
47,978
|
||||
The
liability for lease losses relates to office space that the Company subleased
due to staff reductions in 2009 and in prior years, and the liability will
expire with the termination of the relevant facility leases through 2012. The
lease loss provision (benefit) was $2.3 million, $6.0 million and
($0.2) million for the years ended December 31, 2009, 2008 and 2007,
respectively. The Company estimates its liability for lease losses as the net
present value of the differences between lease payments and receipts under
sublease agreements.
Accrued
expenses and other liabilities at December 31, 2009 and 2008 include an accrual
for anticipated settlement amounts related to loss contingencies described in
Note 16 – Commitments, Guarantees and Contingencies. These amounts are
included in accounts payable and other liabilities in the table
above.
NOTE
10 – NOTES PAYABLE
Notes
payable consisted of the following (in thousands):
|
December
31, 2009
|
December
31, 2008
|
|||||||||||||||
|
Principal
Amount
|
Carrying
Amount
|
Principal Amount
|
Carrying Amount
|
|||||||||||||
|
Senior
Note, floating mid-term AFR (1)
+ 2.25% (2)
|
$
|
13,000
|
$
|
12,732
|
$
|
13,000
|
$
|
12,492
|
||||||||
|
Senior
Note, floating mid-term AFR (1)
+ 2.25% (2)
|
10,000
|
9,794
|
10,000
|
9,609
|
||||||||||||
|
Total
notes payable
|
$
|
23,000
|
$
|
22,526
|
$
|
23,000
|
$
|
22,101
|
||||||||
|
|
(1)
|
Applicable
Federal Rate.
|
|
|
(2)
|
The
Company has recorded the debt principal at a discount to reflect the
below-market stated interest rate of these notes at inception. The Company
amortizes the discount to interest expense so that the interest expense
approximates the Company’s incremental borrowing rate. The effective
interest rates at December 31, 2009 and 2008 were 4.94% and 3.80%,
respectively.
|
The fair
value for each of the notes payable presented above approximates the carrying
value as of December 31, 2009 and 2008, respectively.
Senior
Notes
The
outstanding notes consist of a note in the principal amount of $10 million
issued to the California Public Employees’ Retirement System and a note in the
principal amount of $13 million issued to Nomura America Investment, Inc (the
“Senior Notes”). The Senior Notes have similar terms and covenants. A third note
(the “Contingent Payment Senior Note”) in the principal amount of
$10 million was issued to the California Public Employees’ Retirement
System and was paid in full in September 2008.
The
Senior Notes bear interest at a floating rate equal to the mid-term Applicable
Federal Rate in effect from time to time and mature in February 2011. The
Contingent Payment Senior Note was a non interest bearing note. As the interest
rate terms for all three notes were at amounts more favorable than the current
market incremental borrowing rate for the Company, the notes were recorded at
fair value. Discounts are amortized over the terms of the loans. The discount
for the Contingent Payment Senior Note was fully amortized upon repayment. The
weighted-average interest rate for notes payable was 4.36% and 5.17% at December
31, 2009 and 2008, respectively.
Subordinated
Borrowings
In April
2008, TWP entered into a $25.0 million revolving note and cash subordination
agreement with its primary clearing broker and incurs an annual commitment fee
of 1.0%, or $0.3 million. The credit period in which TWP could draw on the note
ended on April 18, 2009. TWP renewed this agreement on April 30, 2009, and the
new credit period expires on April 30, 2010. In order to borrow under this
agreement, TWP is required to have equity and capital in excess of certain
thresholds. As of December 31, 2009, TWP did not meet the equity threshold
specified in the agreement. As of December 31, 2009, TWP did not have any
balances outstanding under this facility.
TWPC has
a capital rental arrangement with a Canadian financial institution which is also
a member of the IIROC. Under this arrangement, the financial institution
provides subordinated capital on behalf of TWPC out of its capital up to CDN$8.0
million for bought deal underwriting commitments in return for a participation
in the underwriting. During the year ended December 31, 2009, TWPC was provided
capital for a bought deal underwriting commitment and as a result incurred a fee
of $0.1 million.
Covenants
The
Senior Notes include financial covenants including restrictions on additional
indebtedness and other liabilities that could cause them to become callable and
requirements that the notes be repaid should the Company enter into a
transaction to liquidate or dispose of all or substantially all of its property,
business or assets. The Company was in compliance with all covenants at December
31, 2009.
NOTE
11 – FINANCIAL INSTRUMENTS
The
Company records financial assets and liabilities at fair value in the
consolidated statements of financial condition with unrealized gains (losses)
reflected in the consolidated statements of operations.
The
degree of judgment used in measuring the fair value of financial instruments
generally correlates to the level of pricing observability. Pricing
observability is impacted by a number of factors, including the type of
financial instrument, whether the financial instrument is new to the market and
not yet established and the characteristics specific to the transaction.
Financial instruments with readily available active quoted prices for which fair
value can be measured generally will have a higher degree of pricing
observability and a lesser degree of judgment used in measuring fair value.
Conversely, financial instruments rarely traded or not quoted will generally
have less, or no, pricing observability and a higher degree of judgment used in
measuring fair value.
The
Company’s financial assets and liabilities measured and reported at fair value
are classified and disclosed in one of the following
categories:
|
|
·
|
Level
1 – Quoted prices are available in active markets for identical
investments as of the reporting date. Investments generally included in
this category are money market funds, listed equities and equity index
funds. The Company does not adjust the quoted price of these investments,
even in situations where it holds a large position and a sale could
reasonably be expected to affect the quoted
price.
|
|
|
·
|
Level
2 – Pricing inputs are other than quoted prices in active markets, which
are either directly or indirectly observable as of the reporting date, and
fair value is determined through the use of models or other valuation
methodologies. Investments generally included in this category are
convertible bonds.
|
|
|
·
|
Level
3 – Pricing inputs are unobservable for the investment and include
situations where there is little, if any, market activity for the
investment. The inputs used in the determination of fair value require
significant management judgment or estimation. Investments generally
included in this category are partnership interests in private investment
funds, warrants, ARS and securities that cannot be publicly offered or
sold unless registration has been affected under the Securities
Act.
|
The
following is a summary of the fair value of the major categories of financial
instruments held by the Company (in thousands):
|
December
31,
|
||||||||
|
2009
|
2008
|
|||||||
|
Assets
|
||||||||
|
Money
market funds
|
$
|
56,250
|
$
|
26,395
|
||||
|
Securities
owned
|
16,063
|
18,497
|
||||||
|
Investments
in partnerships and other investments
|
57,000
|
44,245
|
||||||
|
Total
assets
|
$
|
129,313
|
$
|
89,137
|
||||
|
Liabilities
|
||||||||
|
Securities
sold, but not yet purchased
|
$
|
15,579
|
$
|
11,537
|
||||
|
Total
liabilities
|
$
|
15,579
|
$
|
11,537
|
||||
The
following is a summary of the Company’s financial assets and liabilities that
are accounted for at fair value on a recurring basis by level in accordance with
the fair value hierarchy described above (in thousands):
|
December
31, 2009
|
||||||||||||||||
|
Level
1
|
Level
2
|
Level
3
|
Total
|
|||||||||||||
|
Assets
|
||||||||||||||||
|
Money
market funds
|
$
|
56,250
|
$
|
—
|
$
|
—
|
$
|
56,250
|
||||||||
|
Securities
owned:
|
||||||||||||||||
|
Equity
securities
|
16,063
|
—
|
—
|
16,063
|
||||||||||||
|
Investments
in partnerships and other investments:
|
||||||||||||||||
|
Investments
in partnerships
|
—
|
—
|
30,661
|
30,661
|
||||||||||||
|
Auction
rate securities
|
—
|
—
|
18,087
|
18,087
|
||||||||||||
|
Warrants
|
—
|
—
|
5,860
|
5,860
|
||||||||||||
|
Other
|
—
|
—
|
2,392
|
2,392
|
||||||||||||
|
Total
assets
|
$
|
72,313
|
$
|
—
|
$
|
57,000
|
$
|
129,313
|
||||||||
|
Liabilities
|
||||||||||||||||
|
Securities
sold, but not yet purchased:
|
||||||||||||||||
|
Equity
securities
|
$
|
19
|
$
|
—
|
$
|
—
|
$
|
19
|
||||||||
|
Equity
index fund
|
15,560
|
—
|
—
|
15,560
|
||||||||||||
|
Total
liabilities
|
$
|
15,579
|
$
|
—
|
$
|
—
|
$
|
15,579
|
||||||||
|
December
31, 2008
|
||||||||||||||||
|
Level
1
|
Level
2
|
Level
3
|
Total
|
|||||||||||||
|
Assets
|
||||||||||||||||
|
Money
market funds
|
$
|
26,395
|
$
|
—
|
$
|
—
|
$
|
26,395
|
||||||||
|
Securities
owned:
|
||||||||||||||||
|
Equity
securities
|
11,172
|
923
|
—
|
12,095
|
||||||||||||
|
Convertible
bonds
|
—
|
6,402
|
—
|
6,402
|
||||||||||||
|
Investments
in partnerships and other investments:
|
||||||||||||||||
|
Investments
in partnerships
|
—
|
—
|
32,654
|
32,654
|
||||||||||||
|
Auction
rate securities
|
—
|
—
|
8,913
|
8,913
|
||||||||||||
|
Warrants
|
—
|
—
|
430
|
430
|
||||||||||||
|
Other
|
—
|
—
|
2,248
|
2,248
|
||||||||||||
|
Total
assets
|
$
|
37,567
|
$
|
7,325
|
$
|
44,245
|
$
|
89,137
|
||||||||
|
Liabilities
|
||||||||||||||||
|
Securities
sold, but not yet purchased:
|
||||||||||||||||
|
Equity
securities
|
$
|
1,465
|
$
|
—
|
$
|
—
|
$
|
1,465
|
||||||||
|
Equity
index fund
|
10,072
|
—
|
—
|
10,072
|
||||||||||||
|
Total
liabilities
|
$
|
11,537
|
$
|
—
|
$
|
—
|
$
|
11,537
|
||||||||
The
following is a summary of changes in fair value of the Company’s financial
assets that have been classified as Level 3 at December 31, 2009 (in thousands):
|
Warrants
|
Investments
in Partnerships
|
Auction
Rate Securities
|
Other
|
Total
|
||||||||||||||||
|
Balance—December 31,
2008
|
$
|
430
|
$
|
32,654
|
$
|
8,913
|
$
|
2,248
|
$
|
44,245
|
||||||||||
|
Realized
and unrealized gains (losses)—net
|
6,539
|
(4,103
|
)
|
(776
|
)
|
227
|
1,887
|
|||||||||||||
|
Purchases,
sales, issuances and settlements—net
|
(1,728
|
) (1)
|
94
|
(2)
|
9,950
|
(83
|
)
|
8,233
|
||||||||||||
|
Cumulative
translation adjustment
|
619
|
—
|
—
|
—
|
619
|
|||||||||||||||
|
Transfer
in
|
—
|
—
|
—
|
—
|
—
|
|||||||||||||||
|
Transfers
out
|
—
|
—
|
—
|
—
|
—
|
|||||||||||||||
|
Other
|
—
|
2,016
|
(3)
|
—
|
—
|
2,016
|
||||||||||||||
|
Balance—December 31,
2009
|
$
|
5,860
|
$
|
30,661
|
$
|
18,087
|
$
|
2,392
|
$
|
57,000
|
||||||||||
|
|
(1)
|
Warrants
are received from time to time as partial payment for investment banking
services. During the year ended December 31, 2009, the Company exercised
$3.3 million of warrants that it held and disposed of them subsequent to
exercise.
|
|
|
(2)
|
Represents
the net of contributions to and distributions from investments in
partnerships.
|
|
|
(3)
|
Represents
carried interest distributions that could potentially be returned to the
partnership due to investment underperformance which are included in
accounts payable and other liabilities in the consolidated statements of
financial condition. Refer to Note 9 – Accrued Expenses and Other
Liabilities.
|
The
following is a summary of changes in fair value of the Company’s financial
assets that have been classified as Level 3 at December 31, 2008 (in thousands):
|
Convertible
Bonds Owned
|
Warrants
|
Investments
in Partnerships
|
Auction
Rate Securities
|
Other
|
Total
|
|||||||||||||||||||
|
Balance—December 31,
2007
|
$
|
15,941
|
$
|
—
|
$
|
53,258
|
$
|
—
|
$
|
8,262
|
$
|
77,461
|
||||||||||||
|
Realized
and unrealized losses—net
|
(1,830
|
)
|
(6,171
|
)
|
(17,807
|
)
|
(737
|
)
|
(2,886
|
)
|
(29,431
|
)
|
||||||||||||
|
Purchases,
sales, issuances and settlements—net
|
(7,054
|
)
|
7,139
|
(1)
|
(2,797
|
)(2)
|
1,100
|
(3,128
|
)
|
(4,740
|
)
|
|||||||||||||
|
Cumulative
translation adjustment
|
—
|
(538
|
)
|
—
|
—
|
—
|
(538
|
)
|
||||||||||||||||
|
Transfer
in
|
—
|
—
|
—
|
8,550
|
(4)
|
—
|
8,550
|
|||||||||||||||||
|
Transfers
out
|
(7,057
|
)(3)
|
—
|
—
|
—
|
—
|
(7,057
|
)
|
||||||||||||||||
|
Balance—December 31,
2008
|
$
|
—
|
$
|
430
|
$
|
32,654
|
$
|
8,913
|
$
|
2,248
|
$
|
44,245
|
||||||||||||
|
(1)
|
On
January 2, 2008, the Company acquired $7.7 million of warrants as a result
of the Westwind acquisition. Other warrants are received from time to time
as partial payment for investment banking services. During the year ended
December 31, 2008, the Company exercised $0.8 million of warrants that it
held and disposed of them subsequent to
exercise.
|
|
(2)
|
Represents
the net of contributions to and distributions from investments in
partnerships.
|
|
(3)
|
Represents
convertible bonds that were registered under the Securities Act of 1933
during year ended December 31, 2008 that previously could not be publicly
offered or sold as registration had not yet been
affected.
|
|
(4)
|
During
the year ended December 31, 2008, ARS for which the auctions failed were
moved to Level 3, as the assets were subject to valuation using
unobservable inputs.
|
The total
net unrealized gains during the year ended December 31, 2009 of $2.2 million
relate to financial assets held by the Company as of December 31,
2009.
Realized
and unrealized gains (losses) from investments in partnerships and other
investments are included in asset management revenues in the consolidated
statements of operations. Realized and unrealized gains (losses) from securities
owned and securities sold, but not yet purchased, are included in brokerage
revenues and asset management revenues in the consolidated statements of
operations.
NOTE
12 – NET INCOME (LOSS) PER SHARE
The
Company uses the treasury stock method to reflect the potential dilutive effect
of unvested restricted stock units, a warrant (both vested and non-vested) and
unexercised stock options (“options”). Potential dilutive shares are excluded
from the computation of net loss per share if their effect is anti-dilutive. The
anti-dilutive options totaled 443,549 and 268,549 for the year ended December
31, 2009 and 2008, respectively. The anti-dilutive warrant totaled 486,486
shares for both the years ended December 31, 2009 and 2008.
The
following table is a reconciliation of basic and diluted net income (loss) per
share (in thousands, except
per share data):
|
Year
Ended December 31,
|
||||||||||||
|
2009
|
2008
|
2007
|
||||||||||
|
Net
income (loss)
|
$
|
(63,678
|
)
|
$
|
(203,252
|
)
|
$
|
20
|
||||
|
Basic
weighted average shares outstanding
|
32,515
|
32,329
|
26,141
|
|||||||||
|
Effect
of dilutive securities:
|
||||||||||||
|
Weighted
average restricted stock units
|
—
|
—
|
261
|
|||||||||
|
Weighted
average options
|
—
|
—
|
—
|
|||||||||
|
Weighted
average warrant
|
—
|
—
|
44
|
|||||||||
|
Diluted
weighted average shares outstanding
|
32,515
|
32,329
|
26,446
|
|||||||||
|
Net
loss per share:
|
||||||||||||
|
Basic
net loss per share
|
$
|
(1.96
|
)
|
$
|
(6.29
|
)
|
$
|
—
|
||||
|
Diluted
net loss per share
|
$
|
(1.96
|
)
|
$
|
(6.29
|
)
|
$
|
—
|
||||
NOTE
13 – SHARE-BASED COMPENSATION
The Third
Amended and Restated Thomas Weisel Partners Group, Inc. Equity Incentive Plan
(the “Equity Incentive Plan”) provides for awards of non-qualified and incentive
stock options, restricted stock and restricted stock units and other share-based
awards to officers, directors, employees, consultants and advisors of the
Company. At the February 2009 Special Meeting of Shareholders, the shareholders
of the Company voted to approve an increase in the number of shares of the
Company’s common stock available for awards under the Equity Incentive Plan by
6,000,000 shares. At December 31, 2009 the total number of shares issuable under
the Equity Incentive Plan was 17,150,000 shares. Awards of stock options and
restricted stock units reduce the number of shares available for future
issuance. The number of shares available for future issuance under the Equity
Incentive Plan at December 31, 2009 was approximately 6,100,000
shares.
Stock
Options
The
Equity Incentive Plan provides for the grant of non-qualified or incentive
options for the purchase of newly issued shares of the Company’s common stock at
a price determined by the Compensation Committee (the “Committee”) of the board
of directors (the “Board”)at the date the option is granted. Generally, options
vest and are exercisable ratably over a three or four-year period from the date
the option is granted (although, in accordance with the terms of the Company’s
Equity Incentive Plan, options granted to non-employee directors as regular
director’s compensation have no minimum vesting period) and expire within ten
years from the date of grant. The exercise prices, as determined by the
Committee, cannot be less than the fair market value of the shares on the grant
date. These options provide for accelerated vesting upon a change in control, as
determined by the Committee.
The fair
value of each option award is estimated on the date of grant using a
Black-Scholes Merton option pricing model with the following weighted-average
assumptions noted in the table below:
Expected volatility – Based
on the lack of historical data for the Company’s own shares, the Company based
its expected volatility on a representative peer group that took into account:
industry, market capitalization, stage of life cycle and capital
structure.
Expected term – Expected term
represents the period of time that options granted are expected to be
outstanding. The Company elected to calculate the expected term of the option
awards using the “simplified method”. This election was made as the Company does
not have sufficient historical exercise data to provide a reasonable basis upon
which to estimate expected term. Under the “simplified” calculation method, the
expected term was calculated as an average of the vesting period and the
contractual life of the options.
Risk-free interest rate –
Based on the U.S. Treasury zero-coupon bond rate with a remaining term
approximate of the expected term of the option.
Dividend yield – As the
Company has not paid, nor does it currently plan to pay, dividends in the
future, the assumed dividend yield is zero.
|
Year
Ended December 31,
|
||||||||||||
|
2009
|
2008
|
2007
|
||||||||||
|
Expected
volatility
|
75.00
|
%
|
54.60
|
%
|
47.46
|
%
|
||||||
|
Expected
term (in years)
|
3.25
|
5.00
|
5.00
|
|||||||||
|
Risk-free
interest rate
|
1.93
|
%
|
3.09
|
%
|
4.71
|
%
|
||||||
|
Dividend
yield
|
—
|
%
|
—
|
%
|
—
|
%
|
||||||
|
Weighted-average
grant date fair value
|
$
|
2.07
|
$
|
3.00
|
$
|
8.59
|
||||||
The
following table is a summary of option activity:
|
Weighted
|
Weighted
Average
|
Aggregate
|
||||||||||||||
|
Average
|
Remaining
|
Intrinsic
|
||||||||||||||
|
Options
|
Exercise
Price
|
Contractual
Life
|
Value
|
|||||||||||||
|
Outstanding—December 31,
2008
|
268,549
|
$
|
10.40
|
8.92
|
$
|
—
|
||||||||||
|
Granted
|
175,000
|
4.00
|
4.59
|
—
|
||||||||||||
|
Exercised
|
—
|
—
|
—
|
—
|
||||||||||||
|
Cancelled
|
—
|
—
|
—
|
—
|
||||||||||||
|
Expired
|
—
|
—
|
—
|
—
|
||||||||||||
|
Outstanding—December 31,
2009
|
443,549
|
$
|
7.87
|
6.61
|
$
|
—
|
||||||||||
|
Exercisable—December 31,
2009
|
266,495
|
$
|
10.31
|
7.94
|
$
|
—
|
||||||||||
As of
December 31, 2009, there were 266,495 options vested. The Company assumes that
there will be no forfeitures of the non-vested options outstanding as of
December 31, 2009 and therefore expects the total amount to vest over their
remaining vesting period.
As of
December 31, 2009, the total unrecognized compensation expense related to
non-vested options was approximately $0.3 million. This cost is expected to
be recognized over a weighted-average period of 0.6 years.
The
Company recorded $0.2 million, $0.6 million and $0.5 million in non-cash
compensation expense with respect to options during the year ended December 31,
2009, 2008 and 2007, respectively.
Restricted
Stock Units
The
Company makes grants of restricted stock units from time to time in connection
with its regular compensation and hiring process. Although the terms of
individual grants vary, as a general matter, grants of restricted stock units
made in connection with the Company’s regular compensation and hiring process
will vest over a three or four-year service period, subject to the employee’s
continued employment with the Company, but may vest earlier in the event of a
change of control. Shares of common stock underlying these restricted stock
units will be deliverable on or about the related vesting date except for
restricted stock units granted in conjunction with the Company’s initial public
offering which vested in three equal installments in 2007, 2008 and 2009, and
are deliverable in three equal installments in 2009, 2010 and 2011,
respectively.
The
Company has granted performance based awards that vest and become deliverable
upon achievement or satisfaction of performance conditions specified in the
performance award agreement. The Company estimates the fair value of
performance-based restricted stock units awarded to employees at the grant date
based on the market price of the Company’s common stock on such date. The
Company also considers the probability of achieving the established performance
targets in determining its share-based compensation with respect to these
awards. The Company recognizes compensation cost over the performance
period.
The
following table is a summary of non-vested restricted stock unit
activity:
|
Weighted
Average
|
||||||||
|
Grant
Date
|
||||||||
|
Shares
|
Fair
Value
|
|||||||
|
Non-vested—December 31,
2008
|
7,316,712
|
$
|
8.58
|
|||||
|
Issued
|
3,597,123
|
3.28
|
||||||
|
Vested
|
(1,745,624
|
)
|
10.84
|
|||||
|
Cancelled
|
(949,767
|
)
|
7.17
|
|||||
|
Non-vested—December 31,
2009
|
8,218,444
|
$
|
5.94
|
|||||
The
Company recorded $19.2 million, $18.3 million and $10.4 million in non-cash
compensation expense with respect to grants of restricted stock units for the
years ended December 31, 2009, 2008 and 2007, respectively. The fair value
of shares vested during the years ended December 31, 2009, 2008 and 2007 was
$7.4 million, $8.0 million and $11.1 million, respectively.
As of
December 31, 2009, there was $29.8 million of total unrecognized
compensation expense related to non-vested restricted stock unit awards. This
cost is expected to be recognized over a weighted-average period of
2.0 years.
In
February 2010, the Company made an additional grant of approximately 3,500,000
restricted stock units in connection with its regular compensation process. The
unrecognized compensation expense associated with this grant is $11.0 million,
net of expected forfeitures. The restricted stock units granted will vest over a
three-year service period, subject to the employee’s continued employment with
the Company, and the shares of common stock underlying these restricted stock
units will be deliverable on or about the related vesting date.
NOTE
14 – INCOME TAXES
The
Company accounts for income taxes by recognizing deferred tax assets and
liabilities based upon temporary differences between the financial reporting and
tax basis of its assets and liabilities. Valuation allowances are established
when necessary to reduce deferred tax assets when it is more likely than not
that a portion or all of the deferred tax assets will not be
realized.
The Company’s operations are in a
cumulative loss position for the three-year period ended December 31, 2009,
primarily as a result of significant operating losses in 2009 and 2008 due to
the challenging environment for the capital markets. For purposes of assessing
the realization of the deferred tax assets, this cumulative taxable loss
position is considered significant negative evidence that it is more likely than
not the Company will not be able to realize the deferred tax assets in the
future. As of December 31, 2008, the Company recorded full valuation
allowances of $44.8 million and $1.7 million on its U.S. deferred tax
assets and its U.K. deferred tax asset, respectively. As of December 31, 2009,
the valuation allowances increased to $67.0 million on U.S. deferred tax assets
and $1.8 million on the U.K. deferred tax asset. Management will reassess the
realization of the deferred tax assets each reporting period. To the extent that
the financial results of the Company improve and the deferred tax assets become
realizable, the Company will be able to reduce the valuation allowances through
earnings.
In 2007,
the Company reduced a previously established $1.4 million valuation allowance to
zero resulting in the recognition of a $1.4 million deferred tax benefit. The
valuation allowance was recorded due to uncertainty of the Company’s ability to
generate future capital gains to offset a deferred tax benefit, which resulted
from unrealized capital losses in its investments in partnerships. In 2007, the
Company recorded net capital gains of $17.7 million in its investments in
partnerships, which included the recognition of previously recorded unrealized
gains. The valuation allowance was reduced due to the significant recognition of
capital gains, the continued performance of the Company’s investments and the
expectation of being able to reduce unrealized capital losses through
recognition and future unrealized capital gains.
The
Company follows guidance issued by the FASB that clarifies the accounting for
uncertainty in income taxes recognized in an entity’s financial statements and
prescribes a recognition threshold and measurement attributes for the financial
statement recognition and measurement of a tax position taken, or expected to be
taken in a tax return. Additional guidance is provided on derecognition,
classification, interest and penalties, accounting in interim periods,
disclosure and transition. In the U.S., the Company is subject to Federal and
state tax authority examination of the 2008, 2007 and 2006 tax years. In 2009,
an examination was concluded in the U.S. on the 2006 tax year resulting in no
change to the reported tax liability. In Canada, the Company is subject to
Federal tax authority examination of the 2008 through 2006 tax years and is
subject to provincial tax authority examination of the 2008 through 2005 tax
years. At December 31, 2008, the Company had a liability for unrecognized
tax benefits in Canada of $1.1 million, which is included in accrued
expenses and other liabilities in the statement of financial condition. During
2009, legislation was passed in Canada, which caused the Company to meet the
recognition threshold and measurement attributes for financial statement
recognition of the unrecognized tax benefits. As a result, the $1.1 million
liability was reversed in 2009 and is included as a tax benefit in the
consolidated statement of operations.
The
components of the provision for taxes (tax benefit) were as follows (in thousands):
|
Year
Ended December 31,
|
||||||||||||
|
2009
|
2008
|
2007
|
||||||||||
|
Current:
|
||||||||||||
|
Federal
|
$
|
—
|
$
|
(8,235
|
)
|
$
|
1,105
|
|||||
|
State
|
—
|
(91
|
)
|
1,210
|
||||||||
|
Foreign
|
2,626
|
1,070
|
123
|
|||||||||
|
Total
current expense (benefit)
|
2,626
|
(7,256
|
)
|
2,438
|
||||||||
|
Deferred:
|
||||||||||||
|
Federal
|
—
|
15,363
|
(3,483
|
)
|
||||||||
|
State
|
—
|
5,534
|
(1,507
|
)
|
||||||||
|
Foreign
|
(2,797
|
)
|
(5,941
|
)
|
(241
|
)
|
||||||
|
Total
deferred expense (benefit)
|
(2,797
|
)
|
14,956
|
(5,231
|
)
|
|||||||
|
Provision
for taxes (tax benefit)
|
$
|
(171
|
)
|
$
|
7,700
|
$
|
(2,793
|
)
|
||||
A
reconciliation of the statutory Federal income tax rate to the Company’s
effective tax rate was as follows:
|
Year
Ended December 31,
|
||||||||||||
|
2009
|
2008
|
2007
|
||||||||||
|
Tax
at U.S. statutory rate
|
35.0
|
%
|
35.0
|
%
|
35.0
|
%
|
||||||
|
State
tax expense (benefit)
|
—
|
(1.8
|
)
|
1.4
|
||||||||
|
Foreign
tax expense (benefit)
|
0.3
|
(0.5
|
)
|
4.3
|
||||||||
|
Permanent
items
|
||||||||||||
|
Goodwill
impairment
|
—
|
(17.0
|
)
|
—
|
||||||||
|
Other
permanent items (1)
|
(1.1
|
)
|
(0.5
|
)
|
7.4
|
|||||||
|
Rate
before adjustment to valuation allowance and impact of change in tax
status of the Company
|
34.2
|
15.2
|
48.1
|
|||||||||
|
Adjustment
to valuation allowance
|
(25.4
|
)
|
(18.7
|
)
|
49.8
|
|||||||
|
Subtotal
|
8.8
|
(3.5
|
)
|
97.9
|
||||||||
|
Other
adjustments (2)
|
(8.5
|
)
|
(0.4
|
)
|
2.8
|
|||||||
|
Effective
tax rate
|
0.3
|
%
|
(3.9
|
)%
|
100.7
|
%
|
||||||
|
|
(1)
|
Other
permanent items for the year ended December 31, 2009 consisted primarily
of non-deductible expenses of (1.1)%. Other permanent items for the year
ended December 31, 2008 consisted primarily of non-deductible expenses and
foreign tax loss of (0.3%) and (0.2%), respectively. Other permanent items
for the year ended December 31, 2007 consisted of tax exempt interest,
non-deductible expenses and foreign tax loss of 39.3%, (27.6%) and (4.3%),
respectively.
|
|
|
(2)
|
Other
adjustments for the year ended December 31, 2009 represent the cumulative
compensation cost recognized for financial reporting purposes for
restricted stock units in excess of the allowed tax
deduction.
|
The
components of deferred tax assets and liabilities were as follows (in thousands):
|
December
31,
|
||||||||
|
2009
|
2008
|
|||||||
|
Deferred
tax assets:
|
||||||||
|
Net
operating loss
|
$
|
37,228
|
$
|
14,520
|
||||
|
Accrued
compensation and related expenses
|
179
|
—
|
||||||
|
Equity
based compensation
|
11,451
|
12,043
|
||||||
|
Depreciation
and amortization
|
8,790
|
7,121
|
||||||
|
Non-deductible
reserves and allowances
|
7,356
|
6,924
|
||||||
|
Net
unrealized capital losses
|
5,574
|
7,984
|
||||||
|
Other
|
102
|
277
|
||||||
|
Total
deferred tax assets
|
70,680
|
48,869
|
||||||
|
Deferred
tax liabilities:
|
||||||||
|
Other
intangible assets
|
(5,864
|
)
|
(6,841
|
)
|
||||
|
Prepaid
expenses
|
(1,039
|
)
|
(1,272
|
)
|
||||
|
Accrued
compensation and related expenses
|
—
|
(256
|
)
|
|||||
|
Other
|
(62
|
)
|
(123
|
)
|
||||
|
Total
deferred tax liabilities
|
(6,965
|
)
|
(8,492
|
)
|
||||
|
Valuation
allowance
|
(68,802
|
)
|
(46,521
|
)
|
||||
|
Net
deferred tax liability
|
$
|
(5,087
|
)
|
$
|
(6,144
|
)
|
||
As of
December 31, 2009, the Company had Federal and state net operating losses
of approximately $79.1 million and $101.4 million, respectively, available to
reduce future income subject to income taxes. The Federal net operating losses
will begin to expire in 2029. The state net operating losses will expire between
2014 and 2030. At December 31, 2009, the Company had foreign net operating
losses of approximately $6.1 million available to reduce future income subject
to income taxes. The foreign net operating losses do not expire.
The
Company does not provide for distribution taxes on the undistributed earnings of
its foreign subsidiaries as the Company intends to reinvest any earnings
indefinitely. Undistributed earnings of the Company’s foreign subsidiaries were
not material for the years ended December 31, 2009, 2008 and
2007.
NOTE
15 – EMPLOYEE BENEFITS
The
Company has a defined contribution 401(k) retirement plan (the “Plan”) which
allows eligible employees to invest a percentage of their pretax compensation,
limited to the maximum allowed by the Internal Revenue Service regulations. The
Company, at its discretion, may contribute funds to the Plan. The Company made
no contributions during the years ended December 31, 2009, 2008 and
2007.
NOTE
16 – COMMITMENTS, GUARANTEES AND CONTINGENCIES
Commitments
Lease
Commitments
The
Company leases office space and computer equipment under non-cancelable
operating leases which extend to 2019 and which may be extended as prescribed
under renewal options in the lease agreements. The Company has entered into
several non-cancelable sub-lease agreements for certain facilities or floors of
facilities which are co-terminus with the Company’s lease for the respective
facilities or floors of facilities. The Company’s minimum annual lease
commitments and related sublease income under these agreements were as follows
(in
thousands):
|
December
31, 2009
|
||||||||||||
|
Minimum
Lease Payments
|
Sublease
Rental Income
|
Net
Minimum Lease Payments
|
||||||||||
|
2010
|
$
|
18,343
|
$
|
1,762
|
$
|
16,581
|
||||||
|
2011
|
14,781
|
770
|
14,011
|
|||||||||
|
2012
|
11,718
|
257
|
11,461
|
|||||||||
|
2013
|
10,130
|
—
|
10,130
|
|||||||||
|
2014
|
9,837
|
—
|
9,837
|
|||||||||
|
Thereafter
|
11,906
|
—
|
11,906
|
|||||||||
|
Total
|
$
|
76,715
|
$
|
2,789
|
$
|
73,926
|
||||||
Facility
and computer equipment lease expenses charged to operations for the years ended
December 31, 2009, 2008, and 2007 were $12.9 million, $16.6 million and
$14.8 million, respectively, net of sublease income of $3.5 million, $3.8
million and $2.9 million, respectively.
During
the year ended December 31, 2009, the Company recorded a $2.3 million lease loss
charge related to office space that it vacated in 2009. At December 31, 2009 and
2008 the Company had a lease loss liability of $7.4 million and $9.6 million,
respectively, related to office space that it vacated in 2009 and in prior
years. The lease loss liability was estimated as the net present value of the
difference between lease payments and receipts under expected sublease
agreements. At December 31, 2009, the Company had subleases on all floors or
facilities that were vacated that are co-terminus with the lease
commitments.
Fund
Capital Commitments
At
December 31, 2009, the Company’s Asset Management Subsidiaries had
commitments to invest in affiliated and unaffiliated investment partnerships.
These commitments are generally called as investment opportunities are
identified by the underlying partnerships. These commitments may be called in
full at any time.
The
Company’s commitments at December 31, 2009 were as follows (in thousands):
|
Asset
Management Subsidiaries:
|
||||
|
Global
Growth Partners I
|
$
|
414
|
||
|
Global
Growth Partners II
|
291
|
|||
|
Global
Growth Partners IV
|
823
|
|||
|
Healthcare
Venture Partners
|
187
|
|||
|
India
Opportunity Fund
|
352
|
|||
|
Total
Affiliated Fund Capital Commitments
|
2,067
|
|||
|
Unaffiliated
Funds
|
3,407
|
|||
|
Total
Fund Commitments
|
$
|
5,474
|
Guarantees
Broker-Dealer
Guarantees and Indemnification
The
Company’s customers’ transactions are introduced to the clearing brokers for
execution, clearance and settlement. Customers are required to complete their
transactions on settlement date, generally three business days after the trade
date. If customers do not fulfill their contractual obligations to the clearing
brokers, the Company may be required to reimburse the clearing brokers for
losses on these obligations. The Company has established procedures to reduce
this risk by monitoring trading within accounts and requiring deposits in excess
of regulatory requirements.
In 2009,
the Company recorded a loss of approximately $5.1 million due to a
customer who failed to pay for several equity purchases that
the Company executed at the customer’s request. Based on the Company’s agreement
with its primary clearing broker, the Company was required to settle and pay
for those transactions on the customer’s behalf. The Company recorded the
loss in bad debt expense which is included in other expense in the consolidated
statements of operations. The Company believes the loss was incurred as a result
of fraudulent activity on the part of the customer and is vigorously pursuing
that customer for the losses incurred upon liquidating those
positions.
The
Company is a member of various securities exchanges. Under the standard
membership agreements, members are required to guarantee the performance of
other members and, accordingly, if another member becomes unable to satisfy its
obligations to the exchange, all other members would be required to meet the
shortfall. The Company’s liability under these arrangements is not quantifiable
and could exceed the cash and securities it has posted as collateral. However,
management believes that the potential for the Company to be required to make
payments under these arrangements is remote. The Company has not recorded any
loss contingency for this indemnification.
Guaranteed
Compensation
The
Company has entered into guaranteed compensation agreements, and obligations
under these agreements are being accrued ratably over the related service
period. Total unaccrued obligations at December 31, 2009 for services to be
provided subsequent to December 31, 2009 were $2.5 million.
Director
and Officer Indemnification
The
Company has entered into agreements that provide indemnification to its
directors, officers and other persons requested or authorized by the Board to
take actions on behalf of the Company for all losses, damages, costs and
expenses incurred by the indemnified person arising out of such person’s service
in such capacity, subject to the limitations imposed by Delaware law. The
Company has not recorded any loss contingency for this
indemnification.
Tax
Indemnification Agreement
In
connection with its initial public offering, the Company entered into a tax
indemnification agreement to indemnify the members of Thomas Weisel Partners
Group LLC against the full amount of certain increases in taxes that relate to
activities of Thomas Weisel Partners Group LLC and its affiliates prior to the
Company’s reorganization. The tax indemnification agreement included provisions
that permit the Company to control any tax proceeding or contest which might
result in it being required to make a payment under the tax indemnification
agreement. The Company has not recorded any loss contingency for this
indemnification.
Contingencies
Loss
Contingencies
The
Company is involved in a number of judicial, regulatory and arbitration matters
arising in connection with its business. The outcome of matters the Company is
involved in cannot be determined at this time and the results cannot be
predicted with certainty. There can be no assurance that these matters will not
have a material adverse effect on the Company’s results of operations in any
future period, and a significant judgment could have a material adverse impact
on the Company’s consolidated statements of financial condition, operations and
cash flows. The Company may in the future become involved in additional
litigation in the ordinary course of its business, including litigation that
could be material to the Company’s business.
The
Company reviews the need for any loss contingency reserves and establishes
reserves when, in the opinion of management, it is probable that a matter would
result in liability, and the amount of loss, if any, can be reasonably
estimated. Generally, in view of the inherent difficulty of predicting the
outcome of those matters, particularly in cases in which claimants seek
substantial or indeterminate damages, it is not possible to determine whether a
liability has been incurred or to reasonably estimate the ultimate or minimum
amount of that liability until the case is close to resolution, in which case no
reserve is established until that time.
Additionally,
the Company will record receivables for insurance recoveries for legal
settlements and expenses when such amounts are covered by insurance and recovery
of such losses or costs are considered probable of recovery. These amounts will
be recorded as other assets in the consolidated statements of financial
condition and will reduce other expense to the extent such losses or costs have
been incurred in the consolidated statements of operations.
Auction
Rate Securities – The Company has received inquiries from FINRA for information
concerning the Company’s activities involving ARS. The Company did not, at any
time, underwrite ARS or manage the associated auctions.
On July
23, 2009, the staff of the Enforcement Department of FINRA (the “Staff”) advised
the Company that the Staff has made a preliminary determination to recommend
disciplinary action against the Company relating to certain activities involving
ARS. The Staff’s recommendation involves potential violations of FINRA and
Municipal Securities Rulemaking Board rules and certain anti-fraud and other
provisions of the Federal securities laws in connection with particular
transactions involving ARS. A Staff preliminary determination is neither a
formal allegation nor is it evidence of wrongdoing.
The
Company has responded to the Staff’s preliminary determination and continues to
communicate with the Staff in an effort to try to resolve the matter. Based upon
its discussions with the Staff, the Company believes that it has reached an
understanding in principle, subject to documenting that understanding in a
letter of acceptance, waiver and consent acceptable to FINRA, that would resolve
all aspects of the investigation of the Company. In light of the terms of that
agreement in principle, the Company has established in total a $4.0 million
provision for loss contingencies related to the FINRA investigation, all of
which would be paid to FINRA as a fine in connection with the resolution of all
aspects of the investigation of the Company.
There can
be no assurance, however, that the Company’s efforts to resolve these matters
will be successful or that a disciplinary proceeding will not be brought. The
Company is prepared to contest vigorously any formal disciplinary action that
would result in a censure, fine, or other sanction that could be material to its
business, financial condition, operations and cash flows. If FINRA were to
institute disciplinary action, it is possible that such action could result in a
material adverse effect on the Company’s business, financial condition,
operations and cash flows. However, the Company is unable to determine at this
time the impact of the ultimate resolution of this matter.
In
addition to the FINRA investigation, the Company has been named in three FINRA
arbitrations filed by customers who purchased ARS. The first claim was
arbitrated and the Company prevailed. The Company has filed answers to the
second and third customers’ complaints, and the parties are now proceeding
toward arbitration on those matters. The Company believes it has meritorious
defenses to those actions and intends to vigorously defend such actions as it
applies to the Company.
While the
Company’s review of the need for, and amount of, any loss contingency reserve
has led the Company to conclude that, based upon currently available
information, it has adequately established a provision for loss contingencies
related to ARS matters, the Company is not able to predict with certainty the
outcome of any such matters, nor the amount if any, of an eventual settlement or
judgment.
In Re Bare Escentuals Inc.
Securities Litigation – The Company has been named as a defendant in a
purported class action litigation brought in connection with the 2006 initial
public offering and 2007 secondary offering of Bare Escentuals where the Company
acted as a co-manager. The complaint was filed in the United States District
Court, Northern District of California, and alleges violations of Federal
securities laws against Bare Escentuals, officers and underwriters, including
the Company, based on alleged misstatements and omissions in the registration
statement. The Company believes it has meritorious defenses to these actions and
intends to vigorously defend such actions as they apply to the Company. At this time the Company
is unable to estimate whether it will incur a liability or the range of any such
liability in this matter.
Borghetti v. Campus Pipeline
– A putative shareholder derivative action was brought in the Third Judicial
District Court in Salt Lake County, Utah on October 5, 2004 against Campus
Pipeline in connection with a sell-side mergers and acquisitions engagement in
which the Company acted as a financial advisor to Campus Pipeline. Plaintiffs
alleged breach of fiduciary duty, fraud and similar related claims against
Campus Pipeline’s directors, officers, attorneys and the Company. On May 3,
2005, the court granted in part and denied in part the Company’s motion to
dismiss, dismissing all claims against the Company except the breach of
fiduciary duty claim. Thereafter, on April 23, 2007, the court granted the
Company’s motion for summary judgment with respect to the remaining claims
against the Company, although the plaintiffs subsequently have appealed this
decision. The Company has denied liability in connection with this matter. The
Company believes it has meritorious defenses to the action and intends to
vigorously defend such action as it applies to the Company. At this time the Company
is unable to estimate whether it will incur a liability or the range of any such
liability in this matter.
In re GT Solar International,
Inc. – The Company has been named as a defendant in a purported class
action litigation brought in connection with an initial public offering of GT
Solar International, Inc. in July 2008 where it acted as a co-manager. The
complaint, filed in the United States District Court for the District of New
Hampshire on August 1, 2008, alleges violations of Federal securities laws
against GT Solar and certain of its directors and officers as well as GT Solar’s
underwriters, including the Company, based on alleged misstatements and
omissions in the registration statement. The Company believes it has meritorious
defenses to the action and intends to vigorously defend such action as it
applies to the Company. At this time the Company
is unable to estimate whether it will incur a liability or the range of any such
liability in this matter.
In re Merix Securities Litigation –
The Company has been named as a defendant in a purported class action
suit brought in connection with an offering in January 2004 involving Merix
Corporation in which it served as co-lead manager for Merix. On
September 15, 2005, the United States District Court for the District of
Oregon entered an order dismissing all claims against the underwriter
defendants, including the Company, and the Merix defendants. A portion of the
claim under Section 12(a)(2) of the Exchange Act was dismissed with
prejudice, and the remainder of that claim and the Section 11 claim were
dismissed with leave to re-file. Plaintiffs subsequently filed an amended
complaint and on September 28, 2006 the Court dismissed the remaining
claims with prejudice. Following the September 28, 2006 dismissal,
plaintiffs filed a notice of appeal to the United States Court of Appeals for
the Ninth Circuit and the dismissal has now been overturned by the appellate
court. The parties have now re-started the litigation process and begun formal
discovery. The Company believes it has meritorious defenses to these actions and
intends to vigorously defend such actions as they apply to the Company. At this time the Company
is unable to estimate whether it will incur a liability or the range of any such
liability in this matter.
In re Noah Educational Holdings,
Ltd. Securities
Litigation – The
Company has been named as a defendant in a purported class action litigation
brought in connection with an initial public offering of Noah Educational
Holdings, Ltd. in October 2007 where it acted as a co-manager. The complaint,
apparently filed in the United States District Court for the Southern District
of New York, alleges violations of Federal securities laws against Noah
Educational and the underwriters, including the Company, based on alleged
misstatements and omissions in the registration statement. The Company believes
it has meritorious defenses to the action and intends to vigorously defend such
action as it applies to the Company. At this time the Company
is unable to estimate whether it will incur a liability or the range of any such
liability in this matter.
In re Orion Energy Systems, Inc.
Securities Litigation – The Company has been named as a defendant in a
purported class action lawsuit filed in February 2008 arising out of the
December 2007 initial public offering of Orion Energy Systems, Inc. where the
Company acted as the sole book manager. The complaint, filed in the United
States District Court for the Southern District of New York, alleges violations
of Federal securities laws against Orion, various officers and directors, as
well as Orion’s underwriters, including the Company, based on alleged
misstatements and omissions in the disclosure documents for the offering. The
Company believes it has meritorious defenses to these actions and intends to
vigorously defend such actions as they apply to the Company. At this time the Company
is unable to estimate whether it will incur a liability or the range of any such
liability in this matter.
In re Rigel Pharmaceuticals Inc.
Securities Litigation – The Company has been named as a defendant in a
purported class action litigation brought in connection with a February 2008
secondary offering of Rigel Pharmaceuticals where the Company acted as a
co-manager. The complaint was filed in the United States District Court,
Northern District of California, and alleges violations of Federal securities
laws against Rigel Pharmaceuticals, its officers and underwriters, including the
Company, based on alleged misstatements and omissions in the registration
statement. The court granted the Company’s motion to dismiss in its entirety on
December 21, 2009 and granted Plaintiffs’ leave to amend their complaint. The
Company believes it has meritorious defenses to these actions and intends to
vigorously defend such actions as they apply to the Company. At this time the Company
is unable to estimate whether it will incur a liability or the range of any such
liability in this matter.
In re Virgin Mobile USA, Inc.
Securities Litigation – The Company has been named as a defendant in one
of two purported class action lawsuits filed in November 2007 arising out of the
October 2007 initial public offering of Virgin Mobile USA, Inc. where the
Company acted as a co-manager. The complaints, filed in the United States
District Courts for New Jersey and the Southern District of New York, allege
violations of Federal securities laws against Virgin Mobile, various officers
and directors as well as Virgin Mobile’s underwriters, including the Company,
based on alleged misstatements and omissions in the disclosure documents for the
offering. The parties have agreed to transfer and consolidate the matters in the
United States District Court for the Southern District of New York. The Company
believes it has meritorious defenses to these actions and intends to vigorously
defend such actions as they apply to the Company. At this time the Company
is unable to estimate whether it will incur a liability or the range of any such
liability in this matter.
Stetson Oil & Gas, Ltd. v.
Thomas Weisel Partners Canada Inc. – Thomas Weisel Partners Canada Inc.
has been named as defendant in a Statement of Claim filed in the Ontario
Superior Court of Justice. The claim arises out of the July 2008 “bought deal”
transaction in which Thomas Weisel Partners Canada Inc. was allegedly engaged to
act as underwriter (purchasing subscription receipts amounting to approximately
CDN$25 million) for Stetson Oil & Gas, Ltd., an Alberta, Canada oil and gas
exploration corporation. In May 2009, Thomas Weisel Partners Canada, Inc. filed
its Statement of Defense and Counterclaim. The Company believes Thomas Weisel
Partners Canada Inc. has meritorious defenses to these actions and intends to
vigorously defend such actions as they apply to the Company and its affiliates.
While our review of the need and amount for any loss contingency reserve has led
us to conclude that, based upon currently available information, we have
adequately established a provision for loss contingencies related to this
matter, we are not able to predict with certainty the outcome of this matter,
nor the amount if any, of an eventual settlement or judgment.
In re Initial Public Offering
Securities Litigation – The Company is a defendant in several purported
class actions brought against numerous underwriters in connection with certain
initial public offerings in 1999 and 2000. These cases have been consolidated in
the United States District Court for the Southern District of New York and
generally allege that underwriters accepted undisclosed compensation in
connection with the offerings, entered into arrangements designed to influence
the price at which the shares traded in the aftermarket and improperly allocated
shares in these offerings. The actions allege violations of Federal securities
laws and seek unspecified damages. Of the 310 issuers named in these cases, the
Company acted as a co-lead manager in one offering, a co-manager in 32
offerings, and as a syndicate member in 10 offerings. The Company has denied
liability in connection with these matters. On June 10, 2004, plaintiffs
entered into a definitive settlement agreement with respect to their claims
against the issuer defendants and the issuers’ present or former officers and
directors named in the lawsuits, however, approval of the proposed settlement
remained on hold pending the resolution of the class certification issue
described below. By a decision dated October 13, 2004, the Federal district
court granted plaintiffs’ motion for class certification, however, the
underwriter defendants petitioned the United States. Court of Appeals for the
Second Circuit to review that certification decision. On December 5, 2006
the Second Circuit vacated the district court’s class certification decision,
and the plaintiffs subsequently petitioned the Second Circuit for a rehearing.
On April 6, 2007, the Second Circuit denied the rehearing request. In May
2007, the plaintiffs filed a motion for class certification on a new basis and
subsequently scheduled discovery. In April 2009, the parties entered into a
comprehensive settlement agreement that was submitted to the Court which
resulted in the resolution of this matter for a payment of $10.6 million which
had been previously accrued in the consolidated statements of financial
condition. The payment was funded by the Company’s insurance
syndicate.
In re Occam Networks
Litigation – The Company has been named as a defendant in a purported
class action lawsuit filed in November 2006 in connection with a secondary
offering of common stock by Occam Networks in November 2006 where the Company
acted as sole book manager. The amended complaint was filed in the United States
District Court, for the Central District of California, and alleges violations
of Federal securities laws against Occam Networks, various officers and
directors as well as the Occam Networks underwriters, including the Company,
based on alleged misstatements and omissions in the disclosure documents for the
offering. The matter has now been settled by the issuer with no
contribution from the underwriter defendants, including the Company, however,
one investor group has indicated that they will not be participating in the
settlement and the issuer will now have to determine whether to forego the
settlement entirely or allow the investor group to proceed on their
own.
In re Openwave Systems Inc.
Securities Litigation – The Company has been named as a defendant in a
purported class action lawsuit filed in June 2007 in connection with a secondary
offering of common stock by Openwave Systems’ in December 2005 where the Company
acted as a co-manager. The complaint, filed in the United States District Court
for the Southern District of New York, alleges violations of Federal securities
laws against Openwave Systems, various officers and directors as well as
Openwave Systems’ underwriters, including the Company, based on alleged
misstatements and omissions in the disclosure documents for the offering. The
underwriters’ motion to dismiss was granted in October 2007, however, the
plaintiffs may appeal the dismissal. The Company believes it has meritorious
defenses to the action and intends to vigorously defend such action as it
applies to the Company.
In re Netlist, Inc. Securities
Litigation – The Company has been named as a defendant in an amended
complaint for a purported class action lawsuit filed in November 2007 in
connection with the initial public offering of Netlist in November 2006 where
the Company acted as a lead manager. The amended complaint, filed in the United
States District Court for the Central District of California, alleges violations
of Federal securities laws against Netlist, various officers and directors as
well as Netlist’s underwriters, including the Company, based on alleged
misstatements and omissions in the disclosure documents for the offering. The
complaint essentially alleges that the registration statement relating to
Netlist’s initial public offering was materially false and misleading. The
Company denies liability in connection with this matter and has filed a motion
to dismiss that was granted without prejudice by the court. Plaintiffs have now
filed an amended complaint and the Company has now filed another motion to
dismiss. The Company believes it has meritorious defenses to the action and
intends to vigorously defend such action as it applies to the
Company.
In re Vonage Holdings Corp.
Securities Litigation – The Company is a defendant named in purported
class action lawsuits filed in June 2006 arising out of the May 2006
initial public offering of Vonage Holdings Corp. where the Company acted as a
co-manager. The complaints, filed in the United States District Court for the
District of New Jersey and in the Supreme Court of the State of New York, County
of Kings, allege misuse of Vonage’s directed share program and violations of
Federal securities laws against Vonage and certain of its directors and senior
officers as well as Vonage’s underwriters, including the Company, based on
alleged false and misleading statements in the registration statement and
prospectus. In January 2007, the plaintiffs’ complaints were transferred to
the U.S. District Court for the District of New Jersey and the defendants filed
motions to dismiss. In 2009, the court issued an order dismissing all claims
against the underwriters, with leave to re-file certain of those claims. The
Company believes it has meritorious defenses to these actions and intends to
vigorously defend such actions as they apply to the Company.
Lev Mass v. Thomas Weisel Partners
LLC – The Company has been named a defendant in a purported class action
lawsuit filed in July 2008 with respect to the alleged misclassification of
certain employees as exempt from provisions of California state law requiring
the payment of overtime wages. The complaint was filed in the California
Superior Court for the County of San Francisco. The Company has now been granted
summary judgment on Mass's individual state law claims, the court has dismissed
the state law claims asserted on behalf of the class without prejudice and
denied without prejudice Mass's motion for leave to amend to add Fair Labor
Standards Act claims.
NOTE
17 – FINANCIAL INSTRUMENTS WITH OFF-BALANCE SHEET RISK, CREDIT RISK OR MARKET
RISK
The
majority of the Company’s transactions, and consequently the concentration of
its credit exposure, is with its clearing brokers. The clearing brokers are also
the primary source of short-term financing for both securities purchased and
securities sold, not yet purchased by the Company. The securities owned by the
Company may be pledged by the clearing brokers. The amount receivable from or
payable to the clearing brokers in the Company’s consolidated statements of
financial condition represent amounts receivable or payable in connection with
the trading of proprietary positions and the clearance of customer securities
transactions. As of December 31, 2009 and 2008, the Company had cash on deposit
of $60.8 million and $69.3 million, respectively, with the clearing brokers that
was not collateralizing any liabilities to the clearing brokers.
In
addition to the clearing brokers, the Company is exposed to credit risk from
other brokers, dealers and other financial institutions with which it transacts
business. In the event counterparties do not fulfill their obligations, the
Company may be exposed to credit risk. The Company seeks to control credit risk
by following an established credit approval process and monitoring credit limits
with counterparties.
The
Company’s trading activities include providing securities brokerage services to
institutional and retail clients. To facilitate these customer transactions, the
Company may purchase, or take positions in equity securities (“long positions”),
convertible bonds, other fixed income securities and equity index funds. The
Company also enters into transactions to sell securities not yet purchased
(“short positions”), which are recorded as liabilities in the consolidated
statements of financial condition. The Company is exposed to market risk on
these long and short securities positions as a result of decreases in market
value of long positions and increases in market value of short positions. Short
positions create a liability to purchase the security in the market at
prevailing prices. Such transactions result in off-balance sheet market risk as
the Company’s ultimate obligation to satisfy the sale of securities sold not yet
purchased may exceed the amount recorded in the consolidated statements of
financial condition. To mitigate the risk of losses, these securities positions
are marked to market daily and are monitored by management to ensure compliance
with limits established by the Company. The associated interest rate risk of
these securities is not deemed material to the Company.
The
Company is also exposed to market risk through its investments in partnerships
and other investments and through certain loans to employees collateralized by
such investments. In addition, as part of the Company’s investment banking and
asset management activities, the Company from time to time takes long and short
positions in publicly traded equities and related options and other derivative
instruments and makes private equity investments, all of which expose the
Company to market risk. These activities are subject, as applicable, to risk
guidelines and procedures designed to manage and monitor market
risk.
NOTE
18 – REGULATED BROKER-DEALER SUBSIDIARIES
TWP is a
registered U.S. broker-dealer that is subject to the Uniform Net Capital Rule
(the “Net Capital Rule”) under the Exchange Act administered by the Securities
and Exchange Commission (“SEC”) and FINRA, which requires the maintenance of
minimum net capital. TWP has elected to use the alternative method to compute
net capital as permitted by the Net Capital Rule, which requires that TWP
maintain minimum net capital, as defined, of $1.0 million. These rules also
require TWP to notify and sometimes obtain approval from the SEC and FINRA for
significant withdrawals of capital or loans to affiliates.
Under the
alternative method, a broker-dealer may not repay subordinated borrowings, pay
cash dividends or make any unsecured advances or loans to its parent or
employees if such payment would result in net capital of less than 5% of
aggregate debit balances or less than 120% of its minimum dollar amount
requirement.
TWPC
is a registered investment dealer in Canada and is subject to the capital
requirements of the IIROC.
TWPIL is
a registered U.K. broker-dealer and is subject to the capital requirements of
the Financial Securities Authority.
The table
below summarizes the minimum capital requirements for the Company’s
broker-dealer subsidiaries (in
thousands):
|
December
31, 2009
|
||||||||||||
|
Required
Net Capital
|
Net
Capital
|
Excess
Net Capital
|
||||||||||
|
TWP
|
$
|
1,000
|
$
|
31,112
|
$
|
30,112
|
||||||
|
TWPC
|
238
|
12,533
|
12,295
|
|||||||||
|
TWPIL
|
1,119
|
2,870
|
1,751
|
|||||||||
|
Total
|
$
|
2,357
|
$
|
46,515
|
$
|
44,158
|
||||||
|
December
31, 2008
|
||||||||||||
|
Required
Net Capital
|
Net
Capital
|
Excess
Net Capital
|
||||||||||
|
TWP
|
$
|
1,000
|
$
|
41,867
|
$
|
40,867
|
||||||
|
TWPC
|
203
|
10,822
|
10,619
|
|||||||||
|
TWPIL
|
1,469
|
1,794
|
325
|
|||||||||
|
Total
|
$
|
2,672
|
$
|
54,483
|
$
|
51,811
|
||||||
TWP is
not required to calculate a reserve requirement and segregate funds for the
benefit of customers since it clears its securities transactions on a fully
disclosed basis and promptly transmits all customer funds and securities to the
clearing brokers.
Proprietary
balances of TWP, the introducing broker-dealer (“PAIB assets”), held at the
clearing brokers are considered allowable assets for net capital purposes,
pursuant to agreements between TWP and the clearing brokers, which require,
among other things, that the clearing brokers perform computations for PAIB
assets and segregate certain balances on behalf of TWP, if
applicable.
NOTE
19 — SEGMENT INFORMATION
The
following table represents net revenues by geographic area (in thousands):
|
Year
Ended December 31,
|
||||||||||||
|
2009
|
2008
|
2007
|
||||||||||
|
United
States
|
$
|
139,838
|
$
|
161,321
|
$
|
289,040
|
||||||
|
Other
countries
|
55,218
|
28,206
|
9
|
|||||||||
|
Total
net revenues
|
$
|
195,056
|
$
|
189,527
|
$
|
289,049
|
||||||
No single
customer accounted for more than 10% of the Company’s net revenues during the
years ended December 31, 2009, 2008 and 2007.
Net
revenues from countries other than the United States during the years ended
December 31, 2009 and 2008 consists primarily of net revenues from Canada, which
accounted for 77% and 75%, respectively, of net revenues from other
countries.
The
following table represents long lived assets, excluding other intangible assets,
by geographic area based on the physical location of the assets (in thousands):
|
December
31,
|
||||||||
|
2009
|
2008
|
|||||||
|
United
States
|
$
|
11,603
|
$
|
17,261
|
||||
|
Other
countries
|
3,250
|
3,320
|
||||||
|
Total
long lived assets—net
|
$
|
14,853
|
$
|
20,581
|
||||
The
following table presents the Company’s unaudited quarterly results (in thousands, except per share
data). These quarterly results were prepared in accordance with GAAP and
reflect all adjustments that are, in the opinion of management, necessary for a
fair statement of the results.
|
Three
Months Ended
|
||||||||||||||||
|
March
31
|
June
30
|
September
30
|
December
31
|
|||||||||||||
|
Fiscal
Year 2009:
|
||||||||||||||||
|
Net
revenues
|
$
|
43,099
|
$
|
48,286
|
$
|
43,554
|
$
|
60,117
|
||||||||
|
Expenses
excluding interest:
|
||||||||||||||||
|
Compensation
and benefits
|
30,678
|
30,061
|
27,312
|
45,304
|
||||||||||||
|
Non-compensation
expenses
|
35,434
|
29,141
|
30,297
|
30,678
|
||||||||||||
|
Total
expenses excluding interest
|
66,112
|
59,202
|
57,609
|
75,982
|
||||||||||||
|
Loss
before tax
|
(23,013
|
)
|
(10,916
|
)
|
(14,055
|
)
|
(15,865
|
)
|
||||||||
|
Provision
for taxes (tax benefit)
|
840
|
(706
|
)
|
336
|
(641
|
)
|
||||||||||
|
Net
loss
|
$
|
(23,853
|
)
|
$
|
(10,210
|
)
|
$
|
(14,391
|
)
|
$
|
(15,224
|
)
|
||||
|
Net
loss per share:
|
||||||||||||||||
|
Basic
net loss per share
|
$
|
(0.74
|
)
|
$
|
(0.31
|
)
|
$
|
(0.44
|
)
|
$
|
(0.46
|
)
|
||||
|
Diluted
net loss per share
|
$
|
(0.74
|
)
|
$
|
(0.31
|
)
|
$
|
(0.44
|
)
|
$
|
(0.46
|
)
|
||||
|
Fiscal
Year 2008:
|
||||||||||||||||
|
Net
revenues
|
$
|
48,924
|
$
|
60,014
|
$
|
49,046
|
$
|
31,543
|
||||||||
|
Expenses
excluding interest:
|
||||||||||||||||
|
Compensation
and benefits
|
40,389
|
41,788
|
36,869
|
28,140
|
||||||||||||
|
Non-compensation
expenses
|
34,987
|
35,112
|
131,656
|
36,138
|
||||||||||||
|
Total
expenses excluding interest
|
75,376
|
76,900
|
168,525
|
64,278
|
||||||||||||
|
Loss
before tax
|
(26,452
|
)
|
(16,886
|
)
|
(119,479
|
)
|
(32,735
|
)
|
||||||||
|
Provision
for taxes (tax benefit)
|
(8,647
|
)
|
(6,759
|
)
|
(10,300
|
)
|
33,406
|
|||||||||
|
Net
loss
|
$
|
(17,805
|
)
|
$
|
(10,127
|
)
|
$
|
(109,179
|
)
|
$
|
(66,141
|
)
|
||||
|
Net
loss per share:
|
||||||||||||||||
|
Basic
net loss per share
|
$
|
(0.54
|
)
|
$
|
(0.31
|
)
|
$
|
(3.41
|
)
|
$
|
(2.08
|
)
|
||||
|
Diluted
net loss per share
|
$
|
(0.54
|
)
|
$
|
(0.31
|
)
|
$
|
(3.41
|
)
|
$
|
(2.08
|
)
|
||||
NOTE
21 – SUBSEQUENT EVENT
As
previously disclosed, the Company has received inquiries from FINRA for
information concerning the Company’s activities involving ARS. On July 23, 2009,
the Staff advised the Company that the Staff has made a preliminary
determination to recommend disciplinary action against the Company relating to
certain activities involving ARS.
The
Company has responded to the Staff’s preliminary determination and continues to
communicate with the Staff in an effort to try to resolve the matter.
Based upon its discussions with the Staff, the Company believes that it
has reached an understanding in principle, subject to documenting that
understanding in a letter of acceptance, waiver and consent acceptable to FINRA,
that would resolve all aspects of the investigation of the Company. In
light of the terms of that agreement in principle, the Company has
established in total a $4.0 million provision for loss contingencies
related to the FINRA investigation, all of which would be paid to FINRA as a
fine in connection with the resolution of all aspects of the investigation of
the Company.
Further
discussion of this matter is included in the description of legal proceedings
contained in Note 16 – Commitments, Guarantees and
Contingencies.
Pursuant
to the requirements of Section 13 or 15(d) of the Securities Exchange Act
of 1934, the Registrant has duly caused this report to be signed on its behalf
by the undersigned, thereunto duly authorized.
THOMAS WEISEL PARTNERS GROUP,
INC.
By: /s/ Thomas W.
Weisel
Name: Thomas
W. Weisel
Title:
Chairman and Chief Executive Officer
Date:
March 12, 2010
KNOW ALL
PERSONS BY THESE PRESENTS, that each person whose signature appears below
constitutes and appoints Thomas W. Weisel, Ryan Stroub and Mark P.
Fisher, and each of them, his true and lawful attorneys-in-fact and agents, with
full power of substitution and resubstitution, for him and in his name, place
and stead, in any and all capacities, to sign any and all amendments to this
Annual Report on Form 10-K and to file the same, with all exhibits thereto,
and all other documents in connection therewith, with the Securities and
Exchange Commission, granting unto each said attorney-in-fact and agents full
power and authority to do and perform each and every act in person, hereby
ratifying and confirming all that said attorneys-in-fact and agents or either of
them or their or his substitute or substitutes may lawfully do or cause to be
done by virtue hereof.
Pursuant
to the requirements of the Securities Exchange Act of 1934, this report has been
signed below by the following persons on behalf of the Registrant and in the
capacities and on the dates indicated.
|
Signature
|
Title
|
Date
|
|
/s/
Thomas W. Weisel
|
Director,
Chairman and Chief Executive Officer
(principal
executive officer)
|
March 12,
2010
|
|
Thomas
W. Weisel
|
||
|
/s/
Ryan Stroub
|
Chief
Financial Officer
(principal
financial officer)
|
March 12,
2010
|
|
Ryan
Stroub
|
||
|
/s/
Thomas I.A. Allen
|
Director
|
March 12,
2010
|
|
Thomas
I.A. Allen
|
||
|
Director
|
|
|
|
Matthew
R. Barger
|
||
|
/s/
Michael W. Brown
|
Director
|
March 12,
2010
|
|
Michael
W. Brown
|
||
|
/s/
Robert E. Grady
|
Director
|
March 12,
2010
|
|
Robert
E. Grady
|
||
|
Director
|
|
|
|
B.
Kipling Hagopian
|
||
|
/s/
Alton F. Irby III
|
Director
|
March 12,
2010
|
|
Alton
F. Irby III
|
||
| /s/ Timothy A. Koogle |
Director
|
March 12, 2010
|
|
Timothy
A. Koogle
|
|
|
Incorporated
by Reference
|
|||||||||||||
|
Exhibit
|
File
|
Date
of
|
Exhibit
|
Filed
|
||||||||||
|
Number
|
Exhibit
Description
|
Form
|
Number
|
First
Filing
|
Number
|
Herewith
|
||||||||
|
2.1
|
Plan
of Reorganization and Merger Agreement, dated as of October 14, 2005,
by and among Thomas Weisel Partners Group LLC, Thomas Weisel Partners
Group, Inc. and TWPG Merger Sub LLC
|
S-1/A
|
333-129108
|
12/13/2005
|
2.1
|
|||||||||
|
2.2
|
Agreement
and Plan of Merger between Thomas Weisel Partners Group, Inc. and Thomas
Weisel Partners Group LLC
|
10-K
|
000-51730
|
3/29/2006
|
2.2
|
|||||||||
|
2.3
|
Arrangement
Agreement dated as of December 31, 2007 by and among Thomas Weisel
Partners Group, Inc., TWP Acquisition Company (Canada), Inc., Westwind
Capital Corporation, and Lionel Conacher, as Shareholders’
Representative
|
8-K
|
000-51730
|
10/1/2007
|
2.1
|
|||||||||
|
3.1
|
Certificate
of Incorporation
|
S-1
|
333-129108
|
10/19/2005
|
3.1
|
|||||||||
|
3.2
|
By-Laws
|
S-1
|
333-129108
|
10/19/2005
|
3.2
|
|||||||||
|
3.3
|
Certificate
of Designations, Preferences and Rights of the Special Voting Preferred
Stock of Thomas Weisel Partners Group, Inc.
|
8-K
|
000-51730
|
1/1/2008
|
3.3
|
|||||||||
|
4.1
|
Form
of Common Stock Certificate
|
10-K
|
000-51730
|
3/29/2006
|
4.1
|
|||||||||
|
4.2
|
Registration
Rights Agreement
|
10-K
|
000-51730
|
3/29/2006
|
4.2
|
|||||||||
|
4.3
|
Warrant
|
10-K
|
000-51730
|
3/29/2006
|
4.3
|
|||||||||
|
10.1
|
Partners’
Equity Agreement
|
10-K
|
000-51730
|
3/29/2006
|
10.1
|
|||||||||
|
10.2+
|
Form
of Employment Agreement
|
S-1/A
|
333-129108
|
1/17/2006
|
10.2
|
|||||||||
|
10.3
|
Form
of Pledge Agreement
|
S-1/A
|
333-129108
|
1/17/2006
|
10.3
|
|||||||||
|
10.4+
|
Equity
Incentive Plan
|
S-1/A
|
333-129108
|
2/1/2006
|
10.4
|
|||||||||
|
10.5+
|
Amended
and Restated Equity Incentive Plan
|
10-Q
|
000-51730
|
8/10/2007
|
10.1
|
|||||||||
|
10.6+
|
Second
Amended and Restated Thomas Weisel Partners Group, Inc. Equity Incentive
Plan
|
10-Q
|
000-51730
|
8/8/2008
|
10.1
|
|||||||||
|
10.7+
|
Third
Amended and Restated Thomas Weisel Partners Group, Inc. Equity Incentive
Plan
|
10-K
|
000-51730
|
3/16/09
|
10.7
|
|||||||||
|
10.8
|
Form
of Indemnification Agreement
|
S-1/A
|
333-129108
|
1/17/2006
|
10.5
|
|||||||||
|
10.9
|
Form
of Tax Indemnification Agreement
|
S-1/A
|
333-129108
|
1/17/2006
|
10.6
|
|||||||||
|
10.10+
|
Thomas
Weisel Partners Group, Inc. Bonus Plan
|
S-1/A
|
333-129108
|
2/1/2006
|
10.16
|
|||||||||
|
10.11+
|
Form
of Restricted Stock Unit Award Agreement
|
S-1/A
|
333-129108
|
2/1/2006
|
10.17
|
|||||||||
|
10.12+
|
Form
of Restricted Stock Award Agreement
|
S-1/A
|
333-129108
|
2/1/2006
|
10.18
|
|||||||||
|
10.13+
|
Form
of Performance Award Agreement
|
8-K
|
000-51730
|
6/11/2008
|
99.1
|
|||||||||
|
10.14+
|
Form
of Equity Incentive Plan Performance Award Agreement (Performance Based,
August 2008)
|
8-K
|
000-51730
|
8/1/2008
|
99.2
|
|||||||||
|
10.15+
|
Form
of Restricted Stock Unit Award Agreement (Time Based, August
2008)
|
8-K
|
000-51730
|
8/1/2008
|
99.3
|
|||||||||
|
10.16+
|
Form
of Restricted Stock Unit Award Agreement
|
8-K
|
000-51730
|
8/1/2008
|
99.4
|
|||||||||
|
10.17+
|
CEO
Employment Agreement
|
10-K
|
000-51730
|
3/29/2006
|
10.19
|
|||||||||
|
10.18+
|
First
Amendment to CEO Employment Agreement
|
10-Q
|
000-51730
|
11/13/2007
|
10.4
|
|||||||||
|
10.19+
|
Amended
and Restated CEO Employment Agreement
|
10-KA
|
000-51730
|
3/17/2009
|
10.19
|
|||||||||
|
10.20+
|
Amendment
No. 1 to Amended and Restated CEO Employment Agreement
|
10-Q
|
000-51730
|
5/8/09
|
10.1
|
|||||||||
|
10.21+
|
President
Employment Agreement
|
8-K
|
000-51730
|
1/1/2008
|
10.3
|
|||||||||
|
Incorporated
by Reference
|
||||||||||||||
|
Exhibit
|
File
|
Date
of
|
Exhibit
|
Filed
|
||||||||||
|
Number
|
Exhibit
Description
|
Form
|
Number
|
First
Filing
|
Number
|
Herewith
|
||||||||
|
10.22+
|
Amended
and Restated President Employment Agreement
|
10-KA
|
000-51730
|
3/17/2009
|
10.21
|
|||||||||
|
10.23+
|
Amendment
No. 1 to Amended and Restated President Employment
Agreement
|
10-Q
|
000-51730
|
5/8/09
|
10.2
|
|||||||||
|
10.24+
|
Agreement,
dated as of February 27, 2009, between Thomas Weisel Partners Group, Inc.
and Lionel F. Conacher
|
10-KA
|
000-51730
|
3/17/2009
|
10.22
|
|||||||||
|
10.25+
|
Form
of Equity Incentive Plan Restricted Stock Unit Award Agreement to Lionel
F. Conacher
|
10-KA
|
000-51730
|
3/17/2009
|
10.23
|
|||||||||
|
10.26+
|
President’s
Employment Agreement
|
8-K
|
000-51730
|
7/29/09
|
10.1
|
|||||||||
|
10.27+
|
Relocation
Letter
|
8-K
|
000-51730
|
7/29/09
|
10.2
|
|||||||||
|
10.28+
|
Side
Letter
|
8-K
|
000-51730
|
7/29/09
|
10.3
|
|||||||||
|
10.29+
|
Option
Award Agreement
|
10-Q
|
000-51730
|
8/7/09
|
10.7
|
|||||||||
|
10.30
|
Letter
Agreement, dated as of January 27, 2006, between Thomas Weisel
Partners Group LLC and California Public Employees’ Retirement
System
|
S-1/A
|
333-129108
|
2/1/2006
|
10.14
|
|||||||||
|
10.31
|
Fully
Disclosed Clearing Agreement dated as of August 15, 2005 by and
between National Financial Services LLC and Thomas Weisel Partners
LLC
|
10-Q
|
000-51730
|
5/8/2006
|
10.12
|
|||||||||
|
10.32
|
Amendments
to the Fully Disclosed Clearing Agreement dated as of August 15, 2005 by
and between National Financial Services LLC and Thomas Weisel Partners
LLC
|
10-Q
|
000-51730
|
8/10/2007
|
10.2
|
|||||||||
|
10.33
|
Subscription
Agreement, dated as of January 18, 2000, between Thomas Weisel Partners
Group LLC and California Public Employees’ Retirement System, as
amended
|
S-1/A
|
333-129108
|
12/13/2005
|
10.13
|
|||||||||
|
10.34
|
Alliance
Agreement, dated as of November 14, 2001, among Nomura Securities Co.,
Ltd., Nomura Corporate Advisors Co., Ltd., Nomura Holding America Inc. and
Thomas Weisel Partners Group LLC
|
S-1/A
|
333-129108
|
12/13/2005
|
10.15
|
|||||||||
|
10.35
|
Revolving
Note and Cash Subordination Agreement
|
10-Q
|
000-51730
|
5/8/09
|
10.3
|
|||||||||
|
10.36
|
Lease,
dated as of December 7, 1998, between Post-Montgomery Associates and
Thomas Weisel Partners Group LLC, as amended by the First Amendment dated
as of June 11, 1999, the Second Amendment dated as of June 11, 1999, the
Third Amendment dated as of June 30, 1999, the Fourth Amendment dated as
of September 27, 1999, the Fifth Amendment dated as of November 19, 1999,
the Sixth Amendment dated as of June 9, 2000, the Seventh Amendment dated
as of July 31, 2000, the Eighth Amendment dated as of October 1, 2000, the
Ninth Amendment dated as of December 18, 2000, the Tenth Amendment dated
as of July 31, 2003 and the Eleventh Amendment dated as of February 5,
2004
|
S-1/A
|
333-129108
|
12/13/2005
|
10.7
|
|||||||||
|
Incorporated
by Reference
|
||||||||||||||
|
Exhibit
|
File
|
Date
of
|
Exhibit
|
Filed
|
||||||||||
|
Number
|
Exhibit
Description
|
Form
|
Number
|
First
Filing
|
Number
|
Herewith
|
||||||||
|
10.37
|
Lease,
dated as of January 10, 2000, between Teachers Insurance and Annuity
Association of America and Thomas Weisel Partners Group LLC, as amended by
the First Amendment dated as of February 1, 2000, the Second Amendment
dated as of June 21, 2000 and the Third Amendment dated as of October 29,
2003
|
S-1/A
|
333-129108
|
12/13/2005
|
10.8
|
|||||||||
|
10.38
|
Lease,
dated as of June 21, 2000, between Teachers Insurance and Annuity
Association of America and Thomas Weisel Partners Group LLC, as amended by
the First Amendment dated as of April 20, 2001 and the Second Amendment
dated as of October 8, 2003
|
S-1/A
|
333-129108
|
12/13/2005
|
10.9
|
|||||||||
|
10.39
|
Lease,
dated May 5, 1999, between 390 Park Avenue Associates, LLC and Thomas
Weisel Partners Group LLC, as amended by the Letter Agreement dated as of
June 3, 1999, the Lease Amendment dated as of October 1, 19999 and the
Third Lease Amendment dated as of May 3, 2000
|
S-1/A
|
333-129108
|
12/13/2005
|
10.10
|
|||||||||
|
10.40
|
Lease,
dated as of June 30, 1999, between Fort Hill Square Phase 2 Associates and
Thomas Weisel Partners Group LLC, as amended by the First Amendment dated
as of October 25, 1999, the Second Amendment dated as of June 12, 2000 and
the Third Amendment dated as of January 8, 2002
|
S-1
|
333-129108
|
10/19/2005
|
10.11
|
|||||||||
|
10.41
|
Lease,
dated as of November 9, 2006, between Moss Adams LLP and Thomas Weisel
Partners Group, Inc.
|
10-K
|
000-51730
|
3/16/2007
|
10.21
|
|||||||||
|
10.42
|
Lease,
dated as of December 31, 2007, between SP4 190 S. LASALLE, L.P. and Thomas
Weisel Partners Group, Inc.
|
10-Q
|
000-51730
|
8/10/2007
|
10.3
|
|||||||||
|
10.43
|
Lease,
dated as of August 1, 2007, between Farallon Capital Management, L.L.C and
Thomas Weisel Partners Group, Inc.
|
10-Q
|
000-51730
|
11/13/2007
|
10.5
|
|||||||||
|
10.44
|
Lease,
dated as of September 1, 2007, between Schweizerische
Rückversicherungs-Gesellschaft, and Thomas Weisel Partners International
Limited
|
10-Q
|
000-51730
|
11/13/2007
|
10.6
|
|||||||||
|
10.45
|
Sublease,
dated as of July 30, 2004, between Dewey Ballantine LLP and Thomas Weisel
Partners Group LLC
|
S-1
|
333-129108
|
10/19/2005
|
10.12
|
|||||||||
|
10.46
|
Sublease,
dated as of November 30, 2006, between Arastra, Inc. and Thomas Weisel
Partners Group, Inc.
|
10-K
|
000-51730
|
3/16/2007
|
10.23
|
|||||||||
|
10.47
|
Sublease,
dated as of November 30, 2006, between Cedar Associates LLC and Thomas
Weisel Partners Group, Inc.
|
10-K
|
000-51730
|
3/16/2007
|
10.24
|
|||||||||
|
Incorporated
by Reference
|
|||||||||||||||
|
Exhibit
|
File
|
Date
of
|
Exhibit
|
Filed
|
|||||||||||
|
Number
|
Exhibit
Description
|
Form
|
Number
|
First
Filing
|
Number
|
Herewith
|
|||||||||
|
10.48
|
Sublease,
dated as of November 27, 2006, between The Alexander Group, Inc. and
Thomas Weisel Partners Group, Inc.
|
10-K
|
000-51730
|
3/16/2007
|
10.25
|
||||||||||
|
10.49
|
Sublease,
dated as of November 30, 2006, between Gyrographic Communications Inc. and
Thomas Weisel Partners Group, Inc.
|
10-K
|
000-51730
|
3/16/2007
|
10.26
|
||||||||||
|
10.50
|
License
to Assign Underlease, dated as of October 15, 2007, between Oppenheim
Immobilien-Kapitalanlagegesellschaft mbH to Fox Williams LLP and Bache
Equities Limited and Thomas Weisel Partners International Limited and
Thomas Weisel Partners Group, Inc.
|
10-K
|
000-51730
|
3/17/2008
|
10.33
|
||||||||||
|
10.51
|
Leave
and License Agreement, dated as of December 2, 2005, between Tivoli
Investments & Trading Company Private Limited and Thomas Weisel
International Private Limited
|
S-1/A
|
333-129108
|
1/17/2006
|
10.25
|
||||||||||
|
10.52
|
Leave
and License Agreement, dated as of December 2, 2005, between Fitech
Equipments (India) Private Limited and Thomas Weisel International Private
Limited
|
S-1/A
|
333-129108
|
1/17/2006
|
10.26
|
||||||||||
|
10.53
|
Loan
and Security Agreement among Silicon Valley Bank, Thomas Weisel Capital
Management LLC, Thomas Weisel Venture Partners LLC, Thomas Weisel
Healthcare Venture Partners LLC and Tailwind Capital Partners LLC, dated
as of June 30, 2004
|
S-1/A
|
333-129108
|
1/17/2006
|
10.20
|
||||||||||
|
10.54
|
Unconditional
Secured Guaranty by Thomas Weisel Partners Group LLC to Silicon Valley
Bank, dated June 15, 2004
|
S-1/A
|
333-129108
|
1/17/2006
|
10.21
|
||||||||||
|
10.55
|
Master
Security Agreement between General Electric Capital Corporation and Thomas
Weisel Partners Group LLC, dated as of December 31, 2003, as amended by
the Amendment dated as of November 30, 2005, the Financial Covenants
Addendum No. 1 to Master Security Agreement, dated as of December 31,
2003, and the Financial Covenants Addendum No. 2 to Master Security
Agreement, dated as of November 30, 2005
|
S-1/A
|
333-129108
|
1/17/2006
|
10.22
|
||||||||||
|
10.56
|
Westwind
Capital Corporation Shareholders’ Equity Agreement dated as of December
31, 2007 by and among Thomas Weisel Partners Group, Inc. and Certain
Former Shareholders of Westwind Capital Corporation
|
8-K
|
000-51730
|
1/1/2008
|
10.1
|
||||||||||
|
10.57
|
Form
of Pledge Agreement dated as of December 31, 2007 by and among Thomas
Weisel Partners Group, Inc., TWP Holdings Company (Canada), ULC, TWPG
Acquisition Company (Canada), Inc., and The Individual Named
Herein
|
8-K
|
000-51730
|
1/1/2008
|
10.2
|
||||||||||
|
Incorporated
by Reference
|
|||||||||||||||
|
Exhibit
|
File
|
Date
of
|
Exhibit
|
Filed
|
|||||||||||
|
Number
|
Exhibit
Description
|
Form
|
Number
|
First
Filing
|
Number
|
Herewith
|
|||||||||
|
21.1
|
List
of Subsidiaries of the Registrant
|
—
|
—
|
—
|
—
|
X
|
|||||||||
|
23.1
|
Consent
of Deloitte & Touche LLP
|
—
|
—
|
—
|
—
|
X
|
|||||||||
|
24.1*
|
Power
of Attorney
|
—
|
—
|
—
|
—
|
||||||||||
|
31.1
|
Rule 13a-14(a)
Certification of Chief Executive Officer
|
—
|
—
|
—
|
—
|
X
|
|||||||||
|
31.2
|
Rule 13a-14(a)
Certification of Chief Financial Officer
|
—
|
—
|
—
|
—
|
X
|
|||||||||
|
32.1
|
Section 1350
Certification of Chief Executive Officer
|
—
|
—
|
—
|
—
|
X
|
|||||||||
|
32.2
|
Section 1350
Certification of Chief Financial Officer
|
—
|
—
|
—
|
—
|
X
|
|||||||||
______________________
+ Indicates
a management contract or a compensatory arrangement.
* Included
on signature page of this filing.