Attached files
Table of Contents
United States
Securities and Exchange Commission
Washington, D.C. 20549
FORM 10-K
| x | Annual Report Pursuant to Section 13 or 15(d) of the Securities Exchange Act of 1934 |
For the Fiscal Year Ended January 30, 2010
or
| ¨ | Transition Report Pursuant to Section 13 or 15(d) of the Securities Exchange Act of 1934 |
Commission file number 000-51217
SEARS HOLDINGS CORPORATION
(Exact Name of Registrant as Specified in Its Charter)
| Delaware | 20-1920798 | |
| (State of Incorporation) | (I.R.S. Employer Identification No.) |
| 3333 Beverly Road, Hoffman Estates, Illinois | 60179 | |
| (Address of principal executive offices) | (Zip Code) |
Registrant’s telephone number, including area code: (847) 286-2500
Securities registered pursuant to Section 12(b) of the Act:
| Title of each class | Name of Each Exchange on Which Registered | |
| Common Shares, par value $0.01 per share | The NASDAQ Stock Market LLC |
Securities registered pursuant to Section 12(g) of the Act:
None
Indicate by check mark if the registrant is a well-known seasoned issuer, as defined in Rule 405 of the Securities Act. Yes x No ¨
Indicate by check mark if the registrant is not required to file reports pursuant to Section 13 or Section 15(d) of the Act. Yes ¨ No x
Indicate by check mark whether the Registrant (1) has filed all reports required to be filed by Section 13 or 15(d) of the Securities Exchange Act of 1934 during the preceding 12 months and (2) has been subject to such filing requirements for the past 90 days. Yes x No ¨
Indicate by check mark whether the registrant has submitted electronically and posted on its corporate Web site, if any, every Interactive Data File required to be submitted and posted pursuant to Rule 405 of Regulation S-T (§ 232.405 of this chapter) during the preceding 12 months (or for such shorter period that the registrant was required to submit and post such files). Yes ¨ No ¨
Indicate by check mark if disclosure of delinquent filers pursuant to Item 405 of Regulation S-K (§229.405 of this chapter) is not contained herein, and will not be contained, to the best of the Registrant’s knowledge, in definitive proxy or information statements incorporated by reference in Part III of this Form 10-K or any amendment to this Form 10-K. ¨
Indicate by check mark whether the Registrant is a large accelerated filer, an accelerated filer, a non-accelerated filer or a smaller reporting company. See the definitions of “large accelerated filer,” “accelerated filer” and “smaller reporting company” in Rule 12b-2 of the Exchange Act.
Large accelerated filer x Accelerated filer ¨ Non-accelerated filer ¨ Smaller reporting company ¨
Indicate by check mark whether the Registrant is a shell company (as defined in Rule 12b-2 of the Exchange Act). Yes ¨ No x
On February 27, 2010, the Registrant had 114,834,071 common shares outstanding. The aggregate market value (based on the closing price of the Registrant’s common shares for stocks quoted on the NASDAQ Global Select Market) of the Registrant’s common shares owned by non-affiliates (which are assumed, solely for the purpose of this calculation, to be stockholders other than (i) directors and executive officers of the Registrant and (ii) any person known by the Registrant to beneficially own five percent or more of the Registrant’s common shares), as of August 1, 2009, the last business day of the Registrant’s most recently completed second fiscal quarter, was approximately $1.8 billion.
Documents Incorporated By Reference
Part III of this Form 10-K incorporates by reference certain information from the Registrant’s definitive proxy statement relating to our Annual Meeting of Stockholders to be held on May 4, 2010 (the “2010 Proxy Statement”), which will be filed with the Securities and Exchange Commission within 120 days after the end of the fiscal year to which this Form 10-K relates.
Table of Contents
PART I
| Item 1. | Business |
General
Sears Holdings Corporation (“Holdings,” “we,” “us,” “our,” or the “Company”) is the parent company of Kmart Holding Corporation (“Kmart”) and Sears, Roebuck and Co. (“Sears”). Holdings was formed as a Delaware corporation in 2004 in connection with the merger of Kmart and Sears (the “Merger”). The Merger, completed on March 24, 2005, combined two of America’s oldest existing retail entities, both with origins dating to the late 1800s. We are a broadline retailer with 2,235 full-line and 1,284 specialty retail stores in the United States operating through Kmart and Sears and 402 full-line and specialty retail stores in Canada operating through Sears Canada Inc. (“Sears Canada”), a 73%-owned subsidiary.
Business Segments
During fiscal 2009, we operated three reportable segments: Kmart, Sears Domestic and Sears Canada. Financial information, including revenues, operating income and total assets for each of these business segments is contained in Note 18 of Notes to Consolidated Financial Statements. Information regarding the components of revenue for Holdings is included in Item 7, “Management’s Discussion and Analysis of Financial Condition and Results of Operations.”
Kmart
As of January 30, 2010, Holdings operated a total of 1,327 Kmart stores across 49 states, Guam, Puerto Rico, and the U.S. Virgin Islands. This store count consists of 1,292 discount stores, averaging 93,000 square feet, and 35 Super Centers, averaging 168,000 square feet, and includes 21 Kmart stores that we have announced plans to close in early 2010. Most Kmart stores are one-floor, free-standing units that carry a wide assortment of general merchandise, including products sold under such well-known labels as Jaclyn Smith and Joe Boxer, and certain proprietary Sears brand products (such as Kenmore, Craftsman, and DieHard brand products) and services. As of January 30, 2010, 274 Kmart stores were selling an assortment of major home appliances, including Kenmore-branded products. Kmart began operating its own footwear business, which had previously been operated by a third party, in January 2009. There are 1,021 Kmart stores that also operate in-store pharmacies. The Super Centers generally operate 24 hours a day and combine a full-service grocery along with the general merchandise selection of a discount store. There are also 20 Sears Auto Centers operating in Kmart stores. Sears Auto Centers offer a variety of professional automotive repair and maintenance services, as well as a full assortment of automotive accessories. Kmart also sells its products through its kmart.com website.
Sears Domestic
As of January 30, 2010, Sears Domestic operations consisted of the following:
| • | Full-line Stores—908 broadline stores, of which 848 are full-line stores located across all 50 states and Puerto Rico, and which are primarily mall-based locations averaging 133,000 square feet. Full-line stores offer a wide array of products across many merchandise categories, including home appliances, consumer electronics, tools, fitness, lawn and garden equipment, certain automotive services and products, such as tires and batteries, home fashion products, as well as apparel, footwear and accessories for the whole family. Our product offerings include our proprietary Kenmore, Craftsman, DieHard, Lands’ End, Covington, Apostrophe, and Canyon River Blues brand merchandise. In addition, as of January 30, 2010, we operated 60 Sears Essentials/Grand stores located in 24 states. These stores are primarily free-standing units averaging 116,000 square feet, offering health and beauty products, pantry goods, household products and toys in addition to the offerings of the typical mall-based store. There are 30 Sears Essentials/Grand stores that operate in-store pharmacies. We also have 775 Sears Auto Centers operating in association with full-line stores and 23 Sears Auto Centers |
2
Table of Contents
| operating out of Sears Essentials/Grand stores. In addition, there are 29 free standing Sears Auto Centers that operate independently of full-line stores. Sears also extends the availability of its product selection through the use of its sears.com website, which offers an assortment of home, apparel and accessory merchandise and provides customers the option of buying through the Internet and picking up their merchandise in one of our full-line and specialty stores. We have announced plans to close 11 broadline stores in the first part of 2010. |
| • | Specialty Stores—1,284 specialty stores located across all 50 states and Puerto Rico, in freestanding, off-mall locations or high-traffic neighborhood shopping centers. Specialty store operations primarily consist of: |
| • | 907 Sears Hometown Stores—Primarily independently-owned stores, predominantly located in smaller communities and averaging 8,800 square feet offering appliances, consumer electronics, lawn and garden equipment, and hardware. Most of our hometown stores carry proprietary Sears brands, such as Kenmore, Craftsman, and DieHard, as well as a wide assortment of national brands. |
| • | 60 Sears Home Appliance Showrooms—Innovative stores averaging 5,100 square feet that have a simple, appliance only showroom design that are strategically positioned in high growth suburban areas. Sears Home Appliance Showrooms offer the best advantages of our Sears Full-Line Stores combined with the Hometown Store customer service standard. |
| • | 106 Sears Hardware Stores and 88 Orchard Supply Hardware Stores—Neighborhood hardware stores averaging 40,000 square feet that carry Craftsman brand tools and lawn and garden equipment, DieHard brand batteries and a wide assortment of national brands and other home improvement products. 117 of these locations also offer a limited selection of Kenmore brand home appliances. |
| • | 12 The Great Indoors Stores—Home decorating and remodeling superstores, averaging 143,000 square feet, dedicated to the four main rooms of the house: kitchen, bedroom, bathroom and great room. |
| • | 93 Outlet Stores—Locations offering overstock and/or distressed appliances, consumer electronics, lawn and garden equipment and other merchandise at a discount. |
| • | Lands’ End—Lands’ End, Inc. (“Lands’ End”) is a leading direct merchant of traditionally styled casual clothing, accessories and footwear for men, women and children, as well as home products and soft luggage. These products are offered through multiple selling channels including Landsend.com, one of the leading apparel websites, as well as catalog mailings, and international businesses. Lands’ End has 14 retail stores, averaging 8,600 square feet, which offer Lands’ End merchandise primarily from catalog and Internet channel overstocks. In addition, Lands’ End has 293 “store within a store” departments inside Sears Domestic broadline locations. The retail sales in those full-line locations are included in the results of our full-line stores. |
| • | Commercial Sales—We sell Sears merchandise, parts, and services to commercial customers through our business-to-business Sears Commercial Sales and Appliance Builder/Distributor businesses. |
| • | Sears Commercial Sales provides appliances and services to commercial customers in the single-family residential construction/remodel, property management, multi-family new construction, and government/military sectors. |
| • | Our Appliance Builder/Distributor business offers premium appliance and plumbing fixtures to architects, designers, and new construction or remodeling customers, and is currently operating in seven markets with 26 showrooms. |
| • | Home Services—Product Repair Services, the nation’s largest product repair service provider, is a key element in our active relationship with more than 38 million households. With over 9,500 service technicians making over 12 million service calls annually, this business delivers a broad range of retail- |
3
Table of Contents
| related residential and commercial services across all 50 states, Puerto Rico, Guam and the Virgin Islands under the Sears Parts & Repair Services and A&E Factory Service brand names. Commercial and residential customers can obtain parts and repair services for all major brands of products within the home appliances, lawn and garden equipment, consumer electronics, floor care products, and heating and cooling systems categories. We also provide repair parts with supporting instructions for “do-it-yourself” customers through our PartsDirect.com website. Smaller items for repair can be brought into Sears Parts & Repair Centers located throughout the United States or into many Sears full-line, hometown and hardware stores. This business also offers protection agreements, product installation services and Kenmore and Carrier brand residential heating and cooling systems. Home Services also includes home improvement services (primarily siding, windows, cabinet refacing, kitchen remodeling, roofing, carpet and upholstery cleaning, air duct cleaning, and garage door installation and repair) provided through Sears Home Improvement Services. |
Sears Canada
Sears Canada, a consolidated, 73%-owned subsidiary of Sears, conducts retail operations in Canada similar to those conducted by Sears Domestic, with a greater emphasis on apparel and other softlines than in the U.S. stores.
As of January 30, 2010, Sears Canada operated a total of 122 full-line stores, 280 specialty stores (including 48 furniture and appliance stores, 186 dealer stores operated under independent local ownership, four appliance and mattress stores, 30 Corbeil stores, and 12 outlet stores), 22 floor covering stores, 1,853 catalog pick-up locations and 108 travel offices. Sears Canada also conducts business over the Internet through its website, sears.ca.
Development of the Business
The Merger provided Holdings a means for leveraging the historical strengths of Kmart and Sears with the goal of making our products, brands and service offerings available through more locations and customer distribution channels. Sears has a long-standing reputation for offering customers a wide variety of merchandise and related services, with a particular emphasis on its strong proprietary brands such as Kenmore, Craftsman, DieHard and Lands’ End. Historically, Sears conducted its business primarily using a mall-based format. At the time of the Merger, Sears operated 874 domestic full-line stores mainly located in such on-mall locations. Kmart, in contrast, historically used large format, off-mall locations in selling a selection of general merchandise goods. At the time of the Merger, Kmart operated approximately 1,400 off-mall stores and sought to further improve its operational performance by pursuing opportunities to offer customers a differentiated high-quality product selection to distinguish itself from competitors. Prior to the Merger, Sears had been challenged for many years to find a way to grow outside of the traditional mall setting. By merging, the combined company achieved the scale and capabilities to compete more effectively against many of its more profitable rivals, without the capital required for building new stores.
After the Merger, we initially worked to improve our operations by focusing on the basics, like markdown disciplines and expense management. At the same time, we prioritized our resources to merge and rebuild many of the company’s systems and processes in an effort to become a more adaptable organization. As a continuation of this effort, we announced during 2008 that we would implement a new organizational structure and operating model designed to simplify the way our business lines are managed and create greater autonomy, accountability and focus for our business unit management teams. Further, this model is intended to allow for effective and efficient execution of the five key pillars of our strategy.
As discussed in more detail in the “Management Discussion and Analysis” section below, our strategy is supported by five key pillars which we believe will help us to achieve more consistency, better customer service, increased transparency, and tighter integration of our stores, our service businesses, and our online experiences.
4
Table of Contents
Our culture is owner-oriented, because we have owners who serve on the board that governs our Company. Because of this ownership, we are able to take a long-term perspective when evaluating strategic, operational and financial decisions.
Consistent with our approach since the Merger, we have chosen to invest primarily in areas of our business that we believe will yield long-term growth and attractive returns. These areas include our online businesses, our service businesses, our Kenmore, Craftsman, DieHard and Lands’ End brands, and some of our alternative formats like Hometown Stores and Outlet Stores. We will continue to experiment and explore ways to materially improve our Kmart and Sears Full-Line store experience and competitiveness. As we look ahead to fiscal 2010, we expect our strategy to deliver improved customer experiences and better financial performance by focusing on innovation in our products and services, increasing the strength of our customer relationships and developing our many talented associates and leaders.
Bankruptcy of Kmart Corporation
Kmart Corporation (the “Predecessor Company”) is a predecessor operating company of Kmart (the “Successor Company”). In January 2002, the Predecessor Company and 37 of its U.S. subsidiaries (collectively, the “Debtors”) filed voluntary petitions for reorganization under Chapter 11 of the federal bankruptcy laws (“Chapter 11”). On May 6, 2003, the Predecessor Company emerged from reorganization proceedings under Chapter 11 pursuant to the terms of an Amended Joint Plan of Reorganization (the “Plan of Reorganization”) and related amended Disclosure Statement. This Plan received formal endorsement of the statutory creditors’ committee and, as modified, was confirmed by the U.S. Bankruptcy Court in April 2003. The Predecessor Company is presently an indirect wholly owned subsidiary of Holdings. During the third quarter of 2008, we completed the settlement of substantially all of the claims associated with the discharge of the Predecessor Company’s liabilities subject to compromise pursuant to the Plan of Reorganization. See Note 10 of Notes to Consolidated Financial Statements for further explanation of the bankruptcy and claims resolution process.
Acquisition of Noncontrolling Interest in Sears Canada
During fiscal 2009, we increased our controlling interest in Sears Canada by acquiring approximately 0.5 million common shares in open market transactions. The Company paid a total of $7 million for the additional shares and accounted for the acquisition of additional interest in Sears Canada as an equity transaction in accordance with a newly issued accounting standard on noncontrolling interests (see Note 1 to the consolidated financial statements for further information on this new standard). Acquisition of the additional interest in Sears Canada was not material to our financial position. Our majority interest in Sears Canada remains at 73%.
During fiscal 2008, the Company increased its majority interest in Sears Canada from 70% to 73% by acquiring approximately 2.6 million common shares in open market transactions. The Company paid a total of $37 million for the additional shares acquired and accounted for the acquisition of additional interest in Sears Canada as a purchase business combination under accounting rules in place at that time. The acquisition of the additional interest in Sears Canada during fiscal 2008 was not material to our operations or financial position.
Real Estate Transactions
In the normal course of business, we consider opportunities to purchase leased operating properties, as well as offers to sell owned, or assign leased, operating and non-operating properties. These transactions may, individually or in the aggregate, result in material proceeds or outlays of cash. In addition, we review leases that will expire in the short term in order to determine the appropriate action to take with respect to them.
Further information concerning our real estate transactions is contained in Note 12 of Notes to Consolidated Financial Statements.
5
Table of Contents
Trademarks, Trade Names and Licenses
The KMART® and SEARS® trade names, service marks and trademarks, used by us both in the United States and internationally, are material to our retail and other related businesses.
We sell proprietary branded merchandise under a number of brand names that are important to our operations. Our KENMORE®, CRAFTSMAN®, DIEHARD® and LANDS’ END® brands are among the most recognized proprietary brands in retailing. These marks are the subject of numerous United States and foreign trademark registrations. Other well recognized Company trademarks and service marks include THE GREAT INDOORS®, OSH®, CANYON RIVER BLUES®, APOSTROPHE®, and COVINGTON®, as well as SHOPYOURWAYSM, which also are registered in the United States. We also have the right to sell an exclusive line of Jaclyn Smith® products through July 2011 (with an option to extend for up to two additional three-year terms, subject to certain conditions). Generally, our right to use our trade names and marks continues so long as we use them.
Seasonality
The retail business is seasonal in nature, and we generate a high proportion of our revenues, operating income and operating cash flows during the fourth quarter of our fiscal year, which includes the holiday season. As a result, our overall profitability is heavily impacted by our fourth quarter operating results. Additionally, in preparation for the fourth quarter holiday season, we significantly increase our merchandise inventory levels, which are financed from operating cash flows, credit terms received from vendors and borrowings under our amended credit agreement (described in the “Uses and Sources of Liquidity” section below). Fourth quarter reported revenues accounted for 30%, 28% and 30% of total reported revenues in fiscal years 2009, 2008 and 2007, respectively. See Note 20 to our Consolidated Financial Statements for further information on revenues earned by quarter in fiscal 2009 and 2008.
Competition
Our business is subject to highly competitive conditions. We compete with a wide variety of retailers, including other department stores, discounters, home improvement stores, consumer electronics dealers, auto service providers, specialty retailers, wholesale clubs, as well as many other retailers operating on a national, regional or local level. Internet and catalog businesses, which handle similar lines of merchandise, also compete with us. Walmart, Target, Kohl’s, JC Penney, Macy’s, Home Depot, Lowe’s and Best Buy are some of the national retailers with which we compete. Home Depot and Lowe’s are major competitors in relation to our home appliance business, which accounted for approximately 15% of our fiscal 2009, 2008 and 2007 reported revenues. Sears Canada competes in Canada with Hudson’s Bay Company and certain U.S.-based competitors, including those mentioned above, that may be expanding into Canada. Success in these competitive marketplaces is based on factors such as price, product assortment and quality, service and convenience, including availability of retail-related services such as access to credit, product delivery, repair and installation. Additionally, we are influenced by a number of factors including, but not limited to, the cost of goods, consumer debt availability and buying patterns, economic conditions, customer preferences, inflation, currency exchange fluctuations, weather patterns, and catastrophic events. Item 1A in this report on Form 10-K contains further information regarding risks to our business.
Employees
As of January 30, 2010, we had approximately 290,000 employees in the United States and U.S. territories, and approximately 32,000 employees in Canada through Sears Canada including, in each case, part-time employees.
6
Table of Contents
Our Website; Availability of SEC Reports and Other Information
Our corporate website is located at searsholdings.com. Our Annual Reports on Form 10-K, Quarterly Reports on Form 10-Q, Current Reports on Form 8-K and any amendments to these reports are available, free of charge, through the “SEC Filings” portion of the Investor Information section of our website as soon as reasonably practicable after they are electronically filed with, or furnished to, the Securities and Exchange Commission (“SEC”).
The Corporate Governance Guidelines of our Board of Directors, the charters of the Audit, Compensation, Finance and Nominating and Corporate Governance Committees of the Board of Directors, our Code of Conduct and the Board of Directors Code of Conduct are available in the Corporate Governance section of searsholdings.com. References to our website address do not constitute incorporation by reference of the information contained on the website, and the information contained on the website is not part of this document.
| Item 1A. | Risk Factors |
The following risk factors could adversely affect our business, results of operations and financial condition. The risks and uncertainties described below are not the only ones we face. Additional risks and uncertainties not presently known to us may also negatively impact our business.
If we fail to offer merchandise and services that our customers want, our sales may be limited, which would reduce our revenues and profits.
In order for our business to be successful, we must identify, obtain supplies of, and offer to our customers, attractive, innovative and high-quality merchandise on a continuous basis. Our products and services must satisfy the desires of our customers, whose preferences may change in the future. If we misjudge either the demand for products and services we sell or our customers’ purchasing habits and tastes, we may be faced with excess inventories of some products and missed opportunities for products and services we chose not to offer. In addition, our sales may decline or we may be required to sell the merchandise we have obtained at lower prices. This would have a negative effect on our business and results of operations.
If we do not successfully manage our inventory levels, our operating results will be adversely affected.
We must maintain sufficient inventory levels to operate our business successfully. However, we also must guard against accumulating excess inventory as we seek to minimize out-of-stock levels across all product categories and to maintain in-stock levels. We obtain a significant portion of our inventory from vendors located outside the United States. Some of these vendors often require lengthy advance notice of our requirements in order to be able to supply products in the quantities we request. This usually requires us to order merchandise, and enter into purchase order contracts for the purchase and manufacture of such merchandise, well in advance of the time these products will be offered for sale. As a result, we may experience difficulty in responding to a changing retail environment, which makes us vulnerable to changes in price. If we do not accurately anticipate the future demand for a particular product or the time it will take to obtain new inventory, our inventory levels will not be appropriate and our results of operations may be negatively impacted.
If we are unable to compete effectively in the highly competitive retail industry, our business and results of operations could be materially adversely affected.
The retail industry is highly competitive with few barriers to entry. We compete with a wide variety of retailers, including other department stores, discounters, home improvement stores, consumer electronics dealers, auto service providers, specialty retailers, wholesale clubs and many other competitors operating on a national, regional or local level. Some of our competitors are actively engaged in new store expansion. Internet and catalog businesses, which handle similar lines of merchandise, also compete with us. In this competitive marketplace, success is based on factors such as price, product assortment and quality, service and convenience.
7
Table of Contents
Our success depends on our ability to differentiate ourselves from our competitors with respect to shopping convenience, a quality assortment of available merchandise and superior customer service. We must also successfully respond to our customers’ changing tastes. The performance of our competitors, as well as changes in their pricing policies, marketing activities, new store openings and other business strategies, could have a material adverse effect on our business, financial condition and results of operations.
Our business has been and will continue to be affected by worldwide economic conditions; a failure of the economy to sustain its recovery and a renewed decline in consumer-spending levels and other conditions could lead to reduced revenues and gross margins, and negatively impact our liquidity.
Many economic and other factors are outside of our control, including consumer and commercial credit availability, consumer confidence and spending levels, employment levels, housing sales and remodels, consumer debt levels and inflation, fuel costs and other challenges currently affecting the global economy, the full impact of which on our business, results of operations and financial condition cannot be predicted with certainty. These economic conditions adversely affect the disposable income levels of, and the credit available to, our customers, which could lead to reduced demand for our merchandise. Also affected are our vendors, upon which we depend to provide us with financing on our purchases of inventory and services. Our vendors could seek to change either the availability of vendor credit to us or other terms under which they sell to us, or both, which could negatively impact our liquidity. In addition, the inability of vendors to access liquidity, or the insolvency of vendors, could lead to their failure to deliver inventory or other services.
In addition to credit terms from vendors, our liquidity needs are funded by our operating cash flows and, to the extent necessary, borrowings under our credit agreements. The availability of financing depends on numerous factors, including economic and market conditions, our credit ratings, and lenders’ assessments of our prospects and the prospects of the retail industry in general. The lenders under our credit facilities may not be able to meet their commitments if they experience shortages of capital and liquidity and there can be no assurance that our ability to otherwise access the credit markets, will not be adversely affected by changes in the financial markets and the global economy.
The domestic and international political situation also affects consumer confidence. The threat, outbreak or escalation of terrorism, military conflicts or other hostilities could lead to a decrease in consumer spending. Any of these events and factors could cause us to increase inventory markdowns and promotional expenses, thereby reducing our gross margins and operating results.
Due to the seasonality of our business, our annual operating results would be adversely affected if our business performs poorly in the fourth quarter.
Our business is seasonal, with a high proportion of revenues, operating income and operating cash flows being generated during the fourth quarter of our fiscal year, which includes the holiday season. As a result, our fourth quarter operating results significantly impact our annual operating results. Our fourth quarter operating results may fluctuate significantly, based on many factors, including holiday spending patterns and weather conditions.
Our sales may fluctuate for a variety of reasons, which could adversely affect our results of operations.
Our business is sensitive to customers’ spending patterns, which in turn are subject to prevailing economic conditions. Our sales and results of operations have fluctuated in the past, and we expect them to continue to fluctuate in the future. A variety of other factors affect our sales and financial performance, including:
| • | actions by our competitors, including opening of new stores in our existing markets or changes to the way these competitors go to market online, |
| • | seasonal fluctuations due to weather conditions, |
8
Table of Contents
| • | changes in our merchandise strategy and mix, |
| • | changes in population and other demographics, and |
| • | timing of our promotional events. |
Accordingly, our results for any one fiscal quarter are not necessarily indicative of the results to be expected for any other quarter, and comparable store sales for any particular future period may increase or decrease. For more information on our results of operations, see “Management’s Discussion and Analysis of Financial Condition and Results of Operations” in Item 7 of this report on Form 10-K.
We rely on foreign sources for significant amounts of our merchandise, and our business may therefore be negatively affected by the risks associated with international trade.
We depend on a large number of products produced in foreign markets. We face risks associated with the delivery of merchandise originating outside the United States, including:
| • | potential economic and political instability in countries where our suppliers are located, |
| • | increases in shipping costs, |
| • | transportation delays and interruptions, |
| • | adverse fluctuations in currency exchange rates, and |
| • | changes in U.S. and foreign laws affecting the importation and taxation of goods, including duties, tariffs and quotas, or changes in the enforcement of those laws. |
We rely extensively on computer systems to process transactions, summarize results and manage our business. Disruptions in these systems could harm our ability to run our business.
Given the number of individual transactions we have each year, it is critical that we maintain uninterrupted operation of our computer and communications hardware and software systems. Our systems are subject to damage or interruption from power outages, computer and telecommunications failures, computer viruses, security breaches, including breaches of our transaction processing or other systems that result in the compromise of confidential customer data, catastrophic events such as fires, tornadoes and hurricanes, and usage errors by our employees. If our systems are breached, damaged or cease to function properly, we may have to make a significant investment to fix or replace them, we may suffer interruptions in our operations in the interim, we may face costly litigation, and our reputation with our customers may be harmed. Any material interruption in our computer operations may have a material adverse effect on our business or results of operations. In addition, we are pursuing complex initiatives to transform our information technology processes and systems, which will include, for many systems, establishing a common platform across our lines of business, such as common human resources and supply chain. The risk of disruption is increased in periods where such complex and significant systems changes are undertaken.
We rely on third parties to provide us with services in connection with the administration of certain aspects of our business.
From time to time we have entered into agreements with third-party service providers (both domestic and overseas) to provide processing and administrative functions over a broad range of areas, and we may continue to do so in the future. These areas include finance and accounting, call center, human resources and procurement functions. There can be no assurance that transition of the functions to third party service providers will be successful. Services provided by third parties as a part of outsourcing initiatives could be interrupted as a result of many factors, such as acts of God or contract disputes, and any failure by third-parties to provide us with these services on a timely basis or within our service level expectations and performance standards could result in a
9
Table of Contents
disruption of our business. In addition, to the extent we are unable to maintain our outsourcing arrangements, we would incur substantial costs, including costs associated with hiring new employees, in order to return these services in-house.
We could incur charges due to impairment of goodwill, intangible and long-lived assets.
At January 30, 2010, we had goodwill and intangible asset balances of $4.6 billion, which are subject to periodic testing for impairment. Our long-lived assets, primarily stores, also are subject to periodic testing for impairment. A significant amount of judgment is involved in the periodic testing. Failure to achieve sufficient levels of cash flow at reporting units could result in impairment charges for goodwill and intangible assets or fixed asset impairment for long-lived assets, which could have a material adverse effect on our results of operations. Impairment charges, if any, resulting from the periodic testing are non-cash. Our goodwill impairment analysis also includes a comparison of the aggregate estimated fair value of all reporting units to our total market capitalization. Therefore, a significant and sustained decline in our stock price could result in goodwill impairment charges. During times of financial market volatility, significant judgment is used to determine the underlying cause of the decline and whether stock price declines are short-term in nature or indicative of an event or change in circumstances.
The loss of key personnel may disrupt our business and adversely affect our financial results.
We depend on the contributions of key personnel, including Edward S. Lampert (chairman) and other key employees, for our future success. Although certain executives have employment agreements with us, changes in our senior management and any future departures of key employees may disrupt our business and materially adversely affect our results of operations.
Affiliates of our Chairman, whose interests may be different than your interests, exert substantial influence over our Company.
Affiliates of Edward S. Lampert, the Chairman of our Board of Directors, beneficially own approximately 57% of the outstanding shares of our common stock. These affiliates are controlled, directly or indirectly, by Mr. Lampert. Accordingly, these affiliates, and thus Mr. Lampert, have substantial influence over many, if not all, actions to be taken or approved by our shareholders, including the election of directors and any transactions involving a change of control.
The interests of these affiliates, which have investments in other companies, may from time to time diverge from the interests of our other shareholders, particularly with regard to new investment opportunities. This substantial influence may have the effect of discouraging offers to acquire our Company because the consummation of any such acquisition would likely require the consent of these affiliates.
We may be subject to product liability claims if people or properties are harmed by the products we sell or the services we offer.
Some of the products we sell may expose us to product liability claims relating to personal injury, death, or property damage caused by such products, and may require us to take actions such as product recalls. We also provide various services, which could also give rise to such claims. Although we maintain liability insurance, we cannot be certain that our coverage will be adequate for liabilities actually incurred or that insurance will continue to be available to us on economically reasonable terms, or at all.
10
Table of Contents
We may be subject to periodic litigation and other regulatory proceedings. These proceedings may be affected by changes in laws and government regulations or changes in the enforcement thereof.
From time to time, we may be involved in lawsuits and regulatory actions relating to our business, certain of which may be in jurisdictions with reputations for aggressive application of laws and procedures against corporate defendants. We are impacted by trends in litigation, including class-action allegations brought under various consumer protection and employment laws, including wage and hour laws. Due to the inherent uncertainties of litigation and regulatory proceedings, we cannot accurately predict the ultimate outcome of any such proceedings. An unfavorable outcome could have a material adverse impact on our business, financial condition and results of operations. In addition, regardless of the outcome of any litigation or regulatory proceedings, these proceedings could result in substantial costs and may require that we devote substantial resources to defend our Company. Further, changes in governmental regulations both in the United States and in the other countries where we operate could have adverse effects on our business and subject us to additional regulatory actions. For a description of current legal proceedings, see Item 3, “Legal Proceedings,” as well as Note 19 to the Consolidated Financial Statements in this report on Form 10-K.
Our pension and postretirement benefit plan obligations are currently underfunded, and we may have to make significant cash payments to some or all of these plans, which would reduce the cash available for our businesses.
We have unfunded obligations under our domestic and foreign pension and postretirement benefit plans. The funded status of our pension plans is dependent upon many factors, including returns on invested assets, the level of certain market interest rates and the discount rate used to determine pension obligations. Unfavorable returns on the plan assets or unfavorable changes in applicable laws or regulations could materially change the timing and amount of required plan funding, which would reduce the cash available for our businesses. In addition, a decrease in the discount rate used to determine pension obligations could result in an increase in the valuation of pension obligations, which could affect the reported funding status of our pension plans and future contributions, as well as the periodic pension cost in subsequent fiscal years.
| Item 1B. | Unresolved Staff Comments |
None.
| Item 2. | Properties |
The following table summarizes the locations of our Kmart and Sears Domestic stores as of January 30, 2010:
| Kmart | Sears Domestic | |||||||||
| State/Territory |
Discount Stores |
Super Centers |
Full-line Mall Stores |
Sears Essentials/ Grand Stores |
Specialty Stores | |||||
| Alabama |
25 | — | 11 | 2 | 31 | |||||
| Alaska |
— | — | 3 | — | 3 | |||||
| Arizona |
17 | — | 14 | 1 | 19 | |||||
| Arkansas |
5 | — | 7 | — | 36 | |||||
| California |
99 | — | 80 | 9 | 140 | |||||
| Colorado |
18 | — | 13 | 2 | 22 | |||||
| Connecticut |
7 | — | 8 | 1 | 11 | |||||
| Delaware |
6 | — | 4 | — | 6 | |||||
| District of Columbia |
— | — | — | — | 1 | |||||
| Florida |
88 | — | 54 | 6 | 42 | |||||
11
Table of Contents
| Kmart | Sears Domestic | |||||||||
| State/Territory |
Discount Stores |
Super Centers |
Full-line Mall Stores |
Sears Essentials/ Grand Stores |
Specialty Stores | |||||
| Georgia |
37 | — | 22 | 1 | 52 | |||||
| Hawaii |
7 | — | 6 | — | 1 | |||||
| Idaho |
8 | — | 6 | — | 6 | |||||
| Illinois |
57 | 4 | 38 | 6 | 52 | |||||
| Indiana |
34 | 5 | 20 | — | 40 | |||||
| Iowa |
24 | — | 11 | — | 17 | |||||
| Kansas |
11 | — | 9 | 1 | 22 | |||||
| Kentucky |
30 | — | 11 | 1 | 23 | |||||
| Louisiana |
11 | — | 13 | — | 23 | |||||
| Maine |
6 | — | 6 | — | 12 | |||||
| Maryland |
21 | — | 19 | 2 | 12 | |||||
| Massachusetts |
18 | — | 21 | 1 | 11 | |||||
| Michigan |
73 | 6 | 26 | 3 | 37 | |||||
| Minnesota |
29 | — | 12 | — | 41 | |||||
| Mississippi |
7 | — | 8 | — | 25 | |||||
| Missouri |
25 | — | 12 | 4 | 50 | |||||
| Montana |
10 | — | 3 | — | 7 | |||||
| Nebraska |
8 | — | 4 | — | 10 | |||||
| Nevada |
10 | — | 4 | 1 | 9 | |||||
| New Hampshire |
6 | — | 6 | 3 | 8 | |||||
| New Jersey |
36 | — | 20 | 5 | 16 | |||||
| New Mexico |
15 | — | 7 | — | 10 | |||||
| New York |
55 | 1 | 45 | — | 34 | |||||
| North Carolina |
46 | 1 | 26 | — | 39 | |||||
| North Dakota |
7 | — | 4 | — | 5 | |||||
| Ohio |
64 | 10 | 41 | 2 | 53 | |||||
| Oklahoma |
9 | — | 11 | — | 19 | |||||
| Oregon |
14 | — | 9 | — | 25 | |||||
| Pennsylvania |
97 | 2 | 45 | 2 | 34 | |||||
| Rhode Island |
1 | — | 2 | — | 2 | |||||
| South Carolina |
26 | 1 | 14 | 1 | 16 | |||||
| South Dakota |
9 | — | 2 | — | 5 | |||||
| Tennessee |
34 | — | 24 | — | 25 | |||||
| Texas |
20 | — | 60 | 1 | 106 | |||||
| Utah |
15 | — | 5 | 2 | 10 | |||||
| Vermont |
3 | — | 2 | — | 10 | |||||
| Virginia |
40 | 3 | 23 | 1 | 25 | |||||
| Washington |
20 | — | 23 | — | 16 | |||||
| West Virginia |
16 | 1 | 8 | — | 9 | |||||
| Wisconsin |
32 | — | 15 | 2 | 39 | |||||
| Wyoming |
9 | — | 2 | — | 7 | |||||
| Puerto Rico |
22 | 1 | 9 | — | 10 | |||||
| U.S. Virgin Islands |
4 | — | — | — | — | |||||
| Guam |
1 | — | — | — | — | |||||
| Totals |
1,292 | 35 | 848 | 60 | 1,284 | |||||
12
Table of Contents
| Kmart | Sears Domestic | Sears Canada | Total | |||||||||||||
| Discount Stores |
Super Centers |
Full-line Mall Stores |
Sears Essentials/ Grand Stores |
Specialty Stores |
Full- line Stores |
Specialty Stores |
||||||||||
| Owned |
174 | 22 | 516 | 17 | 63 | 14 | 2 | 808 | ||||||||
| Leased |
1,118 | 13 | 332 | 43 | 312 | 108 | 73 | 1,999 | ||||||||
| Independently-owned and operated stores |
— | — | — | — | 909 | — | 205 | 1,114 | ||||||||
| Stores as of January 30, 2010 |
1,292 | 35 | 848 | 60 | 1,284 | 122 | 280 | 3,921 | ||||||||
In addition, as of January 30, 2010, we had 39 domestic supply chain distribution centers, of which 16 were owned and 23 were leased for terms ranging from 1 to 12 years. Of the total, 11 primarily support Kmart locations, 24 primarily support Sears stores and four support both Sears and Kmart stores. In addition, we had 485 domestic store warehouses, customer call centers and service facilities (including 26 showrooms related to our appliance builder/distributor business), most of which are leased for terms ranging generally from three to five years or are part of other facilities included in the above table.
Our principal executive offices are located on a 200-acre site owned by us at the Prairie Stone office park in Hoffman Estates, Illinois. The complex consists of six interconnected office buildings totaling approximately two million gross square feet of office space. We also own an 86,000 square foot office building in Troy, Michigan.
As of January 30, 2010, Sears Canada operated a total of 122 full-line stores, 280 specialty stores (including 48 furniture and appliance stores, 186 dealer stores operated under independent local ownership, four appliance and mattress stores, 30 Corbeil stores, and 12 outlet stores), 22 floor covering stores, 1,853 catalog pick-up locations and 108 travel offices.
In August 2007, Sears Canada sold its headquarters office building and adjacent land in Toronto, Ontario. Sears Canada leased back the property under a leaseback agreement through March 2009, at which time it finished its relocation of all head office operations to previously underutilized space in the Toronto Eaton Centre, Ontario. See Note 12 to our Consolidated Financial Statements for further information on this transaction.
A description of our leasing arrangements and commitments appears in Note 15 of Notes to Consolidated Financial Statements.
| Item 3. | Legal Proceedings |
Item 103 of SEC Regulation S-K requires that we disclose legal proceedings to which the Company and a governmental authority is a party and that arise under laws dealing with the discharge of materials into the environment or the protection of the environment, if the proceeding reasonably involves potential monetary sanctions of $100,000 or more. Disclosure also is required as to any such proceedings known by us to be contemplated by governmental authorities. In that connection, we note that we have received a pre-filing notice from the United States Environmental Protection Agency, seeking information and documents concerning the labeling of a private brand pesticide. The parties have agreed to settle the matter and are negotiating a settlement agreement.
See Part II, Item 8, “Financial Statements—Notes to Consolidated Financial Statements,” Note 10—“Bankruptcy Claims Resolution and Settlements,” and Note 19—“Legal Proceedings,” for additional information regarding legal proceedings, which information is incorporated herein by this reference.
13
Table of Contents
| Item 4. | Reserved |
None.
EXECUTIVE OFFICERS OF THE REGISTRANT
The following table and information sets forth the names of our executive officers, their current positions and offices with the Company, the date they first became executive officers of the Company, their current ages, and their principal employment during the past five years.
| Name |
Position |
Date First Became an Executive Officer |
Age | ||||
| W. Bruce Johnson |
Interim Chief Executive Officer and President | 2005 | * | 58 | |||
| William C. Crowley |
Executive Vice President, Chief Administrative Officer | 2005 | * | 52 | |||
| Scott J. Freidheim |
Executive Vice President, Operating and Support Businesses | 2009 | 44 | ||||
| John D. Goodman |
Executive Vice President, Apparel and Home | 2009 | 45 | ||||
| James H. Haworth |
Executive Vice President and President, Retail Services | 2010 | 48 | ||||
| Michael D. Collins |
Senior Vice President and Chief Financial Officer | 2008 | 46 | ||||
| William R. Harker |
Senior Vice President, General Counsel and Corporate Secretary | 2006 | 37 | ||||
| William K. Phelan |
Senior Vice President, Controller and Chief Accounting Officer | 2005 | * | 47 |
| * | Became an executive officer of Holdings upon the completion of the Merger on March 24, 2005. |
Mr. Johnson was elected as the Company’s interim Chief Executive Officer and President in February 2008. He previously served as the Company’s Executive Vice President, Supply Chain and Operations since the Merger. He joined Kmart in October 2003 as Senior Vice President, Supply Chain and Operations.
William C. Crowley has served as an Executive Vice President of the Company since March 2005 and as our Chief Administrative Officer since September 2005. He also served as our Chief Financial Officer from March 2005 to September 2006 and as interim Chief Financial Officer from January 2007 to October 2007. Mr. Crowley has served as Chairman of the Board of Sears Canada, Inc. since December 2006 and as a director of Sears Canada since March 2005. Prior to the Merger, Mr. Crowley served as Senior Vice President, Finance of Kmart Holding Corporation, and had served as an officer of Kmart Holding Corporation since 2003. Mr. Crowley is also the President and Chief Operating Officer of ESL Investments, Inc., a private investment firm, and has served in that capacity since 1999. He is a director of AutoNation, Inc., an automotive retailer, and AutoZone, Inc., a specialty retailer and distributor of automotive replacement parts and accessories.
Mr. Freidheim joined the Company as Executive Vice President, Operating and Support Businesses in January 2009. Prior to joining the Company, Mr. Freidheim served as an Executive Vice President and Chief Administrative Officer from September 2008 to December 2008 and Executive Vice President and Co-Chief Administrative Officer of Lehman Brothers Holdings Inc. (“Lehman Brothers”) from October 2006 to September 2008. Mr. Freidheim also served as Managing Director—Office of the Chairman from 1996 to 2007. Mr. Freidheim served as Global Head of Strategy of Lehman Brothers from 2005 to 2007 and Global Head of Corporate Communications, Advertising, Marketing and Brand of Lehman Brothers from 2003 to 2007. In September 2008, Lehman Brothers filed a petition under Chapter 11 of the U.S. Bankruptcy Code with the U.S. Bankruptcy Court for the Southern District of New York.
Mr. Goodman joined the Company as Executive Vice President, Apparel and Home, and President, Kmart Apparel in November 2009. Mr. Goodman, who served as Chief Apparel and Home Officer from January 2004 until May 2005 for Kmart, was the Chief Executive Officer for apparel retailer Charlotte Russe Holding Inc. from November 2008 to October 2009. He served as the President and Chief Executive Officer of Mervyn’s LLC, a department store chain, from April 2008 to October 2008 and as President of the Dockers® brand at Levi
14
Table of Contents
Strauss and Co., an apparel company, from May 2005 to April 2008. In July 2008, Mervyn’s LLC filed a petition under Chapter 11 of the U.S. Bankruptcy Code with the U.S. Bankruptcy Court for the District of Delaware. In October 2008, Mervyn’s LLC announced that it would liquidate its assets through Chapter 7 of the United States Bankruptcy Code.
Mr. Haworth joined the Company as Executive Vice President and President—Retail Services in January 2010. Prior to joining the Company, Mr. Haworth served as Chairman, President and Chief Executive Office for Chia Tai Enterprises International Limited & CP Lotus, an investment holding company principally engaged in the operation of shopping centers in China, from 2006 to December 2009. In January 2005, he founded Business Decisions Inc., a consulting firm specializing in strategic product marketing for the retail, merchandising and supply chain industries. Previous to Business Decisions Inc., Mr. Haworth spent 20 years with Wal-Mart Stores, Inc., in roles of increasing responsibility including Executive Vice President of Operations for Sam’s Club and Executive Vice President and Chief Operating Officer, Wal-Mart Stores, Inc.
Mr. Collins joined the Company in October 2008 as Senior Vice President, Financial Planning and Analysis. In December 2008, he was elected Senior Vice President and Chief Financial Officer. Prior to joining the Company, Mr. Collins served as Senior Vice President, Planning and Analysis, at General Electric Company’s NBC Universal Division from March 2004 to October 2008. Mr. Collins worked in a variety of finance positions in his 18-year career at General Electric Company.
Mr. Harker joined the Company as Vice President and Chief Counsel in September 2005. He became Vice President, Acting General Counsel and Corporate Secretary in January 2006. In April 2006, Mr. Harker was elected Senior Vice President, Acting General Counsel and Corporate Secretary. He was elected to his current position in December 2006 and also served as our Senior Vice President, Human Resources, from February 2008 to August 2009. Prior to joining Holdings, he practiced corporate law with the law firm of Wachtell, Lipton, Rosen and Katz from September 2000 to August 2005. Mr. Harker has served as a director of Sears Canada since November 2008.
Mr. Phelan was elected Senior Vice President and Controller of the Company in September 2007. From December 2007 until December 2008, Mr. Phelan also served as the Company’s Treasurer. From March 2005 until September 2007, Mr. Phelan served as Vice President and Controller. From December 2000 to March 2005, he served as Assistant Controller of Sears.
15
Table of Contents
PART II
| Item 5. | Market for Registrant’s Common Equity, Related Stockholder Matters and Issuer Purchases of Equity Securities |
Holdings’ common stock is quoted on The NASDAQ Stock Market under the ticker symbol SHLD. There were 21,412 shareholders of record as of February 28, 2010.
The common stock of Holdings began trading on March 28, 2005, the first trading day after the consummation of the Merger. Prior to that date, Kmart’s common stock was quoted on The NASDAQ Stock Market, under the ticker symbol KMRT. The quarterly high and low sales prices for Holdings’ common stock are set forth below.
| Fiscal Year 2009 | ||||||||||||
| Sears Holdings | ||||||||||||
| First Quarter |
Second Quarter |
Third Quarter |
Fourth Quarter | |||||||||
| Common stock price |
||||||||||||
| High |
$ | 62.81 | $ | 70.15 | $ | 78.37 | $ | 105.95 | ||||
| Low |
$ | 34.85 | $ | 49.87 | $ | 61.19 | $ | 66.89 | ||||
| Fiscal Year 2008 | ||||||||||||
| Sears Holdings | ||||||||||||
| First Quarter |
Second Quarter |
Third Quarter |
Fourth Quarter | |||||||||
| Common stock price |
||||||||||||
| High |
$ | 112.80 | $ | 103.75 | $ | 108.75 | $ | 58.58 | ||||
| Low |
$ | 90.30 | $ | 67.36 | $ | 46.51 | $ | 26.80 | ||||
Holdings has not paid dividends on its common stock since the consummation of the merger. Holdings does not expect to pay dividends in the foreseeable future.
Equity Compensation Plan Information
The following table reflects information about securities authorized for issuance under our equity compensation plans as of January 30, 2010.
| Plan Category |
(a) Number of securities to be issued upon exercise of outstanding options, warrants and rights |
(b) Weighted-average exercise price of outstanding options, warrants and rights |
(c) Number of securities remaining available for future issuance under equity compensation plans | |||
| Equity compensation plans approved by security holders |
— | — | 638,901 | |||
| Equity compensation plans not approved by security holders |
— | — | — | |||
| Total |
— | — | 638,901 |
16
Table of Contents
Stock Performance Graph
Comparison of Cumulative Stockholder Return—Value of $100 Invested March 28, 2005
The following graph compares the cumulative total return to stockholders on Holdings’ common stock from March 28, 2005, the first day of trading of our common stock after the Merger, through January 29, 2010, the last trading day before the end of our 2009 fiscal year, with the return on the S&P 500 Stock Index, the S&P 500 Retailing Index and the S&P 500 Department Stores Index for the same period. The graph assumes an initial investment of $100 on March 28, 2005 in each of our common stock, the S&P 500 Stock Index, the S&P Retailing Index and the S&P 500 Department Stores Index.
The S&P 500 Retailing Index consists of companies included in the S&P 500 Stock Index in the broadly defined retail sector, which includes competing retailers of softlines (apparel and domestics) and hardlines (appliances, electronics and home improvement products), as well as food and drug retailers. The S&P 500 Department Stores Index consists primarily of department stores that compete with our full-line stores.
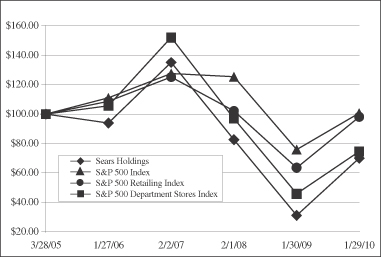
| March 28, 2005 |
Jan. 27, 2006 |
Feb. 2, 2007 |
Feb. 1, 2008 |
Jan. 30, 2009 |
Jan. 29, 2010 | |||||||||||||
| Sears Holdings |
$ | 100.00 | $ | 93.96 | $ | 135.10 | $ | 82.61 | $ | 31.21 | $ | 70.05 | ||||||
| S&P 500 Stock Index |
$ | 100.00 | $ | 110.99 | $ | 127.67 | $ | 125.33 | $ | 75.99 | $ | 100.60 | ||||||
| S&P 500 Retailing Index |
$ | 100.00 | $ | 108.74 | $ | 125.17 | $ | 102.15 | $ | 63.63 | $ | 98.15 | ||||||
| S&P 500 Department Stores Index |
$ | 100.00 | $ | 105.71 | $ | 152.02 | $ | 97.07 | $ | 45.85 | $ | 74.58 | ||||||
17
Table of Contents
Purchase of Equity Securities
The following table provides information about shares of common stock we acquired during the fourth quarter of fiscal 2009, including shares assigned to us as part of settlement agreements resolving claims arising from the Chapter 11 reorganization of Kmart Corporation. During the quarter ended January 30, 2010, we repurchased 0.9 million of our common shares at a total cost of $66 million under our common share repurchase program. As of January 30, 2010, we had $581 million of remaining authorization under the program.
| Total Number of Shares Purchased(1) |
Average Price Paid per Share |
Total Number of Shares Purchased as Part of Publicly Announced Program(2) |
Average Price Paid per Share for Publicly Announced Program |
Approximate Dollar Value of Shares that May Yet Be Purchased Under the Program | |||||||||
| November 1, 2009 to November 28, 2009 |
465,999 | $ | 71.95 | 465,489 | $ | 71.95 | |||||||
| November 29, 2009 to January 2, 2010 |
449,548 | 71.39 | 449,418 | 71.39 | |||||||||
| January 3, 2010 to January 30, 2010 |
3,769 | 92.72 | — | — | |||||||||
| Total |
919,316 | $ | 71.76 | 914,907 | $ | 71.68 | $ | 581,000,000 | |||||
| (1) | Includes 4,409 shares acquired from associates to meet withholding tax requirements from the vesting of restricted stock. These shares were acquired during the quarter as follows: |
| November 1, 2009 to November 28, 2009 |
510 | |
| November 29, 2009 to January 2, 2010 |
130 | |
| January 3, 2010 to January 30, 2010 |
3,769 | |
| Total |
4,409 | |
| (2) | Our common share repurchase program was initially announced on September 14, 2005 with a total authorization by our Board of Directors of up to $500 million. Subsequently, we announced that our Board of Directors authorized the repurchase of up to an additional $500 million of common stock on each of October 14, 2005, April 5, 2006 and September 12, 2006, $1.0 billion of common stock on July 10, 2007, $1.5 billion of common stock on August 13, 2007, and $500 million of common stock on each of May 29, 2008, December 2, 2008 and December 17, 2009 for a total authorization since inception of the program of $6.0 billion. The program has no stated expiration date. |
18
Table of Contents
| Item | 6. Selected Financial Data |
The table below summarizes our recent financial information. The data set forth below should be read in conjunction with “Management’s Discussion and Analysis of Financial Condition and Results of Operations” in Item 7 and our consolidated financial statements and notes thereto in Item 8.
| Fiscal | ||||||||||||||||||||
| dollars in millions, except per share and store data | 2009 | 2008 | 2007 | 2006(1) | 2005(1)(2) | |||||||||||||||
| Summary of Operations |
||||||||||||||||||||
| Total revenues(3) |
$ | 44,043 | $ | 46,770 | $ | 50,703 | $ | 53,016 | $ | 49,455 | ||||||||||
| Domestic comparable sales % |
(5.1 | )% | (8.0 | )% | (4.3 | )% | (3.7 | )% | (5.3 | )% | ||||||||||
| Income before cumulative effect of a change in accounting principle(4) |
235 | 53 | 826 | 1,492 | 947 | |||||||||||||||
| Cumulative effect of a change in accounting principle, net of tax(4) |
— | — | — | — | (90 | ) | ||||||||||||||
| Net income attributable to Holdings’ shareholders(4) |
235 | 53 | 826 | 1,492 | 857 | |||||||||||||||
| Per Common Share |
||||||||||||||||||||
| Basic: |
||||||||||||||||||||
| Income before cumulative effect of a change in accounting principle |
$ | 1.99 | $ | 0.42 | $ | 5.71 | $ | 9.59 | $ | 6.21 | ||||||||||
| Cumulative effect of change in accounting principle |
— | — | — | — | (0.59 | ) | ||||||||||||||
| Net income attributable to Holdings’ shareholders |
$ | 1.99 | $ | 0.42 | $ | 5.71 | $ | 9.59 | $ | 5.62 | ||||||||||
| Diluted: |
||||||||||||||||||||
| Income before cumulative effect of a change in accounting principle |
$ | 1.99 | $ | 0.42 | $ | 5.70 | $ | 9.58 | $ | 6.17 | ||||||||||
| Cumulative effect of change in accounting principle |
— | — | — | — | (0.59 | ) | ||||||||||||||
| Net income attributable to Holdings’ shareholders |
$ | 1.99 | $ | 0.42 | $ | 5.70 | $ | 9.58 | $ | 5.58 | ||||||||||
| Holdings’ book value per common share |
$ | 79.21 | $ | 76.91 | $ | 80.59 | $ | 82.60 | $ | 72.64 | ||||||||||
| Financial Data |
||||||||||||||||||||
| Total assets |
$ | 24,808 | $ | 25,342 | $ | 27,397 | $ | 29,906 | $ | 30,467 | ||||||||||
| Long-term debt |
1,123 | 1,527 | 1,922 | 2,109 | 2,488 | |||||||||||||||
| Long-term capital lease obligations |
575 | 605 | 684 | 734 | 786 | |||||||||||||||
| Capital expenditures |
361 | 497 | 570 | 508 | 552 | |||||||||||||||
| Number of stores |
3,921 | 3,918 | 3,847 | 3,791 | 3,843 | |||||||||||||||
| (1) | During the fourth quarter of 2007, Sears Canada changed its fiscal year end from the Saturday nearest December 31st to the Saturday nearest January 31st. This change was retrospectively applied to prior year amounts reported in the fiscal 2006 and 2005 columns as required by accounting standards for reporting changes in accounting. |
| (2) | Fiscal 2005 includes the results of Sears subsequent to the Merger date. As a result, fiscal 2005 results include approximately 44 weeks of Sears’ results and 52 weeks of Kmart’s results. |
| (3) | We follow a retail-based financial reporting calendar. Accordingly, our fiscal 2006 results reflect the 53-week period ended February 3, 2007 whereas fiscal years 2009, 2008, 2007, and 2005 contained 52-weeks. |
| (4) | The periods presented were impacted by certain significant items, which affected the comparability of amounts reflected in the above selected financial data. For fiscal 2009, 2008, and 2007, these significant items are discussed within Item 7, “Management’s Discussion and Analysis of Financial Condition and Results of Operations.” Fiscal 2006 results include the impact of a $74 million gain derived from our investments in total return swaps, $36 million related to the June 2006 settlement of Visa/MasterCard antitrust litigation, a tax benefit of $31 million related to the resolution of certain income tax matters, restructuring charges of $28 million, a $41 million gain on the sale of Kmart’s former headquarters building, and a charge of $74 million related to an unfavorable verdict in connection with a legal settlement. Fiscal year 2005 included a $90 million charge, net of taxes, due to the cumulative effect of a change in accounting principle pertaining to a change in accounting for certain indirect buying, warehousing and distribution costs and a $111 million charge for restructuring costs. |
19
Table of Contents
| Item 7. | Management’s Discussion and Analysis of Financial Condition and Results of Operations |
We have divided our “Management’s Discussion and Analysis of Financial Condition and Results of Operations” (“MD&A”) into the following six sections:
| • | Overview of Holdings |
| • | Results of Operations: |
Fiscal Year
Holdings’ Consolidated Results
Business Segment Results
| • | Analysis of Consolidated Financial Condition |
| • | Contractual Obligations and Off-Balance Sheet Arrangements |
| • | Application of Critical Accounting Policies and Estimates |
| • | Cautionary Statement Regarding Forward-Looking Information |
The discussion that follows should be read in conjunction with the consolidated financial statements and notes thereto included in Item 8.
OVERVIEW OF HOLDINGS
Holdings is the parent company of Kmart and Sears. We are a broadline retailer and, at the end of fiscal 2009, had 2,235 Kmart and domestic full-line stores and 1,284 specialty retail stores in the United States operating through Kmart and Sears and 402 full-line and specialty retail stores in Canada operating through Sears Canada, a 73%-owned subsidiary.
We currently conduct our operations in three reportable business segments: Kmart, Sears Domestic and Sears Canada. The nature of operations conducted within each of these segments is discussed within the “Business Segments” section of Item 1 in this report on Form 10-K. Our business segments have been determined in accordance with accounting standards regarding the determination, and reporting, of business segments.
The retail industry is highly competitive and as such, Holdings faces significant challenges, including the current macroeconomic environment, as many of our product categories are impacted by the housing market and availability of credit to our customers. In light of these challenges, we remain focused on leveraging our brand strength and service offerings as we strive to improve our multi-channel capabilities and give customers reasons to shop with us more frequently. Over the past 12 months, we have worked hard to improve our stores, while also taking steps to reposition ourselves for retail in the 21st century by adhering to the five key pillars of our strategy:
| • | Creating lasting relationships with customers by empowering them to manage their lives. From our Kenmore appliances, to our home and auto services; from our Lands’ End apparel, to our Sears and Kmart stores and online experiences, we interact with millions of customers every day. This gives us the foundation to strengthen and extend our relationships with our customers. During 2009, we focused on initiatives that increased the breadth and depth of our product offerings, improved our multi-channel capabilities, created platforms that better engage with customers, and improved our ability to deliver customer services and solutions. Specifically, we grew our online engagement platforms, MySears.com and MyKmart.com, allowing our customers to interact with each other and us and get advice from other customers before they buy. We also created the ShopYourWay rewards program, allowing us to leverage technology to improve the customer purchase cycle. We continuously aspire to provide our customers with a platform for whatever they want, wherever and whenever they want it. |
20
Table of Contents
| • | Attaining best in class productivity and efficiency. In 2009, we focused throughout the year on delivering quality products and services to our customers in a more productive and efficient manner. We delivered better results by focusing on product sourcing, supply chain efficiencies, franchising, labor model optimization, and consolidation of functions. Year over year, our gross margin rate improved 60 basis points and we reduced our selling and administrative expenses by over $400 million. We will continue to optimize our resource management to narrow the gap between our productivity and that of our competitors. |
| • | Building our brands. We believe that our proprietary brands provide us with a competitive advantage and we continue to explore alternative ways to enhance their value, especially the Kenmore, Craftsman, DieHard and Lands’ End brands. During 2009, we launched a new innovative collection of our Kenmore laundry products and introduced the Canvas collection from Lands’ End. We also launched or expanded new footwear brands, including Protégé, and introduced a complete product line for the home with the Cannon and Jaclyn Smith brands. In 2010, we expect to continue the update of our Kenmore brand by launching new, innovative products in the cooking and refrigeration categories. We also continue to look for ways to give more Americans more opportunities to purchase our brands, as evidenced by an announcement early in fiscal 2010 to license the DieHard trademarks to a third party, which will enable DieHard-brand power accessories and select products to be sold through other retailers throughout the United States, Puerto Rico and Mexico. We also announced in early 2010 that we will sell Craftsman and DieHard products through another domestic retailer beginning in May 2010. |
| • | Reinventing the Company continuously through technology and innovation. We improved convenience for our customers during 2009 by investing in technology. We also focused on becoming more innovative across all business units as we improved the customer experience on our websites, launched new mobile applications, including Sears2Go and Personal Shopper, and offered our customers multiple forms of payment both in-store and online, including express checkout, PayPal, eBillme, check electronification, and an expanded version of our successful Layaway program. |
| • | Reinforcing “The SHC Way” by living our values every day. During 2009, we strove to improve our work environment and our impact in the communities in which we live. We harnessed technology solutions to increase real-time feedback from our associates and customers, which has had a transformative impact on our culture and customer focus. We also made progress towards our commitment to environmental responsibility by launching a corporate environmental sustainability program and announcing a new sustainable paper procurement policy. Our community programs, such as Heroes at Home, the March of Dimes, and St. Jude’s Research Hospital, continue to grow, all of which are further evidence of a strengthened culture of excellence focused on customer service, transparency and teamwork. |
RESULTS OF OPERATIONS
Fiscal Year
Our fiscal year end is the Saturday closest to January 31st each year. Fiscal years 2009, 2008 and 2007 all consisted of 52 weeks. Unless otherwise stated, references to years in this report relate to fiscal years rather than to calendar years. The following fiscal periods are presented in this report.
| Fiscal year |
Ended | Weeks | ||
| 2009 |
January 30, 2010 | 52 | ||
| 2008 |
January 31, 2009 | 52 | ||
| 2007 |
February 2, 2008 | 52 |
21
Table of Contents
Holdings’ Consolidated Results
Holdings’ consolidated results of operations for fiscal 2009, 2008, and 2007 are summarized as follows:
| millions, except per share data | 2009 | 2008 | 2007(1) | |||||||||
| REVENUES |
||||||||||||
| Merchandise sales and services |
$ | 44,043 | $ | 46,770 | $ | 50,703 | ||||||
| COSTS AND EXPENSES |
||||||||||||
| Cost of sales, buying and occupancy |
31,824 | 34,118 | 36,638 | |||||||||
| Gross margin dollars |
12,219 | 12,652 | 14,065 | |||||||||
| Gross margin rate |
27.7 | % | 27.1 | % | 27.7 | % | ||||||
| Selling and administrative |
10,654 | 11,060 | 11,468 | |||||||||
| Selling and administrative expense as a percentage of total revenues |
24.2 | % | 23.6 | % | 22.6 | % | ||||||
| Depreciation and amortization |
926 | 981 | 1,049 | |||||||||
| Impairment charges |
— | 360 | — | |||||||||
| Gain on sales of assets |
(74 | ) | (51 | ) | (38 | ) | ||||||
| Total costs and expenses |
43,330 | 46,468 | 49,117 | |||||||||
| Operating income |
713 | 302 | 1,586 | |||||||||
| Interest expense |
(265 | ) | (272 | ) | (286 | ) | ||||||
| Interest and investment income |
33 | 46 | 135 | |||||||||
| Other income (loss) |
(61 | ) | 108 | 17 | ||||||||
| Income before income taxes |
420 | 184 | 1,452 | |||||||||
| Income taxes |
(123 | ) | (85 | ) | (550 | ) | ||||||
| Net income |
297 | 99 | 902 | |||||||||
| Income attributable to noncontrolling interests |
(62 | ) | (46 | ) | (76 | ) | ||||||
| NET INCOME ATTRIBUTABLE TO HOLDINGS’ SHAREHOLDERS |
$ | 235 | $ | 53 | $ | 826 | ||||||
| EARNINGS PER COMMON SHARE ATTRIBUTABLE TO HOLDINGS’ SHAREHOLDERS |
||||||||||||
| Diluted earnings per share |
$ | 1.99 | $ | 0.42 | $ | 5.70 | ||||||
| Diluted weighted average common shares outstanding |
117.9 | 127.0 | 144.8 | |||||||||
| (1) | During the fourth quarter of 2007, Sears Canada changed its fiscal year end from the Saturday nearest December 31st to the Saturday nearest January 31st. |
References to comparable store sales amounts within the following discussion include sales for all stores operating for a period of at least 12 full months, including remodeled and expanded stores, but excluding store relocations and stores that have undergone format changes. Comparable store sales results for fiscal 2009 were calculated based on the 52-week period ended January 30, 2010.
Fiscal 2009 Compared to Fiscal 2008
Net Income Attributable to Holdings’ Shareholders
We recorded net income attributable to Holdings’ shareholders of $235 million ($1.99 per diluted share) for fiscal 2009 and $53 million ($0.42 per diluted share) in fiscal 2008. Our results for fiscal 2009 and 2008 were affected by a number of significant items. Our net income, as adjusted for these significant items was $376 million ($3.19 per diluted share) for fiscal 2009 and $215 million ($1.69 per diluted share) for fiscal 2008. The increase in net income for the year reflects an increase in operating income of $411 million, primarily due to a decline in selling and administrative expenses and the below noted significant items, partially offset by a decline in gross margin dollars.
22
Table of Contents
In addition to net income determined in accordance with GAAP, we use certain non-GAAP measures in assessing our operating performance. We believe GAAP measures “As Adjusted” serve as appropriate measures to be used in evaluating the performance of our business and we adjust incentive compensation metrics for our executive management team for these same items. Furthermore, we believe our use of GAAP measures “As Adjusted,” including Diluted Income per Share “As Adjusted,” provides an appropriate measure to use in assessing our performance across periods, given that this measure provides an adjustment for certain significant items, the magnitude of which may vary significantly from period to period and, thereby, have a disproportionate effect on the earnings we report for a given period. Accordingly, we consider the aggregate impact of these items, along with reported results, in reviewing and evaluating our financial performance. However, we do not, and do not recommend that you solely use GAAP measures “As Adjusted” to assess our financial performance or to formulate investment decisions, as the measures may exclude a number of important cash and non-cash recurring items. The following tables set forth results of operations on a GAAP and “As Adjusted” basis, as well as the impact each significant item had on specific income and expense amounts reported in our Consolidated Statements of Income during fiscal years 2009, 2008 and 2007.
| Fiscal 2009 (Year ended January 30, 2010) | ||||||||||||||||||||||||||||||||
| millions, except per share data | GAAP | Domestic Pension Expense |
Mark-to- Market Gains |
Closed Store Reserve and Severance |
Gain on Sale of Sears Canada Headquarters |
Visa / MasterCard Settlement |
Tax Matters |
As Adjusted |
||||||||||||||||||||||||
| Cost of sales, buying and occupancy impact |
$ | 31,824 | $ | — | $ | — | $ | (37 | ) | $ | — | $ | — | $ | — | $ | 31,787 | |||||||||||||||
| Selling and administrative impact |
10,654 | (170 | ) | — | (82 | ) | — | 32 | — | 10,434 | ||||||||||||||||||||||
| Depreciation and amortization impact |
926 | — | — | (12 | ) | — | — | — | 914 | |||||||||||||||||||||||
| Gain on sales of assets impact |
(74 | ) | — | — | — | 44 | — | — | (30 | ) | ||||||||||||||||||||||
| Operating income impact |
713 | 170 | — | 131 | (44 | ) | (32 | ) | — | 938 | ||||||||||||||||||||||
| Other loss impact |
(61 | ) | — | 33 | — | — | — | — | (28 | ) | ||||||||||||||||||||||
| Income tax expense impact |
(123 | ) | (50 | ) | (8 | ) | (38 | ) | 10 | 10 | (41 | ) | (240 | ) | ||||||||||||||||||
| Noncontrolling interest impact |
(62 | ) | — | (9 | ) | (3 | ) | 12 | — | — | (62 | ) | ||||||||||||||||||||
| After tax and noncontrolling interest impact |
235 | 120 | 16 | 90 | (22 | ) | (22 | ) | (41 | ) | 376 | |||||||||||||||||||||
| Diluted income per share impact |
$ | 1.99 | $ | 1.02 | $ | 0.14 | $ | 0.77 | $ | (0.19 | ) | $ | (0.19 | ) | $ | (0.35 | ) | $ | 3.19 | |||||||||||||
23
Table of Contents
| Fiscal 2008 (Year ended January 31, 2009) | ||||||||||||||||||||||||||||||||
| millions, except per share data | GAAP | Impairments | Mark-to- Market Gains |
Closed Store Reserve and Severance |
Legal Settlement |
Repurchase of Debt Securities |
Tax Matters |
As Adjusted |
||||||||||||||||||||||||
| Cost of sales, buying and occupancy impact |
$ | 34,118 | $ | — | $ | — | $ | (36 | ) | $ | — | $ | — | $ | — | $ | 34,082 | |||||||||||||||
| Selling and administrative impact |
11,060 | — | — | (41 | ) | 62 | — | — | 11,081 | |||||||||||||||||||||||
| Impairment charges impact |
360 | (360 | ) | — | — | — | — | — | — | |||||||||||||||||||||||
| Operating income impact |
302 | 360 | — | 77 | (62 | ) | — | — | 677 | |||||||||||||||||||||||
| Interest expense impact |
(272 | ) | — | — | — | — | (13 | ) | — | (285 | ) | |||||||||||||||||||||
| Other income impact |
108 | — | (81 | ) | — | — | — | — | 27 | |||||||||||||||||||||||
| Income tax expense impact |
(85 | ) | (107 | ) | 26 | (30 | ) | 25 | 5 | (8 | ) | (174 | ) | |||||||||||||||||||
| Noncontrolling interest impact |
(46 | ) | (52 | ) | 22 | — | — | — | — | (76 | ) | |||||||||||||||||||||
| After tax and noncontrolling interest impact |
53 | 201 | (33 | ) | 47 | (37 | ) | (8 | ) | (8 | ) | 215 | ||||||||||||||||||||
| Diluted income per share impact |
$ | 0.42 | $ | 1.57 | $ | (0.26 | ) | $ | 0.37 | $ | (0.29 | ) | $ | (0.06 | ) | $ | (0.06 | ) | $ | 1.69 | ||||||||||||
| Fiscal 2007 (Year ended February 2, 2008) | ||||||||||||||||||||
| millions, except per share data | GAAP | Hurricane Related Recoveries |
Sears Canada Post- retirement Curtailment Gain |
Total Return Swap Loss |
As Adjusted | |||||||||||||||
| Selling and administrative impact |
$ | 11,468 | $ | 19 | $ | 27 | $ | — | $ | 11,514 | ||||||||||
| Operating income impact |
1,586 | (19 | ) | (27 | ) | — | 1,540 | |||||||||||||
| Interest and investment income impact |
135 | — | — | 14 | 149 | |||||||||||||||
| Income tax expense impact |
(550 | ) | 7 | 10 | (5 | ) | (538 | ) | ||||||||||||
| After tax and noncontrolling interest impact |
826 | (12 | ) | (17 | ) | 9 | 806 | |||||||||||||
| Diluted income per share impact |
$ | 5.70 | $ | (0.08 | ) | $ | (0.12 | ) | $ | 0.06 | $ | 5.56 | ||||||||
Contributions to our pension plans remain a significant use of our cash on an annual basis. While Sears Holdings’ pension plan is frozen, and thus associates do not currently earn pension benefits, we have a legacy pension obligation for past service performed by Kmart and Sears, Roebuck and Co. associates. The annual pension expense included in our financial statements related to these legacy domestic pension plans was relatively minimal in years prior to fiscal 2009. However, due to the severe decline in the capital markets that occurred in the latter part of 2008, our domestic pension expense increased by $170 million in 2009.
Total Revenues and Comparable Store Sales
Total revenues declined $2.8 billion, or 5.8%, to $44 billion, in fiscal 2009 from $46.8 billion in fiscal 2008. The decrease was primarily due to lower comparable store sales and the impact of having 62 fewer Kmart and Sears full-line stores in operation during 2009, and includes a $142 million decline due to foreign currency exchange rates.
Domestic comparable store sales declined 5.1% in the aggregate, and included a modest decline at Kmart of 0.8% and a decline at Sears Domestic of 8.7% in fiscal 2009. The decline in comparable store sales at Kmart was primarily driven by lower sales in the apparel and food and consumables categories, partially offset by increases in the toys category, as well as the benefit of assuming the operations of its footwear business from a third party effective January 2009. Declines in sales at Sears Domestic reflect decreases in the home appliance, lawn & garden, and home electronics categories.
24
Table of Contents
Gross Margin
We generated $12.2 billion in gross margin in fiscal 2009 and $12.7 billion in fiscal 2008. The total decline of $433 million primarily reflects the impact of lower overall sales on our gross margin and includes a $50 million decline related to the impact of foreign currency exchange rates on gross margin at Sears Canada. Our gross margin was also impacted by charges of $37 million and $36 million recorded in cost of sales for margin related expenses taken in connection with store closings announced during 2009 and 2008, respectively.
While gross margin dollars declined, our gross margin as a percentage of merchandise sales and services revenue (“gross margin rate”) increased 60 basis points to 27.7% in fiscal 2009 from 27.1% for fiscal 2008. The increase was a result of improvements in gross margin rate of 110 basis points at Sears Domestic, 20 basis points at Kmart, and 90 basis points at Sears Canada. Increases in our gross margin rate stem from improvements in merchandise cost and reduced clearance markdowns as a result of better inventory management.
Selling and Administrative Expenses
Our selling and administrative expenses decreased $406 million in 2009 to $10.7 billion, with the decrease mainly reflecting our focus on controlling costs given the economic environment. The decrease includes a $187 million reduction in payroll and benefits expense, a $180 million reduction in advertising expense, a $53 million reduction in insurance expense, and a decrease of $27 million related to the impact of foreign currency exchange rates. Selling and administrative expenses for 2009 were impacted by domestic pension plan expense of $170 million and store closing costs and severance of $82 million, partially offset by a gain of $32 million recorded in connection with the settlement of Visa/MasterCard antitrust litigation. Selling and administrative expenses for 2008 were impacted by a $41 million charge related to store closing and severance, as well as the positive impact of the reversal of a $62 million reserve because of a favorable verdict in connection with a legal settlement.
Selling and administrative expenses as a percentage of total revenues (“selling and administrative expense rate”) were 24.2% for fiscal 2009 and 23.6% for fiscal 2008. The increase in our selling and administrative expense rate is primarily the result of the above noted significant items, as well as lower expense leverage given lower overall sales.
Depreciation and Amortization
Depreciation and amortization expense decreased by $55 million during 2009 to $926 million. The decrease is primarily attributable to having fewer assets available for depreciation.
Impairment Charges
We recorded impairment charges of $360 million during fiscal 2008 related to impairment of goodwill and long-lived assets. We did not record any such impairments in fiscal 2009. Impairment charges recorded during fiscal 2008 are further described in Note 14 in Notes to Consolidated Financial Statements.
Gains on Sales of Assets
We recorded total gains on sales of assets of $74 million during fiscal 2009 and $51 million in fiscal 2008. The increase in gains on sales of assets was due to a $44 million gain recognized by Sears Canada on the sale of its former headquarters, as well as $13 million related to the sale of pharmacy lists for Kmart stores closed during the year. Gains on sales of assets in fiscal 2008 included a $32 million gain on the sale of Sears Canada’s Calgary downtown full-line store.
Sears Canada sold its headquarters office building and adjacent land in Toronto, Ontario in August 2007. Sears Canada leased back the property under a leaseback agreement through March 2009, at which time it
25
Table of Contents
finished its relocation of all head office operations to previously underutilized space in the Toronto Eaton Centre, Ontario. Given the terms of the leaseback, for accounting purposes, the excess of proceeds received over the carrying value of the associated property was deferred, and the resulting gain was recognized when Sears Canada no longer occupied the associated property.
Operating Income
Operating income was $713 million for fiscal 2009 and $302 million for fiscal 2008. Operating income increased $411 million and was the result of reductions in selling and administrative expenses, partially offset by lower gross margin dollars given lower overall sales. Operating income for fiscal 2009 includes expenses of $301 million related to domestic pension plans, store closings and severance, a $44 million gain recognized by Sears Canada on the sale of its former headquarters, and a $32 million gain recorded in connection with the settlement of Visa/MasterCard antitrust litigation. Operating income for fiscal 2008 included a charge of $437 million related to costs associated with asset impairments and store closings and severance, as well as the positive impact of the reversal of a $62 million reserve because of a favorable verdict in connection with a legal settlement.
Interest and Investment Income
We earned $33 million in interest and investment income in fiscal 2009 and $46 million for fiscal 2008. Interest and investment income includes dividends of $9 million and $10 million in fiscal 2009 and 2008, respectively, from our cost method investment in Sears Mexico, and interest income of $5 million and $25 million in fiscal 2009 and 2008, respectively. The decrease in interest income in fiscal 2009 was primarily due to lower yields received on short-term investments during the year, as well as lower average cash balances throughout the year.
Interest Expense
We incurred $265 million in interest expense during fiscal 2009 and $272 million in fiscal 2008. While our total debt balances declined throughout the year, our interest expense was flat to fiscal 2008 primarily due to an increase in amortization expense related to capitalized debt issuance costs related to our amended revolving credit facility.
Other Income (Loss)
Other income (loss) is primarily comprised of mark-to-market and settlement gains and losses on Sears Canada hedge transactions. Total net mark-to-market and settlement losses of $67 million were recorded on these transactions in fiscal 2009. Total net gains of $81 million were recorded on these transactions in fiscal 2008. See Notes 4 and 5 to the Consolidated Financial Statements for further information regarding these transactions.
Income Taxes
Our effective tax rate was 29.3% in fiscal 2009 and 46.2% in fiscal 2008. The decrease in our tax rate is primarily due to the resolution of certain federal and state income tax matters during 2009, which resulted in the recording of a $41 million tax benefit. Income tax expense in 2008 included a benefit of $8 million related to the resolution of certain tax matters, but was higher mainly due to a portion of our impairment charge for goodwill in fiscal 2008 not being deductible for tax purposes.
26
Table of Contents
Fiscal 2008 Compared to Fiscal 2007
Net Income Attributable to Holdings’ Shareholders
Net income attributable to Holdings’ shareholders was $53 million, or $0.42 per diluted share, for the fiscal year ended January 31, 2009 and $826 million, or $5.70 per diluted share, for the fiscal year ended February 2, 2008. Our results for fiscal 2008 and 2007 were affected by a number of significant items. Our net income, as adjusted for these significant items, was $215 million ($1.69 per diluted share) for fiscal 2008 and $806 million ($5.56 per diluted share) for fiscal 2007. The decrease in net income in fiscal 2008 reflects a decrease in operating income of $1.3 billion, primarily due to lower operating income at Kmart and Sears Domestic, as well as slightly lower operating income at Sears Canada, and the above noted significant items. The decrease in net income was also due to lower interest and investment income, partially offset by lower income tax expense.
Declines in the operating results of Sears Domestic and Kmart in 2008 were primarily the result of a decline in gross margin across most major merchandise categories, reflecting both sales declines, as well as an overall decline in our gross margin rate for fiscal 2008. Gross margin rate declined due to increased markdowns taken across most merchandise categories and reduced leverage of buying and occupancy costs. During 2008, we made a concerted effort to reduce our inventory levels due to the deterioration of the economic climate in the latter half of 2007 and what we anticipated to be a higher risk environment in 2008.
Total Revenues and Comparable Store Sales
Total revenues were $46.8 billion for fiscal 2008 and $50.7 billion for fiscal 2007. The decline in revenues of $3.9 billion was primarily due to a $2.5 billion decline at Sears Domestic, a $1.1 billion decline at Kmart, and a $366 million decline at Sears Canada, which included a decrease of $96 million related to the impact of exchange rates during fiscal 2008. Exchange rates did not have as significant an impact on the results of Sears Canada in 2008 as compared to 2007, as rates were less volatile. The decrease in fiscal 2008 revenues was primarily due to the impact of lower comparable store sales at Kmart and Sears Domestic.
Fiscal 2008 domestic comparable store sales were down 8.0% in the aggregate, with Sears Domestic declining 9.5% and Kmart declining 6.1%. In fiscal 2008, declines were experienced across most major merchandise categories. Comparable store sales declines at Sears Domestic were primarily driven by declines recorded in the apparel, tools and lawn and garden categories, and to a lesser degree by declines in the home appliances and household goods categories. Comparable store sales declines at Kmart were driven by declines recorded within the apparel and home categories. We believe the overall decline in comparable store sales in fiscal 2008 reflected the negative impact of certain external economic factors.
Gross Margin
Gross margin declined from $14.1 billion in fiscal 2007 to $12.7 billion in fiscal 2008. The decline of $1.4 billion was mainly attributable to lower gross margin dollars generated at both Kmart and Sears Domestic as a result of the above-noted sales declines, as well as a decline in the gross margin rate. Fiscal 2008 gross margin also includes a charge of $36 million recorded in cost of sales for margin related expenses taken in connection with store closings announced during the third and fourth quarters of the year.
Our gross margin rate was 27.1% in fiscal 2008 and 27.7% in fiscal 2007. The 60 basis point decline consisted of a 100 basis point decline at Sears Domestic and a 20 basis point decline at Kmart, partially offset by an increase of 10 basis points at Sears Canada. Our buying and occupancy costs are relatively fixed in nature, and therefore did not decrease as much as sales decreased during 2008. Reduced leverage of buying and occupancy costs, given lower overall sales levels in fiscal 2008, accounted for approximately 20 basis points of the total decline in our gross margin rate in fiscal 2008.
27
Table of Contents
The remaining 40 basis point decline was primarily the result of a decline in gross margin rate at Sears Domestic, which declined mainly due to increased markdown activity across most merchandise categories. The impact of increased markdowns on Sears Domestic throughout fiscal 2008 was somewhat mitigated by fewer markdowns taken in the seasonal and winter apparel category during the fourth quarter of 2008 as our purchases of merchandise were more consistent with the sales trends.
Selling and Administrative Expenses
Selling and administrative expenses decreased $408 million to $11.1 billion during fiscal 2008. The decrease includes a $259 million reduction in payroll and benefits expense, as well as a $94 million reduction in advertising expense. Fiscal 2008 selling and administrative expenses include a $41 million charge related to store closing and severance reserves and the positive impact of the reversal of a $62 million reserve because of a favorable verdict in connection with a legal settlement. Fiscal 2007 selling and administrative expenses include a $27 million curtailment gain recorded in connection with changes made to Sears Canada’s benefit plans and a $19 million gain related to insurance recoveries for certain Sears Domestic properties damaged by hurricanes during fiscal 2005.
Our selling and administrative expense rate was 23.6% in fiscal 2008 and 22.6% for fiscal 2007. While we took a number of actions to decrease our expenses during 2008, the selling and administrative expense rate increased, primarily reflecting lower expense leverage resulting from lower overall sales levels.
Depreciation and Amortization
Depreciation and amortization expense decreased by $68 million to $981 million during fiscal 2008. The decrease was primarily attributable to additional property and equipment becoming fully depreciated during the year, thereby decreasing our depreciable asset base.
Impairment Charges
In accordance with accounting standards governing the impairment or disposal of long-lived assets, we performed an impairment test of certain of our long-lived assets (principally the value of buildings and other fixed assets associated with our stores) due to events and changes in circumstances during the third quarter of 2008 that indicated an impairment might have occurred. The impairment review was triggered by the increased severity of the economic turmoil and weakening in the U.S. economy during the third quarter of 2008, which had a negative impact on the performance of our stores. As a result of this review, we recorded an impairment charge of $76 million during the third quarter of fiscal 2008. This impairment charge includes a charge for the 22 stores that we decided to close in the third quarter and early fourth quarter of 2008. We also recorded a $22 million impairment charge related to the property and equipment at 24 stores we decided to close in January 2009.
During the fourth quarter of 2008, we performed our annual impairment test of goodwill and intangible assets pursuant to accounting standards governing goodwill and other intangible assets. As a result of our tests, we recorded an impairment charge of $262 million related to the fair value of goodwill associated with our OSH subsidiary. Accounting standards require interim tests for impairment of goodwill and intangible assets be performed should indicators of such an impairment arise as a result of changes in existing business conditions. We did not perform an interim test of goodwill during fiscal 2008 as we did not have any indicators of potential impairment prior to the fourth quarter.
See Note 14 in Notes to Consolidated Financial Statements for further information regarding the $360 million of impairment charges we recorded during fiscal 2008.
28
Table of Contents
Operating Income
We reported operating income of $302 million in fiscal 2008 and $1.6 billion for fiscal 2007. The decline in our operating income in fiscal 2008 was mainly due to lower gross margin dollars, partially offset by a decrease in selling and administrative expense, as well as lower depreciation and amortization expense. Our operating income for fiscal 2008 includes expenses of $437 million related to impairment, store closings, and severance charges discussed above, as well as the positive impact of the reversal of a $62 million reserve because of a favorable verdict in connection with a pre-merger legal matter. Our operating income for fiscal 2007 includes gains of $46 million recorded in connection with changes made to Sears Canada’s benefit plans, as well as insurance recoveries.
Interest and Investment Income
We earned $46 million in interest and investment income in fiscal 2008 and $135 million in fiscal 2007. Interest and investment income was mainly comprised of interest income of $25 million and $107 million for fiscal 2008 and 2007, respectively, and a dividend of $10 million and $20 million, respectively, from our investment in Sears Mexico. Interest and investment income for fiscal 2007 was partially offset by investment losses of $14 million on total return swaps outstanding during the fiscal year ended February 2, 2008. The decrease in interest income in fiscal 2008 is primarily due to lower overall cash and cash equivalent balances maintained during the first three quarters of fiscal 2008.
Interest Expense
We incurred interest expense of $272 million during fiscal 2008 and $286 million during fiscal 2007. The reduction in interest expense is mainly the result of a reduction in long-term borrowings and lower short-term interest rates, partially offset by an increase in the amount of short-term borrowings under our revolving credit facility.
Other Income
Other income in fiscal 2008 was primarily comprised of mark-to-market gains on Sears Canada hedge transactions. Total net gains of $81 million were recorded on these transactions in fiscal 2008. Other income also includes gains on negotiated repurchases of debt securities prior to their maturity and bankruptcy-related recoveries. We recorded $13 million in gains related to the repurchases of debt securities in fiscal 2008. We had no comparable gains in fiscal 2007. We recorded $5 million of bankruptcy-related recoveries during fiscal 2008 and $18 million of such recoveries in fiscal 2007. Bankruptcy-related recoveries represent amounts collected from vendors who had received cash payment for pre-petition obligations. See Note 10 of Notes to Consolidated Financial Statements for further information on bankruptcy claims resolution and settlements.
Income Taxes
Our effective tax rate in fiscal 2008 was 46.2% and 37.9% in fiscal 2007. The increase in our tax rate is primarily due to a portion of our impairment charge for goodwill not being deductible for tax purposes. Income tax expense in 2008 also includes a benefit of $8 million related to the resolution of certain tax matters.
29
Table of Contents
Business Segment Results
Kmart
Kmart results and key statistics were as follows:
| millions, except for number of stores | 2009 | 2008 | 2007 | |||||||||
| Merchandise sales and services |
$ | 15,743 | $ | 16,219 | $ | 17,256 | ||||||
| Cost of sales, buying and occupancy |
12,038 | 12,442 | 13,202 | |||||||||
| Gross margin dollars |
3,705 | 3,777 | 4,054 | |||||||||
| Gross margin rate |
23.5 | % | 23.3 | % | 23.5 | % | ||||||
| Selling and administrative |
3,386 | 3,456 | 3,537 | |||||||||
| Selling and administrative expense as a percentage of total revenues |
21.5 | % | 21.3 | % | 20.5 | % | ||||||
| Depreciation and amortization |
152 | 138 | 116 | |||||||||
| Impairment charges |
— | 21 | — | |||||||||
| Gain on sales of assets |
(23 | ) | (10 | ) | (1 | ) | ||||||
| Total costs and expenses |
15,553 | 16,047 | 16,854 | |||||||||
| Operating income |
$ | 190 | $ | 172 | $ | 402 | ||||||
| Total Kmart stores |
1,327 | 1,368 | 1,382 | |||||||||
Fiscal 2009 Compared to Fiscal 2008
Total Revenues and Comparable Store Sales
Kmart’s comparable store sales and total sales declined 0.8% and 2.9%, respectively, in fiscal 2009. The decline in total revenues primarily reflects the impact of having 41 fewer stores in operation. The 0.8% decline in Kmart comparable store sales during fiscal 2009 was primarily driven by declines in the apparel and food and consumables categories. This decline was partially offset by the benefit of assuming the operations of its footwear business from a third party effective January 2009, as well as an increase in the toys category.
Gross Margin
Kmart generated $3.7 billion in gross margin in fiscal 2009 and $3.8 billion in fiscal 2008. The $72 million decline is mainly a result of the impact of lower overall sales on Kmart’s gross margin and includes a $27 million charge recorded in cost of sales for margin related expenses taken in connection with store closings in 2009. Gross margin for 2008 included a charge of $15 million recorded in cost of sales for margin related expenses taken in connection with store closings announced during that year. Kmart’s gross margin rate increased 20 basis points to 23.5%, from 23.3% in fiscal 2008, mainly as a result of improvements in merchandise cost and reduced clearance markdowns as a result of better inventory management.
Selling and Administrative Expenses
Kmart’s selling and administrative expenses decreased $70 million to $3.4 billion in fiscal 2009. The decline in selling and administrative expenses primarily reflects a reduction in payroll expenses of $38 million, a reduction in advertising expenses of $20 million, as well as reductions in various other expense categories. Selling and administrative expenses for 2009 include charges related to store closings and severance of $35 million, as well as a $17 million gain related to settlement of Visa/MasterCard antitrust litigation. Selling and administrative expenses for 2008 include charges of $12 million related to store closings and severance. Our selling and administrative expense rate was 21.5% for fiscal 2009 and 21.3% in fiscal 2008, and increased primarily as a result of the above noted significant items, as well as lower expense leverage given lower overall sales.
30
Table of Contents
Depreciation and Amortization
Depreciation and amortization expense increased by $14 million in fiscal 2009 to $152 million. The increase is primarily due to the addition of property and equipment in the Kmart segment during the year.
Impairment Charges
We recorded impairment charges of $21 million during fiscal 2008 related to impairment of goodwill and long-lived assets. We did not record any such impairments in fiscal 2009. Impairment charges recorded during fiscal 2008 are further described in Note 14 in Notes to Consolidated Financial Statements.
Operating Income
Kmart recorded operating income of $190 million in fiscal 2009 and $172 million in fiscal 2008. Kmart’s operating income for 2009 includes expenses of $65 million related to store closings and severance, partially offset by a $17 million gain related to settlement of Visa/MasterCard antitrust litigation. Kmart’s operating income for 2008 includes expenses of $48 million related to impairment charges and store closings and severance.
Fiscal 2008 Compared to Fiscal 2007
Total Revenues and Comparable Store Sales
Comparable store sales and total sales decreased 6.1% and 6.0%, respectively, during fiscal 2008. Kmart recorded a 4.7% decline in comparable store sales for fiscal 2007. Comparable store sales declines were driven by declines recorded within the apparel and home categories. We believe the overall decline in comparable store sales in fiscal 2008 reflected the negative impact of certain external economic factors.
Gross Margin
Kmart generated $3.8 billion in total gross margin in fiscal 2008 and $4.1 billion in fiscal 2007. The $277 million decline primarily reflects the negative gross margin impact of lower overall sales, as well as a decline in Kmart’s gross margin rate and includes a charge of $15 million recorded in cost of sales for margin related expenses taken in connection with store closings announced during the third and fourth quarters of 2008. Kmart’s gross margin rate was 23.3% in fiscal 2008 and 23.5% in fiscal 2007, a decrease of 0.2%. The decrease in Kmart’s gross margin rate is due to an increase of 0.5% in buying and occupancy costs (which are more fixed in nature) as a percentage of sales, offset by an increase in margin related to lower royalties paid on select merchandise.
Selling and Administrative Expenses
Fiscal 2008 selling and administrative expenses decreased $81 million to $3.5 billion. The decline in selling and administrative expenses mainly reflects a $68 million reduction in payroll expenses, as well as a $14 million reduction in advertising costs. These reductions were partially offset by expenses incurred for certain store closing and severance costs of $12 million. Our selling and administrative expense rate was 21.3% for fiscal 2008 and 20.5% for fiscal 2007, and increased primarily as a result of lower expense leverage given lower overall sales.
Depreciation and Amortization
Depreciation and amortization expense increased by $22 million to $138 million in fiscal 2008. The increase in expense was due to the addition of property and equipment in the Kmart segment during the year.
31
Table of Contents
Impairment Charges
Kmart recorded an impairment charge of $20 million during the third quarter of fiscal 2008 in connection with impairment testing performed in accordance with accounting standards governing the impairment or disposal of long-lived assets. We recorded an additional impairment of $1 million during the fourth quarter of 2008 related to our decision to close additional Kmart stores in January 2009. See Note 14 to the Consolidated Financial Statements for further information regarding impairment charges.
Operating Income
Operating income was $172 million in fiscal year 2008 and $402 million in fiscal 2007, a decline of $230 million. As discussed above, declines primarily reflect the negative gross margin impact of lower sales levels, as well as a slight decline in Kmart’s gross margin rate in 2008. In addition to the above-noted decline in gross margin, the decline in operating income reflects, to a lesser degree, the impact of $48 million of charges recorded in connection with fixed asset impairments, store closings and severance in 2008.
Sears Domestic
Sears Domestic results and key statistics were as follows:
| millions, except for number of stores | 2009 | 2008 | 2007 | |||||||||
| Merchandise sales and services |
$ | 23,672 | $ | 25,315 | $ | 27,845 | ||||||
| Cost of sales, buying and occupancy |
16,653 | 18,084 | 19,589 | |||||||||
| Gross margin dollars |
7,019 | 7,231 | 8,256 | |||||||||
| Gross margin rate |
29.7 | % | 28.6 | % | 29.6 | % | ||||||
| Selling and administrative |
6,220 | 6,415 | 6,698 | |||||||||
| Selling and administrative expense as a percentage of total revenues |
26.3 | % | 25.3 | % | 24.1 | % | ||||||
| Depreciation and amortization |
672 | 724 | 802 | |||||||||
| Impairment charges |
— | 339 | — | |||||||||
| Gain on sales of assets |
(6 | ) | (10 | ) | (28 | ) | ||||||
| Total costs and expenses |
23,539 | 25,552 | 27,061 | |||||||||
| Operating income (loss) |
$ | 133 | $ | (237 | ) | $ | 784 | |||||
| Number of: |
||||||||||||
| Full-line stores(1) |
908 | 929 | 935 | |||||||||
| Specialty stores |
1,284 | 1,233 | 1,150 | |||||||||
| Total Domestic Sears stores |
2,192 | 2,162 | 2,085 | |||||||||
| (1) | Fiscal 2009 includes 848 full-line stores and 60 Sears Essentials/Grand stores; Fiscal 2008 includes 856 full-line stores and 73 Sears Essentials/Grand stores; Fiscal 2007 includes 860 full-line stores and 75 Sears Essentials/Grand stores |
Fiscal 2009 Compared to Fiscal 2008
Total Revenues and Comparable Store Sales
Sears Domestic’s comparable store sales and total sales declined 8.7% and 6.5%, respectively, during fiscal 2009. The decline in total revenues primarily reflects the impact of lower comparable store sales and includes the impact of having 21 fewer full-line stores in operation. Comparable store sales declines were driven by decreases in the home appliance, lawn & garden, and home electronics categories.
32
Table of Contents
Gross Margin
Sears Domestic’s gross margin dollars declined $212 million to $7 billion in 2009. The decline was mainly a result of the impact of lower overall sales on Sears Domestic’s gross margin and included a $10 million charge recorded in cost of sales for margin related expenses taken in connection with store closings. Sears Domestic’s gross margin for 2008 included a $21 million charge for markdowns recorded in connection with store closings. Sears Domestic’s gross margin rate was 29.7% in fiscal 2009 and 28.6% in fiscal 2008, an increase of 110 basis points. The increase in gross margin rate was mainly the result of improvements in merchandise cost and reduced clearance markdowns as a result of better inventory management.
Selling and Administrative Expenses
Sears Domestic’s selling and administrative expenses decreased $195 million to $6.2 billion in fiscal 2009, with the decrease mainly reflecting a focus on controlling costs. The decrease includes a reduction in payroll and benefits expense of $148 million, a reduction in advertising expenses of $82 million, and was offset by slight increases in various other expense categories. Selling and administrative expenses for 2009 were impacted by domestic pension plan expense of $170 million, store closing costs and severance of $39 million, and a $15 million gain related to settlement of Visa/MasterCard antitrust litigation. Selling and administrative expenses for 2008 were impacted by the positive impact of the reversal of a $62 million reserve because of a favorable verdict in connection with a legal settlement and a $29 million charge related to store closing and severance.
Our selling and administrative expense rate was 26.3% for fiscal 2009 and 25.3% for fiscal 2008. The increase in our selling and administrative expense rate is primarily the result of the significant items noted above.
Depreciation and Amortization
Depreciation and amortization expense decreased by $52 million to $672 million during fiscal 2009. The decrease is primarily attributable to having fewer assets available for depreciation.
Impairment Charges
We recorded impairment charges of $339 million during fiscal 2008 related to impairment of goodwill and long-lived assets. We did not record any such impairments in fiscal 2009. Impairment charges recorded during fiscal 2008 are further described in our discussion of “Fiscal 2008 Compared to Fiscal 2007” and our discussion of critical accounting policies in Note 14 in Notes to Consolidated Financial Statements.
Operating Income
Sears Domestic reported operating income of $133 million in fiscal 2009 and an operating loss of $237 million in fiscal 2008. The increase in Sears Domestic’s operating results was primarily the result of the above noted significant items and reductions in selling and administrative expenses, partially offset by lower gross margin dollars given lower overall sales. Operating income in 2009 includes expenses of $228 million related to domestic pension plans and store closings and severance, as well as a $15 million gain related to settlement of Visa/MasterCard antitrust litigation. The operating loss for 2008 includes the above-noted impairment and store closing charges of $389 million and the positive impact of the reversal of a $62 million reserve because of a favorable verdict in connection with a pre-merger legal matter.
Fiscal 2008 Compared to Fiscal 2007
Total Revenues and Comparable Store Sales
Merchandise sales and services revenues declined $2.5 billion, or 9.1%, to $25.3 billion for fiscal 2008 from $27.8 billion for fiscal 2007. The decline in fiscal 2008 was due primarily to an aggregate 9.5% decrease in
33
Table of Contents
comparable store sales. Comparable store sales declines were primarily driven by declines recorded in the apparel, tools and lawn and garden categories, and to a lesser degree by declines in the home appliances and household goods categories.
Gross Margin
Sears Domestic generated $7.2 billion in total gross margin for fiscal 2008 and $8.3 billion in fiscal 2007, a decline of $1.1 billion. The decline primarily reflects the negative margin impact of lower overall sales levels, as well as a decline in Sears Domestic’s gross margin rate for the year, and includes a $21 million charge recorded in cost of sales for margin related expenses taken in connection with store closings. Sears Domestic’s gross margin rate was 28.6% in fiscal 2008 and 29.6% in fiscal 2007, a decline of 100 basis points.
Reduced leverage of buying and occupancy costs, given lower overall sales levels, accounted for approximately 10 basis points of the total decline in fiscal 2008, with the remaining 90 basis point decline attributable to gross margin rate declines across a number of merchandise categories, most notably home appliances and apparel. While we tightly managed inventory levels all year, with the goal of reducing inventory to below last year’s levels, the economic environment resulted in increased markdowns, which was the primary reason for the remaining 90 basis point decline in Sears Domestic’s gross margin rate. Gross margin rate decreases in the apparel category were mainly the result of markdowns taken to clear seasonal merchandise. The decline in gross margin rate for Sears Domestic was not as great during the fourth quarter of fiscal 2008 as purchases of seasonal and winter apparel became more consistent with current sales trends.
Selling and Administrative Expenses
Selling and administrative expenses declined $283 million during fiscal 2008, which includes a reduction in payroll expenses of $192 million, as well as a decrease in advertising costs of $56 million. Fiscal 2008 selling and administrative expenses include a $29 million charge related to store closing and severance reserves, the positive impact of the reversal of a $62 million reserve because of a favorable verdict in connection with a legal settlement, as well as insurance proceeds of $23 million related to a Sears, Roebuck and Co. matter from March 2000. Selling and administrative expenses for fiscal 2007 include a gain of $19 million for insurance recoveries received on claims filed for certain property damaged by hurricanes during fiscal 2005.
Sears Domestic’s selling and administrative expense rate was 25.3% for fiscal 2008 and 24.1% for fiscal 2007. The increase in the selling and administrative expense rate for fiscal 2008 primarily reflects the impact of lower expense leverage given lower overall sales results.
Depreciation and Amortization
Depreciation and amortization expense decreased by $78 million to $724 million during fiscal 2008. The decrease in fiscal 2008 is primarily attributable to additional property and equipment becoming fully depreciated during the year, thereby decreasing our depreciable asset base.
Impairment Charges
Sears Domestic recorded an impairment charge of $56 million during the third quarter of fiscal 2008 in connection with impairment testing performed in accordance with accounting standards governing the impairment or disposal of long-lived assets. We recorded an additional impairment of $21 million during the fourth quarter of 2008 related to our decision to close additional Sears Domestic stores in January 2009. See Notes 14 in Notes to Consolidated Financial Statements for further information regarding impairment charges.
During the fourth quarter of fiscal 2008, we performed our annual goodwill and intangible assets impairment pursuant to accounting standards governing goodwill and other intangible assets. The goodwill
34
Table of Contents
impairment test involves a two-step process as described in the “Summary of Significant Accounting Policies” in Note 1 below. The first step is a comparison of each reporting unit’s fair value to its carrying value. If the carrying value of the reporting unit is higher than its fair value, there is an indication that impairment may exist and the second step must be performed to measure the amount of impairment loss. As a result of impairment analysis, we determined that the entire amount of goodwill recorded at Sears Domestic’s subsidiary, OSH, was impaired and recorded a charge of $262 million. See Note 14 to the Consolidated Financial Statements for further information regarding impairment charges.
Operating Income (Loss)
Sears Domestic recorded an operating loss of $237 million in fiscal 2008 and operating income of $784 million in fiscal 2007, a decline of $1.0 billion. In addition to the significant items noted above, the decline in operating income primarily reflects lower total gross margin dollars generated as a result of lower overall sales levels and a decline in gross margin rate, partially offset by a reduction in selling and administrative expenses.
Sears Canada
Sears Canada, a consolidated, 73%-owned subsidiary of Sears, conducts similar retail operations as Sears Domestic. Sears Canada results and key statistics were as follows:
| millions, except for number of stores | 2009 | 2008 | 2007 | |||||||||
| Merchandise sales and services |
$ | 4,628 | $ | 5,236 | $ | 5,602 | ||||||
| Cost of sales, buying and occupancy |
3,133 | 3,592 | 3,847 | |||||||||
| Gross margin dollars |
1,495 | 1,644 | 1,755 | |||||||||
| Gross margin rate |
32.3 | % | 31.4 | % | 31.3 | % | ||||||
| Selling and administrative |
1,048 | 1,189 | 1,233 | |||||||||
| Selling and administrative expense as a percentage of total revenues |
22.6 | % | 22.7 | % | 22.0 | % | ||||||
| Depreciation and amortization |
102 | 119 | 131 | |||||||||
| Gain on sales of assets |
(45 | ) | (31 | ) | (9 | ) | ||||||
| Total costs and expenses |
4,238 | 4,869 | 5,202 | |||||||||
| Operating income |
$ | 390 | $ | 367 | $ | 400 | ||||||
| Number of: |
||||||||||||
| Full-line stores |
122 | 122 | 121 | |||||||||
| Specialty stores |
280 | 266 | 259 | |||||||||
| Total Sears Canada stores |
402 | 388 | 380 | |||||||||
Fiscal 2009 Compared to Fiscal 2008
Total Revenues
Sears Canada’s total revenues decreased 11.6% in fiscal 2009. The decrease in total revenues of $608 million includes a $142 million decline due to the impact of exchange rates. On a Canadian dollar basis, revenues decreased by $466 million, reflecting lower comparable stores sales across all major categories. The decline in comparable store sales is mainly the result of lower sales in Sears Canada’s Full-line, Direct, Home, Dealer and Outlet channels, partially offset by higher sales in Corbeil stores.
Gross Margin
Total gross margin dollars decreased $149 million to $1.5 billion for fiscal 2009 and include a $50 million decline due to the impact of exchange rates. Gross margin decreased $99 million on a Canadian dollar basis as a
35
Table of Contents
result of lower overall sales. Sears Canada’s gross margin rate increased to 32.3% in fiscal 2009 from 31.4% in fiscal 2008 primarily as a result of improved inventory management.
Selling and Administrative Expenses
Sears Canada’s selling and administrative expenses declined $141 million to $1 billion in 2009 and include severance expenses of $8 million recorded during the year. The decrease in expenses primarily reflects a reduction in advertising expenses during fiscal 2009, as well as a decline of $27 million due to the impact of exchange rates. Sears Canada’s selling and administrative expense rate was 22.6% in fiscal 2009 and 22.7% in fiscal 2008, and decreased primarily as a result of the noted decline in selling and administrative expenses.
Gains on Sales of Assets
Sears Canada recorded total gains on sales of assets of $45 million during 2009 and $31 million in fiscal 2008. During fiscal 2009, Sears Canada recognized a previously deferred $44 million gain related to the August 2007 sale of its former headquarters. During fiscal 2008, Sears Canada benefited from a $32 million gain from the sale of its Calgary downtown full-line store.
Operating Income
Sears Canada’s operating income increased $23 million to $390 million in fiscal 2009. The increase in operating income includes an $18 million decline due to the impact of foreign currency exchange rates. The increase of $41 million on a Canadian dollar basis reflects the above noted decreases in selling and administrative expenses and increase in gains on sales of assets, which were partially offset by a decrease in gross margin dollars given lower overall sales.
Fiscal 2008 Compared to Fiscal 2007
Total Revenues
Sears Canada’s total revenues decreased by $366 million, or 6.5%, to $5.2 billion for fiscal 2008. The decrease in total revenues includes a $96 million decline due to the impact of unfavorable exchange rates. On an equivalent Canadian dollar basis, revenues decreased by $270 million, primarily reflecting a decrease in Sears Canada’s sales at their Full-line, Home, Outlet, and Direct formats. These declines were partially offset by an increase in revenues from services and credit programs.
Gross Margin
Total gross margin dollars decreased $111 million to $1.6 billion in fiscal 2008 and include a $30 million decline due to the impact of unfavorable exchange rates during the year. Gross margin decreased $81 million on a Canadian dollar basis primarily due to the impact of lower overall sales for the year. For fiscal 2008, Sears Canada’s gross margin rate increased to 31.4% from 31.3% in fiscal 2007 due mainly to improved inventory management.
Selling and Administrative Expenses
Sears Canada’s selling and administrative expenses declined $44 million to $1.2 billion in fiscal 2008. The decline in selling and administrative expenses includes a decline of $24 million due to the impact of exchange rates during the quarter. The remaining decline is mainly due to Sears Canada’s continued efforts to reduce advertising and payroll and benefits expenses. Selling and administrative expenses for fiscal 2007 include a $27 million curtailment gain recorded in connection with changes made to Sears Canada’s post-retirement benefit plans.
36
Table of Contents
Operating Income
Sears Canada’s operating income decreased $33 million to $367 million in fiscal 2008. The decrease in operating income includes a $6 million decline due to the negative impact of foreign currency exchange rates and reflects the above noted decreases in sales, gross margin and selling and administrative expenses. In addition, Sears Canada benefited from a $32 million gain on the sale of its Calgary downtown full-line store during fiscal 2008.
ANALYSIS OF CONSOLIDATED FINANCIAL CONDITION
Cash Balances
Cash and cash equivalents include all highly liquid investments with original maturities of three months or less at the date of purchase. Our cash and cash equivalents balances as of the fiscal years ended January 30, 2010 and January 31, 2009 are detailed in the following table.
| millions | January 30, 2010 |
January 31, 2009 | ||||
| Domestic |
||||||
| Cash and equivalents |
$ | 221 | $ | 337 | ||
| Cash posted as collateral |
9 | 14 | ||||
| Credit card deposits in transit |
168 | 159 | ||||
| Total domestic cash and cash equivalents |
398 | 510 | ||||
| Sears Canada |
1,291 | 663 | ||||
| Total cash and cash equivalents |
1,689 | 1,173 | ||||
| Restricted cash |
11 | 124 | ||||
| Total cash balances |
$ | 1,700 | $ | 1,297 | ||
We had total cash balances of $1.7 billion at January 30, 2010 and $1.3 billion at January 31, 2009. The increase in cash and cash equivalents from January 31, 2009 primarily reflects an increase in net operating cash flows generated during fiscal 2009 due to increased income and increased cash generated from working capital balances. Primary uses of cash for fiscal 2009 included repayments of $452 million on total outstanding debt balances, $424 million for share repurchases, capital expenditures of $361 million, and contributions to our pension and post-retirement benefit plans of $209 million.
Our invested cash may include, from time to time, investments in, but not limited to, commercial paper, U.S. federal, state and municipal government securities, floating-rate notes, repurchase agreements and money market funds. Cash amounts held in these short-term investments are readily available to us and included $1 million and $7 million as of fiscal year end 2009 and fiscal year end 2008, respectively, invested in support of our wholly owned insurance subsidiary.
Credit card deposits in transit include deposits in-transit from banks for payments related to third-party credit card and debit card transactions.
Restricted cash consists of cash related to Sears Canada’s cash balances, which have been pledged as collateral for letters of credit obligations issued under its offshore merchandise purchasing program and with counterparties related to outstanding derivative contracts, as well as funds held in trust in accordance with regulatory requirements governing advance ticket sales related to Sears Canada’s travel business.
Our January 31, 2009 cash balance excluded $38 million on deposit with The Reserve Primary Fund, a money market fund that temporarily suspended withdrawals while it liquidated its holdings to generate cash to
37
Table of Contents
distribute. As a result, we reclassified $38 million from cash to the prepaid expenses and other current assets line within our Consolidated Balance Sheet at January 31, 2009.
We classify outstanding checks in excess of funds on deposit within other current liabilities and reduce cash balances when these checks clear the bank on which they were drawn. Outstanding checks in excess of funds on deposit were $116 million and $228 million for the fiscal year ended 2009 and 2008, respectively.
Investment of Available Capital
Since the Merger, we have generated significant operating cash flows, and management expects that our cash flows will continue to exceed our annual operating cash needs for the foreseeable future. We have and will continue to invest in our businesses to improve the customer experience and provide the opportunity for attractive returns. Further, as of January 30, 2010, we have repurchased approximately $5.4 billion of our common shares since the Merger and may continue to repurchase shares subject to market conditions and board authorization. In addition, we may pursue investments in the form of acquisitions, joint ventures and partnerships where we believe appropriate returns can be obtained. Further, we may determine under certain market conditions that available capital is best utilized to fund investments that we believe offer us attractive return opportunities, whether or not related to our ongoing business activities.
Our Board of Directors has delegated authority to direct investment of our surplus cash to our Chairman, Edward S. Lampert, subject to various limitations that have been or may be from time to time adopted by the Board of Directors and/or Finance Committee of the Board of Directors. During fiscal 2007, we invested a portion of our surplus cash in various securities and financial instruments, including total return swaps, which are derivative instruments that synthetically replicate the economic return characteristics of one or more underlying marketable equity securities. We had no investments in total return swaps during fiscal years 2009 or 2008.
Operating Activities and Cash Flows
Holdings generated $1.5 billion in operating cash flows during fiscal 2009 and $992 million in fiscal 2008. As a retailer, Holdings’ primary source of operating cash flows is the sales of goods and services to customers, while the primary use of cash in operations is to fund the purchase of merchandise inventories. The increase in operating cash flows in fiscal 2009 is mainly the result of increases in cash from these sources of working capital, as well as increased net income.
Our cash flow from operations was partially offset by the purchase of insurance coverage for workers’ compensation claims in the second and fourth quarters of 2009. We use a combination of third-party insurance and self-insurance for our insurable risks. During 2009, we paid $126 million to purchase insurance coverage for certain of our workers’ compensation risks from fiscal 2006 and years prior. The insurance allowed us to limit our risk for these workers’ compensation matters, although we are not indemnified from liability for these matters. Accordingly, the payments were recorded as deposits. These transactions also allowed us to reduce the amount of letters of credit used as collateral for our insurance programs by $212 million. The premium payments associated with these transactions are reported as cash used in operating activities.
Holdings generated $992 million in operating cash flows during fiscal 2008 and $1.5 billion in fiscal 2007. The decrease in net operating cash flows generated during fiscal 2008 primarily reflects lower income, partially offset by an increase in cash generated from inventory reductions during the year.
Merchandise inventories declined $90 million to $8.7 billion at January 30, 2010 from $8.8 billion at January 31, 2009. Inventory levels at Sears Canada increased $13 million due to the impact of foreign currency exchange rates. Merchandise payables were $3.3 billion at January 30, 2010 and $3.0 billion as of January 31, 2009. The increase in merchandise payables is reflective of improved cash management in fiscal 2009.
38
Table of Contents
Investing Activities and Cash Flows
Net cash flows used in investing activities totaled $172 million in fiscal 2009, $637 million in fiscal 2008 and $437 million in fiscal 2007. Cash used in investing activities in all three years was primarily used for purchases of property and equipment.
We spent $361 million on capital expenditures during fiscal 2009, $497 million during fiscal 2008 and $570 million during fiscal 2007. Capital expenditures during fiscal 2009 included investments in information technology and infrastructure for the stores and distribution centers. Capital expenditures during fiscal 2008 included ongoing investments in the maintenance of the company’s facilities (including a significant investment in lighting retrofit projects to reduce energy consumption in Holdings’ facilities) and in information technology. Capital expenditures during fiscal 2007 included multiple real estate acquisitions of space used for Holdings’ retail locations or distribution centers and for continued investments in our information technology.
We anticipate fiscal 2010 capital expenditure levels to increase, as compared to 2009 levels, due to investment in information technology upgrades and ongoing investment in the infrastructure of our facilities; however, it should be noted that in the normal course of business, we consider opportunities to purchase leased operating properties, as well as offers to sell owned, or assign leased, operating and non-operating properties. These transactions may, individually or in the aggregate, result in material proceeds or outlays of cash and cause our capital expenditure levels to vary from period to period. In addition, we review leases that will expire in the short term in order to determine the appropriate action to take with respect to them. During fiscal 2008 and 2007, we purchased 9 and 28 previously leased operating properties for $22 million and $109 million, respectively. We did not make any such purchases in fiscal 2009.
During fiscal 2009, we received $166 million in cash from changes in investments and restricted cash. This reflects cash received from The Reserve Primary Fund of $38 million, as well as changes in restricted cash requirements at Sears Canada.
During fiscal 2008, we purchased an additional 2.6 million of Sears Canada’s common shares in open market transactions. We paid a total of $37 million for the additional shares acquired. This transaction is further described in Note 2 to the Consolidated Financial Statements.
As discussed in the “Results of Operations” and “Investment of Available Capital” sections above, we entered into total return swaps during fiscal 2007. In connection with the settlement of our investments in total return swaps during 2007, collateral posted in the amount of $80 million in 2006 was returned to us in 2007. There were no total return swaps outstanding as of January 30, 2010 or January 31, 2009.
We purchased 5.3 million shares of common stock of Restoration Hardware, Inc. (“Restoration”), a specialty retailer of hardware, bathware, furniture, lighting, textiles, accessories and gifts during 2007. Our investment of $30 million represented an ownership interest of 13.67% of Restoration’s total outstanding shares. We sold our investment in Restoration during the second quarter of fiscal 2008.
Financing Activities and Cash Flows
Net cash used in financing activities was $951 million in fiscal 2009, $643 million in 2008 and $3.4 billion in 2007. The difference primarily reflects common share repurchase activity and debt repayments during the three year period. We repurchased $424 million, $678 million and $2.9 billion of our common stock pursuant to our common share repurchase program in fiscal 2009, 2008 and 2007, respectively. The common share repurchase program was initially announced in 2005 with a total authorization by our Board of Directors of up to $1.0 billion. During the period from fiscal 2006 through fiscal 2009, the Board of Directors authorized the repurchase of up to an additional $5.0 billion of common stock, for a total authorization since inception of the program of $6.0 billion. At January 30, 2010, we had approximately $581 million of remaining authorization
39
Table of Contents
under the program. The share repurchase program has no stated expiration date and share repurchases may be implemented using a variety of methods, which may include open market purchases, privately negotiated transactions, block trades, accelerated share repurchase transactions, the purchase of call options, the sale of put options or otherwise, or by any combination of such methods.
Repayments of debt, when netted with new borrowings during 2009, were $452 million. Total short-term borrowings at January 30, 2010 of $325 million were $117 million lower than our level of borrowings at January 31, 2009. The decrease in outstanding long-term debt includes a reduction in domestic long-term debt and capital lease obligations of $333 million. Long-term debt of the parent at January 30, 2010 (which excludes the debt of our Sears Canada ($281 million) and Orchard Supply Hardware ($296 million) subsidiaries, which is non-recourse to the parent) is less than $1 billion, with no significant required repayments until 2011. Payments on our debt, when netted with new borrowings during 2008, were nominal. Fiscal 2007 financing cash flows included debt payments of $601 million, net of new borrowings.
While we decreased our total amount of short-term borrowings in fiscal 2009, we also altered the mix of our funding to include more borrowings in the commercial paper market, increasing our borrowings from this source by $199 million, while decreasing borrowings under our amended credit agreement by $316 million. The increased level of funding from commercial paper reduced our total borrowing costs and contributed to lower usage of our revolving credit facility during 2009.
In August 2007, Sears Canada sold its headquarters office building and adjacent land in Toronto, Ontario for proceeds of $81 million Canadian, net of closing costs. Sears Canada leased back the property under a leaseback agreement through March 2009, at which time it finished its relocation of all head office operations to previously underutilized space in the Toronto Eaton Centre, Ontario. The carrying value of the property was approximately $35 million as of February 2, 2008. Given the terms of the leaseback, for accounting purposes, the excess of proceeds received over the carrying value of the associated property was deferred, and the resulting $44 million gain was recognized in fiscal 2009 when Sears Canada no longer occupied the associated property.
Uses and Sources of Liquidity
Our primary need for liquidity is to fund working capital requirements of our retail businesses, capital expenditures and for general corporate purposes, including debt repayment, pension plan contributions and common share repurchases. We believe that these needs will be adequately funded by our operating cash flows, credit terms received from vendors and borrowings under our amended credit agreement (described below). At January 30, 2010, $3.3 billion was available under this facility. The facility will decrease in size by $1.7 billion (to $2.4 billion) on March 24, 2010. While we expect to use the Credit Agreement as our primary funding source, we may also access the public debt markets on an opportunistic basis. Additionally, we may from time to time consider selective strategic transactions to create value and improve performance, which may include acquisitions, dispositions, restructurings, joint ventures and partnerships. Transactions of these types may result in material proceeds or cash outlays.
Our year end fiscal 2009 and 2008 outstanding borrowings were as follows:
| millions | January 30, 2010 |
January 31, 2009 | ||||
| Short-term borrowings: |
||||||
| Unsecured commercial paper |
$ | 206 | $ | 7 | ||
| Secured borrowings |
119 | 435 | ||||
| Long-term debt, including current portion: |
||||||
| Notes and debentures outstanding |
1,545 | 1,813 | ||||
| Capitalized lease obligations |
635 | 664 | ||||
| Total borrowings |
$ | 2,505 | $ | 2,919 | ||
40
Table of Contents
In fiscal 2005, the Finance Committee of our Board of Directors authorized the repurchase, subject to market conditions and other factors, of up to $500 million of our outstanding indebtedness in open market or privately negotiated transactions. The source of funds for the purchases is our cash from operations or borrowings under the Credit Agreement. Our wholly owned finance subsidiary, Sears Roebuck Acceptance Corp. (“SRAC”), has repurchased $215 million of its outstanding notes, including $6 million repurchased during fiscal 2009, $49 million repurchased during fiscal 2008 and $2 million repurchased during fiscal 2007, thereby reducing the unused balance of this authorization to $285 million. We recognized a gain of $13 million on the repurchases made during fiscal 2008.
Certain of our debt is variable rate and we therefore manage interest rate risk through the use of fixed and variable-rate funding and interest rate derivatives. At each of January 30, 2010, January 31, 2009 and February 2, 2008, we had interest rate derivatives with notional amounts of $120 million and nominal fair values.
Required Debt Repayments in 2010
The long-term debt maturities occurring in the upcoming 2010 fiscal year are primarily for Sears Canada and Orchard Supply Hardware (“OSH”) borrowings as follows:
| Issue |
Due in Fiscal 2010 | ||
| Sears Canada debentures and medium-term notes |
$ | 281 | |
| OSH collateralized mortgage-backed loan |
120 | ||
| Principal payments on capital lease obligations |
60 | ||
| Other |
21 | ||
| Total 2010 long-term debt maturities |
$ | 482 | |
Sears Canada and OSH are not wholly owned subsidiaries and therefore finance their operations separately from Holdings. Accordingly, their debt is non-recourse to Holdings. Both Sears Canada and OSH believe that they have adequate resources and access to capital markets to repay or refinance these maturities.
Debt Ratings
The ratings of our domestic debt securities as of January 30, 2010 appear in the table below:
| Moody’s Investors Service |
Standard & Poor’s Ratings Services |
Fitch Ratings | ||||
| Unsecured long-term debt |
Ba3 | BB- | BB | |||
| Unsecured commercial paper |
NP | B-2 | B |
Credit Agreement
During the second quarter of 2009, we extended the maturity date of our credit agreement (“Original Credit Agreement”) by entering into an amended credit agreement (the “Amended Credit Agreement”) which has an expiration date of June 22, 2012. The Amended Credit Agreement is an asset based revolving credit facility under which SRAC and Kmart Corporation are the borrowers. Our Original Credit Agreement, which was to expire on March 24, 2010, provided $4.0 billion of borrowing capacity, however only approximately $3.8 billion had been available since September 2008 when an affiliate of Lehman Brothers notified us it would no longer fund its proportionate share of commitments under the Original Agreement. Also during the second quarter of
41
Table of Contents
fiscal 2009, we agreed, for a fee, to allow one of the lenders in our Amended Credit Agreement to exit its commitment, which decreased our total borrowing capacity by $65 million. As a result of the amendment and changes to the facility during the second quarter, our total borrowing capacity increased to $4.1 billion. The fee we received related to the exit of one of our lenders was recorded as a reduction to interest expense during the second quarter of fiscal 2009.
The Amended Credit Agreement provides for a bifurcation of the $4.1 billion credit facility into a $2.4 billion tranche maturing on June 22, 2012, bearing an interest rate of the London Interbank Offered Rate (“LIBOR”) plus 4.00% (the “Extended Tranche”), with a LIBOR floor of 1.75%, and a $1.7 billion tranche maturing March 24, 2010, bearing an initial interest rate of LIBOR plus 0.875% (the “Existing Tranche”). The bifurcation into the Extended Tranche provides Holdings and its subsidiaries more than adequate liquidity for standby letters of credit and working capital needs. The Amended Credit Agreement also gives us the flexibility, subject to certain terms and conditions, to increase the size of the credit facility or add a term loan tranche to the Amended Credit Agreement in an aggregate amount of up to $1.0 billion. It imposes various requirements, including a requirement that, if availability under the credit facility is beneath a certain threshold, the fixed charge ratio as of the last day of any fiscal quarter be not less than 1.0 to 1.0, a cash dominion requirement if excess availability on the revolver falls below designated levels, and limitations on our ability to make restricted payments, including dividends and share repurchases. In connection with the Amended Credit Agreement, the Company agreed to limit the amount of cash accumulated when borrowings are outstanding under the credit facility. The Amended Credit Agreement has a $1.5 billion letter of credit sub-limit, is secured by a first lien on most of our domestic inventory and credit card and pharmacy receivables, and determines availability pursuant to a borrowing base formula.
At January 30, 2010, we had $119 million of borrowings and $646 million of letters of credit outstanding under the Amended Credit Agreement. Our availability under the agreement, given total outstanding borrowings and letters of credit of $765 million, was $3.3 billion at January 30, 2010. The majority of the letters of credit outstanding are used to provide collateral for our insurance programs.
Orchard Supply Hardware LLC (“OSH LLC”) Credit Agreement
In November 2005, OSH LLC entered into a five-year, $130 million senior secured revolving credit facility (the “OSH LLC Facility”), which includes a $25 million letter of credit sublimit. The OSH LLC Facility was amended and extended in January 2010 and, as a result, available capacity was bifurcated into a $100 million tranche maturing December 2013 and a $20 million tranche maturing December 2011. The OSH LLC Facility continues to have a $25 million letter of credit sublimit. The OSH LLC Facility is available for OSH LLC’s general corporate purposes and is secured by a first lien on substantially all of OSH LLC’s non-real estate assets. Availability under the OSH LLC Facility is determined pursuant to a borrowing base formula based on inventory and account and credit card receivables, subject to certain limitations. As of January 30, 2010, there were no borrowings outstanding under the OSH LLC Facility and $8 million in outstanding letters of credit.
Benefit and Pension Plan Obligations
Contributions to our pension plans remain a significant use of our cash on an annual basis. While Sears Holdings’ pension plan is frozen, and thus associates do not currently earn pension benefits, the company has a legacy pension obligation for past service performed by Kmart and Sears, Roebuck and Co. associates. During 2009, we contributed $170 million to our domestic pension plan. However, our contributions are expected to increase in the future as a result of the severe decline in capital markets that occurred in 2008. Based on guidance issued by the Treasury Department, we now estimate that the contribution will be approximately $275 million in 2010 and $535 million in 2011, though the ultimate amount of pension contributions could be affected by further changes in the applicable regulation and financial market and investment performance.
42
Table of Contents
Wholly owned Insurance Subsidiary and Inter-company Notes
As noted in Note 1 of Notes to Consolidated Financial Statements, we have numerous types of insurable risks, including workers’ compensation, product and general liability, automobile, warranty, and asbestos and environmental claims. Also, as discussed in Note 1, we sell extended service contracts to our customers. The associated risks are managed through our wholly owned insurance subsidiary. In accordance with applicable insurance regulations, the insurance subsidiary holds investment grade securities to support the insurance coverage it provides.
We have transferred certain domestic real estate and intellectual property (i.e. trademarks) into separate wholly owned, bankruptcy remote subsidiaries. These bankruptcy remote subsidiaries lease the real estate property to Sears and license the use of the trademarks to Sears and Kmart. Further, the bankruptcy remote subsidiaries have issued asset-backed notes that are collateralized by the aforementioned real estate rental streams and intellectual property licensing fee streams. Cash flows received from rental streams and licensing fee streams paid by Sears, Kmart and, potentially in the future, other affiliates or third parties, will be used for the payment of fees, interest and principal on the asset-backed notes issued. Since the inception of these subsidiaries, the debt securities have been entirely held by our wholly owned consolidated subsidiaries in support of our insurance activities. At January 30, 2010 and January 31, 2009, the net book value of the securitized real estate assets was approximately $1.0 billion. The net book value of the securitized intellectual property assets was approximately $0.9 billion at January 30, 2010 and January 31, 2009.
Contractual Obligations and Off-Balance Sheet Arrangements
Information concerning our obligations and commitments to make future payments under contracts such as debt and lease agreements, and under contingent commitments, is aggregated in the following tables.
| Payments Due by Period | ||||||||||||||||||
| Contractual Obligations |
Total | Within 1 Year | 1-3 Years | 4-5 Years | After 5 Years | Other | ||||||||||||
| millions | ||||||||||||||||||
| Operating leases |
$ | 5,786 | $ | 810 | $ | 1,372 | $ | 978 | $ | 2,626 | $ | — | ||||||
| Short-term debt |
325 | 325 | — | — | — | — | ||||||||||||
| Capital lease obligations |
1,089 | 130 | 248 | 223 | 488 | — | ||||||||||||
| Royalty license fees(1) |
102 | 74 | 19 | 9 | — | — | ||||||||||||
| Purchase obligations |
62 | 8 | 30 | 24 | — | — | ||||||||||||
| Pension funding obligations |
2,227 | 278 | 1,074 | 875 | — | — | ||||||||||||
| Long-term debt |
2,166 | 427 | 573 | 411 | 755 | — | ||||||||||||
| Liability and interest related to uncertain tax positions(2) |
381 | — | — | — | — | 381 | ||||||||||||
| Total contractual obligations |
$ | 12,138 | $ | 2,052 | $ | 3,316 | $ | 2,520 | $ | 3,869 | $ | 381 | ||||||
| (1) | We pay royalties under various merchandise license agreements, which are generally based on sales of products covered under these agreements. We currently have license agreements for which we pay royalties, including those to use Jaclyn Smith and Joe Boxer. Royalty license fees represent the minimum Holdings is obligated to pay, regardless of sales, as guaranteed royalties under these license agreements. |
| (2) | As of January 30, 2010, our uncertain tax position liability and gross interest payable were $310 million and $71 million, respectively. We are unable to reasonably estimate the timing of liabilities and interest payments arising from uncertain tax positions in individual years due to the uncertainties in the timing of the effective settlement of tax positions. |
43
Table of Contents
Other Commercial Commitments
We issue various types of guarantees in the normal course of business. We had the following guarantees outstanding as of January 30, 2010:
| millions | Bank Issued |
SRAC Issued |
Other | Total | ||||||||
| Standby letters of credit |
$ | 662 | $ | 67 | $ | — | $ | 729 | ||||
| Commercial letters of credit |
18 | 106 | — | 124 | ||||||||
| Secondary lease obligations and performance guarantee |
— | — | 19 | 19 | ||||||||
The secondary lease obligations relate to certain store leases of previously divested Sears businesses. We remain secondarily liable if the primary obligor defaults.
Application of Critical Accounting Policies and Estimates
In preparing the financial statements, certain accounting policies require considerable judgment to select the appropriate assumptions to calculate financial estimates. These estimates are complex and subject to an inherent degree of uncertainty. We base our estimates on historical experience, terms of existing contracts, evaluation of trends and other assumptions that we believe to be reasonable under the circumstances. We continually evaluate the information used to make these estimates as our business and the economic environment change. Although the use of estimates is pervasive throughout the financial statements, we consider an accounting estimate to be critical if:
| • | it requires assumptions to be made about matters that were highly uncertain at the time the estimate was made, and |
| • | changes in the estimate that are reasonably likely to occur from period to period or different estimates that could have been selected would have a material effect on our financial condition, cash flows or results of operations. |
Management believes the current assumptions and other considerations used to estimate amounts reflected in the financial statements are appropriate. However, if actual experience differs from the assumptions and the considerations used in estimating amounts, the resulting changes could have a material adverse effect on our consolidated results of operations, and in certain situations, could have a material adverse effect on our financial condition.
Management has discussed the development and selection of these critical accounting estimates with the Audit Committee of our Board of Directors and the Audit Committee has reviewed the disclosure presented below relating to the selection of these estimates.
The following is a summary of our most critical policies and estimates. See Note 1 of Notes to Consolidated Financial Statements for a listing of our other significant accounting policies.
Valuation of Inventory
Our inventory is valued at the lower of cost or market determined primarily using the retail inventory method (“RIM”). RIM is an averaging method that is widely used in the retail industry. To determine inventory cost under RIM, inventory at its retail selling value is segregated into groupings of merchandise having similar characteristics, which are then converted to a cost basis by applying specific average cost factors for each grouping of merchandise. Cost factors represent the average cost-to-retail ratio for each merchandise group based upon the fiscal year purchasing activity for each store location. Accordingly, a significant assumption under the retail method is that inventory in each group is similar in terms of its cost-to-retail relationship and has similar
44
Table of Contents
turnover rates. Management monitors the content of merchandise in these groupings to prevent distortions that would have a material effect on inventory valuation.
RIM inherently requires management judgment and certain estimates that may significantly affect the ending inventory valuation, as well as gross margin. Among others, two significant estimates used in inventory valuation are the level and timing of permanent markdowns (clearance markdowns used to clear unproductive or slow-moving inventory) and shrinkage. Amounts are charged to cost of sales, buying and occupancy at the time the retail value of inventory is reduced through the use of permanent markdowns.
Factors considered in the determination of permanent markdowns include current and anticipated demand, customer preferences, age of the merchandise, fashion trends and weather conditions. In addition, inventory is also evaluated against corporate pre-determined historical markdown cadences. When a decision is made to permanently markdown merchandise, the resulting gross margin reduction is recognized in the period the markdown is recorded. The timing of the decision, particularly surrounding the balance sheet date, can have a significant effect on the results of operations.
Shrinkage is estimated as a percentage of sales for the period from the date of the last physical inventory to the end of the fiscal year. Physical inventories are taken annually for all stores and inventory records are adjusted accordingly. The shrinkage rate from the most recent physical inventory, in combination with historical experience, is used as the basis for the shrinkage accrual following the physical inventory.
Self Insurance Reserves
We use a combination of third-party insurance and/or self-insurance for a number of risks including workers’ compensation, asbestos and environmental, automobile, warranty, product and general liability claims. General liability costs relate primarily to litigation that arises from store operations. Self-insurance reserves include actuarial estimates of both claims filed and carried at their expected ultimate settlement value and claims incurred but not yet reported. Our estimated claim amounts are discounted using a rate with a duration that approximates the duration of our self-insurance reserve portfolio. Our liability reflected on the consolidated balance sheets represents an estimate of the ultimate cost of claims incurred as of the balance sheet date. In estimating this liability, we utilize loss development factors based on Company-specific data to project the future development of incurred losses. Loss estimates are adjusted based upon actual claims settlements and reported claims. These projections are subject to a high degree of variability based upon future inflation rates, litigation trends, legal interpretations, benefit level changes and claim settlement patterns. Although we do not expect the amounts ultimately paid to differ significantly from our estimates, self-insurance reserves could be affected if future claim experience differs significantly from the historical trends and the actuarial assumptions.
Defined Benefit Retirement Plans
The fundamental components of accounting for defined benefit retirement plans consist of the compensation cost of the benefits earned, the interest cost from deferring payment of those benefits into the future and the results of investing any assets set aside to fund the obligation. Such retirement benefits were earned by associates ratably over their service careers. Therefore, the amounts reported in the income statement for these retirement plans have historically followed the same pattern. Accordingly, changes in the obligations or the value of assets to fund them have been recognized systematically and gradually over the associate’s estimated period of service. The largest drivers of losses in recent years have been the discount rate used to determine the present value of the obligation and the actual return on pension assets. We recognize the changes by amortizing experience gains/losses in excess of the 10% corridor into expense over the associate service period and by recognizing the difference between actual and expected asset returns over a five-year period.
Holdings’ actuarial valuations utilize key assumptions including discount rates and expected returns on plan assets. We are required to consider current market conditions, including changes in interest rates and plan asset
45
Table of Contents
investment returns, in determining these assumptions. Actuarial assumptions may differ materially from actual results due to changing market and economic conditions, changes in investment strategies, higher or lower withdrawal rates, and longer or shorter life spans of participants.
Income Taxes
We account for income taxes according to accounting standards for such taxes. Deferred tax assets and liabilities are recognized for the future tax consequences attributable to differences between the book basis and tax basis of assets and liabilities. Deferred tax assets and liabilities are measured using enacted tax rates expected to apply to taxable income in the years in which those temporary differences are expected to be recovered or settled. If future utilization of deferred tax assets is uncertain, the Company may record a valuation allowance against certain deferred tax assets.
In accordance with accounting standards for uncertain tax positions, we record unrecognized tax benefits for positions taken or expected to be taken on tax returns, including the decision to exclude certain income or transactions from a return, when a more-likely-than-not threshold is met for a tax position and management believes that the position will be sustained upon examination by the taxing authorities. Further, we record the largest amount of the unrecognized tax benefit that is greater than 50% likely of being realized upon settlement. Management evaluates each position based solely on the technical merits and facts and circumstances of the position, assuming the position will be examined by a taxing authority having full knowledge of all relevant information. Significant management judgment is required to determine whether the recognition threshold has been met and, if so, the appropriate amount of unrecognized tax benefits to be recorded in the Consolidated Financial Statements. Management reevaluates tax positions each period in which new information about recognition or measurement becomes available.
Significant management judgment is required in determining our provision for income taxes, deferred tax assets and liabilities and the valuation allowance recorded against our net deferred tax assets, if any. In assessing the likelihood of realization of deferred tax assets, management considers estimates of the amount and character of future taxable income. Our actual effective tax rate and income tax expense could vary from estimated amounts due to the future impacts of various items, including changes in income tax laws, tax planning and the Company’s forecasted financial condition and results of operations in future periods. Although management believes current estimates are reasonable, actual results could differ from these estimates.
Domestic and foreign tax authorities periodically audit our income tax returns. These audits include questions regarding our tax filing positions, including the timing and amount of deductions and the allocation of income among various tax jurisdictions. In evaluating the exposures associated with our various tax filing positions, we record reserves in accordance with accounting standards for uncertain tax positions. A number of years may elapse before a particular matter, for which we have established a reserve, is audited and fully resolved. Management’s estimates as of the date of the financial statements reflect our best judgment, giving consideration to all currently available facts and circumstances. As such, these estimates may require adjustment in the future, as additional facts become known or as circumstances change. For further information, see Note 11 of Notes to Consolidated Financial Statements.
Goodwill and Intangible Asset Impairment Assessments
At January 30, 2010 and January 31, 2009, we had goodwill and intangible asset balances of $4.6 billion and $4.7 billion, respectively. Holdings evaluates the carrying value of goodwill and intangible assets for possible impairment under accounting standards governing goodwill and other intangible assets. The majority of our goodwill and intangible assets relate to Kmart’s acquisition of Sears, Roebuck and Co. in March 2005. We allocated goodwill, which is defined as the total purchase price less the fair value of all assets and liabilities acquired, to reporting units as of the acquisition date. As required by accounting standards, we perform annual goodwill and intangible impairment tests in the fourth quarter and update the tests between annual tests if events
46
Table of Contents
or circumstances occur that would more likely than not reduce the fair value of a reporting unit below its carrying amount.
A significant amount of judgment is involved in determining if an indicator of impairment has occurred. Such indicators may include, among others: a significant decline in our expected future cash flows; a sustained, significant decline in our stock price and market capitalization; a significant adverse change in legal factors or in the business climate; unanticipated competition; and the testing for recoverability of a significant asset group within a reporting unit. Any adverse change in these factors could have a significant impact on the recoverability of these assets and could have a material impact on our consolidated financial statements.
Goodwill Impairment Assessments
Our goodwill resides in multiple reporting units. The goodwill impairment test involves a two-step process. The first step is a comparison of each reporting unit’s fair value to its carrying value. We estimate fair value using the best information available, using both a market participant approach, as well as a discounted cash flow model, commonly referred to as the income approach. The market participant approach determines the value of a reporting unit by deriving market multiples for reporting units based on assumptions potential market participants would use in establishing a bid price for the unit. This approach therefore assumes strategic initiatives will result in improvements in operational performance in the event of purchase, and includes the application of a discount rate based on market participant assumptions with respect to capital structure and access to capital markets. The income approach uses a reporting unit’s projection of estimated operating results and cash flows that is discounted using a weighted-average cost of capital that reflects current market conditions. The projection uses management’s best estimates of economic and market conditions over the projected period, including growth rates in sales, costs, estimates of future expected changes in operating margins and cash expenditures. Other significant estimates and assumptions include terminal value growth rates, future estimates of capital expenditures and changes in future working capital requirements. Our final estimate of fair value of reporting units is developed by equally weighting the fair values determined through both the market participant and income approaches.
If the carrying value of the reporting unit is higher than its fair value, there is an indication that impairment may exist and the second step must be performed to measure the amount of impairment loss. The amount of impairment is determined by comparing the implied fair value of reporting unit goodwill to the carrying value of the goodwill in the same manner as if the reporting unit was being acquired in a business combination. Specifically, we would allocate the fair value to all of the assets and liabilities of the reporting unit, including any unrecognized intangible assets, in a hypothetical analysis that would calculate the implied fair value of goodwill. If the implied fair value of goodwill is less than the recorded goodwill, we would record an impairment charge for the difference. We did not record any goodwill impairment charges in fiscal 2009. See Notes 13 and 14 to the Consolidated Financial Statements for further information regarding goodwill and related impairment charges recorded during fiscal 2008.
The use of different assumptions, estimates or judgments in either step of the goodwill impairment testing process, such as the estimated future cash flows of our reporting units, the discount rate used to discount such cash flows, or the estimated fair value of the reporting units’ tangible and intangible assets and liabilities, could significantly increase or decrease the estimated fair value of a reporting unit or its net assets, and therefore, impact the related impairment charge. At the fiscal 2009 annual impairment test date, the above-noted conclusion that no indication of goodwill impairment existed at the test date would not have changed had the test been conducted assuming: 1) a 100 basis point increase in the discount rate used to discount the aggregate estimated cash flows of our reporting units to their net present value in determining their estimated fair values (without any change in the aggregate estimated cash flows of our reporting units), or 2) a 100 basis point decrease in the estimated sales growth rate or terminal period growth rate without a change in the discount rate of each reporting unit.
47
Table of Contents
Intangible Asset Impairment Assessments
We review definite and indefinite-lived intangible assets for impairment by comparing the carrying amount of each asset to the sum of undiscounted cash flows expected to be generated by the asset. We consider both the market approach and income approach when testing intangible assets with indefinite lives for impairment on an annual basis. We determined that the income approach, specifically the Relief from Royalty Method, was most appropriate for analyzing our indefinite-lived assets. This method is based on the assumption that, in lieu of ownership, a firm would be willing to pay a royalty in order to exploit the related benefits of this asset class. The Relief from Royalty Method involves two steps: (i) estimation of reasonable royalty rates for the assets and (ii) the application of these royalty rates to a net sales stream and discounting the resulting cash flows to determine a value. We multiplied the selected royalty rate by the forecasted net sales stream to calculate the cost savings (relief from royalty payment) associated with the assets. The cash flows are then discounted to present value by the selected discount rate and compared to the carrying value of the assets. We did not record any intangible asset impairment charges in fiscal 2009 or fiscal 2008.
The use of different assumptions, estimates or judgments in our intangible asset impairment testing process, such as the estimated future cash flows of assets and the discount rate used to discount such cash flows, could significantly increase or decrease the estimated fair value of an asset, and therefore, impact the related impairment charge. At the fiscal 2009 annual impairment test date, the above-noted conclusion that no indication of intangible asset impairment existed at the test date would not have changed had the test been conducted assuming: 1) a 100 basis point increase in the discount rate used to discount the aggregate estimated cash flows of our assets to their net present value in determining their estimated fair values (without any change in the aggregate estimated cash flows of our reporting units), 2) a 100 basis point decrease in the terminal period growth rate without a change in the discount rate of each reporting unit, or 3) a 10 basis point decrease in the royalty rate applied to the forecasted net sales stream of our assets.
New Accounting Pronouncements
See Note 1 of Notes to Consolidated Financial Statements for information regarding new accounting pronouncements.
CAUTIONARY STATEMENT REGARDING FORWARD-LOOKING INFORMATION
Certain statements made in this Annual Report on Form 10-K and in other public announcements by us contain forward-looking statements within the meaning of the Private Securities Litigation Reform Act of 1995. Forward-looking statements are subject to risks and uncertainties that may cause our actual results, performance or achievements to be materially different from any future results, performance or achievements expressed or implied by these forward-looking statements. Forward-looking statements include information concerning our future financial performance, business strategy, plans, goals and objectives. Statements preceded or followed by, or that otherwise include, the words “believes,” “expects,” “anticipates,” “intends,” “estimates,” “plans,” “forecast,” “is likely to” and similar expressions or future or conditional verbs such as “will,” “may” and “could” are generally forward-looking in nature and not historical facts. Such statements are based upon the current beliefs and expectations of Holdings’ management and are subject to significant risks and uncertainties. Actual results may differ materially from those set forth in the forward-looking statements.
The following factors, among others, could cause actual results to differ from those set forth in the forward-looking statements: our ability to offer merchandise and services that our customers want, including our proprietary brand products; our ability to successfully implement initiatives to improve inventory management and other capabilities; competitive conditions in the retail and related services industries; worldwide economic conditions and business uncertainty, the availability of consumer and commercial credit, changes in consumer confidence, tastes, preferences and spending, and changes in vendor relationships; the impact of seasonal buying patterns, including seasonal fluctuations due to weather conditions, which are difficult to forecast with certainty;
48
Table of Contents
our dependence on sources outside the United States for significant amounts of our merchandise; our extensive reliance on computer systems to process transactions, summarize results and manage our business; our reliance on third parties to provide us with services in connection with the administration of certain aspects of our business; impairment charges for goodwill and intangible assets or fixed-asset impairment for long-lived assets; our ability to properly implement and realize the expected benefits from our organizational structure and operating model; our ability to attract, motivate and retain key executives and other associates; the outcome of pending and/or future legal proceedings, including product liability claims and bankruptcy claims, including proceedings with respect to which the parties have reached a preliminary settlement; and the timing and amount of required pension plan funding.
Certain of these and other factors are discussed in more detail in Item 1A of this Annual Report on Form 10-K. While we believe that our forecasts and assumptions are reasonable, we caution that actual results may differ materially. We intend the forward-looking statements to speak only as of the time made and do not undertake to update or revise them as more information becomes available.
| Item 7A. | Quantitative and Qualitative Disclosures about Market Risk |
We face market risk exposure in the form of interest rate risk, foreign currency risk and equity price risk. These market risks arise from our derivative financial instruments and debt obligations.
Interest Rate Risk
We manage interest rate risk through the use of fixed and variable-rate funding and interest rate derivatives. As of January 30, 2010, we had interest rate derivatives with a notional amount of $120 million, nominal fair value and a weighted average remaining life of 0.9 years. All debt securities and interest-rate derivative instruments are considered non-trading. As of January 30, 2010, 25% of our debt portfolio was variable rate. Based on the size of this variable rate debt portfolio at January 30, 2010, which totaled approximately $621 million, an immediate 100 basis point change in interest rates would have affected annual pretax funding costs by $6 million. These estimates do not take into account the effect on income resulting from invested cash or the returns on assets being funded. These estimates also assume that the variable rate funding portfolio remains constant for an annual period and that the interest rate change occurs at the beginning of the period.
Foreign Currency Risk
As of January 30, 2010, we had a series of foreign currency forward contracts outstanding, totaling $400 million Canadian notional value and with a weighted average remaining life of 0.5 years, designed to hedge our net investment in Sears Canada against adverse changes in exchange rates. The aggregate fair value of the forward contracts as of January 30, 2010 was $15 million. A hypothetical 1% adverse movement in the level of the Canadian exchange rate relative to the U.S. dollar as of January 30, 2010, with all other variables held constant, would have resulted in a loss in the fair value of our foreign currency forward contracts of approximately $4 million as of January 30, 2010. Certain of our currency forward contracts require collateral be posted in the event our liability under such contracts reaches a predetermined threshold. Cash collateral posted under these contracts is recorded as part of our accounts receivable balance. We did not have any cash collateral posted under these contracts as of January 30, 2010.
Sears Canada mitigates the risk of currency fluctuations on offshore merchandise purchases denominated in U.S. currency by purchasing U.S. dollar denominated option contracts for a portion of its expected requirements. As of January 30, 2010, these contracts had a notional value of approximately $299 million and a weighted average remaining life of 0.5 years. The aggregate fair value of the option contracts as of January 30, 2010 was $9 million. A hypothetical 1% adverse movement in the level of the Canadian exchange rate relative to the U.S. dollar as of January 30, 2010, with all other variables held constant, would have resulted in a fair value for these contracts of approximately $7 million as of January 30, 2010, a decrease of $2 million.
49
Table of Contents
Counterparties
We actively manage the risk of nonpayment by our derivative counterparties by limiting our exposure to individual counterparties based on credit ratings, value at risk and maturities. The counterparties to these instruments are major financial institutions with credit ratings of single-A or better. In certain cases, counterparty risk is also managed through the use of collateral in the form of cash or U.S. government securities.
50
Table of Contents
| Item 8. | Financial Statements and Supplementary Data |
| Page | ||
| 52 | ||
| Consolidated Balance Sheets as of January 30, 2010 and January 31, 2009 |
53 | |
| 54 | ||
| 55 | ||
| 56 | ||
| 98 | ||
| Management’s Annual Report on Internal Control over Financial Reporting |
99 | |
| 100 | ||
51
Table of Contents
Consolidated Statements of Income
| millions, except per share data | 2009 | 2008 | 2007 | |||||||||
| REVENUES |
||||||||||||
| Merchandise sales and services |
$ | 44,043 | $ | 46,770 | $ | 50,703 | ||||||
| COSTS AND EXPENSES |
||||||||||||
| Cost of sales, buying and occupancy |
31,824 | 34,118 | 36,638 | |||||||||
| Selling and administrative |
10,654 | 11,060 | 11,468 | |||||||||
| Depreciation and amortization |
926 | 981 | 1,049 | |||||||||
| Impairment charges |
— | 360 | — | |||||||||
| Gain on sales of assets |
(74 | ) | (51 | ) | (38 | ) | ||||||
| Total costs and expenses |
43,330 | 46,468 | 49,117 | |||||||||
| Operating income |
713 | 302 | 1,586 | |||||||||
| Interest expense |
(265 | ) | (272 | ) | (286 | ) | ||||||
| Interest and investment income |
33 | 46 | 135 | |||||||||
| Other income (loss) |
(61 | ) | 108 | 17 | ||||||||
| Income before income taxes |
420 | 184 | 1,452 | |||||||||
| Income taxes |
(123 | ) | (85 | ) | (550 | ) | ||||||
| Net income |
297 | 99 | 902 | |||||||||
| Income attributable to noncontrolling interests |
(62 | ) | (46 | ) | (76 | ) | ||||||
| NET INCOME ATTRIBUTABLE TO HOLDINGS’ SHAREHOLDERS |
$ | 235 | $ | 53 | $ | 826 | ||||||
| EARNINGS PER COMMON SHARE ATTRIBUTABLE TO HOLDINGS’ SHAREHOLDERS |
||||||||||||
| Basic earnings per share |
$ | 1.99 | $ | 0.42 | $ | 5.71 | ||||||
| Diluted earnings per share |
$ | 1.99 | $ | 0.42 | $ | 5.70 | ||||||
| Basic weighted average common shares outstanding |
117.8 | 127.0 | 144.7 | |||||||||
| Diluted weighted average common shares outstanding |
117.9 | 127.0 | 144.8 | |||||||||
See accompanying Notes to Consolidated Financial Statements.
52
Table of Contents
Consolidated Balance Sheets
| millions, except per share data | January 30, 2010 |
January 31, 2009 |
||||||
| ASSETS |
||||||||
| Current assets |
||||||||
| Cash and cash equivalents |
$ | 1,689 | $ | 1,173 | ||||
| Restricted cash |
11 | 124 | ||||||
| Accounts receivable |
652 | 839 | ||||||
| Merchandise inventories |
8,705 | 8,795 | ||||||
| Prepaid expenses and other current assets |
351 | 458 | ||||||
| Deferred income taxes |
30 | 27 | ||||||
| Total current assets |
11,438 | 11,416 | ||||||
| Property and equipment |
||||||||
| Land |
2,059 | 2,056 | ||||||
| Buildings and improvements |
6,193 | 6,040 | ||||||
| Furniture, fixtures and equipment |
2,766 | 2,518 | ||||||
| Capital leases |
374 | 345 | ||||||
| Gross property and equipment |
11,392 | 10,959 | ||||||
| Less accumulated depreciation |
(3,683 | ) | (2,868 | ) | ||||
| Total property and equipment, net |
7,709 | 8,091 | ||||||
| Goodwill |
1,392 | 1,392 | ||||||
| Trade names and other intangible assets |
3,208 | 3,283 | ||||||
| Other assets |
1,061 | 1,160 | ||||||
| TOTAL ASSETS |
$ | 24,808 | $ | 25,342 | ||||
| LIABILITIES |
||||||||
| Current liabilities |
||||||||
| Short-term borrowings |
$ | 325 | $ | 442 | ||||
| Current portion of long-term debt and capitalized lease obligations |
482 | 345 | ||||||
| Merchandise payables |
3,335 | 3,006 | ||||||
| Other current liabilities |
3,098 | 3,226 | ||||||
| Unearned revenues |
1,012 | 1,069 | ||||||
| Other taxes |
534 | 424 | ||||||
| Total current liabilities |
8,786 | 8,512 | ||||||
| Long-term debt and capitalized lease obligations |
1,698 | 2,132 | ||||||
| Pension and postretirement benefits |
2,271 | 2,057 | ||||||
| Other long-term liabilities |
2,618 | 2,942 | ||||||
| Total Liabilities |
15,373 | 15,643 | ||||||
| EQUITY |
||||||||
| Sears Holdings Corporation equity |
||||||||
| Preferred stock, 20 shares authorized; no shares outstanding |
— | — | ||||||
| Common stock $0.01 par value; 500 shares authorized; 115 and 122 shares outstanding, respectively |
1 | 1 | ||||||
| Treasury stock—at cost |
(5,446 | ) | (5,012 | ) | ||||
| Capital in excess of par value |
10,465 | 10,441 | ||||||
| Retained earnings |
4,797 | 4,562 | ||||||
| Accumulated other comprehensive income (loss) |
(721 | ) | (612 | ) | ||||
| Total Sears Holdings Corporation equity |
9,096 | 9,380 | ||||||
| Noncontrolling interest |
339 | 319 | ||||||
| Total Equity |
9,435 | 9,699 | ||||||
| TOTAL LIABILITIES AND EQUITY |
$ | 24,808 | $ | 25,342 | ||||
See accompanying Notes to Consolidated Financial Statements.
53
Table of Contents
Consolidated Statements of Cash Flows
| millions | 2009 | 2008 | 2007 | |||||||||
| CASH FLOWS FROM OPERATING ACTIVITIES |
||||||||||||
| Net income |
$ | 297 | $ | 99 | $ | 902 | ||||||
| Adjustments to reconcile net income to net cash provided by operating activities: |
||||||||||||
| Depreciation and amortization |
926 | 981 | 1,049 | |||||||||
| Impairment charges |
— | 360 | — | |||||||||
| Curtailment gain on Sears Canada’s post-retirement benefit plans |
— | — | (27 | ) | ||||||||
| Loss on total return swaps, net |
— | — | 14 | |||||||||
| Gain on sales of assets |
(74 | ) | (51 | ) | (38 | ) | ||||||
| Gain on sale of investments |
— | — | (2 | ) | ||||||||
| Pension and post-retirement plan contributions |
(209 | ) | (286 | ) | (277 | ) | ||||||
| Settlement of Canadian dollar hedges |
— | (64 | ) | (12 | ) | |||||||
| Change in operating assets and liabilities (net of acquisitions and dispositions): |
||||||||||||
| Deferred income taxes |
90 | (385 | ) | (84 | ) | |||||||
| Merchandise inventories |
188 | 1,003 | 66 | |||||||||
| Merchandise payables |
272 | (389 | ) | 93 | ||||||||
| Income and other taxes |
101 | (173 | ) | (541 | ) | |||||||
| Mark-to-market asset on Sears Canada U.S. dollar option contracts |
65 | (74 | ) | — | ||||||||
| Other operating assets |
48 | 207 | 35 | |||||||||
| Other operating liabilities |
(197 | ) | (236 | ) | 369 | |||||||
| Net cash provided by operating activities |
1,507 | 992 | 1,547 | |||||||||
| CASH FLOWS FROM INVESTING ACTIVITIES |
||||||||||||
| Acquisitions of businesses, net of cash acquired |
— | (37 | ) | — | ||||||||
| Proceeds from sales of property and investments |
23 | 86 | 95 | |||||||||
| Net decrease (increase) in investments and restricted cash |
166 | (189 | ) | (30 | ) | |||||||
| Purchases of property and equipment |
(361 | ) | (497 | ) | (570 | ) | ||||||
| Cash settlements and change in collateral on total return swaps, net |
— | — | 68 | |||||||||
| Net cash used in investing activities |
(172 | ) | (637 | ) | (437 | ) | ||||||
| CASH FLOWS FROM FINANCING ACTIVITIES |
||||||||||||
| Stock issued under executive compensation plans |
13 | — | — | |||||||||
| Proceeds from debt issuances |
— | 17 | 3 | |||||||||
| Repayments of long-term debt |
(335 | ) | (262 | ) | (672 | ) | ||||||
| Increase (decrease) in short-term borrowings, primarily 90 days or less |
(117 | ) | 280 | 68 | ||||||||
| Proceeds from sale leaseback transaction |
— | — | 88 | |||||||||
| Debt issuance costs |
(81 | ) | — | — | ||||||||
| Additional purchase of noncontrolling interest |
(7 | ) | — | — | ||||||||
| Purchase of treasury stock |
(424 | ) | (678 | ) | (2,926 | ) | ||||||
| Net cash used in financing activities |
(951 | ) | (643 | ) | (3,439 | ) | ||||||
| Effect of exchange rate changes on cash and cash equivalents |
132 | (161 | ) | 112 | ||||||||
| NET INCREASE (DECREASE) IN CASH AND CASH EQUIVALENTS |
516 | (449 | ) | (2,217 | ) | |||||||
| CASH AND CASH EQUIVALENTS, BEGINNING OF YEAR |
1,173 | 1,622 | 3,839 | |||||||||
| CASH AND CASH EQUIVALENTS, END OF YEAR |
$ | 1,689 | $ | 1,173 | $ | 1,622 | ||||||
| SUPPLEMENTAL DISCLOSURE ABOUT NON-CASH INVESTING AND FINANCING ACTIVITIES: |
||||||||||||
| Bankruptcy related settlements resulting in the receipt of treasury stock |
$ | — | $ | 12 | $ | 29 | ||||||
| Capital lease obligation incurred |
7 | 12 | 66 | |||||||||
| Supplemental Cash Flow Data: |
||||||||||||
| Income taxes paid, net of refunds |
(70 | ) | 107 | 372 | ||||||||
| Cash interest paid |
185 | 207 | 243 | |||||||||
See accompanying Notes to Consolidated Financial Statements.
54
Table of Contents
Consolidated Statements of Equity
| Equity Attributable to Holdings’ Shareholders | |||||||||||||||||||||||||||||||
| dollars and shares in millions | Number of Shares |
Common Stock |
Treasury Stock |
Capital in Excess of Par Value |
Retained Earnings |
Accumulated Other Comprehensive Income (Loss) |
Noncontrolling Interests |
Total | |||||||||||||||||||||||
| Balance at February 3, 2007—as reported |
154 | $ | 2 | $ | (1,437 | ) | $ | 10,393 | $ | 3,689 | $ | 59 | $ | — | $ | 12,706 | |||||||||||||||
| Effects of adoption of new accounting standard for noncontrolling interests |
— | — | — | — | — | — | 166 | 166 | |||||||||||||||||||||||
| Balance at February 3, 2007—as adjusted |
154 | 2 | (1,437 | ) | 10,393 | 3,689 | 59 | 166 | 12,872 | ||||||||||||||||||||||
| Comprehensive income |
|||||||||||||||||||||||||||||||
| Net income |
— | — | — | — | 826 | — | 76 | 902 | |||||||||||||||||||||||
| Pension and postretirement adjustments, net of tax |
— | — | — | — | — | 53 | 23 | 76 | |||||||||||||||||||||||
| Deferred gain on derivatives |
— | — | — | — | — | 1 | — | 1 | |||||||||||||||||||||||
| Cumulative translation adjustment |
— | — | — | — | — | (44 | ) | 42 | (2 | ) | |||||||||||||||||||||
| Total Comprehensive Income |
977 | ||||||||||||||||||||||||||||||
| Stock awards |
— | — | 54 | (30 | ) | — | — | — | 24 | ||||||||||||||||||||||
| Pre-petition tax settlements/valuation reserve adjustments |
— | — | — | 52 | — | — | — | 52 | |||||||||||||||||||||||
| Bankruptcy related settlement agreements |
— | — | (29 | ) | 4 | — | — | — | (25 | ) | |||||||||||||||||||||
| Shares repurchased |
(22 | ) | (1 | ) | (2,921 | ) | — | — | — | — | (2,922 | ) | |||||||||||||||||||
| Other |
— | — | 2 | — | (6 | ) | — | 6 | 2 | ||||||||||||||||||||||
| Balance at February 2, 2008 |
132 | 1 | (4,331 | ) | 10,419 | 4,509 | 69 | 313 | 10,980 | ||||||||||||||||||||||
| Comprehensive loss |
|||||||||||||||||||||||||||||||
| Net income |
— | — | — | — | 53 | — | 46 | 99 | |||||||||||||||||||||||
| Pension and postretirement adjustments, net of tax |
— | — | — | — | — | (604 | ) | 59 | (545 | ) | |||||||||||||||||||||
| Cumulative translation adjustment |
— | — | — | — | — | (77 | ) | (95 | ) | (172 | ) | ||||||||||||||||||||
| Total Comprehensive Loss |
(618 | ) | |||||||||||||||||||||||||||||
| Stock awards |
— | — | 2 | (8 | ) | — | — | — | (6 | ) | |||||||||||||||||||||
| Pre-petition tax settlements |
— | — | — | 23 | — | — | — | 23 | |||||||||||||||||||||||
| Bankruptcy related settlement agreements |
— | — | (12 | ) | 7 | — | — | — | (5 | ) | |||||||||||||||||||||
| Shares repurchased |
(10 | ) | — | (678 | ) | — | — | — | — | (678 | ) | ||||||||||||||||||||
| Associate stock purchase |
— | — | 7 | — | — | — | — | 7 | |||||||||||||||||||||||
| Other |
— | — | — | — | — | — | (4 | ) | (4 | ) | |||||||||||||||||||||
| Balance at January 31, 2009 |
122 | 1 | (5,012 | ) | 10,441 | 4,562 | (612 | ) | 319 | 9,699 | |||||||||||||||||||||
| Comprehensive income |
|||||||||||||||||||||||||||||||
| Net income |
— | — | — | — | 235 | — | 62 | 297 | |||||||||||||||||||||||
| Pension and postretirement adjustments, net of tax |
— | — | — | — | — | (197 | ) | (62 | ) | (259 | ) | ||||||||||||||||||||
| Deferred gain on derivative |
— | — | — | — | — | 6 | — | 6 | |||||||||||||||||||||||
| Cumulative translation adjustment |
— | — | — | — | — | 82 | 28 | 110 | |||||||||||||||||||||||
| Total Comprehensive Income |
154 | ||||||||||||||||||||||||||||||
| Proceeds from exercise of stock options |
— | — | 16 | (3 | ) | — | — | — | 13 | ||||||||||||||||||||||
| Stock awards |
— | — | (32 | ) | 29 | — | — | — | (3 | ) | |||||||||||||||||||||
| Canadian shares purchased |
— | — | — | (2 | ) | — | — | (5 | ) | (7 | ) | ||||||||||||||||||||
| Shares repurchased |
(7 | ) | (424 | ) | — | — | — | — | (424 | ) | |||||||||||||||||||||
| Associate stock purchase |
— | — | 6 | — | — | — | — | 6 | |||||||||||||||||||||||
| Other |
— | — | — | — | — | — | (3 | ) | (3 | ) | |||||||||||||||||||||
| Balance at January 30, 2010 |
115 | $ | 1 | $ | (5,446 | ) | $ | 10,465 | $ | 4,797 | $ | (721 | ) | $ | 339 | $ | 9,435 | ||||||||||||||
See accompanying Notes to Consolidated Financial Statements.
55
Table of Contents
Notes To Consolidated Financial Statements
NOTE 1—SUMMARY OF SIGNIFICANT ACCOUNTING POLICIES
Nature of Operations, Consolidation and Basis of Presentation
Sears Holdings Corporation (“Holdings,” “we,” “us,” “our” or the “Company”) is the parent company of Kmart Holding Corporation (“Kmart”) and Sears, Roebuck and Co. (“Sears”). Holdings was formed as a Delaware corporation in 2004 in connection with the Merger of Kmart and Sears, which was completed on March 24, 2005. We are a broadline retailer with 2,235 full-line and 1,284 specialty retail stores in the United States operating through Kmart and Sears and 402 full-line and specialty retail stores in Canada operating through Sears Canada Inc. (“Sears Canada”), a 73%-owned subsidiary. We have three reportable segments: Kmart, Sears Domestic and Sears Canada.
The consolidated financial statements include all majority-owned subsidiaries in which Holdings exercises control. Investments in companies in which Holdings exercises significant influence, but which we do not control (generally 20% to 50% ownership interest), are accounted for under the equity method of accounting. Investments in companies in which we have less than a 20% ownership interest and do not exercise significant influence are accounted for at cost. All intercompany transactions and balances have been eliminated.
Fiscal Year
Our fiscal year ends on the Saturday closest to January 31st each year. Unless otherwise stated, references to years in this report relate to fiscal years rather than to calendar years. The following fiscal periods are presented in this report.
| Fiscal year |
Ended | Weeks | ||
| 2009 |
January 30, 2010 | 52 | ||
| 2008 |
January 31, 2009 | 52 | ||
| 2007 |
February 2, 2008 | 52 |
Use of Estimates
The preparation of financial statements in conformity with accounting principles generally accepted in the United States of America requires management to make estimates and assumptions about future events. The estimates and assumptions affect the reported amounts of assets and liabilities and disclosure of contingent assets and liabilities at the date of the financial statements, as well as reported amounts of revenues and expenses during the reporting period. We evaluate our estimates and assumptions on an ongoing basis using historical experience and other factors that management believes to be reasonable under the circumstances. Adjustments to estimates and assumptions are made when facts and circumstances dictate. As future events and their effects cannot be determined with absolute certainty, actual results may differ from the estimates used in preparing the accompanying consolidated financial statements. Significant estimates and assumptions are required as part of determining inventory and accounts receivable valuation, estimating depreciation, amortization and recoverability of long-lived assets, establishing self-insurance, warranty, legal and other reserves, performing goodwill, intangible and long-lived asset impairment analysis, establishing valuation allowances on deferred income tax assets and reserves for tax examination exposures, and calculating retirement benefits.
Reclassifications
Certain prior year amounts have been reclassified to conform to the current year presentation.
56
Table of Contents
SEARS HOLDINGS CORPORATION
Notes to Consolidated Financial Statements—(Continued)
Cash and Cash Equivalents
Cash equivalents include all highly liquid investments with original maturities of three months or less at the date of purchase. We also include deposits in-transit from banks for payments related to third-party credit card and debit card transactions within cash equivalents.
We classify cash balances which have been pledged as collateral, and for which we do not have the ability to substitute letters of credit, as restricted cash on our consolidated balance sheet.
We classify outstanding checks in excess of funds on deposit within other current liabilities and reduce cash and cash equivalents when these checks clear the bank on which they were drawn. Outstanding checks in excess of funds on deposit included in other current liabilities were $116 million and $228 million at January 30, 2010 and January 31, 2009, respectively.
Allowance for Doubtful Accounts
We provide an allowance for doubtful accounts based on both historical experience and a specific identification basis. Allowances for doubtful accounts on accounts receivable balances were $39 million and $42 million as of January 30, 2010 and January 31, 2009, respectively. Our accounts receivable balance on our consolidated balance sheet is presented net of our allowance for doubtful accounts and is comprised of various vendor-related and customer-related accounts receivable, including receivables related to our pharmacy operations.
Merchandise Inventories
Merchandise inventories are valued at the lower of cost or market. For Kmart and Sears Domestic, cost is primarily determined using the retail inventory method (“RIM”). Kmart merchandise inventories are valued under the RIM using primarily a first-in, first-out (“FIFO”) cost flow assumption. Sears Domestic merchandise inventories are valued under the RIM using primarily a last-in, first-out (“LIFO”) cost flow assumption. For Sears Canada, cost is determined using the average cost method based on individual items.
Inherent in the RIM calculation are certain significant management judgments and estimates including, among others, merchandise markons, markups, markdowns and shrinkage, which significantly impact the ending inventory valuation at cost, as well as resulting gross margins. The methodologies utilized by us in our application of the RIM are consistent for all periods presented. Such methodologies include the development of the cost-to-retail ratios, the groupings of homogenous classes of merchandise, the development of shrinkage and obsolescence reserves, the accounting for price changes and the computations inherent in the LIFO adjustment (where applicable). Management believes that the RIM provides an inventory valuation that reasonably approximates cost and results in carrying inventory at the lower of cost or market.
Approximately 50% of consolidated merchandise inventories are valued using LIFO. To estimate the effects of inflation on inventories, we utilize external price indices determined by an outside source, the Bureau of Labor Statistics. If the FIFO method of inventory valuation had been used instead of the LIFO method, merchandise inventories would have been $27 million higher at January 30, 2010 and $26 million higher at January 31, 2009.
Vendor Rebates and Allowances
We receive rebates and allowances from certain vendors through a variety of programs and arrangements intended to offset our costs of promoting and selling certain vendor products. These vendor payments are
57
Table of Contents
SEARS HOLDINGS CORPORATION
Notes to Consolidated Financial Statements—(Continued)
recognized and recorded as a reduction to the cost of merchandise inventories when earned and, thereafter, as a reduction of cost of sales, buying and occupancy as the merchandise is sold. Up-front consideration received from vendors linked to purchases or other commitments is initially deferred and amortized ratably to cost of sales, buying and occupancy over the life of the contract or as performance of the activities specified by the vendor to earn the fee is completed.
Property and Equipment
Property and equipment are recorded at cost, less accumulated depreciation. Additions and substantial improvements are capitalized and include expenditures that materially extend the useful lives of existing facilities and equipment. Maintenance and repairs that do not materially improve or extend the lives of the respective assets are expensed as incurred.
Depreciation expense, which includes depreciation on assets under capital leases, is recorded over the estimated useful lives of the respective assets using the straight-line method for financial statement purposes, and accelerated methods for tax purposes. The range of lives are generally 20 to 50 years for buildings, 3 to 10 years for furniture, fixtures and equipment, and 3 to 5 years for computer systems and computer equipment. Leasehold improvements are depreciated over the shorter of the associated lease term or the estimated useful life of the asset.
Impairment of Long-Lived Assets and Costs Associated with Exit Activities
In accordance with accounting standards governing the impairment or disposal of long-lived assets, the carrying value of long-lived assets, including property and equipment, is evaluated whenever events or changes in circumstances indicate that a potential impairment has occurred relative to a given asset or assets. Factors that could result in an impairment review include, but are not limited to, a current period cash flow loss combined with a history of cash flow losses or a projection that demonstrates continuing losses associated with the use of a long-lived asset, significant changes in the manner of use of the assets or significant changes in business strategies. An impairment loss is recognized when the estimated undiscounted cash flows expected to result from the use of the asset plus net proceeds expected from disposition of the asset (if any) are less than the carrying value of the asset. When an impairment loss is recognized, the carrying amount of the asset is reduced to its estimated fair value as determined based on quoted market prices or through the use of other valuation techniques. In addition to our on-going monitoring of potential impairment circumstances, which may arise, we perform an impairment analysis on our long-lived assets as of the last day of our November accounting period each year. See Note 14 for further information regarding long-lived asset impairment charges recorded during fiscal 2008.
We account for costs associated with location closings in accordance with standards pertaining to accounting for costs associated with exit or disposal activities. As such, we record a liability for costs associated with location closings, which includes employee severance, inventory markdowns and other liquidation fees when management makes the decision to exit a location. We record a liability for future lease costs (net of estimated sublease income) when we cease to use the location.
Goodwill, Trade Names, Other Intangible Assets and Related Impairments
Trade names acquired as part of the Merger account for the majority of our intangible assets recognized in the consolidated balance sheet. The majority of these trade name assets, such as Kenmore, Craftsman and Lands’ End, are expected to generate cash flows indefinitely, do not have estimable or finite useful lives and, therefore,
58
Table of Contents
SEARS HOLDINGS CORPORATION
Notes to Consolidated Financial Statements—(Continued)
are accounted for as indefinite-lived assets not subject to amortization. Certain intangible assets, including favorable lease rights, contractual arrangements and customer lists, have estimable, finite useful lives, which are used as the basis for their amortization. The estimated useful lives of such assets are determined using a number of factors, including the demand for the asset, competition and the level of expenditure required to maintain the cash flows associated with the asset.
As required by accounting standards, we perform annual goodwill and intangible asset impairment tests in the fourth quarter and update the tests between annual tests if events or circumstances occur that would more likely than not reduce the fair value of a reporting unit below its carrying amount. A significant amount of judgment is involved in determining if an indicator of impairment has occurred. Such indicators may include, among others: a significant decline in our expected future cash flows; a sustained, significant decline in our stock price and market capitalization; a significant adverse change in legal factors or in the business climate; unanticipated competition; and the testing for recoverability of a significant asset group within a reporting unit. Any adverse change in these factors could have a significant impact on the recoverability of these assets and could have a material impact on our consolidated financial statements.
Goodwill Impairment Assessments
Our goodwill resides in multiple reporting units. The goodwill impairment test involves a two-step process. The first step is a comparison of each reporting unit’s fair value to its carrying value. We estimate fair value using the best information available, using both a market participant approach, as well as a discounted cash flow model, commonly referred to as the income approach. The market participant approach determines the value of a reporting unit by deriving market multiples for reporting units based on assumptions potential market participants would use in establishing a bid price for the unit. This approach therefore assumes strategic initiatives will result in improvements in operational performance in the event of purchase, and includes the application of a discount rate based on market participant assumptions with respect to capital structure and access to capital markets. The income approach uses a reporting unit’s projection of estimated operating results and cash flows that is discounted using a weighted-average cost of capital that reflects current market conditions. The projection uses management’s best estimates of economic and market conditions over the projected period, including growth rates in sales, costs, estimates of future expected changes in operating margins and cash expenditures. Other significant estimates and assumptions include terminal value growth rates, future estimates of capital expenditures and changes in future working capital requirements. Our final estimate of fair value of reporting units is developed by equally weighting the fair values determined through both the market participant and income approaches.
If the carrying value of the reporting unit is higher than its fair value, there is an indication that impairment may exist and the second step must be performed to measure the amount of impairment loss. The amount of impairment is determined by comparing the implied fair value of reporting unit goodwill to the carrying value of the goodwill in the same manner as if the reporting unit was being acquired in a business combination. See Notes 13 and 14 to the Consolidated Financial Statements for further information regarding goodwill and related impairment charges recorded during fiscal 2008.
Intangible Asset Impairment Assessments
We review definite and indefinite-lived intangible assets for impairment by comparing the carrying amount of each asset to the sum of undiscounted cash flows expected to be generated by the asset. We consider both the market approach and income approach when testing intangible assets with indefinite lives for impairment on an annual basis. We determined that the income approach, specifically the Relief from Royalty Method, was most
59
Table of Contents
SEARS HOLDINGS CORPORATION
Notes to Consolidated Financial Statements—(Continued)
appropriate for analyzing our indefinite-lived assets. This method is based on the assumption that, in lieu of ownership, a firm would be willing to pay a royalty in order to exploit the related benefits of this asset class. The Relief from Royalty Method involves two steps: (i) estimation of reasonable royalty rates for the assets and (ii) the application these royalty rates to a net sales stream and discounting the resulting cash flows to determine a value. We multiplied the selected royalty rate by the forecasted net sales stream to calculate the cost savings (relief from royalty payment) associated with the assets. The cash flows are then discounted to present value by the selected discount rate and compared to the carrying value of the assets.
Financial Instruments and Hedging Activities
We are exposed to fluctuations in foreign currency exchange rates as a result of our net investment in Sears Canada. Further, Sears Canada is exposed to fluctuations in foreign currency exchange rates due to inventory purchase contracts denominated in U.S. dollars. As a result, we primarily use derivatives as a risk management tool to decrease our exposure to fluctuations in the foreign currency market. We primarily use foreign currency forward contracts to hedge the foreign currency exposure of our net investment in Sears Canada against adverse changes in exchange rates and foreign currency option contracts to hedge against foreign currency exposure arising from Sears Canada’s inventory purchase contracts denominated in U.S. dollars.
We use derivative financial instruments, including interest rate swaps and caps, to manage our exposure to movements in interest rates. In addition, we from time to time have entered into total return swaps as a means for investing a portion of our surplus cash, although we did not do so in fiscal 2009 or 2008.
Hedges of Net Investment in Sears Canada
When applying hedge accounting treatment to our derivative transactions, we formally document our hedge relationships, including identification of the hedging instruments and the hedged items, as well as our risk management objectives and strategies for undertaking the hedge transaction. We also formally assess, both at inception and at least quarterly thereafter, whether the derivatives that are used in hedging transactions are highly effective in offsetting changes in either the fair value or cash flows of the hedged item. If it is determined that a derivative ceases to be a highly effective hedge, we discontinue hedge accounting.
For derivatives that are designated as hedges of our net investment in Sears Canada, we assess effectiveness based on changes in spot currency exchange rates. Changes in spot rates on the derivatives are recorded in the currency translation adjustments line in Accumulated Other Comprehensive Income and remain there until such time that we substantially liquidate or sell our holdings in Sears Canada.
Sears Canada Hedges of Merchandise Purchases
Sears Canada mitigates the risk of currency fluctuations on offshore merchandise purchases denominated in U.S. currency by purchasing U.S. dollar denominated option contracts for a portion of its expected requirements. Since Holdings’ functional currency is the U.S. dollar, we are not directly exposed to the risk of exchange rate changes due to Sears Canada’s merchandise purchases, and therefore we do not account for these instruments as a hedge of our foreign currency exposure risk. Changes in the fair value of these contracts are recorded in the consolidated statement of income as a component of other income each period.
Hedges of Interest Rates
For interest rate swaps and caps that have been designated and qualify as hedges, both the effective and ineffective portions of the changes in the fair value of the derivative, along with the offsetting gain or loss on the
60
Table of Contents
SEARS HOLDINGS CORPORATION
Notes to Consolidated Financial Statements—(Continued)
designated hedged item that is attributable to the hedged risk, are recognized in the consolidated statements of income in the same account as the hedged item, as a component of interest expense. Changes in the fair value of interest rate swaps and caps that do not qualify as hedges are recognized currently as a component of interest expense. The foreign currency forward contracts are recorded on the consolidated balance sheet at fair value and, to the extent they have been designated and qualify for hedge accounting treatment, an offsetting amount is recorded as a component of other comprehensive income, net of income tax effects. Changes in the fair value of those forward contracts for which hedge accounting is not applied are recorded in the consolidated statement of income as a component of other income. Certain of our currency forward contracts require collateral to be posted in the event our liability under such contracts reaches a predetermined threshold. Cash collateral posted under these contracts is recorded as part of our restricted cash balance.
Other Financial Instruments
We have, from time to time, invested our surplus cash in various securities and financial instruments, including total return swaps, which are derivative instruments designed to synthetically replicate the economic return characteristics of one or more underlying marketable equity securities. Such investments may be highly concentrated and involve substantial risks. Changes in the fair value of the total return swaps are recognized as a component of interest and investment income in our consolidated statements of income as they occur. We had no investments in total return swaps as of January 30, 2010 or January 31, 2009.
Counterparty Credit Risk
We actively manage the risk of nonpayment by our derivative counterparties by limiting our exposure to individual counterparties based on credit ratings, value at risk and maturities. The counterparties to these instruments are major financial institutions with credit ratings of single-A or better as of January 30, 2010 and January 31, 2009.
Fair Value of Financial Instruments
We determine the fair value of financial instruments in accordance with standards pertaining to fair value measurements. Such standards define fair value and establish a framework for measuring fair value in GAAP. Under fair value measurement accounting standards, fair value is considered to be the exchange price in an orderly transaction between market participants to sell an asset or transfer a liability at the measurement date. We report the fair value of financial assets and liabilities based on the fair value hierarchy prescribed by accounting standards for fair value measurements, which prioritizes the inputs to valuation techniques used to measure fair value into three levels. See Note 4 to the consolidated financial statements for further information regarding our derivative positions.
Financial instruments that potentially subject Holdings to concentration of credit risk consist principally of temporary cash investments, accounts receivable and derivative financial instruments. We place our cash and cash equivalents in investment-grade, short-term instruments with high quality financial institutions and, by policy, limit the amount of credit exposure in any one financial instrument. We use high credit quality counterparties to transact our derivative transactions.
Cash and cash equivalents, accounts receivable, merchandise payables, credit facility borrowings and accrued liabilities are reflected in the consolidated balance sheet at cost, which approximates fair value due to the short-term nature of these instruments. The fair value of our debt is disclosed in Note 3 to the consolidated financial statements.
61
Table of Contents
SEARS HOLDINGS CORPORATION
Notes to Consolidated Financial Statements—(Continued)
Self-insurance Reserves
We are self-insured for certain costs related to workers’ compensation, asbestos and environmental, automobile, warranty, product and general liability claims. We obtain third-party insurance coverage to limit our exposure to certain of these self-insured risks. A portion of these self-insured risks is managed through a wholly owned insurance subsidiary. Our liability reflected on the consolidated balance sheet, classified within other liabilities (current and long-term), represents an estimate of the ultimate cost of claims incurred as of the balance sheet date. In estimating this liability, we utilize loss development factors based on Company-specific data to project the future development of incurred losses. Loss estimates are adjusted based upon actual claims settlements and reported claims. The liabilities for self-insured risks are discounted to their net present values.
Loss Contingencies
We account for contingent losses in accordance with accounting standards pertaining to loss contingencies. Under accounting standards, loss contingency provisions are recorded for probable losses at management’s best estimate of a loss, or when a best estimate cannot be made, a minimum loss contingency amount is recorded. These estimates are often initially developed substantially earlier than the ultimate loss is known, and the estimates are refined each accounting period, as additional information is known.
Revenue Recognition
Revenues include sales of merchandise, services and extended service contracts, net commissions earned from leased departments in retail stores, delivery and handling revenues related to merchandise sold, and fees earned from co-branded credit card programs. We recognize revenues from retail operations at the later of the point of sale or the delivery of goods to the customer. Direct to customer revenues are recognized when the merchandise is delivered to the customer. Revenues from product installation and repair services are recognized at the time the services are provided. Revenues from the sale of service contracts and the related direct acquisition costs are deferred and amortized over the lives of the associated contracts, while the associated service costs are expensed as incurred.
We earn revenues through arrangements with third-party financial institutions that manage and directly extend credit relative to our co-branded credit card programs. The third-party financial institutions pay us for generating new accounts and sales activity on co-branded cards, as well as for selling other financial products to cardholders. We recognize these revenues in the period earned, which is when our related performance obligations have been met. We sell gift cards to customers at our retail stores and through our direct to customer operations. The gift cards generally do not have expiration dates. Revenues from gift cards are recognized when (i) the gift card is redeemed by the customer, or (ii) the likelihood of the gift card being redeemed by the customer is remote (gift card breakage) and we determine that we do not have a legal obligation to remit the value of the unredeemed gift cards to the relevant jurisdictions.
Revenues from merchandise sales and services are reported net of estimated returns and allowances and exclude sales taxes. The reserve for returns and allowances is calculated as a percentage of sales based on historical return percentages. Estimated returns are recorded as a reduction of sales and cost of sales. We defer the recognition of layaway sales and profit until the period in which the customer takes possession of the merchandise.
Cost of Sales, Buying and Occupancy Costs
Cost of sales, buying and occupancy are comprised principally of the costs of merchandise, buying, warehousing and distribution (including receiving and store delivery costs), retail store occupancy costs, product
62
Table of Contents
SEARS HOLDINGS CORPORATION
Notes to Consolidated Financial Statements—(Continued)
repair, and home service and installation costs, customer shipping and handling costs, vendor allowances, markdowns and physical inventory losses.
Selling and Administrative Expenses
Selling and administrative expenses are comprised principally of payroll and benefits costs for retail and corporate employees, occupancy costs of corporate facilities, advertising, pre-opening costs and other administrative expenses.
Pre-Opening Costs
Pre-opening and start-up activity costs are expensed in the period in which they occur.
Advertising Costs
Advertising costs are expensed as incurred, generally the first time the advertising occurs, and amounted to $1.9 billion, $2.1 billion, and $2.2 billion for fiscal 2009, fiscal 2008, and fiscal 2007, respectively. These costs are included within selling and administrative expenses in the accompanying consolidated statements of income.
Income Taxes
We account for income taxes in accordance with accounting standards pertaining to such taxes. Accordingly, we provide deferred income tax assets and liabilities based on the estimated future tax effects of differences between the financial and tax basis of assets and liabilities based on currently enacted tax laws. The tax balances and income tax expense recognized by us are based on management’s interpretation of the tax laws of multiple jurisdictions. Income tax expense also reflects our best estimates and assumptions regarding, among other things, the level of future taxable income and tax planning. Future changes in tax laws, changes in projected levels of taxable income, tax planning, and adoption and implementation of new accounting standards could impact the effective tax rate and tax balances recorded by us.
Stock-based Compensation
We account for stock-based compensation arrangements in accordance with accounting standards pertaining to share-based payment transactions, which requires us to both recognize as expense the fair value of all stock-based compensation awards (which includes stock options) and to classify excess tax benefits associated with share-based compensation deductions as cash from financing activities rather than cash from operating activities. We recognize compensation expense as awards vest on a straight-line basis over the requisite service period of the award.
Earnings Per Common Share
Basic earnings per common share is calculated by dividing net income attributable to Holdings’ shareholders by the weighted average number of common shares outstanding for each period. Diluted earnings per common share also includes the dilutive effect of potential common shares, exercise of stock options and the effect of restricted stock when dilutive.
63
Table of Contents
SEARS HOLDINGS CORPORATION
Notes to Consolidated Financial Statements—(Continued)
New Accounting Pronouncements
In June 2009, the Financial Accounting Standards Board, or FASB, issued the FASB Accounting Standards Codification (“Codification”). Beginning in the third quarter of 2009, the Codification became the single source for all authoritative generally accepted accounting principles, or GAAP, recognized by the FASB and is required to be applied to financial statements issued for interim and annual periods ending after September 15, 2009. SEC rules and interpretive releases also continue to be sources of authoritative GAAP for SEC registrants. The Codification does not change GAAP and did not impact our results of operations, cash flows or financial position.
Pension and Postretirement Benefit Plans
In December 2008, the FASB issued an update to accounting standards regarding employers’ disclosures about postretirement benefit plan assets, which requires additional disclosures for pension and other postretirement benefit plan assets. As pension and other postretirement benefit plan assets were not included within the scope of new accounting standards previously issued on fair value, the update requires employers to disclose information about fair value measurements of plan assets, including the investment policies and strategies for the major categories of plan assets, and significant concentrations of risk within plan assets. The accounting update is effective for fiscal years ending after December 15, 2009. As the update provides only disclosure requirements, the adoption of this standard did not have a material impact on our results of operations, cash flows or financial position. See Note 7 to the Consolidated Financial Statements disclosures regarding the fair value of our pension assets.
Business Combinations
Effective February 1, 2009, we adopted a newly issued accounting standard for business combinations. The new standard has a significant impact on the accounting for transaction costs and restructuring costs, as well as the initial recognition of contingent assets and liabilities assumed during a business combination. The provisions of the new standard are applied prospectively from the date of adoption, except for adjustments to valuation allowances recorded on previously acquired entities’ deferred tax assets and uncertain tax position balances occurring outside the measurement period, which are recorded as a component of income tax expense in the period of adjustment, rather than goodwill. We expect this standard will have an impact on our consolidated financial statements, but the nature and magnitude of the specific effects will depend upon the nature, terms and size of the acquisitions we consummate after the effective date. As of January 30, 2010, we have recorded $38 million of unrecognized tax benefits and related interest, net of federal tax benefit, for tax positions of the Predecessor Company and tax positions of acquired entities taken prior to their acquisition by Holdings. Liabilities settled for different amounts will affect our income tax expense in the period of settlement or reversal. Settlements recorded in fiscal 2009 did not have a material impact on our results of operations.
Noncontrolling Interests in Consolidated Financial Statements
Effective February 1, 2009, we adopted a newly issued accounting standard for noncontrolling interests. The new standard governs the accounting for, and reporting of, noncontrolling interests in partially owned consolidated subsidiaries and the loss of control of subsidiaries. The standard requires that: (1) noncontrolling interest, previously referred to as minority interest, be reported as part of equity in the consolidated financial statements; (2) losses be allocated to a noncontrolling interest even when such allocation might result in a deficit balance, reducing the losses attributed to the controlling interest; (3) changes in ownership interests be treated as equity transactions if control is maintained; (4) changes in ownership interests resulting in gain or loss be recognized in earnings if control is gained or lost; and (5) in a business combination the noncontrolling interest’s
64
Table of Contents
SEARS HOLDINGS CORPORATION
Notes to Consolidated Financial Statements—(Continued)
share of net assets acquired be recorded at the fair value, plus its share of goodwill. The provisions of the new standard were prospective upon adoption, except for the presentation and disclosure requirements. The presentation and disclosure requirements must be applied retrospectively for all periods presented. Accordingly, our consolidated balance sheet as of January 31, 2009, our consolidated statements of income for the fiscal years ended January 31, 2009 and February 2, 2008, and consolidated statements of cash flows and consolidated statements of equity for the fiscal years ended January 31, 2009 and February 2, 2008 have been retrospectively adjusted to reflect noncontrolling interests in Sears Canada and OSH (which represent 27% and 19.9% of the subsidiaries’ ownership, respectively), and include adjustments to reclassify $319 million and $313 million from other long-term liabilities to equity as of January 31, 2009 and February 2, 2008, respectively.
Disclosures about Derivative Instruments
In March 2008, the FASB issued a new standard regarding disclosures about derivative instruments and hedging activities. We adopted the new standard on February 1, 2009. The standard supplements previously required disclosures with additional qualitative and quantitative information, including information regarding our use of derivatives and the effects derivative positions have on our earnings. See information in Note 1 and Note 4 to the Consolidated Financial Statements for further discussion required by this new standard.
Disclosures about Fair Value Measurements
In January 2010, the FASB issued an accounting standards update to improve disclosures about fair value measurements. The update amends existing accounting rules regarding fair value measurements and disclosures to add new requirements for disclosures related to transfers into and out of investment Levels 1 and 2, and separate disclosures about purchases, sales, issuances, and settlements relating to Level 3 investment measurements. It also clarifies existing fair value disclosures about the level of disaggregation, as well as inputs and valuation techniques used to measure fair value. The update is effective for the first reporting period beginning after December 15, 2009, except for the requirement to provide the Level 3 activity of purchases, sales, issuances, and settlements on a gross basis, which will be effective for fiscal years beginning after December 15, 2010. As this update only relates to financial statement disclosures, we do not expect it will have an impact on our results of operations, cash flows or financial positions.
Subsequent Events
During the second quarter of fiscal 2009, we adopted a newly issued accounting standard for subsequent events. The new standard incorporates the principles and accounting guidance for recognizing and disclosing subsequent events that originated as auditing standards into the body of authoritative literature issued by the FASB and also prescribes disclosure regarding the date through which subsequent events have been evaluated. We are required to evaluate subsequent events through the date our financial statements are issued. In February 2010, the FASB amended this new standard to eliminate the disclosure requirement regarding the date through which subsequent events have been evaluated. As the new standard was not intended to significantly change the current practice of reporting subsequent events, it did not have an impact on our results of operations, cash flows or financial positions.
NOTE 2—ACQUISITION OF NONCONTROLLING INTEREST IN SEARS CANADA
During fiscal 2009, we increased our controlling interest in Sears Canada by acquiring approximately 0.5 million common shares in open market transactions. We paid a total of $7 million for the additional shares and accounted for the acquisition of additional interest in Sears Canada as an equity transaction in accordance with a newly issued accounting standard on noncontrolling interests (see Note 1 for further information on this
65
Table of Contents
SEARS HOLDINGS CORPORATION
Notes to Consolidated Financial Statements—(Continued)
new standard). The acquisition of the additional interest in Sears Canada was not material to our financial position. Our majority interest in Sears Canada remains at 73%.
During fiscal 2008, we increased our controlling interest in Sears Canada from 70% to 73% by acquiring approximately 2.6 million common shares in open market transactions. We paid a total of $37 million for the additional shares acquired and accounted for the acquisition of additional interest in Sears Canada as a purchase business combination. Total consideration for the additional interest acquired exceeded the associated proportionate pre-acquisition carrying value for Sears Canada by approximately $9 million, approximately all of which was allocated to goodwill.
NOTE 3—BORROWINGS
Total borrowings outstanding at January 30, 2010 and January 31, 2009 were $2.5 billion and $2.9 billion, respectively. At January 30, 2010, total short-term borrowings were $325 million, consisting of $119 million of secured borrowings and $206 million of unsecured commercial paper. At January 31, 2009, total short-term borrowings were $442 million, consisting of $435 million of secured borrowings and $7 million of unsecured commercial paper. The weighted-average annual interest rate paid on short-term debt was 3.0% in fiscal 2009 and 3.5% in fiscal 2008.
Long-term debt is as follows:
| ISSUE |
January 30, 2010 |
January 31, 2009 |
||||||
| millions | ||||||||
| SEARS ROEBUCK ACCEPTANCE CORP. |
||||||||
| 6.25% to 7.50% Notes, due 2010 to 2043 |
$ | 823 | $ | 1,070 | ||||
| 5.20% to 7.50% Medium-Term Notes, due 2010 to 2013 |
83 | 106 | ||||||
| SEARS DC CORP. |
||||||||
| 9.07% to 9.20% Medium-Term Notes, due 2012 |
23 | 24 | ||||||
| ORCHARD SUPPLY HARDWARE STORES CORPORATION |
||||||||
| Commercial Mortgage-Backed Loan, variable interest rate above LIBOR, due 2010(1) |
120 | 120 | ||||||
| Senior Secured Term Loan, variable rate of interest above LIBOR, due 2013(2) |
176 | 189 | ||||||
| SEARS CANADA INC. |
||||||||
| 7.05% to 7.45% Medium-Term Notes, due 2010 |
281 | 250 | ||||||
| CAPITALIZED LEASE OBLIGATIONS |
635 | 664 | ||||||
| OTHER NOTES AND MORTGAGES |
39 | 54 | ||||||
| Total long-term borrowings |
2,180 | 2,477 | ||||||
| Current maturities |
(482 | ) | (345 | ) | ||||
| Long-term debt and capitalized lease obligations |
$ | 1,698 | $ | 2,132 | ||||
| Weighted-average annual interest rate on long-term debt |
6.6 | % | 6.9 | % | ||||
| (1) | The Commercial Mortgage-Backed Loan is collateralized by certain real properties of our OSH wholly owned subsidiary with a total carrying value of approximately $169 million as of January 30, 2010. The Commercial Mortgage-Backed Loan had an interest rate of LIBOR plus 1.625% at January 30, 2010. |
| (2) | The Senior Secured Term Loan is non-recourse to Holdings. The Senior Secured Term Loan is collateralized by a priority interest in all non-real estate assets of OSH and a second lien on OSH’s inventory, and requires quarterly repayments equal to 0.25% of the then outstanding principal balance. The Senior Secured Term Loan had an interest rate of LIBOR plus 2.75% at January 30, 2010. |
66
Table of Contents
SEARS HOLDINGS CORPORATION
Notes to Consolidated Financial Statements—(Continued)
The fair value of long-term debt was $1.4 billion at both January 30, 2010 and January 31, 2009. The fair value of our debt was estimated based on quoted market prices for the same or similar issues or on current rates offered to us for debt of the same remaining maturities.
As of January 30, 2010, long-term debt maturities for the next five years and thereafter were as follows:
| millions | |||
| 2010 |
$ | 482 | |
| 2011 |
490 | ||
| 2012 |
228 | ||
| 2013 |
68 | ||
| 2014 |
219 | ||
| Thereafter |
693 | ||
| $ | 2,180 | ||
Interest
Interest expense for fiscal years 2009, 2008, and 2007 was as follows:
| millions | 2009 | 2008 | 2007 | ||||||
| COMPONENTS OF INTEREST EXPENSE |
|||||||||
| Interest expense |
$ | 219 | $ | 243 | $ | 253 | |||
| Accretion of obligations at net present value |
22 | 24 | 26 | ||||||
| Amortization of debt issuance costs |
24 | 5 | 7 | ||||||
| Interest expense |
$ | 265 | $ | 272 | $ | 286 | |||
Debt Repurchase Authorization
In fiscal 2005, our Finance Committee of the Board of Directors authorized the repurchase, subject to market conditions and other factors, of up to $500 million of our outstanding indebtedness in open market or privately negotiated transactions. Our wholly owned finance subsidiary, Sears Roebuck Acceptance Corp. (“SRAC”), has repurchased $215 million of its outstanding notes, including $6 million repurchased during fiscal 2009, $49 million repurchased during fiscal 2008 and $2 million repurchased during fiscal 2007, thereby reducing the unused balance of this authorization to $285 million. We recognized a gain of $13 million on the repurchases made during fiscal 2008.
Credit Agreement
During the second quarter of 2009, we extended the maturity date of our credit agreement (“Original Credit Agreement”) by entering into an amended credit agreement (the “Amended Credit Agreement”) which has an expiration date of June 22, 2012. The Amended Credit Agreement is an asset based revolving credit facility under which SRAC and Kmart Corporation are the borrowers. Our Original Credit Agreement, which was to expire on March 24, 2010, provided $4.0 billion of borrowing capacity, however only approximately $3.8 billion had been available since September 2008 when an affiliate of Lehman Brothers notified us it would no longer fund its proportionate share of commitments under the Original Agreement. Also during the second quarter of fiscal 2009, we agreed, for a fee, to allow one of the lenders in our Amended Credit Agreement to exit its commitment, which decreased our total borrowing capacity by $65 million. As a result of the amendment and
67
Table of Contents
SEARS HOLDINGS CORPORATION
Notes to Consolidated Financial Statements—(Continued)
changes to the facility during the second quarter, our total borrowing capacity increased to $4.1 billion. The fee we received related to the exit of one of our lenders was recorded as a reduction to interest expense during the second quarter of fiscal 2009.
The Amended Credit Agreement provides for a bifurcation of the $4.1 billion credit facility into a $2.4 billion tranche maturing on June 22, 2012, bearing an interest rate of the London Interbank Offered Rate (“LIBOR”) plus 4.00% (the “Extended Tranche”), with a LIBOR floor of 1.75%, and a $1.7 billion tranche maturing March 24, 2010, bearing an initial interest rate of LIBOR plus 0.875% (the “Existing Tranche”). The bifurcation into the Extended Tranche provides Holdings and its subsidiaries more than adequate liquidity for standby letters of credit and working capital needs. The Amended Credit Agreement also gives us the flexibility, subject to certain terms and conditions, to increase the size of the credit facility or add a term loan tranche to the Amended Credit Agreement in an aggregate amount of up to $1.0 billion. It imposes various requirements, including a requirement that, if availability under the credit facility is beneath a certain threshold, the fixed charge ratio as of the last day of any fiscal quarter be not less than 1.0 to 1.0, a cash dominion requirement if excess availability on the revolver falls below designated levels, and limitations on our ability to make restricted payments, including dividends and share repurchases. In connection with the Amended Credit Agreement, the Company agreed to limit the amount of cash accumulated when borrowings are outstanding under the credit facility. The Amended Credit Agreement has a $1.5 billion letter of credit sub-limit, is secured by a first lien on most of our domestic inventory and credit card and pharmacy receivables, and determines availability pursuant to a borrowing base formula.
At January 30, 2010, we had $119 million of borrowings and $646 million of letters of credit outstanding under the Amended Credit Agreement. Our availability under the agreement, given total outstanding borrowings and letters of credit of $765 million, was $3.3 billion at January 30, 2010. The facility will decrease in size by $1.7 billion (to $2.4 billion) on March 24, 2010. As of January 31, 2009, we had $435 million of borrowings and $968 million of letters of credit outstanding under the Credit Agreement with $2.6 billion of availability remaining under the Credit Agreement. The majority of the letters of credit outstanding are used to provide collateral for our insurance programs.
Cash Collateral
We post cash collateral for certain self-insurance programs. We continue to classify the cash collateral posted for self-insurance programs as cash and cash equivalents due to our ability to substitute letters of credit for the cash at any time at our discretion. As of January 30, 2010 and January 31, 2009, $7 million and $12 million of cash, respectively, was posted as collateral for self-insurance programs.
Orchard Supply Hardware LLC (“OSH LLC”) Credit Agreement
In November 2005, OSH LLC entered into a five-year, $130 million senior secured revolving credit facility (the “OSH LLC Facility”), which includes a $25 million letter of credit sublimit. The OSH LLC Facility was amended and extended in January 2010 and, as a result, available capacity was bifurcated into a $100 million tranche maturing December 2013 and a $20 million tranche maturing December 2011. The OSH LLC Facility continues to have a $25 million letter of credit sublimit. The OSH LLC Facility is available for OSH LLC’s general corporate purposes and is secured by a first lien on substantially all of OSH LLC’s non-real estate assets. Availability under the OSH LLC Facility is determined pursuant to a borrowing base formula based on inventory and account and credit card receivables, subject to certain limitations. As of January 30, 2010, there were no borrowings outstanding under the OSH LLC Facility and $8 million in outstanding letters of credit.
68
Table of Contents
SEARS HOLDINGS CORPORATION
Notes to Consolidated Financial Statements—(Continued)
Wholly owned Insurance Subsidiary and Inter-company Notes
As noted in Note 1, we have numerous types of insurable risks, including workers’ compensation, product and general liability, automobile, warranty, and asbestos and environmental claims. Also, as discussed in Note 1, we sell extended service contracts to our customers. The associated risks are managed through our wholly owned insurance subsidiary. In accordance with applicable insurance regulations, the insurance subsidiary holds investment grade securities to support the insurance coverage it provides.
We have transferred certain domestic real estate and intellectual property (i.e. trademarks) into separate wholly owned, bankruptcy remote subsidiaries. These bankruptcy remote subsidiaries lease the real estate property to Sears and license the use of the trademarks to Sears and Kmart. Further, the bankruptcy remote subsidiaries have issued asset-backed notes that are collateralized by the aforementioned real estate rental streams and intellectual property licensing fee streams. Cash flows received from rental streams and licensing fee streams paid by Sears, Kmart and, potentially in the future, other affiliates or third parties, will be used for the payment of fees, interest and principal on the asset-backed notes issued. Since the inception of these subsidiaries, the debt securities have been entirely held by our wholly owned consolidated subsidiaries in support of our insurance activities. At January 30, 2010 and January 31, 2009, the net book value of the securitized intellectual property assets was approximately $1.0 billion. The net book value of the securitized real estate assets was approximately $0.9 billion at January 30, 2010 and January 31, 2009.
NOTE 4—DERIVATIVE FINANCIAL INSTRUMENTS AND FINANCIAL GUARANTEES
Sears Canada Hedges of Merchandise Purchases
Sears Canada had entered into foreign currency option contracts with a total notional value of $299 million and $457 million as of January 30, 2010 and January 31, 2009, respectively. As discussed previously, these option contracts are used to hedge Sears Canada’s purchase of inventory under U.S. dollar denominated contracts. We record mark-to-market adjustments based on the total notional value of these outstanding option contracts at the end of each period. We recorded mark-to-market assets related to the foreign currency option contracts of $9 million at January 30, 2010 and $74 million at January 31, 2009.
We record the earnings impact of mark-to-market and settlement adjustments for foreign currency option contracts in other income (loss) at the end of each period. We recorded mark-to-market and settlement losses on these contracts of $77 million and mark-to-market gains of $87 million in other income (loss) for fiscal years ended January 30, 2010 and January 31, 2009, respectively.
Sears Canada’s above noted foreign currency options contracts were entered into as a hedge of merchandise purchase contracts denominated in U.S. currency. We also record mark-to-market adjustments for the value of the merchandise purchase contracts (considered to be embedded derivatives under relevant accounting rules) at the end of each period. These embedded derivates had a zero fair value as of January 30, 2010. We recorded a liability of $6 million at January 31, 2009 related to the fair value of these embedded derivatives.
We record the earnings impact of mark-to-market and settlement adjustments related to the embedded derivative in the merchandise purchase contracts in other income (loss) at the end of each period. We recorded mark-to-market and settlement gains of $10 million for the fiscal year ended January 30, 2010 and mark-to-market losses of $6 million for the fiscal year ended January 31, 2009.
At January 30, 2010, we had total derivative mark-to-market assets related to the option contracts and embedded derivatives of $9 million. We recorded total mark-to-market losses and settlements of $67 million in
69
Table of Contents
SEARS HOLDINGS CORPORATION
Notes to Consolidated Financial Statements—(Continued)
other income (loss) for the fiscal year ending January 30, 2010. At January 31, 2009, we had a mark-to-market asset related to the option contracts of $74 million and a mark-to-market liability related to the embedded derivatives of $6 million. We recorded total mark-to-market gains of $81 million in other income (loss) for the fiscal year ending January 31, 2009. See Note 5 for further information regarding fair value of these option and merchandise purchase contracts and the respective balance sheet classifications as of January 30, 2010 and January 31, 2009.
Hedges of Net Investment in Sears Canada
As of January 30, 2010, we had a series of foreign currency forward contracts outstanding with a total Canadian notional value of $400 million and with a weighted-average remaining life of 0.5 years. These contracts were designated and qualified as hedges of the foreign currency exposure of our net investment in Sears Canada. Accordingly, the aggregate fair value of the forward contracts as of January 30, 2010, $15 million, was recorded as an asset on our consolidated balance sheet, with an offsetting amount, net of tax, recorded as a component of other comprehensive income. Certain of our currency forward contracts require collateral be posted in the event our liability under such contracts reaches a predetermined threshold. Cash collateral posted under these contracts is recorded as part of our accounts receivable balance. We did not have any cash collateral posted under these contracts as of January 30, 2010. We had no such foreign currency forward contracts outstanding as of January 31, 2009.
During fiscal 2008, we paid a net amount of $64 million to settle certain foreign currency forward contracts entered into in prior years. As hedge accounting was applied to such contract settlements, an offsetting amount was recorded as a component of other comprehensive income.
Total Return Swaps
We have, from time to time, invested our surplus cash in various securities and financial instruments, including total return swaps, which are derivative instruments designed to synthetically replicate the economic return characteristics of one or more underlying marketable equity securities. Such investments may be highly concentrated and involve substantial risks and may require us to post cash collateral as a percentage of the notional amount of the underlying position. We had no total return swaps outstanding at any point during fiscal 2009 or fiscal 2008. We recognized investment losses of $14 million on total return swaps during fiscal 2007.
Financial Guarantees
We issue various types of guarantees in the normal course of business. We had the following guarantees outstanding as of January 30, 2010:
| millions | Bank Issued |
SRAC Issued |
Other | Total | ||||||||
| Standby letters of credit |
$ | 662 | $ | 67 | $ | — | $ | 729 | ||||
| Commercial letters of credit |
18 | 106 | — | 124 | ||||||||
| Secondary lease obligations |
— | — | 19 | 19 | ||||||||
The secondary lease obligations relate to certain store leases of previously divested Sears businesses. We remain secondarily liable if the primary obligor defaults.
70
Table of Contents
SEARS HOLDINGS CORPORATION
Notes to Consolidated Financial Statements—(Continued)
NOTE 5—FAIR VALUE OF FINANCIAL ASSETS AND LIABILITIES
We determine fair value of financial assets and liabilities based on the following fair value hierarchy, which prioritizes the inputs to valuation techniques used to measure fair value into three levels:
Level 1 inputs—unadjusted quoted prices in active markets for identical assets or liabilities that we have the ability to access. An active market for the asset or liability is one in which transactions for the asset or liability occur with sufficient frequency and volume to provide ongoing pricing information.
Level 2 inputs—inputs other than quoted market prices included in Level 1 that are observable, either directly or indirectly, for the asset or liability. Level 2 inputs include, but are not limited to, quoted prices for similar assets or liabilities in an active market, quoted prices for identical or similar assets or liabilities in markets that are not active and inputs other than quoted market prices that are observable for the asset or liability, such as interest rate curves and yield curves observable at commonly quoted intervals, volatilities, credit risk and default rates.
Level 3 inputs—unobservable inputs for the asset or liability.
Cash and cash equivalents, accounts receivable, merchandise payables, short-term borrowings and accrued liabilities are reflected in the consolidated balance sheets at cost, which approximates fair value due to the short-term nature of these instruments. The fair value of our debt is disclosed in Note 3 to the Consolidated Financial Statements. The following table provides the fair value measurement amounts for other financial assets and liabilities recorded on our consolidated balance sheets at fair value as of January 30, 2010 and January 31, 2009:
| millions | Total Fair Value Amounts at January 30, 2010 |
Level 1 | Level 2 | Level 3 | ||||||||
| Foreign currency derivative assets(1) |
$ | 24 | $ | — | $ | 24 | $ | — | ||||
| Total |
$ | 24 | $ | — | $ | 24 | $ | — | ||||
| millions | Total Fair Value Amounts at January 31, 2009 |
Level 1 | Level 2 | Level 3 | ||||||||||
| Short-term investments(2) |
$ | 38 | $ | — | $ | 38 | $ | — | ||||||
| Foreign currency derivative assets(1) |
74 | — | 74 | — | ||||||||||
| Foreign currency derivative liabilities(3) |
(6 | ) | — | (6 | ) | — | ||||||||
| Total |
$ | 106 | $ | — | $ | 106 | $ | — | ||||||
| (1) | Included within Accounts receivable on the consolidated balance sheets. |
| (2) | Included within Prepaid expenses and other current assets on the consolidated balance sheets. |
| (3) | Included within Other current liabilities on the consolidated balance sheets. |
Short-term investments are typically valued at the closing price in the principal active market as of the last business day of the year. Short-term investments at January 31, 2009 included $38 million on deposit with The Reserve Primary Fund, a money market fund that had temporarily restricted withdrawals while it liquidated its holdings to generate cash to distribute. The fair value of this investment was determined by using estimates based on the values of similar assets and information obtained from The Reserve Primary Fund. We recorded a $3
71
Table of Contents
SEARS HOLDINGS CORPORATION
Notes to Consolidated Financial Statements—(Continued)
million loss in connection with our investment in The Reserve Primary Fund for the fiscal year ended January 31, 2009.
The fair values of derivative assets and liabilities traded in the over-the-counter market are determined using quantitative models that require the use of multiple inputs including interest rates, prices and indices to generate pricing and volatility factors. The predominance of market inputs are actively quoted and can be validated through external sources, including brokers, market transactions and third-party pricing services. Our derivative instruments are valued using Level 2 measurements.
NOTE 6—INTEREST AND INVESTMENT INCOME
The following table sets forth the components of interest and investment income as reported in our consolidated statements of income.
| millions | 2009 | 2008 | 2007 | |||||||
| Interest income on cash and cash equivalents |
$ | 5 | $ | 25 | $ | 107 | ||||
| Other investment income |
28 | 21 | 42 | |||||||
| Total return swap loss |
— | — | (14 | ) | ||||||
| Total |
$ | 33 | $ | 46 | $ | 135 | ||||
Interest Income on Cash and Cash Equivalents
We recorded interest income of $5 million, $25 million, and $107 million for fiscal 2009, fiscal 2008 and fiscal 2007, respectively, primarily related to interest earned on cash and cash equivalents. These cash and cash equivalents consist of highly liquid investments with original maturities of three months or less at the date of purchase. Our invested cash may include, from time to time, investments in, but not limited to, commercial paper, U.S. federal, state and municipal government securities, floating-rate notes, repurchase agreements and money market funds. All invested cash amounts are readily available to us.
Other Investment Income
Other investment income primarily includes income generated by (and sales of investments in) certain real estate joint ventures and other equity investments in which we do not have a controlling interest. Other investment income included a $9 million, $10 million and $20 million dividend received on our cost method investment in Sears Mexico for fiscal 2009, fiscal 2008 and fiscal 2007, respectively.
Total Return Swap Loss
As discussed above in Note 4, from time to time, we invest our surplus cash in various securities and financial instruments, including total return swaps. During fiscal 2007, we recognized investment losses of $14 million on these total return swaps. We had no total return swaps outstanding at any time during fiscal years 2009 and 2008.
72
Table of Contents
SEARS HOLDINGS CORPORATION
Notes to Consolidated Financial Statements—(Continued)
NOTE 7—BENEFIT PLANS
We sponsor a number of pension and postretirement benefit plans. Expenses for retirement and savings-related benefit plans were as follows:
| millions | 2009 | 2008 | 2007 | |||||||
| Retirement/401(k) Savings Plans |
$ | 13 | $ | 97 | $ | 91 | ||||
| Pension plans |
172 | — | (21 | ) | ||||||
| Postretirement benefits |
27 | 28 | 6 | |||||||
| Total |
$ | 212 | $ | 125 | $ | 76 | ||||
Retirement Savings Plans
We sponsor Sears and Kmart 401(k) retirement savings plans for employees meeting service eligibility requirements. Prior to fiscal 2009, we matched a portion of employee contributions made to the plans. The Company announced during fiscal 2008 that it would suspend matching contributions on employee deferrals to 401(k) plans with respect to eligible compensation earned for payroll periods that end after January 31, 2009. Total expense related to the Retirement Savings Plans was $84 million and $91 million in fiscal 2008 and 2007, respectively.
Effective July 1, 2008, the Sears Canada defined pension plan was amended and a defined contribution component was added. The defined benefit service accrual ceased and all plan members earn pensionable service under the defined contribution component of the Sears Registered Retirement Plan. The defined contribution expense was $13 million during each of fiscal 2009 and fiscal 2008.
Kmart’s Benefit Plans
Prior to 1996, the Predecessor Company (defined in Note 10) had a tax-qualified and a non-qualified defined benefit pension plan, which covered eligible associates who met certain requirements of age, length of service, and hours worked per year. Effective January 31, 1996, the pension plans were frozen, and associates no longer earn additional benefits under the plans.
The non-qualified defined benefit plan is for certain current and former Kmart associates, and is funded as benefits are paid. The benefit obligation was $1 million and $2 million at January 30, 2010 and January 31, 2009, respectively, and is included in the accompanying consolidated balance sheet. The projected benefit obligation is equal to the accumulated benefit obligation for all periods presented.
Kmart provides employees and pre-65 retirees certain medical benefits. Effective January 1, 2008, Holdings provides eligible post-65 retirees medical benefits as well. The plan is contributory, with retiree contributions adjusted annually. The accounting for the plan anticipates future cost-sharing changes that are consistent with our expressed intent to increase the retiree contribution rate annually. There were no accrued post-retirement benefit costs as of January 30, 2010 and January 31, 2009.
Sears’ Benefit Plans
Certain domestic full-time and part-time employees of Sears are eligible to participate in noncontributory defined benefit plans after meeting age and service requirements. Substantially all full-time Canadian employees, as well as some part-time employees, are eligible to participate in contributory defined benefit plans. Pension
73
Table of Contents
SEARS HOLDINGS CORPORATION
Notes to Consolidated Financial Statements—(Continued)
benefits are based on length of service, compensation and, in certain plans, social security or other benefits. Funding for the various plans is determined using various actuarial cost methods. Effective January 1, 2006, the Sears domestic pension plan was frozen and domestic associates no longer earn additional benefits under the plan.
In addition to providing pension benefits, Sears provides domestic and Canadian employees and retirees certain medical benefits. These benefits provide access to medical plans, with Company subsidies for certain eligible retirees. Certain domestic Sears’ retirees are also provided life insurance benefits. To the extent we share the cost of the retiree medical benefits with retirees, such cost sharing is based on years of service and year of retirement. Sears’ postretirement benefit plans are not funded. We have the right to modify or terminate these plans.
Effective January 1, 2006, we eliminated our subsidization of retiree medical costs under the Sears’ domestic retiree medical plan for those Sears’ retirees who were under age 65 as of December 31, 2005. In February 2007, Sears Canada announced amendments to its post-retirement programs including the introduction of a defined contribution component to its pension plan and the discontinuation of retiree medical, dental and life benefits for those Sears Canada associates who did not achieve eligibility for such benefits by December 31, 2008. The amendments to the post-retirement programs generated a curtailment gain and reduction to the benefit plan obligation in the amount of $27 million during the fiscal year ended February 2, 2008.
Merger of Plans
The Kmart tax-qualified defined benefit pension plan was merged with and into the Sears domestic pension plan effective as of January 30, 2008. The merged plan was renamed as the Sears Holdings Pension Plan (“SHC domestic plan”) and Holdings accepted sponsorship of the SHC domestic plan effective as of that date.
Effective January 1, 2007, the Kmart pre-65 retiree medical plan and the Sears pre-65 and post-65 retiree medical plans were merged into a master retiree medical program sponsored by Holdings. Effective December 19, 2007, this master program was merged with a subsidiary’s retiree program, creating a new master plan, which includes separate Holdings pre-65 and post-65 programs.
Eligible Kmart associates who retired on or after January 1, 2008 and all eligible Sears retirees are covered by both of these programs. Kmart associates who retired before January 1, 2008 are eligible for the pre-65 program only.
Changes in Accounting for Pensions and Postretirement Plans
Effective January 31, 2009, a provision of a previously adopted accounting standard regarding pension and postretirement plans required us to measure plan assets and benefit obligations at fiscal year end. We previously performed this measurement at December 31 of each year. The change in our measurement date did not have a material impact on our results of operations or financial condition.
74
Table of Contents
SEARS HOLDINGS CORPORATION
Notes to Consolidated Financial Statements—(Continued)
Pension Plans
| 2009 | 2008 | |||||||||||||||||||||||
| millions | SHC Domestic |
Sears Canada |
Total | SHC Domestic |
Sears Canada |
Total | ||||||||||||||||||
| Change in projected benefit obligation |
||||||||||||||||||||||||
| Beginning balance |
$ | 4,920 | $ | 868 | $ | 5,788 | $ | 5,232 | $ | 1,510 | $ | 6,742 | ||||||||||||
| Benefits earned during the period |
— | — | — | — | 23 | 23 | ||||||||||||||||||
| Interest cost |
336 | 71 | 407 | 356 | 75 | 431 | ||||||||||||||||||
| Actuarial loss (gain) |
525 | 276 | 801 | (265 | ) | (373 | ) | (638 | ) | |||||||||||||||
| Benefits paid |
(346 | ) | (101 | ) | (447 | ) | (403 | ) | (138 | ) | (541 | ) | ||||||||||||
| Foreign currency exchange impact |
— | 142 | 142 | — | (236 | ) | (236 | ) | ||||||||||||||||
| Other |
— | — | — | — | 7 | 7 | ||||||||||||||||||
| Balance as of the measurement date |
$ | 5,435 | $ | 1,256 | $ | 6,691 | $ | 4,920 | $ | 868 | $ | 5,788 | ||||||||||||
| Change in assets at fair value: |
||||||||||||||||||||||||
| Beginning balance |
$ | 3,215 | $ | 1,053 | $ | 4,268 | $ | 4,421 | $ | 1,567 | $ | 5,988 | ||||||||||||
| Actual return on plan assets |
591 | 108 | 699 | (1,062 | ) | (106 | ) | (1,168 | ) | |||||||||||||||
| Company contributions |
173 | 10 | 183 | 259 | 3 | 262 | ||||||||||||||||||
| Benefits paid |
(346 | ) | (101 | ) | (447 | ) | (403 | ) | (138 | ) | (541 | ) | ||||||||||||
| Foreign currency exchange impact |
— | 154 | 154 | — | (267 | ) | (267 | ) | ||||||||||||||||
| Other |
— | (13 | ) | (13 | ) | — | (6 | ) | (6 | ) | ||||||||||||||
| Balance as of the measurement date |
$ | 3,633 | $ | 1,211 | $ | 4,844 | $ | 3,215 | $ | 1,053 | $ | 4,268 | ||||||||||||
| Net amount recognized |
$ | (1,802 | ) | $ | (45 | ) | $ | (1,847 | ) | $ | (1,705 | ) | $ | 185 | $ | (1,520 | ) | |||||||
75
Table of Contents
SEARS HOLDINGS CORPORATION
Notes to Consolidated Financial Statements—(Continued)
Postretirement Obligations
| 2009 | 2008 | |||||||||||||||||||||||
| millions | SHC Domestic |
Sears Canada |
Total | SHC Domestic |
Sears Canada |
Total | ||||||||||||||||||
| Change in projected benefit obligation: |
||||||||||||||||||||||||
| Beginning balance |
$ | 297 | $ | 190 | $ | 487 | $ | 334 | $ | 308 | $ | 642 | ||||||||||||
| Benefits earned during the period |
— | 1 | 1 | — | 1 | 1 | ||||||||||||||||||
| Interest cost |
19 | 15 | 34 | 22 | 17 | 39 | ||||||||||||||||||
| Plan participants’ contributions |
48 | — | 48 | 54 | — | 54 | ||||||||||||||||||
| Actuarial loss (gain) |
3 | 44 | 47 | (12 | ) | (66 | ) | (78 | ) | |||||||||||||||
| Benefits paid |
(77 | ) | (14 | ) | (91 | ) | (101 | ) | (19 | ) | (120 | ) | ||||||||||||
| Foreign currency exchange rate impact and other |
— | 30 | 30 | — | (51 | ) | (51 | ) | ||||||||||||||||
| Balance as of the measurement date |
$ | 290 | $ | 266 | $ | 556 | $ | 297 | $ | 190 | $ | 487 | ||||||||||||
| Change in plan assets at fair value: |
||||||||||||||||||||||||
| Beginning of year balance |
$ | — | $ | 95 | $ | 95 | $ | — | $ | 116 | $ | 116 | ||||||||||||
| Actual return on plan assets |
— | 8 | 8 | — | 3 | 3 | ||||||||||||||||||
| Company contributions |
29 | — | 29 | 47 | 16 | 63 | ||||||||||||||||||
| Plan participants’ contributions |
48 | — | 48 | 54 | — | 54 | ||||||||||||||||||
| Benefits paid |
(77 | ) | (14 | ) | (91 | ) | (101 | ) | (19 | ) | (120 | ) | ||||||||||||
| Foreign currency exchange rate impact and other |
— | 13 | 13 | — | (21 | ) | (21 | ) | ||||||||||||||||
| Balance as of the measurement date |
$ | — | $ | 102 | $ | 102 | $ | — | $ | 95 | $ | 95 | ||||||||||||
| Funded status |
$ | (290 | ) | $ | (164 | ) | $ | (454 | ) | $ | (297 | ) | $ | (95 | ) | $ | (392 | ) | ||||||
The current portion of our liability for postretirement obligations is $36 million, which we expect to pay during fiscal 2010.
Weighted-average assumptions used to determine plan obligations are as follows:
| 2009 | 2008 | 2007 | |||||||||||||||||||
| SHC Domestic |
Sears Canada |
SHC Domestic |
Sears Canada |
Kmart | Sears Domestic |
Sears Canada |
|||||||||||||||
| Pension benefits: |
|||||||||||||||||||||
| Discount Rate |
6.00 | % | 6.00 | % | 7.00 | % | 7.90 | % | 6.45 | % | 6.45 | % | 5.50 | % | |||||||
| Rate of compensation increases |
N/A | 3.50 | % | N/A | 3.50 | % | N/A | N/A | 4.00 | % | |||||||||||
| Postretirement benefits: |
|||||||||||||||||||||
| Discount Rate |
6.00 | % | 6.00 | % | 7.00 | % | 7.80 | % | N/A | 6.45 | % | 5.50 | % | ||||||||
| Rate of compensation increases |
N/A | 3.50 | % | N/A | 3.50 | % | N/A | N/A | 4.00 | % | |||||||||||
76
Table of Contents
SEARS HOLDINGS CORPORATION
Notes to Consolidated Financial Statements—(Continued)
Net Periodic Benefit Cost
The components of net periodic benefit cost are as follows:
| 2009 | 2008 | 2007 | ||||||||||||||||||||||||||||||||||||||
| millions | SHC Domestic |
Sears Canada |
Total | SHC Domestic |
Sears Canada |
Total | Kmart | Sears Domestic |
Sears Canada |
Total | ||||||||||||||||||||||||||||||
| Pension benefits: |
||||||||||||||||||||||||||||||||||||||||
| Benefits earned during the period |
$ | — | $ | — | $ | — | $ | — | $ | 10 | $ | 10 | $ | — | $ | — | $ | 32 | $ | 32 | ||||||||||||||||||||
| Interest cost |
336 | 71 | 407 | 356 | 52 | 408 | 154 | 170 | 74 | 398 | ||||||||||||||||||||||||||||||
| Expected return on plan assets |
(241 | ) | (70 | ) | (311 | ) | (355 | ) | (63 | ) | (418 | ) | (171 | ) | (175 | ) | (92 | ) | (438 | ) | ||||||||||||||||||||
| Recognized net loss |
76 | — | 76 | — | — | — | — | — | — | — | ||||||||||||||||||||||||||||||
| Other |
— | — | — | — | — | — | — | (13 | ) | — | (13 | ) | ||||||||||||||||||||||||||||
| Net periodic benefit cost (benefit) |
$ | 171 | $ | 1 | $ | 172 | $ | 1 | $ | (1 | ) | $ | — | $ | (17 | ) | $ | (18 | ) | $ | 14 | $ | (21 | ) | ||||||||||||||||
| Postretirement benefits: |
||||||||||||||||||||||||||||||||||||||||
| Benefits earned during the period |
$ | — | $ | 1 | $ | 1 | $ | — | $ | 1 | $ | 1 | $ | — | $ | — | $ | 2 | $ | 2 | ||||||||||||||||||||
| Interest cost |
19 | 16 | 35 | 22 | 10 | 32 | — | 21 | 16 | 37 | ||||||||||||||||||||||||||||||
| Expected return on assets |
— | (6 | ) | (6 | ) | — | (5 | ) | (5 | ) | — | — | (8 | ) | (8 | ) | ||||||||||||||||||||||||
| Curtailment gain |
— | — | — | — | — | — | — | — | (27 | ) | (27 | ) | ||||||||||||||||||||||||||||
| Recognized net gain |
(1 | ) | — | (1 | ) | — | — | — | — | — | 1 | 1 | ||||||||||||||||||||||||||||
| Amortization of net actuarial gain |
— | (2 | ) | (2 | ) | — | — | — | — | — | — | — | ||||||||||||||||||||||||||||
| Other |
— | — | — | — | — | — | — | 1 | — | 1 | ||||||||||||||||||||||||||||||
| Net periodic benefit cost (benefit) |
$ | 18 | $ | 9 | $ | 27 | $ | 22 | $ | 6 | $ | 28 | $ | — | $ | 22 | $ | (16 | ) | $ | 6 | |||||||||||||||||||
Weighted-average assumptions used to determine net cost for years ended are as follows:
| 2009 | 2008 | 2007 | |||||||||||||||||||
| SHC Domestic |
Sears Canada |
SHC Domestic |
Sears Canada |
Kmart | Sears Domestic |
Sears Canada |
|||||||||||||||
| Pension benefits: |
|||||||||||||||||||||
| Discount Rate |
7.00 | % | 7.90 | % | 6.45 | % | 5.50 | % | 5.90 | % | 5.90 | % | 5.25 | % | |||||||
| Return of plan assets |
7.75 | % | 6.50 | % | 7.50 | % | 6.50 | % | 7.75 | % | 7.75 | % | 6.50 | % | |||||||
| Rate of compensation increases |
N/A | 3.50 | % | N/A | 4.00 | % | N/A | N/A | 4.00 | % | |||||||||||
| Postretirement benefits: |
|||||||||||||||||||||
| Discount Rate |
7.00 | % | 7.80 | % | 6.45 | % | 5.50 | % | N/A | 5.90 | % | 5.25 | % | ||||||||
| Return of plan assets |
N/A | 6.50 | % | N/A | 7.00 | % | N/A | N/A | 7.00 | % | |||||||||||
| Rate of compensation increases |
N/A | 3.50 | % | N/A | 4.00 | % | N/A | N/A | 4.00 | % | |||||||||||
77
Table of Contents
SEARS HOLDINGS CORPORATION
Notes to Consolidated Financial Statements—(Continued)
For 2010 and beyond, the domestic weighted-average health care cost trend rates used in measuring the postretirement benefit expense are a 10.0% trend rate in 2010 to an ultimate trend rate of 8.0% in 2014. A one-percentage-point change in the assumed health care cost trend rate would have the following effects on the postretirement liability:
| millions | 1 percentage-point Increase |
1 percentage-point Decrease |
|||||
| Effect on total service and interest cost components |
$ | 1 | $ | (1 | ) | ||
| Effect on postretirement benefit obligation |
$ | 23 | $ | (20 | ) | ||
$76 million of the unrecognized net losses in accumulated other comprehensive income are expected to be amortized as a component of net periodic benefit cost during fiscal 2010.
Investment Strategy
The Investment Committee, made up of select members of senior management, has appointed a non-affiliated third party professional to advise the Committee with respect to the SHC domestic pension plan assets. The plan’s overall investment objective is to provide a long-term return that, along with Company contributions, is expected to meet future benefit payment requirements. A long-term horizon has been adopted in establishing investment policy such that the likelihood and duration of investment losses are carefully weighed against the long-term potential for appreciation of assets. The plan’s investment policy requires investments to be diversified across individual securities, industries, market capitalization and valuation characteristics. In addition, various techniques are utilized to monitor, measure and manage risk.
Domestic plan assets were invested in the following classes of securities (none of which were securities of the Company):
| Plan Assets as of | ||||||
| January 30, 2010 |
January 31, 2009 |
|||||
| Equity securities |
38 | % | 33 | % | ||
| Fixed income and other debt securities |
59 | 61 | ||||
| Other |
3 | 6 | ||||
| Total |
100 | % | 100 | % | ||
The domestic plan’s target allocation is determined by taking into consideration the amounts and timing of projected liabilities, our funding policies and expected returns on various asset classes. At January 30, 2010, the plan’s target asset allocation was 40% equity and 60% fixed income. To develop the expected long-term rate of return on assets assumption, we considered the historical returns and the future expectations for returns for each asset class, as well as the target asset allocation of the pension portfolio.
78
Table of Contents
SEARS HOLDINGS CORPORATION
Notes to Consolidated Financial Statements—(Continued)
Sears Canada plan assets were invested in the following classes of securities (none of which were securities of the Company):
| Plan Assets as of | ||||||
| January 30, 2010 |
January 31, 2009 |
|||||
| Equity securities |
20 | % | 16 | % | ||
| Fixed income and other debt securities |
48 | 50 | ||||
| Alternative investments securities |
32 | 34 | ||||
| Total |
100 | % | 100 | % | ||
The Sears Canada plans’ target allocation is determined by taking into consideration the amounts and timing of projected liabilities, our funding policies and expected returns on various asset classes. At January 30, 2010, the plan’s target asset allocation was 50% fixed income, 30% alternative investments and 20% equity. To develop the expected long-term rate of return on assets assumption, we considered the historical returns and the future expectations for returns for each asset class, as well as the target asset allocation of the pension portfolio.
Future Cash Flows of Benefit Plans
Information regarding expected future cash flows for our benefit plans is as follows:
| millions | SHC Domestic |
Sears Canada |
Total | ||||||
| Pension benefits: |
|||||||||
| Employer contributions: |
|||||||||
| Fiscal 2010 (expected) |
$ | 278 | $ | — | $ | 278 | |||
| Expected benefit payments: |
|||||||||
| Fiscal 2010 |
$ | 321 | $ | 89 | $ | 410 | |||
| Fiscal 2011 |
330 | 92 | 422 | ||||||
| Fiscal 2012 |
340 | 94 | 434 | ||||||
| Fiscal 2013 |
351 | 97 | 448 | ||||||
| Fiscal 2014 |
361 | 101 | 462 | ||||||
| Fiscal 2015-2019 |
1,955 | 556 | 2,511 | ||||||
| Postretirement benefits: |
|||||||||
| Employer contributions: |
|||||||||
| Fiscal 2010 (expected) |
$ | 37 | $ | — | $ | 37 | |||
| Expected benefit payments: |
|||||||||
| Fiscal 2010 |
$ | 37 | $ | 18 | $ | 55 | |||
| Fiscal 2011 |
35 | 18 | 53 | ||||||
| Fiscal 2012 |
33 | 19 | 52 | ||||||
| Fiscal 2013 |
31 | 19 | 50 | ||||||
| Fiscal 2014 |
30 | 19 | 49 | ||||||
| Fiscal 2015-2019 |
120 | 97 | 217 | ||||||
79
Table of Contents
SEARS HOLDINGS CORPORATION
Notes to Consolidated Financial Statements—(Continued)
Fair Value of Pension and Postretirement Benefit Plan Assets
The following table presents our plan assets using the fair value hierarchy described in Note 5 as of January 30, 2010:
| SHC Domestic |
Investment Assets at Fair Value as of January 30, 2010 | ||||||||||||
| Total | Level 1 | Level 2 | Level 3 | ||||||||||
| Cash equivalents and short term investments |
$ | 157 | $ | — | $ | 157 | $ | — | |||||
| Global equity securities |
|||||||||||||
| Common and preferred stock |
1,263 | 1,262 | 1 | — | |||||||||
| Registered investment companies |
5 | 5 | — | — | |||||||||
| Fixed income securities |
|||||||||||||
| Corporate |
1,205 | — | 1,205 | — | |||||||||
| U.S. government and agencies |
301 | — | 301 | — | |||||||||
| Mortgage backed and asset backed |
377 | — | 364 | 13 | |||||||||
| Municipal and foreign government |
73 | — | 73 | — | |||||||||
| Ventures and partnerships |
50 | — | 1 | 49 | |||||||||
| Total investment assets at fair value |
$ | 3,431 | $ | 1,267 | $ | 2,102 | $ | 62 | |||||
| Cash |
172 | ||||||||||||
| Accounts receivable |
59 | ||||||||||||
| Accounts payable |
(29 | ) | |||||||||||
| Net assets available for plan benefits |
$ | 3,633 | |||||||||||
| Sears Canada |
Investment Assets at Fair Value as of January 30, 2010 | ||||||||||||
| Total | Level 1 | Level 2 | Level 3 | ||||||||||
| Cash equivalents and short term investments |
$ | 7 | $ | 7 | $ | — | $ | — | |||||
| Global equity securities |
|||||||||||||
| Pooled equity funds |
644 | 260 | — | 384 | |||||||||
| Fixed income securities |
|||||||||||||
| Corporate |
226 | 65 | 93 | 68 | |||||||||
| U.S. government and agencies |
2 | — | 2 | — | |||||||||
| Mortgage backed and asset backed |
2 | — | — | 2 | |||||||||
| Municipal and foreign government |
378 | 345 | 33 | — | |||||||||
| Futures, options and other |
23 | — | 23 | — | |||||||||
| Total investment assets at fair value |
$ | 1,282 | $ | 677 | $ | 151 | $ | 454 | |||||
| Cash |
6 | ||||||||||||
| Refundable deposits |
23 | ||||||||||||
| Accounts receivable |
3 | ||||||||||||
| Accounts payable |
(1 | ) | |||||||||||
| Net assets available for plan benefits |
$ | 1,313 | |||||||||||
80
Table of Contents
SEARS HOLDINGS CORPORATION
Notes to Consolidated Financial Statements—(Continued)
A rollforward of our Level 3 assets each year is as follows:
| SHC Domestic |
January 31, 2009 Balance |
Net Realized and Unrealized Gains/(Losses) |
Net Purchases, Issuances and Settlements |
Net Transfers Into/(Out of) Level 3 |
January 30, 2010 Balance | ||||||||||||
| Fixed income securities |
|||||||||||||||||
| Mortgage backed and asset backed |
$ | 42 | $ | 17 | $ | (25 | ) | $ | (21 | ) | $ | 13 | |||||
| Venture and partnerships |
138 | — | (89 | ) | — | 49 | |||||||||||
| Total Level 3 investments |
$ | 180 | $ | 17 | $ | (114 | ) | $ | (21 | ) | $ | 62 | |||||
| Sears Canada |
January 31, 2009 Balance |
Net Realized and Unrealized Gains/(Losses) |
Net Purchases, Issuances and Settlements |
Net Transfers Into/(Out of) Level 3 |
January 30, 2010 Balance | ||||||||||||
| Fixed income securities |
|||||||||||||||||
| Pooled equity funds |
$ | 409 | $ | 38 | $ | (63 | ) | $ | — | $ | 384 | ||||||
| Corporate bonds and notes |
62 | 14 | (8 | ) | — | 68 | |||||||||||
| Mortgage backed and asset backed |
4 | (2 | ) | — | — | 2 | |||||||||||
| Total Level 3 investments |
$ | 475 | $ | 50 | $ | (71 | ) | $ | — | $ | 454 | ||||||
NOTE 8—EARNINGS PER SHARE
The following tables set forth the components used to calculate basic and diluted earnings per share.
| millions except earnings per share | 2009 | 2008 | 2007 | ||||||
| Basic weighted average shares |
117.8 | 127.0 | 144.7 | ||||||
| Dilutive effect of restricted stock and stock options |
0.1 | — | 0.1 | ||||||
| Diluted weighted average shares |
117.9 | 127.0 | 144.8 | ||||||
| Net income attributable to Holdings’ shareholders |
$ | 235 | $ | 53 | $ | 826 | |||
| Earnings per share attributable to Holdings’ shareholders |
|||||||||
| Basic |
$ | 1.99 | $ | 0.42 | $ | 5.71 | |||
| Diluted |
$ | 1.99 | $ | 0.42 | $ | 5.70 | |||
NOTE 9—EQUITY
Stock-based Compensation
We account for stock-based compensation using the fair value method in accordance with accounting standards regarding share-based payment transactions. We recorded $10 million, $1 million, and $29 million in total compensation expense relative to stock-based compensation arrangements during fiscal 2009, fiscal 2008, and fiscal 2007, respectively. At January 30, 2010, we had $8 million in total compensation cost related to nonvested awards, which is expected to be recognized over approximately the next 3 years.
81
Table of Contents
SEARS HOLDINGS CORPORATION
Notes to Consolidated Financial Statements—(Continued)
We do not currently have an employee stock option plan and as of January 30, 2010, there are no outstanding options. Changes in employee stock options for fiscal 2009, fiscal 2008, and fiscal 2007 were as follows:
| 2009 | 2008 | 2007 | ||||||||||||||
| (Shares in thousands) | Shares | Weighted- Average Exercise Price |
Shares | Weighted- Average Exercise Price |
Shares | Weighted- Average Exercise Price | ||||||||||
| Beginning of year balance |
350 | $ | 112.90 | 350 | $ | 112.90 | 350 | $ | 112.90 | |||||||
| Granted |
— | — | — | — | — | — | ||||||||||
| Exercised |
(150 | ) | 88.62 | — | — | — | — | |||||||||
| Cancelled/Forfeited |
(200 | ) | 131.11 | — | — | — | — | |||||||||
| End of year balance |
— | $ | — | 350 | $ | 112.90 | 350 | $ | 112.90 | |||||||
| Exercisable |
350 | $ | 112.90 | 350 | $ | 112.90 | ||||||||||
| Fair value of options granted during the year |
$ | — | $ | — | ||||||||||||
We have granted restricted stock awards to certain associates. These restricted stock awards typically vest in full three years from the date of grant, provided the grantee remains employed by us as of the vesting date. The fair value of these awards is equal to the market price of our common stock on the date of grant. We do not currently have a program that provides for restricted stock awards on an annual basis. Changes in restricted stock awards for fiscal 2009, fiscal 2008, and fiscal 2007 were as follows:
| 2009 | 2008 | 2007 | ||||||||||||||||
| (Shares in thousands) | Shares | Weighted- Average Fair Value on Date of Grant |
Shares | Weighted- Average Fair Value on Date of Grant |
Shares | Weighted- Average Fair Value on Date of Grant | ||||||||||||
| Beginning of year balance |
594 | $ | 134.32 | 593 | $ | 155.05 | 273 | $ | 133.79 | |||||||||
| Granted |
110 | 54.90 | 184 | 84.63 | 549 | 159.69 | ||||||||||||
| Vested |
(86 | ) | 134.67 | (16 | ) | 111.59 | (94 | ) | 105.15 | |||||||||
| Forfeited |
(339 | ) | 152.59 | (167 | ) | 155.40 | (135 | ) | 165.60 | |||||||||
| End of year balance |
279 | $ | 80.73 | 594 | $ | 134.32 | 593 | $ | 155.05 | |||||||||
| millions | 2009 | 2008 | 2007 | ||||||
| Aggregate fair value of shares granted based on weighted average fair value at date of grant |
$ | 6 | $ | 16 | $ | 88 | |||
| Aggregate fair value of shares vesting during period |
5 | 1 | 13 | ||||||
| Aggregate fair value of shares forfeited during period |
14 | 13 | 16 | ||||||
Approximately 114,000 shares of the 279,000 shares of restricted stock outstanding at January 30, 2010 are expected to vest during the fiscal year 2010.
Common Share Repurchase Program
From time to time, we repurchase shares of our common stock under a common share repurchase program authorized by our Board of Directors. The common share repurchase program was initially announced in 2005 with a total authorization by our Board of Directors of up to $1.0 billion. Since the original authorization in 2005,
82
Table of Contents
SEARS HOLDINGS CORPORATION
Notes to Consolidated Financial Statements—(Continued)
our Board of Directors authorized the repurchase of up to an additional $5.0 billion of common stock, including an additional $500 million authorization in fiscal 2009, for a total authorization since inception of the program of $6.0 billion. During fiscal 2009, we repurchased approximately 7.1 million of our common shares at a total cost of approximately $424 million, or an average price of $59.81 per share. During fiscal 2008, we repurchased approximately 10.3 million of our common shares at a total cost of approximately $678 million, or an average price of $65.58 per share. During fiscal 2007, we repurchased approximately 21.7 million of our common shares at a total cost of approximately $2.9 billion, or an average price of $134.65 per share. As of January 30, 2010, we had approximately $581 million of remaining authorization under this program.
The share repurchase program has no stated expiration date and share repurchases may be implemented using a variety of methods, which may include open market purchases, privately negotiated transactions, block trades, accelerated share repurchase transactions, the purchase of call options, the sale of put options or otherwise, or by any combination of such methods.
Accumulated Other Comprehensive Income (Loss)
The following table displays the components of accumulated other comprehensive income (loss):
| millions | January 30, 2010 |
January 31, 2009 |
February 2, 2008 |
|||||||||
| Pension and postretirement adjustments (net of tax of $(451), $(324) and $73, respectively) |
$ | (686 | ) | $ | (489 | ) | $ | 115 | ||||
| Cumulative unrealized derivative gain (net of tax of $6, $2 and $2, respectively) |
9 | 3 | 3 | |||||||||
| Currency translation adjustments (net of tax of $(29), $(84) and $33, respectively) |
(44 | ) | (126 | ) | (49 | ) | ||||||
| Accumulated other comprehensive income (loss) |
$ | (721 | ) | $ | (612 | ) | $ | 69 | ||||
Pension and postretirement adjustments relate to the net actuarial gain or loss on our pension and postretirement plans recognized as a component of accumulated other comprehensive income.
On February 1, 2009, we adopted a newly issued accounting standard for noncontrolling interests that requires us to classify noncontrolling interests as part of equity and to disclose the amount of other comprehensive income attributable to noncontrolling interests. Accumulated other comprehensive income attributable to noncontrolling interests at January 30, 2010, January 31, 2009 and February 2, 2008 was a negative $132 million, $98 million and $62 million, respectively.
NOTE 10—BANKRUPTCY CLAIMS RESOLUTION AND SETTLEMENTS
Background
On May 6, 2003, Kmart Corporation (the “Predecessor Company”), a predecessor operating company of Kmart, emerged from reorganization proceedings under Chapter 11 of the federal bankruptcy laws pursuant to the terms of a plan of reorganization (the “Plan of Reorganization”). The Predecessor Company is an indirect, wholly owned subsidiary of Kmart and an indirect, wholly owned subsidiary of Holdings. Upon emergence, all of the then outstanding equity securities of the Predecessor Company, as well as substantially all of its pre-petition liabilities were cancelled. On the day of emergence, 89.7 million shares of Kmart common stock and options to purchase 8.2 million shares of Kmart common stock were issued pursuant to the Plan of Reorganization, of which 31.9 million shares of the Kmart common stock issued were allocated to satisfy the pre-petition claims of unsecured Class 5 creditors.
83
Table of Contents
SEARS HOLDINGS CORPORATION
Notes to Consolidated Financial Statements—(Continued)
Claims Resolution
During the third quarter of 2008, we completed the settlement of substantially all of the claims associated with the discharge of the Predecessor Company’s liabilities subject to compromise pursuant to the Plan of Reorganization. Accordingly, the remaining 2.1 million of the 31.9 million shares set aside for distribution have been (or are in the process of being) distributed to holders of Class 5 claims. The actual amount of allowed Class 5 claims was approximately $4 billion, which is less than the $4.3 billion estimate provided for in the Plan of Reorganization.
Bankruptcy-Related Settlements
In fiscal 2008 and 2007, we recognized recoveries of $5 million, and $18 million, respectively, from vendors who had received cash payments for pre-petition obligations (“critical vendor claims”) or preference payments. During fiscal 2008, the Company received 126,385 shares of common stock (weighted average price of $94.61 per share) with an approximate value of $12 million from the Class 5 distribution referenced above. Of this amount, $5 million was recognized as a recovery gain in other income, as they relate to recoveries from vendors who had received cash payments for pre-petition obligations (critical vendor claims) or preference payments. The remaining $7 million was recorded as capital in excess of par value, as these shares are the result of a fiscal 2004 transaction in which the Company entered into settlement agreements with past providers of surety bonds to resolve all issues in connection with their pre-petition claims. In accordance with the terms of the settlement agreements, Kmart assumed responsibility for the future obligations under the bonds issued with respect to the Predecessor Company’s workers’ compensation insurance program and was assigned the Class 5 claims against the Company.
84
Table of Contents
SEARS HOLDINGS CORPORATION
Notes to Consolidated Financial Statements—(Continued)
NOTE 11—INCOME TAXES
| millions | 2009 | 2008 | 2007 | |||||||||
| Income (loss) before income taxes |
||||||||||||
| U.S. |
$ | (38 | ) | $ | (407 | ) | $ | 953 | ||||
| Foreign |
458 | 591 | 499 | |||||||||
| Total |
$ | 420 | $ | 184 | $ | 1,452 | ||||||
| Income tax expense (benefit) |
||||||||||||
| Current: |
||||||||||||
| Federal |
$ | (179 | ) | $ | (70 | ) | $ | 76 | ||||
| State and local |
18 | 32 | 43 | |||||||||
| Foreign |
141 | 199 | 98 | |||||||||
| Total |
(20 | ) | 161 | 217 | ||||||||
| Deferred: |
||||||||||||
| Federal |
124 | (60 | ) | 253 | ||||||||
| State and local |
21 | (11 | ) | 2 | ||||||||
| Foreign |
(2 | ) | (5 | ) | 78 | |||||||
| 143 | (76 | ) | 333 | |||||||||
| Total |
$ | 123 | $ | 85 | $ | 550 | ||||||
| 2009 | 2008 | 2007 | ||||||||||
| Effective tax rate reconciliation |
||||||||||||
| Federal income tax rate |
35.0 | % | 35.0 | % | 35.0 | % | ||||||
| State and local taxes net of federal tax benefit |
6.0 | 7.2 | 2.0 | |||||||||
| Tax credits |
(3.0 | ) | (6.3 | ) | (0.4 | ) | ||||||
| Resolution of income tax matters |
(6.2 | ) | (6.8 | ) | 0.5 | |||||||
| Basis difference in domestic subsidiary |
— | (30.2 | ) | 0.3 | ||||||||
| Canadian rate differential on noncontrolling interest |
(0.9 | ) | (2.3 | ) | — | |||||||
| Nondeductible goodwill |
— | 50.0 | — | |||||||||
| Other |
(1.6 | ) | (0.4 | ) | 0.5 | |||||||
| 29.3 | % | 46.2 | % | 37.9 | % | |||||||
85
Table of Contents
SEARS HOLDINGS CORPORATION
Notes to Consolidated Financial Statements—(Continued)
| millions | January 30, 2010 |
January 31, 2009 |
||||||
| Deferred tax assets and liabilities |
||||||||
| Deferred tax assets: |
||||||||
| Federal benefit for state and foreign taxes |
$ | 179 | $ | 143 | ||||
| Accruals and other liabilities |
232 | 309 | ||||||
| Capital leases |
159 | 169 | ||||||
| NOL carryforwards |
306 | 280 | ||||||
| OPEB |
176 | 169 | ||||||
| Pension |
664 | 582 | ||||||
| Deferred revenue |
202 | 191 | ||||||
| Credit carryforwards |
156 | 108 | ||||||
| Other |
113 | 185 | ||||||
| Total deferred tax assets |
2,187 | 2,136 | ||||||
| Valuation allowance |
(131 | ) | (117 | ) | ||||
| Net deferred tax assets |
2,056 | 2,019 | ||||||
| Deferred tax liabilities: |
||||||||
| Trade names/Intangibles |
1,186 | 1,203 | ||||||
| Property and equipment |
304 | 206 | ||||||
| Inventory |
264 | 246 | ||||||
| Other |
203 | 178 | ||||||
| Total deferred tax liabilities |
1,957 | 1,833 | ||||||
| Net deferred tax asset |
$ | 99 | $ | 186 | ||||
We account for income taxes in accordance with accounting standards for such taxes, which requires that deferred tax assets and liabilities be recognized using enacted tax rates for the effect of temporary differences between the financial reporting and tax bases of recorded assets and liabilities. Accounting standards also requires that deferred tax assets be reduced by a valuation allowance if it is more likely than not that some portion of or all of the deferred tax asset will not be realized.
During fiscal 2008, we reduced our reserves for Predecessor Company income tax liabilities by $1 million, primarily due to favorable resolution of income tax claims. Beginning in 2009, any benefit realized or cost recognized from an adjustment to pre-confirmation income tax liabilities will impact our income tax expense instead of equity under newly issued accounting standards for business combinations. Additionally, in fiscal year 2008, we received a tax benefit of $23 million relating to certain Class 5 and 6 pre-petition claims paid with equity. We did not receive any tax benefits related to these pre-petition claims in fiscal 2009.
At January 30, 2010, we had Federal net operating loss (“NOL”) carryforwards from the Predecessor Company of approximately $269 million subject to an overall annual section 382 limitation of $96 million, generating deferred tax assets of approximately $94 million. The federal NOL carryforwards will expire in 2021, 2022, 2023, and 2028. We also have credit carryforwards of $156 million, which will expire between 2015 and 2029.
At the end of fiscal 2008, we had a state NOL deferred tax asset of $186 million and a valuation allowance of $117 million. In fiscal 2009, there was a net addition to the state NOL deferred tax asset of $26 million, bringing the ending balance to $212 million. The additional NOLs were the result of additional state losses incurred in fiscal 2009, netted against NOL expirations. The valuation allowance increased by $14 million, to
86
Table of Contents
SEARS HOLDINGS CORPORATION
Notes to Consolidated Financial Statements—(Continued)
$131 million. Additional state valuation allowances were created against the state losses incurred in fiscal 2009 and were netted against state valuation allowances reversals due to expiring state NOLs in fiscal 2009. The state NOLs will predominantly expire between 2017 and 2029.
Accounting for Uncertainties in Income Taxes
We account for uncertainties in income taxes according to accounting standards for uncertain tax positions. We are present in a large number of taxable jurisdictions, and at any point in time, can have audits underway at various stages of completion in any of these jurisdictions. We evaluate our tax positions and establish liabilities for uncertain tax positions that may be challenged by local authorities and may not be fully sustained, despite our belief that the underlying tax positions are fully supportable. Unrecognized tax benefits are reviewed on an ongoing basis and are adjusted in light of changing facts and circumstances, including progress of tax audits, developments in case law, and closing of statute of limitations. Such adjustments are reflected in the tax provision as appropriate. We are generally not able to reliably estimate the ultimate settlement amounts until the close of the audit. While we do not expect material changes, it is possible that the amount of unrecognized benefit with respect to our uncertain tax positions will significantly increase or decrease within the next 12 months related to the audits described above. At this time, we are not able to make a reasonable estimate of the range of impact on the balance of unrecognized tax benefits or the impact on the effective tax rate related to these items. A reconciliation of the beginning and ending amount of gross unrecognized tax benefits (“UTB”) is as follows:
| Federal, State, and Foreign Tax | ||||||||||||
| millions | January 30, 2010 |
January 31, 2009 |
February 2, 2008 |
|||||||||
| Gross UTB Balance at Beginning of Period |
$ | 360 | $ | 454 | $ | 408 | ||||||
| Tax positions related to the current period: |
||||||||||||
| Gross increases |
50 | 66 | 45 | |||||||||
| Gross decreases |
(17 | ) | (39 | ) | (14 | ) | ||||||
| Tax positions related to prior periods: |
||||||||||||
| Gross increases |
57 | 136 | 98 | |||||||||
| Gross decreases |
(59 | ) | (238 | ) | (21 | ) | ||||||
| Settlements |
(29 | ) | (6 | ) | (14 | ) | ||||||
| Lapse of statute of limitations |
(52 | ) | (13 | ) | (48 | ) | ||||||
| Gross UTB Balance at End of Period |
$ | 310 | $ | 360 | $ | 454 | ||||||
At the end of fiscal 2009, we had gross unrecognized tax benefits of $310 million. Of this amount, $117 million would, if recognized, impact our effective tax rate, with the remaining amount being comprised of unrecognized tax benefits related to gross temporary differences or any other indirect benefits. Included in the $117 million, we have income tax liabilities of $33 million, net of federal benefit on state tax, for tax positions of acquired entities taken prior to their acquisition by Holdings that would, with the adoption of the new accounting standard for business combinations in 2009, impact our effective tax rate if recognized. We expect that our unrecognized tax benefits could decrease up to $117 million over the next 12 months for federal and state settlements and for federal and state tax positions related to prior business dispositions due to both the expiration of the statute of limitations for certain jurisdictions, as well as expected related settlements.
We classify interest expense and penalties related to unrecognized tax benefits and interest income on tax overpayments as components of income tax expense. As of January 30, 2010, the total amount of interest and
87
Table of Contents
SEARS HOLDINGS CORPORATION
Notes to Consolidated Financial Statements—(Continued)
penalties recognized on our consolidated balance sheet was $71 million ($46 million net of federal benefit). The total amount of net interest income recognized in our consolidated statement of income for fiscal 2009 was $11 million.
We file income tax returns in both the United States and various foreign jurisdictions. The U.S. Internal Revenue Service (“IRS”) is currently auditing the Holdings’ federal income tax returns for the fiscal years 2006 and 2007. The IRS has completed its examination of Sears’ federal income tax returns for the fiscal years 2002, 2003, 2004, and 2005 and Holdings’ federal income tax return for the fiscal year 2005. We have resolved with the IRS all matters arising from these exams. In addition, Holdings and Sears are under examination by various state, local and foreign income tax jurisdictions for the fiscal years 2001-2007, and Kmart is under examination by such jurisdictions for the fiscal years 2003-2007.
NOTE 12—REAL ESTATE TRANSACTIONS
Gain on Sale of Assets
We recognized $74 million, $51 million, and $38 million in gains on sales of assets during fiscal 2009, fiscal 2008, and fiscal 2007, respectively. These gains were primarily a function of several large real estate transactions. During fiscal 2009, the gain on sales of assets included a $44 million gain recognized by Sears Canada on the sale of its former headquarters. During fiscal 2008, the gain on sale of assets included a $32 million pre-tax gain recognized on the sale of Sears Canada’s Calgary downtown full-line store. During fiscal 2007, the gain on sale of assets included a $21 million pre-tax gain on the sale of our Sears fashion center in Los Angeles.
In August 2007, Sears Canada sold its headquarters office building and adjacent land in Toronto, Ontario for proceeds of $81 million Canadian, net of closing costs. Sears Canada leased back the property under a leaseback agreement through March 2009, at which time it finished its relocation of all head office operations to previously underutilized space in the Toronto Eaton Centre, Ontario. The carrying value of the property was approximately $35 million as of February 2, 2008. Given the terms of the leaseback, for accounting purposes, the excess of proceeds received over the carrying value of the associated property was deferred, and the resulting gain was recognized in fiscal 2009 given that Sears Canada no longer occupied the associated property.
We classify a portion of our property as held for sale when criteria set out under accounting standards governing the disposal of long-lived assets have been met. Property held for sale at January 30, 2010 and January 31, 2009 totaled $38 million and $58 million, respectively.
Property Acquisitions
During fiscal 2008 and fiscal 2007, we purchased 9 and 28 previously leased operating properties for $22 million and $109 million, respectively. During fiscal 2009, we did not purchase any previously leased operating properties. In the normal course of business, we consider opportunities to purchase leased operating properties, as well as offers to sell owned, or assign leased, operating and non-operating properties. These transactions may, individually or in the aggregate, result in material proceeds or outlays of cash. In addition, we review leases that will expire in the short-term in order to determine the appropriate action to take with respect to them.
88
Table of Contents
SEARS HOLDINGS CORPORATION
Notes to Consolidated Financial Statements—(Continued)
NOTE 13—GOODWILL AND INTANGIBLE ASSETS
The following summarizes our intangible assets as of January 30, 2010 and January 31, 2009, respectively, the amortization expenses recorded for the fiscal years then ended, as well as our estimated amortization expense for the next five fiscal years and thereafter.
| Weighted Average Life |
January 30, 2010 | January 31, 2009 | ||||||||||||
| millions | Gross Carrying Amount |
Accumulated Amortization |
Gross Carrying Amount |
Accumulated Amortization | ||||||||||
| Amortized intangible assets |
||||||||||||||
| Favorable lease rights |
22 | $ | 451 | $ | 194 | $ | 460 | $ | 164 | |||||
| Contractual arrangements and customer lists |
9 | 226 | 121 | 247 | 117 | |||||||||
| Trade names |
8 | 75 | 40 | 75 | 29 | |||||||||
| 752 | 355 | 782 | 310 | |||||||||||
| Unamortized intangible assets |
||||||||||||||
| Trade names |
2,811 | — | 2,811 | — | ||||||||||
| Total |
$ | 3,563 | $ | 355 | $ | 3,593 | $ | 310 | ||||||
| Aggregate Amortization Expense |
|||
| Fiscal 2009 |
$ | 74 | |
| Fiscal 2008 |
84 | ||
| Fiscal 2007 |
90 | ||
| Estimated Amortization |
|||
| Fiscal 2010 |
$ | 68 | |
| Fiscal 2011 |
63 | ||
| Fiscal 2012 |
59 | ||
| Fiscal 2013 |
36 | ||
| Fiscal 2014 |
27 | ||
| Thereafter |
144 | ||
Goodwill is the excess of the purchase price over the fair value of the net assets acquired in business combinations accounted for under the purchase method. We recorded $1.7 billion in goodwill in connection with the Merger. We recorded $12 million in connection with our acquisition of an additional 3% interest in Sears Canada during fiscal 2008.
89
Table of Contents
SEARS HOLDINGS CORPORATION
Notes to Consolidated Financial Statements—(Continued)
Changes in the carrying amount of goodwill by segment during fiscal years 2008 and 2009 are as follows:
| millions | Sears Domestic |
Sears Canada |
Total | ||||||||
| Balance, February 2, 2008: |
|||||||||||
| Goodwill |
$ | 1,428 | $ | 258 | $ | 1,686 | |||||
| Fiscal 2008 changes: |
|||||||||||
| Acquisition of additional interest in Sears Canada |
— | 12 | 12 | ||||||||
| Impairment charges |
(262 | ) | — | (262 | ) | ||||||
| Tax adjustments affecting Merger-related goodwill |
(69 | ) | 25 | (44 | ) | ||||||
| Balance, January 31, 2009 and January 30, 2010: |
|||||||||||
| Goodwill |
1,359 | 295 | 1,654 | ||||||||
| Accumulated impairment charges |
(262 | ) | — | (262 | ) | ||||||
| $ | 1,097 | $ | 295 | $ | 1,392 | ||||||
In accordance with accounting standards for goodwill and other intangible assets, goodwill is not amortized but requires testing for potential impairment, at a minimum on an annual basis, or when indications of potential impairment exist. The impairment test for goodwill utilizes a fair value approach. The impairment test for identifiable intangible assets not subject to amortization is also performed annually or when impairment indications exist, and consist of a comparison of the fair value of the intangible asset with its carrying amount. Identifiable intangible assets that are subject to amortization are evaluated for impairment using a process similar to that used to evaluate other long-lived assets. Our annual impairment analysis is performed as of the last day of our November accounting period each year. See Note 14 for further information regarding our impairment charges recorded in fiscal 2008.
NOTE 14—STORE CLOSINGS AND IMPAIRMENTS
Store Closings and Severance
We made the decision to close 62 underperforming stores during fiscal 2009 and 46 underperforming stores in fiscal 2008. The store closures included closures within both of our Kmart and Sears Domestic segments. We recorded charges related to these store closings of $131 million and $77 million in fiscal 2009 and 2008, respectively. The charges include $37 million and $36 million in 2009 and 2008, respectively, recorded in cost of sales for margin related expenses, $82 million and $41 million in 2009 and 2008, respectively, recorded in selling and administrative expenses for store closing and severance costs, and $12 million recorded in 2009 related to accelerated depreciation on assets in stores we decided to close.
In accordance with accounting standards governing costs associated with exit or disposal activities, expenses related to future rent payments for which we no longer intend to receive any economic benefit are accrued for when we cease to use the leased space. We expect to record an additional charge of approximately $7 million during the first half of 2010 related to stores we announced would close in 2009.
Goodwill
We perform our annual goodwill and intangible impairment test required under accounting standards during the fourth quarter of each fiscal year, or when an indication of potential impairment exists. The goodwill impairment test involves a two-step process as described in the “Summary of Significant Accounting Policies” in
90
Table of Contents
SEARS HOLDINGS CORPORATION
Notes to Consolidated Financial Statements—(Continued)
Note 1 above. The first step is a comparison of each reporting unit’s fair value to its carrying value. If the carrying value of the reporting unit is higher than its fair value, there is an indication that impairment may exist and the second step must be performed to measure the amount of impairment loss.
After performing the first step of the process in fiscal 2008, we determined goodwill recorded at Sears Domestic’s subsidiary, OSH, was potentially impaired. After performing the second step of the process, we determined that the total amount of goodwill recorded at OSH was impaired and recorded a charge of $262 million.
Long-Lived Assets
In accordance with accounting standards governing the impairment or disposal of long-lived assets, we performed an impairment test of certain of our long-lived assets (principally the value of buildings and other fixed assets associated with our stores) due to events and changes in circumstances during 2008 that indicated an impairment might have occurred. The impairment review was triggered by the increased severity of the economic turmoil and weakening in the U.S. economy during the year, which had a negative impact on the performance of our stores. As a result of this impairment testing, the Company recorded a $98 million impairment charge during 2008. This impairment charge was made up of a $21 million charge at Kmart and a $77 million charge at Sears Domestic.
NOTE 15—LEASES
We lease certain stores, office facilities, warehouses, computers and transportation equipment.
Operating and capital lease obligations are based upon contractual minimum rents and, for certain stores, amounts in excess of these minimum rents are payable based upon specified percentages of sales. Contingent rent is accrued over the lease term, provided that the achievement of the specified sales level that triggers the contingent rental is probable. Certain leases include renewal or purchase options.
Rental expense for operating leases was as follows:
| millions | 2009 | 2008 | 2007 | |||||||||
| Minimum rentals |
$ | 893 | $ | 890 | $ | 904 | ||||||
| Percentage rentals |
23 | 28 | 39 | |||||||||
| Less—Sublease rentals |
(52 | ) | (54 | ) | (60 | ) | ||||||
| Total |
$ | 864 | $ | 864 | $ | 883 | ||||||
91
Table of Contents
SEARS HOLDINGS CORPORATION
Notes to Consolidated Financial Statements—(Continued)
Minimum lease obligations, excluding taxes, insurance and other expenses payable directly by us, for leases in effect as of January 30, 2010, were as follows:
| Minimum Lease Commitments |
||||||||
| millions | Capital | Operating | ||||||
| As of January 30, 2010 |
||||||||
| 2010 |
$ | 130 | $ | 810 | ||||
| 2011 |
125 | 736 | ||||||
| 2012 |
123 | 636 | ||||||
| 2013 |
115 | 540 | ||||||
| 2014 |
108 | 438 | ||||||
| Later years |
488 | 2,626 | ||||||
| Total minimum lease payments(1) |
1,089 | 5,786 | ||||||
| Less—minimum sublease income |
(272 | ) | ||||||
| Net minimum lease payments |
$ | 5,514 | ||||||
| Less: |
||||||||
| Estimated executory costs |
(122 | ) | ||||||
| Interest at a weighted average rate of 7.6% |
(332 | ) | ||||||
| Capital lease obligations |
635 | |||||||
| Less current portion of capital lease obligations |
(60 | ) | ||||||
| Long-term capital lease obligations |
$ | 575 | ||||||
| (1) | Sears Canada: Total operating minimum lease payments of $476 million. |
NOTE 16—RELATED PARTY DISCLOSURE
Our Board of Directors has delegated authority to direct investment of our surplus cash to Edward S. Lampert, subject to various limitations that have been or may be from time to time adopted by the Board of Directors and/or the Finance Committee of the Board of Directors. Mr. Lampert is Chairman of our Board of Directors and Finance Committee and is the Chairman and Chief Executive Officer of ESL. Neither Mr. Lampert nor ESL will receive compensation for any such investment activities undertaken on our behalf. ESL beneficially owned 57.4% of our outstanding common stock as of January 30, 2010.
Further, to clarify the expectations that the Board of Directors has with respect to the investment of our surplus cash, the Board has renounced, in accordance with Delaware law, any interest or expectancy of the Company associated with any investment opportunities in securities that may come to the attention of Mr. Lampert or any employee, officer, director or advisor to ESL and its affiliated investment entities who also serves as an officer or director of the Company (each, a “Covered Party”) other than (a) investment opportunities that come to such Covered Party’s attention directly and exclusively in such Covered Party’s capacity as a director, officer or employee of the Company, (b) control investments in companies in the mass merchandising, retailing, commercial appliance distribution, product protection agreements, residential and commercial product installation and repair services and automotive repair and maintenance industries and (c) investment opportunities in companies or assets with a significant role in our retailing business, including investment in real estate currently leased by the Company or in suppliers for which the Company is a substantial customer representing over 10% of such companies’ revenues, but excluding investments of ESL as of May 23, 2005.
92
Table of Contents
SEARS HOLDINGS CORPORATION
Notes to Consolidated Financial Statements—(Continued)
Holdings, through its subsidiaries, engages in commercial transactions with AutoZone, Inc. (“AutoZone”) in the ordinary course of business. In fiscal 2009, we paid AutoZone approximately $21 million for automotive parts, accessories, and other services. ESL owns approximately 40.5% of the outstanding common stock of AutoZone (based on publicly available data as of March 9, 2010), and Mr. Crowley serves as a director of AutoZone.
Holdings employs certain employees of ESL. William C. Crowley is a director and our Executive Vice President, Chief Administrative Officer while continuing his role as President and Chief Operating Officer of ESL. Our Senior Vice President of Real Estate is also employed by ESL.
NOTE 17—SUPPLEMENTAL FINANCIAL INFORMATION
Other long-term liabilities as of January 30, 2010 and January 31, 2009 consisted of the following:
| millions | January 30, 2010 |
January 31, 2009 | ||||
| Unearned revenues |
$ | 829 | $ | 889 | ||
| Self-insurance reserves |
801 | 826 | ||||
| Other |
988 | 1,227 | ||||
| Total |
$ | 2,618 | $ | 2,942 | ||
NOTE 18—SUMMARY OF SEGMENT DATA
The Company evaluates segment financial performance based on operating income, as presented in the Consolidated Statements of Income. We currently have three reportable segments: Kmart, Sears Domestic and Sears Canada.
| 2009 | ||||||||||||||||
| millions | Kmart | Sears Domestic |
Sears Canada |
Sears Holdings |
||||||||||||
| Merchandise sales and services |
$ | 15,743 | $ | 23,672 | $ | 4,628 | $ | 44,043 | ||||||||
| Costs and expenses |
||||||||||||||||
| Cost of sales, buying and occupancy |
12,038 | 16,653 | 3,133 | 31,824 | ||||||||||||
| Selling and administrative |
3,386 | 6,220 | 1,048 | 10,654 | ||||||||||||
| Depreciation and amortization |
152 | 672 | 102 | 926 | ||||||||||||
| Gain on sales of assets |
(23 | ) | (6 | ) | (45 | ) | (74 | ) | ||||||||
| Total costs and expenses |
15,553 | 23,539 | 4,238 | 43,330 | ||||||||||||
| Operating income |
$ | 190 | $ | 133 | $ | 390 | $ | 713 | ||||||||
| Total assets |
$ | 5,729 | $ | 15,489 | $ | 3,590 | $ | 24,808 | ||||||||
93
Table of Contents
SEARS HOLDINGS CORPORATION
Notes to Consolidated Financial Statements—(Continued)
| 2008 | ||||||||||||||||
| millions | Kmart | Sears Domestic |
Sears Canada |
Sears Holdings |
||||||||||||
| Merchandise sales and services |
$ | 16,219 | $ | 25,315 | $ | 5,236 | $ | 46,770 | ||||||||
| Costs and expenses |
||||||||||||||||
| Cost of sales, buying and occupancy |
12,442 | 18,084 | 3,592 | 34,118 | ||||||||||||
| Selling and administrative |
3,456 | 6,415 | 1,189 | 11,060 | ||||||||||||
| Depreciation and amortization |
138 | 724 | 119 | 981 | ||||||||||||
| Impairment charges |
21 | 339 | — | 360 | ||||||||||||
| Gain on sales of assets |
(10 | ) | (10 | ) | (31 | ) | (51 | ) | ||||||||
| Total costs and expenses |
16,047 | 25,552 | 4,869 | 46,468 | ||||||||||||
| Operating income (loss) |
$ | 172 | $ | (237 | ) | $ | 367 | $ | 302 | |||||||
| Total assets |
$ | 5,968 | $ | 16,089 | $ | 3,285 | $ | 25,342 | ||||||||
| 2007 | ||||||||||||||||
| millions | Kmart | Sears Domestic |
Sears Canada |
Sears Holdings |
||||||||||||
| Merchandise sales and services |
$ | 17,256 | $ | 27,845 | $ | 5,602 | $ | 50,703 | ||||||||
| Costs and expenses |
||||||||||||||||
| Cost of sales, buying and occupancy |
13,202 | 19,589 | 3,847 | 36,638 | ||||||||||||
| Selling and administrative |
3,537 | 6,698 | 1,233 | 11,468 | ||||||||||||
| Depreciation and amortization |
116 | 802 | 131 | 1,049 | ||||||||||||
| Gain on sales of assets |
(1 | ) | (28 | ) | (9 | ) | (38 | ) | ||||||||
| Total costs and expenses |
16,854 | 27,061 | 5,202 | 49,117 | ||||||||||||
| Operating income |
$ | 402 | $ | 784 | $ | 400 | $ | 1,586 | ||||||||
| Total assets |
$ | 6,275 | $ | 17,635 | $ | 3,487 | $ | 27,397 | ||||||||
NOTE 19—LEGAL PROCEEDINGS
Maurice Levie, individually and on behalf of all others similarly situated v. Sears, Roebuck & Co., et al.—Following the announcement of the Merger on November 17, 2004, a lawsuit was filed in the United States District Court for the Northern District of Illinois relating to the transaction. This suit asserts claims under the federal securities laws on behalf of a class of former Sears’ stockholders against Sears, Alan J. Lacy, Edward S. Lampert and ESL Partners, L.P. for allegedly failing to make timely disclosure of merger discussions during the period September 9 through November 16, 2004, and seeks damages. On July 17, 2007, the Court granted in part and denied in part plaintiffs’ motion for class certification, certifying a class of Sears’ stockholders who sold shares of Sears’ stock between September 9, 2004 and November 16, 2004, excluding short sellers who covered their positions during the class period. On December 18, 2009, the Court entered an order granting defendants’ motions for summary judgment. Plaintiffs filed a notice of appeal on January 15, 2010. Briefing on the appeal continues.
In re: Sears Holdings Corporation Securities Litigation—In May and July 2006, two class action lawsuits, which each name as defendants Sears Holdings Corporation and Edward S. Lampert, were filed in United States District Court for the Southern District of New York, purportedly on behalf of a class of persons that sold shares of Kmart Holding Corporation stock on or after May 6, 2003 through June 4, 2004. The plaintiffs in each case allege that Kmart’s Plan of Reorganization and Disclosure Statement filed on January 24, 2003 and amended on
94
Table of Contents
SEARS HOLDINGS CORPORATION
Notes to Consolidated Financial Statements—(Continued)
February 25, 2003 misrepresented Kmart’s assets, particularly its real estate holdings, as evidenced by the prices at which Kmart subsequently sold certain of its stores in June 2004 to Home Depot and Sears. Plaintiffs seek damages for alleged misrepresentations. On December 19, 2006, the Court consolidated the actions and plaintiffs filed their consolidated complaint. On July 21, 2009, the Court granted defendants’ second motion to dismiss and entered a final order of dismissal. Plaintiffs filed a notice of appeal on August 20, 2009. Briefing on the appeal has concluded and the matter has been set for oral argument on March 25, 2010.
AIG Annuity Insurance Company, et al. v. Sears, Roebuck and Co.—On October 12, 2004, an action was filed against Sears in the District Court, 192nd Judicial District, Dallas County, Texas by several holders of certain bonds issued by Sears from 1991 through 1993. Plaintiffs allege under theories of breach of contract and misrepresentation that Sears prematurely redeemed the bonds in 2004 following Sears’ sale of the credit business in 2003. On February 2, 2007, a jury in the case reached a verdict against Sears and the Court subsequently awarded plaintiffs $61 million plus post-judgment interest. Sears then filed a notice of appeal. On August 21, 2008, the Texas Court of Appeals reversed the trial court’s judgment and entered judgment in favor of Sears on all counts. Plaintiffs’ subsequent motion for rehearing was denied as was their petition for review and motion for rehearing with the Texas Supreme Court. On January 26, 2010, the Texas Court of Appeals issued a mandate consistent with its prior order reversing the judgment, thereby concluding this matter.
Robert F. Booth Trust, derivatively v. William C. Crowley, et al.—In August 2009, a shareholder derivative lawsuit was filed in United States District Court for the Northern District of Illinois against current and former directors William C. Crowley, Edward S. Lampert, Steven T. Mnuchin, Richard C. Perry, Ann N. Reese, Kevin B. Rollins, Emily Scott and Thomas Tisch, and nominally Sears Holdings Corporation. Plaintiff alleges that by nominating for re-election to the Sears Holdings Corporation board Mr. Crowley and Ms. Reese while they were also members of the boards of AutoNation, Inc. (Crowley), AutoZone, Inc. (Crowley), and Jones Apparel Group, Inc. (Reese), defendants violated Section 8 of the Clayton Act prohibiting “interlocking directorships” and breached their fiduciary duty to the Company. Plaintiff seeks injunctive relief and recovery of its costs, including reasonable attorney fees. Defendants’ motion to dismiss was denied and thus their answer is due on or before March 16, 2010. Plaintiff filed a motion for preliminary injunction seeking various injunctive relief concerning the upcoming nomination and election of directors. The parties are engaged in limited discovery in anticipation of a hearing on this matter, which has not yet been scheduled.
We are a defendant in several lawsuits containing class-action allegations in which the plaintiffs are current and former hourly and salaried associates who allege various wage and hour violations and unlawful termination practices. The complaints generally seek unspecified monetary damages, injunctive relief, or both. Further, certain of these proceedings are in jurisdictions with reputations for aggressive application of laws and procedures against corporate defendants. One of these class-action lawsuits described above is Moldowan, et al. v. Sears, Roebuck and Company, et al., a lawsuit filed on August 12, 2004 in the Superior Court of the State of California, County of Sonoma in which plaintiffs alleged that Sears failed to pay them for all hours worked and otherwise failed to pay them correctly for work performed in accordance with California law. Plaintiffs sought monetary damages in an unspecified amount, together with attorneys’ fees, interest, statutory penalties and punitive damages. The parties settled the matter and the Court approved the settlement. Administration of the settlement has concluded. In agreeing to the settlement, defendants did not admit any wrongdoing and denied committing any violation of law. Defendants agreed to the settlement solely to eliminate the uncertainties, burden and expense of further protracted litigation. We previously established a reserve for the expected settlement and it did not have a material adverse effect on our annual results of operations, financial position, liquidity or capital resources.
We are subject to various other legal and governmental proceedings, many involving litigation incidental to our businesses. Some matters contain class action allegations, environmental and asbestos exposure allegations and other consumer-based claims, each of which may seek compensatory, punitive or treble damage claims (potentially in large amounts), as well as other types of relief.
95
Table of Contents
SEARS HOLDINGS CORPORATION
Notes to Consolidated Financial Statements—(Continued)
In accordance with accounting standards regarding loss contingencies, we accrue an undiscounted liability for those contingencies where the incurrence of a loss is probable and the amount can be reasonably estimated and we do not record liabilities when the likelihood that the liability has been incurred is probable but the amount cannot be reasonably estimated, or when the liability is believed to be only reasonably possible or remote. Because litigation outcomes are inherently unpredictable, these assessments often involve a series of complex assessments by management about future events and can rely heavily on estimates and assumptions. While the consequences of certain unresolved proceedings are not presently determinable, an adverse outcome from certain matters could have a material adverse effect on our earnings in any given reporting period. However, in the opinion of our management, after consulting with legal counsel, and taking into account insurance and reserves, the ultimate liability is not expected to have a material adverse effect on our financial position, liquidity or capital resources.
NOTE 20—QUARTERLY FINANCIAL INFORMATION (UNAUDITED)
| 2009 | ||||||||||||||
| millions, except per share data | First Quarter(1) |
Second Quarter(2) |
Third Quarter(3) |
Fourth Quarter(4) | ||||||||||
| Total revenues |
$ | 10,055 | $ | 10,551 | $ | 10,190 | $ | 13,247 | ||||||
| Cost of sales, buying and occupancy |
7,182 | 7,756 | 7,419 | 9,467 | ||||||||||
| Selling and administrative |
2,573 | 2,630 | 2,664 | 2,787 | ||||||||||
| Net income (loss) attributable to Holdings’ shareholders |
26 | (94 | ) | (127 | ) | 430 | ||||||||
| Basic net income (loss) per share attributable to Holdings’ shareholders |
0.22 | (0.79 | ) | (1.09 | ) | 3.75 | ||||||||
| Diluted net income (loss) per share attributable to Holdings’ shareholders |
0.21 | (0.79 | ) | (1.09 | ) | 3.74 | ||||||||
| 2008 | ||||||||||||||
| millions, except per share data | First Quarter |
Second Quarter(5) |
Third Quarter(6) |
Fourth Quarter(7) | ||||||||||
| Total revenues |
$ | 11,068 | $ | 11,762 | $ | 10,660 | $ | 13,280 | ||||||
| Cost of sales, buying and occupancy |
8,045 | 8,640 | 7,806 | 9,627 | ||||||||||
| Selling and administrative |
2,815 | 2,694 | 2,731 | 2,820 | ||||||||||
| Net income (loss) attributable to Holdings’ shareholders |
(56 | ) | 65 | (146 | ) | 190 | ||||||||
| Basic and diluted net income (loss) per share attributable to Holdings’ shareholders |
(0.43 | ) | 0.50 | (1.16 | ) | 1.55 | ||||||||
Earnings per share amounts for each quarter are required to be computed independently and may not equal the amount computed for the total year.
Quarterly Items:
| (1) | The first quarter of 2009 includes a previously deferred gain on the August 2007 sale of Sears Canada’s former headquarters building of $44 million ($19 million after tax and noncontrolling interest or $0.16 per diluted share), which was recognized as Sears Canada ceased use of the building under the lease-back agreement signed at the time of the sale; domestic pension plan expense of $42 million ($25 million after tax or $0.20 per diluted share); mark-to-market losses on Sears Canada hedge transactions of $14 million ($6 million after tax and noncontrolling interest or $0.05 per diluted share); and a charge of $17 million ($9 million after tax and noncontrolling interest or $0.08 per diluted share) related to costs associated with store closings and severance. |
96
Table of Contents
SEARS HOLDINGS CORPORATION
Notes to Consolidated Financial Statements—(Continued)
| (2) | The second quarter of 2009 includes domestic pension plan expense of $42 million ($26 million after tax or $0.22 per diluted share); mark-to-market losses on Sears Canada hedge transactions of $22 million ($10 million after tax and noncontrolling interest or $0.08 per diluted share); and a charge for costs associated with store closings and severance of $61 million ($38 million after tax or $0.32 per diluted share). |
| (3) | The third quarter of 2009 includes domestic pension plan expense of $44 million ($28 million after tax or $0.24 per diluted share); a charge for costs associated with store closings and severance of $10 million ($6 million after tax or $0.05 per diluted share); and mark-to-market gains on Sears Canada hedge transactions of $2 million ($1 million after tax and noncontrolling interest or $0.01 per diluted share). |
| (4) | The fourth quarter of 2009 includes a gain of $32 million ($22 million after tax or $0.19 per diluted share) recorded in connection with the settlement of Visa/MasterCard antitrust litigation in 2009; domestic pension plan expense of $42 million ($29 million after tax or $0.25 per diluted share); mark-to-market gains on Sears Canada hedge transactions of $1 million ($1 million after tax and noncontrolling interest or $0.01 per diluted share); a charge for costs associated with store closings and severance of $43 million ($30 million after tax or $0.26 per diluted share); and a tax benefit of $41 million ($0.36 per diluted share) related to the resolution of certain income tax matters. |
| (5) | The second quarter of 2008 includes the positive impact of the reversal of a $62 million ($37 million after tax or $0.29 per diluted share) reserve because of the overturning of the February 2, 2007 adverse jury verdict relating to the redemption of certain Sears, Roebuck and Co. bonds in 2004. |
| (6) | The third quarter of 2008 includes a charge of $101 million ($61 million after tax or $0.49 per diluted share) related to the costs associated with the closure of 14 stores and asset impairments and mark-to-market gains on Sears Canada hedge transactions of $67 million ($29 million after tax and noncontrolling interest or $0.23 per diluted share). |
| (7) | The fourth quarter of 2008 includes a charge of $336 million ($187 million after tax and noncontrolling interest or $1.53 per diluted share) related to the a goodwill impairment charge at our subsidiary, OSH, and costs associated with store closings and severance; mark-to-market gains on Sears Canada hedge transactions of $9 million ($4 million after tax and noncontrolling interest or $0.03 per diluted share); a tax benefit of $8 million ($0.07 per diluted share) related to the resolution of certain income tax matters; and gains on negotiated repurchases of debt securities prior to maturity of $9 million ($5 million after tax or $0.04 per diluted share). |
97
Table of Contents
Schedule II—Valuation and Qualifying Accounts
Fiscal Years 2009, 2008 and 2007
| Millions | Balance at beginning of period |
Additions charged to costs and expenses |
(Deductions) | Balance at end of period | |||||||||
| Allowance for Doubtful Accounts(1): |
|||||||||||||
| Fiscal 2009 |
$ | 42 | $ | 4 | $ | (7 | ) | $ | 39 | ||||
| Fiscal 2008 |
37 | 18 | (13 | ) | 42 | ||||||||
| Fiscal 2007 |
29 | 11 | (3 | ) | 37 | ||||||||
| Allowance for Deferred Tax Assets(2): |
|||||||||||||
| Fiscal 2009 |
117 | 18 | (4 | ) | 131 | ||||||||
| Fiscal 2008 |
120 | 17 | (20 | ) | 117 | ||||||||
| Fiscal 2007 |
216 | 37 | (133 | ) | 120 | ||||||||
| (1) | Charges to the account are for the purposes for which the reserves were created. |
| (2) | At the end of fiscal 2008, we had a state net operating loss (“NOL”) deferred tax asset of $186 million and a valuation allowance of $117 million. In fiscal 2009, there was a net addition to the state NOL deferred tax asset of $26 million, bringing the ending balance to $212 million. The additional NOL’s were the result of additional state losses incurred in fiscal 2009, netted against NOL expirations. The valuation allowance increased by $14 million, to $131 million. Additional state valuation allowances were created against the state losses incurred in fiscal 2009 and were netted against state valuation allowances reversals due to expiring state NOL’s in fiscal 2009. |
98
Table of Contents
MANAGEMENT’S ANNUAL REPORT ON INTERNAL CONTROL OVER FINANCIAL REPORTING
The management of Sears Holdings Corporation is responsible for establishing and maintaining adequate internal control over financial reporting. Internal control over financial reporting is a process designed by, or under the supervision of, the Company’s principal executive and principal financial officers and effected by the Company’s board of directors, management and other personnel to provide reasonable assurance regarding the reliability of financial reporting and the preparation of financial statements for external purposes in accordance with generally accepted accounting principles and includes those policies and procedures that:
| • | pertain to the maintenance of records that in reasonable detail accurately and fairly reflect the transactions and dispositions of the assets of the Company; |
| • | provide reasonable assurance that transactions are recorded as necessary to permit preparation of financial statements in accordance with generally accepted accounting principles, and that receipts and expenditures of the Company are being made only in accordance with authorizations of management and directors of the Company; and |
| • | provide reasonable assurance regarding prevention or timely detection of unauthorized acquisition, use or disposition of the Company’s assets that could have a material effect on the financial statements. |
Because of inherent limitations, internal control over financial reporting may not prevent or detect misstatements. Projections of any evaluation of effectiveness to future periods are subject to the risks that controls may become inadequate because of changes in conditions, or that the degree of compliance with the policies or procedures may deteriorate.
Management assessed the effectiveness of the Company’s internal control over financial reporting as of January 30, 2010. In making its assessment, management used the criteria set forth in the Internal Control—Integrated Framework issued by the Committee of Sponsoring Organizations of the Treadway Commission (“COSO”). The assessment included the documentation and understanding of the Company’s internal control over financial reporting. Management evaluated the design effectiveness and tested the operating effectiveness of internal controls over financial reporting to form its conclusion.
Based on this evaluation, management concluded that, as of January 30, 2010, the Company’s internal control over financial reporting is effective to provide reasonable assurance that the Company’s financial statements are fairly presented in conformity with generally accepted accounting principles.
Deloitte & Touche LLP, independent registered public accounting firm, has reported on the effectiveness of the Company’s internal control over financial reporting as of January 30, 2010, as stated in their report included herein.
99
Table of Contents
REPORT OF INDEPENDENT REGISTERED PUBLIC ACCOUNTING FIRM
To the Board of Directors and Shareholders of Sears Holdings Corporation
We have audited the accompanying consolidated balance sheets of Sears Holdings Corporation and subsidiaries (the “Company”) as of January 30, 2010 and January 31, 2009, and the related consolidated statements of income, equity, and cash flows for each of the three years in the period ended January 30, 2010. Our audits also included the financial statement schedule listed in the Index at Item 8. We also have audited the Company’s internal control over financial reporting as of January 30, 2010, based on criteria established in Internal Control—Integrated Framework issued by the Committee of Sponsoring Organizations of the Treadway Commission. The Company’s management is responsible for these financial statements and financial statement schedule, for maintaining effective internal control over financial reporting, and for its assessment of the effectiveness of internal control over financial reporting, included in the accompanying Management’s Annual Report on Internal Control Over Financial Reporting. Our responsibility is to express an opinion on these financial statements and financial statement schedule and an opinion on the Company’s internal control over financial reporting based on our audits.
We conducted our audits in accordance with the standards of the Public Company Accounting Oversight Board (United States). Those standards require that we plan and perform the audit to obtain reasonable assurance about whether the financial statements are free of material misstatement and whether effective internal control over financial reporting was maintained in all material respects. Our audits of the financial statements included examining, on a test basis, evidence supporting the amounts and disclosures in the financial statements, assessing the accounting principles used and significant estimates made by management, and evaluating the overall financial statement presentation. Our audit of internal control over financial reporting included obtaining an understanding of internal control over financial reporting, assessing the risk that a material weakness exists, testing and evaluating the design and operating effectiveness of internal control based on the assessed risk. Our audits also included performing such other procedures as we considered necessary in the circumstances. We believe that our audits provide a reasonable basis for our opinions.
A company’s internal control over financial reporting is a process designed by, or under the supervision of, the company’s principal executive and principal financial officers, or persons performing similar functions, and effected by the company’s board of directors, management, and other personnel to provide reasonable assurance regarding the reliability of financial reporting and the preparation of financial statements for external purposes in accordance with generally accepted accounting principles. A company’s internal control over financial reporting includes those policies and procedures that (1) pertain to the maintenance of records that, in reasonable detail, accurately and fairly reflect the transactions and dispositions of the assets of the company; (2) provide reasonable assurance that transactions are recorded as necessary to permit preparation of financial statements in accordance with generally accepted accounting principles and that receipts and expenditures of the company are being made only in accordance with authorizations of management and directors of the company; and (3) provide reasonable assurance regarding prevention or timely detection of unauthorized acquisition, use, or disposition of the company’s assets that could have a material effect on the financial statements.
Because of the inherent limitations of internal control over financial reporting, including the possibility of collusion or improper management override of controls, material misstatements due to error or fraud may not be prevented or detected on a timely basis. Also, projections of any evaluation of the effectiveness of the internal control over financial reporting to future periods are subject to the risk that the controls may become inadequate because of changes in conditions, or that the degree of compliance with the policies or procedures may deteriorate.
In our opinion, the consolidated financial statements referred to above present fairly, in all material respects, the financial position of the Sears Holdings Corporation and subsidiaries as of January 30, 2010 and January 31, 2009, and the results of their operations and their cash flows for each of the three years in the period ended January 30, 2010, in conformity with accounting principles generally accepted in the United States of
100
Table of Contents
America. Also, in our opinion, such financial statement schedule, when considered in relation to the basic consolidated financial statements taken as a whole, presents fairly, in all material respects, the information set forth therein. Also, in our opinion, the Company maintained, in all material respects, effective internal control over financial reporting as of January 30, 2010, based on the criteria established in Internal Control—Integrated Framework issued by the Committee of Sponsoring Organizations of the Treadway Commission.
| /s/ DELOITTE & TOUCHE LLP |
| Deloitte & Touche LLP |
| Chicago, Illinois |
| March 12, 2010 |
101
Table of Contents
| Item 9. | Changes in and Disagreements with Accountants on Accounting and Financial Disclosure |
None.
| Item 9A. | Controls and Procedures |
Our management, with the participation of our principal executive officer and principal financial officer, conducted an evaluation of the effectiveness of the design and operation of our disclosure controls and procedures, as defined in Rule 13a-15(e) under the Securities Exchange Act of 1934, as amended (the “Exchange Act”), as of the end of the period covered by this report (the “Evaluation Date”). Based on this evaluation, the principal executive officer and principal financial officer concluded that, as of the Evaluation Date, our disclosure controls and procedures were effective in ensuring that information required to be disclosed by us in the reports that we file or submit under the Exchange Act (i) is recorded, processed, summarized and reported within the time periods specified in the SEC’s rules and forms and (ii) is accumulated and communicated to our management, including our principal executive officer and principal financial officer, as appropriate to allow timely decisions regarding required disclosure.
In addition, based on that evaluation, no changes in our internal control over financial reporting have occurred during our last fiscal quarter that have materially affected, or are reasonably likely to materially affect, our internal control over financial reporting.
See Management’s Annual Report on Internal Control over Financial Reporting and the Report of Independent Registered Public Accounting Firm included in Item 8 of this Report, which reports are incorporated herein by this reference.
| Item 9B. | Other Information |
On March 8, 2010, the Compensation Committee approved a new compensation package for Mr. Collins, our Senior Vice President and Chief Financial Officer. Mr. Collins will receive, effective January 30, 2010, an increase in base salary from $600,000 to $700,000 and an increase in his annual incentive opportunity under the Company’s annual incentive plans from 75% of base salary to 90% of base salary. Mr. Collins also received a restricted stock award of 4,950 shares under the Company’s 2006 Stock Plan, which will vest in full on the third anniversary of the grant date, provided that he is an employee of the Company on the vesting date. Mr. Collins’s restricted stock award is governed by the terms and conditions of the Company’s standard form of restricted stock award agreement and the Company’s 2006 Stock Plan.
On March 12, 2010, one of our current directors, Kevin B. Rollins, advised us that he has decided not to stand for re-election to our Board of Directors at the Company’s Annual Meeting of Stockholders to be held on May 4, 2010. Mr. Rollins has indicated his intention to serve until the Annual Meeting.
102
Table of Contents
PART III
| Item 10. | Directors, Executive Officers and Corporate Governance |
Information regarding directors and executive officers of Holdings is incorporated herein by reference to the information regarding Director nominees and current Directors under “Item 1. Election of Directors” and the information under “Committees of the Board of Directors,” “Director Independence” and “Section 16(a) Beneficial Ownership Reporting Compliance” of the 2010 Proxy Statement and to Part I of this Report.
Holdings has adopted a Code of Conduct, which applies to all employees, including our principal executive officer, principal financial officer and principal accounting officer, and a Code of Conduct for its Board of Directors. Directors who are also officers of Holdings are subject to both codes of conduct. Each code of conduct is a code of ethics as defined in Item 406 of SEC Regulation S-K. The codes of conduct are available on the Corporate Governance section of our website at www.searsholdings.com. Any amendment to, or waiver from, a provision of the codes of conduct will be posted to the above-referenced website.
There were no changes to the process by which stockholders may recommend nominees to the Board of Directors during the last fiscal year.
| Item 11. | Executive Compensation |
Information regarding executive and director compensation is incorporated by reference to the material under the headings “Executive Compensation,” “Compensation of Directors,” and “Compensation Committee Report” of the 2010 Proxy Statement.
| Item 12. | Security Ownership of Certain Beneficial Owners and Management and Related Stockholder Matters |
Information regarding security ownership of certain beneficial owners and management is incorporated herein by reference to the material under the heading “Amount and Nature of Beneficial Ownership” of the 2010 Proxy Statement.
See also “Equity Compensation Plan Information” in Item 5 of this Report for a discussion of securities authorized for issuance under equity compensation plans.
| Item 13. | Certain Relationships and Related Transactions, and Director Independence |
Information regarding certain relationships and related transactions is incorporated herein by reference to the material under the headings “Certain Relationships and Transactions” and “Corporate Governance” of the 2010 Proxy Statement.
| Item 14. | Principal Accountant Fees and Services |
Information regarding principal accountant fees and services is incorporated herein by reference to the material under the heading “Independent Auditor Fees” of the 2010 Proxy Statement.
103
Table of Contents
PART IV
| Item 15. | Exhibits and Financial Statement Schedules |
| (a) | The following documents are filed as part of this report: |
| 1. | Financial Statements |
Financial statements filed as part of this Form 10-K are listed under Item 8.
| 2. | Financial Statement Schedule |
The financial statement schedule filed as part of this Form 10-K is listed under Item 8.
The separate financial statements and summarized financial information of majority-owned subsidiaries not consolidated and of 50% or less owned persons have been omitted because they are not required pursuant to conditions set forth in Rules 3-09 and 1-02(w) of Regulation S-X.
All other schedules have been omitted because they are not required under the instructions contained in Regulation S-X because the information called for is contained in the financial statements and notes thereto.
| 3. | Exhibits |
An “Exhibit Index” has been filed as part of this Report beginning on Page E-1 and is incorporated herein by this reference.
104
Table of Contents
SIGNATURES
Pursuant to the requirements of Section 13 or 15(d) of the Securities Exchange Act of 1934, the registrant has duly caused this report to be signed on its behalf by the undersigned, thereunto duly authorized.
| SEARS HOLDINGS CORPORATION | ||
| By: | /s/ WILLIAM K. PHELAN | |
| Name: | William K. Phelan | |
| Title: | Senior Vice President and Controller | |
| Date: March 12, 2010 | ||
Pursuant to the requirements of the Securities Exchange Act of 1934, this report has been signed below by the following persons on behalf of the registrant and in the capacities stated and on the dates indicated.
| * W. BRUCE JOHNSON |
Interim Chief Executive Officer and President (principal executive officer) |
March 12, 2010 | ||||
| W. Bruce Johnson | ||||||
| * MICHAEL D. COLLINS |
Senior Vice President and Chief Financial Officer (principal financial officer) |
March 12, 2010 | ||||
| Michael D. Collins | ||||||
| * WILLIAM K. PHELAN |
Senior Vice President and Controller (principal accounting officer) |
March 12, 2010 | ||||
| William K. Phelan | ||||||
| * EDWARD S. LAMPERT |
Director and Chairman of the Board of Directors |
March 12, 2010 | ||||
| Edward S. Lampert | ||||||
| * WILLIAM C. CROWLEY |
Director, Executive Vice President and Chief Administrative Officer |
March 12, 2010 | ||||
| William C. Crowley | ||||||
| * WILLIAM C. KUNKLER III |
Director |
March 12, 2010 | ||||
| William C. Kunkler III | ||||||
| * STEVEN T. MNUCHIN |
Director |
March 12, 2010 | ||||
| Steven T. Mnuchin | ||||||
| * ANN N. REESE |
Director |
March 12, 2010 | ||||
| Ann N. Reese | ||||||
| * KEVIN B. ROLLINS |
Director |
March 12, 2010 | ||||
| Kevin B. Rollins | ||||||
| * EMILY SCOTT |
Director |
March 12, 2010 | ||||
| Emily Scott | ||||||
| * THOMAS J. TISCH |
Director |
March 12, 2010 | ||||
| Thomas J. Tisch | ||||||
| By |
/S/ WILLIAM K. PHELAN |
|||||
| * William K. Phelan | ||||||
| Individually and as Attorney-in-fact | ||||||
105
Table of Contents
EXHIBIT INDEX
| 3.1 | Restated Certificate of Incorporation (incorporated by reference to Exhibit 3.1 to Registrant’s Current Report on Form 8-K, dated March 24, 2005, filed on March 24, 2005 (File No. 000-51217)). | |
| 3.2 | Amended and Restated By-Laws (incorporated by reference to Exhibit 3.2 to Registrant’s Current Report on Form 8-K, dated December 2, 2009, filed on December 4, 2009 (File No. 000-51217)). | |
| 4.1 | Registrant hereby agrees to furnish to the Commission, upon request, the instruments defining the rights of holders of each issue of long-term debt of Registrant and its consolidated subsidiaries. | |
| 10.1 | Guarantee executed by Sears, Roebuck and Co. under the Indenture, dated as of May 15, 1995, between Sears Roebuck Acceptance Corp. and JP Morgan Chase Bank (successor to The Chase Manhattan Bank, N.A.), as supplemented by the First Supplemental Indenture, dated as of November 3, 2003 (incorporated by reference to Exhibit 4(g) to Sears Roebuck Acceptance Corp.’s Quarterly Report on Form 10-Q for the fiscal quarter ended September 27, 2003 (File No. 1-4040)). | |
| 10.2 | Guarantee executed by Sears, Roebuck and Co. under the Indenture, dated as of October 1, 2002, between Sears Roebuck Acceptance Corp. and BNY Midwest Trust Company, as supplemented by the First Supplemental Indenture, dated as of November 3, 2003 (incorporated by reference to Exhibit 4(h) to Sears Roebuck Acceptance Corp.’s Quarterly Report on Form 10-Q for the fiscal quarter ended September 27, 2003 (File No. 1-4040)). | |
| 10.3 | Guarantee dated as of November 3, 2003 by Sears, Roebuck and Co. of the commercial paper master notes of Sears Roebuck Acceptance Corp. (incorporated by reference to Exhibit 10.38 to Sears, Roebuck and Co.’s Annual Report on Form 10-K for the fiscal year ended January 3, 2004 (File No. 1-416)). | |
| 10.4 | Amended and Restated Credit Agreement, dated as of May 21, 2009, among Sears Holdings Corporation, Sears Roebuck Acceptance Corp., Kmart Corporation, the lenders party thereto, Bank of America, N.A., as Administrative Agent, Co-Collateral Agent and Swingline Lender, Wells Fargo Retail Finance, LLC and General Electric Capital Corporation, as Co-Syndication Agents and Co-Collateral Agents, JPMorgan Chase Bank, N.A. and Barclays Bank plc, as Co-Documentation Agents, and Banc of America Securities LLC, Wells Fargo Retail Finance, LLC and GE Capital Markets, Inc., as Joint Lead Arrangers and Joint Bookrunners (incorporated by reference to Exhibit 10.3 to Registrant’s Quarterly Report on Form 10-Q for the fiscal quarter ended May 2, 2009 (File No. 000-51217)). | |
| 10.5 | Amended and Restated Guarantee and Collateral Agreement, dated as of May 21, 2009, among the Registrant and certain other subsidiaries of the Registrant and Bank of America, N.A., Wells Fargo Retail Finance, LLC and General Electric Capital Corporation, as Co-Collateral Agents (incorporated by reference to Exhibit 10.4 to Registrant’s Quarterly Report on Form 10-Q for the fiscal quarter ended May 2, 2009 (File No. 000-51217)). | |
| 10.6 | Purchase, Sale and Servicing Transfer Agreement, dated as of July 15, 2003, by and among Sears, Roebuck and Co., certain subsidiaries of Sears, Roebuck and Co. and Citicorp (incorporated by reference to Exhibit 10.1 to Sears, Roebuck and Co.’s Current Report on Form 8-K dated July 15, 2003 (File No. 1-416)). | |
| 10.7 | Amendment No. 1, dated as of November 3, 2003, to the Purchase, Sale and Servicing Transfer Agreement, by and among Sears, Roebuck and Co., certain subsidiaries of Sears, Roebuck and Co. and Citicorp (incorporated by reference to Exhibit 2(b) to Sears, Roebuck and Co.’s Quarterly Report on Form 10-Q for the fiscal quarter ended September 27, 2003 (File No. 1-416)). | |
| 10.8 | Amended and Restated Program Agreement, dated as of July 15, 2003, amended and restated as of November 3, 2003, by and between Sears, Roebuck and Co., Sears Intellectual Property Management Company and Citibank (USA) N.A. (incorporated by reference to Exhibit 10(a) to Sears, Roebuck and Co.’s Quarterly Report on Form 10-Q for the fiscal quarter ended September 27, 2003 (File No. 1-416). | |
E-1
Table of Contents
| 10.9 | Terms Sheet For Revision of Program Agreement Between Sears, Roebuck and Co. and Citibank USA, N.A., dated April 29, 2005 (incorporated by reference to Exhibit 10.40 to Registrant’s Quarterly Report on Form 10-Q for the fiscal quarter ended April 30, 2005 (File No. 000-51217)). | |
| 10.10 | Sears Holdings Corporation Director Compensation Program (incorporated by reference to Exhibit 10(b) to Registrant’s Current Report on Form 8-K dated September 13, 2005, filed on September 16, 2005 (File No. 000-51217)).** | |
| 10.11 | Sears Holdings Corporation 2006 Stock Plan, as amended (incorporated by reference to Appendix C to Registrant’s Proxy Statement dated March 15, 2006 (File No. 00051217)).** | |
| 10.12 | Sears Holdings Corporation Umbrella Incentive Program, as amended (incorporated by reference to Exhibit 10.5 to Registrant’s Annual Report on Form 10-K for the fiscal year ended February 2, 2008 (the “2007 10-K”)) (File No. 000-51217).** | |
| 10.13 | Form of Sears Holdings Corporation Restricted Stock Award Agreement (incorporated by reference to Exhibit 10.44 to Registrant’s Annual Report on Form 10-K for the fiscal year ended February 3, 2007 (the “2006 10-K”)) (File No. 000-51217).** | |
| *10.14 | Form of Sears Holdings Corporation Restricted Stock Award Agreement** | |
| 10.15 | Sears Holdings Corporation 2007 Executive Long-Term Incentive Program Document (incorporated by reference to Appendix A-1 to Registrant’s Proxy Statement dated April 3, 2007 (File No. 000-51217)).** | |
| 10.16 | First Amendment to the Sears Holdings Corporation 2007 Executive Long-Term Incentive Program Document (incorporated by reference to Exhibit 10.18 to Registrant’s Annual Report on Form 10-K for the fiscal year ended January 31, 2009 (the “2008 10-K”)) (File No. 000-51217).** | |
| 10.17 | Form of 2007 Executive LTIP Restricted Stock Award Agreement (incorporated by reference to Exhibit 10.4 to Registrant’s Quarterly Report on Form 10-Q for the fiscal quarter ended May 5, 2007) (File No. 000-51217).** | |
| 10.18 | Form of Addendum to 2007 Executive LTIP Restricted Stock Award Agreement (incorporated by reference to Exhibit 10.20 to the 2008 10-K) (File No. 000-51217).** | |
| 10.19 | Sears Holdings Corporation 2008 Long-Term Incentive Program (incorporated by reference to Exhibit 10.2 to Registrant’s Quarterly Report on Form 10-Q for the fiscal quarter ended May 3, 2008 (File No. 000-51217)).** | |
| 10.20 | Form of LTIP Award Agreement (2008 and 2009) (incorporated by reference to Exhibit 10.45 to the 2006 10-K) (File No. 000-51217).** | |
| 10.21 | Sears Holdings Corporation 2009 Long-Term Incentive Program (incorporated by reference to Exhibit 10.2 to Registrant’s Quarterly Report on Form 10-Q for the fiscal quarter ended May 2, 2009 (File No. 000-51217)).** | |
| 10.22 | Sears Holdings Corporation 2009 Annual Incentive Plan Document (incorporated by reference to Exhibit 10.1 to Registrant’s Quarterly Report on Form 10-Q for the fiscal quarter ended May 2, 2009 (File No. 000-51217)).** | |
| 10.23 | Revised Form of Executive Severance/Non-Compete Agreement for Senior Executives of the Registrant (incorporated by reference to Exhibit 10.5 to Registrant’s Quarterly Report on Form 10-Q for the fiscal quarter ended October 29, 2005 (File No. 000-51217)).** | |
| 10.24 | Revised Form of Executive Severance/Non-Compete Agreement for Senior Executives of the Registrant (incorporated by reference to Exhibit 10.6 to Registrant’s Quarterly Report on Form 10-Q for the fiscal quarter ended October 29, 2005 (File No. 000-51217)).** | |
| 10.25 | Form of Executive Severance Agreement (incorporated by reference to Exhibit 10.19 to the 2007 10-K) (File No. 000-51217).** | |
E-2
Table of Contents
| *10.26 | Form of Executive Severance Agreement** | |
| 10.27 | Letter from Registrant to W. Bruce Johnson relating to employment dated February 3, 2006 (incorporated by reference to Exhibit 10.16 to the 2005 10-K) (File No. 000-51217).** | |
| 10.28 | Letter from Registrant to W. Bruce Johnson relating to employment dated January 28, 2008 (incorporated by reference to Exhibit 10.30 to the 2008 10-K) (File No. 000-51217).** | |
| 10.29 | Letter from Registrant to Michael D. Collins relating to Employment dated December 5, 2008 (incorporated by reference to Exhibit 10.1 to Registrant’s Current Report on Form 8-K, dated December 3, 2008, filed on December 9, 2008 (File No. 000-51217)).** | |
| 10.30 | Letter from Registrant to Scott J. Freidheim relating to Employment dated January 20, 2009 (incorporated by reference to Exhibit 10.32 to the 2008 10-K) (File No. 000-51217).** | |
| 10.31 | Letter from Registrant to Scott J. Freidheim relating to cash component of long-term special incentive award dated February 18, 2009 (incorporated by reference to Exhibit 10.33 to the 2008 10-K) (File No. 000-51217).** | |
| *10.32 | Letter from Registrant to John D. Goodman relating to employment dated February 17, 2010.** | |
| *10.33 | Executive Severance Agreement, dated as of December 15, 2009, between the Registrant and John D. Goodman** | |
| 10.34 | Letter from Registrant to Kevin R. Holt relating to Employment dated February 25, 2008 (incorporated by reference to Exhibit 10.36 to the 2008 10-K) (File No. 000-51217).** | |
| 10.35 | Executive Employment and Severance Agreement, dated as of February 25, 2008, between the Registrant and Kevin R. Holt (incorporated by reference to Exhibit 10.37 to the 2008 10-K) (File No. 000-51217).** | |
| *10.36 | Letter from Registrant to Stuart C. Reed relating to employment dated August 4, 2008.** | |
| *21 | Subsidiaries of Registrant. | |
| *23 | Consent of Deloitte & Touche LLP. | |
| *24 | Powers of Attorney of certain officers and directors of Registrant. | |
| *31.1 | Certification of Chief Executive Officer Pursuant to Section 302 of the Sarbanes-Oxley Act of 2002. | |
| *31.2 | Certification of Chief Financial Officer Pursuant to Section 302 of the Sarbanes-Oxley Act of 2002. | |
| *32. | Certification of Chief Executive Officer and Chief Financial Officer Pursuant to 18 U.S.C. Section 1350, as adopted pursuant to Section 906 of the Sarbanes-Oxley Act of 2002. | |
| * | Filed herewith |
| ** | A management contract or compensatory plan or arrangement required to be filed as an exhibit to this report pursuant to Item 15(b) of Form 10-K. |
E-3