Attached files
| file | filename |
|---|---|
| EX-31.1 - CERTIFICATION OF CEO PURSUANT TO SECTION 302 - Qumu Corp | rimage101201_ex31-1.htm |
| EX-23.1 - CONSENT OF KPMG LLP - Qumu Corp | rimage101201_ex23-1.htm |
| EX-21.1 - SUBSIDIARIES OF RIMAGE CORPORATION - Qumu Corp | rimage101201_ex21-1.htm |
| EX-10.18 - FORM OF NON-EMPLOYEE DIRECTOR RESTRICTED STOCK UNIT AGREEMENT - Qumu Corp | rimage101201_ex10-18.htm |
| EX-32 - CERTIFICATION OF CEO/CFO PURSUANT TO SECTION 906 - Qumu Corp | rimage101201_ex32.htm |
| EX-31.2 - CERTIFICATION OF CFO PURSUANT TO SECTION 302 - Qumu Corp | rimage101201_ex31-2.htm |
|
|
|
FORM 10-K |
|
U.S. SECURITIES AND EXCHANGE COMMISSION |
|
WASHINGTON, DC 20549 |
|
|
|
x ANNUAL REPORT PURSUANT TO SECTION 13 OR 15(D) OF THE |
|
FOR THE FISCAL YEAR ENDED DECEMBER 31, 2009 |
|
OR |
|
o TRANSITION REPORT PURSUANT TO SECTION 13 OR 15(D) OF THE |
|
|
|
COMMISSION FILE NO. 000-20728 |
|
|
|
RIMAGE CORPORATION |
|
(Exact name of registrant as specified in its charter) |
|
|
|
|
|
|
Minnesota |
|
41-1577970 |
|
|
State or other jurisdiction of incorporation or organization |
|
(I.R.S. Employer Identification No.) |
|
|
|
|
|
|
|
7725 Washington Avenue South, Minneapolis, Minnesota |
|
55439 |
|
|
(Address of principal executive offices) |
|
(Zip Code) |
|
|
|
|
|
|
|
|
|
|
|
|
Registrant’s telephone number: |
|
(952) 944 - 8144 |
|
|
|
|
|
Securities registered pursuant to Section 12(b) of the Act: |
Common Stock, $.01 par value |
|
|
|
|
|
Preferred Stock Purchase Rights |
|
|
|
|
Securities registered pursuant to Section 12(g) of the Act: |
None |
Indicate
by checkmark if the registrant is a well-known seasoned issuer, as defined in
Rule 405 of the Securities Act.
Yes o No x
Indicate
by checkmark if the registrant is not required to file reports pursuant to
Section 13 or Section 15(d) of the Act.
Yes o No x
Indicate by checkmark whether the registrant (1) has filed all reports required to be filed by Section 13 or 15 (d) of the Securities Exchange Act of 1934 during the preceding 12 months (or for such shorter period that the Registrant was required to file such reports), and (2) has been subject to such filing requirements for the past 90 days. Yes x No o
Indicate by check mark whether the registrant has submitted electronically and posted on its corporate Web site, if any, every Interactive Data File required to be submitted and posted pursuant to Rule 405 of Regulation S-T during the preceding 12 months (or for such shorter period that the registrant was required to submit and post such files). Yes o No o
Indicate by checkmark if disclosure of delinquent filers pursuant to Item 405 of Regulation S-K is not contained herein, and will not be contained, to the best of registrant’s knowledge, in definitive proxy or information statements incorporated by reference in Part III of this Form 10-K or any amendment to this Form 10-K. o
Indicate by checkmark whether the registrant is a large accelerated filer, an accelerated filer, a non-accelerated filer or a smaller reporting company.
Large Accelerated Filer o Accelerated Filer x
Non-Accelerated Filer o Smaller Reporting Company o
Indicate by checkmark whether the registrant is a shell company (as defined in Rule 12b-2 of the Exchange Act):
Yes o No x
The aggregate market value of common stock held by non-affiliates of the registrant, computed by reference to the last quoted price at which such stock was sold on such date as reported by the Nasdaq Stock Market as of the last business day of the registrant’s most recently completed second fiscal quarter was approximately $155,700,000.
As of February 28, 2009, 9,471,885 shares of the registrant’s common stock were outstanding.
DOCUMENTS INCORPORATED BY REFERENCE
Portions of the registrant’s definitive proxy statement for its 2010 Annual Meeting of Shareholders, to be filed within 120 days after the end of the fiscal year covered by this report, are incorporated by reference into Part III hereof.
1
|
|
|
|
|
|
|
|
|
Page |
|
|
|
|
|
|
|
|
3 |
|
|
|
|
|
|
|
|
3 |
||
|
|
|
|
|
|
|
|
3 |
|
|
|
|
3 |
|
|
|
|
4 |
|
|
|
|
4 |
|
|
|
|
5 |
|
|
|
|
5 |
|
|
|
|
5 |
|
|
|
|
6 |
|
|
|
6 |
||
|
|
6 |
||
|
|
11 |
||
|
|
11 |
||
|
|
12 |
||
|
|
12 |
||
|
|
|
|
|
|
|
12 |
||
|
|
|
|
|
|
Market for Common Equity, Related Stockholder Matters and Issuer Purchases of Equity Securities |
|
12 |
|
|
|
12 |
||
|
|
12 |
||
|
|
13 |
||
|
|
14 |
||
|
|
15 |
||
|
Management’s Discussion and Analysis of Financial Condition and Results of Operations |
|
16 |
|
|
|
16 |
||
|
|
16 |
||
|
|
19 |
||
|
|
20 |
||
|
|
22 |
||
|
|
22 |
||
|
|
22 |
||
|
|
23 |
||
|
Changes in and Disagreements with Accountants on Accounting and Financial Disclosure |
|
49 |
|
|
|
49 |
||
|
|
50 |
||
|
|
|
|
|
|
|
50 |
||
|
|
|
|
|
|
|
50 |
||
|
|
50 |
||
|
Security Ownership of Certain Beneficial Owners and Management and Related Stockholders Matters |
|
50 |
|
|
Certain Relationships and Related Transactions and Directors Independence |
|
51 |
|
|
|
51 |
||
|
|
|
|
|
|
|
51 |
||
|
|
|
|
|
|
|
51 |
||
|
|
|
|
|
|
|
52 |
||
2
General Information
|
|
|
|
BUSINESS |
Rimage Corporation (“Rimage” or the “Company”) is a leading provider of high-performance digital publishing systems that are used by businesses to produce recordable CD, DVD and Blu-ray Discs™ with customized digital content on an on-demand basis. Rimage’s publishing systems, which include equipment to handle a full range of low-to-high production volumes, incorporate robotics, software and custom printing technology for disc labeling. Rimage focuses its digital publishing solutions on a set of vertical markets with special needs for customized, on-demand digital information, including digital photography, medical imaging, business services, law enforcement and video workflows.
Incorporated as IXI, Inc. in Minnesota in February 1987, Rimage has focused on digital storage production equipment since its inception. Since 1995, Rimage has focused its business on development and sale of its CD recordable (“CD-R”) publishing systems, and since 2000, its DVD recordable (“DVD-R”) publishing systems. Blu-ray capabilities were integrated into key products in late 2006 to address the needs of customers desiring the substantial increase in storage capacity provided by this technology.
Rimage’s products are designed to enable the automation of data distribution and archiving processes. In some cases, this results in reductions of labor, training and inventory costs for users of the products; in other cases, it enables totally new and innovative applications. Rimage products provide compelling solutions for distribution and archiving of information on recordable CD, DVD and Blu-ray media for just-in-time, on-demand and mass customization of discs with unique content and labels.
The principal benefits to users of Rimage’s products include unattended operation, reduced labor costs and higher throughput and quality than alternative systems. One of the essential elements of Rimage’s marketing and development strategy is to provide users with a path for future product upgrades to obtain improved products or products with additional capabilities, such as drives that will accommodate new media types, drives with faster recording speeds and opportunities to upgrade to improved printing technologies. Rimage has made a long-term commitment to its customers by providing maintenance service contracts, replacement parts and repair service for current, as well as past products.
Sales of Rimage’s digital publishing systems comprised 40%, 39%, and 52% of its revenue from operations during 2009, 2008 and 2007, respectively. Rimage’s other major sources of revenue are recurring in nature and consist of consumables (ribbons, ink cartridges and Rimage-branded blank recordable CD, DVD and Blu-ray media), parts and maintenance contract sales.
Rimage’s digital publishing systems have been divided into two primary product lines: the Producer line of equipment for higher volume requirements for production of recordable CD, DVD or Blu-ray media, and the Desktop line of lower-cost products for office and other desktop applications. The Producer line of hardware products continues to generate a significant portion of Rimage’s revenue, comprising 34% of total revenues during 2009 at $27.9 million, 33% during 2008 at $30.3 million and 43% during 2007 at $46.8 million. The Desktop line of hardware products contributed 6% of total revenues in 2009 at $5.1 million, 6% in 2008 at $5.8 million and 9% in 2007 at $9.4 million. The balance of revenue in each year was generated through sale of Rimage-branded blank recordable CD, DVD and Blu-ray media, ribbons, ink cartridges, parts, repair services and maintenance contracts. These recurring revenues comprised 60% of total revenues during 2009 at $50.3 million, 61% during 2008 at $55.3 million and 48% during 2007 at $52.6 million. The decrease in recurring revenues has been driven by the economic downturn compressing demand for many products including the CD, DVD, and Blu-ray media products created by Rimage customers.
The Producer III Series. The Producer III Series of digital publishing systems, introduced in 2006, represent the latest generation of the high-performance Producer line and consists of a family of products that cover a broad range of applications for the publishing and duplication of CD, DVD and Blu-ray discs with digital content. The Company augmented its Producer product line with the introduction in 2007 of the Professional Series line of digital publishing systems. Each product in the Producer line incorporates recorders capable of recording on CD, DVD or Blu-ray media, customized robotics, a thermal or thermal re-transfer printer for on-disc color printing, software and computer hardware components.
Rimage offers its Producer line of products in seven basic configurations to meet the varying needs of its commercial customers. The Rimage 8100 system, part of the Producer III Series of publishing systems introduced in 2006, provides industry leading speed and throughput for on-demand production of CD, DVD or Blu-ray discs with digital content. The Rimage 8100 system utilizes up to four simultaneous data streams and four recorders and provides for a capacity of 300 discs. The Rimage 7100 system, also part of the Producer III Series, has two recorders. The Rimage 6100 system, introduced in 2008 as an expansion of the Producer III Series, has a
3
single recorder. The Rimage 8100 and Rimage 7100 systems have a control center embedded inside the unit, while the Rimage 6100 is available with an embedded control center or may be purchased without a control center. The Rimage 8100, 7100, and the single-recorder 6100 systems are each available with either Rimage’s Everest or Prism printers. The Professional Series systems include the 5300N and 5100N, designed as network-attached publishing systems that feature an embedded control center, an Everest printer and a small product size and footprint. Rimage introduced two new digital publishing systems to its Professional Series line of products effective March 1, 2010. The Rimage Professional Series 5400N and Rimage Professional Series 3400 offer an entry point for on-demand disc publishing and are compact, all-in one solutions designed specifically for retail applications and disc publishing in front office settings. Both systems utilize two recorders, three input bins and an Everest printer. The Rimage Professional Series 5400N has a control center embedded inside the unit, while the Rimage Professional Series 3400 does not contain a control center. The Professional Series 5400N and 3400 line of systems will replace the 5300N and 5100N as product offerings over the course of 2010.
The Everest printer was developed to meet the need of customers for an on-demand surface printer able to produce color and monochrome labels with quality similar to offset and silkscreen printing systems. Everest produces images on recordable CD, DVD and Blu-ray media that are indelible and cover the full surface of the media. In 2008, Rimage introduced the Everest 600 printer which enables users to print labels with 600 dpi print resolution for printing photo quality images and clear, crisp text. Rimage’s Prism printer provides high-speed, laser quality monochrome and spot color printing on standard recordable CD and DVD media for in-house, customized printing. The Producer line also includes Autoprinters that incorporate either an Everest or Prism printer.
The markets and applications for Rimage’s Producer line of products include digital photography, medical imaging, business services, law enforcement and video workflows. List prices for the Producer line of publishing products available during 2009 currently range from $10,500 to $37,950. List prices for the recently introduced Professional Series 5400N and 3400 range from $6,950 to $12,950.
The Desktop Series. Rimage’s Desktop Series of CD-R/DVD-R products feature economical pricing, a compact “desktop” design, software, network compatibility and stand-alone, plug-and-play technology ideal for office environments. The Company introduced the two-drive recorder Rimage 2000i Desktop publishing system and Rimage 480i thermal inkjet printer in June 2004. Co-developed by the Company and Hewlett-Packard, the Rimage 480i inkjet printer features 4800 dpi resolution for high clarity color printing on CD-R/DVD-R discs. The current list price for the Rimage 2000i Desktop publishing system is $3,450.
During 2009 and through March 31, 2010, Rimage has and will utilize the following principal means of distributing its products: A two-tier distribution channel of distributors to value added resellers in Europe, the U.S. and Latin America; a distributor or OEM to end-user distribution channel in Asia Pacific, some areas in Europe and some U.S. market applications; and direct sales to select accounts using its own sales force. Rimage’s channel partners, primarily consisting of distributors, value added resellers and other strategic partners, currently generate the majority of the Company’s sales.
Effective April 1, 2010, Rimage is terminating its distributor relationships with distributors in the United States, Germany, and the United Kingdom. The termination of these distributors is part of the Company’s plan to improve the efficiency of its sales channels. Following termination of the distributors, the Company will sell product in these regions to end-user customers primarily through value-added resellers or other strategic partners and also directly to select accounts through its own sales force.
Rimage has historically focused its sales and marketing efforts on high-volume CD-R and DVD-R publishing solutions for its Producer product line in such areas as banking and finance, wholesale photo processing labs, medical imaging, and retail photography. Rimage plans to continue to expand its position in some of these markets while also focusing on new applications with high-growth potential in business services, law enforcement and video workflows. The Company’s sales and marketing organization is focused on penetrating these targeted markets and strengthening marketing support for new products.
During 2009, 2008 and 2007, Rimage derived 18%, 15% and 14% of its respective revenues from one of its distributors, and derived 10%, 11% and 9% of its revenues from a second distributor during the same respective periods. Sales to one of the Company’s strategic partners represented 11%, 10% and 9% of revenues during 2009, 2008 and 2007, respectively. The agreement governing these sales is the Company’s standard distributor agreement (in the case of the distributors) or standard form of purchase order in the case of the strategic partner.
Rimage conducts foreign sales through its U.S. operation and its subsidiaries in Germany and Japan, Rimage Europe GmbH and Rimage Japan Co., Ltd., respectively. Foreign sales constituted approximately 41% of Rimage’s revenues for the year ended December 31, 2009, 42% for the year ended December 31, 2008 and 36% of revenues for the year ended December 31, 2007.
Rimage competes with a number of manufacturers of CD-R/DVD-R/Blu-ray production equipment and related products. Primary competitors of the Company currently include Primera Technology, Inc., Teac, Microtech Systems, Inc., and Seiko Epson Corporation. Rimage is able to compete effectively in the sale of digital publishing systems because of technological leadership in
4
automated solutions and its early start within the CD-R/DVD-R production equipment industry. Rimage believes that its quality printing capabilities for recordable CD, DVD and Blu-ray media, its transporter mechanisms, its software, its serviceability, and its integration tools differentiate its products from those of competitors. Rimage also competes with online distribution and alternative technologies in the storage media industry such as high capacity hard drives, tape drives and flash memory. Rimage believes that within its targeted markets its technology has advantages over these alternative technologies in terms of usability, reliability, performance, security and cost.
Rimage’s manufacturing operations consist primarily of the assembly of products from components purchased from third parties. Some parts are standard components and others are manufactured to Rimage’s specifications. Rimage’s employees at its facility in Edina, Minnesota conduct assembly and testing operations. Components include DVD-R drives, Blu-ray recorders, printers, circuit boards, electric motors, machined and molded parts, precision sheet metal assemblies, computer components and other mechanical parts. The Company depends upon a single-source supplier for its Everest printers and, beginning in March 2010, its Rimage Professional Series 5400N and Rimage Professional Series 3400 systems. The Company currently purchases these products pursuant to its standard form of purchase order, submitted to the supplier from time to time as the products are needed.
Although Rimage believes it has identified alternative assembly contractors for most of its subassemblies and products, an actual change in such contractors would likely require a period of training and testing. Accordingly, a sudden interruption in a supply relationship or the production capacity of one or more of such contractors could result in increased costs, delivery delays, loss of sales and quality control issues as the Company seeks to secure alternative sources of supply.
At December 31, 2009, 27 full-time employees were involved in research and development at Rimage. This staff, with software, electrical, mechanical and drafting capabilities, engages in research and development of new products and development of enhancements to existing products. In addition, Rimage partners with third-parties to utilize their competencies in creating products to enhance its product offering.
The industries served by Rimage are subject to rapid technological changes. Other technologies, including online distribution and alternative data storage media exist or are under development, including high capacity hard drives, tape drives and flash memory. All these forces may affect the usage of recordable CD, DVD and Blu-ray media. Rimage believes that it must continue to innovate and anticipate advances in the storage media industry in order to remain competitive.
Rimage’s expenditures for research and development were $7.1 million, $5.3 million and $5.9 million in 2009, 2008 and 2007, representing 8.6%, 5.7% and 5.4% of revenues, respectively. Rimage anticipates its expenditures in research and development in 2010 will remain similar to the levels experienced during 2009 to support a sustained level of new product development initiatives and improve existing products.
Patents and Government Regulation
Rimage currently maintains 27 U.S. and foreign patents and has a total of four U.S. and foreign patents pending. In addition, Rimage protects the proprietary nature of its software primarily through copyright and license agreements and through close integration with its hardware offerings. It is Rimage’s policy to protect the proprietary nature of its newly developed products whenever they are likely to become significant sources of revenue. No assurance can be given that Rimage will be able to obtain patent or other protection for its products. In addition, Rimage has registered and may in the future register trademarks and other marks used in its business.
As the number of Rimage’s products increases and the functionality of those products expands, Rimage believes that it may become increasingly subject to attempts by others to duplicate its proprietary technology and to the possibility of infringement of Rimage patents. In addition, although Rimage does not believe that any of its products infringe on the rights of others, third parties have claimed, and may in the future claim, Rimage’s products infringe on their rights and these third parties may assert infringement claims against Rimage in the future. Rimage may litigate to enforce patents issued to it and to defend against claimed infringement of the rights of others or to determine the ownership, scope, or validity of Rimage’s proprietary rights and the rights of others. Any claim of infringement against Rimage could involve significant liabilities to third parties, could require Rimage to seek licenses from third parties, and could prevent Rimage from manufacturing, selling or using its products.
The FCC requires some of Rimage’s equipment to meet radio frequency emission standards. Rimage takes steps to ensure proper compliance of all products.
Blu-ray Disc™ is a trademark of the Blu-ray Disc Association.
5
At December 31, 2009, Rimage had 186 full-time employees, of which 27 were involved in research and development, 79 in production, testing, repair and customer service, and 80 in sales, marketing, administration and management. None of Rimage’s employees are represented by a labor union or covered by a collective bargaining agreement.
Cautionary Note Regarding Forward-Looking Statements
We make statements from time to time regarding our business and prospects, such as projections of future performance, statements of management’s plans and objectives, forecasts of market trends, and other matters that are forward-looking statements within the meaning of Section 27A of the Securities Act of 1933 and Section 21E of the Securities Exchange Act of 1934. Statements containing the words or phrases “will likely result,” “are expected to,” “will continue,” “is anticipated,” “estimates,” “projects,” “believes,” “expects,” “anticipates,” “intends,” “target,” “goal,” “plans,” “objective,” “should” or similar expressions identify forward-looking statements. Forward-looking statements may appear in documents, reports, filings with the Securities and Exchange Commission (SEC), news releases, written or oral presentations made by our authorized officers or other representatives. For such statements, we claim the protection of the safe harbor for forward-looking statements contained in the Private Securities Litigation Reform Act of 1995.
Our future results, including results expressed in or implied by forward-looking statements, involve a number of risks and uncertainties. Forward-looking statements are not guarantees of future actions, results or performance. Any forward-looking statement made by or on behalf of us speaks only as of the date on which such statement is made. We do not undertake any obligation to update or keep current any forward-looking statement to reflect events or circumstances arising after the date of such statement.
In addition to other matters identified or described by us from time to time in filings with the SEC, there are many important factors that could cause our future results to differ materially from historical results or trends, results anticipated or planned by us, or the results expressed in or implied by any forward-looking statements. These important factors are described below under Item 1A. Risk Factors.
|
|
|
|
RISK FACTORS |
If any of the following risks actually occur, our results of operations, cash flows and the market price of our common stock could be negatively impacted. Although we believe that we have identified and discussed below the key risk factors affecting our business, there may be additional risks and uncertainties that are not presently known or that are not currently believed to be significant that may adversely affect our performance or financial condition.
Adverse economic conditions, particularly those affecting our customers, distributors and resellers, will harm our business.
Unfavorable changes in economic conditions, including recession, inflation, lack of access to capital, lack of consumer confidence or other changes have resulted and may continue to result in lower spending among customers in the industries we serve. Unfavorable economic conditions have also resulted and may continue to result in decreased sales to our distributors and resellers.
Further, we sell our products throughout the United States, as well as in several foreign countries. Our business may be adversely affected by factors in the United States and other countries, such as disruptions in financial markets or downturns in economic activity in specific countries or regions, or in the various industries in which we operate; social, political or labor conditions in specific countries or regions; or adverse changes in the availability and cost of capital, interest rates, tax rates, or regulations. These factors are beyond our control, but may result in further decreases in spending among customers and softening demand for our products.
Declining demand for our products would adversely affect our revenue. Further, challenging economic conditions also may impair the ability of our customers to pay for products and services they have purchased. As a result, our cash flow may be negatively impacted and our allowance for doubtful accounts and write-offs of accounts receivable may increase.
Technology in our industry evolves rapidly, potentially causing our products to become obsolete, and we must continue to enhance existing systems and develop new systems or we will lose sales.
Rapid technological advances, rapidly changing customer requirements and fluctuations in demand characterize the current market for our products. Further, online distribution and alternative data storage media is available, including high capacity hard drives, tape drives and flash memory. Our existing and development-stage products may become obsolete if our competitors introduce newer or more appealing technologies. If these technologies are patented or proprietary to our competitors, we may not be able to access these technologies. We believe that we must continue to innovate and anticipate advances in the storage media industry in order to remain competitive. If we fail to anticipate or respond to technological developments or customer requirements, or if we are significantly delayed in developing and introducing products, our business will suffer lost sales.
6
Our market is competitive and such competition may result in price reductions, lower gross profits and loss of market share.
The storage media industry is becoming more competitive, and we face the potential for increased competition in developing and selling our recordable CD, DVD and Blu-ray publishing systems in both the U.S. and in foreign markets. Our competitors may have or could develop or acquire significant marketing, financial, development and personnel resources. Our current primary competitors include Primera Technology, Inc., Teac America, Inc., Seiko Epson Corporation and Microtech Systems, Inc. To remain competitive, we believe that we must continue to provide:
|
|
|
|
|
|
• |
Technologically advanced systems that anticipate and satisfy the demands of end-users; |
|
|
|
|
|
|
• |
Continuing advancements in our recordable CD, DVD and Blu-ray digital publishing systems; |
|
|
|
|
|
|
• |
A responsive and effective sales force; |
|
|
|
|
|
|
• |
A dependable and efficient distribution and reseller network; |
|
|
|
|
|
|
• |
Superior customer service; and |
|
|
|
|
|
|
• |
High levels of quality and reliability. |
We cannot assure you that we will be able to compete successfully against our current or future competitors. The storage media industry has increased visibility, which may lead to large, well-known, well-financed companies entering into this market. Increased competition from manufacturers of systems or consumable supplies may result in price reductions, lower gross profit margins, and increased discounts to customers and loss of market share and could require increased spending by us on research and development, sales and marketing and customer support.
If our products fail to compete successfully with other existing publishing systems or newly-developed products for the storage media or content distribution industries, our business will suffer.
The success of our products depends upon our end users choosing our recordable CD, DVD and Blu-ray technology for their storage media needs. However, online distribution and alternative data storage media exist, such as high capacity hard drives, tape drives and flash memory. Further, additional media is under development. If end users perceive any technology that is competing with ours as more reliable, higher performing, less expensive or having other advantages over our technology, the demand for our products could decrease. Additionally, some of our competitors may make strategic acquisitions or establish cooperative relationships with suppliers or companies that produce complementary products. Competition from other publishing systems, online distribution or other storage media is likely to increase. If our products do not compete successfully with existing or new competitive products, our business will suffer.
We sell a significant portion of our products internationally, which exposes us to risks associated with foreign operations.
We sell a significant amount of our products to customers outside the United States, particularly in Europe, Asia and Latin America. International sales accounted for 41% of our revenues for the year ended December 31, 2009, 42% of our revenues for the year ended December 31, 2008, and 36% for the year ended December 31, 2007. We expect that shipments to international customers, including customers in Europe, Asia and Latin America, will continue to account for a significant portion of our net sales. Sales outside the United States involve the following risks, among others:
|
|
|
|
|
|
• |
Foreign governments may impose tariffs, quotas and taxes; |
|
|
|
|
|
|
• |
The demand for our products will depend, in part, on local economic health. |
|
|
|
|
|
|
• |
Political and economic instability may reduce demand for our products; |
|
|
|
|
|
|
• |
Restrictions on the export or import of technology may reduce or eliminate our ability to sell in certain markets; |
|
|
|
|
|
|
• |
Potentially limited intellectual property protection in certain countries may limit our recourse against infringing products or cause us to refrain from selling in certain markets; |
|
|
|
|
|
|
• |
We may face difficulties in managing our international operations; |
|
|
|
|
|
|
• |
The burden and cost of complying with a variety of foreign laws; |
|
|
|
|
|
|
• |
We may decide to price our products in foreign currency denominations; |
|
|
|
|
|
|
• |
Our contracts with foreign distributors and resellers cannot fully protect us against political and economic instability; |
|
|
|
|
|
|
• |
We may face difficulties in collecting receivables; and |
|
|
|
|
|
|
• |
We may not be able to control our international distributors’ efforts on our behalf. |
The financial results of our German and Japanese subsidiaries are translated into U.S. dollars for consolidation with our overall financial results. Additionally, we hedge against currency fluctuations associated with foreign currency denominated transactions (principally the Euro) with Rimage Europe. Despite our hedging activity, currency translations and fluctuations may adversely affect the financial performance of our consolidated operations. Currency fluctuations also may increase the relative price of our product in foreign markets and thereby could also cause our products to become less affordable or less price competitive than those of foreign
7
manufacturers. These risks associated with foreign operations may have a material adverse effect on our revenue from or costs associated with international sales.
If our domestic or international intellectual property rights are not adequately protected, others may offer products similar to ours which could depress our product selling prices and gross profit or result in loss of market share.
We believe that protecting our proprietary technology is important to our success and competitive positioning. In addition to common law intellectual property rights, we rely on patents, trade secrets, trademarks, copyrights, know-how, license agreements and contractual provisions to establish and protect our intellectual property rights. However, these legal means afford us only limited protection and may not adequately protect our rights or remedies to gain or keep any advantages we may have over our competitors.
We cannot assure you that others may not independently develop the same or similar technologies or otherwise obtain access to our technology and trade secrets.
Our competitors, who may have or could develop or acquire significant resources, may make substantial investments in competing technologies, or may apply for and obtain patents that will prevent, limit, or interfere with our ability to manufacture or market our products. Further, although we do not believe that any of our products infringe the rights of others, third parties have claimed, and may in the future claim, our products infringe on their rights, and these third parties may assert infringement claims against us in the future. We may litigate to enforce patents issued to us and to defend against claimed infringement of the rights of others or to determine the ownership, scope, or validity of our proprietary rights and the rights of others. Any claim of infringement against us could involve significant liabilities to third parties, could require us to seek licenses from third parties, and could prevent us from manufacturing, selling or using our products.
Costly litigation may be necessary to enforce patents issued to us, to protect trade secrets or “know-how” we own, to defend us against claimed infringement of the rights of others or to determine the ownership, scope, or validity of our proprietary rights and the rights of others. Any claim of infringement against us may involve significant liabilities to third parties, could require us to seek licenses from third parties, and could prevent us from manufacturing, selling, or using our products. The occurrence of this litigation, or the effect of an adverse determination in any of this type of litigation, could have a material adverse effect on our business, financial condition and results of operations. Further, the laws of some of the countries in which our systems are or may be sold may not protect our systems and intellectual property to the same extent as the United States or at all. Our failure to protect or enforce our intellectual property rights could have a material adverse effect on our business, results of operations and financial condition.
Our sales will decline, and our business will be materially harmed, if our sales and marketing efforts are not effective.
Historically, we have distributed our products to end users through a two-tier system of distributors and resellers and through our own sales force to select accounts.
Effective April 1, 2010, we will terminate several distributor relationships as part of our plan to improve the efficiency of our sales channels. Following termination of the distributors, we will sell product to end-user customers primarily through value-added resellers, other strategic partners, a web-based ordering tool and also directly to select accounts through our own sales force. Although we have communicated with our customers regarding these changes, we may encounter difficulties in transitioning customer relationships from terminated distributors. Because we will be performing much of the sales and marketing to this larger customer group, we may also encounter difficulties in managing a more complex sales and marketing function that meets the needs of our customers, and may also experience challenges in maintaining an appropriate number of trained personnel. If we are not able to effectively market our products to customers or service these customers through our new distribution channels, our sales may decline and our business may be harmed.
For sales that are made to customers through value-added resellers or other strategic partners, we depend on these businesses to provide effective sales and marketing support to our products. Our distributors and resellers are independent businesses that we do not control. Our agreements with distributors and resellers do not contain requirements that a certain percentage of such parties’ sales are of our products. Further, some of our channel partners are small organizations with limited capital, and our success in distributing our products to end-users will depend upon the continued viability and financial stability of these entities. These channel partners may choose to devote their efforts to other products in different markets or reduce or fail to devote the necessary resources to provide effective sales and marketing support of our products, any of which could harm our business by reducing sales to customers.
We believe that our future growth and success will depend upon the success of our sales and marketing efforts as well as those of our value-added resellers or other strategic partners.
If we do not maintain adequate inventories of component parts or finished goods, or if we fail to adequately forecast demand, the likely resulting delays in producing our publishing systems products would damage our business.
8
We forecast production based on past sales and our estimates of future demand. In the event that we significantly underestimate our needs or encounter an unexpectedly high level of demand for our systems or our suppliers are unable to deliver our orders of components in a timely manner, we may be unable to fill our product orders on time which could harm our reputation and result in reduced sales.
We rely on single-source suppliers, which could cause delays, increases in costs or prevent us from completing customer orders, all of which could materially harm our business.
We assemble our Producer Series and Desktop Series products using materials and components supplied by various subcontractors and suppliers. We purchase critical components for our systems, including our Everest printers, DVD-R drives, Blu-ray drives, circuit boards, electric motors, machined and molded parts, precision sheet metal assemblies and mechanical parts from third parties. Some of our subcontractors and suppliers are the sole source of these components and these third parties may also own technology and manufacturing know-how required to manufacture critical components. If any of our suppliers is unable to ship critical components, we would be unable to assemble and ship products to our resellers or end-user customers. If the price of these components increases for any reason, or if these suppliers are unable or unwilling to deliver, we may have to find another source, which could result in interruptions, increased costs, delays, loss of sales and quality control problems. We purchase these components pursuant to our standard form of purchase order, submitted to the supplier from time to time as the components are needed.
The termination or interruption of any of these relationships, or the failure of these manufacturers or suppliers to supply products or components to us on a timely basis or in sufficient quantities, likely would cause us to be unable to meet orders for our products and harm our reputation and our business. For the majority of our critical components, we have identified alternative suppliers. The Company depends upon a single-source supplier for its Everest printers and, beginning in March 2010, its Rimage Professional Series 5400N and Rimage Professional Series 3400 systems. For these products, it is more difficult to identify an alternative supplier because of the proprietary information and technology held by the current supplier. If we were unable to effectively transition the technology and proprietary information used by our current suppliers to alternative suppliers, the design and manufacture of components and products to our specifications may be significantly delayed, resulting in potential production delays and significant expense. Further, if we obtain a new supplier for a component or product or use an alternative component in our product, we may need to conduct additional testing of our products to ensure the product meets our quality and performance standards. Any delays in delivery of our product to end-users, distributors or resellers could be extended, and our costs associated with the change in product manufacturing could increase.
The failure of our components suppliers to supply us with the components consistent with our requirements as to quality, quantity and timeliness could materially harm our business by causing delays, loss of sales, increases in costs and lower gross profit margins.
Our products must be compatible with products designed and manufactured by others and, in the event of design changes or the introduction of new products by them or us, our products must continue to be compatible with products of others.
Our Producer Series and Desktop Series of digital publishing systems incorporate computer and related computer equipment, hardware and software manufactured by others. Our products are designed to provide end users with a fully-integrated publishing system and therefore, our products must operate with the computer and related equipment of others to function properly for end users. Problems with the products of others may adversely affect the performance and reliability of our publishing system products and damage our reputation with end users. Further, if there are changes in our products, changes in the computer or computer related equipment integrated into our products or if we offer new products, we must maintain compatibility and interoperability of our products with the products of others. We cannot assure you that we will be able to adapt our products to be compatible with any newly designed product of another party. We would likely incur substantial costs to test and “de-bug” any newly designed product that we integrate into our products. Further, our new product development efforts may be hampered by our need to maintain compatibility with the products of others, and we may incur additional expense designing for compatibility.
Our publishing systems may have manufacturing or design defects that we discover after shipment, which could negatively affect our revenues, increase our costs and harm our reputation.
Our publishing systems are complex and may contain undetected and unexpected defects, errors or failures. If these product defects are substantial, the result could be product recalls, an increased amount of product returns, loss of market acceptance and damage to our reputation, all of which could increase our costs and cause us to lose sales. We carry general commercial liability insurance covering our products with policy limits per occurrence and in the aggregate that we have deemed to be sufficient. We cannot predict, however, whether this insurance is sufficient, or if not, whether we will be able to obtain sufficient insurance to cover the risks associated with our business or whether such insurance will be available at premiums that are commercially reasonable. In addition, these insurance policies must be renewed annually. Although we have been able to obtain liability insurance, such insurance may not be available in the future on acceptable terms, if at all. A successful claim against us or settlement by us in excess of our insurance coverage or our inability to maintain insurance in the future could have a material adverse effect on our business, results of operations, liquidity and financial condition.
9
If our systems fail to comply with domestic and international government regulations, or if these regulations result in a barrier to our business, we could lose sales.
Our systems must comply with various domestic and international laws, regulations and standards. In the event that we are unable or unwilling to comply with any such laws, regulations or standards, we may decide not to conduct business in certain markets. Particularly in international markets, we may experience difficulty in securing required licenses or permits on commercially reasonable terms, or at all. Failure to comply with existing or evolving laws or regulations, including export and import restrictions and barriers, or to obtain timely domestic or foreign regulatory approvals or certificates could result in lost sales.
Fluctuations in our future operating results may negatively affect the market price of our common stock.
We have experienced fluctuations in our quarterly operating results, and we expect those fluctuations to continue due to a variety of factors. Some of the factors that influence our quarterly operating results include:
|
|
|
|
|
|
• |
The number and mix of products sold in the quarter; |
|
|
|
|
|
|
• |
The timing of major projects; |
|
|
|
|
|
|
• |
The availability and cost of components and materials; |
|
|
|
|
|
|
• |
Timing, costs and benefits of new product introductions; |
|
|
|
|
|
|
• |
Customer order size and shipment timing; |
|
|
|
|
|
|
• |
Seasonal factors affecting timing of purchase orders; |
|
|
|
|
|
|
• |
Promotions by ourselves or competitors, and the timing of the promotion; |
|
|
|
|
|
|
• |
The impact to the marketplace of competitive products and pricing; and |
|
|
|
|
|
|
• |
The timing and level of operating expenses; |
|
|
|
|
|
|
• |
General economic and market conditions including market uncertainty. |
Because of these factors, our quarterly operating results are difficult to predict and are likely to vary in the future. If our operating results are below financial analysts’ or investors’ expectations, the market price of our common stock may fall abruptly and significantly.
If we fail to retain and attract highly skilled managerial and technical personnel, we may fail to remain competitive.
Our future success depends, in significant part, upon the continued service and performance of our senior management and other key personnel. The loss of the services of our management team, some of whom have significant experience in our industry, and other key personnel could impair our ability to effectively manage our company and to carry out our business plan. We do not carry life insurance on any of our executive officers. In addition, competition for skilled employees in our industry is intense. Our future success also depends on our continuing ability to attract, retain and motivate highly qualified managerial, technical and sales personnel. Our inability to retain or attract qualified personnel could have a significant negative effect and thereby materially harm our business and financial condition.
Our stock price may be volatile, and a shareholder’s investment could decline in value.
Our stock price has fluctuated in the past and may continue to fluctuate significantly, making it difficult for an investor to resell shares or to resell shares at an attractive price. The market prices for securities of technology companies, like Rimage, have historically been highly volatile. Future events concerning us or our competitors could cause such volatility, including:
|
|
|
|
|
|
• |
Actual or anticipated variations in our operating results; |
|
|
|
|
|
|
• |
Investments required in infrastructure and/or personnel to meet long-term strategic objectives; |
|
|
|
|
|
|
• |
Technological innovations or new commercial products introduced by us or our competitors; |
|
|
|
|
|
|
• |
Developments concerning proprietary rights; |
|
|
|
|
|
|
• |
Changes in senior management; |
|
|
|
|
|
|
• |
Potential acquisition or strategic alliance activities; |
|
|
|
|
|
|
• |
Investor perception of us and our industry; |
|
|
|
|
|
|
• |
General economic and market conditions including market uncertainty; |
|
|
|
|
|
|
• |
National or global political events; and |
|
|
|
|
|
|
• |
Public confidence in the securities markets and regulation by or of the securities markets. |
In addition, the stock market is subject to price and volume fluctuations that affect the market prices for companies in general, and small-capitalization, high-technology companies in particular, which are often unrelated to the operating performance of these companies. Any failure by us to meet or exceed estimates of financial analysts is likely to cause a decline in our common stock price.
10
Further, recent economic conditions have resulted in significant fluctuations and significant declines in stock prices for many companies, including Rimage. We cannot predict when the stock markets and the market for our common stock may stabilize.
Future sales of shares of our common stock in the public market may negatively affect our stock price.
Future sales of our common stock, or the perception that these sales could occur, could have a significant negative effect on the market price of our common stock. In addition, upon exercise of outstanding options, the number of shares outstanding of our common stock could increase substantially. This increase, in turn, could dilute future earnings per share, if any, and could depress the market value of our common stock. Dilution and potential dilution, the availability of a large amount of shares for sale, and the possibility of additional issuances and sales of our common stock may negatively affect both the trading price of our common stock and the liquidity of our common stock. These sales also might make it more difficult for us to sell equity securities or equity-related securities in the future at a time and price that we would deem appropriate.
Provisions of Minnesota law, our bylaws and other agreements may deter a change of control of our company and may have a possible negative effect on our stock price.
Certain provisions of our Minnesota law, our bylaws and other agreements may make it more difficult for a third- party to acquire, or discourage a third-party from attempting to acquire, control of our company, including:
|
|
|
|
|
|
• |
The provisions of Minnesota law relating to business combinations and control share acquisitions; |
|
|
|
|
|
|
• |
The provisions of our bylaws regarding the business properly brought before shareholders; |
|
|
|
|
|
|
• |
The right of our Board of Directors to establish more than one class or series of shares and to fix the relative rights and preferences of any such different classes or series; |
|
|
|
|
|
|
• |
Our shareholder rights plan, which would cause substantial dilution to any person or group attempting to acquire our company on terms not approved in advance by our Board of Directors; |
|
|
|
|
|
|
• |
The provisions of our stock option plans allowing for the acceleration of vesting or payments of awards granted under the plans in the event of specified events that result in a “change in control”; and |
|
|
|
|
|
|
• |
The provisions of our agreements provide for severance payments to our executive officers in the event of certain terminations following a “change in control.” |
These measures could discourage or prevent a takeover of our company or changes in our management, even if an acquisition or such changes would be beneficial to our shareholders. This may have a negative effect on the price of our common stock.
Compliance with changing regulation of corporate governance and public disclosure may result in additional expenses.
Keeping abreast of, and in compliance with, changing laws, regulations and standards relating to corporate governance and public company disclosure requirements, including the Sarbanes-Oxley Act of 2002 and in particular Section 404 of that Act relating to management certification of internal controls, the regulations of the Securities and Exchange Commission and the rules of the Nasdaq Stock Market have required an increased amount of management attention and external resources. We intend to invest all reasonably necessary resources to comply with evolving corporate governance and public disclosure standards, and this investment may result in increased general and administrative expenses and a diversion of management time and attention from revenue-generating activities to compliance activities.
|
|
|
|
UNRESOLVED STAFF COMMENTS |
None.
|
|
|
|
PROPERTIES |
Rimage headquarters are located in a facility of 58,500 square feet at 7725 Washington Avenue South, Edina, Minnesota 55439. This facility is used for manufacturing, engineering, service, sales, marketing and administration.
In July 2006, Rimage entered into a facility lease of approximately 18,200 square feet in Dietzenbach, Germany, used for service, sales and light assembly. The current term of the lease in Germany expires June 30, 2011, and monthly base rent is €14,833 (or approximately $22,000 U.S. dollars). Additionally, in May 2008, the Company entered into a facility lease of approximately 2,689 square feet in Tokyo, Japan, used for sales and service. The current term of the lease in Japan expires April 30, 2010, and monthly base rent is ¥ 1,685,441 (or approximately $18,000 U.S. dollars).
11
|
|
|
|
LEGAL PROCEEDINGS |
The Company is exposed to a number of asserted and unasserted legal claims encountered in the ordinary course of its business. Although the outcome of any such legal actions cannot be predicted, management believes that there are no pending legal proceedings against or involving the Company for which the outcome is likely to have a material adverse effect upon its financial position or results of operations.
|
|
|
|
[RESERVED] |
|
|
|
|
MARKET FOR COMMON EQUITY, RELATED STOCKHOLDER MATTERS AND ISSUER PURCHASES OF EQUITY SECURITIES |
Market Information
Rimage’s common stock is traded on the Nasdaq Global Market under the symbol “RIMG”. The following table sets forth, for the periods indicated, the range of low and high sales prices for Rimage’s common stock as reported on The Nasdaq Stock Market.
|
|
|
|
|
|
|
|
|
|
|
|
Low |
|
High |
|
||
|
|
|
|
|
|
|
||
|
Year 2008: |
|
|
|
|
|
|
|
|
1st Quarter |
|
$ |
21.25 |
|
$ |
26.61 |
|
|
2nd Quarter |
|
$ |
12.09 |
|
$ |
23.85 |
|
|
3rd Quarter |
|
$ |
12.01 |
|
$ |
17.88 |
|
|
4th Quarter |
|
$ |
10.07 |
|
$ |
15.89 |
|
|
Year 2009: |
|
|
|
|
|
|
|
|
1st Quarter |
|
$ |
11.14 |
|
$ |
15.11 |
|
|
2nd Quarter |
|
$ |
12.58 |
|
$ |
18.00 |
|
|
3rd Quarter |
|
$ |
14.97 |
|
$ |
17.86 |
|
|
4th Quarter |
|
$ |
15.47 |
|
$ |
19.38 |
|
As of February 17, 2010, there were 46 shareholders of record of Rimage’s common stock.
To date, Rimage has not paid or declared any cash dividends on its common stock. The payment by Rimage of dividends, if any, on its common stock in the future is subject to the discretion of the Board of Directors and will depend on Rimage’s continued earnings, financial condition, capital requirements and other relevant factors.
12
Other Information Regarding Equity Compensation Plans
The following table sets forth information regarding Rimage’s equity compensation plans in effect as of December 31, 2009. Each of the Company’s equity compensation plans is an “employee benefit plan” as defined by Rule 405 of Regulation C of the Securities Act of 1933.
|
|
|
|
|
|
|
|
|
|
|
|
|
|
|
|
|
|
|
|
|
Securities Authorized for Issuance Under Equity Compensation Plans |
|
|||||||||||||
|
|
|
|
|
|
|
|
|
|
|
|
||||||
|
Plan category |
|
Number of shares of |
|
Weighted-average |
|
Number of shares of |
|
|||||||||
|
Equity compensation plans approved by shareholders: |
|
|
|
1,069,626 |
|
|
|
$ |
17.85 |
|
|
|
|
675,420 |
|
|
|
|
|
|
|
|
|
|
|
|
|
|
|
|
|
|
|
|
|
Equity compensation plans not approved by shareholders: |
|
|
|
200,000 |
|
|
|
$ |
14.10 |
|
|
|
|
— |
|
|
|
Total |
|
|
|
1,269,626 |
|
|
|
$ |
17.26 |
|
|
|
|
675,420 |
|
|
|
|
|
|
|
|
(1) |
Excludes shares of common stock listed in the first column |
“Equity compensation plans not approved by shareholders” consists of a non-qualified stock option grant to Sherman L. Black on April 1, 2009, the first day of his employment with Rimage. The stock option was granted outside of the Company’s current equity incentive plan, the 2007 Stock Incentive Plan, as an “inducement award” pursuant to Nasdaq Marketplace Rule 4350(i)(1)(A)(iv). The option has an exercise price equal to the closing price of the Company’s common stock as reported by the Nasdaq Stock Market on April 1, 2009, vests in four equal installments on each of the first four anniversaries of the date of grant, and has a term of seven years. In other respects, the option was structured to mirror the terms of options granted under the Company’s 2007 Stock Incentive Plan and is subject to a stock option plan and agreement entered into by and between the Company and Mr. Black dated April 1, 2009.
13
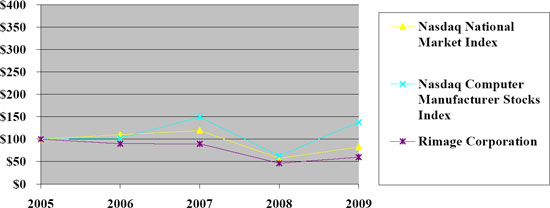
The Company’s common stock is quoted on The Nasdaq Global Market. The graph and table below set forth a comparison of the cumulative total return of the Company’s common stock over the last five fiscal years with a broad market index and either a nationally-recognized industry standard or an index of peer companies selected by the Company. Rimage has chosen to use the Nasdaq National Market Index (U.S.) as its broad market index and the Nasdaq Computer Manufacturer Stocks Index as its index of peer companies.
The following graph shows changes during the period from December 31, 2005 to December 31, 2009 in the value of $100 invested in: (1) the Nasdaq National Market Index (U.S.); (2) the Nasdaq Computer Manufacturer Stocks Index; and (3) Rimage’s common stock. The values of each investment as of the dates indicated are based on share prices plus any dividends paid in cash, with the dividends reinvested on the date they were paid. The calculations exclude trading commissions and taxes. The table and graph are not necessarily indicative of future investment performance.
|
|
|
|
|
|
|
|
|
|
|
|
|
|
|
|
|
|
|
|
|
12/30/05 |
|
12/29/06 |
|
12/31/07 |
|
12/31/08 |
|
12/31/09 |
|
|||||
|
|
|
|
|
|
|
|
|
|
|
|
|
|
|
|
|
|
|
Nasdaq National Market Index |
|
$ |
100.00 |
|
$ |
109.84 |
|
$ |
119.14 |
|
$ |
57.41 |
|
$ |
82.52 |
|
|
|
|
|
|
|
|
|
|
|
|
|
|
|
|
|
|
|
|
Nasdaq Computer Manufacturer Stocks Index |
|
$ |
100.00 |
|
$ |
102.13 |
|
$ |
149.41 |
|
$ |
62.76 |
|
$ |
137.84 |
|
|
|
|
|
|
|
|
|
|
|
|
|
|
|
|
|
|
|
|
Rimage Corporation |
|
$ |
100.00 |
|
$ |
89.72 |
|
$ |
89.54 |
|
$ |
46.27 |
|
$ |
59.83 |
|
14
|
|
|
|
SELECTED FINANCIAL DATA |
The selected consolidated financial data below should be read in conjunction with “Management’s Discussion and Analysis of Financial Condition and Results of Operations” in Item 7 below and the Consolidated Financial Statements and the Notes thereto included in Item 8 below. (In thousands, except per share data).
Consolidated Statements of Income Information:
|
|
|
|
|
|
|
|
|
|
|
|
|
|
|
|
|
|
|
|
|
Year ended December 31, |
|
|||||||||||||
|
|
|
2009 |
|
2008 |
|
2007 |
|
2006 |
|
2005 |
|
|||||
|
Revenues |
|
$ |
83,227 |
|
$ |
91,394 |
|
$ |
108,874 |
|
$ |
103,252 |
|
$ |
95,410 |
|
|
Cost of revenues |
|
$ |
42,894 |
|
$ |
51,731 |
|
$ |
57,719 |
|
$ |
56,014 |
|
$ |
51,957 |
|
|
Gross profit |
|
$ |
40,333 |
|
$ |
39,663 |
|
$ |
51,155 |
|
$ |
47,238 |
|
$ |
43,453 |
|
|
Operating expenses |
|
$ |
29,087 |
|
$ |
27,915 |
|
$ |
30,274 |
|
$ |
29,464 |
|
$ |
26,829 |
|
|
Operating income |
|
$ |
11,246 |
|
$ |
11,748 |
|
$ |
20,881 |
|
$ |
17,774 |
|
$ |
16,624 |
|
|
Other income, net |
|
$ |
1,866 |
|
$ |
2,711 |
|
$ |
3,513 |
|
$ |
2,684 |
|
$ |
1,419 |
|
|
Income tax expense |
|
$ |
4,617 |
|
$ |
5,028 |
|
$ |
8,633 |
|
$ |
7,374 |
|
$ |
6,675 |
|
|
Net income |
|
$ |
8,495 |
|
$ |
9,431 |
|
$ |
15,761 |
|
$ |
13,084 |
|
$ |
11,368 |
|
|
|
|
|
|
|
|
|
|
|
|
|
|
|
|
|
|
|
|
Basic net income per share |
|
$ |
0.91 |
|
$ |
0.99 |
|
$ |
1.59 |
|
$ |
1.33 |
|
$ |
1.19 |
|
|
Diluted net income per share |
|
$ |
0.89 |
|
$ |
0.97 |
|
$ |
1.52 |
|
$ |
1.26 |
|
$ |
1.10 |
|
|
Weighted average shares outstanding: |
|
|
|
|
|
|
|
|
|
|
|
|
|
|
|
|
|
Basic |
|
|
9,374 |
|
|
9,559 |
|
|
9,915 |
|
|
9,812 |
|
|
9,530 |
|
|
Diluted |
|
|
9,507 |
|
|
9,729 |
|
|
10,371 |
|
|
10,356 |
|
|
10,312 |
|
|
|
|
|
|
|
|
|
|
|
|
|
|
|
|
|
|
|
|
|
|
|
|
|
|
|
|
|
|
|
|
|
|
|
|
|
|
Consolidated Balance Sheet Information: |
|
|
|
|
|
|
|
|
|
|
|
|
|
|
|
|
|
|
|
|
|
|
|
|
|
|
|
|
|
|
|
|
|
|
|
|
|
Balances as of December 31, |
|
|||||||||||||
|
|
|
2009 |
|
2008 |
|
2007 |
|
2006 |
|
2005 |
|
|||||
|
Cash and cash equivalents |
|
$ |
72,507 |
|
$ |
14,885 |
|
$ |
7,416 |
|
$ |
8,500 |
|
$ |
12,693 |
|
|
Marketable securities |
|
$ |
28,581 |
|
$ |
39,870 |
|
$ |
51,605 |
|
$ |
30,266 |
|
$ |
51,582 |
|
|
Receivables, net |
|
$ |
13,732 |
|
$ |
11,099 |
|
$ |
14,447 |
|
$ |
21,697 |
|
$ |
12,885 |
|
|
Inventories |
|
$ |
4,123 |
|
$ |
5,625 |
|
$ |
8,075 |
|
$ |
6,072 |
|
$ |
6,621 |
|
|
Current assets |
|
$ |
120,760 |
|
$ |
74,151 |
|
$ |
84,771 |
|
$ |
70,116 |
|
$ |
86,444 |
|
|
Property and equipment, net |
|
$ |
7,855 |
|
$ |
6,183 |
|
$ |
3,206 |
|
$ |
3,626 |
|
$ |
2,525 |
|
|
Marketable securities - non-current |
|
$ |
9,037 |
|
$ |
40,647 |
|
$ |
35,201 |
|
$ |
38,594 |
|
$ |
— |
|
|
Total assets |
|
$ |
140,282 |
|
$ |
123,456 |
|
$ |
125,096 |
|
$ |
112,359 |
|
$ |
89,009 |
|
|
Current liabilities |
|
$ |
17,589 |
|
$ |
12,010 |
|
$ |
17,882 |
|
$ |
16,163 |
|
$ |
12,191 |
|
|
Long-term liabilities |
|
$ |
2,744 |
|
$ |
2,398 |
|
$ |
2,153 |
|
$ |
720 |
|
$ |
289 |
|
|
Stockholders’ equity |
|
$ |
119,949 |
|
$ |
109,048 |
|
$ |
105,061 |
|
$ |
95,476 |
|
$ |
76,529 |
|
15
|
|
|
|
MANAGEMENT’S DISCUSSION AND ANALYSIS OF FINANCIAL CONDITION AND RESULTS OF OPERATIONS |
The percentage relationships to revenues of certain income and expense items for the three years ended December 31, 2009 and the percentage changes in these income and expense items between years are contained in the following table:
|
|
|
|
|
|
|
|
|
|
|
|
|
|
|
|
|
|
|
|
|
Percentage (%) of Revenues |
|
Percent (%) Increase (Decrease) |
|
|||||||||||
|
|
|
2009 |
|
2008 |
|
2007 |
|
2009 vs. 2008 |
|
2008 vs. 2007 |
|
|||||
|
Revenues |
|
|
100.0 |
|
|
100.0 |
|
|
100.0 |
|
|
(8.9 |
) |
|
(16.1 |
) |
|
Cost of revenues |
|
|
(51.5 |
) |
|
(56.6 |
) |
|
(53.0 |
) |
|
(17.1 |
) |
|
(10.4 |
) |
|
Gross profit |
|
|
48.5 |
|
|
43.4 |
|
|
47.0 |
|
|
1.7 |
|
|
(22.5 |
) |
|
Operating expenses: |
|
|
|
|
|
|
|
|
|
|
|
|
|
|
|
|
|
Research and development |
|
|
(8.6 |
) |
|
(5.7 |
) |
|
(5.4 |
) |
|
36.0 |
|
|
(11.0 |
) |
|
Selling, general and administrative |
|
|
(26.4 |
) |
|
(24.8 |
) |
|
(22.4 |
) |
|
(3.2 |
) |
|
(7.0 |
) |
|
Operating income |
|
|
13.5 |
|
|
12.9 |
|
|
19.2 |
|
|
(4.3 |
) |
|
(43.7 |
) |
|
Other income, net |
|
|
2.2 |
|
|
2.9 |
|
|
3.2 |
|
|
(31.2 |
) |
|
(22.8 |
) |
|
Income before income taxes |
|
|
15.7 |
|
|
15.8 |
|
|
22.4 |
|
|
(9.3 |
) |
|
(40.7 |
) |
|
Income tax expense |
|
|
(5.5 |
) |
|
(5.5 |
) |
|
(7.9 |
) |
|
(8.2 |
) |
|
(41.8 |
) |
|
Net income |
|
|
10.2 |
|
|
10.3 |
|
|
14.5 |
|
|
(9.9 |
) |
|
(40.2 |
) |
Rimage develops, manufactures and markets digital publishing systems that are used by businesses to produce recordable CD, DVD and Blu-ray discs with customized digital content on an on-demand basis. Rimage distributes its publishing systems from its operations in the United States, Germany and Japan. The Company also distributes related consumables for use with its systems, consisting of media kits, ribbons, ink cartridges and Rimage-branded blank CD-R, DVD-R and Blu-ray media. These systems allow customers to benefit from cost savings by eliminating their manual labor efforts in markets and applications such as digital photography, medical imaging, business services, law enforcement and video workflows. As Rimage’s sales within North America and Europe have averaged 92% of total sales over the past three years, the strength of the economies in these regions plays an important role in determining the success of Rimage.
Rimage earns revenues through the sale of equipment, consumables and parts (included in product revenues on the accompanying consolidated statements of income), as well as maintenance contracts, repair and installation services (included as service revenues on the consolidated statements of income). Rimage’s recurring revenues (consumables, parts, maintenance contracts and service) comprised approximately 60%, 61% and 48% of its consolidated revenues in 2009, 2008 and 2007, respectively. Exclusive of a small amount of capital lease obligations, Rimage has no long-term debt and does not require significant capital investment as all fabrication of its products is outsourced to vendors.
Revenues. Total revenues were $83.2 million for 2009, reflecting a 9% decline from total revenues of $91.4 million in 2008, which reflected a decline of 16% from total revenues of $108.9 million in 2007.
The $8.2 million reduction in total revenues from 2008 to 2009 reflects a $9.6 million or 12% decrease in product revenues, partially offset by an increase in service revenues of $1.4 million or 17%. The decrease in product revenues resulted from a $6.5 million reduction in sales of consumable products and a $3.1 million reduction in sales of equipment. The decrease in consumable product sales consisted of a $3.7 million decline in the volume of ribbon and ink cartridge sales and a $2.8 million reduction in media and media kit sales. The current year decline in sales of consumable products was primarily attributable to a reduction in sales in the retail market segment of $4.0 million, impacted by the economy-related reductions in consumer demand. Also contributing to the current year decrease in sales of consumable products was a $1.1 million reduction in sales to the Company’s U.S. channel partners. The overall decline in equipment sales in the current year period was primarily impacted by a reduced volume of sales in the Company’s European market of $3.6 million, spurred by lower sales of Producer product line equipment and the impact of fluctuations in the Euro relative to the U.S. dollar. The reduction in equipment sales in the current period was also impacted by a shift in the distribution of sales to lower-end Producer products, which have lower average selling prices than higher-end Producer product line equipment. The partially offsetting growth in service revenues of $1.4 million was impacted by increased coverage of the Company’s installed base of systems with maintenance contracts, driven primarily by new and renewed maintenance contract in the retail market segment. Recurring revenues comprised 60% of total revenues for the year ended December 31, 2009, compared to 61% in the prior year period. Sales of Producer product line equipment comprised 34% of total revenues in 2009, compared to 33% in the prior-year period.
16
Remaining revenues in each year were generated by sales of Desktop product line equipment, representing 6% of revenues in 2009 and 2008.
The reduction in total revenues from 2007 to 2008 of $17.5 million resulted from an $18.2 million or 18% decline in product revenues, partially offset by a $0.7 million or 8% increase in service revenues. The reduction in product revenues resulted primarily from a 36% or $20.2 million decrease in the volume of sales of Producer and Desktop product line equipment, largely driven by a decline in equipment sales in the Company’s retail market segment. Sales in the retail market segment can fluctuate significantly between periods because the Company’s retail customers make purchases at various times with orders of unequal size at irregularly spaced intervals. Also contributing to the decline in equipment sales from 2007 to 2008 was a decrease in sales to the Company’s U.S. channel partners. The lower volume and concentration of sales in the retail market segment in 2008 helped drive an increase in average selling prices on Producer product line equipment, partially offsetting the impact on revenue of a decreased volume of equipment sales. Also partially offsetting the decrease in equipment sales was growth in recurring revenues of $2.7 million, consisting primarily of a rise in consumables revenues of $2.1 million and an increase in service revenues of $0.7 million. The growth in recurring revenues was primarily due to the continued expansion of the Company’s installed base of publishing systems and the Company’s increased emphasis on promoting this portion of its business.
International sales decreased 11% in 2009 from 2008 and comprised 41% of total sales, compared to 42% in 2008 and 36% in 2007. The decline in international sales in the current year was driven by a 16% reduction in sales in the Company’s European market, partially offset by sales growth in the Company’s Asian markets of 20%. Without the impact of currency fluctuations affecting the Company’s European and Japanese operations, international revenues decreased by 8% in 2009 relative to 2008. The European market continued to generate the majority of international sales. Currency fluctuations affecting the Company’s European and Japanese operations decreased consolidated revenues in 2009 by 1.4% relative to 2008 and increased consolidated revenues by 2.8% in 2008 relative to 2007.
Revenue levels in 2010 will be dependent upon many factors, including the effectiveness of changes that will occur effective April 1, 2010 to improve the efficiency of the Company’s sales channels. As part of this change, Rimage will be terminating its distributor relationships with distributors in the United States, Germany, and the United Kingdom and will sell products in these regions to end-user customers primarily through value-added resellers or other strategic partners and also directly to select accounts through its own sales force. Other factors that will influence revenue levels in 2010 include the performance of the Company’s channel partners, the timing of new product introductions, the rate of adoption of new applications for the Company’s products in its targeted markets, the impact of changes in economic conditions and the impact of foreign currency exchange rate fluctuations.
Gross Profit. Gross profit as a percentage of total revenues was 48.5% for the year ended December 31, 2009, compared to 43.4% and 47.0% for the years ended December 31, 2008, and 2007, respectively.
The increase in gross profit as a percentage of total revenues in 2009 relative to 2008 resulted primarily from an improvement in service margins, impacted by growth in maintenance contract revenues largely within the retail market segment. Additionally, service costs decreased as a result of lower compensation costs stemming from a reduced workforce in 2009 and a reduction in support costs for service parts and freight as a result of corporate initiatives which reduced the number of maintenance exchanges. Also contributing to the increase in gross profit as a percentage of revenues in 2009 was a reduction in sales rebates from sales incentive and other programs. Partially offsetting the favorable impact in 2009 of the changes described above was a reduced volume and concentration of higher margin product sales, including higher-end systems in the Producer product line and ribbons and ink cartridges.
The decline in gross profit as a percentage of total revenues in 2008 relative to 2007 resulted primarily from a reduction in product margins, stemming from a shift in the distribution of sales to lower margin products. This shift was driven largely by a reduced volume and concentration of Producer product line equipment sales, which generally carry higher gross margins than Desktop product line equipment or recurring revenues. Sales in 2008 also included an increased volume and concentration of sales of media and media kits, which generally carry lower margins than other product offerings, comprising 21% of revenues in 2008, compared to 14% in 2007. Also contributing to the decline in gross profit as a percentage of revenues in 2008 was the impact of service costs increasing at a faster pace than the associated service revenues, impacted by investments to strengthen the service support infrastructure of the Company’s subsidiaries and increased fuel costs. Partially offsetting the unfavorable impact of changes in product mix and increased service costs was an overall improvement in equipment margins primarily as a result of higher average selling prices on Producer equipment configurations, influenced by the lower concentration of sales in the retail market segment. Additionally, the gross margin in 2008 benefited from reductions in compensation related costs resulting from a workforce reduction in the second quarter 2008 in the Company’s U.S. operations. Gross profit as a percentage of revenues was also favorably impacted in 2008 by reduced inventory related charges to cost of revenues of approximately $0.3 million relative to 2007.
Future gross profit margins will continue to be affected by many factors, including the impact of planned changes in the Company’s sales distribution model described above, product mix, the timing of new product introductions, changes in material costs, manufacturing volume, the growth rate of service related revenues relative to associated service support costs and foreign currency exchange rate fluctuations.
17
Operating Expenses. Research and development expenses were $7.1 million, $5.3 million and $5.9 million for the years ended December 31, 2009, 2008 and 2007, respectively, representing 8.6%, 5.7% and 5.4% of revenues, respectively.
The 36% increase in research and development expense from 2008 to 2009 was primarily due to $2.3 million in expenses incurred in 2009 as part of a development arrangement with a third party supplier to develop a new product scheduled to launch during the first quarter of 2010. Partially offsetting this increase was the impact in 2009 of a 7% reduction in average headcount. A lower level of development expenses was incurred in 2008 to support activities associated with the projects described below.
The 11% reduction in research and development expenses from 2007 to 2008 was primarily due to the timing of activities associated with new product development projects and enhancements to existing products. Expenses in 2008 included costs to support the introduction of the Rimage 6100 system, a new Producer series product, and modifications to the operating system software used in Rimage publishing systems to facilitate usage of the Company’s products in a customer’s Macintosh-based environment. Higher levels of development expenses were required in 2007 to support introduction of the Professional Series line of Producer products and other products under development.
Rimage anticipates its expenditures in research and development in 2010 will remain similar to the levels experienced during 2009 to support a sustained level of new product development initiatives and improve existing products.
Selling, general and administrative expenses for the years ended December 31, 2009, 2008 and 2007 were $21.9 million, $22.7 million and $24.4 million, respectively, representing 26.4%, 24.8% and 22.4% of revenues, respectively.
The 3.2% decline in selling, general and administrative expenses in 2009 compared to 2008 was primarily impacted by cost reduction measures implemented during 2008 and early 2009, including reduced employee compensation related costs of approximately $1.8 million stemming from workforce reductions and reduced expenditures for travel and marketing and promotional programs approximating $0.9 million. Also contributing to the decline in expenses was the net impact of currency fluctuations primarily affecting the Company’s European operations, reducing selling, general and administrative expenses by $0.2 million. Partially offsetting the reductions in expenses described above were higher expenses associated with incentive bonus compensation of approximately $1.2 million resulting from above plan operating performance in 2009, compensation related expenses associated with the retirement of the outgoing Chief Executive Officer of $0.6 million, and compensation expenses associated with the hire in 2009 of two new executive officers.
The 7% decline in selling, general and administrative expenses in 2008 compared to 2007 was primarily impacted by a reduction in bonus related expenses approximating $1.1 million, stemming from below plan revenue and operating income. Also contributing to the decline in expenses were reduced expenditures for marketing and promotional programs of approximately $0.6 million, lower stock-based compensation costs of $0.5 million and reduced consulting related expenses of $0.3 million, primarily stemming from the Company’s implementation in the prior year’s first quarter of a new enterprise resource planning (“ERP”) system in its European operation. Additionally, cost savings from workforce reductions, net of severance related costs, amounted to approximately $0.15 million in 2008. Partially offsetting the reductions in expenses described above was the impact of currency fluctuations affecting the Company’s European and Japanese operations, increasing selling, general and administrative expenses by $0.6 million in 2008 relative to 2007. Also partially offsetting the decline in 2008 expenses was a 9% increase in average sales and general and administrative headcount in the Company’s U.S. operations, resulting in higher salaries and travel related expenses relative to 2007.
Other Income, Net. The Company recognized interest income on cash and marketable securities of $1.5 million, $2.8 million and $3.5 million in 2009, 2008 and 2007, respectively. The reduction in interest income in 2009 relative to 2008 was the result of a decline of approximately one and a half percentage points in the effective yield on the Company’s investment portfolio, partially offset by higher average cash and marketable securities balances of $9.4 million. The reduction in interest income in 2008 relative to 2007 was the result of an approximate decline of one percentage point in the effective yield on the Company’s investment portfolio, partially offset by higher average cash and marketable securities balances of $7.9 million. See “Liquidity and Capital Resources” below for a discussion of changes in cash levels.
Income Taxes. The provision for income taxes represents federal, state, and foreign income taxes on income. For the years ended December 31, 2009, 2008 and 2007, income tax expense amounted to $4.6 million, $5.0 million and $8.6 million, respectively, representing 35.2%, 34.8% and 35.4% of income before income taxes, respectively. The rise in the effective tax rate in 2009 relative to 2008 primarily reflects the impact of tax-exempt interest income comprising a smaller percentage of pre-tax income and higher state income taxes affected primarily by changes in certain state tax apportionment factors. Partially offsetting the unfavorable effect of the above was the impact in 2009 of the implementation of recommendations of a transfer price study which reduced U.S. pre-tax income as a result of a re-allocation to the U.S. parent company of expenses incurred in the Company’s Japanese subsidiary to properly reflect expenses for each legal entity. The reduction in the effective income tax rate in 2008 relative to 2007 primarily reflects the impact of reduced state income taxes as a result of reductions in certain state tax apportionment rates, the impact of tax-exempt interest income comprising a larger percentage of pre-tax income and the impact of a lower tax bracket. Partially offsetting the above
18
reductions in 2008 was the impact of recording no tax benefit on increased foreign operating losses in the Company’s Japanese subsidiary and reduced benefits from the manufacturer’s tax deduction and federal research credit.
Net Income / Net Income Per Share. Net income for the years ended December 31, 2009, 2008 and 2007 amounted to $8.5 million, $9.4 million and $15.8 million, representing 10.2%, 10.3% and 14.5% of revenues, respectively. Related net income per diluted share amounts were $0.89 in 2009, $0.97 in 2008 and $1.52 in 2007.
Liquidity and Capital Resources
The Company expects it will be able to maintain current operations, including anticipated capital expenditure requirements, through its internally generated funds and, if required, from Rimage’s existing credit agreement. The credit agreement allows for advances under an unsecured revolving loan up to a maximum advance of $10 million. At December 31, 2009, no amounts were outstanding under the credit agreement.
At December 31, 2009, the Company had working capital of $103.2 million, an increase of $41.0 million from working capital reported at December 31, 2008. The increase was primarily the result of the impact of a non-cash change in the classification of $26.4 million of marketable securities from non-current as of December 31, 2008 to current as of December 31, 2009, the sale of $6.8 million of non-current marketable securities and corresponding purchase of current marketable securities and net income of $8.5 million. The change in the classification of marketable securities occurred as the remaining term to maturity for these securities is twelve months or less as of December 31, 2009.
On October 17, 2007, the Company’s Board of Directors authorized the repurchase of up to 500,000 shares of its common stock. In February 2008, the Company’s Board of Directors increased the share repurchase authorization by an additional 500,000 shares, bringing total shares authorized for repurchase to 1,000,000. Shares may be purchased at prevailing market prices in the open market or in private transactions, subject to market conditions, share price, trading volume and other factors. The repurchase program may be discontinued at any time. The Company will finance the purchase of the shares using cash on hand. During 2009, the Company did not repurchase any shares of its common stock. The Company also intends on utilizing its assets for its continued organic growth and potential future strategic initiatives or alliances.
Net cash provided by operating activities totaled $14.2 million, $12.2 million and $26.1 million for the years ended December 31, 2009, 2008 and 2007, respectively. The $2.0 million increase in cash provided by operating activities in 2009 relative to 2008 resulted from changes in operating assets and liabilities producing a $3.5 million larger increase in cash, partially offset by a $1.5 million reduction in net income adjusted for non-cash and non-operating items. Primarily contributing to the change in operating assets and liabilities was a $6.0 million favorable change in the aggregate amount of trade accounts payable, accrued compensation and other accrued expenses and a $2.5 million favorable change in deferred income, partially offset by a $5.9 million unfavorable change in receivables. The changes in trade accounts payable, accrued compensation and accrued expenses reflect a $1.6 million aggregate increase in the amount of these balances in the current year, compared to a $4.4 million aggregate decrease in 2008. These changes were primarily due to increased accruals in 2009 for costs related to a development project and reduced inventory purchases, in the case of accounts payable, and increased bonus accruals, in the case of accrued compensation. The favorable change in deferred income resulted from a larger volume of new maintenance contracts or renewals in 2009 compared to 2008, impacted primarily by significant renewals in the retail market segment in 2009. The unfavorable change in receivables resulted from a $2.6 million increase in related balances in 2009 compared to a $3.3 million decrease in 2008, primarily impacted by a $3.4 million increase in sales from December 2008 to December 2009, compared to a $2.6 million decline in sales between December 2007 and December 2008.
Investing activities provided a net increase in cash of $42.2 million for the year ended December 31, 2009, compared to a net increase in cash of $2.7 million and a net use of cash of $18.7 million for the years ended December 31, 2008 and 2007, respectively. Cash provided by or used in investing activities for each year primarily reflects maturities and sales of marketable securities, net of purchases of marketable securities. Maturities and sales of marketable securities, net of related purchases, generated a net increase in cash and cash equivalents of $42.6 million and $7.0 million in 2009 and 2008, respectively, compared to purchases of marketable securities, net of related maturities, generating a net use of cash and cash equivalents of $17.6 million in 2007. Investing activities also included purchases of property and equipment of $0.4 million in 2009, $4.4 million in 2008 and $1.3 million in 2007. Capital expenditures in 2009 included purchases of office equipment, manufacturing tooling and information technology related infrastructure. Purchases in 2008 consisted primarily of the purchase of the Company’s U.S. corporate headquarters and manufacturing facility ($3.9 million), previously leased by the Company, and purchases of manufacturing tooling and office equipment. Expenditures in 2007 consisted primarily of costs capitalized as part of the implementation of an enterprise resource planning system and purchases of manufacturing tooling. In 2010, the Company expects capital expenditure related investments to primarily support the Company’s production and information technology infrastructure related requirements. Capital expenditures in 2010 are expected to range from $3.5 million to $4.0 million, including $2.4 million for production tooling capitalized by the Company in late 2009 associated with a new product scheduled to launch during the first quarter of 2010.
Financing activities generated net cash of $1.3 million in 2009 and used net cash of $7.4 million in 2008 and $8.7 million in 2007. The significant net use of cash in financing activities in 2008 and 2007 was primarily attributable to the Company’s repurchase of shares of
19
its common stock, requiring $9.6 million of cash to purchase 577,083 shares in 2008 and $12.6 million to repurchase 500,000 shares in 2007. Financing activities in each year included proceeds from employee stock plans of $1.2 million, $1.6 million and $2.8 million, respectively. Additionally, financing activities in each year include excess tax benefits recognized as an addition to the Additional Paid-in Capital (“APIC”) pool of $0.1 million in 2009, $0.7 million in 2008 and $1.2 million in 2007. Such amounts are required to be reported as an addition to financing activities and a reduction in operating activities in the Statements of Cash Flows.
A summary of Rimage’s contractual obligations for minimum lease payments under non-cancelable operating or capital leases and income tax liabilities under FIN 48 at December 31, 2009 is as follows (in thousands):
|
|
|
|
|
|
|
|
|
|
|
|
|
|
|
|
|
|
|
|
|
|
|
|
Payments due by period |
|
||||||||||||||||
|
Contractual Obligations |
|
Total |
|
2010 |
|
2011 |
|
2012 |
|
2013 |
|
2014 |
|
||||||
|
Operating leases |
|
$ |
662 |
|
$ |
439 |
|
$ |
202 |
|
$ |
20 |
|
$ |
1 |
|
$ |
— |
|
|
Capital leases (1) |
|
|
111 |
|
|
23 |
|
|
23 |
|
|
23 |
|
|
23 |
|
|
19 |
|
|
Income tax liabilities under FIN 48 (2) |
|
|
— |
|
|
— |
|
|
— |
|
|
— |
|
|
— |
|
|
— |
|
|
Total contractual cash obligations |
|
$ |
773 |
|
$ |
462 |
|
$ |
225 |
|
$ |
43 |
|
$ |
24 |
|
$ |
19 |
|
|
|
|
|
|
|
(1) |
Amounts include principal and interest. |
|
|
|
|
|
|
(2) |
The Company does not currently expect any income tax liabilities accrued under FIN 48 as of December 31, 2009 to be paid to the applicable tax authorities in 2010. The full balance of unrecognized tax benefits under FIN 48 of $364,000 at December 31, 2009 has been excluded from the above table as the period of payment or reversal cannot be reasonably estimated. This amount is before reduction for deferred federal benefits of uncertain tax positions and also excludes potential interest and penalties. |
Management utilizes its technical knowledge, cumulative business experience, judgment and other factors in the selection and application of the Company’s accounting policies. The accounting policies described below are considered by management to be the most critical to the presentation of the consolidated financial statements because they require the most difficult, subjective and complex judgments. In applying the critical accounting policies described below, management reassesses its estimates each reporting period based on available information. Changes in such estimates did not have a significant impact on earnings for the year ended December 31, 2009.
Revenue Recognition. Revenue for product sales (including hardware and consumables), which do not include any requirement for installation or training, is recognized on shipment, at which point the following criteria have been satisfied:
|
|
|
|
|
|
• |
Persuasive evidence of an arrangement exists. Orders are received for all sales and sales invoices are mailed on shipment. |
|
|
|
|
|
|
• |
Delivery has occurred. Product has been transferred to the customer or the customer’s designated delivery agent, at which time title and risk of loss transfers. |
|
|
|
|
|
|
• |
The vendor’s price is fixed or determinable. All sales prices are fixed at the time of the sale (shipment). |
|
|
|
|
|
|
• |
Collectability is probable. All sales are made on the basis that collection is expected in line with the Company’s standard payment terms, which are consistent with industry practice in the geographies in which the Company markets its products. |
A standard product sale by the Company does not require a commitment on the Company’s part to provide installation, set-up or training. When such services are requested, value-added resellers generally arrange and perform the service directly with the customer, with no financial interest or obligation on the part of the Company. In the limited situations in which the Company does provide installation or training services for customers, the Company charges separately for the service based upon its published list prices and recognizes the associated service revenue upon the successful completion of the service.
The Company records an allowance for sales returns from its customers. The amount of the allowance is based upon historical trends, timing of new product introductions and other factors. A return policy is in place with certain of the Company’s distributors to restrict the volume of returned products, and the Company reviews the distributors’ inventory to ensure compliance with the return policy.
As part of its product offering, the Company sells separately priced maintenance agreements that are valued based on the amount invoiced for the service. Revenue associated with all other elements in a multiple element arrangement is allocated among the separate accounting units based on the residual method. Under the residual method, the arrangement revenue is allocated to undelivered elements based on the fair value of such undelivered elements and the residual amount of revenue is allocated to the delivered elements.
20
Allowance for Doubtful Accounts. The Company records an allowance for doubtful accounts for potentially uncollectible receivables. The allowance is established based on a specific assessment of accounts with known collection exposure, based upon a review of the age of the receivable, the customer’s payment history, the customer’s financial condition and industry and general economic conditions, as well as a general assessment of collection exposure in the remaining receivable population based upon bad debt history. Actual bad debt exposure could differ significantly from management’s estimates if economic conditions worsened for the Company’s customers.
Inventory Provisions. The Company records provisions for inventory shrinkage and for potential excess, obsolete and slow moving inventory. The amounts of these provisions are based upon usage, historical loss trends, inventory levels, expected product lives and forecasted sales demand. Results could be materially different if demand for the Company’s products decreased because of economic or competitive conditions, or if products became obsolete because of technical advancements in the industry or by the Company.
Income Taxes. The Company is required to estimate income taxes in each of the jurisdictions in which it operates. This process involves estimating actual current tax expense and assessing temporary differences resulting from differing treatment of items for book and tax purposes. These temporary differences result in deferred tax assets and liabilities, which are included in the consolidated balance sheets. Management records a valuation allowance to reduce its deferred tax assets to the amount that is more likely than not to be realized. Increases in the valuation allowance result in the recognition of additional income tax expense. Income tax expense could be materially different from actual results because of changes in management’s expectations regarding future taxable income, the relationship between book and taxable income and tax planning strategies employed by the Company. As of December 31, 2009, the Company carried a valuation allowance of $0.9 million to reduce the full tax benefit of a loss carryforward for a subsidiary in Japan established in May 2005.
Management recognizes a tax accrual for estimated exposures associated with uncertain tax positions and adjusts this accrual in light of changing facts and circumstances. However, due to the complexity of some of these uncertainties, the ultimate settlement may result in payments that are significantly different from management’s current estimate of tax liabilities, resulting in the recognition of additional charges or benefits to income tax expense. As of December 31, 2009, the Company recognized tax liabilities of $259,000 and $30,000, before reduction for the federal benefit for state income tax related amounts and a valuation allowance on a foreign loss carryforward, for new uncertainties related to prior and current year income tax positions, respectively. As of December 31, 2009, the Company reversed gross tax liabilities, exclusive of interest and penalties, amounting to $62,000 associated with income tax settlements and $224,000 for prior year tax positions. The decrease of $224,000 is primarily offset by a deferred tax asset of $217,000.
Stock-Based Compensation. The Company accounts for stock-based awards using the modified prospective method. Under this method, the Company recognizes compensation expense on a straight-line basis over the vesting period for all stock-based awards granted on or after January 1, 2006, and for previously granted awards not yet vested as of January 1, 2006. The Company recognized stock-based compensation costs of approximately $1.5 million, $1.1 million and $1.6 million for the years ended December 31, 2009, 2008 and 2007, respectively.
During the year ended December 31, 2006, the Company granted 16,967 performance shares to certain managerial and executive employees under the 1992 Plan, with performance criteria established based on revenue and operating income goals for calendar year 2008. Performance share awards are valued based on the market value of the Company’s shares on the date of grant, which is equal to the intrinsic value of the shares on that date. Compensation cost for awards with a performance condition is recognized pro-ratably over the performance period, once achievement of performance criteria is deemed probable. The Company assessed the probability of the achievement of performance criteria associated with the performance shares as probable during 2006 and the first half of 2007. As such, the total fair value of the performance shares of approximately $372,000 was being recognized as compensation expense over the performance period ending December 31, 2008. During the third quarter of 2007, the Company changed its assessment of achieving the performance criteria from probable to improbable. Accordingly, the Company reversed all compensation expense recorded in prior periods for the 2006 performance shares during the third quarter of 2007, amounting to approximately $111,000, of which $41,000 related to expense recorded in 2006. As the revenue and operating income goals for calendar year 2008 were not achieved, all performance shares were cancelled and employees received no common stock for the cancelled performance shares.
The Company utilizes a Black-Scholes option pricing model to estimate the fair value of each stock option award on the date of grant. The Black-Scholes model requires the input of certain assumptions that involve management judgment. Key assumptions that affect the calculation of fair value include the expected life of stock-based awards and the Company’s historical stock price volatility. Additionally, the Company is required to estimate the expected forfeiture rate of unvested awards and recognize expense for only those shares expected to vest. The assumptions used in calculating the fair value of stock-based awards and the forfeiture rate of such awards reflect management’s best estimates. However, circumstances may change and additional data may become available over time, which could result in changes to these assumptions that materially impact the fair value determination of future awards or their estimated rate of forfeiture. If assumptions change for future stock-based awards, the compensation expense recorded may differ significantly from the expense recorded in the current period.
21
See Note 3 under the Notes to Consolidated Financial Statements in this Form 10-K for additional information on stock-based compensation.
Impairment of Long-lived Assets. Long-lived assets at December 31, 2009 consisted of property and equipment. The Company reviews the carrying amount of its long-lived assets when events or changes in circumstances such as market value, asset utilization, physical change, legal factors or other matters indicate that the carrying amount of the assets may not be recoverable. When this review indicates the carrying amount of an asset or asset group exceeds the sum of the future undiscounted cash flows expected to be generated by the assets, the Company recognizes an asset impairment charge against operations for the amount by which the carrying amount of the impaired asset exceeds its fair value. Considerable judgment is required in the evaluation of whether certain events or circumstances lead to an indication of impairment, and in the assumptions used in determining the amount and period over which future revenues are expected to be earned, related costs, terminal values and discount rates. No impairment charges were recognized by the Company during the year ended December 31, 2009.
In September 2009, the FASB ratified its guidance on two revenue recognition standards that will become effective for the Company beginning January 1, 2011, with earlier adoption permitted. Under the new guidance on revenue arrangements with multiple deliverables, when vendor specific objective evidence or third party evidence for deliverables in an arrangement cannot be determined, a best estimate of the selling price is required to separate deliverables and allocate arrangement consideration using the relative selling price method. Under the new guidance on arrangements that include software elements, tangible products that have software components that are essential to the functionality of the tangible product will no longer be within the scope of the software revenue recognition guidance, and software-enabled products will now be subject to the new guidance for multiple deliverable arrangements discussed above. In the initial year of application, companies are required to make qualitative and quantitative disclosures about the impact of the changes under both standards. The Company is currently evaluating the impact that this guidance will have on its consolidated financial statements and related disclosures.
Rimage maintains a website at www.rimage.com. Its annual reports on Form 10-K, quarterly reports on Form 10-Q, current reports on Form 8-K filed or furnished pursuant to Section 13(a) or 15(d) of the Securities Exchange Act of 1934, are available on its website, as soon as reasonably practicable after these documents are filed with the SEC. To obtain copies of these reports, go to www.rimage.com and click on “Investor Relations,” then click on “EDGAR Filings.” A copy of any report filed by the Company with the SEC will also be furnished without charge to any shareholder who requests it in writing to: Secretary, Rimage Corporation 7725 Washington Avenue South, Minneapolis, Minnesota 55439.
|
|
|
|
QUANTITATIVE AND QUALITATIVE DISCLOSURES ABOUT MARKET RISK |
Foreign Currency Translation. The Company is exposed to market risk from foreign exchange rate fluctuations of the European Euro and Japanese Yen to the U.S. dollar as the financial position and operating results of the Company’s German and Japanese subsidiaries, Rimage Europe GmbH and Rimage Japan Co., Ltd., respectively, are translated into U.S. dollars for consolidation. Resulting translation adjustments are recorded as a separate component of stockholders’ equity.
Derivative Financial Instruments. The Company enters into forward exchange contracts principally to hedge inter-company receivables denominated in Euros arising from sales to its subsidiary in Germany. Gains or losses on forward exchange contracts are calculated at each period end and are recognized in net income in the period in which they arose. The Company records the fair value of its open forward foreign exchange contracts in other current assets or other current liabilities depending on whether the net amount is a gain or a loss. The Company does not utilize financial instruments for trading or other speculative purposes.
22
Exchange Rate Sensitivity. The table below summarizes information on foreign currency forward exchange agreements that are sensitive to foreign currency exchange rates. For these foreign currency forward exchange agreements, the table presents the notional amounts and weighted average exchange rates by expected (contractual) maturity dates. These notional amounts generally are used to calculate the contractual payments to be exchanged under the contract.
|
|
|
|
|
|
|
|
|
|
|
|
|
|
|
|
|
|
|
|
|
|
|
|
|
|
|
Expected Maturity or Transaction Date |
|
|
|
|||||||||||||||||
|
|
|
2010 |
|
2011 |
|
2012 |
|
2013 |
|
There- |
|
Total |
|
Fair |
|
|||||||
|
|
|
(US$ Equivalent in Thousands) |
|
|
||||||||||||||||||
|
Anticipated Transactions and |
|
|
|
|
|
|
|
|
|
|
|
|||||||||||
|
|
|
|
|
|
|
|
|
|
|
|
|
|
|
|
|
|
|
|
|
|
|
|
|
Forward Exchange Agreements (Receive $US/Pay €) |
|
|
|
|
|
|
|
|
|
|
|
|
|
|
|
|
|
|
|
|
|
|
|
Contract Amount |
|
$ |
550 |
|
|
— |
|
|
— |
|
|
— |
|
|
— |
|
$ |
550 |
|
$ |
17 |
|
|
Average Contractual |
|
|
1.4779 |
|
|
— |
|
|
— |
|
|
— |
|
|
— |
|
|
1.4779 |
|
|
|
|
A hypothetical 10% appreciation or depreciation in the value of the U.S. dollar relative to the Euro as of December 31, 2009, assuming all other variables are held constant, would result in a larger gain or loss in fair value of approximately $53,000, respectively, than that reflected above as of December 31, 2009.
|
|
|
|
FINANCIAL STATEMENTS AND SUPPLEMENTARY DATA |
Financial Statements
|
|
|
|
|
|
|
|
Page in Annual |
|
|
|
|
|
|
|
Management’s Report on Internal Control over Financial Reporting |
|
24 |
|
|
|
|
|
|
|
|
25 - 26 |
|
|
|
|
|
|
|
|
Consolidated Balance Sheets as of December 31, 2009 and 2008 |
|
27 |
|
|
|
|
|
|
|
Consolidated Statements of Income for the years ended December 31, 2009, 2008 and 2007 |
|
28 |
|
|
|
|
|
|
|
|
29 |
|
|
|
|
|
|
|
|
Consolidated Statements of Cash Flows for the years ended December 31, 2009, 2008 and 2007 |
|
30 |
|
|
|
|
|
|
|
|
31 - 49 |
|
|
23
Management’s Report on Internal Control over Financial Reporting
The Board of
Directors and Stockholders
Rimage Corporation:
Management is responsible for establishing and maintaining adequate internal control over financial reporting as defined in Rules 13a15-(f) and 15d-15(f) under the Securities Exchange Act of 1934. The Company’s internal control over financial reporting is a process designed to provide reasonable assurance regarding the reliability of financial reporting and the preparation of financial statements for external purposes in accordance with generally accepted accounting principles. A company’s internal control over financial reporting includes those policies and procedures that:
|
|
|
|
|
|
(i) |
pertain to the maintenance of records that, in reasonable detail, accurately and fairly reflect the transactions and dispositions of the assets of the Company; |
|
|
|
|
|
|
(ii) |
provide reasonable assurance that transactions are recorded as necessary to permit preparation of financial statements in accordance with generally accepted accounting principles, and that receipts and expenditures of the Company are being made only in accordance with authorizations of management and directors of the Company; and |
|
|
|
|
|
|
(iii) |
provide reasonable assurance regarding prevention or timely detection of unauthorized acquisition, use or disposition of the Company’s assets that could have a material effect on the financial statements. |
Because of its inherent limitations, internal control over financial reporting may not prevent or detect misstatements. Also, projections of any evaluation of effectiveness to future periods are subject to the risk that controls may become inadequate because of changes in conditions, or that the degree of compliance with the policies or procedures may deteriorate.
Under the supervision of our chief executive officer and our chief financial officer, we conducted an evaluation of the effectiveness of our internal control over financial reporting based on the framework in Internal Control – Integrated Framework issued by the Committee of Sponsoring Organizations of the Treadway Commission (COSO). Based on our assessment and those criteria, management believes that the Company maintained effective internal control over financial reporting as of December 31, 2009. Our independent registered public accounting firm, KPMG LLP, has issued an audit report on the effectiveness of our internal control over financial reporting, which report is included in this Form 10-K.
24
Report of Independent Registered Public Accounting Firm
The Board of
Directors and Stockholders
Rimage Corporation:
We have audited the accompanying consolidated balance sheets of Rimage Corporation and subsidiaries as of December 31, 2009 and 2008 and the related consolidated statements of income, stockholders’ equity and comprehensive income, and cash flows for each of the years in the three-year period ended December 31, 2009. In connection with our audits of the consolidated financial statements, we have also audited the financial statement schedule for each of the years in the three-year period ended December 31, 2009, listed in schedule II of this Form 10-K. These consolidated financial statements and financial statement schedule are the responsibility of the Company’s management. Our responsibility is to express an opinion on these consolidated financial statements and financial statement schedule based on our audits.
We conducted our audits in accordance with the standards of the Public Company Accounting Oversight Board (United States). Those standards require that we plan and perform the audit to obtain reasonable assurance about whether the financial statements are free of material misstatement. An audit includes examining, on a test basis, evidence supporting the amounts and disclosures in the financial statements. An audit also includes assessing the accounting principles used and significant estimates made by management, as well as evaluating the overall financial statement presentation. We believe that our audits provide a reasonable basis for our opinion.
In our opinion, the consolidated financial statements referred to above present fairly, in all material respects, the financial position of Rimage Corporation and subsidiaries as of December 31, 2009 and 2008, and the results of their operations and their cash flows for each of the years in the three-year period ended December 31, 2009, in conformity with U.S. generally accepted accounting principles. Also in our opinion, the related financial statement schedule referred to above, when considered in relation to the basic consolidated financial statements taken as a whole, presents fairly, in all material respects, the information set forth therein.
We also have audited, in accordance with the standards of the Public Company Accounting Oversight Board (United States), Rimage Corporation’s internal control over financial reporting as of December 31, 2009, based on criteria established in Internal Control – Integrated Framework issued by the Committee of Sponsoring Organizations of the Treadway Commission (COSO), and our report dated March 12, 2010, expressed an unqualified opinion on the effectiveness of the Company’s internal control over financial reporting.
|
|
|
|
KPMG LLP |
|
|
|
|
|
Minneapolis, Minnesota |
|
|
March 12, 2010 |
|
25
Report of Independent Registered Public Accounting Firm
The Board of
Directors and Stockholders
Rimage Corporation:
We have audited Rimage Corporation and subsidiaries’ (the company) internal control over financial reporting as of December 31, 2009, based on criteria established in Internal Control – Integrated Framework issued by the Committee of Sponsoring Organizations of the Treadway Commission (COSO). The Company’s management is responsible for maintaining effective internal control over financial reporting and for its assessment of the effectiveness of internal control over financial reporting, included in the accompanying Management’s Report on Internal Control over Financial Reporting. Our responsibility is to express an opinion on the Company’s internal control over financial reporting based on our audit.
We conducted our audit in accordance with the standards of the Public Company Accounting Oversight Board (United States). Those standards require that we plan and perform the audit to obtain reasonable assurance about whether effective internal control over financial reporting was maintained in all material respects. Our audit included obtaining an understanding of internal control over financial reporting, assessing the risk that a material weakness exists, and testing and evaluating the design and operating effectiveness of internal control based on the assessed risk. Our audit also included performing such other procedures as we considered necessary in the circumstances. We believe that our audit provides a reasonable basis for our opinion.
A company’s internal control over financial reporting is a process designed to provide reasonable assurance regarding the reliability of financial reporting and the preparation of financial statements for external purposes in accordance with generally accepted accounting principles. A company’s internal control over financial reporting includes those policies and procedures that (1) pertain to the maintenance of records that, in reasonable detail, accurately and fairly reflect the transactions and dispositions of the assets of the company; (2) provide reasonable assurance that transactions are recorded as necessary to permit preparation of financial statements in accordance with generally accepted accounting principles, and that receipts and expenditures of the company are being made only in accordance with authorizations of management and directors of the company; and (3) provide reasonable assurance regarding prevention or timely detection of unauthorized acquisition, use, or disposition of the company’s assets that could have a material effect on the financial statements.
Because of its inherent limitations, internal control over financial reporting may not prevent or detect misstatements. Also, projections of any evaluation of effectiveness to future periods are subject to the risk that controls may become inadequate because of changes in conditions, or that the degree of compliance with the policies or procedures may deteriorate.
In our opinion, the Company maintained, in all material respects, effective internal control over financial reporting as of December 31, 2009, based on criteria established in Internal Control – Integrated Framework issued by the Committee of Sponsoring Organizations of the Treadway Commission (COSO).
We also have audited, in accordance with the standards of the Public Company Accounting Oversight Board (United States), the consolidated balance sheets of Rimage Corporation as of December 31, 2009 and 2008, and the related consolidated statements of income, stockholders’ equity and comprehensive income, and cash flows for each of the years in the three-year period ended December 31, 2009, and our report dated March 12, 2010 expressed an unqualified opinion on those consolidated financial statements.
|
|
|
|
KPMG LLP |
|
Minneapolis,
Minnesota
March 12, 2010
26
RIMAGE CORPORATION AND SUBSIDIARIES
Consolidated Balance Sheets
December 31, 2009 and 2008
(In
thousands, except share data)
|
|
|
|
|
|
|
|
|
|
Assets |
|
December 31, |
|
December 31, |
|
||
|
|
|
|
|
|
|
|
|
|
Current assets: |
|
|
|
|
|
|
|
|
Cash and cash equivalents |
|
$ |
72,507 |
|
$ |
14,885 |
|
|
Marketable securities |
|
|
28,581 |
|
|
39,870 |
|
|
Receivables, net of allowance for doubtful accounts and sales returns of $327 and $489, respectively |
|
|
13,732 |
|
|
11,099 |
|
|
Inventories |
|
|
4,123 |
|
|
5,625 |
|
|
Prepaid income taxes |
|
|
— |
|
|
314 |
|
|
Prepaid expenses and other current assets |
|
|
1,271 |
|
|
2,014 |
|
|
Deferred income taxes - current |
|
|
546 |
|
|
344 |
|
|
Total current assets |
|
|
120,760 |
|
|
74,151 |
|
|
|
|
|
|
|
|
|
|
|
Marketable securities - non-current |
|
|
9,037 |
|
|
40,647 |
|
|
Property and equipment, net |
|
|
7,855 |
|
|
6,183 |
|
|
Deferred income taxes - non-current |
|
|
2,630 |
|
|
2,281 |
|
|
Other assets - non-current |
|
|
— |
|
|
194 |
|
|
Total assets |
|
$ |
140,282 |
|
$ |
123,456 |
|
|
|
|
|
|
|
|
|
|
|
Liabilities and Stockholders’ Equity |
|
|
|
|
|
|
|
|
Current liabilities: |
|
|
|
|
|
|
|
|
Trade accounts payable |
|
$ |
6,898 |
|
$ |
4,534 |
|
|
Accrued compensation |
|
|
3,834 |
|
|
1,879 |
|
|
Other accrued expenses |
|
|
911 |
|
|
827 |
|
|
Income taxes payable |
|
|
222 |
|
|
— |
|
|
Deferred income and customer deposits |
|
|
5,706 |
|
|
4,507 |
|
|
Other current liabilities |
|
|
18 |
|
|
263 |
|
|
Total current liabilities |
|
|
17,589 |
|
|
12,010 |
|
|
|
|
|
|
|
|
|
|
|
Long-term liabilities: |
|
|
|
|
|
|
|
|
Deferred income and customer deposits - non-current |
|
|
2,452 |
|
|
1,942 |
|
|
Income taxes payable - non-current |
|
|
213 |
|
|
421 |
|
|
Other non-current liabilities |
|
|
79 |
|
|
35 |
|
|
Total long-term liabilities |
|
|
2,744 |
|
|
2,398 |
|
|
Total liabilities |
|
|
20,333 |
|
|
14,408 |
|
|
|
|
|
|
|
|
|
|
|
Commitments and contingencies (Notes 13 and 17) |
|
|
— |
|
|
— |
|
|
Stockholders’ equity: |
|
|
|
|
|
|
|
|
Preferred stock, $.01 par value, authorized 250,000 shares, no shares issued and outstanding |
|
|
— |
|
|
— |
|
|
Common stock, $.01 par value, authorized 29,750,000 shares, issued and outstanding 9,471,885 and 9,334,435, respectively |
|
|
94 |
|
|
93 |
|
|
Additional paid-in capital |
|
|
40,296 |
|
|
37,484 |
|
|
Retained earnings |
|
|
78,782 |
|
|
70,287 |
|
|
Accumulated other comprehensive income |
|
|
777 |
|
|
1,184 |
|
|
Total stockholders’ equity |
|
|
119,949 |
|
|
109,048 |
|
|
|
|
|
|
|
|
|
|
|
Total liabilities and stockholders’ equity |
|
$ |
140,282 |
|
$ |
123,456 |
|
See accompanying notes to consolidated financial statements.
27
RIMAGE CORPORATION AND SUBSIDIARIES
Consolidated Statements of Income
Years Ended December 31, 2009, 2008 and 2007
(In
thousands, except per share data)
|
|
|
|
|
|
|
|
|
|
|
|
|
|
|
2009 |
|
2008 |
|
2007 |
|
|||
|
Revenues: |
|
|
|
|
|
|
|
|
|
|
|
Product |
|
$ |
72,285 |
|
$ |
81,848 |
|
$ |
100,071 |
|
|
Service |
|
|
10,942 |
|
|
9,546 |
|
|
8,803 |
|
|
Total revenues |
|
|
83,227 |
|
|
91,394 |
|
|
108,874 |
|
|
Cost of revenues: |
|
|
|
|
|
|
|
|
|
|
|
Product |
|
|
35,491 |
|
|
42,382 |
|
|
49,435 |
|
|
Service |
|
|
7,403 |
|
|
9,350 |
|
|
8,285 |
|
|
Total cost of revenues |
|
|
42,894 |
|
|
51,731 |
|
|
57,719 |
|
|
Gross profit |
|
|
40,333 |
|
|
39,663 |
|
|
51,155 |
|
|
|
|
|
|
|
|
|
|
|
|
|
|
Operating expenses: |
|
|
|
|
|
|
|
|
|
|
|
Research and development |
|
|
7,143 |
|
|
5,251 |
|
|
5,903 |
|
|
Selling, general and administrative |
|
|
21,944 |
|
|
22,664 |
|
|
24,371 |
|
|
Total operating expenses |
|
|
29,087 |
|
|
27,915 |
|
|
30,274 |
|
|
|
|
|
|
|
|
|
|
|
|
|
|
Operating income |
|
|
11,246 |
|
|
11,748 |
|
|
20,881 |
|
|
|
|
|
|
|
|
|
|
|
|
|
|
Other income (expense): |
|
|
|
|
|
|
|
|
|
|
|
Interest, net |
|
|
1,542 |
|
|
2,819 |
|
|
3,451 |
|
|
Realized gain on sale of marketable securities |
|
|
278 |
|
|
— |
|
|
— |
|
|
Gain (loss) on currency exchange |
|
|
48 |
|
|
(105 |
) |
|
80 |
|
|
Other, net |
|
|
(2 |
) |
|
(3 |
) |
|
(18 |
) |
|
Total other income, net |
|
|
1,866 |
|
|
2,711 |
|
|
3,513 |
|
|
|
|
|
|
|
|
|
|
|
|
|
|
Income before income taxes |
|
|
13,112 |
|
|
14,459 |
|
|
24,394 |
|
|
Income tax expense |
|
|
4,617 |
|
|
5,028 |
|
|
8,633 |
|
|
Net income |
|
$ |
8,495 |
|
$ |
9,431 |
|
$ |
15,761 |
|
|
|
|
|
|
|
|
|
|
|
|
|
|
Net income per basic share |
|
$ |
0.91 |
|
$ |
0.99 |
|
$ |
1.59 |
|
|
|
|
|
|
|
|
|
|
|
|
|
|
Net income per diluted share |
|
$ |
0.89 |
|
$ |
0.97 |
|
$ |
1.52 |
|
|
|
|
|
|
|
|
|
|
|
|
|
|
Basic weighted average shares outstanding |
|
|
9,374 |
|
|
9,559 |
|
|
9,915 |
|
|
|
|
|
|
|
|
|
|
|
|
|
|
Diluted weighted average shares outstanding |
|
|
9,507 |
|
|
9,729 |
|
|
10,371 |
|
See accompanying notes to consolidated financial statements
28
|
|
|
RIMAGE CORPORATION AND SUBSIDIARIES |
|
Consolidated Statements of Stockholders’ Equity and Comprehensive Income |
|
Years Ended December 31, 2009, 2008, and 2007 |
|
(In thousands) |
|
|
|
|
|
|
|
|
|
|
|
|
|
|
|
|
|
|
|
|
|
|
|
|
|
|
|
|
|
|
|
|
|
|
|
|
Accumulated |
|
|
|
|
|
|
|
|
Common stock |
|
Additional |
|
Retained |
|
|
|
|
|||||||||
|
|
|
Shares |
|
Amount |
|
|
|
|
Total |
|
|||||||||
|
|
|
|
|
|
|
|
|
|
|
|
|
|
|
|
|
|
|
|
|
|
Balance at December 31, 2006 |
|
|
9,925 |
|
$ |
99 |
|
$ |
27,914 |
|
$ |
67,324 |
|
$ |
139 |
|
$ |
95,476 |
|
|
|
|
|
|
|
|
|
|
|
|
|
|
|
|
|
|
|
|
|
|
|
Stock issued for employee stock plans |
|
|
276 |
|
|
3 |
|
|
2,751 |
|
|
— |
|
|
— |
|
|
2,754 |
|
|
Issuance of restricted stock |
|
|
5 |
|
|
— |
|
|
— |
|
|
— |
|
|
— |
|
|
— |
|
|
Income tax reductions relating to exercise of stock options |
|
|
— |
|
|
— |
|
|
1,545 |
|
|
— |
|
|
— |
|
|
1,545 |
|
|
Stock-based compensation |
|
|
— |
|
|
— |
|
|
1,617 |
|
|
— |
|
|
— |
|
|
1,617 |
|
|
Repurchase of common stock |
|
|
(500 |
) |
|
(5 |
) |
|
— |
|
|
(12,623 |
) |
|
— |
|
|
(12,628 |
) |
|
Comprehensive income: |
|
|
|
|
|
|
|
|
|
|
|
|
|
|
|
|
|
|
|
|
Net income |
|
|
— |
|
|
— |
|
|
— |
|
|
15,761 |
|
|
— |
|
|
15,761 |
|
|
Translation adjustment |
|
|
— |
|
|
— |
|
|
— |
|
|
— |
|
|
339 |
|
|
339 |
|
|
Change in unrealized gain from available-for-sale securities, net of taxes of $125 |
|
|
— |
|
|
— |
|
|
— |
|
|
— |
|
|
197 |
|
|
197 |
|
|
Total comprehensive income |
|
|
|
|
|
|
|
|
|
|
|
|
|
|
|
|
|
16,297 |
|
|
|
|
|
|
|
|
|
|
|
|
|
|
|
|
|
|
|
|
|
|
|
Balance at December 31, 2007 |
|
|
9,706 |
|
$ |
97 |
|
$ |
33,827 |
|
$ |
70,462 |
|
$ |
675 |
|
$ |
105,061 |
|
|
|
|
|
|
|
|
|
|
|
|
|
|
|
|
|
|
|
|
|
|
|
Stock issued for employee stock plans |
|
|
201 |
|
|
2 |
|
|
1,548 |
|
|
— |
|
|
— |
|
|
1,550 |
|
|
Issuance of restricted stock |
|
|
5 |
|
|
— |
|
|
— |
|
|
— |
|
|
— |
|
|
— |
|
|
Income tax reductions relating to exercise of stock options |
|
|
— |
|
|
— |
|
|
982 |
|
|
— |
|
|
— |
|
|
982 |
|
|
Stock-based compensation |
|
|
— |
|
|
— |
|
|
1,127 |
|
|
— |
|
|
— |
|
|
1,127 |
|
|
Repurchase of common stock |
|
|
(577 |
) |
|
(6 |
) |
|
— |
|
|
(9,606 |
) |
|
— |
|
|
(9,612 |
) |
|
Comprehensive income: |
|
|
|
|
|
|
|
|
|
|
|
|
|
|
|
|
|
|
|
|
Net income |
|
|
— |
|
|
— |
|
|
— |
|
|
9,431 |
|
|
|
|
|
9,431 |
|
|
Translation adjustment |
|
|
— |
|
|
— |
|
|
— |
|
|
— |
|
|
90 |
|
|
90 |
|
|
Change in unrealized gain from available-for-sale securities, net of taxes of $258 |
|
|
— |
|
|
— |
|
|
— |
|
|
— |
|
|
419 |
|
|
419 |
|
|
Total comprehensive income |
|
|
|
|
|
|
|
|
|
|
|
|
|
|
|
|
|
9,940 |
|
|
|
|
|
|
|
|
|
|
|
|
|
|
|
|
|
|
|
|
|
|
|
Balance at December 31, 2008 |
|
|
9,335 |
|
$ |
93 |
|
$ |
37,484 |
|
$ |
70,287 |
|
$ |
1,184 |
|
$ |
109,048 |
|
|
|
|
|
|
|
|
|
|
|
|
|
|
|
|
|
|
|
|
|
|
|
Stock issued for employee stock plans |
|
|
117 |
|
|
1 |
|
|
1,224 |
|
|
— |
|
|
— |
|
|
1,225 |
|
|
Issuance of restricted stock |
|
|
20 |
|
|
— |
|
|
— |
|
|
— |
|
|
— |
|
|
— |
|
|
Income tax reductions relating to exercise of stock options |
|
|
— |
|
|
— |
|
|
46 |
|
|
— |
|
|
— |
|
|
46 |
|
|
Stock-based compensation |
|
|
— |
|
|
— |
|
|
1,542 |
|
|
— |
|
|
— |
|
|
1,542 |
|
|
Repurchase of common stock |
|
|
— |
|
|
— |
|
|
— |
|
|
— |
|
|
— |
|
|
— |
|
|
Comprehensive income: |
|
|
|
|
|
|
|
|
|
|
|
|
|
|
|
|
|
|
|
|
Net income |
|
|
— |
|
|
— |
|
|
— |
|
|
8,495 |
|
|
— |
|
|
8,495 |
|
|
Translation adjustment |
|
|
— |
|
|
— |
|
|
— |
|
|
— |
|
|
(42 |
) |
|
(42 |
) |
|
Change in unrealized gain from available-for-sale securities, net of taxes of $225 |
|
|
— |
|
|
— |
|
|
— |
|
|
— |
|
|
(365 |
) |
|
(365 |
) |
|
Total comprehensive income |
|
|
|
|
|
|
|
|
|
|
|
|
|
|
|
|
|
8,088 |
|
|
|
|||||||||||||||||||
|
Balance at December 31, 2009 |
|
|
9,472 |
|
$ |
94 |
|
$ |
40,296 |
|
$ |
78,782 |
|
$ |
777 |
|
$ |
119,949 |
|
See accompanying notes to consolidated financial statements.
29
|
|
|
RIMAGE CORPORATION AND SUBSIDIARIES |
|
Years ended December 31, 2009, 2008 and 2007 |
|
(In thousands) |
|
|
|
|
|
|
|
|
|
|
|
|
|
|
|
2009 |
|
2008 |
|
2007 |
|
|||
|
Cash flows from operating activities: |
|
|
|
|
|
|
|
|
|
|
|
Net income |
|
$ |
8,495 |
|
$ |
9,431 |
|
$ |
15,761 |
|
|
Adjustments to reconcile net income to net cash provided by operating activities: |
|
|
|
|
|
|
|
|
|
|
|
Depreciation and amortization |
|
|
1,250 |
|
|
1,372 |
|
|
1,525 |
|
|
Deferred income tax charge (benefit) |
|
|
(573 |
) |
|
672 |
|
|
(1,227 |
) |
|
Impairment of long-lived assets |
|
|
— |
|
|
— |
|
|
60 |
|
|
Gain on sale of marketable securities |
|
|
(278 |
) |
|
— |
|
|
— |
|
|
Loss on sale of property and equipment |
|
|
40 |
|
|
7 |
|
|
67 |
|
|
Stock-based compensation |
|
|
1,542 |
|
|
1,128 |
|
|
1,617 |
|
|
Excess tax benefits from stock-based compensation |
|
|
(64 |
) |
|
(673 |
) |
|
(1,217 |
) |
|
Changes in operating assets and liabilities: |
|
|
|
|
|
|
|
|
|
|
|
Receivables |
|
|
(2,572 |
) |
|
3,349 |
|
|
7,250 |
|
|
Inventories |
|
|
1,486 |
|
|
2,450 |
|
|
(2,003 |
) |
|
Prepaid expenses and other current assets |
|
|
930 |
|
|
(617 |
) |
|
(440 |
) |
|
Trade accounts payable |
|
|
(194 |
) |
|
(3,019 |
) |
|
553 |
|
|
Prepaid income taxes/income taxes payable |
|
|
623 |
|
|
238 |
|
|
1,187 |
|
|
Accrued compensation |
|
|
1,948 |
|
|
(1,258 |
) |
|
256 |
|
|
Other accrued expenses and other current liabilities |
|
|
(178 |
) |
|
(125 |
) |
|
(238 |
) |
|
Deferred income and customer deposits |
|
|
1,707 |
|
|
(762 |
) |
|
2,987 |
|
|
|
|
|
|
|
|
|
|
|
|
|
|
Net cash provided by operating activities |
|
|
14,162 |
|
|
12,193 |
|
|
26,138 |
|
|
|
|
|
|
|
|
|
|
|
|
|
|
Cash flows from investing activities: |
|
|
|
|
|
|
|
|
|
|
|
Purchases of marketable securities |
|
|
(70,479 |
) |
|
(77,714 |
) |
|
(82,128 |
) |
|
Maturities of marketable securities |
|
|
106,231 |
|
|
80,016 |
|
|
64,505 |
|
|
Sales of marketable securities |
|
|
6,835 |
|
|
4,663 |
|
|
— |
|
|
Purchases of property and equipment |
|
|
(424 |
) |
|
(4,366 |
) |
|
(1,285 |
) |
|
Proceeds from the sale of property and equipment |
|
|
— |
|
|
— |
|
|
13 |
|
|
Other non-current items |
|
|
— |
|
|
108 |
|
|
169 |
|
|
|
|
|
|
|
|
|
|
|
|
|
|
Net cash provided by (used in) investing activities |
|
|
42,163 |
|
|
2,707 |
|
|
(18,726 |
) |
|
|
|
|
|
|
|
|
|
|
|
|
|
Cash flows from financing activities: |
|
|
|
|
|
|
|
|
|
|
|
Principal payments on capital lease obligations |
|
|
(35 |
) |
|
(24 |
) |
|
(9 |
) |
|
Repurchase of common stock |
|
|
— |
|
|
(9,612 |
) |
|
(12,628 |
) |
|
Excess tax benefits from stock-based compensation |
|
|
64 |
|
|
673 |
|
|
1,217 |
|
|
Proceeds from employee stock plans |
|
|
1,225 |
|
|
1,550 |
|
|
2,754 |
|
|
Net cash provided by (used in) financing activities |
|
|
1,254 |
|
|
(7,413 |
) |
|
(8,666 |
) |
|
|
|
|
|
|
|
|
|
|
|
|
|
Effect of exchange rate changes on cash |
|
|
43 |
|
|
(18 |
) |
|
170 |
|
|
|
|
|
|
|
|
|
|
|
|
|
|
Net increase (decrease) in cash and cash equivalents |
|
|
57,622 |
|
|
7,469 |
|
|
(1,084 |
) |
|
|
|
|
|
|
|
|
|
|
|
|
|
Cash and cash equivalents, beginning of year |
|
|
14,885 |
|
|
7,416 |
|
|
8,500 |
|
|
|
|
|
|
|
|
|
|
|
|
|
|
Cash and cash equivalents, end of year |
|
$ |
72,507 |
|
$ |
14,885 |
|
$ |
7,416 |
|
|
|
|
|
|
|
|
|
|
|
|
|
|
Supplemental disclosures of net cash paid during the period for: |
|
|
|
|
|
|
|
|
|
|
|
Income taxes |
|
$ |
4,031 |
|
$ |
4,872 |
|
$ |
8,699 |
|
|
Non-cash investing and financing activties: |
|
|
|
|
|
|
|
|
|
|
|
Income tax reductions relating to exercise of stock options |
|
$ |
— |
|
$ |
309 |
|
$ |
328 |
|
|
Change in unrealized net gains from available-for-sale securities |
|
$ |
(590 |
) |
$ |
677 |
|
$ |
322 |
|
|
Capital lease obligations |
|
$ |
98 |
|
$ |
— |
|
$ |
86 |
|
See accompanying notes to consolidated financial statements.
RIMAGE
30
CORPORATION AND SUBSIDIARIES
NOTES TO CONSOLIDATED FINANCIAL STATEMENTS
1) Nature of Business and Summary of Significant Accounting Policies
Basis of Presentation and Nature of Business
The consolidated financial statements include the accounts of Rimage Corporation and its subsidiaries, collectively hereinafter referred to as “Rimage” or the “Company.” All intercompany accounts and transactions have been eliminated in consolidation.
Rimage develops, manufactures and markets digital publishing systems that are used by businesses to produce recordable CD, DVD and Blu-ray discs with customized digital content on an on-demand basis.
In July 2009, the FASB launched its Accounting Standards Codification (the “Codification”). The Codification became the exclusive authoritative source of nongovernmental U.S. generally accepted accounting principles (“GAAP”) for interim and annual accounting periods ending after September 15, 2009, except for rules and interpretive releases of the SEC, which are sources of authoritative GAAP for SEC registrants. The Codification did not change GAAP but reorganized the literature.
Revenue Recognition
Revenue for product sales, which do not include any requirement for installation or training, is recognized on shipment, at which point the following criteria have been satisfied:
|
|
|
|
|
|
• |
Persuasive evidence of an arrangement exists. Orders are received for all sales, and sales invoices are mailed on shipment. |
|
|
|
|
|
|
• |
Delivery has occurred. Product has been transferred to the customer or the customer’s designated delivery agent. |
|
|
|
|
|
|
• |
The vendor’s price is fixed or determinable. All sales prices are fixed at the time of the sale (shipment). |
|
|
|
|
|
|
• |
Collectability is probable. All sales are made on the basis that collection is expected in line with the Company’s standard payment terms, which are consistent with industry practice in the geographies in which the Company markets its products. |
A standard product sale by the Company does not require a commitment on the Company’s part to provide installation, set-up or training. When such services are requested, value-added resellers generally arrange and perform the service directly with the customer, with no financial interest or obligation on the part of the Company. In the limited situations in which the Company does provide installation or training services for customers, the Company charges separately for the service based upon its published list prices and recognizes the associated service revenue upon the successful completion of the service.
As part of its product offering, the Company sells separately priced maintenance agreements that are valued based on the amount invoiced for the service. Revenue associated with all other elements in a multiple element arrangement is allocated among the separate accounting units based on the residual method. Under the residual method, the arrangement revenue is allocated to undelivered elements based on the fair value of such undelivered elements and the residual amount of revenue is allocated to the delivered elements.
Shipping and handling fees billed to customers are reported within revenue in the consolidated statements of income, and the related costs are included in cost of revenues in the consolidated statements of income.
Sales Returns
An allowance for sales returns is recorded by the Company based upon historical trends, timing of new product introductions and other factors. A return policy is in place with certain of the Company’s distributors to restrict the volume of returned products.
31
Receivables and Allowance for Doubtful Accounts
The Company records accounts receivable at face amount less an allowance for doubtful accounts for potentially uncollectible receivables. The allowance is established based on a specific assessment of accounts with known collection exposure, based upon a review of the age of the receivable, the customer’s payment history, the customer’s financial condition and industry and general economic conditions, as well as a general assessment of collection exposure in the remaining receivable population based upon bad debt history. The uncollectible portion of receivables is charged against the allowance for doubtful accounts when collection efforts have ceased. Recoveries of receivables previously charged-off are recorded when received.
Cash Equivalents
All short-term investments with original maturities of three months or less at date of purchase are considered cash equivalents, except for variable rate demand notes, which are classified as marketable securities.
Marketable Securities
Marketable securities generally consist of U.S. treasury bills, municipal securities, corporate securities, money market securities and U.S. government agency securities with long-term credit ratings of AAA and short-term credit ratings of A-1. Marketable securities are classified as short-term or long-term in the accompanying consolidated balance sheet based on their effective maturity date. All marketable securities, except for variable rate demand notes included in the Company’s portfolio at December 31, 2008, have maturities ranging from three to 36 months. Variable rate demand notes may be liquidated in less than three months from the date of purchase, but have legal maturities of greater than three months and are required to be classified as marketable securities. Marketable securities are classified as available-for-sale. Available-for-sale securities are recorded at fair value and any unrealized holding gains and losses, net of the related tax effect, are excluded from earnings and are reported as a separate component of accumulated other comprehensive income (loss) until realized. See Note 5, “Fair Value Measurements,” for a discussion of inputs used to measure the fair value of the Company’s available-for-sale securities. The Company’s investment portfolio at December 31, 2009 did not include any auction-rate securities, “high-yield” sub-prime backed paper or other affected securities which are subject to significant market value declines or liquidity issues.
Sources of Supply
Many of the purchased components used to assemble the Company’s products are standard parts and are readily available. Other components and subassemblies are manufactured to the Company’s specifications. For the majority of the Company’s critical components, the Company has identified alternative suppliers. The Company depends upon a single-source supplier for its Everest printers and, beginning in March 2010, its Rimage Professional Series 5400N and Rimage Professional Series 3400 systems. For these products, it is more difficult to identify an alternative supplier because of the proprietary information and technology held by the current supplier. If the Company were unable to effectively transition the technology and proprietary information used by its current suppliers to alternative suppliers, the design and manufacture of components and products to the Company’s specifications may be significantly delayed, resulting in potential production delays and significant expense Further, if the Company obtains a new supplier for a component or product or uses an alternative component in its product, the Company may need to conduct additional testing of its products to ensure the product meets its quality and performance standards. Any delays in delivery of its product to end-users, distributors or resellers could be extended, and costs associated with the change in product manufacturing could increase.
Inventories
Inventories are stated at the lower of cost or market. Cost is determined on a first-in, first-out (FIFO) basis. The Company records provisions for potential excess, obsolete and slow moving inventory based upon usage, historical loss trends, expected product lives and forecasted sales demand.
Property and Equipment
Property and equipment are stated at cost and depreciated on a straight-line basis over estimated useful lives ranging from two to seven years for most assets, and 15 years for the Company’s headquarters facility purchased in September 2008. Leasehold improvements are amortized using the straight-line method over the shorter of the property’s useful life or the term of the underlying lease. Repairs and maintenance costs are charged to operations as incurred.
Impairment of Long-lived Assets
Long-lived assets at December 31, 2009 and 2008 consisted of property and equipment. The Company reviews the carrying amount of its long-lived assets when events or changes in circumstances such as market value, asset utilization, physical change, legal factors or other matters indicate that the carrying amount of the assets may not be recoverable. When this review indicates the carrying amount of an asset or asset group exceeds the sum of the future undiscounted cash flows expected to be generated by the assets, the Company recognizes an asset impairment charge against operations for the amount by which the carrying amount of the impaired asset exceeds its fair value.
32
Product Warranty
The
Company’s non-consumable products are warranted to the end-user to ensure
end-user confidence in design, workmanship and overall quality. Warranty
lengths vary by product type, ranging from periods of six to 12 months.
Warranty covers parts, labor and other associated expenses. The Company
performs the majority of warranty work, while authorized distributors and
dealers also perform some warranty work. Warranty expense is accrued during the
warranty period based on an analysis of historical claims experience, which
includes labor, freight and parts costs, with consideration of the proportion
of parts that can be re-used.
The warranty accrual rollforward, including
provisions and claims, is as follows for the years ended December 31, 2009,
2008 and 2007 (in thousands):
|
|
|
|
|
|
|
|
|
|
|
|
|
|
|
|
|
|
|
Years ended: |
|
Beginning |
|
Warranty |
|
Warranty |
|
Foreign |
|
Ending |
|
|||||
|
|
|
|
|
|
|
|
|
|
|
|
|
|
|
|
|
|
|
December 31, 2009 |
|
$ |
263 |
|
$ |
376 |
|
$ |
(419 |
) |
$ |
1 |
|
$ |
221 |
|
|
|
|
|
|
|
|
|
|
|
|
|
|
|
|
|
|
|
|
December 31, 2008 |
|
$ |
420 |
|
$ |
314 |
|
$ |
(468 |
) |
$ |
(3 |
) |
$ |
263 |
|
|
|
|
|
|
|
|
|
|
|
|
|
|
|
|
|
|
|
|
December 31, 2007 |
|
$ |
394 |
|
$ |
851 |
|
$ |
(838 |
) |
$ |
13 |
|
$ |
420 |
|
Stock-Based Compensation
The Company measures the cost of employee services received in exchange for the award of equity instruments based on the fair value of the award at the date of grant. The cost is recognized on a straight-line basis over the period during which an employee is required to provide services in exchange for the entire award. The benefits of tax deductions in excess of recognized compensation expense is reported as a financing cash flow.
The Company accounts for stock options using the modified prospective method. Under this method, the Company recognizes compensation expense on a straight-line basis over the vesting period for all stock-based awards granted on or after January 1, 2006, and for previously granted awards not yet vested as of January 1, 2006. The Company recognizes stock-based compensation net of an estimated forfeiture rate, resulting in the recognition of compensation cost for only those shares expected to vest. Compensation cost is recognized for all awards over the vesting period to the extent the employees or directors meet the requisite service requirements, whether or not the award is ultimately exercised. Conversely, when an employee or director does not meet the requisite service requirements and forfeits the award prior to vesting, any compensation expense previously recognized for the award is reversed. See Note 3 to the Consolidated Financial Statements for additional information on stock-based compensation.
Research and Development Costs
Research and development costs relate to hardware and software development and enhancements to existing products. All such costs are expensed as incurred.
Income Taxes
Deferred tax assets and liabilities are recognized for the estimated future tax consequences attributable to differences between the financial statement carrying amounts of existing assets and liabilities and their respective tax bases. Deferred tax assets and liabilities are measured using enacted tax rates in effect for the year in which those temporary differences are expected to be recovered or settled. The effect on deferred tax assets and liabilities of a change in tax rates is recognized in income in the period that includes the enactment date. A valuation allowance is provided to offset deferred tax assets if, based on the available evidence, it is more likely than not that some or all of the deferred tax asset will not be realized.
Net Income Per Share
Basic net income per share is calculated as income available to common stockholders divided by the weighted average number of common shares outstanding for the period. Diluted net income per share includes the potentially dilutive effect of common shares issued in connection with outstanding stock options using the treasury stock method.
Foreign Currency Translation / Transactions
The functional currency for each of the Company’s foreign subsidiaries is the respective local currency. The assets and liabilities of the Company’s foreign subsidiaries are translated into U.S. dollars using period-end exchange rates, while revenues and expenses are translated at average exchange rates prevailing during the year. The resulting translation adjustments are recorded as a separate component of stockholders’ equity in accumulated other comprehensive income (loss). The Company recorded net gains (losses) on foreign currency translation in comprehensive income of ($42,000), $90,000 and $339,000 for the years ended December 31, 2009, 2008 and 2007, respectively.
33
The Company enters into forward foreign exchange contracts to hedge intercompany receivables denominated in Euros arising from sales to its subsidiary in Germany. Gains or losses on forward foreign exchange contracts are calculated at each period end and are recognized in net income in the period in which they arose. The fair value of forward foreign exchange contracts is recorded in other current assets or other current liabilities depending on whether the net amount is a gain or a loss.
Comprehensive Income
Comprehensive income consists of the Company’s net income, foreign currency translation adjustments, and unrealized holding gains and losses from available-for-sale marketable securities and is presented in the Consolidated Statements of Stockholders’ Equity and Comprehensive Income.
Operating Leases
The Company leases certain of its facilities and some of its equipment under non-cancelable operating lease arrangements. The rental payments under these leases are charged to expense as incurred.
Taxes Collected From Customers
Sales taxes charged to and collected from customers as part of the Company’s sales transactions are excluded from revenues and recorded as a liability to the applicable governmental taxing authority.
Use of Estimates
The preparation of financial statements in conformity with accounting principles generally accepted in the United States of America requires management to make estimates and assumptions that affect the reported amounts of assets and liabilities and disclosure of contingent assets and liabilities at the date of the financial statements and the reported amounts of revenues and expenses during the reporting period. Actual results could differ from estimates on items such as allowance for doubtful accounts and sales returns, inventory provisions, asset impairment charges, deferred tax asset valuation allowances, accruals for uncertain tax positions and warranty accruals. These estimates and assumptions are based on management’s best judgment. Management evaluates estimates and assumptions on an ongoing basis using its technical knowledge, historical experience and other factors, including consideration of the impact of the current economic environment. Management believes its assumptions are reasonable in light of the current economic environment. Management adjusts such estimates and assumptions when facts and circumstances change. Illiquid credit markets, volatile equity, foreign currency and energy markets, and declines in business and consumer spending have combined to increase the uncertainty inherent in such estimates and assumptions. As future events and their effects cannot be determined with precision, actual results could differ significantly from these estimates. Changes in those estimates resulting from continuing changes in the economic environment will be reflected in the financial statements in future periods.
New Accounting Pronouncements
In September 2006, the Financial Accounting Standards Board (“FASB”) issued authoritative guidance on fair value measurements and disclosures. This guidance defines fair value, establishes a framework for measuring fair value and requires enhanced disclosures about fair value measurements. The Company adopted this guidance effective January 1, 2008. In February 2008, the FASB delayed the effective date of this guidance to fiscal years beginning after November 15, 2008 for nonfinancial assets and liabilities, except for items that are recognized and disclosed at fair value in the financial statements on a recurring basis (at least annually). Effective January 1, 2009, the company adopted the guidance applicable to nonfinancial assets and liabilities that was previously deferred. The adoption did not impact the Company’s consolidated financial statements and related disclosures for the year ended December 31, 2009.
In March 2008, the FASB issued authoritative guidance on disclosures about derivative instruments and hedging activities. The required disclosures include information about an entity’s objectives and strategies for using derivatives, the existence and nature of credit-risk-related contingent features in derivative instruments, counterparty credit risk, the relative volume of derivative activity, the fair value of derivative instruments and related amounts of gains and losses. The Company’s adoption of the disclosure provisions of this guidance effective January 1, 2009 did not have a material impact on the Company’s consolidated financial statements and related disclosures.
In June 2008, the FASB issued authoritative guidance on the treatment of participating securities in the calculation of earnings per share (“EPS”). This guidance requires all outstanding unvested share-based payment awards that contain nonforfeitable rights to dividends or dividend equivalents (whether paid or unpaid) to be considered participating securities and shall be included in the computation of basic and diluted earnings per share using the two-class method. All prior-period earnings per share data presented shall be adjusted retrospectively. The Company adopted this guidance effective January 1, 2009. As discussed under Note 12, while applicable to the Company, the adoption did not have a material impact on the Company’s consolidated financial statements.
In November 2007, the FASB issued authoritative guidance on the accounting for collaborative arrangements. This guidance applies to participants in a collaborative arrangement, defined as a contractual arrangement that involves a joint operating activity involving two (or more) parties who are both (a) active participants in the activity and (b) exposed to significant risks and rewards dependent on
34
the commercial success of the activity. Revenues and costs incurred with third parties in connection with a collaborative arrangement should be presented gross or net by the collaborators based on criteria outlined in other applicable accounting literature. Payments to or from collaborators should be presented in the income statement based on the nature of the arrangement, the nature of the Company’s business and whether the payments are within the scope of other accounting literature. This guidance is effective for the Company as of January 1, 2009, and should be applied to collaborative arrangements in existence at the date of adoption using the modified retrospective method that requires reclassification in all periods presented for those arrangements still in effect at the transition date, unless that application is impracticable. The adoption of this guidance did not have an impact on the Company’s consolidated financial statements and related disclosures for the year ended December 31, 2009.
In April 2009, the FASB issued authoritative guidance for estimating fair value of assets and liabilities when market activity has decreased and on identifying transactions that are not orderly. Additionally, entities are required to disclose in interim and annual periods the inputs and valuation techniques used to measure fair value. This guidance was effective for the Company for its quarter ended June 30, 2009. The adoption of this guidance did not have an impact on the Company’s consolidated financial statements and related disclosures.
2) Development and Manufacturing Arrangement
In late 2008, the Company entered into a shared development arrangement with a supplier of printers and consumables used in its digital publishing systems. Rimage engaged the supplier to assist in the design, development and manufacture of a new digital publishing system based on specifications developed by Rimage. The new system will be assembled by the supplier and sold exclusively by Rimage with product launch scheduled for the first quarter of 2010.
Under the development arrangement, Rimage shall become obligated to pay the supplier development fees and purchase production tooling developed by the supplier based on the achievement of certain project milestones agreed to by the parties. In late December 2009, Rimage completed the approval of the project milestones and authorized the project be released to production. Aggregate fees due to the supplier consist of development fees approximating $2.5 million, including agency testing fees of approximately $0.1 million expected to be incurred in the first quarter of 2010, and production tooling costs of $2.4 million.
Rimage assumed ownership of the production tooling upon the release to production approval and capitalized $2.4 million of costs in property and equipment in the accompanying consolidated balance sheets as of December 31, 2009. Development fees incurred with the supplier were charged to research and development expense in the accompanying consolidated statements of income as project milestones were achieved and totaled $2.3 million and $0.1 million for the years ended December 31, 2009 and 2008, respectively. To the extent Rimage issues the first purchase order for the new system within six months after the release to production approval, approximately $1.5 million in development fees will be paid to the supplier as Rimage orders, takes delivery and purchases the first 10,000 units from the supplier, or approximately $150 per unit. In the event Rimage does not order a total of 10,000 units within three years from first delivery, Rimage shall pay the then remaining balance of $1.5 million within 60 days after the end of the three-year period. In the event Rimage does not issue the first purchase order for the new system within six months of the release to production approval, Rimage shall pay the $1.5 million within 60 days after the end of the six-month period. Rimage paid the supplier development fees of approximately $0.3 million during 2009. The remaining development fees of approximately $0.7 million and the production tooling costs of $2.4 million are payable by Rimage to the supplier in 2010. Amounts payable to the supplier for development and tooling costs incurred as of December 31, 2009 total $4.5 million and are included in trade accounts payable on the consolidated balance sheets.
3) Stock-Based Compensation and Common Stock Repurchases
In May 2007, the Company’s shareholders approved the 2007 Stock Incentive Plan (the “2007 Plan”). The 2007 Plan provides for the grant of stock incentive awards in the form of incentive and non-qualified stock options, stock appreciation rights, restricted stock, restricted stock units, performance stock, performance units and other awards in stock and/or cash to certain key employees, non-employee directors and service providers. In May 2009, the Company’s shareholders approved amendments to the 2007 Plan, including an increase in the number of shares authorized for issuance by 500,000 shares to a total of 1,230,320 shares. At December 31, 2009, a total of 675,420 shares were available for future grant under the 2007 Plan, as amended. Effective with the approval of the 2007 Plan in May 2007, the Company may not issue any new awards or options under its Amended and Restated 1992 Stock Option Plan (the “1992 Plan”). The exercise price of stock options granted under the 2007 Plan is equal to the market value on the date of grant. Options issued to employees through March 31, 2006 under the 1992 Plan generally become exercisable over a two-year period and terminate ten years from the date of grant. Options issued to employees after March 31, 2006 under both the 1992 Plan and the 2007 Plan generally become exercisable over a four-year period. Options issued to employees through May 13, 2008 under the 1992 Plan and the 2007 Plan terminate ten years from the date of grant, while options issued effective May 14, 2008 under the 2007 Plan terminate seven years from the date of grant. Stock options granted to non-employee directors vest six months from the date of grant and terminate ten years from the date of grant. Restricted stock and restricted stock units issued to employees and to non-employee directors under the 2007 Plan are subject to the risk of forfeiture and transfer restrictions that generally lapse one year from the date of grant.
35
In addition to awards granted under the 2007 Plan and 1992 Plan, the Company granted a non-qualified option to purchase 200,000 shares of its common stock to a newly hired executive officer on April 1, 2009. The option was granted outside of any shareholder-approved plan as an inducement to accept employment with the Company. The option has an exercise price equal to the closing price of the Company’s common stock as reporting by the Nasdaq Stock Market on the first day of employment of April 1, 2009, vests in four equal installments on each of the first four anniversaries of the date of grant and has a term of seven years. In other respects, the option was structured to mirror the terms of the options granted under the 2007 Plan and is subject to a stock option plan and agreement between the Company and the executive officer.
Amounts recognized in the financial statements for the years ended December 31, 2009, 2008 and 2007 with respect to the Company’s share-based payment arrangements are as follows (in thousands):
|
|
|
|
|
|
|
|
|
|
|
|
|
|
|
Year Ended December 31, |
|
|||||||
|
|
|
2009 |
|
2008 |
|
2007 |
|
|||
|
|
|
|
|
|
|
|
|
|
|
|
|
Stock-based compensation cost charged against income, before income tax benefit |
|
$ |
1,542 |
|
$ |
1,128 |
|
$ |
1,617 |
|
|
Income tax benefit related to stock-based compensation included in net income |
|
$ |
(539 |
) |
$ |
(397 |
) |
$ |
(611 |
) |
Total stock-based compensation cost reflected in the preceding table of $1,542,000 for 2009 consisted of $1,174,000 for the issuance of stock options and $368,000 associated with the grant of restricted stock and restricted stock units to independent Board members and certain employees. Total stock-based compensation cost reflected of $1,128,000 for 2008 consisted of $1,072,000 for the issuance of stock options and $56,000 associated with the grant of restricted stock to independent Board members. Total stock-based compensation cost of $1,617,000 for 2007 consisted of $1,523,000 for the issuance of stock options, $135,000 associated with the grant of restricted stock to independent Board members and a reduction in expense of $41,000 for the reversal of performance share expense.
Stock Options
The fair value of each option award is estimated at the date of grant using the Black-Scholes option pricing model. The assumptions used to determine the fair value of stock option awards granted during the years ended December 31, 2009, 2008 and 2007 were as follows:
|
|
|
|
|
|
|
|
|
|
|
Year Ended December 31, |
||||
|
|
|
2009 |
|
2008 |
|
2007 |
|
|
|
|
|
|
|
|
|
Expected life of options in years |
|
4.75 |
|
4.75 - 6.00 |
|
6.00 |
|
|
|
|
|
|
|
|
|
Risk-free interest rate |
|
1.58% - 2.30% |
|
3.1% |
|
4.0 - 4.8% |
|
|
|
|
|
|
|
|
|
Expected volatility |
|
48.5 - 49.9% |
|
39.1 - 40.0% |
|
38.0- 40.0% |
|
|
|
|
|
|
|
|
|
Expected dividend yield |
|
0.0% |
|
0.0% |
|
0.0% |
The Company reviews these assumptions at the time of each new option award and adjusts them as necessary to ensure proper option valuation. The expected life represents the period that the stock option awards are expected to be outstanding. For all stock options granted in 2007, and all stock options granted to non-employee directors in 2008, the expected life was determined based on an analysis of historical exercise behavior and anticipated future exercise patterns, giving consideration to the contractual terms of unexercised stock option awards. Effective April 2008, the Company’s Board of Directors approved a change in the contractual term of stock options granted to employees from 10 to seven years. Given the reduction in the contractual term of its employee stock option awards, the Company determined it was unable to rely on its historical exercise data as a basis for estimating the expected life of stock options granted to employees in 2008 and 2009. As such, the Company used the “simplified” method for determining the expected life of stock options granted to employees in 2008 and 2009, as specified by Staff Accounting Bulletin (“SAB”) No. 107, “Valuation of Share-Based Payment Arrangements for Public Companies,” which bases the expected life calculation on the average of the vesting term and the contractual term of the awards. The risk-free interest rate is based on the yield of constant maturity U.S. treasury bonds with a remaining term equal to the expected life of the awards. The Company estimated the stock price volatility using historical weekly price observations over the expected life of the awards. The expected dividend yield is zero, as the Company has not paid or declared any cash dividends on its common stock, and does not currently have plans to pay dividends.
36
A summary of share option activity under the 2007 and 1992 Plans as of and for the year ended December 31, 2009 is presented in the table below (in thousands, except per share data):
|
|
|
|
|
|
|
|
|
|
|
|
|
|
|
|
|
|
Shares |
|
WAEP* |
|
Weighted Average |
|
Aggregate |
|||||
|
|
|||||||||||||
|
Options outstanding at December 31, 2008 |
|
|
1,159 |
|
$ |
17.88 |
|
|
|
|
|
|
|
|
Granted |
|
|
449 |
|
|
14.77 |
|
|
|
|
|
|
|
|
Exercised |
|
|
(117 |
) |
|
10.43 |
|
|
|
|
|
|
|
|
Canceled |
|
|
(221 |
) |
|
19.09 |
|
|
|
|
|
|
|
|
|
|
|
|
|
|
|
|
|
|
|
|
|
|
|
Options outstanding at December 31, 2009 |
|
|
1,270 |
|
$ |
17.26 |
|
|
6.11 |
|
$ |
2,763 |
|
|
|
|
|
|
|
|
|
|
|
|
|
|
|
|
|
Options subject to exercise at December 31, 2009 |
|
|
724 |
|
$ |
17.88 |
|
|
5.05 |
|
$ |
1,707 |
|
*Weighted Average Exercise Price
**Aggregate intrinsic value includes only those options with intrinsic value (options where the exercise price is below the market value).
A summary of the status of the Company’s nonvested option shares as of December 31, 2009 and changes during the year ended December 31, 2009 is presented in the table below (in thousands, except per share data):
|
|
|
|
|
|
|
|
|
|
|
|
Number of Shares |
|
Weighted Average |
|
||
|
Nonvested at December 31, 2008 |
|
|
306 |
|
|
9.61 |
|
|
|
|
|
|
|
|
|
|
|
Granted |
|
|
449 |
|
|
6.36 |
|
|
|
|
|
|
|
|
|
|
|
Vested |
|
|
(94 |
) |
|
10.13 |
|
|
|
|
|
|
|
|
|
|
|
Canceled |
|
|
(115 |
) |
|
8.42 |
|
|
|
|
|
|
|
|
|
|
|
Nonvested at December 31, 2009 |
|
|
546 |
|
|
7.09 |
|
As of December 31, 2009, there was $3,184,000 of total stock option compensation expense (gross of the impact of potential forfeitures) not yet recognized related to non-vested option awards, which is expected to be recognized over a weighted average period of 2.94 years.
Other information pertaining to options is as follows:
|
|
|
|
|
|
|
|
|
|
|
|
|
|
|
Year Ended December 31, |
|
|||||||
|
|
|
2009 |
|
2008 |
|
2007 |
|
|||
|
|
|
(in thousands, except per share data) |
|
|||||||
|
|
|
|
|
|||||||
|
Number of options granted |
|
|
449 |
|
|
184 |
|
|
248 |
|
|
Fair value of options granted |
|
$ |
2,850 |
|
$ |
1,282 |
|
$ |
3,036 |
|
|
Per share weighted average fair value of options granted |
|
$ |
6.36 |
|
$ |
6.98 |
|
$ |
12.24 |
|
|
Total fair value of stock options vested |
|
$ |
958 |
|
$ |
1,144 |
|
$ |
1,649 |
|
|
Total intrinsic value of stock options exercised |
|
$ |
718 |
|
$ |
2,641 |
|
$ |
4,613 |
|
Cash received from the exercise of stock options was $1,225,000, $1,550,000 and $2,754,000 for the years ended December 31, 2009, 2008 and 2007, respectively. The income tax benefit realized from the exercise of stock options and recorded as an increase to
37
additional paid-in capital was $46,000, $982,000 and $1,545,000 for the years ended December 31, 2009, 2008 and 2007, respectively.
Performance Shares
The Company granted no performance share awards during the years ended December 31, 2009, 2008 and 2007. During the year ended December 31, 2006, the Company granted 16,967 performance shares to certain managerial and executive employees under the 1992 Plan, with performance criteria established based on revenue and operating income goals for calendar year 2008. If the performance goals are not achieved during the performance period, all performance shares are to be canceled and the employees will receive no common stock for the canceled performance shares. An employee must also remain employed by the Company as of the end of the performance period to be eligible to receive common stock for the performance shares. Performance share awards were valued based on the market value of the Company’s shares on the date of grant, which was equal to the intrinsic value of the shares on that date. Compensation cost for awards with a performance condition is recognized ratably over the performance period, once achievement of performance criteria is deemed probable. The Company assessed the probability of the achievement of performance criteria associated with the performance shares as probable during 2006 and the first half of 2007. As such, the total fair value of the performance shares of approximately $372,000, based on a common stock price on the date of grant of $21.92, was being recognized as compensation expense over the performance period ending December 31, 2008. During the third quarter of 2007, the Company changed its assessment of achieving the performance criteria from probable to improbable. Accordingly, the Company reversed all compensation expense recorded in prior periods and ceased recording additional expense for the 2006 performance shares during the third quarter 2007. The expense reversal recorded in the third quarter of 2007 amounted to approximately $111,000, of which $41,000 related to expense recorded in 2006. As the revenue and operating income goals for calendar year 2008 were not achieved, all performance shares were cancelled and employees received no common stock for the cancelled performance shares.
Restricted Stock
On May 13, 2009, the Company issued 3,500 shares of restricted stock units to each of the five independent members of its Board of Directors. The restricted stock units were valued based on the market value of the Company’s shares on the date of grant of $258,000, which was equal to the intrinsic value of the shares on that date. Such restricted stock units vest and the restriction lapse one year after the date of grant. As such, the Company is recognizing expense for the intrinsic value of the restricted stock units ratably over the one-year vesting period, resulting in $164,000 of expense for the year ended December 31, 2009.
During 2009, the Company issued 20,000 shares of restricted stock to certain management employees and on May 14, 2008, the Company issued 1,000 shares of restricted stock to each of the five independent members of its Board of Directors. The restricted stock was valued based on the market value of the Company’s shares on the date of grant which was equal to the intrinsic value of the shares on that date. Restricted stock of 10,000 shares awarded to a newly hired executive officer effective April 1, 2009 vest and the restrictions lapse nine months from the date of grant. The remaining issued shares of restricted stock vest and the restrictions lapse one year after the date of grant. The Company recognizes expense for the intrinsic value of the restricted stock ratably over the vesting period, resulting in $203,000 and $56,000 of expense for the years ended December 31, 2009 and 2008, respectively.
Common Stock Repurchases
On October 17, 2007, the Company’s Board of Directors authorized the repurchase of up to 500,000 shares of its common stock. In February 2008, the Company’s Board of Directors increased the share repurchase authorization by an additional 500,000 shares, bringing total shares authorized for repurchase to 1,000,000. Shares may be purchased at prevailing market prices in the open market or in private transactions, subject to market conditions, share price, trading volume and other factors. The repurchase program may be discontinued at any time. During the year ended December 31, 2008, the Company repurchased 577,083 shares of its common stock at an average purchase price of $16.66 per share under the authorization. The repurchase program was funded from cash on hand. The Company did not repurchase any shares of its common stock during the year ended December 31, 2009. As of December 31, 2009, there were 422,917 shares available for repurchase under the authorizations.
38
4) Marketable Securities
The amortized cost, gross unrealized holding gains, gross unrealized holding losses and fair value of available-for-sale marketable securities by major security type and class of security at December 31, 2009 and 2008 are reflected in the following table (in thousands). Unrealized holding gains and losses are included in accumulated other comprehensive income (loss) until realized.
|
|
|
|
|
|
|
|
|
|
|
|
|
|
Amortized |
Gross |
Fair value |
|
||||||
|
At December 31, 2009: |
|
|
|
|
|
|
|
|
|
|
|
|
||||||||||
|
Short term: |
|
|
|
|
|
|
|
|
|
|
|
Government guaranteed - corporate securities |
|
$ |
6,017 |
|
$ |
59 |
|
$ |
6,076 |
|
|
U.S. Treasury bills |
|
|
5,999 |
|
|
1 |
|
|
6,000 |
|
|
Municipal securities |
|
|
16,401 |
|
|
104 |
|
|
16,505 |
|
|
|
||||||||||
|
Total |
|
$ |
28,417 |
|
$ |
164 |
|
$ |
28,581 |
|
|
Long term: |
|
|
|
|
|
|
|
|
|
|
|
Government guaranteed - corporate securities |
|
$ |
3,992 |
|
$ |
136 |
|
$ |
4,128 |
|
|
Municipal securities |
|
|
4,801 |
|
|
108 |
|
|
4,909 |
|
|
|
||||||||||
|
Total |
|
$ |
8,793 |
|
$ |
244 |
|
$ |
9,037 |
|
|
|
||||||||||
|
At December 31, 2008: |
|
|
|
|
|
|
|
|
|
|
|
|
||||||||||
|
Short term: |
|
|
|
|
|
|
|
|
|
|
|
Government securities |
|
$ |
2,009 |
|
$ |
56 |
|
$ |
2,065 |
|
|
Corporate securities |
|
|
1,985 |
|
|
22 |
|
|
2,007 |
|
|
Municipal securities |
|
|
35,440 |
|
|
358 |
|
|
35,798 |
|
|
|
||||||||||
|
Total |
|
$ |
39,434 |
|
$ |
436 |
|
$ |
39,870 |
|
|
Long term: |
|
|
|
|
|
|
|
|
|
|
|
Government guaranteed - corporate securities |
|
$ |
10,023 |
|
$ |
166 |
|
$ |
10,189 |
|
|
Municipal securities |
|
|
30,062 |
|
|
396 |
|
|
30,458 |
|
|
|
||||||||||
|
Total |
|
$ |
40,085 |
|
$ |
562 |
|
$ |
40,647 |
|
5) Fair Value Measurements
A hierarchy for inputs used in measuring fair value is in place that distinguishes market data between observable independent market inputs and unobservable market assumptions by the reporting entity. The hierarchy is intended to maximize the use of observable inputs and minimize the use of unobservable inputs by requiring that the most observable inputs be used when available. Three levels within the hierarchy may be used to measure fair value:
|
|
|
|
|
|
• |
Level 1: Inputs are unadjusted quoted prices in active markets for identical assets and liabilities. |
|
|
||
|
|
• |
Level 2: Inputs include data points that are observable such as quoted prices for similar assets or liabilities in active markets, quoted prices for identical or similar assets or liabilities in markets that are not active, and inputs (other than quoted prices) such as interest rates and yield curves that are observable for the asset or liability, either directly or indirectly. |
|
|
||
|
|
• |
Level 3: Inputs are generated from model-based techniques that use significant assumptions not observable in the market. These unobservable assumptions reflect an entity’s own estimates of assumptions that market participants would use in pricing the asset or liability. |
39
The Company’s assets and liabilities measured at fair value on a recurring basis and the fair value hierarchy utilized to determine such fair values is as follows at December 31, 2009:
|
|
|
|
|
|
|
|
|
|
|
|
|
|
|
|
|
|
|
|
|
Fair Value Measurements Using |
|
|||||||
|
(in thousands) |
Total Carrying |
Quoted Prices in |
Significant Other |
Significant |
|
||||||||
|
Assets: |
|
|
|
|
|
|
|
|
|
|
|
|
|
|
Available-for-sale securities |
|
$ |
37,618 |
|
$ |
— |
|
$ |
37,618 |
|
$ |
— |
|
|
Foreign currency forward exchange contracts |
|
$ |
17 |
|
$ |
— |
|
$ |
17 |
|
$ |
— |
|
Available-for-sale securities in the preceding table are classified as either current or non-current marketable securities in the accompanying consolidated balance sheets. Available-for-sale securities are carried at fair value based on significant observable inputs other than quoted market prices. Such inputs may include benchmark yields, reported trades, broker/dealer quotes, issuer spreads, two-sided markets, benchmark securities, bids, offers and other reference data. Foreign currency forward exchange contracts are also carried at fair value based on significant other observable market inputs, in this case, quoted foreign currency exchange rates. Such valuation represents the amount the Company would receive or pay to terminate the forward exchange contracts at the reporting date.
6) Derivatives
The Company enters into forward foreign exchange contracts principally to hedge intercompany receivables denominated in Euros arising from sales to its subsidiary in Germany. The Company’s foreign exchange contracts do not qualify for hedge accounting. As a result, gains or losses related to mark-to-market adjustments on forward foreign exchange contracts are recognized as other income or expense in the consolidated income statement during the period in which the instruments are outstanding. The fair value of forward foreign exchange contracts represents the amount the Company would receive or pay to terminate the forward exchange contracts at the reporting date and is recorded in other current assets or other current liabilities depending on whether the net amount is a gain or a loss. The Company does not utilize financial instruments for trading or other speculative purposes.
As of December 31, 2009, the Company had three outstanding foreign exchange contracts with a notional amount totaling approximately $550,000. These contracts mature during 2010 and bear exchange rates ranging from 1.4554 and 1.4913 U.S. Dollars per Euro. As of December 31, 2009, the fair value of foreign exchange contracts resulted in a net gain position of $17,000, which is recorded in other current assets.
As of December 31, 2008, the Company had 15 outstanding foreign exchange contracts with a notional amount totaling $2,601,000, all maturing during the first half of 2009 at exchange rates ranging from 1.2431 to 1.3540 U.S. Dollars per Euro. As of December 31, 2008, the fair value of foreign exchange contracts resulted in a net loss position of approximately $238,000, which is recorded in other current liabilities.
Realized and unrealized gains or losses on derivative instruments related to foreign currency exchange contracts and their location on the Company’s consolidated statements of income are as follows (in thousands):
|
|
|
|
|
|
|
|
|
|
|
|
|
|
|
|
Year Ended |
|
||||
|
Derivative Instrument |
|
Location |
|
2009 |
|
2008 |
|
||
|
|
|||||||||
|
Foreign Exchange Contracts |
|
Gain (loss) on currency exchange |
|
$ |
266 |
|
$ |
(323 |
) |
The net gains or losses from foreign exchange contracts reflected above were largely offset by the underlying transaction net losses or gains, respectively, arising from the foreign currency exposures for which these contracts relate.
The gross fair market value of derivative instruments related to foreign currency exchange contracts and their location on the Company’s consolidated balance sheets is as follows as of December 31, 2009 (in thousands):
40
|
|
|
|
|
|
|
|
|
|
|
|
|
|
|
|
Asset Derivatives |
|
Liability Derivatives |
|
||||||
|
Derivative Instrument |
|
Location |
|
December 31, |
|
Location |
|
December 31, |
|
||
|
|
|
|
|
|
|
|
|
|
|
|
|
|
Foreign Exchange Contracts |
|
Other current assets (1) |
|
$ |
17 |
|
Other current liabilities(1) |
|
$ |
— |
|
|
|
|
|
(1) |
As the Company’s foreign exchange agreement is subject to a master netting arrangement, the Company’s policy is to record the fair value of outstanding foreign exchange contracts as other current assets or other current liabilities, based on whether outstanding contracts are in a net gain or loss position, respectively. See Note 5, “Fair Value Measurements,” for additional information regarding the fair value measurements of derivative instruments related to foreign currency exchange contracts. |
The Company enters into its foreign exchange contracts with a single counterparty, a financial institution. The Company manages its concentration of counterparty risk associated with foreign exchange contracts by periodically assessing relevant information such as the counterparty’s current financial statements, credit agency reports and/or credit references. To further mitigate credit risk, the Company’s Foreign Exchange Agreement with its counterparty includes a master netting arrangement, which allows netting of asset and liability positions of outstanding foreign exchange contracts if settlement were required.
7) Inventories
Inventories consisted of the following as of December 31, (in thousands):
|
|
|
|
|
|
|
|
|
|
|
2009 |
2008 |
|
||||
|
|
|||||||
|
Finished goods and demonstration equipment |
|
$ |
1,425 |
|
$ |
1,717 |
|
|
Purchased parts and subassemblies |
|
|
2,698 |
|
|
3,908 |
|
|
|
|
$ |
4,123 |
|
$ |
5,625 |
|
8) Property and Equipment
Property and equipment consisted of the following as of December 31, (in thousands):
|
|
|
|
|
|
|
|
|
|
|
|
2009 |
|
2008 |
|
||
|
Land and land improvements |
|
$ |
1,096 |
|
$ |
1,096 |
|
|
Building and building improvements |
|
|
2,808 |
|
|
2,806 |
|
|
Manufacturing equipment |
|
|
5,543 |
|
|
3,071 |
|
|
Development fixtures and equipment |
|
|
760 |
|
|
760 |
|
|
Data equipment and furniture |
|
|
5,116 |
|
|
4,814 |
|
|
Leasehold improvements |
|
|
1,106 |
|
|
1,089 |
|
|
|
|
|
16,430 |
|
|
13,636 |
|
|
Less accumulated depreciation and amortization |
|
|
(8,575 |
) |
|
(7,453 |
) |
|
|
|
$ |
7,855 |
|
$ |
6,183 |
|
Depreciation and amortization expense was $1,250,000, $1,372,000 and $1,525,000 for the years ended December 31, 2009, 2008 and 2007, respectively.
Included in manufacturing equipment as of December 31, 2009 is $2.4 million of production tooling capitalized by the Company in late 2009 in conjunction with a development and manufacturing arrangement further described in Note 2. The Company will depreciate the production tooling over a three-year period upon commencement of production scheduled for the first quarter of 2010. The capitalized amount of $2.4 million is included in trade accounts payable as of December 31, 2009 and is expected to be paid in 2010.
41
On August 11, 2008, a Purchase and Sale Agreement dated July 31, 2008 between the Company and 7725 Washington Avenue Corp. (“the Seller”) became effective. Under the Purchase and Sale Agreement, the Company agreed to purchase from the Seller the real property and building the Company previously leased as its corporate headquarters in Edina, Minnesota. The closing of the purchase transaction was effective September 30, 2008. The aggregate cost of the property totaled $3.9 million, consisting of the base purchase price of $3.8 million and other direct costs of $0.1 million. The Company financed the purchase using cash on hand. The $3.9 million purchase price of the property was allocated to the building and land based on relative market values, with 72% of the value allocated to the building ($2.8 million) and 28% allocated to the land ($1.1 million). The Company is depreciating the building cost over a period of 15 years.
|
|
|
|
9) |
Credit Agreement |
On March 29, 2004, the Company entered into a term note agreement (the Credit Agreement) with a bank. The Credit Agreement, as amended effective July 1, 2009, is effective until July 1, 2010, and allows for advances under an unsecured revolving loan up to a maximum advance of $10 million to be used for general Company operating expenses. The outstanding principal balance of the note bears interest either 1) at a fluctuating rate per annum equal to a Base Rate in effect from time to time, or 2) at a fixed rate per annum determined by the Company’s bank to be two and one quarter percent (2.25%) above LIBOR in effect on the first day of the applicable fixed rate term. The Base Rate is a fluctuating rate equal to the highest of 1) the Prime Rate in effect on such day, 2) a rate determined by the Company’s bank to be one and one-half percent (1.50%) above the daily one month LIBOR in effect on such day, and 3) the Federal Funds Rate plus one and one-half percent (1.50%). No amounts were outstanding under the Credit Agreement at December 31, 2009 and 2008.
The Credit Agreement contains various covenants pertaining to minimum tangible net worth, restrictions on the amount of net losses for each fiscal quarter and minimum unencumbered liquid assets. The Company was in compliance with all covenants as of December 31, 2009.
|
|
|
|
10) |
Income Taxes |
The components of income before income taxes consist of the following (in thousands):
|
|
|
|
|
|
|
|
|
|
|
|
|
|
|
Year Ended December 31, |
|
|||||||
|
|
|
2009 |
|
2008 |
|
2007 |
|
|||
|
|
|
|
|
|
|
|
|
|
|
|
|
Income before income taxes: |
|
|
|
|
|
|
|
|
|
|
|
Domestic |
|
$ |
12,065 |
|
$ |
14,427 |
|
$ |
23,907 |
|
|
Foreign |
|
|
1,047 |
|
|
32 |
|
|
487 |
|
|
|
|
$ |
13,112 |
|
$ |
14,459 |
|
$ |
24,394 |
|
The provision for income tax expense (benefit) consists of the following (in thousands):
|
|
|
|
|
|
|
|
|
|
|
|
|
|
|
Year Ended December 31, |
|
|||||||
|
|
|
2009 |
|
2008 |
|
2007 |
|
|||
|
|
|
|
|
|
|
|
|
|
|
|
|
Current: |
|
|
|
|
|
|
|
|
|
|
|
U.S. Federal |
|
$ |
3,671 |
|
$ |
4,007 |
|
$ |
7,718 |
|
|
State |
|
|
827 |
|
|
641 |
|
|
1,637 |
|
|
Foreign |
|
|
348 |
|
|
319 |
|
|
396 |
|
|
Total current |
|
|
4,846 |
|
|
4,967 |
|
|
9,751 |
|
|
|
|
|
|
|
|
|
|
|
|
|
|
Deferred: |
|
|
|
|
|
|
|
|
|
|
|
U.S. Federal |
|
|
(143 |
) |
|
(37 |
) |
|
(897 |
) |
|
State |
|
|
(86 |
) |
|
98 |
|
|
(221 |
) |
|
Total deferred |
|
|
(229 |
) |
|
61 |
|
|
(1,118 |
) |
|
|
|
|
|
|
|
|
|
|
|
|
|
|
|
$ |
4,617 |
|
$ |
5,028 |
|
$ |
8,633 |
|
42
Total income tax expense differs from the expected income tax expense, computed by applying the federal statutory rate of 35% to earnings before income taxes as follows (in thousands):
|
|
|
|
|
|
|
|
|
|
|
|
|
|
|
Year Ended December 31, |
|
|||||||
|
|
|
2009 |
|
2008 |
|
2007 |
|
|||
|
|
|
|
|
|
|
|
|
|
|
|
|
Expected income tax expense |
|
$ |
4,589 |
|
$ |
5,061 |
|
$ |
8,540 |
|
|
State income taxes, net of federal tax effect |
|
|
481 |
|
|
480 |
|
|
920 |
|
|
Manufacturer’s deduction |
|
|
(120 |
) |
|
(80 |
) |
|
(234 |
) |
|
Federal R&D credit |
|
|
(38 |
) |
|
(34 |
) |
|
(130 |
) |
|
Tax-exempt interest income |
|
|
(367 |
) |
|
(663 |
) |
|
(751 |
) |
|
Change in valuation allowance |
|
|
(22 |
) |
|
437 |
|
|
250 |
|
|
Benefit of lower federal tax bracket |
|
|
(100 |
) |
|
(100 |
) |
|
— |
|
|
Other, net |
|
|
194 |
|
|
(73 |
) |
|
38 |
|
|
|
|
|
|
|
|
|
|
|
|
|
|
|
|
$ |
4,617 |
|
$ |
5,028 |
|
$ |
8,633 |
|
The tax effects of temporary differences that give rise to significant portions of deferred tax assets (liabilities) as of December 31 are presented below (in thousands):
|
|
|
|
|
|
|
|
|
|
|
|
2009 |
|
2008 |
|
||
|
Deferred tax assets: |
|
|
|
|
|
|
|
|
Inventory provisions and uniform capitalization |
|
$ |
302 |
|
$ |
374 |
|
|
Accounts receivable allowances |
|
|
109 |
|
|
167 |
|
|
Non-qualified stock option and restricted stock expense |
|
|
1,629 |
|
|
1,327 |
|
|
Deferred maintenance revenue |
|
|
855 |
|
|
610 |
|
|
Unrecognized tax benefits |
|
|
32 |
|
|
253 |
|
|
Loss carryforward of foreign subsidiary |
|
|
906 |
|
|
928 |
|
|
Other accruals and reserves |
|
|
253 |
|
|
185 |
|
|
Other |
|
|
154 |
|
|
93 |
|
|
Total deferred tax assets before valuation allowance |
|
|
4,240 |
|
|
3,937 |
|
|
Less valuation allowance |
|
|
(906 |
) |
|
(928 |
) |
|
Total deferred tax assets |
|
$ |
3,334 |
|
$ |
3,009 |
|
|
|
|
|
|
|
|
|
|
|
Deferred tax liabilities: |
|
|
|
|
|
|
|
|
Unrealized gain on marketable securities |
|
$ |
(158 |
) |
$ |
(384 |
) |
|
Total deferred tax liabilities |
|
$ |
(158 |
) |
$ |
(384 |
) |
|
Total net deferred tax assets |
|
$ |
3,176 |
|
$ |
2,625 |
|
The Company generally believes that it is more likely than not that the future results of its operations will generate sufficient taxable income to realize the tax benefits related to the Company’s net deferred tax assets. However, the Company established a full valuation allowance on the tax benefit of a loss carryforward for a subsidiary in Japan established in May 2005. The cumulative pre-tax loss amounts generated by the Japanese subsidiary from 2005 through 2009 approximated $2.5 million. The 2009 amounts for the deferred tax asset associated with the loss carryforward of the foreign subsidiary and related valuation allowance reflect reductions for an unrecognized tax benefit of $187,000. The valuation allowances were calculated in accordance with the requirement that a valuation allowance be established or maintained when it is “more likely than not” that all or a portion of deferred tax assets will not be realized. The available loss carryforward at December 31, 2009 of the Company’s Japanese subsidiary is scheduled to expire between tax years 2012 and 2016.
The Company has not provided deferred taxes on unremitted earnings attributable to its international subsidiary in Germany that are considered to be reinvested indefinitely. These earnings relate to ongoing operations and were approximately $5.2 million as of December 31, 2009.
43
A recognition threshold and measurement criteria are in place for the financial statement recognition and measurement of a tax position taken or expected to be taken in a tax return. Guidance is also provided on derecognition, classification, interest and penalties, accounting in interim periods, disclosure and transition.
The impact on the Company’s financial statements of adopting the
recognition threshold and measurement criteria was insignificant; as a result,
a cumulative effect adjustment to the January 1, 2007 balance of retained
earnings was not recorded.
A reconciliation of the beginning and ending amounts
of gross unrecognized tax benefits for the years ended December 31, 2009 and
2008 is presented in the table below (in thousands):
|
|
|
|
|
|
|
|
|
|
|
|
2009 |
|
2008 |
|
||
|
Gross unrecognized tax benefits at beginning of year |
|
$ |
361 |
|
$ |
187 |
|
|
Increases related to: |
|
|
|
|
|
|
|
|
Prior year income tax positions |
|
|
259 |
|
|
— |
|
|
Current year income tax positions |
|
|
30 |
|
|
29 |
|
|
Reclassification |
|
|
— |
|
|
217 |
|
|
Decreases related to: |
|
|
|
|
|
|
|
|
Prior year income tax positions |
|
|
(224 |
) |
|
— |
|
|
Settlements |
|
|
(62 |
) |
|
(72 |
) |
|
Gross unrecognized tax benefits at end of year |
|
$ |
364 |
|
$ |
361 |
|
The increase in gross unrecognized tax benefits in 2009 related to prior year tax positions includes $187,000 of unrecognized tax benefits that are offset against a deferred tax asset associated with a cumulative net operating loss for the Company’s subsidiary in Japan.
The decrease in gross unrecognized tax benefits in 2009 for prior year income tax positions of $224,000 is offset by a deferred tax asset of $217,000. The reclassification in 2008 of $217,000 resulted from a balance sheet reclassification of a deferred tax asset that had previously been offset in unrecognized tax benefits as of December 31, 2007.
Included in the balance of unrecognized tax benefits at December 31, 2009 are potential benefits of $343,000 that if recognized, would affect the effective tax rate. The difference between this amount and the corresponding amount of gross unrecognized tax benefits relates primarily to deferred federal benefits of uncertain tax positions.
The Company does not anticipate that the total amount of unrecognized tax benefits as of December 31, 2009 will change significantly by December 31, 2010.
The Company recognizes accrued interest and penalties related to unrecognized tax benefits as a component of income tax expense. Total accrued interest and penalties amounted to $36,000 and $59,000 on a gross basis at December 31, 2009 and 2008, respectively, and are excluded from the reconciliation of unrecognized tax benefits presented above. Interest and penalties recognized in the consolidated statements of income related to uncertain tax positions amounted to a net $23,000 benefit in 2009 and $19,000 of expense in 2008.
The Company files income tax returns in the U.S. federal jurisdiction and various state and foreign jurisdictions. As of December 31, 2009, the Company was no longer subject to income tax examinations for taxable years before 2006 and 2005 in the case of U.S. federal and German taxing authorities, respectively, and taxable years generally before 2005 in the case of state taxing authorities, consisting primarily of Minnesota, California and Maryland.
|
|
|
|
11) |
Stockholders’ Equity |
Preferred Stock Purchase Rights
On September 16, 2003, the Company’s Board of Directors adopted a shareholder rights plan and declared a dividend of one preferred share purchase right (a “Right”) for each share of common stock of the Company outstanding on October 6, 2003 and with respect to each share of common stock issued thereafter. The rights become exercisable only after any person or group (the “Acquiring Person”) becomes or would become the beneficial owner of 15% or more of the Company’s outstanding common stock.
Each Right entitles the registered holder to purchase from the Company 1/100 of a Series A Junior Participating Preferred Share at a price of $100.00 per 1/100 of a Preferred Share, subject to adjustment. In the event that any person or group becomes an Acquiring Person, each holder of a Right, other than Rights that are or were beneficially owned by the Acquiring Person (which will thereafter be void), will thereafter have the right to receive, upon exercise thereof at the then current exercise price of the Right, that number of Common Shares having a market value of two times the exercise price of the Right, subject to certain possible adjustments. If the
44
Company is acquired in certain mergers or other business combination transactions, or 50% or more of the assets or earning power of the Company and its subsidiaries (taken as a whole) are sold, each holder of a Right (other than Rights that have become void under the terms of the Rights Agreement) will thereafter have the right to receive, upon exercise of the Right at the then current exercise price of the Right, the number of common shares of the acquiring company (or, in certain cases, one of its affiliates) having a market value of two times the exercise price of the Right. At any time prior to the time that a person or group has become an Acquiring Person, the Company’s Board of Directors may redeem the Rights in whole, but not in part, at a price of $.001 per Right, subject to adjustment, payable in cash. The Rights will expire at the close of business on September 16, 2013, unless extended or earlier redeemed by the Company. No preferred shares have been issued or are outstanding under the shareholder rights plan as of December 31, 2009.
|
|
|
|
12) |
Net Income Per Share |
Basic net income per common share is determined by dividing net income by the basic weighted average number of shares of common stock outstanding. Diluted net income per common share includes the potentially dilutive effect of common shares issued in connection with outstanding stock options using the treasury stock method and the dilutive impact of restricted stock units. Stock options to acquire 735,000, 739,000 and 321,000 weighted average common shares for the years ended December 31, 2009, 2008 and 2007 have been excluded from the computation of diluted weighted average shares outstanding for each respective period as their effect is anti-dilutive.
Effective January 1, 2009, the Company adopted guidance which requires all outstanding unvested share-based payment awards that contain nonforfeitable rights to dividends or dividend equivalents (whether paid or unpaid) to be considered participating securities and shall be included in the computation of basic and diluted earnings per share using the two-class method. As required by this guidance, the Company increased the amount of basic weighted average shares outstanding previously reported for the year ended December 31, 2008 by approximately 3,000 shares. These amounts pertain to outstanding unvested restricted stock deemed to be participating securities. The adjustment had no impact on previously reported earnings per share amounts. The following table identifies the components of net income per basic and diluted share (in thousands, except for per share data):
|
|
|
|
|
|
|
|
|
|
|
|
|
|
|
December 31, |
|
|||||||
|
|
|
2009 |
|
2008 |
|
2007 |
|
|||
|
|
|
|
|
|
|
|
|
|
|
|
|
Shares outstanding at end of period |
|
|
9,472 |
|
|
9,335 |
|
|
9,706 |
|
|
|
|
|
|
|
|
|
|
|
|
|
|
Basic weighted average shares outstanding |
|
|
9,374 |
|
|
9,559 |
|
|
9,915 |
|
|
|
|
|
|
|
|
|
|
|
|
|
|
Dilutive effect of stock options and restricted stock |
|
|
133 |
|
|
170 |
|
|
456 |
|
|
Total diluted weighted average shares outstanding |
|
|
9,507 |
|
|
9,729 |
|
|
10,371 |
|
|
|
|
|
|
|
|
|
|
|
|
|
|
Net income |
|
$ |
8,495 |
|
$ |
9,431 |
|
$ |
15,761 |
|
|
|
|
|
|
|
|
|
|
|
|
|
|
Basic net income per common share |
|
$ |
0.91 |
|
$ |
0.99 |
|
$ |
1.59 |
|
|
|
|
|
|
|
|
|
|
|
|
|
|
Diluted net income per common share |
|
$ |
0.89 |
|
$ |
0.97 |
|
$ |
1.52 |
|
45
13) Lease Commitments
The Company leases certain of its facilities and some of its equipment under non-cancelable operating lease arrangements. The rental payments under these leases are charged to expense as incurred. The following is a schedule of future minimum lease payments, excluding property taxes and other operating expenses, required under all non-cancelable operating leases (in thousands):
|
|
|
|
|
|
|
Year ending December 31, |
|
Total |
|
|
|
|
|
|
|
|
|
2010 |
|
$ |
439 |
|
|
2011 |
|
|
202 |
|
|
2012 |
|
|
20 |
|
|
2013 |
|
|
1 |
|
|
|
|
|
|
|
|
Minimum lease payments |
|
$ |
662 |
|
Rent expense under operating leases amounted to approximately $903,000, $1,259,000 and $1,161,000 for the years ended December 31, 2009, 2008 and 2007, respectively.
14) Profit Sharing and Savings Plan
Rimage has a profit sharing and savings plan under Section 401(k) of the Internal Revenue Code. The plan allows employees to contribute up to 100% of pretax compensation. The Company matches a percentage of employees’ contributions. Matching contributions totaled $260,000, $302,000 and $313,000 in 2009, 2008 and 2007, respectively.
15) Business Segment Information / Major Customers
The Company has identified one operating segment consisting of high-performance digital publishing systems that are used by businesses to produce recordable CD, DVD and Blu-ray discs with customized digital content on an on-demand basis. The Company’s hardware products consist of two primary product lines: The Producer line, which accommodates higher volume requirements for production of recordable CD, DVD or Blu-ray media, and the Desktop line of lower-cost products for office and other desktop applications. The Company also sells related consumables (media kits, ribbons, ink cartridges and Rimage-branded blank CD-R, DVD-R and Blu-ray media) and services (primarily maintenance contracts and repairs) for use with its digital publishing systems. The Company conducts operations from its U.S. corporate headquarters and from subsidiaries in Europe and Japan.
The Company’s two primary product lines (Producer and Desktop) and three primary geographic locations have similar economic characteristics. Both product lines are digital publishing systems as described above. The production processes are also similar; both product lines are assembled from components purchased from third party suppliers, consisting of recordable DVD or Blu-ray drives, printers, circuit boards, electric motors, machined and molded parts, precision sheet metal assemblies and other mechanical parts. Both product lines are sold from each of the Company’s geographic locations to similar classes of commercial customers in similar vertical markets, including digital photography, medical imaging, business services, law enforcement and video workflows. Both product lines utilize Rimage consumables and services and generate recurring revenues from each. Rimage used similar methods to distribute its products from each geographic location during 2009. These consisted of a two-tier distribution channel of distributors to value added resellers in Europe, the U.S. and Latin America; a distributor or OEM to end-user distribution channel in Asia Pacific, some areas in Europe and some U.S. market applications; and direct sales to select accounts using its own sales force. Furthermore, the types of information and internal reports used by management to monitor performance, evaluate results of operations, allocate resources and otherwise manage the business support a single reportable segment. Accordingly, based on these similarities, the Company has concluded that its operations, consisting of two primary product lines sold from three primary geographic locations, comprise one operating segment for purposes of reporting under this disclosure.
46
The following represents sales amounts and related accounts receivable balances generated by the Company’s unaffiliated customers that provided more than 10% of consolidated revenues (in thousands):
|
|
|
|
|
|
|
|
|
|
|
|
|
|
|
Year ended December 31, |
|
|||||||
|
|
|
2009 |
|
2008 |
|
2007 |
|
|||
|
|
|
Revenues |
|
|||||||
|
Customer A |
|
$ |
14,972 |
|
$ |
13,883 |
|
$ |
14,921 |
|
|
Customer B |
|
$ |
9,425 |
|
$ |
9,497 |
|
|
* |
|
|
Customer C |
|
$ |
8,673 |
|
$ |
9,686 |
|
|
* |
|
|
|
|
|
|
|
|
|
|
|
|
|
|
|
|
December 31, |
|
|||||||
|
|
|
2009 |
|
2008 |
|
2007 |
|
|||
|
|
|
Accounts Receivable |
|
|||||||
|
Customer A |
|
$ |
2,047 |
|
$ |
1,042 |
|
$ |
1,982 |
|
|
Customer B |
|
$ |
438 |
|
$ |
773 |
|
|
* |
|
|
Customer C |
|
$ |
1,486 |
|
$ |
1,198 |
|
|
* |
|
|
|
|
|
* |
Sales to customer did not represent more than 10% of consolidated revenues. |
The Company’s revenues from each of its principal geographic regions are presented based on customer location as follows (in thousands):
|
|
|
|
|
|
|
|
|
|
|
|
|
|
|
Year Ended December 31, |
|
|||||||
|
|
|
2009 |
|
2008 |
|
2007 |
|
|||
|
North America |
|
$ |
48,956 |
|
$ |
52,992 |
|
$ |
70,046 |
|
|
Europe |
|
|
26,509 |
|
|
31,610 |
|
|
31,885 |
|
|
Other |
|
|
7,762 |
|
|
6,792 |
|
|
6,943 |
|
|
|
|
|
|
|
|
|
|
|
|
|
|
Total |
|
$ |
83,227 |
|
$ |
91,394 |
|
$ |
108,874 |
|
Long-lived assets of the Company were located as follows (in thousands):
|
|
|
|
|
|
|
|
|
|
|
|
December 31, 2009 |
|
December 31, 2008 |
|
||
|
North America |
|
$ |
7,275 |
|
$ |
5,511 |
|
|
Germany |
|
|
536 |
|
|
630 |
|
|
Japan |
|
|
44 |
|
|
42 |
|
|
|
|
$ |
7,855 |
|
$ |
6,183 |
|
47
The Company’s revenues from each of its principal products and services were as follows (in thousands):
|
|
|
|
|
|
|
|
|
|
|
|
|
|
|
Year Ended December 31, |
|
|||||||
|
|
|
2009 |
|
2008 |
|
2007 |
|
|||
|
Equipment: |
|
|
|
|
|
|
|
|
|
|
|
Producer |
|
$ |
27,868 |
|
$ |
30,297 |
|
$ |
46,829 |
|
|
Desktop |
|
|
5,089 |
|
|
5,783 |
|
|
9,435 |
|
|
Total |
|
|
32,957 |
|
|
36,080 |
|
|
56,264 |
|
|
|
|
|
|
|
|
|
|
|
|
|
|
Consumables and parts |
|
|
39,328 |
|
|
45,768 |
|
|
43,807 |
|
|
|
|
|
|
|
|
|
|
|
|
|
|
Service |
|
|
10,942 |
|
|
9,546 |
|
|
8,803 |
|
|
|
|
|
|
|
|
|
|
|
|
|
|
Total |
|
$ |
83,227 |
|
$ |
91,394 |
|
$ |
108,874 |
|
16) Related Party Transactions
One of the Company’s non-employee directors was a member of the board of directors through August 2007 of one of the Company’s vendors, a supplier of printed circuit boards used in the assembly of the Company’s digital publishing systems. Effective September 2007, this related party relationship no longer exists. The Company purchased component parts from this supplier approximating $1.9 million for the year ended December 31, 2007. Outstanding accounts payable with this supplier totaled approximately $70,000 at December 31, 2007, payable under standard 30-day payment terms.
17) Contingencies
The Company is exposed to a number of asserted and unasserted claims encountered in the normal course of business. In the opinion of management, the resolution of these matters will not have a material adverse effect on the Company’s financial position or results of operations.
18) Subsequent Event
Over the past several years, Rimage has utilized the following principal means of distributing its products: A two-tier distribution channel of distributors to value added resellers in Europe, the U.S. and Latin America; a distributor or OEM to end-user distribution channel in Asia Pacific, some areas in Europe and some U.S. market applications; and direct sales to select accounts using its own sales force.
On January 25, 2010, the Company notified distributors of its products in the United States that the Company is terminating these distributor relationships effective April 1, 2010. The Company also terminated distribution relationships in Germany and the United Kingdom effective April 1, 2010. The termination of these distributors is part of the Company’s plan to improve the efficiency of its sales channels. Following termination of the distributors, the Company will sell product in these regions to end-user customers primarily through value-added resellers or other strategic partners and also directly to select accounts through its own sales force. The Company is currently evaluating the expected future impact of this change, if any, on its consolidated financial statements.
48
19) Supplemental Quarterly Data – Unaudited (dollars in thousands, except per share data)
|
|
|
|
|
|
|
|
|
|
|
|
|
|
|
|
|
|
|
|
|
|
|
|
|
|
|
|
|
|
2009 |
|
2008 |
|
||||||||||||||||||||
|
|
|
Fourth |
|
Third |
|
Second |
|
First |
|
Fourth |
|
Third |
|
Second |
|
First |
|
||||||||
|
|
|
|
|
|
|
|
|
|
|
|
|
|
|
|
|
|
|
|
|
|
|
|
|
|
|
|
Revenues |
|
$ |
22,686 |
|
$ |
22,365 |
|
$ |
19,818 |
|
$ |
18,358 |
|
$ |
20,749 |
|
$ |
25,210 |
|
$ |
22,686 |
|
$ |
22,749 |
|
|
Cost of revenues |
|
|
11,203 |
|
|
11,268 |
|
|
10,630 |
|
|
9,793 |
|
|
12,654 |
|
|
13,233 |
|
|
12,772 |
|
|
13,072 |
|
|
Gross profit |
|
|
11,483 |
|
|
11,097 |
|
|
9,188 |
|
|
8,565 |
|
|
8,095 |
|
|
11,977 |
|
|
9,914 |
|
|
9,677 |
|
|
|
|
|
|
|
|
|
|
|
|
|
|
|
|
|
|
|
|
|
|
|
|
|
|
|
|
|
Operating expenses: |
|
|
|
|
|
|
|
|
|
|
|
|
|
|
|
|
|
|
|
|
|
|
|
|
|
|
Research and development |
|
|
2,153 |
|
|
1,514 |
|
|
1,501 |
|
|
1,975 |
|
|
1,160 |
|
|
1,227 |
|
|
1,513 |
|
|
1,351 |
|
|
Selling, general and administrative |
|
|
6,445 |
|
|
5,009 |
|
|
5,148 |
|
|
5,342 |
|
|
5,129 |
|
|
5,225 |
|
|
5,672 |
|
|
6,638 |
|
|
Total operating expenses |
|
|
8,598 |
|
|
6,523 |
|
|
6,649 |
|
|
7,317 |
|
|
6,289 |
|
|
6,452 |
|
|
7,185 |
|
|
7,989 |
|
|
|
|
|
|
|
|
|
|
|
|
|
|
|
|
|
|
|
|
|
|
|
|
|
|
|
|
|
Operating income |
|
|
2,885 |
|
|
4,574 |
|
|
2,539 |
|
|
1,248 |
|
|
1,806 |
|
|
5,525 |
|
|
2,729 |
|
|
1,688 |
|
|
|
|
|
|
|
|
|
|
|
|
|
|
|
|
|
|
|
|
|
|
|
|
|
|
|
|
|
Other income (expense): |
|
|
|
|
|
|
|
|
|
|
|
|
|
|
|
|
|
|
|
|
|
|
|
|
|
|
Interest, net |
|
|
219 |
|
|
309 |
|
|
458 |
|
|
556 |
|
|
616 |
|
|
691 |
|
|
676 |
|
|
836 |
|
|
Realized gain on sale of marketable securities |
|
|
— |
|
|
— |
|
|
278 |
|
|
— |
|
|
— |
|
|
— |
|
|
— |
|
|
— |
|
|
Gain (loss) on currency exchange |
|
|
1 |
|
|
5 |
|
|
87 |
|
|
(45 |
) |
|
18 |
|
|
40 |
|
|
(410 |
) |
|
247 |
|
|
Other, net |
|
|
3 |
|
|
(4 |
) |
|
— |
|
|
(1 |
) |
|
(3 |
) |
|
(20 |
) |
|
21 |
|
|
(1 |
) |
|
Total other income, net |
|
|
223 |
|
|
310 |
|
|
823 |
|
|
510 |
|
|
631 |
|
|
711 |
|
|
287 |
|
|
1,082 |
|
|
|
|
|
|
|
|
|
|
|
|
|
|
|
|
|
|
|
|
|
|
|
|
|
|
|
|
|
Income before income taxes |
|
|
3,108 |
|
|
4,884 |
|
|
3,362 |
|
|
1,758 |
|
|
2,437 |
|
|
6,236 |
|
|
3,016 |
|
|
2,770 |
|
|
Income tax expense |
|
|
880 |
|
|
1,775 |
|
|
1,389 |
|
|
573 |
|
|
725 |
|
|
2,230 |
|
|
1,089 |
|
|
984 |
|
|
Net income |
|
$ |
2,228 |
|
$ |
3,109 |
|
$ |
1,973 |
|
$ |
1,185 |
|
$ |
1,712 |
|
$ |
4,006 |
|
$ |
1,927 |
|
$ |
1,786 |
|
|
|
|
|
|
|
|
|
|
|
|
|
|
|
|
|
|
|
|
|
|
|
|
|
|
|
|
|
Net income per basic share |
|
$ |
0.24 |
|
$ |
0.33 |
|
$ |
0.21 |
|
$ |
0.13 |
|
$ |
0.19 |
|
$ |
0.42 |
|
$ |
0.20 |
|
$ |
0.18 |
|
|
|
|
|
|
|
|
|
|
|
|
|
|
|
|
|
|
|
|
|
|
|
|
|
|
|
|
|
Net income per diluted share |
|
$ |
0.23 |
|
$ |
0.33 |
|
$ |
0.20 |
|
$ |
0.13 |
|
$ |
0.18 |
|
$ |
0.42 |
|
$ |
0.19 |
|
$ |
0.18 |
|
During the second quarter of 2008 the Company determined that translation gains associated with an intercompany loan that was deemed to be indefinitely invested in the first quarter of 2008 were recorded in other income/(expense) as transaction gains during the first quarter of 2008, but should have been recorded as other comprehensive income at that time. The Company recorded a pre-tax out-of-period adjustment of approximately $244,000 during the second quarter of 2008 to reduce the transaction gains and to increase other comprehensive income to properly state accumulated other comprehensive income as of June 30, 2008.
|
|
|
|
CHANGES IN AND DISAGREEMENTS WITH ACCOUNTANTS ON ACCOUNTING AND FINANCIAL DISCLOSURE |
None.
|
|
|
|
CONTROLS AND PROCEDURES |
|
|
|
|
a) |
Evaluation of Disclosure Controls and Procedures |
The Company’s Chief Executive Officer, Sherman L. Black, and the Company’s Chief Financial Officer, Robert M. Wolf, have evaluated the Company’s disclosure controls and procedures as of December 31, 2009. Based upon such evaluation, they have concluded that these disclosure controls and procedures are effective. The Company’s Chief
49
Executive Officer and Chief Financial Officer used the definition of “disclosure controls and procedures” as set forth in Rule 13a-15(e) under the Exchange Act in making their conclusion as to the effectiveness of such controls and procedures.
|
|
|
|
(b) |
Changes in Internal Control Over Financial Reporting |
There have been no changes in internal controls over financial reporting that occurred during the fourth quarter ended December 31, 2009 that have materially affected, or are reasonable likely to materially affect, the Company’s internal control over financial reporting.
See Item 8. “Financial Statements and Supplementary Data” of this Form 10-K for management’s report on internal control over financial reporting and the report on internal control over financial reporting of the Company’s Independent Registered Accounting Firm.
|
|
|
|
OTHER INFORMATION |
|
|
|
|
|
None. |
|
|
|
|
|
|
|
|
DIRECTORS, EXECUTIVE OFFICERS AND CORPORATE GOVERNANCE |
|
The information required by this item is incorporated herein by reference to the following sections of the Company’s Proxy Statement for its 2010 Annual Meeting of Shareholders, which will be filed with the Securities and Exchange Commission pursuant to Regulation 14A within 120 days after the close of the fiscal year for which this report is filed (the “Proxy Statement”):
|
|
|
|
|
|
– |
Ownership of Voting Securities by Principal Holders and Management; |
|
|
|
|
|
|
– |
Proposal 1—Election of Directors; |
|
|
|
|
|
|
– |
Nominees for Election of Directors; |
|
|
|
|
|
|
– |
Executive Officers of the Company; |
|
|
|
|
|
|
– |
Executive Compensation; |
|
|
|
|
|
|
– |
Section 16(a) Beneficial Ownership Reporting Compliance; |
|
|
|
|
|
|
– |
Corporate Governance; and |
|
|
|
|
|
|
– |
Code of Ethics. |
|
|
|
|
EXECUTIVE COMPENSATION |
The information required by this item is incorporated herein by reference to the section of the Company’s Proxy Statement entitled “Executive Compensation.”
|
|
|
|
SECURITY OWNERSHIP OF CERTAIN BENEFICIAL OWNERS AND MANAGEMENT AND RELATED STOCKHOLDER MATTERS |
The information required by this item is incorporated herein by reference to the section of the Company’s Proxy Statement entitled “Ownership of Voting Securities by Principal Holders and Management,” and is incorporated herein by reference to Part II, Item 5 entitled “Market for Common Equity, Related Stockholder Matters and Issuer Purchases of Equity Securities” of this Annual Report on Form 10-K.
50
|
|
|
|
|
CERTAIN RELATIONSHIPS AND RELATED TRANSACTIONS AND DIRECTOR INDEPENDENCE |
||
|
|
|
|
|
The information required by this item is incorporated by reference to the sections of the Company’s Proxy Statement entitled “Certain Relationships and Related Person Transactions” and “Corporate Governance.” |
||
|
|
||
|
PRINCIPAL ACCOUNTANT FEES AND SERVICES |
||
|
|
|
|
|
The information required by this item is incorporated herein by reference to the section of the Company’s Proxy Statement entitled “Relationship with Independent Registered Public Accounting Firm.” |
||
|
|
||
|
|
|
|
|
EXHIBITS AND FINANCIAL STATEMENT SCHEDULES |
||
|
|
|
|
|
(a) |
(1) Financial Statements. See Part II, Item 8 of this report. |
|
|
|
|
|
|
|
(2) Financial Statement Schedules. See page 55 of this report. |
|
|
|
|
|
|
|
(3) Exhibits. See Index to Exhibits on page 53 of this report. |
|
|
|
|
|
|
(b) |
See Index to Exhibits on page 53 of this report. |
|
51
Pursuant to the requirements of Section 13 or 15 (d) of the Securities Exchange Act of 1934, the registrant caused this report to be signed on its behalf by the undersigned, thereto duly authorized.
|
|
|
|
|
|
Dated: March 12, 2010 |
RIMAGE CORPORATION |
||
|
|
|
|
|
|
|
|
By: |
/s/ Sherman L. Black |
|
|
|
|
Sherman L. Black |
|
|
|
|
Chief Executive Officer |
|
|
|
|
|
|
|
|
|
|
|
|
|
By: |
/s/ Robert M. Wolf |
|
|
|
|
Robert M. Wolf |
|
|
|
|
Chief Financial Officer |
Pursuant to the requirements of the Securities Exchange Act of 1934, this report has been signed below by the following persons on behalf of the registrant and in the capacities and on the dates indicated. Each person whose signature appears below constitutes and appoints Sherman L. Black and Robert M. Wolf as his true and lawful attorneys-in-fact and agents, each acting alone, with full power of substitution and re-substitution, for him and in his name, place and stead, in any and all capacities, to sign any and all amendments to this Annual Report on Form 10-K and to file the same, with all exhibits thereto, and other documents in connection therewith, with the U.S. Securities and Exchange Commission, granting unto said attorneys-in-fact and agents, each acting alone, full power and authority to do and perform each and every act and thing requisite and necessary to be done in and about the premises, as fully to all intents and purposes as he might or could do in person, hereby ratifying and confirming all said attorneys-in-fact and agents, each acting alone, or his substitute or substitutes, may lawfully do or cause to be done by virtue thereof.
|
|
|
|
|
|
|
Signature |
|
Title |
|
Date |
|
|
|
|
|
|
|
/s/ Sherman L. Black |
|
Chief Executive Officer and
President |
|
March 12, 2010 |
|
Sherman L. Black |
|
|
|
|
|
|
|
|
|
|
|
/s/ Robert M. Wolf |
|
Chief Financial Officer
(Principal |
|
March 12, 2010 |
|
Robert M. Wolf |
|
|
|
|
|
|
|
|
|
|
|
/s/ James L. Reissner |
|
Director |
|
March 12, 2010 |
|
James L. Reissner |
|
|
|
|
|
|
|
|
|
|
|
/s/ Thomas F. Madison |
|
Director |
|
March 12, 2010 |
|
Thomas F. Madison |
|
|
|
|
|
|
|
|
|
|
|
/s/ Steven M. Quist |
|
Director |
|
March 12, 2010 |
|
Steven M. Quist |
|
|
|
|
|
|
|
|
|
|
|
/s/ Lawrence M. Benveniste |
|
Director |
|
March 12, 2010 |
|
Lawrence M. Benveniste |
|
|
|
|
|
|
|
|
|
|
|
/s/ Philip D. Hotchkiss |
|
Director |
|
March 12, 2010 |
|
Philip D. Hotchkiss |
|
|
|
|
52
INDEX TO EXHIBITS
|
|
|
|
|
Exhibit |
|
|
|
|
|
|
|
No. |
|
Description |
|
3.1 |
|
1992 Restated Articles of Incorporation of Rimage Corporation (Incorporated herein by reference to Exhibit 3.1 to the Company’s Registration Statement on Form SB-2 (File No. 33-22558)). |
|
|
|
|
|
3.2 |
|
Articles of Amendment to 1992 Restated Articles of Incorporation of Rimage Corporation (Incorporated by reference to Exhibit 4.2 to the Company’s Registration Statement on Form S-8 (File No. 333-69550)). |
|
|
|
|
|
3.3 |
|
Amended and Restated Bylaws of Rimage Corporation, as amended (Incorporated by reference to Exhibit 3.2 to the Company’s Current Report on Form 8-K dated March 7, 2007). |
|
|
|
|
|
3.4 |
|
Rights Agreement dated as of September 17, 2003 between Rimage Corporation and Wells Fargo Bank, as Rights Agent (Incorporated by reference to Exhibit 1 to the Company’s Registration Statement on Form 8-A (File No. 000-20728)). |
|
|
|
|
|
10.1 |
|
Rimage Corporation Amended and Restated 1992 Stock Option Plan (as amended through May 17, 2005) * (Incorporated by reference to Exhibit 4.1 to the Company’s Registration Statement on Form S-8 (File No. 333-127244)). |
|
|
|
|
|
10.2 |
|
Rimage Corporation 2001 Stock Option Plan for Non-Employee Directors * (Incorporated by reference to Exhibit 10.2 to the Company’s Annual Report on Form 10-K for the year ended December 31, 2001). |
|
|
|
|
|
10.3 |
|
Rimage Corporation Amended and Restated 2007 Stock Incentive Plan * (Incorporated by reference to Appendix A to the Company’s Proxy Statement for the 2009 Annual Meeting of Shareholders held on May 13, 2009). |
|
|
|
|
|
10.4 |
|
Amended and Restated Form of Severance/Change in Control Letter Agreement dated December 22, 2008, between the Company and certain executive officers * (Incorporated by reference to Exhibit 10.1 of the Company’s Current Report on Form 8-K dated December 22, 2008). |
|
|
|
|
|
10.5 |
|
Credit Agreement, dated March 29, 2004, by and between the Company and Wells Fargo Bank, National Association (Incorporated by reference to Exhibit 10.6 to the Company’s Annual Report on Form 10-K for the year ended December 31, 2004). |
|
|
|
|
|
10.6 |
|
First Amendment to Credit Agreement, dated June 30, 2005, by and between the Company and Wells Fargo Bank, National Association (Incorporated by reference to Exhibit 10.7 to the Company’s Annual Report on Form 10-K for the year ended December 31, 2005). |
|
|
|
|
|
10.7 |
|
Second Amendment to Credit Agreement, dated August 6, 2006, by and between the Company and Wells Fargo Bank, National Association (Incorporated by reference to Exhibit 10.9 of the Company’s Annual Report on Form 10-K for the year ended December 31, 2006). |
|
|
|
|
|
10.8 |
|
Third Amendment to Credit Agreement, dated June 7, 2007, by and between the Company and Wells Fargo Bank, National Association (Incorporated by reference to Exhibit 10.13 of the Company’s Annual Report on Form 10-K for the year ended December 31, 2007). |
|
|
|
|
|
10. 9 |
|
Letter from Rimage Corporation to Sherman L. Black regarding offer of employment, accepted on January 29, 2009 * (Incorporated by reference to Exhibit 10.1 of the Company’s Current Report on Form 8-K dated January 29, 2009). |
|
|
|
|
|
10.10 |
|
Restricted Stock Agreement dated April 1, 2009 by and between Sherman L. Black and the Company * (Incorporated by reference to Exhibit 10.2 of the Company’s Current Report on Form 8-K dated January 29, 2009). |
|
|
|
|
|
10.11 |
|
Stock Option Agreement dated April 1, 2009 by and between Sherman L. Black and the Company * (Incorporated by reference to Exhibit 10.1 of the Company’s Quarterly Report on Form 10-Q for the quarter ended June 30, 2009). |
|
|
|
|
|
10.12 |
|
Fourth Amendment to Credit Agreement, dated July 1, 2009, by and between the Company and Wells Fargo Bank, National Association (Incorporated by reference to Exhibit 10.2 of the Company’s Quarterly Report on Form 10-Q for the quarter ended June 30, 2009). |
|
|
|
|
|
10.13 |
|
Revolving Line of Credit Note, dated July 1, 2009, in the principal amount of $10,000,000 issued to the Company by Wells Fargo Bank, National Association (Incorporated by reference to Exhibit 10.3 of the Company’s Quarterly Report on Form 10-Q for the quarter ended June 30, 2009). |
|
|
|
|
|
10.14 |
|
Letter from Rimage Corporation to Samir Mittal regarding offer of employment, accepted on August 20, 2009 * (Incorporated by reference to Exhibit 10.1 of the Company’s Current Report on Form 8-K dated April 20, 2009). |
53
|
|
|
|
|
10.15 |
|
Letter Agreement dated November 4, 2009 by and between Rimage Corporation and Sherman L. Black * (Incorporated by reference to Exhibit 10.1 of the Company’s Current Report on Form 8-K dated November 4, 2009). |
|
|
|
|
|
10.16 |
|
Separation and Release Agreement dated November 4, 2009 by and between Rimage Corporation and Bernard P. Aldrich * (Incorporated by reference to Exhibit 10.2 of the Company’s Current Report on Form 8-K dated November 4, 2009). |
|
|
|
|
|
10.17 |
|
Consulting Agreement dated November 4, 2009 by and between Rimage Corporation and Bernard P. Aldrich * (Incorporated by reference to Exhibit 10.3 of the Company’s Current Report on Form 8-K dated November 4, 2009). |
|
|
|
|
|
10.18 |
|
Form of Non-Employee Director Restricted Stock Unit Agreement with Deferral Election *. |
|
|
|
|
|
21.1 |
|
Subsidiaries of Rimage Corporation. |
|
|
|
|
|
23.1 |
|
Consent of KPMG LLP, Independent Registered Public Accounting Firm. |
|
|
|
|
|
31.1 |
|
Certificate of Chief Executive Officer pursuant to Rules 13a-14(a) and 15d-14(a) of the Exchange Act. |
|
|
|
|
|
31.2 |
|
Certificate of Chief Financial Officer pursuant to Rules 13a-14(a) and 15d-14(a) of the Exchange Act. |
|
|
|
|
|
32 |
|
Certification pursuant to 18 U.S.C. §1350. |
* Indicates a management contract or compensatory plan or arrangement
54
Schedule II
RIMAGE
CORPORATION
Valuation and Qualifying Accounts
(in thousands)
|
|
|
|
|
|
|
|
|
|
|
|
|
Allowance for Doubtful Accounts Receivable: |
|
|
|
|
|
|
|
|
|
|
|
|
|
|
|
|
|
|
|
|
|
|
|
|
|
Years ended December 31, |
|
|||||||
|
|
|
2009 |
|
2008 |
|
2007 |
|
|||
|
|
|
|
|
|
|
|
|
|
|
|
|
Balance at beginning of year |
|
$ |
196 |
|
$ |
244 |
|
$ |
309 |
|
|
|
|
|
|
|
|
|
|
|
|
|
|
Write-offs and other adjustments |
|
|
(132 |
) |
|
(52 |
) |
|
(89 |
) |
|
Recoveries |
|
|
6 |
|
|
(6 |
) |
|
(57 |
) |
|
Additions charged to costs and expenses |
|
|
136 |
|
|
10 |
|
|
81 |
|
|
|
|
|
|
|
|
|
|
|
|
|
|
Balance at end of year |
|
$ |
206 |
|
$ |
196 |
|
$ |
244 |
|
See accompanying report of Independent Registered Public Accounting Firm.
55