Attached files
| file | filename |
|---|---|
| EX-23.1 - ONE LIBERTY PROPERTIES INC | v177132_ex23-1.htm |
| EX-32.2 - ONE LIBERTY PROPERTIES INC | v177132_ex32-2.htm |
| EX-31.2 - ONE LIBERTY PROPERTIES INC | v177132_ex31-2.htm |
| EX-32.1 - ONE LIBERTY PROPERTIES INC | v177132_ex32-1.htm |
| EX-31.1 - ONE LIBERTY PROPERTIES INC | v177132_ex31-1.htm |
| EX-21.1 - ONE LIBERTY PROPERTIES INC | v177132_ex21-1.htm |
UNITED
STATES
SECURITIES
AND EXCHANGE COMMISSION
Washington,
D.C. 20549
FORM
10-K
ANNUAL
REPORT
PURSUANT
TO SECTIONS 13 OR 15(d)
OF THE
SECURITIES EXCHANGE ACT OF 1934
x Annual
Report Pursuant to Section 13 or 15(d)
of the
Securities Exchange Act of l934
For the
fiscal year ended December 31,
2009
Or
¨
Transition Report Pursuant to Section 13 or 15(d)
of the
Securities Exchange Act of 1934
Commission
File Number 001-09279
ONE LIBERTY PROPERTIES,
INC.
(Exact
name of registrant as specified in its charter)
|
MARYLAND
|
13-3147497
|
|
|
(State
or other jurisdiction of
|
(I.R.S.
employer
|
|
|
incorporation
or organization)
|
identification
number)
|
60 Cutter Mill Road, Great
Neck, New York 11021
(Address
of principal executive offices) (Zip
Code)
Registrant's telephone
number, including area code: (516) 466-3100
Securities
registered pursuant to Section 12(b) of the Act:
|
|
Name
of exchange
|
|
|
Title of each class
|
on which registered
|
|
|
|
||
|
Common
Stock, par value $1.00
|
New
York Stock Exchange
|
|
|
per
share
|
|
Securities
registered pursuant to Section 12(g) of the Act:
NONE
Indicate
by check mark if the registrant is a well-known seasoned issuer as defined in
Rule 405 of the Securities Act. Yes ¨
No x
Indicate
by check mark if the registrant is not required to file reports pursuant to
Section 13 or 15(d) of the Act. Yes ¨
No x
Indicate by check mark whether the
registrant (1) has filed all reports required to be filed by Section 13 or 15(d)
of the Securities Exchange Act of 1934 during the preceding 12 months (or for
such shorter period that the registrant was required to file such reports), and
(2) has been subject to such filing requirements for the past 90
days. Yes x No ¨
Indicate
by check mark whether the registrant has submitted electronically and posted on
its corporate Web site, if any, every Interactive Data File required to be
submitted and posted pursuant to Rule 405 of Regulation S-T (§ 232.405 of this
chapter) during the preceding 12 months (or for such shorter period that the
registrant was required to submit and post such
files). Yes o No o
Indicate
by check mark if disclosure of delinquent filers pursuant to Item 405 of
Regulation S-K (§229.405 of this chapter) is not contained herein, and will not
be contained, to the best of registrant's knowledge, in definitive proxy or
information statements incorporated by reference in Part III of this Form 10-K
or any amendment to this Form 10-K. x
Indicate
by check mark whether the registrant is a large accelerated filer, an
accelerated filer, a non-accelerated filer, or a small reporting
company. See definitions of “large accelerated filer,” “accelerated
filer,” and “small reporting company” in Rule 12b-2 of the Exchange
Act.
|
Large
accelerated filer o
|
Accelerated
filer x
|
|
Non-accelerated
filer o
|
Small
reporting company o
|
|
(Do
not check if a small reporting company)
|
Indicate
by check mark whether registrant is a shell company (defined in Rule 12b-2 of
the Exchange Act).
Yes o No
x
As of
June 30, 2009 (the last business day of the registrant’s most recently completed
second quarter), the aggregate market value of all common equity held by
non-affiliates of the registrant, computed by reference to the price at which
common equity was last sold on said date, was approximately $46.2
million.
As of
March 9, 2010, the registrant had 11,380,887 shares of common stock
outstanding.
DOCUMENTS
INCORPORATED BY REFERENCE
Portions
of the proxy statement for the 2010 annual meeting of stockholders of One
Liberty Properties, Inc., to be filed pursuant to Regulation 14A not later than
April 30, 2010, are incorporated by reference into Part III of this Annual
Report on Form 10-K.
PART
I
Item
1. Business
General
We are a
self-administered and self-managed real estate investment trust, also known as a
REIT. We were incorporated under the laws of the State of Maryland on
December 20, 1982. We acquire, own and manage a geographically
diversified portfolio of retail (including furniture and office supply stores),
industrial, office, flex, health and fitness and other properties, a substantial
portion of which are under long-term leases. Substantially all of our leases are
“net leases” and ground leases under which the tenant is typically responsible
for real estate taxes, insurance and ordinary maintenance and
repairs. As of December 31, 2009 (giving effect to our acquisition of
a community shopping center on February 24, 2010), we owned 72 properties, one
of which is vacant, and one of which is a 50% tenancy in common interest, and
participated in five joint ventures that own five properties. Our
properties and the properties owned by our joint ventures are located in 27
states and have an aggregate of approximately 5.4 million square feet of space
(including approximately 106,000 square feet of space at the property in which
we own a tenancy in common interest and approximately 1.5 million square feet of
space at properties owned by the joint ventures in which we
participate).
Our 2010
contractual rental income will be approximately $39.8 million. Our
2010 contractual rental income includes (i) rental income that is payable to us
in 2010 under leases existing at December 31, 2009, (ii) rental income that is
payable to us in 2010 on our tenancy in common interest, and (iii) rental income
of approximately $1.6 million, representing approximately ten months of rental
payments, that is payable to us in 2010 under leases at a community shopping
center we acquired on February 24, 2010. In 2010, we expect
that our share of the rental income payable to our five joint ventures will be
approximately $1.3 million. On December 31, 2009, the occupancy rate
of properties owned by us was 98.6% based on square footage (including the
property in which we own a tenancy in common interest) and the occupancy rate of
properties owned by our joint ventures was 100% based on square
footage. The occupancy rate of the community shopping center we
acquired on February 24, 2010 for $23.5 million was 99% as of the acquisition
date. The weighted average remaining term of the leases in our
portfolio, including our tenancy in common interest and the community shopping
center we acquired on February 24, 2010, is 8.4 years and 10.5 years for the
leases at properties owned by our joint ventures.
As a
result of the national economic recession, consumer confidence and retail
spending declined, which negatively impacted certain of our retail
tenants. For example, Circuit City Stores, Inc., which previously
leased five of our properties, filed for protection under the Federal bankruptcy
laws in 2008 and thereafter rejected our leases and closed all their
stores. Other retail tenants have requested rent relief, lease
amendments, and other financial concessions from us due to the deterioration of
their financial condition in the present economic environment. We
agreed to some of these requests. Our rental income from our retail
tenants will account for 59% of our 2010 contractual rental
income. One retail tenant in the office supply business and one
retail tenant in the furniture business represent an aggregate of 11.1% and
10.8%, respectively, of our 2010 contractual rental income. No other
single tenant accounts for more than 5.9% of our 2010 contractual rental
income. To the extent that our retail tenants are adversely affected
by the recession and reduced consumer spending, our portfolio may be adversely
affected.
2
Acquisition
Strategies
We seek
to acquire properties throughout the United States that have locations,
demographics and other investment attributes that we believe to be
attractive. We believe that long-term leases provide a predictable
income stream over the term of the lease, making fluctuations in market rental
rates and in real estate values less significant to achieving our overall
investment objectives. Our goal is to acquire properties that are
subject to long-term net or ground leases that include periodic contractual
rental increases. Periodic contractual rental increases provide
reliable increases in future rent payments, while rent increases based on the
consumer price index provide protection against
inflation. Historically, long-term leases have made it easier for us
to obtain longer-term, fixed-rate mortgage financing with principal
amortization, thereby moderating the interest rate risk associated with
financing or refinancing our property portfolio by reducing the outstanding
principal balance over time. Although we regard long-term leases as
an important element of our acquisition strategy, we may acquire a property that
is subject to a short-term lease when we believe the property represents a good
opportunity for recurring income and residual value. Although we
regard the acquisition of properties subject to net and ground leases as an
important aspect of our investment strategy, we have expanded our focus and are
also seeking to acquire community shopping centers anchored by national or
regional tenants. Typically, we would pay substantially all operating
expenses at these community shopping centers, a significant portion of which
will be reimbursed by the tenants pursuant to their leases.
Generally, we hold the properties we
acquire for an extended period of time. Our investment criteria are
intended to identify properties from which increased asset value and overall
return can be realized from an extended period of ownership. Although
our investment criteria favor an extended period of ownership, we will dispose
of a property if we regard the disposition of the property as an opportunity to
realize the overall value of the property sooner or to avoid future risks by
achieving a determinable return from the property.
Historically,
we identify properties through the network of contacts of our senior management
and our affiliates, which includes real estate brokers, private equity firms,
banks and law firms. In addition, we attend industry conferences and
engage in direct solicitations.
Although
we investigated, analyzed and bid on several properties in 2009, due to a
variety of factors, including unfavorable prices and a lack of available
traditional mortgage financing, we did not acquire any properties in
2009. On February 24, 2010, we acquired, for $23.5 million, a
community shopping center with approximately 194,000 square feet of space, of
which 67% are subject to ground leases.
There is
no limit on the number of properties in which we may invest, the amount or
percentage of our assets that may be invested in any specific property or
property type, or on the concentration of investments in any geographic area in
the United States. We do not intend to acquire properties located
outside of the United States. We will continue to form entities to
acquire interests in real properties, either alone or with other investors, and
we may acquire interests in joint ventures or other entities that own real
property.
It is our
policy, and the policy of our affiliated entities, that any investment
opportunity presented to us or to any of our affiliated entities that involves
primarily the acquisition of a net leased property, a ground lease or a
community shopping center, will first be offered to us and may not be pursued by
any of our affiliated entities unless we decline the opportunity.
Investment
Evaluation
In evaluating potential investments, we
consider, among other criteria, the following:
|
|
·
|
the
ability of a tenant, if a net leased property, or major tenants, if a
shopping center, to meet operational needs and lease obligations
recognizing the current economic
climate;
|
3
|
|
·
|
the
current and projected cash flow of the
property;
|
|
|
·
|
the
estimated return on equity to us;
|
|
|
·
|
an
evaluation of the property and improvements, given its location and
use;
|
|
|
·
|
local
demographics (population and rental
trends);
|
|
|
·
|
the
terms of tenant leases, including the relationship between current rents
and market rents;
|
|
|
·
|
the
projected residual value of the
property;
|
|
|
·
|
potential
for income and capital
appreciation;
|
|
|
·
|
occupancy
of and demand for similar properties in the market area;
and
|
|
|
·
|
alternate
use for the property at lease
termination.
|
Our
Business Objective
Our business objective is to maintain
and increase the cash available for distribution to our stockholders
by:
|
|
·
|
monitoring
and maintaining our portfolio, including tenant negotiations and lease
amendments with tenants having financial
difficulty;
|
|
|
·
|
obtaining
mortgage indebtedness on favorable terms and maintaining access to capital
to finance property acquisitions;
|
|
|
·
|
identifying
opportunistic property acquisitions consistent with our portfolio and our
objectives; and
|
|
|
·
|
managing
assets effectively, including lease extensions and opportunistic property
sales.
|
Typical
Property Attributes
The properties in our portfolio and
owned by our joint ventures typically have the following
attributes:
|
|
·
|
Net or ground
leases. Substantially all of the leases are net and
ground leases under which the tenant is typically responsible for real
estate taxes, insurance and ordinary maintenance and
repairs. We believe that investments in net and ground leased
properties offer more predictable returns than investments in properties
that are not net or ground leased;
|
|
|
·
|
Long-term
leases. Substantially all of our leases are long-term
leases. Excluding leases relating to properties owned by our
joint ventures, leases representing approximately 70% of our 2010
contractual rental income expire after 2015, and leases representing
approximately 42% of our 2010 contractual rental income expire after 2019;
and
|
|
|
·
|
Scheduled rent
increases. Leases representing approximately 95% of our
2010 contractual rental income provide for either scheduled rent increases
or periodic contractual rent increases based on the consumer price
index. None of the leases on properties owned by our joint
ventures provide for scheduled rent
increases.
|
4
Our
Tenants
The following table sets forth
information about the diversification of our tenants by industry sector as of
December 31, 2009 (giving effect to a community shopping center we acquired on
February 24, 2010):
|
Percentage
of
|
||||||||||||||||
|
Type
of
|
Number
of
|
Number
of
|
2010
Contractual
|
2010
Contractual
|
||||||||||||
|
Property
|
Tenants
|
Properties
|
Rental Income (1)
|
Rental Income
|
||||||||||||
|
Retail
– various (2)
|
36 | 27 | $ | 10,994,550 | 27.6 | % | ||||||||||
|
Retail
– furniture (3)
|
5 | 15 | 7,325,227 | 18.4 | ||||||||||||
|
Industrial
(4)
|
7 | 8 | 5,362,762 | 13.5 | ||||||||||||
|
Retail
– office supply (5)
|
12 | 12 | 5,188,383 | 13.0 | ||||||||||||
|
Office
(6)
|
3 | 3 | 4,490,385 | 11.3 | ||||||||||||
|
Flex
|
3 | 2 | 2,596,846 | 6.5 | ||||||||||||
|
Health
& fitness
|
3 | 3 | 1,783,128 | 4.5 | ||||||||||||
|
Movie
theater (7)
|
1 | 1 | 1,384,267 | 3.5 | ||||||||||||
|
Residential
|
1 | 1 | 700,000 | 1.7 | ||||||||||||
| 71 | 72 | $ | 39,825,548 | 100.0 | % | |||||||||||
|
(1)
|
Our
2010 contractual rental income includes (a) rental income that is payable
to us in 2010 under leases existing at December 31, 2009, (b) rental
income that is payable to us in 2010 on our tenancy in common interest,
and (c) rental income that is payable to us in 2010 under leases at a
community shopping center we acquired on February 24,
2010.
|
|
(2)
|
Fourteen
of the retail properties are net leased to single tenants. Five
properties are net leased to a total of 21 separate tenants pursuant to
separate leases and eight properties are net leased to one tenant pursuant
to a master lease.
|
|
(3)
|
Eleven
properties are net leased to Haverty Furniture Companies, Inc. pursuant to
a master lease covering all locations. Four of the properties
are net leased to single tenants.
|
|
(4)
|
Includes
one vacant property.
|
|
(5)
|
Includes
ten properties which are net leased to one tenant pursuant to ten separate
leases. Eight of these leases contain cross-default
provisions.
|
|
(6)
|
Includes
a property in which we own a 50% tenancy in common
interest.
|
|
(7)
|
We
are the ground lessee of this property under a long-term lease and net
lease the movie theater to an
operator.
|
Most of
our retail tenants operate on a national basis and include, among others, Barnes
& Noble, Best Buy, CarMax, CVS, Kohl’s, Marshalls, Office Depot, Office Max,
Party City, Petco, The Sports Authority, and Walgreens, and some of our tenants
operate on a regional basis, including Giant Food Stores and Haverty Furniture
Companies.
Our
Leases
Substantially all of our leases are net
or ground leases (including the leases entered into by our joint ventures) under
which the tenant, in addition to its rental obligation, typically is responsible
for expenses attributable to the operation of the property, such as real estate
taxes and assessments, water and sewer rents and other charges. The
tenant is also generally responsible for maintaining the property and for
restoration following a casualty or partial condemnation. The tenant
is typically obligated to indemnify us for claims arising from the property and
is responsible for maintaining insurance coverage for the property it
leases. Under some net leases, we are responsible for structural
repairs, including foundation and slab, roof repair or replacement and
restoration following a casualty event, and at several properties we are
responsible for certain expenses related to the operation and maintenance of the
property.
5
Our
typical lease provides for contractual rent increases periodically throughout
the term of the lease. Some of our leases provide for rent increases pursuant to
a formula based on the consumer price index and some of our leases provide for
minimum rents supplemented by additional payments based on sales derived from
the property subject to the lease. Such additional payments were not a material
part of our 2009 rental revenues and are not expected to be a material part of
our 2010 contractual rental income. Additionally, all of the leases
for the community shopping center we acquired on February 24, 2010 provide for
the reimbursement to us by the tenants of a significant portion of the
property’s operating expenses.
Our policy has been to acquire
properties that are subject to existing long-term leases or to enter into
long-term leases with our tenants. Our leases generally provide the tenant
with one or more renewal options.
The following table sets forth
scheduled lease expirations of leases for our properties (excluding joint
venture properties) as of December 31, 2009 and includes the lease expiration of
leases for the community shopping center we acquired on February 24,
2010:
|
% of 2010 Contractual
|
||||||||||||||||
|
Approximate
Square
|
2010
Contractual
|
Rental
Income
|
||||||||||||||
|
Year
of Lease
|
Number
of
|
Feet
Subject to
|
Rental
Income Under
|
Represented
by
|
||||||||||||
|
Expiration (1)
|
Expiring Leases
|
Expiring Leases
|
Expiring Leases
|
Expiring Leases
|
||||||||||||
|
2010
|
2 | 16,000 | $ | 170,377 | .4 | % | ||||||||||
|
2011
|
8 | 246,744 | 2,658,542 | 6.7 | ||||||||||||
|
2012
|
3 | 20,650 | 508,362 | 1.3 | ||||||||||||
|
2013
|
5 | 120,790 | 1,356,441 | 3.4 | ||||||||||||
|
2014
|
11 | 652,287 | 5,638,747 | 14.1 | ||||||||||||
|
2015
|
4 | 127,240 | 1,423,207 | 3.6 | ||||||||||||
|
2016
|
4 | 163,849 | 1,258,619 | 3.2 | ||||||||||||
|
2017
|
4 | (2) | 209,605 | 3,125,998 | 7.8 | |||||||||||
|
2018
|
12 | 303,172 | 6,004,051 | 15.1 | ||||||||||||
|
2019
and
|
||||||||||||||||
|
Thereafter
|
18 | 1,906,225 | 17,681,204 | 44.4 | ||||||||||||
| 71 | 3,766,562 | $ | 39,825,548 | 100.0 | % | |||||||||||
________________
|
(1)
|
Lease
expirations assume tenants do not exercise existing renewal
options.
|
|
(2)
|
Includes
a property in which we have a tenancy in common
interest.
|
6
Financing,
Re-Renting and Disposition of Our Properties
Under our
governing documents, there is no limit on the level of debt that we may
incur. Our credit facility, which matures on March 31, 2010, is provided
by VNB New York Corp., Bank Leumi, USA, Manufacturers and Traders Trust Company
and Israel Discount Bank of New York and is a full recourse obligation. We
have negotiated a modification and extension of our credit facility with our
lending syndicate and have agreed to all of the material terms (although there
can be no assurance that it will be consummated). The proposed
modification and extension agreement would reduce permitted borrowings from
$62.5 million to $40 million, expire on March 31, 2012, and increase the
interest rate from the lower of LIBOR plus 2.15% or the bank’s prime rate to 90
day LIBOR plus 3% with a minimum interest rate of 6% per annum. Among
other limitations in our credit facility is our ability to incur additional
indebtedness. Our current credit facility limits total indebtedness that
we may incur to an amount equal to 70% of the value (as defined) of our
properties and the negotiated modification and extension agreement would limit
total indebtedness that we may incur to an amount equal to 65% of the value (as
defined) of our properties. We borrow funds on a secured and unsecured basis and
intend to continue to do so in the future.
We also
mortgage specific properties on a non-recourse basis (subject to standard
carve-outs) to enhance the return on our investment in a specific
property. The proceeds of mortgage loans may be used for property
acquisitions, investments in joint ventures or other entities that own real
property, to reduce bank debt and for working capital purposes. The
proceeds of our credit facility may be used to payoff existing mortgages, fund
the acquisition of additional properties, or to invest in joint ventures. Net
proceeds received from refinancing of properties are required to be used to
repay amounts outstanding under our credit facility if proceeds from the credit
facility were used to purchase or refinance the property.
With respect to properties we acquire
on a free and clear basis, we usually seek to obtain long-term fixed-rate
mortgage financing, when available at acceptable terms, shortly after the
acquisition of such property to avoid the risk of movement of interest rates and
fluctuating supply and demand in the mortgage markets.
Due to
lending freezes, the imposition of more stringent lending standards and
dislocations in the mortgage securitization markets, we have been limited in our
ability to obtain mortgage financing on acceptable terms. However, in
March 2009 we refinanced one mortgage and we secured floating rate mortgages for
two properties, one in November 2008 and one in March 2009. In order to
eliminate our interest rate risk under these floating rate mortgages, we entered
into interest rate swap agreements. Under the interest rate swap
agreements, we make fixed rate monthly payments to our counterparty, thereby
satisfying all of our interest payments. In October 2009, in connection
with the sale of the property securing the mortgage, we paid off the mortgage
obtained in November 2008 and the related interest rate swap agreement was
terminated.
We also will acquire a property that is
subject to (and will assume) a fixed-rate mortgage. Substantially all of
our mortgages provide for amortization of part of the principal balance during
the term, thereby reducing the refinancing risk at maturity. Some of our
properties may be financed on a cross-defaulted or cross-collateralized basis,
and we may collateralize a single financing with more than one
property.
After
termination or expiration of any lease relating to any of our properties, we
will seek to re-rent or sell such property in a manner that will maximize the
return to us, considering, among other factors, the income potential and market
value of such property. We acquire properties for long-term investment for
income purposes and do not typically engage in the turnover of
investments. We will consider the sale of a property if a sale appears
advantageous in view of our investment objectives. We may take back a
purchase money mortgage as partial payment in lieu of cash in connection with
any sale and may consider local custom and prevailing market conditions in
negotiating the terms of repayment. If there is a substantial tax gain, we
may seek to enter into a tax deferred transaction and reinvest the proceeds in
another property. It is our policy to use any cash realized from the sale
of properties, net of any distributions to stockholders, to pay down amounts due
under our credit facility, if any, and for the acquisition of additional
properties.
7
Our
Joint Ventures
As of December 31, 2009, we are a joint
venture partner in five joint ventures that own an aggregate of five properties,
and have an aggregate of approximately 1.5 million rentable square feet of
space. Three of the properties are retail properties and two are industrial
properties. We own a 50% equity interest in four of the joint ventures and
a 36% equity interest in the fifth joint venture. We are designated as “managing
member” or “manager” under the operating agreements of three of these joint
ventures; however, we do not exercise substantial operating control over these
entities. At December 31, 2009, our investment in unconsolidated joint
ventures was approximately $6 million.
Based on
existing leases, we anticipate that our share of rental income payable to our
joint ventures in 2010 will be approximately $1.3 million. The leases for
two properties (each of which is owned by one of our joint ventures), which are
expected to contribute 88.5% of the aggregate projected rental income payable to
all of our joint ventures in 2010, will expire in 2021 and 2022.
Competition
We face
competition for the acquisition of properties from a variety of investors,
including domestic and foreign corporations and real estate companies, financial
institutions, insurance companies, pension funds, investment funds, other REITs
and individuals, some of which have significant advantages over us, including a
larger, more diverse group of properties and greater financial and other
resources than we have.
Our
Structure
Five
employees, Patrick J. Callan, Jr., our president and chief executive officer,
Lawrence G. Ricketts, Jr., our executive vice president and chief operating
officer, and three others, devote all of their business time to our
company. Our other executive, administrative, legal, accounting and
clerical personnel share their services on a part-time basis with us and other
affiliated entities that share our executive offices.
We
entered into a compensation and services agreement with Majestic Property
Management Corp. effective as of January 1, 2007. Majestic Property
Management Corp. is wholly-owned by our chairman of the board and it provides
compensation to certain of our executive officers. Pursuant to the
compensation and services agreement, we pay an annual fee to Majestic Property
Management Corp. and Majestic Property Management Corp. assumes our obligations
under a shared services agreement, and provides us with the services of all
affiliated executive, administrative, legal, accounting and clerical personnel
that we use on a part time basis, as well as certain property management
services, property acquisition, sales and leasing and mortgage brokerage
services. The annual fees we pay to Majestic Property Management Corp. are
negotiated each year by us and Majestic Property Management Corp., and are
approved by our audit committee and independent directors.
In 2009,
we incurred a fee of $2,025,000 to Majestic Property Management Corp. under the
compensation and services agreement. Pursuant to the compensation and
services agreement, we paid $2,013,000 of the fee and the remainder of the fee,
$12,000, was offset by the $12,000 paid to Majestic Property Management Corp. by
one of our joint ventures. In addition, we made a payment to Majestic
Property Management Corp. of $175,000 for our share of all direct office
expenses, including, among other expenses, rent, telephone, postage, computer
services and internet usage. We also paid our chairman a fee of $250,000
in 2009 in accordance with the compensation and services agreement.
8
We
believe that the compensation and services agreement allows us to benefit from
access to, and from the services of, a group of senior executives with
significant knowledge and experience in the real estate industry and our company
and its activities. If not for the compensation and services agreement, we
believe that a company of our size would not have access to the skills and
expertise of these executives at the cost that we have incurred and will incur
in the future. For a description of the background of our management,
please see the information under the heading “Executive Officers” in Part I of
this Annual Report.
Available
Information
Our
Internet address is www.onelibertyproperties.com. On the Investor
Information page of our web site, we post the following filings as soon as
reasonably practicable after they are electronically filed with or furnished to
the Securities and Exchange Commission (the “SEC”): our annual report on Form
10-K, our quarterly reports on Form 10-Q, our current reports on Form 8-K, and
any amendments to those reports filed or furnished pursuant to Section 13(a) or
15(d) of the Securities Exchange Act of 1934, as amended. All such filings on
our Investor Information Web page, which also includes Forms 3, 4 and 5 filed
pursuant to Section 16(a) of the Securities Exchange Act of 1934, as amended,
are available to be viewed free of charge.
On the
Corporate Governance page of our web site, we post the following charters and
guidelines: Audit Committee Charter, Compensation Committee Charter, Nominating
and Corporate Governance Committee Charter, Corporate Governance Guidelines and
Code of Business Conduct and Ethics, as amended and restated. All such
documents on our Corporate Governance Web page are available to be viewed free
of charge.
Information
contained on our web site is not part of, and is not incorporated by reference
into, this Annual Report on Form 10-K or our other filings with the SEC. A
copy of this Annual Report on Form 10-K and those items disclosed on our
Investor Information Web page and our Corporate Governance Web page are
available without charge upon written request to: One Liberty Properties, Inc.,
60 Cutter Mill Road, Suite 303, Great Neck, New York 11021, Attention:
Secretary.
Forward-Looking
Statements
This
Annual Report on Form 10-K, together with other statements and information
publicly disseminated by us, contains certain forward-looking statements within
the meaning of Section 27A of the Securities Act of 1933, as amended, and
Section 21E of the Securities Exchange Act of 1934, as amended. We intend
such forward-looking statements to be covered by the safe harbor provision for
forward-looking statements contained in the Private Securities Litigation Reform
Act of 1995 and include this statement for purposes of complying with these safe
harbor provisions. Forward-looking statements, which are based on certain
assumptions and describe our future plans, strategies and expectations, are
generally identifiable by use of the words “may,” “will,” “could,” “believe,”
“expect,” “intend,” “anticipate,” “estimate,” “project,” or similar expressions
or variations thereof. You should not rely on forward-looking statements
since they involve known and unknown risks, uncertainties and other factors
which are, in some cases, beyond our control and which could materially affect
actual results, performance or achievements. Factors which may cause actual
results to differ materially from current expectations include, but are not
limited to:
|
|
·
|
the
financial condition of our tenants and the performance of their lease
obligations;
|
|
|
·
|
general
economic and business conditions, including those currently affecting our
nation’s economy and real estate
markets;
|
9
|
|
·
|
the
availability of and costs associated with sources of
liquidity;
|
|
|
·
|
accessibility
of debt and equity capital markets;
|
|
|
·
|
general
and local real estate conditions, including any changes in the value of
our real estate;
|
|
|
·
|
breach
of credit facility covenants;
|
|
|
·
|
more
competition for leasing of vacant space due to current economic
conditions;
|
|
|
·
|
changes
in governmental laws and regulations relating to real estate and related
investments;
|
|
|
·
|
the
level and volatility of interest
rates;
|
|
|
·
|
competition
in our industry; and
|
|
|
·
|
the
other risks described under “Risks Related to Our Company” and “Risks
Related to the REIT Industry.”
|
Any or
all of our forward-looking statements in this report, in our 2010 Annual Report
to Stockholders and in any other public statements we make may turn out to be
incorrect. Actual results may differ from our forward looking statements
because of inaccurate assumptions we might make or because of the occurrence of
known or unknown risks and uncertainties. Many factors mentioned in the
discussion below will be important in determining future results. Consequently,
no forward-looking statement can be guaranteed and you are cautioned not to
place undue reliance on these forward-looking statements. Actual future results
may vary materially.
Except as
may be required under the United States federal securities laws, we undertake no
obligation to publicly update our forward-looking statements, whether as a
result of new information, future events or otherwise. You are advised, however,
to consult any further disclosures we make in our reports that are filed with or
furnished to the SEC.
Item
1A. Risk
Factors.
Set
forth below is a detailed discussion of certain risks affecting our business.
The categorization of risks set forth below is meant to help you better
understand the risks facing our business and is not intended to limit your
consideration of the possible effects of these risks to the listed categories.
Any adverse effects arising from the realization of any of the risks discussed,
including our financial condition and results of operation, may, and likely
will, adversely affect many aspects of our business.
In
addition to the other information contained or incorporated by reference in this
Form 10-K, readers should carefully consider the following risk
factors:
10
Risks Related to Our
Business
If
our tenants default, if we are unable to re-rent properties upon the expiration
of our leases, or if a significant number of tenants are granted rent relief,
our revenues will be reduced and we would incur additional costs.
Substantially
all of our revenues are derived from rental income paid by tenants at our
properties. The current economic crisis and recession has effected a
number of our tenants. A deterioration of economic conditions could result
in tenants defaulting on their obligations, fewer tenants renewing their
leases upon the expiration of their terms or tenants seeking rent relief or
other accommodations or renegotiation of their leases. As a result of any
of these events, our revenues would decline. At the same time, we would
remain responsible for the payment of our mortgage obligations and would become
responsible for the operating expenses related to our properties, including,
among other things, real estate taxes, maintenance and insurance. In
addition, we would incur expenses for enforcing our rights as landlord.
Even if we find replacement tenants or renegotiate leases with current tenants,
the terms of the new or renegotiated leases, including the cost of required
renovations or concessions to tenants, or the expense of the reconfiguration of
a single tenancy property for use by multiple tenants, may be less favorable
than current lease terms and could reduce the amount of cash available to meet
expenses.
Approximately
60% of our rental revenue is derived from tenants operating in the retail
industry, which has been particularly weakened in the current recession, and the
inability of those tenants to pay rent would significantly reduce our
revenues.
Approximately
60% of our rental revenues (excluding rental revenues from our joint ventures)
for the year ended December 31, 2009 was derived from retail tenants and
approximately 59% of our 2010 contractual rental income is expected to be
derived from retail tenants, including 18.4% and 13%, from tenants engaged in
retail furniture and office supply operations, respectively. The current
economic crisis and recession has caused a significant decline in consumer
spending on retail goods.
If the
recession continues, it could cause our retail tenants to fail to meet their
lease obligations, including rental payment delinquencies, which would have an
adverse effect on our results of operations, liquidity and financial condition,
including making it more difficult for us to satisfy our operating and debt
service requirements, make capital expenditures and make distributions to our
stockholders.
A
significant portion of our 2009 revenues and our 2010 contractual rental income
is derived from five tenants. The default, financial distress or failure
of any of these tenants could significantly reduce our revenues.
Haverty
Furniture Companies, Inc., Office Depot, Inc., Ferguson Enterprises, Inc., DSM
Nutritional Products, Inc., and L-3 Communications Corp., accounted for
approximately 11.9%, 10.9%, 5.6%, 5.1% and 4.3%, respectively, of our rental
revenues (excluding rental revenues from our joint ventures) for the year ended
December 31, 2009, and account for 10.8%, 11.1%, 5.9%, 5.1% and 4.6%,
respectively, of our 2010 contractual rental income. The default,
financial distress or bankruptcy of any of these tenants would cause
interruptions in the receipt of, or the loss of, a significant amount of rental
revenues and would require us to pay operating expenses currently paid by the
tenant. This could also result in the vacancy of the property or
properties occupied by the defaulting tenant, which would significantly reduce
our rental revenues and net income until the re-rental of the property or
properties, and could decrease the ultimate sale value of the
property.
The
current recession and its consequences present a challenge to our present
acquisition strategy.
Our present acquisition strategy
relies, to a large extent, on the acquisition of additional properties that are
located in market or industry sectors that we identify, from time to time, as
offering superior risk-adjusted returns. Although we acquired a community
shopping center on February 24, 2010, we did not acquire any properties in 2009
due to, among other issues, the economic recession and the difficulty in
obtaining satisfactory mortgage financing, even though we investigated, analyzed
and bid on several properties. If we continue to be hampered in our
ability to acquire additional properties in the near term, our growth strategy
will be significantly curtailed.
11
In order to fund acquisitions, our
business model generally prescribes that we initially use funds borrowed under
our credit facility and then seek mortgage indebtedness for the purchased
properties on a non-recourse basis, repaying the amount borrowed under the
credit facility. We have negotiated a modification and extension of our
credit facility, which will reduce permitted borrowings from $62.5 million to
$40 million. Institutions have significantly curtailed their lending
activities and it has become increasingly challenging to identify and secure
mortgage indebtedness. Additionally, although we have negotiated a
modification and extension of our credit facility with our current lenders, our
current credit facility expires on March 31, 2010, and, although we are
confident that the modification and extension will be documented substantially
in accordance with the agreed upon terms, there is no guaranty that the
modification and extension agreement will be concluded. If the
modification and extension agreement is not concluded and mortgage financing
does not become more available property acquisitions may be
limited.
Declines
in the value of our properties could result in additional impairment
charges.
The
recent economic downturn has caused a decline in real estate values generally
throughout the country. If we are presented with indications of an
impairment in the value of a particular property or group of properties, we will
be required to evaluate any such property or properties. If we determine
that the undiscounted cash flows have declined to a level which results in the
fair value of any of our properties having a value which is below the net book
value, we will be required to recognize an impairment charge for the difference
between the fair value and the book value during the quarter in which we make
such determination. In addition, we may incur losses from time to time if
we dispose of properties for sales prices that are less than our book
value.
If
we are unable to refinance our mortgage loans at maturity, we may be forced to
sell properties at disadvantageous terms, which would result in the loss of
revenues and in a decline in the value of our portfolio.
As of
December 31, 2009, we had outstanding approximately $190.5 million in mortgage
indebtedness, all of which is non-recourse (subject to standard
carve-outs). In connection with the acquisition of a community shopping
center on February 24, 2010, we assumed a $17.7 million mortgage, maturing in
2014, which is non-recourse, subject to standard carve-outs. As of
December 31, 2009 (not including the mortgage we assumed in connection with the
community shopping center), our ratio of mortgage debt to total assets was
approximately 46.6%. In addition, as of December 31, 2009, our joint
ventures had approximately $17.9 million in total mortgage indebtedness (all of
which is non-recourse subject to standard carve-outs). The risks
associated with our mortgage debt and the mortgage debt of our joint ventures
include the risk that cash flow from properties securing the mortgage
indebtedness and our available cash and cash equivalents and short-term
investments will be insufficient to meet required payments of principal and
interest.
12
Only a
small portion of the principal of our mortgage indebtedness will be repaid prior
to maturity. We do not plan to retain sufficient cash to repay such indebtedness
at maturity. Accordingly, in order to meet these obligations if they
cannot be refinanced at maturity, we will have to use funds available under our
credit facility, if any, and our available cash and cash equivalents and
short-term investments to pay our mortgage debt or seek to raise funds through
the financing of unencumbered properties, sale of properties or the issuance of
additional equity. Between January 2010 and December 31, 2014,
approximately $64.9 million of our mortgage debt matures (excluding mortgage
debt of our joint ventures). In January 2010 we paid off one mortgage with a
balance of $2.4 million. A $4.5 million mortgage loan matured on March 1,
2010, which we have not paid off, on which we continue to pay debt service on a
current basis, and with respect to which we have commenced discussions with
representatives of the mortgagee. Approximately $9 million of our mortgage
debt will mature in April 2010, $979,000 of our mortgage debt will mature in
September 2010 and approximately $3 million of our mortgage debt will mature in
2011. In addition one mortgage loan with an outstanding balance of $1.7
million has been callable since October, 2009 on ninety days notice by the
mortgagee. With respect to our joint ventures, approximately $13.4 million
and $1.6 million of mortgage debt matures in 2015 and 2016, respectively.
If we (or our joint ventures) are not successful in refinancing or extending
existing mortgage indebtedness or financing unencumbered properties, selling
properties on favorable terms or raising additional equity, our cash flow (or
the cash flow of a joint venture) will not be sufficient to repay all maturing
mortgage debt when payments become due, and we (or a joint venture) may be
forced to dispose of properties on disadvantageous terms or convey properties
secured by mortgages to the mortgagees, which would lower our revenues and the
value of our portfolio.
Additionally, with the national
economic recession and the reductions in real estate values, we may find that
the value of a property could be less than the mortgage secured by such
property. In such instance, we may seek to renegotiate the terms of the
mortgage, or to the extent that our loan is non-recourse and it cannot be
satisfactorily renegotiated, forfeit the property by conveying it to the
mortgagee and writing off our investment.
If
we are unable to extend our current credit facility or secure a new credit
facility at maturity of our current facility on March 31, 2010 at favorable
rates, our net income may decline or we may be forced to sell properties at
disadvantageous terms, which would result in the loss of revenues and in a
decline in the value of our portfolio.
As of
December 31, 2009 and March 10, 2010, we had $27 million outstanding under our
revolving credit facility. The facility is guaranteed by all of our
subsidiaries which own unencumbered properties, and the shares of stock of all
other subsidiaries are pledged as collateral. Our credit facility expires
on March 31, 2010. We have negotiated a modification and extension of our
credit facility with our lending syndicate and have come to agreement on all
material terms. The proposed modification and extension would reduce our
permitted borrowings from $62.5 million to $40 million, expire on March 31,
2012, and increase the interest rate from the lower of LIBOR plus 2.15% or the
bank’s prime rate to 90 day LIBOR plus 3% with a minimum interest rate of
6%. Although we are confident that the modification and extension will be
documented in accordance with the agreed upon terms, there can be no assurance
that it will be consummated. Between March 1, 2010 and April 30, 2010,
approximately $13.5 million of our mortgage debt matures. If we are not
successful in modifying or otherwise amending our current credit facility,
securing a new credit facility, financing unencumbered properties, selling
properties on favorable terms, or raising additional equity, our cash and short
term investments may not be sufficient to repay all amounts outstanding under
our credit facility when it matures on March 31, 2010 and all outstanding
amounts due under our mortgages maturing in 2010, and we may be forced to
dispose of properties on disadvantageous terms, which would lower our revenues
and the value of our portfolio.
The
United States’ credit markets continue to experience significant price
volatility and liquidity disruptions, which thus far has caused market prices of
many stocks to plummet and terms for financings to be less attractive, and in
many cases unavailable. Continued uncertainty in the credit markets could
negatively impact our ability to refinance the amount outstanding under our
revolving credit facility at favorable terms or at all, if the modification and
extension of the credit agreement is not finalized.
13
If
our borrowings increase, the risk of default on our repayment obligations and
our debt service requirements will also increase.
Our
governing documents do not contain any limitation on the amount of indebtedness
we may incur. However, the terms of our existing credit facility with VNB
New York Corp., Bank Leumi, USA, Manufacturers and Traders Trust Company and
Israel Discount Bank of New York limit our ability to incur indebtedness,
including limiting the total indebtedness that we may incur to an amount equal
to 70% of the value (as defined in the credit agreement) of our
properties. Similarly, the proposed modification and extension of our
credit facility will limit our ability to incur indebtedness, including limiting
the total indebtedness that we may incur to an amount equal to 65% of the value
(as defined) of our properties. Increased leverage could result in
increased risk of default on our payment obligations related to borrowings and
in an increase in debt service requirements, which could reduce our net income
and the amount of cash available to meet expenses and to make distributions to
our stockholders.
If
a significant number of our tenants default or fail to renew expiring leases, or
we take impairment charges against our properties, a breach of our revolving
credit facility could occur.
Our
revolving credit facility includes, and the proposed modification and extension
of our credit facility that we have negotiated will include, financial covenants
that require us to maintain certain financial ratios and requirements. If our
tenants default under their leases with us or fail to renew expiring leases,
generally accepted accounting principles may require us to recognize impairment
charges against our properties, and our financial position could be adversely
affected causing us to be in breach of the financial covenants contained in our
credit facility.
Failure
to meet interest and other payment obligations under our revolving credit
facility or a breach by us of the covenants to maintain the financial ratios
would place us in default under our credit facility, and, if the banks called a
default and required us to repay the full amount outstanding under the credit
facility, we might be required to rapidly dispose of our properties, which could
have an adverse impact on the amounts we receive on such disposition. If we are
unable to dispose of our properties in a timely fashion to the satisfaction of
the banks, the banks could foreclose on that portion of our collateral pledged
to the banks, which could result in the disposition of our properties at below
market values. The disposition of our properties at below our carrying value
would adversely affect our net income, reduce our stockholders’ equity and
adversely affect our ability to pay distributions to our
stockholders.
Impairment
charges against owned real estate may not be adequate to cover actual
losses.
Impairment
charges are based on an evaluation of known risks and economic factors. The
determination of an appropriate level of impairment charges is an inherently
difficult process and is based on numerous assumptions. The amount of
impairment charges of real estate is susceptible to changes in economic,
operating and other conditions that are largely beyond our control. Any
impairment charges that we may take may not be adequate to cover actual losses
and we may need to take additional impairment charges in the future. Actual
losses and additional impairment charges in the future could materially affect
our results of operations.
14
The
tightening of the credit markets have made it difficult for us to secure
financing, which may limit our ability to finance or refinance our real estate
properties, reduce the number of properties we can acquire, and adversely affect
your investment.
Due to
the national economic recession and credit crisis and the resulting caution by
lenders in evaluating and underwriting new transactions, there has been a
significant tightening of the credit markets. The tightening of the credit
markets make it difficult for us to secure mortgage debt, thereby limiting the
mortgage debt available on real estate properties we wish to acquire, and even
reducing the number of properties we can acquire. Even in the event that we are
able to secure mortgage debt on, or otherwise finance our real estate
properties, due to increased costs associated with securing financing and other
factors beyond our control, we run the risk of being unable to refinance the
entire outstanding loan balance or being subject to unfavorable terms (such as
higher loan fees, interest rates and periodic payments) if we do refinance the
loan balance. Either of these results could reduce any income from those
properties and reduce cash available for distribution, which may adversely
affect your investment.
Our
net leases and our ground leases require us to pay property related expenses
that are not the obligations of our tenants.
Under the
terms of substantially all of our net leases, in addition to satisfying their
rent obligations, our tenants are responsible for the payment of real estate
taxes, insurance and ordinary maintenance and repairs. Similarly, pursuant
to the terms of all of our leases at the community shopping center we acquired
on February 24, 2010, our tenants are required to reimburse us for a significant
portion of the property’s operating expenses. However, under the
provisions of certain net and shopping center leases, we are required to pay
some expenses, such as the costs of environmental liabilities, roof and
structural repairs, insurance, certain non-structural repairs and
maintenance. If our properties incur significant expenses that must be
paid by us under the terms of our leases, our business, financial condition and
results of operations will be adversely affected and the amount of cash
available to meet expenses and to make distributions to holders of our common
stock may be reduced.
Uninsured
and underinsured losses may affect the revenues generated by, the value of, and
the return from a property affected by a casualty or other claim.
Substantially
all of our tenants obtain, for our benefit, comprehensive insurance covering our
properties in amounts that are intended to be sufficient to provide for the
replacement of the improvements at each property. However, the amount of
insurance coverage maintained for any property may not be sufficient to pay the
full replacement cost of the improvements at the property following a casualty
event. In addition, the rent loss coverage under the policy may not extend
for the full period of time that a tenant may be entitled to a rent abatement as
a result of, or that may be required to complete restoration following, a
casualty event. In addition, there are certain types of losses, such as
those arising from earthquakes, floods, hurricanes and terrorist attacks, that
may be uninsurable or that may not be economically insurable. Changes in
zoning, building codes and ordinances, environmental considerations and other
factors also may make it impossible or impracticable for us to use insurance
proceeds to replace damaged or destroyed improvements at a property. If
restoration is not or cannot be completed to the extent, or within the period of
time, specified in certain of our leases, the tenant may have the right to
terminate the lease. If any of these or similar events occur, it may
reduce our revenues, the value of, or our return from, an affected
property.
15
Our
revenues and the value of our portfolio are affected by a number of factors that
affect investments in real estate generally.
We are
subject to the general risks of investing in real estate. These include
adverse changes in economic conditions and local conditions such as changing
demographics, retailing trends and traffic patterns, declines in the rental
rates, changes in the supply and price of quality properties and the market
supply and demand of competing properties, the impact of environmental laws,
security concerns, prepayment penalties applicable under mortgage financings,
changes in tax, zoning, building code, fire safety and other laws and
regulations, the type of insurance coverage available in the market, and changes
in the type, capacity and sophistication of building systems.
Approximately 59%, 13.5% and 11.3% of our 2010 contractual rental income is
expected to come from retail, industrial, and office tenants, respectively, and
we are vulnerable to economic declines that negatively impact these sectors of
the economy, which could have an adverse effect on our results of operations,
liquidity and financial condition.
Our
revenues and the value of our portfolio are affected by a number of factors that
affect investments in leased real estate generally.
We are
subject to the general risks of investing in leased real estate. These
include the non-performance of lease obligations by tenants, leasehold
improvements that will be costly or difficult to remove should it become
necessary to re-rent the leased space for other uses, covenants in certain
retail leases that limit the types of tenants to which available space can be
rented (which may limit demand or reduce the rents realized on re-renting),
rights of termination of leases due to events of casualty or condemnation
affecting the leased space or the property or due to interruption of the
tenant’s quiet enjoyment of the leased premises, and obligations of a landlord
to restore the leased premises or the property following events of casualty or
condemnation. The occurrence of any of these events could adversely impact
our results of operations, liquidity and financial condition.
Real
estate investments are relatively illiquid and their values may
decline.
Real estate investments are relatively
illiquid. Therefore, we will be limited in our ability to reconfigure our
real estate portfolio in response to economic changes. We may encounter
difficulty in disposing of properties when tenants vacate either at the
expiration of the applicable lease or otherwise. If we decide to sell any of our
properties, our ability to sell these properties and the prices we receive on
their sale may be
affected by many factors, including the number of potential buyers, the number
of competing properties on the market and other market conditions, as well as
whether the property is leased and if it is leased, the terms of the lease. As a result, we may be
unable to sell our properties for an extended period of time without incurring a
loss, which would adversely affect our results of operations, liquidity and
financial condition.
The
concentration of our properties in certain geographic areas may make our
revenues and the value of our portfolio vulnerable to adverse changes in local
economic conditions.
We do not
have specific limitations on the total percentage of our real estate properties
that may be located in any one geographic area. Consequently, properties
that we own may be located in the same or a limited number of geographic
regions. Approximately 31% of our rental income (excluding our share of
rental income from our joint ventures) for the year ended December 31, 2009 was,
and approximately 30% of our 2010 contractual rental income will be, derived
from properties located in Texas and New York. At December 31, 2009, 27%
of the depreciated book value of our real estate investments (excluding our
share of the assets from our joint ventures) were located in Texas and New
York. As a result, a decline in the economic conditions in these
geographic regions, or in geographic regions where our properties may be
concentrated in the future, may have an adverse effect on the rental and
occupancy rates for, and the property values of, these properties, which could
lead to a reduction in our rental income and in the results of
operations.
16
We
may pay our stockholder distributions in shares of our common stock, thereby
reducing the cash a stockholder would have otherwise received from
us.
Effective
with respect to distributions declared on or after January 1, 2008, and
applicable to REIT distributions with respect to taxable income from years
ending on or before December 31, 2011, the Internal Revenue Service has issued
Revenue Procedures in order to assist REITs in retaining cash, while
simultaneously satisfying their tax distribution requirements. Pursuant to
these Revenue Procedures, REITs may temporarily satisfy the distribution
requirements for their taxable income from 2009, 2010 and 2011 by offering their
stockholders the option to receive the distribution in cash or the REIT’s
stock. If too many of a REIT’s stockholders elect to receive only cash,
each such stockholder may receive up to 90% of the distribution in shares of
stock, thereby reducing the cash such stockholder would have otherwise received
from such REIT. We have elected to take advantage of these Revenue
Procedures, and the distributions we paid on April 27, 2009, July 21, 2009,
October 30, 2009 and January 25, 2010, consisted of 90% stock and 10%
cash. On March 9, 2010, our board of directors declared a distribution of
$.30 per share to be paid on April 6, 2010, which will consist of all
cash. For any other distributions we declare applicable to 2009, 2010 or
2011 taxable income, we may provide our stockholders with the option of
receiving such distribution in cash or shares of our common stock to be
determined by our board of directors. A distribution which consists of
cash and stock may negatively impact the market price of our common
stock.
If
we reduce our dividend, the market value of our common stock may
decline.
The level
of our common stock dividend is established by our board of directors from time
to time based on a variety of factors, including our cash available for
distribution, our funds from operations and our maintenance of REIT
status. Various factors could cause our board of directors to decrease our
dividend level, including tenant defaults or bankruptcies resulting in a
material reduction in our funds from operations or a material loss resulting
from an adverse change in the value of one or more of our properties. If
our board determines to reduce our common stock dividend, the market value of
our common stock could be adversely affected.
We cannot assure you of our ability
to pay dividends in the future.
We intend
to pay quarterly dividends and to make distributions to our stockholders in
amounts such that all or substantially all of our taxable income in each year,
subject to certain adjustments, is distributed. This, along with other
factors, will enable us to quality for the tax benefits accorded to a REIT under
the Code. We have not established a minimum dividend payment level and our
ability to pay dividends may be adversely affected by the risk factors described
in this Annual Report on Form 10-K. All distributions will be made at the
discretion of our board of directors and will depend on our earnings, our
financial condition, maintenance of our REIT status and such other factors as
our board of directors may deem relevant from time to time. If the
economic crisis and recession continues, our tenants may be further affected,
which could likely cause a decline in our revenues, and may reduce or eliminate
our profitability and result in the reduction or elimination of our
dividends.
Competition
in the real estate business is intense and could reduce our revenues and harm
our business.
We
compete for real estate investments with all types of investors, including
domestic and foreign corporations and real estate companies, financial
institutions, insurance companies, pension funds, investment funds, other REITs
and individuals. Many of these competitors have significant advantages
over us, including a larger, more diverse group of properties and greater
financial and other resources.
17
Compliance
with environmental regulations and associated costs could adversely affect our
liquidity.
Under
various federal, state and local laws, ordinances and regulations, an owner or
operator of real property may be required to investigate and clean up hazardous
or toxic substances or petroleum product releases at the property and may be
held liable to a governmental entity or to third parties for property damage and
for investigation and cleanup costs incurred in connection with
contamination. The cost of investigation, remediation or removal of
hazardous or toxic substances may be substantial, and the presence of such
substances, or the failure to properly remediate a property, may adversely
affect our ability to sell or rent the property or to borrow money using the
property as collateral. In connection with our ownership, operation and
management of real properties, we may be considered an owner or operator of the
properties and, therefore, potentially liable for removal or remediation costs,
as well as certain other related costs, including governmental fines and
liability for injuries to persons and property, not only with respect to
properties we own now or may acquire, but also with respect to properties we
have owned in the past.
We cannot
provide any assurance that existing environmental studies with respect to any of
our properties reveal all potential environmental liabilities, that any prior
owner of a property did not create any material environmental condition not
known to us, or that a material environmental condition does not otherwise
exist, or may not exist in the future, as to any one or more of our
properties. If a material environmental condition does in fact exist, or
exists in the future, the remediation of costs could have a material adverse
impact upon our results of operations, liquidity and financial
condition.
Compliance
with the Americans with Disabilities Act could be costly.
Under the
Americans with Disabilities Act of 1990, all public accommodations must meet
Federal requirements for access and use by disabled persons. A
determination that our properties do not comply with the Americans with
Disabilities Act could result in liability for both governmental fines and
damages. If we are required to make unanticipated major modifications to
any of our properties to comply with the Americans with Disabilities Act, which
are determined not to be the responsibility of our tenants, we could incur
unanticipated expenses that could have an adverse impact upon our results of
operations, liquidity and financial condition.
Our
senior management and other key personnel are critical to our business and our
future success depends on our ability to retain them.
We depend
on the services of Fredric H. Gould, chairman of our Board of Directors, Patrick
J. Callan, Jr., our president and chief executive officer, Lawrence G. Ricketts,
Jr., our executive vice president and chief operating officer, and other members
of our senior management to carry out our business and investment
strategies. Only two of our senior officers, Messrs. Callan and Ricketts,
devote all of their business time to our company. The remainder of our
senior management provide services to us on a part-time, as-needed basis.
The loss of the services of any of our senior management or other key personnel,
or our inability to recruit and retain qualified personnel in the future, could
impair our ability to carry out our business and investment strategies. We
would need to attract and retain qualified senior management and other key
personnel, both on a full-time and part-time basis.
18
Our
transactions with affiliated entities involve conflicts of
interest.
From time
to time we have entered into transactions with persons and entities affiliated
with us and with certain of our officers and directors. Our policy for
transactions with affiliates is to have these transactions approved by our audit
committee and by a majority of our board of directors, including a majority of
our independent directors. We entered into a compensation and services
agreement with Majestic Property Management Corp. effective as of January 1,
2007. Majestic Property Management Corp. is wholly-owned by the chairman
of our Board of Directors and it provides compensation to certain of our senior
executive officers. Pursuant to the compensation and services agreement, we pay
an annual fee to Majestic Property Management Corp. and they assume our
obligations under a shared services agreement, and provide us with the
services of all affiliated executive, administrative, legal, accounting and
clerical personnel that we use on a part time basis, as well as certain property
management services, property acquisition, sales and leasing and mortgage
brokerage services. In 2009, we paid to Majestic a fee of approximately
$2,025,000 under the compensation and services agreement. In addition, in
accordance with the compensation and services agreement, in 2009 we paid our
chairman a fee of $250,000 and made an additional payment to Majestic Property
Management Corp. of $175,000 for our share of all direct office expenses,
including rent, telephone, postage, computer services, and internet
usage.
Risks Related to the REIT
Industry
Failure
to qualify as a REIT would result in material adverse tax consequences and would
significantly reduce cash available for distributions.
We
operate so as to qualify as a REIT under the Internal Revenue Code of 1986, as
amended. Qualification as a REIT involves the application of technical and
complex legal provisions for which there are limited judicial and administrative
interpretations. The determination of various factual matters and
circumstances not entirely within our control may affect our ability to qualify
as a REIT. In addition, no assurance can be given that legislation, new
regulations, administrative interpretations or court decisions will not
significantly change the tax laws with respect to qualification as a REIT or the
federal income tax consequences of such qualification. If we fail to
quality as a REIT, we will be subject to federal, certain additional state and
local income tax (including any applicable alternative minimum tax) on our
taxable income at regular corporate rates and would not be allowed a deduction
in computing our taxable income for amounts distributed to stockholders.
In addition, unless entitled to relief under certain statutory provisions, we
would be disqualified from treatment as a REIT for the four taxable years
following the year during which qualification is lost. The additional tax
would reduce significantly our net income and the cash available for
distributions to stockholders.
We
are subject to certain distribution requirements that may result in our having
to borrow funds at unfavorable rates.
To obtain
the favorable tax treatment associated with being a REIT, we generally are
required, among other things, to distribute to our stockholders at least 90% of
our ordinary taxable income (subject to certain adjustments) each year. To
the extent that we satisfy these distribution requirements, but distribute less
than 100% of our taxable income we will be subject to federal corporate tax on
our undistributed taxable income. In addition, we may be subject to a 4%
nondeductible excise tax on the amount, if any, by which certain distributions
paid by us with respect to any calendar year are less than the sum of 85% of our
ordinary income, 95% of our capital gain net income and 100% of our
undistributed income from prior years.
19
As a
result of differences in timing between the receipt of income and the payment of
expenses, and the inclusion of such income and the deduction of such expenses in
arriving at taxable income, and the effect of nondeductible capital
expenditures, the creation of reserves and the timing of required debt service
(including amortization) payments, we may need to borrow funds or make
distributions in stock during 2010, in order to make the distributions necessary
to retain the tax benefits associated with qualifying as a REIT, even if we
believe that then prevailing market conditions are not generally favorable for
such borrowings, such as currently is the case. Such borrowings could
reduce our net income and the cash available for distributions to holders of our
common stock.
Compliance
with REIT requirements may hinder our ability to maximize profits.
In order
to qualify as a REIT for Federal income tax purposes, we must continually
satisfy tests concerning, among other things, our sources of income, the amounts
we distribute to our stockholders and the ownership of our stock. We may
also be required to make distributions to stockholders at disadvantageous times
or when we do not have funds readily available for distribution.
Accordingly, compliance with REIT requirements may hinder our ability to operate
solely on the basis of maximizing profits.
In order
to qualify as a REIT, we must also ensure that at the end of each calendar
quarter, at least 75% of the value of our assets consists of cash, cash items,
government securities and qualified REIT real estate assets. Any
investment in securities cannot include more than 10% of the outstanding voting
securities of any one issuer or more than 10% of the total value of the
outstanding securities of any one issuer. In addition, no more than 5% of
the value of our assets can consist of the securities of any one issuer, other
than a qualified REIT security. If we fail to comply with these
requirements, we must dispose of such portion of these securities in excess of
these percentages within 30 days after the end of the calendar quarter in order
to avoid losing our REIT status and suffering adverse tax consequences.
This requirement could cause us to dispose of assets for consideration that is
less than their true value and could lead to an adverse impact on our results of
operations and financial condition.
|
Item
1B.
|
Unresolved Staff
Comments.
|
None.
20
EXECUTIVE
OFFICERS
Set forth
below is a list of our executive officers whose terms expire at our 2010 annual
board of director’s meeting. The business history of our officers, who are also
directors, will be provided in our proxy statement to be filed pursuant to
Regulation 14A not later than April 30, 2010.
|
NAME
|
AGE
|
POSITION WITH THE
COMPANY
|
||
|
Fredric
H. Gould*
|
74
|
Chairman
of the Board
|
||
|
Patrick
J. Callan, Jr.
|
47
|
President,
Chief Executive Officer, and Director
|
||
|
Lawrence
G. Ricketts, Jr.
|
33
|
Executive
Vice President and Chief Operating Officer
|
||
|
Jeffrey
A. Gould*
|
44
|
Senior
Vice President and Director
|
||
|
Matthew
J. Gould*
|
50
|
Senior
Vice President and Director
|
||
|
David
W. Kalish
|
62
|
Senior
Vice President and Chief Financial Officer
|
||
|
Israel
Rosenzweig
|
62
|
Senior
Vice President
|
||
|
Mark
H. Lundy**
|
47
|
Senior
Vice President and Secretary
|
||
|
Simeon
Brinberg**
|
76
|
Senior
Vice President
|
||
|
Karen
Dunleavy
|
51
|
Vice
President, Financial
|
||
|
Alysa
Block
|
|
49
|
|
Treasurer
|
*
Matthew J. Gould and Jeffrey A. Gould are Fredric H. Gould’s
sons.
** Mark
H. Lundy is Simeon Brinberg’s son-in-law.
Lawrence G. Ricketts,
Jr. Mr. Ricketts has been Chief Operating Officer of One Liberty
Properties since January 2008, and Vice President since December 1999 (Executive
Vice President since June 2006), and has been employed by One Liberty Properties
since January 1999.
David W. Kalish. Mr.
Kalish has served as Senior Vice President and Chief Financial Officer of One
Liberty Properties since June 1990. Mr. Kalish has served as Senior Vice
President, Finance of BRT Realty Trust since August 1998 and Vice President and
Chief Financial Officer of the managing general partner of Gould Investors L.P.
since June 1990. Mr. Kalish is a certified public accountant.
Israel Rosenzweig. Mr.
Rosenzweig has been a Senior Vice President of One Liberty Properties since June
1997 and a Senior Vice President of BRT Realty Trust since March 1998. He
has been a Vice President of the managing general partner of Gould Investors
L.P. since May 1997 and was President of GP Partners, Inc., a sub-advisor to a
registered investment advisor, from 2000 to March 2009.
21
Mark H. Lundy. Mr. Lundy
has served as the Secretary of One Liberty Properties since June 1993 and a Vice
President since June 2000 (Senior Vice President since June 2006). Mr.
Lundy has been a Vice President of BRT Realty Trust since April 1993 (Senior
Vice President since March 2005) and a Vice President of the managing general
partner of Gould Investors L.P. since July 1990. He is an attorney-at-law
and a member of the bars of New York and the District of Columbia.
Simeon Brinberg. Mr.
Brinberg has served as a Senior Vice President of One Liberty Properties since
1989. He has been Secretary of BRT Realty Trust since 1983, a Senior Vice
President of BRT Realty Trust since 1988 and a Vice President of the managing
general partner of Gould Investors L.P. since 1988. Mr. Brinberg is an
attorney-at-law and a member of the bar of the State of New York.
Karen Dunleavy. Ms.
Dunleavy has been Vice President, Financial of One Liberty Properties since
August 1994. She has served as Treasurer of the managing general partner
of Gould Investors L.P. since 1986. Ms. Dunleavy is a certified public
accountant.
Alysa Block. Ms. Block
has been Treasurer of One Liberty Properties since June 2007, and served as
Assistant Treasurer from June 1997 to June 2007. Ms. Block also serves as
the Treasurer of BRT Realty Trust since March 2008, and served as its Assistant
Treasurer from March 1997 to March 2008.
22
Item
2. Properties.
As of
December 31, 2009 (giving effect to a community shopping center we acquired on
February 24, 2010), we owned 72 properties, one of which is vacant and one of
which is a 50% tenancy in common interest, and participated in five joint
ventures that own five properties. The properties owned by us and our
joint ventures are suitable and adequate for their current uses. The
aggregate net book value of our 71 properties as of December 31, 2009 (excluding
the community shopping center we acquired on February 24, 2010), was $345.7
million.
The
tables below set forth information as of December 31, 2009 (giving effect to a
community shopping center we acquired on February 24, 2010) concerning each
property which we own and in which we currently own an equity interest.
Except for one movie theater property, we and our joint ventures own fee title
to each property.
Our
Properties
|
Percentage
|
||||||||||
|
of 2010
|
Approximate
|
|||||||||
|
Type of
|
Contractual
|
Building
|
||||||||
|
Location
|
Property
|
Rental Income (1)
|
Square Feet
|
|||||||
|
Baltimore,
MD
|
Industrial
|
5.9 | % | 367,000 | ||||||
|
Parsippany,
NJ
|
Office
|
5.1 | 106,680 | |||||||
|
Hauppauge,
NY
|
Flex
|
4.6 | 149,870 | |||||||
|
Royersford,
PA
|
Retail
(2)
|
4.1 | 194,451 | |||||||
|
El
Paso, TX
|
Retail
|
3.9 | 110,179 | |||||||
|
Greensboro,
NC
|
Theater
|
3.5 | 61,213 | |||||||
|
Los
Angeles, CA
|
Office
(3)
|
3.3 | 106,262 | |||||||
|
Plano,
TX
|
Retail
(4)
|
3.0 | 112,389 | |||||||
|
Brooklyn,
NY
|
Office
|
2.8 | 66,000 | |||||||
|
Knoxville,
TN
|
Retail
|
2.7 | 35,330 | |||||||
|
Columbus,
OH
|
Retail
(4)
|
2.6 | 96,924 | |||||||
|
Philadelphia,
PA
|
Industrial
|
2.3 | 166,000 | |||||||
|
Plano,
TX
|
Retail
(5)
|
2.3 | 51,018 | |||||||
|
East
Palo Alto, CA
|
Retail
(6)
|
2.3 | 30,978 | |||||||
|
Tucker,
GA
|
Health
& Fitness
|
2.2 | 58,800 | |||||||
|
Ronkonkoma,
NY
|
Flex
|
1.9 | 89,500 | |||||||
|
Manhattan,
NY
|
Residential
|
1.8 | 125,000 | |||||||
|
Lake
Charles, LA
|
Retail
(7)
|
1.7 | 54,229 | |||||||
|
Cedar
Park, TX
|
Retail
(4)
|
1.7 | 50,810 | |||||||
|
Columbus,
OH
|
Industrial
|
1.5 | 100,220 | |||||||
|
Grand
Rapids, MI
|
Health
& Fitness
|
1.4 | 130,000 | |||||||
23
|
Percentage
|
||||||||||
|
of 2010
|
Approximate
|
|||||||||
|
Type of
|
Contractual
|
Building
|
||||||||
|
Location
|
Property
|
Rental Income (1)
|
Square Feet
|
|||||||
|
Ft.
Myers, FL
|
Retail
|
1.4 | 29,993 | |||||||
|
Atlanta,
GA
|
Retail
|
1.4 | 50,400 | |||||||
|
Chicago,
IL
|
Retail
(6)
|
1.3 | 23,939 | |||||||
|
Miami
Springs, FL
|
Retail
(6)
|
1.3 | 25,000 | |||||||
|
Kennesaw,
GA
|
Retail
(6)
|
1.3 | 32,052 | |||||||
|
Wichita,
KS
|
Retail
(4)
|
1.2 | 88,108 | |||||||
|
Athens,
GA
|
Retail
(8)
|
1.2 | 41,280 | |||||||
|
Naples,
FL
|
Retail
(6)
|
1.2 | 15,912 | |||||||
|
Saco,
ME
|
Industrial
|
1.2 | 91,400 | |||||||
|
New
Hyde Park, NY
|
Industrial
|
1.2 | 38,000 | |||||||
|
Champaign,
IL
|
Retail
|
1.2 | 50,530 | |||||||
|
Greenwood
Village, CO
|
Retail
|
1.1 | 45,000 | |||||||
|
Tyler,
TX
|
Retail
(4)
|
1.1 | 72,000 | |||||||
|
Onalaska,
WI
|
Retail
|
1.1 | 63,919 | |||||||
|
Melville,
NY
|
Industrial
|
1.1 | 51,351 | |||||||
|
Cary,
NC
|
Retail
(6)
|
1.1 | 33,490 | |||||||
|
Fayetteville,
GA
|
Retail
(4)
|
1.0 | 65,951 | |||||||
|
Richmond,
VA
|
Retail
(4)
|
.9 | 38,788 | |||||||
|
Amarillo,
TX
|
Retail
(4)
|
.9 | 72,227 | |||||||
|
Virginia
Beach, VA
|
Retail
(4)
|
.9 | 58,937 | |||||||
|
Eugene,
OR
|
Retail
(6)
|
.9 | 24,978 | |||||||
|
Selden,
NY
|
Retail
|
.9 | 14,550 | |||||||
|
Pensacola,
FL
|
Retail
(6)
|
.9 | 22,700 | |||||||
|
Lexington,
KY
|
Retail
(4)
|
.8 | 30,173 | |||||||
|
El
Paso, TX
|
Retail
(6)
|
.8 | 25,000 | |||||||
24
|
Percentage
|
||||||||||
|
of 2010
|
Approximate
|
|||||||||
|
Type of
|
Contractual
|
Building
|
||||||||
|
Location
|
Property
|
Rental Income (1)
|
Square Feet
|
|||||||
|
Duluth,
GA
|
Retail
(4)
|
.8 | 50,260 | |||||||
|
Grand
Rapids, MI
|
Health
& Fitness
|
.8 | 72,000 | |||||||
|
Newport
News, VA
|
Retail
(4)
|
.8 | 49,865 | |||||||
|
Hyannis,
MA
|
Retail
|
.7 | 9,750 | |||||||
|
Batavia,
NY
|
Retail
(6)
|
.7 | 23,483 | |||||||
|
Gurnee,
IL
|
Retail
(4)
|
.7 | 22,768 | |||||||
|
Somerville,
MA
|
Retail
|
.6 | 12,054 | |||||||
|
Hauppauge,
NY
|
Retail
|
.6 | 7,000 | |||||||
|
Bluffton,
SC
|
Retail
(4)
|
.6 | 35,011 | |||||||
|
Houston,
TX
|
Retail
|
.6 | 12,000 | |||||||
|
Vicksburg,
MS
|
Retail
|
.5 | 2,790 | |||||||
|
Everett,
MA
|
Retail
|
.4 | 18,572 | |||||||
|
Flowood,
MS
|
Retail
|
.4 | 4,505 | |||||||
|
Bastrop,
LA
|
Retail
|
.4 | 2,607 | |||||||
|
Monroe,
LA
|
Retail
|
.4 | 2,756 | |||||||
|
Marston
Mills, MA
|
Retail
|
.4 | 8,775 | |||||||
|
D’Iberville,
MS
|
Retail
|
.4 | 2,650 | |||||||
|
Kentwood,
LA
|
Retail
|
.4 | 2,578 | |||||||
|
Monroe,
LA
|
Retail
|
.4 | 2,806 | |||||||
|
Vicksburg,
MS
|
Retail
|
.4 | 4,505 | |||||||
|
Newark,
DE
|
Retail
|
.3 | 23,547 | |||||||
|
West
Palm Beach, FL
|
Industrial
|
.3 | 10,361 | |||||||
|
Killeen,
TX
|
Retail
|
.2 | 8,000 | |||||||
|
Seattle,
WA
|
Retail
|
.1 | 3,038 | |||||||
|
Rosenberg,
TX
|
Retail
|
.1 | 8,000 | |||||||
|
New
Hyde Park, NY
|
Industrial
(9)
|
- | 51,000 | |||||||
| 100 | % | 3,819,212 | ||||||||
25
Properties
Owned by Joint Ventures (10)
|
Percentage
|
||||||||||
|
of Our Share
|
||||||||||
|
of Rent Payable
|
Approximate
|
|||||||||
|
Type of
|
in 2010 to Our
|
Building
|
||||||||
|
Location
|
Property
|
Joint Ventures
|
Square Feet
|
|||||||
|
Lincoln,
NE
|
Retail
|
45.8 | % | 112,260 | ||||||
|
Milwaukee,
WI
|
Industrial
|
42.7 | 927,685 | |||||||
|
Savannah,
GA
|
Retail
|
5.5 | 101,550 | |||||||
|
Miami,
FL
|
Industrial
|
3.9 | 396,000 | |||||||
|
Savannah,
GA
|
Retail
|
2.1 | 7,959 | |||||||
| 100 | % | 1,545,454 | ||||||||
_______________
|
(1)
|
Percentage
of 2010 contractual rental income payable to us in 2010 (a) under leases
existing at December 31, 2009, (b) on our tenancy in common interest, and
(c) under leases at a community shopping center we acquired on February
24, 2010.
|
|
(2)
|
Property
is a community shopping center we acquired on February 24, 2010 and is
leased to ten tenants.
|
|
(3)
|
An
undivided 50% interest in this property is owned by us as tenant in common
with an unrelated entity. Percentage of contractual rental income
indicated represents our share of the 2010 rental
income. Approximate square footage indicated represents the
total rentable square footage of the
property.
|
|
(4)
|
This
property is leased to a retail furniture
operator.
|
|
(5)
|
Property
has two tenants, of which approximately 53% is leased to a retail
furniture operator.
|
|
(6)
|
This
property is leased to a retail office supply
operator.
|
|
(7)
|
Property
has three tenants, of which approximately 43% is leased to a retail office
supply operator.
|
|
(8)
|
Property
has two tenants, of which approximately 48% is leased to a retail office
supply operator.
|
|
(9)
|
Vacant
property.
|
|
(10)
|
Each
property is owned by a joint venture in which we are a venture
partner. Except for the joint venture which owns the Miami,
Florida property, in which we own a 36% economic interest, we own a 50%
economic interest in each joint venture. Approximate square
footage indicated represents the total rentable square footage of the
property owned by the joint
venture.
|
The
occupancy rate for our properties (including the property in which we own a
tenancy in common interest and the community shopping center we acquired on
February 24, 2010) based on total rentable square footage, was 98.6% and 97.5%
as of December 31, 2009 and 2008, respectively. The occupancy rate
for the community shopping center we acquired on February 24, 2010 was 99% as of
the acquisition date. The occupancy rate for the properties owned by
our joint ventures, based on total rentable square footage, was 100% and 99.5%
as of December 31, 2009 and 2008, respectively.
26
As of December 31, 2009 (giving effect
to the community shopping center we acquired on February 24, 2010), the 72
properties owned by us and the five properties owned by our joint ventures are
located in 27 states.
The following tables set forth certain
information, presented by state, related to our properties and properties owned
by our joint ventures as of December 31, 2009 (giving effect to the community
shopping center we acquired on February 24, 2010).
Our
Properties
|
Approximate
|
||||||||||||
|
Number
of
|
2010 Contractual
|
Building
|
||||||||||
|
State
|
Properties
|
Rental Income
|
Square Feet
|
|||||||||
|
New
York
|
10
|
$ | 6,191,264 | 615,754 | ||||||||
|
Texas
|
10
|
5,773,100 | 521,623 | |||||||||
|
Georgia
|
6
|
3,150,157 | 298,743 | |||||||||
|
Pennsylvania
|
2
|
2,553,724 | 360,451 | |||||||||
|
Maryland
|
1
|
2,340,923 | 367,000 | |||||||||
|
California
|
2
|
2,223,556 | 137,240 | |||||||||
|
New
Jersey
|
1
|
2,034,921 | 106,680 | |||||||||
|
Florida
|
5
|
2,015,585 | 103,966 | |||||||||
|
North
Carolina
|
2
|
1,810,259 | 94,703 | |||||||||
|
Ohio
|
2
|
1,651,084 | 197,144 | |||||||||
|
Louisiana
|
5
|
1,321,204 | 64,976 | |||||||||
|
Illinois
|
3
|
1,258,630 | 97,237 | |||||||||
|
Tennessee
|
1
|
1,079,367 | 35,330 | |||||||||
|
Virginia
|
3
|
1,036,044 | 147,590 | |||||||||
|
Other
|
19
|
5,385,730 | 670,775 | |||||||||
|
72
|
$ | 39,825,548 | 3,819,212 | |||||||||
Properties
Owned by Joint Ventures
|
Our Share
|
||||||||||||
|
of Rent Payable
|
Approximate
|
|||||||||||
|
Number
of
|
in 2010 to Our
|
Building
|
||||||||||
|
State
|
Properties
|
Joint Ventures
|
Square Feet
|
|||||||||
|
Nebraska
|
1
|
$ | 603,594 | 112,260 | ||||||||
|
Wisconsin
|
1
|
562,500 | 927,685 | |||||||||
|
Georgia
|
2
|
99,318 | 109,509 | |||||||||
|
Florida
|
1
|
51,496 | 396,000 | |||||||||
|
5
|
$ | 1,316,908 | 1,545,454 | |||||||||
27
At
December 31, 2009 (excluding the community shopping center we acquired on
February 24, 2010), we had first mortgages on 52 of the 71 properties we owned
as of that date (including our 50% tenancy in common interest, but excluding
properties owned by our joint ventures). At December 31, 2009, we had
approximately $190.5 million of mortgage loans outstanding, bearing interest at
rates ranging from 5.4% to 8.8%. Upon the acquisition of the
community shopping center on February 24, 2010, we assumed a $17.7 million
mortgage loan, bearing interest at 5.67%. Substantially all of our
mortgage loans contain prepayment penalties. The following table sets
forth scheduled principal mortgage payments due for our properties as of
December 31, 2009 (excluding the community shopping center we acquired on
February 24, 2010), and assumes no payment is made on principal on any
outstanding mortgage in advance of its due date:
| PRINCIPAL PAYMENTS DUE | |||||
|
|
IN YEAR INDICATED | ||||
|
YEAR
|
(Amounts in Thousands) | ||||
|
2010
|
$
|
23,259 | (a) | ||
|
2011
|
8,061 | ||||
|
2012
|
36,994 | ||||
|
2013
|
8,999 | ||||
|
2014
|
19,356 | ||||
|
Thereafter
|
93,849 | ||||
|
Total
|
$
|
190,518 | |||
(a) Includes
a $4.5 million mortgage loan which matured on March 1, 2010 which we have not
paid off and are currently in discussions with representatives of the
mortgagee. In addition, three other mortgages mature during 2010,
which require balloon payments aggregating approximately $12.4 million at
maturity, including a $2.4 million mortgage loan we paid off in January
2010. Also included is a $1.7 million mortgage loan which the lender
can call on 90 days notice and the scheduled amortization of principal balances
in the amount of $4.7 million.
At December 31, 2009, our joint
ventures had first mortgages on three properties with outstanding balances of
approximately $17.9 million, bearing interest at rates ranging from 5.8% to
6.4%. Substantially all these mortgages contain prepayment
penalties. The following table sets forth the scheduled principal
mortgage payments due for properties owned by our joint ventures as of December
31, 2009, and assumes no payment is made on principal on any outstanding
mortgage in advance of its due date:
|
PRINCIPAL
PAYMENTS DUE
|
|||||
|
|
IN
YEAR INDICATED
|
||||
|
YEAR
|
(Amounts in
Thousands)
|
||||
|
2010
|
$
|
462 | |||
|
2011
|
490 | ||||
|
2012
|
520 | ||||
|
2013
|
552 | ||||
|
2014
|
586 | ||||
|
Thereafter
|
15,296 | ||||
|
Total
|
$
|
17,906 | |||
28
Significant
Tenants
As of
December 31, 2009, no single property owned by us had a book value equal to or
greater than 10% of our total assets or had revenues which accounted for more
than 10% of our aggregate annual gross revenues in the year ended December 31,
2009.
Haverty
Furniture Companies, Inc.
As of
December 31, 2009, we owned a portfolio of eleven properties leased under a
master lease to Haverty Furniture Companies, Inc., which properties had a net
book value equal to 14.9% of our depreciated book value of real estate
investments, and revenues which accounted for 11.9% of our aggregate annual
gross revenues in the year ended December 31, 2009. Of the eleven properties,
three are located in each of Texas and Virginia, two are located in Georgia, and
one is located in each of Kansas, Kentucky and South Carolina. The
properties contain buildings with an aggregate of approximately 612,130 square
feet.
The
properties are net leased to Haverty Furniture Companies, Inc. pursuant to a
master lease, which expires on August 14, 2022. Haverty Furniture
Companies, Inc. is a New York Stock Exchange listed company and operates over
100 showrooms in 17 states. The master lease provides for a current base
rent of $4,310,000 per annum (which accounts for 10.8% of our 2010 contractual
rental income), increasing on August 15, 2012 and every five years thereafter
and provides the tenant with certain renewal options. Pursuant to the
master lease, the tenant is responsible for maintenance and repairs, and for
real estate taxes and assessments on the properties. The 2009 annual real
estate taxes on the properties aggregated $856,000. The tenant
utilizes approximately 86% of the properties for retail and 14% for
warehouse.
The
mortgage loan, which our subsidiary, OLP Havertportfolio L.P.,
assumed when it acquired these eleven properties in 2006, is secured by
mortgages/deeds of trust on all such properties in the principal amount of
approximately $24.7 million at December 31, 2009. The mortgage loan bears
interest at 6.87% per annum, matures on September 1, 2012 and is being amortized
based on a 25-year amortization schedule. Assuming only contractual
payments are made on the principal amount of the mortgage loan, the principal
balance due on the maturity date will be approximately $23 million. Although the
mortgage loan provides for defeasance, it is generally not prepayable until 90
days prior to the maturity date.
Office
Depot, Inc.
As of
December 31, 2009, we owned a portfolio of ten properties, each of which is
subject to a lease with Office Depot, Inc. The ten Office Depot, Inc.
properties have a net book value equal to 13.9% of our depreciated book value of
real estate investments, accounted for 10.9% of our 2009 rental income and will
account for 11.1% of our 2010 contractual rental income. Of the ten
properties, two are located in each of Florida and Georgia, and one is located
in each of California, Illinois, Louisiana, North Carolina, Oregon and
Texas. The properties contain buildings with an aggregate of
approximately 261,678 square feet.
Each
property is subject to a separate lease. Eight of the leases contain
cross-default provisions, expire on September 30, 2018, and provide the tenant
with four five-year renewal options. One lease expires on June 30, 2013 and
provides the tenant with three five-year renewal options, and one lease expires
on February 28, 2014 and provides the tenant with four five-year renewal
options. Office Depot, Inc. is a New York Stock Exchange listed
company and operates over 1,500 worldwide retail stores. The ten
leases provide for an aggregate current base rent of $4,439,000. The
rent for eight of the properties increases every five years by
10%. The rent for one property increases by 5% every five years and
the rent for one property increases by $20,000 every five
years. Pursuant to the leases, the tenant is responsible for
maintenance and repairs, and for real estate taxes and assessments on the
properties. The 2009 annual real estate taxes on the properties
aggregated $696,000.
29
Item 3.
Legal
Proceedings
None.
Part
II
|
Item
4.
|
Reserved.
|
|
Item
5.
|
Market for the
Registrant's Common Equity, Related Stockholder Matters and Issuer
Purchase of Equity
Securities.
|
Our
common stock is listed on the New York Stock Exchange. The following
table sets forth the high and low prices for our common stock as reported by the
New York Stock Exchange for 2009 and for 2008 and the per share distributions
declared on our common stock during each quarter of the years ended December 31,
2009 and 2008.
|
DISTRIBUTION
|
||||||||||||
|
2009
|
HIGH
|
LOW
|
PER SHARE(1)
|
|||||||||
|
First
Quarter
|
$ | 10.28 | $ | 2.48 | $ | .22 | (2) | |||||
|
Second
Quarter
|
$ | 6.90 | $ | 3.21 | $ | .22 | (3) | |||||
|
Third
Quarter
|
$ | 9.89 | $ | 5.30 | $ | .22 | (4) | |||||
|
Fourth
Quarter
|
$ | 9.40 | $ | 7.92 | $ | .22 | (5) | |||||
|
(1)
|
The
provisions of Internal Revenue Service Revenue Procedures related to REITs
permits public REITs to distribute a dividend with respect to the 2009,
2010 and 2011 taxable income by issuing shares of common stock; provided
that at least 10% of the dividend amount is paid in cash. We
elected to use these provisions for each dividend we declared in
2009. For each dividend we declared in 2009 the cash amount was
allocated pro rata among all stockholders who elected to receive cash.
Since any stockholder electing cash could not receive the entire dividend
in cash, the remainder of the dividend was paid in shares of our common
stock. Stockholders who did not elect to receive cash received the entire
dividend in shares of our common
stock.
|
|
(2)
|
This
dividend was distributed on April 27, 2009 and consisted of an aggregate
of 529,000 shares of our common stock and approximately $223,000 in
cash.
|
|
(3)
|
This
dividend was distributed on July 21, 2009 and consisted of an aggregate of
376,000 shares of our common stock and approximately $234,000 in
cash.
|
|
(4)
|
This
dividend was distributed on October 30, 2009 and consisted of an aggregate
of 255,000 shares of our common stock and approximately $240,000 in
cash.
|
|
(5)
|
This
dividend was distributed on January 25, 2010 and consisted of an aggregate
of 216,000 shares of our common stock and approximately $246,000 in
cash.
|
30
|
CASH
|
||||||||||||
|
DISTRIBUTION
|
||||||||||||
|
2008
|
HIGH
|
LOW
|
PER SHARE
|
|||||||||
|
First
Quarter
|
$ | 18.73 | $ | 15.45 | $ | .36 | ||||||
|
Second
Quarter
|
$ | 17.95 | $ | 16.01 | $ | .36 | ||||||
|
Third
Quarter
|
$ | 19.32 | $ | 15.20 | $ | .36 | ||||||
|
Fourth
Quarter
|
$ | 18.15 | $ | 6.35 | $ | .22 | ||||||
As of March 5, 2010, there were 331
common stockholders of record and we estimate that at such date there were
approximately 3,700 beneficial owners of our common stock.
We
qualify as a REIT for federal income tax purposes. In order to
maintain that status, we are required to distribute to our stockholders at least
90% of our annual ordinary taxable income. The amount and timing of
future distributions will be at the discretion of our board of directors and
will depend upon our financial condition, earnings, business plan, cash flow and
other factors. We intend to make distributions in an amount at least
equal to that necessary for us to maintain our status as a real estate
investment trust for Federal income tax purposes.
Stock
Performance Graph
The
following graph compares the performance of our common stock with the Standard
and Poor’s 500 Index and a peer group index of publicly traded equity real
estate investment trusts prepared by the National Association of Real Estate
Investment Trusts. As indicated, the graph assumes $100 was invested
on December 31, 2004 in our common stock and assumes the reinvestment of
dividends.
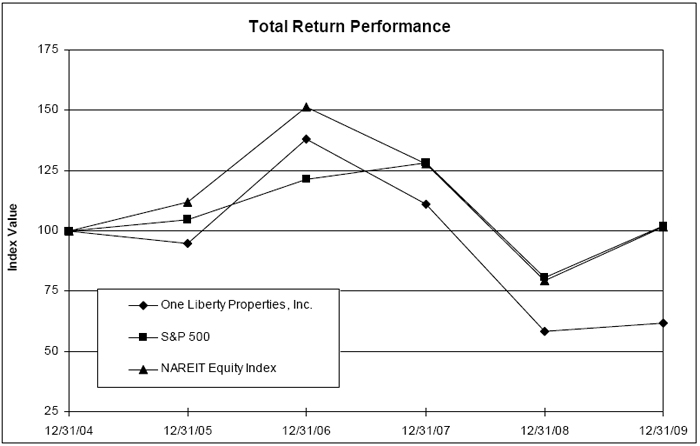
31
Equity
Compensation Plan Information
The
following table provides information about shares of our common stock that may
be issued upon the exercise of options, warrants, rights and restricted stock
under our 2009 Stock Incentive Plan as of December 31, 2009:
|
Number of
|
||||||||||||
|
securities
|
||||||||||||
|
Number of
|
remaining available
|
|||||||||||
|
securities
|
for future issuance
|
|||||||||||
|
to be issued
|
Weighted-
|
under equity
|
||||||||||
|
upon exercise
|
average
|
compensation
|
||||||||||
|
of outstanding
|
exercise price
|
plans (excluding
|
||||||||||
|
options,
|
of outstanding
|
securities
|
||||||||||
|
warrants and
|
options, warrants
|
reflected in
|
||||||||||
|
Plan Category
|
rights
|
and rights
|
column(a))
|
|||||||||
|
(a)
|
(b)
|
(c)
|
||||||||||
|
Equity
compensation plans approved by security holders (1)
|
- | - | 456,900 | |||||||||
|
Equity
compensation plans not approved by security holders
|
- | - | - | |||||||||
|
Total
|
- | - | 456,900 | |||||||||
(1) Our
2009 Stock Incentive Plan, which was approved by our stockholders in 2009, is
our only equity compensation plan. Our 2009 Stock Incentive Plan
permits us to grant stock options, restricted stock and performance based awards
to our employees, officers, directors and consultants. There are no
options outstanding under our 2009 Stock Incentive Plan. See Note 10
to our Consolidated Financial Statements for a description of our 2009 Stock
Incentive Plan.
Issuer
Purchases of Equity Securities
We did
not repurchase any shares of our outstanding common stock in October, November
or December 2009.
Item
6. Selected
Financial Data.
The
following table sets forth the selected consolidated statement of operations
data for each of the periods indicated, all of which are derived from our
audited consolidated financial statements and related notes. The selected
financial data for each of the three years in the period ended December 31, 2009
should be read together with our consolidated financial statements and related
notes appearing elsewhere in this Annual Report on Form 10-K and in
“Management’s Discussion and Analysis of Financial Condition and Results of
Operations,” below, where this data is discussed in more
detail.
32
|
As
of and for the Year Ended
|
||||||||||||||||||||
|
December
31
|
||||||||||||||||||||
|
(Amounts
in Thousands, Except Per Share Data)
|
||||||||||||||||||||
|
2009
|
2008
|
2007
|
2006
|
2005
|
||||||||||||||||
|
OPERATING
DATA (Note
a)
|
||||||||||||||||||||
|
Rental
revenues
|
$ | 39,016 | $ | 36,031 | $ | 33,439 | $ | 38,109 | $ | 31,942 | ||||||||||
|
Equity
in earnings (loss) of unconsolidated joint ventures (Note
b)
|
559 | 622 | 648 | (3,276 | ) | 2,102 | ||||||||||||||
|
Gain
on dispositions of real estate of unconsolidated joint
ventures
|
- | 297 | 583 | 26,908 | - | |||||||||||||||
|
Net
gain on sale of unimproved land, air rights and other
gains
|
- | 1,830 | - | 413 | 10,248 | |||||||||||||||
|
Income
from continuing operations
|
12,320 | 9,943 | 7,685 | 29,254 | 16,832 | |||||||||||||||
|
Income
(loss) from discontinued operations
|
7,321 | (5,051 | ) | 2,905 | 7,171 | 4,448 | ||||||||||||||
|
Net
income
|
19,641 | 4,892 | 10,590 | 36,425 | 21,280 | |||||||||||||||
|
Weighted
average number of common shares outstanding:
|
||||||||||||||||||||
|
Basic
|
10,651 | 10,183 | 10,069 | 9,931 | 9,838 | |||||||||||||||
|
Diluted
|
10,812 | 10,183 | 10,069 | 9,934 | 9,843 | |||||||||||||||
|
Net
income per common share – basic
|
||||||||||||||||||||
|
Income
from continuing operations
|
$ | 1.15 | $ | .98 | $ | .76 | $ | 2.95 | $ | 1.71 | ||||||||||
|
Income
(loss) from discontinued operations
|
.69 | (.50 | ) | .29 | .72 | .45 | ||||||||||||||
|
Net
income
|
$ | 1.84 | $ | .48 | $ | 1.05 | $ | 3.67 | $ | 2.16 | ||||||||||
|
Net
income per common share – diluted
|
||||||||||||||||||||
|
Income
from continuing operations
|
$ | 1.14 | $ | .98 | $ | .76 | $ | 2.95 | $ | 1.71 | ||||||||||
|
Income
(loss) from discontinued operations
|
.68 | (.50 | ) | .29 | .72 | .45 | ||||||||||||||
|
Net
income
|
$ | 1.82 | $ | .48 | $ | 1.05 | $ | 3.67 | $ | 2.16 | ||||||||||
|
Cash
distributions per share of common stock (Note c)
|
$ | .08 | $ | 1.30 | $ | 2.11 | $ | 1.35 | $ | 1.32 | ||||||||||
|
Stock
distributions per share of common stock
|
$ | .80 | - | - | - | - | ||||||||||||||
|
BALANCE SHEET DATA
|
||||||||||||||||||||
|
Real
estate investments, net
|
$ | 345,693 | $ | 353,113 | $ | 344,042 | $ | 351,841 | $ | 258,122 | ||||||||||
|
Investment
in unconsolidated joint ventures
|
5,839 | 5,857 | 6,570 | 7,014 | 27,335 | |||||||||||||||
|
Cash
and cash equivalents
|
28,036 | 10,947 | 25,737 | 34,013 | 26,749 | |||||||||||||||
|
Available-for-sale
securities
|
6,762 | 297 | 1,024 | 1,372 | 163 | |||||||||||||||
|
Total
assets
|
408,686 | 429,105 | 406,634 | 422,037 | 330,583 | |||||||||||||||
|
Mortgages
and loan payable
|
190,518 | 225,514 | 222,035 | 227,923 | 167,472 | |||||||||||||||
|
Line
of credit
|
27,000 | 27,000 | - | - | - | |||||||||||||||
|
Total
liabilities
|
228,558 | 265,130 | 235,395 | 241,912 | 175,064 | |||||||||||||||
|
Total
stockholders' equity
|
180,128 | 163,975 | 171,239 | 180,125 | 155,519 | |||||||||||||||
33
|
As
of and for the Year Ended
|
||||||||||||||||||||
|
December
31
|
||||||||||||||||||||
|
(Amounts
in Thousands, Except Per Share Data)
|
||||||||||||||||||||
|
2009
|
2008
|
2007
|
2006
|
2005
|
||||||||||||||||
|
OTHER
DATA (Note
d)
|
||||||||||||||||||||
|
Funds
from operations
|
$ | 23,272 | $ | 13,952 | $ | 18,645 | $ | 13,707 | $ | 26,658 | ||||||||||
|
Funds
from operations per common share:
|
||||||||||||||||||||
|
Basic
|
$ | 2.19 | $ | 1.37 | $ | 1.85 | $ | 1.38 | $ | 2.71 | ||||||||||
|
Diluted
|
$ | 2.15 | $ | 1.37 | $ | 1.85 | $ | 1.38 | $ | 2.71 | ||||||||||
|
Adjusted
funds from operations
|
$ | 22,064 | $ | 12,458 | $ | 16,621 | $ | 11,594 | $ | 25,093 | ||||||||||
|
Adjusted
funds from operations per common share:
|
||||||||||||||||||||
|
Basic
|
$ | 2.07 | $ | 1.22 | $ | 1.65 | $ | 1.17 | $ | 2.55 | ||||||||||
|
Diluted
|
$ | 2.04 | $ | 1.22 | $ | 1.65 | $ | 1.17 | $ | 2.55 | ||||||||||
Note
a: Certain amounts reported in prior periods have been reclassified
to conform to the current year’s presentation, primarily the restatement of
prior periods for discontinued operations.
Note
b: For the year ended December 31, 2006, “Equity in earnings (loss)
of unconsolidated joint ventures” is after giving effect to $5.3 million, our
share of the mortgage prepayment premium expense incurred in connection with
dispositions of real estate of unconsolidated joint ventures. This
expense is reflected as interest expense on the books of the joint ventures and
is not netted against the $26.9 million gain on dispositions.
Note
c: 2007 includes a special cash distribution of $.67 per
share.
Note
d: We consider funds from operations (FFO) and adjusted funds from
operations (AFFO) to be relevant and meaningful supplemental measures of the
operating performance of an equity REIT, and they should not be deemed to be a
measure of liquidity. FFO and AFFO do not represent cash generated
from operations as defined by generally accepted accounting principles (GAAP)
and is not indicative of cash available to fund all cash needs, including
distributions. They should not be considered as an alternative to net
income for the purpose of evaluating our performance or to cash flows as a
measure of liquidity.
We
compute FFO in accordance with the “White Paper on Funds From Operations” issued
in April 2002 by the National Association of Real Estate Investment Trusts
(NAREIT). FFO is defined in the White Paper as “net income (computed
in accordance with generally accepting accounting principles), excluding gains
(or losses) from sales of property, plus depreciation and amortization, and
after adjustments for unconsolidated partnerships and joint
ventures. Adjustments for unconsolidated partnerships and joint
ventures will be calculated to reflect funds from operations on the same basis.”
In computing FFO, we do not add back to net income the amortization of costs in
connection with our financing activities or depreciation of non-real estate
assets. Since the NAREIT White Paper only provides guidelines for
computing FFO, the computation of FFO may vary from one REIT to another. We
compute AFFO by deducting from FFO our straightline rent accruals and
amortization of lease intangibles (including our share of our unconsolidated
joint ventures).
34
We
believe that FFO and AFFO are useful and standard supplemental measures of the
operating performance for equity REITs and are used frequently by securities
analysts, investors and other interested parties in evaluating equity REITs,
many of which present FFO and AFFO when reporting their operating
results. FFO and AFFO are intended to exclude GAAP historical cost
depreciation and amortization of real estate assets, which assures that the
value of real estate assets diminish predictability over time. In
fact, real estate values have historically risen and fallen with market
conditions. As a result, we believe that FFO and AFFO provide a
performance measure that when compared year over year, should reflect the impact
to operations from trends in occupancy rates, rental rates, operating costs,
interest costs and other matters without the inclusion of depreciation and
amortization, providing a perspective that may not be necessarily apparent from
net income. We also consider FFO and AFFO to be useful to us in
evaluating potential property acquisitions.
FFO and
AFFO do not represent net income or cash flows from operations as defined by
GAAP. FFO and AFFO should not be considered to be an alternative to
net income as a reliable measure of our operating performance; nor should FFO
and AFFO be considered an alternative to cash flows from operating, investing or
financing activities (as defined by GAAP) as measures of liquidity.
FFO and
AFFO do not measure whether cash flow is sufficient to fund all of our cash
needs, including principal amortization, capital improvements and distributions
to stockholders. FFO and AFFO do not represent cash flows from
operating, investing or financing activities as defined by GAAP.
Management
recognizes that there are limitations in the use of FFO and AFFO. In
evaluating the performance of our company, management is careful to examine GAAP
measures such as net income and cash flows from operating, investing and
financing activities. Management also reviews the reconciliation of
net income to FFO and AFFO.
The table
below provides a reconciliation of net income in accordance with GAAP to FFO and
AFFO, as calculated under the current NAREIT definition of FFO, for each of the
years in the five year period ended December 31, 2009 (amounts in
thousands):
|
2009
|
2008
|
2007
|
2006
|
2005
|
||||||||||||||||
|
Net
income (Note 1)
|
$ | 19,641 | $ | 4,892 | $ | 10,590 | $ | 36,425 | $ | 21,280 | ||||||||||
|
Add:
depreciation of properties
|
9,001 | 8,971 | 8,248 | 7,091 | 5,905 | |||||||||||||||
|
Add:
our share of depreciation in unconsolidated joint ventures
|
323 | 322 | 329 | 716 | 1,277 | |||||||||||||||
|
Add:
amortization of deferred leasing costs
|
64 | 64 | 61 | 43 | 101 | |||||||||||||||
|
Deduct:
gain on sales of real estate
|
(5,757 | ) | - | - | (3,660 | ) | (1,905 | ) | ||||||||||||
|
Deduct:
gain on dispositions of real estate of unconsolidated joint
ventures
|
- | (297 | ) | (583 | ) | (26,908 | ) | - | ||||||||||||
|
Funds
from operations (Note 1)
|
23,272 | 13,952 | 18,645 | 13,707 | 26,658 | |||||||||||||||
|
Deduct:
straight line rent accruals and amortization of lease
intangibles
|
(1,151 | ) | (1,394 | ) | (1,924 | ) | (1,950 | ) | (1,282 | ) | ||||||||||
|
Deduct:
our share of straight line rent accruals and amortization of lease
intangibles of unconsolidated joint ventures
|
(57 | ) | (100 | ) | (100 | ) | (163 | ) | (283 | ) | ||||||||||
|
Adjusted
funds from operations (Note 1)
|
$ | 22,064 | $ | 12,458 | $ | 16,621 | $ | 11,594 | $ | 25,093 | ||||||||||
35
Note
1: For the year ended December 31, 2008, net income FFO and AFFO are
after $6 million of impairment charges. For the year ended December
31, 2006, net income, FFO and AFFO are after giving effect to $5.3 million, our
share of the mortgage prepayment premium expense incurred in connection with the
dispositions of real estate of unconsolidated joint ventures. This
expense is reflected as interest expense on the books of the joint ventures and
not netted against gain on dispositions. For the year ended December
31, 2005, net income, FFO and AFFO include $10.2 million from the gain on sale
of air rights.
The table
below provides a reconciliation of net income per common share (on a diluted
basis) in accordance with GAAP to FFO and AFFO.
|
2009
|
2008
|
2007
|
2006
|
2005
|
||||||||||||||||
|
Net
income (Note 2)
|
$ | 1.82 | $ | .48 | $ | 1.05 | $ | 3.67 | $ | 2.16 | ||||||||||
|
Add:
depreciation of properties
|
.83 | .88 | .82 | .71 | .60 | |||||||||||||||
|
Add:
our share of depreciation in unconsolidated joint ventures
|
.03 | .03 | .03 | .07 | .13 | |||||||||||||||
|
Add:
amortization of deferred leasing costs
|
- | .01 | .01 | .01 | .01 | |||||||||||||||
|
Deduct:
gain on sales of real estate
|
(.53 | ) | - | - | (.37 | ) | (.19 | ) | ||||||||||||
|
Deduct:
gain on dispositions of real estate of unconsolidated joint
ventures
|
- | (.03 | ) | (.06 | ) | (2.71 | ) | - | ||||||||||||
|
Funds
from operations (Note 2)
|
2.15 | 1.37 | 1.85 | 1.38 | 2.71 | |||||||||||||||
|
Deduct: straight
line rent accruals and amortization of lease intangibles
|
(.11 | ) | (.14 | ) | (.19 | ) | (.20 | ) | (.13 | ) | ||||||||||
|
Deduct:
our share of straight line rent accruals and amortization of lease
intangibles of unconsolidated joint ventures
|
- | (.01 | ) | (.01 | ) | (.01 | ) | (.03 | ) | |||||||||||
|
Adjusted
funds from operations (Note 2)
|
$ | 2.04 | $ | 1.22 | $ | 1.65 | $ | 1.17 | $ | 2.55 | ||||||||||
Note
2: For the year ended December 31, 2008, net income, FFO and AFFO is
after $.59 of impairment charges. For the year ended December 31,
2006, net income, FFO and AFFO is after $.53, our share of the mortgage
prepayment premium expense. For the year ended December 31, 2005, net
income, FFO and AFFO include $1.04 from the gain on sale of air
rights. See Note 1 above.
36
Item
7. Management’s Discussion and
Analysis of Financial Condition and Results of Operations.
Comparison
of Years Ended December 31, 2009 and December 31, 2008
Rental
Revenues
Rental income. Rental income
increased by $3 million, or 8.3%, to $39 million for the year ended December 31,
2009, from $36 million for the year ended December 31, 2008. The
increase in rental revenues is primarily due to rental revenues of $3.4 million
earned during the year ended December 31, 2009 on twelve properties acquired by
us during 2008. The increase in rental income was offset by a
decrease in rent payments from two tenants adversely affected by the recession
and by a lease termination in June 2009, for which we received the lease
termination fee referred to below.
Lease termination fee. The
lease termination fee income received in 2009 resulted from a $1,905,000 lease
termination payment from a retail tenant that had been paying its rent on a
current basis, but had vacated the property in March 2009, offset by the write
off of the entire balance of the unbilled rent receivable and intangible lease
asset related to this property, aggregating $121,000. There was no
comparable fee income in 2008. This property was released effective
November 9, 2009.
Operating
Expenses
Depreciation and amortization
expense. Depreciation and amortization expense increased by $689,000, or
8.8%, to $8.5 million for the year ended December 31, 2009, from $7.8 million
for the year ended December 31, 2008. The increase was primarily due
to depreciation and amortization increases of $660,000 on twelve properties
acquired during 2008, as well as from an increase in depreciation expense of
building improvements.
Real estate expenses.
Real estate
expenses increased by $340,000, or 98.8%, to $684,000 for the year ended
December 31, 2009, from $344,000 for the year ended December 31, 2008, resulting
primarily from real estate taxes and utilities related to our vacant
property. In addition, the year ended December 31, 2009 includes real
estate taxes for another property which became subject to a lease with a new
tenant under which we are responsible for the real estate taxes, and an increase
in repairs, maintenance and other operating expenses at several
properties.
Other
Income and Expenses
Gain on dispositions of real estate
of unconsolidated joint ventures. In the year ended December 31, 2008, we
recognized a net gain of $297,000 on the sale by a joint venture of a vacant
property. There was no comparable gain in the year ended December 31,
2009.
Interest and other income.
Interest and other income decreased by $175,000, or 32.8%, to $358,000
for the year ended December 31, 2009, from $533,000 for the year ended December
31, 2008. The decrease resulted primarily because we had less cash
available for investment as we applied available cash to purchase nine
properties in September 2008. In addition, interest rates earned on
short-term cash equivalents declined significantly. Offsetting the
decrease in interest income was $110,000 of consulting fee income and $37,000
received for granting an easement at one of our properties, both recorded in
2009.
37
Interest expense. Interest
expense decreased by $229,000, or 1.7%, to $13.6 million for the year ended
December 31, 2009, from $13.8 million for the year ended December 31, 2008. This
decrease resulted from the payoff in full of two mortgage loans during the year,
as well as from the monthly principal amortization of other
mortgages. These decreases were offset by interest expense on fixed
rate mortgages placed on three properties between September 2008 and March
2009. In addition, at the end of September 2008, we borrowed $34
million under our line of credit which was applied to the purchase of eight
properties, of which $7 million was repaid in November 2008 with a portion of
the proceeds from a mortgage financing of one of our
properties. Accordingly, interest expense relating to our line of
credit increased by $297,000 during the year ended December 31,
2009.
Amortization of deferred financing
costs. Amortization of deferred financing costs increased by
$146,000, or 25.1%, to $728,000 for the year ended December 31, 2009, from
$582,000 for the year ended December 31, 2008. The increase results
primarily from accelerated amortization of deferred financing costs of $118,000
relating to a mortgage loan that was refinanced during 2009 and from $37,000
relating to a mortgage loan that was repaid in full during 2009.
Income from settlement with former
president. In November 2009, civil litigations commenced by us
as plaintiff, against our former president and chief executive officer, arising
out of his inappropriate financial dealings, were settled, and we received
$900,000 in cash and 5,641 shares of our common stock valued at $51,000 (based
on the November 23, 2009 closing price). We were also assigned an
interest in a real estate consulting venture, the value of which was fully
reserved against.
Gain on sale of excess unimproved
land. During the year ended December 31, 2008, we sold five
acres of excess unimproved land that we acquired as part of the purchase of a
flex building in 2000 and recognized a gain of $1.8 million. There
was no such gain in the year ended December 31, 2009.
Discontinued
Operations
Income
from discontinued operations increased by $12.4 million, or 245%, to $7.3
million for the year ended December 31, 2009 from a loss of $5.1 million for the
year ended December 31, 2008 and includes the operations of eight of our
properties, five of which were conveyed to the mortgagee and three of which were
sold during the year ended December 31, 2009.
In July
2009, non-recourse mortgages, secured and cross collateralized by five of our
properties that had formerly been leased to Circuit City Stores Inc., had an
outstanding balance of $8,706,000. Circuit City Stores, Inc. filed
for protection under the federal bankruptcy laws in November 2008 and rejected
leases for two of our properties in December 2008 and rejected leases for the
remaining three properties in March 2009. No payments were made on these
mortgages from December 1, 2008 and a letter of default was received on March
16, 2009. In July 2009, these properties were conveyed to the mortgagee by
deeds-in-lieu of foreclosure and we and our five wholly-owned subsidiaries which
owned the Circuit City properties were released from all obligations, including
principal, interest and real estate taxes due. We had accrued mortgage interest
expense totaling $297,000 for the period December 2008 through July 7, 2009 and
accrued real estate tax expense totaling $246,000 on these five properties. The
carrying value of the portfolio of the properties transferred of $8,075,000, net
of the $5,231,000 of impairment charges taken at December 31, 2008, approximated
their fair value at the time of transfer. During the year ended
December 31, 2009, we recognized an $897,000 gain based on the excess of the
carrying amount of the payables (mortgage, real estate taxes and mortgage
interest) over the fair value of the portfolio of properties transferred. The
gain also reflects the write off of deferred costs and escrows relating to these
mortgages totaling $277,000.
38
In
addition to the $5,231,000 impairment charge taken during the year ended
December 31, 2008 against the Circuit City properties discussed above, an
impairment charge of $752,000 was taken against another property in 2008, where
a retail tenant that had been paying its rent on a current basis had vacated the
property in 2006. In March 2009, we sold this property and recorded an
impairment charge of $229,000 to recognize the loss.
In
October 2009, in unrelated transactions, we sold two properties and recognized
gains for accounting purposes totaling $5,757,000. There were no
comparable gains in the year ended December 31, 2008.
Comparison
of Years Ended December 31, 2008 and December 31, 2007
Rental
Revenues
Rental revenues. Rental
revenues increased by $2.6 million, or 7.8%, to $36 million for the year ended
December 31, 2008, from $33.4 million for the year ended December 31,
2007. The increase in rental revenues is substantially due to rental
revenues of $1.7 million earned during the year ended December 31, 2008 on
twelve properties acquired by us during 2008. The increase in 2008
rental income as compared to 2007 also resulted from a $253,000 write off of the
intangible lease liability related to a property where we directly assumed in
December 2008 the sublease for a property leased by us to Circuit City and
subleased by Circuit City to a furniture retailer. Additionally, in
2008 and 2007, we wrote off the entire balance of unbilled rent receivable
relating to several properties.
Operating
Expenses
Depreciation and amortization
expense. Depreciation and amortization expense increased by $402,000, or
5.4%, to $7.8 million for the year ended December 31, 2008, from $7.4 million
for the year ended December 31, 2007. The increase was primarily due
to depreciation and amortization of $370,000 on twelve properties acquired
between January and September 2008.
General and administrative expenses.
General and administrative expenses decreased by $13,000, or .2%, to
$6.508 million for the year ended December 31, 2008, from $6.521 million for the
year ended December 31, 2007. The decrease is due to a number of
factors, including: (a) a $100,000 decrease paid under the Compensation and
Services Agreement; (b) a $91,000 decrease in Federal excise tax expense; and
(c) a $64,000 decrease in state tax expense. These decreases were
offset by several factors, including: (i) a $133,000 increase in payroll and
payroll related expenses for full-time employees; and (ii) a $105,000 increase
in professional fees incurred in connection with civil litigations commenced by
us as plaintiff, arising out of the activities of our former president and chief
executive officer.
Real estate expenses.
Real estate
expenses increased by $135,000, or 64.6%, to $344,000 for the year ended
December 31, 2008, from $209,000 for the year ended December 31, 2007, resulting
primarily from real estate taxes for three of our properties, including one
vacant property and a property which became subject to a lease with a new tenant
under which we are responsible for the real estate taxes.
39
Other
Income and Expenses
Gain on dispositions of real estate
of unconsolidated joint ventures. In the years ended December 31, 2008
and 2007, two of our joint ventures each sold a vacant property and we
recognized gains on sale of $297,000 and $583,000, respectively.
Interest and other income.
Interest and other income decreased by $1.2 million, or 70%, to $533,000
for the year ended December 31, 2008, from $1.8 million for the year ended
December 31, 2007. Due to the credit crisis, interest rates steadily
declined over the past several quarters resulting in a decrease in the income we
earn on our investment in short-term cash equivalents. In addition,
we had less cash available for investment after we paid a special distribution
of $6.7 million to our stockholders in October 2007 and purchased nine
properties in September 2008. Also contributing to the decrease in
interest and other income was the inclusion of a $118,000 gain on the sale of
available-for-sale securities in the year ended December 31, 2007. We
did not have a similar sale of securities in 2008.
Interest expense. Interest
expense increased by $99,000, or .7%, to $13.8 million for the year ended
December 31, 2008, from $13.7 million for the year ended December 31, 2007. At
the end of September 2008, we borrowed $34 million under our credit facility
which was applied to the purchase of eight Office Depot properties, of which $7
million was repaid in November 2008 with a portion of the proceeds from a
mortgage financing of one of our properties. Accordingly, interest
expense relating to our credit facility increased by $360,000 during the year
ended December 31, 2008. The increase was also due to interest
expense on fixed rate mortgages placed on three properties between August 2007
and September 2008, and the assumption of two fixed rate mortgages in connection
with the purchase of two properties in January and February
2008. These increases were offset from the payoff in full of two
mortgage loans, as well as from the monthly principal amortization of other
mortgages.
Gain on sale of excess unimproved
land. During the year ended December 31, 2008, we sold five
acres of excess land that we acquired as part of the purchase of a flex building
in 2000 and recognized a gain of $1.8 million. There was no such gain
in the year ended December 31, 2007.
Discontinued
Operations
Income
from discontinued operations decreased by $8 million, or 274%, to a loss of $5.1
million for the year ended December 31, 2008 from income of $2.9 million for the
year ended December 31, 2007 and includes the operations of eight of our
properties, five of which were conveyed to the mortgagee (Circuit City
properties) during the year ended December 31, 2009 and three of which were sold
during the year ended December 31, 2009. The decrease in discontinued
operations results substantially from $6 million of impairment charges we
recorded during the year ended December 31, 2008 relating to four of these
properties. An impairment charge of $5.2 million was recorded
relating to three of our Circuit City properties and $752,000 was related to a
retail furniture property. Circuit City rejected leases for two of
the properties in December 2008 and rejected the lease for the third property in
March 2009. Our analysis determined that the other two properties
leased to Circuit City which were rejected in March 2009, did not require an
impairment charge. Although the retail furniture property has been
vacant, the tenant is current in its rent payments. There was no
impairment charge recorded in the year ended December 31, 2007.
40
Liquidity
and Capital Resources
Our
capital sources include income from our operating activities, cash and cash
equivalents, available-for-sale securities, borrowings under a revolving credit
facility, refinancing existing mortgage loans and obtaining mortgage loans
secured by our unencumbered properties. Our available liquidity at
December 31, 2009 was approximately $34.8 million, including $28 million of cash
and cash equivalents and $6.8 million of marketable securities. Our
available liquidity as of March 8, 2010 (giving effect to the acquisition by us
of a community shopping center on February 24, 2010) was approximately $30
million, including cash and available-for-sale securities.
Liquidity
and Financing
We expect
to meet all of our capital needs with cash flow generated by our operating
activities, primarily, rental income. To the extent that cash
provided by our operations is not adequate to cover all of our capital needs
(which we do not anticipate), we will be required to use our available cash and
cash equivalents and/or sell our marketable securities to pay our capital
needs.
Mortgage
loans aggregating $18.6 million in principal amount mature in 2010, of which a
$2.4 million mortgage loan was repaid in January 2010, a $4.5 million mortgage
loan matured on March 1, 2010 and a $9 million mortgage loan is due on April 1,
2010. Additionally, one mortgage loan, with an outstanding principal
amount of $1.7 million, has been since October, 2009 callable on ninety days
notice by the mortgagee. We are seeking to refinance or extend the
mortgage loans which have or will become due in 2010 as well as the mortgage
loan due upon demand, and we intend to repay the amount not refinanced or
extended from our existing cash position, including our marketable
securities. In addition, at December 31, 2009, we owned unencumbered
income producing real estate with an aggregate carrying value, before
accumulated depreciation, of $74.3 million, which we may seek to finance if we
determine we need additional liquidity.
We
continually seek to refinance existing mortgage loans on terms we deem
acceptable, in order to generate additional liquidity. Additionally,
in the normal course of our business, we sell properties when we determine that
it is in our best interests which also generates additional liquidity. Further,
since each of our encumbered properties is subject to a non-recourse mortgage
(with standard carve outs), if our in-house evaluation of the market value of
such property is substantially less than the principal balance outstanding on
the mortgage loan, we may determine to convey such property to the mortgagee in
order to terminate our mortgage obligations, including payment of interest,
principal and real estate taxes, with respect to such property.
Our
credit facility expires on March 31, 2010. Currently, there is $27
million outstanding under our credit facility. We have negotiated a
modification and extension of our credit facility with our lending syndicate and
have reached an understanding on all material terms, including among other
items, a two year extension. For a discussion of all of the material
terms of the proposed modification and extension of the credit facility, see
"Credit Facility"
below. We are confident the modification and extension of the credit facility
will be consummated, and that our lending syndicate will continue our current
credit facility until the modification and extension is
consummated. In the event that we do not consummate the modification
and extension, our lending syndicate may demand prompt re-payment of the $27
million outstanding under the credit facility. If that occurs and we
are unable to fully repay the $27 million outstanding as we have been unable to
(i) obtain a new credit facility, (ii) secure adequate funds by refinancing
existing mortgages and/or mortgaging unencumbered properties, or (iii) unable to
raise funds by other means (whether by equity or debt offerings or securing
short term financing, etc.), we will be required to sell certain of our
properties at prices we may deem inadequate in order to secure funds to repay
all amounts outstanding under our credit facility.
41
Typically,
we utilize funds from a credit facility to acquire a property and, thereafter
secure long term, fixed rate mortgage debt on such property. We apply the
proceeds from the mortgage loan to repay borrowings under the credit facility,
thus providing us with the ability to re-borrow under the credit facility for
the acquisition of additional properties. As a result, in order to
grow our business, it is important to have a credit facility in place in order
for us to pursue an active acquisition program. If we are unable to
consummate the modification and extension of our credit facility or obtain a new
credit facility, then unless we can raise additional equity or long term debt,
of which there is no assurance, we will be significantly constrained in our
ability to acquire properties. In addition, in the current credit
environment, borrowers are limited in their ability to obtain mortgage
financing. If we continue to be limited in obtaining mortgage
financing (either for acquisitions or with respect to our properties), it will
also adversely affect our ability to acquire additional
properties. Accordingly, our long term liquidity is dependent (i)
upon our ability to document the modification and extension of our credit
facility or obtain a new credit facility, (ii) the increased availability of
long term, institutional mortgage financing, or (iii) our ability to raise
additional equity or long term debt.
Credit
Facility
We are a
party to a credit agreement, as amended, with VNB New York Corp., Bank Leumi,
USA, Manufacturers and Traders Trust Company and Israel Discount Bank of New
York, which provides for a $62.5 million revolving credit
facility. The credit facility is available to pay off existing
mortgages, to fund the acquisition of additional properties or to invest in
joint ventures. The facility matures on March 31,
2010. Borrowings under the facility bear interest at the lower of
LIBOR plus 2.15% or the bank’s prime rate and there is an unused facility fee of
¼% per annum. Net proceeds received from the sale or refinancing of
properties are required to be used to repay amounts outstanding under the
facility if proceeds from the facility were used to purchase or refinance the
property. The facility is guaranteed by our subsidiaries that own
unencumbered properties and is secured by the outstanding stock of subsidiary
entities. As of December 31, 2009 and March 10, 2010, there was $27
million outstanding under the facility.
We have
negotiated a modification and extension of our credit facility with our lending
syndicate and have agreed on all of the material terms. The proposed
modification and extension will reduce the availability under the facility from
$62.5 million to $40 million, extend the expiration date from March 31, 2010 to
March 31, 2012, increase the interest rate from the lower of LIBOR plus 2.15% or
the banks prime rate to 90 day LIBOR plus 3%, with a minimum interest rate of 6%
per annum. Until we have executed the modification and extension, our
lending syndicate has advised us that our current credit facility will remain in
place, but we will not be permitted to draw down any additional funds under our
credit facility. Although, we are confident that the modification and
extension will be documented substantially in accordance with the agreed upon
terms, there can be no assurance that it will be consummated. In the event, that
the modification and extension is not consummated, we expect to have sufficient
liquidity available to us to fully repay the $27 million outstanding under our
credit facility. As a result, we will be required to seek liquidity
from other sources, including refinancing mortgages, financing unencumbered
properties, selling assets, raising equity or obtaining short or long term
debt.
Contractual
Obligations
The
following sets forth our contractual cash obligations as of December 31, 2009,
which relate to interest and amortization payments and balances due at maturity
under outstanding mortgages secured by our properties for the periods
indicated. It also includes the amount due at maturity under our
credit facility and does not include the $17.7 million mortgage we assumed in
connection with the purchase of a community shopping center we acquired on
February 24, 2010 (amounts in thousands):
42
|
Payment due by period
|
||||||||||||||||||||
|
Less than
|
1-3
|
4-5
|
More than
|
|||||||||||||||||
|
Contractual Obligations
|
Total
|
1 Year
|
Years
|
Years
|
5 Years
|
|||||||||||||||
|
Mortgages
payable – interest and amortization
|
$ | 92,011 | $ | 16,220 | $ | 32,158 | $ | 29,871 | $ | 13,762 | ||||||||||
|
Mortgages
payable – balances due at maturity
|
154,335 | 18,591 | 35,287 | 11,040 | 89,417 | |||||||||||||||
|
Credit
facility
|
27,000 | 27,000 | - | - | - | |||||||||||||||
|
Total
|
$ | 273,346 | $ | 61,811 | $ | 67,445 | $ | 40,911 | $ | 103,179 | ||||||||||
As of
December 31, 2009, we had outstanding approximately $190.5 million in mortgage
indebtedness (excluding mortgage indebtedness of our unconsolidated joint
ventures), all of which is non-recourse (subject to standard
carve-outs). We expect that debt service payments of approximately
$48.4 million due in the next three years will be paid primarily from cash
generated from our operations. We anticipate that loan maturities of
approximately $80.9 million, including $27 million due under our credit
facility, due in the next three years will be paid primarily from cash and cash
equivalents and mortgage financings and refinancings. If we are not
successful in refinancing our existing indebtedness or financing our
unencumbered properties, our cash flow, funds available under our credit
facility and available cash, if any, may not be sufficient to repay all maturing
debt when payments become due, and we may be forced to sell additional equity,
obtain long or short term debt, or dispose of properties on disadvantageous
terms.
In
addition, we, as ground lessee, are obligated to pay rent under a ground lease
for a property owned in fee by an unrelated third party. The annual
fixed leasehold rent expense is as follows (amounts in thousands):
|
Total
|
2010
|
2011
|
2012
|
2013
|
2014
|
More than
5 years
|
||||||||||||||||||||
| $ | 3,487 | $ | 297 | $ | 297 | $ | 297 | $ | 297 | $ | 328 | $ | 1,971 | |||||||||||||
We had no
outstanding contingent commitments, such as guarantees of indebtedness, or any
other contractual cash obligations at December 31, 2009.
Cash
Distribution Policy
We have
elected to be taxed as a REIT under the Internal Revenue Code of 1986, as
amended. To qualify as a REIT, we must meet a number of
organizational and operational requirements, including a requirement that we
distribute currently at least 90% of our ordinary taxable income to our
stockholders (pursuant to Internal Revenue Procedures). It
is our current intention to comply with these requirements and maintain our REIT
status. As a REIT, we generally will not be subject to corporate
federal, state or local income taxes on taxable income we distribute currently
(in accordance with the Internal Revenue Code and applicable regulations) to our
stockholders. If we fail to qualify as a REIT in any taxable year, we
will be subject to federal, state and local income taxes at regular corporate
rates and may not be able to qualify as a REIT for four subsequent tax
years. Even if we qualify for federal taxation as a REIT, we may be
subject to certain state and local taxes on our income and to federal income
taxes on our undistributed taxable income (i.e., taxable income not distributed
in the amounts and in the time frames prescribed by the Internal Revenue Code
and applicable regulations thereunder) and are subject to federal excise taxes
on our undistributed taxable income.
43
It is our
intention to pay to our stockholders within the time periods prescribed by the
Internal Revenue Code no less than 90%, and, if possible, 100% of our annual
taxable income, including taxable gains from the sale of real estate and
recognized gains on the sale of securities. It will continue to be
our policy to make sufficient distributions to stockholders in order for us to
maintain our REIT status under the Internal Revenue Code.
In 2008,
our board determined that, in view of the economic environment, we should
conserve our capital. As a result, all of our dividends declared in
2009 consisted of 90% stock and 10% cash, pursuant to Revenue Procedures issued
by the Internal Revenue Service. On March 9, 2010, our board of
directors declared a quarterly dividend of $.30 per share payable in cash on
April 6, 2010 to record holders on March 26, 2010. Our board of
directors reviews the dividend policy at each regularly scheduled quarterly
board meeting to determine if any changes to our dividend should be made and
whether the distribution should consist of all cash or a combination of cash and
stock.
Off-Balance Sheet
Arrangements
None.
Critical
Accounting Policies
Our
significant accounting policies are more fully described in Note 2 to our
Consolidated Financial Statements, provided in this annual report on Form
10-K. Certain of our accounting policies are particularly important
to an understanding of our financial position and results of operations and
require the application of significant judgment by our management; as a result
they are subject to a degree of uncertainty. These critical accounting policies
include the following, discussed below.
Purchase
Accounting for Acquisition of Real Estate
The fair
value of real estate acquired is allocated to acquired tangible assets,
consisting of land and building, and identified intangible assets and
liabilities, consisting of the value of above-market and below-market leases and
other value of in-place leases based in each case on their fair
values. The fair value of the tangible assets of an acquired property
(which includes land and building) is determined by valuing the property as if
it were vacant, and the “as-if-vacant” value is then allocated to land and
building based on management’s determination of relative fair values of these
assets. We assess fair value of the lease intangibles based on
estimated cash flow projections that utilize appropriate discount rates and
available market information. The allocation made by management may
have a positive or negative effect on net income and may have an effect on the
assets and liabilities on the balance sheet.
44
Revenues
Our
revenues, which are substantially derived from rental income, include rental
income that our tenants pay in accordance with the terms of their respective
leases reported on a straight line basis over the term of each
lease. It is our policy not to record straight-line rent beyond the
expected useful life of a building. Since many of our leases provide
for rental increases at specified intervals, straight line basis accounting
requires us to record as an asset and include in revenues, unbilled rent
receivables which we will only receive if the tenant makes all rent payments
required through the expiration of the term of the
lease. Accordingly, our management must determine, in its judgment,
that the unbilled rent receivable applicable to each specific tenant is
collectible. We review unbilled rent receivables on a quarterly basis
and take into consideration the tenant’s payment history and the financial
condition of the tenant. In the event that the collectability of an
unbilled rent receivable is in doubt, we are required to take a reserve against
the receivable or a direct write off of the receivable, which has an adverse
affect on net income for the year in which the reserve or direct write off is
taken, and will decrease total assets and stockholders’ equity.
Value
of Real Estate Portfolio
We review
our real estate portfolio on a quarterly basis to ascertain if there are any
indicators of impairment to the value of any of our real estate assets,
including deferred costs and intangibles, in order to determine if there is any
need for an impairment charge. In reviewing the portfolio, we examine
the type of asset, the current financial statements or other available financial
information of the tenant, the economic situation in the area in which the asset
is located, the economic situation in the industry in which the tenant is
involved and the timeliness of the payments made by the tenant under its lease,
as well as any current correspondence that may have been had with the tenant,
including property inspection reports. For each real estate asset
owned for which indicators of impairment exist, if the undiscounted cash flow
analysis yields an amount which is less than the asset’s carrying amount, an
impairment loss is recorded to the extent that the estimated fair value is less
than the asset’s carrying amount. The estimated fair value is
determined using a discounted cash flow model of the expected future cash flows
through the useful life of the property. Real estate assets that are
expected to be disposed of are valued at the lower of carrying amount or fair
value less costs to sell on an individual asset basis. We generally
do not obtain any independent appraisals in determining value but rely on our
own analysis and valuations. Any impairment charge taken with respect to any
part of our real estate portfolio will reduce our net income and reduce assets
and stockholders’ equity to the extent of the amount of any impairment charge,
but it will not affect our cash flow or our distributions until such time as we
dispose of the property.
Item
7A. Qualitative and Quantitative
Disclosures About Market Risk.
Our
primary market risk exposure is the effect of changes in interest rates on the
interest cost of draws on our revolving variable rate credit facility and the
effect of changes in the fair value of our interest rate swap
agreement. Interest rates are highly sensitive to many factors,
including governmental monetary and tax policies, domestic and international
economic and political considerations and other factors beyond our
control.
At
December 31, 2009, we had one interest rate swap agreement outstanding that was
entered into March 2009. The fair market value of the interest rate
swap is dependent upon existing market interest rates and swap spreads, which
change over time. As of December 31, 2009, if there had been a 1%
increase in forward interest rates, the fair market value of the interest rate
swap and net unrealized gain on derivative instruments would have increased by
approximately $394,000. If there were a 1% decrease in forward
interest rates, the fair market value of the interest rate swap and net
unrealized gain on derivative instruments would have decreased by approximately
$440,000. These changes would not have any impact on our net income
or cash.
45
We
utilize interest rate swaps to limit interest rate risk. Derivatives
are used for hedging purposes rather than speculation. We do not
enter into financial instruments for trading purposes.
In
connection with our mortgage debt (excluding our mortgage subject to the
interest swap agreement), it bears interest at fixed rates and accordingly, the
effect of changes in interest rates would not impact the amount of interest
expense that we incur under these mortgages. Our credit facility is a
revolving variable rate facility which is sensitive to interest
rates. Under current market conditions, we do not believe that our
risk of material potential losses in future earnings, fair values and/or cash
flows from near-term changes in market rates that we consider reasonably
possible is material.
We
assessed the market risk for our revolving variable rate credit facility and
believe that a 1% increase in interest rates would cause a decrease in net
income and cash of $270,000 and a 1% decrease would cause an increase in net
income and cash of $270,000 based on the $27 million outstanding on our credit
facility at December 31, 2009.
The fair market value of our long term
debt is estimated based on discounting future cash flows at interest rates that
our management believes reflect the risks associated with long term debt of
similar risk and duration.
The following table sets forth our debt
obligations by scheduled principal cash flow payments and maturity date,
weighted average interest rates and estimated fair market value at December 31,
2009 (excluding a community shopping center we acquired on February 24,
2010):
|
For the Year Ended December 31
|
||||||||||||||||||||||||||||||||
|
(amounts in thousands)
|
||||||||||||||||||||||||||||||||
|
2010
|
2011
|
2012
|
2013
|
2014
|
There-
after
|
Total
|
Fair
Market
Value
|
|||||||||||||||||||||||||
|
Fixed rate:
|
||||||||||||||||||||||||||||||||
|
Long
term debt
|
$ | 23,259 | $ | 8,061 | $ | 36,994 | $ | 8,999 | $ | 19,356 | $ | 93,849 | $ | 190,518 | $ | 184,443 | ||||||||||||||||
|
Weighted
average interest rate
|
6.35 | % | 6.29 | % | 6.29 | % | 6.20 | % | 6.18 | % | 6.09 | % | 6.19 | % | 7.00 | % | ||||||||||||||||
|
Variable rate:
|
||||||||||||||||||||||||||||||||
|
Long
term debt (Note 1)
|
$ | 27,000 | - | - | - | - | - | $ | 27,000 | $ | 26,681 | |||||||||||||||||||||
Note 1:
Our credit line facility matures on March 31, 2010 and bears interest at the
lower of LIBOR plus 2.15% or the respective bank’s prime rate.
Item
8. Financial Statements and
Supplementary Data.
This information appears in Item 15(a)
of this Annual Report on Form 10-K, and is incorporated into this Item 8 by
reference thereto.
46
Item
9. Changes in and Disagreements
with Accountants on Accounting and Financial
Disclosure.
None.
Item
9A. Controls and
Procedures.
A review
and evaluation was performed by our management, including our Chief Executive
Officer (“CEO”) and Chief Financial Officer (“CFO”), of the effectiveness of the
design and operation of our disclosure controls and procedures as of the end of
the period covered by this Annual Report on Form 10-K. Based on that
review and evaluation, the CEO and CFO have concluded that our current
disclosure controls and procedures, as designed and implemented, were
effective. There have been no significant changes in our internal
controls or in other factors that could significantly affect our internal
controls subsequent to the date of their evaluation. There were no
significant material weaknesses identified in the course of such review and
evaluation and, therefore, we took no corrective measures.
Management
Report on Internal Control over Financial Reporting
Our management is responsible for
establishing and maintaining adequate internal control over financial
reporting. Internal control over financial reporting is defined in
Rules 13a-15(f) and 15d-15(f) promulgated under the Securities Exchange Act of
1934, as amended (the “Exchange Act”), as a process designed by, or under the
supervision of, a company’s principal executive and principal financial officers
and effected by a company’s board, management and other personnel to provide
reasonable assurance regarding the reliability of financial reporting and the
preparation of financial statements for external purposes in accordance with
GAAP, and includes those policies and procedures that:
|
|
·
|
pertain
to the maintenance of records that in reasonable detail accurately and
fairly reflect the transactions and dispositions of the assets of a
company;
|
|
|
·
|
provide
reasonable assurance that transactions are recorded as necessary to permit
preparation of financial statements in accordance with GAAP, and that
receipts and expenditures of a company are being made only in accordance
with authorizations of management and directors of a company;
and
|
|
|
·
|
provide
reasonable assurance regarding prevention or timely detection of
unauthorized acquisition, use or disposition of a company’s assets that
could have a material effect on the financial
statements.
|
Because
of its inherent limitations, internal control over financial reporting may not
prevent or detect misstatements. Projections of any evaluation of
effectiveness to future periods are subject to the risks that controls may
become inadequate because of changes in conditions or that the degree of
compliance with the policies or procedures may deteriorate.
Our
management assessed the effectiveness of our internal control over financial
reporting as of December 31, 2009. In making this assessment, our
management used criteria set forth by the Committee of Sponsoring Organizations
of the Treadway Commission (COSO) in Internal Control-Integrated
Framework.
47
Based on
its assessment, our management believes that, as of December 31, 2009, our
internal control over financial reporting was effective based on those
criteria.
Our
independent registered public accounting firm, Ernst & Young LLP, has issued
an audit report on management’s assessment of our internal control over
financial reporting. This report appears on page F-1 of this Annual
Report on Form 10-K.
Item
9B. Other
Information.
None.
PART
III
Item
10. Directors, Executive
Officers and Corporate Governance.
We have adopted an amended and restated
business code of conduct and ethics that applies to all directors, officers and
employees, including our principal executive officer, principal financial
officer and principal accounting officer. You can find our business
code of conduct and ethics on our web site by going to the following
address: www.onelibertyproperties.com. We will post any
amendments to our amended and restated business code of conduct and ethics as
well as any waivers that are required to be disclosed by the rules of either the
SEC or The New York Stock Exchange on our web site.
Our board of directors has adopted
corporate governance guidelines and charters for the audit, compensation and
nominating and corporate governance committees of our board of
directors. You can find these documents on our web site by going to
the following address: www.onelibertyproperties.com.
You can also obtain a printed copy of
any of the materials referred to above for free by contacting us at the
following address: One Liberty Properties, Inc., 60 Cutter Mill Road, Great
Neck, New York 11021, Attention: Secretary, telephone number
1-800-450-5816.
The audit committee of our board of
directors is an “audit committee” for the purposes of Section 3(a) (58) of the
Exchange Act. The members of that committee are Charles Biederman,
Chairman, Joseph A. DeLuca and James J. Burns.
Apart from certain information
concerning our executive officers which is set forth in Part I of this Annual
Report, additional information required by this Item 10 shall be included in our
proxy statement for our 2010 annual meeting of stockholders, to be filed with
the SEC not later than April 30, 2010, and is incorporated herein by reference
thereto, including the information set forth under the captions “Election of
Directors,” “Section 16(a) Beneficial Ownership Reporting Compliance”
and “Governance of the Company.”
Item
11. Executive
Compensation.
The information concerning our
executive compensation required by this Item 11 shall be included in our proxy
statement for our 2010 annual meeting of stockholders, to be filed with the SEC
not later than April 30, 2010, and is incorporated herein by reference thereto,
including the information set forth under the captions “Executive Compensation,”
“Compensation of Directors,” “Compensation Committee Interlocks and Insider
Participation” and “Report of Compensation Committee.”
48
Item
12. Security Ownership of
Certain Beneficial Owners and Management and Related Stockholder
Matters.
The information concerning our
beneficial owners and management required by this Item 12 shall be included in
our proxy statement for our 2010 annual meeting of stockholders, to be filed
with the SEC not later than April 30, 2010 and is incorporated herein by
reference thereto, including the information set forth under the caption “Stock
Ownership of Certain Beneficial Owners, Directors and Officers.”
Equity compensation plan information is
incorporated herein by reference to Part II, Item 4, “Market For Registrant’s
Common Equity, Related Stockholder Matters and Issuer Purchases of Equity
Securities,” of this annual report.
Item
13. Certain
Relationships and Related Transactions.
The information concerning certain
relationships, related transactions and director independence required by this
Item 13 shall be included in our proxy statement for our 2010 annual meeting of
stockholders, to be filed with the SEC not later than April 30, 2010 and is
incorporated herein by reference thereto, including the information set forth
under the captions “Certain Relationships and Related Transactions,” and
“Governance of the Company.”
Item
14. Principal Accountant Fees
and Services.
The information concerning our
principal accounting fees required by this Item 14 shall be included in our
proxy statement for our 2010 annual meeting of stockholders, to be filed with
the SEC not later than April 30, 2010, and is incorporated herein by reference
thereto, including the information set forth under the caption “Independent
Registered Public Accounting Firm.”
49
PART
IV
Item
15. Exhibits and Financial
Statement Schedules
|
(a)
|
Documents
filed as part of this Report:
|
|
(1)
|
The
following financial statements of the Company are included in this Report
on Form 10-K:
|
|
- Reports
of Independent Registered
|
|
|
Public
Accounting Firm
|
F-1
through F-2
|
|
- Statements:
|
|
|
Consolidated
Balance Sheets
|
F-3
|
|
Consolidated
Statements of Income
|
F-4
|
|
Consolidated
Statements of Stockholders' Equity
|
F-5
|
|
Consolidated
Statements of Cash Flows
|
F-6
through F-7
|
|
Notes
to Consolidated Financial Statements
|
F-8
through F-30
|
|
(2)
|
Financial
Statement Schedules:
|
|
- Schedule
III-Real Estate and Accumulated Depreciation
|
F-31
through F-33
|
All other schedules are omitted because
they are not applicable or the required information is shown in the consolidated
financial statements or the notes thereto.
| (3) Exhibits: | |
|
3.1
|
Articles
of Amendment and Restatement of One Liberty Properties, Inc., dated July
20, 2004 (incorporated by reference to Exhibit 3.1 to One Liberty
Properties, Inc.'s Quarterly Report on Form 10-Q for the quarter ended
June 30, 2004).
|
|
3.2
|
Articles
of Amendment to Restated Articles of Incorporation of One Liberty
Properties, Inc. filed with the State of Assessments and Taxation of
Maryland on June 17, 2005 (incorporated by reference to Exhibit 3.1 to One
Liberty Properties, Inc.'s Quarterly Report on Form 10-Q for the quarter
ended June 30, 2005).
|
|
3.3
|
Articles
of Amendment to Restated Articles of Incorporation of One Liberty
Properties, Inc. filed with the State of Assessments and Taxation of
Maryland on June 21, 2005 (incorporated by reference to Exhibit 3.2 to One
Liberty Properties, Inc.'s Quarterly Report on Form 10-Q for the quarter
ended June 30, 2005).
|
|
3.4
|
By-Laws
of One Liberty Properties, Inc., as amended (incorporated by reference to
Exhibit 3.1 to One Liberty Properties, Inc.'s Current Report
on Form 8-K filed on December 12,
2007).
|
|
4.1
|
One
Liberty Properties, Inc. 2009 Incentive Plan (incorporated by reference to
Exhibit A to One Liberty Properties, Inc.'s Proxy Statement on Schedule
14A filed on April 29, 2009).
|
50
|
4.2
|
Form
of Common Stock Certificate (incorporated by reference to Exhibit 4.1 to
One Liberty Properties, Inc.'s Registration Statement on Form S-2,
Registration No. 333-86850, filed on April 24, 2002 and declared effective
on May 24, 2002).
|
|
10.1
|
Amended
and Restated Loan Agreement, dated as of June 4, 2004, by and among One
Liberty Properties, Inc., Valley National Bank, Merchants Bank Division,
Bank Leumi USA, Israel Discount Bank of New York and Manufacturers and
Traders Trust Company (incorporated by reference to the Exhibit to One
Liberty Properties, Inc.'s Current Report on Form 8-K filed on June 8,
2004).
|
|
10.2
|
First
Amendment to Amended and Restated Loan Agreement, dated as of March 15,
2007, between VNB New York Corp. as assignee of Valley National Bank,
Merchants Bank Division, Bank Leumi, USA, Manufacturers and Traders Trust
Company, Israel Discount Bank of New York, and One Liberty Properties,
Inc. (incorporated by reference to Exhibit 10.1 to One Liberty Properties,
Inc.’s Current Report on Form 8-K filed on March 15,
2007).
|
|
10.3
|
Second
Amendment to Amended and Restated Loan Agreement effective as of September
30, 2007, between VNB New York Corp., as assignee, of Valley National
Bank, Merchants Bank Division, Bank Leumi USA, Israel Discount Bank of New
York, Manufacturers and Traders Trust Company and One Liberty Properties,
Inc. (incorporated by reference to Exhibit 10.3 to One Liberty Properties,
Inc.’s Annual Report on Form 10-K filed on March 13,
2008).
|
|
10.4
|
Compensation
and Services and Agreement effective as of January 1, 2007 between One
Liberty Properties, Inc. and Majestic Property Management Corp.
(incorporated by reference to One Liberty Properties, Inc.’s Current
Report on Form 8-K filed on March 14,
2007).
|
|
14.1
|
Code
of Business Conduct and Ethics (incorporated by reference to Exhibit 14.1
to One Liberty Properties, Inc.’s Current Report on Form 8-K filed on
March 14, 2006).
|
|
21.1
|
Subsidiaries
of Registrant*
|
|
23.1
|
Consent
of Ernst & Young LLP*
|
|
31.1
|
Certification
of President and Chief Executive
Officer*
|
|
31.2
|
Certification
of Senior Vice President and Chief Financial
Officer*
|
|
32.1
|
Certification
of President and Chief Executive Officer
*
|
|
32.2
|
Certification
of Senior Vice President and Chief Financial
Officer*
|
* Filed
herewith
51
SIGNATURES
Pursuant
to the requirements of Section 13 or 15(d) of the Exchange, the Registrant has
duly caused this report to be signed on its behalf of the undersigned, thereunto
duly authorized.
|
ONE
LIBERTY PROPERTIES, INC.
|
|
|
By:
|
/s/ Patrick J. Callan,
Jr.
|
|
Patrick
J. Callan, Jr.
|
|
|
President
and Chief Executive
Officer
|
|
Pursuant
to the requirements of the Exchange Act, this report has been signed below by
the following persons on behalf of the Registrant in the capacities indicated on
the dates indicated.
|
Signature
|
Title
|
Date
|
||
|
/s/ Fredric H. Gould
|
Chairman
of the
|
|||
|
Fredric
H. Gould
|
Board
of Directors
|
March
12, 2010
|
||
|
/s/ Patrick J. Callan, Jr.
|
President,
Director and
|
|||
|
Patrick
J. Callan, Jr
|
Chief
Executive Officer
|
March
12, 2010
|
||
|
/s/ Joseph A. Amato
|
||||
|
Joseph
A. Amato
|
Director
|
March
12, 2010
|
||
|
/s/ Charles Biederman
|
||||
|
Charles
Biederman
|
Director
|
March
12, 2010
|
||
|
/s/ James J. Burns
|
||||
|
James
J. Burns
|
Director
|
March
12, 2010
|
||
|
/s/ Jeffrey A. Gould
|
||||
|
Jeffrey
A. Gould
|
Director
|
March
12, 2010
|
||
|
/s/ Matthew J. Gould
|
||||
|
Matthew
J. Gould
|
Director
|
March
12, 2010
|
||
|
/s/ Joseph DeLuca
|
||||
|
Joseph
DeLuca
|
Director
|
March
12, 2010
|
||
|
/s/ J. Robert Lovejoy
|
||||
|
J.
Robert Lovejoy
|
Director
|
March
12, 2010
|
||
|
/s/ David W. Kalish
|
||||
|
David
W. Kalish
|
Senior
Vice President and
|
|||
|
Chief
Financial Officer
|
March
12,
2010
|
REPORT
OF INDEPENDENT REGISTERED PUBLIC ACCOUNTING FIRM
The Board
of Directors and Stockholders of
One
Liberty Properties, Inc. and Subsidiaries
We have
audited One Liberty Properties, Inc. and Subsidiaries’ (the “Company”) internal
control over financial reporting as of December 31, 2009, based on criteria
established in Internal Control—Integrated Framework issued by the Committee of
Sponsoring Organizations of the Treadway Commission (the COSO
criteria). The Company’s management is responsible for maintaining
effective internal control over financial reporting, and for its assessment of
the effectiveness of internal control over financial reporting included in the
accompanying Management Report on Internal Control over Financial Reporting. Our
responsibility is to express an opinion on the company’s internal control over
financial reporting based on our audit.
We
conducted our audit in accordance with the standards of the Public Company
Accounting Oversight Board (United States). Those standards require that we plan
and perform the audit to obtain reasonable assurance about whether effective
internal control over financial reporting was maintained in all material
respects. Our audit included obtaining an understanding of internal control over
financial reporting, assessing the risk that a material weakness exists, testing
and evaluating the design and operating effectiveness of internal control based
on the assessed risk, and performing such other procedures as we considered
necessary in the circumstances. We believe that our audit provides a reasonable
basis for our opinion.
A
company’s internal control over financial reporting is a process designed to
provide reasonable assurance regarding the reliability of financial reporting
and the preparation of financial statements for external purposes in accordance
with generally accepted accounting principles. A company’s internal control over
financial reporting includes those policies and procedures that (1) pertain to
the maintenance of records that, in reasonable detail, accurately and fairly
reflect the transactions and dispositions of the assets of the company; (2)
provide reasonable assurance that transactions are recorded as necessary to
permit preparation of financial statements in accordance with generally accepted
accounting principles, and that receipts and expenditures of the company are
being made only in accordance with authorizations of management and directors of
the company; and (3) provide reasonable assurance regarding prevention or timely
detection of unauthorized acquisition, use, or disposition of the company’s
assets that could have a material effect on the financial
statements.
Because
of its inherent limitations, internal control over financial reporting may not
prevent or detect misstatements. Also, projections of any evaluation
of effectiveness to future periods are subject to the risk that controls may
become inadequate because of changes in conditions, or that the degree of
compliance with the policies or procedures may deteriorate.
In our
opinion, One Liberty Properties, Inc. and
Subsidiaries maintained, in all material respects, effective internal
control over financial reporting as of December 31, 2009, based on the COSO criteria.
We also
have audited, in accordance with the standards of the Public Company Accounting
Oversight Board (United States), the consolidated balance sheets of One Liberty
Properties, Inc. and Subsidiaries as of December 31, 2009 and 2008, and the
related consolidated statements of income, stockholders’ equity and cash flows
for each of the three years in the period ended December 31, 2009 of the Company
and our report dated March 12, 2010 expressed an unqualified opinion
thereon.
/s/ Ernst
& Young LLP
New York,
New York
March 12,
2010
F-1
REPORT
OF INDEPENDENT REGISTERED PUBLIC ACCOUNTING FIRM
To the
Board of Directors and Stockholders of
One
Liberty Properties, Inc. and Subsidiaries
We have
audited the accompanying consolidated balance sheets of One Liberty Properties,
Inc. and Subsidiaries (the "Company") as of December 31, 2009 and 2008, and the
related consolidated statements of income, stockholders' equity, and cash flows
for each of the three years in the period ended December 31,
2009. Our audits also included the financial statement schedule
listed in the Index at Item 15(a). These financial statements and
schedule are the responsibility of the Company's management. Our responsibility
is to express an opinion on these financial statements and schedule based on our
audits.
We
conducted our audits in accordance with the standards of the Public Company
Accounting Oversight Board (United States). Those standards require
that we plan and perform the audit to obtain reasonable assurance about whether
the financial statements are free of material misstatement. An audit
includes examining, on a test basis, evidence supporting the amounts and
disclosures in the financial statements. An audit also includes
assessing the accounting principles used and significant estimates made by
management, as well as evaluating the overall financial statement
presentation. We believe that our audits provide a reasonable basis
for our opinion.
In our
opinion, the financial statements referred to above present fairly, in all
material respects, the consolidated financial position of One Liberty
Properties, Inc. and Subsidiaries at December 31, 2009 and 2008, and the
consolidated results of their operations and their cash flows for each of the
three years in the period ended December 31, 2009, in conformity with U.S.
generally accepted accounting principles. Also, in our opinion, the
related financial statement schedule, when considered in relation to the basic
financial statements taken as a whole, presents fairly, in all material
respects, the information set forth therein.
We also
have audited, in accordance with the standards of the Public Company Accounting
Oversight Board (United States), One Liberty Properties, Inc. and Subsidiaries’
internal control over financial reporting as of December 31, 2009, based on
criteria established in Internal Control – Integrated Framework issued by the
Committee of Sponsoring Organizations of the Treadway Commission and our report
dated March 12, 2010 expressed an unqualified opinion thereon.
/s/ Ernst
& Young LLP
New York,
New York
March 12,
2010
F-2
ONE
LIBERTY PROPERTIES, INC. AND SUBSIDIARIES
Consolidated
Balance Sheets
(Amounts
in Thousands, Except Per Share Data)
|
December 31,
|
||||||||
|
2009
|
2008
|
|||||||
|
ASSETS
|
||||||||
|
Real
estate investments, at cost
|
||||||||
|
Land
|
$ | 88,050 | $ | 88,050 | ||||
|
Buildings
and improvements
|
305,017 | 304,441 | ||||||
| 393,067 | 392,491 | |||||||
|
Less
accumulated depreciation
|
47,374 | 39,378 | ||||||
| 345,693 | 353,113 | |||||||
|
Properties
held for sale
|
- | 34,343 | ||||||
|
Assets
related to properties held for sale
|
- | 2,129 | ||||||
|
Investment
in unconsolidated joint ventures
|
5,839 | 5,857 | ||||||
|
Cash
and cash equivalents
|
28,036 | 10,947 | ||||||
|
Available-for-sale
securities (including treasury bills of $3,999 in 2009)
|
6,762 | 297 | ||||||
|
Unbilled
rent receivable
|
10,706 | 9,623 | ||||||
|
Unamortized
intangible lease assets
|
7,157 | 8,018 | ||||||
|
Escrow,
deposits and other assets and receivables
|
2,471 | 2,055 | ||||||
|
Investment
in BRT Realty Trust at market (related party)
|
189 | 111 | ||||||
|
Unamortized
deferred financing costs
|
1,833 | 2,612 | ||||||
| $ | 408,686 | $ | 429,105 | |||||
|
LIABILITIES
AND STOCKHOLDERS' EQUITY
|
||||||||
|
Liabilities:
|
||||||||
|
Mortgages
payable
|
$ | 190,518 | $ | 207,553 | ||||
|
Mortgages
payable – properties held for sale
|
- | 17,961 | ||||||
|
Line
of credit
|
27,000 | 27,000 | ||||||
|
Dividends
payable
|
2,456 | 2,239 | ||||||
|
Accrued
expenses and other liabilities
|
3,757 | 5,143 | ||||||
|
Unamortized
intangible lease liabilities
|
4,827 | 5,234 | ||||||
|
Total
liabilities
|
228,558 | 265,130 | ||||||
|
Commitments
and contingencies
|
- | - | ||||||
|
Stockholders'
equity:
|
||||||||
|
Preferred
stock, $1 par value; 12,500 shares authorized; none issued
|
- | - | ||||||
|
Common
stock, $1 par value; 25,000 shares authorized; 10,879 and 9,962 shares
issued and outstanding
|
10,879 | 9,962 | ||||||
|
Paid-in
capital
|
143,272 | 138,688 | ||||||
|
Accumulated
other comprehensive income (loss)
|
191 | (239 | ) | |||||
|
Accumulated
undistributed net income
|
25,786 | 15,564 | ||||||
|
Total
stockholders' equity
|
180,128 | 163,975 | ||||||
|
Total
liabilities and stockholders’ equity
|
$ | 408,686 | $ | 429,105 | ||||
See
accompanying notes.
F-3
ONE
LIBERTY PROPERTIES, INC. AND SUBSIDIARIES
Consolidated
Statements of Income
(Amounts
in Thousands, Except Per Share Data)
|
Year Ended December 31,
|
||||||||||||
|
2009
|
2008
|
2007
|
||||||||||
|
Revenues:
|
||||||||||||
|
Rental
income
|
$ | 39,016 | $ | 36,031 | $ | 33,439 | ||||||
|
Lease
termination fee
|
1,784 | - | - | |||||||||
|
Total
revenues
|
40,800 | 36,031 | 33,439 | |||||||||
|
Operating
expenses:
|
||||||||||||
|
Depreciation
and amortization
|
8,527 | 7,838 | 7,436 | |||||||||
|
General
and administrative (including $2,188, $2,188 and $2,290, respectively, to
related party)
|
6,540 | 6,508 | 6,521 | |||||||||
|
Real
estate expenses
|
684 | 344 | 209 | |||||||||
|
Leasehold
rent
|
308 | 308 | 308 | |||||||||
|
Total
operating expenses
|
16,059 | 14,998 | 14,474 | |||||||||
|
Operating
income
|
24,741 | 21,033 | 18,965 | |||||||||
|
Other
income and expenses:
|
||||||||||||
|
Equity
in earnings of unconsolidated joint ventures
|
559 | 622 | 648 | |||||||||
|
Gain
on dispositions of real estate - unconsolidated joint
ventures
|
- | 297 | 583 | |||||||||
|
Interest
and other income
|
358 | 533 | 1,776 | |||||||||
|
Interest:
|
||||||||||||
|
Expense
|
(13,561 | ) | (13,790 | ) | (13,691 | ) | ||||||
|
Amortization
of deferred financing costs
|
(728 | ) | (582 | ) | (596 | ) | ||||||
|
Income
from settlement with former president
|
951 | - | - | |||||||||
|
Gain
on sale of excess unimproved land
|
- | 1,830 | - | |||||||||
|
Income
from continuing operations
|
12,320 | 9,943 | 7,685 | |||||||||
|
Discontinued
operations:
|
||||||||||||
|
Income
from operations
|
896 | 932 | 2,905 | |||||||||
|
Impairment
charges
|
(229 | ) | (5,983 | ) | - | |||||||
|
Gain
on troubled mortgage restructuring, as a result of conveyance to
mortgagee
|
897 | - | - | |||||||||
|
Net
gain on sales
|
5,757 | - | - | |||||||||
|
Income
(loss) from discontinued operations
|
7,321 | (5,051 | ) | 2,905 | ||||||||
|
Net
income
|
$ | 19,641 | $ | 4,892 | $ | 10,590 | ||||||
|
Weighted
average number of common shares outstanding:
|
||||||||||||
|
Basic
|
10,651 | 10,183 | 10,069 | |||||||||
|
Diluted
|
10,812 | 10,183 | 10,069 | |||||||||
|
Net
income per common share – basic:
|
||||||||||||
|
Income
from continuing operations
|
$ | 1.15 | $ | .98 | $ | .76 | ||||||
|
Income
(loss) from discontinued operations
|
.69 | (.50 | ) | .29 | ||||||||
|
Net
income per common share
|
$ | 1.84 | $ | .48 | $ | 1.05 | ||||||
|
Net
income per common share – diluted:
|
||||||||||||
|
Income
from continuing operations
|
$ | 1.14 | $ | .98 | $ | .76 | ||||||
|
Income
(loss) from discontinued operations
|
.68 | (.50 | ) | .29 | ||||||||
|
Net
income per common share
|
$ | 1.82 | $ | .48 | $ | 1.05 | ||||||
|
Cash
distributions per share of common stock
|
$ | .08 | $ | 1.30 | $ | 2.11 | ||||||
|
Stock
distributions per share of common stock
|
$ | .80 | $ | - | $ | - | ||||||
See
accompanying notes.
F-4
ONE
LIBERTY PROPERTIES, INC. AND SUBSIDIARIES
Consolidated
Statements of Stockholders' Equity
For the
Three Years Ended December 31, 2009
(Amounts
in Thousands, Except Per Share Data)
|
Common
Stock
|
Paid-in
Capital
|
Accumulated
Other
Comprehensive
Income
(Loss)
|
Accumulated
Undistributed
Net
Income
|
Total
|
||||||||||||||||
|
Balances,
December 31, 2006
|
$ | 9,823 | $ | 134,826 | $ | 935 | $ | 34,541 | $ | 180,125 | ||||||||||
|
Cash
distributions – common stock ($2.11 per share)
|
- | - | - | (21,218 | ) | (21,218 | ) | |||||||||||||
|
Repurchase
of common stock
|
(159 | ) | (3,053 | ) | - | - | (3,212 | ) | ||||||||||||
|
Shares
issued through dividend reinvestment plan
|
237 | 4,482 | - | - | 4,719 | |||||||||||||||
|
Restricted
stock vesting
|
5 | (5 | ) | - | - | - | ||||||||||||||
|
Compensation
expense – restricted stock
|
- | 826 | - | - | 826 | |||||||||||||||
|
Net
income
|
- | - | - | 10,590 | 10,590 | |||||||||||||||
|
Other
comprehensive income-
Net
unrealized loss on available-for-sale securities
|
- | - | (591 | ) | - | (591 | ) | |||||||||||||
|
Comprehensive
income
|
- | - | - | - | 9,999 | |||||||||||||||
|
Balances,
December 31, 2007
|
9,906 | 137,076 | 344 | 23,913 | 171,239 | |||||||||||||||
|
Cash
distributions – common stock ($1.30 per share)
|
- | - | - | (13,241 | ) | (13,241 | ) | |||||||||||||
|
Repurchase
of common stock
|
(125 | ) | (1,702 | ) | - | - | (1,827 | ) | ||||||||||||
|
Shares
issued through dividend reinvestment plan
|
158 | 2,449 | - | - | 2,607 | |||||||||||||||
|
Restricted
stock vesting
|
23 | (23 | ) | - | - | - | ||||||||||||||
|
Compensation
expense – restricted stock
|
- | 888 | - | - | 888 | |||||||||||||||
|
Net
income
|
- | - | - | 4,892 | 4,892 | |||||||||||||||
|
Other
comprehensive income-
Net
unrealized loss on available-for-sale securities
|
- | - | (583 | ) | - | (583 | ) | |||||||||||||
|
Comprehensive
income
|
- | - | - | - | 4,309 | |||||||||||||||
|
Balances,
December 31, 2008
|
9,962 | 138,688 | (239 | ) | 15,564 | 163,975 | ||||||||||||||
|
Distributions
– common stock
|
||||||||||||||||||||
|
cash
- $.08 per share
|
- | - | - | (948 | ) | (948 | ) | |||||||||||||
|
stock
- $.80 per share
|
1,160 | 4,955 | - | (8,471 | ) | (2,356 | ) | |||||||||||||
|
Repurchase
of common stock
|
(268 | ) | (1,148 | ) | - | - | (1,416 | ) | ||||||||||||
|
Retirement
of common stock
|
(6 | ) | (45 | ) | - | - | (51 | ) | ||||||||||||
|
Restricted
stock vesting
|
31 | (31 | ) | - | - | - | ||||||||||||||
|
Compensation
expense – restricted stock
|
- | 853 | - | - | 853 | |||||||||||||||
|
Net
income
|
- | - | - | 19,641 | 19,641 | |||||||||||||||
|
Other
comprehensive income -
|
||||||||||||||||||||
|
Net
unrealized gain on available-for-sale securities
|
- | - | 319 | - | 319 | |||||||||||||||
|
Net
unrealized gain on derivative instruments
|
- | - | 111 | - | 111 | |||||||||||||||
|
Comprehensive
income
|
- | - | - | - | 20,071 | |||||||||||||||
|
Balances,
December 31, 2009
|
$ | 10,879 | $ | 143,272 | $ | 191 | $ | 25,786 | $ | 180,128 | ||||||||||
See
accompanying notes.
F-5
ONE
LIBERTY PROPERTIES, INC. AND SUBSIDIARIES
Consolidated
Statements of Cash Flows
(Amounts
in Thousands)
|
Year Ended December 31,
|
||||||||||||
|
2009
|
2008
|
2007
|
||||||||||
|
Cash
flows from operating activities:
|
||||||||||||
|
Net
income
|
$ | 19,641 | $ | 4,892 | $ | 10,590 | ||||||
|
Adjustments
to reconcile net income to net cash provided by operating
activities:
|
||||||||||||
|
Gain
on sale of excess unimproved land, real estate and other
|
(5,757 | ) | (1,830 | ) | (122 | ) | ||||||
|
Gain
on troubled mortgage restructuring, as a result of conveyance to
mortgagee
|
(897 | ) | - | - | ||||||||
|
Increase
in rental income from straight-lining of rent
|
(1,336 | ) | (1,201 | ) | (1,996 | ) | ||||||
|
Decrease
in rental income resulting from bad debt expense
|
619 | 356 | 322 | |||||||||
|
Decrease
(increase) in rental income from amortization of intangibles relating to
leases
|
23 | (371 | ) | (250 | ) | |||||||
|
Impairment
charges
|
229 | 5,983 | - | |||||||||
|
Amortization
of restricted stock expense
|
853 | 888 | 826 | |||||||||
|
Retirement
of common stock
|
(51 | ) | - | - | ||||||||
|
Change
in fair value of non-qualifying interest rate swap
|
- | 650 | - | |||||||||
|
Gain
on dispositions of real estate related to unconsolidated joint
ventures
|
- | (297 | ) | (583 | ) | |||||||
|
Equity
in earnings of unconsolidated joint ventures
|
(559 | ) | (622 | ) | (648 | ) | ||||||
|
Distributions
of earnings from unconsolidated joint ventures
|
507 | 535 | 1,089 | |||||||||
|
Depreciation
and amortization
|
9,066 | 9,035 | 8,309 | |||||||||
|
Amortization
of financing costs
|
1,012 | 631 | 638 | |||||||||
|
Changes
in assets and liabilities:
|
||||||||||||
|
(Increase)
decrease in escrow, deposits, other assets and receivables
|
(976 | ) | 695 | (153 | ) | |||||||
|
(Decrease)
increase in accrued expenses and other liabilities
|
(682 | ) | 93 | (138 | ) | |||||||
|
Net
cash provided by operating activities
|
21,692 | 19,437 | 17,884 | |||||||||
|
Cash
flows from investing activities:
|
||||||||||||
|
Purchase
of real estate and improvements
|
(576 | ) | (60,009 | ) | (423 | ) | ||||||
|
Net
proceeds from sale of real estate and excess unimproved
land
|
24,014 | 2,976 | 4 | |||||||||
|
Investment
in unconsolidated joint ventures
|
(7 | ) | (379 | ) | (8 | ) | ||||||
|
Distributions
of return of capital from unconsolidated joint ventures
|
86 | 1,435 | 551 | |||||||||
|
Net
proceeds from sale of available-for-sale securities
|
4,495 | 525 | 843 | |||||||||
|
Purchase
of available-for-sale securities
|
(10,683 | ) | - | (551 | ) | |||||||
|
Net
cash provided by (used in) investing activities
|
17,329 | (55,452 | ) | 416 | ||||||||
|
Cash
flows from financing activities:
|
||||||||||||
|
Borrowing
on bank line of credit, net
|
- | 27,000 | - | |||||||||
|
Proceeds
from mortgage financings
|
2,559 | 14,185 | 2,700 | |||||||||
|
Payment
of financing costs
|
(208 | ) | (366 | ) | (695 | ) | ||||||
|
Repayment
of mortgages and loan payable
|
(19,780 | ) | (13,476 | ) | (8,588 | ) | ||||||
|
Change
in restricted cash
|
- | 7,742 | (333 | ) | ||||||||
|
Cash
distributions - common stock
|
(2,939 | ) | (14,640 | ) | (21,167 | ) | ||||||
|
Repurchase
of common stock
|
(1,416 | ) | (1,827 | ) | (3,212 | ) | ||||||
|
Expenses
associated with stock issuance
|
(148 | ) | - | - | ||||||||
|
Issuance
of shares through dividend reinvestment plan
|
- | 2,607 | 4,719 | |||||||||
|
Net
cash (used in) provided by financing activities
|
(21,932 | ) | 21,225 | (26,576 | ) | |||||||
|
Net
increase (decrease) in cash and cash equivalents
|
17,089 | (14,790 | ) | (8,276 | ) | |||||||
|
Cash
and cash equivalents at beginning of year
|
10,947 | 25,737 | 34,013 | |||||||||
|
Cash
and cash equivalents at end of year
|
$ | 28,036 | $ | 10,947 | $ | 25,737 | ||||||
Continued
on next page
F-6
ONE
LIBERTY PROPERTIES, INC. AND SUBSIDIARIES
Consolidated
Statements of Cash Flows (Continued)
(Amounts
in Thousands)
|
Year Ended December 31,
|
||||||||||||
|
2009
|
2008
|
2007
|
||||||||||
|
Supplemental
disclosures of cash flow information:
|
||||||||||||
|
Cash
paid during the year for interest expense
|
$ | 15,287 | $ | 14,908 | $ | 14,812 | ||||||
|
Cash
paid during the year for income taxes
|
67 | 81 | 35 | |||||||||
|
Supplemental
schedule of non-cash investing and financing activities:
|
||||||||||||
|
Reclassification
of real estate owned to properties held for sale
|
$ | - | $ | 34,343 | $ | - | ||||||
|
Reclassification
of assets related to properties held for sale
|
- | 2,129 | - | |||||||||
|
Reclassification
of mortgages payable to mortgages payable- properties held for
sale
|
- | 17,961 | - | |||||||||
|
Mortgage
debt extinguished upon conveyance of properties to mortgagee by
deeds-in-lieu of foreclosure
|
8,706 | - | - | |||||||||
|
Properties
conveyed to mortgagee
|
8,075 | - | - | |||||||||
| Liabilities extinguished upon transfer to mortgagee | 543 | - | - | |||||||||
|
Common
stock dividend – portion paid in shares of Company’s common
stock
|
6,263 | - | - | |||||||||
|
Assumption
of mortgages payable in connection with (sale) purchase of real
estate
|
(9,069 | ) | 2,771 | - | ||||||||
|
Purchase
accounting allocations – intangible lease assets
|
- | 4,362 | - | |||||||||
|
Purchase
accounting allocations – intangible lease liabilities
|
- | (451 | ) | - | ||||||||
|
Purchase
accounting allocations – mortgage payable discount
|
- | (40 | ) | - | ||||||||
See
accompanying notes.
F-7
ONE
LIBERTY PROPERTIES, INC. AND SUBSIDIARIES
Notes to
Consolidated Financial Statements
December
31, 2009
|
NOTE
1 -
|
ORGANIZATION
AND BACKGROUND
|
One
Liberty Properties, Inc. (“OLP”) was incorporated in 1982 in the state of
Maryland. OLP is a self-administered and self-managed real estate investment
trust ("REIT"). OLP acquires, owns and manages a geographically
diversified portfolio of retail (including furniture and office supply stores),
industrial, office, flex, health and fitness and other properties, a substantial
portion of which are under long-term net leases. As of December 31, 2009, OLP
owned 71 properties, one of which is vacant, and one of which is a 50% tenancy
in common interest. OLP’s joint ventures owned a total of five properties. The
76 properties are located in 27 states.
|
NOTE
2 -
|
SIGNIFICANT
ACCOUNTING POLICIES
|
On July
1, 2009, OLP adopted the Financial Accounting Standards Board (“FASB”)
Accounting Standards Codification (“ASC”) as the exclusive source of
authoritative U.S. generally accepted accounting principles (“GAAP”), to be
applied by non-government entities, except for Securities and Exchange
Commission (“SEC”) rules and interpretive releases, which are also authoritative
GAAP for U.S. registrants. Upon adoption, the FASB ASC superseded all
then existing non-SEC accounting and reporting standards. All other
non-grandfathered, non-SEC accounting literature not included in the FASB ASC
became non-authoritative. The FASB ASC does not change U.S. GAAP, but
is intended to simplify user access to all authoritative U.S. GAAP by providing
all the authoritative literature related to a particular topic in one
place. The Company’s conversion to FASB ASC, which was effective for
financial statements issued for interim and annual periods ending after
September 15, 2009, did not have any effect on the Company’s consolidated
financial position, results of operations, or cash flows.
Principles
of Consolidation
The
consolidated financial statements include the accounts and operations of OLP
and its wholly owned subsidiaries. OLP and its
subsidiaries are hereinafter referred to as the Company. Material
intercompany items and transactions have been eliminated.
Investment
in Unconsolidated Joint Ventures
The
Company accounts for its investments in unconsolidated joint ventures under the
equity method of accounting. Although the Company is the managing
member, it does not exercise substantial operating control over these entities,
and such entities are not variable-interest entities. These
investments are recorded initially at cost, as investments in unconsolidated
joint ventures, and subsequently adjusted for its share of equity in earnings,
cash contributions and distributions. None of the joint venture debt
is recourse to the Company.
The
Company has elected to follow the cumulative earnings approach when assessing,
for the statement of cash flows, whether the distribution from the investee is a
return of the investor’s investment as compared to a return on its investment.
The source of the cash generated by the investee to fund the distribution is not
a factor in the analysis (that is, it does not matter whether the cash was
generated through investee refinancing, sale of assets or operating results).
Consequently, the investor only considers the relationship between the cash
received from the investee to its equity in the undistributed earnings of the
investee, on a cumulative basis, in assessing whether the distribution from the
investee is a return on or return of its investment. Cash received from
the unconsolidated entity is presumed to be a return on the investment to the
extent that, on
a cumulative basis, distributions received by the investor are less than its
share of the equity in the undistributed earnings of the
entity.
F-8
NOTE
2 - SIGNIFICANT ACCOUNTING POLICIES (Continued)
Use
of Estimates
The
preparation of the consolidated financial statements in conformity with GAAP
requires management to make estimates and assumptions that affect the amounts
reported in the financial statements and accompanying notes. Actual results
could differ from those estimates.
Management
believes that the estimates and assumptions that are most important to the
portrayal of the Company’s financial condition and results of operations, in
that they require management’s most difficult, subjective or complex judgments,
form the basis of the accounting policies deemed to be most significant to the
Company. These significant accounting policies relate to revenues and
the value of the Company’s real estate portfolio. Management believes
its estimates and assumptions related to these significant accounting policies
are appropriate under the circumstances; however, should future events or
occurrences result in unanticipated consequences, there could be a material
impact on the Company’s future financial condition or results of
operations.
Revenue
Recognition
Rental
income includes the base rent that each tenant is required to pay in accordance
with the terms of their respective leases reported on a straight-line basis over
the term of the lease. It is the Company’s policy not to record straight-line
rent beyond the expected useful life of a building. In order for management to
determine, in its judgment, that the unbilled rent receivable applicable to each
specific property is collectible, management reviews unbilled rent receivables
on a quarterly basis and takes into consideration the tenant’s payment history
and the financial condition of the tenant. Some of the leases provide for
additional contingent rental revenue in the form of percentage rents and
increases based on the consumer price index. The percentage rents are
based upon the level of sales achieved by the lessee and are recorded once the
required sales levels are reached.
Gains or
losses on disposition of properties are recorded when the criteria for
recognizing such gains or losses under generally accepted accounting principles
have been met.
Purchase
Accounting for Acquisition of Real Estate
The
Company allocates the purchase price of real estate to land and building and
intangibles, such as the value of above, below and at-market leases and
origination costs associated with in-place leases. The Company depreciates the
amount allocated to building and intangible assets or liabilities over their
estimated useful lives, which generally range from two to forty
years. The values of the above and below market leases are amortized
and recorded as either an increase (in the case of below market leases) or a
decrease (in the case of above market leases) to rental income over the
remaining minimum term of the associated lease. The origination costs
are amortized as an expense over the remaining minimum term of the
lease. The Company assesses fair value of the lease intangibles based
on estimated cash flow projections that utilize appropriate discount rates and
available market information.
F-9
NOTE
2 - SIGNIFICANT ACCOUNTING POLICIES (Continued)
As a result of the acquisitions made during the
year ending December 31, 2008, the Company recorded additional deferred
intangible lease assets of $4,362,000, representing the value of the acquired
above market leases and assumed lease origination costs. The Company
also recorded during the year ending December 31, 2008 additional deferred
intangible lease liabilities of $451,000, representing the value of the acquired
below market leases. The Company did not acquire any properties
during the year ended December 31, 2009. The Company recognized a net
(decrease) increase in rental revenue of ($23,000), $371,000 and $250,000 for
the amortization of the above/below market leases for the years ended 2009, 2008
and 2007, respectively. For the years ended 2009, 2008 and 2007, the Company
recognized amortization expense of $534,000, $499,000 and $290,000,
respectively, relating to the amortization of the assumed lease origination
costs. The years ended 2009 and 2008 include a decline in rental revenue of
$170,000 and $180,000, respectively, and additional amortization expense of
$323,000 and $161,000, respectively, resulting from the accelerated expiration
of certain leases. In 2007, there was no decline in revenue or
additional amortization expense resulting from the accelerated expiration of
rents and leases. At December 31, 2009 and 2008, accumulated
amortization of intangible lease assets was $2,188,000 and $1,813,000,
respectively and accumulated amortization of intangible lease liabilities was
$1,562,000 and $1,155,000, respectively.
The
unamortized balance of intangible lease assets as a result of acquired above
market leases at December 31, 2009 will be deducted from rental income through
2025 as follows:
|
2010
|
$ | 375,000 | ||
|
2011
|
375,000 | |||
|
2012
|
375,000 | |||
|
2013
|
376,000 | |||
|
2014
|
369,000 | |||
|
Thereafter
|
1,320,000 | |||
| $ | 3,190,000 |
The
unamortized balance of intangible lease liabilities as a result of acquired
below market leases at December 31, 2009 will be added to rental income through
2022 as follows:
|
2010
|
$ | 407,000 | ||
|
2011
|
407,000 | |||
|
2012
|
407,000 | |||
|
2013
|
407,000 | |||
|
2014
|
407,000 | |||
|
Thereafter
|
2,792,000 | |||
| $ | 4,827,000 |
Accounting
for Long-Lived Assets and Impairment
of Real Estate Owned
The
Company reviews its real estate portfolio on a quarterly basis to ascertain if
there are any indicators of impairment to the value of any of its real estate
assets, including deferred costs and intangibles, in order to determine if there
is any need for an impairment charge. In reviewing the portfolio, the
Company examines the type of asset, the current financial statements or other
available financial information of the tenant, the economic situation in the
area in which the asset is located, the economic situation in the industry in
which the tenant is involved and the timeliness of the payments made by the
tenant under its lease, as well as any current correspondence that may have been
had with the tenant, including property inspection reports. For each
real estate asset owned for which indicators of impairment exist, if the
undiscounted cash flow analysis yields an amount which is less than the asset’s
carrying amount, an impairment loss is recorded to the extent that the estimated
fair value is less than the asset’s carrying amount. The estimated
fair value is determined using a discounted cash flow model of the expected
future cash flows through the useful life of
the property. Real estate assets that are classified as held for sale
are valued at the lower of carrying
amount or fair value less costs to sell on an individual asset
basis.
F-10
NOTE
2 - SIGNIFICANT ACCOUNTING POLICIES (Continued)
A
conditional asset retirement obligation (“CARO”) is a legal obligation to
perform an asset retirement activity in which the timing and/or method of
settlement is conditional on a future event that may or may not be within the
control of the Company. The Company would record a liability for a
CARO if the fair value of the obligation can be reasonably
estimated. There were no CARO’s recorded by the Company during the
three years ended December 31, 2009.
Cash
and Cash Equivalents
All
highly liquid investments with original maturities of three months or less when
purchased are considered to be cash equivalents. The Company places
its cash and cash equivalents in high quality financial
institutions.
Escrow,
Deposits and Other Assets and Receivables
Escrow,
deposits and other assets and receivables include $738,000 and $866,000 at
December 31, 2009 and 2008, respectively, of restricted cash relating to real
estate taxes, insurance and other escrows.
Allowance
for Doubtful Accounts
The
Company maintains an allowance for doubtful accounts for estimated losses
resulting from the inability of our tenants to make required rent
payments. If the financial condition of a specific tenant were to
deteriorate, resulting in an impairment of its ability to make payments,
additional allowances may be required. At December 31, 2009 and 2008,
the balance in allowance for doubtful accounts was $472,000 and $160,000,
respectively, recorded as a reduction to accounts receivable. The Company
records bad debt expense as a reduction of rental income. For the years ended
December 31, 2009, 2008 and 2007, the Company recorded bad debt expense of
$619,000, $356,000 and $322,000, respectively. Of these amounts, $58,000 and
$277,000 were recorded in discontinued operations for the years ended December
31, 2009 and 2008. For 2007, discontinued operations did not include any bad
debt expense.
Depreciation
and Amortization
Depreciation
of buildings and improvements is computed on the straight-line method over an
estimated useful life of 40 years for commercial properties and 27 1/2 years for
the Company’s residential property. Depreciation ceases when a
property is deemed “held for sale”. If a property which was deemed
“held for sale” is reclassified to a “held and used” property, “catch-up”
depreciation is recorded. Leasehold interest and the related ground lease
payments are amortized over the initial lease term of the leasehold
position. Depreciation expense, including amortization of a leasehold
position, lease origination costs, and capitalized lease commissions amounted to
$8,527,000, $7,838,000 and $7,436,000 for the three years ended December 31,
2009, 2008 and 2007, respectively.
Deferred
Financing Costs
Mortgage
and credit line costs are deferred and amortized on a straight-line basis over
the terms of the respective debt obligations, which approximates the effective
interest method. At December 31, 2009 and 2008, accumulated
amortization of such costs was $2,943,000 and $3,069,000,
respectively.
F-11
NOTE
2 - SIGNIFICANT ACCOUNTING POLICIES (Continued)
Federal
Income Taxes
The
Company has qualified as a real estate investment trust under the applicable
provisions of the Internal Revenue Code. Under these provisions, the
Company will not be subject to federal income taxes on amounts distributed to
stockholders providing it distributes at least 90% of its taxable income and
meets certain other conditions.
All
distributions made during 2009 were attributable to ordinary
income. Distributions made during 2008 included 3% treated as capital
gain distributions, with the balance treated as ordinary income.
The
Company follows a two step approach for evaluating uncertain tax
positions. Recognition (step one) occurs when an enterprise concludes
that a tax position, based solely on its technical merits, is
more-likely-than-not to be sustained upon examination. Measurement
(step two) determines the amount of benefit that more-likely-than-not will be
realized upon settlement. Derecognition of a tax position that was
previously recognized would occur when a company subsequently determines that a
tax position no longer meets the more-likely-than-not threshold of being
sustained. The use of a valuation allowance as a substitute for
derecognition of tax positions is prohibited. The Company has not
identified any uncertain tax positions requiring accrual.
Investment
in Available-For-Sale Securities
The
Company determines the appropriate classification of equity and debt securities
at the time of purchase and reassesses the appropriateness of the classification
at each reporting date. At December 31, 2009, all marketable
securities have been classified as available-for-sale and recorded at fair
value. The fair value of the Company’s equity and debt investment in
publicly-traded companies is determined based upon the closing trading price of
the equity and debt securities as of the balance sheet date and unrealized gains
and losses on these securities are recorded as a separate component of
stockholders' equity.
The
Company's investment in 37,081 common shares of BRT Realty Trust ("BRT"), a
related party of the Company, (accounting for less than 1% of the total voting
power of BRT), was purchased at a cost of $132,000 and has a fair market value
at December 31, 2009 of $189,000. At December 31, 2009, the total
cumulative unrealized gain of $80,000 on all investments in equity and debt
securities is reported as accumulated other comprehensive income (loss) in the
stockholders' equity section.
Realized
gains and losses are determined using the average cost method and is included in
“Interest and other income” on the income statement. During 2009,
2008 and 2007, sales proceeds and gross realized gains and losses on securities
classified as available-for-sale were (amounts in thousands):
|
2009
|
2008
|
2007
|
||||||||||
|
Sales
proceeds
|
$ | 4,495 | $ | 525 | $ | 843 | ||||||
|
Gross
realized losses
|
$ | - | $ | 4 | $ | - | ||||||
|
Gross
realized gains
|
$ | - | $ | 4 | $ | 118 | ||||||
Concentration
of Credit Risk
The
Company maintains accounts at various financial institutions. While
the Company attempts to limit any financial exposure, its deposit balances
exceed federally insured limits. The Company has not experienced any
losses on such accounts.
F-12
NOTE
2 - SIGNIFICANT ACCOUNTING POLICIES (Continued)
The
Company’s properties are located in 27 states. For the years
ended December 31, 2009, 2008 and 2007, 15.4%, 15.8% and 16.0% of rental
revenues were attributable to properties located in Texas and 15.4%, 14.6% and
15.0% of rental revenues were attributable to properties located in New
York. No other state contributed over 10% to the Company’s rental
revenues.
The
Company owns eleven retail furniture stores that are located in six states and
are net leased to Haverty Furniture Companies, Inc. pursuant to a master
lease. The basic term of the net lease expires August 2022, with
several renewal options. These properties, which represented 14.9% of
the depreciated book value of real estate investments at December 31, 2009,
generated rental revenues of approximately $4,844,000 in each year, or 11.9%,
12.0% and 12.7%, of the Company’s total revenues for the years ended December
31, 2009, 2008 and 2007, respectively.
In
September 2008, the Company acquired eight retail office supply stores, located
in seven states, net leased to Office Depot, Inc. pursuant to eight separate
leases which contain cross default provisions. The basic term of the
net leases expire September 2018, with several renewal options. These
eight properties plus two other Office Depot properties the Company already
owned represented 13.9% of the depreciated book value of real estate investments
at December 31, 2009 and generated rental revenues of $4,433,000 and $1,551,000,
or 10.9% and 3.8%, of the Company’s total revenues for the years ended December
31, 2009 and 2008, respectively.
Earnings
Per Common Share
Basic
earnings per share was determined by dividing net income for each year by the
weighted average number of shares of common stock outstanding, which includes
unvested restricted stock during each year.
Diluted
earnings per share reflects the potential dilution that could occur if
securities or other contracts exercisable for, or convertible into, common stock
were exercised or converted or resulted in the issuance of common stock that
shared in the earnings of the Company. The weighted average number of
common shares outstanding used for the diluted earnings per share calculations
includes the impact of common stock issued in connection with the dividends paid
in April, July and October 2009 and January 2010, as of the dividend declaration
date, as the shares were contingently issuable as of that date. Such
stock dividends were included in basic EPS as of the issuance
date. There was zero impact on the income per common share used in
the diluted earnings per share calculations. There were no options to
purchase shares of common stock or other contracts exercisable for, or
convertible into, common stock in the years ended December 31, 2009, 2008 and
2007.
Segment
Reporting
Virtually
all of the Company's real estate assets are comprised of real estate owned that
is net leased to tenants on a long-term basis. Therefore, the Company
operates predominantly in one industry segment.
Derivatives
and Hedging Activities
The
Company’s primary objective in using derivatives is to add stability to interest
expense and to manage its exposure to interest rate movements. To accomplish
this objective, the Company primarily uses interest rate swaps as part of its
interest rate risk management strategy. At December 31, 2009, the Company had
one interest rate swap outstanding, involving the receipt of variable rate
amounts from a counterparty in exchange for the Company making fixed-rate
payments over the life of the agreement without exchange of the underlying
principal amount. Derivatives were used to hedge the variable cash flows
associated with variable rate debt regarding two properties, including one
outstanding at December 31, 2009 and one outstanding at December 31,
2008. The Company did not have any derivatives during the year ended
December 31, 2007. The Company does not use derivatives for trading
or speculative purposes.
F-13
NOTE
2 - SIGNIFICANT ACCOUNTING POLICIES (Continued)
The
Company records all derivatives on the consolidated balance sheets at fair
value. In determining the fair value of its derivatives, the Company considers
the credit risk of its counterparties and the Company
and widely accepted valuation techniques, including discounted cash flow
analysis on the expected cash flows of the derivative. These
counterparties are generally larger financial institutions engaged in
providing a variety of financial services. These institutions generally face
similar risks regarding adverse changes in market and economic conditions,
including, but not limited to, fluctuations in interest rates, exchange rates,
equity and commodity prices and credit spreads.
The
accounting for changes in the fair value of derivatives depends on the intended
use of the derivative, whether the Company has elected to designate a derivative
in a hedging relationship and apply hedge accounting and whether the hedging
relationship has satisfied the criteria necessary to apply hedge
accounting. For derivatives designated as cash flow hedges, the
effective portion of changes in the fair value of the derivative is initially
reported in accumulated other comprehensive income (outside of earnings) and
subsequently reclassified to earnings in the period in which the hedged
transaction affects earnings. The ineffective portion of changes in
the fair value of the derivative is recognized directly in
earnings. For derivatives not designated as cash flow hedges, changes
in the fair value of the derivative are recognized directly in earnings in the
period in which the change occurs.
Stock
Based Compensation
The fair
value of restricted stock grants, determined as of the date of grant, is
amortized into general and administrative expense over the respective vesting
period.
New
Accounting Pronouncements
On
January 1, 2009, the Company adopted the updated accounting guidance related to
business combinations and is applying such provisions prospectively to business
combinations that have an acquisition date on or after January 1,
2009. The updated guidance (i) establishes the acquisition-date fair
value as the measurement objective for all assets acquired, liabilities assumed
and any contingent consideration, (ii) requires expensing of most transaction
costs that were previously capitalized upon acquisition and (iii) requires the
acquirer to disclose to investors and other users of the information needed to
evaluate and understand the nature and financial effect of the business
combination. The principal impact of the adoption on the Company’s consolidated
financial statements is the requirement that the Company expense most of its
transaction costs relating to its acquisition activities. There were
no acquisitions which occurred during the twelve months ended December 31,
2009.
On
January 1, 2009, the Company adopted the updated accounting guidance related to
disclosures about derivative instruments and hedging activities. The
updated guidance expands the disclosure requirements with the intent to provide
users of financial statements with an enhanced understanding of (i) how and why
an entity uses derivative instruments, (ii) how derivative instruments and
related hedged items are accounted for, and (iii) how derivative instruments and
related hedged items affect an entity’s financial position, financial
performance, and cash flows. In addition, it requires qualitative disclosures
about objectives and strategies for using derivatives, quantitative
disclosures about the fair value of and gains and losses on derivative
instruments, and disclosures about credit-risk-related contingent features in
derivative instruments. As a result of the adoption, the Company has added
significant disclosures to its financial statements. Refer to Note 7 for the
Company’s added disclosures.
F-14
NOTE
2 - SIGNIFICANT ACCOUNTING POLICIES (Continued)
On
January 1, 2009, the Company adopted the updated accounting guidance related to
determining whether instruments granted in share-based payment transactions are
participating securities. The updated guidance states that unvested
share-based payment awards that contain nonforfeitable
rights to dividends or dividend equivalents (whether paid or unpaid) are
participating securities and shall be included in the computation of earnings
per share. The adoption had no impact on the Company as the unvested restricted
stock awards were previously included in the per share amounts for both basic
and diluted earnings per share.
On April
1, 2009, the Company adopted the updated accounting guidance related to debt and
equity securities. The updated guidance changes existing accounting
requirements for other-than-temporary impairment for debt
securities. The updated guidance also extends new disclosure
requirements for debt and equity securities to interim reporting periods as well
as provides new disclosure requirements. The adoption did not have a
material effect on the Company’s consolidated financial condition, results of
operations, or cash flows. Refer to Note 8 for the Company’s added
disclosures.
On April
1, 2009, the Company adopted the updated accounting guidance related to fair
value measurements and disclosures. The updated guidance clarifies
the guidance for fair value measurements when the volume and level of activity
for the asset or liability have significantly decreased and includes guidance on
identifying circumstances that indicate a transaction is not
orderly. The updated guidance must be applied prospectively. The
adoption did not have a material effect on the Company’s consolidated financial
condition, results of operations, or cash flows.
In
January 2010, the FASB issued Accounting Standards Update No. 2010-1, Accounting for Distributions to
Shareholders with Components of Stock and Cash, (“ASU
2010-1). The updated guidance clarifies that the stock portion of a
distribution to shareholders that allows them to elect to receive cash or stock
with a potential limitation on the total amount of cash that all shareholders
can elect to receive in the aggregate is considered a share issuance that is
reflected in earnings per share prospectively and is not a stock dividend for
the purpose of the calculation. ASU 2010-1 is effective for interim
and annual periods ending on or after December 15, 2009 and is to be applied
retrospectively. As a result of the adoption of this updated
guidance, the Company has restated its weighted average shares outstanding and
its earnings per share for the 2009 interim quarters as presented in Note
18.
On April
1, 2009, the Company adopted the updated accounting guidance related to
subsequent events. The updated guidance establishes general standards
of accounting for and disclosure of subsequent events. It renames the
two types of subsequent events as recognized subsequent events or non-recognized
subsequent events and modifies the definition of the evaluation period for
subsequent events as events or transactions that occur after the balance sheet
date, but before the issuance of the financial statements. The
adoption did not have a material effect on the Company’s consolidated financial
condition, results of operations, or cash flows. In February
2010, the FASB further amended the subsequent events guidance with the issuance
of Accounting Standards Update No. 2010-9, Amendments to Certain Recognition
and Disclosure Requirements, (“ASU 2010-9”). As a result of the adoption
of ASU 2010-9, the Company is no longer required to disclose
the date through which management evaluated subsequent events in the financial
statements, either in originally issued financial statements or reissued
financial statements.
F-15
NOTE
2 - SIGNIFICANT ACCOUNTING POLICIES (Continued)
The FASB
has issued updated consolidation accounting guidance for determining whether an
entity is a variable interest entity, or VIE, and requires the performance of a
qualitative rather than a quantitative analysis to determine the primary
beneficiary of a VIE. The updated guidance requires an entity to consolidate a
VIE if it has (i) the power to direct the activities that most significantly
impact the entity’s economic performance and (ii) the obligation to absorb
losses of the VIE or the right to receive benefits from the VIE that could be
significant to the VIE. The updated guidance is effective for the
first annual reporting period that begins after November 15, 2009, with early
adoption prohibited. While the Company is currently evaluating the
effect of adoption of this guidance, it currently believes that its adoption
will not have a material impact on its consolidated financial
statements.
Reclassification
Certain
amounts reported in previous consolidated financial statements have been
reclassified in the accompanying consolidated financial statements to conform to
the current year’s presentation, primarily to reclassify three real estate
investments sold in 2009 from real estate investments to properties held for
sale at December 31, 2008 and to reclassify the property operating income and
expenses to discontinued operations in all periods presented. In
addition, five real estate investments, formerly leased to Circuit City Stores,
Inc. and conveyed in July 2009 to the mortgagee by deeds-in-lieu of foreclosure,
were reclassified from real estate investments to properties held for sale at
December 31, 2008 and the related property operating income and expenses were
reclassified to discontinued operations in all periods presented.
NOTE
3 - REAL ESTATE INVESTMENTS AND MINIMUM FUTURE RENTALS
During
the year ended December 31, 2008, the Company purchased twelve single tenant
properties, including a portfolio of eight properties which are leased to the
same tenant, located in eight states for a total consideration of
$62,085,000. There were no property acquisitions during the year
ended December 31, 2009.
With the
exception of one vacant property, the rental properties owned at December 31,
2009 are leased under noncancellable operating leases with current expirations
ranging from 2010 to 2038, with certain tenant renewal
rights. Substantially all of the lease agreements are net lease
arrangements which require the tenant to pay not only rent but all the expenses
of the leased property including maintenance, taxes, utilities and
insurance. Certain lease agreements provide for periodic rental
increases and others provide for increases based on the consumer price
index.
F-16
NOTE
3 - REAL ESTATE INVESTMENTS AND MINIMUM FUTURE RENTALS (Continued)
The
minimum future rentals to be received over the next five years and thereafter on
the operating leases in effect at December 31, 2009 are as follows:
|
Year
Ending
December 31,
|
(In Thousands)
|
|||
|
2010
|
$ | 38,207 | ||
|
2011
|
37,882 | |||
|
2012
|
37,090 | |||
|
2013
|
36,899 | |||
|
2014
|
34,605 | |||
|
Thereafter
|
207,725 | |||
|
Total
|
$ | 392,408 | ||
Included
in the minimum future rentals are rentals from a property not owned in fee, but
ground leased from an unrelated third party. The Company paid annual fixed
leasehold rent of $237,500 through July 2009 at which time the annual amount
increased to $296,875. There are 25% increases every five years
through March 3, 2020 and the Company has a right to extend the lease for up to
five 5-year and one seven month renewal options.
At
December 31, 2009 and 2008, the Company has recorded an unbilled rent receivable
aggregating $10,706,000 and $10,916,000, respectively, including $1,293,000
classified as assets related to properties held for sale at December 31, 2008,
representing rent reported on a straight-line basis in excess of rental payments
required under the term of the respective leases. This amount is to be billed
and received pursuant to the lease terms during the next eighteen
years.
During
the year ended December 31, 2009, the Company wrote-off or recorded accelerated
amortization of $1,545,000 of unbilled “straight-line” rent receivable, which
includes $1,384,000 relating to two properties sold during 2009. During the year
ended December 31, 2008, the Company wrote-off or recorded accelerated
amortization of $332,000 of unbilled "straight-line" rent receivable for six
retail properties, including five properties formerly leased to Circuit City
Stores, Inc.
Lease
Termination Fee Income
In June
2009, the Company received a $1,905,000 lease termination fee from a retail
tenant that had been paying its rent on a current basis, but had vacated the
property in March 2009. Offsetting this amount is the write off of
the entire balance of the unbilled rent receivable and the intangible lease
asset related to this property, aggregating $121,000. The net amount
of $1,784,000 is recorded on the income statement as “Lease termination fee”
income in the year ended December 31, 2009. The Company has re-leased
this property effective November 2009.
Sale
of Excess Unimproved Land
In May
2008, the Company sold a five acre parcel of excess, unimproved land to an
unrelated third party for a sales price of $3,150,000 and realized a gain of
$1,830,000. This land, adjacent to a flex property owned by the
Company, had been acquired by the Company as part of the purchase of the flex
property in 2000.
NOTE
4 – PROPERTIES HELD FOR SALE AND DISCONTINUED OPERATIONS
Properties
are classified as held for sale when management has determined that it has met
the criteria established under GAAP. Properties which are held for
sale are not depreciated and their operations
are included in a separate component of income on the consolidated statements of
income
under the caption Discontinued Operations. This has resulted in
certain reclassification of 2009, 2008 and 2007 financial statement
amounts.
F-17
NOTE
4 – PROPERTIES HELD FOR SALE AND DISCONTINUED OPERATIONS
(Continued)
Properties
Conveyed to Mortgagee
Circuit
City Stores, Inc., a retail tenant which previously leased five properties from
five of OLP’s wholly-owned subsidiaries, filed for protection under the Federal
bankruptcy laws in November 2008, rejected leases for two of the properties in
December 2008 and rejected leases for the remaining three properties in March
2009. These five properties were secured by non-recourse
cross-collateralized mortgages with an outstanding balance of $8,706,000. No
payments were made on these mortgages from December 1, 2008 and a letter of
default was received on March 16, 2009. On July 7, 2009, these
properties were conveyed to the mortgagee by deeds-in-lieu of foreclosure and
OLP and the five wholly-owned subsidiaries which owned the Circuit City
properties were released from all obligations, including principal, interest and
real estate taxes due.
The
$8,075,000 carrying value of the portfolio of the properties transferred, net of
the $5,231,000 of impairment charges taken at December 31, 2008, approximated
their fair value at the time of transfer.
The
conveyance of these properties was accounted for as a troubled debt
restructuring. The Company had accrued interest expense on these mortgages and
real estate tax expense totaling $297,000 and $246,000, respectively, for the
period December 2008 through July 7, 2009. In connection with this
conveyance, the Company wrote off deferred costs and escrows relating to these
mortgages totaling $277,000. The Company recognized a “Gain on troubled mortgage
restructuring, as a result of conveyance to mortgagee” based on the excess of
the carrying amount of the payables over the fair value of the portfolio of
properties transferred in the amount of $897,000 ($.08 per diluted and basic
common share).
Sales
of Properties
In
February 2009, the Company entered into a lease termination agreement with a
retail tenant of a Texas property that had been paying its rent on a current
basis, but had vacated the property in 2006. Pursuant to the agreement, the
tenant paid the Company $400,000 as consideration for the lease
termination. On March 5, 2009, the Company sold this property for
$1,900,000 and recorded an impairment charge of $229,000 to recognize the loss.
This is in addition to an impairment charge of $752,000 taken in the prior year.
The related property income and expenses, including the impairment charges and
the lease termination fee are included in discontinued operations for the
current and prior years. The net book value of this property was
$2,072,000 and is included in properties held for sale at December 31, 2008 on
the accompanying consolidated balance sheet.
In
October 2009, in unrelated transactions, the Company sold two properties for a
total sales price of $31,788,000, resulting in gains totaling $5,757,000, which
is included in net gain on sales in discontinued operations in the results of
operations for the year ended December 31, 2009. In connection with the
closings, one mortgage, in the amount of $9,069,000, was assumed by the buyer
and is included in mortgages payable-properties held for sale on the
accompanying balance sheet at December 31, 2008. The other mortgage, in the
amount of $10,477,000, was paid off and the related interest rate swap agreement
was terminated. The Company incurred a $492,000 fee for terminating the swap
which is included in interest expense in discontinued operations. The net book
value of the two properties was $24,104,000 at December 31, 2008 and is included
in properties held for sale on the accompanying consolidated balance
sheet.
F-18
NOTE
4 – PROPERTIES HELD FOR SALE AND DISCONTINUED OPERATIONS
(Continued)
At
December 31, 2008, assets related to the three properties that were sold and the
five properties that were transferred to the mortgagee during 2009 aggregated
approximately $2,129,000, consisting of unbilled rent receivable, unamortized
intangible lease assets, unamortized deferred financing costs and escrow,
deposits and other receivables.
The
following details the components of income from discontinued operations,
primarily the eight properties discussed above. Rental income for the
year ended December 31, 2007 includes settlements of $405,000 relating to
properties sold in a prior year (amounts in thousands):
|
Year Ended December 31,
|
||||||||||||
|
2009
|
2008
|
2007
|
||||||||||
|
Rental
income
|
$ | 3,080 | $ | 4,310 | $ | 5,116 | ||||||
|
Depreciation
and amortization
|
539 | 1,196 | 873 | |||||||||
|
Real
estate expenses
|
270 | 278 | 55 | |||||||||
|
Interest
expense
|
1,375 | 1,904 | 1,283 | |||||||||
|
Total
expenses
|
2,184 | 3,378 | 2,211 | |||||||||
|
Income
from operations
|
896 | 932 | 2,905 | |||||||||
|
Impairment
charges
|
(229 | ) | (5,983 | ) | - | |||||||
|
Gain
on troubled mortgage restructuring, as a result of conveyance to
mortgagee
|
897 | - | - | |||||||||
|
Net
gain on sales
|
5,757 | - | - | |||||||||
|
Income
(loss) from discontinued operations
|
$ | 7,321 | $ | (5,051 | ) | $ | 2,905 | |||||
NOTE
5 – INVESTMENT IN UNCONSOLIDATED JOINT VENTURES
The
Company’s five unconsolidated joint ventures each own and operate one
property. At December 31, 2009 and 2008, the Company’s equity
investment in unconsolidated joint ventures totaled $5,839,000 and $5,857,000,
respectively. These balances are net of distributions, including
distributions of $593,000 and $1,970,000 received in 2009 and 2008,
respectively. In addition to the gain on sale of properties of $297,000 and
$583,000 for the years ended December 31, 2008 and 2007, respectively, the
unconsolidated joint ventures contributed $559,000, $622,000 and $648,000 in
equity earnings for the years ending December 31, 2009, 2008 and 2007,
respectively. See Note 9 for related party fees paid by one of the
unconsolidated joint ventures.
In 2008
and 2007, two of the Company’s unconsolidated joint ventures sold their only
properties, which were vacant, resulting in gains to the Company of $297,000 and
$583,000, respectively.
NOTE
6 – DEBT OBLIGATIONS
Mortgages
Payable
At
December 31, 2009, there were 35 outstanding mortgages payable, all of which are
secured by first liens on individual real estate investments with an aggregate
carrying value before accumulated depreciation of $318,767,000. The
mortgage payments bear interest at fixed rates ranging from 5.44% to 8.8%, and
mature between 2010 and 2037. The weighted average interest rate was
6.18% and 6.33% for the years ended December 31, 2009 and 2008,
respectively.
F-19
NOTE
6 – DEBT OBLIGATIONS (Continued)
Scheduled
principal repayments during the next five years and thereafter are as
follows:
|
Year
Ending
December 31,
|
(In Thousands)
|
|||
|
2010
|
$ | 23,259 | (a) | |
|
2011
|
8,061 | |||
|
2012
|
36,994 | |||
|
2013
|
8,999 | |||
|
2014
|
19,356 | |||
|
Thereafter
|
93,849 | |||
|
Total
|
$ | 190,518 | ||
(a)
Includes a $4,500,000 mortgage loan which matured on March 1, 2010 which the
Company has not paid off and is currently in discussions with representatives of
the mortgagee. In addition, three other mortgages mature during 2010
which require balloon payments aggregating approximately $12,400,000 at
maturity, including a $2,400,000 mortgage loan the Company paid off in January
2010. Also included is a $1,700,000 mortgage loan which the lender
can call on 90 days notice and the scheduled amortization of principal balances
in the amount of $4,659,000.
Line
of Credit
The
Company has a $62,500,000 revolving credit facility (“Facility”) with VNB New
York Corp., Bank Leumi USA, Israel Discount Bank of New York and Manufacturers
and Traders Trust Company. The Facility matures March 31, 2010 and provides that
the Company pays interest at the lower of LIBOR plus 2.15% or the respective
bank’s prime rate on funds borrowed and has an unused facility fee of
1/4%. At December 31, 2009, there was $27,000,000 outstanding under
the Facility. The Company was in compliance with all debt covenants at December
31, 2009.
The
Facility is guaranteed by all of the Company’s subsidiaries which own
unencumbered properties and is secured by the outstanding stock of all
subsidiaries of the Company. The Facility is available to pay off existing
mortgages, to fund the acquisition of additional properties, or to invest in
joint ventures. Net proceeds received from the sale or refinancing of
properties are required to be used to repay amounts outstanding under the
Facility if proceeds from the Facility were used to purchase or refinance the
property.
The
Company has negotiated a modification and extension of its credit facility and
has come to agreement on all material terms. The proposed
modification and extension will extend the maturity date from March 31, 2010 to
March 31, 2012 and reduce permitted borrowings from $62,500,000 to $40,000,000.
Interest will be charged at the 90 day LIBOR rate plus 3%, with a minimum
interest rate of 6% per annum and there is an unused facility fee of 1/4%. In
connection with the amendment, the Company will pay a commitment fee of
$400,000. Although the Company is confident that the modification and
extension will be finalized, there can be no assurance that it will be
consummated.
F-20
NOTE
7 - DERIVATIVE FINANCIAL INSTRUMENTS
The
following is a summary of the terminated and designated derivative financial
instruments as of December 31, 2009 and 2008 (amounts in
thousands):
|
Notional
|
Fair
Value
|
||||||||||||||||||
|
December
31,
|
December
31,
|
||||||||||||||||||
|
Designation
|
Derivative
|
2009
|
2008
|
Balance
Sheet
Location
|
2009
|
2008
|
|||||||||||||
|
Non-Qualifying
|
Terminated
Interest Rate Swap
|
$ | - | $ | 10,675 |
Other
Liabilities
|
$ | - | $ | 650 | |||||||||
|
Qualifying
|
Active
Cash Flow Interest Rate Swap
|
$ | 9,832 | $ | - |
Other
Assets
|
$ | 111 | $ | - | |||||||||
At
December 31, 2009, the Company had one qualifying interest rate swap, which was
entered into in March 2009. At December 31, 2008, the Company had one
non-qualifying interest rate swap which was subsequently designated as a
qualifying cash flow hedge at April 1, 2009. The Company terminated
the loan agreement on this interest rate swap in October 2009 due to the sale of
the mortgaged property.
The
following table presents the effect of the Company’s derivative financial
instrument that was not designated as a cash flow hedge on the consolidated
statement of income for the year ended December 31, 2009 (amounts in
thousands):
|
Gain Recognized
|
||||||
|
Derivative Not Designated as
Hedging Instruments
|
Location of Gain Recognized in
Income on Derivative
|
on Derivative
2009
|
||||
|
Interest
Rate Swap
|
Interest
Expense
|
$ | 201 | |||
The
following table presents the effect of the Company’s derivative financial
instruments that were designated as cash flow hedges on the consolidated
statement of income for the year ended December 31, 2009 (amounts in
thousands):
|
Derivative in
Cash Flow
Hedging
Relationships
|
(Loss)
Recognized
in OCI on
Derivatives
(Effective
Portion)
|
Location of Loss
Reclassified from
Accumulated OCI
into Income
(Effective Portion)
|
(Loss)
Reclassified from
Accumulated
OCI into Income
(Effective
Portion)
|
Location of Gain
Recognized in
Income on
Derivative
(Ineffective Portion
and Amount
Excluded from
Effectiveness
Testing)
|
Gain
Recognized in
Income on
Derivative
(Ineffective
Portion and
Amount
Excluded from
Effectiveness
Testing)
|
|||||||||
|
Interest
Rate Swap
|
$ | (24 | ) |
Interest
Expense
|
$ | (135 | ) |
Interest
Expense
|
$ | 111 | ||||
During
the twelve months ended December 31, 2009, the Company recorded a $111,000 gain
on hedge ineffectiveness attributable to the late designation of one of the
Company’s interest rate swaps which was recorded as a reduction of interest
expense. In addition, the Company accelerated
the reclassification of amounts in other comprehensive income to earnings as a
result of the Company’s termination of the loan agreement on this interest rate
swap due to the sale of the mortgaged property in October 2009. The
accelerated amount was a gain of $63,000 reclassified out of other comprehensive
income into earnings as a reduction to interest expense due to the termination
of the loan agreement.
F-21
NOTE
7 - DERIVATIVE FINANCIAL INSTRUMENTS (Continued)
At
December 31, 2009, the Company had one qualifying interest rate swap designated
as a cash flow hedge. During the next 12 months, the Company
estimates an additional $188,000 will be reclassified from other comprehensive
income to interest expense.
The
derivative agreement in existence at December 31, 2009 provides that if the
wholly owned subsidiary of the Company which is a party to the agreement
defaults or is capable of being declared in default on any of its indebtedness,
then a default can be declared on such subsidiary’s derivative obligation. In
addition, the Company (but not any of its subsidiaries) is a credit support
provider and a party to the derivative agreement and if there is a default by
the Company on any of its indebtedness, a default can be declared on the
derivative obligation under the agreement to which the Company is a party. The
default under the Circuit City mortgage obligations referred to in Note 4 was
not a default under the derivative agreement outstanding at December 31, 2009 or
the derivative agreement terminated in October 2009.
NOTE
8 - FAIR VALUE OF FINANCIAL INSTRUMENTS
Financial
Instruments Not Measured at Fair Value
The
following methods and assumptions were used to estimate the fair value of each
class of financial instruments for which adjustments to measure at fair value
are not reported:
Cash and
cash equivalents: The carrying amounts reported in the balance sheet
for these instruments approximate their fair values.
Mortgages
payable: At December 31, 2009, the $184,443,000 estimated fair value
of the Company's mortgages payable is less than their carrying value by
approximately $6,075,000, assuming a market interest rate of 7%.
Line of
credit: At December 31, 2009, the $26,681,000 estimated fair value of
the Company’s line of credit is less than its carrying value by approximately
$319,000, assuming a market interest rate of 6%.
The fair
value of the Company’s mortgages and line of credit was estimated using other
observable inputs such as available market information and discounted cash flow
analysis based on borrowing rates the Company believes it could obtain with
similar terms and maturities.
Considerable
judgment is necessary to interpret market data and develop estimated fair
value. The use of different market assumptions and/or estimation
methodologies may have a material effect on the estimated fair value
amounts.
F-22
NOTE
8 - FAIR VALUE OF FINANCIAL INSTRUMENTS (Continued)
Financial
Instruments Measured at Fair Value
The
Company accounts for fair value measurements based on the assumptions that
market participants would use in pricing the asset or liability. As a
basis for considering market participant assumptions
in fair value measurements, a fair value hierarchy distinguishes between market
participant assumptions based on market data obtained from sources independent
of the reporting entity and the reporting entity’s own assumptions about market
participant assumptions. In accordance with the fair value hierarchy,
Level 1 assets/liabilities are valued based on quoted prices for identical
instruments in active markets, Level 2 assets/liabilities are valued based on
quoted prices in active markets for similar instruments, on quoted prices in
less active or inactive markets, or on other “observable” market inputs and
Level 3 assets/liabilities are valued based significantly on “unobservable”
market inputs. The Company does not currently own any financial
instruments that are classified as Level 3.
The
Company’s financial assets and liabilities, other than mortgages payable and
line of credit, are generally short-term in nature, and consist of cash and cash
equivalents, rents and other receivables, other assets, and accounts payable and
accrued expenses. The carrying amounts of these assets and liabilities are not
measured at fair value on a recurring basis, but are considered to be recorded
at amounts that approximate fair value due to their short-term
nature.
The fair
value of the Company’s available-for-sale securities and derivative financial
instrument was determined using the following inputs as of December 31, 2009
(amount in thousands):
|
Fair
Value
Measurements
Using
|
||||||||||||||||
|
Carrying
and
|
Fair Value Hierarchy
|
|||||||||||||||
|
Fair Value
|
Maturity Date
|
Level 1
|
Level 2
|
|||||||||||||
|
Financial assets:
|
||||||||||||||||
|
Available-for-sale
securities:
|
||||||||||||||||
|
Corporate
debt security
|
$ | 1,405 |
January
15, 2012
|
$ | - | $ | 1,405 | |||||||||
|
Corporate
debt security
|
981 |
February
15, 2037
|
- | 981 | ||||||||||||
|
Equity
securities
|
566 |
-
|
566 | - | ||||||||||||
|
Treasury
bill
|
2,000 |
March
11, 2010
|
2,000 | - | ||||||||||||
|
Treasury
bill
|
1,999 |
May
6, 2010
|
1,999 | - | ||||||||||||
|
Derivative
financial instrument
|
111 |
-
|
- | 111 | ||||||||||||
Available-for-sale
securities
The
Company’s available-for-sale securities have a total amortized cost of
$6,839,000. At December 31, 2009, unrealized gains on such securities
were $257,000 and unrealized losses were $145,000. The aggregate net
unrealized gain of $112,000 is included in accumulated other comprehensive
income on the balance sheet. Fair values are approximated on current
market quotes from financial sources that track such securities. All of the
available-for-sale securities in an unrealized loss position are equity
securities and amounts are not considered to be other than temporary impairment
because the Company expects the value of these securities to recover and plans
on holding them until at least such recovery.
Derivative
financial instrument
Fair
values are approximated using widely accepted valuation techniques including
discounted cash flow analysis on the expected cash flows of the derivative. This
analysis reflects the contractual
terms of the derivative, including the period to maturity, and uses observable
market-based inputs, including interest rate curves, foreign exchange rates, and
implied volatilities. At December 31, 2009, this derivative is
included in other assets on the consolidated balance sheet.
F-23
NOTE
8 - FAIR VALUE OF FINANCIAL INSTRUMENTS (Continued)
Although
the Company has determined that the majority of the inputs used to value its
derivative fall within Level 2 of the fair value hierarchy, the
credit valuation adjustments associated with it utilize Level 3
inputs, such as estimates of current credit spreads to evaluate the likelihood
of default by itself and its counterparty. However, as of December
31, 2009, the Company has assessed the significance of the impact of the credit
valuation adjustments on the overall valuation of its derivative position and
has determined that the credit valuation adjustments are not significant to the
overall valuation of its derivative. As a result, the Company has
determined that its derivative valuation is classified in Level 2 of the fair
value hierarchy.
NOTE
9 – RELATED PARTY TRANSACTIONS
At
December 31, 2009 and 2008, Gould Investors L.P. (“Gould”), a related party,
owned 1,268,221 and 991,707 shares of the common stock of the Company or
approximately 11.4% and 9.7%, respectively. During 2009, Gould
purchased 139,970 shares of the Company’s stock in the open market and received
136,544 shares of the Company in connection with the stock dividends paid in
April, July and October 2009. There were no stock dividends in the
years ended December 31, 2008 and 2007. During 2008, Gould purchased
78,466 shares of the Company through the Company’s dividend reinvestment
plan. The Company suspended the dividend reinvestment plan on
December 9, 2008 as described in Note 13.
Effective
as of January 1, 2007, the Company entered into a compensation and services
agreement with Majestic Property Management Corp. (“Majestic”), a company
wholly-owned by our Chairman and in which certain of the Company’s executive
officers are officers and from which they receive compensation. Under the terms
of the agreement, Majestic took over the Company’s obligations to make payments
to Gould (and other affiliated entities) under a shared services agreement and
agreed to provide to the Company the services of all affiliated executive,
administrative, legal, accounting and clerical personnel that the Company had
theretofore utilized on an as needed, part time basis and for which the Company
had paid, as a reimbursement, an allocated portion of the payroll expenses of
such personnel in accordance with the shared services agreement. Accordingly,
the Company, no longer incurs any allocated payroll expenses. Under
the terms of the agreement, Majestic (or its affiliates) continues to provide to
the Company certain property management services (including construction
supervisory services), property acquisition, sales and leasing services and
mortgage brokerage services that it has provided to the Company in
the past, some of which were capitalized, deferred or reduced net sales proceeds
in prior years. The Company does not incur any fees or expenses for such
services except for the annual fees described below. As consideration
for providing to the Company the services described above, the Company paid
Majestic an annual fee of $2,025,000, $2,025,000 and $2,125,000 in 2009, 2008
and 2007, respectively, in equal monthly installments. Majestic
credits against the fee payments due to it under the agreement any management or
other fees received by it from any joint venture in which the Company is a joint
venture partner (exclusive of fees paid by the tenant in common on a property
located in Los Angeles, California). The agreement also provides for
an additional payment to Majestic of $175,000 in 2009, 2008 and 2007 for the
Company’s share of all direct office expenses, such as rent, telephone, postage,
computer services, internet usage, etc., previously allocated to the Company
under the shared services agreement. The annual payments the Company
makes to Majestic is negotiated each year by the Company and Majestic, and is
approved by the Company’s Audit Committee and the Company’s independent
directors. The Company also agreed to pay compensation to the Company’s Chairman
of $250,000 per annum effective January 2007.
F-24
NOTE
10 - STOCK BASED COMPENSATION
The
Company’s 2009 Stock Incentive Plan (the “2009 Incentive Plan”), approved by the
Company’s stockholders in June 2009, permits the Company to grant stock options,
restricted stock and/or performance-based awards to its employees, officers,
directors and consultants. The maximum number of shares of the
Company’s common stock that may be issued pursuant to the 2009 Incentive Plan is
600,000.
The
Company’s 2003 Stock Incentive Plan (the “2003 Incentive Plan”), approved by the
Company’s stockholders in June 2003, permitted the Company to grant stock
options and restricted stock to its employees, officers, directors and
consultants. The maximum number of shares of the Company’s common
stock that was allowed to be issued pursuant to the 2003 Incentive Plan was
275,000.
The
restricted stock grants are recorded based on the market value of the common
stock on the date of the grant and substantially all restricted stock awards
made to date provide for vesting upon the fifth anniversary of the date of grant
and under certain circumstances may vest earlier. For accounting purposes, the
restricted stock is not included in the outstanding shares shown on the balance
sheet until they vest, however dividends are paid on the unvested
shares. The value of such grants is initially deferred, and
amortization of amounts deferred is being charged to general and administrative
expense over the respective vesting periods.
|
Years Ended December 31,
|
||||||||||||
|
2009
|
2008
|
2007
|
||||||||||
|
Restricted
share grants
|
175,025 | 50,550 | 51,225 | |||||||||
|
Average
per share grant price
|
$ | 7.00 | $ | 17.50 | $ | 24.50 | ||||||
|
Recorded
as deferred compensation
|
$ | 1,225,000 | $ | 885,000 | $ | 1,255,000 | ||||||
|
Total
charge to general and administrative expenses, all outstanding restricted
grants
|
$ | 853,000 | $ | 888,000 | $ | 826,000 | ||||||
|
Non-vested
shares:
|
||||||||||||
|
Non-vested
beginning of period
|
213,625 | 186,300 | 140,175 | |||||||||
|
Grants
|
175,025 | 50,550 | 51,225 | |||||||||
|
Vested
during period
|
(30,675 | ) | (22,650 | ) | (5,050 | ) | ||||||
|
Forfeitures
|
(50 | ) | (575 | ) | (50 | ) | ||||||
|
Non-vested
end of period
|
357,925 | 213,625 | 186,300 | |||||||||
Through
December 31, 2009, a total of 274,950 and 143,100 shares were issued pursuant to
the Company’s 2003 and 2009 Stock Incentive Plans, respectively, of which
456,900 shares remain available for grant under the 2009
Plan. Approximately $2,548,000 remains as deferred compensation and
will be charged to expense over the remaining respective vesting periods. The
weighted average vesting period is approximately 3.14 years.
As of
December 31, 2009, 2008 and 2007 there were no options outstanding under the
2009 and 2003 Incentive Plans.
F-25
NOTE
11 - COMMON STOCK DIVIDEND DISTRIBUTIONS
The
following table details the distributions paid in cash and common stock of the
Company with respect to the 2009 fiscal year.
|
Payment Date
|
Total
Dividend
|
Cash
|
# Common
Shares
|
Per Share Value of
Common Stock
|
||||||||||||
|
January 25, 2010
|
$ | 2,456,000 | $ | 246,000 | 216,000 | $ | 10.20 | |||||||||
|
October
30, 2009
|
$ | 2,401,000 | $ | 240,000 | 255,000 | $ | 8.45 | |||||||||
|
July
21, 2009
|
$ | 2,333,000 | $ | 234,000 | 376,000 | $ | 5.58 | |||||||||
|
April
27, 2009
|
$ | 2,229,000 | $ | 223,000 | 529,000 | $ | 3.79 | |||||||||
The
number of common shares issued and outstanding as presented on the balance sheet
at December 31, 2009 would have been 11,095,000, taking into account the 216,000
shares issued on January 25, 2010.
NOTE
12 – STOCK REPURCHASE PROGRAMS
In
November 2008, the Company announced that its Board of Directors had authorized
a twelve month common stock repurchase program of up to 500,000 shares of the
Company’s common stock in open market transactions. From November
2008 through October 2009, the Company repurchased 300,000 shares of common
stock for an aggregate consideration of $1,679,000.
In August
2007, the Company announced that its Board of Directors had authorized a twelve
month common stock repurchase program of up to 500,000 shares of the Company’s
common stock in open market transactions. From August 2007 through
July 2008, the Company repurchased 252,000 shares of common stock for an
aggregate consideration of $4,776,000.
NOTE
13 - DISTRIBUTION REINVESTMENT PLAN
On
December 9, 2008, the Company suspended its Dividend Reinvestment Plan (the
“Plan”). The Plan had provided owners of record the opportunity to reinvest cash
dividends paid on the Company’s common stock in additional shares of its common
stock, at a discount of 0% to 5% from the market price. The discount
was determined at the Company’s sole discretion and had been offered at a 5%
discount from market. Under the Plan, the Company issued 158,242 and
236,645 common shares during the years ended December 31, 2008 and 2007,
respectively.
NOTE
14 – INCOME FROM SETTLEMENT WITH FORMER PRESIDENT
On
November 23, 2009, the Company settled its civil suit against the Company’s
former president and chief executive officer (who resigned in July 2005
following the discovery of inappropriate financial dealings). The terms of the
settlement included his payment to us of $900,000, 5,641 shares of the Company,
valued at $51,000, based on the November 23, 2009 stock closing price and the
assignment of his interest in a real estate consulting venture, which value has
been fully reserved against. The income from this settlement, which aggregated
$951,000, was recorded in the year ended December 31, 2009.
NOTE
15 – COMMITMENTS AND CONTINGENCIES
The
Company maintains a non-contributory defined contribution pension plan covering
eligible employees. Contributions by the Company are made through a
money purchase plan, based upon a percent of qualified employees’ total salary
as defined. Pension expense approximated $114,000, $107,000 and
$100,000 for the years ended December 31, 2009, 2008 and 2007, respectively.
F-26
NOTE
15 – COMMITMENTS AND CONTINGENCIES (Continued)
In the
ordinary course of business the Company is party to various legal actions which
management believes are routine in nature and incidental to the operation of the
Company’s business. Management believes that the outcome of the
proceedings will not have a material adverse effect upon the Company’s
consolidated statements taken as a whole.
NOTE
16 – INCOME TAXES
The
Company elected to be taxed as a real estate investment trust (REIT) under the
Internal Revenue Code, commencing with its taxable year ended December 31,
1983. To qualify as a REIT, the Company must meet a number of
organizational and operational requirements, including a requirement that it
currently distribute at least 90% of its adjusted taxable income to its
stockholders. It is management’s current intention to adhere to these
requirements and maintain the Company’s REIT status. As a REIT, the Company
generally will not be subject to corporate level federal, state and local income
tax on taxable income it distributes currently to its stockholders. If the
Company fails to qualify as a REIT in any taxable year, it will be subject to
federal, state and local income taxes at regular corporate rates (including any
applicable alternative minimum tax) and may not be able to qualify as a REIT for
four subsequent taxable years. Even though the Company qualifies for
taxation as a REIT, the Company is subject to certain state and local taxes on
its income and property, and to federal income and excise taxes on its
undistributed taxable income.
The
Company recorded $91,000 of federal excise tax (included in general and
administrative expense) which is based on taxable income generated but not yet
distributed for the year ended December 31, 2007. There was no
federal excise tax for the years ended December 31, 2009 and
2008. Included in general and administrative expenses for the years
ended December 31, 2009, 2008 and 2007 are state tax expense of $178,000,
$162,000 and $226,000, respectively.
Reconciliation
between Financial Statement Net Income and Federal Taxable Income:
The
following unaudited table reconciles financial statement net income to federal
taxable income for the years ended December 31, 2009, 2008 and 2007 (amounts in
thousands):
|
2009
Estimate
|
2008
Actual
|
2007
Actual
|
||||||||||
|
Net
income
|
$ | 19,641 | $ | 4,892 | $ | 10,590 | ||||||
|
Straight
line rent adjustments
|
(1,174 | ) | (1,023 | ) | (1,600 | ) | ||||||
|
Excess
of capital losses over capital gains
|
- | - | 868 | |||||||||
|
Financial statement gain on sale
in excess of tax gain (A)
|
(10,619 | ) | (1,685 | ) | (1,581 | ) | ||||||
|
Rent
received in advance, net
|
299 | (82 | ) | 95 | ||||||||
|
Financial
statement impairment charge
|
229 | 5,983 | - | |||||||||
|
Federal
excise tax, non-deductible
|
- | - | 91 | |||||||||
|
Financial
statement adjustment for above/below market leases
|
23 | (371 | ) | (285 | ) | |||||||
|
Non-deductible
portion of restricted stock expense
|
741 | 507 | 710 | |||||||||
|
Financial
statement adjustment of fair value of derivative
|
(694 | ) | 650 | - | ||||||||
|
Financial
statement depreciation in excess of tax depreciation
|
1,002 | 1,158 | 702 | |||||||||
|
Other
adjustments
|
389 | 64 | 2 | |||||||||
|
Federal
taxable income
|
$ | 9,837 | $ | 10,093 | $ | 9,592 | ||||||
F-27
|
NOTE
16 – INCOME TAXES (Continued)
|
|
(A)
|
For
the year ended December 31, 2009, amount includes $4,951 GAAP gain on sale
of real estate which was deferred for federal tax purposes in accordance
with Section 1031 of the Internal Revenue Code of 1986, as amended. Also
includes financial statement impairment charges of $5,983, which were
recorded during the year ended December 31, 2008 relating to four
properties that were disposed of in the year ended December 31,
2009.
|
Reconciliation
between Cash Dividends Paid and Dividends Paid Deduction:
The
following unaudited table reconciles cash dividends paid with the dividends paid
deduction for the years ended December 31, 2009, 2008 and 2007 (amounts in
thousands):
|
2009
Estimate
|
2008
Actual
|
2007
Actual
|
||||||||||
|
Dividends
paid (A)
|
$ | 9,419 | $ | 13,241 | $ | 21,218 | ||||||
|
Dividend
reinvestment plan (B)
|
- | 96 | 268 | |||||||||
| 9,419 | 13,337 | 21,486 | ||||||||||
|
Less:
Spillover dividends designated to previous year (C)
|
(2,667 | ) | (5,861 | ) | (17,705 | ) | ||||||
|
Plus:
Dividends designated from following year (C)
|
3,135 | 2,667 | 5,861 | |||||||||
|
Dividends
paid deduction (D)
|
$ | 9,887 | $ | 10,143 | $ | 9,642 | ||||||
|
(A)
|
In
2009, the quarterly dividends on the Company’s common stock of $.22 per
share were paid in cash and/or shares of the Company’s common
stock.
|
|
(B)
|
Amount
reflects the 5% discount on the Company's common shares purchased through
the dividend reinvestment plan, which was terminated in December
2008.
|
|
(C)
|
Includes
a special dividend paid on October 2, 2007 of $.67 per share or $6,731,
which represents the remaining undistributed portion of the taxable income
recognized by the Company in 2006 primarily from gains on sale by two of
its 50% owned joint ventures of their portfolio of movie theater
properties.
|
|
(D)
|
Dividends
paid deduction is slightly higher than federal taxable income in 2009,
2008 and 2007 so as to account for adjustments made to federal taxable
income as a result of the impact of the alternative minimum
tax.
|
NOTE
17 – SUBSEQUENT EVENTS
On
February 24, 2010, the Company acquired a community shopping center located in
Pennsylvania, for a purchase price of $23,500,000. The center is 99% occupied
and leased to ten separate tenants. In connection with the purchase, the Company
assumed an existing first mortgage encumbering the property of approximately
$17,700,000 and the balance was paid in cash.
On March
9, 2010, the Board of Directors declared a quarterly cash distribution of $.30
per share totaling $3,436,000, on the Company's common stock, payable on April
6, 2010 to stockholders of record on March 26, 2010.
F-28
NOTE
18- QUARTERLY FINANCIAL DATA (Unaudited):
|
(In
Thousands, Except Per Share Data)
|
|
Quarter Ended
|
||||||||||||||||||||
|
2009
|
March 31
|
June 30
|
Sept. 30
|
Dec. 31
|
Total
For Year
|
|||||||||||||||
|
Rental
revenues as previously reported
|
$ | 10,679 | $ | 12,324 | $ | 9,591 | $ | 9,838 | $ | 42,432 | ||||||||||
|
Revenues
from discontinued operations (A)
|
(838 | ) | (794 | ) | - | - | (1,632 | ) | ||||||||||||
|
Revenues
|
$ | 9,841 | $ | 11,530 | $ | 9,591 | $ | 9,838 | $ | 40,800 | ||||||||||
|
Income
from continuing operations (B)
|
$ | 2,337 | $ | 4,304 | $ | 2,215 | $ | 3,464 | $ | 12,320 | ||||||||||
|
Income
from discontinued operations (B)
|
316 | 139 | 1,225 | 5,641 | 7,321 | |||||||||||||||
|
Net
income
|
$ | 2,653 | $ | 4,443 | $ | 3,440 | $ | 9,105 | $ | 19,641 | ||||||||||
|
Weighted
average number of common shares outstanding (C):
|
||||||||||||||||||||
|
Basic:
|
10,165 | 10,488 | 10,837 | 11,104 | 10,651 | |||||||||||||||
|
Diluted:
|
10,276 | 10,751 | 10,974 | 11,234 | 10,812 | |||||||||||||||
|
Net
income per common share:
|
||||||||||||||||||||
|
Basic:
|
||||||||||||||||||||
|
Income
from continuing operations (B)
|
$ | .23 | $ | .41 | $ | .20 | $ | .31 | $ | 1.15 | (D) | |||||||||
|
Income
from discontinued operations (B)
|
.03 | .01 | .12 | .51 | .69 | (D) | ||||||||||||||
|
Net
income (C)
|
$ | .26 | $ | .42 | $ | .32 | $ | .82 | $ | 1.84 | (D) | |||||||||
|
|
||||||||||||||||||||
|
Diluted:
|
||||||||||||||||||||
|
Income
from continuing operations (B)
|
$ | .23 | $ | .40 | $ | .20 | $ | .31 | $ | 1.14 | (D) | |||||||||
|
Income
from discontinued operations (B)
|
.03 | .01 | .11 | .50 | .68 | (D) | ||||||||||||||
|
Net
income (C)
|
$ | .26 | $ | .41 | $ | .31 | $ | .81 | $ | 1.82 | (D) | |||||||||
|
(A)
|
Represents
revenues from discontinued operations which were previously included in
rental revenues as previously reported in the March and June 2009
quarters.
|
|
(B)
|
Amounts
have been adjusted to give effect to the Company’s discontinued
operations.
|
|
(C)
|
Amounts
have been restated to give effect to a new accounting pronouncement as
discussed in Note 2.
|
|
(D)
|
Calculated
on weighted average shares outstanding for the
year.
|
F-29
NOTE
18- QUARTERLY FINANCIAL DATA (Continued)
|
Quarter Ended
|
||||||||||||||||||||
|
2008
|
March 31
|
June 30
|
Sept. 30
|
Dec. 31
|
Total
For Year
|
|||||||||||||||
|
Rental
revenues as previously reported
|
$ | 9,751 | $ | 9,686 | $ | 9,950 | $ | 10,954 | $ | 40,341 | ||||||||||
|
Reclassification of
revenues (E)
|
(1,195 | ) | (1,016 | ) | (1,204 | ) | (895 | ) | (4,310 | ) | ||||||||||
|
Revenues
|
$ | 8,556 | $ | 8,670 | $ | 8,746 | $ | 10,059 | $ | 36,031 | ||||||||||
|
|
||||||||||||||||||||
|
Income from
continuing operations (F)
|
$ | 2,089 | $ | 3,664 | $ | 1,787 | $ | 2,403 | $ | 9,943 | ||||||||||
|
Income (loss) from
discontinued operations (F)
|
690 | (418 | ) | 681 | (6,004 | ) | (5,051 | ) | ||||||||||||
|
Net
income (loss)
|
$ | 2,779 | $ | 3,246 | $ | 2,468 | $ | (3,601 | ) | $ | 4,892 | |||||||||
|
Weighted
average number of common shares outstanding - basic and
diluted
|
10,152 | 10,219 | 10,169 | 10,192 | 10,183 | |||||||||||||||
|
Net
income per common share – basic and diluted:
|
||||||||||||||||||||
|
Income
from continuing operations
|
$ | .21 | $ | .36 | $ | .17 | $ | .24 | $ | .98 | (G) | |||||||||
|
Income
(loss) from discontinued operations
|
.06 | (.04 | ) | .07 | (.59 | ) |
(.50
|
)(G) | ||||||||||||
|
Net
income (loss)
|
$ | .27 | $ | .32 | $ | .24 | $ | (.35 | ) | $ | .48 | (G) | ||||||||
|
(E)
|
Represents
revenues from discontinued operations which were previously included in
rental revenues as previously
reported.
|
|
(F)
|
Amounts
have been adjusted to give effect to the Company’s discontinued
operations.
|
|
(G)
|
Calculated
on weighted average shares outstanding for the
year.
|
F-30
ONE
LIBERTY PROPERTIES, INC. AND SUBSIDIARIES
Schedule
III - Consolidated Real Estate and Accumulated Depreciation
December
31, 2009
(Amounts
in Thousands)
|
Initial Cost To
Company
|
Cost
Capitalized
Subsequent
to Acquisition
|
Gross Amount at Which Carried at
December 31, 2009
|
Accumulated
Depreciation
|
Date of
Construction
|
Date
Acquired
|
Life on
Which
Depreciation
in Latest
Income
Statement is
Computed
(Years)
|
|||||||||||||||||||||||||||||||||
|
Encumbrances
|
Land
|
Buildings
|
Improvements
|
Land
|
Buildings and
Improvements
|
Total
|
|||||||||||||||||||||||||||||||||
|
Free Standing Retail
Locations:
|
|||||||||||||||||||||||||||||||||||||||
|
10
Properties –
Note
1
|
$ | 2,782 | $ | 19,929 | $ | 29,720 | $ | - | $ | 19,929 | $ | 29,720 | $ | 49,649 | $ | 1,491 |
Various
|
Various
|
40
|
||||||||||||||||||||
|
11
Properties –
Note
2
|
24,750 | 10,286 | 45,414 | - | 10,286 | 45,414 | 55,700 | 4,210 |
Various
|
04/07/06
|
40
|
||||||||||||||||||||||||||||
|
Miscellaneous
|
65,228 | 30,656 | 104,426 | 1,010 | 30,656 | 105,436 | 136,092 | 19,956 |
Various
|
Various
|
40
|
||||||||||||||||||||||||||||
|
Flex
Buildings:
|
|||||||||||||||||||||||||||||||||||||||
|
Miscellaneous
|
12,976 | 2,993 | 15,125 | 1,032 | 2,993 | 16,157 | 19,150 | 3,489 |
Various
|
Various
|
40
|
||||||||||||||||||||||||||||
|
Office
Buildings:
|
|||||||||||||||||||||||||||||||||||||||
|
Parsippany,
NJ
|
15,604 | 6,055 | 23,300 | - | 6,055 | 23,300 | 29,355 | 2,500 |
1997
|
09/16/05
|
40
|
||||||||||||||||||||||||||||
|
Miscellaneous
|
15,596 | 3,537 | 13,688 | 2,574 | 3,537 | 16,262 | 19,799 | 3,307 |
Various
|
Various
|
40
|
||||||||||||||||||||||||||||
|
Apartment
Building:
|
|||||||||||||||||||||||||||||||||||||||
|
Miscellaneous
|
4,142 | 1,110 | 4,439 | - | 1,110 | 4,439 | 5,549 | 2,509 |
1910
|
06/14/94
|
27.5
|
||||||||||||||||||||||||||||
|
Industrial:
|
|||||||||||||||||||||||||||||||||||||||
|
Baltimore,
MD -
Note
3
|
22,725 | 6,474 | 25,282 | - | 6,474 | 25,282 | 31,756 | 1,923 |
1960
|
12/20/06
|
40
|
||||||||||||||||||||||||||||
|
Miscellaneous
|
11,591 | 4,777 | 18,263 | 956 | 4,777 | 19,219 | 23,996 | 2,794 |
Various
|
Various
|
40
|
||||||||||||||||||||||||||||
|
Theater:
|
|||||||||||||||||||||||||||||||||||||||
|
Miscellaneous
|
5,903 | - | 8,328 | - | - | 8,328 | 8,328 | 2,895 |
2000
|
08/10/04
|
15.6
|
||||||||||||||||||||||||||||
|
Health
Clubs:
|
|||||||||||||||||||||||||||||||||||||||
|
Miscellaneous
|
9,221 | 2,233 | 8,729 | 2,731 | 2,233 | 11,460 | 13,693 | 2,300 |
Various
|
Various
|
40
|
||||||||||||||||||||||||||||
|
Totals
|
$ | 190,518 | $ | 88,050 | $ | 296,714 | $ | 8,303 | $ | 88,050 | $ | 305,017 | $ | 393,067 | $ | 47,374 | |||||||||||||||||||||||
F-31
Note 1 –
These ten properties are retail office supply stores net leased to the same
tenant, pursuant to separate leases. Eight of these leases contain
cross default provisions. They are located in eight states (Florida, Illinois,
Louisiana, North Carolina, Texas, California, Georgia and Oregon) and no
individual property is greater than 5% of the Company’s total
assets.
Note 2 –
These 11 properties are retail furniture stores covered by one master lease and
one loan that is secured by crossed mortgages. They are
located
in six
states (Georgia, Kansas, Kentucky, South Carolina, Texas and Virginia) and no
individual property is greater than 5% of the Company’s total
assets.
Note 3 –
Upon purchase of the property in December 2006, a $416,000 rental income reserve
was posted by the seller for the Company’s benefit, since the property was not
producing sufficient rent at the time of acquisition. The Company
recorded the receipt of this rental reserve as a reduction to land and
building.
F-32
ONE
LIBERTY PROPERTIES, INC. AND SUBSIDIARIES
Notes to
Schedule III
Consolidated
Real Estate and Accumulated Depreciation
|
(a)
|
Reconciliation
of "Real Estate and Accumulated
Depreciation"
|
|
|
(Amounts
In Thousands)
|
|
Year Ended December 31,
|
||||||||||||
|
2009
|
2008
|
2007
|
||||||||||
|
Investment
in real estate:
|
||||||||||||
|
Balance,
beginning of year
|
$ | 392,491 | $ | 380,270 | $ | 380,111 | ||||||
|
Addition:
Land, buildings and improvements
|
576 | 59,015 | 576 | |||||||||
|
Deductions:
|
||||||||||||
|
Cost
of properties sold
|
- | (1,148 | ) | (1 | ) | |||||||
|
Reclassification
to “properties held for sale”
|
- | (39,663 | ) | - | ||||||||
|
Impairment
charge
|
- | (5,983 | ) | - | ||||||||
|
Rental
reserve received (see Note 3 above)
|
- | - | (416 | ) | ||||||||
|
Balance,
end of year
|
$ | 393,067 | $ | 392,491 | $ | 380,270 | ||||||
|
(b)
|
||||||||||||
|
Accumulated
depreciation:
|
||||||||||||
|
Balance,
beginning of year
|
$ | 39,378 | $ | 36,228 | $ | 28,270 | ||||||
|
Addition:
Depreciation
|
8,467 | 8,470 | 7,958 | |||||||||
|
Deduction:
|
||||||||||||
|
Accumulated
depreciation related to “properties held for sale”
|
(471 | ) | (5,320 | ) | - | |||||||
|
Balance,
end of year
|
$ | 47,374 | $ | 39,378 | $ | 36,228 | ||||||
|
(b)
|
The
aggregate cost of the properties is approximately $16,323 lower for
federal income tax purposes at December 31,
2009.
|
F-33